Embed Size (px)
Citation preview

eScholarship provides open access, scholarly publishingservices to the University of California and delivers a dynamicresearch platform to scholars worldwide.
California Partners for AdvancedTransportation Technology
UC Berkeley
Title:Freeway Detector Data Analysis For Simulation Of The Santa Monica Freeway - InitialInvestigations
Author:Bloomberg, Loren D.Bacon, Jr., Vinton W.May, Adolf D.
Publication Date:01-01-1993
Series:Working Papers
Permalink:http://escholarship.org/uc/item/12q6j2g5
Keywords:Smart Corridor Demonstration Project (Calif.), Detectors--Reliability, Traffic flow--Measurement--Electronic equipment, Santa Monica Freeway (Los Angeles, Calif.)
Abstract:This report provides an analysis of vehicle detector data on the Santa Monica Freeway in LosAngeles, Calif. It was found that approximately 32 percent of the mainline freeway detectorsappeared to give reasonable results. The report suggests that Caltrans District 07 staff makeefforts towards increasing the number of detectors which give reliable information so that anevaluation and simulation of the Smart Corridor on the Santa Monica Freeway may be undertaken.This report was revised and re-issued as UCB-ITS-PWP-93-10 (PATH Database record #4779)
Copyright Information:All rights reserved unless otherwise indicated. Contact the author or original publisher for anynecessary permissions. eScholarship is not the copyright owner for deposited works. Learn moreat http://www.escholarship.org/help_copyright.html#reuse

This paper has been mechanically scanned. Someerrors may have been inadvertently introduced.

CALIFORNIA PATH PROGRAMINSTITUTE OF TRANSPORTATION STUDIESUNIVERSITY OF CALIFORNIA, BERKELEY
Freeway Detector Data Analysis for Simulationof the Santa Monica Freeway - InitialInvestigations
Loren D. BloombergVinton W. Bacon, Jr.Adolf D. May
UCB-ITS-PWP-93-1
This work was performed as part of the California PATH Program ofthe University of California, in cooperation with the State of CaliforniaBusiness, Transportation, and Housing Agency, Department ofTransportation; and the United States Department of Transportation,Federal Highway Administration.
The contents of this report reflect the views of the authors who areresponsible for the facts and the accuracy of the data presented herein.The contents do not necessarily reflect the official views or policies ofthe State of California. This report does not constitute a standard,specification, or regulation.
AUGUST 1993
ISSN 1055-1417

Acknowledgments
The authors of this working paper would like to acknowledge the help of several individuals whoprovided value assistance in this study. Mark Miller (from the PATH program) helped to initiatethe study of the Smart Corridor freeway detectors, and provided key contacts throughout.Randall Cayford from the ITS Sytems Unit at UC Berkeley made substantial modifications to theinitial data extraction program developed at UC Irvine. In addition, he provided technical supportand guidance for the numerous hardware/software issues.
The authors would also like to thank Alex Kalbasi from Caltrans District 07 who provided theinitial tape download of the freeway detector data. Phoebe Coler, Arte Gupta, and Alan Clellandof JHK & Associates all provided valuable insight into the detector data and provided helpfulsuggestions for proceeding with the study. Finally, Yonnel Gardes (from ITS at UC Berkeley)was a continued source of insight and advice on issues related to the Smart Corridor.
This work was performed as part of the California PATH Program of the University of California,in cooperation with the State of California Business, Transportation, and Housing Agency,Department of Transportation; and the United States Department of Transportation, FederalHighway Administration.
The contents of this report reflect the views of the authors who are responsible for the facts andthe accuracy of the data presented herein. The contents do not necessarily reflect the officialviews or policies of the State of California. This report does not constitute a standard,specification, or regulation.
This report is part of an effort to simulate various IVHS strategies on the Santa Monica Freewaycorridor (I-10) in Los Angeles. This corridor is also known as the “Smart Corridor” because ofthe project of the same name that is currently underway on the corridor. While much of the dataused for this report were obtained from the agencies involved in the Smart Corridor project, itshould be made clear that this research was conducted at the University of California at Berkeleyand is not a part of the Smart Corridor project itself. The results arrived at in this report do notnecessarily reflect the views of any of the agencies involved in the Smart Corridor project.

Table of Contents
Section 1: Executive Summary
Section 2: Rationale
Section 3: ProcessA. CalTrans Data CollectionB. Initial Work at UC BerkeleyC. UC Irvine Extraction ProgramD. OutputE. Issues
Section 4: ResultsA. Data IntegrityB. Mainline Flow and Occupancy Data
Section 5: Further InvestigationsA. Additional Days and TimesB. Additional Detector DataC. Study Recommendations
Appendix: Data Extraction Program
FiguresFigure 1: Sample query.& input fileFigure 2: Sample voLdmp output fileFigure 3: Numbering scheme for detectorsFigure 4: Zone Detector Data (Eastbound)Figure 5: Zone Detector Data (Westbound)Figure 6: Map of Smart Corridor: FreewayFigure 7: Summary of Detector ResultsFigure 8: Detector OccupancyFigure 9: Detector Flow DataFigure 10: Flow Data vs. TimeFigure 11: Occupancy Data vs. TimeFigure 12: Flow vs. Density
page 1
page 2
page 3page 3page 3page 3page 4page 5
page 7page 7page 11
page 20page 20page 20page 21
page 22
page 4page 4page 5page 8page 9page 10page 11page 12page 14page 17page 18page 19

Section 1: Executive Summary
As part of the efforts for the Smart Corridor evaluation and simulation projects, a team at theUniversity of California at Berkeley performed a pilot analysis of freeway detector data from theSanta Monica Freeway in Los Angeles. The study was undertaken to benefit two separateprojects: an evaluation project investigating the benefits of Intelligent Vehicle-Highway Systems(IVHS) for the Smart Corridor, and a simulation project to model the Smart Corridor usingINTEGRATION.
Caltrans provided Santa Monica freeway detector data on magnetic tapes for the week ofDecember 7, 1992. The detector data on the tapes were transferred to PC files using anextraction program developed by a team at UC Irvine and modified by the UC Berkeley team.Data for the morning peak period (6 A.M. to 12 noon) on Tuesday December 8 was selected asthe central focus of the analysis. Two spreadsheets were developed: one containing trafficvolume for 15 minute periods at each of 7 1 zones along the freeway, and another with occupancydata. Each zone included 15 detector stations. The fust 4 or 5 detectors were positioned on themainline freeway (one per lane).
It was found that approximately 32 percent of all possible mainline freeway detectors appeared toreturn data that are appropriate for freeway traffic. (Note that Caltrans recognizes that many ofthese detectors are not working and some zones may in fact not have mainline detectors.Therefore, this percentage may be underestimated.) The working detectors were grouped roughlyin the center portion of the freeway sections; there were also several large sections with noworking detectors. While there is no guarantee as to the accuracy of the “working” detectors (32percent), detailed traffic flow analysis on data from two zones of detectors (La Brea 2 andCrenshaw) give the appearance of reasonable results. Several charts are provided in the reportthat detail the results of the analysis.
It is suggested that Caltrans District 07 staff review this report and give consideration to effortsdirected toward increasing the number of detectors which are operable and give reliableinformation. Otherwise, other means of freeway data collection will need to be undertaken for theevaluation and simulation of the Santa Monica Freeway. These other means of freeway datacollection may be quite costly and time consuming, and not as comprehensive as the freewaydetector system data.
Smart Corridor Freeway Detector Data page 1 March l,l!W3

Section 2: Rationale
Two separate projects are underway to analyze the benefits of Intelligent Vehicle-HighwaySystem (IVHS) technology for the Smart Corridor in Los Angeles. As part of the PATHprogram, the Smart Corridor evaluation project is investigating the benefits of this technology bycomparing field measurements of existing and future (after specific IVHS components areimplemented) conditions along the Smart Corridor. A parallel effort is a simulation project that isapplying the INTEGRATION model to the Smart Corridor in order to assess and refine individualand combined ATIYATMS strategies.
Both projects have substantial data requirements. The evaluation project is collecting data onexisting conditions on the freeways and arterials within the Santa Monica Freeway corridor. Inorder to assess the benefits of IVHS, it is first necessary to develop a baseline model forcomparison. Since demand data is critical for such a model, the evaluation project is investigatingtechniques for gathering traffic data.
The simulation project also requires demand data as an input to its model. The INTEGRATIONmodel requires origin/destination data. These data can either be direct (i.e., gathered directly bymeans of surveys or other techniques), or synthesized (using traffic flow data at specific points).The simulation project will use the synthesized origin/destination data as the source of demanddata. However, in order to build a useful model, it is critical for the team to have access to timelyand accurate demand data.
Since both projects require these demand data, it was decided to undertake a pilot study of theavailable sources of data. Since Caltrans has developed a network of freeway detectors,determining the usefulness of the data from these detectors was considered to be an importantfast step. The study involved gathering and organizing the data from Caltrans and performing aseries of analyses to assess the data. While the primary activities in the study involved analyzingthe data from freeway detectors, the overall goal was to make a general assessment of the validityand usefulness of the freeway data in order to help define future work.
Smart Corridor Freeway Detector Data Page 2 March 1,1993

Section 3: Process
This section outlines the data collection and extraction process. The steps that were undertakento prepare the data for analysis are described.
A. Caltrans Data CollectionAt the request of the UC Berkeley team, Caltrans captured freeway detector data for the week ofDecember 7, 1992. The data is automatically collected by Caltrans for detectors throughout theLos Angeles area (including a large set of detectors on the Santa Monica Freeway, botheastbound and westbound within the Smart Corridor area). For this project, the detector data forfour days (Monday December 7 through Thursday December 10) were copied to magnetic tapes.
B. Initial Work at UC BerkeleyThe data was received at UC Berkeley the following week on eight magnetic tapes, eachcontaining 12 hours of freeway detector data (midnight to noon and noon to midnight) from all ofthe freeway detectors on the L.A. area. 2000 sets of detector data (numbered 1 to 2000) werecollected, but a test indicated that only about 1300 of these contained any data.
The magnetic tapes were taken to Computing Services in Evans Hall (at UC Berkeley) for tempo-rary storage. A simple program was used to transfer (via the campus Ethernet network) the datafrom the tape to a PC in the Transportation Engineering department (McLaughlin Hall) at UCBerkeley. Then, each 1Zhour tape was stored as a binary fne on the PC, requiring 45-50megabytes of disk storage space.
C. UC Irvine Extraction ProgramTo analyze the data in these binary files, the first step was to extract the data and convert it intoASCII format, a standard format for PC computing. A program was developed by researchers atUC Irvine (including Stephen Ritchie) for this purpose. However, the program did not supportseveral key functions that were needed by the project team. First, it was determined that volumeand occupancy counts would be most useful if they were aggregated over five minute periods (asopposed to 30 seconds on the tapes). Secondly, it was desirable to have the data in the outputfiles separated by tabs. These delimiters made it easier to import the data sets into spreadsheets.
The most important modification involved the extraction of data into individual detectors. The2000 sets of detector data are divided into zones, with each zone representing a group ofdetectors. For example, a group of detectors along each lane of a freeway would compose azone. It was determined (with the help of JHK & Associates) that the tape contained data for upto 15 detectors per zone. However, the original UC Irvine program was limited in the number ofdetectors it could extract from each zone. Since many zones contain mainline,collector/distributor, and/or ramp data, it was critical to modify the program to support extractionof up to 15 detectors per zone.
Programmers from the ITS Systems Unit and the project team made modifications to supportthese new requirements. (The modified source code for this program is included as Appendix 1)
Smart Corridor Freeway Detector Data Page 3 March 1,1993

The extraction program is relatively simple and straightforward to use. It requires two inputs, theextracted binary data file and an input file called querydat. This file must be created by the userand specifies the zones that will be extracted from the tape. For this analysis, querydat includedzone numbers within the Santa Monica freeway section. The input file also designates the timeperiods to be analyzed. Time periods range from O-1440 (in minutes) for morning tapes and from1441-2880 for the afternoon/evening tapes. Figure 1 depicts a sample query.dat:
2 0 14401200 151204 61219 15
Figure 1: Sample query.& input fde
The first number is a constant parameter that will always be 2. The 0 and 1440 represent thebeginning and ending times for the analysis. This example would extract data for the entiremorning period. 1200, 1204, and 12 19 are the zone numbers for which data will be extracted.The second parameter on each line (e.g., 15 and 6) indicates the number of lanes (i.e., detectors)that are examined from each zone.
One problem that was found was that there was often some extraneous data at the beginning ofthe tape. It was found that skipping one time period at the beginning of the tape effectivelyeliminated the problem, and no detector data was lost.
D. OutputThe output of the extraction program is two output files. Each is presented in tabular form, andbroken down by zone and detector. The file vol.dmp contains volume data (in number of cars perfive minute period) and the file occ.dmp contains occupancy data (in percentage of occupancy byfive minute period). Figure 2 presents a sample vol.dmp output file (0cc.dm.p looks similar):
1200 1 95 101 89 104 112 991200 2 85 89 92 102 101 1041204 1 80 79 80 84 89 771204 2 67 68 80 77 81 691204 3 48 52 58 44 55 60
Figure 2: Sample vol.dmp output file
Smart Corridor Freeway Detector Data page 4 March 1,1993

The first number on each line (i.e., 1200 and 1204) indicates the zone number being studied. Thesecond number signifies the detector number within the zone. For this example, two detectorswere studied in zone 1200 and three detectors were examined in zone 1204. The remainingnumbers show actual volume data aggregated into 5 minute periods. Each value represents 1030-second periods. In this example, thirty minutes of volume data are presented.
The voZ.dmp and occ.dmp files generated from roughly 70 zones with 15 detectors per zone wereabout 75 kilobytes (in tabular form). To work with the data sets more easily, the .dmp fties wereimported into a spreadsheet (Microsoft Excel and Lotus 123 were used; there are some file sizelimitations with Quattro Pro). The resulting spreadsheet files were approximately 300 kilobytes.
These spreadsheets were the tool that was used to perform data analysis. The results of theanalysis of the volume and occupancy data is given in Section 4.
E. IssuesSeveral issues were encountered during the process of extracting the detector data. Many ofthese were necessarily resolved during the project; however, some of these issues need furtherinvestigation.
The first major task was to correlate the zone numbers in the data with actual locations on thefreeway. Caltrans provided several maps and a list of zones with mileposts, nearest cross streetand other data for each zone. Figure 3 outlines the numbering scheme used to label the detectors.
O-900900- 15001500-2000
Detectors that include ramps and collector/distributor lanes.Freeway mainline collectors.Freeway mainline collectors where the controller is on the opposite
side of the freeway from the detectors.
Figure 3: Numbering Scheme for Detectors
Using this documentation, the coding scheme that was used for the detector data tapes wasdetermined, and the map in the next section is a summary of that work. However, it was foundthat several detectors in the data were not listed on the maps (though their locations were foundwithin other documentation), and that there are some detectors listed on the map produce nodata. Therefore, it may be worthwhile to update a map with current detector information.
Another issue involves the identification of detectors within each zone. It is clear that the first ndetectors in each zone correspond to the mainline freeway lanes (where n is the number of lanes inthat section of freeway). However, it is not obvious which of the other detectors (of the 15 ineach zone) correspond to ramp detectors, collector/distributor lanes, or other data. In fact,conversations with Caltrans officials indicated that there may be up to 28 detectors associatedwith a particular zone. However, in the tapes received from Caltrans, there is a maximum of 15detectors per zone; it is not clear where the 28 figure arose. The Atlanta office of JHK &
Smart Corridor Freeway Detector Data page 5 March 1,1993

Associates has had experience in decoding the data, and they are studying the results from thisstudy. For this study, only the mainline freeway lanes were examined. However, future work willneed to examine the other data. This is especially important for synthetic O/D development,where ramp on/off counts are required.
Smart Corridor Freeway Detector Data page 6 March 1,1993

Section 4: Results
This section outlines the results of the analysis of the Santa Monica Freeway detector data. Ageneral assessment of the data integrity is made, and then several studies of specific data (e.g.,volumes and occupancies) are presented.
A. Data IntegrityUsing the data generated from the extract tapes, the detectors were appraised to determine ageneral level of integrity. Figures 4 and 5 present the results of this analysis. (Figure 4 is foreastbound detectors and Figure 5 is for westbound detectors). The first columns list the zonenumber, milepost marker, and nearest cross street. These correspond to the map in Figure 6. Thenumber of mainline freeway lanes in that zone is also indicated. Note that the number of lanesvaries between four and five for most of the freeway section.
The fifteen numbered columns correspond to the “lanes” within each zone. Strictly speaking, onlythe first four or five detectors are lanes (the mainline freeway lanes). These are delineated withthe heavy line on the chart. The remaining detectors are on ramps, collector/distributor lanes, ornon-existent.
The symbols on the chart give a general assessment of the functionality of the detectors. A Jindicates data that appears reasonable for mainline freeway data (volume of at least 100 cars for anumber of 5 minute periods during daylight hours). Note that this designation is based on volumecounts only; in some cases the occupancy data is of different integrity. L signifies data that issignificantly lower than that for the mainline (volume figures consistently under 70), but may bereasonable for ramps and/or collector distributor lanes. Note that 4 and L denote detectors thatappear to be giving good data, but there is no guarantee of accuracy; they just have reasonablevalues. Also, an L in the mainline is probably poor data, but may be reasonable in the otherdetector section.
x indicates data that is obviously flawed. Usually, this consists of a value that is repeatedthroughout the time period. Another common problem was ridiculously high values for volumeand/or occupancy (e.g., 10000 cars or 99% occupancy). 0 indicates detector data that wascaptured as all zeroes. A blank cell shows where there is no data at all. Note that there are threepossible reasons for detector cells that are noted as having flawed data:
l the detector is present but is returning no datal detectors are present at the freeway location (the specific zone) but not in that particular
“lane”l there are no detectors at the freeways location (zone)
Without more detailed data on the detector locations it is difficult to specify the exact problemwith flawed detector data (Section 5 discusses steps to address this issue). For now, the resultsare presented with as much detail as is possible.
Smart Corridor Freeway Detector Data page 7 March 1,1993

Zone Detector Data
Santa Monica - Route 10 - EastboundFrom Centinela to Soto
Lane Number:Zone # Mile Cross St. lanes 1 2 3 4 5 6 7 8 9 10 11 12 13 14 15 I(
1525152615271530254
1631667
1533668
1234266562
1537669
1538825261947
1503827
1504812986810824
1506807
1507911640645653654655912913908907946945944
3.93 Centinela4.37 PicQ4.77 Bundy6.15 Westwood6.50 Overland6.73 Motor7.22 Manning7.82 Robertson7.99 National8.36 Cattaraugu8.73 La Cienega9.01 Venice9.21 Fairfax9.51 Washington9.80 Hauser
10.23 La Brea 110.53 La Brea 210.70 Harcourt11.06 West11.53 Crenshaw12.23 Arling. 112.45 Arling. 212.58 Gramercy12.95 Western 213.44 Normam. 213.53 Budlong13.95 Vermont 114.12 Hoover14.81 E of 11015.33 Flower15.78 Los Angeles16.21 San Pedro16.84 Central17.09 Alameda17.40 Olympic17.78 Wof50.18 E of Macy0.52 Echandia
18.53 State18.75 S Louis19.03 Soto
445545555544455444555445445544455555
-
J~J~~Lxxxx0xxxx
L L x x x o x x x x
LLLxx0xxxx
-
o o o o x x x x x:;;x;xxxxxx x0 x4 x 4 XTL L 0 L L 0 x x x x3 o o o o o o o o o o x x x x4 4 4 4-xLLLL00xxxxJ~J~LLLL000xxxx
; : ; t;+o”x x x x 0 x x x x
0 x44~4dLxx;:~xx
-
LLXLLLXXXXLLLLxxxxxx0xxxx4 4 4 x x o x x x x x x x o x
LLLLO-iLxxx
-10~~0000000000x300000Lxxx0xxxxxL00xx0xxx00xxx100LTLLLxx0xxxx
x x x x x 0 x x x x
0 0 0 0 0 0 0 0 0 xx x x x x 0 x x x xx x x 0 x o x x x xo~xoxooxxx~0~~L00xxx-JJLqL-JdxxxL~L~000xxx
I 0 0 x x
3 LLOOI 0 0 L xL L L L LL L L L LL L L L 4L 4 4 4 LL x L J 4
Figure 4 - Eastbound Detectors
Z./D&pN YN YN YN YN YN YN YN YN YN YY YY YN YN YN YY YY YN YN YY YY YY YY YY YY YN YN YN YN NN NN NN NN NN NN NN N
NNNNN
Smart Corridor Freeway Detector Data page 8 March 1,1993

Zone Detector Data
Santa Monica - Route 10 - WestboundFrom Soto to Centinela
Lane Number:Zone # Mile Cross St. lane 1 2 3 4 5 6 7 8
1569 18.75 S. Louis ddddxxxx1567 18.53 State980 18.5 Bus. State
1531 0.52 Echandia1558 0.18 E. of Macy1207 14.74 oak813 14.12 Hoover808 13.66 Vermont 1
1206 13.53 Budlong952 13.21 Normandie 1
1505 12.95 Western 2828 12.7 Western 1
1501 12.58 Gramercy809 12.23 Arlington
1502 11.53 Crenshaw1202 11.06 West1540 10.7 Harcourt265 10.53 La Brea 2826 10.24 La Brea 1
1238 9.8 Hauser811 9.21 Fairfax252 8.75 La Cienega
1534 8.36 Cattarauga262 7.81 Robertson
1532 7.22 Manning1231 6.73 Motor1230 6.15 Weshvood1227 4.77 Bundy1226 4.37 Pica1225 3.93 Centinela
3454444455544454454445544
~~~xxxxxXLLXXOOL
Figure 5 - Westbound Detectors
9 10 11 12 13 14 15x x x x x o xx x x x x o xx x x x x o xx x x x x o xx x x x x o xx x x x x o x
LxdLxOxx x x x x x xLOdjxxxx x x x x o xx x x x x x xx x x x x o xL00xxxxx x x x x0 xx x x x x o xx x x x x o xL-/Oxxxx
0L00xxx
x x x x x o x
CD MapNNNNN
Y YY YY YY YY YY YY YY YN YN YN YY YY YY YN YN YN YN YN YN YN YN YN YN YN Y
Smart Corridor Freeway Detector Data page 9 March 1,1993

Beverly Hills
Smart Corridor: Santa Monica Freeway
Hollywood
Mannin La Cienega HauSer Western 2 Hooveri I I 1
La Cieneg! HWSeI
Culver City
Figure 6: Map of Smart Corridor Freeway

The last two columns indicate whether collector/distributor lanes are in the area and if the zonewas located on a map of the Santa Monica Freeway. Figure 7 summarizes the results from thisclassification of data:
Detector 4 J&w) X 0 (blank) TotalLocation E W T E W T E W T E W T E W T E W TMainline 49 39 88 1 1 3 1 4 15 4 19 29 13 42 62 48 110 166 107273Other 19 19 38 60 23 83 165 165 330 70 29 99 135107242 449343 792Total 68 58 126 71 26 97 180 169 349 99 42 141 197155352 6154501065
Figure 7: Summary of Detector Results
Several points should be noted in terms of the general validity of the data:
l According to the results of the study, only about 32% of the mainline freeway detectors arereturning data that might be accurately used for analysis. Again, it should be noted that eventhis data is not certain to be accurate; it is likely that even less of the detectors are returningtrue values. A cross-checking of this data with field measurements at certain locations wouldbe desirable for validation. On the other hand, it is possible that some of the missing data maybe because certain detectors do not even exist. If this is the case, the percentage offunctioning detectors may be underestimated. A more detailed study may be needed, but itseems safe to say that a large proportion of the detectors are not returning good data.
l The usable data is spotty in many areas and two major trouble spots exist. First, the west endof the Santa Monica Freeway between La Cienega and Centinela has very few detectorsworking. Secondly, the section between the Harbor and Golden Gate freeways has nofunctional detectors whatsoever. This is a 5 mile gap in the data.
l No information could be found relating to detectors east of I-5. Without an accurate map ofthese detectors, it is not particularly helpful. Also, it is possible that the detector data may beinvalid, because magnetic detectors were used in this area. The freeway structures includemetal, which may be setting off the detectors.
B. Mainline Flow and Occupancy Data
Using the data from 6 A.M. to 12 noon on Tuesday Dec. 8, 1992, several studies of flow andoccupancy were made. The first step was to develop aggregate spreadsheets. For each zone,detectors from the (assumed) mainline lanes were grouped together and data values were summed(for volumes) and averaged (for occupancies). To further clarify, the data was aggregated into15 minute periods by simply summing (or averaging) over blocks of three 5 minute periods.Figure 8 presents the occupancy data by mainline freeway zone by time. Figure 9 provides similardata for the volume data. Note that data is provided for freeway sections between Centinela andapproximately I-5 (zone numbers 1525-913 eastbound and 1207 to 1225 westbound). Also, thevolume data is aggregated over the lanes in the freeway mainline section (given in the secondcolumn). The occupancy data is calculated using an average (non-weighted) over the lanes.
Smart Corridor Freeway Detector Data page 11 March 1,1993

Zone #Lanes1525 4 0 0 0 0 0 0 0 0 0 0 0 0 0 0 0 0 0 0 0 0 0 0 0 01526 4 0 0 0 0 0 0 0 0 0 0 0 0 0 0 0 0 0 0 0 0 0 0 0 01527 5 0 0 0 0 0 0 0 0 0 0 0 0 0 0 0 0 0 0 0 0 0 0 0 01530 5 0 0 0 0 0 0 0 0 0 0 0 0 0 0 0 0 0 0 0 0 0 0 0 0254 4 5 6 18 10 14 I5 13 13 13 13 13 12 12 12 13 11 11 12 12 I2 12 12 13 12
1631 5 0 0 0 0 0 0 0 0 0 0 0 0 0 0 0 0 0 0 0 0 0 0 0 0667 5 4 5 8 IO 19 31 27 12 10 14 I1 10 10 12 14 10 9 9 10 9 9 9 10 9
1533 5 0 0 0 0 0 0 0 0 0 0 0 0 0 0 0 0 0 0 0 0 0 0 0 0668 5 5 6 8 11 29 32 35 22 17 18 24 15 12 13 19 11 10 12 I2 10 12 I2 13 II
1234 5 0 0 0 0 0 0 0 0 0 0 0 0 0 0 0 0 0 0 0 0 0 0 0 0266 4 0 0 0 0 0 0 0 0 0 0 0 0 0 0 0 0 0 0 0 0 0 0 0 0562 4 4 7 0 0 0 0 0 0 0 0 0 0 0 0 0 0 0 0 0 0 0 0 0 0
1537 4 16 18 19 20 22 25 30 28 31 34 35 26 22 22 21 20 20 20 20 20 20 20 20 20669 5 25 26 38 47 49 52 56 57 56 58 56 55 47 45 48 48 29 28 29 29 29 29 29 29
1538 5 0 0 0 0 0 0 0 0 0 0 0 0 0 0 0 0 0 0 0 0 0 0 0 0825 4 8 19 7 9 11 24 21 19 32 43 21 31 18 29 16 I1 10 9 9 10 26 18 10 IO261 4 7 10 31 33 39 42 43 38 39 38 41 41 33 32 27 24 12 12 12 13 13 13 14 14947 4 28 28 28 28 28 28 28 28 28 28 28 28 28 28 28 28 28 28 28 28 28 28 28 9
I503 5 14 15 16 17 18 19 19 23 24 23 21 20 21 19 19 19 17 17 17 17 17 17 17 18827 5 7 8 25 27 28 31 32 35 37 33 32 29 31 26 27 33 I1 12 II 11 11 11 I2 13
1504 5 5 7 21 20 23 24 27 29 27 26 24 20 16 17 18 20 II 9 9 9 9 II 9 10812 4 16 16 16 16 16 16 16 16 17 17 17 17 17 17 17 17 17 16 17 17 16 17 17 16986 4 23 24 25 25 26 27 30 30 29 29 29 30 26 25 25 25 25 25 25 25 25 25 25 25
1504 5 0 0 0 0 0 0 0 0 0 0 0 0 0 0 0 0 0 0 0 0 0 0 0 0812 4 0 0 0 0 0 0 0 0 0 0 0 0 0 0 0 0 0 0 0 0 0 0 0 0986 4 0 0 0 0 0 0 0 0 0 0 0 0 0 0 0 0 0 0 0 0 0 0 0 0810 5 5 7 21 25 23 28 34 34 31 29 31 25 24 20 17 17 9 8 9 9 9 10 IO 10824 4 0 0 0 0 0 0 0 0 0 0 0 0 0 0 0 0 0 0 0 0 0 0 0 0
1506 4 1 1 2 2 2 2 2 2 2 2 2 2 2 2 2 2 2 2 2 2 2 2 2 2807 5 40 40 40 40 40 40 40 40 40 40 40 40 40 40 40 40 40 40 40 40 40 40 40 40
1507 5 22 22 23 22 22 22 23 22 22 22 22 22 22 23 22 22 22 22 22 22 22 22 23 22911 4 28 28 28 28 28 28 28 28 28 28 28 28 28 28 28 28 28 28 28 28 28 28 28 28640 4 0 0 0 0 0 0 0 0 0 0 0 0 0 0 0 0 0 0 0 0 0 0 0 0645 4 0 0 0 0 0 0 0 0 0 0 0 0 0 0 0 0 0 0 0 0 0 0 0 0653 5 12 12 12 13 12 12 13 12 12 12 12 12 13 13 13 13 13 13 13 13 13 13 13 13654 5 12 13 14 14 14 14 14 15 15 14 14 14 13 13 13 13 13 13 12 13 13 13 13 13655 5 2 3 4 4 4 5 5 6 6 8 5 5 3 3 3 2 2 2 2 2 2 2 3 2912 5 2 3 3 4 5 5 5 5 5 5 4 4 5 4 4 5 5 5 4 5 5 5 5 6913 5 4 5 7 7 8 9 9 10 9 9 8 8 7 6 7 6 7 6 6 6 6 6 6 6
Eastbound Occupancy 6 A.M. to 12 Noon
5:OO 6:lS 6:30 6:45 7~00 7~15 7:30 7:45 8:OO 8~15 8:30 8:45 9~00 9:15 9:30 9:45 1O:OO lo:15 10:30 10:4S 11:06 11:lS ll:w) 11:455:lS 6:30 6:45 7~00 7x15 730 7~45 MO 8:15 830 8~45 9:OO 9~15 9~30 9:45 lo:00 10~15 lo:30 l&45 11:OO 11:lS 1MO 11245 12~06
Figure 8: Detector Occupancy

Zone #Laws
1207 3 37 38 38 38 38 38 38 38 38 38 38 38 38 38 38 38 38 38 38 38 38 38 38 38
813 4 0 0 0 0 0 0 0 0 0 0 0 0 0 0 0 0 0 0 0 0 0 0 0 0
808 5 1 2 14 14 13 15 I1 I2 8 10 10 9 9 9 8 9 2 2 17 16 2 2 2 2
1206 4 34 37 38 37 37 44 53 54 55 55 52 52 53 53 54 53 43 41 37 41 37 37 39 37
952 4 10 12 28 28 25 42 48 42 42 47 50 47 49 43 41 39 20 18 14 17 16 15 18 13
1505 4 34 37 38 38 38 48 48 50 53 51 50 50 49 49 50 50 42 40 38 39 39 39 39 39
828 4 15 16 16 17 17 16 16 16 15 16 15 15 I5 15 16 16 I5 16 16 16 16 16 16 16
1501 4 56 58 59 59 60 64 66 66 67 64 64 64 64 64 64 64 60 59 58 58 58 58 57 58
809 5 8 10 25 41 38 50 60 57 58 59 63 62 56 54 53 52 33 31 28 28 27 26 27 24
1502 5 I7 18 21 28 31 41 45 45 44 38 41 31 18 17 17 17 21 20 19 19 19 19 18 19
1202 5 36 37 40 42 47 48 50 51 50 48 47 47 40 36 36 36 39 39 38 38 38 37 37 38
1540 4 41 43 43 43 43 43 43 43 43 43 43 43 43 43 43 43 43 43 43 43 43 43 43 14
265 4 7 10 28 36 42 48 51 47 41 37 30 29 19 11 8 7 10 II 11 9 9 9 8 9
826 4 0 0 0 0 0 0 0 0 0 0 0 0 0 0 0 0 0 0 0 0 0 0 0 0
1238 5 0 0 0 0 0 0 0 0 0 0 0 0 0 0 0 0 0 0 0 0 0 0 0 0
811 4 6 8 25 40 47 48 49 53 47 54 44 44 36 18 9 9 II II 10 9 9 9 IO 10
252 4 0 0 0 0 0 0 0 0 0 0 0 0 0 0 0 0 0 0 0 0 0 0 0 0
1534 5 0 0 0 0 0 0 0 0 0 0 0 0 0 0 0 0 0 0 0 0 0 0 0 0
262 4 0 0 0 0 0 0 0 0 0 0 0 0 0 0 0 0 0 0 0 0 0 0 0 0
1532 4 47 40 41 49 48 46 47 42 41 40 40 40 41 40 36 36 37 38 38 37 37 38 38 38
1231 4 0 0 0 0 0 0 0 0 0 0 0 0 0 0 0 0 0 0 0 0 0 0 0 0
1230 5 0 0 0 0 0 0 0 0 0 0 0 0 0 0 0 0 0 0 0 0 0 0 0 0
1227 5 0 0 0 0 0 0 0 0 0 0 0 0 0 0 0 0 0 0 0 0 0 0 0 0
1226 4 0 0 0 0 0 0 0 0 0 0 0 0 0 0 0 0 0 0 0 0 0 0 0 0
1225 4 0 0 0 0 0 0 0 0 0 0 0 0 0 0 0 0 0 0 0 0 0 0 0 0
Westbound Occupancy 6 A.M. to 12 Noon
6:OO 6:15 630 6:45 7~00 7~15 7:30 7:4J %:OO 8~15 8:30 8~45 9:OO 9:15 9:30 9:4S lo:00 lo:15 IO:30 lo:45 11:OO 11:15 11:30 11:456:lS 6:30 6:45 7:00 7:s 7:30 7:4s 8:OO 8:15 MO 8:45 9:Oo 9:ts 930 9:45 1o:OO 10315 lo:30 10:45 11:OO 11:15 11:30 11:45 12m
Figure 8: Detector Occupancy

Zone I Lanes1525 41526 41527 51530 5254 4
I631 5667 5
1533 5668 5
1234 5266 4562 4
1537 4669 5
1538 5825 4261 4947 4
1503 5827 5
1504 5812 4986 4810 5824 4
1506 4807 5
1507 4911 4640 5645 5653 4654 4655 4912 5913 5
Eastbound Flows: 6 A.M. to 12 Noon
6~00 6:lS 6~30 6~45 7:00 7~15 730 7:45 8:OO 8:15 8:30 8:45 9~00 9~15 9:30 9~45 lo:00 lo:15 1030 lo:45 II:00 11:lS 11:30 11:456:lS 630 6:45 7:oo 7:lS 7:30 7:45 am 8:15 830 8:45 9:oo 9x15 930 9:45 lo:00 lo:15 1090 lo:45 11:oo 11:lS 11:30 11:45 12:oo
0 0 0 0 0 0 0 0 0 0 0 0 0 0 0 0 0 0 0 0 0 0 0 00 0 0 0 0 0 0 0 0 0 0 0 0 0 0 0 0 0 0 0 0 0 0 00 0 0 0 0 0 0 0 0 0 0 0 0 0 0 0 0 0 0 0 0 0 0 00 0 0 0 0 0 0 0 0 0 0 0 0 0 0 0 0 0 0 0 0 0 0 0
817 1128 1426 1672 1892 2055 1861 1749 1691 1750 1728 1710 1680 1781 1809 1713 1709 1757 1749 1698 1718 1682 1773 17110 0 0 0 0 0 0 0 0 0 0 0 0 0 0 0 0 0 0 0 0 0 0 0
725 986 1308 1532 1773 1926 1748 1650 1614 1677 1617 1589 1584 1648 1695 1584 1557 1594 1642 1503 1626 1551 1666 15760 0 0 0 0 0 0 0 0 0 0 0 0 0 0 0 0 0 0 0 0 0 0 0
690 933 1286 1482 1757 1853 1699 1585 1499 1603 1555 1509 1481 1524 1621 1493 I434 1470 1526 I450 1461 1458 1574 15230 0 0 0 0 0 0 0 0 0 0 0 0 0 0 0 0 0 0 0 0 0 0 00 0 0 0 0 0 0 0 0 0 0 0 0 0 0 0 0 0 0 0 0 0 0 0
7743a3ss 0 0 0 0 0 0 0 0 0 0 0 0 0 0 0 0 0 0 0 0 0 0816 1060 1449 1773 1914 1929 1719 1656 1370 1532 1487 1713 1600 1511 1781 1579 1534 1567 I635 1594 1582 1572 1694 1702463 621 897 1095 1163 1206 1067 1008 894 940 962 1022 1029 930 1075 962 902 913 954 927 924 936 993 999
0 0 0 0 0 0 0 0 0 0 0 0 0 0 0 0 0 0 0 0 0 0 0 01019 1357 1709 2045 2238 2147 2046 1780 1790 1819 1866 1925 1840 1838 2098 1868 1795 1801 1913 1909 1816 1887 1985 1927973 1319 1734 2037 2197 2146 2065 1794 1756 1809 1906 1927 1876 1847 2092 1877 1786 1809 1865 1882 1820 1849 1934 1932
1229 1230 1230 1230 1230 1230 1230 1230 1230 1230 1230 1230 1230 1230 1230 1230 1230 1230 1230 1230 1230 1230 1230 410852 1149 1518 1741 1822 1816 1717 1500 1409 1539 1599 1650 1588 1551 1736 1486 1506 1534 1562 1594 1534 1579 1630 1638915 1260 1622 1946 2013 2090 2022 1802 1714 1834 1889 I930 1867 1811 1901 1691 1666 1665 1657 1694 1683 1665 1742 1771
0 0 0 0 0 0 0 0 0 0 0 0 0 0 0 0 0 0 0 0 0 0 0 00 0 0 0 0 0 0 0 0 0 0 0 0 0 0 0 0 0 0 0 0 0 0 00 0 0 0 0 0 0 0 0 0 0 0 0 0 0 0 0 0 0 0 0 0 0 0
478 644 836 994 1054 1062 954 860 833 918 884 913 886 882 854 809 809 772 732 761 759 784 760 815358 339 418 370 459 413 435 449 463 458 465 450 464 415 463 460 476 413 447 453 378 475 489 469761 1046 1343 1545 1602 1590 1367 1339 1284 1360 1355 1407 1346 1325 1288 1207 1294 1217 1206 1224 1229 1243 1244 1308882 1192 1550 1758 1840 1782 1556 1509 1493 1512 1549 1579 1482 1516 1559 1460 1554 1436 1478 1463 1458 1480 1557 1639
0 0 0 0 0 0 0 0 0 0 0 0 0 0 0 0 0 0 0 0 0 0 0 0400 534 625 665 733 753 691 641 641 602 639 579 590 558 524 641 560 538 616 630 653 660 644 715
0 0 0 0 0 0 0 0 0 0 0 0 0 0 0 0 0 0 0 0 0 0 0 017 18 23 23 13 22 23 12 16 24 22 22 22 16 21 19 18 27 38 13 21 25 26 28
105 164 155 158 154 154 157 142 145 127 126 118 129 121 88 128 122 139 135 118 135 141 153 I50658 660 660 660 660 660 660 660 660 660 660 660 660 660 660 660 660 660 660 660 660 660 660 660
0 0 0 0 0 0 0 0 0 0 0 0 0 0 0 0 0 0 0 0 0 0 0 066 84 94 125 136 114 146 114 125 142 141 118 114 I25 92 126 109 119 126 107 113 110 111 123
530 531 563 563 569 562 578 562 565 559 567 567 582 579 596 582 590 594 614 605 619 594 623 601
Figure 9: Detector Flow Data

Westbound Flows: 6 AM to 12 Noon
Zone #Lanes
1207
813
808
1206
952
1505
828
1501
809
1502
1202
1540
265
826
1238
811
252
1534
262
1532
1231
1230
1227
1226
1225
3
4
5
4
4
4
4
4
5
5
5
4
4
4
5
4
4
5
4
4
4
5
5
4
4
a:? 6~15 630 6:45 7:00 7:15 7:30 7:45 8:00 8:lS 830 8:45 9~00 9~15 9:30 9:45 1O:OO lo:15 tOdO lo:45 11:OO 11:15 11:30 11:456:lS 630 6:45 7:oo 7:s 7:30 7:45 am 8:15 8:30 8:45 9:Oo 9:lS 9:30 9:45 IO:00 l&15 lo:30 l&45 11:OO 11:lS 11:30 lb45 12:oo
8 40 40 40 40 40 40 40 40 40 40 40 40 40 40 40 40 40 40 40 40 40 40 40
10 0 0 0 0 0 0 0 0 0 0 0 0 0 0 0 0 0 0 0 0 0 0
10 0 0 0 0 0 0 0 0 0 0 0 0 0 0 0 0 0 0 0 0 0 0
539 1742 1961 2024 1808 1621 1265 997 984 899 1138 1188 1192 1216 1210 1173 1234 1834 1883 1850 1910 1901 1919 1835
543 1704 1935 2006 1783 1532 1186 1025 916 872 1143 1208 1201 1177 1197 1160 1281 1821 1894 1793 1905 1873 1882 1828
601 1822 2082 2223 2024 1787 1320 1227 1025 974 1362 1353 1358 1370 1374 12% 1479 1960 2068 1960 2069 2041 2058 1965
82 201 233 252 254 292 214 230 183 229 219 188 220 210 201 253 233 232 254 350 285 271 285 302
358 964 1061 1138 1023 860 645 557 499 487 696 672 698 695 690 659 780 983 1031 1001 1036 1026 1024 968
555 1731 2006 2292 1750 1700 1268 I064 974 986 1250 1243 1193 1134 1230 1164 1398 1683 1748 1590 1764 1711 1679 1609
524 1658 1846 2082 1882 1378 1224 1161 883 1081 1245 1276 1360 1370 1367 1310 1627 1986 1982 1816 1934 1819 1816 1774
441 1382 1565 1756 1558 1214 1160 1110 870 1085 1153 1170 1305 1186 1163 1098 1352 1686 1666 1538 1652 1492 1530 1485
389 1140 1140 1140 1140 1140 1140 1140 1140 1140 1140 1140 1140 1140 1140 1140 1140 1140 1140 1140 1140 1140 1140 1140
576 1760 1991 2145 1873 1532 1326 1272 1050 1368 1379 1477 1529 1643 1544 1474 1770 2156 2074 2070 2121 1961 2005 1943
10 0 0 0 0 0 0 0 0 0 0 0 0 0 0 0 0 0 0 0 0 0 0
10 0 0 0 0 0 0 0 0 0 0 0 0 0 0 0 0 0 0 0 0 0 0
474 1513 1716 2007 1596 1481 1350 1307 1195 1618 1513 1629 1720 1710 1484 1451 1569 1904 1878 1825 1872 1713 1805 1732
JO 0 0 0 0 0 0 0 0 0 0 0 0 0 0 0 0 0 0 0 0 0 0 0
10 0 0 0 0 0 0 0 0 0 0 0 0 0 0 0 0 0 0 0 0 0 0
10 0 0 0 0 0 0 0 0 0 0 0 0 0 0 0 0 0 0 0 0 0 0
350 1417 1606 1696 1663 1825 1927 1768 2123 2144 2123 2143 2232 2151 1998 1820 1805 2061 2031 2036 1948 1978 1958 1957
10 0 0 0 0 0 0 0 0 0 0 0 0 0 0 0 0 0 0 0 0 0 0
10 0 0 0 0 0 0 0 0 0 0 0 0 0 0 0 0 0 0 0 0 0 0
10 0 0 0 0 0 0 0 0 0 0 0 0 0 0 0 0 0 0 0 0 0 0
10 0 0 0 0 0 0 0 0 0 0 0 0 0 0 0 0 0 0 0 0 0 0
10 0 0 0 0 0 0 0 0 0 0 0 0 0 0 0 0 0 0 0 0 0 0
Figure 9: Detector Flow Data
Using these tables, it is possible to get a general assessment of the congestion on the morning ofDecember 8. Traffic becomes very heavy on the freeway around 6:30 A.M. and remainscongested (occupancies greater than 20 percent) until about 9:30 A.M. The late morning hasrelatively high flow values but lower occupancies (15 to 20 percent). However, with data onlyavailable for about one third of the detectors, it is impossible to perform a complete analysis.Therefore, it was decided to study a small subset of the detectors in order to present a sample ofthe studies that would be possible with a complete set of accurate detector data.
Two zones with reasonable data were selected for more detailed analysis: Crenshaw (zonenumbers 827 eastbound and 1502 westbound) and La Brea 2 (261 eastbound and 265westbound). These zones are located exactly one mile apart in the approximate center of theSmart Corridor freeway section. Figure 10 shows flow (traffic volume) for these detectors overthe time period. Note that La Brea is a four-lane section while Crenshaw has five, but the volumedata are presented as hourly flows per lane. The graphs show good correlation between the flowson the two detectors. Also, there may have been an incident upstream of the westbound detectorsduring the morning rush hour; the flows fall off substantially during this period.
Figure 11 shows the average occupancy per lane for each of the zones during the same period.Again, there is generally a good correlation between the data, as would be expected for two zoneslocated in close proximity to each other. The eastbound and westbound traffic appears to sharplydecrease in density by around 10 A.M. The westbound traffic decreases earlier; around 8:45A.M.
Figure 12 provides a scatter plot of flow vs. occupancy for these detectors, (Density is linearlyrelated to occupancy as a function of the detectable vehicle length and detector zone length.) Theflow/occupancy graph in Figure 12 also appears to reasonably represent the relationship betweenflow and occupancy that might be expected on a freeway section, although the flow data appearsto be somewhat high for occupancies around 30%.
These graphs are a sample of the analysis that can be accomplished for any of the zones in thedata set (subject to the integrity of the data). Other traffic flow relationships naturally followfrom the flow and occupancy data, and it would be a straightforward process to study these.
Smart Corridor Freeway Detector Data page 16 March 1,1993

Flow
(ve
hicl
es/h
our/l
ane)
6:00
6:15
6:30
6:45
7:00
7:15
7:30
7:45
8:00
8:15
8:30
cc. 8:
45B fD
990
9:15
9:30
9:45
1o:O
O10
: 15
10:3
010
:45
11:O
O11
:15
11:3
011
:45
Flow
(ve
hicl
es/h
our/l
ane)
06:
006:
156:
306:
457:
007:
157:
30u
7:45
8 s8:
00s
8:15
48:
305 4
E8:
45a
a93
0% w
9:15
9:30
@ !z9:
45s
1o:O
O2
10:1
5sd
10:3
010
:45
11:O
O11
:15
11:3
011
:45

06:0
0-
615
--63
0 --
6145
--7:
00 -
-7:
15 --
7:30
--7:
45 -
-8:O
O --
8:15
--8:
30 --
cc. 8~
45
--E a
930
--9:
15 --
9:30
--9:
45 -
-lo
:OO
--10
:15
--10
:30
--10
:45
--11
:00
--11
:15
--11
:30
--11
:45
-
Occ
upan
cy (
%)
sfs
“0
%
“0
?i0
6:00
-6:
15 -
-6:
30 --
6:45
--7:
00 -
-7:
15 -
-7:
30 --
7:45
--
8:00
--
8:15
--8:
30 --
gi 8:
45
--i
9:oo
--
9:15
--
9:30
--
9:45
--
10:0
0 --
10:1
5 --
10:3
0 --
10:4
5 --
11:0
0 --
11:1
5 --
11:3
0 --
11:4
5 -
Occ
upan
cy (
%)
wlz
Go
ulo
vlo
~lG
t4W
WP

88Oo a
cfifp0
O0
0
0
Flow vs. Occupancy
:*l $ l
l l
l 0:�
l 0
l
l
0 0
O* O :$0
0 I I I I II I I I I0 10 20 30 40 50 60
Occupancy (%)
n LaBrea2EB 0 Crenshaw EB l Crenshaw WB 0 La Brea WB
1
0
Figure 12: Flow vs. Density (both Crenshaw and La Brea 2 detectors)
Smart Corridor Freeway Detector Data page 19 March 1,1993

Section 5: Further Investigations
The conclusions in this report are based on observations and analysis of a relatively limited dataset. This section suggests some additional studies that might be undertaken with additionalresources.
A. Additional Days and TimesData was gathered for four days in early December 1992. While these periods were selected tominimize other factors (e.g., Christmas and weekend traffic), it is certainly premature to baseanalysis on one week of data. At a minimum, data could be collected during one other weekduring the year (probably in the summer). Also, given the relatively high frequency of incidentson the Santa Monica Freeway sections, it would be beneficial to have a larger sample size forstudy. With more data, it would be possible to study congestion under the effects of trafficblockages and incident-free traffic.
Also, only the data from Tuesday was considered for this study. As a baseline, the data fromMonday (both morning and afternoon) was analyzed. This was done to set the procedures forhandling the data. However, the data from Monday was not closely studied because there wereheavy rains in the Los Angeles area on Monday, December 7. Since the weather was clear onTuesday, it was decided that it was the best day for study. However, to be complete, otherstudies could be made on the remaining data (Wednesday and Thursday).
Efforts were concentrated around the morning rush hour because expected traffic volumes andoccupancies were known. To check the integrity of the detector data, it was helpful to havebaseline figures to compare with the detector data. For more detailed studies, analysis of theafternoon rush hour and off-peak times would give more complete results.
B. Additional Detector DataObviously, the study is limited because only about one third of the detectors are operational. Fora complete analysis of the freeway section, a much higher percentage (at least 80%) would berequired. It is recognized that it would require significant effort for Caltrans to repair andcalibrate all of the freeway detectors. However, some automated method of traffic data collectionis very helpful for useful studies of the freeway.
Another limitation of the study is the lack of detailed maps to reference some of the detectorstations. For further research, it would be desirable to obtain accurate and detailed maps of thedetectors from Caltrans.
Perhaps more importantly, the issue of the ramp and collector/distributor detectors has still notbeen resolved as of this report. For the purposes of simulation, the flows on the ramps are moreimportant than detector data from the mainline freeway sections. Therefore, the logical next stepfor this study would be to concentrate efforts on determining, analyzing, and calibrating rampflow and occupancy data.
Smart Corridor Freeway Detector Data page 20 March 1,1993

It may be appropriate to have a meeting of involved parties as a next step for the analysis of thefreeway sections. This meeting might include members of the UC Berkeley project team andrepresentatives from Caltrans. Discussions could include limitations of the data (as found in thisstudy), additional data on location and operation of detectors (from Caltrans), and plans for futurestudy. With a relatively complete data set from the ramps, the simulation effort for the SmartCorridor would be enhanced.
C. Study RecommendationsFrom the results of the study, several recommendations can be made that may further the researcheffort. They are presented below as possible discussion points during future meetings:
Consider efforts directed toward increasing the number of detectors that give reliableinformation
Collect and analyze detector data from freeway ramps on the Santa Monica Freeway
Collect and analyze detector data from additional days and times; this effort was limited byproject scope.
Locate and/or develop a detailed and accurate map that includes current detector informationfor all detectors included in the study.
Smart Corridor Freeway Detector Data page 21 March 1,1993

Appendix: Data Extraction Program
Listed below is the source code for the data extraction program used for the freeway detectordata tapes. The program was initially developed by UC Irvine by a team including Steven Ritchie,Neil Prosser, and Kelvin Cheu and was extensively modified by Randall Cayford of ITS. Allmodified statements are bracketed by comment lines in the code in the following format:,****t*t************~~~~~,.
/* This query file reads Caltrans binary data tape with *//* each cycle (=30sec) occupying 2 tracks *//* modified from Neil Presser's original program by Kelvin Cheu *//* 10-25-91 *//* Institute of Transportation Studies, University of California, Irvine *//* all rights reserved */
/* modifications made *//* (1) in get-cycle0 *//* (2) in main0 *//* (3) in read-query0 *//* all modified statements enclose by ----- lines l /
#include <stdio.h>#include <io.h>#include <fcntl.h>#include <alloc.h>#include <stdlib.h>
#define MAX-ZONE-NO 200#define MAX-LANES 15#define MAX-CYCLES 2000#define MAX-READ 48
FILE *flog, *fvol, *fox ;int cycindex;long SKIP; /* offset to skip over garbage at front of tape */
getbytes (fd, pos, buf, n),****************~*******/int fd, n ;long pos ;char *buf ;f
long fpos;int numread;
fpos = lseek (fd, pos + SKIP, 0);numread = readtfd, buf, n) ;return(numread);
1
unsigned short getwordffd, pas),t**********C*****************/int fd ;long pos ;
tunsigned char i[2];getbytes (fd, pos, (char *)i, 2) ;return (i[Ol*256 + i[ll) ;I
cyc-to-time (cyc, time)
Smart Corridor Freeway Detector Data page 22 March 1,1993

,********c************/int cyc ;char *time :
Iint i ;if ((cyc < 0) II (cyc > 2879))
time[O] = I*' ;time[l] = I*' ;time[2] = '*I ;time[3] = '\O' ;return ;1 ;
i = cyc / 1200 ;time[O] = i + '0' ;cyc = cyc - i*1200 ;
i = cyc / 120 ;time[l] = i + '0' ;cyc = cyc - i*120 ;
time[2] = 1:' ;i = cyc / 20 ;time[3] = i + '0' ;cyc = cyc - i*20 ;
i = cyc / 2 ;time[4] = i + '0' ;cyc = cyc - i*2 ;
time[5] = ':' ;if (cyc == 1)
time[6] = '3' ;else
time[6] = '0' ;time{71 = IO' ;time[8] = '\O' ;I
read-header (fin, cyc),*t*******t*******t**/int fin ;unsigned short *cyc ;
Iunsigned int word-value ;int year, month, day, dayofweek, trackno ;char time-str [lo] ;
*cyc = getword (fin, OL) ;cyc-to-time (*cyc, time-str) ;
word-value = getword (fin, 2L) ;year = word-value / 512 ;word-value -= year * 512 ;month = word-value / 32 ;day = word-value - month * 32 ;
word-value = getword (fin, 4L) ;dayofweek = word-value / 256 ;trackno = word-value - dayofweek * 256 ;
fprintf (flog,fprintf (flog,fprintf (flog,
fprintf (flog,fprintf (flog,fprintf (flog,fprintf (flog,I
'\n\n TAPE HEADER INFORMATION') ;.\n ***********************., .'\n\n\n Date (MM/DD/YY) : %;d/%2d/%2d',month, day, year) :'\n First cycle number : %u', *cyc) ;'\n Time : %S", time-str) ;"\n Day of week : %Id", dayofweek) ;'\n Number of tracks : %ld", trackno) ;
Smart Corridor Freeway Detector Data page 23 March 1,1993

FILE *fin ;int *w-type :unsigned short *bcyc, *ecyc ;int zone [I, nlanes [I ;
(char time-str [lo] ;int i = 0, j, k ;
fscanf (fin, "
fscanf (fin, .*bcyc = j ;*ecyc = k ;
fprintf (flog,fprintf (flog,
%d", xx-type) ;
%d %d", Sj, &k) ;
l \n\n QUERY FIELDS') ;.\n ************., ;
cyc-to-time (*bcyc, time-str) ;
fprintf (flog, "\n\n First cycle : %u %s', *bcyc, time-str) ;
cyc-to-time (*ecyc, time-str) ;fprintf (flog, '\n Last cycle : %u %s', *ecyc, time-str) ;
fprintf (flog, '\n Print type : %d', l pr-type) ;
/*-------------------------------------------------------------~-----*~/* if ((*bcyc < 0 ) II ('bcyc > 28791 II (*ecyc < 0 1 II
(*ecyc > 2879) II (*bcyc > *ecyc))error (' error in cycle specification') ; */
if ((*bcyc < 0 1 II (*bcyc > 28791 II (*ecyc < 0 ) II(*ecyc t 2880) II (*bcyc > *ecyc))error (' error in cycle specification') :
/*-------------------------------------------------------------------*/
fprintf (flog, "\n Zones (with lane no.) : ") ;while (fscanf (fin, '%d %d', &zone[i], &nlanes[il) == 2)
(if ((zone[il < 0) II (zone[il > 2000))
error (' invalid zone number') ;fprintf (flog, '\n %6d (%ld)*, zone[il, nlanes[il) ;
if (nlaneslil > MAX-LANES)nlanes[i] = MAX-LANES;
i++ ;1
fprintf (flog, '\n\n\n') ;return (i) ;1
get-cycle (fin, offset, zone, nlanes, lanes,volume, occupancy),***C****************t***********f******~~~~**~~~~~~~~~~,int fin ;long offset ;int zone , nlanes;int lanes ; /* 0 = print lane config to log file */int *volume:int *occupancy;
Ilong off ;int j, track, length ;unsigned char list[MAX-READ] ;
if (lanes == 0) (fprintf (flog, '\n\n\n LANE CONFIGURATIONS') ;fprintf (flog, '\n *******************.) ;
I
off = offset + 4 + zone * 2 ;if (getbytes (fin, off, (char *) list, 2) != 2) (
puts ('error in reading zone offset') ;return(l);
Smart Corridor Freeway Detector Data page 24 March 1,1993
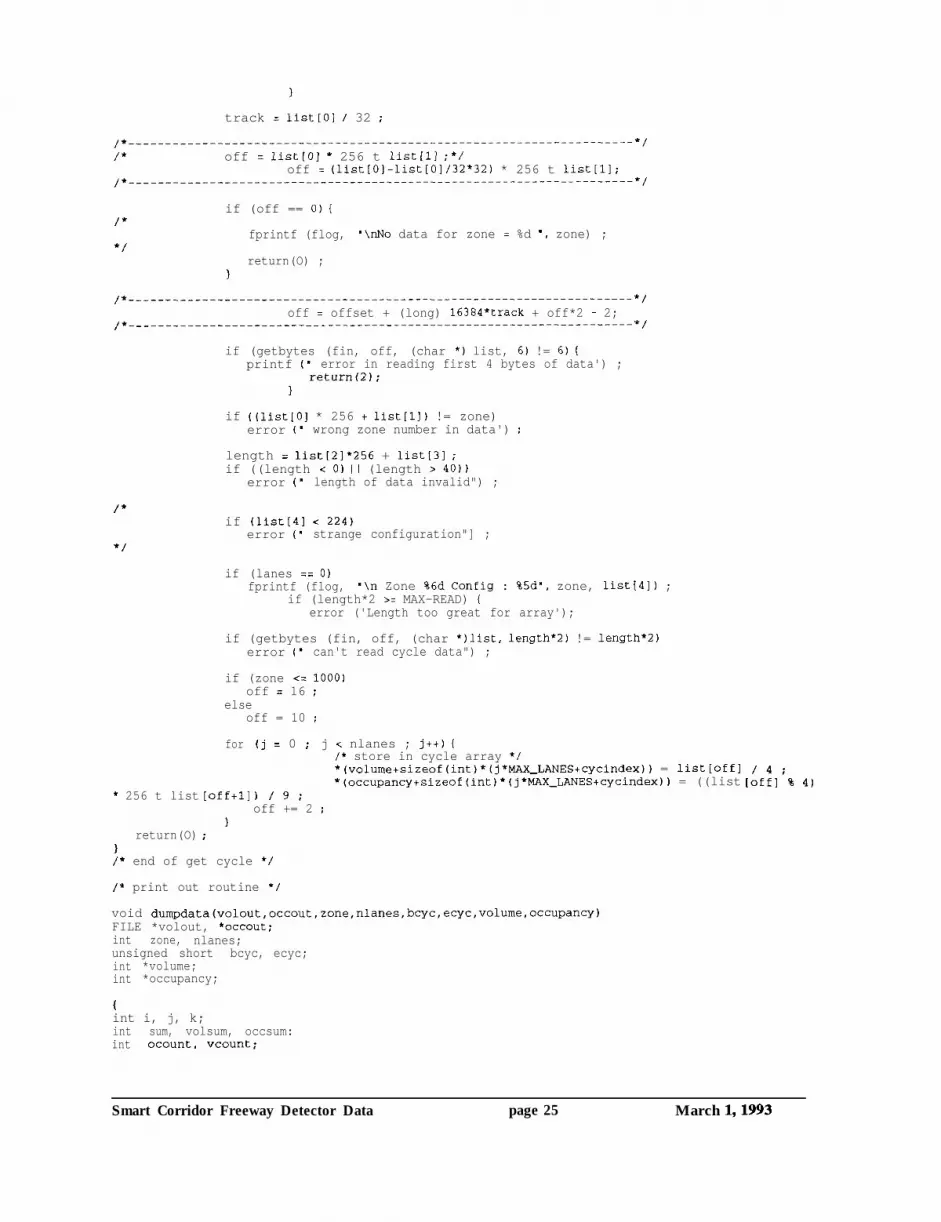
track = list]01 / 32 ;
,*---------------------------------------------------------------------~,i* off = list[O] * 256 t list[l] ;*/
off = (list[O]-list[0]/32*32) * 256 t list[l];,*---------------------------------------------------------------------~,
if (off == 0) (/*
fprintf (flog, '\nNo data for zone = %d ', zone) ;
return(O) ;1
,‘---------------------------------------------------------------------~,
off = offset + (long) 16384*track + off*2 - 2;,*---------------------------------------------------------------------~,
if (getbytes (fin, off, (char *) list, 6) != 6) (printf (' error in reading first 4 bytes of data') ;
return(a);1
if ((list[O] * 256 + list]111 != zone)error (' wrong zone number in data') :
length = list[2]*256 + list131 ;if ((length < 0) II (length > 40))
error (" length of data invalid") ;
/*
*/
* 256 t list
return(O)
if (list[4] < 224)error (" strange configuration"] ;
if (lanes == 0)fprintf (flog, '\n Zone %6d Config : %5d', zone, list[l]) ;
if (length*2 >= MAX-READ) (error ('Length too great for array');
if (getbytes (fin, off, (char *)list, length*2) != length*2)error (' can't read cycle data") ;
if (zone <= 1000)off = 16 ;
elseoff = 10 ;
for
offtl]
I
(j = 0 : j < nlanes ; jet) {/* store in cycle array */*(volume+sizeof(int)*(j*MAX-LANEStcycindex)) = list[offl*(occupancy+sizeof(int)*(j*MAX-LANEStcycindex)) = ((list
b/9;off += 2 ;
[:f;ill% 4)
1/* end of get cycle */
/* print out routine */
void dumpdata(volout,occout,zone,nlanes,bcYc,ecYc,volume,occuPancY)FILE *volout, *oCCOUt;int zone, nlanes;unsigned short bcyc, ecyc;int *volume;int *occupancy;
tint i, j, k;int sum, volsum, occsum:int ocount, vcount;
Smart Corridor Freeway Detector Data page 25 March 1,1993

for (j=O; j < nlanes; j++) {sum = 0;vcount = 0;volsum = 0;ocount = 0;occsum = 0;fprintf(volout;%d\t%d*, zone, jtl);fprintf(occout,'%d\t%d', zone, jtl);for (k=O; k <= ecyc - bcyc; ktt) {
sum++;if (*(volume+sizeof(int)*(j*MAX-LANEStk)) != -1) {
vcount++;volsum += *(volume+sizeof(int)*(j*MAX-LANES+k));
Iif (*(volume+sizeof(int)*(j*MAX-LANES+k)) != -1) (
ocount++;occsum += *(occupancy+sizeof(int)*(j*MAX-LANES+k));
Iif (sum == 10 && vcount != 0 && ocount != 0) [
fprintf(volout, '\t%d", tint) ((float) volsum /vcount * sum + 0.5));fprintf(occout, '\t%d", (int) ((float) occsum/ocount + 0.5));sum = 0;vcount = 0;volsum = 0;ocount = 0;occsum = 0;
if (sum != 0 && vcount != 0 && ocount != 0) (fprintf(volout, '\t%d", tint) ((float) volsum /vcount * sum + 0.5));fprintf(occout, '\t%d', tint) ((float) occsum/ocount + 0.5));
1fprintf(volout;\n');fprintf(occout,"\n');
error (mess),********tt,char *mess ;
(fprintf (flog, '\n\n ERROR -----\n %s', mess) ;printf ("\n\n ERROR -----\n %s\n", mess) ;fclose (flog) ;fclose(fvo1);
fclose(focc);exit (2) ;
main 0,*****,
1FILE *fquery ;int fin, fvo12, focc2 ;int retcode;int volume[MAXJANES][MAX-CYCLES];int occupancy[MAX-LANES] [MAX-CYCLES];
unsigned short begcyc, endcyc;
unsigned short bcyc, ecyc, cyc ,startcyc;int zone [MAX-ZONE-NO], nlanes [MAX-ZONEJOI, no-zones ;int ~01 [MAx-z~NE-No*MAx-LANES], occ [MAx-Z~NE-NO*MAX-LANESI ;
i n t i, j, pr-type ;int jj, kk;long k;unsigned char list[481 ;long offset = 0 ;char timestrl[lO], timestr2[10], timestr3[101 ;char filename 1241 ;
/* open query and data and log files */
Smart Corridor Freeway Detector Data page 26 March 1,1993

printf ('\nEnter binary data file name :- ') ;gets (filename) i
printf('\nEnter # of blocks to skip at beginning of file:- ');gets (list);
SKIP = (long) atoillist) * 16384;
if ((fquery = fopen ('query.dat', *r")) == NULL)error ('Can't open query.dat') ;
if ((fin = open (filename, O-RDONLY I O-BINARY)) == -1)error ('Can't open %s", filename) :
printf ('\nReading from file %s\n', filename) ;
if ((flog = fopen ('query.log', 'w')) == NULL)error ('Can't open query.log') ;
/* read header information and write to log file */read-header (fin, &cyc) ;startcyc = cyc;
/* read query data and write to log file */no-zones = read-query (fquery, &pr-type, &bcyc, &ecyc, zone, nlanes) ;begcyc = bcyc;endcyc = ecyc;
/* open output files */
if ((focc = fopen ('occ.dmp', '~'1) == NULL)error ('Can't open occ.dmp") ;
if ((fvol = fopen ("vol.dmp', "w')) == NULL)error ('Can't open vol.dmp.1 ;
for (k=O; k < no-zones; k++) (cyc = startcyc;bcyc = begcyc;ecyc = endcyc;offset = 0;
/* initialize */for (jj=O; jj < MAX-LANES; jjt+)
for (kk=O; kk < MAX-CYCLES; kk+t) (volume[jj][kk] = -1:occupancy[jj][kkl = -1;
I
/* seek first track */
if (cyc > bcyc)fprintf (flog, '\n\n WARNING - beg. cycle not found') ;
fprintf (flog, '\nProcessing following cycles :-'1 ;printf ('\nProcessing following cycles for zone %d :\n\n',zone[kl) ;
for (i = 0 ; ((i < 3000) && (cyc < bcyc)); it+)ioffset += (long) 16384*2 ;cyc = getword (fin, offset) ;cyc = cyc % 4096 ;fprintf (flog, '\n %ld', (long) cyc) ;printf (*\r%ld ', (long) cyc) ;1
if (cyc != bcyc)puts (' Could not find first cycle') ;
for (i = 0 ; ((i < 3000) && (cyc < ecyc)) ; it+)I
cycindex = cyc - bcyc;retcode = get-cycle (fin, offset, zone[k], nlanes[kl, 1,
volume, occupancy) ;if (retcode == 1 0 retcode == 2) {
Smart Corridor Freeway Detector Data page 27 March 1,1993

cyc = ecyc + 1;continue;
*/fprintf (flog, '\n %ld ****, (long) cyc) ;
printf ('\r%ld ***', (long) cyc) ;
,*--------------------------------------------------------------~--------~,offset += (long) 16384*2 ;
cyc = getword (fin, offset) ;
) /* end of loop through cycles */
dumpdata(fvol,focc,zone[k],nlanes[k],bcyc,ecyc,volume,occupancy);) /* end of loop through zones */
printf ('\n\nsuccessful Completion\n\n") ;fprintf (flog, '\n\n %d cycles extracted', i) ;fprintf (flog, '\n\n\n ****** SUCCESSFUL COMPLETION ******") ;fclosetfvol);fclose(focc);fclose(flog);
1
Smart Corridor Freeway Detector Data page 28 March I,1993


