Embed Size (px)
Citation preview
FRACTURE MECHANICS OF PIPES SUBJECTED TO REELING
Hugo A. Ernst Tenaris Group - Center for
Industrial Research Dr. Simini 250 (2804), Campana, Argentina [email protected]
Richard E. Bravo Tenaris Group - Center for
Industrial Research Dr. Simini 250 (2804), Campana, Argentina [email protected]
Federico Daguerre Tenaris Group - Tamsa
Km. 433.7 Carretera Via Xalapa, Veracruz (91697), México [email protected]
ABSTRACT
The fact that welded structures may contain flaws that do not necessarily affect structural integrity or service performance is implicitly recognized by most welding fabrication codes that specify weld flaw tolerance, or acceptance, levels based on experience and workmanship practice. However, these levels are somewhat arbitrary and do not provide a quantitative measure of structural integrity, i.e. how “close” a particular structure containing a flaw is to the failure condition. This concept is of special interest in cases in which the pipe is subjected to loads that produce important deformations. In particular, the reeling process, used to install offshore lines, produce large cyclic plastic deformation on the pipes. In this work, a method to perform a structural reliability analysis (SRA) for a tube subject to reeling is considered in detail. A fracture mechanics based methodology is reviewed and the points that need to be resolved before extending the methods to include reeling are clearly identified. The effect of the strain history on the applied and material fracture mechanics parameters were studied. A theoretical model was developed to describe the crack driving force evolution through strain cycles. A criterion was proposed and corroborated to represent material fracture resistance behavior. An experimental program was carried out. The material analyzed was an API 5L - X65 grade. Monotonic and cyclic fracture mechanic tests were performed on single edge notch in tension (SENT) specimens. The material fracture resistance curve was determined based on the monotonic tests. The cyclic tests were used to determine experimentally the applied fracture mechanic parameters evolution. A very good agreement between predicted and measured crack tip opening displacement (CTOD) values was obtained for the cases analyzed. A methodology to perform a SRA for tubulars subjected to reeling is proposed, and the results of the currently used and the proposed method were compared.
1 INTRODUCTION
1.1 Structural Reliability Assessment
The Structural Reliability Assessment (SRA) represents a convenient method that provides defect acceptability levels of a component. Two of the main failure mechanisms are fracture and plastic collapse. The concept of failure by “plastic collapse” refers to the failure of the remaining ligament of the defect due to the attainment of a critical value of plastic deformation on the ligament. The defect is considered as a lack of resistant area; neither the stress concentration around the defect tip nor the material notch sensitivity are taken in consideration. The load causing plastic collapse depends on material mechanical properties and structure and defect geometry. Fracture is a failure mechanism that involves the propagation of a crack in a structure.
As the crack driving force, the stress intensity factor, K, is applicable to conditions where the plastic zone at the crack tip is small compared with the size of the component/specimen in which the defect is located. However, in most structural materials, significant plasticity develops before failure.
For materials that fracture in an elastic-plastic way, alternative fracture parameters have been proposed, namely energy release rate, J, and the crack tip opening displacement, CTOD (δ).The applied and material fracture parameters are needed to perform a reliability analysis.
1.1.1 Applied Fracture Mechanics Parameters - Crack Driving Force:
The crack driving force, or applied J (Jappl), is calculated using equations involving the applied load, P (or load point displacement, v), the defect size and the geometry of the structure. Jappl is a fracture mechanics
International Symposium on Microalloyed Steels for the Oil and Gas IndustryEdited by W.J. Fazackerley, P. Bordignon, K. Hulka, and F. Siciliano
TMS (The Minerals, Metals & Materials Society), 2007
533
parameter indicating the severity of the stress-strain fields around the crack tip. Based on the deformation theory of plasticity, the fracture mechanics parameters can be evaluated using final value of P (or v).
Jappl = Jappl (a, P) = Jappl (a, v) (1)
Where a relation v = v (P, a), is assumed.
1.1.2 Material Fracture Mechanics Parameters - Material Fracture Resistance:
Some materials, exhibiting high enough toughness, do not fail catastrophically immediately after crack initiation. Instead, they develop a so-called material resistance to crack growth curve (R-curve or J-R curve), i.e. a plot of the material fracture resistance parameter, J, or CTOD, vs. crack increment, a.These curves characterize the material resistance to crack initiation and growth. They are obtained from lab tests [1].
Jmat = Jmat ( a) (2)
An ideally brittle material has a flat R-curve whereas a ductile metal has a rising R-curve. In metals, a rising R curve is normally associated with growth and coalescence of microvoids.
1.1.3 Fracture Criterion:
For fracture to occur, a detrimental combination of applied stress, crack dimension and the material fracture toughness is required, i.e., if the crack driving force is greater than or equal to the fracture toughness, failure by fracture will occur. For crack initiation:
Jappl = JIC (3)
On the other hand after some amount of crack extension, the crack growth process can be stable or unstable. This depends on material properties as well as characteristics of the whole structure and loading conditions.In early works, [2, 3, 4] the problem was tackled, for load control conditions, by comparing plots of the driving force with the material resistance curve. The instability condition occurs when the driving force curve is a tangent to the R-curve.
materialapplied dadJ
dadJ
=
(4)
The results of the structural reliability analysis may be obtained in terms of critical load, Pcrit, vs. acrit, P vs. v, etc., from these it can be determined if the component is suitable for the operation. Summarizing, the necessary elements to perform a SRA are the applied fracture mechanic parameters and the R-curve together with a fracture criterion. These concepts are applicable to processes where the structure under analysis is monotonically loaded. There are other cases where the structure is subject to loading cycles (load reversal points). For these cases it is not possible to correctly apply the methodology without adequate modifications.
1.2 Reeling of Pipes
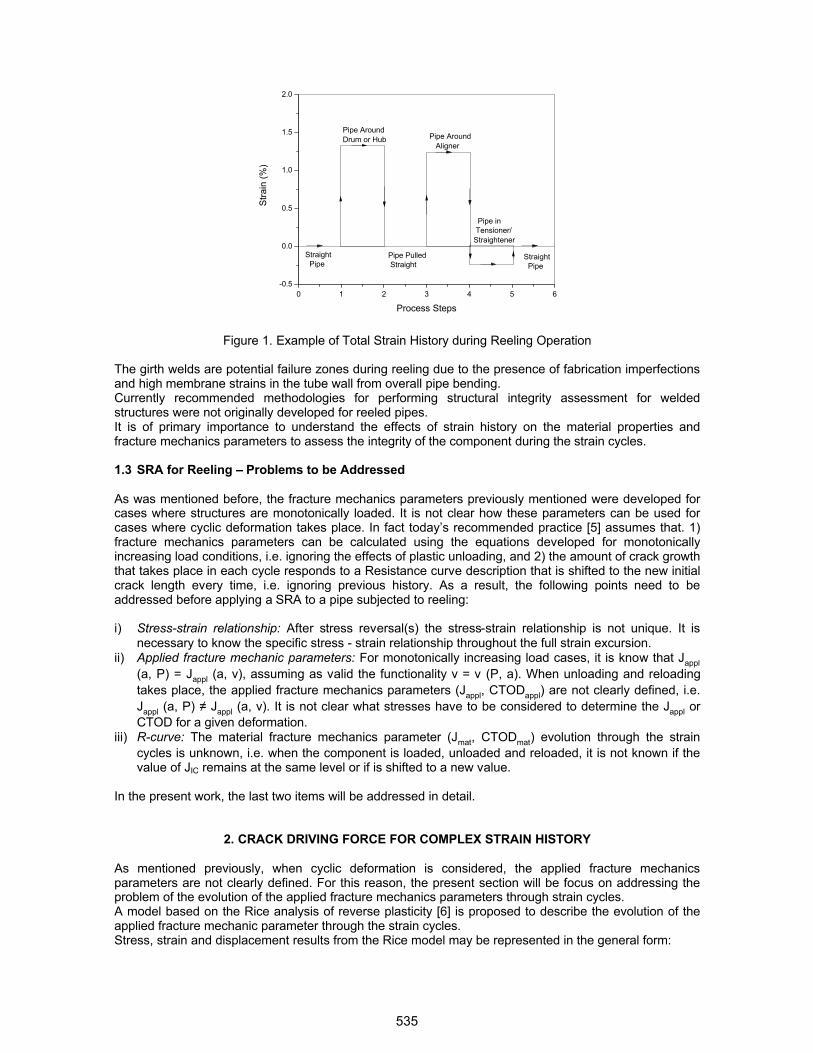
To install pipelines in offshore applications, the process of reeling is often used. Reeling is a method that provides a fast and efficient means of laying offshore pipelines. The reeling process imposes high plastic deformation on the pipe, due to bending. During the process the pipeline will be subjected to cyclic loading. In a standard cycle, the welded pipes are reeled onto a drum, reeled off, aligned and straightened, see Fig. 1.
534
0 1 2 3 4 5 6-0.5
0.0
0.5
1.0
1.5
2.0
Straight Pipe
Pipe in Tensioner/Straightener
Pipe Around Aligner
Pipe Pulled Straight
Pipe AroundDrum or Hub
Stra
in (%
)
Process Steps
Straight Pipe
Figure 1. Example of Total Strain History during Reeling Operation
The girth welds are potential failure zones during reeling due to the presence of fabrication imperfections and high membrane strains in the tube wall from overall pipe bending. Currently recommended methodologies for performing structural integrity assessment for welded structures were not originally developed for reeled pipes.It is of primary importance to understand the effects of strain history on the material properties and fracture mechanics parameters to assess the integrity of the component during the strain cycles.
1.3 SRA for Reeling – Problems to be Addressed
As was mentioned before, the fracture mechanics parameters previously mentioned were developed for cases where structures are monotonically loaded. It is not clear how these parameters can be used for cases where cyclic deformation takes place. In fact today’s recommended practice [5] assumes that. 1) fracture mechanics parameters can be calculated using the equations developed for monotonically increasing load conditions, i.e. ignoring the effects of plastic unloading, and 2) the amount of crack growth that takes place in each cycle responds to a Resistance curve description that is shifted to the new initial crack length every time, i.e. ignoring previous history. As a result, the following points need to be addressed before applying a SRA to a pipe subjected to reeling:
i) Stress-strain relationship: After stress reversal(s) the stress-strain relationship is not unique. It is necessary to know the specific stress - strain relationship throughout the full strain excursion.
ii) Applied fracture mechanic parameters: For monotonically increasing load cases, it is know that Jappl(a, P) = Jappl (a, v), assuming as valid the functionality v = v (P, a). When unloading and reloading takes place, the applied fracture mechanics parameters (Jappl, CTODappl) are not clearly defined, i.e. Jappl (a, P) Jappl (a, v). It is not clear what stresses have to be considered to determine the Jappl or CTOD for a given deformation.
iii) R-curve: The material fracture mechanics parameter (Jmat, CTODmat) evolution through the strain cycles is unknown, i.e. when the component is loaded, unloaded and reloaded, it is not known if the value of JIC remains at the same level or if is shifted to a new value.
In the present work, the last two items will be addressed in detail.
2. CRACK DRIVING FORCE FOR COMPLEX STRAIN HISTORY
As mentioned previously, when cyclic deformation is considered, the applied fracture mechanics parameters are not clearly defined. For this reason, the present section will be focus on addressing the problem of the evolution of the applied fracture mechanics parameters through strain cycles. A model based on the Rice analysis of reverse plasticity [6] is proposed to describe the evolution of the applied fracture mechanic parameter through the strain cycles. Stress, strain and displacement results from the Rice model may be represented in the general form:
535
)Y/P,,a/r(Y ijij θΣ=σ (5)
)Y/P,,a/r(E ijijij θΣε=ε 0 (6)
)Y/P,,a/r(Ua ijii θΣε=µ 0 (7)
for monotonic loadings, where r, are polar coordinates centered at the crack tip, P is a remote applied load, Y and 0 are a representative yield stress and strain, and ij, Eij and Ui are dimensionless functions of their arguments, reversing sign with sign reversal of P. The change in value of the field variables is given by: The stress, strain and displacement after unloading are ij - ij, ij - ij, µij - µij, respectively where the change in value of the field variables, due to load reduction from P to P – P, is given by:
)/P,,a/r(ijij 00 22 σ∆θΣσ=σ∆ (8)
)/P,,a/r(E ijijij 00 22 σ∆θΣε=ε∆ 9)
)/P,,a/r(Ua ijii 00 22 σ∆θΣε=µ∆ (10)
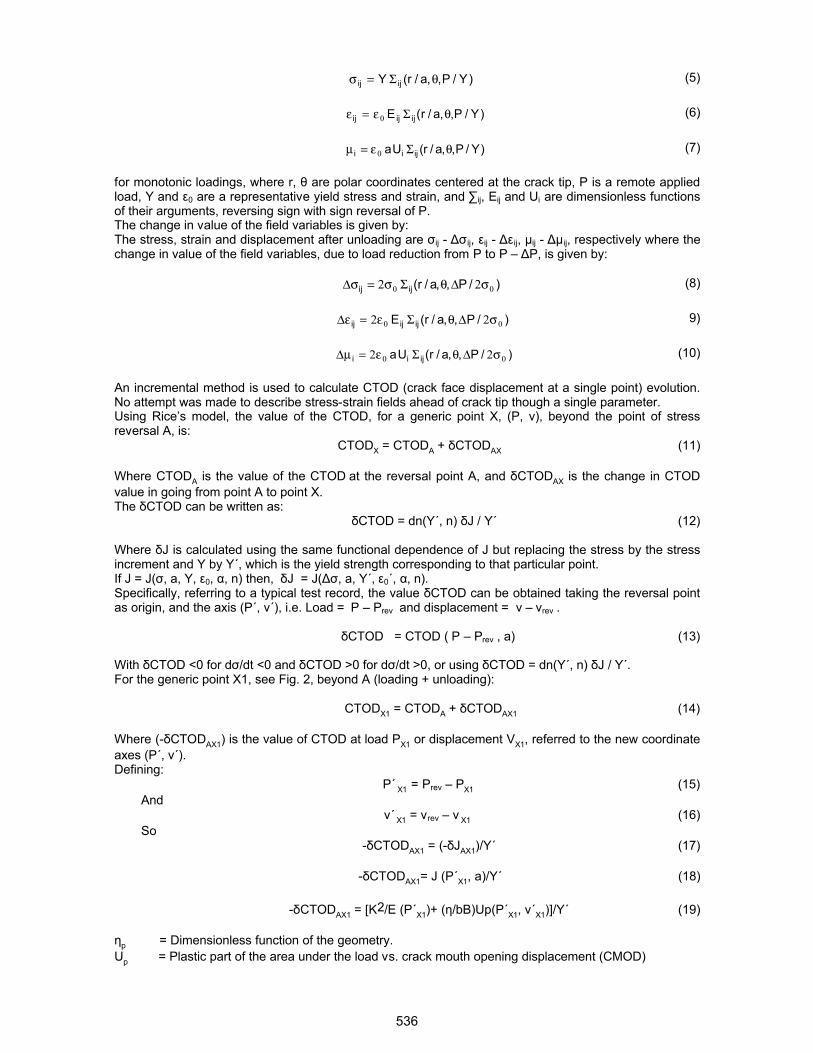
An incremental method is used to calculate CTOD (crack face displacement at a single point) evolution. No attempt was made to describe stress-strain fields ahead of crack tip though a single parameter. Using Rice’s model, the value of the CTOD, for a generic point X, (P, v), beyond the point of stress reversal A, is:
CTODX = CTODA + CTODAX (11)
Where CTODA is the value of the CTOD at the reversal point A, and CTODAX is the change in CTOD value in going from point A to point X. The CTOD can be written as:
CTOD = dn(Y´, n) J / Y´ (12)
Where J is calculated using the same functional dependence of J but replacing the stress by the stress increment and Y by Y´, which is the yield strength corresponding to that particular point. If J = J( , a, Y, 0, , n) then, J = J( , a, Y´, 0´, , n). Specifically, referring to a typical test record, the value CTOD can be obtained taking the reversal point as origin, and the axis (P´, v´), i.e. Load = P – Prev and displacement = v – vrev .
CTOD = CTOD ( P – Prev , a) (13)
With CTOD <0 for d /dt <0 and CTOD >0 for d /dt >0, or using CTOD = dn(Y´, n) J / Y´. For the generic point X1, see Fig. 2, beyond A (loading + unloading):
CTODX1 = CTODA + CTODAX1 (14)
Where (- CTODAX1) is the value of CTOD at load PX1 or displacement VX1, referred to the new coordinate axes (P´, v´). Defining:
P´ X1 = Prev – PX1 (15) And
v´ X1 = vrev – v X1 (16) So
- CTODAX1 = (- JAX1)/Y´ (17)
- CTODAX1= J (P´X1, a)/Y´ (18)
- CTODAX1 = [K2/E (P´X1)+ ( /bB)Up(P´X1, v´X1)]/Y´ (19)
p = Dimensionless function of the geometry. Up = Plastic part of the area under the load vs. crack mouth opening displacement (CMOD)
536
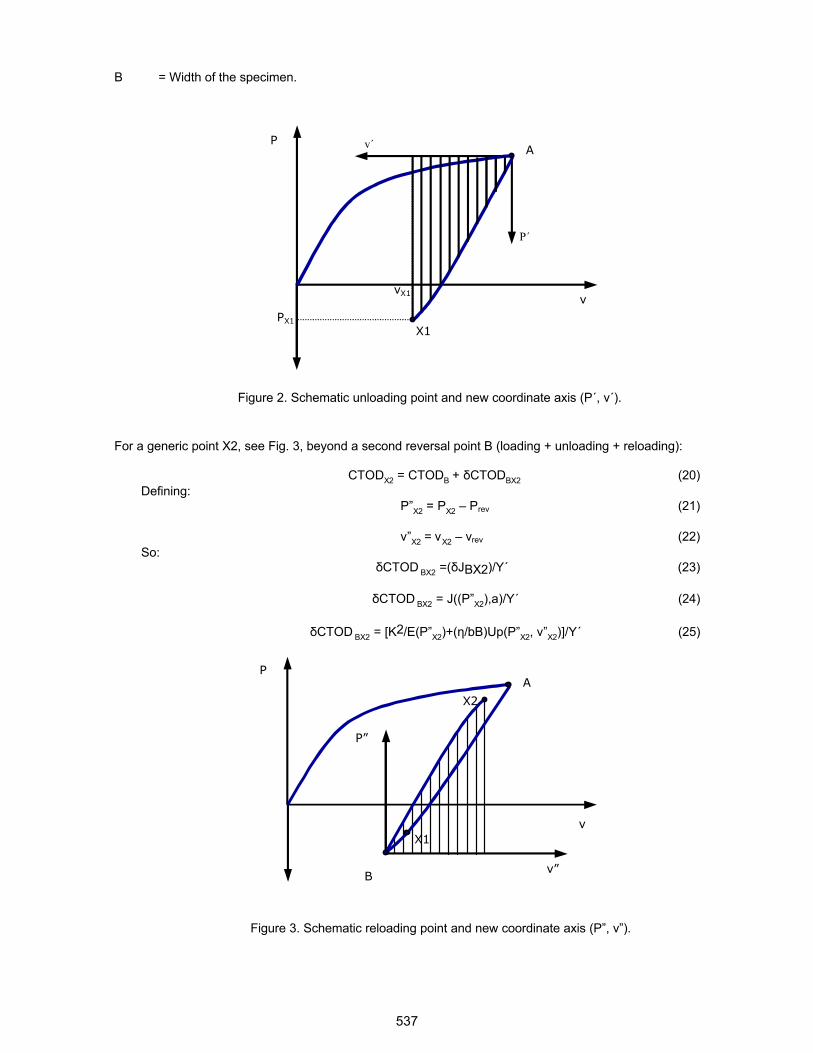
B = Width of the specimen.
Figure 2. Schematic unloading point and new coordinate axis (P´, v´).
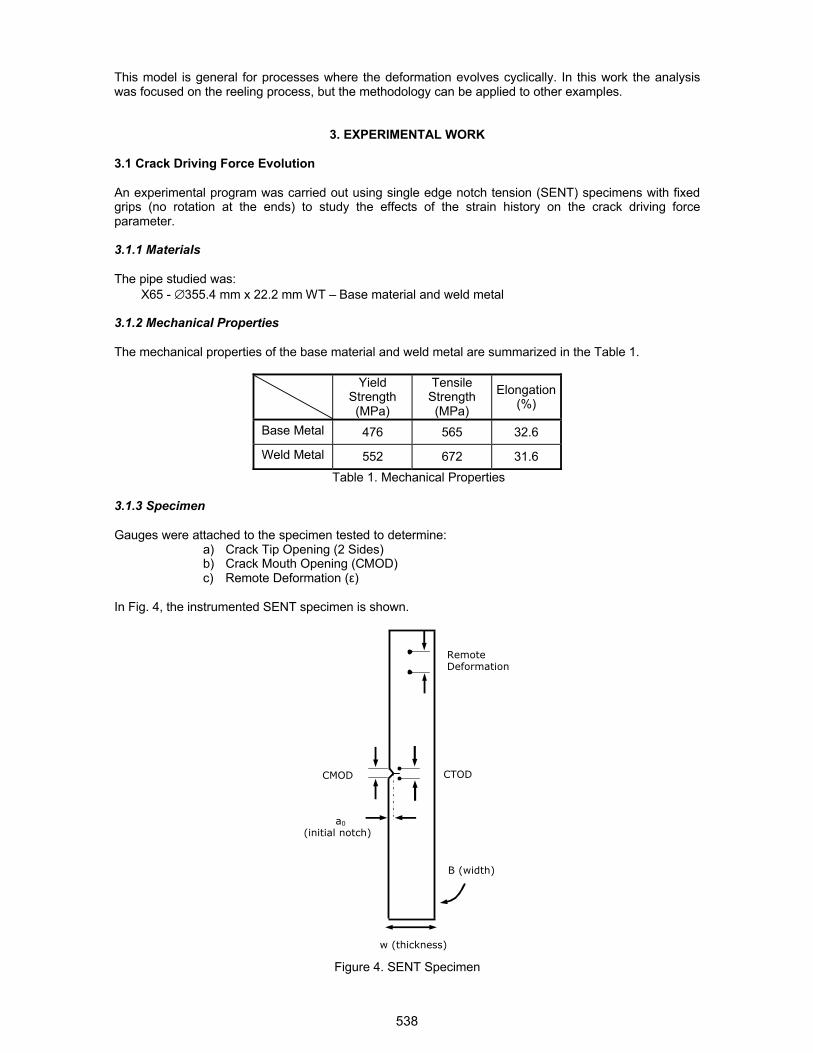
For a generic point X2, see Fig. 3, beyond a second reversal point B (loading + unloading + reloading):
CTODX2 = CTODB + CTODBX2 (20) Defining:
P”X2 = PX2 – Prev (21)
v”X2 = vX2 – vrev (22) So:
CTOD BX2 =( JBX2)/Y´ (23)
CTOD BX2 = J((P”X2),a)/Y´ (24)
CTOD BX2 = [K2/E(P”X2)+( /bB)Up(P”X2, v”X2)]/Y´ (25)
Figure 3. Schematic reloading point and new coordinate axis (P”, v”).
v”
P”
v
PA
B
X2
X1
A
vX1
PX1
v´
P´
v
P
X1
537
This model is general for processes where the deformation evolves cyclically. In this work the analysis was focused on the reeling process, but the methodology can be applied to other examples.
3. EXPERIMENTAL WORK
3.1 Crack Driving Force Evolution
An experimental program was carried out using single edge notch tension (SENT) specimens with fixed grips (no rotation at the ends) to study the effects of the strain history on the crack driving force parameter.
3.1.1 Materials
The pipe studied was: X65 - ∅355.4 mm x 22.2 mm WT – Base material and weld metal
3.1.2 Mechanical Properties
The mechanical properties of the base material and weld metal are summarized in the Table 1.
YieldStrength (MPa)
TensileStrength (MPa)
Elongation (%)
Base Metal 476 565 32.6
Weld Metal 552 672 31.6 Table 1. Mechanical Properties
3.1.3 Specimen
Gauges were attached to the specimen tested to determine: a) Crack Tip Opening (2 Sides) b) Crack Mouth Opening (CMOD) c) Remote Deformation ( )
In Fig. 4, the instrumented SENT specimen is shown.
Figure 4. SENT Specimen
CMOD CTOD
RemoteDeformation
w (thickness)
a0
(initial notch)
B (width)
538
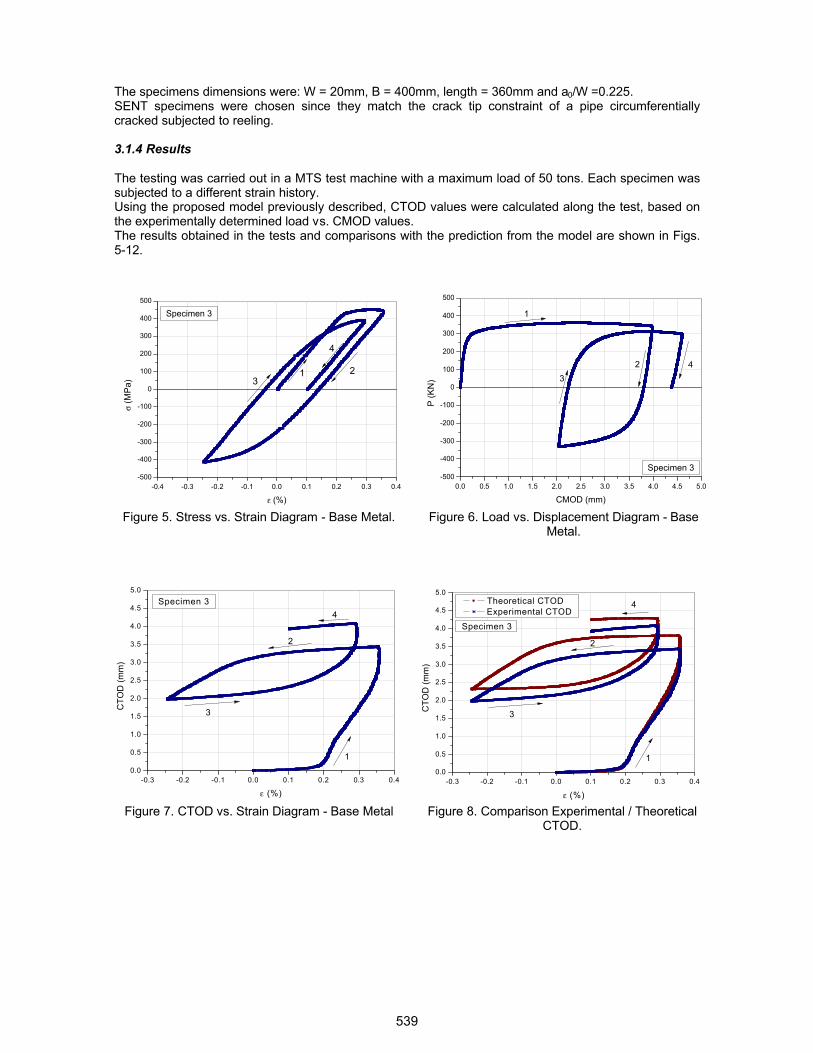
The specimens dimensions were: W = 20mm, B = 400mm, length = 360mm and a0/W =0.225.SENT specimens were chosen since they match the crack tip constraint of a pipe circumferentially cracked subjected to reeling.
3.1.4 Results
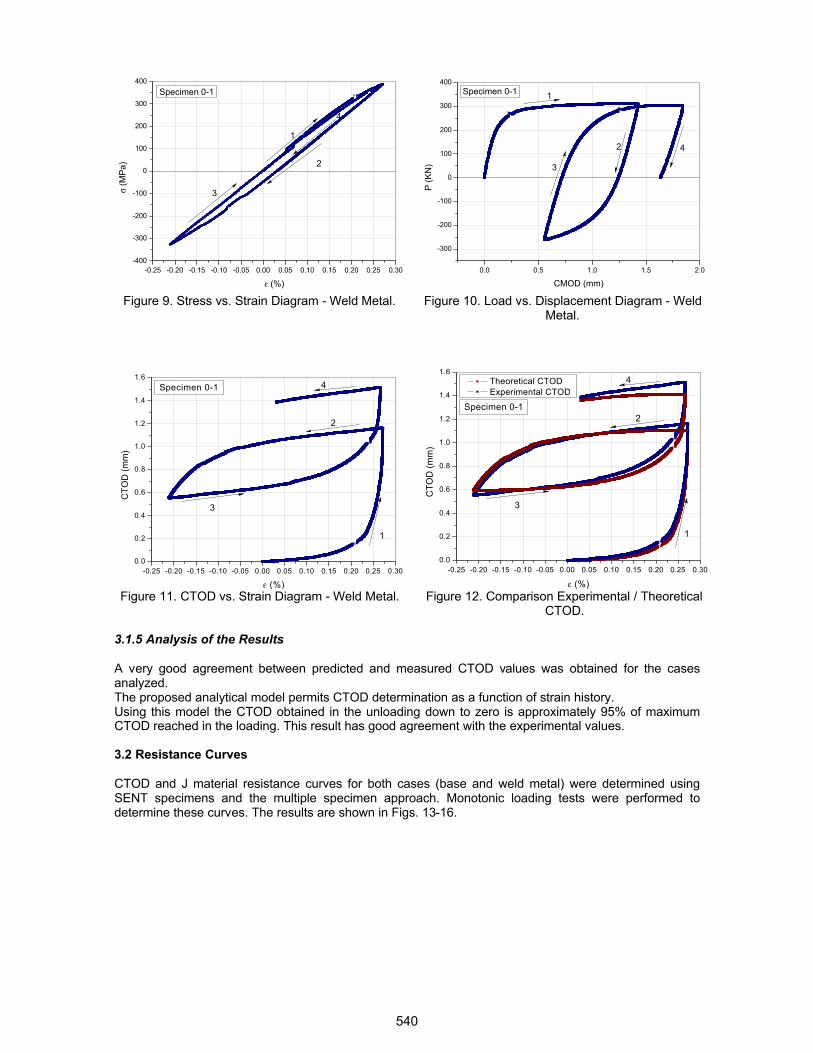
The testing was carried out in a MTS test machine with a maximum load of 50 tons. Each specimen was subjected to a different strain history. Using the proposed model previously described, CTOD values were calculated along the test, based on the experimentally determined load vs. CMOD values. The results obtained in the tests and comparisons with the prediction from the model are shown in Figs. 5-12.
-0.4 -0.3 -0.2 -0.1 0.0 0.1 0.2 0.3 0.4-500
-400
-300
-200
-100
0
100
200
300
400
500
σ (M
Pa)
ε (%)
Specimen 3
13
2
4
0.0 0.5 1.0 1.5 2.0 2.5 3.0 3.5 4.0 4.5 5.0-500
-400
-300
-200
-100
0
100
200
300
400
500
P (K
N)
CMOD (mm)
Specimen 3
1
23
4
Figure 5. Stress vs. Strain Diagram - Base Metal. Figure 6. Load vs. Displacement Diagram - Base Metal.
-0.3 -0.2 -0.1 0.0 0.1 0.2 0.3 0.40.0
0.5
1.0
1.5
2.0
2.5
3.0
3.5
4.0
4.5
5.0
CTO
D (m
m)
ε (%)
1
2
3
4Specimen 3
-0.3 -0.2 -0.1 0.0 0.1 0.2 0.3 0.40.0
0.5
1.0
1.5
2.0
2.5
3.0
3.5
4.0
4.5
5.0
Specimen 3
CTO
D (m
m)
ε (%)
Theoretical CTOD Experimental CTOD
1
2
3
4
Figure 7. CTOD vs. Strain Diagram - Base Metal Figure 8. Comparison Experimental / Theoretical CTOD.
539
-0.25 -0.20 -0.15 -0.10 -0.05 0.00 0.05 0.10 0.15 0.20 0.25 0.30-400
-300
-200
-100
0
100
200
300
400
σ (M
Pa)
ε (%)
Specimen 0-1
1
2
3
4
0.0 0.5 1.0 1.5 2.0
-300
-200
-100
0
100
200
300
400
P (K
N)
CMOD (mm)
Specimen 0-1 1
2
3
4
Figure 9. Stress vs. Strain Diagram - Weld Metal. Figure 10. Load vs. Displacement Diagram - Weld Metal.
-0.25 -0.20 -0.15 -0.10 -0.05 0.00 0.05 0.10 0.15 0.20 0.25 0.300.0
0.2
0.4
0.6
0.8
1.0
1.2
1.4
1.6
CTO
D (m
m)
ε (%)
Specimen 0-1
1
2
3
4
-0.25 -0.20 -0.15 -0.10 -0.05 0.00 0.05 0.10 0.15 0.20 0.25 0.300.0
0.2
0.4
0.6
0.8
1.0
1.2
1.4
1.6
CTO
D (m
m)
ε (%)
Theoretical CTOD Experimental CTOD
Specimen 0-1
1
2
4
3
Figure 11. CTOD vs. Strain Diagram - Weld Metal. Figure 12. Comparison Experimental / Theoretical CTOD.
3.1.5 Analysis of the Results
A very good agreement between predicted and measured CTOD values was obtained for the cases analyzed. The proposed analytical model permits CTOD determination as a function of strain history. Using this model the CTOD obtained in the unloading down to zero is approximately 95% of maximum CTOD reached in the loading. This result has good agreement with the experimental values.
3.2 Resistance Curves
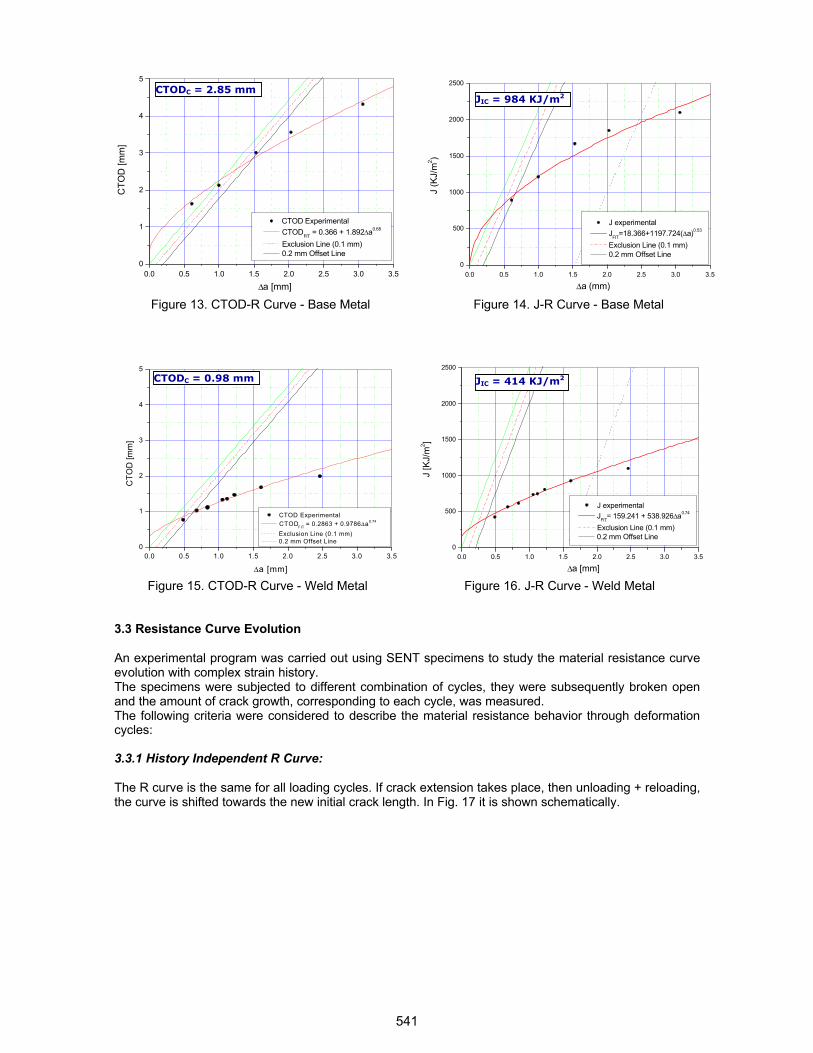
CTOD and J material resistance curves for both cases (base and weld metal) were determined using SENT specimens and the multiple specimen approach. Monotonic loading tests were performed to determine these curves. The results are shown in Figs. 13-16.
540
0.0 0.5 1.0 1.5 2.0 2.5 3.0 3.50
1
2
3
4
5
CTOD Experimental CTODFIT = 0.366 + 1.892∆a0.68
Exclusion Line (0.1 mm) 0.2 mm Offset Line
CTO
D [m
m]
∆a [mm]0.0 0.5 1.0 1.5 2.0 2.5 3.0 3.5
0
500
1000
1500
2000
2500
J experimental J
FIT=18.366+1197.724(∆a)0.53
Exclusion Line (0.1 mm) 0.2 mm Offset Line
J (K
J/m
2 )
∆a (mm)
Figure 13. CTOD-R Curve - Base Metal Figure 14. J-R Curve - Base Metal
0.0 0.5 1.0 1.5 2.0 2.5 3.0 3.50
1
2
3
4
5
CTO
D [m
m]
∆a [mm]
CTOD Experimental CTODFIT = 0.2863 + 0.9786∆a0.74
Exclusion Line (0.1 mm) 0.2 mm Offset Line
0.0 0.5 1.0 1.5 2.0 2.5 3.0 3.50
500
1000
1500
2000
2500
J experimental J
FIT= 159.241 + 538.926∆a0.74
Exclusion Line (0.1 mm) 0.2 mm Offset Line
J [K
J/m
2 ]
∆a [mm]
Figure 15. CTOD-R Curve - Weld Metal Figure 16. J-R Curve - Weld Metal
3.3 Resistance Curve Evolution
An experimental program was carried out using SENT specimens to study the material resistance curve evolution with complex strain history. The specimens were subjected to different combination of cycles, they were subsequently broken open and the amount of crack growth, corresponding to each cycle, was measured. The following criteria were considered to describe the material resistance behavior through deformation cycles:
3.3.1 History Independent R Curve:
The R curve is the same for all loading cycles. If crack extension takes place, then unloading + reloading, the curve is shifted towards the new initial crack length. In Fig. 17 it is shown schematically.
CTODC = 2.85 mm JIC = 984 KJ/m2
JIC = 414 KJ/m2CTODC = 0.98 mm
541
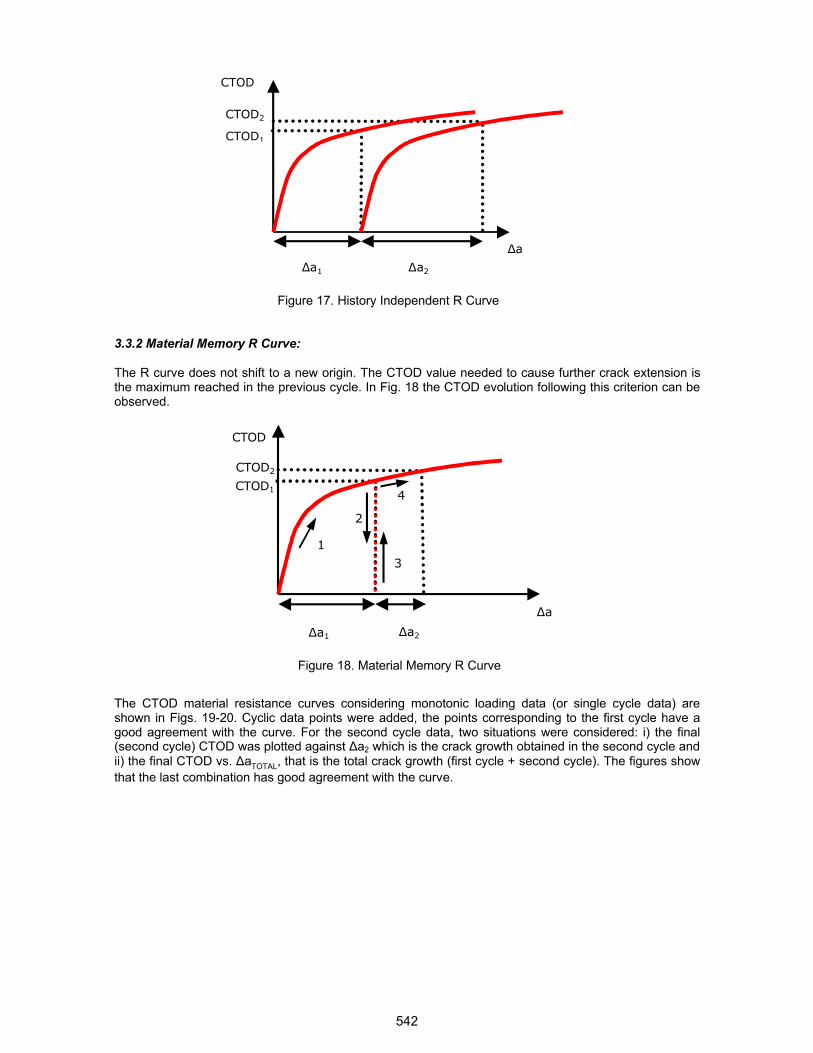
Figure 17. History Independent R Curve
3.3.2 Material Memory R Curve:
The R curve does not shift to a new origin. The CTOD value needed to cause further crack extension is the maximum reached in the previous cycle. In Fig. 18 the CTOD evolution following this criterion can be observed.
Figure 18. Material Memory R Curve
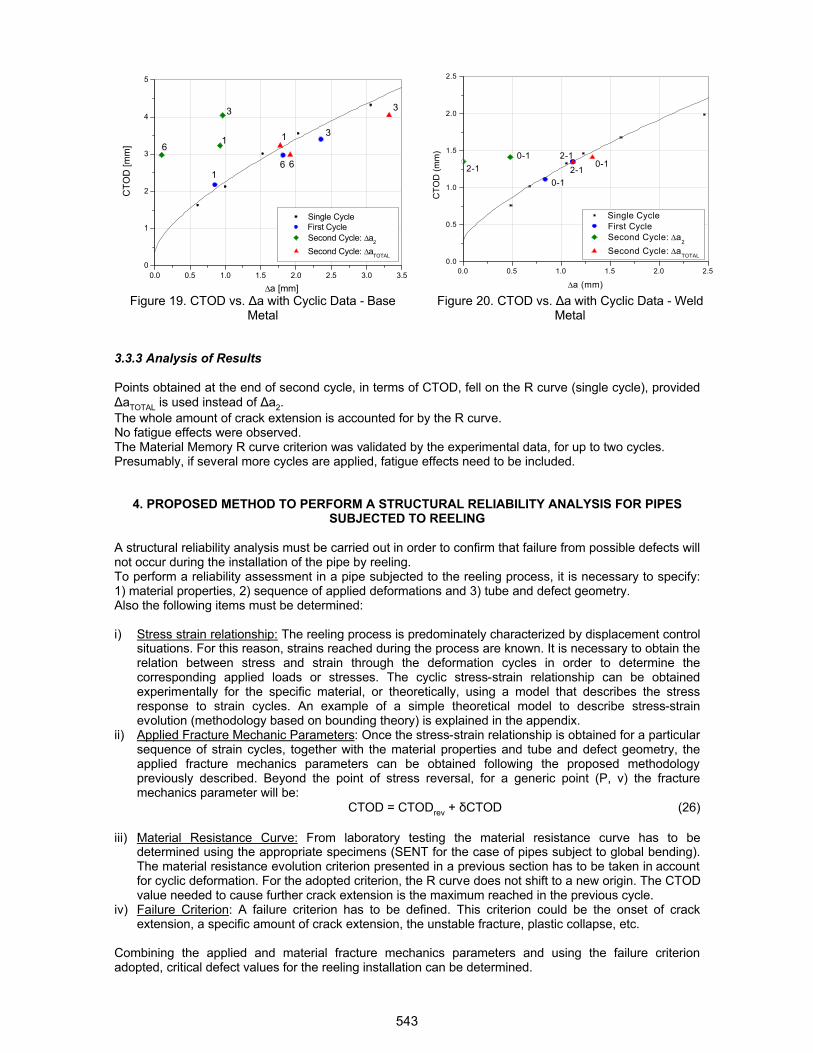
The CTOD material resistance curves considering monotonic loading data (or single cycle data) are shown in Figs. 19-20. Cyclic data points were added, the points corresponding to the first cycle have a good agreement with the curve. For the second cycle data, two situations were considered: i) the final (second cycle) CTOD was plotted against a2 which is the crack growth obtained in the second cycle and ii) the final CTOD vs. aTOTAL, that is the total crack growth (first cycle + second cycle). The figures show that the last combination has good agreement with the curve.
a
CTOD1
CTOD2
a2a1
CTOD
a
CTOD1
CTOD2
a2a1
CTOD
1
2
3
4
542
0.0 0.5 1.0 1.5 2.0 2.5 3.0 3.50
1
2
3
4
5
3
3
3
66
611
Single Cycle First Cycle Second Cycle: ∆a2
Second Cycle: ∆aTOTAL
CTO
D [m
m]
∆a [mm]
1
0.0 0.5 1.0 1.5 2.0 2.50.0
0.5
1.0
1.5
2.0
2.5
2-12-12-1
0-1
0-1
CTO
D (m
m)
∆a (mm)
Single Cycle First Cycle Second Cycle: ∆a
2
Second Cycle: ∆aTOTAL
0-1
Figure 19. CTOD vs. a with Cyclic Data - Base Metal
Figure 20. CTOD vs. a with Cyclic Data - Weld Metal
3.3.3 Analysis of Results
Points obtained at the end of second cycle, in terms of CTOD, fell on the R curve (single cycle), provided aTOTAL is used instead of a2.
The whole amount of crack extension is accounted for by the R curve. No fatigue effects were observed. The Material Memory R curve criterion was validated by the experimental data, for up to two cycles. Presumably, if several more cycles are applied, fatigue effects need to be included.
4. PROPOSED METHOD TO PERFORM A STRUCTURAL RELIABILITY ANALYSIS FOR PIPES SUBJECTED TO REELING
A structural reliability analysis must be carried out in order to confirm that failure from possible defects will not occur during the installation of the pipe by reeling. To perform a reliability assessment in a pipe subjected to the reeling process, it is necessary to specify: 1) material properties, 2) sequence of applied deformations and 3) tube and defect geometry. Also the following items must be determined:
i) Stress strain relationship: The reeling process is predominately characterized by displacement control situations. For this reason, strains reached during the process are known. It is necessary to obtain the relation between stress and strain through the deformation cycles in order to determine the corresponding applied loads or stresses. The cyclic stress-strain relationship can be obtained experimentally for the specific material, or theoretically, using a model that describes the stress response to strain cycles. An example of a simple theoretical model to describe stress-strain evolution (methodology based on bounding theory) is explained in the appendix.
ii) Applied Fracture Mechanic Parameters: Once the stress-strain relationship is obtained for a particular sequence of strain cycles, together with the material properties and tube and defect geometry, the applied fracture mechanics parameters can be obtained following the proposed methodology previously described. Beyond the point of stress reversal, for a generic point (P, v) the fracture mechanics parameter will be:
CTOD = CTODrev + CTOD (26)
iii) Material Resistance Curve: From laboratory testing the material resistance curve has to be determined using the appropriate specimens (SENT for the case of pipes subject to global bending). The material resistance evolution criterion presented in a previous section has to be taken in account for cyclic deformation. For the adopted criterion, the R curve does not shift to a new origin. The CTOD value needed to cause further crack extension is the maximum reached in the previous cycle.
iv) Failure Criterion: A failure criterion has to be defined. This criterion could be the onset of crack extension, a specific amount of crack extension, the unstable fracture, plastic collapse, etc.
Combining the applied and material fracture mechanics parameters and using the failure criterion adopted, critical defect values for the reeling installation can be determined.
543
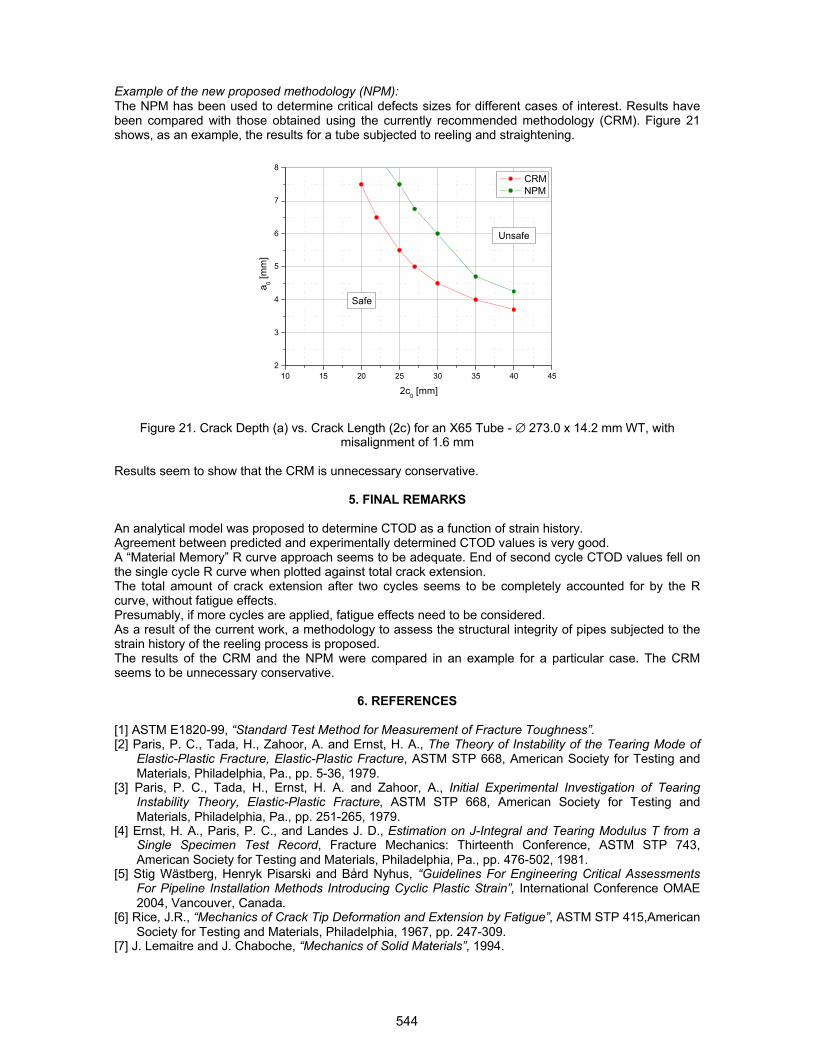
Example of the new proposed methodology (NPM): The NPM has been used to determine critical defects sizes for different cases of interest. Results have been compared with those obtained using the currently recommended methodology (CRM). Figure 21 shows, as an example, the results for a tube subjected to reeling and straightening.
10 15 20 25 30 35 40 452
3
4
5
6
7
8
Unsafe
a 0 [mm
]
2c0 [mm]
CRM NPM
Safe
Figure 21. Crack Depth (a) vs. Crack Length (2c) for an X65 Tube - ∅ 273.0 x 14.2 mm WT, with misalignment of 1.6 mm
Results seem to show that the CRM is unnecessary conservative.
5. FINAL REMARKS
An analytical model was proposed to determine CTOD as a function of strain history. Agreement between predicted and experimentally determined CTOD values is very good. A “Material Memory” R curve approach seems to be adequate. End of second cycle CTOD values fell on the single cycle R curve when plotted against total crack extension. The total amount of crack extension after two cycles seems to be completely accounted for by the R curve, without fatigue effects. Presumably, if more cycles are applied, fatigue effects need to be considered. As a result of the current work, a methodology to assess the structural integrity of pipes subjected to the strain history of the reeling process is proposed. The results of the CRM and the NPM were compared in an example for a particular case. The CRM seems to be unnecessary conservative.
6. REFERENCES
[1] ASTM E1820-99, “Standard Test Method for Measurement of Fracture Toughness”.[2] Paris, P. C., Tada, H., Zahoor, A. and Ernst, H. A., The Theory of Instability of the Tearing Mode of
Elastic-Plastic Fracture, Elastic-Plastic Fracture, ASTM STP 668, American Society for Testing and Materials, Philadelphia, Pa., pp. 5-36, 1979.
[3] Paris, P. C., Tada, H., Ernst, H. A. and Zahoor, A., Initial Experimental Investigation of Tearing Instability Theory, Elastic-Plastic Fracture, ASTM STP 668, American Society for Testing and Materials, Philadelphia, Pa., pp. 251-265, 1979.
[4] Ernst, H. A., Paris, P. C., and Landes J. D., Estimation on J-Integral and Tearing Modulus T from a Single Specimen Test Record, Fracture Mechanics: Thirteenth Conference, ASTM STP 743, American Society for Testing and Materials, Philadelphia, Pa., pp. 476-502, 1981.
[5] Stig Wästberg, Henryk Pisarski and Bård Nyhus, “Guidelines For Engineering Critical Assessments For Pipeline Installation Methods Introducing Cyclic Plastic Strain”, International Conference OMAE 2004, Vancouver, Canada.
[6] Rice, J.R., “Mechanics of Crack Tip Deformation and Extension by Fatigue”, ASTM STP 415,American Society for Testing and Materials, Philadelphia, 1967, pp. 247-309.
[7] J. Lemaitre and J. Chaboche, “Mechanics of Solid Materials”, 1994.
544
[8] C.L. Xie, S. Ghosh and M. Groeber, “Modeling Cyclic Deformation of HSLA Steels using Crystal Plasticity”. Journal of Engineering Materials and Technology, Vol. 126, No. 4: 339-352, 2004.
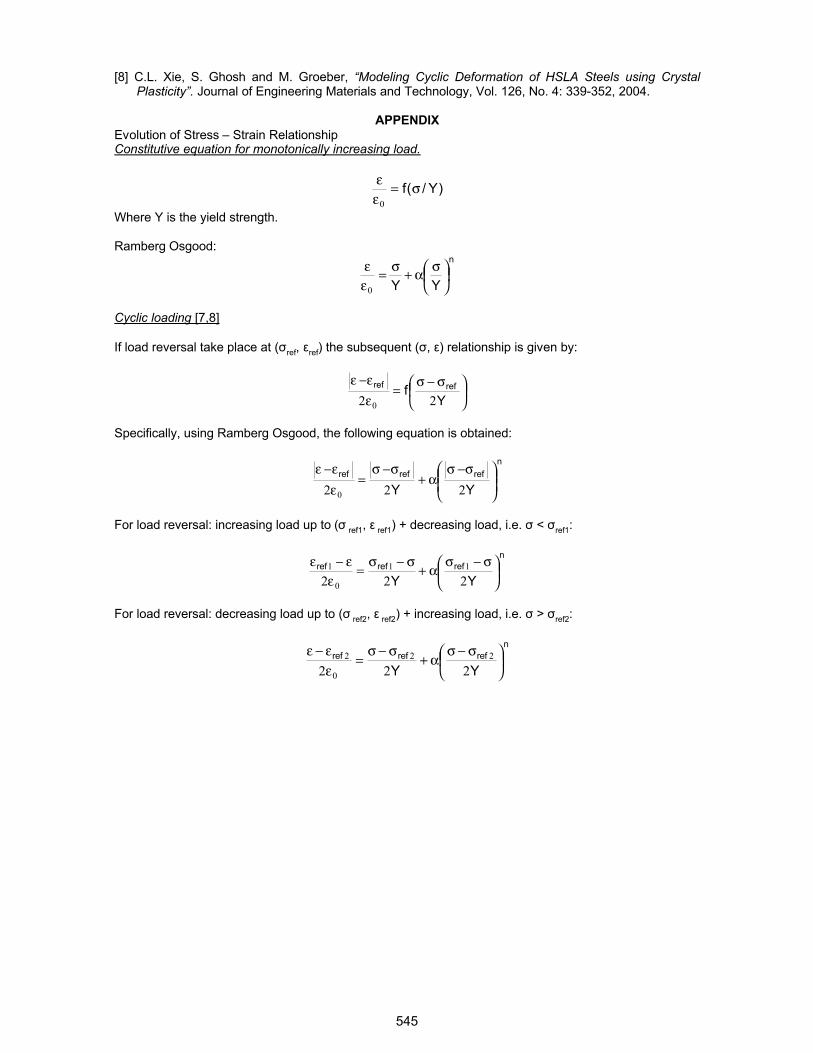
APPENDIX Evolution of Stress – Strain Relationship Constitutive equation for monotonically increasing load.
)Y/(f σ=εε
0Where Y is the yield strength.
Ramberg Osgood: n
YY
σα+σ=
εε
0
Cyclic loading [7,8]
If load reversal take place at ( ref, ref) the subsequent ( , ) relationship is given by:
σ−σ
=εε−ε
Yf refref
22 0
Specifically, using Ramberg Osgood, the following equation is obtained:
nrefrefref
YY
σ−σα+
σ−σ=
εε−ε
222 0
For load reversal: increasing load up to ( ref1, ref1) + decreasing load, i.e. < ref1:
nrefrefref
YY
σ−σ
α+σ−σ
=ε
ε−ε222
11
0
1
For load reversal: decreasing load up to ( ref2, ref2) + increasing load, i.e. > ref2:
nrefrefref
YY
σ−σ
α+σ−σ
=εε−ε
22222
0
2
545


