Embed Size (px)
Citation preview

Cement & Concrete Composites 33 (2011) 749–762
Contents lists available at ScienceDirect
Cement & Concrete Composites
journal homepage: www.elsevier .com/locate /cemconcomp
Using electrical, magnetic and acoustic sensors to detect damagein segmental concrete pipes subjected to permanent ground displacement
Mohammad Pour-Ghaz a,⇑, Junhee Kim b, Srinivasa S. Nadukuru b, Sean M. O’Connor b,Radoslaw L. Michalowski b, Aaron S. Bradshaw c, Russell A. Green d, Jerome P. Lynch b, Amir Poursaee e,W. Jason Weiss f
a Purdue University, School of Civil Engineering, 550 Stadium Mall Drive, West Lafayette, IN 47907, United Statesb University of Michigan, Department of Civil and Environmental Engineering, 2340 G.G. Brown Bldg., Ann Arbor, MI 48109, United Statesc Civil and Environmental Engineering, University of Rhode Island, Department of Civil and Environmental Engineering, Kingston, RI 02881, United Statesd Civil and Environmental Engineering, The Charles Edward Via, Jr. Department of Civil and Environmental Engineering, 120B Patton Hall,Virginia Tech Blacksburg, VA 24061, United Statese Civil Engineering, Clemson University, Civil Engineering Department, 316 Lowry Hall, Box 340911, Clemson, SC 29634, United Statesf Director of the Pankow Materials Laboratory, School of Civil Engineering, Purdue University, School of Civil Engineering, 550 Stadium Mall Drive, West Lafayette, IN 47907,United States
a r t i c l e i n f o
Article history:Received 12 November 2010Received in revised form 7 April 2011Accepted 8 April 2011Available online 16 April 2011
Keywords:Acoustic emissionConductive concreteCrack detectionDamage sensingEarthquake engineeringElectrical sensingLarge-scale testMagnetic sensingPermanent ground deformationSegmental concrete pipeline
0958-9465/$ - see front matter � 2011 Elsevier Ltd. Adoi:10.1016/j.cemconcomp.2011.04.004
⇑ Corresponding author. Tel.: +1 765 494 7999.E-mail address: [email protected] (M. Pour-G
a b s t r a c t
This paper describes results of an experimental study that used sensing methods for monitoring damagealong segmental concrete pipelines resulting from permanent ground displacement across a simulatedearthquake fault. The literature contains examples of such damage occurring during actual earthquakes,significantly impacting the functionality of the pipelines. Detecting the location of the damage and theextent of the damage in pipelines can significantly accelerate post-earthquake repair efforts. In this paper,electrical sensing methods, magnetic sensing, and acoustic emission are used to monitor structural dam-age in a segmental concrete pipeline during a large-scale test. In this test, the segmental concrete pipelinewas subjected to a concentrated transverse permanent ground displacements (PGDs). The majority of thedamage to the pipe segments was localized at the joints, especially the bell sections while the damage tothe spigots was minimal. The damage extended away from the joints in the pipe segments in the imme-diate vicinity of the fault line. Telescoping (i.e., crushing of the bell-and-spigot) was a primary mode offailure that was observed. The results of this study indicate that electrical sensing methods (includingthe use of conductive grout), magnetic sensing, and acoustic emission, employed alone or in combination,can detect and quantify the damage in segmental concrete pipelines.
� 2011 Elsevier Ltd. All rights reserved.
1. Introduction
This paper describes results of an experimental study that usedin situ sensing methods to identify damage along segmental con-crete pipelines resulting from permanent ground displacementacross a ground fault. The literature is replete with examples ofsuch damage occurring during actual earthquakes, adverselyimpacting the functionality of the pipelines. For example, a reportissued 3 days after the 2010 Chile earthquake indicated that morethan 1.5 million people were still without access to clean drinkingwater as a result of the earthquake [1]. Rapid restoration of societallifelines (such as pipelines) is an absolutely essential component ofsuccessful response and recovery efforts [2]. Previous earthquakes,
ll rights reserved.
haz).
such as the 1994 Northridge earthquake, have shown that the ac-tual repair cost of the pipelines reflects only a fraction of the totalcosts associated with the failure of lifelines. Indirect losses, such asbusiness losses during downtime and fire damage, which couldhave been minimized had it not been for the loss of the water sup-ply, can be several times higher than the direct losses [3–5]. Meth-ods for accurate damage detection can significantly accelerate therepair efforts of pipelines and, in turn, minimize the downtime.After the 1995 Kobe earthquake (Kobe, Japan), complete restora-tion of water and gas pipelines took over 2 and 3 months, respec-tively, while the electricity was restored in 3 days [6–8]. A majorcause of this delayed recovery time was that many water and gaspipelines are buried and not readily accessible for visualinspection.
The seismic hazards that are important for pipelines can be cat-egorized as wave propagation and permanent ground displace-ment (PGD) [6,9]. Irrespective of the direction in which PGD

750 M. Pour-Ghaz et al. / Cement & Concrete Composites 33 (2011) 749–762
affects the pipeline (transverse or longitudinal), it can be catego-rized as concentrated [10] or distributed [6,11–13]. As their namesimply, ‘‘concentrated’’ PGD occurs over a relatively short length ofthe pipeline while ‘‘distributed’’ PGD occurs over a longer length.The most common types of failures observed in segmental concretepipelines subjected to concentrated transverse PGD can be catego-rized in four groups: (1) localized damage in the vicinity of thejoints: cracking and spalling of the bell-and-spigot connection[2,14,15]; (2) telescoping and crushing of the bell-and-spigot[2,14,16–18]; (3) decoupling due to tensile forces, bending androtation at joints [19–21]; and (4) extensive cracking of the pipeaway from the joints after large PGD [2,15]. Although the commonmodes of failure of the segmental concrete pipelines are ratherwell-documented, information on the progression of damage inthe vicinity of the concentrated transverse PGD is scarce. Further-more, effective methods for identifying the location of the damageand the extent of the damage in the segmental concrete pipelinesare currently not well developed. For example, the major challengein detecting damage in buried concrete pipelines is that visualinspection is not feasible, often requiring excavation, which isexpensive and time-consuming.
The main objectives of the study presented herein are twofold:(1) to utilize methods for damage detection and health monitoringfor segmental concrete pipelines and (2) provide a better under-standing of the damage evolution in segmental concrete pipelinesin the vicinity of the concentrated transverse PGD using new meth-ods of damage detection. In this vein, six methods were used in thisstudy to monitor deformation and damage of the pipeline duringthe test; four of those methods, specifically designed for segmentalconcrete pipelines, are discussed in this paper. The methods thatare discussed in the present work include: conductive surface tapesensors (CST), magnetic sensors, acoustic emission (AE), and con-ductive grout. These methods were implemented on commercialconcrete pipe segments that were used in a large-scale test undersimulated PGD. The methods were designed to not only detect themost common modes of failure, but more importantly to detectdamage in its initial stages. The two methods used in the test thatare not discussed in great detail in this paper are strain gages and
Fault line
(a)Fig. 1. (a) Test basin after backfilling, (b) full-scale segmental concrete pipeline (after excfor Earthquake Engineering Simulation (NEES) site at Cornell University.
LVDTs. In the subsequent sections of this paper, an overview of thelarge-scale test facility (George E. Brown, Jr. Network for Earth-quake Engineering Simulation (NEES) site at Cornell University)used in this study is first presented. Next, a description of the con-crete pipe tested is given including the method used to place thepipe and to bury it with consolidated backfill. This is followed bya description of the instrumentation, test procedures and a discus-sion of the results.
2. Large scale testing facility
Full-scale testing of the segmental concrete pipeline was per-formed at the Network for Earthquake Engineering Simulations(NEES) Large-Scale Lifelines Testing Facility at Cornell University[22,23]. The segmental concrete pipeline was tested in a split-box test basin; Fig. 1a shows the test basin with buried pipelineready for testing, with the fault denoted by the dashed line (thefault line is inclined at 50� to the longitudinal axis of the test ba-sin). Fig. 1b shows the test basin with excavated pipeline afterthe test. The test basin was 3.4 m (�11 ft) wide and 13.5 m(�44 1/3 ft) long and 2.3 m (�7 1/2 ft) deep. The soil-filled portionof the test basin near the fault line was wider than the sections fur-ther away from the fault (Fig. 1a); this was to reduce the amount ofsand needed for backfilling, without affecting the influence of thebox boundaries on the deforming pipeline near the primary faultplane. The pipeline was buried using approximately 100 tons ofsand. The moveable (North) portion of the test basin was movedalong the fault line, relative to the fixed portion (South). The lengthof the fixed portion of the test basin was 6.5 m (�21 1/3 ft). Thedisplacement was induced by four hydraulic actuators and simu-lates transverse PGD [22,23].
3. Concrete pipe segment and pipeline
Commercial class 3=4 reinforced concrete culvert pipes with aninner diameter of 12 in. (34.5 cm), manufactured according toASTM C 76 [24] and ASTM C 655 [25], were used. The concrete pipesegments were 2.44-m (8.0-ft) long with a wall thickness of 5.1 cm
No.5
No.4
No.3
No.2
No.1
(b)avation) tested at the large-scale testing facility at the George E. Brown, Jr. Network

(a) (b)Fig. 2. (a) Heavy steel fixture designed for load transfer from pipe to load cells, (b) north (moveable) end of the pipeline after mounting the fixture.
M. Pour-Ghaz et al. / Cement & Concrete Composites 33 (2011) 749–762 751
(�2 in.). The pipe segments had a circumferential reinforcementratio of 1.5 cm2/linear meter length (0.07 in.2/linear ft), and thecompressive strength of the concrete was 27.6 MPa (�4000 psi).
The pipe segments were placed on the prepared bedding (de-scribed in the next section) and were aligned using a level and astring spread between the ends of the test basin. A total of five fullpipe segments were used; in addition, a 1-foot (30-cm) portion cutfrom a complete pipe segment was used at the North end to makeup the total length of the test basin. The pipe segments were num-bered starting from the South end of the test basin (Fig. 1b). Thefault line crossed the mid-span of Pipe Segment 3.
All the joints were grouted according to the AWWA C300 [26]standard. A mortar grout with water-to-cement ratio of 0.50 and30% fine aggregate by volume, conforming to specification of theAWWA C 300 standard [26] was used. To enhance the workabilityof the grout, 0.5% (by weight of cement) high range water reducerwas used. A plastic diaper was placed around the joints to ensurethe grout remained in place prior to curing.
Steel plates with inserts were designed for mounting load cellsat both ends of the pipeline to monitor the reactions at the endwalls of the test basin. The inserts consisted of 1-foot (30-cm) steelhollow tubes (Fig. 2a) mounted on the base plates. The tubes wereinserted into the pipe segments at each end of the pipeline, andload cells (4 at each end) were placed between the base platesand the reaction plates on the walls of the test basin (Fig. 2b).
At the South end of the pipeline, the insert was placed inside thespigot of Pipe Segment 1. On the North end, the insert was placedinside the small section of a cut pipe adjacent to the Pipe Segment5 (Fig. 2b). To avoid contact of the soil and the effect of moisture onthe load cells, a wooden box was constructed around the load cellsbefore backfilling the basin with soil.
4. Bedding and backfilling specifications
A 20.0-cm (�8-in.) thick bedding was prepared by compactingsand using a vibratory plate compactor (plate-tamper). After plac-ing and aligning the pipe segments on the bedding, backfill wasplaced in 20.0-cm (�8-in.) lifts. The total height of the backfillingwas 140.0 cm (�55 1/8 in.). Each lift was compacted with theplate-tamper, and the dry unit weight and moisture content weremeasured using a nuclear density gage according to ASTM D2922[27] and ASTM D 2216 [28], respectively. Measurements were per-formed on a grid of 30.0 � 30.0 cm (�12 � 12 in.) on each com-pacted lift. The dry unit weight and moisture content of the soilin all layers was 16.5 ± 0.3 kN/m3 (�105.8 ± 1.8 lb/ft3) and4.2 ± 0.6%, respectively. A grid of 10.0 � 10.0 cm (�4 � 4 in.) was
spray-painted on the surface of the soil after the final lift to aidthe visual trace of the deformation of the soil surface (Fig. 1a). Thisprocedure to preparing the pipeline bedding and backfill was in-tended to closely simulate real field conditions.
5. Instrumentation
The four types of sensors used in the large-scale test to assessdamage (i.e., conductive surface tape (CST), magnetic sensors,acoustic emission, and conductive grout) are described below.
5.1. Conductive surface tape
Conductive surface tape (CST) sensors are resistance-based sen-sors that are installed on the surface of the concrete pipe. The sen-sors used in this study were made of conductive copper tape. Ascracking occurred in the concrete pipe, the CST sensors stretchedcausing their resistances to rise slightly. When cracks enlarged inthe pipe segments, the tape ruptured causing the resistance to in-crease dramatically. By continuously monitoring the resistance ofthe conductive surface sensor, the time of cracking can be captured[29]. These sensors were previously used to investigate the effectof boundary conditions and degree of restraint on cracking behav-ior of the restrained concrete elements [29–31]. These sensorswere selected for this work since they are made of a low cost mate-rial and can easily and rapidly be applied to the surface of the con-crete pipe.
In segmental concrete pipelines subjected to a concentratedtransverse PGD, the majority of the damage localizes in the vicinityof the joints [6,16,19]. Therefore, a higher number of CST sensorswere installed in the vicinity of the joints. Fig. 3a schematicallyillustrates an instrumented pipe segment. Photographs of aninstrumented bell and an instrumented spigot section of a concretepipe segment are shown in Fig. 3b.
A total of 24 CST sensors were used to instrument the entirepipeline. Different numbers of CST sensors were used for each pipesegment depending on their relative location with respect to thefault line. Eight CST sensors were installed on Pipe Segment 3 (lo-cated on the fault line). The quantity and location of CST sensorsshown in Fig. 3a corresponds to that of Pipe Segment 3. Fig. 4 sche-matically illustrates the complete instrumentation of the pipeline.CST sensors are indicated by the letter ‘‘R’’ (for resistance-based).As may be observed from this figure, six CST sensors were installedon Pipe Segments 2 and 4, and only two CST sensors were installedon each Pipe Segments 1 and 5. In addition to Fig. 4, the detailedlocation of the CST sensors is also provided in Table 1.

Fig. 3. (a) Schematic illustration of instrumentation on a concrete pipe segment, (b) conductive surface tape sensors installed on the bell and on the spigot section of aconcrete pipe segment.
Fig. 4. Schematic illustration of instrumentation of the pipeline and the location of the sensors.
752 M. Pour-Ghaz et al. / Cement & Concrete Composites 33 (2011) 749–762
A 24 gage low-resistance copper wire was soldered to the sur-face of the CST sensors after installation of the sensor on the pipesegments to connect the sensor to an automated resistance mea-surement unit (AEMS) [32].
5.2. Magnetic opening sensors
Magnetic sensors are two-part sensors consisting of a switchand a magnet. The switch is triggered depending on the strengthof the magnetic field, which is dependent on the proximity of theswitch and the magnet. In this work, a commercially availablestandard AC-rated cylindrical mini-magnetic switch was used.The electrical resistance of the switch part of the sensor increases
when the distance between the two parts increases more than2.5 mm (1/10 in.). The responses of the magnetic sensors are mon-itored by measuring the electrical resistance of the switch. Fig. 5aillustrates both parts of a magnetic sensor used in the presentwork. These sensors were used to monitor the rotation and separa-tion of the bell and the spigot at each joint. The magnet side of thesensor was installed on the spigot, and the switch side of the sen-sor was installed on the bell. The two parts of the sensor were in-stalled at a right angle with respect to each other to facilitatetriggering of the sensors in response to both decoupling (i.e., open-ing) and telescoping (i.e., closing) of the joint.
Three magnetic sensors were installed at each joint except thelast joint (i.e., Joint 4) at the North end of the pipeline where

Table 1Type and location of sensors with respect to pipe segments and joints.
Sensor number Pipe/location Joint/location
Ra-1 Pipe 1/Bell 1R-2 Pipe 1/Bell 1R-3 Pipe 2/Spigot 1R-4 Pipe 2/Spigot 1R-5 Pipe 2/1/8 Spigot side –R-6 Pipe 2/1/8 Bell side –R-7 Pipe 2/Bell 2R-8 Pipe 2/Bell 2R-9 Pipe 3/Spigot 2R-10 Pipe 3/Spigot 2R-11 Pipe 3/1/8 Spigot side –R-12 Pipe 3/3/8 Spigot side –R-13 Pipe 3/3/8 Bell side –R-14 Pipe 3/1/8 Bell side –R-15 Pipe 3/Bell 3R-16 Pipe 3/Bell 3R-17 Pipe 4/Spigot 3R-18 Pipe 4/Spigot 3R-19 Pipe 4/1/8 Spigot side –R-20 Pipe 4/1/8 Bell side –R-21 Pipe 4/Bell 4R-22 Pipe 4/Bell 4R-23 Pipe 5/Spigot 4R-24 Pipe 5/Spigot 4Mb-1 – 1/EastM-2 – 1/TopM-3 – 1/WestM-4 – 2/EastM-5 – 2/TopM-6 – 2/WestM-7 – 3/EastM-8 – 3/TopM-9 – 3/WestGc-1 – 4/EastG-2 – 4/TopG-3 – 4/West
a CST type sensor.b Magnetic type sensor.c Conductive grout electrode.
M. Pour-Ghaz et al. / Cement & Concrete Composites 33 (2011) 749–762 753
conductive grout was used. One sensor was installed at the crownand two sensors were installed at spring lines (Fig. 3a). Both partsof the magnetic sensors were mounted on the pipes using highstrength epoxy. The locations of the magnetic sensors along thelength of the pipeline are illustrated in Fig. 4, and also are providedin Table 1. Letter M (for magnetic) is used to designate magneticsensors in Fig. 4 and Table 1.
5.3. Acoustic emission
Cracking of the concrete pipe results in the release of strain en-ergy. The released strain energy leads to stress wave propagation
MAGNET
SWITCH SENSOR CONNECTOR
(a) (b)Fig. 5. (a) Components of the magnetic sensor, (b) AE sensors installed on top of a w
in the pipe. The stress waves cover a wide range of inaudible andaudible frequencies, known as acoustic waves. Acoustic emission(AE) describes a technique that captures and monitors the digitizedacoustic waves at the surface of the material [33]. Piezoelectricsensors are used to convert the captured acoustic waves into elec-trical signals. The strength of the signals generally depends on theamount of released energy, distance and orientation of the sourcewith respect to the sensor, and nature of transferring media[30,34–40]. The signal captured with the sensors are then ampli-fied and recorded in a data acquisition system. The calculated en-ergy of the captured acoustic wave is proportional to the fractureenergy [35].
AE is particularly powerful since, unlike the previously de-scribed methods that require substantial cracking or displacementbefore damage can be detected, AE can detect damage in the formof micro-cracking that may occur even at very low load levels.These micro-cracks can be detected by acoustic emission before alocalized visible crack develops [41].
Two AE sensors were installed at both Joints 2 and 3, which arethe closest joints to the fault line (Joints 2 and 3 in Fig. 4), and oneAE sensor was installed at Joint 4. All of the AE sensors were in-stalled on the spigot section of the pipe as shown in Fig. 3a. A steelwaveguide was used between each sensor and the concrete pipe.Steel waveguides show negligible attenuation [33,42]. The AE sen-sors were installed on the steel waveguide using silicon-basedadhesive as a coupling agent (Fig. 5b). This type of coupling agenthas shown good performance in the past for AE sensing. A rigidconnection between the waveguide and the concrete was obtainedby mounting the waveguide in a small hole drilled in the concretepipe. A high strength epoxy was used to fix the steel waveguide inplace. The complete assembly is shown in Fig. 5b. A pre-amplifierwas installed between each sensor and the data acquisition sys-tem. The pre-amplifiers were installed inside the pipe segment asshown in Fig. 5c.
5.4. Conductive grout
The conductive grout that was used in this study to monitor theintegrity of the joints was a mortar mixture containing highly con-ductive carbon micro-fibers. The micro-fibers were approximately7–9 lm (2.75 � 10�4 to 3.5 � 10�4 in.) long and had an aspect ratio(i.e., length/diameter) of approximately 25. The fibers were madeof 99% carbon. The conductive grout used was a mortar with awater-to-cement ratio (w/c) of 0.50 and 30% aggregate and 13%carbon micro-fiber by volume.
The volume percentage of the fiber was calculated to be abovethe theoretical percolation volume. The theoretical percolation vol-ume was calculated based on the theory of overlapping ellipsoids[43]. Trial mixtures with fiber volume above the calculated
STEEL WAVEGUIDE
PRE-AMPLIFIER AE SENSOR
Temporarily installed tape to cure coupling agent
STEEL WAVEGUIDE
(c)aveguide, (c) waveguide and pre-amplifiers installed inside the pipe segment.

754 M. Pour-Ghaz et al. / Cement & Concrete Composites 33 (2011) 749–762
percolation volume were made to optimize the required amount ofwater reducer (to ensure that the mixture is workable). The groutused had a resistivity value of 0.39 X m (�15.51 X in.) after 7 days(in sealed condition). The resistivity of mortar with equivalentnon-conductive inclusions was 17.67 X m (�695.61 X in.) at thesame age.
The electrical resistance of the conductive grout increases withcracking of the grout at the joints (e.g., due to the telescoping fail-ure). By monitoring the electrical resistance of the conductivegrout, the damage development at the joint can be assessed. Theelectrical resistance was measured using three electrodes mountedat 120�with respect to each other around the joint. The electricalresistance was measured between two consecutive electrodesresulting in a total of three sections being measured at each joint.Conductive grout is particularly useful in monitoring the damagedue to telescoping failure. Conductive grout was used at the lastjoint at the north end of the pipeline (Joint 4, see Fig. 4). The loca-tions of the electrodes in the conductive grout are specified in Ta-ble 1 and are designated by letter G (for grout).
6. Test procedure
A displacement-controlled testing procedure was used in thisexperiment. The moveable portion (North end) of the test basinwas displaced relative to the fixed portion (South end) in twelve,2.54-cm (1-in.) steps. In total the North end of the basin was dis-placed 30.5 cm (12 in.) along the fault in a right lateral strike-slipmovement. The magnitude of this displacement was chosen basedon the previous test results [2,14,15] and subjected the pipeline tocompressive, shear, and bending forces [2,14,15,22,23]. The rela-tive speed of the two portions of the test basins was 0.3 m per min-ute (�1 ft per minute). Each displacement step was completed inless than 5 s, after which the test was paused (relaxation phase).The relaxation phase allowed visual inspection of the soil surface,documentation of observations, and examination of the effect ofsoil relaxation on the axial forces measured by load cells at theboth ends of the pipeline.
A high-speed camera was installed above the test basin(approximately 2 m from the soil surface) to capture the soil sur-face deformation during the experiment. All monitoring systemswere activated, and the readings were continuously recorded dur-ing the process of displacement.
After the completion of the test and all of the sensor data wascollected, the excavation phase began. The first 120 cm (�47 in.)of the soil was removed using a hydraulic clamshell bucket. Theremaining backfill was removed carefully using shovels andbrushes to avoid causing further damage to the pipeline. The pipe-line after excavation is shown in Fig. 1b.
7. Results and discussion
7.1. Load and displacement
Fig. 6a illustrates the actuator displacement, actuator load, andthe total axial load at the North end (moveable end) and the Southend (fixed end) of the test basin. The change of load with time atboth ends of the test basin shows the same pattern as that of theactuator load. The load at the south end (fixed end) of the test basinslightly lags behind the applied actuator load, especially for thefifth and seventh displacement steps.
The average load in the actuators during the relaxation periodsand the average axial forces measured by load cells at both ends ofthe test basin are plotted in Fig. 6b. This figure is useful for tracingthe damage accumulation is the pipeline. The development ofdamage is accompanied with a dramatic reduction in load due tothe increase of the compliance (loss of stiffness) of the system.
During the first four applied displacement steps the load in theactuators and at both ends of the pipeline increased with the dis-placement. During the fifth step, the load slightly decreased inthe actuator and a slight increase in the end load was observedat both ends of the pipeline. A significant decrease in load is ob-served at the seventh displacement step indicating significantdamage to the pipeline. Further decrease in load is observed inthe twelfth step. It is noted that damage starts to accumulate inthe pipeline from the first displacement step; however, it cannotbe seen by only looking at the load–displacement plot as the dam-age up to the seventh step is not significant to increase the compli-ance of the system to affect the measured loads.
7.2. Conductive surface tape sensors
Before rupture, the CST sensor’s resistance is approximately0.05 X. However, after rupture, the resistance increases several or-ders of magnitude. The resistance measurements are treated asbinary, with zero indicating an intact CST (i.e., no damage) andone indicating a ruptured CST (i.e., damaged).
The rupture sequence of the CST sensors is shown in Fig. 7,along with the actuator displacement. Additionally, Fig. 8 showsthe location and rupture sequence of the CST sensors on schemat-ics of the pipe segments for six different fault displacements. Thearrows in Figs. 7 and 8 indicate the rupture of a CST sensor.
As may be observed from Figs. 7 and 8, significant damage oc-curred during the second displacement step in the bell sectionsof Pipe Segments 2 and 3 (Joints 2 and 3, respectively). This dam-age extended beyond 3.8 cm (�1½ in.) on the bell section of bothpipe segments since both sensors installed on the bell sections ofPipe Segments 2 and 3 detected the damage. The mode of damagethat occurred is schematically illustrated in Fig. 9a and can beattributed to the relative rotation of the spigot inside the bellsection.
The CST sensor (R-23) installed at the spigot of the Pipe Seg-ment 5 (Joint 4) also detected damage. This sensor was installed1.27 cm (�1/2 in.) away from the end of the spigot (see Figs. 3and 4). The damage, however, is not extensive since the next CSTsensor in the array (R-24), which was placed 2.5 cm (�1 in.) fromthe end of the spigot (1.27 cm from R-23), did not detect any dam-age. The damage captured at Joint 4 by R-23 is most likely due tomovement of the spigot inside the bell (i.e., ‘‘wedge-breaking’’).This type of damage is schematically illustrated in Fig. 9b. It isnoted that at this stage telescoping of the pipeline is not significantand that the compressive forces along the pipeline only tightenedthe joints resulting in minimal damage.
With an increase in the displacement during the fourth step(Figs. 7 and 8), further damage developed at Joint 3 where R-17is located (Fig. 8b). This damage is probably due to wedge-breakingaction and did not extend beyond 1.27 cm (�1/2 in.). Up to the fifthstep, the majority of the damage is localized at the joints in thevicinity of the fault line (i.e., Joints 2 and 3). Damage at this pointbegan to occur at Joint 1. The signals slightly lag the displacementof the actuators.
During the fifth and seventh displacement steps, Joints 1 and 4were damaged and are most likely associated with telescoping ef-fects resulting from high compressive forces. The damage occurredat the bell section of the joints (Figs. 8c and d). Fig. 9c schematicallyillustrates the damage due to compressive forces (i.e., telescoping).
During the tenth and eleventh displacement steps, damagestarted to extend beyond the joints and occurred in the body ofPipe Segments 2 and 3 (i.e., R-6 and R-14). These sensors were lo-cated 30 cm (�1 ft) away from the end of the bell section. This typeof damage is due to rotation of the pipes at the joints accompaniedwith compressive axial forces. A schematic illustration of this typeof damage is shown in Fig. 9d.
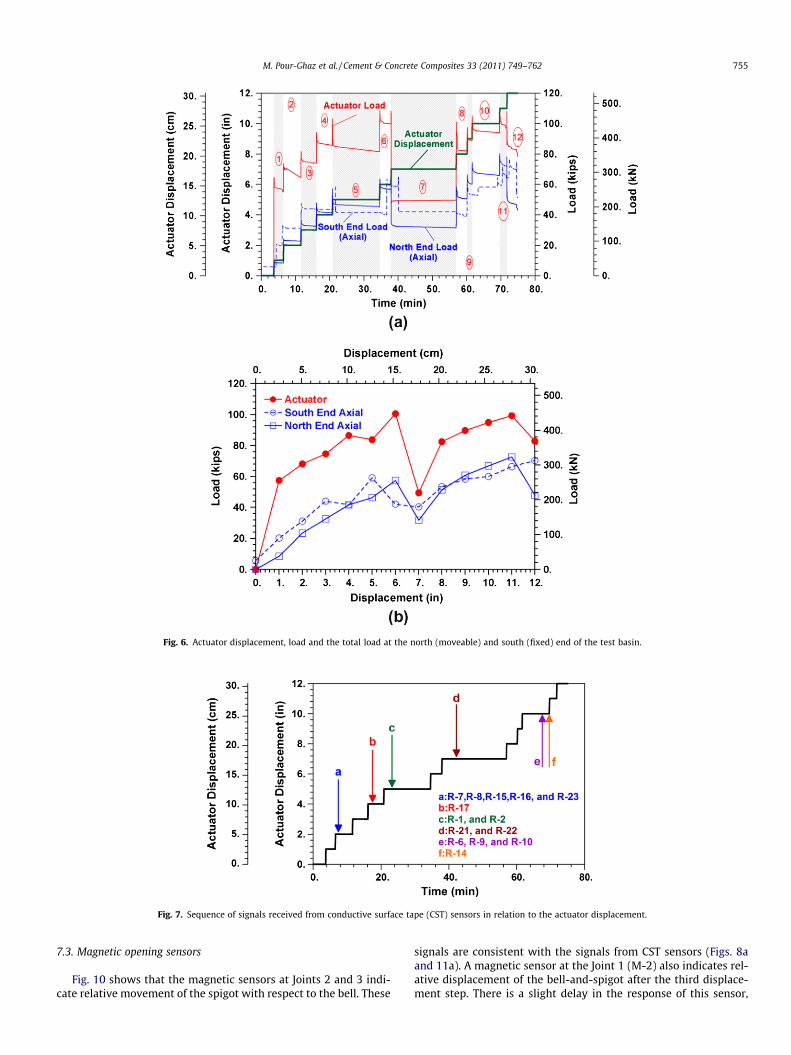
Fig. 7. Sequence of signals received from conductive surface tape (CST) sensors in relation to the actuator displacement.
Fig. 6. Actuator displacement, load and the total load at the north (moveable) and south (fixed) end of the test basin.
M. Pour-Ghaz et al. / Cement & Concrete Composites 33 (2011) 749–762 755
7.3. Magnetic opening sensors
Fig. 10 shows that the magnetic sensors at Joints 2 and 3 indi-cate relative movement of the spigot with respect to the bell. These
signals are consistent with the signals from CST sensors (Figs. 8aand 11a). A magnetic sensor at the Joint 1 (M-2) also indicates rel-ative displacement of the bell-and-spigot after the third displace-ment step. There is a slight delay in the response of this sensor,

Fig. 8. Location of the detected damage by sensors. Arrows indicate the location of the damage captured by conductive surface tape (CST) sensors.
756 M. Pour-Ghaz et al. / Cement & Concrete Composites 33 (2011) 749–762
which might be due to the visco-elastic behavior of the soil. Thevisco-elastic behavior of soil can be seen in Fig. 6a especially dur-ing the relaxation period after the fourth and fifth displacementsteps where the actuator load decreases while the displacementis constant. During the relaxation period after the fifth displace-ment step, a relative movement of the joint is detected at Joint 3by the magnetic sensors (Fig. 11c). During the seventh displace-ment step, the magnetic sensor at Joint 1 detected damage, whichis most likely associated with telescoping effects due to high com-pressive forces. Further damage using magnetic sensors is capturedafter the tenth displacement step.
7.4. Acoustic emission
Fig. 12 shows the average captured acoustic energy per sensorat Joints 2, 3, and 4. The amount of energy captured at Joints 2and 3 are orders of magnitude larger than the amount of energycaptured at Joint 4. This is consistent with the results from theCST and magnetic sensors in that the damage to Joints 2 and 3was greater than at Joint 4. A significant amount of energy is cap-tured during the first two displacement steps. This is consistentwith the results shown in Fig. 7 where the damage was observedat Joints 2 and 3. Note that in all cases acoustic activity starts be-fore any damage is detected by CST sensors in Fig. 7. A sudden
increase of acoustic energy at Joint 4 was observed after theseventh displacement step. This observation is consistent withthe signals received from CST and magnetic sensors. Also a signif-icant decrease in load was observed at this actuation step (Fig. 6b).
A significant increase in acoustic energy is observed during theeighth displacement step at all joints. However, no signals fromCST and magnetic sensors are received during this step (seeFig. 7) because the majority of the sensors installed at Joints 2and 3 failed previously. During the relaxation period after the tenthdisplacement step no acoustic activity is captured; however, dur-ing this period signals from CST and magnetic sensors indicatedamage at Joint 2 and Pipe Segment 2. This suggests that the dam-age to the joint occurred during the displacement and that the de-lay in the CST sensors might be due to the widening of the crackand the commensurate rupture of the CST.
Fig. 13 shows the cumulative acoustic energy at each joint cat-egorized in three groups based on peak amplitude of the acousticsignal: <60 dB, 60 to 80 dB, and >80 dB. Smaller amplitudes cangenerally be attributed to the movement of the soil, micro-crackingof the concrete pipe, or cracking of the concrete far away from thesensor. High amplitude acoustic activity is generally associatedwith discrete cracking in the close vicinity of the sensor. Fig. 13shows that the cumulative acoustic energy from high amplitudewaves increases significantly after the eighth displacement step.

Fig. 9. Schematic illustration of (a) failure of bell due to angular rotation, (b) wedge-breaking due to compressive force, (c) failure due to telescoping and (d) failure of thejoint due to rotation and telescoping.
Fig. 10. Sequence of signals received from magnetic (M) sensors in relation to the actuator displacement.
M. Pour-Ghaz et al. / Cement & Concrete Composites 33 (2011) 749–762 757
This indicates extensive damage to the joints. The cracking at Joints2 and 3 continues up to the tenth displacement step (i.e., 10-in.displacement).
7.5. Conductive grout
Fig. 14 illustrates the results of resistance measurements of theconductive grout at Joint 4. The resistance results are normalizedto the maximum value measured. The normalized value of theresistance can be considered as an indirect measure of damage.As may be observed in Fig. 14, the resistance of the grout increaseseven at early stages of loading and continues to increase up to endof the seventh displacement step and then reaches the maximumvalue corresponding to the complete damage at the joint. This isconsistent with the reduction of the loads (actuator and axial) inthe seventh displacement step in Fig. 6b.
All three sections of Joint 4 approximately follow the sametrend of resistance increasing; this indicates that the damage is al-most uniformly distributed around the joint (i.e., telescoping). Themajority of the damage is accumulated in the joint up to the end ofthe third displacement step. These results are consistent with theresults obtained from CST sensors in Fig. 7a (Fig. 8a) where thedamage is detected at spigot section of the Joint 4.
7.6. Damage evolution
Generally, the results provided above clearly show that thedamage detected by the different sensor types is consistent. AE de-tected the damage before it was captured by CST and magneticsensors (Fig. 12). The resistance increase of conductive grout dueto telescoping damage (Fig. 14) is consistent with the decrease ofaxial and actuator loads (Fig. 6b). In combination, the sensors pro-vide information on the types and order of damage that can occurin segmental concrete pipelines.
During the first four displacement steps (Figs. 8a and b, and 11aand b), the majority of the damage to the pipeline was concen-trated close to the fault line. This is supported by the measure-ments taken by the CST, magnetic, and acoustic emission sensors.With an increase in displacement, particularly during the fifthand seventh displacement steps (Figs. 8c and d, and 11c and d),the damage had spread along a larger length of the pipeline. Thiscan be seen in Fig. 7, and is confirmed by the decrease in the axialloads and actuator load (Fig. 6b).
Further damage to the pipeline is captured during the eighthdisplacement step by AE (Fig. 12). After the tenth and eleventh dis-placement steps, the damage propagates away from the joints andcaused longitudinal cracks along of the Pipe Segments 2 and 3. The
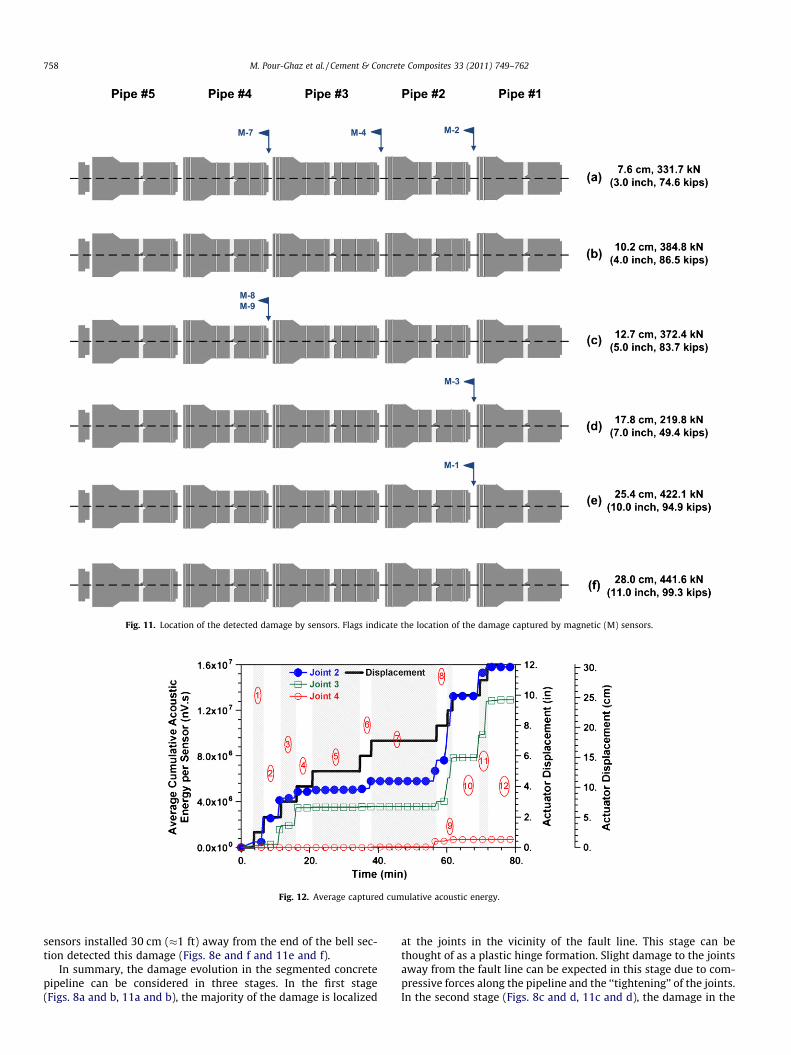
Fig. 11. Location of the detected damage by sensors. Flags indicate the location of the damage captured by magnetic (M) sensors.
Fig. 12. Average captured cumulative acoustic energy.
758 M. Pour-Ghaz et al. / Cement & Concrete Composites 33 (2011) 749–762
sensors installed 30 cm (�1 ft) away from the end of the bell sec-tion detected this damage (Figs. 8e and f and 11e and f).
In summary, the damage evolution in the segmented concretepipeline can be considered in three stages. In the first stage(Figs. 8a and b, 11a and b), the majority of the damage is localized
at the joints in the vicinity of the fault line. This stage can bethought of as a plastic hinge formation. Slight damage to the jointsaway from the fault line can be expected in this stage due to com-pressive forces along the pipeline and the ‘‘tightening’’ of the joints.In the second stage (Figs. 8c and d, 11c and d), the damage in the
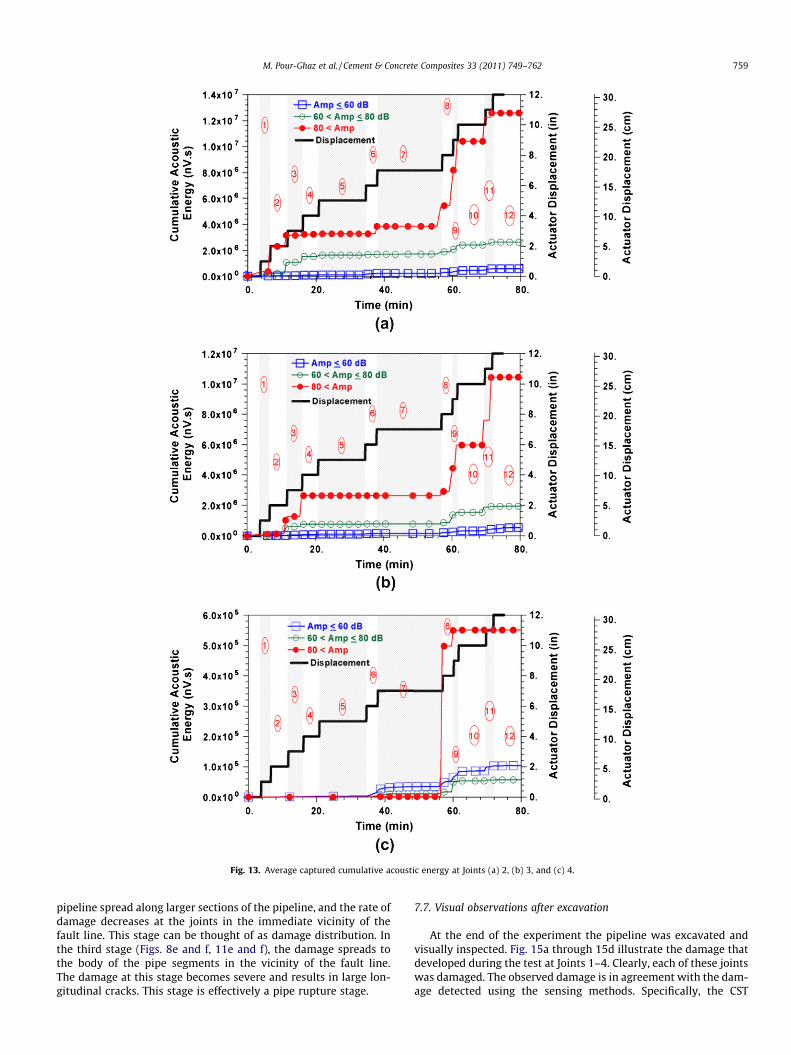
Fig. 13. Average captured cumulative acoustic energy at Joints (a) 2, (b) 3, and (c) 4.
M. Pour-Ghaz et al. / Cement & Concrete Composites 33 (2011) 749–762 759
pipeline spread along larger sections of the pipeline, and the rate ofdamage decreases at the joints in the immediate vicinity of thefault line. This stage can be thought of as damage distribution. Inthe third stage (Figs. 8e and f, 11e and f), the damage spreads tothe body of the pipe segments in the vicinity of the fault line.The damage at this stage becomes severe and results in large lon-gitudinal cracks. This stage is effectively a pipe rupture stage.
7.7. Visual observations after excavation
At the end of the experiment the pipeline was excavated andvisually inspected. Fig. 15a through 15d illustrate the damage thatdeveloped during the test at Joints 1–4. Clearly, each of these jointswas damaged. The observed damage is in agreement with the dam-age detected using the sensing methods. Specifically, the CST

Fig. 14. Resistance increase of conductive grout due to damage at Joint 4.
Fig. 15. Damage to joints observed after excavation (a) Joint 1, (b) Joint 2, (c) Joint 3, (d) Joint 4, and wedge-breaking type of damage seen in Joint 2.
760 M. Pour-Ghaz et al. / Cement & Concrete Composites 33 (2011) 749–762

M. Pour-Ghaz et al. / Cement & Concrete Composites 33 (2011) 749–762 761
sensors installed on the bell section of the joints detected damageat multiple points. The damage detected using CST and magneticsensors is shown in Fig. 8 and Fig. 11 respectively. Extensive dam-age was observed at the bell sections of all four joints. Figs. 15b andc illustrate the damage to Joints 2 and 3, which were the most se-verely damaged. Large longitudinal cracks propagating away fromthe bell section can be seen. This damage was captured by CST sen-sors as shown in Figs. 8e and f.
The types of damage illustrated in Fig. 9 can be seen in the pho-tographs shown in Fig. 15. Figs. 15b and c show the damage to Joints2 and 3, which appear to have rotated and telescoped (Fig. 9d). Itshould be remembered that the photographs in Fig. 15 show dam-age at the time of excavation, however, the damage to Joints 2 and3 increased progressively over time, from wedge-breaking damageto the spigot (Fig. 9b) to telescoping and crushing of the bell (Fig. 9c),and eventually to rotational and telescoping type failure (Fig. 9d).The wedge-breaking type of damage that was observed at Joint 3is shown in Fig. 15e. The damage to Joints 1 and 4 is similar to theschematic illustration shown in Fig. 9c.
Except for the damage to Pipe Segments 2 and 3 that was de-tected by the CST sensors R-6 and R-14 (Figs. 8e and f), no othervisually observed damage was found on the pipe segments awayfrom the joints (along the pipe length).
8. Conclusions
This paper presented results from an experimental study thatused a variety of sensing methods to assess damage developmentin a buried segmental concrete pipeline subjected to a concen-trated transverse permanent ground displacement (PGD). Thesensing methods included conductive surface tape, conductivegrout, magnetic sensors, and acoustic emission. In addition, loaddisplacement measurements were used to monitor the damagedevelopment. These methods enabled tracing of the damage prop-agation in the pipeline.
The sensing approaches captured the damage development inthe segmental concrete pipeline, and the damage was consistentwith the visual inspection after excavation of the pipeline.
The sensing methods used provided the time- and location-dependent information on damage development in the pipeline.Two types of damage were primarily observed: failure of jointdue to relative rotation of bell-and-spigot and telescoping andcrushing of the joints.
The results indicated that the majority of the damage in seg-mental concrete pipelines occurred at the bell sections of the jointsin the pipeline. Damage was also observed away from the joints inthe pipe segments in the immediate vicinity of the fault line. Tele-scoping, caused by axial forces, introduced considerable damage tosegmental concrete pipelines. While damage due to shear forces ismore severe in the vicinity of the fault line, damage due to tele-scoping affects a larger section of the pipeline.
Three stages of damage were observed. In the first stage, themajority of the damage occurred at the joints in the immediatevicinity of the fault line. This began with as little as 5.1 cm (2 in.)displacement along the fault line. The damage in the second stagebegan to occur after 12.7 cm (5 in.) displacement along the faultline. The damage in the second stage was more distributed alongthe pipeline and the rate of damage decreased at the joints in theimmediate vicinity of the fault line. This stage was accompaniedby telescoping process. The third stage of the damage developmentstarted approximately after 25.4 cm (10 in.) of displacement alongthe fault line. In this stage the damage spread to the body of thepipe segments in the immediate vicinity of the fault line. The dam-age at this stage became severe and resulted in large longitudinalcracks in the body of the pipe segments. This stage is effectivelya pipe rupture stage.
This paper presented results from a second iteration of testing asegmental concrete pipeline as a part of a four-year program. Themain objectives of the work described in this paper were to (1)use sensing methods for damage detection of segmental concretepipelines, and (2) provide insight to the damage evolution of seg-mental concrete pipelines in the vicinity of concentrated trans-verse permanent ground displacement.
The sensing methods implemented in the tests described in thispaper will be used to optimize the methods to be used in the nexttwo years of pipeline testing, and to design new sensing methodsthat are more economical for field applications.
Acknowledgments
This work was supported by the National Science Foundationunder the NEES Program, Grant CMMI-0724022, and this supportis gratefully acknowledged. Any opinions, findings, and conclu-sions or recommendations expressed in this material are those ofthe authors and do not necessarily reflect the views of the NationalScience Foundation. The large-scale testing was performed at theLarge-Scale Pipelines Testing Facility at Cornell University that isa node in the George E. Brown, Jr. Network for Earthquake Engi-neering Simulation (NEES). The authors thank the Cornell stafffor their outstanding help with the experimental program. In par-ticular, the help of Mr. Tim Bond and Mr. Joe Chipalowsky is greatlyappreciated. This work, in part, was conducted in the PankowMaterials Laboratory and the Materials Sensing and Characteriza-tion Laboratory at Purdue University, and the Laboratory for Intel-ligent Structural Technology at the University of Michigan.
References
[1] Services TAMC. Chile earthquake and tsunami update. Hawaii: Tripler ArmyMedical Center. Center for Excellence in Disaster Management andHumanitarian Assistance; 2010.
[2] Kim J, Lynch JP, Michalowski RL, Green RA, Pour-Ghaz M, Weiss WJ, et al.Experimental study on the behavior of segmented buried concrete pipelinessubject to ground movements. In: Felix WH, Diaz AA, Shull PJ, Vogel DW,editors. Nondestructive characterization for composite materials, Aerospaceengineering, civil infrastructure, and homeland security 2009. SPIE; 2009. p.729419–10.
[3] Shinozuka M, Rose A, Eguchi R. Engineering and socioeconomic impacts ofearthquakes. Buffalo, NY: Multidisciplinary Center for Earthquake EngineeringResearch; 1998.
[4] Eguchi RT. Mitigating risks to infrastructure systems through natural hazardreduction and design. In: Choi C-K, Penzien J, editors. International Symposiumon Public Infrastructure Systems Research. Seoul, Korea; 1995.
[5] Chang SE, Seligson HA, Eguchi RT. Estimation of the economic impact ofmultiple lifeline disruption: memphis light, gas and water case study. Buffalo,NY: Multidisciplinary Center for Earthquake Engineering Research; 1996.
[6] Chen W-F, Scawthorn C. Earthquake engineering handbook. New Directions inCivil Engineering. New York: CRC Press; 2002.
[7] Ballantyne D, Chung R, O’Rourke T, Schiff A. Performance of lifeline systems,the January 17. 1995 Hyogoken-Nanbu (Kobe) earthquake, performance ofstructures, lifelines and fire protection systems. Washington, DC: NationalInstitute of Standards and Technology; 1996.
[8] Ballantyne D. Water system performance in the Great Hanshin (Kobe)earthquake. 1995 American Water Works Association Annual Conference.Anaheim, CA: American Water Works Association, Denver, CO; 1995.
[9] O’Rourke TD, Grigoriu MD, Khater MM. A state of the art review: seismicresponse of buried pipelines. In: Sundararajan C, editor. Decade of progress inpressure vessel technology. New York: American Society of MechanicalEngineers; 1985.
[10] Eguchi RT. Seismic vulnerability models for underground pipes. Earthquakebehavior and safety of oil and gas storage facilities, buried pipelines andequipment, PVP-77. New York: American Society of Mechanical Engineers;1983. p. 368–73.
[11] Porter KA, Scawthorn C, Honegger DG, O’Rourke TD, Blackburn F. Performanceof water supply pipelines in liquefied soil. Fourth US–Japan Workshop onEarthquake Disaster Prevention for Lifeline Systems. Los Angeles, CA; 1991. p.3–17.
[12] Heubach WF. Seismic damage estimation for buried pipeline systems. FourthUS conference on lifeline earthquake engineering. New York: American Societyof Civil Engineers, Technical Council on Lifeline Earthquake Engineering; 1995.p. 312–9.

762 M. Pour-Ghaz et al. / Cement & Concrete Composites 33 (2011) 749–762
[13] Eidinger JM, Maison B, Lee D, Lau B. East Bay municipal utility district waterdistribution damage in 1989 Loma Prieta earthquake. Fourth US Conference onLifeline Earthquake Engineering. American Society of Civil Engineers,Technical Council on Lifeline Earthquake Engineering; 1995. p. 240–7.
[14] Kim J, O’Connor S, Nadukuru S, Lynch JP, Michalowski R, Green RA, et al.Behavior of full-scale concrete segmented pipelines under permanent grounddisplacements. In: Kundu T, editor. Health Monitoring of Structural andBiological systems 2010. SPIE; 2010. p. 76500U-U-11.
[15] Bradshaw AS, daSilva G, McCue MT, Kim J, Nadukuru SS, Lynch J, et al. Damagedetection and health monitoring of buried concrete pipelines. In: Oka FMAKS,editor. International Symposium on Prediction and Simulation Methods forGeohazard Mitigation. Kyoto, Japan; 2009. p. 473–8.
[16] O’Rourke TD, Gowdy TE, Stewart HE, Pease JW. Lifeline performance andground deformation in the Marina during 1989 Loma Prieta Earthquake. ThirdJapan–US Workshop on Earthquake Resistant Design of Lifeline Facilities andCountermeasures for Soil Liquefaction. San Francisco; 1991. p. 129–46.
[17] Krathy RG, Salvadori MG. Strength and dynamic characteristics of gasket-jointed concrete water pipelines. New York: Weidlinger Associates; 1978.
[18] Ayala G, O’Rourke M. Effects of the 1985 Michoacan earthquake on watersystems and other buried lifelines in Mexico. Buffalo, NY: MultidisciplinaryCenter for Earthquake Engineering Research; 1989.
[19] Sun S, Shien S. Analysis of seismic damage to buried pipelines in Tangshanearthquake. Earthquake behavior and safety of oil and gas storage facilities,buried pipelines and equipment, PVP-77. New York: American Society ofMechanical Engineers; 1983. p. 365–7.
[20] Prior JC. Investigation of bell and spigot joints in cast iron water pipes. OhioState University; 1935.
[21] El Hmadi K, O’Rourke MJ. Seismic wave effects on straight jointed buriedpipeline. Buffalo, NY: Multidisciplinary Center for Earthquake EngineeringResearch; 1989.
[22] Palmer MC, O’Rourke TD, Stewart HE, O’Rourke MJ, Symans M. Largedisplacement soil-structure interaction test facility for lifelines. Eighth USNational Conference on Earthquake Engineering, San Francisco, CA2006.
[23] O’Rourke TD, Bonneau A. Lifeline performance under extreme loading duringearthquakes. In: Pitilakis KD, editor. Earthquake Geotechnical Engineering.Dordrecht, Netherlands: Springer; 2007. p. 407–32.
[24] ASTMC76. Standard specification for reinforced concrete culvert, storm drain,and sewer pipe. West Conshohocken, PA: ASTM International; 2010.
[25] ASTMC655. Standard specification for reinforced concrete d-load culvert,storm drain, and sewer pipe. West Conshohocken, PA: ASTM International;2009.
[26] AWWAC300. Standard for reinforced concrete pressure pipe, steel cylindertype, for water and other liquids. Denver, CO: American Water WorksAssociation; 2004.
[27] ASTMD2922. Standard test methods for density of soil and soil-aggregate inplace by nuclear methods (shallow depth). West Conshohocken, PA: ASTMInternational; 2005.
[28] ASTMD2216. Standard test methods for laboratory determination of water(moisture) content of soil and rock by mass. West Conshohocken, PA: ASTMInternational; 2010.
[29] Pour-Ghaz M, Weiss J. Detecting the time and location of cracks usingelectrically conductive surfaces. Cem Conc Compos 2011;33:116–23.
[30] Raoufi K, Pour-Ghaz M, Poursaee A, Weiss J. Restrained shrinkage cracking inconcrete elements: the role of substrate bond on crack development. ASCE JCiv Eng Mater; 2011. doi:10.1061/(ASCE)MT.1943-5533.0000247.
[31] Pour-Ghaz M, Poursaee A, Spragg R, Weiss J. Experimental methods to detectand quantify damage in restrained ring test. West Lafayette. School of CivilEngineering, Purdue University; 2010.
[32] Poursaee A, Weiss WJ. An automated electrical monitoring system (AEMS) toassess property development in concrete. Automat Constr 2010;19(4):485–90.
[33] Scott IG. Basic acoustic emission. New York: Gordon and Breach Science; 1991.[34] Yuyama S, Ohtsu M. Acoustic emission evaluation in concrete. Acoust Emission
– Beyond Millennium 2000:187–213.[35] Puri S, Weiss J. Assessment of localized damage in concrete under compression
using acoustic emission. ASCE J Civ Eng Mater 2003;18(3):325–33.[36] Puri S. Assessing the development of localized damage in concrete under
compressive loading using acoustic emission. West Lafayette, PurdueUniversity; 2003.
[37] Ouyang CS, Landis E, Shah SP. Damage assessment in concrete usingquantitative acoustic-emission. J Eng Mech – ASCE 1991;117(11):2681–98.
[38] Ohtsu M, Shigeishi M, Sakata Y. Nondestructive evaluation of defects inconcrete by quantitative acoustic emission and ultrasonics. Ultrasonics1998;36(1–5):187–95.
[39] Ohtsu M, Shigeishi M, Iwase H, Koyanagi W. Determination of crack location,type and orientation in concrete structures by acoustic-emission. Mag ConcrRes 1991;43(155):127–34.
[40] Landis EN, Baillon L. Experiments to relate acoustic emission energy to fractureenergy of concrete. J Eng Mech – ASCE 2002;128(6):698–702.
[41] Kim B, Weiss J. Using acoustic emission to quantify damage in restrained fiberreinforced cement mortars. Cem Concr Res 2003;33(2):207–14.
[42] Pour-Ghaz M, Weiss J. Quantifying damage due to aggregate expansion incement matrix. In: Ideker JH, Radlinska A, editors. Advances in the MaterialScience of concrete. American Concrete Institution; 2010.
[43] Garboczi EJ, Snyder KA, Douglas JF, Thorpe MF. Geometrical percolation-threshold of overlapping ellipsoids. Phys Rev E 1995;52(1):819–28.


