Embed Size (px)
Citation preview

Computers & Geosciences 29 (2003) 143–153
Fracture connectivity from fracture intersections inborehole image logs
Sait I. Ozkayaa,*, Joerg Mattnerb
a Baker Atlas Geosciences, P.O. Box 15425, Manama, Bahrainb GeoTechnical Consulting, P.O. Box 20393, Manama, Bahrain
Received 20 September 2001; received in revised form 22 August 2002
Abstract
The connectivity of fractures in subsurface rock formations is a key factor in understanding and predicting fracture
flow in hydrocarbon reservoirs. We present a method to determine average number of fracture intersections per
fracture, l; and fracture length from borehole image logs. Fracture length is estimated from relative frequency of
fractures with partial or complete circumferential traces on borehole image logs.
When all fractures are interconnected fractures are above percolation threshold. Every fracture must intersect at least
two other fractures for percolation, which means that percolation threshold corresponds to l ¼ 2: We introduce the
term sub-percolation threshold at l ¼ 1 to define the transition from isolated fractures to fracture clusters. Fractures
are isolated when lo1 form clusters within sub-percolation range (1olo2) and generate a network above percolation
threshold (l > 2).
Within sub-percolation range, the expected number of fractures, N ; in a cluster is related to l as follows: N ¼2l=ð2 � lÞ: This equation shows that fracture clusters remain small until l reaches the percolation threshold value, at
which point they interconnect in an explosive manner to form a network. Hence, only the areas where l is greater than 2
need to be considered for fracture networks.
Relative frequency of intersecting fractures, which is observed in borehole image logs, depends very much on fracture
size. More than 50% of observed fractures must be intersecting for an average fracture length of 1 m at percolation
threshold. The required frequency for percolation drops to 25% for an average fracture length of 2 m, and to 10% for
10 m average length.
r 2002 Elsevier Science Ltd. All rights reserved.
Keywords: Fracture intersections; Borehole image logs; Connectivity; Percolation and sub-percolation thresholds
1. Introduction
Determining fracture connectivity is a key factor in
predicting and modeling fracture flow in subsurface rock
formations containing economically valuable products
such as water or hydrocarbons. This is true for both
mineralized fractures, which are often considered flow
barriers and non-mineralized fractures, which are
usually considered conduits. Commonly, fracture den-
sity, average length and angular scatter of fractures
determine fracture connectivity. The critical value of
connectivity at which fractures form an infinite network
is called percolation threshold (Berkowitz, 1995). Note
that this ‘‘infinite network’’ is a geometric concept and
exists independently of geomechanical and kinematic
analysis of fracture systems. Hestir and Long (1990)
proposed the following formula as a measure of fracture
connectivity:
z ¼ df LavHðyÞ; ð1Þ
*Corresponding author. Tel.: +973-212-234; fax: +973-212-
345.
E-mail addresses: [email protected]
(S.I. Ozkaya), [email protected] (J. Mattner).
0098-3004/02/$ - see front matter r 2002 Elsevier Science Ltd. All rights reserved.
PII: S 0 0 9 8 - 3 0 0 4 ( 0 2 ) 0 0 1 1 3 - 9

where HðyÞ is a measure of angular scatter. df is fracture
density and Lav is the average fracture length. For
uniformly distributed fracture orientation, HðyÞ equals
2=p: The value of z at percolation threshold is 3.6. This
formula, however, applies only to non-natural, con-
ceptual two-dimensional fracture network maps. An
analogous formula does not exist for equivalent three-
dimensional fracture networks. Fracture connectivity
and permeability must be estimated using discrete
fracture networks (DFN) (i.e. Odling, 1992; Odling
et al., 1999; Chen et al., 1999).
In this paper we present a method to deter-
mine fracture connectivity from borehole image logs
and cores using relative abundance of isolated
and connected fractures. We introduce three distinct
cases of fracture connectivity: (i) isolated fractures,
(ii) fracture clusters, (iii) fracture networks. We propose
the term sub-percolation threshold to define the transi-
tion from isolated fractures to fracture clusters. We
show that both the sub-percolation and percolation
threshold values can be obtained from the relative
abundance of isolated to interconnected fractures. The
differentiation of the three cases may have profound
implications on the interpretation of fractured reser-
voirs. The frequency of interconnected fractures also
gives information on the size, volume and surface area
of fracture clusters between sub-percolation and perco-
lation thresholds.
The idea of determining fracture connectivity from
frequency of isolated and connected fractures is
particularly appealing, because isolated fractures can
easily be differentiated from connected/intersecting
fractures on borehole image logs and cores. If we make
the assumption that the observed fracture relationships
are important to the reservoir productivity, some
significant parameters of these fracture systems such as
fracture tributary area, drainage volume, radius of
fracture enhanced zone around a wellbore and perme-
ability enhancement by fractures may be obtained from
borehole image logs.
For the purpose of this paper, only the spatial–
geometric relationships of fractures are examined, with-
out dealing with the geomechanical and kinematic origin
of fractures. The analysis is based on several implicit
assumptions that are listed below.
(1) We assume first that the image analyst has
identified and eliminated all drilling induced
fractures from consideration. It is not al-
ways straightforward to separate induced and
natural fractures (i.e. to differentiate fractures,
which are present in the rock before the well was
drilled from those, which are induced e.g. by the
drilling of the well). The problem becomes com-
pounded when drilling activity enhances natural
fractures.
(2) We also neglect fractures that are smaller than the
borehole diameter, since such small fractures are
usually below the resolution of borehole image logs
and do not contribute significantly to fracture flow.
2. Finding expected number of fracture intersections per
fracture
Let us start with a reference fracture. A borehole may
or may not pass through this reference fracture or may
pass through its edge (Fig. 1). Suppose that the reference
fracture is intersected by another fracture. When a
fracture intersection is encountered by a wellbore
it is usually visible as intersecting or truncating
fracture traces in borehole image logs (Fig. 2A and 3).
However, a borehole may or may not cross through a
fracture intersection (Fig. 2B). Frequency of fracture
intersections in borehole image logs is, therefore, less
than the actual frequency.
It is possible to estimate the actual frequency from
observed frequency of intersecting fractures if additional
Fig. 1. Boreholes (or cores) can have full encounter with
fracture when borehole passes through middle or partial
encounter when borehole passes through edge of fracture.
S.I. Ozkaya, J. Mattner / Computers & Geosciences 29 (2003) 143–153144

information on wellbore diameter, trajectory and
orientation is available. Borehole diameter is always
known. Spatial orientation of fractures and wellbore are
directly measurable.
The probability that a borehole passes through a
fracture intersection given that it has encountered an
intersecting fracture can be estimated from the following
expression (see Appendix A):
p ¼A
B¼
rLð1 þ cos yÞ=8 þ 4r2
ðL=2 þ rÞðL cos y=2 þ rÞðAoBÞ;
p ¼ 1 ðAXBÞ; ð2Þ
where L is fracture length, r is borehole radius and y is
the average angle fractures make with the borehole.
When a fracture is not coin shaped the average of length
and height may be used in place of L: The condition that
p ¼ 1 if AXB has to be placed because the equation is
based on geometric approximations. When the fracture
length is equal or smaller than borehole, the probability
that a borehole ‘‘sees’’ a fracture intersection is regarded
as unity.
Fracture length L is calculated from the relative
frequency of fractures, r; with full and partial circumfer-
ential traces on borehole image logs (see Appendix B). r
is related to length, L; as follows:
r ¼ðL � dÞðL cos y� dÞðL þ dÞðL cos yþ dÞ
; ð3Þ
where d is borehole diameter. L may be regarded as the
average fracture size. If a fracture is rectangular,
fracture width can be calculated from L; if fracture
height is known.
If we assume that fracture intersections follow
Poisson’s distribution we can calculate the expected
number of fracture intersections, l for each fracture
from the following relationship:
Pð0Þ ¼ e�lX
k
Pð0=kÞlk
k!; ð4Þ
where Pð0=kÞ means probability that a wellbore
encounters no fracture intersection given that the
reference fracture is intersected by k other fractures.
Pð0Þ is the probability of having an isolated fracture.
The first few of the conditional probabilities are listed
below.
Pð0=0Þ ¼ 1;
Pð0=1Þ ¼ 1 � p;
Pð0=2Þ ¼ 1 � 2p þ p2: ð5Þ
The conditional probabilities are based on the simplify-
ing assumption that a wellbore encountering one or the
other of the two intersections are independent events, i.e.
Pða,bÞ ¼ PðaÞ þ pðbÞ � Pða-bÞ: ð6Þ
The conditional probability for 3, 4 and higher number
of intersections can be calculated from the general form
of Eq. (5). It is necessary only to find the sum up to 6
intersections. When there are more than 6 intersections
the probabilities are very low and can be neglected. The
probability of having an isolated fracture, Pobsð0Þ; is
estimated by the relative frequency of fractures (12kob)
with no intersections in a wellbore
Pobsð0Þ ¼ 1 � kob: ð7Þ
The relative frequency kob is given by
kob ¼Nc
Nt; ð8Þ
Fig. 2. Fracture intersection on reference fracture may or may
not be encountered by a wellbore depending on location of
wellbore with respect to line of intersection. (A) Borehole
encounters fracture intersection. (B) Fracture intersection is
missed.
S.I. Ozkaya, J. Mattner / Computers & Geosciences 29 (2003) 143–153 145

where Nc is number of fractures with at least one
intersection and Nt is the total number of fractures
observed in a wellbore. Using Pobsð0Þ from Eq. (7) for
Pð0Þ; the expected value l can be calculated from Eq. (4)
by iteration.
3. Percolation and sub-percolation thresholds
Below we introduce three distinct cases of fracture
connectivity:
Case 1: Isolated fracture (Fig. 4).
Case 2: Fracture clusters (Fig. 5).
Case 3: Fracture network (Fig. 6).
We propose the term sub-percolation threshold when
isolated fractures start forming fracture clusters. At
percolation threshold isolated fracture clusters connect
and start forming a continuous three-dimensional
fracture network. The differentiation of the three cases
has profound implications on the interpretation of
fracture flow within a field context and the interpreta-
tion of near wellbore. Both the sub-percolation and
percolation threshold values can be obtained by the
relative abundance of isolated to interconnected frac-
tures.
Fractures reach percolation when the expected
number of intersections per fracture l ¼ 2: Thus, it
becomes possible to determine whether fractures are
above percolation from borehole image logs by finding
the relative frequency of isolated and connected
fractures.
When l is less than 1, fractures are expected to be
isolated. We call this value the sub-percolation thresh-
old. We coin the term sub-percolation range for l values
between these two critical limits (1olo2). Below the
sub-percolation threshold fractures are isolated. Above
the percolation threshold fractures form fully intercon-
nected network.
4. Size of sub-percolation fracture clusters
Fractures occur as clusters within the sub-percolation
range. The frequency of interconnected fractures also
Outcrop of fractured
Mesozoic volcanic rocks
Borehole Image(CBIL)
1m
N S
Fracture intersections
Fra
ctu
res
N
Fig. 3. Outcrop and borehole image log example of intersecting non-mineralized fractures. Intersecting non-mineralized fractures can
form large fluid conductive networks. This type of fractures allows, for example, economical hydrocarbon production from
formations, which would otherwise be considered non-producing. Outcrop shows fractured Mesozoic volcanic rocks in anti-Lebanon
in Syria (see hammer for scale). Image log depicts fractures in same rock formation in Syria at depth of over 2 km. On right, part of
image is interpreted and sketch indicates spatial attitude of intersecting fractures.
S.I. Ozkaya, J. Mattner / Computers & Geosciences 29 (2003) 143–153146

gives information on the size, the volume and surface
area of fracture clusters between sub-percolation and
percolation threshold (Fig. 5). The expected number of
fractures in a cluster can be found from the sum of
fractures, N; that are expected to connect to a seed
Isolated fractures (λ<1)
Clusters
(A)
(B)
Fig. 4. Two-dimensional fracture system below sub-percolation
threshold. Fractures are mostly isolated. (A) All fractures, (B)
only intersecting fractures. Only a few small clusters are present
with two to three fractures. Fracture data: average
length=0.291 m, area density=2.32/m2, scan line den-
sity=0.68/m, number of fractures=200, number of intersec-
tions=50, expected number of intersections=0.25.
N=13
N=13
N=8
N=5
N=5
N=51
N=21
N=6
N=17
N=23
Selected clusters (N=number of fractures in cluster)
Fracture clusters (sub-percolation range) (1<λ<2)
(A)
(B)
Fig. 5. Two-dimensional stochastic fracture model with ran-
dom orientation and exponential length distribution. Fractures
are within sub-percolation range and occur mostly in clusters.
(A) All fractures, (B) only some selected fracture clusters.
Fracture cluster size is related to expected number of fracture
intersections. For this example, calculated average number of
fractures per cluster is 2.57. Actual value is 4. Maximum
number of fractures per cluster is 55. Fracture length, density
and expected number of fracture intersections determines this
volume. Fracture data: average length=0.33 m, area den-
sity=6.75/m2, scan line density=2.23/m, number of frac-
tures=503, number of intersections=724, expected number of
intersections=1.44.
S.I. Ozkaya, J. Mattner / Computers & Geosciences 29 (2003) 143–153 147

fracture, i.e.
N ¼ 2lX
ðl� 1Þn: ð9Þ
When (l� 1) is less than 1 (lo2) this series is
convergent to 1=ð22lÞ: Thus the expected number of
fractures in a cluster is given by
N ¼2l
2 � l: ð10Þ
If fracture length and density are known, this number
can be used to determine the total drainage area and
volume of fracture clusters and the near-wellbore
permeability enhancement by fracture clusters con-
nected to a wellbore.
5. Discussion and conclusion
We presented a method for finding expected value of
fracture intersections per fracture, l; from borehole
image logs and demonstrated how this value indicates
the degree of fracture connectivity. We define two
critical values for l corresponding to fracture percola-
tion (l ¼ 2) and sub-percolation threshold (l ¼ 1).
Fractures are isolated below sub-percolation threshold,
and form interconnected networks above percolation
threshold. Between the two limits, fractures occur as
clusters. We have also provided a simple formula to
determine fracture cluster size at sub-percolation range
in terms of expected number of fracture intersections.
The formula reveals that fracture clusters have little
impact on flow dynamics below percolation threshold
because clusters remain small until percolation is
reached, when they interconnect to form a continuous
network in an exponential manner (Fig. 7). For exam-
ple, the average number of fractures in a cluster does not
exceed a few hundred for l ¼ 1:99: For a fracture
density of 2 fractures per m3 this average cluster volume
is smaller than 15 m3. Fracture clusters remain small
until percolation threshold is reached. Hence, only the
areas where l is greater than 2 will have fracture
networks with fracture clusters elsewhere will be too
small to impact on flow dynamics.
Relative frequency of intersecting fractures, which is
observed in borehole image logs, depends very much on
fracture size (Fig. 8). More than 50% of observed
fractures must be intersecting for an average fracture
length of 1 m at percolation threshold. The required
frequency for percolation drops to 25% for a fracture
length of 2 m, and 10% for 10 m average length. It is
therefore necessary to have an accurate fracture size
estimate in order to determine degree of fracture
connectivity from fracture intersection in borehole
image logs.
It should be noted that the derivations are based
entirely on simplified geometric relationships and do not
take into consideration geomechanical or geological
origin of an observed fracture system. In particular, the
following points must be kept in mind when calculating
fracture connectivity:
Continuous fracture network
Fracture network (λ>2)
(A)
(B)
Fig. 6. Two-dimensional stochastic fracture model with ran-
dom orientation and exponential length distribution. Fractures
are above percolation threshold. (A) Most fractures belong to
continuous network, (B) only fractures that belong to
percolating network. Fracture data: fracture length=0.35 m,
area density=10.9 m2, scan line density=3.83/m, number of
fractures=780, number if intersections=1862, expected num-
ber of intersections=2.38.
S.I. Ozkaya, J. Mattner / Computers & Geosciences 29 (2003) 143–153148

(1) If geological fracture connectivity is required, both
cemented and open fractures are to be included in
the analysis. For permeability assessment of
fracture systems, as barriers or conduits, fluid
conductive fractures and non-sealing fractures
should be considered separately.
(2) Partially mineralized fractures create a complex
network, in which connectivity of fluid condu-
ctive segments and sealing segments needs to
be assessed independently. Channeling along
fracture planes creates an additional challenge. In
this case, connectivity of the one-dimensional
tributary channel-network is critical and not the
fracture surface intersection. Two fractures may
intersect, but might fail to have connected flow
pathways.
(3) Fracture characteristics, including length and con-
nectivity are very much dependent on mechanical
layer properties, such as layer thickness, porosity or
dolomite content. The connectivity analysis must
be performed for each mechanical layer.
(4) The average fracture connectivity of an area and
the connectivity of individual fracture clusters are
significantly different. Fracture clusters usually
occur in the vicinity of faults. In order to calculate
the average fracture connectivity of an area for an
100
300
500
0 1 2
λ
N
N= number of fractures in a cluster = average number of fracture intersections per fractureλ
Fig. 7. Fracture cluster size as a function of expected number of fracture intersections. Fracture clusters remain small until percolation
is reached at l ¼ 2; at which point they become interconnected in an exponential manner to form a continuous network.
0
0.2
0.4
0.6
0.8
1
0 2 4 6 8 10 12
Fracture Length (m)
Per
cent
of i
nter
sect
ing
frac
ture
s
Fig. 8. Minimum percent of intersecting fractures that must be observed in borehole image logs or cores for fractures at or above
percolation threshold.
S.I. Ozkaya, J. Mattner / Computers & Geosciences 29 (2003) 143–153 149
upscale fracture connectivity model, the connectiv-
ity between the clusters must also be calculated.
Appendix A. Fracture intersections from borehole image
logs
Below we derive a formula to remove the sampling
bias and obtain a corrected value for fraction of
intersected fractures from borehole image log/core
observations with the assumption that all fractures are
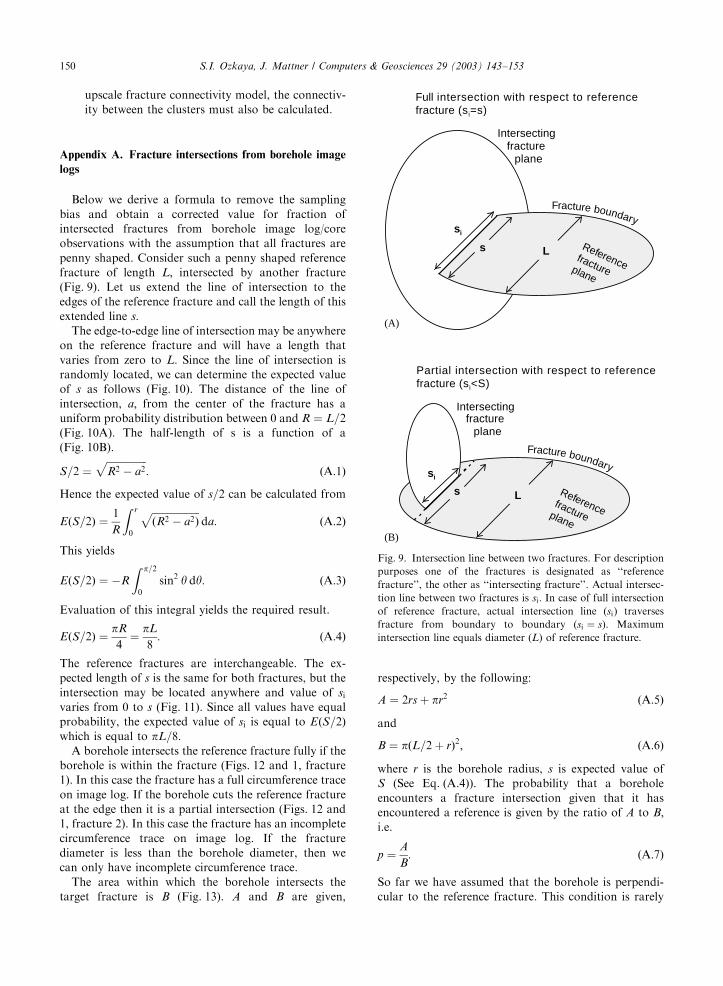
penny shaped. Consider such a penny shaped reference
fracture of length L; intersected by another fracture
(Fig. 9). Let us extend the line of intersection to the
edges of the reference fracture and call the length of this
extended line s:The edge-to-edge line of intersection may be anywhere
on the reference fracture and will have a length that
varies from zero to L: Since the line of intersection is
randomly located, we can determine the expected value
of s as follows (Fig. 10). The distance of the line of
intersection, a; from the center of the fracture has a
uniform probability distribution between 0 and R ¼ L=2
(Fig. 10A). The half-length of s is a function of a
(Fig. 10B).
S=2 ¼ffiffiffiffiffiffiffiffiffiffiffiffiffiffiffiffiR2 � a2
p: ðA:1Þ
Hence the expected value of s=2 can be calculated from
EðS=2Þ ¼1
R
Z r
0
ffiffiffiffiffiffiffiffiffiffiffiffiffiffiffiffiffiffiffiðR2 � a2Þ
pda: ðA:2Þ
This yields
EðS=2Þ ¼ �R
Z p=2
0
sin2 y dy: ðA:3Þ
Evaluation of this integral yields the required result.
EðS=2Þ ¼pR
4¼
pL
8: ðA:4Þ
The reference fractures are interchangeable. The ex-
pected length of s is the same for both fractures, but the
intersection may be located anywhere and value of si
varies from 0 to s (Fig. 11). Since all values have equal
probability, the expected value of si is equal to EðS=2Þwhich is equal to pL=8:
A borehole intersects the reference fracture fully if the
borehole is within the fracture (Figs. 12 and 1, fracture
1). In this case the fracture has a full circumference trace
on image log. If the borehole cuts the reference fracture
at the edge then it is a partial intersection (Figs. 12 and
1, fracture 2). In this case the fracture has an incomplete
circumference trace on image log. If the fracture
diameter is less than the borehole diameter, then we
can only have incomplete circumference trace.
The area within which the borehole intersects the
target fracture is B (Fig. 13). A and B are given,
respectively, by the following:
A ¼ 2rs þ pr2 ðA:5Þ
and
B ¼ pðL=2 þ rÞ2; ðA:6Þ
where r is the borehole radius, s is expected value of
S (See Eq. (A.4)). The probability that a borehole
encounters a fracture intersection given that it has
encountered a reference is given by the ratio of A to B;i.e.
p ¼A
B: ðA:7Þ
So far we have assumed that the borehole is perpendi-
cular to the reference fracture. This condition is rarely
Intersectingfracture
plane
Intersectingfracture
plane
L
Full intersection with respect to referencefracture (si=s)
Partial intersection with respect to referencefracture (si<S)
Fracture boundary
Referencefractureplane
(A)
(B)
s
si
L
Fracture boundary
Referencefractureplane
s
si
Fig. 9. Intersection line between two fractures. For description
purposes one of the fractures is designated as ‘‘reference
fracture’’, the other as ‘‘intersecting fracture’’. Actual intersec-
tion line between two fractures is si: In case of full intersection
of reference fracture, actual intersection line (si) traverses
fracture from boundary to boundary (si ¼ s). Maximum
intersection line equals diameter (L) of reference fracture.
S.I. Ozkaya, J. Mattner / Computers & Geosciences 29 (2003) 143–153150

met. More often, the borehole intersects the reference
fracture at an angle y and plan view of the reference
fracture on a plane perpendicular to the borehole is an
ellipse. The length of the two principal axes of this
ellipse, a and b given by (Fig. 14)
a ¼ L cos y; ðA:8Þ
b ¼ L:
The average length of fracture intersection on this plan
view is
sav ¼s þ s cos y
2: ðA:9Þ
The area A and B must be modified, respectively, as
follows:
A ¼ 2rsav þ 4pr2 ðA:10Þ
and
B ¼ pðL=2 þ rÞðL cos y=2 þ rÞ: ðA:11Þ
Accordingly, the probability that a borehole
passes through fracture intersection, given that it has
encountered an intersecting fracture can be estimated
from Eq. (2).
θS/2
a
R=L/2
Referencefracture plane
Referencefractureplane
s1
s2
s3
sn
Planview
Planview
(A)
(B)
Fig. 10. Calculation of expected maximum length of fracture
intersections. (A) Fracture intersection, s; can be located
anywhere on reference fracture. Full intersection length (s)
varies from length zero to diameter of reference fracture (L). (B)
Expected value of s can be calculated as function of distance
from center, assuming this distance has uniform probability
distribution.
S
Ssi
si
Partial intersection case 1 (si<S)
Partial intersection case 2 (si<s)
Intersecti
ng
fractu
re
Intersecti
ng
fractu
re
Referencefracture
Referencefracture
(A)
(B)
Fig. 11. Basis for calculation of expected value for si as
function of s: (A) Partial intersection with respect to reference
fracture, full intersection with respect to intersecting fracture.
(B) Both fractures have partial intersections. Irrespective of
relative fracture sizes, si varies in length from zero to s;randomly. Consequently, it can be shown that expected value of
si equals s=2:
S.I. Ozkaya, J. Mattner / Computers & Geosciences 29 (2003) 143–153 151

Appendix B. Fracture length from borehole image logs
Consider a coin shaped fracture with diameter L and a
borehole with diameter d : The fracture pole makes an
angle, y with the borehole trajectory. If the center of the
circle with diameter d representing the borehole falls
entirely within the following area, A; where
A ¼pðL � dÞðL cos y� dÞ
4ðB:1Þ
the fracture will have a full circumferential trace (see
Fig. 12), This area is within the fracture projection onto
a plane perpendicular to the borehole (Fig. 14). Now
consider another ellipse with dimension w1; and w2
given, respectively, by
w1 ¼ L þ d ðB:2Þ
and
w2 ¼ L cos yþ d: ðB:3Þ
If the center of the circle that represents the borehole
falls within this ellipse, the borehole intersects the
fracture (Fig. 12). The fracture may have full or partial
circumferential trace on the image log depending on
r
r : borehole radiusL : reference fracture diameter
Full encounterof fracture
Partial encounter of fracture
L/2
Referencefracture
bore-hole
bore-hole
Fig. 12. Borehole has to be located within dotted circle in order
to encounter reference fracture. Partial encounters are located
within outer rim of reference fracture (dotted circle). Borehole
radius (r) plus radius (L=2) of reference fracture define radius of
outer dotted circle. Relative frequency of partial fracture
encounters may be used to estimate fracture length from
borehole image logs.
r : borehole diameters : line of intersection
L : reference fracture diameterr : borehole radius
Area of borehole encounterof fracture intersection (Area A)
Area borehole encountersreference fracture (Area B)
Planview
Plan view
L/2 r
(A)
(B)
Are
a A
Area B
sr
Referencefracture
Fig. 13. Basis for calculation of probability that borehole
encounters fracture intersection on reference fracture given
that there is an intersection. (A) Plan view showing geometric
configuration of area in which borehole encounters fracture
intersection (borehole is perpendicular to reference fracture
plane). (B) Defintion of fracture intersection probability.
Probability that borehole misses fracture intersection, given
that there is an intersection, is 12A=B:
S.I. Ozkaya, J. Mattner / Computers & Geosciences 29 (2003) 143–153152

where the borehole encounters the fracture. The area of
this ellipse, A0; is
A0 ¼pðL þ dÞðL cos yþ dÞ
4: ðB:4Þ
The ratio, r of fully intersected fractures to all
intersected fractures is therefore given by
r ¼A
A0: ðB:5Þ
This yields the following expression:
r ¼ðL � dÞðL cos y� dÞðL þ dÞðL cos yþ dÞ
: ðB:6Þ
References
Berkowitz, B., 1995. Analysis of fracture network connectivity
using percolation theory. Mathematical Geology 27,
467–483.
Chen, M., Bai, M., Roegiers, J.C., 1999. Permeability tensors of
anisotropic fracture networks. Mathematical Geology 31,
355–373.
Hestir, K., Long, J.C., 1990. Analytical expressions for the
permeability of random two-dimensional Poisson fracture
networks based on regular lattice percolation and equivalent
media theories. Journal of Geophysical Research 95 (B13),
21565–21581.
Odling, N., 1992. Permeability of natural and simulated
fracture patterns. In: Larsen, R.M., Brekke, H., Larsen,
B.T., Talleraas, E. (Eds.), Structural and Tectonic Modeling
and its Application to Petroleum Geology. Norwegian
Petroleum Society Special Publication 1, Elsevier, Amster-
dam, pp. 365–380.
Odling, N.E., Gillespie, P., Bourgine, B., Castaing, C., Chiles,
J.-P., Christensen, N.P., Fillion, E., Genter, A., Olsen, C.,
Thrane, L., Trice, R., Aarsesth, E., Walsh, J.J., Watterson,
J., 1999. Variations in fracture system geometry and their
implications for fluid flow in fractured hydrocarbon
reservoirs. Petroleum Geoscience 5, 373–384.
Fig. 14. Plan view of reference fracture perpendicular to
borehole is elliptical when borehole is not perpendicular to
the reference fracture plane. Area of fracture and fracture
intersection encounter must be modified accordingly.
S.I. Ozkaya, J. Mattner / Computers & Geosciences 29 (2003) 143–153 153