Embed Size (px)
Citation preview
Dissertation der Fakultät für Biologie der
Ludwig-Maximilians-Universität München
Foxc1 regulates Pecam-1 Expression in embryonic
Endothelial Progenitor Cells
Eingereicht von Mathias Lamparter
München, 15. Januar 2008
Angefertigt am Institut für Klinische Molekularbiol ogie und Tumorgenetik,
Helmholtz Zentrum München – Deutsches Forschungszen trum für Gesundheit
und Umwelt, und Division of Cardiovascular Medicine , Vanderbilt University
Medical Center, Nashville, TN, USA

Erster Gutachter: Prof. Dr. Dirk Eick
Zweiter Gutachter: Prof. Dr. Manfred Schliwa Tag der mündlichen Prüfung: 02. Juli 2008

SUMMARY ................................................................................................................. 1
1. INTRODUCTION.................................................................................................... 3
1.1 The Vascular System........................................................................................ 3
1.2 De novo formation of the vasculature – Vasculogenesis................................... 3
1.3 Expansion and maturation of the vasculature – Angiogenesis.......................... 4
1.4 The vasculature in disease states..................................................................... 5
1.5 Characteristics of adult EPCs ........................................................................... 5
1.6 EPC promote neovascularization...................................................................... 6
1.7 Molecular control of blood vessel formation ...................................................... 6
1.7.1 VEGF and VEGF-Receptors ...................................................................... 7
1.7.2 Angiopoietins and Tie-Receptors................................................................ 8
1.7.3 Ephrins and Eph Receptors........................................................................ 8
1.7.4 Extracellular Matrix and Cell Adhesion Molecules...................................... 8
1.7.5 Other signaling pathways involved in vascular development...................... 9
1.7.6 Cytokines.................................................................................................. 10
1.7.7 Angiogenic inhibitors ................................................................................ 10
1.7.8 Haemodynamic forces.............................................................................. 10
1.8 Transcriptional control of vascular formation................................................... 10
1.8.1 Ets transcription factors................................................................................ 11
1.8.2 Basic Helix-Loop-Helix Transcription Factors........................................... 11
1.8.3 Homeobox Transcription Factors.............................................................. 12
1.8.4 Further Transcription Factors ................................................................... 12
1.8.5 Hypoxia and HIFαααα .................................................................................... 12
1.9 Embryonic endothelial progenitor cells (eEPCs) as a model system .............. 13
1.10 Foxc1 and Foxc2 are induced during eEPC in vitro differentiation................ 14
1.11 Forkhead (Fox) Transcription Factors ........................................................... 14
1.11.1 General characteristics of Fox Genes .................................................... 14
1.11.2 Nomenclature of Fox Genes................................................................... 15
1.11.3 Chromosomal organization of Fox genes ............................................... 15
1.11.4 Fox Genes in Development .................................................................... 16
1.11.5 Fox Genes in Signaling Pathways .......................................................... 17
1.11.6 Fox Genes in Human Diseases.............................................................. 18
1.11.7 Fox Genes in the Adult Organism........................................................... 19
1.12 The FoxC subfamily - Foxc1 and Foxc2........................................................ 19
1.12.1 Expression Patterns ............................................................................... 19
1.12.2 Abnormalities in FoxC mutant embryos.................................................. 20
1.12.3 Foxc1 and Foxc2 - signaling pathways and target gene activation......... 21
1.13 Aims of the Ph.D. Project .............................................................................. 22
2. MATERIAL and METHODS.................................................................................. 23
2.1 Tissue Culture................................................................................................. 23
2.1.1 Cell lines................................................................................................... 23
2.1.2 Tissue culture media ................................................................................ 24
2.1.3 Passage of cell cultures............................................................................ 24
2.1.4 Freezing and thawing of cell lines............................................................. 25
2.1.5 Transfection of cell lines ........................................................................... 25
2.2 Molecular biology techniques.......................................................................... 26
2.2.1 Total RNA isolation................................................................................... 26
2.2.2 Reverse Transcriptase-Polymerase Chain Reaction (RT-PCR) ............... 27
2.2.3 Polymerase Chain Reaction (PCR) .......................................................... 28
2.2.4 PCR Primer Design .................................................................................. 29
2.2.5 DNA Sequencing...................................................................................... 29
2.2.6 Plasmid DNA preparation ......................................................................... 31
2.2.7 Transformation of CaCl2-competent DH5αααα E.coli ..................................... 32
2.2.8 DNA restriction digests ............................................................................. 33
2.2.9 DNA ligation ............................................................................................. 34
2.2.10 Plasmid Constructs................................................................................. 34
2.2.11 Agarose gel electrophoresis ................................................................... 37
2.2.12 Ethanol Precipitation of DNA .................................................................. 38
2.3 Quantitative Real-Time Amplification (qPCR) ................................................. 38
2.3.1 LightCycler Real-Time PCR System......................................................... 38
2.3.2 iQ5 Real-Time PCR System..................................................................... 40
2.4 Fluorescence Activated Cell Sorting (FACS) Analysis .................................... 42
2.5 Microscopy and Fluorescence Microscopy ..................................................... 43
2.6 Immunofluorescence....................................................................................... 43
2.7 Promoter-Luciferase Assays ........................................................................... 44
2.8 Western Blot ................................................................................................... 46
2.9 Chromatin Immunoprecipiation ....................................................................... 48
2.10 Online Databases and Bioinformatics Programs........................................... 51
3. RESULTS............................................................................................................. 53
3.1 Expression of Fox genes in eEPCs................................................................. 53
3.2 Foxc1 and Foxc2 regulate expression of Pecam-1 in eEPCs ......................... 56
3.3 Pecam-1 as an endothelial target gene of Foxc1............................................ 60
3.4 Cis-regulatory areas of the Pecam-1 promoter ............................................... 61
3.5 Pecam-1 promoter and enhancer analysis in different cell lines ..................... 62
3.6 Foxc1 activates transcription through the 5’-flanking 3.5kb-fragment ............. 65
3.7 The distal 5’-flanking 3.5kb-fragment responds specifically to Foxc1 ............. 66
3.8 Foxc1 activates transcription specifically in eEPCs ........................................ 68
3.9 Endogenous Pecam-1 RNA analysis matches promoter activation studies.... 70
3.10 Dose-dependent activation of the Pecam-1 promoter by Foxc1 ................... 71
3.11 Activation of the Pecam-1 promoter takes place in multiple, independently
isolated eEPC clones............................................................................................ 72
3.12 Pecam-1 promoter activity – Summary ......................................................... 73
3.13 Localization of Foxc1-responsive sites.......................................................... 74
3.14 Analysis of the Pecam-1 promoter using Bioinformatic Tools ....................... 76
3.15 The (TTTGT)n motif is found at the human PECAM-1 locus ......................... 78
3.16 Deletion of the repeat motif abolishes promoter activity................................ 81
3.17 Foxc1 binds the (TTTGT)n motif on native chromatin.................................... 83
3.18 Results – Summary....................................................................................... 86
4. DISCUSSION ....................................................................................................... 87
4.1 Pecam-1 basal promoter activity reflects endogenous transcript levels .......... 87
4.2 Foxc1 induced Pecam-1 expression reflects an eEPC-specific mechanism... 88
4.3 Pecam-1 expression is controlled by multiple factors...................................... 89
4.4 Expression of Pecam-1 in isolated embryonic angioblasts requires a specific
upstream regulatory element ................................................................................ 90
4.5 Loss of Foxc1 does not affect pan-endothelial Pecam-1 expression .............. 92
4.6 Foxc1 binds a microsatellite repeat in the 5’-area of the mouse Pecam-1 gene
.............................................................................................................................. 93
4.7 The activity of the upstream element depends on the number of microsatellite
repeat motifs ......................................................................................................... 95
4.8 The repeat number compensates the loss of the consensus motif ................. 96
4.9 Fox proteins can bind low-affinity sides........................................................... 97
4.10 Microsatellite repeats represent species-specific transcriptional elements ... 97
4.11 Variation in transcription factor binding sites across species ........................ 99
4.12 Difference between Foxc1 and Foxc2 functions ......................................... 100
4.13 Foxc1 as regulator of vascular adhesion molecules?.................................. 101
4.14 Conclusion .................................................................................................. 102
REFERENCES....................................................................................................... 104
SUPPLEMENTAL TABLE....................................................................................... 123
ABBREVIATIONS................................................................................................... 125
ACKNOWLEDGMENTS ......................................................................................... 127
LIST OF PUBLICATIONS....................................................................................... 129
Summary
1
SUMMARY
The formation of the vascular network in the embryo is a highly complex event that is
controlled on multiple levels in a spatial and temporal manner. Initial formation takes
place by vasculogenesis, i.e. the de novo formation of a primitive vessel network by
mesodermal endothelial progenitor cells. Subsequent remodeling and expansion into
a mature, diverse vasculature is undergone by angiogenesis, which refers to the
proliferation of pre-existing endothelial cells. Both processes are controlled by a
number of molecular signals such as receptor/ligand complexes, adhesion and matrix
molecules as well as signaling intermediates that have been uncovered in the past
years. However, the transcriptional mechanisms that regulate the initial differentiation
of endothelial progenitor cells to mature tissue are not well-understood. We have
used mouse embryonic endothelial progenitor cells (eEPCs) derived from E7.5
embryos – when vascular structures begin to form - as an in vitro model to study the
process of endothelial cell maturation. We found that Foxc1 and Foxc2, two
members of the winged/helix Forkhead transcription factor family, are induced during
cAMP-stimulated differentiation of eEPCs in vitro. Forkhead transcription factors
comprise of a group of DNA binding proteins that act as trans-activators as well as
trans-repressors at target gene cis-regulatory areas and are involved in a wide
variety of biological processes in animals and fungi. Because Foxc1 and Foxc2 have
been also implicated in cardiovascular development, we investigated their role during
eEPC-differentiation. The work described in this Ph.D. thesis provides evidence that
Foxc1 contributes to the de novo activation of the vascular-specific gene Pecam-1
(platelet endothelial adhesion molecule-1). In contrast, Foxc1 appears to down-
regulate Pecam-1 expression in mature endothelial cells. In vitro promoter analysis
revealed that the de novo activation of Pecam-1 in response to Foxc1 is mediated by
a distal upstream regulatory element. Further analysis uncovered that Foxc1 does
not bind to a bone fide Fox binding site, but to a microsatellite sequence consisting of
repeats of the Fox binding site core ‘TTTGT’ motif. Stepwise deletion of this repeat
motif gradually reduces the ability of Foxc1 to activate the Pecam-1 promoter in vitro.
Chromatin immunoprecipitation assays showed that Foxc1 protein has the capability
to bind to the (TTTGT)n pentanucleotide repeat motif in the chromosomal context in
vivo. Interestingly, the suppression of the Pecam-1 gene in adult endothelial cell lines

Summary
2
appears to be mediated by a different element immediately upstream from the
transcription initiation site. In summary, our study identified a new transcriptional
control mechanism for the de novo Pecam-1 expression in immature embryonic
EPCs, thus providing new insight into to the understanding of vascular specific gene
expression.
Introduction
3
1. INTRODUCTION
1.1 The Vascular System
As the first functional organ to develop in the embryo, the cardiovascular system
plays a critical role during vertebrate development and homeostasis. Arising primarily
from cells of mesodermal origin, it provides the embryonic tissues with oxygen and
nutrients [1]. Blood vessels appear almost simultaneously during embryogenesis at
different anatomical sites including the extraembryonic yolk sac membrane, the
proximal lateral mesoderm and the allantois. Endothelial cells form the major
compartment of the blood vessels where they line the innermost layer (luminal side)
and are involved in multiple processes such as cell trafficking, nutrients and oxygen
delivery, regulation of the vasomotor tone, maintenance of blood circulation as well
as expansion of the vasculature through proliferation [2]. Endothelial cells contain
distinctive morphological properties such as the presence of Weibel-Palade bodies
and caveolae [3] as well as distinct molecular features, e.g. the expression of specific
genes [4].
1.2 De novo formation of the vasculature – Vasculog enesis
The initial event of blood vessel formation during embryonic development is called
vasculogenesis, which describes the in situ and de novo assembly of vascular
structures from differentiating progenitor cells [5]. Mesodermal cells migrate through
the primitive streak and begin to differentiate to endothelial progenitor cells in lateral
and posterior areas, such as the head mesenchyme and posterior lateral plate
mesoderm. In particular, progenitor cells appear within the cranial region in a bilateral
distribution along the midline and begin to form the pre-endocardial tubes [6]; these
will later fuse and give rise to the endocardium (the inner layer) of the primitive
embryonic heart and the major blood vessels [5, 7]. As development progresses,
endothelial progenitor cells gradually appear in most areas of the intraembryonic
mesoderm (except the notochord and the prechordal plate) in vascular “hot spots”

Introduction
4
where they assemble into the primitive de novo vascular network of the embryo [8].
In parallel to intraembryonic vasculogenesis, the extraembryonic blood vessels form
first in the yolk sac where cells within the inner, mesodermal layer assemble in
clusters called blood islands [9]. The Flk-1+/Tal1+ cells in the blood islands
differentiate at the perimeter into endothelial progenitors, whereas those in the center
lose Flk-1 (or VEGFR2) expression and give rise to extraembryonic Flk-1-/Tal1+
hematopoietic precursors [6]. Morphogenetic observations and the close association
of early blood and endothelial cells led to the idea of a common precursor for both
endothelial and hematopoietic progenitor cells in the yolk sac, called the
hemangioblast [9, 10].
1.3 Expansion and maturation of the vasculature – A ngiogenesis
Whereas the primitive vascular plexus in the yolk sac and the major intra-embryonic
vessels are formed by vasculogenesis, subsequent remodeling and expansion of the
vasculature takes place by angiogenesis, i.e. the proliferation, sprouting and
migration of pre-existing endothelial cells at the onset of embryonic circulation [11,
12], yielding an extended network of arteries, veins, capillaries, and lymphatics.
Several intra-embryonic tissues such as the kidney, thymus, brain, limb and choroid
plexus are solely vascularized by angiogenesis, whereas certain endodermal tissues,
such as lung or the liver undergo blood vessel formation by vasculogenesis [13, 14].
Angiogenesis also occurs by non-sprouting intussusceptive microvascular growth
(IMG), i.e., the splitting of the existing vasculature by transluminal pillars or
transendothelial bridges [15, 16].
Vessel maturation is achieved by recruitment of supporting smooth muscle cells
(SMCs) and pericytes and production of extracellular matrix (ECM) to stabilize the
nascent vessels. Pericytes form a layer and surround the endothelium in capillaries
and post-capillary venules, whereas large vessels, such as arteries, are surrounded
by mural cells (SMCs), that form a multilayer around the elastic artery wall [17, 18].
Depending on their final localization during development, SMCs differ in their origin,
e.g. the first SMCs in the embryo derive from mesoderm cells, pericytes in the
Introduction
5
forebrain derive from neural crest cells and SMCs around vessels that lead to the
heart originate from the epicardium (the outer layer of the heart) [19].
Under physiological conditions, the adult endothelium is quiescent and the majority of
endothelial cells do not undergo cell division in postnatal life. However, vascular
remodeling and the pro-angiogenic activity do not entirely cease during adulthood but
remain active during the pro-angiogenic activity in the corpus luteum during the
female reproductive cycle [20, 21].
1.4 The vasculature in disease states
The vascular system plays a critical role in many human diseases. Abnormal
remodeling of the vasculature can lead to psoriasis (hypervascularity of skin vessels)
and pulmonary hypertension [22]. Increased vascularization can cause retinopathy
(damage of the retina in the eye) [23] and rheumatoid arthritis. Atherosclerosis
(occlusion of arteries) is an abnormal deposition of SMCs and mononuclear cells in
the artery wall, mainly triggered through over-expressed inflammatory cytokines [24].
In addition, postnatal angiogenesis is activated during pathological conditions like
wound healing or tissue ischemia. Moreover, tumor growth depends on the tumor’s
ability to induce blood vessel growth through angiogenesis or vasculogenesis [12,
25]. The main goals of clinical research in the field of vessel growth are to block
vascularization in diseases like retinopathy or cancer and to enhance
neovascularization in patients who suffered myocardial infarction and stroke or have
peripheral vascular diseases.
1.5 Characteristics of adult EPCs
Postnatal blood vessel growth, for example during vascular disease states, mostly
depends on the proliferation of mature, pre-existing endothelial cells or angiogenesis
[12]. However, within the last years, numerous studies showed that mononuclear
bone marrow or peripheral blood precursor cells have the potential to take part in the
formation of new blood vessels, a process called adult or neo-vasculogenesis [12,
Introduction
6
26, 27]. Those endothelial progenitor cells (EPCs) are characterized as CD34+/Flk-1+
cells. In the bone marrow, human EPCs also express CD133 (formerly AC133), a
surface antigen of hematopoietic precursors, in contrast to circulating EPCs that have
lower expression of CD133 [28-32]. However, no specific antigen profile has been
uncovered to characterize EPCs as a distinct cell type from other mononuclear cells
in the bone marrow and peripheral blood. Past studies suggest that EPCs do not
consist of a unique cell population but are probably derived from a subpopulation of
mononuclear cells, which acquire endothelial characteristics when recruited to
ischemic or angiogenic environments. In accordance, EPCs also express myeloid
monocytic markers like CD14 [33].
1.6 EPC promote neovascularization
Since the original publications about ten years ago, numerous studies demonstrated
the potency of bone marrow mononuclear cells to differentiate to EPCs and then
endothelial cells [28-30, 34-36]. By using various animal models of disease, these
experiments provided evidence about the involvement of EPCs in blood vessel
growth in ischemic myocardium [37-39], ischemic hindlimb [33-35, 40, 41], in cerebral
ischemic tissue [42], or during tumor growth [43, 44]. Collectively, these studies
showed that EPCs home specifically to areas of active angiogenesis, associate
closely with the vascular wall and participate in vessel formation, mostly through the
stimulation of angiogenesis and enhanced tissue recovery.
The increasing importance of modulating vascular growth in clinical therapies during
disease states has fostered intensive studies to uncover the molecular and cellular
mechanisms that guide blood vessel growth during both, embryonic and postnatal
vascularization.
1.7 Molecular control of blood vessel formation
Vascular formation is a complex, highly organized mechanism, relying on the correct
spatial and temporal expression of specific sets of genes, that eventually result into
Introduction
7
the formation of the vascular network [14, 45, 46]. Different molecular factors carry
out distinct functions, such as endothelial growth stimulation or regulation of vessel
maturation. Among them are e.g. extracellular ligands and their receptors, cell
adhesion molecules, extracellular matrix components and intracellular signaling
intermediates. The initiation of embryonic endothelial specification is driven by
Fibroblast Growth Factor-2 (Fgf2) [47]. During subsequent vascular formation, three
families of receptor tyrosine kinases and their ligands play major roles: the VEGF
(Vascular Endothelial Growth Factor) family and their receptors [48, 49], the
angiopoietins and their Tie receptors [50], and the ephrins and their Eph receptors
[51].
1.7.1 VEGF and VEGF-Receptors
VEGF signaling is crucial to achieve a continued vascularization of the developing
embryo, including organs such as heart and brain, as well as growth of the major
blood vessels. The VEGF family consists of six members, VEGF-A – VEGF-E and
PlGF (Placental Growth Factor). Three VEGF-receptor tyrosine kinases (VEGFR1-
VEGFR3) have been identified. VEGFR1 (Flt-1) and VEGFR2 (Flk-1) are expressed
on the vascular endothelium, whereas VEGFR3 (Flt-4) is restricted to lymphatic
endothelium [52].
VEGF-A (usually termed VEGF) has the ability to induce proliferation, differentiation
and migration of endothelial progenitor cells in vivo and in vitro and it is essential in
both processes of vasculogenesis and angiogenesis [51]. Mutations of VEGF or
VEGFR2 lead to early embryonic lethality. In the adult, lack of VEGF affects mainly
wound healing or the ovarian corpus lutei [53]. The second VEGF receptor, Flt-1
(VEGFR1) modulates VEGF signaling through Flk-1 (VEGFR2) and is involved in
hemangioblast commitment. VEGF signaling is also modulated by the members of
the neuropilin (NRP) family, which form a family of transmembrane proteins and bind
members of the VEGF family, thus functioning as regulators of vasculogenesis [54].
Further, members of the neuropilin family differentially mark the arterial-venous
system, with NRP-1 being expressed in arterial ECs, whereas NRP-2 is found on
venous endothelium and later on lymphatic vessels [55].

Introduction
8
1.7.2 Angiopoietins and Tie-Receptors
Angiopoietins, which comprise four secreted proteins (Ang1, Ang2, Ang3, and Ang4),
and their receptors, the Ties (Tie-1 and Tie-2) function subsequent to the action of
VEGF and have an important role in vessel maturation or destabilization by
regulating processes such as endothelial sprouting, vessel wall remodeling and
mural cell recruitment [50]. Ang1 counters the function of VEGF by promoting and
maximizing the tight contact between ECs and underlying support cells, thus
maintaining the quiescence and stabilization of the vessel [56]. In turn, a second Tie-
2 ligand - Ang2 - acts as a natural antagonist of Ang1 and leads to opposite effects
like de-stabilization of the vessel wall [57].
1.7.3 Ephrins and Eph Receptors
Artery-vein cell fate is genetically programmed by numerous factors, including
members of the Eph/ephrin family, which are expressed differentially in arterial and
venous ECs. The Eph Family consists of at least 14 members and their counterparts,
the ephrins, of at least 8 members. This receptor/ligand system stands out inasmuch
that both, the receptor and its ligand must be membrane-bound to induce signaling
into the cell [53]. Knockout studies showed that ephrinB2 and EphB4 are involved in
the important specification of arterial and venous vessel identity, with EphB4 being
expressed in veins whereas ephrinB2 marking arteries [58-60]. Mutations in both
ephrin-B2 and Eph-B4 lead to embryonic lethality at E9.5, showing failure to remodel
the primitive vascular plexus into arteries and veins.
1.7.4 Extracellular Matrix and Cell Adhesion Molecules
Matrix Metalloproteinases (MMPs) are zinc-dependent enzymes that partake in
degrading the extracellular matrix during angiogenesis, thus permitting ECs to
migrate into the surrounding tissue [45]. Their function is countered during vessel
formation by circulating tissue-localized inhibitors of matrix metalloproteinases
(TIMPs) [61].
Introduction
9
The assembly of migrating ECs into solid cords is established by cell-cell contacts
through adhesion molecules, e.g. Pecam-1 (Platelet-Endothelial Cell Adhesion
Molecule-1) [62] and members of the cadherin surface molecule family such as N-
cadherin (Neuronal-Cadherin) and VE-cadherin (Vascular endothelial-cadherin),
which are expressed in ECs [63-65]. Integrins, a family of transmembrane proteins,
mediate cell adhesion to proteins of the extracellular matrix and partake in the
regulation of angiogenesis [66, 67], e.g. the integrin family member αvβ3 is expressed
on angioblasts where it functions during EC maturation and vessel formation [68].
Extracellular matrix molecules such as fibronectin support the formation of the basic
vascular network [69]. During vessel maturation, fibronectin decreases and ECs
synthesize collagen type IV and laminin that support the stability of the vascular
tubes [70].
1.7.5 Other signaling pathways involved in vascular development
The Notch-Delta pathway is involved in driving the differentiation of the primitive
vessel network toward a hierarchy of mature vascular beds and controls arterial cell
fate as well as homeostatic functions of mature arteries [71, 72]. This pathway is a
highly conserved mechanism comprising of four receptors (Notch 1-4) and five
ligands (Jagged-1 and -2 and Delta-1,-3,-4), and all these factors have been shown
to have expression patterns in different components such as arteries, veins,
capillaries, and mural cells. Mutations in Notch receptors, ligands and downstream
components lead to strong vascular defects [73].
During maturation of newly formed vessels, members of the transforming growth
factor-beta (TGFβ) and platelet derived growth factor (PDGF) family inhibit
proliferation and migration of ECs [18, 74]. PDGF-B is secreted by ECs in response
to VEGF, and lack of PDGF-B leads to impaired pericyte recruitment [75]. Pleiotropic
TGFβ-signaling consists of an essential role during vascular development, controlling
EC migration as well as maturation [76].
Introduction
10
1.7.6 Cytokines
Several cytokines such as GM-CSF (Granulocyte-Monocyte Colony Stimulating
Factor) or SDF-1 (Stromal Cell-Derived Factor-1) stimulate the migration of EPCs
from the bone marrow to sites of neovascularization in adults [41, 77-79].
1.7.7 Angiogenic inhibitors
Besides numerous pro-angiogenic factors, several naturally occurring inhibitors of
angiogenesis exist [45], among them thrombospondin, angiostatin or endostatin [80,
81].
1.7.8 Haemodynamic forces
Next to oxygen and genetic factors, the vascular system is shaped by the influence of
haemodynamic forces, such as shear stress, i.e. the tangential, mechanical force
acting upon the surface of the endothelium [14, 82]. Blood flow dynamics was shown
to induce changes in vessel branching angles to allow optimization of flow, and shear
stress has been suggested to be a driving force for the release of angiogenic signals
[83].
1.8 Transcriptional control of vascular formation
Besides extracellular signaling factors, surface receptors, and matrix molecules that
have been described during blood vessel growth, factors also regulate vascular
development on the transcriptional level and control the genetic regulation of
endothelial differentiation. During development, transcription factors serve as master
switches in activating the expression of tissue and cell-line specific genes. Unlike
during developmental processes such as hematopoiesis or myogenesis, where a
wide set of important transcriptional regulators have been uncovered in the past, only
a few transcriptional regulators of vascular development are known to date [84].
Introduction
11
1.8.1 Ets transcription factors
The majority of the identified transcription factors during vascular development are
activators of the expression of e.g. certain tyrosine kinase receptors like Tie1 and
Tie2 or Flk-1 (VEGF receptor 2) and Flt-1 (VEGF receptor 1). Regulatory elements in
the genomic regions of these genes were shown to contain binding sites for
members of the Ets-family of transcription factors, e.g. Ets-1, Ets-2, and Fli-1 [85-89].
For example, Tie1 and Tie2 were strongly activated by the Ets-family members
NERF and ELF-1 [85, 86], with the latter one being strongly enriched in developing
chicken embryos. In addition, the Ets-factor Fli-1 is enriched in the developing
vasculature of zebrafish [88] and was shown to be a critical factor of vascular
development in both, the zebrafish and E11.5 Fli-1 knockout mice, which display loss
of vascular integrity [88, 89]. Ectopic expression of the transcription factor SCL/Tal1
in zebrasfish mesoderm allowed identification of an important role of this gene in
vasculogenesis, hematopoiesis and endothelial differentiation [90]. In addition,
SCL/Tal1 is expressed in both, mouse and zebrafish embryos, where it can be
detected in the developing vasculature [90, 91]. The Gata transcription factor family
member Gata-2 was shown to be strongly expressed in endothelial cells and serves
as an important regulator of the expression of vascular-specific genes, such as Flk-1,
Icam-2 (Intercellular Adhesion Molecule-2), eNOS (endothelial nitric oxide synthase)
and Pecam-1 [87, 92-94].
1.8.2 Basic Helix-Loop-Helix Transcription Factors
Basic Helix-Loop-Helix (bHLH) transcription factors are involved in the formation of
the vasculature. The bHLH protein Tfeb was shown to be required for the
vascularization of the placenta [95] and the transcription factor HESR1 is upregulated
during vascular tube formation, where in turn it downregulates the expression of Flk-
1, thus lowering the responsiveness of ECs to VEGF, eventually resulting into
increased vessel maturation [96].
Introduction
12
1.8.3 Homeobox Transcription Factors
Capillary morphogenesis is under the partial control of the homeobox gene HoxB3,
with ectopic overexpression of this gene resulting into increased capillary density in
the chorioallantoic membrane of embryos [97, 98]. The related homeobox
transcription factor HoxD3 was shown to regulate the expression levels of integrin
αvβ3 on endothelial cells [99] and endothelial differentiation is enhanced after
overexpression of the homeobox transcription factor gene hhex in zebrafish embryos
[100].
1.8.4 Further Transcription Factors
Further transcription factors required for endothelial differentiation include the
immediate-early gene Fra1 - an AP-1 transcription factor family member - whose
deletion leads to a reduced number of endothelial cells in the placenta [101]. The
zinc-finger transcription factor gene Vezf1 is expressed specifically in endothelial
cells and their progenitors as well as ECs of the dorsal aorta, the branchial arch
artery and the endocardium [102] and its expression co-localizes with Flk-1. The zink-
finger transcription factor gene LKLF is expressed in non-vascular and vascular cells,
and its loss leads to abnormalities during the late stages of vascular formation [103].
1.8.5 Hypoxia and HIFα
Hypoxia serves as a master stimulus in promoting the growth of new blood vessels,
thereby inducing the expression of transcription factors that mediate this response.
Among them is the bHLH-PAS domain transcription factor HIF1α (hypoxia inducible
factor 1α) that mediates the expression of angiogenic genes, such as VEGF during
low-oxygen conditions [104, 105].
Signaling pathways that partake in the transcriptional induction of vascular and
angiogenic genes involve the PI3-kinase (Phosphoinositide 3-kinases) pathway, that
modulates VEGF induction by hypoxia. The catalytic subunit p110 induces HIF1α
activity in response to hypoxia [106], and the mitogen-activated protein kinases p42
and p44 have been shown to modulate HIF1α activity through phosphorylation [107].
Introduction
13
1.9 Embryonic endothelial progenitor cells (eEPCs) as a model system
As mentioned above, bone marrow derived progenitor cells with endothelial potential
partake in postnatal neovascularization processes. A number of endothelial lineages
have been established in the past for in vitro studies to disclose the cellular
processes of vessel development, including mature lines from diverse vascular beds
of different species as well as CD34+ progenitor cells [4]. In order to gain further
insight into the molecular mechanisms of endothelial cell growth and differentiation,
our group took advantage of an embryonic endothelial progenitor (eEPC) line that
was isolated by Hatzopoulos and coworkers [108].
These cells were cultured from intra-embryonic egg cylinders of trypsin-dissociated
mouse embryos at day 7.5 during midgestation, prior to the formation of the
cardiovascular system. They represent a subpopulation of the first angioblasts in the
embryo proper during development and show unlimited stem cell-like growth and
properties of endothelial progenitor cells. Expression profile analysis indicates that
these cells are derived from the embryonic proximal lateral mesoderm and represent
an early pro-endocardial population. They express the stem-cell marker c-Kit as well
as early endothelial markers like thrombomodulin and Tie2. In culture, they show a
round to spindle-like shape and bind to GSL I B4 isolectin that interacts specifically
with ECs and EPCs [109]. RNase protection assays - a method for gene expression
studies - revealed that retinoic acid and cyclic adenosine monophosphate (cAMP)
are capable to induce differentiation of these embryonic endothelial progenitor cells
(eEPCs) toward more mature endothelial cells that express endothelium specific
Flk-1 and vWF [109]. Furthermore, eEPCs can differentiate and form tube-like
structures when plated in Matrigel (an extra-cellular matrix basement material) [109].
Taking together, the data showed that these embryonic mesodermal cells have the
properties of EPCs and can differentiate into mature ECs. Interestingly, eEPCs do
not express endothelial progenitor marker genes such as CD34 [40, 110] or Flk-1
[111] before retinoic acid/cAMP treatment, but they show high levels of the
endothelial surface protein Tie2. They display unlimited growth potential ex vivo with
population doublings every 24 hours. Further, eEPCs were shown to retain their
properties of endothelial progenitor cells after ex vivo culturing and they form
vascular structures after injection into host chick embryos. Animal models showed
Introduction
14
incorporation of eEPCs into the tumor microvasculature in lung carcinomas in mice
[112] and eEPCs displayed intensive therapeutic potential inside damaged tissue in
models of ischemic hind limb and myocardial infarction [113, 114]. Moreover, using
eEPCs, it was shown that homing of progenitor cells from the circulation to the tumor
vasculature is mediated by adhesive mechanisms that resemble the interaction of
activated leukocytes with the vessel wall and involve ESL-1 (E-selectin ligand) and
PSGL-1 (P-selectin ligand) expressed on eEPCs, and their respective receptors – E-
selectin and P-selectin – expressed on resident endothelial cells [112].
In summary, embryonic EPCs have provided a new tool and allowed us to gain
further insight into the molecular and cellular biology of endothelial progenitor cells
and their behavior in postnatal vasculogenesis and organ vascularization.
1.10 Foxc1 and Foxc2 are induced during eEPC in vitro differentiation
In order to elucidate new vascular specific regulatory factors, the eEPC transcriptome
was analyzed by means of Affymetrix GeneChip, which uncovered a number of
genes induced or suppressed during in vitro differentiation. Among the induced
genes were Foxc1 and Foxc2, two closely related members of the Forkhead/winged
helix (Fox) transcription factor gene family [115, 116].
1.11 Forkhead (Fox) Transcription Factors
1.11.1 General characteristics of Fox Genes
Fox genes encode a subclass of the helix-turn-helix class of transcription factors and
comprise a monophyletic group of DNA binding proteins with an approximately 110-
amino acid conserved monomeric DNA binding domain [117], called the Fox
(Forkhead) domain. The structure of the Fox domain is based on a helix-turn-helix
core of three α-helices, flanked by two looped wings [118], giving Fox proteins the
alternative name winged helix proteins, due to this butterfly-like three-dimensional
structure [116, 119]. The Drosophila melanogaster forkhead gene and the rat Foxa1
Introduction
15
gene were the first identified members of this gene family [120, 121] and since then,
Fox genes have been identified in numerous species, ranging from yeast to
mammals [115, 116]. Because of their wide functional variety in biological processes,
there is no simplified scheme of a general function of all members of the Fox gene
family. Fox transcription factors have been shown to act as trans-activators as well as
trans-repressors and unlike most helix-turn-helix proteins, Fox proteins bind as
monomers to an asymetric target sequence and are most likely to activate gene
expression directly by opening up the chromatin structure close to the target gene
locus [122]. In addition, little is known about the interactions of Fox proteins with the
basic transcriptional machinery, although Foxf2 has been shown to interact with the
general transcriptional regulators TBP and TFIIB in vitro [123].
1.11.2 Nomenclature of Fox Genes
Chordate Fox genes are divided into 17 subclasses, or clades, namely A-Q, based
on the amino acid sequence of the conserved Fox (Forkhead) domain. Kaestner and
coworkers revised the nomenclature system for Fox transcription factors, leading to a
standardized name system that uses Fox (from Forkhead Box) as a root and divides
the members into subfamilies [115]. Each member of a respective subfamily is further
defined by a number, e.g. Foxa2 or Foxf1. This ensures a unified nomenclature
between species and identifies orthologues family members between species.
Comprehensive and updated information about Fox genes is available online under
http://www.biology.pomona.edu/fox.html.
1.11.3 Chromosomal organization of Fox genes
Generally, Fox genes are distributed throughout the whole genome of a species and
do not show any physical clustering. However, certain members of the human FOX
gene family within the human genome show proximity, e.g. FOXQ1-FOXF2-FOXC1
(on chromosome locus 6p25.3) or FOXC2-FOXF1-FOXL1 (locus 16q24.1), giving
evidence for anchestreal intra-and inter-chromosomal gene duplications [124].
Ancient loci duplications, followed by sequence divergence, are thought to be
responsible for the expansion of the Fox gene family. In some cases, the duplications
Introduction
16
date back in evolution before the separation of zebrafish and coelacanths (jawed
fish), as for Foxc1 and Foxc2, since these genes are present in both eukaryotic
organisms [119]. Most of the vertebrate Fox genes have only a few small introns and
some are even intronless, such as Foxc1, Foxc2, Foxd1, Foxd2 and Foxg1, whereas
others such as Foxo1 and Foxo3 genes have large introns up to 130kb separating
the Forkhead domain [116].
1.11.4 Fox Genes in Development
Since the discovery of the first Fox gene, the biological importance of this gene family
has become of significance because they partake in a wide variety of biological
functions, e.g. cell cycle control, cell differentiation, metabolic control, and
developmental processes such as the establishment of the body axis and the
development of various tissues from all three germ layers [116, 119].
For example, Foxh1 was shown to regulate the establishment of the left-right body
axis in zebrafish and mouse embryos [125, 126] and mutations in Foxj1 lead to sinus
inversus, i.e. abnormal laterality of the heart [127]. Hair development in mammals
involves Foxq1 and Foxn1 and mutations in Foxq1 causes aberrant differentiation of
the hair shaft [128] whereas Foxn1, that is specifically expressed in the skin and the
thymic epithelium, leads to the nude phenotype in newborn mice, that is
characterized by the absence of hair and severe immunodeficiencies [129, 130].
Impaired organogenesis also occurs in Foxi1 -/- mice, which display intense inner ear
structural dysgenesis and severe hearing impairment [131], due to a lack of Foxi1
expression in the ectodermal epithelium of the otic vesicle. Foxe3 is another Fox
gene required for specification of ectodermal epithelia, where it controls the
proliferation of ectodermal lens cells [132]. FoxA genes (Foxa1, Foxa2, Foxa3) are
expressed in the vertebrate endoderm and formation of the epithelial gut tubes is
impaired in Foxa2 -/- embryos [133, 134]. Other organs relying on Fox gene function
involve the lung, where gene expression in the epithelium is controlled by Foxa1 and
Foxa2 [135] and Foxj1 [127, 136, 137] as well as Foxp2 [138], which guide the
specification of ciliated cells in the airway epithelium. In contrast, Foxf1 is expressed
in the lateral plate mesoderm and the posterior primitive streak where it drives the
separation of the lateral plate into splanchnic and somatic mesoderm [139, 140] and
Introduction
17
Foxb1 deletions were shown to cause embryonic lethality with an open neural tube
and dysgenesis of the caudal midbrain [141]. The development and differentiation of
neuronal cells is controlled by several members of the Fox gene family such as
Foxg1 that regulates the development of the cerebral hemispheres in the
neuroectoderm, where it controls the proliferation of telenchephalic neuroepithelial
cells [142, 143]. Foxd3 was shown to regulate and maintain the neural crest stem cell
pool in zebrafish [144]. Adult myogenic stem cells require Foxk1 expression for
proper cell cycle regulation and myogenic cell commitment [145].
1.11.5 Fox Genes in Signaling Pathways
Fox genes have been related to a number of important signaling pathways, where
they function as downstream activators or repressors of transcription. Mammalian
Foxh1 is involved in mediating TGFβ induced downstream responses during target
gene activation. In addition, Foxh1 was shown to form a complex with smad2 and
smad4, both intermediate signal transducers downstream of activin signaling, a
member of the TGFβ superfamily [146-149]. Conversely, Foxg1 was shown to inhibit
gene activation in response to TGFβ-type signaling [150, 151]. Sonic hedgehog
signaling activates several mammalian Fox genes, such as Foxa2 in the floorplate of
the neural tube or Foxc2 and Foxd2 in the presomitic mesoderm and Foxf1
expression in the sclerotomes was shown to depend on Shh signaling from the
notochord [152]. Foxl1 function was linked to Wnt/b-catenin/TCF signaling pathway in
the intestinal mesenchyme [153].
Furthermore, FoxO genes have been linked to Akt/PKB (Protein Kinase B) signaling,
where they are involved in cell cycle regulation. Phosphorylation by PI3K/PKB leads
to arrest of the cell cycle entry in G1 [154] and Foxo4 was shown to be
phosphorylated by Ras signaling, placing certain Fox proteins downstream from
major signaling pathways [116, 154, 155]. Mammalian FoxM1 is activated upon the
cell’s entry into the S-phase and has been implied in the regulation of DNA
replication [156].
Despite this wealth of information, the precise genetic program of Fox genes,
including their regulators and downstream targets, yet has to be identified for most of
the family members.
Introduction
18
1.11.6 Fox Genes in Human Diseases
Since Fox family members play pivotal functions during organogenesis and in the
maintenance of physiological homeostasis, mutations or deletions in human FOX
genes, e.g. in the case of FOXC1, FOXC2, FOXE1, FOXP2, lead to various human
congenital disorders and malformations, such as skeletal, craniofacial, immune and
circulatory defects. A majority of the known eight human disorders, that are caused
by mutations in Fox genes, are autosomal dominantly inherited. The mutations
frequently lie within the highly conserved Forkhead Domain, i.e. the DNA binding
domain [116].
In the human genome, FOXC1 lies in the 6p25 forkhead cluster and mutations of this
gene cause Axenfeld-Rieger Syndrom, characterized by defects in eye development,
eventually resulting into glaucoma [157-159]. Malformations of the anterior chamber
of the eye have also been linked to mutations in FOXE3 [160] and mutations in
FOXL2 and FOXC2 cause eyelid defects and lymphedema [161-165]. A fraction of
primary endometrial and ovarian cancers exhibit FOXC1 inactivation, suggesting a
tumor suppressor gene role for FOXC1 [166]. FOXL2 also has been implicated in
premature ovarian failure [167], and FOXN1 deficiency causes T-cell
immunodeficiency and skin disorders [168]. Speech and language disorders in
humans have been linked to FOXP2 [169]. FOXA1 is overexpressed in esophageal
and lung cancer [170], whereas FOXM1 expression levels were shown to be
elevated in pancreatic cancer [171] and in basal cell carcinomas [172]. In acute
lymphoid leukemia, fusion proteins consisting of the DNA binding domain of a certain
transcription factor and the transactivation domain of FOXO3 or FOXO4 can cause
oncogenic transformations [173-175].
There is increasing interest in disclosing the precise biological and molecular function
of Fox gene family members, since a profound understanding of their role may lead
to novel therapeutics as well as diagnosis and prevention of certain human genetic
diseases.
Introduction
19
1.11.7 Fox Genes in the Adult Organism
Interestingly, many Fox genes show an expanded repertoire of functions in the adult
organism, compared to embryonic life. Metabolic control in liver, lung, intestine and
pancreatic tissues is one of the major functions of Fox genes in adult tissues, as it
was shown for members of the FoxA subfamily, by the use of conditional knock out
mice [135]. Likewise, a functional switch from embryonic control of morphogenesis to
adult control of metabolism in adults is seen for Foxc2, which regulates metabolic
efficiency in response to the energy content of the diet [176] and FoxO subfamily
genes were shown to be involved in insulin/IGF signaling in the adult organism [116,
155, 177].
1.12 The FoxC subfamily - Foxc1 and Foxc2
Foxc1 and Foxc2 proteins have nearly identical DNA binding domains, suggesting
that they were generated by a duplication event [115]. The role of the mouse Foxc1
and Foxc2 genes during embryogenesis and the resulting phenotypes after gene
knock out in mice was the subject of extensive research during the last years,
implicating these two genes in cardiovascular development [178-181].
1.12.1 Expression Patterns
Initially, FoxC genes are expressed in a dorsoventral gradient and they display
overlapping expression patterns in several embryonic tissues, e.g. the paraxial,
cephalic, and nephrogenic mesoderm [180, 182]. In addition, FoxC transcripts are
localized in the endothelium and the surrounding mesenchyme of the developing
blood vessels and the heart [178, 179, 181, 183, 184] and both genes were shown to
be expressed in the nuclei of endothelial and smooth muscle cells in the aorta of the
developing embryo [180].
Introduction
20
1.12.2 Abnormalities in FoxC mutant embryos
For the most part, Foxc1 and Foxc2 are partially functionally redundant and display
interactive roles during cardiac and renal morphogenesis, since compound
heterozygous embryos (Foxc1 +/- ; Foxc2 +/-) have similar defects as single null
mutant embryos, whereas compound null mutant embryos (Foxc1 -/- ; Foxc2-/-)
display much more severe abnormalities. Most compound heterozygotes (Foxc1+/-
;Foxc2+/-) as well as single homozygotes (Foxc1 -/- or Foxc2 -/-) die pre-or
perinatally with similar phenotypes, such as cardiovascular, multiple skeletal,
urogenic, and ocular defects, as well as ventricular septal defects and pulmonary
valve diplasia [178-180, 185-189]. However, blood vessels and somites form to a
certain extent in those embryos, suggesting that Foxc1 and Foxc2 can compensate
for each other to a certain degree in a dose-dependent function. Besides this,
compound homozygote Foxc1, Foxc2 mice (Foxc1 -/- ; Foxc2 -/-) and compound
heterozygous/homozygous embryos (Foxc1 +/- ; Foxc2 -/- or Foxc1 -/- ; Foxc2 +/-)
die in utero with intensified malformations that are more severe than those of each
single homozygous null embryo, undermining a dose-dependent function of the two
transcription factors [180].
Blood vessels in embryos carrying Foxc1 and Foxc2 null mutations are disorganized
vascular plexi without proper remodeling into a well-defined system of larger and
smaller blood vessels, and compound Foxc1+/-;Foxc2-/- embryos display extensive
defects in the morphology and remodeling in the head vasculature, and the number,
size and organization of the branchial arch arteries is abnormal [180]. Further, the
heart shows dysgenesis and is smaller than in wild type animals. In addition, FoxC
transcription factors were shown to be involved in the regulation of arterial endothelial
cell specification [181]. They directly activate transcription of the Notch ligand Dll4, a
marker for arterial endothelium, through a Fox-binding site in the Dll4 promoter.
Foxc1-/-;Foxc2-/- compound mutants have arteriovenous malformations and lack
expression of arterial markers [181], making FoxC proteins important transcriptional
regulators in arterial fate determination. Overlapping domains of expression have
also been shown in the pro-epicardium, in cardiac neural crest cells and the
endocardium, where a lack of Foxc1 and Foxc2 may affect the formation of the
outflow tract cushions [190]. Because of its expression in cephalic neural crest
derived mesechyme, Foxc1 mutations lead to hydrocephalus and defects in eye
Introduction
21
development in the mutant embryo [187, 191] and craniofacial development is
strongly impaired in these null mice, with maxilla and mandible, skull and facial gland
developmental defects [188]. Foxc1 and Foxc2 were also shown to play a role in the
specification of mesoderm to paraxial fate versus intermediate fate [178, 180, 185,
187, 192], and double null mutants show a lack of paraxial mesoderm patterning and
somite formation [180].
1.12.3 Foxc1 and Foxc2 - signaling pathways and target gene activation
As for other members of the Fox gene family, little is known about the signaling
pathways that interact with FoxC transcription factors downstream in the nucleus and
so far, transcriptional target genes of FoxC proteins have lacked profound
identification. Recent studies showed that the gene paraxis - a presumptive and
definite paraxial mesoderm marker - contains several Fox binding sites in its
promoter region [192], suggesting a direct regulation of that gene by Fox proteins.
Foxc1 was shown to act as a TGFβ1 responsive gene in several human cancer cell
lines and mesenchymal cells in Foxc1 null embryo lack proper differentiation into
cartilage and do not response to added Bmp2 and TGFβ1 [187], showing that TGFβ
family members can mediate their function involving members of the FoxC gene
family.
Further, Foxc1 was shown to regulate the proliferation of osteoprogenitor cells by
controlling Bmp-driven expression of the homeobox transcription factors Msx2 during
calvarial development [193], and the expression of Foxc1 in turn was shown to be
regulated by FGF2 signaling [194]. Together, the proliferation of osteoprognitor cells
is under strict genetic control of Bmp and Fgf signaling, and Foxc1 was identified as
one of the downstream transcriptional regulators. Lack of activity of the T-box
transcription factor Tbx1, a downstream target of FoxC proteins in the head
mesenchyme, has been accounted for craniofacial defects and FoxC proteins were
shown to function as intermediate factors in sonic hedgehog signaling during the
transcriptional activation of Tbx1, that was identified as the first direct target gene of
Foxc1 and Foxc2 during development [195]. Haploinsufficiency of Tbx1 is a major
Introduction
22
factor of congenital cardiac and craniofacial defects, which are associated with
DiGeorge syndrome, linking FoxC genes to that congenital disorder [195].
1.13 Aims of the Ph.D. Project
Because of the involvement of Foxc1 and Foxc2 in the development of the
cardiovascular system and their induction during in vitro eEPC-differentiation, these
two transcription factors were considered as interesting candidates to study
transcriptional mechanisms during the transition from eEPCs to the mature
endothelial cell phenotype. Since little is known about FoxC proteins regarding their
direct transcriptional targets as well as the transcriptional regulation of endothelial-
specific gene expression, this Ph.D. thesis aimed in identifying new transcriptional
targets of Foxc1 and Foxc2 in the vascular system, using embryonic EPCs as a
cellular model system. The identification of mouse Pecam-1 as a Foxc1 target gene
and the characterization of a distal 5’-flanking Foxc1 binding site are described
herein. Further, core promoter areas and an enhancer from the 2nd intron of mouse
Pecam-1 are characterized for their cis-regulatory activity in eEPCs, mature
endothelial cells and non-endothelial lines.
Material and Methods
23
2. MATERIAL and METHODS 2.1 Tissue Culture
2.1.1 Cell lines
For the Ph.D. Thesis, the mouse embryonic endothelial progenitor cell (eEPC) lines
FT4b, T17b, and T19b were used for all procedures. The isolation of eEPCs has
been described previously by Hatzopoulos and coworkers [108]. In addition, bovine
aortic endothelial cells (BAECs - American Type Culture Collection, Manassas, VA,
USA), pancreatic endothelial cells (MS1-ECs - American Type Culture Collection),
cardiac endothelial cells (H5V-ECs - kind gift from Bin Zhou, Vanderbilt University,
Nashville, TN, USA – described in [196]), CGR8 mouse embryonic stem cells
(FunGenES Consortium), NIH mouse 3T3 fibroblasts and green monkey (fibroblast-
like) kidney Cos7 cells (American Type Culture Collection) were used for the project.
Embryonic EPCs were cultured on coated plates (0.1% porcine skin gelatin - Sigma-
Aldrich, St. Louis, MS, USA) to enhance attachment of the cells to the surface, and
passaged every 3-4 days onto new plates. BAECs, MS1-ECs, H5V-ECs, Cos7 cells,
and 3T3 fibroblasts were cultured on 0.1% gelatin-coated plates and passaged every
5-6 days (or when the cell layer reached a density of around 100%). During growth,
the cells were washed with 1X PBS (137 mM NaCl, 2,7 mM KCl, 4.3 mM Na2HPO4,
1,4 mM KH2PO4, - Sigma-Aldrich) and supplied with fresh medium if the medium
color turned into orange, indicating a pH below 7.5.
ES cells were supplied with fresh medium daily to continuously provide active
leukemia inhibitory factor (LIF) and prevent premature differentiation. They were
cultured on 0.2% gelatin-coated plates (pre-coated for at least 3 hours) and
passaged every 2-3 days (or before growing to a density of more than 70%, since a
higher density can induce differentiation and thus cause the loss of pluripotency of
the ES cells) onto fresh plates. Tissue culture work was carried out in a sterile tissue
culture bank (Clean Air Technik BV, Woerden, The Netherlands and NUAIRE
Biological Safety Cabinets, Plymouth, MN, USA) and all cell lineages were incubated
at 37°C, 5% CO 2, 21% O2 in a CO2 Water Jacketed Incubator (Thermo Forma,
Marietta, OH, USA) and cultured on standard tissue culture plastic plates (NUNC

Material and Methods
24
Brand Products, Nalgen Nunc International, Denmark or Sarstedt Inc., Newton, NC,
USA).
2.1.2 Tissue culture media
Embryonic EPCs were maintained in DULBECCO´S Minimal Essential Medium
(DMEM) (4.5 g/Liter Glucose, Mediatech Inc., Herndon, VA, USA or GIBCO
Invitrogen Corporation, Carlsbad, CA, USA) supplemented with 20% heat-inactivated
Fetal Bovine Serum (55°C - 30 min, GIBCO Invitrogen ), 1x Penicillin/Streptomycin
(100x Stock - 10.000 units/ml Penicillin, 10 mg/ml Streptomycin, Mediatech or GIBCO
Invitrogen), 2 mM L-Glutamine (Mediatech or GIBCO Invitrogen), 25 mM HEPES pH
7.5 (Mediatech), 1x MEM non-essential amino acids (Mediatech or GIBCO
Invitrogen), and 0.1 mM β-Mercaptoethanol (Sigma-Aldrich).
BAECs, MS1-ECs, H5V-ECs, Cos7, and NIH 3T3 fibroblasts were maintained in
DMEM (4.5 g/Liter Glucose) supplemented with 10% Fetal Bovine Serum, 1X
Penicillin/Streptomycin and 2 mM L-Glutamine.
CGR8 ES cells were maintained in Glasgow Minimal Essential Medium (GMEM,
Sigma-Aldrich) supplemented with 10% Fetal Bovine Serum, 2 mM L-Glutamine,
0.05 mM β-Mercaptoethanol, and 5x10⁴ units Leukemia Inhibitory Factor (LIF,
Chemicon Millipore Corporation, Billerica, MA, USA).
Prepared tissue culture media were filter-sterilized using a 0.2 µm pore size SFCA
Serum Filter Unit (Nalgene Filtration Products, Nalgene Nunc International,
Rochester, NY, USA).
2.1.3 Passage of cell cultures
The split ratios for cell lines were as follows: FT4b,T17b, and T19b eEPCs -1:20 for
3-4 days; MS1-ECs - 1:10 for 5-6 days; H5V-ECs - 1:5 for 5-6 days; BAECs - 1:10 for
5-6 days; CGR8 ES cells - 1:5 for 3-4 days; Cos7 cells - 1:10 for 5-6 days; 3T3
fibroblasts - 1:10 for 5-6 days. Before splitting, the cell layer was washed with 5 ml
(60 mm plates) or 10 ml (100 mm plates) 1X PBS. To detach cells from plates, the
Material and Methods
25
cell layer was incubated for 10 minutes with 1-2 ml of 0.05% Trypsin-EDTA (GIBCO
Invitrogen). Trypsinization was stopped with serum through the addition of the
respective growth medium. The cell suspension was then spun at 250 g for 5 min to
pellet the cells. The supernatant was removed and cells were resuspended in the
corresponding fresh growth medium and plated onto freshly gelatin-coated plates.
2.1.4 Freezing and thawing of cell lines
All cell lines were frozen in 90% FBS and 10% Dimethylsulfoxide (DMSO - Sigma-
Aldrich). First, 1-2x10⁶ cells were washed with 1X PBS, trypzinised, resuspended
and then spun down (as described above). The supernatant was removed and the
cells were resuspended in 4°C cold FBS. Subsequently, DMSO was added to a final
concentration of 10%. One ml of the cell suspension was then pipetted into a
cryovial (Nalgene Nunc), stored at -20°C for 2 hours and subsequently transferred to
-80°C for 2 days. Finally, the frozen cells were long-term stored in liquid nitrogen
(around -196°C). To thaw frozen cell stocks, a cryovial was warmed quickly in a 37°C
water bath until the cells were thawed. Immediately after, the cells were gently
pipetted onto a 100 mm plate containing 25 ml of pre-warmed (37°C) tissue culture
growth medium. Cells were then incubated overnight and washed with 1X PBS the
following day and supplied with fresh growth medium for further culturing.
2.1.5 Transfection of cell lines
Transfection is a technique that allows the transfer of nucleic acids into eukaryotic
cells. To this end, cell lines were transfected with the reagent Lipofectamine 2000
(Invitrogen Corporation, Carlsbad, CA, USA), according to the manufacturer’s
instructions. Lipofecatamine is a cationic liposome reagent that facilitates the contact
and fusion of the negatively charged nucleic acid molecules with the phospholipid cell
membrane, which also carries a negative net charge [197]. Upon mixture, the DNA
molecule binds to a positively charged head group of the liposome containing
nitrogen atoms, that interact with the negative phosphate backbone of the nucleic
Material and Methods
26
acid as well as with the negatively charged cell membrane, thus providing a linker to
overcome the electrostatic repulsion between the DNA and the cell membrane. The
fusion with the cell membrane is carried out by neutral hydrocarbon chains, that are
linked to the positively charged head group in the liposomes. After fusion, the nucleic
acid-liposome complex penetrates the cell and is also carried into the core by
merging with the nuclear membrane, thus exposing the DNA to nuclear proteins,
allowing efficient transcription of e.g. genes cloned into expression plasmids. Nucleic
acids can eventually integrate into the host genome, resulting into genetically
engineered stable cell lines.
In this project, transfection was carried out using a 2-fold excess of µg Lipofecatime
2000 compared to µg of plasmid DNA. E.g., for transfection of a 60 mm cell culture
plate (about 3-5x10⁶ cells), 8 µg of plasmid DNA was dissolved in 1 ml of OPTIMEM
medium (Invitrogen), i.e. a modified minimal essential medium (MEM) that only
contains minimal protein levels (insulin and transferrin at 15 µg/ml), but has a
formulation that allows cells to survive under serum-deprived conditions for several
hours. Transfections have to be carried out in a low-serum environment, since serum
lipoproteins can interfere with the liposomes. Next to the DNA/OPTIMEM mix, a
second mixture containing 1 ml OPTIMEM and 16 µg of Lipofectamine 2000
(liposomes) was set up and incubated for 5 min at room temperature before both
mixtures were combined by gentle mixing and incubated for 30 min at room
temperature. Finally, the combined mixture was given onto the cells and incubated
for 6 hours at 37ºC, followed by addition of 5 ml of regular growth medium to the
plate. The cells were then grown further for 24 hours before they were used for
downstream applications.
2.2 Molecular biology techniques
2.2.1 Total RNA isolation
The RNA isolation procedure was carried out using the QIAGEN RNeasy® Kit
(QIAGEN Corporation, Valencia, CA, USA), which is based on a silica-gel membrane
system that binds RNA molecules with a length of more than 200bp (RNeasy® Mini
Handbook, QIAGEN). Cell lysis occurs in the presence of the denaturing agent
Material and Methods
27
isothiocyanate, which also inactivates RNases, thus preventing an enzymatic
degradation of RNA. The purification step is based on the highly specific binding of
larger RNA molecules, such as mRNA to the membrane, whereas smaller RNAs, e.g.
tRNA, are efficiently washed away, together with other contaminants. The binding of
RNA is also enhanced by the presence of ethanol. After binding and washing with
ethanol-containing washing buffers, the bound RNA is eluted with H2O and can be
used for further processing.
Generally, for RNA isolation, cell monolayers on plates (around 5x10⁶ cells) were
lyzed in 700 µl RLT Lysis buffer (RNeasy Kit). DNA digestion (with RNase-Free
DNase Set, QIAGEN) was performed to avoid contamination of isolated RNA with
genomic DNA. The RNA was eluted in 40-50 µl RNase-free water (QIAGEN) and
stored at -80°C for future use. RNA concentrations were measured at an OD260 using
an Eppendorf BioPhotometer (Eppendorf Corporation, Hamburg, Germany).
2.2.2 Reverse Transcriptase-Polymerase Chain Reaction (RT-PCR)
RT-PCR is a technique to measure expression levels of gene transcripts. In a first
step, cDNA is synthesized by Reverse Transcription (RT) using RNA as a template.
The molecular reaction is carried out by enzymes called reverse transcriptases,
which are RNA-dependant DNA polymerases derived from retroviruses such as the
moloney murine leukemia virus [198]. Single-stranded RNA is thereby transcribed
into complementary DNA (cDNA), using specific deoxyoligonucleotides, such as
oligo(dT), as primers for the enzymatic reaction. The derived single-strand cDNA
subsequently serves as template for amplification by Polymerase Chain Reaction
(PCR).
The steps for RT-PCR were carried out in an Eppendorf Thermomixer (Eppendorf
Corporation) in 1.5 ml tubes. First, 3 µg of RNA were added to autoclaved ddH2O to
a total volume of 15 µl. Then, 3,75 µl of 80 ng/µl oligo(dT)15 primer (Promega
Corporation, Madison, WI, USA) were added to the mixture. The tubes were
incubated at 65°C for 5 min to open up secondary RN A structures and allow the
primers to bind to the polyA tails of mRNA molecules. Afterwards, the tubes were put
Material and Methods
28
on ice immediately to avoid refolding of the RNA. Then 11,25 µl of RT-Mix was added
to the tubes. RT-Mix contained:
4,5 µl NX buffer (0.4 M KCl, 0.1 M Tris-HCl pH 8,4, 20 mM MgCl2, 2% Tween20, all
from Sigma-Aldrich), 1.5 µl dNTPs (20mM stock - Amersham Biosciences
Piscataway, NJ, USA), 3 µl of 0.1 M β-mercaptoethanol (Sigma-Aldrich), 10 U
RNasin (40 U/µl - Promega), 100 units M-MLV Reverse Transcriptase (200 U/µl -
Invitrogen). The entire mixture was incubated at 37°C for 55 min, followed by a
second incubation step at 95°C for 5 min to inactiv ate the enzyme and stop further
reaction. Finally, 270 µl autoclaved ddH2O was added to the reaction to obtain a final
cDNA volume of 300 µl at a concentration of about 10 ng/µl. The cDNA was then
stored at -20°C for future use.
2.2.3 Polymerase Chain Reaction (PCR)
Polymerase Chain Reaction (PCR) is a powerful technique that allows the
exponential in vitro amplification of a specific region of a template DNA strand [199].
In typical applications, DNA fragments up to the size of 10 kb are amplified. A PCR
reaction is divided into cycles that consist of three steps, i.e. (1) denaturation of the
DNA double helix at around 95°C; (2) primer anneali ng between 55-65°C; (3)
elongation of the polymerase reaction at 72°C. The cycles are preceded by a
denaturation step at around 95°C for several minute s to assure proper opening of the
DNA double helix. At the end of the cyclic program, a 5-7 min elongation step is
performed before the enzymatic reaction is stopped. The thermostable Taq DNA
polymerase from the hot springs thermophilic bacterium Thermus aquaticus resists
the high denaturation temperatures, thus allowing the reaction to be performed
without the requirement to add fresh enzyme during each thermocyclic amplification.
PCR amplification was carried out using 20 ng cDNA as template derived from RT-
PCR reactions. Oligodeoxynucleotide primer pairs (2 µl) were added to a final
concentration of 0.5 µM, together with 0.2 µl deoxynucleotide 5’-triphosphate (dNTP)
mix (20 mM of each dNTP – Amersham Biosciences), 2 µl of 10X PCR reaction
buffer (0.1 M Tris-HCl pH 8.4, 0.5 M KCl, 15 mM MgCl2, all from Sigma-Aldrich), 1 µl
DMSO (Sigma-Aldrich) and 1 U Taq DNA polymerase (Promega). The reaction
mixture was filled up with ddH2O to 20 µl and amplified with a MJ Research PTC-100
Material and Methods
29
Thermo Cycler (Bio-Rad Laboratories, Hercules, CA, USA). The primer sequences
and their corresponding thermocyclic program were as follows: Aldolase forward 5’-
AGCTGTCTGACATCGCTCACCG-3’, reverse 5’-CACATACTGGCAGCGCTTCAAG-
3’ (24 cycles – 65ºC annealing); Pecam-1 forward
5’-GTTCAGCGAGATCCTGAGGGT-3’ (35 cycles – 60ºC annealing), reverse
5’-GAGGACACTTCCACTTCTGTGTATTC-3’; Foxc1 forward
5’-GCAGTGAAGGACAAGGAGGAGAAG-3’, reverse
5’-TGGAGGCAGCGAGTAGTCGG-3’ (35 cycles – 65ºC annealing); Foxc2 forward
5’-CTCTTACGACTGCACCAAATACTG-3’, reverse
5’-GAATCTCCACAGAAGTCATTAGGG-3’ (35 cycles – 65ºC annealing); Foxa2
forward 5’-AGGAGTGTACTCCAGGCCTATTATG-3’, reverse
5’-GTCCGGTACACCAGACTCTTACAT-3’ (35 cycles – 60ºC annealing). Shown are
the sequences for the primarily used RT-PCR primers. A complete list of all primers
used in RT-PCR is given in the supplemental file ‘primer_sequences.pdf’.
2.2.4 PCR Primer Design
Primers were designed using the online primer3 tool (http://fokker.wi.mit.edu/cgi-
bin/primer3/primer3_www.cgi). This program allows optimal design of
oligonucleotides for PCR by selecting a large number of criteria that specify the
working conditions of the primer. Primers were designed to contain the following
criteria: an annealing temperature between 60-65ºC, a length between 20-25 bp; a
PCR amplification product of variable length between 150-800 bp. For cDNA
amplification and gene expression studies, if possible, primers were designed to bind
in areas representing different exons of the transcript, such enabling the distinction
between amplified cDNA and possible impurities of genomic DNA that would also
serve as template. Primers were ordered from MWG Biotech (Ebersberg, Germany)
or Integrated DNA Technologies (Coralville, IA, USA).
2.2.5 DNA Sequencing To date, the chain-termination method developed by Frederick Sanger is the
standard choice for the sequencing of DNA. The principle of this enzymatic reaction
Material and Methods
30
is based on the use of dideoxynucleotide triphosphates (ddNTPs) that function as
nucleic acid chain terminators [200]. The original described method uses single-
stranded DNA to be sequenced as template. Modern protocols also use double-
stranded DNA that has been denaturated using e.g. alkali, as template. A special
DNA polymerase, e.g. E.coli DNA polymerase I, initiates the synthesis of a
complementary strand, starting from an oligodeoxynucelotide primer that binds at the
3’-end of the template DNA strand. The key of the reaction lies in the separation into
four separate sequencing reactions, that all contain the standard deoxynucelotides,
i.e. dATP, dCTP, dGTP, dTTP. In addition, each reaction contains one of four
dideoxynucelotides (ddATP, ddCTP, ddGTP, ddTTP), that lack the 3’-OH group
required for the enzymatic formation of the phosphodiester bond between two
nucleotides during the polymerization of the DNA strand. Thus, the incorporation of a
dideoxynucelotide into the elongating DNA strand causes the termination of the
polymerization reaction and yields multiple DNA fragments of various, random
lengths. The elongated DNA fragments are then separated according to their length
by gel electrophoresis using denaturing polyacrylamid gels, and each of the four
separate sequencing reactions (containing one of the four ddNTPs) is run in an
individual lane. The DNA molecules are visualized through the use of e.g.
fluorescence-labeled oligodeoxynucleotide primers during the polymerization
reaction. The terminal nucleotide base on the template strand is similar to the
dideoxynucelotide used in the individual sequencing reaction and the relative
positions of the DNA bands in the gel are used to assemble the nucleotide sequence
of the template DNA strand. Modern automated DNA sequencers use a single
reaction with all four dideoxy terminator nucleotides at the same time, and with
different fluorescent colors on each of them, usually red, green, blue and yellow. The
resulting fragments are subsequently separated by electrophoresis, and an ultraviolet
laser determines the color of the DNA molecules. The complete sequence is then
automatically assembled by the computer. In this project, DNA sequencing of
plasmid DNA and PCR amplification products was carried out by commercial
sequencing centers (MWG Biotech, Ebersberg, Germany and Genhunter
Corporation, Nashville, TN, USA).
Material and Methods
31
2.2.6 Plasmid DNA preparation For high amount preparations, plasmid DNA was purified using the commercially
available DNA Maxi Prep Kit from QIAGEN. Plasmids were isolated from E.coli DH5α
cultures grown in LB culture medium (10 g Tryptone, 5 g Yeast extract, 10 g NaCl, all
from Sigma-Aldrich, - filled up with ddH2O to 1 liter). Bacteria cultures were grown for
12-14 hours (OD600 of about 4.0) at 37ºC under shaking (225 rpm) in the presence of
the appropriate selective antibiotics (100 µg/ml Ampicillin, or 50 µg/ml Kanamycin –
Sigma-Aldrich), based on the antibiotic resistance gene on the plasmid backbone.
Overnight cultures for plasmid DNA Maxi Preps (100 ml total volume) were
inoculated from frozen DH5α 15%-glycerol stocks (850 µl E.coli suspension, 150 µl
glycerol – Sigma-Aldrich) containing the respective plasmid. The stocks were kept at
-80ºC for long-term storage. Alternatively, Maxi Prep cultures were inoculated with
200 µl E.coli starter culture that was grown in LB medium for 8-9 hours from a single
agar plate colony. After growth, E.coli Maxi Prep cultures were centrifuged for 20 min
at 3000 g and 4ºC to pellet the cells, and then subjected to plasmid isolation.
In the Maxi Prep, the plasmid DNA is purified trough binding to an anion-exchange
resin column, under low-salt and low-pH conditions. Lysis of bacteria is based on the
alkaline lysis method of Birnboim and Doly, involving a NaOH/SDS (sodium dodecyl
sulfate) buffer [201]. Subsequent purification involves the removal of RNA -that is
fragmented by RNase digestion during the bacteria pellet resuspension - and other
low-weight molecules through washing steps with medium-salt buffers (QIAGEN),
that in turn allows the plasmid DNA to remain bound to the anion-exchange matrix. In
a step that precedes the medium-salt buffer washes, the alkaline lysis is neutralized
by potassium acetate, resulting into the precipitation of cell membrane bound
genomic DNA, proteins and larger cellular debris.
After washing, elution of plasmid DNA from the column is facilitated by high-salt
buffers (QIAGEN), followed by isopropanol precipitation, resulting into pure pelleted
plasmid DNA that is re-dissolved in TE buffer (10 mM Tris-HCl pH 8.0, 1 mM EDTA –
Sigma-Aldrich) and stored at -20ºC for future use.
In accordance, Mini-Prep plasmid DNA purification during cloning procedures was
carried out with the QIAprep Spin Miniprep Kit (QIAGEN), and cell lysis as well as
plasmid DNA purification is based on analogous steps as described for the Maxi-
Prep plasmid DNA purification (QIAprep Spin Miniprep Kit Handbook). E.coli cultures
Material and Methods
32
for Mini Preps were inoculated by picking single colonies from freshly streaked LB
agar plates (as described below), followed by growth for 12-14 hours at 37ºC and
225 rpm shaking.
The optical density (OD) of E.coli suspensions was measured at a wavelength of 600
nm (OD600) using an Eppendorf BioPhotometer (Eppendorf Corporation).
2.2.7 Transformation of CaCl2-competent DH5α E.coli
Through transformation, foreign DNA can be introduced into bacteria cells that were
rendered competent by exposure to calcium ions [202]. Uptake of plasmid DNA
occurs during a heat-shock that enables the nucleic acid to efficiently penetrate the
cells. To generate calcium competent E.coli cells, LB growth medium (200 ml) was
inoculated with 3 ml of a DH5α overnight starter culture and grown to an OD600 of 0.4
(early to mid-log phase) at 37ºC, followed by a cooling step for 15 min on ice. The
cells were pelleted by centrifugation (3000 g, 10 min, 4ºC) and the pellet was
resuspended in 80 ml of Tfb1 buffer (pH 5.8 - 30 mM KOAc, 100 mM RbCl2, 10 mM
CaCl2, 50 mM MnCl2, 15 % Glycerin, all from Sigma-Aldrich) and incubated for 15
min on ice, followed by centrifugation. The pellet was then resuspended in 8 ml of
TfbII buffer (pH 6.5 - 10 mM MOPS, 75 mM CaCl2, 10 mM RbCl2, 15% Glycerin),
followed by another incubation step for 15 min on ice. The suspension was aliquoted
(50 µl) into prechilled 1.5 ml tubes and frozen immediately at -80ºC for future
transformations.
Transformations were carried out with 50 µl aliquots of competent DH5α E.coli cells.
In brief, the cells were thawed on ice and 0.1-0.5 µg of plasmid DNA was added to
the thawed cell suspension, followed by an incubation step for 30 min on ice. E.coli
cells were then heat-shocked at 42ºC for 45 sec, followed by an immediate
incubation on ice for 2 min. To grow, 900 µl of non-selective LB growth medium was
added and the E.coli cells were incubated at 37ºC for 1 hour under shaking (1200
rpm) to recover and to allow transcription and synthesis of antiobiotic-resistance
genes. Subsequently, 100 µl of the suspension was plated onto LB agar plates (2%
agar, Sigma-Aldrich) containing the appropriate selective antibiotics (100 µg/ml
Ampicillin or 50 µg/ml Kanamycin). The agar plates were grown inverted at 37ºC for
12-14 hours and then checked for the presence of colonies.
Material and Methods
33
2.2.8 DNA restriction digests
DNA restriction endonucleases (or restriction enzymes) are procaryotic enzymes that
catalyze specific reactions on the DNA in a sequence-specific manner and protect
the bacteria host cell from viral infections by degrading viral DNA [203]. Their
discovery has marked a revolutionary change in molecular biology, and today, their
use to cleave DNA at defined positions into specific fragments is one of the most
common procedures in molecular biology and genetic engineering. The majority of
restriction endonucleases used in molecular biology applications belong to the type II
and most members of this type II recognize a short nucleotide sequence (4-6
nucleotides in length) on the DNA and cleave the double helix within the recognized
sequence. The recognition sequence is mostly palindromic, i.e. the sequence on one
DNA strand is the same in 5’ to 3’ direction as on the complementary strand. Different
restriction endonucleases that recognize the same target sequence are referred to as
isoschizomeres. Other type II restriction endonucleases cleave the DNA outside of
their recognition sequence on one side. The cleavage of the double helix results into
3’-hydroxyl on one side and a 5’-phospahte residue on the other side of the cut and
some restriction endonucleases leave blunt ends after cleaving, whereas others
cleave the double helix in a staggered manner, yielding cohesive ends with single-
stranded 5’ or 3’ overhangs.
All restriction endonucleases were from NEB (New Enland Biolabs Incorporation,
Ipswich, MA, USA) and were used according to the manufacturer’s instructions. In
general, restriction digests in this project were set up in a total volume of 20-50 µl.
The mixture contained purified template DNA dissolved in ddH2O or TE buffer,
together with 5 µl of the appropriate 10X enzyme buffer (containing MgCl2 - NEB), 0.5
µl of 100X bovine serum albumine solution (10 mg/ml - NEB) and an 5-fold excess of
restriction enzyme units compared to µg of DNA (with enzyme volume not exceeding
10% of the total reaction volume). Reaction mixtures were incubated for 1 hour or
longer at 37ºC or the appropriate temperature for certain restriction endonucleases,
according to the manufacturer’s instructions.
Material and Methods
34
2.2.9 DNA ligation
Whereas restriction endonucleases cleave the double helix, DNA ligases catalyze the
ligation of two blunt- or cohesive-end DNA fragments through the formation of
phosphodiester bonds between adjacent 5’-phospahte and 3’-hydroxyl termini in the
double helix. Commonly, T4 DNA ligase – a product of the bacteriophage T4 - is
used for molecular biology applications and catalyzes the formation of
phosphodiester bonds by use of ATP as cofactor [204].
DNA ligation was carried out according to the manufacturer’s instruction (NEB).
Typically, the enzymatic reaction had a total volume of 20 µl, containing 2 µl of 10X
enzyme buffer (0.5 M Tris-HCl pH 7.5, 0.1 M MgCl2, 10 mM ATP, 250 µg/ml BSA -
NEB), and 400 U of T4 DNA ligase (NEB). Ligation was carried out at 16ºC for 12
hours, with a 10-fold molar excess of DNA insert fragment compared to plasmid DNA
backbone to assure a high efficiency of insertion.
2.2.10 Plasmid Constructs
Foxc1, Foxc2 and Foxa2 expression plasmids (CMV-Foxc1, CMV-Foxc2, and CMV-
Foxa2) are based on the pcDNA3 backbone (Invitrogen) and were kindly provided by
Tom Kume (Vanderbilt University). The cloned cDNA sequences were as follows:
Foxc1, +415 to +2779 based on ENSEMBL Genome Browser Transcript ID
ENSMUST00000062292; Foxc2, +373 to +2704 based on Ensembl Genome
Browser Transcript ID ENSMUST00000054691; Foxa2, +112 to +1970 based on
Ensembl Genome Browser Transcript ID ENSMUST00000047315
(http://www.ensembl.org).
Pecam-1 promoter-luciferase plasmids pGL2-mp (minimal promoter), pGL2-lpp, (long
proximal promoter), pGL2-5’3.5kb/mp (distal 5’-flanking 3.5kb fragment and minimal
promoter), and pGL2-I2-4.5kb/mp (2nd intron 4.5kb fragment and minimal promoter)
were kindly provided by Dr. Scott Baldwin (Vanderbilt University – further description
in RESULTS). The cloned genomic sequences (relative and absolute nucleotide
numbers) were as follows: plasmid pGL2-mp - relative -88 to +57 / absolute
106,531,458 to 106,531,315; plasmid pGL2-lpp - relative -280 to +57 / absolute
106,531,651 to 106,531,315; plasmid pGL2-5’3.5kb/mp – relative -13,597 to -10,063
Material and Methods
35
/ absolute 106,544,967 to 106,541,433 (distal 5’-flanking 3.5kb fragment); plasmid
pGL2-I2-4.5kb/mp -relative +5,849 to +10,273 / absolute 106,525,521 - 106,521,098
(2nd intron 4.5kb fragment). For all promoter-luciferase plasmids, the relative
nucleotide numbers refer to the transcription initiation site of mouse Pecam-1.
Absolute nucleotide numbering was obtained from the UCSC Bioinformatics
Database, with the transcription initiation site at nucleotide position 106,531,371 on
chromosome 11 (descending nucleotide numbers).
Promoter-Luciferase-plasmids pGL2-5’1kb(A)/mp (distal 5’-flanking 1kb fragment and
minimal promoter), pGL2-5’1kb(B)/mp (distal 5’-flanking 1kb fragment and minimal
promoter), and pGL2-5’1.5kb/mp (distal 5’-flanking 1.5kb fragment and minimal
promoter) were generated by PCR using pGL2-5’3.5kb/mp as DNA template. The
PCR reaction contained 100 ng template DNA, 5 µl 10X Pfu buffer (Promega), 0.5 µl
dNTPs (20 mM each dNTP – Amersham Biosciences), 2 µl primer mix (5 µM each
primer), and 2 U Pfu Polymerase (Promega), all filled up with H2O to 50 µl. Pfu
Polymerase is a DNA polymerase that has 3’ to 5’ exonuclease activity
(proofreading), thus resulting into high fidelity amplification of the DNA template.
Amplification was carried out as follows: initial denaturation (95ºC – 2 min), 35 cycles
(95ºC – 30 sec, 60ºC – 30 sec, 74ºC – 2 min), final elongation (74ºC – 5 min).
The cloned genomic sequences were as follows: plasmid pGL2-5’1kb(A)/mp– relative
-13,597 to -12,547 / absolute 106,544,967 - 106,543,917 (distal 5’-flanking 1kb
fragment); plasmid pGL2-5’1kb(B)/mp - relative -12,568 to -11,499 / absolute
106,543,939 - 106,542,870 (distal 5’-flanking 1kb fragment); pGL2-5’1.5kb/mp –
relative -11,520 to -10,063 / absolute 106,542,891 – 106,541,433 (distal 5’-flanking
1.5kb fragment).
The primers were as follows: plasmid pGL2-5’1kb(A)/mp forward
5’-ggggtaccGAGCTCATGGTTTGGTTTCT-3’, reverse
5’-cgacgcgtCACTTATAGTAAAACCACCTG-3’; pGL2-5’1kb(B)/mp forward
5’-ggggtaccCAGGTGGTTTTACTATAAGTG-3’, reverse
5’-cgacgcgtGTCAGTGTCCCTGACTGATG-3’; pGL2-5’1.5kb/mp forward
5’-ggggtaccCATCAGTCAGGGACACTGAC-3’, reverse
5’-cgacgcgtGAGCTCTCCTGAGCGTGAAG-3’; lower-case nucleotides indicate
restriction sites added for cloning purposes. Fragments were cloned into pGL2-mp
using KpnI (in the forward primer) and MluI (in the reverse primer).
Material and Methods
36
Mutated promoter-luciferase-plasmids pGL2-5’1.5kbD1/mp, pGL2-5’1.5kbD2/mp,
pGL2-5’1.5kbD3/mp, and pGL2-5’1.5kbD4/mp were generated by in vitro site-
directed mutagenesis, using the QuikChange II Site-Directed Mutagenesis Kit
(Stratagene Corporation, La Jolla, CA, USA) and pGL2-5’1.5kb/mp as DNA template.
Site-directed mutagenesis is a technique to selectively manipulate a nucleotide
sequence by creating a mutation at a defined site on a DNA molecule [205]. Whereas
conventional mutagenesis protocols require the presence of single-stranded DNA as
template, the method used in this project allows to directly mutate supercoiled
double-stranded plasmid DNA. The key of this technique lies in the use of two
complementary oligodeoxynucleotide primers, that both carry the desired mutation
and anneal to the same sequence on the opposite strands of the template plasmid
DNA. The mutations in the primers can consist of single nucleotide point mutations or
even larger insertions or deletions. In case of a deletion to be inserted into the
plasmid, the primers consist of two “nucleotide arms” (around 20 bp in length) that
represent the sequence on either side of the deletion. During amplification, the
parental plasmid DNA forms a loop between the two “nucleotide arms” and is not
integrated into the newly polymerized DNA, thus resulting into a deletion that is
carried on during the amplification.
The protocols were according to the manufacturer’s instructions (Stratagene). In
brief, the template plasmid DNA was amplified by PCR consisting of an initial
denaturation step (95ºC - 1 min), 18 cycles (95ºC - 50 sec; 60ºC - 50 sec; 68ºC - 7.5
min), and a final elongation step (68ºC – 7 min). The PCR mixture contained 5 µl of
10X reaction buffer (Stratagene), 50 ng of template DNA, 125 ng of 5’- and 3’-PCR
primer (described below), 1 µl of 20 mM dNTP Mix (Amersham Biosciences), 3 µl of
QuickSolution (Stratagene), filled up with H2O to 50 µl total. PfuUltra HF DNA
polymerase (2.5 U - Stratagene) was then added to the mixture and following
amplification, the samples were cooled down on ice and incubated with 10 U/µl DpnI
(Stratagene) for 1 hour at 37ºC. DpnI is a restriction endonuclease that requires the
presence of N6-methyladenine within its recognition sequence (5’-Gm6ATC-3’) to
cleave DNA [206]. Thus, it specifically digests the methylated parental DNA (pGL2-
5’1.5kb/mp) derived from E.coli Maxi Preps but has no affinity for non-methylated
DNA, which is generated during the mutagenesis PCR reaction. An aliquot of 45 µl
Material and Methods
37
XL10-Gold competent E.coli cells (Stratagene) was incubated with 2 µl
β-Mercaptoethanol (Stratagene) for 10 min on ice and subsequently 2 µl of the DpnI-
treated DNA was added to the mixture, followed by 30 min incubation on ice and a 30
sec heat-shock at 42ºC. After another 2 min incubation on ice, 500 µl of NZY+ broth
(10 g NZ amine, 5 g yeast extract, 5 g NaCl, 12.5 ml 1 M MgCl2, 12.5 ml 1 M MgSO4,
10 ml 2 M glucose – ddH2O to 1 liter) was added and the cells were grown for 1 hour
at 37ºC under shaking (225 rpm), followed by plating on LB-agar plates (2% agar -
100 µg/ml ampicillin) and grown until colonies were visible. Colonies were picked,
grown in LB-medium, and subjected to plasmid DNA Mini Preps and DNA
sequencing to check for the presence of the deletion.
Primers used for the individual deletions were as follows: plasmid pGL2-
5’1.5kbD1/mp (deletion relative -11,495 to -11020; deletion absolute 106,542,865 to
106,542,390) 5’-cagggacactgactttgCCTAGGATGGGCACC-3’ and
5’-GGTGCCCATCCTAGGcaaagtcagtgtccctg-3’; plasmid pGL2-5’1.5kbD2/mp
(deletion relative -11,495 to -10,884; deletion absolute 106,542,865 to 106,542,254)
5’-cagtcagggacactgactttgGTTTGTTAAATGTTC-3’ and
5’-GAACATTTAACAAACcaaagtcagtgtccctgactg-3’; plasmid pGL2-5’1.5kbD3/mp
(deletion relative -11,495 to -10,741; deletion absolute 106,542,865 to 106,542,111)
5’-cagggacactgactttgGTTAGTTAAATGTTCCC-3’ and
5’-GGGAACATTTAACTAACcaaagtcagtgtccctg-3’ ; plasmid pGL2-5’1.5kbD4/mp
(deletion relative -11,495 to -10,458; deletion absolute 106,542,865 to 106,541,828)
5’-cagggacactgactttgGGTCTGATCCTCCTG-3’ and
5’-CAGGAGGATCAGACCcaaagtcagtgtccctg-3’. The nucleotides in lower case letters
indicate the “primer-arm” on one side of the deletion, whereas the upper-case letters
indicate the “primer-arm” on the other side.
The complete sequences of the cloned promoter and cDNA inserts are given in the
supplemental file ‘plasmid_sequences.pdf’.
2.2.11 Agarose gel electrophoresis
Agarose is a gelatinous polymer isolated from red algae and its use in agarose gel
electrophoresis is an effective technique for the separation of nucleic acid fragments
Material and Methods
38
of different sizes. During electrophoresis, the negatively charged nucleic acid
molecules migrate toward the positive electrode of the electrophoresis unit and are
separated according to their size, with smaller fragments migrating faster through the
polymerized gel [207].
DNA amplification products from conventional PCR and LightCycler runs were
separated in 1.5% agarose gels (ultraPURE agarose, Invitrogen), run in horizontal
electrophoresis chambers (Bio-Rad Laboratories, Hercules, CA, USA) in 1X TBE
electrophoresis buffer (0.089 M Tris-borate, 2 mM EDTA, 0.02% ethidium bromide -
Sigma-Aldrich). The size of DNA fragments was determined using a 100 basepair
ladder (Amersham Biosciences), which contains DNA fragments of known size, as
molecular marker. After electrophoresis, the DNA bands were visualized under UV
light at a wavelength of 254 nm and agarose gels were then photographed using a
Polaroid camera or a Bio-Rad Gel Documentation system (Bio-Rad).
2.2.12 Ethanol Precipitation of DNA
DNA was purified by Ethanol precipitation. For this purpose, sodium acetate pH 5.2
(Sigma-Aldrich) was added to a total volume of 10% to the DNA solution, together
with 2 volumes of ice-cold 100% Ethanol and mixed thoroughly. Next, the mixture
was incubated for 30 min at -20ºC to precipitate the DNA and subsequently
centrifuged at 15.000 g for 10 min. The DNA pellet was washed twice with ice-cold
70% ethanol, each time followed by a 5 min centrifugation step at 15.000 g.
Following, the pellet was air-dried for 5 min at room temperature and subsequently
dissolved in 20-30 µl ddH2O or TE buffer.
2.3 Quantitative Real-Time Amplification (qPCR)
2.3.1 LightCycler Real-Time PCR System Embryonic EPC chromatin for chromatin immunoprecipitation (ChIP) analysis was
amplified taking advantage of the Roche Advanced LightCycler System (Roche
Material and Methods
39
Diagnostics) using the LightCycler FastStart DNA Master SYBR Green I Kit and
LightCycler glass capillaries as reaction vessel. The LightCycler System is a powerful
tool that allows monitoring real-time amplification of reverse transcribed mRNA [208].
Compared with conventional PCR, real-time amplification is much more sensitive,
since the amount of PCR amplicons is continuously monitored during every
amplification cycle, allowing accurate quantification of PCR products. Furthermore,
no agarose gels, which lack sensitivity, are necessary for quantification. A real-time
PCR system is based upon the detection and quantification of a fluorescent reporter
dye, e.g. SYBR Green I [209]. This dye is incorporated into the double stranded DNA
helix and, upon intercalation, emits green fluorescence at a wavelength of 530 nm.
Since unbound dye only emits minimal background fluorescence, the increased
signal is in direct proportion to the amount of doubled-stranded PCR product in a
reaction. In addition, the LightCycler System takes advantage of a thermostable
recombinant Taq Polymerase, that does not display any activity below 75ºC and
allows to perform a hot-start PCR reaction, that avoids the creation of unspecific PCR
amplification products.
The concentration of cDNA can be determined relatively to a standard curve. As an
example, a cDNA pool that is known to contain a certain transcript was amplified with
the respective primer pair at a high cycle number and at different temperatures to find
optimal primer working conditions. Subsequently, 10 µl of amplified cDNA was taken
out from every capillary and run on an agarose gel to verify the proper length of the
amplification product and thus the specificity of the amplification reaction. In addition,
a melting curve calculated by the LightCycler Software 3.0 (Roche Diagnostics)
indicates the purity and specificity of the amplification as monitored in real-time.
During melting curve analysis, the PCR reaction is slowly but continuously heated to
95ºC, resulting into denaturation of the DNA double helix and decrease of the SYBR
Green I fluorescence signal. The decrease in activity from the bound SYBR Green of
each PCR amplicon is presented as a melting curve, and the presence of a single
peak indicates the specific amplification of the desired PCR product, alongside with a
specific band in an agarose gel. In turn, non-specific amplicons and primer dimers
are indicated by multiple peaks in the melting curve analysis.
Amplified cDNA that shows the right length and a proper melting curve without minor
peaks was then used for a dilution series. For this, 1:103 and 1:105 dilutions of
amplified cDNA are prepared with RS2 RNA as carrier (Roche Diagnostics GmbH,
Material and Methods
40
Mannheim, Germany) and 1:107 and 1:109 dilutions are prepared in autoclaved
ddH2O. Carrier RNA avoids the adhesion of template cDNA to the wall of the reaction
capillary, thus assuring a higher quality of the analysis. During the main amplification
of all cDNA samples with a certain primer pair, the corresponding dilutions are re-
amplified and their concentrations are set to a relative value in the LightCycler
software before the amplification. E.g., the 103 dilution can be set to a value of 106,
the 105 dilution to a value of 104, the 107 dilution to a value of 102 and the 109 dilution
to a value of 1. On the basis of these four relative values, a standard curve is
calculated by the LightCycler software and the relative cDNA concentrations from all
samples are then referenced by the software to these standard curves.
2.3.2 iQ5 Real-Time PCR System Real-time quantification of gene transcript levels was also carried out using the Bio-
Rad iQ5 Real-Time PCR system and the iQ SYBR Green Supermix (Bio-Rad
Laboratories, Hercules, CA, USA). Like the LightCycler, this system as well uses the
fluorescent dye SYBR green I and the key of the real-time quantification method is
the same as the one described above for the LightCycler system.
In brief, 1 µl of cDNA was combined with 2 µl primer mix (5 µM each), 7 µl ddH2O
and 10 µl iQ SYBR Green Supermix (2X – containing 100 mM KCl, 40 mM Tris-
HCl pH 8.4, 0.4 mM dNTPs, 50 U/ml iTaq Polymerase, 6 mM MgCl2, SYBR Green I,
20 nM fluorescein) to obtain a whole reaction volume of 20 µl. The quantitative real-
time PCR (qPCR) reactions were carried out in 96-well twin.tec PCR plates
(Eppendorf).
The relative gene expression levels obtained with the iQ5 qPCR system were
calculated using the 2-∆∆CT method [210]. In brief, the method is a way to calculate the
relative amount of a gene transcript in a given sample as well as relative changes in
gene expression without the need to create a standard curve. The amount of cDNA
(mRNA) added to the reaction is normalized to an endogenous reference (internal
control gene), typically a housekeeping gene such as β-actin, Gapdh, or rRNA. In
addition, the transcript levels are presented as fold-change relative to an untreated
control sample, also called the calibrator, which is arbitrarily chosen for each qPCR
reaction. The CT value indicates the threshold cycle during the PCR reaction, i.e. the
Material and Methods
41
number of cycles at which the target sequence is present as a certain copy number
and reached a fixed threshold. The data analysis is based on the equation:
∆∆CT = (CT,sample-CT,internal-control)time/sampleX – (CT,sample-CT,internal-control)time/sample0
The first part of the equation calculates the ∆CT value of a treated sample or a
sample at a specific experimental time point by subtracting the corresponding CT
value of the internal control gene (i.e. Gapdh) from the CT value of the specific gene
of interest, giving ∆CT, time/sampleX. The second part of the equation gives the ∆CT value
of the calibrator sample, e.g. an untreated control sample or a sample at time point
zero in an experiment, giving ∆CT, time/sample0. The ∆∆CT value is obtained by
subtracting ∆CT, time/sample0 from ∆CT, time/sampleX,. The amount of target gene transcript
is then given by the term 2-∆∆CT.
The 2-∆∆CT value of the untreated control sample (calibrator) is 1, since ∆∆CT for the
calibrator sample is 0 and 20 equals 1. All other samples are calculated relative to the
arbitrary value of the untreated control sample. A detailed description of the
mathematical derivation of the 2-∆∆CT method and further applications have been
described by Livak & Schmittgen [210].
The cDNA was amplified using the following primers: β-actin forward 5’-
CTACGAGGGCTATGCTCTCCC-3’, reverse 5’-CCGGACTCATCGTACTCCTGC-3’;
Gapdh forward 5’-CTCACTCAAGATTGTCAGCAATG-3’, reverse 5’-
GAGGGAGATGCTCAGTGTTGG-3’;
Cxcr4 forward 5’-GATTGGTCTTCCTGCCCACCA-3’, reverse 5’-
CAGTAACAGGAGAGGATGACG-3’;
Icam-1 forward 5’-GGAGACGCAGAGGACCTTAACAG-3’ reverse 5’-
CATCTCCTGTTTGACAGACTTCACC-3’;
Pecam-1 5’-forward AGACATGGAATACCAGTGCAGAG-3’, reverse 5’-
ACAGGATGGAAATCACAACTTCAT-3’.
The iQ5 qPCR parameters for all primers were as follows: heat-activation of the hot-
start iTaq Polymerase (55°C – 2 min), initial denat uration of DNA (95°C – 3 min), 45
amplification cycles (94°C – 20 sec, 62°C – 30 sec, data collection and real-time
analysis, 72°C - 1 min), denaturation (95°C - 1 min ), incubation (55°C - 1 min),
melting curve analysis (55°C to 94.5°C - 0.5°C incr ement - 15 sec each), final cooling
(4°C). The data were analyzed with the iQ5 Optical System Software (Version 2.0 -
Bio-Rad).
Material and Methods
42
2.4 Fluorescence Activated Cell Sorting (FACS) Anal ysis
FACS analysis is a technique for examining and counting cells in a suspension. For
example, it is used to detect surface proteins on eukaryotic cells and to quantify their
amount through the binding of primary antibodies – directed against a specific protein
- that in turn are recognized by secondary fluorescencently-labeled antibodies [211].
FACS analysis was performed using the BECTON DICKINSON Flow Cytometer
FACSCalibur System (BD Biosciences, San Jose, USA). Data were analyzed with
the CellQuest Software 3.3 (BD Biosciences). Primary antibodies recognizing mouse
antigens were detected with red R-phycoerythrin-conjugated AffiniPure F(ab`)2
fragment donkey anti-rat IgG (Jackson Laboratories, Bar Harbor, ME, USA). The
surface protein levels were quantified using two-dimensional dot plot analysis for
double-stained eEPCs (red phycoerythrin and EGFP positive eEPCs). A dot plot is
usually divided into four quadrants: lower left (LL), lower right (LR), upper left (UL)
and upper right (UR). The settings in the software were chosen that the x-axis shows
cells that emit a green fluorescence EGFP signal whereas the y-axis shows cells that
are positive for red fluorescence phycoerythrin (PE), which is conjugated to the
secondary antibody. Cells that are negative for both colors are located in the LL
quadrant. Cells that only emit an EGFP signal accumulate in the LR quadrant. Only
cells that are positive for both signals locate in the UR quadrants and indicate
presence of the respective surface protein. Cells occasionally show only a red PE
signal in the UL quadrant. These cells are eEPCs that express the gene of interest
but lost EGFP expression. Summarizing the percentages of gated cells in the UL and
UR leads to the total percentage of cells that express the protein of interest. By
comparing this percentage to the control (stained with isotype antibody that does not
bind to the cells) it is possible to conclude whether a protein is present on the cell
surface.
For FACS analysis, eEPCs were plated at a density of 2x10⁵ cells/ml into 6-well
tissue culture plates and transiently transfected with 8 µg of Foxc1-expression
plasmid or pcDNA3 as negative control. Additionally, 8 µg of pBK-CMV-EGFP were
transfected into the cells. After 24 hours, the cells were washed with 1X PBS and
detached from plates by incubation with 5 mM EDTA (Sigma-Aldrich) at 37°C for 20-

Material and Methods
43
30 min. After successful detaching, the suspension was centrifuged at 250 g for
2 min to pellet the cells, that were subsequently washed with 4 ml ice-cold FACS
buffer (4% bovine serum albumin, ICN Biomedicals, Solon, OH, USA and 0.1%
sodium azide, Sigma-Aldrich, both diluted in 1X PBS), centrifuged again and finally
resuspended in 2 ml fresh ice-cold FACS buffer. About 2x10⁵ cells of this suspension
were used for incubation with each primary antibody, at a final antibody concentration
of 5 µg/ml. Cells were incubated 30 min at 4oC with anti-mouse Pecam-1 rat-
monoclonal (Mec 13.3), rat IgG Isotype, or anti-mouse Tie2 rat-monoclonal primary
antibody (all BD Pharmingen, Heidelberg, Germany) and subsequently washed twice
with 400 µl ice-cold FACS buffer. R-phycoerythrin-conjugated donkey-anti-rat
secondary antibody (Jackson Laboratories, Bar Harbor, ME, USA) was added to the
cell suspension at a final concentration of 5 µg/ml and incubated for 30 min at 4oC
(protected from light), followed by two washing steps with 400 µl ice-cold FACS
buffer. Finally, the cells were fixed in 400 µl 1% paraformaldehyde (Sigma-Aldrich)
and subjected to FACS analysis.
2.5 Microscopy and Fluorescence Microscopy
Microscopy and fluorescence microscopy were carried out using a NIKON Eclipse
TE2000-U Microscope (Nikon, Tokyo, Japan). Fluorescence emission by cells was
observed by means of a NIKON Super High Pressure Mercury Lamp at a wavelength
of 480 nm for excitation of EGFP and at 550 nm for Cy3. Cells were photographed
using a NIKON F90X camera (Nikon, Tokyo, Japan).
2.6 Immunofluorescence
Immunofluorescence is a way to detect proteins in tissue sections, based on the
binding of primary monoclonal or polyclonal antibodies to their respective antigens.
As in FACS analysis, secondary antibodies, conjugated with a fluorescence dye, bind
to the primary antibodies. The fluorescence signal is observed using fluorescence
microscopy.
Mouse tissues were cryopreserved in OCT Tissue Tek (Sakura Finetek, Torrance,
CA, USA) and stored at -80°C for further work. Tiss ue sectioning was carried out with
Material and Methods
44
a JUNG FRIGOCUT 2800E Cryostat (Leica Microsystem Vertrieb GmbH, Bensheim,
Germany). All sections had a thickness of 10 µm.
Prior to the antibody staining, the issues sections were fixed in a 1:1
acetone/methanol solution (Sigma-Aldrich) at 4°C fo r 5 min. The sections were then
surrounded with a PapPen (SCI Science Services, Munich, Germany) and washed
5x with 1X PBS for 10 min each, followed by a blocking step for 1 hour with blocking
buffer (1% bovine serum albumin and 0.05% Saponin, Sigma-Aldrich, in 1X PBS) at
room temperature to prevent unspecific antibody binding to the tissue sections. Rat
anti-Pecam-1 monoclonal antibody (BD Biosciences Pharmingen, Heidelberg,
Germany) was added to the sections at a concentration of 5 µg/ml and incubated
overnight at 4°C. After this step, the sections wer e washed 5x with 1X PBS for 10
min each and subsequently incubated with a Cy3-conjugated donkey anti-rat IgG
secondary antibody (Jackson ImmunoResearch Laboratories Inc., West Grove, PA,
USA) for 1 hour at room temperature. Finally, the sections were again washed 5x
with 1X PBS for 10 min each, air-dried for a short time, mounted with VECTASHIELD
Mounting Medium (Vector Laboratories, Burlingame, CA, USA) and photographed
under fluorescence light at a wavelength of 550 nm. The sections were also sealed
with nail polish for long-term storage.
2.7 Promoter-Luciferase Assays
The Firefly luciferase gene is a molecular genetic tool to identify and study the
presence and activity of regulatory elements in gene promoter areas, as well as to
investigate their interaction with trans-regulatory factors. In general, luciferase
reporter assays are commonly used to investigate the regulation of eukaryotic gene
expression.
Firefly luciferase is a 61kDa monomeric protein synthesized by the firefly beetle. It
catalyzes the oxidation of beetle luciferin into oxyluciferin in a reaction requiring the
presence of O2, ATP and Mg2+ ions. As a result, ATP is hydrolyzed into AMP and
PPi, and energy is emitted in the form of photons [212]. The key principle of the
assay lies in the quantification of promoter activity through the amount of luciferase
Material and Methods
45
mRNA transcribed, which is proportional to the luminescence that is emitted during
the reaction catalyzed by translated luciferase protein. A certain promoter fragment is
cloned in front of the luciferase gene that is part of a reporter plasmid. The construct
is transfected into a cell line where the activity of the cloned promoter area is to be
studied. This way, the intensity of the emitted luminescence is directly correlated to
the activity of a genetic regulatory element cloned upstream of the luciferase gene.
For the project, the Dual-Luciferase Reporter Assay System (Promega) was used.
The system takes advantage of the simultaneous expression of two distinct reporter
genes in the transfected cells. The activities of Firefly luciferase and of a second
luciferase enzyme derived from the sea pansy (Renilla Reniformis) [213] are
measured together from a single sample. Renilla luciferase is a 36kDa monomeric
protein and catalyzes the oxidation of coelenterazine to coelenteramide with
simultaneous emission of photons. The two luciferase enzymes use distinct
substrates and emit different wavelength fluorescent light,
allowing to measure sequentially the activity of either enzyme. The advantage of the
co-expression of two reporter genes lies in its high accuracy, allowing to rule out
variability such as differences in transfection efficiency, cell numbers, or cell lysis
efficiency. The activity of the experimental reporter gene (Firefly luciferase under the
control of a promoter area of interest) is thereby normalized to the activity of the
Renilla luciferase reporter gene, which is under the control of the constitutively active
Herpes Simplex Virus thymidine kinase (HSV-tk) promoter.
In this project, eEPCs, BAECs, MS1-ECs, Cos7, and ES cells were plated at a
density of 1x10⁵-5x10⁵ cells/ml into 24-well plates (Falcon) and subjected to
transfection with 0.3 µg pGL2 promoter-luciferase plasmid (section 2.2.10) and 0.03
µg HSV-tk-Renilla-luciferase plasmid (Promega) to correct for experimental
variabilities. For co-transfections, the cells were additionally transfected with 2.4 µg
Fox-expression plasmid (CMV-Foxc1, CMV-Foxc2, CMV-Foxa2) or basic pcDNA3
(Invitrogen) as control plasmid. After 24 hours, the growth medium was removed and
the cells were washed with 1X PBS, followed by lysis using the 5X Passive Lysis
buffer provided in the Dual Luciferase Kit (Promega). Per well, 100 µl of diluted (1X)
Passive Lysis buffer was added and the plates were shaken subsequently for 15 min
at room temperature on an orbital shaker to assure efficient lysis. Following lysis, the
luciferase activity was measured according to the manufacturer’s instructions
Material and Methods
46
(Promega). In brief, 20 µl of cell lysate was combined with 20 µl of luciferase assay
reagent II containing the substrate for Firefly luciferase, followed by measuring of the
luminescence, using a Monolight 2010 Luminometer. Afterwards, the firefly
luminescence was quenched by adding Stop & Glo Reagent that simultaneously
activates the Renilla luciferase activity. The Firefly luciferase values are then
normalized to the Renilla luciferase values from the same sample. All luciferase
assays were performed in triplicates and replicated at least twice to obtain a
statistically significant data set.
2.8 Western Blot
Western Blot is used to detect a specific protein in a cell or tissue homogenate (or
extract) [214]. The principle of the method lies in the separation of denaturated
proteins, usually depending on their size (i.e., the length of the polypeptide chain),
using gel electrophoresis and polyacrylamide gels under denaturating conditions.
Initially, the protein extract is denaturated and solubilized by SDS (sodium
dodecylsulfate). Typically, SDS-PAGE (polyacrylamide gel-electrophoresis) is used to
separate the proteins. It maintains them in a denaturated state preventing formation
of secondary and tertiary structures. In addition, the negatively charged SDS causes
the proteins to adopt an overall negative net charge and thus allows their separation
during electrophoresis, where they migrate toward the positive anode. Smaller
proteins migrate faster through the polyacrylamide gel. Following, the proteins are
electrophoretically transferred to a positively charged nitrocellulose membrane,
causing irreversible binding. During transfer, the membrane is placed on the anode
side of a transfer unit, resulting into a “pulling” of the negatively charged antigens
onto the membrane. To prevent unspecific binding of antibodies during the
subsequent stages, the membrane is blocked by a diluted protein solution – usually
non-fat dry milk powder - that blocks binding sides on the membrane where no
antigens are bound. The specific antigen of interest is detected by a primary antibody
that in turn is recognized by a secondary antibody directed against the species-
specific part of the primary antibody. The secondary antibody itself is conjugated to a
reporter enzyme such as horseradish peroxidase that catalyzes a detectable
Material and Methods
47
chemiluminscent reaction visualized on X-ray films. Alternatively, the secondary
antibody can carry a radioactive label for detection purposes.
For Western Blots in this project, protein lysates were generated from embryonic
EPCs using the NE-PER Nuclear and Cytoplasmic Extraction Reagents Kit (Pierce
Biotechnology), according to the manufacturer’s instructions. In brief, cytoplasmic
contents are released by disruption of the cell membranes. In a next step, the intact
nuclei are recovered from the cytoplasmic extract by centrifugation, and nuclear
proteins are extracted through lysis of the nuclei. The use of pure nuclear extract
without the presence of cytoplasmic components elevates the quality to study
interactions of DNA and nuclear proteins. To assure the stability of the nuclear
extract, a proteinase inhibitor cocktail tablet (Roche Diagnostics, Indianapolis, IN,
USA) was added to the extraction reagents (provided by Pierce Biotechnology) and
the nuclear and cytoplasmic extracts were stored at -80ºC for further applications.
The total protein concentrations of the cell lysates were determined using the BCA
Protein Assay Reagent Kit (Pierce Biotechnology). This assay allows colorimetric
quantification of protein amounts by the reduction of Cu2+ to Cu+ by chelation of
cupric ions through proteins in an alkaline environment (i.e. the biuret reaction or
assay) [215]. The light blue to violet chelated complex absorbs light at 540 nm and
the intensity of the colored signal is in proportion to the amount of peptides in the
mixture, with four to six peptide bonds forming a complex with one cupric ion. For
Western Blot, 3 µg of protein lysate were incubated together with 4 µl of 5X loading
buffer (250 mM Tris-HCl pH 6.8, 500 mM DTT, 10% SDS, 20% Glycerin, 2%
Bromphenol blue) in a total volume of 20 µl for 10 min at 70ºC to unfold the
polypeptide chains, followed by electrophoresis using NUPage 4-12% Bis-Tris
polyacryamide gels (Invitrogen) and a vertical gel electrophoresis unit (Hoefer
Pharmacia Biotech Inc., San Francisco, CA, USA) at 85 V for 2 hours in running
buffer (24 mM Tris-Base, 192 mM glycin, 3.4 mM SDS, pH 7.4) Next to the protein
samples, a molecular weight ladder (SeeBlue Plus2 Prestained Standard -
Invitrogen) was run. Following electrophoresis, a Hybond-ECL nitrocellulose
membrane (Amersham Biosciences) was placed onto the gel and the complex was
covered on both sides with blotting paper (VWR International, West Chester, PA,
USA) and a transfer sponge on the outside (VWR). The whole complex was soaked
in transfer buffer (48 mM Tris-Base, 39 mM glycine, 0.038% SDS, 20% methanol
Material and Methods
48
pH 8 - Sigma-Aldrich) and placed into a transfer unit (Hoefer), followed by
electrophoretic blotting at 60 V for 2 hours in transfer buffer. Subsequently, the
membrane was incubated for 1 hour in 5% non-fat dry milk powder (Nestle
Corporation) at room temperature under shaking at 100 rpm, followed by incubation
with the primary antibody for 12 hours at 4ºC or 1 hour at room temperature. The
membrane was incubated with goat polyclonal anti-Foxc1 or goat polyclonal anti-
Foxc2 (Abcam Incorporation, Cambridge, MA, USA – both at a concentration of 0.5
µg/ml, diluted in 5% non-fat dry milk powder) or mouse monoclonal anti-β-Actin
(Santa Cruz Biotechnology, Santa Cruz, CA, USA). Following incubation, the
membrane was washed 5x with PBST buffer (PBS, 0.05% Tween20 - Sigma-Aldrich)
for 10 min each and subsequently incubated with a secondary antibody (0.2 µg/ml in
5% non-fat milk powder) directed against the Fc part of mouse or goat antibodies and
conjugated with horseradish peroxidase (Santa Cruz). After incubation for 2 h at
room temperature under shaking at 100 rpm, the membrane was washed 5x with
PBST buffer, followed by the development of chemiluminescent light reaction, using
the ECL Western Blotting Analysis System (Amersham). This kit provides the
substrate reagent and buffers for the horseradish peroxidase enzyme and allows to
develop a light reaction that was subsequently detected using a X-ray film (CL-X
Posure Film, Pierce Biotechnology).
Horseradish peroxidase catalyzes the oxidation of chemiluminescent substrates such
as luminol in the presence of H2O2 [216], and this enzymatic activity is then
visualized on X-ray films.
2.9 Chromatin Immunoprecipiation
Chromatin immunoprecipiation (ChIP) assay is a technique to study DNA-protein
interactions in vivo [217]. Unlike plasmid promoter assays or band-shift experiments,
where binding to synthetic DNA loci (e.g. plasmid DNA) is studied, ChIP allows to
assess the binding of a protein to a DNA sequence on the chromosome. The
principle of this method lies in a reversible cross-linking of all DNA-associated protein
Material and Methods
49
to the chromatin, by the means of gentle formaldehyde fixation of cultured cells. The
chromatin is then isolated through cell lysis, followed by nuclei purification and lysis.
As a key step, the chromatin is fragmented by sonication into small pieces (around
200-1000 bp in length). The obtained DNA-protein complexes are then
immunoprecipitated using antibodies directed against the proteins of interest,
followed by purification of the DNA-protein-antibody complex using protein A or G
agarose beads that bind the Fc part of immunoglobulins. Thus, any DNA sequence
that is specifically cross-linked to the protein of interest precipitates as part of the
chromatin-protein complex. This immunoprecipitate complex is then purified and the
cross-link is reversed, thus liberating the DNA. Finally, the identity of the isolated
DNA fragments is uncovered by means of PCR. DNA regions that have associated
with a specific protein are amplified, as indicated by a positive PCR signal.
For ChIP experiments in this project, 4x10⁷ eEPCs were transfected with 50 µg CMV-
Foxc1 plasmid. Following transfection, the cells were washed 3x with 1X PBS
24 hours later and fixed for 10 min at 37ºC in 1% formaldehyde, followed by 3 wash
steps with ice-cold 1X PBS. The cells were then scratched from the plates using 500
µl ice-cold 1X PBS per 100 mm plate and spun down (1500 g, 5 min, 4ºC). Hypotonic
buffer Mendez A (10 mM Hepes pH 7.9, 10 mM KCl, 1.5 mM MgCl2, 0.34 M sucrose,
10% glycerin, Roche protease inhibitor cocktail tablet) was added to the pellet for
resuspension. Lysis was carried out by addition of Triton-X (0.04% final
concentration), followed by an incubation step for 10 min on ice. The samples were
spun down (1300 g, 4 min, 4ºC), resulting into separation of nuclear and cytoplasmic
proteins. After two wash steps with ice-cold 1X PBS, the pellet was dissolved in
2.3 ml LSB (0.1M NaCl, 10 mM Tris-HCl pH 7.4, 0.1% NP-40, 1 mM EDTA – Sigma-
Aldrich) and the nuclei were lysed by addition of 300 µl 20% Sarkosyl. Next, the
chromatin was gently transferred onto a 40 ml LSB-sucrose cushion (100 mM
sucrose) and centrifuged (2500 g, 10 min, 4ºC) to separate soluble protein from
chromatin bound protein. The supernatant was removed and the chromatin was
resuspended in 2 ml TE buffer (containing a Roche protease inhibitor cocktail tablet),
followed by sonication (Branson sonifier, Danbury, CT, USA - 250-D, 50% amplitude,
2 x 50 sec in 1 second intervals). Finally, the chromatin concentration was measured
at OD260.

Material and Methods
50
For immunoprecipitation, 10 µg of goat anti-Foxc1 polyclonal antibody (Abcam) or
10 µg of Goat Isotype IgG (Jacksons Laboratories) as control was added to 500 µg
sonicated chromatin and incubated at 4ºC for 12-16 hours. 50 µl of protein G
agarose/salmon-sperm DNA beads (50 % slurry – Upstate Millipore Corporation,
Billerica, MA, USA) were added and the mixture was incubated (2 hours, 4ºC)
followed by a quick spin to pellet the beads. The supernatant was removed and the
beats were resuspended in RIPA buffer (150 mM NaCl, 0.1% SDS, 0.5% DOC,
1% NP-40, 50 mM Tris-HCl pH 8.0) and transferred to Poly-Prep chromatography
columns (Bio-Rad) where they were rinsed with 20 ml RIPA buffer, 20 ml LiCl buffer
(250 mM LiCl, 0.5% NP-40, 0.5% DOC, 1 mM EDTA, 10 mM Tris-HCl, pH 8.0), and
20 ml TE buffer. Subsequently, the columns were sealed and the beads were
transferred with 1 ml TE buffer to a microfuge tube. Following a quick spin, the
immunoprecipitated chromatin was eluted in 200 µl TE buffer / 10% SDS under
shaking for 10 min at 37ºC, followed by a second elution at room temperature. The
supernatant was transferred into new tubes and 200 µl TE buffer was added to dilute
the SDS. The mixture was incubated at 65ºC for 2 hours to reverse-cross-link the
immunoprecipitate, followed by Proteinase K (Roche Diagnostics) digest (45ºC,
overnight) to degrade the antibodies and proteins. Finally, the chromatin was purified
by Phenol / Chloroform / Isoamylalcohol extraction and subsequent ethanol
precipitation. All protocols for ChIP analysis were based on a protocol by Gerhardt et
al. [218].
The purified eEPC chromatin was amplified with the following primers: Foxc1 binding
sites forward 5’-CAGAGTCCTAAGTTTCACATCCCTA-3’ , reverse
5’-GTCAGGAGGATCAGACCTTTAAAAC-3’; Negative control promoter site forward
5’-GCAGAGAACAAAAACCTGAGTTGGT-3’, reverse
5’-CTGACTTTGGTGGTCTTTTCTCGTT-3’. The amplifications were carried out
using the LightCycler system (described in section 2.3.1). The amplification products
were run on 1.5% agarose gels for evaluation without real-time quantification. The
LightCycler PCR Mix for amplification of ChIP-derived chromatin contained 13.1 µl
ddH20, 2.4 µl 25 mM MgCl2 (Roche Diagnostics), 0.5 µl primer Mix (5 µM each), 2 µl
LightCycler Fast Start Enzyme (Roche Diagnostics), and 2 µl template DNA. The
PCR parameters for Foxc1 binding site primers and negative control promoter primer
were as follows: 50 amplification cycles (95ºC - 10 sec, 5 cycles 62ºC annealing, 5
cycles 60ºC annealing, 40 cycles 58ºC annealing - all 10 sec, 72ºC - 45 sec).

Material and Methods
51
Densitometric analysis of the ChIP-PCR agarose gel bands to quantitate the relative
amount of amplicon was carried out with the Bio-Rad Gel Documentation System
Software (Bio-Rad).
2.10 Online Databases and Bioinformatics Programs
Sequence screening for individual transcription factor binding sites in selected
genomic sequences was carried out with the MatInspector program from Genomatix
(Genomatix Software Incorporation, Munich, Germany – http://www.genomatix.de),
that allows the identification of cis-regulatory elements embedded in nucleotide
motifs by means of a large library of weight matrices [219].
Alignment of the genomic sequence of the mouse Pecam-1 locus with the
corresponding human Pecam-1 sequence was performed using the DiAlignTF
program from Genomatix [220]. The program combines sequence alignments with
the identification of conserved transcription factor binding sites within aligned
orthologous sequences, thus achieving a higher degree of confidence regarding the
biological functionality of identified transcription factor binding sites. The genomic
sequences used for the MatInspector and DiAlignTF programs were derived from the
NCBI Entrez Gene WebViewer (http://www.ncbi.nlm.nih.gov/sites/entrez - see
RESULTS for details).
The nucleotide numbering used to indicate the relative position of the different
genomic fragments of the mouse Pecam-1 locus where calculated by alignment of
those sequences with the genomic sequences from the UCSC Bioinformatics
Database, which displays the positions in absolute nucleotide numbering on the
respective chromosome. Alignments were performed with the Blat Search Genome
tool from the UCSC Bioinformatics Database. The numbers were then calculated
relative to the transcription initiation site of Pecam-1, as indicated by the UCSC
Bioinformatics Database.
The nucleotide sequences of Pecam-1 transcripts were obtained from the NCBI
Nucleotide Database (http://www.ncbi.nlm.nih.gov/). The accession numbers for the
mRNAs are mentioned in the RESULTS section. The nucleotide sequences from the

Material and Methods
52
Pecam-1 genomic areas cloned for promoter-luciferase assays were obtained from
Dr. Scott Baldwin and coworkers (Vanderbilt University – personal communication).
The display of homology areas between the mouse and human Pecam-1 locus was
based on the output parameters of the DiAlignTF program (Genomatix). The
alignment of 20kb of the 5’-flanking genomic sequence was subdivided into 2,000
data points (each representing a block of 10 nucleotides) and the relative nucleotide
homology within the sequence blocks was indicated according to the output value of
the alignment, with ‘0’ indicating no similarity and ‘10’ representing maximal similarity
of a pairwise nucleotide alignment.
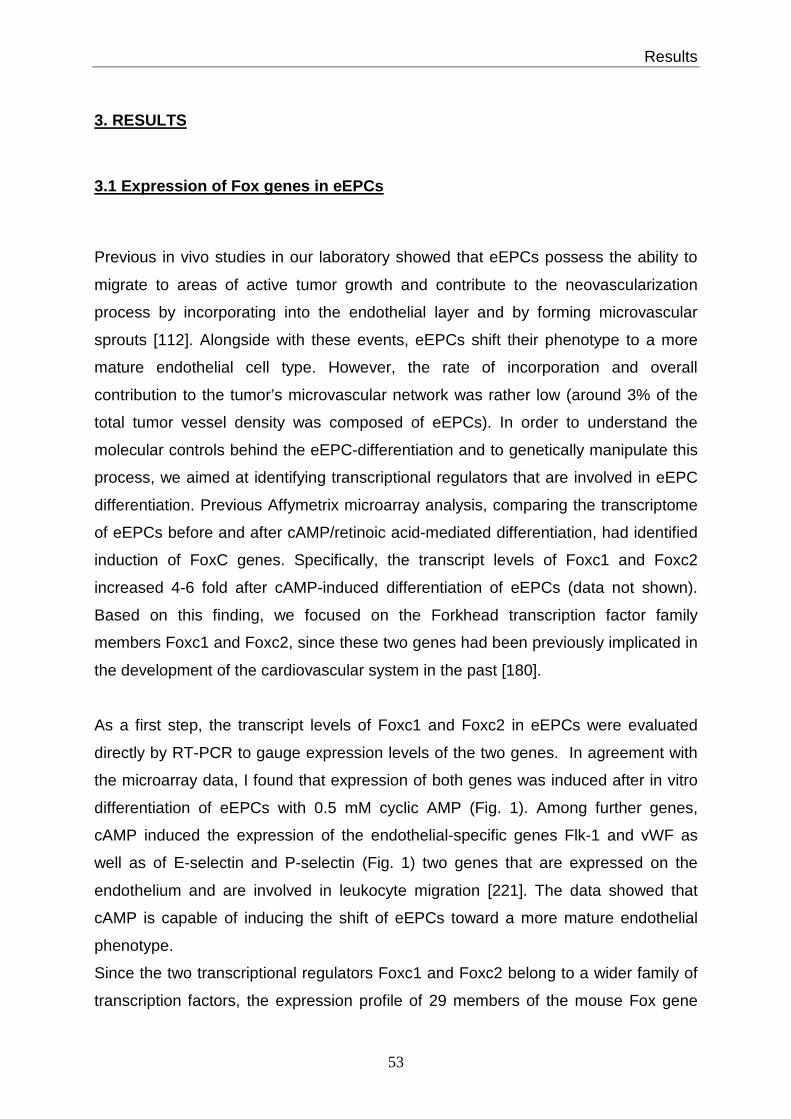
Results
53
3. RESULTS
3.1 Expression of Fox genes in eEPCs
Previous in vivo studies in our laboratory showed that eEPCs possess the ability to
migrate to areas of active tumor growth and contribute to the neovascularization
process by incorporating into the endothelial layer and by forming microvascular
sprouts [112]. Alongside with these events, eEPCs shift their phenotype to a more
mature endothelial cell type. However, the rate of incorporation and overall
contribution to the tumor’s microvascular network was rather low (around 3% of the
total tumor vessel density was composed of eEPCs). In order to understand the
molecular controls behind the eEPC-differentiation and to genetically manipulate this
process, we aimed at identifying transcriptional regulators that are involved in eEPC
differentiation. Previous Affymetrix microarray analysis, comparing the transcriptome
of eEPCs before and after cAMP/retinoic acid-mediated differentiation, had identified
induction of FoxC genes. Specifically, the transcript levels of Foxc1 and Foxc2
increased 4-6 fold after cAMP-induced differentiation of eEPCs (data not shown).
Based on this finding, we focused on the Forkhead transcription factor family
members Foxc1 and Foxc2, since these two genes had been previously implicated in
the development of the cardiovascular system in the past [180].
As a first step, the transcript levels of Foxc1 and Foxc2 in eEPCs were evaluated
directly by RT-PCR to gauge expression levels of the two genes. In agreement with
the microarray data, I found that expression of both genes was induced after in vitro
differentiation of eEPCs with 0.5 mM cyclic AMP (Fig. 1). Among further genes,
cAMP induced the expression of the endothelial-specific genes Flk-1 and vWF as
well as of E-selectin and P-selectin (Fig. 1) two genes that are expressed on the
endothelium and are involved in leukocyte migration [221]. The data showed that
cAMP is capable of inducing the shift of eEPCs toward a more mature endothelial
phenotype.
Since the two transcriptional regulators Foxc1 and Foxc2 belong to a wider family of
transcription factors, the expression profile of 29 members of the mouse Fox gene
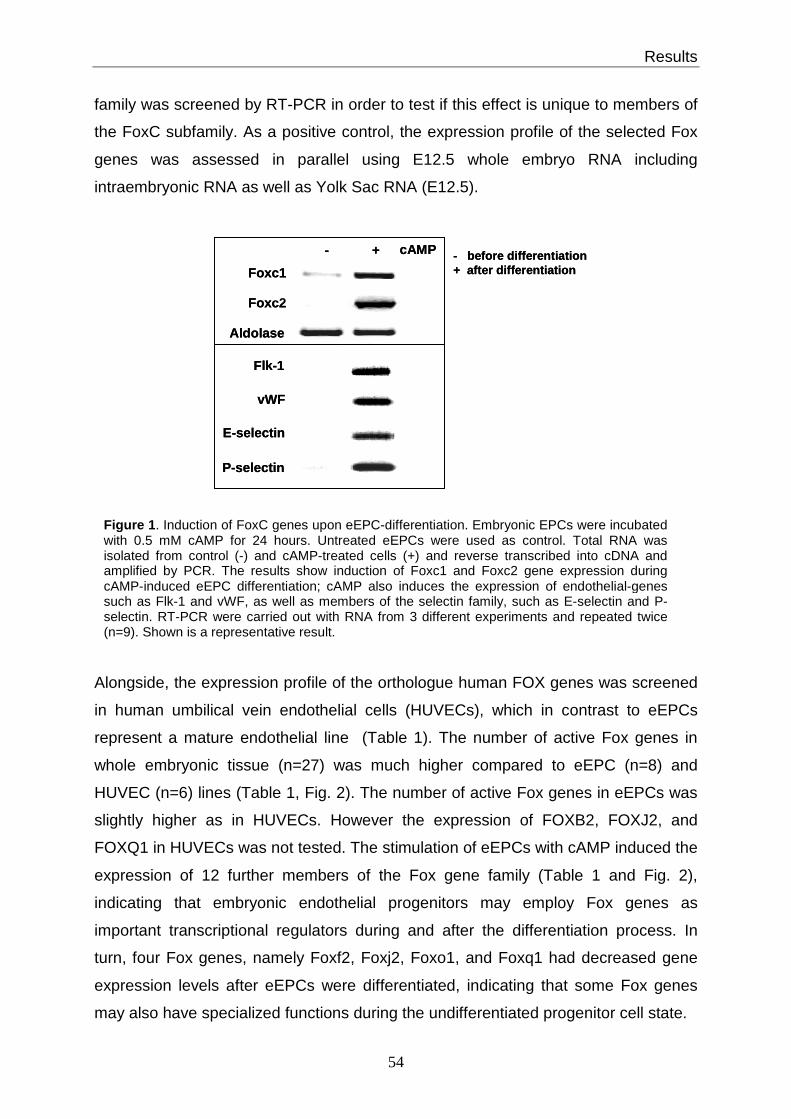
Results
54
family was screened by RT-PCR in order to test if this effect is unique to members of
the FoxC subfamily. As a positive control, the expression profile of the selected Fox
genes was assessed in parallel using E12.5 whole embryo RNA including
intraembryonic RNA as well as Yolk Sac RNA (E12.5).
Alongside, the expression profile of the orthologue human FOX genes was screened
in human umbilical vein endothelial cells (HUVECs), which in contrast to eEPCs
represent a mature endothelial line (Table 1). The number of active Fox genes in
whole embryonic tissue (n=27) was much higher compared to eEPC (n=8) and
HUVEC (n=6) lines (Table 1, Fig. 2). The number of active Fox genes in eEPCs was
slightly higher as in HUVECs. However the expression of FOXB2, FOXJ2, and
FOXQ1 in HUVECs was not tested. The stimulation of eEPCs with cAMP induced the
expression of 12 further members of the Fox gene family (Table 1 and Fig. 2),
indicating that embryonic endothelial progenitors may employ Fox genes as
important transcriptional regulators during and after the differentiation process. In
turn, four Fox genes, namely Foxf2, Foxj2, Foxo1, and Foxq1 had decreased gene
expression levels after eEPCs were differentiated, indicating that some Fox genes
may also have specialized functions during the undifferentiated progenitor cell state.
- before differentiation+ after differentiationFoxc1
- +
Aldolase
cAMP
Flk-1
vWF
E-selectin
P-selectin
Foxc2
- before differentiation+ after differentiationFoxc1
- +
Aldolase
cAMP
Flk-1
vWF
E-selectin
P-selectin
Foxc2
Figure 1 . Induction of FoxC genes upon eEPC-differentiation. Embryonic EPCs were incubated with 0.5 mM cAMP for 24 hours. Untreated eEPCs were used as control. Total RNA was isolated from control (-) and cAMP-treated cells (+) and reverse transcribed into cDNA and amplified by PCR. The results show induction of Foxc1 and Foxc2 gene expression during cAMP-induced eEPC differentiation; cAMP also induces the expression of endothelial-genes such as Flk-1 and vWF, as well as members of the selectin family, such as E-selectin and P-selectin. RT-PCR were carried out with RNA from 3 different experiments and repeated twice (n=9). Shown is a representative result.
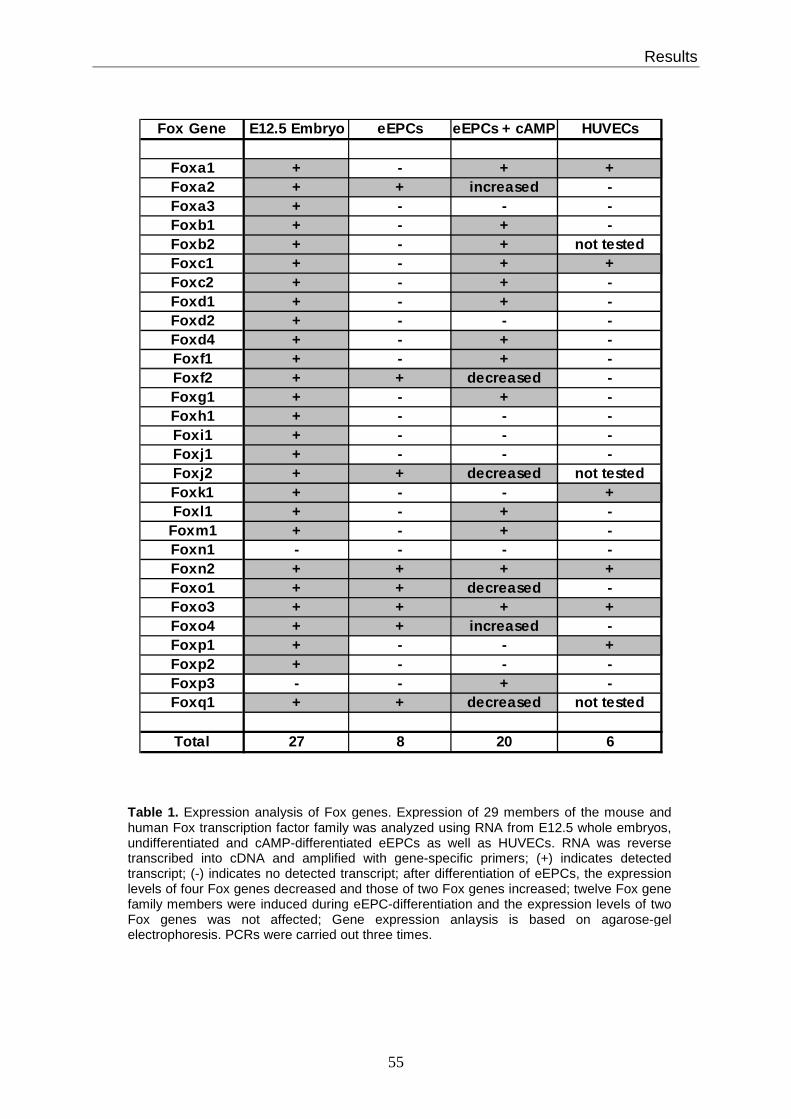
Results
55
Fox Gene E12.5 Embryo eEPCs eEPCs + cAMP HUVECs
Foxa1 + - + +Foxa2 + + increased -Foxa3 + - - -Foxb1 + - + -Foxb2 + - + not testedFoxc1 + - + +Foxc2 + - + -Foxd1 + - + -Foxd2 + - - -Foxd4 + - + -Foxf1 + - + -Foxf2 + + decreased -Foxg1 + - + -Foxh1 + - - -Foxi1 + - - -Foxj1 + - - -Foxj2 + + decreased not testedFoxk1 + - - +Foxl1 + - + -
Foxm1 + - + -Foxn1 - - - -Foxn2 + + + +Foxo1 + + decreased -Foxo3 + + + +Foxo4 + + increased -Foxp1 + - - +Foxp2 + - - -Foxp3 - - + -Foxq1 + + decreased not tested
Total 27 8 20 6
Table 1. Expression analysis of Fox genes. Expression of 29 members of the mouse and human Fox transcription factor family was analyzed using RNA from E12.5 whole embryos, undifferentiated and cAMP-differentiated eEPCs as well as HUVECs. RNA was reverse transcribed into cDNA and amplified with gene-specific primers; (+) indicates detected transcript; (-) indicates no detected transcript; after differentiation of eEPCs, the expression levels of four Fox genes decreased and those of two Fox genes increased; twelve Fox gene family members were induced during eEPC-differentiation and the expression levels of two Fox genes was not affected; Gene expression anlaysis is based on agarose-gel electrophoresis. PCRs were carried out three times.

Results
56
3.2 Foxc1 and Foxc2 regulate expression of Pecam-1 in eEPCs
The upregulation of FoxC genes during differentiation of eEPCs suggested that they
might play a role in the endothelial maturation process. To answer this question,
Foxc1, Foxc2, and Foxa2 (the last as a control) genes were over-expressed to
monitor changes in the expression levels of known endothelial-specific genes. In this
experiment, undifferentiated eEPCs were transfected with expression plasmids
encoding either Foxc1 or Foxc2 full-length cDNAs under the control of the CMV
promoter (CMV-Foxc1 or CMV-Foxc2). To assure that Foxc1 and Foxc2 proteins
were translated from the plasmid-encoded mRNA, Western Blot analysis was
performed with nuclear protein extract from transfected eEPCs (Fig. 3). The assay
showed high amounts of synthesized FoxC protein, confirming efficient over-
expression of the transgenes.
27
8
20
6
0
5
10
15
20
25
30N
umbe
r of
exp
ress
ed F
ox G
enes
E12.5 control cAMP HUVECs
eEPCs
27
8
20
6
0
5
10
15
20
25
30N
umbe
r of
exp
ress
ed F
ox G
enes
E12.5 control cAMP HUVECs
eEPCs
Figure 2. Fox gene expression. The chart shows the number of expressed Fox transcription factors in the different tissues and cell lines tested; cAMP-treatment of eEPCs strongly augments the number of expressed Fox genes.
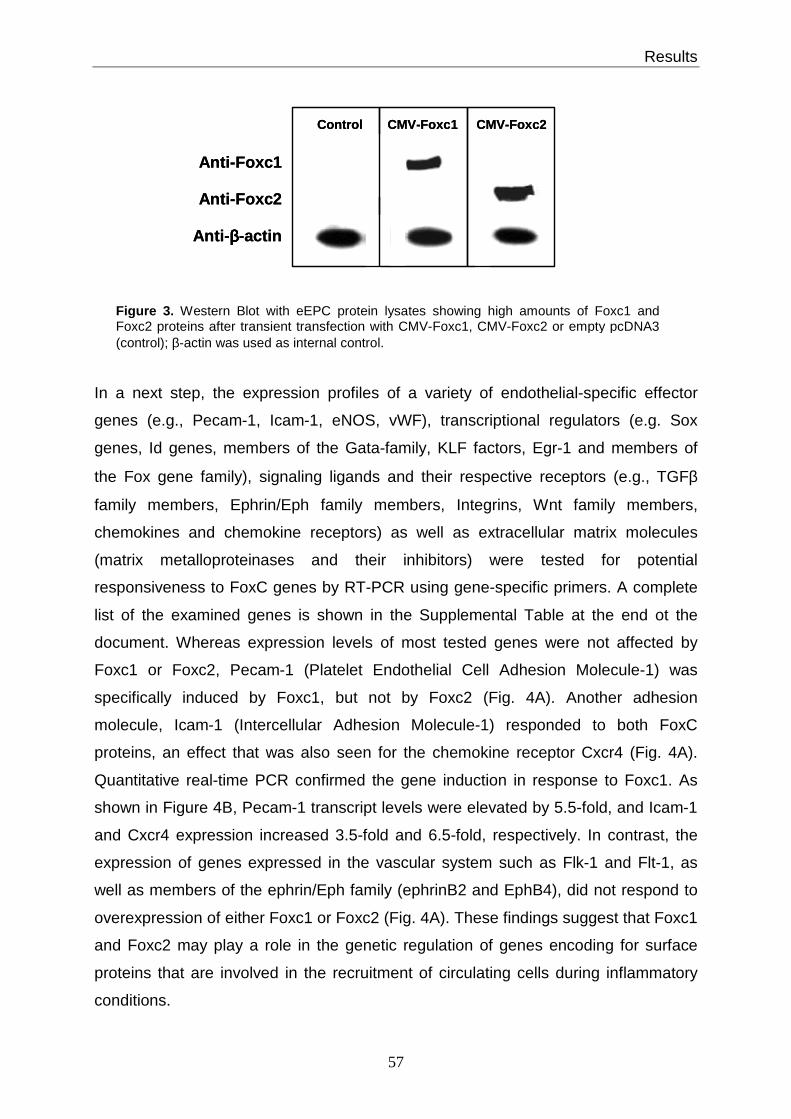
Results
57
In a next step, the expression profiles of a variety of endothelial-specific effector
genes (e.g., Pecam-1, Icam-1, eNOS, vWF), transcriptional regulators (e.g. Sox
genes, Id genes, members of the Gata-family, KLF factors, Egr-1 and members of
the Fox gene family), signaling ligands and their respective receptors (e.g., TGFβ
family members, Ephrin/Eph family members, Integrins, Wnt family members,
chemokines and chemokine receptors) as well as extracellular matrix molecules
(matrix metalloproteinases and their inhibitors) were tested for potential
responsiveness to FoxC genes by RT-PCR using gene-specific primers. A complete
list of the examined genes is shown in the Supplemental Table at the end ot the
document. Whereas expression levels of most tested genes were not affected by
Foxc1 or Foxc2, Pecam-1 (Platelet Endothelial Cell Adhesion Molecule-1) was
specifically induced by Foxc1, but not by Foxc2 (Fig. 4A). Another adhesion
molecule, Icam-1 (Intercellular Adhesion Molecule-1) responded to both FoxC
proteins, an effect that was also seen for the chemokine receptor Cxcr4 (Fig. 4A).
Quantitative real-time PCR confirmed the gene induction in response to Foxc1. As
shown in Figure 4B, Pecam-1 transcript levels were elevated by 5.5-fold, and Icam-1
and Cxcr4 expression increased 3.5-fold and 6.5-fold, respectively. In contrast, the
expression of genes expressed in the vascular system such as Flk-1 and Flt-1, as
well as members of the ephrin/Eph family (ephrinB2 and EphB4), did not respond to
overexpression of either Foxc1 or Foxc2 (Fig. 4A). These findings suggest that Foxc1
and Foxc2 may play a role in the genetic regulation of genes encoding for surface
proteins that are involved in the recruitment of circulating cells during inflammatory
conditions.
Figure 3. Western Blot with eEPC protein lysates showing high amounts of Foxc1 and Foxc2 proteins after transient transfection with CMV-Foxc1, CMV-Foxc2 or empty pcDNA3 (control); β-actin was used as internal control.
Anti-Foxc1
Anti-Foxc2
Control CMV-Foxc1 CMV-Foxc2
Anti- ββββ-actin
Anti-Foxc1
Anti-Foxc2
Control CMV-Foxc1 CMV-Foxc2
Anti- ββββ-actin
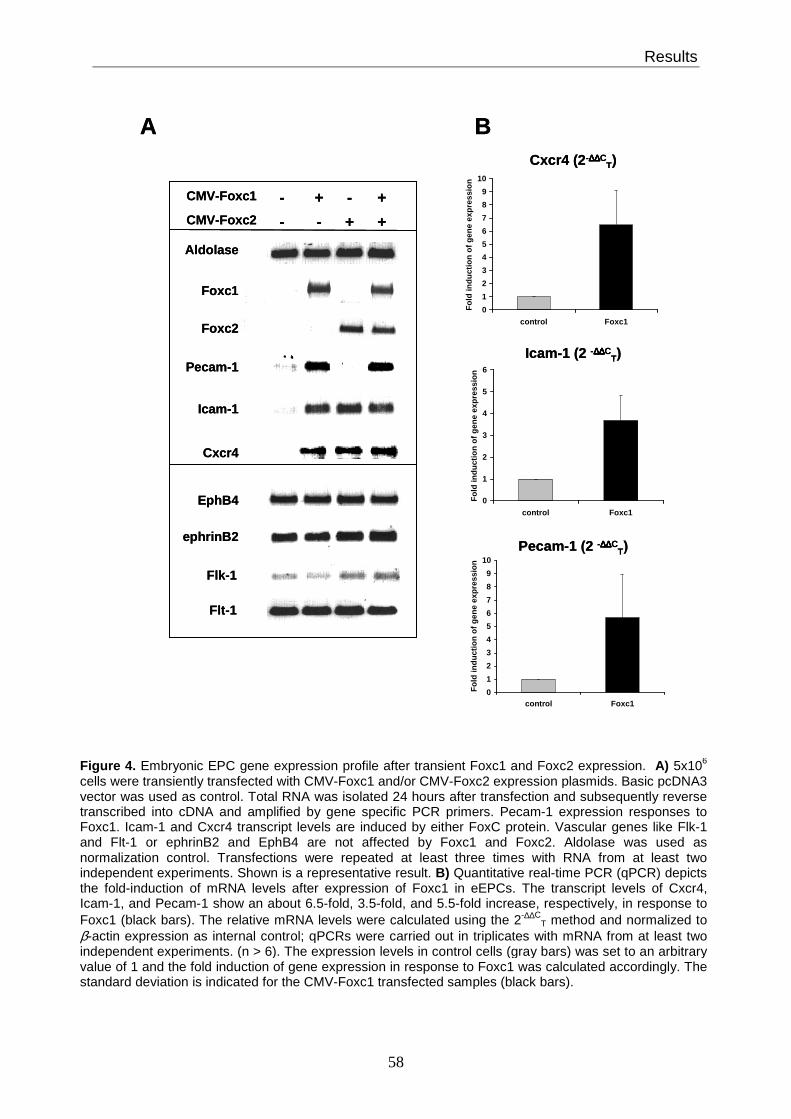
Results
58
Cxcr4 (2-∆∆∆∆∆∆∆∆CT)
Pecam-1
Foxc1
Foxc2
Aldolase
CMV-Foxc1
CMV-Foxc2
+
+
+
+
-
-
-
-
Icam-1
Cxcr4
EphB4
ephrinB2
Flk-1
Flt-1
A B
0
1
2
3
4
5
6
7
8
9
10
control Foxc1
Fol
d in
duct
ion
of g
ene
expr
essi
on
0
1
2
3
4
5
6
control Foxc1
Fol
d in
duct
ion
of g
ene
expr
essi
on
0
1
2
3
4
5
6
7
8
9
10
control Foxc1
Fol
d in
duct
ion
of g
ene
expr
essi
on
Icam-1 (2 -∆∆∆∆∆∆∆∆CT)
Pecam-1 (2 -∆∆∆∆∆∆∆∆CT)
Figure 4. Embryonic EPC gene expression profile after transient Foxc1 and Foxc2 expression. A) 5x10⁶
cells were transiently transfected with CMV-Foxc1 and/or CMV-Foxc2 expression plasmids. Basic pcDNA3 vector was used as control. Total RNA was isolated 24 hours after transfection and subsequently reverse transcribed into cDNA and amplified by gene specific PCR primers. Pecam-1 expression responses to Foxc1. Icam-1 and Cxcr4 transcript levels are induced by either FoxC protein. Vascular genes like Flk-1and Flt-1 or ephrinB2 and EphB4 are not affected by Foxc1 and Foxc2. Aldolase was used as normalization control. Transfections were repeated at least three times with RNA from at least two independent experiments. Shown is a representative result. B) Quantitative real-time PCR (qPCR) depicts the fold-induction of mRNA levels after expression of Foxc1 in eEPCs. The transcript levels of Cxcr4, Icam-1, and Pecam-1 show an about 6.5-fold, 3.5-fold, and 5.5-fold increase, respectively, in response to Foxc1 (black bars). The relative mRNA levels were calculated using the 2-∆∆C
T method and normalized to β-actin expression as internal control; qPCRs were carried out in triplicates with mRNA from at least two independent experiments. (n > 6). The expression levels in control cells (gray bars) was set to an arbitrary value of 1 and the fold induction of gene expression in response to Foxc1 was calculated accordingly. The standard deviation is indicated for the CMV-Foxc1 transfected samples (black bars).
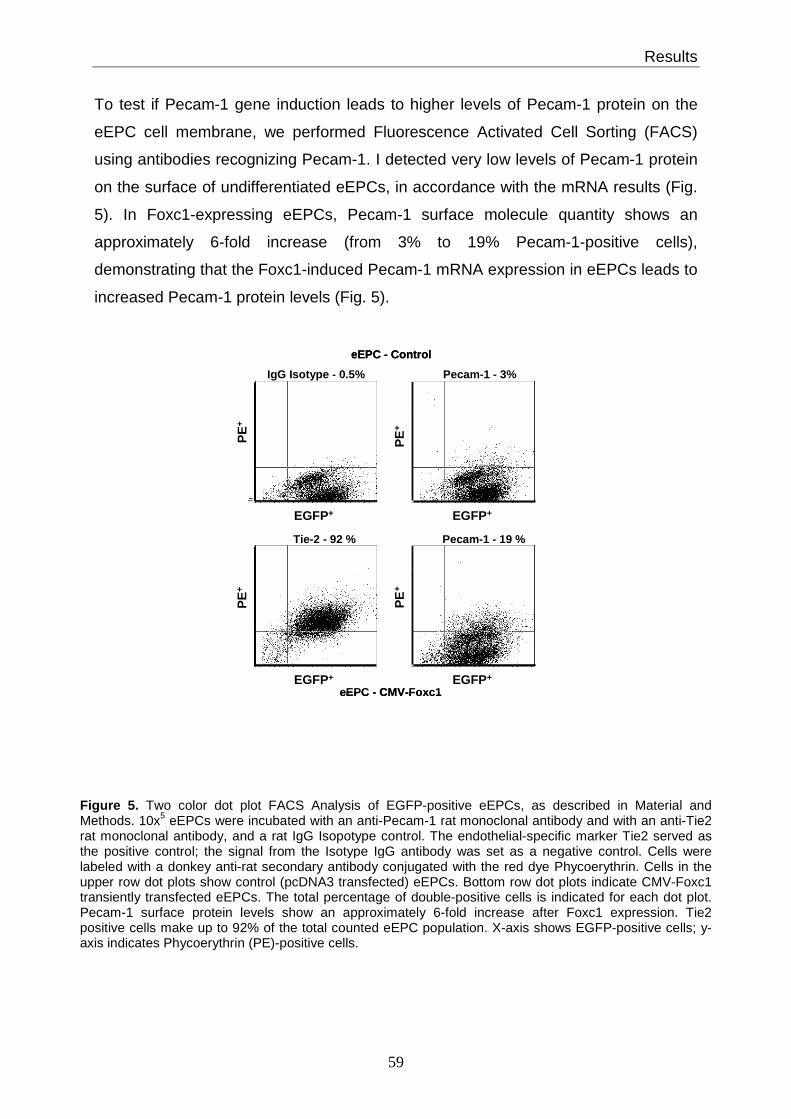
Results
59
To test if Pecam-1 gene induction leads to higher levels of Pecam-1 protein on the
eEPC cell membrane, we performed Fluorescence Activated Cell Sorting (FACS)
using antibodies recognizing Pecam-1. I detected very low levels of Pecam-1 protein
on the surface of undifferentiated eEPCs, in accordance with the mRNA results (Fig.
5). In Foxc1-expressing eEPCs, Pecam-1 surface molecule quantity shows an
approximately 6-fold increase (from 3% to 19% Pecam-1-positive cells),
demonstrating that the Foxc1-induced Pecam-1 mRNA expression in eEPCs leads to
increased Pecam-1 protein levels (Fig. 5).
Pecam-1 - 19 %Tie-2 - 92 %
eEPC - Control
Pecam-1 - 3%IgG Isotype - 0.5%
EGFP+ EGFP+
EGFP+ EGFP+
PE
+
PE
+
PE
+
PE
+
eEPC - CMV-Foxc1
Pecam-1 - 19 %Tie-2 - 92 %
eEPC - Control
Pecam-1 - 3%IgG Isotype - 0.5%
EGFP+ EGFP+
EGFP+ EGFP+
PE
+
PE
+
PE
+
PE
+
eEPC - CMV-Foxc1
Figure 5. Two color dot plot FACS Analysis of EGFP-positive eEPCs, as described in Material and Methods. 10x5 eEPCs were incubated with an anti-Pecam-1 rat monoclonal antibody and with an anti-Tie2 rat monoclonal antibody, and a rat IgG Isopotype control. The endothelial-specific marker Tie2 served as the positive control; the signal from the Isotype IgG antibody was set as a negative control. Cells were labeled with a donkey anti-rat secondary antibody conjugated with the red dye Phycoerythrin. Cells in the upper row dot plots show control (pcDNA3 transfected) eEPCs. Bottom row dot plots indicate CMV-Foxc1 transiently transfected eEPCs. The total percentage of double-positive cells is indicated for each dot plot. Pecam-1 surface protein levels show an approximately 6-fold increase after Foxc1 expression. Tie2 positive cells make up to 92% of the total counted eEPC population. X-axis shows EGFP-positive cells; y-axis indicates Phycoerythrin (PE)-positive cells.
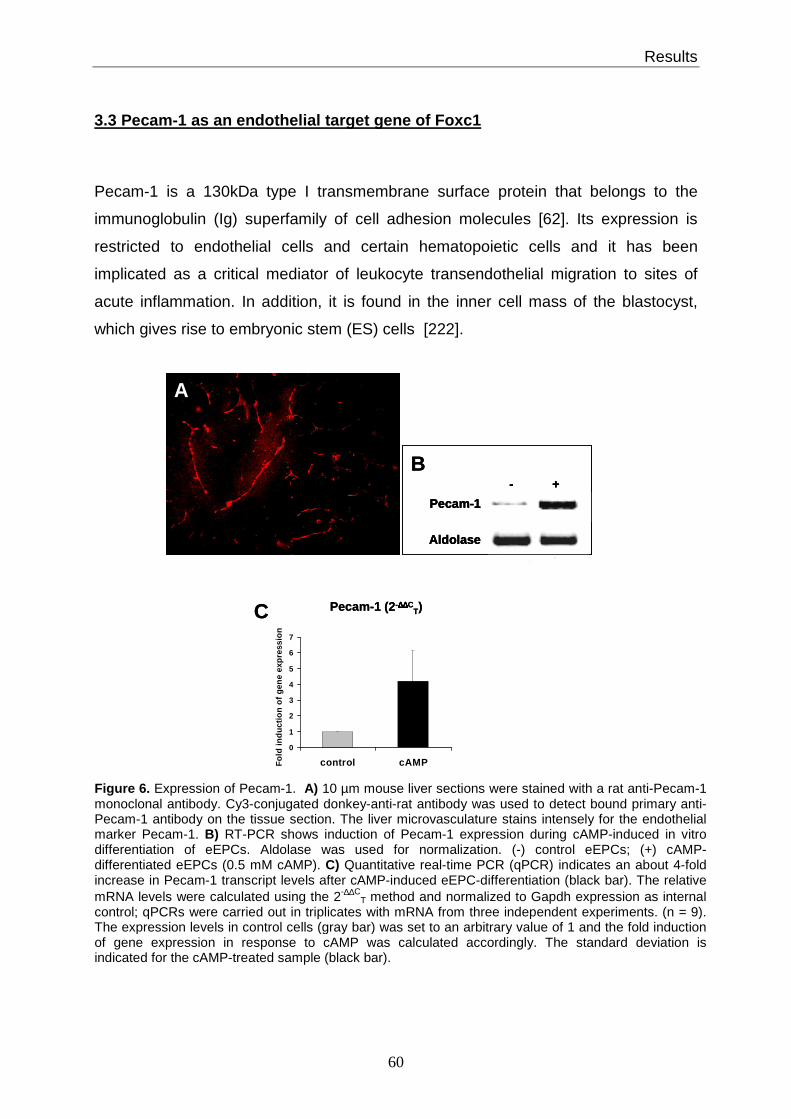
Results
60
3.3 Pecam-1 as an endothelial target gene of Foxc1
Pecam-1 is a 130kDa type I transmembrane surface protein that belongs to the
immunoglobulin (Ig) superfamily of cell adhesion molecules [62]. Its expression is
restricted to endothelial cells and certain hematopoietic cells and it has been
implicated as a critical mediator of leukocyte transendothelial migration to sites of
acute inflammation. In addition, it is found in the inner cell mass of the blastocyst,
which gives rise to embryonic stem (ES) cells [222].
Pecam-1
- +
Aldolase
A
B
C Pecam-1 (2-∆∆∆∆∆∆∆∆CT)
0
1
2
3
4
5
6
7
control cAMPFol
d in
duct
ion
of g
ene
expr
essi
on
Pecam-1
- +
Aldolase
Pecam-1
- +
Aldolase
A
B
C Pecam-1 (2-∆∆∆∆∆∆∆∆CT)
0
1
2
3
4
5
6
7
control cAMPFol
d in
duct
ion
of g
ene
expr
essi
on
Figure 6. Expression of Pecam-1. A) 10 µm mouse liver sections were stained with a rat anti-Pecam-1 monoclonal antibody. Cy3-conjugated donkey-anti-rat antibody was used to detect bound primary anti-Pecam-1 antibody on the tissue section. The liver microvasculature stains intensely for the endothelial marker Pecam-1. B) RT-PCR shows induction of Pecam-1 expression during cAMP-induced in vitrodifferentiation of eEPCs. Aldolase was used for normalization. (-) control eEPCs; (+) cAMP-differentiated eEPCs (0.5 mM cAMP). C) Quantitative real-time PCR (qPCR) indicates an about 4-fold increase in Pecam-1 transcript levels after cAMP-induced eEPC-differentiation (black bar). The relative mRNA levels were calculated using the 2-∆∆C
T method and normalized to Gapdh expression as internal control; qPCRs were carried out in triplicates with mRNA from three independent experiments. (n = 9). The expression levels in control cells (gray bar) was set to an arbitrary value of 1 and the fold induction of gene expression in response to cAMP was calculated accordingly. The standard deviation isindicated for the cAMP-treated sample (black bar).
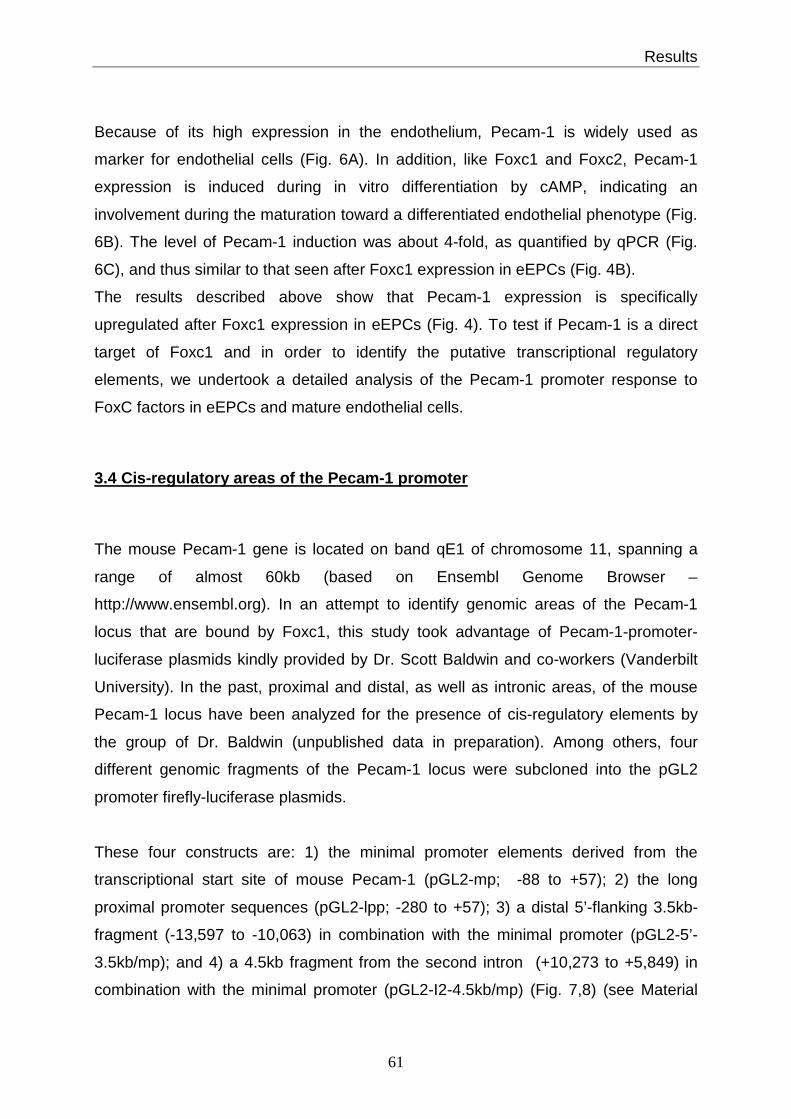
Results
61
Because of its high expression in the endothelium, Pecam-1 is widely used as
marker for endothelial cells (Fig. 6A). In addition, like Foxc1 and Foxc2, Pecam-1
expression is induced during in vitro differentiation by cAMP, indicating an
involvement during the maturation toward a differentiated endothelial phenotype (Fig.
6B). The level of Pecam-1 induction was about 4-fold, as quantified by qPCR (Fig.
6C), and thus similar to that seen after Foxc1 expression in eEPCs (Fig. 4B).
The results described above show that Pecam-1 expression is specifically
upregulated after Foxc1 expression in eEPCs (Fig. 4). To test if Pecam-1 is a direct
target of Foxc1 and in order to identify the putative transcriptional regulatory
elements, we undertook a detailed analysis of the Pecam-1 promoter response to
FoxC factors in eEPCs and mature endothelial cells.
3.4 Cis-regulatory areas of the Pecam-1 promoter
The mouse Pecam-1 gene is located on band qE1 of chromosome 11, spanning a
range of almost 60kb (based on Ensembl Genome Browser –
http://www.ensembl.org). In an attempt to identify genomic areas of the Pecam-1
locus that are bound by Foxc1, this study took advantage of Pecam-1-promoter-
luciferase plasmids kindly provided by Dr. Scott Baldwin and co-workers (Vanderbilt
University). In the past, proximal and distal, as well as intronic areas, of the mouse
Pecam-1 locus have been analyzed for the presence of cis-regulatory elements by
the group of Dr. Baldwin (unpublished data in preparation). Among others, four
different genomic fragments of the Pecam-1 locus were subcloned into the pGL2
promoter firefly-luciferase plasmids.
These four constructs are: 1) the minimal promoter elements derived from the
transcriptional start site of mouse Pecam-1 (pGL2-mp; -88 to +57); 2) the long
proximal promoter sequences (pGL2-lpp; -280 to +57); 3) a distal 5’-flanking 3.5kb-
fragment (-13,597 to -10,063) in combination with the minimal promoter (pGL2-5’-
3.5kb/mp); and 4) a 4.5kb fragment from the second intron (+10,273 to +5,849) in
combination with the minimal promoter (pGL2-I2-4.5kb/mp) (Fig. 7,8) (see Material
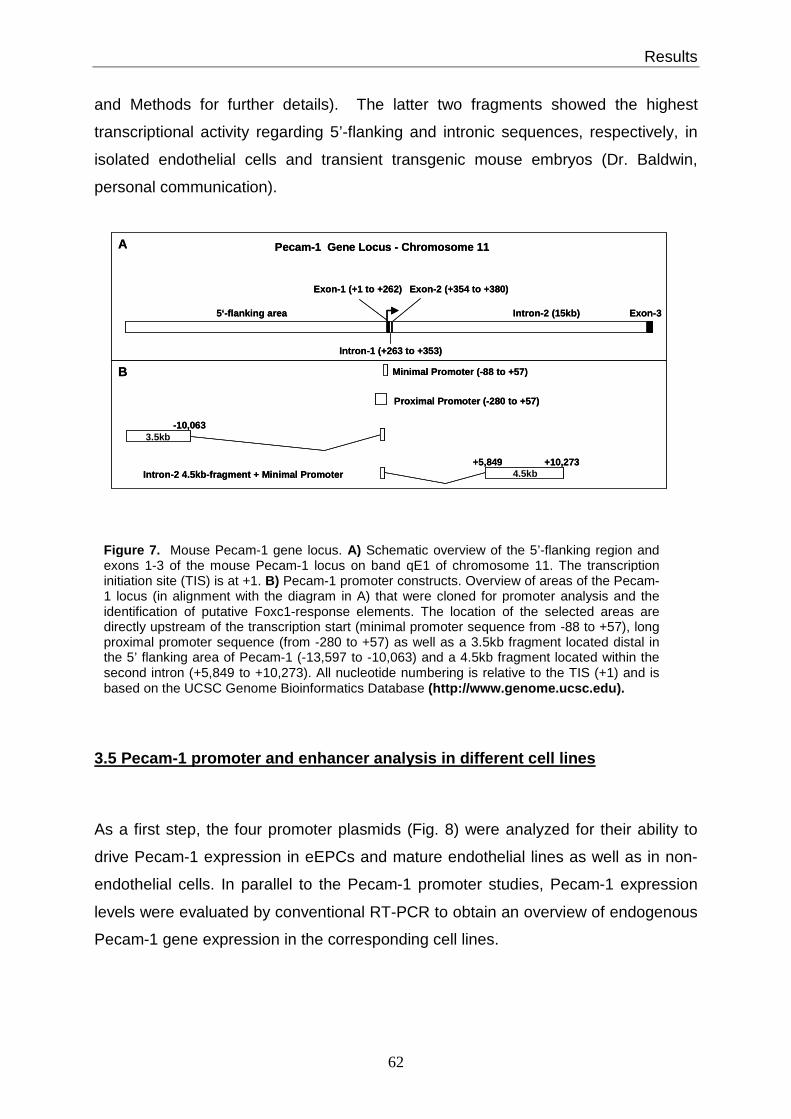
Results
62
and Methods for further details). The latter two fragments showed the highest
transcriptional activity regarding 5’-flanking and intronic sequences, respectively, in
isolated endothelial cells and transient transgenic mouse embryos (Dr. Baldwin,
personal communication).
3.5 Pecam-1 promoter and enhancer analysis in different cell l ines
As a first step, the four promoter plasmids (Fig. 8) were analyzed for their ability to
drive Pecam-1 expression in eEPCs and mature endothelial lines as well as in non-
endothelial cells. In parallel to the Pecam-1 promoter studies, Pecam-1 expression
levels were evaluated by conventional RT-PCR to obtain an overview of endogenous
Pecam-1 gene expression in the corresponding cell lines.
Pecam-1 Gene Locus - Chromosome 11
Minimal Promoter (-88 to +57)
Proximal Promoter (-280 to +57)
Intron-2 4.5kb-fragment + Minimal Promoter
Exon-1 (+1 to +262)
Exon-3
Exon-2 (+354 to +380)
Intron-2 (15kb)
4.5kb
3.5kb
4.5kb
Intron-1 (+263 to +353)
5‘-flanking area
-10,063
+5,849 +10,273
A
B
Pecam-1 Gene Locus - Chromosome 11
Minimal Promoter (-88 to +57)
Proximal Promoter (-280 to +57)
Intron-2 4.5kb-fragment + Minimal Promoter
Exon-1 (+1 to +262)
Exon-3
Exon-2 (+354 to +380)
Intron-2 (15kb)
4.5kb
3.5kb
4.5kb
Intron-1 (+263 to +353)
5‘-flanking area
-10,063
+5,849 +10,273
A
B
Figure 7. Mouse Pecam-1 gene locus. A) Schematic overview of the 5’-flanking region and exons 1-3 of the mouse Pecam-1 locus on band qE1 of chromosome 11. The transcription initiation site (TIS) is at +1. B) Pecam-1 promoter constructs. Overview of areas of the Pecam-1 locus (in alignment with the diagram in A) that were cloned for promoter analysis and the identification of putative Foxc1-response elements. The location of the selected areas are directly upstream of the transcription start (minimal promoter sequence from -88 to +57), long proximal promoter sequence (from -280 to +57) as well as a 3.5kb fragment located distal in the 5’ flanking area of Pecam-1 (-13,597 to -10,063) and a 4.5kb fragment located within the second intron (+5,849 to +10,273). All nucleotide numbering is relative to the TIS (+1) and is based on the UCSC Genome Bioinformatics Database (http://www.genome.ucsc.edu).
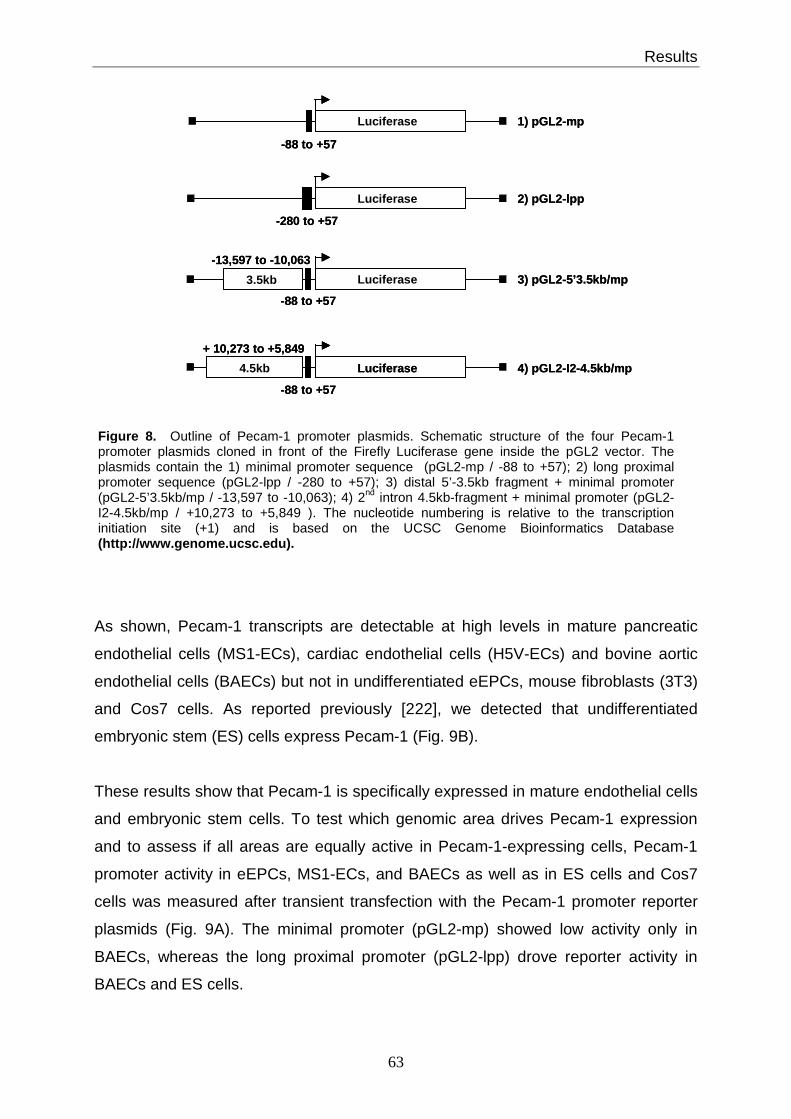
Results
63
As shown, Pecam-1 transcripts are detectable at high levels in mature pancreatic
endothelial cells (MS1-ECs), cardiac endothelial cells (H5V-ECs) and bovine aortic
endothelial cells (BAECs) but not in undifferentiated eEPCs, mouse fibroblasts (3T3)
and Cos7 cells. As reported previously [222], we detected that undifferentiated
embryonic stem (ES) cells express Pecam-1 (Fig. 9B).
These results show that Pecam-1 is specifically expressed in mature endothelial cells
and embryonic stem cells. To test which genomic area drives Pecam-1 expression
and to assess if all areas are equally active in Pecam-1-expressing cells, Pecam-1
promoter activity in eEPCs, MS1-ECs, and BAECs as well as in ES cells and Cos7
cells was measured after transient transfection with the Pecam-1 promoter reporter
plasmids (Fig. 9A). The minimal promoter (pGL2-mp) showed low activity only in
BAECs, whereas the long proximal promoter (pGL2-lpp) drove reporter activity in
BAECs and ES cells.
Firefly Luciferase
4.5kb
3.5kb Luciferase
Luciferase
Luciferase
-88 to +57
-280 to +57
-88 to +57
-13,597 to -10,063
-88 to +57
+ 10,273 to +5,849
Luciferase
3) pGL2-5’3.5kb/mp
2) pGL2-lpp
4) pGL2-I2-4.5kb/mp
1) pGL2-mpFirefly Luciferase
4.5kb
3.5kb Luciferase
Luciferase
Luciferase
-88 to +57
-280 to +57
-88 to +57
-13,597 to -10,063
-88 to +57
+ 10,273 to +5,849
Luciferase
3) pGL2-5’3.5kb/mp
2) pGL2-lpp
4) pGL2-I2-4.5kb/mp
1) pGL2-mp
Figure 8. Outline of Pecam-1 promoter plasmids. Schematic structure of the four Pecam-1 promoter plasmids cloned in front of the Firefly Luciferase gene inside the pGL2 vector. The plasmids contain the 1) minimal promoter sequence (pGL2-mp / -88 to +57); 2) long proximal promoter sequence (pGL2-lpp / -280 to +57); 3) distal 5’-3.5kb fragment + minimal promoter (pGL2-5’3.5kb/mp / -13,597 to -10,063); 4) 2nd intron 4.5kb-fragment + minimal promoter (pGL2-I2-4.5kb/mp / +10,273 to +5,849 ). The nucleotide numbering is relative to the transcription initiation site (+1) and is based on the UCSC Genome Bioinformatics Database (http://www.genome.ucsc.edu).

Results
64
The enhancer from the 2nd intron (pGL2-I2-4.5kb/mp) displayed high activity in
BAECs, and moderate activity in ES cells and pancreatic microvascular endothelial
cells (MS1-ECs), thus suggesting that this regulatory element might be primary
responsible to drive Pecam-1 expression in endothelial cells of larger vessels. The
distal 5’-flanking enhancer (pGL2-5’3.5kb/mp) did not display extra activity. In
accordance with endogenous Pecam-1 expression levels, no reporter gene activity
0 0,2 0,4 0,6 0,8 1 1,2
pGL2-mp
pGL2-lpp
pGL2-5'3.5kb/mp
pGL2-I2 4.5kb/mp
relative luciferase activity
eEPCBAECMS1-ECES cellsCos7
A
3T3
Pecam-1 - RT-PCR
Aldolase - RT-PCR
MS1-ECs ES cellsBAECseEPCsB
H5V-ECs
0 0,2 0,4 0,6 0,8 1 1,2
pGL2-mp
pGL2-lpp
pGL2-5'3.5kb/mp
pGL2-I2 4.5kb/mp
relative luciferase activity
eEPCBAECMS1-ECES cellsCos7
A
3T3
Pecam-1 - RT-PCR
Aldolase - RT-PCR
MS1-ECs ES cellsBAECseEPCsB
H5V-ECs
Figure 9. Pecam-1 expression analysis A) For promoter analysis, eEPCs, BAECs, MS1-ECs, ES cells, and Cos7 cells were transiently transfected with 0.3 µg of Pecam-1 promoter plasmids (outline in Fig. 7). Ten ng of the HSV-tk-Renilla plasmid were co-transfected for normalization, as described in Material and Methods. Luciferase activity was measured 24 hours after transfection. The luciferase activity derived from pGL2-I2-4.5kb/mp in BAECs was set to an arbitrary value of 1 and all other values were normalized accordingly. Pecam-1 expression is driven by pGL2-I2-4.5kb/mp in BAECs (purple bars), MS1-ECs (orange bars), and ES cells (green bars). Embryonic EPCs (black bars) and Cos7 (white bars) cells do not display promoter activity. Luciferase assays were carried out in triplicates and repeated at least once and bars represent average values (n > 6). The standard deviation is indicated for each bar. B) RT-PCR analysis shows expression of Pecam-1 in BAECs, MS1-ECs, H5V-ECs, and ES cells but not in eEPCs and 3T3 fibroblasts. RNA was isolated from at least three different experiments and PCR was repeated at least twice. Aldolase was used as normalization control. Shown is a representative result.
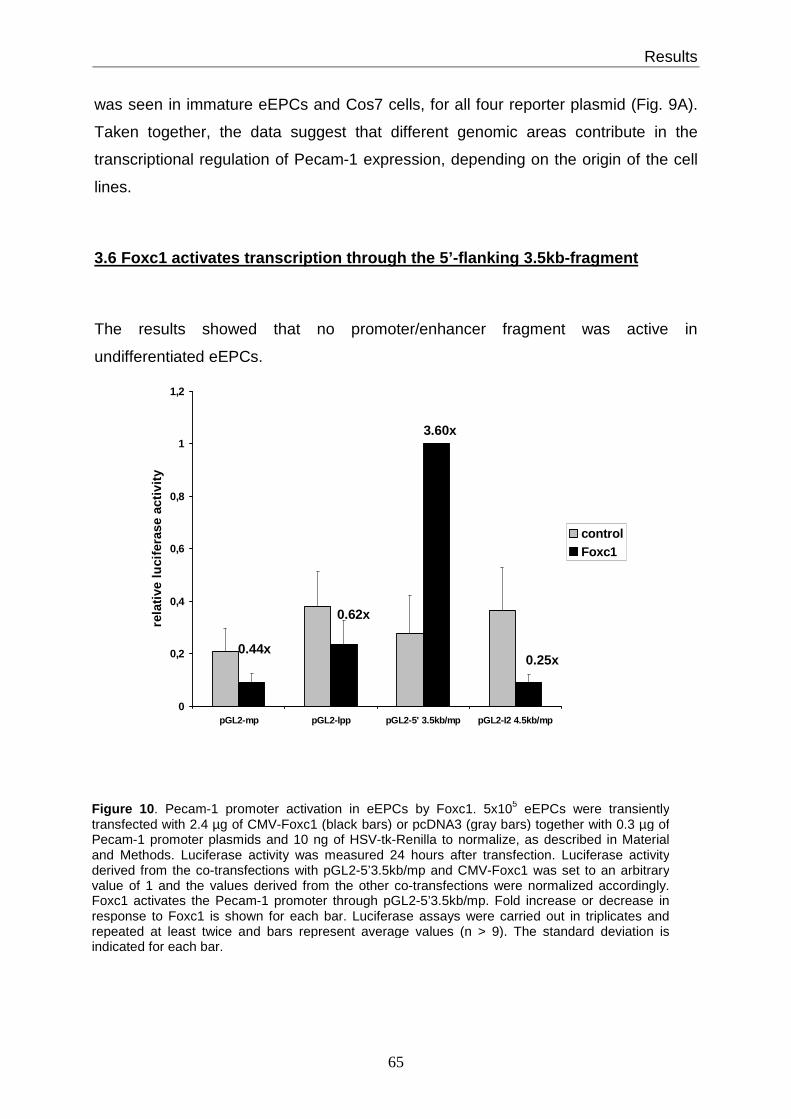
Results
65
was seen in immature eEPCs and Cos7 cells, for all four reporter plasmid (Fig. 9A).
Taken together, the data suggest that different genomic areas contribute in the
transcriptional regulation of Pecam-1 expression, depending on the origin of the cell
lines.
3.6 Foxc1 activates transcription through the 5’-fl anking 3.5kb-fragment
The results showed that no promoter/enhancer fragment was active in
undifferentiated eEPCs.
Figure 10 . Pecam-1 promoter activation in eEPCs by Foxc1. 5x10⁵ eEPCs were transiently transfected with 2.4 µg of CMV-Foxc1 (black bars) or pcDNA3 (gray bars) together with 0.3 µg of Pecam-1 promoter plasmids and 10 ng of HSV-tk-Renilla to normalize, as described in Material and Methods. Luciferase activity was measured 24 hours after transfection. Luciferase activity derived from the co-transfections with pGL2-5’3.5kb/mp and CMV-Foxc1 was set to an arbitrary value of 1 and the values derived from the other co-transfections were normalized accordingly. Foxc1 activates the Pecam-1 promoter through pGL2-5’3.5kb/mp. Fold increase or decrease in response to Foxc1 is shown for each bar. Luciferase assays were carried out in triplicates and repeated at least twice and bars represent average values (n > 9). The standard deviation is indicated for each bar.
0
0,2
0,4
0,6
0,8
1
1,2
pGL2-mp pGL2-lpp pGL2-5' 3.5kb/mp pGL2-I2 4.5kb/mp
rela
tive
luci
fera
se a
ctiv
ity
controlFoxc1
0.44x
0.62x
3.60x
0.25x
0
0,2
0,4
0,6
0,8
1
1,2
pGL2-mp pGL2-lpp pGL2-5' 3.5kb/mp pGL2-I2 4.5kb/mp
rela
tive
luci
fera
se a
ctiv
ity
controlFoxc1
0.44x
0.62x
3.60x
0.25x
Results
66
To test if the putative Foxc1-responsive elements reside within the tested genomic
areas, the cells were co-transfected with the promoter plasmids and a Foxc1-
expression (CMV-Foxc1) plasmid. As shown in Figure 10, a strong activation of
reporter gene transcription through the 5’-flanking 3.5kb-fragment (pGL2-5’3.5kb/mp)
was observed after Foxc1 expression, showing a 3.6-fold higher activity compared to
control, empty-vector transfected eEPCs that do not express Foxc1 (Fig. 10).
Transcriptional activation of the reporter gene by Foxc1 was neither seen for the
proximal (pGL2-lpp) and minimal promoter area (pGL2-mp) nor with the intronic
4.5kb-fragment (pGL2-I2-4.5kb/mp), where the background activity even dropped
about 4-fold after Foxc1 expression in the cell. Similar, a drop of the relative reporter
activity was seen in the promoter plasmids containing the proximal and minimal
promoter sequences (about 2-fold in each case). Since the effect is not seen with the
empty vector transfection, it is ruled out that this suppression is due to competition for
a limited pool of transcription factors between co-transfected plasmids. Instead, it
appears that Foxc1 protein overexpression might be interfering with the general
transcriptional machinery. The around 3.5-fold induction after Foxc1 binding is in
accordance with the increase in Pecam-1 mRNA and protein levels after Foxc1
expression in eEPCs (Fig 4B, 5). Additionally, Pecam-1 levels increase about the
same fold after eEPCs are induced to differentiate with cAMP and retinoic acid. In
conclusion, these data support the notion that a cis-acting regulatory site within the
5’-flanking 3.5kb-fragment is driving Pecam-1 expression after Foxc1 expression in
eEPCs.
3.7 The distal 5’-flanking 3.5kb-fragment responds specifically to Foxc1
To test if the transactivation of Pecam-1 in eEPCs through the distal upstream
element is specific to Foxc1, the cells were co-transfected with the pGL2-5’3.5kb/mp
promoter plasmid and pGL2-mp as control, together with the CMV-Foxc1, CMV-
Foxc2, or CMV-Foxa2 expression plasmids. Gain of function studies showed that
Pecam-1 expression in eEPCs was specifically activated by Foxc1 but not by the
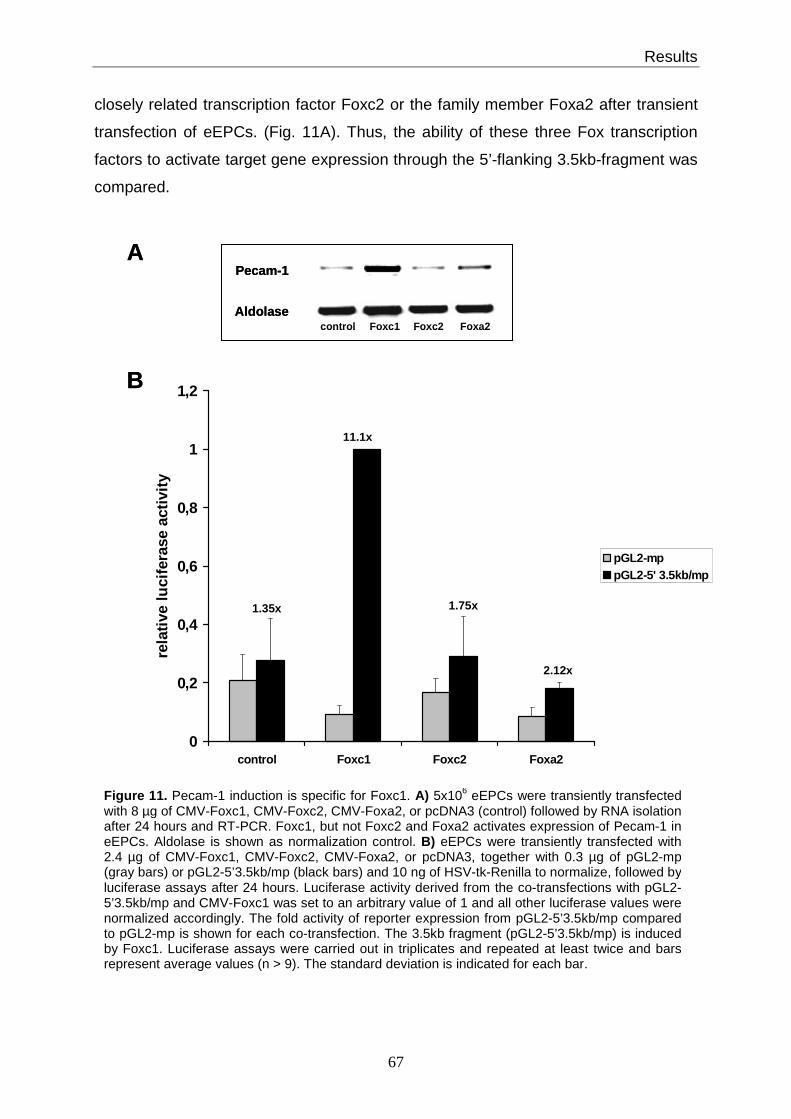
Results
67
closely related transcription factor Foxc2 or the family member Foxa2 after transient
transfection of eEPCs. (Fig. 11A). Thus, the ability of these three Fox transcription
factors to activate target gene expression through the 5’-flanking 3.5kb-fragment was
compared.
0
0,2
0,4
0,6
0,8
1
1,2
control Foxc1 Foxc2 Foxa2
rela
tive
luci
fera
se a
ctiv
ity
pGL2-mppGL2-5' 3.5kb/mp
1.35x
11.1x
1.75x
2.12x
B
A
control Foxc1 Foxc2 Foxa2
Pecam-1
Aldolase
0
0,2
0,4
0,6
0,8
1
1,2
control Foxc1 Foxc2 Foxa2
rela
tive
luci
fera
se a
ctiv
ity
pGL2-mppGL2-5' 3.5kb/mp
1.35x
11.1x
1.75x
2.12x
B
A
control Foxc1 Foxc2 Foxa2
Pecam-1
Aldolase
Figure 11. Pecam-1 induction is specific for Foxc1. A) 5x10⁶ eEPCs were transiently transfected with 8 µg of CMV-Foxc1, CMV-Foxc2, CMV-Foxa2, or pcDNA3 (control) followed by RNA isolation after 24 hours and RT-PCR. Foxc1, but not Foxc2 and Foxa2 activates expression of Pecam-1 in eEPCs. Aldolase is shown as normalization control. B) eEPCs were transiently transfected with 2.4 µg of CMV-Foxc1, CMV-Foxc2, CMV-Foxa2, or pcDNA3, together with 0.3 µg of pGL2-mp (gray bars) or pGL2-5’3.5kb/mp (black bars) and 10 ng of HSV-tk-Renilla to normalize, followed by luciferase assays after 24 hours. Luciferase activity derived from the co-transfections with pGL2-5’3.5kb/mp and CMV-Foxc1 was set to an arbitrary value of 1 and all other luciferase values were normalized accordingly. The fold activity of reporter expression from pGL2-5’3.5kb/mp compared to pGL2-mp is shown for each co-transfection. The 3.5kb fragment (pGL2-5’3.5kb/mp) is induced by Foxc1. Luciferase assays were carried out in triplicates and repeated at least twice and bars represent average values (n > 9). The standard deviation is indicated for each bar.
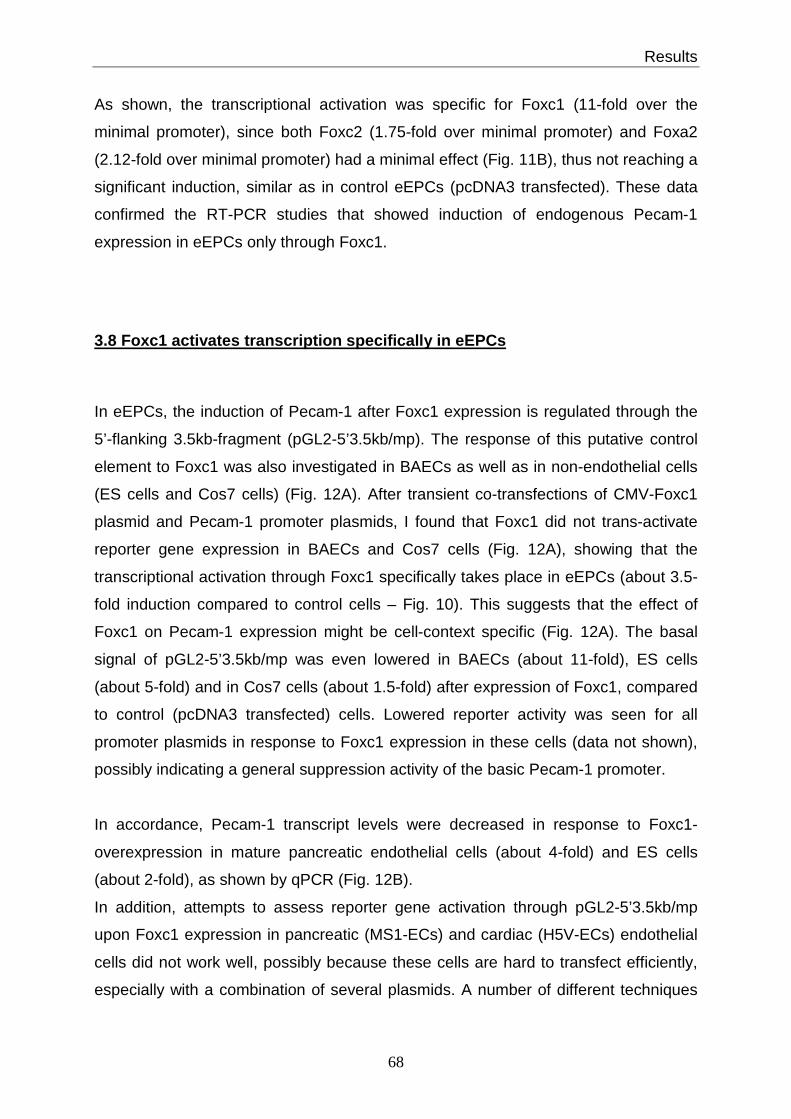
Results
68
As shown, the transcriptional activation was specific for Foxc1 (11-fold over the
minimal promoter), since both Foxc2 (1.75-fold over minimal promoter) and Foxa2
(2.12-fold over minimal promoter) had a minimal effect (Fig. 11B), thus not reaching a
significant induction, similar as in control eEPCs (pcDNA3 transfected). These data
confirmed the RT-PCR studies that showed induction of endogenous Pecam-1
expression in eEPCs only through Foxc1.
3.8 Foxc1 activates transcription specifically in e EPCs
In eEPCs, the induction of Pecam-1 after Foxc1 expression is regulated through the
5’-flanking 3.5kb-fragment (pGL2-5’3.5kb/mp). The response of this putative control
element to Foxc1 was also investigated in BAECs as well as in non-endothelial cells
(ES cells and Cos7 cells) (Fig. 12A). After transient co-transfections of CMV-Foxc1
plasmid and Pecam-1 promoter plasmids, I found that Foxc1 did not trans-activate
reporter gene expression in BAECs and Cos7 cells (Fig. 12A), showing that the
transcriptional activation through Foxc1 specifically takes place in eEPCs (about 3.5-
fold induction compared to control cells – Fig. 10). This suggests that the effect of
Foxc1 on Pecam-1 expression might be cell-context specific (Fig. 12A). The basal
signal of pGL2-5’3.5kb/mp was even lowered in BAECs (about 11-fold), ES cells
(about 5-fold) and in Cos7 cells (about 1.5-fold) after expression of Foxc1, compared
to control (pcDNA3 transfected) cells. Lowered reporter activity was seen for all
promoter plasmids in response to Foxc1 expression in these cells (data not shown),
possibly indicating a general suppression activity of the basic Pecam-1 promoter.
In accordance, Pecam-1 transcript levels were decreased in response to Foxc1-
overexpression in mature pancreatic endothelial cells (about 4-fold) and ES cells
(about 2-fold), as shown by qPCR (Fig. 12B).
In addition, attempts to assess reporter gene activation through pGL2-5’3.5kb/mp
upon Foxc1 expression in pancreatic (MS1-ECs) and cardiac (H5V-ECs) endothelial
cells did not work well, possibly because these cells are hard to transfect efficiently,
especially with a combination of several plasmids. A number of different techniques
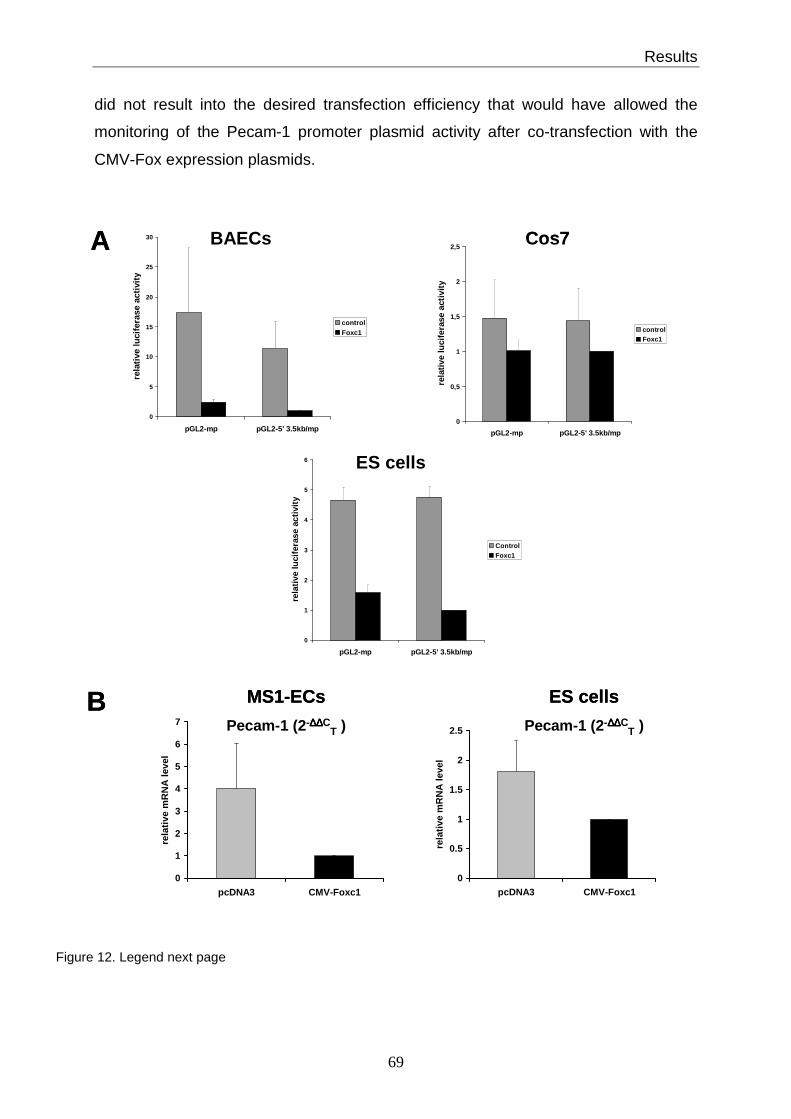
Results
69
did not result into the desired transfection efficiency that would have allowed the
monitoring of the Pecam-1 promoter plasmid activity after co-transfection with the
CMV-Fox expression plasmids.
0
0,5
1
1,5
2
2,5
pGL2-mp pGL2-5' 3.5kb/mpre
lativ
e lu
cife
rase
act
ivity
controlFoxc1
0
1
2
3
4
5
6
pGL2-mp pGL2-5' 3.5kb/mp
rela
tive
luci
fera
se a
ctiv
ity
ControlFoxc1
0
5
10
15
20
25
30
pGL2-mp pGL2-5' 3.5kb/mp
rela
tive
luci
fera
se a
ctiv
ity
controlFoxc1
BAECs Cos7
ES cells
A
B
0
1
2
3
4
5
6
7
pcDNA3 CMV-Foxc1
rela
tive
mR
NA
leve
l
0
0.5
1
1.5
2
2.5
pcDNA3 CMV-Foxc1
rela
tive
mR
NA
leve
l
MS1-ECs
Pecam-1 (2-∆∆∆∆∆∆∆∆CT )
ES cells
Pecam-1 (2-∆∆∆∆∆∆∆∆CT )
0
0,5
1
1,5
2
2,5
pGL2-mp pGL2-5' 3.5kb/mpre
lativ
e lu
cife
rase
act
ivity
controlFoxc1
0
1
2
3
4
5
6
pGL2-mp pGL2-5' 3.5kb/mp
rela
tive
luci
fera
se a
ctiv
ity
ControlFoxc1
0
5
10
15
20
25
30
pGL2-mp pGL2-5' 3.5kb/mp
rela
tive
luci
fera
se a
ctiv
ity
controlFoxc1
BAECs Cos7
ES cells
A
B
0
1
2
3
4
5
6
7
pcDNA3 CMV-Foxc1
rela
tive
mR
NA
leve
l
0
0.5
1
1.5
2
2.5
pcDNA3 CMV-Foxc1
rela
tive
mR
NA
leve
l
MS1-ECs
Pecam-1 (2-∆∆∆∆∆∆∆∆CT )
ES cells
Pecam-1 (2-∆∆∆∆∆∆∆∆CT )
Figure 12. Legend next page

Results
70
3.9 Endogenous Pecam-1 RNA analysis matches promoter activation studies
To corroborate the promoter studies, activation of endogenous Pecam-1 expression
in response to Foxc1 was studied. Figure 13 summarizes the data, showing that
Pecam-1 transcript levels are elevated only in eEPCs after Foxc1 expression.
In contrast, mature endothelial lines (MS1-ECs, H5V-ECs, BAECs), which express
constitutively high levels of Pecam-1, do not upregulate Pecam-1 expression after
transient transfection of CMV-Foxc1 plasmid. Undifferentiated ES cells express
Pecam-1, but - like in mature endothelial cells - transcript levels are not influenced by
the presence of Foxc1 in the cells (Fig. 13). Non-endothelial lines such as Cos7 cells
and 3T3 mouse fibroblasts do not express Pecam-1, and no de novo activation is
seen after Foxc1 expression is induced. Thus, it appears that endogenous
upregulation of Pecam-1 after Foxc1 induction is confined to embryonic EPCs
indicating that the Pecam-1 response is cell-context specific.
Figure 12. A) Pecam-1 transactivation by Foxc1 is specific for eEPCs. 1x10⁵ BAECs, ES cells, or Cos7 cells were transiently transfected with 2.4 µg of CMV-Foxc1 (black bars) or pcDNA3 (gray bars) together with 0.3 µg of pGL2-mp or pGL2-5’3.5kb/mp and 10 ng of HSV-tk-Renilla to normalize, followed by luciferase assays after 24 hours. Luciferase activity derived from the co-transfections with pGL2-5’ 3.5kb/mp and CMV-Foxc1 was set to an arbitrary value of 1 and all other luciferase values were normalized accordingly. Note that luciferase values are normalized independently for each cell line and values in the charts do not represent absolute luciferase units. BAECs, ES cells, or Cos7 cells do not activate reporter expression through pGL2-5’3.5kb/mp in response to Foxc1 (black bars). Luciferase assays were carried out in triplicates and repeated at least twice and bars represent average values (n > 9). The standard deviation is indicated for each bar. B) Quantitative Real-Time PCR (qPCR) shows a decrease in endogenous Pecam-1 mRNA levels in MS1-ECs and ES cells after overexpression of Foxc1. 5x10⁶ MS1-ECs or ES cells were transiently transfected with 8 µg of CMV-Foxc1 plasmid (black bars) or pcDNA3 as control (gray bars). Cells were lysed 24 hours after transfection and total RNA was subjected to RT-PCR, followed by qPCR. Endogenous Pecam-1 mRNA levels decrease about 4-fold (MS1-ECs) or about 2-fold (ES cells) in response to Foxc1 expression. The mRNA level in CMV-Foxc1-transfected cells was set to an arbitrary value of 1 and the mRNA level in control cells was normalized accordingly for each cell line. The relative mRNA levels for each sample were calculated using the 2-∆∆C
T method and normalized to β-actin expression; qPCRs were carried out in triplicates with mRNA from two independent experiments. (n = 6). The standard deviation is indicated for the control samples (gray bars).
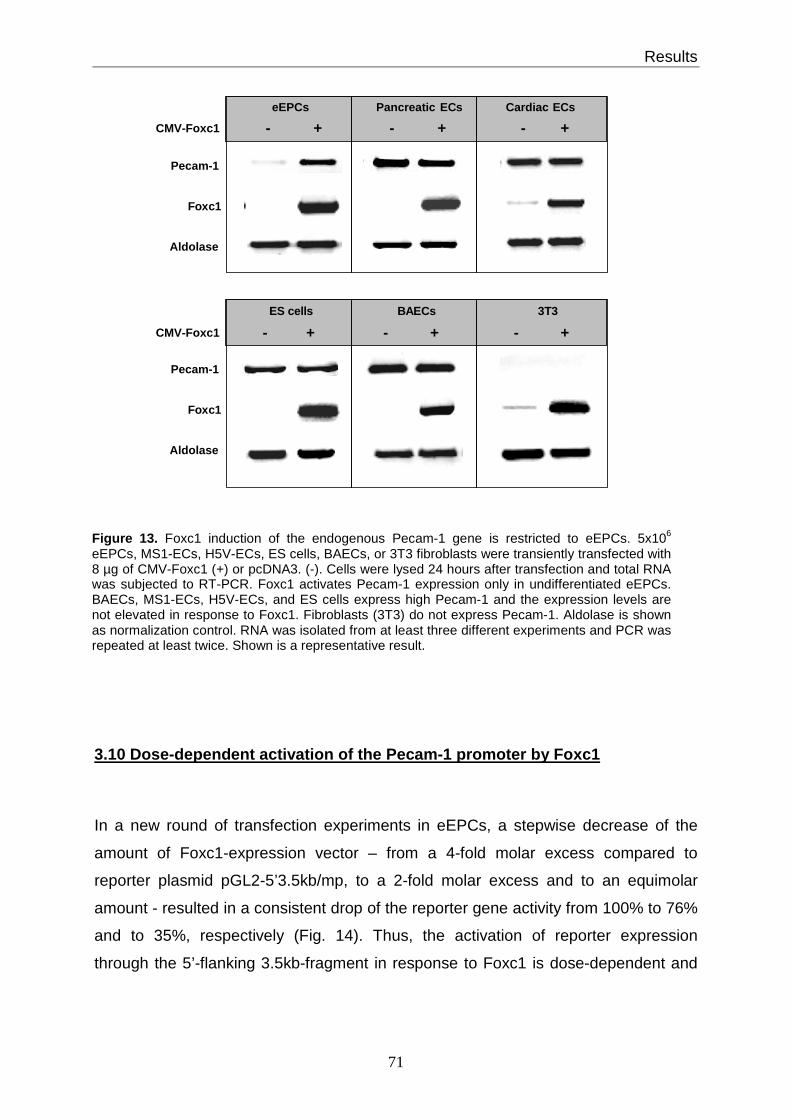
Results
71
3.10 Dose-dependent activation of the Pecam-1 promoter by Foxc1
In a new round of transfection experiments in eEPCs, a stepwise decrease of the
amount of Foxc1-expression vector – from a 4-fold molar excess compared to
reporter plasmid pGL2-5’3.5kb/mp, to a 2-fold molar excess and to an equimolar
amount - resulted in a consistent drop of the reporter gene activity from 100% to 76%
and to 35%, respectively (Fig. 14). Thus, the activation of reporter expression
through the 5’-flanking 3.5kb-fragment in response to Foxc1 is dose-dependent and
Pancreatic ECs
BAECs
Cardiac ECseEPCs
ES cells
CMV-Foxc1 - +
-
- + - +CMV-Foxc1
Pecam-1
Aldolase
- + - +
3T3
- +
Foxc1
Pecam-1
Aldolase
Foxc1
Figure 13. Foxc1 induction of the endogenous Pecam-1 gene is restricted to eEPCs. 5x10⁶
eEPCs, MS1-ECs, H5V-ECs, ES cells, BAECs, or 3T3 fibroblasts were transiently transfected with 8 µg of CMV-Foxc1 (+) or pcDNA3. (-). Cells were lysed 24 hours after transfection and total RNA was subjected to RT-PCR. Foxc1 activates Pecam-1 expression only in undifferentiated eEPCs. BAECs, MS1-ECs, H5V-ECs, and ES cells express high Pecam-1 and the expression levels are not elevated in response to Foxc1. Fibroblasts (3T3) do not express Pecam-1. Aldolase is shown as normalization control. RNA was isolated from at least three different experiments and PCR was repeated at least twice. Shown is a representative result.
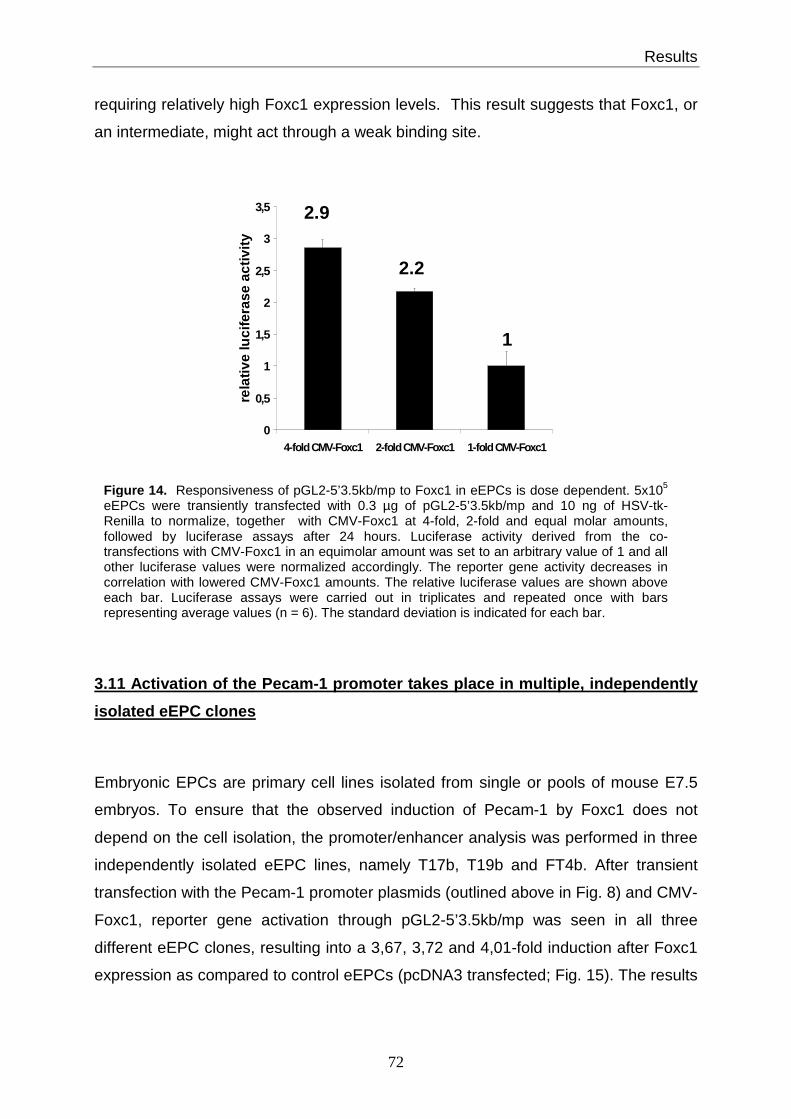
Results
72
requiring relatively high Foxc1 expression levels. This result suggests that Foxc1, or
an intermediate, might act through a weak binding site.
3.11 Activation of the Pecam-1 promoter takes place in multiple, independently
isolated eEPC clones
Embryonic EPCs are primary cell lines isolated from single or pools of mouse E7.5
embryos. To ensure that the observed induction of Pecam-1 by Foxc1 does not
depend on the cell isolation, the promoter/enhancer analysis was performed in three
independently isolated eEPC lines, namely T17b, T19b and FT4b. After transient
transfection with the Pecam-1 promoter plasmids (outlined above in Fig. 8) and CMV-
Foxc1, reporter gene activation through pGL2-5’3.5kb/mp was seen in all three
different eEPC clones, resulting into a 3,67, 3,72 and 4,01-fold induction after Foxc1
expression as compared to control eEPCs (pcDNA3 transfected; Fig. 15). The results
0
0,5
1
1,5
2
2,5
3
3,5
4-fold CMV-Foxc1 2-fold CMV-Foxc1 1-fold CMV-Foxc1
rela
tive
luci
fera
se a
ctiv
ity
1
2.2
2.9
0
0,5
1
1,5
2
2,5
3
3,5
4-fold CMV-Foxc1 2-fold CMV-Foxc1 1-fold CMV-Foxc1
rela
tive
luci
fera
se a
ctiv
ity
1
2.2
2.9
Figure 14. Responsiveness of pGL2-5’3.5kb/mp to Foxc1 in eEPCs is dose dependent. 5x10⁵
eEPCs were transiently transfected with 0.3 µg of pGL2-5’3.5kb/mp and 10 ng of HSV-tk-Renilla to normalize, together with CMV-Foxc1 at 4-fold, 2-fold and equal molar amounts,followed by luciferase assays after 24 hours. Luciferase activity derived from the co-transfections with CMV-Foxc1 in an equimolar amount was set to an arbitrary value of 1 and all other luciferase values were normalized accordingly. The reporter gene activity decreases in correlation with lowered CMV-Foxc1 amounts. The relative luciferase values are shown above each bar. Luciferase assays were carried out in triplicates and repeated once with bars representing average values (n = 6). The standard deviation is indicated for each bar.
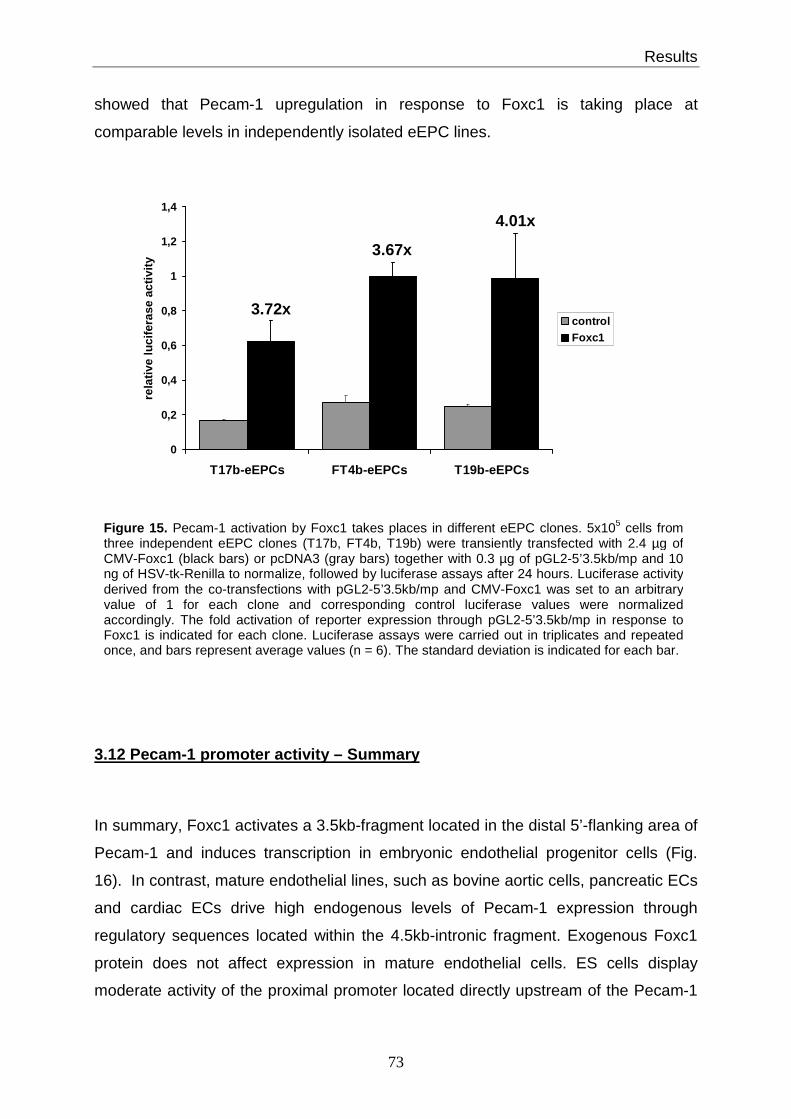
Results
73
showed that Pecam-1 upregulation in response to Foxc1 is taking place at
comparable levels in independently isolated eEPC lines.
3.12 Pecam-1 promoter activity – Summary
In summary, Foxc1 activates a 3.5kb-fragment located in the distal 5’-flanking area of
Pecam-1 and induces transcription in embryonic endothelial progenitor cells (Fig.
16). In contrast, mature endothelial lines, such as bovine aortic cells, pancreatic ECs
and cardiac ECs drive high endogenous levels of Pecam-1 expression through
regulatory sequences located within the 4.5kb-intronic fragment. Exogenous Foxc1
protein does not affect expression in mature endothelial cells. ES cells display
moderate activity of the proximal promoter located directly upstream of the Pecam-1
0
0,2
0,4
0,6
0,8
1
1,2
1,4
T17b-eEPCs FT4b-eEPCs T19b-eEPCs
rela
tive
luci
fera
se a
ctiv
ity
controlFoxc1
3.72x
3.67x
4.01x
0
0,2
0,4
0,6
0,8
1
1,2
1,4
T17b-eEPCs FT4b-eEPCs T19b-eEPCs
rela
tive
luci
fera
se a
ctiv
ity
controlFoxc1
3.72x
3.67x
4.01x
Figure 15. Pecam-1 activation by Foxc1 takes places in different eEPC clones. 5x10⁵ cells from three independent eEPC clones (T17b, FT4b, T19b) were transiently transfected with 2.4 µg of CMV-Foxc1 (black bars) or pcDNA3 (gray bars) together with 0.3 µg of pGL2-5’3.5kb/mp and 10 ng of HSV-tk-Renilla to normalize, followed by luciferase assays after 24 hours. Luciferase activity derived from the co-transfections with pGL2-5’3.5kb/mp and CMV-Foxc1 was set to an arbitrary value of 1 for each clone and corresponding control luciferase values were normalized accordingly. The fold activation of reporter expression through pGL2-5’3.5kb/mp in response to Foxc1 is indicated for each clone. Luciferase assays were carried out in triplicates and repeated once, and bars represent average values (n = 6). The standard deviation is indicated for each bar.

Results
74
transcription start and, as with mature endothelial cells, gain of Foxc1 function does
not increase Pecam-1 expression nor does it induce luciferase activity of the
promoter/enhancer constructs. The promoter elements have no activity in Cos7 cells,
regardless of Foxc1, in accordance with the fact that Cos7 cells represent a Pecam-1
negative non-endothelial cell population [223].
3.13 Localization of Foxc1-responsive sites
Next, the 5’-flanking 3.5kb-fragment (-13,597 to -10,063) was scrutinized for putative
sites responding directly or indirectly to Foxc1. Using PCR amplification, the whole
3.5kb-fragment was separated into three pieces (-13,597 to -12,547; -12,568 to -
Foxc1 Exon-3Intron-2 -15kb4.5kb
Foxc1 GoF - eEPCs
B
Exon-3Intron-2-15kb
4.5kb
Pancreatic ECs / Cardiac ECs / BAECs
C
Exon-3Intron-2 (15kb)-15kb4.5kb
Undifferentiated ES CellsD
Exon-3Intron-2 (15kb)-15kb
4.5kb
Cos7 Kidney CellsE
Exon 1 (+1 to +262)
Exon-3
Exon 2 (+354 to +380)
Intron-2 -15kb
4.5kb
Intron 1 (+263 to +353)
No Pecam-1 expression - eEPCsA
Figure 16 . Summary of Pecam-1 Promoter regulation in different cell types. A) Undifferentiated eEPCs do not show cis-regulatory activity of the distal 5’-flanking 3.5kb fragment (gray box), the proximal promoter areas (around Exon-1), or the 4.5kb fragment (black-white striped box) in the second intron. B) Gene transcription is activated through the distal 5’-flanking 3.5kb fragment after Foxc1 expression C) Mature endothelial cells (pancreatic ECs, cardiac ECs, bovine aortic ECs) have high endogenous Pecam-1 expression driven by the 4.5kb fragment located within the second intron (gray triangle). The activity of the intronic enhancer is independent of Foxc1. D)Undifferentiated ES cells drive Pecam-1 expression through the proximal promoter area as well as through the intronic 4.5kb fragment (gray triangles). E) Cos7 kidney cells do not express Pecam-1and display no activity of the different promoter elements, regardless of Foxc1 expression. All inactive promoter elements are indicated by a black circled X; GoF = Gain of Funtion.
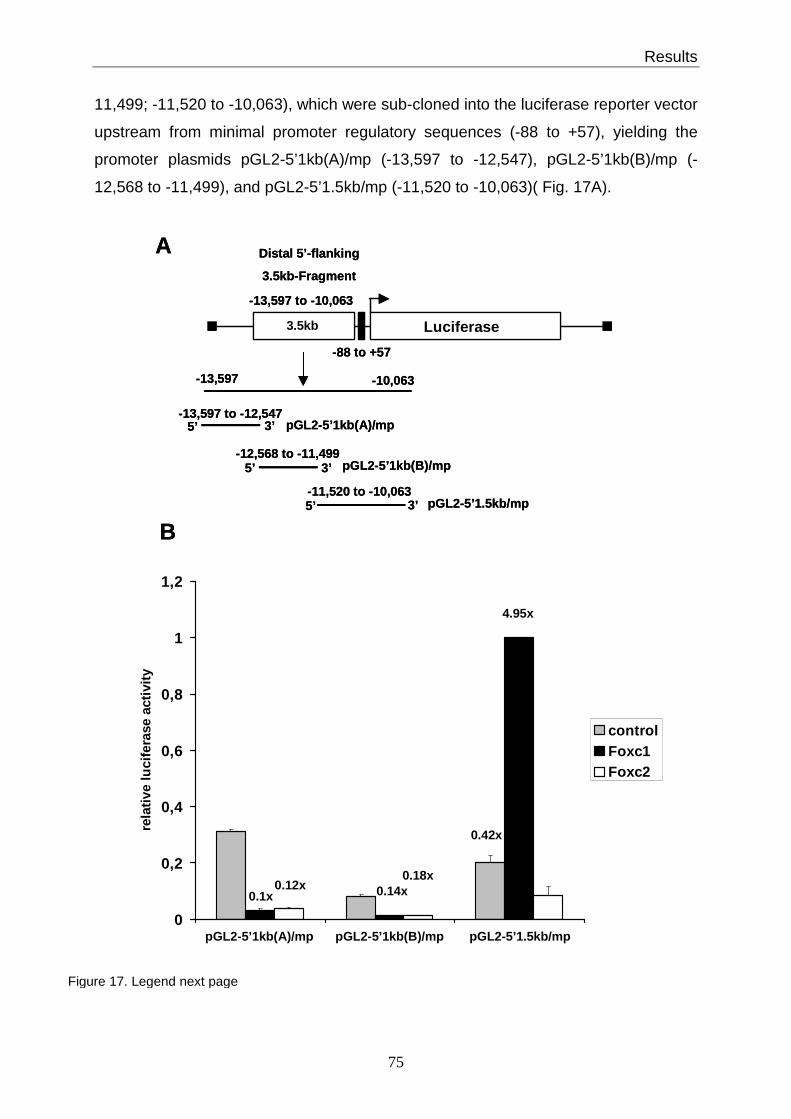
Results
75
11,499; -11,520 to -10,063), which were sub-cloned into the luciferase reporter vector
upstream from minimal promoter regulatory sequences (-88 to +57), yielding the
promoter plasmids pGL2-5’1kb(A)/mp (-13,597 to -12,547), pGL2-5’1kb(B)/mp (-
12,568 to -11,499), and pGL2-5’1.5kb/mp (-11,520 to -10,063)( Fig. 17A).
Distal 5’-flanking
3.5kb-Fragment
pGL2-5’1kb(A)/mp
pGL2-5’1.5kb/mp
-13,597 -10,063
pGL2-5’1kb(B)/mp
5’ 3’
5’ 3’
5’ 3’
3.5kb Luciferase
-88 to +57
-13,597 to -10,063
A
0
0,2
0,4
0,6
0,8
1
1,2
pGL2-5' 1.1kb(A)/mp pGL2-5' 1.1kb(B)/mp pGL2-5' 1.5kb /mp
rela
tive
luci
fera
se a
ctiv
ity
controlFoxc1Foxc2
0.1x0.12x 0.14x
0.18x
4.95x
0.42x
B
-13,597 to -12,547
-12,568 to -11,499
-11,520 to -10,063
pGL2-5’1kb(A)/mp pGL2-5’1kb(B)/mp pGL2-5’1.5kb/mp
Figure 17. Legend next page
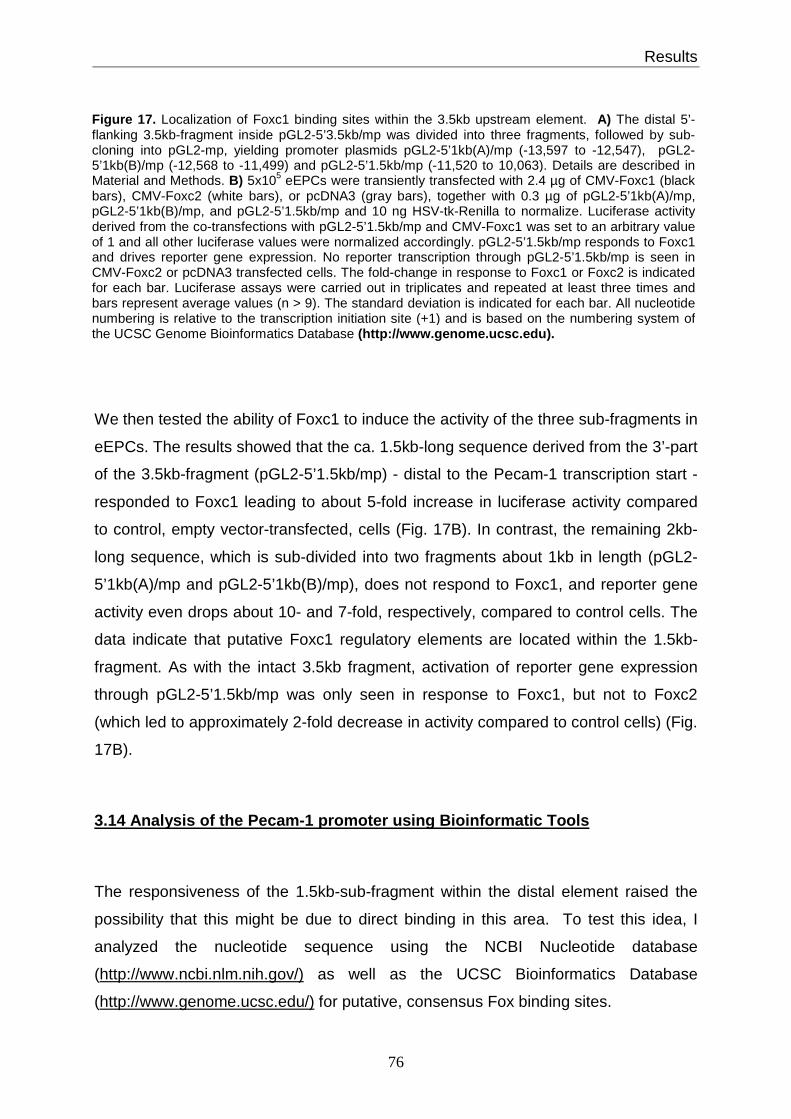
Results
76
We then tested the ability of Foxc1 to induce the activity of the three sub-fragments in
eEPCs. The results showed that the ca. 1.5kb-long sequence derived from the 3’-part
of the 3.5kb-fragment (pGL2-5’1.5kb/mp) - distal to the Pecam-1 transcription start -
responded to Foxc1 leading to about 5-fold increase in luciferase activity compared
to control, empty vector-transfected, cells (Fig. 17B). In contrast, the remaining 2kb-
long sequence, which is sub-divided into two fragments about 1kb in length (pGL2-
5’1kb(A)/mp and pGL2-5’1kb(B)/mp), does not respond to Foxc1, and reporter gene
activity even drops about 10- and 7-fold, respectively, compared to control cells. The
data indicate that putative Foxc1 regulatory elements are located within the 1.5kb-
fragment. As with the intact 3.5kb fragment, activation of reporter gene expression
through pGL2-5’1.5kb/mp was only seen in response to Foxc1, but not to Foxc2
(which led to approximately 2-fold decrease in activity compared to control cells) (Fig.
17B).
3.14 Analysis of the Pecam-1 promoter using Bioinformatic Tools
The responsiveness of the 1.5kb-sub-fragment within the distal element raised the
possibility that this might be due to direct binding in this area. To test this idea, I
analyzed the nucleotide sequence using the NCBI Nucleotide database
(http://www.ncbi.nlm.nih.gov/) as well as the UCSC Bioinformatics Database
(http://www.genome.ucsc.edu/) for putative, consensus Fox binding sites.
Figure 17. Localization of Foxc1 binding sites within the 3.5kb upstream element. A) The distal 5’-flanking 3.5kb-fragment inside pGL2-5’3.5kb/mp was divided into three fragments, followed by sub-cloning into pGL2-mp, yielding promoter plasmids pGL2-5’1kb(A)/mp (-13,597 to -12,547), pGL2-5’1kb(B)/mp (-12,568 to -11,499) and pGL2-5’1.5kb/mp (-11,520 to 10,063). Details are described in Material and Methods. B) 5x10⁵ eEPCs were transiently transfected with 2.4 µg of CMV-Foxc1 (blackbars), CMV-Foxc2 (white bars), or pcDNA3 (gray bars), together with 0.3 µg of pGL2-5’1kb(A)/mp, pGL2-5’1kb(B)/mp, and pGL2-5’1.5kb/mp and 10 ng HSV-tk-Renilla to normalize. Luciferase activity derived from the co-transfections with pGL2-5’1.5kb/mp and CMV-Foxc1 was set to an arbitrary value of 1 and all other luciferase values were normalized accordingly. pGL2-5’1.5kb/mp responds to Foxc1 and drives reporter gene expression. No reporter transcription through pGL2-5’1.5kb/mp is seen in CMV-Foxc2 or pcDNA3 transfected cells. The fold-change in response to Foxc1 or Foxc2 is indicated for each bar. Luciferase assays were carried out in triplicates and repeated at least three times and bars represent average values (n > 9). The standard deviation is indicated for each bar. All nucleotide numbering is relative to the transcription initiation site (+1) and is based on the numbering system of the UCSC Genome Bioinformatics Database (http://www.genome.ucsc.edu).
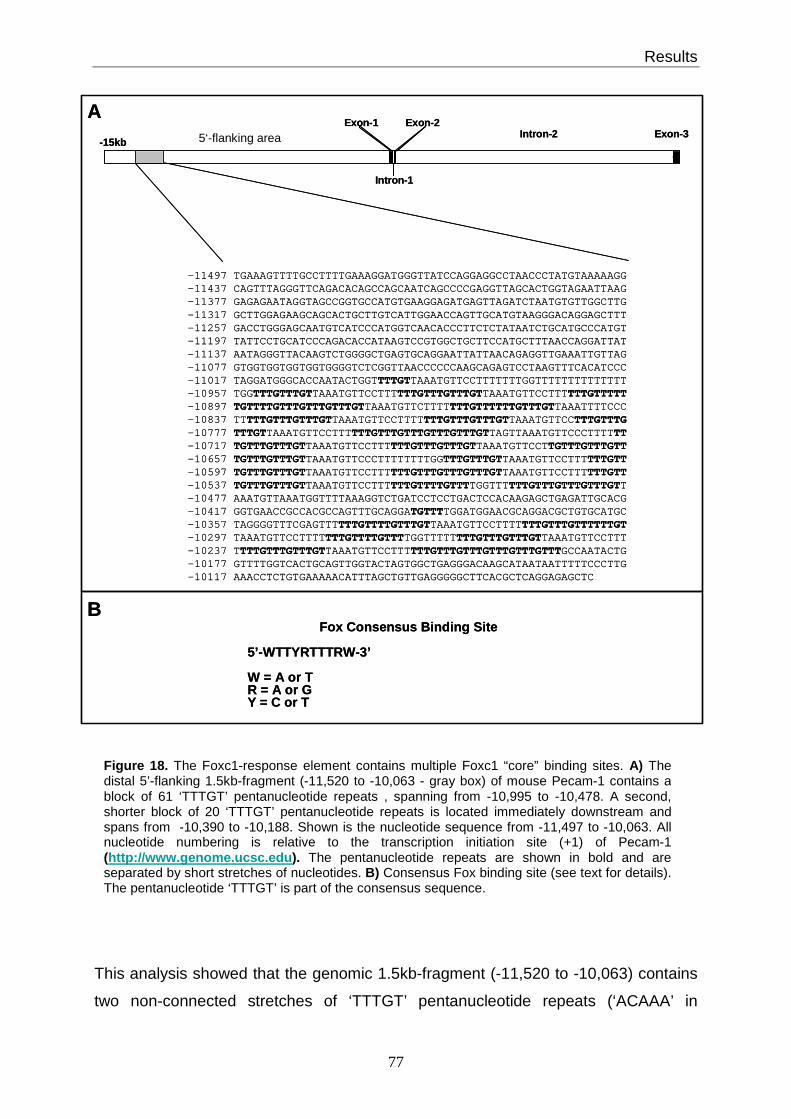
Results
77
This analysis showed that the genomic 1.5kb-fragment (-11,520 to -10,063) contains
two non-connected stretches of ‘TTTGT’ pentanucleotide repeats (‘ACAAA’ in
Exon-1Exon-3
Exon-2Intron-2
-15kb
Intron-1
5Ō-flanking area
-11497 TGAAAGTTTTGCCTTTTGAAAGGATGGGTTATCCAGGAGGCCTAACCCTATGTAAAAAGG-11437 CAGTTTAGGGTTCAGACACAGCCAGCAATCAGCCCCGAGGTTAGCACTGGTAGAATTAAG-11377 GAGAGAATAGGTAGCCGGTGCCATGTGAAGGAGATGAGTTAGATCTAATGTGTTGGCTTG-11317 GCTTGGAGAAGCAGCACTGCTTGTCATTGGAACCAGTTGCATGTAAGGGACAGGAGCTTT-11257 GACCTGGGAGCAATGTCATCCCATGGTCAACACCCTTCTCTATAATCTGCATGCCCATGT-11197 TATTCCTGCATCCCAGACACCATAAGTCCGTGGCTGCTTCCATGCTTTAACCAGGATTAT-11137 AATAGGGTTACAAGTCTGGGGCTGAGTGCAGGAATTATTAACAGAGGTTGAAATTGTTAG-11077 GTGGTGGTGGTGGTGGGGTCTCGGTTAACCCCCCAAGCAGAGTCCTAAGTTTCACATCCC-11017 TAGGATGGGCACCAATACTGGTTTTGTTAAATGTTCCTTTTTTTGGTTTTTTTTTTTTTT-10957 TGG TTTGTTTGTTAAATGTTCCTTTTTTGTTTGTTTGTTAAATGTTCCTTTTTTGTTTTT-10897 TGTTTTGTTTGTTTGTTTGTTAAATGTTCTTTTTTTGTTTTTTGTTTGTTAAATTTTCCC-10837 TT TTTGTTTGTTTGTTAAATGTTCCTTTTTTTGTTTGTTTGTTAAATGTTCCTTTGTTTG-10777 TTTGTTAAATGTTCCTTTTTTGTTTGTTTGTTTGTTTGTTAGTTAAATGTTCCCTTTTTT-10717 TGTTTGTTTGTTAAATGTTCCTTTTTTGTTTGTTTGTTAAATGTTCCTTGTTTGTTTGTT-10657 TGTTTGTTTGTTAAATGTTCCCTTTTTTTTGGTTTGTTTGTTAAATGTTCCTTTTTTGTT-10597 TGTTTGTTTGTTAAATGTTCCTTTTTTGTTTGTTTGTTTGTTAAATGTTCCTTTTTTGTT-10537 TGTTTGTTTGTTAAATGTTCCTTTTTTGTTTTGTTTTGGTTTTTTGTTTGTTTGTTTGTT-10477 AAATGTTAAATGGTTTTAAAGGTCTGATCCTCCTGACTCCACAAGAGCTGAGATTGCACG-10417 GGTGAACCGCCACGCCAGTTTGCAGGATGTTTTGGATGGAACGCAGGACGCTGTGCATGC-10357 TAGGGGTTTCGAGTTTTTTGTTTTGTTTGTTAAATGTTCCTTTTTTTGTTTGTTTTTTGT-10297 TAAATGTTCCTTTTTTTGTTTTGTTTTGGTTTTTTTTGTTTGTTTGTTAAATGTTCCTTT-10237 T TTTGTTTGTTTGTTAAATGTTCCTTTTTTGTTTGTTTGTTTGTTTGTTTGCCAATACTG-10177 GTTTTGGTCACTGCAGTTGGTACTAGTGGCTGAGGGACAAGCATAATAATTTTTCCCTTG-10117 AAACCTCTGTGAAAAACATTTAGCTGTTGAGGGGGCTTCACGCTCAGGAGAGCTC
Fox Consensus Binding Site
5’-WTTYRTTTRW-3’
W = A or TR = A or GY = C or T
A
B
5‘-flanking areaExon-1
Exon-3Exon-2
Intron-2-15kb
Intron-1
5Ō-flanking area
-11497 TGAAAGTTTTGCCTTTTGAAAGGATGGGTTATCCAGGAGGCCTAACCCTATGTAAAAAGG-11437 CAGTTTAGGGTTCAGACACAGCCAGCAATCAGCCCCGAGGTTAGCACTGGTAGAATTAAG-11377 GAGAGAATAGGTAGCCGGTGCCATGTGAAGGAGATGAGTTAGATCTAATGTGTTGGCTTG-11317 GCTTGGAGAAGCAGCACTGCTTGTCATTGGAACCAGTTGCATGTAAGGGACAGGAGCTTT-11257 GACCTGGGAGCAATGTCATCCCATGGTCAACACCCTTCTCTATAATCTGCATGCCCATGT-11197 TATTCCTGCATCCCAGACACCATAAGTCCGTGGCTGCTTCCATGCTTTAACCAGGATTAT-11137 AATAGGGTTACAAGTCTGGGGCTGAGTGCAGGAATTATTAACAGAGGTTGAAATTGTTAG-11077 GTGGTGGTGGTGGTGGGGTCTCGGTTAACCCCCCAAGCAGAGTCCTAAGTTTCACATCCC-11017 TAGGATGGGCACCAATACTGGTTTTGTTAAATGTTCCTTTTTTTGGTTTTTTTTTTTTTT-10957 TGG TTTGTTTGTTAAATGTTCCTTTTTTGTTTGTTTGTTAAATGTTCCTTTTTTGTTTTT-10897 TGTTTTGTTTGTTTGTTTGTTAAATGTTCTTTTTTTGTTTTTTGTTTGTTAAATTTTCCC-10837 TT TTTGTTTGTTTGTTAAATGTTCCTTTTTTTGTTTGTTTGTTAAATGTTCCTTTGTTTG-10777 TTTGTTAAATGTTCCTTTTTTGTTTGTTTGTTTGTTTGTTAGTTAAATGTTCCCTTTTTT-10717 TGTTTGTTTGTTAAATGTTCCTTTTTTGTTTGTTTGTTAAATGTTCCTTGTTTGTTTGTT-10657 TGTTTGTTTGTTAAATGTTCCCTTTTTTTTGGTTTGTTTGTTAAATGTTCCTTTTTTGTT-10597 TGTTTGTTTGTTAAATGTTCCTTTTTTGTTTGTTTGTTTGTTAAATGTTCCTTTTTTGTT-10537 TGTTTGTTTGTTAAATGTTCCTTTTTTGTTTTGTTTTGGTTTTTTGTTTGTTTGTTTGTT-10477 AAATGTTAAATGGTTTTAAAGGTCTGATCCTCCTGACTCCACAAGAGCTGAGATTGCACG-10417 GGTGAACCGCCACGCCAGTTTGCAGGATGTTTTGGATGGAACGCAGGACGCTGTGCATGC-10357 TAGGGGTTTCGAGTTTTTTGTTTTGTTTGTTAAATGTTCCTTTTTTTGTTTGTTTTTTGT-10297 TAAATGTTCCTTTTTTTGTTTTGTTTTGGTTTTTTTTGTTTGTTTGTTAAATGTTCCTTT-10237 T TTTGTTTGTTTGTTAAATGTTCCTTTTTTGTTTGTTTGTTTGTTTGTTTGCCAATACTG-10177 GTTTTGGTCACTGCAGTTGGTACTAGTGGCTGAGGGACAAGCATAATAATTTTTCCCTTG-10117 AAACCTCTGTGAAAAACATTTAGCTGTTGAGGGGGCTTCACGCTCAGGAGAGCTC
Fox Consensus Binding Site
5’-WTTYRTTTRW-3’
W = A or TR = A or GY = C or T
A
B
5‘-flanking area
Figure 18. The Foxc1-response element contains multiple Foxc1 “core” binding sites. A) The distal 5’-flanking 1.5kb-fragment (-11,520 to -10,063 - gray box) of mouse Pecam-1 contains a block of 61 ‘TTTGT’ pentanucleotide repeats , spanning from -10,995 to -10,478. A second, shorter block of 20 ‘TTTGT’ pentanucleotide repeats is located immediately downstream and spans from -10,390 to -10,188. Shown is the nucleotide sequence from -11,497 to -10,063. All nucleotide numbering is relative to the transcription initiation site (+1) of Pecam-1(http://www.genome.ucsc.edu). The pentanucleotide repeats are shown in bold and are separated by short stretches of nucleotides. B) Consensus Fox binding site (see text for details). The pentanucleotide ‘TTTGT’ is part of the consensus sequence.
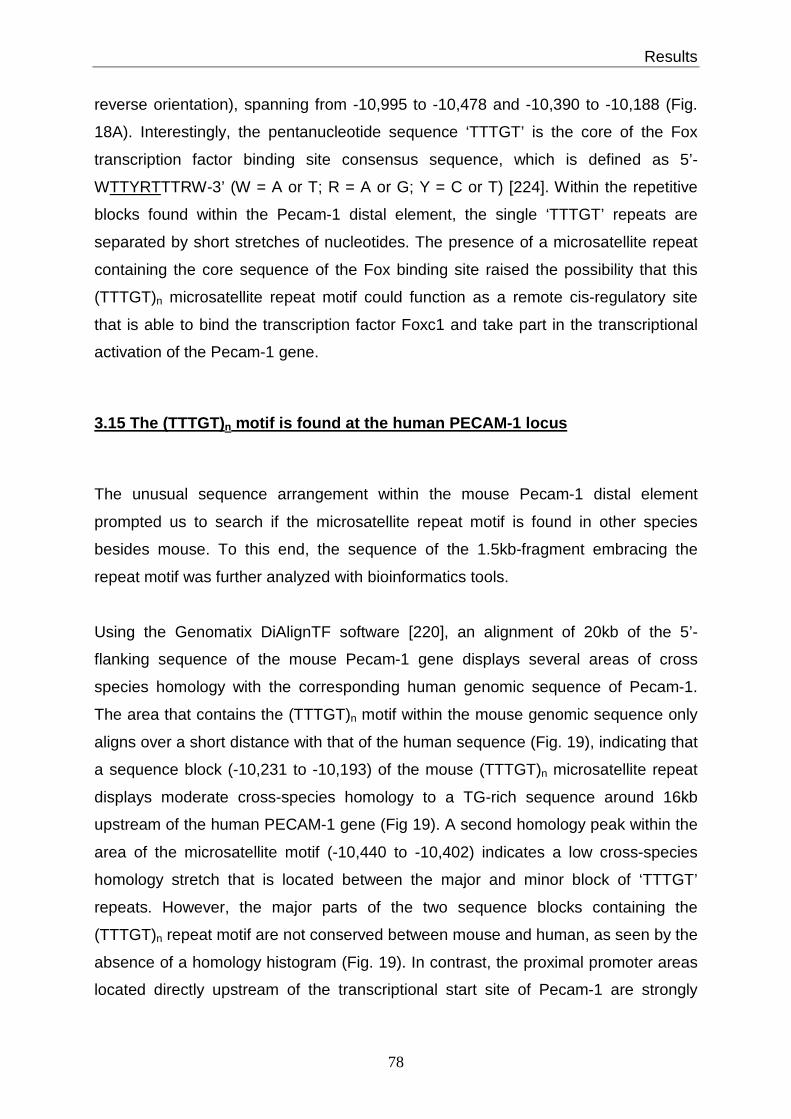
Results
78
reverse orientation), spanning from -10,995 to -10,478 and -10,390 to -10,188 (Fig.
18A). Interestingly, the pentanucleotide sequence ‘TTTGT’ is the core of the Fox
transcription factor binding site consensus sequence, which is defined as 5’-
WTTYRTTTRW-3’ (W = A or T; R = A or G; Y = C or T) [224]. Within the repetitive
blocks found within the Pecam-1 distal element, the single ‘TTTGT’ repeats are
separated by short stretches of nucleotides. The presence of a microsatellite repeat
containing the core sequence of the Fox binding site raised the possibility that this
(TTTGT)n microsatellite repeat motif could function as a remote cis-regulatory site
that is able to bind the transcription factor Foxc1 and take part in the transcriptional
activation of the Pecam-1 gene.
3.15 The (TTTGT)n motif is found at the human PECAM-1 locus
The unusual sequence arrangement within the mouse Pecam-1 distal element
prompted us to search if the microsatellite repeat motif is found in other species
besides mouse. To this end, the sequence of the 1.5kb-fragment embracing the
repeat motif was further analyzed with bioinformatics tools.
Using the Genomatix DiAlignTF software [220], an alignment of 20kb of the 5’-
flanking sequence of the mouse Pecam-1 gene displays several areas of cross
species homology with the corresponding human genomic sequence of Pecam-1.
The area that contains the (TTTGT)n motif within the mouse genomic sequence only
aligns over a short distance with that of the human sequence (Fig. 19), indicating that
a sequence block (-10,231 to -10,193) of the mouse (TTTGT)n microsatellite repeat
displays moderate cross-species homology to a TG-rich sequence around 16kb
upstream of the human PECAM-1 gene (Fig 19). A second homology peak within the
area of the microsatellite motif (-10,440 to -10,402) indicates a low cross-species
homology stretch that is located between the major and minor block of ‘TTTGT’
repeats. However, the major parts of the two sequence blocks containing the
(TTTGT)n repeat motif are not conserved between mouse and human, as seen by the
absence of a homology histogram (Fig. 19). In contrast, the proximal promoter areas
located directly upstream of the transcriptional start site of Pecam-1 are strongly
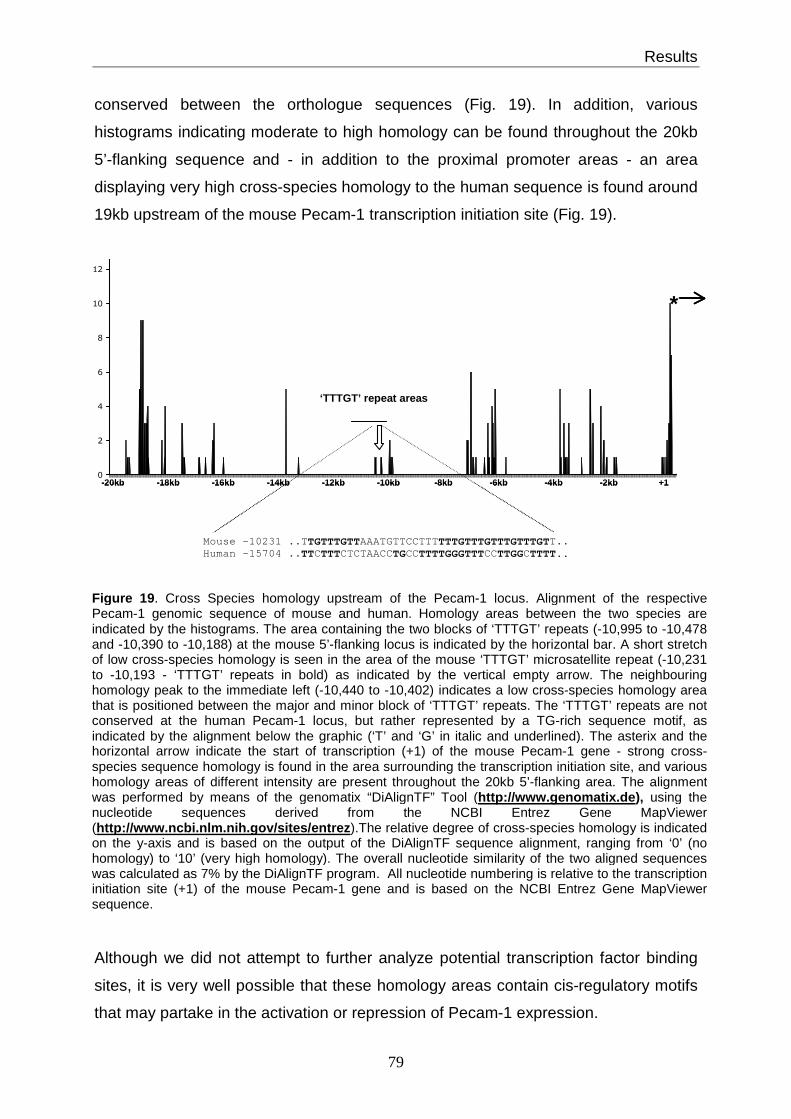
Results
79
conserved between the orthologue sequences (Fig. 19). In addition, various
histograms indicating moderate to high homology can be found throughout the 20kb
5’-flanking sequence and - in addition to the proximal promoter areas - an area
displaying very high cross-species homology to the human sequence is found around
19kb upstream of the mouse Pecam-1 transcription initiation site (Fig. 19).
Although we did not attempt to further analyze potential transcription factor binding
sites, it is very well possible that these homology areas contain cis-regulatory motifs
that may partake in the activation or repression of Pecam-1 expression.
0
2
4
6
8
10
12
‘TTTGT’ repeat areas
-20kb -18kb -16kb -14kb -12kb -8kb -4kb-6kb -2kb +1-10kb
*
Mouse –10231 .. TTGTTTGTTAAATGTTCCTTTTTTGTTTGTTTGTTTGTT.. Human –15704 .. TTCTTTCTCTAACCTGCCTTTTGGGTTTCCTTGGCTTTT..
0
2
4
6
8
10
12
‘TTTGT’ repeat areas
-20kb -18kb -16kb -14kb -12kb -8kb -4kb-6kb -2kb +1-10kb
*
Mouse –10231 .. TTGTTTGTTAAATGTTCCTTTTTTGTTTGTTTGTTTGTT.. Human –15704 .. TTCTTTCTCTAACCTGCCTTTTGGGTTTCCTTGGCTTTT..
Figure 19 . Cross Species homology upstream of the Pecam-1 locus. Alignment of the respective Pecam-1 genomic sequence of mouse and human. Homology areas between the two species are indicated by the histograms. The area containing the two blocks of ‘TTTGT’ repeats (-10,995 to -10,478 and -10,390 to -10,188) at the mouse 5’-flanking locus is indicated by the horizontal bar. A short stretch of low cross-species homology is seen in the area of the mouse ‘TTTGT’ microsatellite repeat (-10,231 to -10,193 - ‘TTTGT’ repeats in bold) as indicated by the vertical empty arrow. The neighbouring homology peak to the immediate left (-10,440 to -10,402) indicates a low cross-species homology area that is positioned between the major and minor block of ‘TTTGT’ repeats. The ‘TTTGT’ repeats are not conserved at the human Pecam-1 locus, but rather represented by a TG-rich sequence motif, as indicated by the alignment below the graphic (‘T’ and ‘G’ in italic and underlined). The asterix and the horizontal arrow indicate the start of transcription (+1) of the mouse Pecam-1 gene - strong cross-species sequence homology is found in the area surrounding the transcription initiation site, and various homology areas of different intensity are present throughout the 20kb 5’-flanking area. The alignment was performed by means of the genomatix “DiAlignTF” Tool (http://www.genomatix.de), using the nucleotide sequences derived from the NCBI Entrez Gene MapViewer (http://www.ncbi.nlm.nih.gov/sites/entrez).The relative degree of cross-species homology is indicated on the y-axis and is based on the output of the DiAlignTF sequence alignment, ranging from ‘0’ (no homology) to ‘10’ (very high homology). The overall nucleotide similarity of the two aligned sequences was calculated as 7% by the DiAlignTF program. All nucleotide numbering is relative to the transcription initiation site (+1) of the mouse Pecam-1 gene and is based on the NCBI Entrez Gene MapViewer sequence.
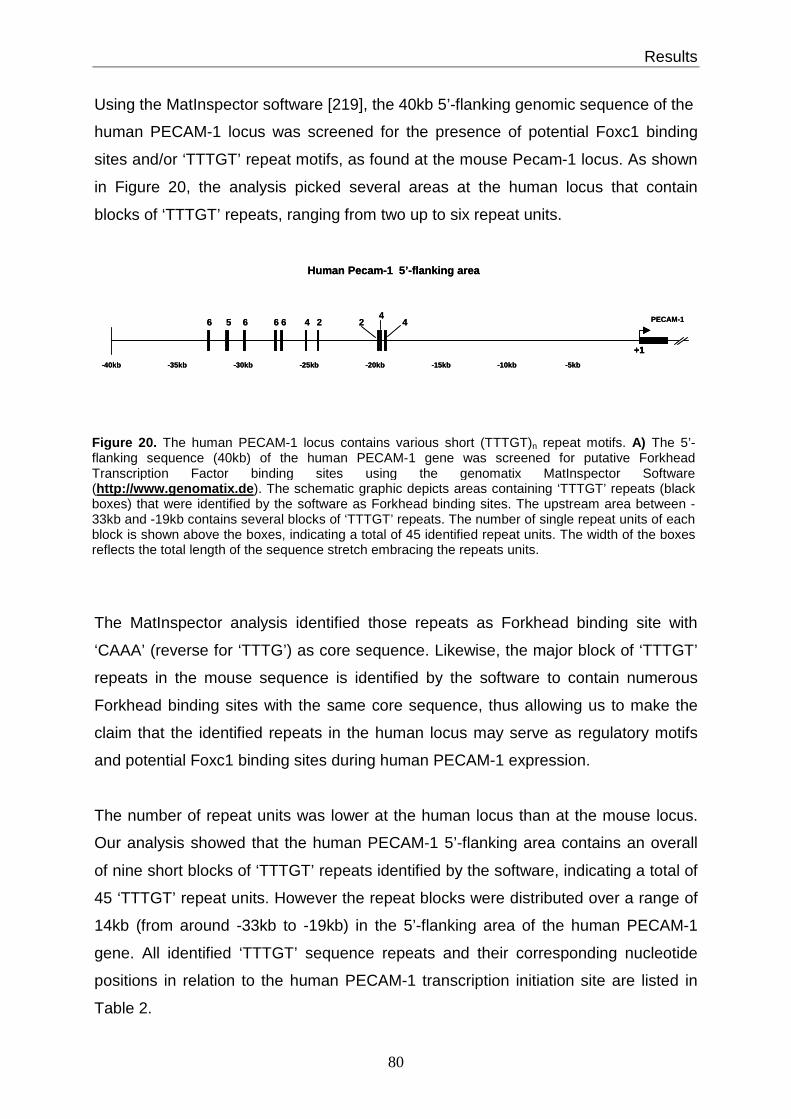
Results
80
Using the MatInspector software [219], the 40kb 5’-flanking genomic sequence of the
human PECAM-1 locus was screened for the presence of potential Foxc1 binding
sites and/or ‘TTTGT’ repeat motifs, as found at the mouse Pecam-1 locus. As shown
in Figure 20, the analysis picked several areas at the human locus that contain
blocks of ‘TTTGT’ repeats, ranging from two up to six repeat units.
The MatInspector analysis identified those repeats as Forkhead binding site with
‘CAAA’ (reverse for ‘TTTG’) as core sequence. Likewise, the major block of ‘TTTGT’
repeats in the mouse sequence is identified by the software to contain numerous
Forkhead binding sites with the same core sequence, thus allowing us to make the
claim that the identified repeats in the human locus may serve as regulatory motifs
and potential Foxc1 binding sites during human PECAM-1 expression.
The number of repeat units was lower at the human locus than at the mouse locus.
Our analysis showed that the human PECAM-1 5’-flanking area contains an overall
of nine short blocks of ‘TTTGT’ repeats identified by the software, indicating a total of
45 ‘TTTGT’ repeat units. However the repeat blocks were distributed over a range of
14kb (from around -33kb to -19kb) in the 5’-flanking area of the human PECAM-1
gene. All identified ‘TTTGT’ sequence repeats and their corresponding nucleotide
positions in relation to the human PECAM-1 transcription initiation site are listed in
Table 2.
+1
-35kb -30kb -25kb -20kb -15kb -10kb -5kb-40kb
Human Pecam-1 5’-flanking area
6 5 6 6 6 44
42 PECAM-12
+1+1
-35kb -30kb -25kb -20kb -15kb -10kb -5kb-40kb
Human Pecam-1 5’-flanking area
6 5 6 6 6 44
42 PECAM-12
Figure 20. The human PECAM-1 locus contains various short (TTTGT)n repeat motifs. A) The 5’-flanking sequence (40kb) of the human PECAM-1 gene was screened for putative Forkhead Transcription Factor binding sites using the genomatix MatInspector Software (http://www.genomatix.de). The schematic graphic depicts areas containing ‘TTTGT’ repeats (black boxes) that were identified by the software as Forkhead binding sites. The upstream area between -33kb and -19kb contains several blocks of ‘TTTGT’ repeats. The number of single repeat units of each block is shown above the boxes, indicating a total of 45 identified repeat units. The width of the boxes reflects the total length of the sequence stretch embracing the repeats units.

Results
81
To further verify the possibility that the (TTTGT)n repeat motifs serve as putative cis-
regulatory sites at the human PECAM-1 locus, an experimentally verified Foxc1
binding site at the mouse Tbx1 locus that was shown to be involved as cis-regulatory
element in the expression of Tbx1 [195], was identified by the MatInspector software
as Forkhead binding site with ‘CAAA’ as core binding site (data not shown), as seen
for the (TTTGT)n repeat motifs at the mouse and human Pecam-1 locus. This
strengthened our assumption that, like in the mouse, transcriptional control of the
human PECAM-1 gene may involve the randomly distributed (TTTGT)n repeat motifs
(Fig. 20).
3.16 Deletion of the repeat motif abolishes promote r activity
To test the notion that the (TTTGT)n repeat motif has cis-acting regulatory activity,
the 1.5kb-fragment (pGL2-5’1.5kb/mp) containing the microsatellite sequence was
deleted stepwise from the 5’-end using site-directed PCR mutagenesis, as described
in Material and Methods. Figure 21 summarizes the obtained data, showing that a
decrease in reporter gene activity correlated with a stepwise deletion of the (TTTGT)n
repeats. A deletion of 612bp (-11,495 to -10,884) from the 1.5kb fragment
encompassing 10 ‘TTTGT’ repeats (promoter plasmid pGL2-5’1.5kbD2/mp) or 755bp
(-11,495 to -10,741) with 28 ‘TTTGT’ repeats (promoter plasmid pGL2-
Repeat Units Position
6 -32,941
5 -31,569
6 -30,221
6 27,885
6 -27,372
4 -25,541
2 -24,720
2 -20,005
4 -19,884
4 -19,435
Table 2 . Listing of ‘TTTGT’ repeats in the distal 5’-flanking area of the human PECAM-1 gene. The left column shows the number of single repeat units; right column indicates the first nucleotide position of each repeat motif.
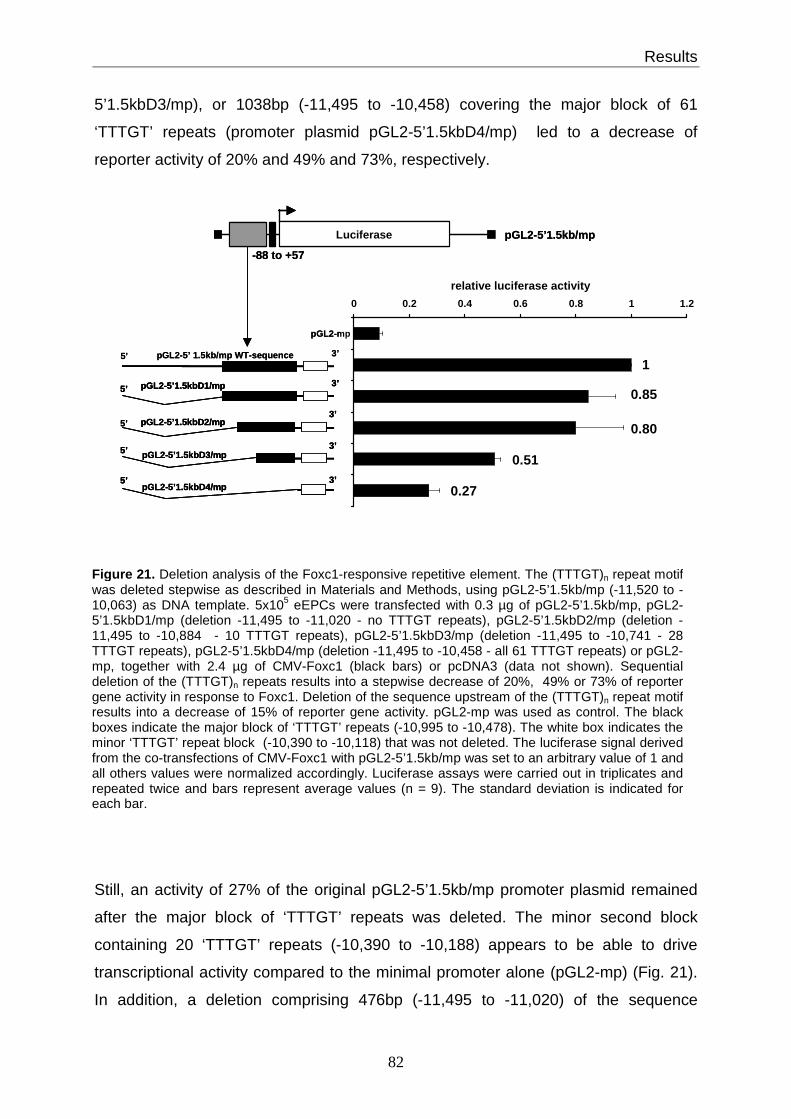
Results
82
5’1.5kbD3/mp), or 1038bp (-11,495 to -10,458) covering the major block of 61
‘TTTGT’ repeats (promoter plasmid pGL2-5’1.5kbD4/mp) led to a decrease of
reporter activity of 20% and 49% and 73%, respectively.
Still, an activity of 27% of the original pGL2-5’1.5kb/mp promoter plasmid remained
after the major block of ‘TTTGT’ repeats was deleted. The minor second block
containing 20 ‘TTTGT’ repeats (-10,390 to -10,188) appears to be able to drive
transcriptional activity compared to the minimal promoter alone (pGL2-mp) (Fig. 21).
In addition, a deletion comprising 476bp (-11,495 to -11,020) of the sequence
5’
pGL2-5’1.5kbD4/mp5’ 3’
5’3’
pGL2-5’1.5kbD2/mp
5’ pGL2-5’1.5kbD3/mp3’
5’3’pGL2-5’1.5kbD1/mp
0 0.2 0.4 0.6 0.8 1 1.2
relative luciferase activity
pGL2-5’ 1.5kb/mp WT-sequence 3’
Luciferase
-88 to +57
pGL2-5’1.5kb/mp
1
0.85
0.51
0.27
pGL2-mp
0.80
5’
pGL2-5’1.5kbD4/mp5’ 3’
pGL2-5’1.5kbD4/mp5’ 3’
5’3’
pGL2-5’1.5kbD2/mp3’
pGL2-5’1.5kbD2/mp
5’ pGL2-5’1.5kbD3/mp3’5’ pGL2-5’1.5kbD3/mp3’
5’3’pGL2-5’1.5kbD1/mp5’3’pGL2-5’1.5kbD1/mp
0 0.2 0.4 0.6 0.8 1 1.2
relative luciferase activity
pGL2-5’ 1.5kb/mp WT-sequence 3’
Luciferase
-88 to +57
pGL2-5’1.5kb/mp
1
0.85
0.51
0.27
pGL2-mp
0.80
Figure 21. Deletion analysis of the Foxc1-responsive repetitive element. The (TTTGT)n repeat motif was deleted stepwise as described in Materials and Methods, using pGL2-5’1.5kb/mp (-11,520 to -10,063) as DNA template. 5x10⁵ eEPCs were transfected with 0.3 µg of pGL2-5’1.5kb/mp, pGL2-5’1.5kbD1/mp (deletion -11,495 to -11,020 - no TTTGT repeats), pGL2-5’1.5kbD2/mp (deletion -11,495 to -10,884 - 10 TTTGT repeats), pGL2-5’1.5kbD3/mp (deletion -11,495 to -10,741 - 28 TTTGT repeats), pGL2-5’1.5kbD4/mp (deletion -11,495 to -10,458 - all 61 TTTGT repeats) or pGL2-mp, together with 2.4 µg of CMV-Foxc1 (black bars) or pcDNA3 (data not shown). Sequential deletion of the (TTTGT)n repeats results into a stepwise decrease of 20%, 49% or 73% of reporter gene activity in response to Foxc1. Deletion of the sequence upstream of the (TTTGT)n repeat motif results into a decrease of 15% of reporter gene activity. pGL2-mp was used as control. The black boxes indicate the major block of ‘TTTGT’ repeats (-10,995 to -10,478). The white box indicates the minor ‘TTTGT’ repeat block (-10,390 to -10,118) that was not deleted. The luciferase signal derived from the co-transfections of CMV-Foxc1 with pGL2-5’1.5kb/mp was set to an arbitrary value of 1 and all others values were normalized accordingly. Luciferase assays were carried out in triplicates and repeated twice and bars represent average values (n = 9). The standard deviation is indicated for each bar.

Results
83
upstream of the (TTTGT)n repeat motif (promoter plasmid pGL2-5’1.5kbD1/mp) leads
to a decrease of 15% of the luciferase activity, possibly caused by the removal of
positive regulatory elements in that area which may respond to eEPC-nuclear
protein. In brief, the data show that the (TTTGT)n repeat motif is responsible of
driving reporter gene transcription in response to Foxc1 expression and has cis-
acting regulatory activity.
3.17 Foxc1 binds the (TTTGT) n motif on native chromatin
In the previous experiments, Foxc1 protein was shown to bind the (TTTGT)n repeat
motif on a promoter plasmid in vitro. To examine if this interaction can take place in
vivo, the binding of Foxc1 protein at the chromosomal Pecam-1 locus was analyzed
using chromatin immunoprecipitation (ChIP) analysis. As shown in Figure 22, PCR
primers were used to amplify a 599bp fragment (-11,039 to -10,441) that contains the
major block of the 61 ‘TTTGT’ repeats (-10,995 to -10,478) in the distal 5’-flanking
area of mouse Pecam-1 (Fig. 22A). The primers amplified sonicated eEPC chromatin
that was precipitated with an anti-Foxc1 goat polyclonal antibody (Fig. 22B), but no
amplification took place on chromatin precipitated with a goat Isotype IgG control
antibody. The Input DNA sample (sonicated total eEPC chromatin) showed a positive
control signal, whereas the PCR reaction with no template chromatin (H2O) was
negative and proved the specificity of the PCR reaction. In addition, eEPC chromatin
was amplified with a primer pair that spans a 171bp sequence upstream of the
repeat motif (-13,021 to -12,851) and served as negative non-binding control site for
Foxc1 in the distal 5’-flanking area of Pecam-1. No amplification of anti-Foxc1 goat
polyclonal antibody-precipitated chromatin was seen in the PCR with these primers
(Fig. 22B).
In addition, goat Isotype IgG antibody-precipitated chromatin and Input DNA showed
no PCR signal and a positive signal, respectively. Finally, control PCR (no template
chromatin) did not yield a PCR product, indicating the specificity of the observed
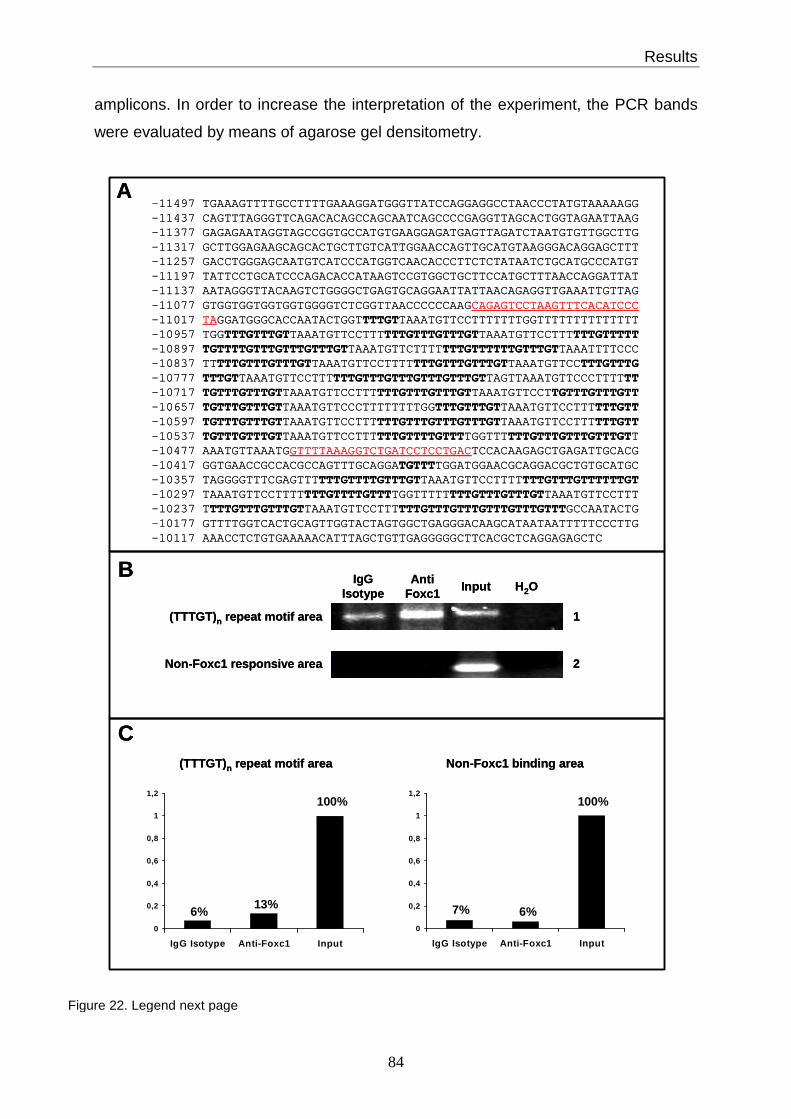
Results
84
amplicons. In order to increase the interpretation of the experiment, the PCR bands
were evaluated by means of agarose gel densitometry.
Figure 22. Legend next page
(TTTGT)n repeat motif area
Non-Foxc1 responsive area
-11497 TGAAAGTTTTGCCTTTTGAAAGGATGGGTTATCCAGGAGGCCTAACCCTATGTAAAAAGG-11437 CAGTTTAGGGTTCAGACACAGCCAGCAATCAGCCCCGAGGTTAGCACTGGTAGAATTAAG-11377 GAGAGAATAGGTAGCCGGTGCCATGTGAAGGAGATGAGTTAGATCTAATGTGTTGGCTTG-11317 GCTTGGAGAAGCAGCACTGCTTGTCATTGGAACCAGTTGCATGTAAGGGACAGGAGCTTT-11257 GACCTGGGAGCAATGTCATCCCATGGTCAACACCCTTCTCTATAATCTGCATGCCCATGT-11197 TATTCCTGCATCCCAGACACCATAAGTCCGTGGCTGCTTCCATGCTTTAACCAGGATTAT-11137 AATAGGGTTACAAGTCTGGGGCTGAGTGCAGGAATTATTAACAGAGGTTGAAATTGTTAG-11077 GTGGTGGTGGTGGTGGGGTCTCGGTTAACCCCCCAAGCAGAGTCCTAAGTTTCACATCCC-11017 TAGGATGGGCACCAATACTGGTTTTGTTAAATGTTCCTTTTTTTGGTTTTTTTTTTTTTT-10957 TGG TTTGTTTGTTAAATGTTCCTTTTTTGTTTGTTTGTTAAATGTTCCTTTTTTGTTTTT-10897 TGTTTTGTTTGTTTGTTTGTTAAATGTTCTTTTTTTGTTTTTTGTTTGTTAAATTTTCCC-10837 TT TTTGTTTGTTTGTTAAATGTTCCTTTTTTTGTTTGTTTGTTAAATGTTCCTTTGTTTG-10777 TTTGTTAAATGTTCCTTTTTTGTTTGTTTGTTTGTTTGTTAGTTAAATGTTCCCTTTTTT-10717 TGTTTGTTTGTTAAATGTTCCTTTTTTGTTTGTTTGTTAAATGTTCCTTGTTTGTTTGTT-10657 TGTTTGTTTGTTAAATGTTCCCTTTTTTTTGGTTTGTTTGTTAAATGTTCCTTTTTTGTT-10597 TGTTTGTTTGTTAAATGTTCCTTTTTTGTTTGTTTGTTTGTTAAATGTTCCTTTTTTGTT-10537 TGTTTGTTTGTTAAATGTTCCTTTTTTGTTTTGTTTTGGTTTTTTGTTTGTTTGTTTGTT-10477 AAATGTTAAATGGTTTTAAAGGTCTGATCCTCCTGACTCCACAAGAGCTGAGATTGCACG-10417 GGTGAACCGCCACGCCAGTTTGCAGGATGTTTTGGATGGAACGCAGGACGCTGTGCATGC-10357 TAGGGGTTTCGAGTTTTTTGTTTTGTTTGTTAAATGTTCCTTTTTTTGTTTGTTTTTTGT-10297 TAAATGTTCCTTTTTTTGTTTTGTTTTGGTTTTTTTTGTTTGTTTGTTAAATGTTCCTTT-10237 T TTTGTTTGTTTGTTAAATGTTCCTTTTTTGTTTGTTTGTTTGTTTGTTTGCCAATACTG-10177 GTTTTGGTCACTGCAGTTGGTACTAGTGGCTGAGGGACAAGCATAATAATTTTTCCCTTG-10117 AAACCTCTGTGAAAAACATTTAGCTGTTGAGGGGGCTTCACGCTCAGGAGAGCTC
A
IgG Isotype
Anti Foxc1
Input H 2O
1
2
B
0
0,2
0,4
0,6
0,8
1
1,2
IgG Isotype Anti-Foxc1 Input
0
0,2
0,4
0,6
0,8
1
1,2
IgG Isotype Anti-Foxc1 Input
(TTTGT)n repeat motif area Non-Foxc1 binding area
100% 100%
6%6% 7%13%
C
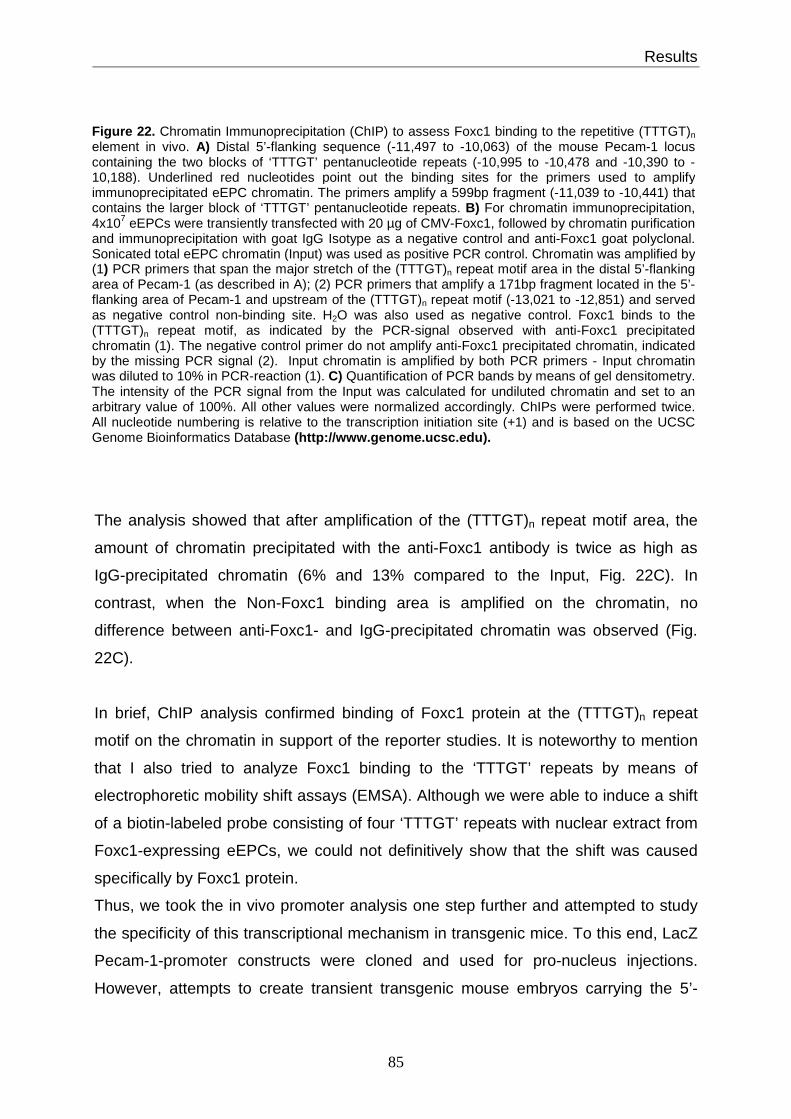
Results
85
The analysis showed that after amplification of the (TTTGT)n repeat motif area, the
amount of chromatin precipitated with the anti-Foxc1 antibody is twice as high as
IgG-precipitated chromatin (6% and 13% compared to the Input, Fig. 22C). In
contrast, when the Non-Foxc1 binding area is amplified on the chromatin, no
difference between anti-Foxc1- and IgG-precipitated chromatin was observed (Fig.
22C).
In brief, ChIP analysis confirmed binding of Foxc1 protein at the (TTTGT)n repeat
motif on the chromatin in support of the reporter studies. It is noteworthy to mention
that I also tried to analyze Foxc1 binding to the ‘TTTGT’ repeats by means of
electrophoretic mobility shift assays (EMSA). Although we were able to induce a shift
of a biotin-labeled probe consisting of four ‘TTTGT’ repeats with nuclear extract from
Foxc1-expressing eEPCs, we could not definitively show that the shift was caused
specifically by Foxc1 protein.
Thus, we took the in vivo promoter analysis one step further and attempted to study
the specificity of this transcriptional mechanism in transgenic mice. To this end, LacZ
Pecam-1-promoter constructs were cloned and used for pro-nucleus injections.
However, attempts to create transient transgenic mouse embryos carrying the 5’-
Figure 22. Chromatin Immunoprecipitation (ChIP) to assess Foxc1 binding to the repetitive (TTTGT)n
element in vivo. A) Distal 5’-flanking sequence (-11,497 to -10,063) of the mouse Pecam-1 locus containing the two blocks of ‘TTTGT’ pentanucleotide repeats (-10,995 to -10,478 and -10,390 to -10,188). Underlined red nucleotides point out the binding sites for the primers used to amplify immunoprecipitated eEPC chromatin. The primers amplify a 599bp fragment (-11,039 to -10,441) that contains the larger block of ‘TTTGT’ pentanucleotide repeats. B) For chromatin immunoprecipitation, 4x10⁷ eEPCs were transiently transfected with 20 µg of CMV-Foxc1, followed by chromatin purification and immunoprecipitation with goat IgG Isotype as a negative control and anti-Foxc1 goat polyclonal. Sonicated total eEPC chromatin (Input) was used as positive PCR control. Chromatin was amplified by (1) PCR primers that span the major stretch of the (TTTGT)n repeat motif area in the distal 5’-flanking area of Pecam-1 (as described in A); (2) PCR primers that amplify a 171bp fragment located in the 5’-flanking area of Pecam-1 and upstream of the (TTTGT)n repeat motif (-13,021 to -12,851) and served as negative control non-binding site. H2O was also used as negative control. Foxc1 binds to the (TTTGT)n repeat motif, as indicated by the PCR-signal observed with anti-Foxc1 precipitated chromatin (1). The negative control primer do not amplify anti-Foxc1 precipitated chromatin, indicated by the missing PCR signal (2). Input chromatin is amplified by both PCR primers - Input chromatin was diluted to 10% in PCR-reaction (1). C) Quantification of PCR bands by means of gel densitometry. The intensity of the PCR signal from the Input was calculated for undiluted chromatin and set to an arbitrary value of 100%. All other values were normalized accordingly. ChIPs were performed twice. All nucleotide numbering is relative to the transcription initiation site (+1) and is based on the UCSC Genome Bioinformatics Database (http://www.genome.ucsc.edu).

Results
86
flanking 1.5kb fragment (-11,520 to -10,063) in combination with the minimal
promoter (-88 to +57) cloned in front of the LacZ reporter gene were not successful,
thus not allowing further conclusions about the specificity and activity of the Pecam-1
distal element transcriptional mechanism.
3.18 Results – Summary
The data presented in this Ph.D. project have identified Pecam-1 as a direct target of
Foxc1 in embryonic endothelial progenitor cells. Promoter deletion analysis identified
a fragment around 11kb upstream of the transcription initiation site that contains a
Foxc1 responsive element. Sequence analysis identified a microsatellite sequence
consisting of a (TTTGT)n pentanucleotide repeat motif that is arranged in two
neighboring blocks. A stepwise deletion of this repeat motif causes a stepwise
decrease in the ability of Foxc1 to drive reporter gene expression. Bioinformatics
analysis revealed that this microsatellite sequence is also found randomly distributed
in short blocks in the distal 5’-flanking area of the human PECAM-1 gene. In
accordance with the promoter activity assays, ChIP analysis showed that Foxc1
transcription factor binds to the (TTTGT)n repeat motif upstream of mouse Pecam-1
on the chromosome in vivo. It is noteworthy that this molecular interaction was not
observed in mature endothelial lines, such as mouse pancreatic and cardiac ECs, as
well as bovine aortic ECs, nor in undifferentiated ES cells and Cos7 kidney cells,
suggesting a specific role in the early stages of endothelial cell differentiation.
Discussion
87
4. DISCUSSION
Vascular development is a highly organized sequence of events requiring the spatial
and temporal expression of specific genes. Endothelial differentiation from pluripotent
stem cells through committed endothelial progenitors is one of the initial steps during
blood vessel formation. Thereby, the expression of endothelial specific marker genes
such as Pecam-1 and VE-cadherin is associated with the differentiation process
toward the endothelial lineage. In addition, recruitment and incorporation of EPCs at
sites of adult neo-vascularization takes place as a multi-step process consisting of
attraction, adherence, transendothelial migration and eventually differentiation.
In the last years, the identification of genomic regulatory sites of vascular specific
genes has progressed the understanding about the transcriptional mechanisms
required for vascular specific gene expression, although the mechanisms governing
the transition from endothelial progenitor cells to endothelial cells are not well
understood. In order to identify new molecular players during endothelial gene
expression and differentiation, this Ph.D. thesis took advantage of embryonic EPC
lines to study the involvement of the Forkhead transcription factor Foxc1 in the EPC-
differentiation process. The characterization of a Foxc1 binding site embedded
within a ‘TTTGT’ pentanucelotide microsatellite motif that drives endothelial-specific
transcription of the Pecam-1 gene preferentially in eEPCs is described herein and
discussed below.
4.1 Pecam-1 basal promoter activity reflects endogenous transc ript levels
Pecam-1 promoter activity was driven by a 4.5kb-intronic fragment combined with the
minimal promoter in mature aortic ECs, as well as at lower levels in pancreatic
endothelial cells (MS1-ECs) and ES cells (Fig. 9A). Vascular-specific genes such as
Flk-1 and Tie2 were shown to require an intronic enhancer for their endothelial-
directed expression [87, 225], and Pecam-1 may represent another example for this
type of endothelial-specific gene expression regulation. The strong transcriptional
activity of the 4.5kb intronic fragment is consistent with the high endogenous
Pecam-1 expression levels in BAECs, MS1-ECs and ES cells, whereas expression is
Discussion
88
not seen in kidney cells and immature eEPCs, paralleled by a lack of activity of all
four promoter plasmids (Fig. 9A,B). Further, reporter gene expression and
endogenous Pecam-1 activity are in accordance with Pecam-1 expression being
restricted primarily to the vascular endothelium and certain types of blood cells in
adult life, whereas it is not expressed on the surface of epithelial cells, muscle cells,
and fibroblasts, as well as other non-vascular cell lineages [62].
ES cells, which are derived from the inner cell mass of day 3.5 mouse embryos [222]
express Pecam-1 and, in addition to the intronic 4.5kb fragment, the long proximal
promoter areas also drove reporter gene activity (Fig. 9A). Since pluripotent ES cells
and terminally differentiated endothelial lineages represent different developmental
stages, it is not unexpected that they may use different combinations of gene
regulatory elements to drive stage-specific expression of Pecam-1. Overall, it is
possible that the proximal promoter sequences and also the distal 5’-flanking 3.5kb-
fragment are capable to drive expression during eEPC differentiation, but the strong
cis-active elements that regulate transcription in mature endothelium are located
within the intronic 4.5kb-fragemnt.
4.2 Foxc1 induced Pecam-1 expression reflects an eEPC-specific mechanism
Transcriptional activation through the genomic 5’-3.5kb element might represent a
stage-specific mechanism through a remote regulatory site in embryonic EPCs where
Foxc1 is required to activate de novo Pecam-1 expression. Consistent with this
proposition, alterations in endogenous Pecam-1 transcript levels in response to
Foxc1 gain-of-function are only seen in eEPCs, but not in aortic, pancreatic and
cardiac ECs, as well as undifferentiated ES cells (Fig. 13). It is also in agreement with
the lack of significant Foxc1 expression in these cell types.
In general, gene expression is regulated by genomic sites that are located in close
proximity of the transcription initiation site (TIS) of a gene, such as cis-active
elements in the core promoter region. In addition, gene expression is also controlled
by enhancer/silencer elements, which can be located within introns and upstream or
downstream of the transcript and at great distances of up to one megabase from the
TIS [226, 227]. It is possible that Foxc1 transcription factor plays a more significant
Discussion
89
role activating gene transcription through enhancer regulatory sequences rather than
being bound by regulatory elements within the core promoter of a target gene.
Support of this suggestion comes from recent publications that identified Foxc1
binding sites at remote DNA loci upstream of the T-box transcription factor Tbx1 or
the Notch-ligand Delta-like 4 (Dll4) gene [181, 195].
In general, genes are expressed in different tissues or during distinct stages of
development. In addition, gene expression can be activated in response to various
external stimuli under normal or pathophysiological conditions. Extensive studies of
how gene expression is regulated have established the model that the combined
activity of multiple regulatory sites controls gene expression in a temporal and spatial
manner [228, 229]. The identified Foxc1 binding site might represent such a tissue-
and time-specific regulatory element that allows Pecam-1 induction in early
embryonic angioblasts (eEPCs). This would indicate an analogous situation as with
the transcriptional control of Tbx1 through Foxc1 and Foxc2, which exclusively drive
its expression in the head mesenchyme and the pharyngeal endoderm of the embryo
[195].
Moreover, cellular heterogeneity is an important factor of endothelial function. The
vasculature has to adopt organ and tissue-specific characteristics, since every organ
shares a specific interaction with the blood vessel system to meet its local
requirements [14]. The phenotypic endothelial heterogeneity is mediated in part by
temporal and spatial differences in gene expression and regulation [4], and also
depends on the vascular bed the cells originate from. For example, lung, kidney and
brain ECs were shown to have specific patterns of cell surface proteins [230, 231].
This molecular diversity is also regulated at the transcriptional level through tissue-
specific regulatory elements [4].
4.3 Pecam-1 expression is controlled by multiple factors
Past studies showed that specific elements of the human PECAM-1 promoter are
capable to drive cell-line specific transcription of a reporter gene in vitro. For
instance, a 1.3kb proximal 5’-flanking sequence of the human PECAM-1 gene is
lacking consensus TATA or CAAT binding elements, but contains multiple consensus
Discussion
90
binding sites for different trans-acting factors, such as 2 NF-κB-sites, 4 Ets-sites, 3
Sp1-sites, 2 E-box-domains, 2 tandem GATA-associated sites, 4 GATA elements
and 3 shear-stress responsive elements (SSRE) [94]. In addition, two retinoic-acid
responsive elements are located in the core promoter and might be involved during
transcriptional regulation. In vitro studies showed that NF-kB is involved in regulating
PECAM-1 expression in human myeloid cells, such as human promonocytic U937
cells and macrophages. TNFα elevated human PECAM-1 promoter activity by 2.5-
fold, and NF-κB was shown to function as downstream activator of this process in
promonocytic cells. [232]. In turn, the transcription factor GATA-2 binds to a cis-
acting GATA element at position -24 in the human PECAM-1 promoter and drives
optimal lineage specific expression in the megakoryocitic lines HEL and Dami [94].
Although activity of this core promoter element was described in megakaryocytes, it
remained elusive if the same cis-regulatory elements are capable to drive human
PECAM-1 expression in endothelial cells and cells of the myeloid precursor lineage.
Regardless, the studies showed that different transcription factors are responsible for
Pecam-1 expression in different lineages, showing that the tight restriction of
Pecam-1 gene expression to endothelial cells and certain leukocytes is most likely
regulated on multiple levels and depends on the action of a multitude of trans-acting
regulatory factors. This notion is further supported by transgenic mouse studies,
which showed that the majority of endothelial-specific gene promoter constructs
direct transcription of reporter genes to endothelial subpopulations in specific
vascular beds. For example, short pieces of the promoter of vWF or Tie2 only have
the capacity to drive reporter gene expression in limited endothelial subpopulations
[233, 234], whereas longer fragments of the 5’-or 3’-flanking loci extend the
expression patterns to wider areas of the vascular tree [225, 235]. In that respect, the
distal 5’-flanking Foxc1 binding site could be required to regulate de novo Pecam-1
expression in angioblasts during vasculogenesis.
4.4 Expression of Pecam-1 in isolated embryonic angioblasts requires a
specific upstream regulatory element
Depending on the cell type, Pecam-1 is expressed constitutively – as in mature
Discussion
91
endothelial cells - or requires the presence of special signals for inducible
expression, as in monocytes, where Pecam-1 expression is regulated during the
maturation and differentiation to macrophages [236-238]. During PECAM-1 activation
in human myeloid cells, specific transcription factors, e.g. NF-κB in this case, account
for its directed expression within the promonocytic lineage. This inducible expression
most likely has a different type of molecular regulation than the constitutive
expression found in mature endothelial cells [232]. In accordance, eEPCs may
require the controlled activity of trans-acting factors such as Foxc1 to initiate
Pecam-1 expression transiently in eEPCs during the transition from an
undifferentiated to a differentiated cell stage, but this type of regulation is no longer
required in mature endothelium of blood vessels. In mature endothelial cells
constitutive Pecam-1 expression appears to be driven by Foxc1-independent
mechanisms (Fig. 12 and Fig. 13), involving cis-regulatory elements that are located
within the minimal promoter and in the 4.5kb intronic enhancer (Fig. 9A) that do not
require bound Foxc1 protein for their activity. However, since mature endothelial lines
– mouse and bovine alike - used in this project had Pecam-1 expression driven
through the intronic 4.5kb-fragment element, it is reasonable to speculate that human
endothelial cells, such as human umbilical vein endothelial cells (HUVECs) would
regulate PECAM-1 expression by the same active promoter elements as mouse and
bovine lines. Nevertheless, it appears that Foxc1 might have an opposite role in
mature endothelial cells since down-regulation of both endogenous Pecam-1
expression, as well as reporter gene expression through Pecam-1 promoter
constructs, was observed after Foxc1 expression.
In addition, Pecam-1 expression is insulin regulated [239] and Foxc2 has been
implicated in insulin regulated PAI-1 expression [240]. Thus, it will be interestingly to
test if FoxC genes are regulating Pecam-1 levels in hyperglycemia.
To address these issues, we attempted to knock-down endogenous FOXC1
expression in HUVECs by the means of sequence-specific siRNA molecules but
without succes, likely because of the poor transfection efficiency of HUVECs cells,
thus not allowing to assess a possible role of FOXC1 at the human PECAM-1
promoter. Likewise, our attempts to knock-down Foxc1 expression during eEPC-
differentiation by means of siRNA were not realized, thus not allowing to observe a
Discussion
92
direct effect of lacking endogenous Foxc1 activity on Pecam-1 activation in
differentiated eEPCs. Alternative future approaches using viral vectors and shRNA
(small-hairpin RNA) could overcome this problem and allow us to draw conclusions
about this particular transcriptional mechanism.
4.5 Loss of Foxc1 does not affect pan-endothelial Pecam-1 expression
A stage and/or temporal specific function of Foxc1 at the Pecam-1 locus or a role
under pathological conditions such as diabetes, might also explain why the
vasculature of Foxc1-/- embryos still expresses Pecam-1 [180]. Because of the
endothelial heterogeneity and the complex regulation of Pecam-1 expression,
absence of one specific trans-factor might not result into an overall lack of gene
expression. This notion gains further support by the fact that, although Gata-2 was
implicated in Pecam-1 regulation in megakaryocytes and NF-κB is involved in
Pecam-1 expression in cells of the monocytic lineage, Pecam-1 expression in
endothelial cells is not affected by loss of either of these two genes. Studies in
female Gata-2 +/- knock out mice showed that the vasculature of the placenta of
Gata-2 -/- embryos still stains positive for Pecam-1, when compared with the
placenta of wild-type embryos [241]. In addition, mice lacking Ikk1 and Ikk2, two
genes encoding critical IκB kinases required to activate NF-κB, still display regular
Pecam-1 staining of the embryonic vasculature, although NF-κB activity is absent
[242]. Alongside, one could argue that loss of Foxc1 alleles in embryos does not
affect the overall expression of Pecam-1 in the pan-vascular bed, because this
transcriptional mechanism rather has specificity for an early endothelial progenitor
population.
Besides, transcriptional activation of vascular genes is considered to be under the
control of a combinatorial interaction of different classes of transcription factors that
might provide the molecular basis for the endothelial cell-specificity [84], as it has
been shown for the e.g. Tie2 gene [243]. This might further explain why the absence
of one trans-factor, i.e. Foxc1 in this case, might not lead to an overall loss of pan-
endothelial Pecam-1 expression, even if Foxc1 was required for Pecam-1 activity in
mature vascular beds. Additionally, as mentioned in the Introduction, FoxC proteins
Discussion
93
were shown to activate the arterial marker Delta-Like 4 (Dll4), a Notch ligand, through
a Fox binding site around 3.5kb upstream of the transcription start site. However, the
authors showed that mutations in the Fox binding site do not result into a complete
loss of promoter activity, suggesting that further transcription factors account for the
activation of Dll4 in arterial endothelium [181]. Likewise, loss of Foxc1 might be
compensated by other transcription factors whose interaction with the Pecam-1
regulatory sites might still be sufficient to drive Pecam-1 in mature endothelium.
In addition, the presence of co-factors could support the specificity of a transcription
factor thus allowing its activity at a certain promoter to be restricted to the vasculature
or certain endothelial sub-compartments [4, 84].
In that light, the molecular basis for the eEPC-specificity of Foxc1 induced Pecam-1
expression could be defined by a combination of Foxc1 and other transcription
factors and/or co-activators, which in turn might be unavailable in ES cells and
mature endothelial cells. For example, the transcriptional adaptor proteins p300 and
CREB-binding protein (CBP) form a multiprotein/DNA complex with HIF1α while
binding the VEGF gene, thus activating transcription in response to hypoxia [244],
and FoxO transcription factors were shown to interact with CBP/p300 in mediating
transcriptional activity [245]. However, an interaction of Foxc1 protein with CBP/p300
during Pecam-1 activation in eEPCs was not seen (data not shown) and further
putative co-activators of Foxc1 at the Pecam-1 locus were not identified in the frame
of this Ph.D. project.
4.6 Foxc1 binds a microsatellite repeat in the 5’-a rea of the mouse Pecam-1
gene
The Foxc1 binding site was identified within a microsatellite element that is
comprised of a ‘TTTGT’ pentanucleotide repeat. Microsatellites, also called simple
sequence repeats (SSR), consist of tandem repeats of up to six very short nucleotide
motifs [246], that in many cases show multiallelic polymorphism. In eukaryotic
genomes, SSRs are widely dispersed in non-coding regions, and coding regions of
mammalian genomes often include trinucleotide SSRs [247]. They are thought to

Discussion
94
represent a source of quantitative genetic variation. Their polymorphic nature, due to
variations in the number of the tandem repeat units caused by mutations in the DNA
through slippage-like events during replication [248, 249], makes them suitable
markers for genetic mapping and kinship studies [250, 251]. Next to coding
sequences of genes, SSRs have been found within introns as well as 5’-and 3’-UTRs
where they can serve as regulatory elements of transcription. This is especially true
for upstream promoter elements, where SSRs were shown to be involved in gene
regulation.
Specifically, the human epidermal growth factor receptor (EGF-R) gene contains two
blocks of (TCC)3 repeats in its upstream promoter elements that were suggested to
bind Sp1 and to be involved in regulation of EGF-R transcription [252]. Likewise, a
motif of seven ‘TCCC’ repeats in the human proto-oncogene c-KI-ras promoter [253]
is involved in transcriptional regulation, and the transcription factor p53 was
described to activate the expression of the tumor-suppressor gene PIG3 through
binding to a (TGYCC)n (Y= C or T) pentanucleotide repeat sequence within the
human PIG3 promoter [254]. Another polymorphic (CCT)n trinucleotide repeat,
located around 100 nucleotides upstream of the major transcription initiation site of
the human paired box gene-7 (PAX7) gene, was shown to confer high transcriptional
efficiency to the PAX7 promoter [255]. Those studies and others (reviewed in [256])
underscore the capability of repeated short sequence motifs to direct gene
transcription.
Additional support comes from a recent publication that aimed at identifying
transcription factor binding sites within microsatellite sequences across the entire
human genome [251]. Iglesias and co-workers investigated the functionality of
microsatellites located near the transcription initiation site (TIS - around the first
exon) and the first intron of all annotated genes of the human genome and assessed
their effect on gene expression as cis-regulatory elements. Among others, the
pentanucleotide ‘AAACA’ (reverse sequence of ‘TTTGT’) was found in 12
polymorphic microsatellites in the human genome. It was shown that the ‘TTTGT’
repeats have the capacity to bind DNA associated proteins in band shift assays,
indicating that this repeat-motif sequence can indeed serve as a binding-site and cis-
regulatory element in gene promoters [251]. Although this study did not further
investigate the precise nature of putative DNA binding proteins at the ‘AAACA’
Discussion
95
microsatellite repeat, we propose that Foxc1 might be among the group of yet to be
identified proteins that has the ability to bind at ‘AAACA’ repeats on the chromatin
and induce transcription of neighbouring genes. We found a similar scenario in band
shift assays by using a biotin-labeled probe comprising four ‘TTTGT’ repeats that is
shifted in presence of eEPC nuclear exract (data not shown), arguing that this
pentanucleotide repeat is able to act as Fox protein binding site. However, the data
obtained in these assays require further evaluation before being presented in a final
conclusive form.
Further, it is plausible that the promoter activation through the repeat motif has
biological relevance, since, if there was unspecific binding of ectopically expressed
Foxc1 to the (TTTGT)n repeat motifs, it would likely occur in all the co-transfection
experiments with the different cell lines included in this study. Alongside, the
decreased Pecam-1 mRNA levels in mature pancreatic endothelial cells (MS1-ECs)
and ES cells in response to Foxc1 (Fig. 12B) indicate that the transcriptional effect of
Foxc1 at the Pecam-1 promoter may be biphasic. Foxc1 could carry out a
repressional effect in mature endothelial cells and ES cells, whereas a potential
specific function as transcriptional activator specifically takes place in eEPCs (Fig.
13). This is in accordance with the general notion that Fox transcription factors can
act as trans-activators and trans-repressors [116].
4.7 The activity of the upstream element depends on the number of
microsatellite repeat motifs
Consistent with the observed drop in reporter expression after the (TTTGT)n motif is
shortened, Iglesias et al. showed that protein binding capacity increased with higher
numbers of AAACA repeats, with 7 repeats displaying about twice the binding
capacity as four repeats [251]. In this respect, the ‘TGYCC’ repeat-motif in the human
PIG3 promoter displays polymorphism in 117 human individuals, with four different
motif lengths consisting of either 10,15,16, or 17 repeats [254]. Decreased numbers
of ‘TGYCC’ repeats derived from the PIG3 promoter of different human individuals
conferred a decreased degree of responsiveness to p53 when combined with a
minimal promoter. Parallel overexpression of p53 showed that a motif comprising of
Discussion
96
17 repeats confers an about 4-fold higher promoter activity compared to the allele
containing only 10 repeats [254].
Moreover, the binding affinity of the transcription factor Sp1 for (CCT)n-repeats in the
human PAX7 promoter directly correlated with the repeat numbers of different alleles
[255]. Genotype analysis showed that the polymorphic (CCT)n-repeat in the human
PAX7 promoter has length variation in a Western European population and consists
of three different alleles with 8,10, or 11 repeats in close proximity to the TIS and as
for the ‘TTTGT’ and ‘TGYCC’ repeat motifs, alleles with a higher repeat number, in
this case 11 repeats, drove higher reporter gene expression in rhabdomyosarcoma
cells than alleles containing 8 or 10 repeats [255]. In similar fashion, I found that
increasing numbers of ‘TTTGT’ repeats drive higher reporter activity in vitro in the
Pecam-1 reporter gene studies.
4.8 The repeat number compensates the loss of the c onsensus motif
Despite its low similarity to the p53 consensus binding sequence, the ‘TGYCC’
repeat motif in the human PIG3 promoter was shown to be necessary and sufficient
to activate PIG3 expression in response to p53 [254].
Alongside, Fox proteins were also shown to bind DNA motifs with only partial
homology to the consensus core sequence and the efficient binding of Fox protein to
their target DNA also depends on the flanking sequences of the core [116, 155]. In
that respect, the ‘TTTGT’ pentanucleotide repeat might represent a sub-optimal
recognition site, which is yet able to bind Foxc1 protein. However, the lower binding
affinity could explain why high Foxc1 levels were necessary to induce promoter
activity in the reporter gene assays. The same was true in the case of p53, where
high amounts of p53 expression plasmid were required to induce a higher activation
of the PIG3 promoter through binding to the (TGYCC)n repeats in the study of
Contente and co-workers, compared to gene activation through a p53-consensus
promoter site [254, 257].
Next to requiring higher amounts of transcription factor, the deviation from the
consensus sequence might be compensated by the large number of ‘TTTGT’ motif
repeats, as found in the mouse Pecam-1 5’-flanking area, thus allowing to pass a
Discussion
97
threshold level to initiate gene expression. This would also explain that a large
number of repeat units has to be deleted to significantly decrease reporter gene
expression, with each single repeat unit contributing weakly to the overall activity.
4.9 Fox proteins can bind low-affinity sides
FoxC expression levels are regarded as a key factor during the precise temporal and
spatial control of target gene expression, e.g. the progressive loss of functional FoxC
alleles in embryos is associated with an increasing lateralization of paraxial and
somite mesoderm, showing a dose-dependent function of the proteins at the DNA
regulatory sites [192]. Thus, it is speculated that suboptimal Fox binding sites, such
as the ‘TTTGT’ repeats in our case, need high levels of endogenous Foxc1 protein
for binding in order to be functionally active.
Further support for a crucial dose dependent regulation of target genes by Fox
transcription factors comes from in vivo studies in C.elegans. During development,
the FoxA orthologue pha-4 controls pharyngeal development and the concentration
of Pha-4 protein increases during development, thus activating target genes with low-
affinity binding site in their promoters, whereas during the onset of pha-4
transcription, low protein concentrations are only able to activate target genes with
high affinity binding sites within their regulatory sequences [258]. If target gene
expression depends on a fine balanced level of Fox protein under certain
circumstances, the presence of low-affinity sites such as the ‘TTTGT’ repeat motif
described herein may allow a mechanism by which Pecam-1 transcript levels depend
on the intracellular concentration of Foxc1 protein, thus allowing a dose-dependent
control of gene expression.
4.10 Microsatellite repeats represent species-speci fic transcriptional elements
The lack of a similar arrangement of the (TTTGT)n repeat motif at the human locus
makes the two blocks of repeat units a unique feature of the mouse Pecam-1 locus
Discussion
98
(Fig. 19). However, a total of 45 ‘TTTGT’ repeat units was identified further upstream
of the transcriptional start site of human PECAM-1 (Fig. 20). Unlike in the mouse,
those repeats were shown to be distributed more randomly in shorter blocks of up to
6 repeat units. As a general rule, microsatellite repeats are considered to have
evolved differently between closely related species, e.g., the human genome
contains more and longer polymorphic repeats (especially dinucleotides), compared
to the genome of chimpanzees or other related primates [259]. Thus, it is unlikely to
expect a similar microsatellite motif – consisting of a comparable number and
arrangement of ‘TTTGT’ pentanucleotides – directly at the corresponding genomic
locus in orthologue species. Further support for a cis-regulatory role of the (TTTGT)n
repeat motif comes from our Bioinformatics analysis, that identified an experimentally
verified Foxc1 binding site at the Tbx1 locus [195], containing the same ‘TTTG’ core
sequence that was also as identified by the software within the ‘TTTGT’ repeats at
the mouse and human Pecam-1 locus (Fig. 18, Fig. 20). Hence, we suggest that this
microsatellite motif is involved in regulating the transcriptional activity of mouse and
human Pecam-1.
Functional conservation of a transcriptional regulatory activity of a microsatellite
repeat sequence has also been described for the human PAX7 promoter, where the
microsatellite shows a high conservation to the orthologue sequence in the mouse,
which, interestingly, does not consist of a (CCT)n repeat motif, but rather a C/T rich
sequence that might serve as a Sp1 binding site in vitro [255].
As a general assumption, mutational processes that lead to the diversity of simple
sequence repeats include replication slippage, point mutation, and recombination. If
DNA changes are not corrected by the DNA mismatch repair system, then new
alleles at the microsatellite loci are generated and eventually result into alternate
phenotypes and contribute to the species specificity of microsatellites. This kind of
divergence has been proposed to be responsible, at least in part, for temporal and
quantitative differences in gene expression between species [251].
In conclusion, we speculate that a cis-regulatory potential of a sequence repeat motif
can be contained between related species, although there might be differences and
variations on the nucleotide level or the position of the microsatellite repeat relative to
the transcription initiation site of a gene.
Discussion
99
4.11 Variation in transcription factor binding site s across species
In general, binding sites for highly conserved transcription factors can vary
significantly between mouse and human, as shown in a recent study that used
custom DNA microarrays which analyzed 10kb of sequences surrounding the known
transcription start sites of 4000 orthologue gene pairs from mouse and human [260].
The DNA was precipitated from primary mouse and human hepatocytes using
antibodies against liver-specific transcription factors, since hepatocytes and the
transcription factors that control their development and function are highly conserved
among mammals [261]. Interestingly, the study showed that up to 89% of orthologue
promoter regions bound by a protein in one species were not recognized by the
same protein in the second species, depending on the individual factor. For example
only 26% of orthologue genes bound by hepatocyte nuclear factor 6 (HNF6) in
human hepatocytes were recognized by this transcription factor in mouse
hepatocytes. Moreover, the location of binding events varied widely between the two
species, e.g. the binding of HNF6 at a certain locus was shifted about 4 kb from the
promoter region in human DNA to the first intron in the mouse DNA [260].
Furthermore, 41 orthologue pairs were bound by the related transcription factor
HNF1A in both species, but only 20 binding events occurred in sequences that were
aligned between mouse and human. This high mobility was regarded to account for
the most notable feature of the divergent transcription factor binding sites.
Generally, comparison of mouse and human genomic regulatory regions is used to
identify putative binding sites for different classes of transcription factors. And
conservation of sequence motifs suggests that a family of transcription factors might
be important in regulating the e.g. vascular-specific expression of a certain gene [84].
However, bioinformatics studies suggest that comparative genomics may not always
be sufficient to decode putative regulatory elements in promoter areas. Smith et al.
showed that fewer than 10% of orthologue promoter pairs from mouse and human
retain significant conservation, suggesting that tissue-specific sites would be difficult
to identify by relying purely on traditional cross-species analysis through co-linear
promoter alignment, which may result into high false-negative detection rates [229,
260]. In order to identify putative Foxc1 binding sites at the human PECAM-1 locus
Discussion
100
that might not match with the mouse sequence in co-linear alignments, we took
advantage of the MatInspector and DiAlign Tools [219, 220]. In accordance with the
above mentioned study [260], we suggest that the identified dispersed (TTTGT)n
repeat motifs upstream of the human PECAM-1 gene might present another example
of a transcription factor binding site that has a shifted position at the human locus, as
compared to the mouse locus.
In addition, it cannot be excluded that the human PECAM-1 locus contains Foxc1
binding motifs, which might be embedded inside regular consensus sequences that
are not in alignment with the repeat motif in the mouse genome and were not
identified by the bioinformatics analysis applied in this study. Besides this notion, it is
possible that further (TTTGT)n repeat motifs, other ‘TG’-rich sequences or regular
Foxc1 consensus binding sites are located in genomic areas of the human locus that
were not analyzed at all for the presence of such sites, e.g. areas far upstream of the
transcription initiation site, as well as downstream of the PECAM-1 gene or within
intronic regions. This is making it hard to speculate about the possible existence of
further Foxc1 sites with reasonable accuracy.
In conclusion, the lack of identified Foxc1 binding sites in areas of the human locus
that correspond to the microsatellite in the mouse sequence, does not rule out the
possibility that putative functional Foxc1 sites, such as the already identified ‘TTTGT’
repeats in the human sequence, are present in distinct areas of the human PECAM-1
locus.
4.12 Difference between Foxc1 and Foxc2 functions
Although the biological functions of the two closely related members of the FoxC
subfamily are often conserved during evolution, their activities differ in some
instances. For example, the congenital hydrocephalus phenotype in Foxc1 -/- mice is
not seen in Foxc2 -/- mice [187, 189]. In turn, Foxc2 was shown to have stronger
transcriptional activity in the cardiovascular system than Foxc1. [181, 190, 240]. For
instance, the formation of the cardiac outflow tract, the right ventricle and the inflow
tract is severely impaired in compound Foxc1+/-; Foxc2-/- and Foxc1-/-;Foxc2-/-

Discussion
101
embryos, whereas compound Foxc1-/-;Foxc2+/- embryos do not display this kind of
developmental abnormalities [190]. Moreover, Foxc2, but not Foxc1, was shown to
bind and transactivate the promoter of the plasminogen activator inhibitor-1 (PAI-1)
gene in endothelial cells [240].
Although Foxc1 and Foxc2 differ considerably in their sequence, the DNA binding
domains are almost 100% identical [116]. In this respect, it is surprising that only
Foxc1 leads to transcriptional activation of the endogenous Pecam-1 gene as well as
of the upstream 5’-flanking 3.5kb element in the reporter construct. This likely occurs
because Foxc1 might be able to bind to other proteins within the transcriptional
complex forming on the Pecam-1 promoter, but Foxc2 does not. This in turn would
not be surprising since the two FoxC homologues differ extensively in the non-DNA
binding domains [116]. This selective activation of Pecam-1 through Foxc1 likely
represents another example of a functional difference between the closely related
FoxC proteins, leading to gene target specificity under certain conditions; this in turn
is consistent with the fact that the two genes cannot compensate for each other in
many developmental stages.
4.13 Foxc1 as regulator of vascular adhesion molecu les?
Myeloid cells regulate Pecam-1 activity through involvement of the transcriptional
regulator NF-κB (Nuclear Factor-kappa B), which has also been implicated in the
transcriptional regulation of other members of the Ig (Immunglobuline) superfamily,
such as Icam-1 (Intercellular Adhesion Molecule-1) and Vcam-1 (Vascular Cell
Adhesion Molecule-1) [262, 263], that are both implicated in endothelial-leukocyte
adhesion during pathological conditions. These finding suggest a broad role of NF-κB
in regulating the expression of cell adhesion molecules on the endothelium in
response to environmental stimuli such as those occuring during inflammation. In
accordance, in the frame of this project, Foxc1 and Foxc2 were shown to induce
expression of Icam-1 and the chemokine receptor Cxcr4 (Fig. 4) in mouse eEPCs.
Others have shown the induction of Cxcr4 by FoxC proteins in endothelial cells (Tom
Discussion
102
Kume, personal communication) and Vcam-1 was identified as a target gene of
Foxc1 and Foxc2 (Tom Kume, unpublished observations). As for NF-κB, our findings
of Pecam-1 as well as Icam-1 and Cxcr4 as target genes could indicate a role of
FoxC transcription factors in regulating the expression of genes encoding for surface
proteins that typically are involved in the recruitment and adhesion of bone marrow-
derived peripheral blood cells of the leukocytic lineage to target organ sites during
pathological conditions such as inflammation. However, further studies such as gain
of function analysis in endothelial cell cultures or in vivo studies using FoxC knock-
out animal models will be necessary to verify this hypothesis.
4.14 Conclusion
In summary, transgenic overexpression of the transcription factor Foxc1 in eEPCs
identified a transcriptional mechanism that up-regulates mouse Pecam-1 expression
in undifferentiated embryonic endothelial progenitor cells, which represent an early
angioblast population [108]. Most likely, Foxc1-induced Pecam-1 expression is active
as a stage-specific mechanism in eEPCs as part of the molecular endothelial
heterogeneity and may not reflect a general pan-endothelial transcriptional
mechanism of Pecam-1 in mature vascular beds. Alternatively, Foxc1 might play a
role in suppressing Pecam-1 expression under special circumstances like during
inflammatory conditions or hyperglycemia. It was shown that the induction of Pecam-
1 expression by Foxc1 is direct, thus suggesting that Foxc1 may be involved in the
initial control of endothelial differentiation by inducing Pecam-1. The results
presented here indicate that Foxc1 regulates Pecam-1 induction through a distal 5’-
flanking binding site composed of a tandem repeated ‘TTTGT’ microsatellite motif
that reflects the core-pentanucleotide of the Fox consensus binding site [224].
Microsatellites repeats have gained increasing importance as regulatory elements in
gene expression and in human genetic diseases [251]. Yet, it is not entirely clear how
they function during transcriptional regulation compared to single transcription factor
binding sites with strong affinities. The data herein provide a new model of gene
expression regulation involving a cis-active microsatellite repeat. In the future, it will
be of interest to study the dispersed (TTTGT)n repeat motifs upstream of the human

Discussion
103
PECAM-1 gene for cis-regulatory activity by an experimental approach in vitro and in
vivo, through e.g. ChIP analysis. This will add further data about a role of this repeat
motif in endothelial gene regulation.
The presented data provide new insight into the regulation of vascular-specific gene
expression. Identifying additional targets of Foxc1 and also Foxc2 in endothelial cells
will also extend our understanding of the role of these transcription factors during
cardiovascular development and disease.
References
104
REFERENCES
[1] Hatzopoulos AK, Rosenberg RD. Embryonic development of the vascular system: Oxford University Press; 1999.
[2] Cines DB, Pollak ES, Buck CA, et al. Endothelial cells in physiology and in the pathophysiology of vascular disorders. Blood. 1998;91:3527-3561.
[3] Weibel ER, Palade GE. New Cytoplasmic Components in Arterial Endothelia. J Cell Biol. 1964;23:101-112.
[4] Minami T, Aird WC. Endothelial cell gene regulation. Trends Cardiovasc Med. 2005;15:174-184.
[5] Risau W, Flamme I. Vasculogenesis. Annu Rev Cell Dev Biol. 1995;11:73-91.
[6] Drake CJ, Fleming PA. Vasculogenesis in the day 6.5 to 9.5 mouse embryo. Blood. 2000;95:1671-1679.
[7] DeRuiter MC, Poelmann RE, VanderPlas-de Vries I, Mentink MM, Gittenberger-de Groot AC. The development of the myocardium and endocardium in mouse embryos. Fusion of two heart tubes? Anat Embryol (Berl). 1992;185:461-473.
[8] Noden DM. Embryonic origins and assembly of blood vessels. Am Rev Respir Dis. 1989;140:1097-1103.
[9] Sabin FR. Studies on the origin of blood-vessels and of red blood-corpuscles as seen in the living blastoderm of chicks during the second day of incubation. Contrib Embryol Carnegie Inst Publ Wash. 1920;9:213-262.
[10] Murray PDF. The Development in vitro of the blood of the early chick embryo. Proc R Soc Lond [Biol]. 1932;11:497-521.
[11] Risau W. Vasculogenesis, angiogenesis and endothelial cell differentiation during embryonic development. Basel: Karger; 1991.
[12] Carmeliet P. Angiogenesis in health and disease. Nat Med. 2003;9:653-660.
[13] Pardanaud L, Yassine F, Dieterlen-Lievre F. Relationship between vasculogenesis, angiogenesis and haemopoiesis during avian ontogeny. Development (Cambridge, England). 1989;105:473-485.
[14] Ribatti D. Genetic and epigenetic mechanisms in the early development of the vascular system. J Anat. 2006;208:139-152.
[15] Augustin HG. Tubes, branches, and pillars: the many ways of forming a new vasculature. Circ Res. 2001;89:645-647.
References
105
[16] Burri PH, Djonov V. Intussusceptive angiogenesis--the alternative to capillary sprouting. Mol Aspects Med. 2002;23:S1-27.
[17] Baldwin HS. Early embryonic vascular development. Cardiovasc Res. 1996;31 Spec No:E34-45.
[18] Carmeliet P. Mechanisms of angiogenesis and arteriogenesis. Nat Med. 2000;6:389-395.
[19] Gittenberger-de Groot AC, DeRuiter MC, Bergwerff M, Poelmann RE. Smooth muscle cell origin and its relation to heterogeneity in development and disease. Arteriosclerosis, thrombosis, and vascular biology. 1999;19:1589-1594.
[20] Reynolds LP, Killilea SD, Redmer DA. Angiogenesis in the female reproductive system. Faseb J. 1992;6:886-892.
[21] Augustin HG, Braun K, Telemenakis I, Modlich U, Kuhn W. Ovarian angiogenesis. Phenotypic characterization of endothelial cells in a physiological model of blood vessel growth and regression. Am J Pathol. 1995;147:339-351.
[22] Carmeliet P, Jain RK. Angiogenesis in cancer and other diseases. Nature. 2000;407:249-257.
[23] Boulton AJ, Malik RA. Diabetic neuropathy. Med Clin North Am. 1998;82:909-929.
[24] Ross R. Cell biology of atherosclerosis. Annu Rev Physiol. 1995;57:791-804.
[25] Folkman J. Angiogenesis in cancer, vascular, rheumatoid and other disease. Nat Med. 1995;1:27-31.
[26] Rafii S, Lyden D. Therapeutic stem and progenitor cell transplantation for organ vascularization and regeneration. Nat Med. 2003;9:702-712.
[27] Urbich C, Dimmeler S. Endothelial progenitor cells: characterization and role in vascular biology. Circ Res. 2004;95:343-353.
[28] Peichev M, Naiyer AJ, Pereira D, et al. Expression of VEGFR-2 and AC133 by circulating human CD34(+) cells identifies a population of functional endothelial precursors. Blood. 2000;95:952-958.
[29] Quirici N, Soligo D, Caneva L, Servida F, Bossolasco P, Deliliers GL. Differentiation and expansion of endothelial cells from human bone marrow CD133(+) cells. Br J Haematol. 2001;115:186-194.
[30] Gehling UM, Ergun S, Schumacher U, et al. In vitro differentiation of endothelial cells from AC133-positive progenitor cells. Blood. 2000;95:3106-3112.
[31] Yin AH, Miraglia S, Zanjani ED, et al. AC133, a novel marker for human hematopoietic stem and progenitor cells. Blood. 1997;90:5002-5012.
References
106
[32] Miraglia S, Godfrey W, Yin AH, et al. A novel five-transmembrane hematopoietic stem cell antigen: isolation, characterization, and molecular cloning. Blood. 1997;90:5013-5021.
[33] Kalka C, Masuda H, Takahashi T, et al. Transplantation of ex vivo expanded endothelial progenitor cells for therapeutic neovascularization. Proceedings of the National Academy of Sciences of the United States of America. 2000;97:3422-3427.
[34] Asahara T, Masuda H, Takahashi T, et al. Bone marrow origin of endothelial progenitor cells responsible for postnatal vasculogenesis in physiological and pathological neovascularization. Circ Res. 1999;85:221-228.
[35] Asahara T, Takahashi T, Masuda H, et al. VEGF contributes to postnatal neovascularization by mobilizing bone marrow-derived endothelial progenitor cells. Embo J. 1999;18:3964-3972.
[36] Lin Y, Weisdorf DJ, Solovey A, Hebbel RP. Origins of circulating endothelial cells and endothelial outgrowth from blood. J Clin Invest. 2000;105:71-77.
[37] Orlic D, Kajstura J, Chimenti S, et al. Bone marrow cells regenerate infarcted myocardium. Nature. 2001;410:701-705.
[38] Orlic D, Kajstura J, Chimenti S, et al. Mobilized bone marrow cells repair the infarcted heart, improving function and survival. Proceedings of the National Academy of Sciences of the United States of America. 2001;98:10344-10349.
[39] Kocher AA, Schuster MD, Szabolcs MJ, et al. Neovascularization of ischemic myocardium by human bone-marrow-derived angioblasts prevents cardiomyocyte apoptosis, reduces remodeling and improves cardiac function. Nat Med. 2001;7:430-436.
[40] Asahara T, Murohara T, Sullivan A, et al. Isolation of putative progenitor endothelial cells for angiogenesis. Science (New York, NY. 1997;275:964-967.
[41] Takahashi T, Kalka C, Masuda H, et al. Ischemia- and cytokine-induced mobilization of bone marrow-derived endothelial progenitor cells for neovascularization. Nat Med. 1999;5:434-438.
[42] Zhang ZG, Zhang L, Jiang Q, Chopp M. Bone marrow-derived endothelial progenitor cells participate in cerebral neovascularization after focal cerebral ischemia in the adult mouse. Circ Res. 2002;90:284-288.
[43] Davidoff AM, Ng CY, Brown P, et al. Bone marrow-derived cells contribute to tumor neovasculature and, when modified to express an angiogenesis inhibitor, can restrict tumor growth in mice. Clin Cancer Res. 2001;7:2870-2879.
[44] Lyden D, Hattori K, Dias S, et al. Impaired recruitment of bone-marrow-derived endothelial and hematopoietic precursor cells blocks tumor angiogenesis and growth. Nat Med. 2001;7:1194-1201.
[45] Conway EM, Collen D, Carmeliet P. Molecular mechanisms of blood vessel growth. Cardiovasc Res. 2001;49:507-521.
References
107
[46] Jain RK. Molecular regulation of vessel maturation. Nat Med. 2003;9:685-693.
[47] Flamme I, Risau W. Induction of vasculogenesis and hematopoiesis in vitro. Development (Cambridge, England). 1992;116:435-439.
[48] Breier G, Albrecht U, Sterrer S, Risau W. Expression of vascular endothelial growth factor during embryonic angiogenesis and endothelial cell differentiation. Development (Cambridge, England). 1992;114:521-532.
[49] Veikkola T, Karkkainen M, Claesson-Welsh L, Alitalo K. Regulation of angiogenesis via vascular endothelial growth factor receptors. Cancer Res. 2000;60:203-212.
[50] Thurston G. Role of Angiopoietins and Tie receptor tyrosine kinases in angiogenesis and lymphangiogenesis. Cell Tissue Res. 2003;314:61-68.
[51] Yancopoulos GD, Davis S, Gale NW, Rudge JS, Wiegand SJ, Holash J. Vascular-specific growth factors and blood vessel formation. Nature. 2000;407:242-248.
[52] Kukk E, Lymboussaki A, Taira S, et al. VEGF-C receptor binding and pattern of expression with VEGFR-3 suggests a role in lymphatic vascular development. Development (Cambridge, England). 1996;122:3829-3837.
[53] Gale NW, Yancopoulos GD. Growth factors acting via endothelial cell-specific receptor tyrosine kinases: VEGFs, angiopoietins, and ephrins in vascular development. Genes Dev. 1999;13:1055-1066.
[54] Neufeld G, Cohen T, Shraga N, Lange T, Kessler O, Herzog Y. The neuropilins: multifunctional semaphorin and VEGF receptors that modulate axon guidance and angiogenesis. Trends Cardiovasc Med. 2002;12:13-19.
[55] Herzog Y, Kalcheim C, Kahane N, Reshef R, Neufeld G. Differential expression of neuropilin-1 and neuropilin-2 in arteries and veins. Mech Dev. 2001;109:115-119.
[56] Thurston G, Suri C, Smith K, et al. Leakage-resistant blood vessels in mice transgenically overexpressing angiopoietin-1. Science (New York, NY. 1999;286:2511-2514.
[57] Maisonpierre PC, Suri C, Jones PF, et al. Angiopoietin-2, a natural antagonist for Tie2 that disrupts in vivo angiogenesis. Science (New York, NY. 1997;277:55-60.
[58] Wang HU, Chen ZF, Anderson DJ. Molecular distinction and angiogenic interaction between embryonic arteries and veins revealed by ephrin-B2 and its receptor Eph-B4. Cell. 1998;93:741-753.
[59] Adams RH, Wilkinson GA, Weiss C, et al. Roles of ephrinB ligands and EphB receptors in cardiovascular development: demarcation of arterial/venous domains, vascular morphogenesis, and sprouting angiogenesis. Genes Dev. 1999;13:295-306.
References
108
[60] Adams RH, Klein R. Eph receptors and ephrin ligands. essential mediators of vascular development. Trends Cardiovasc Med. 2000;10:183-188.
[61] Brew K, Dinakarpandian D, Nagase H. Tissue inhibitors of metalloproteinases: evolution, structure and function. Biochim Biophys Acta. 2000;1477:267-283.
[62] Newman PJ. The biology of PECAM-1. J Clin Invest. 1997;99:3-8.
[63] Radice GL, Rayburn H, Matsunami H, Knudsen KA, Takeichi M, Hynes RO. Developmental defects in mouse embryos lacking N-cadherin. Dev Biol. 1997;181:64-78.
[64] Dejana E, Bazzoni G, Lampugnani MG. Vascular endothelial (VE)-cadherin: only an intercellular glue? Exp Cell Res. 1999;252:13-19.
[65] Gory-Faure S, Prandini MH, Pointu H, et al. Role of vascular endothelial-cadherin in vascular morphogenesis. Development (Cambridge, England). 1999;126:2093-2102.
[66] Eliceiri BP, Cheresh DA. The role of alphav integrins during angiogenesis: insights into potential mechanisms of action and clinical development. J Clin Invest. 1999;103:1227-1230.
[67] Hynes RO. A reevaluation of integrins as regulators of angiogenesis. Nat Med. 2002;8:918-921.
[68] Brooks PC, Clark RA, Cheresh DA. Requirement of vascular integrin alpha v beta 3 for angiogenesis. Science (New York, NY. 1994;264:569-571.
[69] Risau W, Lemmon V. Changes in the vascular extracellular matrix during embryonic vasculogenesis and angiogenesis. Dev Biol. 1988;125:441-450.
[70] Drake CJ, Davis LA, Walters L, Little CD. Avian vasculogenesis and the distribution of collagens I, IV, laminin, and fibronectin in the heart primordia. J Exp Zool. 1990;255:309-322.
[71] Iso T, Hamamori Y, Kedes L. Notch signaling in vascular development. Arteriosclerosis, thrombosis, and vascular biology. 2003;23:543-553.
[72] Alva JA, Iruela-Arispe ML. Notch signaling in vascular morphogenesis. Curr Opin Hematol. 2004;11:278-283.
[73] Shawber CJ, Kitajewski J. Notch function in the vasculature: insights from zebrafish, mouse and man. Bioessays. 2004;26:225-234.
[74] Hellstrom M, Kalen M, Lindahl P, Abramsson A, Betsholtz C. Role of PDGF-B and PDGFR-beta in recruitment of vascular smooth muscle cells and pericytes during embryonic blood vessel formation in the mouse. Development (Cambridge, England). 1999;126:3047-3055.
References
109
[75] Lindahl P, Johansson BR, Leveen P, Betsholtz C. Pericyte loss and microaneurysm formation in PDGF-B-deficient mice. Science (New York, NY. 1997;277:242-245.
[76] Goumans MJ, Valdimarsdottir G, Itoh S, Rosendahl A, Sideras P, ten Dijke P. Balancing the activation state of the endothelium via two distinct TGF-beta type I receptors. Embo J. 2002;21:1743-1753.
[77] Yamaguchi J, Kusano KF, Masuo O, et al. Stromal cell-derived factor-1 effects on ex vivo expanded endothelial progenitor cell recruitment for ischemic neovascularization. Circulation. 2003;107:1322-1328.
[78] Askari AT, Unzek S, Popovic ZB, et al. Effect of stromal-cell-derived factor 1 on stem-cell homing and tissue regeneration in ischaemic cardiomyopathy. Lancet. 2003;362:697-703.
[79] Aiuti A, Webb IJ, Bleul C, Springer T, Gutierrez-Ramos JC. The chemokine SDF-1 is a chemoattractant for human CD34+ hematopoietic progenitor cells and provides a new mechanism to explain the mobilization of CD34+ progenitors to peripheral blood. J Exp Med. 1997;185:111-120.
[80] O'Reilly MS, Holmgren L, Shing Y, et al. Angiostatin: a novel angiogenesis inhibitor that mediates the suppression of metastases by a Lewis lung carcinoma. Cell. 1994;79:315-328.
[81] O'Reilly MS, Boehm T, Shing Y, et al. Endostatin: an endogenous inhibitor of angiogenesis and tumor growth. Cell. 1997;88:277-285.
[82] Unthank JL, Fath SW, Burkhart HM, Miller SC, Dalsing MC. Wall remodeling during luminal expansion of mesenteric arterial collaterals in the rat. Circ Res. 1996;79:1015-1023.
[83] Djonov VG, Kurz H, Burri PH. Optimality in the developing vascular system: branching remodeling by means of intussusception as an efficient adaptation mechanism. Dev Dyn. 2002;224:391-402.
[84] Oettgen P. Transcriptional regulation of vascular development. Circ Res. 2001;89:380-388.
[85] Iljin K, Dube A, Kontusaari S, et al. Role of ets factors in the activity and endothelial cell specificity of the mouse Tie gene promoter. Faseb J. 1999;13:377-386.
[86] Dube A, Akbarali Y, Sato TN, Libermann TA, Oettgen P. Role of the Ets transcription factors in the regulation of the vascular-specific Tie2 gene. Circ Res. 1999;84:1177-1185.
[87] Kappel A, Schlaeger TM, Flamme I, Orkin SH, Risau W, Breier G. Role of SCL/Tal-1, GATA, and ets transcription factor binding sites for the regulation of flk-1 expression during murine vascular development. Blood. 2000;96:3078-3085.
References
110
[88] Brown LA, Rodaway AR, Schilling TF, et al. Insights into early vasculogenesis revealed by expression of the ETS-domain transcription factor Fli-1 in wild-type and mutant zebrafish embryos. Mech Dev. 2000;90:237-252.
[89] Hart A, Melet F, Grossfeld P, et al. Fli-1 is required for murine vascular and megakaryocytic development and is hemizygously deleted in patients with thrombocytopenia. Immunity. 2000;13:167-177.
[90] Gering M, Rodaway AR, Gottgens B, Patient RK, Green AR. The SCL gene specifies haemangioblast development from early mesoderm. Embo J. 1998;17:4029-4045.
[91] Visvader JE, Fujiwara Y, Orkin SH. Unsuspected role for the T-cell leukemia protein SCL/tal-1 in vascular development. Genes Dev. 1998;12:473-479.
[92] Cowan PJ, Tsang D, Pedic CM, et al. The human ICAM-2 promoter is endothelial cell-specific in vitro and in vivo and contains critical Sp1 and GATA binding sites. The Journal of biological chemistry. 1998;273:11737-11744.
[93] German Z, Chambliss KL, Pace MC, Arnet UA, Lowenstein CJ, Shaul PW. Molecular basis of cell-specific endothelial nitric-oxide synthase expression in airway epithelium. The Journal of biological chemistry. 2000;275:8183-8189.
[94] Gumina RJ, Kirschbaum NE, Piotrowski K, Newman PJ. Characterization of the human platelet/endothelial cell adhesion molecule-1 promoter: identification of a GATA-2 binding element required for optimal transcriptional activity. Blood. 1997;89:1260-1269.
[95] Steingrimsson E, Tessarollo L, Reid SW, Jenkins NA, Copeland NG. The bHLH-Zip transcription factor Tfeb is essential for placental vascularization. Development (Cambridge, England). 1998;125:4607-4616.
[96] Henderson AM, Wang SJ, Taylor AC, Aitkenhead M, Hughes CC. The basic helix-loop-helix transcription factor HESR1 regulates endothelial cell tube formation. The Journal of biological chemistry. 2001;276:6169-6176.
[97] Myers C, Charboneau A, Boudreau N. Homeobox B3 promotes capillary morphogenesis and angiogenesis. J Cell Biol. 2000;148:343-351.
[98] Belotti D, Clausse N, Flagiello D, et al. Expression and modulation of homeobox genes from cluster B in endothelial cells. Lab Invest. 1998;78:1291-1299.
[99] Boudreau N, Andrews C, Srebrow A, Ravanpay A, Cheresh DA. Induction of the angiogenic phenotype by Hox D3. J Cell Biol. 1997;139:257-264.
[100] Liao W, Ho CY, Yan YL, Postlethwait J, Stainier DY. Hhex and scl function in parallel to regulate early endothelial and blood differentiation in zebrafish. Development (Cambridge, England). 2000;127:4303-4313.
[101] Schreiber M, Wang ZQ, Jochum W, Fetka I, Elliott C, Wagner EF. Placental vascularisation requires the AP-1 component fra1. Development (Cambridge, England). 2000;127:4937-4948.
References
111
[102] Xiong JW, Leahy A, Lee HH, Stuhlmann H. Vezf1: A Zn finger transcription factor restricted to endothelial cells and their precursors. Dev Biol. 1999;206:123-141.
[103] Kuo CT, Veselits ML, Barton KP, Lu MM, Clendenin C, Leiden JM. The LKLF transcription factor is required for normal tunica media formation and blood vessel stabilization during murine embryogenesis. Genes Dev. 1997;11:2996-3006.
[104] Wang GL, Jiang BH, Rue EA, Semenza GL. Hypoxia-inducible factor 1 is a basic-helix-loop-helix-PAS heterodimer regulated by cellular O2 tension. Proceedings of the National Academy of Sciences of the United States of America. 1995;92:5510-5514.
[105] Forsythe JA, Jiang BH, Iyer NV, et al. Activation of vascular endothelial growth factor gene transcription by hypoxia-inducible factor 1. Molecular and cellular biology. 1996;16:4604-4613.
[106] Mazure NM, Chen EY, Laderoute KR, Giaccia AJ. Induction of vascular endothelial growth factor by hypoxia is modulated by a phosphatidylinositol 3-kinase/Akt signaling pathway in Ha-ras-transformed cells through a hypoxia inducible factor-1 transcriptional element. Blood. 1997;90:3322-3331.
[107] Richard DE, Berra E, Gothie E, Roux D, Pouyssegur J. p42/p44 mitogen-activated protein kinases phosphorylate hypoxia-inducible factor 1alpha (HIF-1alpha) and enhance the transcriptional activity of HIF-1. The Journal of biological chemistry. 1999;274:32631-32637.
[108] Hatzopoulos AK, Folkman J, Vasile E, Eiselen GK, Rosenberg RD. Isolation and characterization of endothelial progenitor cells from mouse embryos. Development (Cambridge, England). 1998;125:1457-1468.
[109] Coffin JD, Harrison J, Schwartz S, Heimark R. Angioblast differentiation and morphogenesis of the vascular endothelium in the mouse embryo. Dev Biol. 1991;148:51-62.
[110] Shi Q, Rafii S, Wu MH, et al. Evidence for circulating bone marrow-derived endothelial cells. Blood. 1998;92:362-367.
[111] Yamaguchi TP, Dumont DJ, Conlon RA, Breitman ML, Rossant J. flk-1, an flt-related receptor tyrosine kinase is an early marker for endothelial cell precursors. Development (Cambridge, England). 1993;118:489-498.
[112] Vajkoczy P, Blum S, Lamparter M, et al. Multistep nature of microvascular recruitment of ex vivo-expanded embryonic endothelial progenitor cells during tumor angiogenesis. J Exp Med. 2003;197:1755-1765.
[113] Kupatt C, Hinkel R, Lamparter M, et al. Retroinfusion of embryonic endothelial progenitor cells attenuates ischemia-reperfusion injury in pigs: role of phosphatidylinositol 3-kinase/AKT kinase. Circulation. 2005;112:I117-122.
[114] Kupatt C, Horstkotte J, Vlastos GA, et al. Embryonic endothelial progenitor cells expressing a broad range of proangiogenic and remodeling factors enhance
References
112
vascularization and tissue recovery in acute and chronic ischemia. Faseb J. 2005;19:1576-1578.
[115] Kaestner KH, Knochel W, Martinez DE. Unified nomenclature for the winged helix/forkhead transcription factors. Genes Dev. 2000;14:142-146.
[116] Carlsson P, Mahlapuu M. Forkhead transcription factors: key players in development and metabolism. Dev Biol. 2002;250:1-23.
[117] Weigel D, Jackle H. The fork head domain: a novel DNA binding motif of eukaryotic transcription factors? Cell. 1990;63:455-456.
[118] Clark KL, Halay ED, Lai E, Burley SK. Co-crystal structure of the HNF-3/fork head DNA-recognition motif resembles histone H5. Nature. 1993;364:412-420.
[119] Lehmann OJ, Sowden JC, Carlsson P, Jordan T, Bhattacharya SS. Fox's in development and disease. Trends Genet. 2003;19:339-344.
[120] Weigel D, Jurgens G, Kuttner F, Seifert E, Jackle H. The homeotic gene fork head encodes a nuclear protein and is expressed in the terminal regions of the Drosophila embryo. Cell. 1989;57:645-658.
[121] Lai E, Prezioso VR, Tao WF, Chen WS, Darnell JE, Jr. Hepatocyte nuclear factor 3 alpha belongs to a gene family in mammals that is homologous to the Drosophila homeotic gene fork head. Genes Dev. 1991;5:416-427.
[122] Cirillo LA, Zaret KS. An early developmental transcription factor complex that is more stable on nucleosome core particles than on free DNA. Mol Cell. 1999;4:961-969.
[123] Hellqvist M, Mahlapuu M, Blixt A, Enerback S, Carlsson P. The human forkhead protein FREAC-2 contains two functionally redundant activation domains and interacts with TBP and TFIIB. The Journal of biological chemistry. 1998;273:23335-23343.
[124] Katoh M, Katoh M. Human FOX gene family (Review). Int J Oncol. 2004;25:1495-1500.
[125] Sirotkin HI, Gates MA, Kelly PD, Schier AF, Talbot WS. Fast1 is required for the development of dorsal axial structures in zebrafish. Curr Biol. 2000;10:1051-1054.
[126] Hoodless PA, Pye M, Chazaud C, et al. FoxH1 (Fast) functions to specify the anterior primitive streak in the mouse. Genes Dev. 2001;15:1257-1271.
[127] Brody SL, Yan XH, Wuerffel MK, Song SK, Shapiro SD. Ciliogenesis and left-right axis defects in forkhead factor HFH-4-null mice. Am J Respir Cell Mol Biol. 2000;23:45-51.
[128] Hong HK, Noveroske JK, Headon DJ, et al. The winged helix/forkhead transcription factor Foxq1 regulates differentiation of hair in satin mice. Genesis. 2001;29:163-171.
References
113
[129] Brissette JL, Li J, Kamimura J, Lee D, Dotto GP. The product of the mouse nude locus, Whn, regulates the balance between epithelial cell growth and differentiation. Genes Dev. 1996;10:2212-2221.
[130] Nehls M, Pfeifer D, Schorpp M, Hedrich H, Boehm T. New member of the winged-helix protein family disrupted in mouse and rat nude mutations. Nature. 1994;372:103-107.
[131] Hulander M, Wurst W, Carlsson P, Enerback S. The winged helix transcription factor Fkh10 is required for normal development of the inner ear. Nat Genet. 1998;20:374-376.
[132] Blixt A, Mahlapuu M, Aitola M, Pelto-Huikko M, Enerback S, Carlsson P. A forkhead gene, FoxE3, is essential for lens epithelial proliferation and closure of the lens vesicle. Genes Dev. 2000;14:245-254.
[133] Weinstein DC, Ruiz i Altaba A, Chen WS, et al. The winged-helix transcription factor HNF-3 beta is required for notochord development in the mouse embryo. Cell. 1994;78:575-588.
[134] Ang SL, Rossant J. HNF-3 beta is essential for node and notochord formation in mouse development. Cell. 1994;78:561-574.
[135] Costa RH, Kalinichenko VV, Lim L. Transcription factors in mouse lung development and function. Am J Physiol Lung Cell Mol Physiol. 2001;280:L823-838.
[136] Chen J, Knowles HJ, Hebert JL, Hackett BP. Mutation of the mouse hepatocyte nuclear factor/forkhead homologue 4 gene results in an absence of cilia and random left-right asymmetry. J Clin Invest. 1998;102:1077-1082.
[137] Tichelaar JW, Lim L, Costa RH, Whitsett JA. HNF-3/forkhead homologue-4 influences lung morphogenesis and respiratory epithelial cell differentiation in vivo. Dev Biol. 1999;213:405-417.
[138] Shu W, Yang H, Zhang L, Lu MM, Morrisey EE. Characterization of a new subfamily of winged-helix/forkhead (Fox) genes that are expressed in the lung and act as transcriptional repressors. The Journal of biological chemistry. 2001;276:27488-27497.
[139] Peterson RS, Lim L, Ye H, Zhou H, Overdier DG, Costa RH. The winged helix transcriptional activator HFH-8 is expressed in the mesoderm of the primitive streak stage of mouse embryos and its cellular derivatives. Mech Dev. 1997;69:53-69.
[140] Mahlapuu M, Ormestad M, Enerback S, Carlsson P. The forkhead transcription factor Foxf1 is required for differentiation of extra-embryonic and lateral plate mesoderm. Development (Cambridge, England). 2001;128:155-166.
[141] Wehr R, Mansouri A, de Maeyer T, Gruss P. Fkh5-deficient mice show dysgenesis in the caudal midbrain and hypothalamic mammillary body. Development (Cambridge, England). 1997;124:4447-4456.
References
114
[142] Xuan S, Baptista CA, Balas G, Tao W, Soares VC, Lai E. Winged helix transcription factor BF-1 is essential for the development of the cerebral hemispheres. Neuron. 1995;14:1141-1152.
[143] Yuasa J, Hirano S, Yamagata M, Noda M. Visual projection map specified by topographic expression of transcription factors in the retina. Nature. 1996;382:632-635.
[144] Montero-Balaguer M, Lang MR, Sachdev SW, et al. The mother superior mutation ablates foxd3 activity in neural crest progenitor cells and depletes neural crest derivatives in zebrafish. Dev Dyn. 2006;235:3199-3212.
[145] Garry DJ, Meeson A, Elterman J, et al. Myogenic stem cell function is impaired in mice lacking the forkhead/winged helix protein MNF. Proceedings of the National Academy of Sciences of the United States of America. 2000;97:5416-5421.
[146] Chen X, Rubock MJ, Whitman M. A transcriptional partner for MAD proteins in TGF-beta signalling. Nature. 1996;383:691-696.
[147] Chen X, Weisberg E, Fridmacher V, Watanabe M, Naco G, Whitman M. Smad4 and FAST-1 in the assembly of activin-responsive factor. Nature. 1997;389:85-89.
[148] Liu B, Dou CL, Prabhu L, Lai E. FAST-2 is a mammalian winged-helix protein which mediates transforming growth factor beta signals. Molecular and cellular biology. 1999;19:424-430.
[149] Yeo CY, Chen X, Whitman M. The role of FAST-1 and Smads in transcriptional regulation by activin during early Xenopus embryogenesis. The Journal of biological chemistry. 1999;274:26584-26590.
[150] Dou C, Lee J, Liu B, et al. BF-1 interferes with transforming growth factor beta signaling by associating with Smad partners. Molecular and cellular biology. 2000;20:6201-6211.
[151] Rodriguez C, Huang LJ, Son JK, McKee A, Xiao Z, Lodish HF. Functional cloning of the proto-oncogene brain factor-1 (BF-1) as a Smad-binding antagonist of transforming growth factor-beta signaling. The Journal of biological chemistry. 2001;276:30224-30230.
[152] Mahlapuu M, Enerback S, Carlsson P. Haploinsufficiency of the forkhead gene Foxf1, a target for sonic hedgehog signaling, causes lung and foregut malformations. Development (Cambridge, England). 2001;128:2397-2406.
[153] Perreault N, Katz JP, Sackett SD, Kaestner KH. Foxl1 controls the Wnt/beta-catenin pathway by modulating the expression of proteoglycans in the gut. The Journal of biological chemistry. 2001;276:43328-43333.
[154] Medema RH, Kops GJ, Bos JL, Burgering BM. AFX-like Forkhead transcription factors mediate cell-cycle regulation by Ras and PKB through p27kip1. Nature. 2000;404:782-787.
References
115
[155] Kops GJ, Burgering BM. Forkhead transcription factors: new insights into protein kinase B (c-akt) signaling. J Mol Med. 1999;77:656-665.
[156] Korver W, Roose J, Clevers H. The winged-helix transcription factor Trident is expressed in cycling cells. Nucleic acids research. 1997;25:1715-1719.
[157] Nishimura DY, Swiderski RE, Alward WL, et al. The forkhead transcription factor gene FKHL7 is responsible for glaucoma phenotypes which map to 6p25. Nat Genet. 1998;19:140-147.
[158] Mears AJ, Jordan T, Mirzayans F, et al. Mutations of the forkhead/winged-helix gene, FKHL7, in patients with Axenfeld-Rieger anomaly. Am J Hum Genet. 1998;63:1316-1328.
[159] Mirzayans F, Gould DB, Heon E, et al. Axenfeld-Rieger syndrome resulting from mutation of the FKHL7 gene on chromosome 6p25. Eur J Hum Genet. 2000;8:71-74.
[160] Semina EV, Brownell I, Mintz-Hittner HA, Murray JC, Jamrich M. Mutations in the human forkhead transcription factor FOXE3 associated with anterior segment ocular dysgenesis and cataracts. Hum Mol Genet. 2001;10:231-236.
[161] Crisponi L, Deiana M, Loi A, et al. The putative forkhead transcription factor FOXL2 is mutated in blepharophimosis/ptosis/epicanthus inversus syndrome. Nat Genet. 2001;27:159-166.
[162] Fang J, Dagenais SL, Erickson RP, et al. Mutations in FOXC2 (MFH-1), a forkhead family transcription factor, are responsible for the hereditary lymphedema-distichiasis syndrome. Am J Hum Genet. 2000;67:1382-1388.
[163] Bell R, Brice G, Child AH, et al. Analysis of lymphoedema-distichiasis families for FOXC2 mutations reveals small insertions and deletions throughout the gene. Hum Genet. 2001;108:546-551.
[164] Erickson RP, Dagenais SL, Caulder MS, et al. Clinical heterogeneity in lymphoedema-distichiasis with FOXC2 truncating mutations. J Med Genet. 2001;38:761-766.
[165] Brice G, Mansour S, Bell R, et al. Analysis of the phenotypic abnormalities in lymphoedema-distichiasis syndrome in 74 patients with FOXC2 mutations or linkage to 16q24. J Med Genet. 2002;39:478-483.
[166] Zhou Y, Kato H, Asanoma K, et al. Identification of FOXC1 as a TGF-beta1 responsive gene and its involvement in negative regulation of cell growth. Genomics. 2002;80:465-472.
[167] Harris SE, Chand AL, Winship IM, Gersak K, Aittomaki K, Shelling AN. Identification of novel mutations in FOXL2 associated with premature ovarian failure. Mol Hum Reprod. 2002;8:729-733.
[168] Frank J, Pignata C, Panteleyev AA, et al. Exposing the human nude phenotype. Nature. 1999;398:473-474.
References
116
[169] Lai CS, Fisher SE, Hurst JA, Vargha-Khadem F, Monaco AP. A forkhead-domain gene is mutated in a severe speech and language disorder. Nature. 2001;413:519-523.
[170] Lin L, Miller CT, Contreras JI, et al. The hepatocyte nuclear factor 3 alpha gene, HNF3alpha (FOXA1), on chromosome band 14q13 is amplified and overexpressed in esophageal and lung adenocarcinomas. Cancer Res. 2002;62:5273-5279.
[171] Nakamura T, Furukawa Y, Nakagawa H, et al. Genome-wide cDNA microarray analysis of gene expression profiles in pancreatic cancers using populations of tumor cells and normal ductal epithelial cells selected for purity by laser microdissection. Oncogene. 2004;23:2385-2400.
[172] Teh MT, Wong ST, Neill GW, Ghali LR, Philpott MP, Quinn AG. FOXM1 is a downstream target of Gli1 in basal cell carcinomas. Cancer Res. 2002;62:4773-4780.
[173] Parry P, Wei Y, Evans G. Cloning and characterization of the t(X;11) breakpoint from a leukemic cell line identify a new member of the forkhead gene family. Genes Chromosomes Cancer. 1994;11:79-84.
[174] Borkhardt A, Repp R, Haas OA, et al. Cloning and characterization of AFX, the gene that fuses to MLL in acute leukemias with a t(X;11)(q13;q23). Oncogene. 1997;14:195-202.
[175] Hillion J, Le Coniat M, Jonveaux P, Berger R, Bernard OA. AF6q21, a novel partner of the MLL gene in t(6;11)(q21;q23), defines a forkhead transcriptional factor subfamily. Blood. 1997;90:3714-3719.
[176] Cederberg A, Gronning LM, Ahren B, Tasken K, Carlsson P, Enerback S. FOXC2 is a winged helix gene that counteracts obesity, hypertriglyceridemia, and diet-induced insulin resistance. Cell. 2001;106:563-573.
[177] Brunet A, Datta SR, Greenberg ME. Transcription-dependent and -independent control of neuronal survival by the PI3K-Akt signaling pathway. Curr Opin Neurobiol. 2001;11:297-305.
[178] Iida K, Koseki H, Kakinuma H, et al. Essential roles of the winged helix transcription factor MFH-1 in aortic arch patterning and skeletogenesis. Development (Cambridge, England). 1997;124:4627-4638.
[179] Winnier GE, Kume T, Deng K, et al. Roles for the winged helix transcription factors MF1 and MFH1 in cardiovascular development revealed by nonallelic noncomplementation of null alleles. Dev Biol. 1999;213:418-431.
[180] Kume T, Jiang H, Topczewska JM, Hogan BL. The murine winged helix transcription factors, Foxc1 and Foxc2, are both required for cardiovascular development and somitogenesis. Genes Dev. 2001;15:2470-2482.
[181] Seo S, Fujita H, Nakano A, Kang M, Duarte A, Kume T. The forkhead transcription factors, Foxc1 and Foxc2, are required for arterial specification and lymphatic sprouting during vascular development. Dev Biol. 2006;294:458-470.
References
117
[182] Sasaki H, Hogan BL. Differential expression of multiple fork head related genes during gastrulation and axial pattern formation in the mouse embryo. Development (Cambridge, England). 1993;118:47-59.
[183] Hiemisch H, Monaghan AP, Schutz G, Kaestner KH. Expression of the mouse Fkh1/Mf1 and Mfh1 genes in late gestation embryos is restricted to mesoderm derivatives. Mech Dev. 1998;73:129-132.
[184] Swiderski RE, Reiter RS, Nishimura DY, et al. Expression of the Mf1 gene in developing mouse hearts: implication in the development of human congenital heart defects. Dev Dyn. 1999;216:16-27.
[185] Winnier GE, Hargett L, Hogan BL. The winged helix transcription factor MFH1 is required for proliferation and patterning of paraxial mesoderm in the mouse embryo. Genes Dev. 1997;11:926-940.
[186] Kume T, Deng K, Hogan BL. Murine forkhead/winged helix genes Foxc1 (Mf1) and Foxc2 (Mfh1) are required for the early organogenesis of the kidney and urinary tract. Development (Cambridge, England). 2000;127:1387-1395.
[187] Kume T, Deng KY, Winfrey V, Gould DB, Walter MA, Hogan BL. The forkhead/winged helix gene Mf1 is disrupted in the pleiotropic mouse mutation congenital hydrocephalus. Cell. 1998;93:985-996.
[188] Kidson SH, Kume T, Deng K, Winfrey V, Hogan BL. The forkhead/winged-helix gene, Mf1, is necessary for the normal development of the cornea and formation of the anterior chamber in the mouse eye. Dev Biol. 1999;211:306-322.
[189] Smith RS, Zabaleta A, Kume T, et al. Haploinsufficiency of the transcription factors FOXC1 and FOXC2 results in aberrant ocular development. Hum Mol Genet. 2000;9:1021-1032.
[190] Seo S, Kume T. Forkhead transcription factors, Foxc1 and Foxc2, are required for the morphogenesis of the cardiac outflow tract. Dev Biol. 2006;296:421-436.
[191] Hong HK, Lass JH, Chakravarti A. Pleiotropic skeletal and ocular phenotypes of the mouse mutation congenital hydrocephalus (ch/Mf1) arise from a winged helix/forkhead transcriptionfactor gene. Hum Mol Genet. 1999;8:625-637.
[192] Wilm B, James RG, Schultheiss TM, Hogan BL. The forkhead genes, Foxc1 and Foxc2, regulate paraxial versus intermediate mesoderm cell fate. Dev Biol. 2004;271:176-189.
[193] Rice R, Rice DP, Olsen BR, Thesleff I. Progression of calvarial bone development requires Foxc1 regulation of Msx2 and Alx4. Dev Biol. 2003;262:75-87.
[194] Rice R, Rice DP, Thesleff I. Foxc1 integrates Fgf and Bmp signalling independently of twist or noggin during calvarial bone development. Dev Dyn. 2005;233:847-852.
References
118
[195] Yamagishi H, Maeda J, Hu T, et al. Tbx1 is regulated by tissue-specific forkhead proteins through a common Sonic hedgehog-responsive enhancer. Genes Dev. 2003;17:269-281.
[196] Garlanda C, Parravicini C, Sironi M, et al. Progressive growth in immunodeficient mice and host cell recruitment by mouse endothelial cells transformed by polyoma middle-sized T antigen: implications for the pathogenesis of opportunistic vascular tumors. Proceedings of the National Academy of Sciences of the United States of America. 1994;91:7291-7295.
[197] Dalby B, Cates S, Harris A, et al. Advanced transfection with Lipofectamine 2000 reagent: primary neurons, siRNA, and high-throughput applications. Methods (San Diego, Calif. 2004;33:95-103.
[198] Roth MJ, Tanese N, Goff SP. Purification and characterization of murine retroviral reverse transcriptase expressed in Escherichia coli. The Journal of biological chemistry. 1985;260:9326-9335.
[199] Saiki RK, Gelfand DH, Stoffel S, et al. Primer-directed enzymatic amplification of DNA with a thermostable DNA polymerase. Science (New York, NY. 1988;239:487-491.
[200] Sanger F, Nicklen S, Coulson AR. DNA sequencing with chain-terminating inhibitors. Proceedings of the National Academy of Sciences of the United States of America. 1977;74:5463-5467.
[201] Birnboim HC, Doly J. A rapid alkaline extraction procedure for screening recombinant plasmid DNA. Nucleic acids research. 1979;7:1513-1523.
[202] Dagert M, Ehrlich SD. Prolonged incubation in calcium chloride improves the competence of Escherichia coli cells. Gene. 1979;6:23-28.
[203] Williams RJ. Restriction endonucleases: classification, properties, and applications. Molecular biotechnology. 2003;23:225-243.
[204] Tomkinson AE, Vijayakumar S, Pascal JM, Ellenberger T. DNA ligases: structure, reaction mechanism, and function. Chemical reviews. 2006;106:687-699.
[205] Smith M. In vitro mutagenesis. Annual review of genetics. 1985;19:423-462.
[206] Nelson M, McClelland M. Use of DNA methyltransferase/endonuclease enzyme combinations for megabase mapping of chromosomes. Methods in enzymology. 1992;216:279-303.
[207] McDonell MW, Simon MN, Studier FW. Analysis of restriction fragments of T7 DNA and determination of molecular weights by electrophoresis in neutral and alkaline gels. Journal of molecular biology. 1977;110:119-146.
[208] Nolan T, Hands RE, Bustin SA. Quantification of mRNA using real-time RT-PCR. Nature protocols. 2006;1:1559-1582.
References
119
[209] Zipper H, Brunner H, Bernhagen J, Vitzthum F. Investigations on DNA intercalation and surface binding by SYBR Green I, its structure determination and methodological implications. Nucleic acids research. 2004;32:e103.
[210] Livak KJ, Schmittgen TD. Analysis of relative gene expression data using real-time quantitative PCR and the 2(-Delta Delta C(T)) Method. Methods (San Diego, Calif. 2001;25:402-408.
[211] Loken MR, Parks DR, Herzenberg LA. Two-color immunofluorescence using a fluorescence-activated cell sorter. J Histochem Cytochem. 1977;25:899-907.
[212] Wood KV, de Wet JR, Dewji N, DeLuca M. Synthesis of active firefly luciferase by in vitro translation of RNA obtained from adult lanterns. Biochemical and biophysical research communications. 1984;124:592-596.
[213] Lorenz WW, McCann RO, Longiaru M, Cormier MJ. Isolation and expression of a cDNA encoding Renilla reniformis luciferase. Proceedings of the National Academy of Sciences of the United States of America. 1991;88:4438-4442.
[214] Burnette WN. "Western blotting": electrophoretic transfer of proteins from sodium dodecyl sulfate--polyacrylamide gels to unmodified nitrocellulose and radiographic detection with antibody and radioiodinated protein A. Analytical biochemistry. 1981;112:195-203.
[215] Smith PK, Krohn RI, Hermanson GT, et al. Measurement of protein using bicinchoninic acid. Analytical biochemistry. 1985;150:76-85.
[216] Welinder KG. Plant peroxidases. Their primary, secondary and tertiary structures, and relation to cytochrome c peroxidase. European journal of biochemistry / FEBS. 1985;151:497-504.
[217] Das PM, Ramachandran K, vanWert J, Singal R. Chromatin immunoprecipitation assay. BioTechniques. 2004;37:961-969.
[218] Gerhardt J, Jafar S, Spindler MP, Ott E, Schepers A. Identification of new human origins of DNA replication by an origin-trapping assay. Molecular and cellular biology. 2006;26:7731-7746.
[219] Cartharius K, Frech K, Grote K, et al. MatInspector and beyond: promoter analysis based on transcription factor binding sites. Bioinformatics (Oxford, England). 2005;21:2933-2942.
[220] Morgenstern B, Frech K, Dress A, Werner T. DIALIGN: finding local similarities by multiple sequence alignment. Bioinformatics (Oxford, England). 1998;14:290-294.
[221] van Buul JD, Hordijk PL. Signaling in leukocyte transendothelial migration. Arteriosclerosis, thrombosis, and vascular biology. 2004;24:824-833.
[222] Redick SD, Bautch VL. Developmental platelet endothelial cell adhesion molecule expression suggests multiple roles for a vascular adhesion molecule. Am J Pathol. 1999;154:1137-1147.
References
120
[223] Albelda SM, Muller WA, Buck CA, Newman PJ. Molecular and cellular properties of PECAM-1 (endoCAM/CD31): a novel vascular cell-cell adhesion molecule. J Cell Biol. 1991;114:1059-1068.
[224] Samatar AA, Wang L, Mirza A, Koseoglu S, Liu S, Kumar CC. Transforming growth factor-beta 2 is a transcriptional target for Akt/protein kinase B via forkhead transcription factor. The Journal of biological chemistry. 2002;277:28118-28126.
[225] Schlaeger TM, Bartunkova S, Lawitts JA, et al. Uniform vascular-endothelial-cell-specific gene expression in both embryonic and adult transgenic mice. Proceedings of the National Academy of Sciences of the United States of America. 1997;94:3058-3063.
[226] Nobrega MA, Ovcharenko I, Afzal V, Rubin EM. Scanning human gene deserts for long-range enhancers. Science (New York, NY. 2003;302:413.
[227] West AG, Fraser P. Remote control of gene transcription. Hum Mol Genet. 2005;14 Spec No 1:R101-111.
[228] Su AI, Wiltshire T, Batalov S, et al. A gene atlas of the mouse and human protein-encoding transcriptomes. Proceedings of the National Academy of Sciences of the United States of America. 2004;101:6062-6067.
[229] Smith AD, Sumazin P, Zhang MQ. Tissue-specific regulatory elements in mammalian promoters. Molecular systems biology. 2007;3:73.
[230] Pasqualini R, Ruoslahti E. Organ targeting in vivo using phage display peptide libraries. Nature. 1996;380:364-366.
[231] Rajotte D, Arap W, Hagedorn M, Koivunen E, Pasqualini R, Ruoslahti E. Molecular heterogeneity of the vascular endothelium revealed by in vivo phage display. J Clin Invest. 1998;102:430-437.
[232] Botella LM, Puig-Kroger A, Almendro N, et al. Identification of a functional NF-kappa B site in the platelet endothelial cell adhesion molecule-1 promoter. J Immunol. 2000;164:1372-1378.
[233] Aird WC, Jahroudi N, Weiler-Guettler H, Rayburn HB, Rosenberg RD. Human von Willebrand factor gene sequences target expression to a subpopulation of endothelial cells in transgenic mice. Proceedings of the National Academy of Sciences of the United States of America. 1995;92:4567-4571.
[234] Schlaeger TM, Qin Y, Fujiwara Y, Magram J, Sato TN. Vascular endothelial cell lineage-specific promoter in transgenic mice. Development (Cambridge, England). 1995;121:1089-1098.
[235] Aird WC, Edelberg JM, Weiler-Guettler H, Simmons WW, Smith TW, Rosenberg RD. Vascular bed-specific expression of an endothelial cell gene is programmed by the tissue microenvironment. J Cell Biol. 1997;138:1117-1124.
References
121
[236] Cabanas C, Sanchez-Madrid F, Bellon T, et al. Characterization of a novel myeloid antigen regulated during differentiation of monocytic cells. Eur J Immunol. 1989;19:1373-1378.
[237] Goldberger A, Middleton KA, Newman PJ. Changes in expression of the cell adhesion molecule PECAM-1 (CD31) during differentiation of human leukemic cell lines. Tissue Antigens. 1994;44:285-293.
[238] Almendro N, Bellon T, Rius C, et al. Cloning of the human platelet endothelial cell adhesion molecule-1 promoter and its tissue-specific expression. Structural and functional characterization. J Immunol. 1996;157:5411-5421.
[239] Okouchi M, Okayama N, Imai S, et al. High insulin enhances neutrophil transendothelial migration through increasing surface expression of platelet endothelial cell adhesion molecule-1 via activation of mitogen activated protein kinase. Diabetologia. 2002;45:1449-1456.
[240] Fujita H, Kang M, Eren M, Gleaves LA, Vaughan DE, Kume T. Foxc2 is a common mediator of insulin and transforming growth factor beta signaling to regulate plasminogen activator inhibitor type I gene expression. Circ Res. 2006;98:626-634.
[241] Ma GT, Roth ME, Groskopf JC, et al. GATA-2 and GATA-3 regulate trophoblast-specific gene expression in vivo. Development (Cambridge, England). 1997;124:907-914.
[242] Li Q, Estepa G, Memet S, Israel A, Verma IM. Complete lack of NF-kappaB activity in IKK1 and IKK2 double-deficient mice: additional defect in neurulation. Genes Dev. 2000;14:1729-1733.
[243] Minami T, Kuivenhoven JA, Evans V, Kodama T, Rosenberg RD, Aird WC. Ets motifs are necessary for endothelial cell-specific expression of a 723-bp Tie-2 promoter/enhancer in Hprt targeted transgenic mice. Arteriosclerosis, thrombosis, and vascular biology. 2003;23:2041-2047.
[244] Arany Z, Huang LE, Eckner R, et al. An essential role for p300/CBP in the cellular response to hypoxia. Proceedings of the National Academy of Sciences of the United States of America. 1996;93:12969-12973.
[245] van der Heide LP, Smidt MP. Regulation of FoxO activity by CBP/p300-mediated acetylation. Trends Biochem Sci. 2005;30:81-86.
[246] Vogt P. Potential genetic functions of tandem repeated DNA sequence blocks in the human genome are based on a highly conserved "chromatin folding code". Hum Genet. 1990;84:301-336.
[247] Stallings RL. Distribution of trinucleotide microsatellites in different categories of mammalian genomic sequence: implications for human genetic diseases. Genomics. 1994;21:116-121.
[248] Weber JL, Wong C. Mutation of human short tandem repeats. Hum Mol Genet. 1993;2:1123-1128.
References
122
[249] Djian P. Evolution of simple repeats in DNA and their relation to human disease. Cell. 1998;94:155-160.
[250] Tautz D. Hypervariability of simple sequences as a general source for polymorphic DNA markers. Nucleic acids research. 1989;17:6463-6471.
[251] Iglesias AR, Kindlund E, Tammi M, Wadelius C. Some microsatellites may act as novel polymorphic cis-regulatory elements through transcription factor binding. Gene. 2004;341:149-165.
[252] Johnson AC, Jinno Y, Merlino GT. Modulation of epidermal growth factor receptor proto-oncogene transcription by a promoter site sensitive to S1 nuclease. Molecular and cellular biology. 1988;8:4174-4184.
[253] Hoffman EK, Trusko SP, Murphy M, George DL. An S1 nuclease-sensitive homopurine/homopyrimidine domain in the c-Ki-ras promoter interacts with a nuclear factor. Proceedings of the National Academy of Sciences of the United States of America. 1990;87:2705-2709.
[254] Contente A, Dittmer A, Koch MC, Roth J, Dobbelstein M. A polymorphic microsatellite that mediates induction of PIG3 by p53. Nat Genet. 2002;30:315-320.
[255] Syagailo YV, Okladnova O, Reimer E, et al. Structural and functional characterization of the human PAX7 5'-flanking regulatory region. Gene. 2002;294:259-268.
[256] Kashi Y, King D, Soller M. Simple sequence repeats as a source of quantitative genetic variation. Trends Genet. 1997;13:74-78.
[257] Roth J, Koch P, Contente A, Dobbelstein M. Tumor-derived mutations within the DNA-binding domain of p53 that phenotypically resemble the deletion of the proline-rich domain. Oncogene. 2000;19:1834-1842.
[258] Gaudet J, Mango SE. Regulation of organogenesis by the Caenorhabditis elegans FoxA protein PHA-4. Science (New York, NY. 2002;295:821-825.
[259] Rubinsztein DC, Leggo J, Amos W. Microsatellites evolve more rapidly in humans than in chimpanzees. Genomics. 1995;30:610-612.
[260] Odom DT, Dowell RD, Jacobsen ES, et al. Tissue-specific transcriptional regulation has diverged significantly between human and mouse. Nat Genet. 2007;39:730-732.
[261] Zaret KS. Regulatory phases of early liver development: paradigms of organogenesis. Nat Rev Genet. 2002;3:499-512.
[262] Baeuerle PA, Henkel T. Function and activation of NF-kappa B in the immune system. Annu Rev Immunol. 1994;12:141-179.
[263] Collins T, Read MA, Neish AS, Whitley MZ, Thanos D, Maniatis T. Transcriptional regulation of endothelial cell adhesion molecules: NF-kappa B and cytokine-inducible enhancers. Faseb J. 1995;9:899-909.
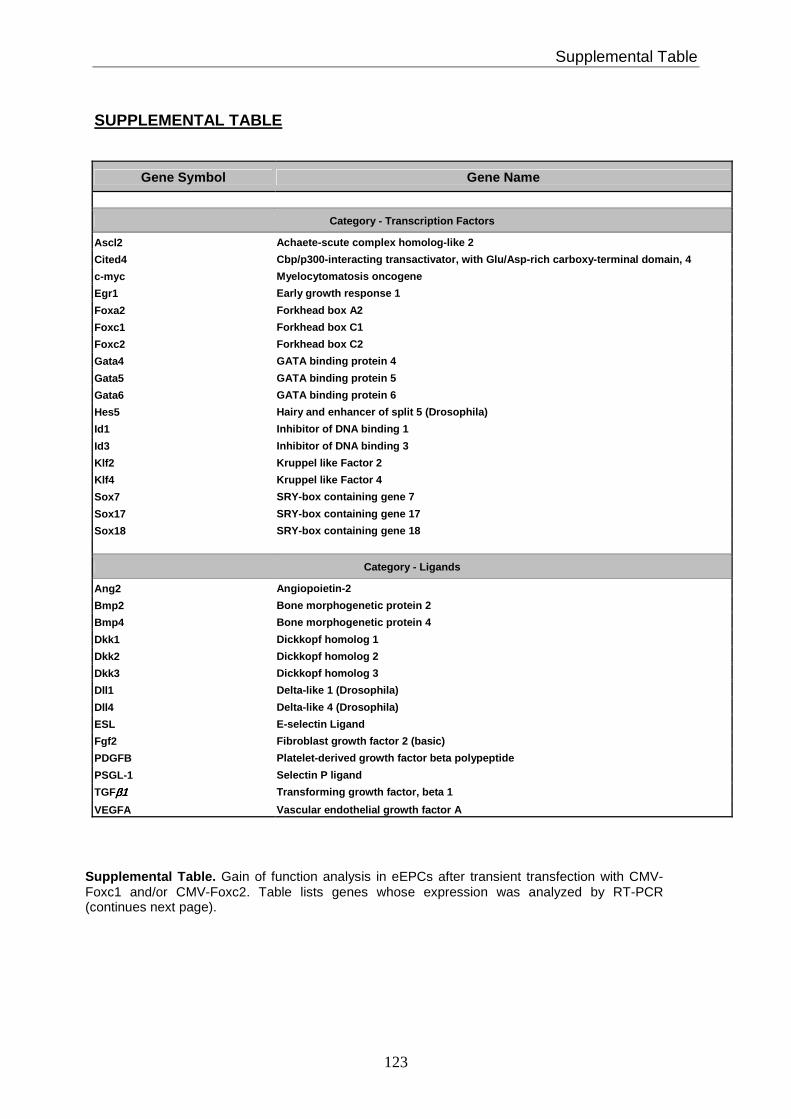
Supplemental Table
123
SUPPLEMENTAL TABLE
Gene Symbol Gene Name
Category - Transcription Factors
Ascl2 Achaete-scute complex homolog-like 2
Cited4 Cbp/p300-interacting transactivator, with Glu/Asp-r ich carboxy-terminal domain, 4
c-myc Myelocytomatosis oncogene
Egr1 Early growth response 1
Foxa2 Forkhead box A2
Foxc1 Forkhead box C1
Foxc2 Forkhead box C2
Gata4 GATA binding protein 4
Gata5 GATA binding protein 5
Gata6 GATA binding protein 6
Hes5 Hairy and enhancer of split 5 (Drosophila)
Id1 Inhibitor of DNA binding 1
Id3 Inhibitor of DNA binding 3
Klf2 Kruppel like Factor 2
Klf4 Kruppel like Factor 4
Sox7 SRY-box containing gene 7
Sox17 SRY-box containing gene 17
Sox18 SRY-box containing gene 18
Category - Ligands
Ang2 Angiopoietin-2
Bmp2 Bone morphogenetic protein 2
Bmp4 Bone morphogenetic protein 4
Dkk1 Dickkopf homolog 1
Dkk2 Dickkopf homolog 2
Dkk3 Dickkopf homolog 3
Dll1 Delta-like 1 (Drosophila)
Dll4 Delta-like 4 (Drosophila)
ESL E-selectin Ligand
Fgf2 Fibroblast growth factor 2 (basic)
PDGFB Platelet-derived growth factor beta polypeptide
PSGL-1 Selectin P ligand
TGFβ1β1β1β1 Transforming growth factor, beta 1
VEGFA Vascular endothelial growth factor A
Supplemental Table. Gain of function analysis in eEPCs after transient transfection with CMV-Foxc1 and/or CMV-Foxc2. Table lists genes whose expression was analyzed by RT-PCR (continues next page).
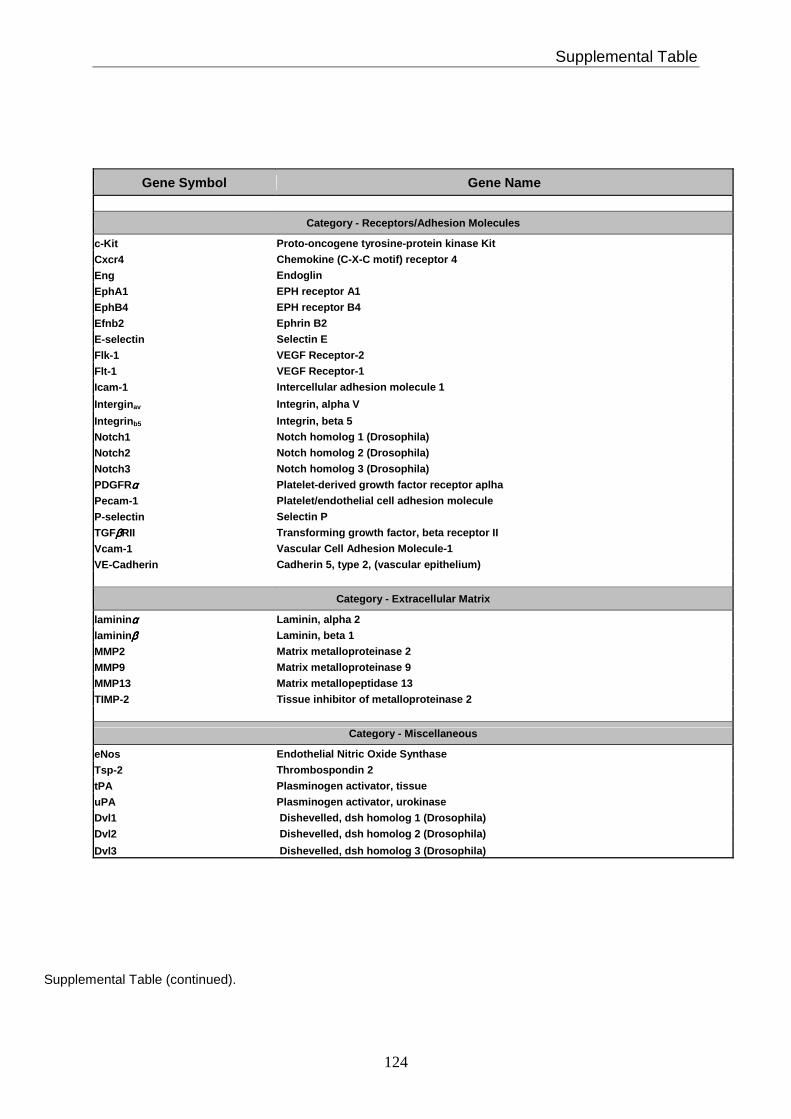
Supplemental Table
124
Gene Symbol Gene Name
Category - Receptors/Adhesion Molecules
c-Kit Proto-oncogene tyrosine-protein kinase Kit
Cxcr4 Chemokine (C-X-C motif) receptor 4
Eng Endoglin
EphA1 EPH receptor A1
EphB4 EPH receptor B4
Efnb2 Ephrin B2
E-selectin Selectin E
Flk-1 VEGF Receptor-2
Flt-1 VEGF Receptor-1
Icam-1 Intercellular adhesion molecule 1
Interginav Integrin, alpha V
Integrinb5 Integrin, beta 5
Notch1 Notch homolog 1 (Drosophila)
Notch2 Notch homolog 2 (Drosophila)
Notch3 Notch homolog 3 (Drosophila)
PDGFRαααα Platelet-derived growth factor receptor aplha
Pecam-1 Platelet/endothelial cell adhesion molecule
P-selectin Selectin P
TGFββββRII Transforming growth factor, beta receptor II
Vcam-1 Vascular Cell Adhesion Molecule-1
VE-Cadherin Cadherin 5, type 2, (vascular epithelium)
Category - Extracellular Matrix
lamininαααα Laminin, alpha 2
lamininββββ Laminin, beta 1
MMP2 Matrix metalloproteinase 2
MMP9 Matrix metalloproteinase 9
MMP13 Matrix metallopeptidase 13
TIMP-2 Tissue inhibitor of metalloproteinase 2
Category - Miscellaneous
eNos Endothelial Nitric Oxide Synthase
Tsp-2 Thrombospondin 2
tPA Plasminogen activator, tissue
uPA Plasminogen activator, urokinase
Dvl1 Dishevelled, dsh homolog 1 (Drosophila)
Dvl2 Dishevelled, dsh homolog 2 (Drosophila)
Dvl3 Dishevelled, dsh homolog 3 (Drosophila)
Supplemental Table (continued).
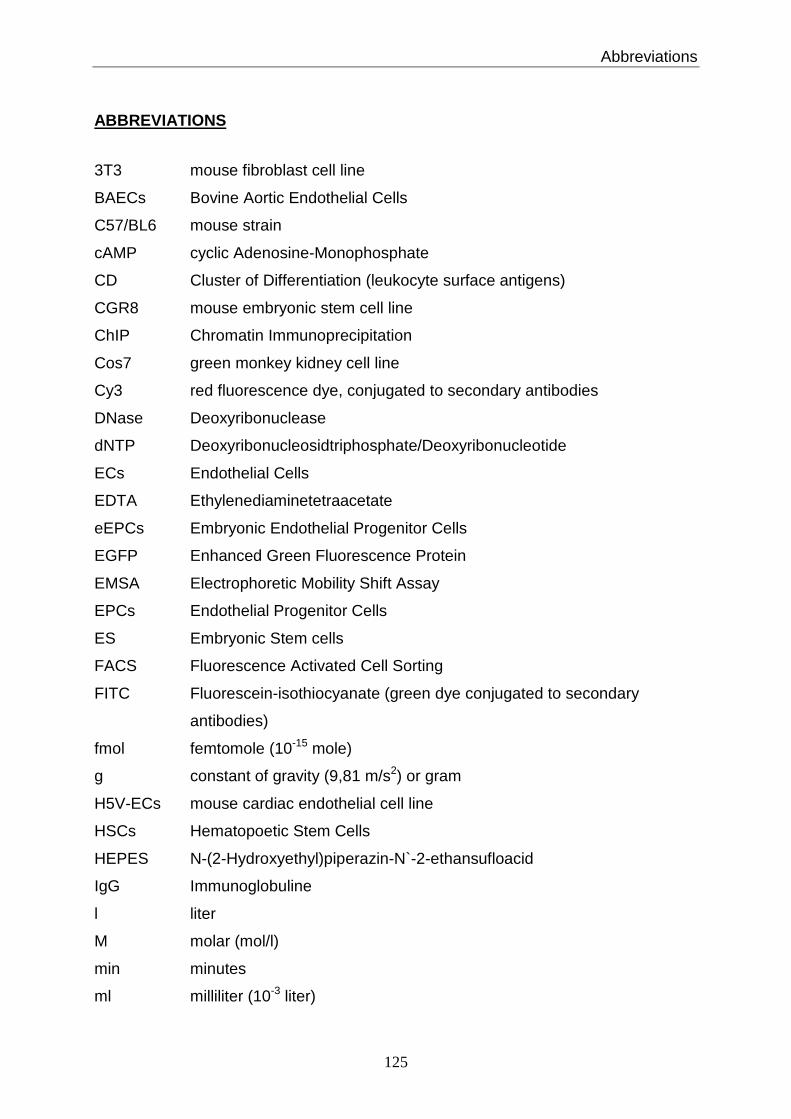
Abbreviations
125
ABBREVIATIONS
3T3 mouse fibroblast cell line
BAECs Bovine Aortic Endothelial Cells
C57/BL6 mouse strain
cAMP cyclic Adenosine-Monophosphate
CD Cluster of Differentiation (leukocyte surface antigens)
CGR8 mouse embryonic stem cell line
ChIP Chromatin Immunoprecipitation
Cos7 green monkey kidney cell line
Cy3 red fluorescence dye, conjugated to secondary antibodies
DNase Deoxyribonuclease
dNTP Deoxyribonucleosidtriphosphate/Deoxyribonucleotide
ECs Endothelial Cells
EDTA Ethylenediaminetetraacetate
eEPCs Embryonic Endothelial Progenitor Cells
EGFP Enhanced Green Fluorescence Protein
EMSA Electrophoretic Mobility Shift Assay
EPCs Endothelial Progenitor Cells
ES Embryonic Stem cells
FACS Fluorescence Activated Cell Sorting
FITC Fluorescein-isothiocyanate (green dye conjugated to secondary
antibodies)
fmol femtomole (10-15 mole)
g constant of gravity (9,81 m/s2) or gram
H5V-ECs mouse cardiac endothelial cell line
HSCs Hematopoetic Stem Cells
HEPES N-(2-Hydroxyethyl)piperazin-N`-2-ethansufloacid
IgG Immunoglobuline
l liter
M molar (mol/l)
min minutes
ml milliliter (10-3 liter)
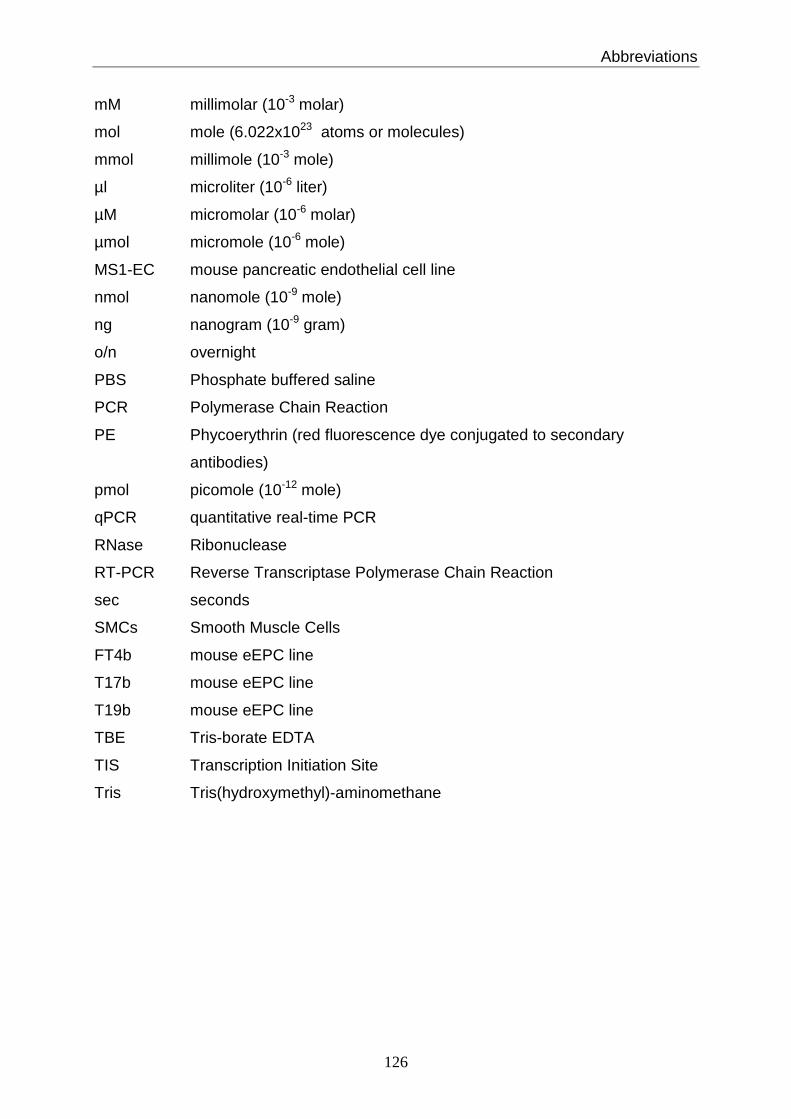
Abbreviations
126
mM millimolar (10-3 molar)
mol mole (6.022x10²³ atoms or molecules)
mmol millimole (10-3 mole)
µl microliter (10-6 liter)
µM micromolar (10-6 molar)
µmol micromole (10-6 mole)
MS1-EC mouse pancreatic endothelial cell line
nmol nanomole (10-9 mole)
ng nanogram (10-9 gram)
o/n overnight
PBS Phosphate buffered saline
PCR Polymerase Chain Reaction
PE Phycoerythrin (red fluorescence dye conjugated to secondary
antibodies)
pmol picomole (10-12 mole)
qPCR quantitative real-time PCR
RNase Ribonuclease
RT-PCR Reverse Transcriptase Polymerase Chain Reaction
sec seconds
SMCs Smooth Muscle Cells
FT4b mouse eEPC line
T17b mouse eEPC line
T19b mouse eEPC line
TBE Tris-borate EDTA
TIS Transcription Initiation Site
Tris Tris(hydroxymethyl)-aminomethane

Acknowledgments
127
ACKNOWLEDGMENTS I want to thank � Dr. Antonis Hatzopoulos, leader of the Vascular Genetics group at the
Hämatologikum GSF, and Associate Professor at the Cardiovascular Medicine
Division at Vanderbilt University Medical Center, for the great opportunity to
develop a Ph.D. thesis under his supervision and to work on this interesting
project, as well as for his permanent support and help during the entire Ph.D.
project.
� Prof. Dr. Dirk Eick, Hämatologikum GSF, and Department of Genetics at the
Ludwig-Maximilians-University of Munich, for his willingness to supervise this
Ph.D. thesis as doctoral thesis supervisor (Doktorvater) and for his continuous
support during the entire Ph.D. project.
� Dr. Heike Beck, Hämatologikum GSF, for her help with tissue sectioning,
histology and immunoflurescence.
� Dr. Jürgen Schoch, Hämatologikum GSF, for his help with primer design.
� Dr. Georgios Vlastos, Hämatologikum GSF, for his help with FACS Analysis.
� Dr. Reinhardt Mailhammer, Hämatologikum GSF, for his help with the
LightCycler System.
� Albert Geishauser, Hämatologikum GSF, for his help with tissue sectioning
and microscopy.
� Dr. Scott Baldwin, Vanderbilt University Medical Center, for providing the
Pecam-1 promoter plasmids and sharing ideas about the project.
� Drew Misfeld, Vanderbilt University Medical Center, for his great help with
mouse embryo isolation and LacZ-staining.

Acknowledgments
128
� Dr. Jeannine Gerhardt, Vanderbilt University Medical Center, for her great help
with and sharing ideas about ChIP analysis, and her help with the LightCycler
System.
� Dr. Meena Rai, Vanderbilt University Medical Center, for her help with
Western Blot analysis.
� Dr. Jingbo Yan, Vanderbilt University Medical Center, for his help with mouse
embryo isolation and bioinformatics software.
� Dr. Tom Kume, Vanderbilt University Medical Center, for providing the Fox-
expression plasmids.
� All lab members at Vanderbilt University for the great atmosphere and team
work during my stay at Vanderbilt University.
� All lab members from the Vascular Genetics group for the great atmosphere
and team work at the Hämatologikum, GSF.
Publications
129
LIST OF PUBLICATIONS
� Lamparter M , Misfeldt D, Gerhardt J, Baldwin HS, Hatzopoulos AK. Foxc1
regulates Pecam-1 expression in embryonic endothelial progenitor cells. (In
Preparation).
� Lamparter M , Hatzopoulos AK. In Angiogenesis: Basic Science and Clinical
Applications. (Maragoudakis ME, Papadimitriou E, Eds). Transworld Research
Network, Kerala, India. (2007).
� Lamparter M , Hatzopoulos AK. In Therapeutic Neovascularization: Quo
vadis? (Deindl E, Kupatt C, Eds). Springer, Dordrecht, The Netherlands, pp.
197-214, 2007
� Ryzhov S, Solenkova NV, Goldstein AE, Lamparter M , Fleenor T, Young PP,
Greelish JP, Byrne JG, Vaughan DE, Biaggioni I, Hatzopoulos AK, Feoktistov
I. Adenosine Receptor Mediated Adhesion of Endothelial Progenitors to
Cardiac Microvascular Endothelial Cells. Circ Res. 2007 Nov 21 [Epub ahead
of print].
� Kupatt C, Hinkel R, Lamparter M , von Brühl ML, Pohl T, Horstkotte J, Beck H,
Müller S, Delker S, Gildehaus FJ, Büning H, Hatzopoulos AK, Boekstegers P.
Retroinfusion of embryonic endothelial progenitor cells attenuates ischemia-
reperfusion injury in pigs: role of phosphatidylinositol 3-kinase/AKT kinase.
Circulation 112:I117-122, 2005.
� Kupatt C, Horstkotte J, Vlastos GA, Pfosser A, Lebherz C, Semisch M,
Thalgott M, Büttner K, Browarzyk C, Mages J, Hoffmann R, Deten A,
Lamparter M , Müller F, Beck H, Büning H, Boekstegers P, Hatzopoulos AK.
Embryonic endothelial progenitor cells expressing a broad range of
proangiogenic and remodeling factors enhance vascularization and tissue
recovery in acute and chronic ischemia. FASEB J. 19:1576-1578, 2005.
Publications
130
� Wei J, Blum S, Unger M, Jarmy G, Lamparter M , Geishauser A, Vlastos GA,
Chan G, Fischer KD, Rattat D, Debatin KM, Hatzopoulos AK, Beltinger C.
Embryonic endothelial progenitor cells armed with a suicide gene target
hypoxic lung metastases after intravenous delivery. Cancer Cell 5:477-488,
2004.
� Vajkoczy P, Blum S, Lamparter M , Mailhammer R, Erber R, Engelhardt B,
Vestweber D, Hatzopoulos AK. Multistep nature of microvascular recruitment
of ex vivo-expanded embryonic endothelial progenitor cells during tumor
angiogenesis. J Exp Med 197:1755-1765, 2003.
Lebenslauf
Persönliche Daten
Familienname Lamparter
Vorname Mathias Geburtsdatum 03.12.1976
Geburtsort München
Staatsangehörigkeit deutsch
Hochschulausbildung
10/2002-01/2008 Promotion
Promotionsstudent an der Fakultät für Biologie der Ludwig-Maximilians
Universität München; Ausführung der Promotion am Institut für Klinische Molekularbiologie und
Tumorgenetik, Helmholtz Zentrum München (ehemals GSF
Forschungszentrum für Umwelt und Gesundheit), Arbeitsgruppe Vaskulare Genetik, Dr. Antonis Hatzopoulos (10/2002-01/2005);
Fortsetzung der Promotion am Vanderbilt University Medical Center, Nashville, Tennessee, USA - Institute for Cardiovascular Medicine, Prof. Dr. Antonis Hatzopoulos (02/2005-11/2007);
Doktorvater: Prof. Dr. Dirk Eick , Institut für Klinische Molekularbiologie und
Tumorgenetik, Helmholtz Zentrum München ([email protected]) 11/1997-06/2002 Biologiestudium an der Technischen Universität München zur Erlangung
des Grades Diplom-Biologe - Gesamtnote 1,1 (mit Auszeichnung bestanden)
Hauptstudium - Schwerpunktfach: Technische Biologie
Hauptstudium - Nebenfächer: Genetik, Virologie, Biochemie 11/2001-06/2002 Diplomarbeit am Institut für Klinische Molekularbiologie und Tumorgenetik,
Helmholtz Zentrum München, Arbeitsgruppe Vaskulare Genetik, Dr. Antonis Hatzopoulos Titel: “Investigation of homing and activation of embryonic endothelial progenitor cells in tumor angiogenesis” - (Note 1,0)
Schulische Ausbildung
1996 Abitur am Heinrich-Heine-Gymnasium, München (Note: 2,8)


