Embed Size (px)
Citation preview

A&A 519, A22 (2010)DOI: 10.1051/0004-6361/201014101c© ESO 2010
Astronomy&
Astrophysics
Formation of methyl formate after cosmic ionirradiation of icy grain mantles
P. Modica and M. E. Palumbo
INAF – Osservatorio Astrofisico di Catania, via Santa Sofia 78, 95123 Catania, Italye-mail: [email protected]
Received 19 January 2010 / Accepted 25 May 2010
ABSTRACT
Context. Methyl formate (HCOOCH3) is a complex organic molecule detected in hot cores and hot corinos. Gas-phase chemistry failsto reproduce its observed abundance, which usually varies between 10−7 and 10−9 with respect to H2.Aims. Laboratory experiments were performed in order to investigate a solid-state route of methyl formate formation, to obtain anestimate of the amount that can be formed, and to verify whether it can account for the observed abundances.Methods. Several solid samples (16 K) of astrophysical interest were analyzed by infrared spectroscopy in the 4400−400 cm−1
range. The infrared spectral characteristics of frozen methyl formate were studied by deriving their band strength values. The effectsproduced upon warm-up of the samples were analyzed comparing the spectra taken at different temperatures. In order to study theformation and destruction mechanism of methyl formate in the interstellar ices, a binary mixture of methanol (CH3OH) and carbonmonoxide (CO) ice and a sample of pure methanol were irradiated at 16 K with 200 keV protons. Methyl formate was identifiedthrough its fundamental mode (CH3 rocking) at about 1160 cm−1.Results. We present the mid-infrared methyl formate ice spectrum showing both the amorphous (16 K) and the crystalline (110 K)structure. We report novel measurements of the band strength values of the six main methyl formate bands. We prove the formation andthe destruction of methyl formate after irradiation of CH3OH and a CO:CH3OH mixture. Extrapolating our results to the interstellarmedium conditions we found that the production timescale of methyl formate agrees well with the evolutionary time of molecularclouds. The comparison with the observational data indicates that the amount of methyl formate formed after irradiation can accountfor the observed abundances.Conclusions. The present results allow us to suggest that gas phase methyl formate observed in dense molecular clouds is formedin the solid state after cosmic ion irradiation of icy grain mantles containing CO and CH3OH and released to the gas phase afterdesorption of icy mantles.
Key words. astrochemistry – molecular data – ISM: abundances – ISM: clouds – methods: laboratory
1. Introduction
Dust grains inside dense molecular clouds are covered byicy mantles. These are volatile structures consisting of simplemolecules and atoms such as carbon monoxide, oxygen, and ni-trogen. Other molecules can be produced on the grain surface bysuccessive hydrogenation of condensed species and/or interac-tion with low-energy cosmic rays and UV photons (e.g. Tielens& Hagen 1982; Grim & Greenberg 1987; Palumbo & Strazzulla1993). The radiation field modifies the pristine ices ionizing themolecules and producing radicals that after recombination canform new species. As a consequence icy mantles are composedof water, carbon monoxide, carbon dioxide, traces of formalde-hyde, methanol, ammonia, and possibly even more complexmolecules (e.g. Boogert et al. 2008; Gerakines et al. 1999).When a young stellar object begins to form, the dust reachesthe appropriate sublimation temperature of the ices, then the icymantles sublime releasing their components into the gas phase.They may condense onto the grain surface again during theproto-planetary disk phase. Perhaps they are incorporated intothe planetesimal forming the building blocks of planets, or intocomets and asteroids.
In the astrophysical context, organic molecules with morethan four atoms are usually considered complex and arecalled complex organic molecules (COMs). Some COMs are
interesting to biology because they are linked to the origin oflife. They are known to exist in hot cores of star-forming regions(e.g. Ikeda et al. 2001), which are characterized by relativelyhigh temperature (T ≥ 100 K) and density (n ≥ 106 cm−3). Inthese objects icy mantles have sublimated. For over two decades,COMs have been detected only in massive hot cores, while re-cently they have also been observed in three hot corinos, low-mass star-forming regions (Cazaux et al. 2003; Kuan et al. 2004;Bottinelli et al. 2004a,b). Because hot corinos have sizes of a fewtens of AU, the size of the solar nebula, it is particularly rele-vant to study the COMs formation and destruction mechanismbecause of the link to the formation of the Solar System. Suchcomplex molecules would provide early proto-planetary nebulaewith a rich organic inventory similarly to that expected to haveoccurred in our presolar nebula. Clues that connect the interstel-lar chemistry to the Solar System can be found in the cometarydetection of COMs (Sandford et al. 2006) because comets arebelieved to contain the most pristine material remaining from thepresolar nebula. They may have carried prebiotic organic chem-istry from the interstellar clouds to the early Earth.
Of the COMs detected so far, special attention has beenpaid to the formation of the C2H4O2 isomers − methyl formate(HCOOCH3), acetic acid (CH3COOH), and glycolaldehyde(HOCH2CHO) − molecules that have the same chemical for-mula but differ in the way atoms are connected. These molecules
Article published by EDP Sciences Page 1 of 10

A&A 519, A22 (2010)
may provide important clues to the formation chemistry of largebiomolecules. From recent observations in Sgr B2 N(NLH), it isestimated that the relative abundances of the three molecules are1864:103:1 (methyl formate: acetic acid: glycolaldehyde) andthe fractional abundances relative to H2 are 3.7 × 10⁻⁸, 2.0 ×10⁻⁹, 2.0 × 10⁻¹¹ for methyl formate, acetic acid, and glyco-laldehyde respectively (Bennett & Kaiser 2007).
This paper focuses on methyl formate (HCOOCH3), themost abundant of C2H4O2 isomers in hot cores. Methyl formatemay provide a connection to acetic acid (CH3COOH) and evento glycine (NH2CH2COOH), the simplest biologically impor-tant amino acid. The first detection of interstellar methyl for-mate was made by Brown et al. (1975) toward the star-formingregion Sgr B2. After it has been detected in several hot cores,in three hot corinos (Bottinelli et al. 2007), and in comets(Bockelée-Morvan et al. 2000; Despois et al. 2005; Remijanet al. 2006). All these detections suggest that methyl formatemay be widely distributed in the Galaxy.
One of the open questions about methyl formate is to explainits abundance in the interstellar medium. Although it is generallyaccepted that methyl formate can be produced from methanolformed in the icy grain mantles, models based only on gas-phasereactions are unable to account for the observed abundances.Until a few years ago it was thought that methyl formate couldbe formed in the gas phase after the sublimation of icy man-tles containing H2CO and CH3OH. Horn and colleagues studiedthe specific sequence of reactions that was supposed to lead tothe synthesis of methyl formate (Horn et al. 2004). The resultsof their theoretical and experimental gas-phase study have con-clusively shown that the processes in the gas phase are unableto produce sufficient amounts of methyl formate. This evidencehas profoundly changed the standard production scenario sug-gesting that methyl formate should be produced mainly by re-actions in ices rather than in gas phase. Nowadays new routesof formation and destruction have been proposed in literature,pointing to a much more important role for grain surface reac-tions and energetic processing of icy mantles than previouslybelieved. Mixtures of methanol and carbon monoxide ices wereirradiated at 10 K with energetic electrons (Bennett & Kaiser2007), establishing the formation of glycolaldehyde and methylformate. Furthermore methyl formate has been observed afterUV photolysis of pure CH3OH and CO:CH3OH ice mixtures(Gerakines et al. 1996; Öberg et al. 2009).
Methyl formate has not yet been observed in the solidstate as a component of icy grain mantles because its strongestbands overlap with those from other present and more abun-dant molecules. Both CO and CH3OH are found to be abun-dant within the grain mantles. Recently, it was experimentallyshown that CH3OH can be produced efficiently by successivehydrogenation of CO (Watanabe et al. 2007; Fuchs et al. 2009).As a consequence, these two components are supposed to residewell mixed in the icy mantles.
In this work we will investigate the formation and destruc-tion of methyl formate in the solid state after cosmic ion irra-diation of icy grain mantles containing CO and CH3OH. Ourpurpose is to study in the laboratory the formation mechanismsuggested, to quantitatively evaluate the amount of methyl for-mate that can be formed, and to assess whether it is able toproduce methyl formate in such quantities to justify the ob-served abundances in the interstellar medium. In this regard weconducted experiments that simulate the chemical-physical ef-fects induced on icy mantles after cosmic ion irradiation. In or-der to study the formation of methyl formate within interstel-lar ices, we chose to investigate the effects of 200 keV protons
on a binary ice mixture of carbon monoxide and methanol(CO:CH3OH = 1.6:1) and a sample of pure methanol at 16 K.These effects were studied by infrared spectroscopy. We haveperformed new laboratory experiments, which enabled us to ob-tain an estimate of the amount of methyl formate formed afterirradiation.
2. Experimental procedure
2.1. Experimental set-up
The present experiments were performed in the Laboratory forExperimental Astrophysics at INAF-Osservatorio Astrofisico diCatania (Italy). The experimental apparatus used to obtain in-frared transmission spectra is composed of a stainless steelhigh-vacuum chamber operating at a pressure P < 10−7 mbarinterfaced with a FTIR spectrometer (4400−400 cm−1 =2.27−25 μm) through IR-transparent windows. The gas or gasmixture to be investigated is injected into the chamber througha needle valve and subsequently frozen onto a chosen sub-strate (Si or KBr) that is in thermal contact with a cold finger(10−300 K).
After deposition the samples were bombarded by 200 keVH+ ions. The ions are obtained from an ion implanter interfacedwith the vacuum chamber. The beam used produces current den-sities in the range from 10−1 to a few μA cm−2 in order to avoidmacroscopic heating of the target. The ion beam and the in-frared beam are mutually perpendicular while they form an an-gle of 45 degrees with the substrate plane. In this way, spectracan be taken at any time, before, during, and after irradiation,without tilting the sample. The energy released to the sampleby impinging ions (dose) is given in eV/16 u, where u is theunified atomic mass unit defined as 1/12 of the mass of an iso-lated atom of carbon-12. As discussed by Strazzulla & Johnson(1991), the dose given in units of eV per small molecule (16 u) isa convenient way to characterize chemical changes and comparethe results obtained irradiating different samples.
For each sample, after each step of irradiation, two spectraare taken, one with the electric vector parallel (P polarized) andone perpendicular (S polarized) to the plane of incidence, wherethe polarization of the infrared radiation is selected by rotating apolarizer placed in the path of the infrared beam in front of thedetector. All spectra in this work are ratioed to the correspondingspectrum of the background acquired before deposition and weretaken at a resolution of 1 cm−1. Each spectrum is plotted on anoptical depth scale using the relation I = I0 · e−τ (Beer-Lambertlaw), where τ = α · x (α = absorption coefficient; x = path lengththrough the material).
A detailed description of the experimental apparatus usedcan be found elsewhere (Strazzulla et al. 2001; Palumbo et al.2004).
2.2. Thickness measurement
In this experimental set-up it is possible to measure the thicknessof the frozen samples. Here we followed the same procedure de-scribed in Fulvio et al. (2009). During deposition a He-Ne laserbeam (λ = 543 nm) is directed towards the sample and re-flected by the vacuum-sample and the sample-substrate inter-faces (Fig. 1). After the reflection the laser beam is detected byan external silicon-diode detector. Between the reflected com-ponents of the laser beam there is a difference of optical path,which grows with increasing thickness. Because of this, inter-ference is produced. By looking in real time at the interference
Page 2 of 10

P. Modica and M. E. Palumbo: Formation of methyl formate
Fig. 1. Scheme of the multiple reflections of the laser beam by thevacuum-sample and the sample-substrate interfaces.
curve (intensity versus time) it is possible to monitor the accre-tion of the sample during deposition. We used two different sub-strates for deposition: Si and KBr.
To measure the thickness of the sample it is first of all neces-sary to determine its refractive index nf . We can obtain this valuefrom the interference curve with a numerical method (Baratta &Palumbo 1998). Because the amplitude of the experimental in-terference curve depends on the refractive index nf and on otherknown quantities (the refractive index ns of the substrate, the in-cidence angle θi, and the polarization of the laser light), nf canbe derived measuring the intensity ratio between maxima andminima in the experimental interference curve. For HCOOCH3deposited on Si at 16 K, the value found is nf = 1.30.
Once nf was derived, we could also obtain the theoreti-cal interference curve (reflectance) versus thickness. For non-absorbing materials this curve is a periodic function. We couldmeasure the thickness of the deposited sample by comparing thetheoretical interference curve with the experimental one, nor-malized from 0 to 1. For each chosen point on the experimentalinterference curve, we normalized the intensity value of radi-ation from 0 to 1. Then in the theoretical curve we identifiedthe point at which this ordinate corresponds. The abscissa ofthe point found is the value of the thickness. We considered fivethickness values.
The absolute accuracy of the thickness measured in this wayis about 5%. It is limited mainly by the uncertainties in theknowledge of the optical constants of the substrate at low tem-perature and by the error in measuring the incidence angle of thelaser beam. The thickness is corrected by a factor of
1cos θr
=1√
1 − sin2 θin2
f
, (1)
where θr is the refractive angle. This correction takes into ac-count the increased path length of the IR beam at an incidenceangle θi = 45 deg.
3. Results
3.1. HCOOCH3
Methyl formate (HCOOCH3) is the methyl ester of formic acid(HCOOH). Its mid-infrared spectrum at 16 K (see Fig. 2) showssix main absorption bands due to molecular vibrations. Thestrong band at 1720 cm−1 is due to the C=O stretching vibration(ν4 mode). The two strong bands at 1210 and 1164 cm−1 are dueto the C−O stretching vibration (ν8 mode) and the CH3 rock-ing vibration (ν9 mode) respectively. The double peak at 1435and 1450 cm−1 is due to the CH3 deformation (ν14, ν6 modes).
Fig. 2. IR spectrum of a pure HCOOCH3 ice deposited at 16 K from3800 to 600 cm−1 (2.6−16.7 μm).
Table 1. Band positions of solid methyl formate deposited at 16 K andtheir assignments.
Band position Assignment Characterizationcm−1 μm3038 3.29 ν1 CH3 str3010 3.32 ν2, ν13 CH3 str2960 3.38 ν3 CH str1720 5.81 ν4 C=O str1450 6.90 ν6 CH3 def1435 6.97 ν14 CH3 def1383 7.23 ν7 CH bend1210 8.26 ν8 C–O str1164 8.59 ν9 CH3 rock910 10.99 ν10 O–CH3 str768 13.02 ν11 OCO def
The two sharp bands at 910 cm−1 and 768 cm−1 are due to theO−CH3 (ν10 mode) and the OCO deformation (ν11 mode) re-spectively. Table 1 reports the main methyl formate features.
3.2. Band strengths
From the derived nf value, we can also estimate the sample den-sity with the Lorentz-Lorenz relation
L ρ =n2
f − 1
n2f + 2
· (2)
For a given species the Lorentz-Lorenz coefficient L is nearlyconstant for a fixed wavelength regardless of the material phaseand temperature. Furthermore, although L is a function of wave-length, we can assume to a first approximation that it does notvary between 543 nm and 590 nm for a material transparentin the visible. With the refractive index and the density valuesfor HCOOCH3 at 590 nm and room temperature, available fromcommercial catalogs, we obtain L = 0.217 cm3 g−1. By substi-tuting this L value in Eq. (2) and the value of the refractive indexmeasured, we obtain for our experimental deposition conditionsthe density ρ = 0.87 g cm−3 for frozen HCOOCH3 at 16 K.
With the values of thickness d (cm) and density ρ(g cm−3) calculated above, we can derive the column density N
Page 3 of 10

A&A 519, A22 (2010)
Fig. 3. Individual measures of the band area versus the column densityfor the HCOOCH3 main bands from spectra taken in P and in S po-larization. Superimposed is the line through the origin that best fits thepoints in S polarization.
(molecules cm−2) for a species of molecular weight μ (g) withthe relation
N =d ρμ· (3)
The integrated intensity (area) measured of each selected band(in optical depth τ(ν) scale) for a not-saturated band is propor-tional to the column density, and the following relation is valid:∫τ(ν)dν = A × N. (4)
Measuring the integrated intensity of each selected band fromthe infrared spectra for different thickness values, we get the in-tegrated band strength A (cm molecule−1) value:
A =
∫τ(ν)dν
N· (5)
To derive the band strength values for the main infrared featuresof frozen HCOOCH3 at 16 K we plotted each band area againstthe column density (Figs. 3 and 4). Calculating the best fit ofdata, the angular coefficients of the straight lines obtained repre-sent the band strength for each selected feature for the two differ-ent substrates used for deposition. The band strength values arereported in Table 2. For the double peak at 1435 and 1450 cm−1
we have estimated the A value considering it as a single featurepeaked at 1435 cm−1. We note differences due to the substrate inthe obtained A value between 6−25%. These differences can beexplained by the limits of applicability of the Beer-Lambert law.
3.3. Warm-up effects
Because of its high gas phase abundance, the sublimation prop-erties of HCOOCH3 are important.
Fig. 4. Individual measures of the band area versus the column densityfor the HCOOCH3 main bands from spectra taken in P and in S po-larization. Superimposed is the line through the origin that best fits thepoints in S polarization.
Table 2. Band strength values (A) for the most intense features offrozen methyl formate deposited at 16 K on two different substrates(Si and KBr).
Band position (cm−1) A (cm molecule−1)Substrate Si KBr
1720 4.77 × 10⁻¹⁷ 4.96 × 10⁻¹⁷
1435 4.94 × 10⁻¹⁸ 5.58 × 10⁻¹⁸
1164 1.62 × 10⁻¹⁷ 1.96 × 10⁻¹⁷
1210 2.80 × 10⁻¹⁷ 2.93 × 10⁻¹⁷
910 3.79 × 10⁻¹⁸ 4.82 × 10⁻¹⁸
768 1.01 × 10⁻¹⁸ 1.25 × 10⁻¹⁸
Methyl formate deposited at 16 K presents an amorphousstructure. The sample was warmed-up and spectra were acquiredat 30, 50, 70, 90, 110, and 155 K (in P and in S polarization).In Fig. 5 we compare two spectra taken before (16 K) and after(110 K) the warm-up. The individual panels show the profile ofthe most intense bands. The deep changes in the bottom panelsare caused by the crystallization of the sample. It occurs withinthe temperature range between 90 and 100 K. At 130 K the sam-ple sublimes.
3.4. CH3OH:HCOOCH3
A CH3OH:HCOOCH3 = 10:1 ice mixture was deposited onKBr at 16 K. The profile of methyl formate bands in mixturewith methanol is slightly different from that of the pure sample,in particular the width of the bands decreases. Figure 6 showsthe spectral region from 1170 to 1000 cm−1 where we can makea comparison between the 1164 cm−1 band, normalized to themaximum value, in the spectrum of the CH3OH:HCOOCH3 icemixture and in the spectrum of the pure HCOOCH3 ice. The fullwidth at half maximum (FWHM) in the pure sample is 27 cm−1,
Page 4 of 10

P. Modica and M. E. Palumbo: Formation of methyl formate
Fig. 5. Profiles of the most intense bands (in S polarization) in amor-phous HCOOCH3 (top panels) and in crystalline HCOOCH3 (bottompanels). The y-scale in the panels is different for clarity.
Fig. 6. Comparison between the profile of the band at 1164 cm−1 in pureHCOOCH3 (dotted line) and in a CH3OH:HCOOCH3 = 10:1 mixture(solid line) at T = 16 K. The spectrum of CH3OH (dashed dotted line)is shown for completeness. The optical depth is expressed in arbitraryunits.
while in the mixture it is 21 cm−1. For completeness the spec-trum of methanol is also shown.
After deposition the ice mixture was warmed-up and spectrawere taken at 80, 100, 120, and 140 K. In this experiment wefound that methyl formate in a mixture with methanol sublimesbetween 120 and 140 K. This temperature is similar to that ofthe pure species.
Fig. 7. Enlargement of the methanol spectrum in the 1250−950 cm−1
(8.0−10.5 μm) spectral region.
3.5. Ion irradiation effects
We irradiated pure CH3OH and a CO:CH3OH mixture at 16 Kwith 200 keV H+ ions.
The mid-IR spectrum of solid methanol (Sandford &Allamandola 1993; Palumbo et al. 1999; Bennett et al. 2007)presents a wide and intense band centered at 3269 cm−1 dueto the OH stretching (ν1 mode), two less intense bands dueto the CH3 stretching mode at 2959 cm−1 (ν2, ν9 modes)and 2830 cm−1 (ν3 mode). In the region between 2600 and2000 cm−1 there are weak bands due to combination modes anda band at 2049 cm−1 due to overtones. In the last portion of thespectrum there is a band at 1452 cm−1 due to the CH3 defor-mation (ν4, ν5, ν10 modes), which presents a small shoulder at1424 cm−1 due to the OH bending (ν6 mode). There is a weakband at 1129 cm−1 due to the CH3 rocking (ν7, ν11 modes) and anintense band at 1033 cm−1 due to the CO stretching (ν8 mode).Figure 7 is an enlargement of the 1250−950 cm−1 spectral re-gion, where a weak band due to the CH3 rocking vibration atabout 1160 cm−1 is evident.
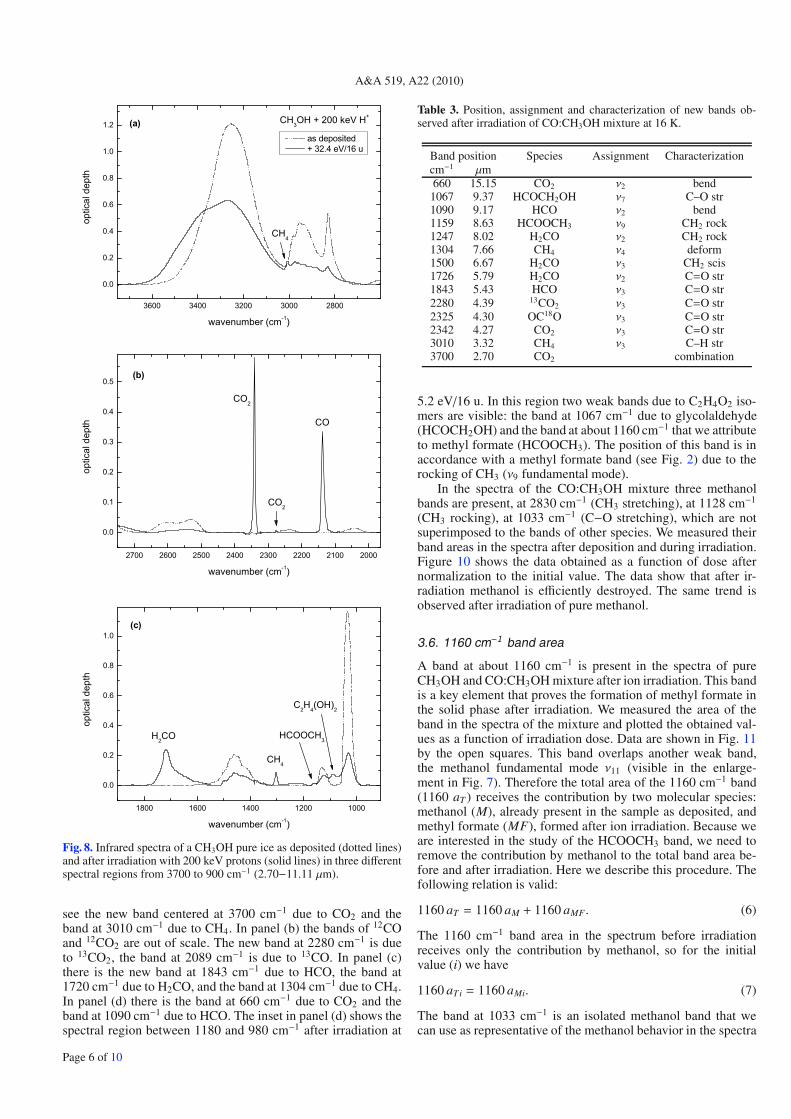
We compared the IR spectrum of pure methanol frozen at16 K with that obtained after irradiation with 200 keV H+ ionsat a dose of 32.4 eV/16 u. Because of ion irradiation, methanolmolecules are broken and other species are formed as a con-sequence of recombination of produced radicals and molecularfragments. New bands appear in the spectrum taken after irradi-ation. The spectral region of interest was divided into three partsfor clarity (Fig. 8). In panel (a) a band due to CH4 appears at3010 cm−1 (Palumbo et al. 1999). In panel (b) CO2 bands ap-pear at 2344 cm−1 (12CO2) and 2278 cm−1 (13CO2), while theCO band appears at 2136 cm−1. In panel (c) we can observethe formation of H2CO at 1720 cm−1 (Hudson & Moore 2000;Bennett & Kaiser 2007), CH4 at 1304 cm−1, and C2H4(OH)2(ethylene glycol) at 1090 cm−1 (Hudson & Moore 2000).Moreover we can see a weak band near 1160 cm−1 that we at-tribute to HCOOCH3.
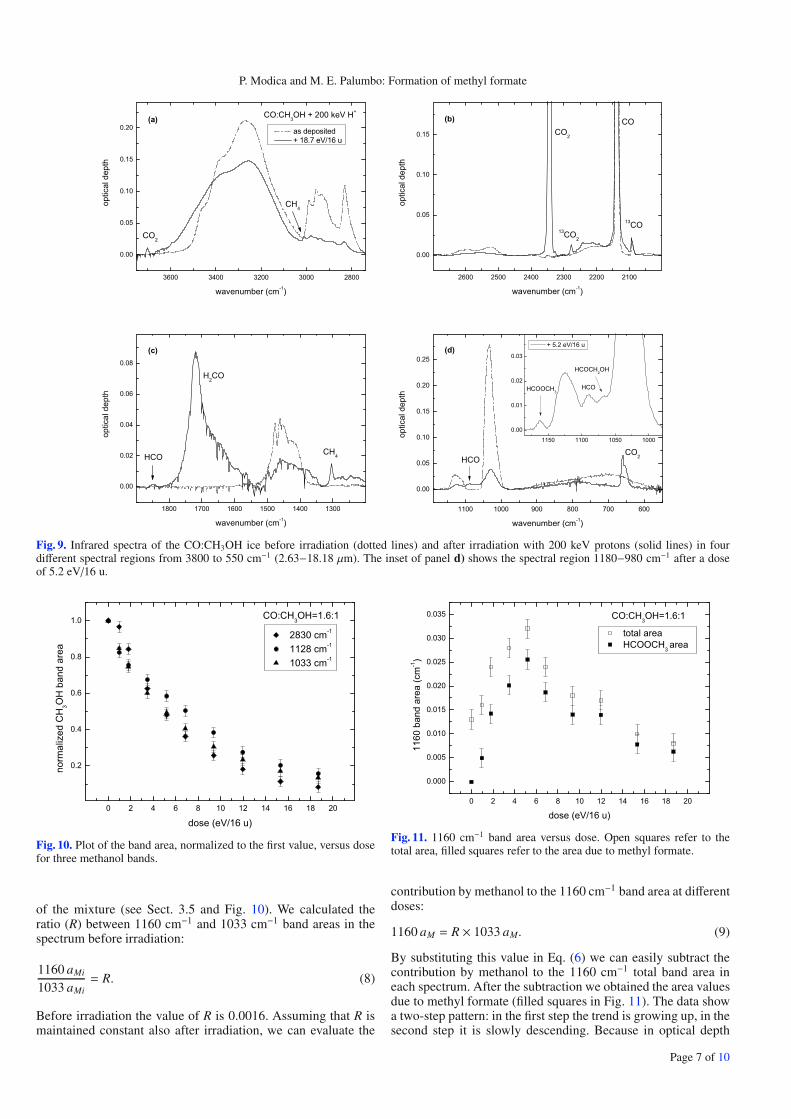
A CO:CH3OH = 1.6:1 ice mixture was deposited at 16 K. Atthe end of deposition the thickness was d = 1.65 μm. The sam-ple was irradiated with 200 keV H+ ions and spectra were takenat increasing dose. Also here, new bands appear in the spectrataken after irradiation, which are listed in Table 3. The spectralregion of interest was divided into four parts for clarity (Fig. 9).We compared the IR spectrum of the mixture ice at 16 K withthat obtained after irradiation at 18.7 eV/16 u. In panel (a) we
Page 5 of 10
A&A 519, A22 (2010)
Fig. 8. Infrared spectra of a CH3OH pure ice as deposited (dotted lines)and after irradiation with 200 keV protons (solid lines) in three differentspectral regions from 3700 to 900 cm−1 (2.70−11.11 μm).
see the new band centered at 3700 cm−1 due to CO2 and theband at 3010 cm−1 due to CH4. In panel (b) the bands of 12COand 12CO2 are out of scale. The new band at 2280 cm−1 is dueto 13CO2, the band at 2089 cm−1 is due to 13CO. In panel (c)there is the new band at 1843 cm−1 due to HCO, the band at1720 cm−1 due to H2CO, and the band at 1304 cm−1 due to CH4.In panel (d) there is the band at 660 cm−1 due to CO2 and theband at 1090 cm−1 due to HCO. The inset in panel (d) shows thespectral region between 1180 and 980 cm−1 after irradiation at
Table 3. Position, assignment and characterization of new bands ob-served after irradiation of CO:CH3OH mixture at 16 K.
Band position Species Assignment Characterizationcm−1 μm660 15.15 CO2 ν2 bend1067 9.37 HCOCH2OH ν7 C–O str1090 9.17 HCO ν2 bend1159 8.63 HCOOCH3 ν9 CH2 rock1247 8.02 H2CO ν2 CH2 rock1304 7.66 CH4 ν4 deform1500 6.67 H2CO ν3 CH2 scis1726 5.79 H2CO ν2 C=O str1843 5.43 HCO ν3 C=O str2280 4.39 13CO2 ν3 C=O str2325 4.30 OC18O ν3 C=O str2342 4.27 CO2 ν3 C=O str3010 3.32 CH4 ν3 C–H str3700 2.70 CO2 combination
5.2 eV/16 u. In this region two weak bands due to C2H4O2 iso-mers are visible: the band at 1067 cm−1 due to glycolaldehyde(HCOCH2OH) and the band at about 1160 cm−1 that we attributeto methyl formate (HCOOCH3). The position of this band is inaccordance with a methyl formate band (see Fig. 2) due to therocking of CH3 (ν9 fundamental mode).
In the spectra of the CO:CH3OH mixture three methanolbands are present, at 2830 cm−1 (CH3 stretching), at 1128 cm−1
(CH3 rocking), at 1033 cm−1 (C−O stretching), which are notsuperimposed to the bands of other species. We measured theirband areas in the spectra after deposition and during irradiation.Figure 10 shows the data obtained as a function of dose afternormalization to the initial value. The data show that after ir-radiation methanol is efficiently destroyed. The same trend isobserved after irradiation of pure methanol.
3.6. 1160 cm−1 band area
A band at about 1160 cm−1 is present in the spectra of pureCH3OH and CO:CH3OH mixture after ion irradiation. This bandis a key element that proves the formation of methyl formate inthe solid phase after irradiation. We measured the area of theband in the spectra of the mixture and plotted the obtained val-ues as a function of irradiation dose. Data are shown in Fig. 11by the open squares. This band overlaps another weak band,the methanol fundamental mode ν11 (visible in the enlarge-ment in Fig. 7). Therefore the total area of the 1160 cm−1 band(1160 aT ) receives the contribution by two molecular species:methanol (M), already present in the sample as deposited, andmethyl formate (MF), formed after ion irradiation. Because weare interested in the study of the HCOOCH3 band, we need toremove the contribution by methanol to the total band area be-fore and after irradiation. Here we describe this procedure. Thefollowing relation is valid:
1160 aT = 1160 aM + 1160 aMF . (6)
The 1160 cm−1 band area in the spectrum before irradiationreceives only the contribution by methanol, so for the initialvalue (i) we have
1160 aTi = 1160 aMi. (7)
The band at 1033 cm−1 is an isolated methanol band that wecan use as representative of the methanol behavior in the spectra
Page 6 of 10
P. Modica and M. E. Palumbo: Formation of methyl formate
Fig. 9. Infrared spectra of the CO:CH3OH ice before irradiation (dotted lines) and after irradiation with 200 keV protons (solid lines) in fourdifferent spectral regions from 3800 to 550 cm−1 (2.63−18.18 μm). The inset of panel d) shows the spectral region 1180−980 cm−1 after a doseof 5.2 eV/16 u.
Fig. 10. Plot of the band area, normalized to the first value, versus dosefor three methanol bands.
of the mixture (see Sect. 3.5 and Fig. 10). We calculated theratio (R) between 1160 cm−1 and 1033 cm−1 band areas in thespectrum before irradiation:
1160 aMi
1033 aMi= R. (8)
Before irradiation the value of R is 0.0016. Assuming that R ismaintained constant also after irradiation, we can evaluate the
Fig. 11. 1160 cm−1 band area versus dose. Open squares refer to thetotal area, filled squares refer to the area due to methyl formate.
contribution by methanol to the 1160 cm−1 band area at differentdoses:
1160 aM = R × 1033 aM. (9)
By substituting this value in Eq. (6) we can easily subtract thecontribution by methanol to the 1160 cm−1 total band area ineach spectrum. After the subtraction we obtained the area valuesdue to methyl formate (filled squares in Fig. 11). The data showa two-step pattern: in the first step the trend is growing up, in thesecond step it is slowly descending. Because in optical depth
Page 7 of 10
A&A 519, A22 (2010)
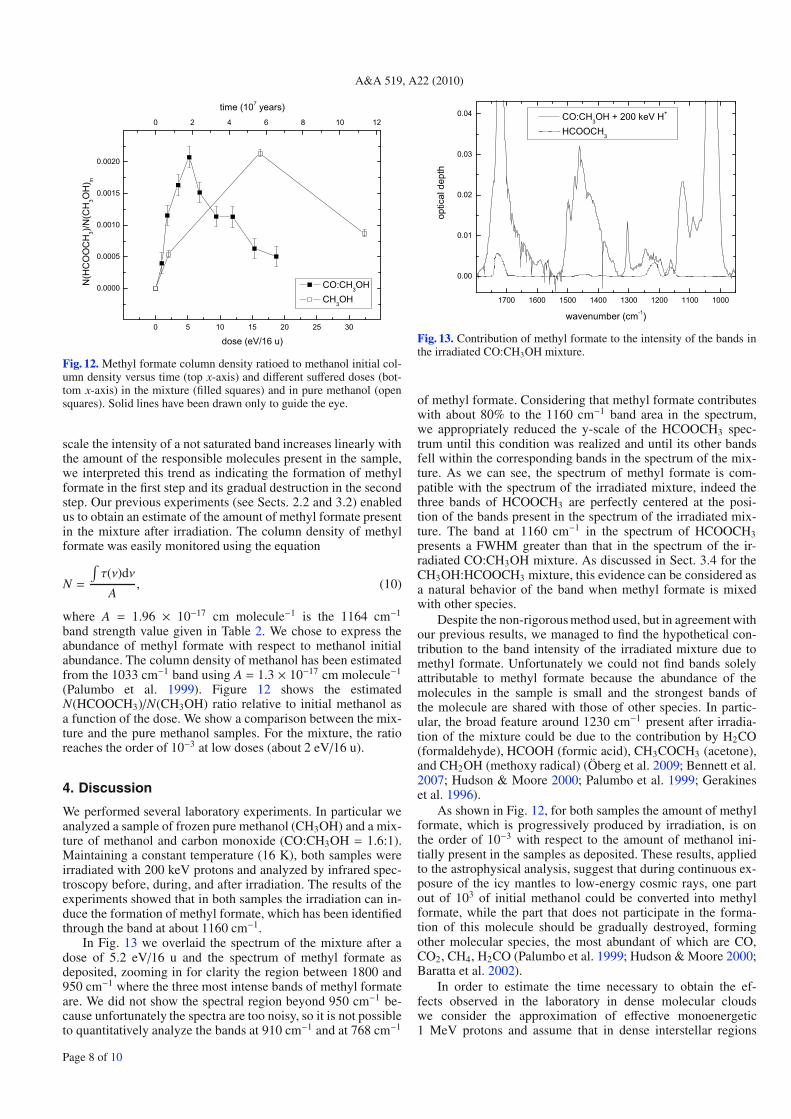
Fig. 12. Methyl formate column density ratioed to methanol initial col-umn density versus time (top x-axis) and different suffered doses (bot-tom x-axis) in the mixture (filled squares) and in pure methanol (opensquares). Solid lines have been drawn only to guide the eye.
scale the intensity of a not saturated band increases linearly withthe amount of the responsible molecules present in the sample,we interpreted this trend as indicating the formation of methylformate in the first step and its gradual destruction in the secondstep. Our previous experiments (see Sects. 2.2 and 3.2) enabledus to obtain an estimate of the amount of methyl formate presentin the mixture after irradiation. The column density of methylformate was easily monitored using the equation
N =
∫τ(ν)dν
A, (10)
where A = 1.96 × 10⁻¹⁷ cm molecule−1 is the 1164 cm−1
band strength value given in Table 2. We chose to express theabundance of methyl formate with respect to methanol initialabundance. The column density of methanol has been estimatedfrom the 1033 cm−1 band using A = 1.3 × 10⁻¹⁷ cm molecule−1
(Palumbo et al. 1999). Figure 12 shows the estimatedN(HCOOCH3)/N(CH3OH) ratio relative to initial methanol asa function of the dose. We show a comparison between the mix-ture and the pure methanol samples. For the mixture, the ratioreaches the order of 10−3 at low doses (about 2 eV/16 u).
4. Discussion
We performed several laboratory experiments. In particular weanalyzed a sample of frozen pure methanol (CH3OH) and a mix-ture of methanol and carbon monoxide (CO:CH3OH = 1.6:1).Maintaining a constant temperature (16 K), both samples wereirradiated with 200 keV protons and analyzed by infrared spec-troscopy before, during, and after irradiation. The results of theexperiments showed that in both samples the irradiation can in-duce the formation of methyl formate, which has been identifiedthrough the band at about 1160 cm−1.
In Fig. 13 we overlaid the spectrum of the mixture after adose of 5.2 eV/16 u and the spectrum of methyl formate asdeposited, zooming in for clarity the region between 1800 and950 cm−1 where the three most intense bands of methyl formateare. We did not show the spectral region beyond 950 cm−1 be-cause unfortunately the spectra are too noisy, so it is not possibleto quantitatively analyze the bands at 910 cm−1 and at 768 cm−1
Fig. 13. Contribution of methyl formate to the intensity of the bands inthe irradiated CO:CH3OH mixture.
of methyl formate. Considering that methyl formate contributeswith about 80% to the 1160 cm−1 band area in the spectrum,we appropriately reduced the y-scale of the HCOOCH3 spec-trum until this condition was realized and until its other bandsfell within the corresponding bands in the spectrum of the mix-ture. As we can see, the spectrum of methyl formate is com-patible with the spectrum of the irradiated mixture, indeed thethree bands of HCOOCH3 are perfectly centered at the posi-tion of the bands present in the spectrum of the irradiated mix-ture. The band at 1160 cm−1 in the spectrum of HCOOCH3presents a FWHM greater than that in the spectrum of the ir-radiated CO:CH3OH mixture. As discussed in Sect. 3.4 for theCH3OH:HCOOCH3 mixture, this evidence can be considered asa natural behavior of the band when methyl formate is mixedwith other species.
Despite the non-rigorous method used, but in agreement withour previous results, we managed to find the hypothetical con-tribution to the band intensity of the irradiated mixture due tomethyl formate. Unfortunately we could not find bands solelyattributable to methyl formate because the abundance of themolecules in the sample is small and the strongest bands ofthe molecule are shared with those of other species. In partic-ular, the broad feature around 1230 cm−1 present after irradia-tion of the mixture could be due to the contribution by H2CO(formaldehyde), HCOOH (formic acid), CH3COCH3 (acetone),and CH2OH (methoxy radical) (Öberg et al. 2009; Bennett et al.2007; Hudson & Moore 2000; Palumbo et al. 1999; Gerakineset al. 1996).
As shown in Fig. 12, for both samples the amount of methylformate, which is progressively produced by irradiation, is onthe order of 10−3 with respect to the amount of methanol ini-tially present in the samples as deposited. These results, appliedto the astrophysical analysis, suggest that during continuous ex-posure of the icy mantles to low-energy cosmic rays, one partout of 103 of initial methanol could be converted into methylformate, while the part that does not participate in the forma-tion of this molecule should be gradually destroyed, formingother molecular species, the most abundant of which are CO,CO2, CH4, H2CO (Palumbo et al. 1999; Hudson & Moore 2000;Baratta et al. 2002).
In order to estimate the time necessary to obtain the ef-fects observed in the laboratory in dense molecular cloudswe consider the approximation of effective monoenergetic1 MeV protons and assume that in dense interstellar regions
Page 8 of 10

P. Modica and M. E. Palumbo: Formation of methyl formate
Fig. 14. Formation of methyl formate on icy grain mantles and release to the gas-phase. Left panel: CO hydrogenation and formation of CH3OH.Middle panel: interaction with cosmic rays and formation of HCOOCH3. Right panel: rise of temperature and HCOOCH3 sublimation.
the 1 MeV flux is equal to 1 proton cm−2 s−1 (Mennella et al.2003). Our experimental results were obtained using 200 keVprotons. Thus in order to extrapolate the laboratory results tothe interstellar medium conditions we assume that they scalewith the stopping power (S, energy loss per unit path length) ofimpinging ions. With these hypotheses we indicated in Fig. 12the timescale axis (top x-axis), which gives an estimation ofthe time (107 years) necessary to obtain the effects observedin the laboratory on interstellar ices. We obtained that about2 × 107 years would be necessary to form the observed col-umn density of methyl formate. This time agrees with the evolu-tionary timescale (3 × 10⁷−5 × 10⁸ years) of molecular clouds(Greenberg 1982). Methyl formate has also been observed inClass 0 objects (e.g. Bottinelli et al. 2004a,b, 2007). It has beenestimated that these objects have a dynamical age of a few thou-sand years (e.g. Maret et al. 2002; Bottinelli et al. 2004a,b).According to current models, low-mass stars form inside molec-ular clouds from dense and cold condensations, called prestel-lar cores, which evolve into Class 0 and then Class I sources.Prestellar cores are characterized by low temperature (T ≤ 10 K)and high density (n ≥ 106 cm−3). High depletion of gas phasespecies has been observed towards prestellar cores (e.g. Tafallaet al. 2004, 2006), suggesting that ice grain mantles are presentin these regions. Furthermore ice grain mantles have been ob-served in quiescent regions of dense molecular clouds (e.g. Chiaret al. 1994, 1995; Whittet et al. 1998; Knez et al. 2005). Theseresults suggest that ice mantles could be as old as the molecu-lar cloud in which they are detected and then suffer from cosmicion irradiation for a time as long as the molecular cloud’s life-time (e.g. Palumbo & Strazzulla 1993).
Observations have shown that in hot cores and hot cori-nos the fractional abundance of methyl formate can vary in awide range of magnitudes, but generally it is on the order of10−7−10−9 with respect to H2. The laboratory experiments pre-sented here indicate that after ion irradiation of CO:CH3OH iceat 16 K the amount of methyl formate is on the order of 10−3
with respect to initial methanol. In order to compare our resultswith the observational data we need to express this value with re-spect to H2. In dense molecular clouds the fractional abundanceof CO is on the order of 10−4 with respect to H2 (Frerking et al.1982). Experimental results revealed that CH3OH can be pro-duced efficiently by successive hydrogenation of CO on grainsurfaces at temperatures that are typical in molecular clouds(Watanabe et al. 2007; Fuchs et al. 2009), and the amount ofCH3OH obtained is at least on the order of 10−1 with respect
to CO. Other authors suggest that this amount could be higher(Fuchs et al. 2009). Thus if we assume high CO depletion wecan say that the fractional abundance of solid CH3OH is on theorder of 10−5 with respect to H2. Moreover, if we assume thatmethyl formate/methanol column density ratio obtained in thesolid state after ion irradiation is maintained in the gas phaseafter desorption of icy grain mantles, we obtain an amount ofmethyl formate on the order of 10−8 with respect to H2. Thisamount is consistent with the observed abundances. For ex-ample, the fractional abundance of methyl formate in Sgr B2N(LMH) is 1.1 × 10⁻⁸ (Snyder 2006), in IRAS 16293−2422 Bit is >1.2 × 10⁻⁸ (Remijan & Hollis 2006), in NGC 2264 MMSit is (0.7−5.3) × 10−8 (Sakai et al. 2007).
In the light of our results we can propose the model illus-trated in Fig. 14. Gas-phase processes produce a high abun-dance of carbon monoxide, some of which is deposited on thegrain surface, where it is partially hydrogenated into formalde-hyde and methanol. During their lifetime, icy grain mantles con-taining CO and CH3OH interact with low-energy cosmic rays.As a consequence of ion irradiation, methyl formate is producedwithin interstellar ices. Once this molecule is formed, it can sub-sequently be released into the gas phase after desorption mech-anisms, i.e., when a young stellar object begins to form and theicy mantles sublime.
5. Conclusion
Methyl formate may have played a decisive role in the develop-ment of life on our planet. It is therefore crucial to understandwhat the process of formation of this molecule is in order toinclude it in the evolutionary models of molecular clouds andto explain the formation of planetary systems. Armed with cor-rect model predictions, it will be possible to conduct meaningfulsearches of new complex organic molecules. It is likely that dif-ferent formation processes contribute in different ways at differ-ent times of the protostar evolution. We suggested that interac-tion of icy grain mantles with low-energy cosmic rays could beconsidered a dominant mechanism in the formation of methylformate. The analysis of laboratory data allow us to suggestthat the gas phase methyl formate observed in the interstellarmedium is formed in the solid state after cosmic ion irradiationof icy mantles containing CO and CH3OH and released to thegas phase after desorption of icy mantles.
Methyl formate has two isomers, glycolaldehyde and aceticacid. Differentiation in the molecular isomers has been observed,
Page 9 of 10

A&A 519, A22 (2010)
but not explained. Because the set of the three isomers sharethe same chemical formula (C2H4O2), they could also share thesame formation process. Our experiments have indeed revealed aweak band that could be attributed to glycolaldehyde. However,we need further and more detailed experimental works to con-firm this suggestion. As future work we plan to study the for-mation of glycolaldehyde and acetic acid after ion irradiation ofCO:CH3OH ice mixtures. Major advances in understanding theformation chemistry of these molecules can come from observa-tional projects like ALMA (Atacama Large Millimeter Array),EVLA (Expanded Very Large Array) and the Herschel satellite,all of which expect astrochemistry to be an important componentof their scientific programs.
Acknowledgements. The authors wish to thank F. Spinella for his technical as-sistance in the laboratory, and G. A. Baratta and G. Strazzulla for fruitful dis-cussions during the preparation of this work. This research has been finan-cially supported by the Italian Space Agency contract No. I/015/07/0 (Studi diEsplorazione del Sistema Solare).
References
Baratta, G. A., & Palumbo, M. E. 1998, J. Opt. Soc. Am. A, 15, 3076Baratta, G. A., Leto, G., & Palumbo, M. E. 2002, A&A, 384, 343Bennett, C. J., & Kaiser, R. I. 2007, ApJ, 661, 899Bennett, C. J., Chen, S. H., Sun, B. J., Chang, A. H. H., & Kaiser, R. I. 2007,
ApJ, 660, 1588Bockelée-Morvan, D., Lis, D. C., Wink, J. E., et al. 2000, A&A, 353, 1101Boogert, A. C. A., Pontoppidan, K. M., Knez, C., et al. 2008, ApJ, 678, 985Bottinelli, S., Ceccarelli, C., Lefloch, B., et al. 2004a, ApJ, 615, 354Bottinelli, S., Ceccarelli, C., Neri, R., et al. 2004b, ApJ, 617, 69Bottinelli, S., Ceccarelli, C., Williams, J. P., et al. 2007, ApJ, 463, 601Brown, R. D., Crofts, J. G., Gardner, F. F., et al. 1975, ApJ, 197, L29Cazaux, S., Tielens, A. G. G. M., Ceccarelli, C., et al. 2003, ApJ, 593, 51Chiar, J. E., Adamson, A. J., Kerr, T. H., & Whittet, D. C. B. 1994, ApJ, 426,
240Chiar, J. E., Adamson, A. J., Kerr, T. H., & Whittet, D. C. B. 1995, ApJ, 455,
234
Despois, D., Biver, N., Bockelée-Morvan, D., & Crovisier, J. 2005, inAstrochemistry: Recent Successes and Current Challenges, ed. D. C. Lis,G. A. Blake, & E. Herbst (Cambridge University Press), IAU Symp., 231,469
Frerking, M. A., Langer, W. D., & Wilson, R. W. 1982, ApJ, 262, 590Fuchs, G. W., Cuppen, H. M., Ioppolo, S., et al. 2009, A&A, 505, 629Fulvio, D., Sivaraman, B., Baratta, G. A., et al. 2009, Spectrochim. Acta A, 72,
1007Gerakines, P. A., Schutte, W. A., & Ehrenfreund, P. 1996, A&A, 312, 289Gerakines, P. A., Whittet, D. C. B., Ehrenfreund, P., et al. 1999, ApJ, 522, 357Greenberg, J. M. 1982, in Comets, ed. L. L. Wilkening (Tucson: The University
of Arizona Press), 131Grim, R. J. A., & Greenberg, J. M. 1987, ApJ, 321, L91Horn, A., Mollendal, H., Sekiguchi, O., et al. 2004, ApJ, 611, 605Hudson, R. L., & Moore, M. H. 2000, Icarus, 145, 661Knez, C., Boogert, A. C. A., Pontoppidan, K. M., et al. 2005, ApJ, 635, L145Kuan, Y. J., Huang, H. C., Charnley, S. B., et al. 2004, ApJ, 616, 27Ikeda, M., Ohishi, M., Nummelin, A., et al. 2001, ApJ, 560, 792Maret, S., Ceccarelli, C., Caux, E., Tielens, A. G. G. M., & Castets, A. 2002,
A&A, 395, 573Mennella, V., Baratta, G. A., Esposito, A., Ferini, G., & Pendleton, Y. J. 2003,
ApJ, 587, 727Öberg, K. I., van Dishoeck, E. F., & Linnartz, H. 2009, A&A, 504, 891Palumbo, M. E., & Strazzulla, G. 1993, A&A, 269, 568Palumbo, M. E., Castorina, A. C., & Strazzulla, G. 1999, A&A, 342, 551Palumbo, M. E., Ferini, G., & Baratta, G. A. 2004, Adv. Sp. Res., 33, 49Remijan, A. J., & Hollis, H. 2006, ApJ, 640, 842Remijan, A. J., Friedel, D. N., de Pater, I., et al. 2006, ApJ, 643, 567Sakai, N., Sakai, T., & Yamamoto, S. 2007, ApJ, 660, 363Sandford, S. A., & Allamandola, L. J. 1993, ApJ, 417, 815Sandford, S. A., Aleon, J., Alexander, C. M. O. D., et al. 2006, Science, 314,
1720Snyder, L. E. 2006, Proc. Natl. Sci., 103, 12243Strazzulla, G., & Johnson, R. E. 1991, in Comets in the post-Halley era, ASSL
Series, Dordrecht, 1, 243Strazzulla, G., Baratta, G. A., & Palumbo, M. E. 2001, Spectrochem. Acta Part
A, 57, 825Tielens, A. G. G. M., & Hagen, W. 1982, A&A, 114, 245Watanabe, N., Mouri, O., Nagaoka, T., et al. 2007, ApJ, 668, 1001Whittet, D. C. B., Gerakines, P. A., Tielens, A. G. G. M., et al. 1998, ApJ, 498,
L159
Page 10 of 10


