Embed Size (px)
Citation preview
Applied Energy 88 (2011) 1241–1250
Contents lists available at ScienceDirect
Applied Energy
journal homepage: www.elsevier .com/locate /apenergy
Forest biomass supply logistics for a power plant using the discrete-eventsimulation approach
Mahdi Mobini a, Taraneh Sowlati b,⇑, Shahab Sokhansanj c,d
a Industrial Engineering Group, Department of Wood Science, University of British Columbia, 2943-2424 Main Mall, Vancouver, BC V6T-1Z4, Canadab Department of Wood Science, University of British Columbia, 2931-2424 Main Mall, Vancouver, BC V6T-1Z4, Canadac Department of Chemical and Biological Engineering, University of British Columbia, 2360 East Mall, Vancouver, BC V6T 1Z3, Canadad Environmental Sciences Division, Oak Ridge National Laboratory, Oak Ridge, TN 37831, USA
a r t i c l e i n f o
Article history:Received 8 June 2010Received in revised form 31 August 2010Accepted 8 October 2010Available online 10 November 2010
Keywords:Forest biomassSimulationIBSALBioenergyBiofuelSupply chain
0306-2619/$ - see front matter � 2010 Elsevier Ltd. Adoi:10.1016/j.apenergy.2010.10.016
⇑ Corresponding author. Tel.: +1 604 822 6109.E-mail address: [email protected] (T. Sowlat
a b s t r a c t
This study investigates the logistics of supplying forest biomass to a potential power plant. Due to thecomplexities in such a supply logistics system, a simulation model based on the framework of IntegratedBiomass Supply Analysis and Logistics (IBSAL) is developed in this study to evaluate the cost of deliveredforest biomass, the equilibrium moisture content, and carbon emissions from the logistics operations. Themodel is applied to a proposed case of 300 MW power plant in Quesnel, BC, Canada. The results show thatthe biomass demand of the power plant would not be met every year. The weighted average cost of deliv-ered biomass to the gate of the power plant is about C$ 90 per dry tonne. Estimates of equilibrium mois-ture content of delivered biomass and CO2 emissions resulted from the processes are also provided.
� 2010 Elsevier Ltd. All rights reserved.
1. Introduction
Issues related to the consumption of fossil fuels, such as theirnegative effects on the environment, non-renewable nature, andunstable prices, have increased the interest in utilizing renewableenergy sources. The benefits of using renewable energy sources in-clude reduction in environmental pollution, fuel diversity, energysecurity, and regional and local economic stability. Among the po-tential renewable energy sources, forest biomass has receivedattention recently and in some cases, such as the one by Lundmark[1] its utilization in energy production has been shown to be eco-nomical. Technical, economic and environmental evaluations arerequired prior to the establishment of a bioenergy production facil-ity. The long-term availability of biomass, the cost of generated en-ergy, and environmental impacts of utilizing forest biomass areamong important factors that need to be assessed in the feasibilitystudy of a bioenergy project.
Several studies have been carried out to assess the various as-pects of biomass utilization in bioenergy production. Sedjo [2]evaluated the economics of utilizing forest biomass in energy pro-duction. A review paper by Berndes et al. [3] discussed the poten-tial contribution of biomass in energy production. Ericsson and
ll rights reserved.
i).
Nilsson [4] examined the short, medium and long term prospectiveutilization of biomass for bioenergy production in Europe. Theyconcluded that there was no resource limitation on meeting theEU’s target for generating 5.6 EJ y�; however, given the slow pro-gress in the industry it did not seem likely to reach this goal inthe near future. Sasaki et al. [5] studied the case of Southeast Asia.They developed models on the forest land use and estimated theavailability of woody biomass in the area. Moreover, using forestbiomass for power generation in Japan and Portugal was studiedby Kinoshita et al. [6] and Viana et al. [7], respectively. All thesestudies emphasize on the advantages of biomass-based energyproduction, as well as its opportunities and challenges.
The economic aspect of the biomass utilization for energyproduction, particularly in terms of cost estimations, has beenevaluated in several studies. These studies are usually region-dependent due to the contributing local factors affecting theresults of such investigations. The different sources of biomassavailable in different locations, type of biomass, its yield, and otherlocal specifications that have an effect on the logistics of thesupplying the biomass are essential in these studies. Associatedcosts of supplying biomass for energy production purposes areexamined in Allen et al. [8] in UK, Gallagher et al. [9] in USA,Hamelinck et al. [10] in Western Europe, Caputo et al. [11] in Italy,Yoshioka et al. [12] in Japan, and Kumar et al. [13], MacDonald [14],Stennes and McBeath [15] in Western Canada using mathematical
1242 M. Mobini et al. / Applied Energy 88 (2011) 1241–1250
calculations. Based on this modeling approach, the dynamics of thesystem and uncertainties involved in it are not considered. There-fore, the obtained results only give a general picture of the system,while, more detailed studies on the system are required to providemore reliable results.
Also, there are studies that involve mathematical modelingdeveloped to deal with various problems in this field. For example,finding the optimum location of biomass-based facilities was stud-ied in [16–18]. Vera et al. [16] developed a framework for findingthe optimum location and capacity of a power plant fed with res-idues from olive oil producing areas. The problem of finding thebest location for a biorefinery plant considering the local availabil-ity of biomass and geographical distribution of customers has beenstudied by Leduc et al. [17] and Leduc et al. [18].
Simulation modeling is a prominent approach that is usedmostly under two conditions: (1) when the system is too complexto be modeled by mathematical or other kind of models and (2)when the degree of uncertainty in the model is to the extent thatignoring it leads to biased results. The supply chain models, andmore specifically biomass supply chains are entitled to both thesespecifications, i.e. complexity and inevitable uncertainty. Decisionmaking in such an environment needs the consideration of variousentities and uncertain factors, such as supply, demand, costs,prices, operations productivity, and weather condition. Therefore,simulation models are proposed by researchers to thoroughlystudy the biomass supply chain management.
Hall et al. [19] developed a simulation model to estimate andcompare logistics costs of delivering two types of forest residues(landing residues and cutover residues) to a biomass-based powerplant in New Zealand. A simulation model developed by Sims andVenturi [20] was aimed at estimating the costs of supplying shortrotation coppice crop to a bioenergy conversion plant in North Is-land, New Zealand.
A simulation model called Integrated Biomass Supply and Logis-tics (IBSAL) was developed by Sokhansanj et al. [21] to estimate thecost, moisture content, energy input, and carbon dioxide emissionsof collecting and transporting agricultural biomass. This model hasbeen applied to a case of collection and transportation of corn sto-ver, wheat straw, and switchgrass in Idaho and Iowa. The transpor-tation costs for a given distance and suite of equipment wereaffected by the biomass bulk density. IBSAL’s framework has beenused in several studies on agricultural biomass projects [22–25].
Mahmoudi et al. [26] developed a simulation model of supply-ing biomass from roadside residues to a proposed power plant byKumar et al. [27] in British Columbia, Canada. Their model providesestimates of quantity, cost, supply time, and moisture content ofdelivered biomass, as well as carbon emissions from operations.
The objective of the present study is to develop a comprehen-sive simulation model for supplying biomass to the proposedpower plant from roadside residues and full-tree chipping of in-fested trees. This model extends the supply chain investigated inMahmoudi et al. [26] by incorporating all three harvesting systemsproposed by MacDonald [14] for the case study. Mahmoudi et al.[26] considered the roadside residues as the only source of biomassin their simulation model and the model simulated the supplylogistics system over 1-year period. In addition to incorporatingother harvesting systems, our simulation model accounts forchanges in biomass availability due to the mountain pine beetleinfestation and models the supply logistics systems over the ser-vice life of the power plant (20 years). This has been done by incor-porating a shelf-life model that estimates the changes in thevolumes of saw log and fuel wood over the time horizon of the sim-ulation. The cost of delivered biomass to the power plant usingeach harvesting system, carbon emissions generated by the equip-ment, and biomass moisture content fluctuations are the model’smain outputs. The simulation model can provide useful informa-
tion during the feasibility assessment stage of establishing a powerplant to minimize the risk of investments. It is flexible enough tobe modified and applied to other cases in different regions consid-ering the local specifications.
2. Materials and methods
2.1. The case study
The case study is a potential power plant with a capacity of300 MW near the city of Quesnel, which requires 1.35 milliondry tonne (dt) of wood chips per year [27]. The required feedstockwould be supplied from Quesnel Timber Supply Area (TSA). TheQuesnel TSA is located in the interior British Columbia (BC) cover-ing approximately 1.6 million ha. It is one of the most affectedareas by mountain pine beetle in BC, Canada. The current annualallowable cut (AAC) for the Quesnel TSA is 5,280,000 m3 [28].The AAC is the amount of log permitted to be harvested during ayear in a TSA to ensure the sustainability and productivity of theforests. The current infestation in BC is the largest infestation ofmountain pine beetle that has occurred in this area [14]. Conse-quently, the AAC value is significantly increased to make the mostvalue from the infested trees before they burn or decay. One of theconceivable usages of the infested trees is in the bioenergy indus-try; especially when considering the fact that the available re-sources of feedstock is much more than the demand of thecurrent forest industries.
This study evaluates the supply of forest biomass from theQuesnel TSA to the potential power plant using different harvest-ing systems. The logistics of operations including harvesting, pro-cessing and transporting biomass to the power plant aremodeled. The forest area selected in the study comprises of 18 landunits. A dataset of these land units is provided by Forest Engineer-ing Research Institute of Canada (FERIC) in which each land unit isdivided into three classes of stands with percentages of fuel woodless than 50%, between 50% and 95% and more than 95%. Also, eachof three classes in each land unit is further divided into smallergroups of stands based on mixture of species and existing road net-work. For each group of stands, FERIC estimated area and volumesof sawlogs and fuel wood. To estimate area and volumes after 5, 10,15 and 20 years, FERIC created a shelf-life model. The shelf-lifemodel estimates the MPB-infested percentages for each of standsbased on its biogeoclimatic zone. The estimates of average haulingdistance from the stand groups to the city of Quesnel are providedin the dataset. These distances are categorized into highways, mainroads, and branch roads that are used to calculate the haulingduration and transportation costs in the simulation model. The rateof transportation is fixed based on the data provided in the inputset (shown in Tables 1–3), but the transportation cost for each loadis calculated based on the distance and type of the road from thatstand to the power plant.
2.2. Harvesting systems
For Quesnel TSA, MacDonald [14] suggested using the conven-tional harvesting system for stands with fuel-wood content lessthan 50%. For stands with fuel wood content between 50% and95%, the satellite harvesting system was proposed, while the full-tree chipping method was recommended for the stands with morethan 95% fuel wood.
In the conventional harvesting system (Fig. 1), which is the sys-tem currently being used by the logging companies in the QuesnelTSA, trees are felled and skidded to the roadside where they areprocessed to sawlogs (merchantable wood) and transported tothe sawmills. Residues resulted from the processing operation
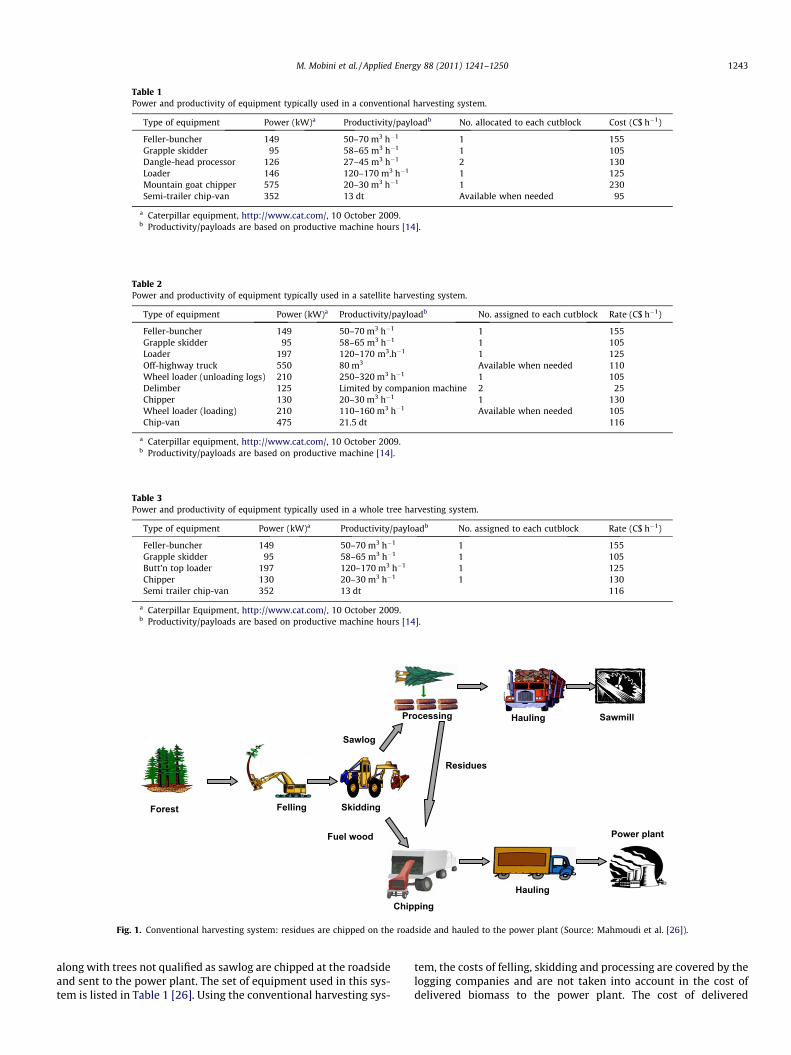
Table 1Power and productivity of equipment typically used in a conventional harvesting system.
Type of equipment Power (kW)a Productivity/payloadb No. allocated to each cutblock Cost (C$ h�1)
Feller-buncher 149 50–70 m3 h�1 1 155Grapple skidder 95 58–65 m3 h�1 1 105Dangle-head processor 126 27–45 m3 h�1 2 130Loader 146 120–170 m3 h�1 1 125Mountain goat chipper 575 20–30 m3 h�1 1 230Semi-trailer chip-van 352 13 dt Available when needed 95
a Caterpillar equipment, http://www.cat.com/, 10 October 2009.b Productivity/payloads are based on productive machine hours [14].
Table 2Power and productivity of equipment typically used in a satellite harvesting system.
Type of equipment Power (kW)a Productivity/payloadb No. assigned to each cutblock Rate (C$ h�1)
Feller-buncher 149 50–70 m3 h�1 1 155Grapple skidder 95 58–65 m3 h�1 1 105Loader 197 120–170 m3.h�1 1 125Off-highway truck 550 80 m3 Available when needed 110Wheel loader (unloading logs) 210 250–320 m3 h�1 1 105Delimber 125 Limited by companion machine 2 25Chipper 130 20–30 m3 h�1 1 130Wheel loader (loading) 210 110–160 m3 h�1 Available when needed 105Chip-van 475 21.5 dt 116
a Caterpillar equipment, http://www.cat.com/, 10 October 2009.b Productivity/payloads are based on productive machine [14].
Table 3Power and productivity of equipment typically used in a whole tree harvesting system.
Type of equipment Power (kW)a Productivity/payloadb No. assigned to each cutblock Rate (C$ h�1)
Feller-buncher 149 50–70 m3 h�1 1 155Grapple skidder 95 58–65 m3 h�1 1 105Butt’n top loader 197 120–170 m3 h�1 1 125Chipper 130 20–30 m3 h�1 1 130Semi trailer chip-van 352 13 dt 116
a Caterpillar Equipment, http://www.cat.com/, 10 October 2009.b Productivity/payloads are based on productive machine hours [14].
Forest Felling
Hauling Processing
HaulingChipping
Skidding
Fuel wood
Residues
Sawlog
Power plant
Sawmill
Fig. 1. Conventional harvesting system: residues are chipped on the roadside and hauled to the power plant (Source: Mahmoudi et al. [26]).
M. Mobini et al. / Applied Energy 88 (2011) 1241–1250 1243
along with trees not qualified as sawlog are chipped at the roadsideand sent to the power plant. The set of equipment used in this sys-tem is listed in Table 1 [26]. Using the conventional harvesting sys-
tem, the costs of felling, skidding and processing are covered by thelogging companies and are not taken into account in the cost ofdelivered biomass to the power plant. The cost of delivered
1244 M. Mobini et al. / Applied Energy 88 (2011) 1241–1250
biomass from their model was the aggregated costs of moving,chipping and hauling. Mahmoudi et al. [26] modeled this harvest-ing system. Therefore, the only source of biomass considered intheir study was the roadside residues left after harvesting opera-tions. They did not consider stands containing more than 50% offuel-wood, so other harvesting systems proposed by MacDonald[11] were not considered in their simulation model.
When fuel wood content of a stand group is more than 50%, thelogging companies would not be willing to harvest those standssince the cost of operations would be more than the value of the ex-tracted log volume [11]. However, log volume is still significant andcould be extracted from the trees. In this case, logs are by-productand the main focus is on the wood chips for power generation.
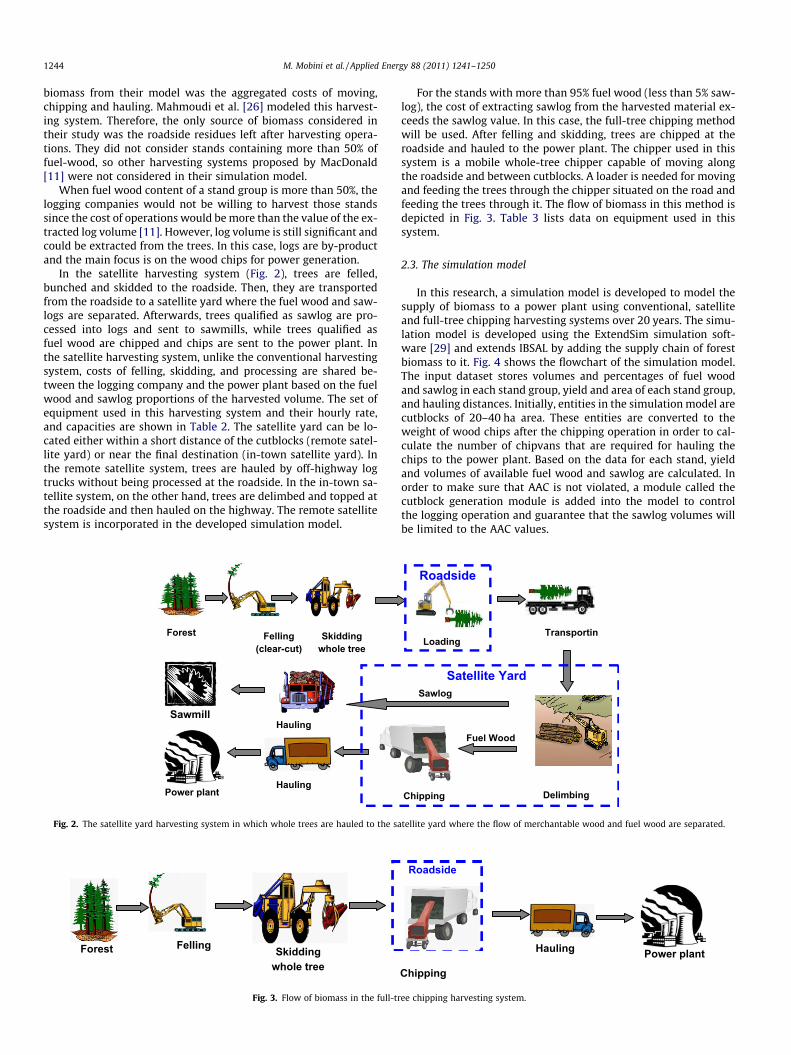
In the satellite harvesting system (Fig. 2), trees are felled,bunched and skidded to the roadside. Then, they are transportedfrom the roadside to a satellite yard where the fuel wood and saw-logs are separated. Afterwards, trees qualified as sawlog are pro-cessed into logs and sent to sawmills, while trees qualified asfuel wood are chipped and chips are sent to the power plant. Inthe satellite harvesting system, unlike the conventional harvestingsystem, costs of felling, skidding, and processing are shared be-tween the logging company and the power plant based on the fuelwood and sawlog proportions of the harvested volume. The set ofequipment used in this harvesting system and their hourly rate,and capacities are shown in Table 2. The satellite yard can be lo-cated either within a short distance of the cutblocks (remote satel-lite yard) or near the final destination (in-town satellite yard). Inthe remote satellite system, trees are hauled by off-highway logtrucks without being processed at the roadside. In the in-town sa-tellite system, on the other hand, trees are delimbed and topped atthe roadside and then hauled on the highway. The remote satellitesystem is incorporated in the developed simulation model.
Forest Felling (clear-cut)
Skidding whole tree
Hauling
Sawmill
Power plant
Hauling
Fig. 2. The satellite yard harvesting system in which whole trees are hauled to the sa
Forest Felling Skidding whole tree
Fig. 3. Flow of biomass in the full-tr
For the stands with more than 95% fuel wood (less than 5% saw-log), the cost of extracting sawlog from the harvested material ex-ceeds the sawlog value. In this case, the full-tree chipping methodwill be used. After felling and skidding, trees are chipped at theroadside and hauled to the power plant. The chipper used in thissystem is a mobile whole-tree chipper capable of moving alongthe roadside and between cutblocks. A loader is needed for movingand feeding the trees through the chipper situated on the road andfeeding the trees through it. The flow of biomass in this method isdepicted in Fig. 3. Table 3 lists data on equipment used in thissystem.
2.3. The simulation model
In this research, a simulation model is developed to model thesupply of biomass to a power plant using conventional, satelliteand full-tree chipping harvesting systems over 20 years. The simu-lation model is developed using the ExtendSim simulation soft-ware [29] and extends IBSAL by adding the supply chain of forestbiomass to it. Fig. 4 shows the flowchart of the simulation model.The input dataset stores volumes and percentages of fuel woodand sawlog in each stand group, yield and area of each stand group,and hauling distances. Initially, entities in the simulation model arecutblocks of 20–40 ha area. These entities are converted to theweight of wood chips after the chipping operation in order to cal-culate the number of chipvans that are required for hauling thechips to the power plant. Based on the data for each stand, yieldand volumes of available fuel wood and sawlog are calculated. Inorder to make sure that AAC is not violated, a module called thecutblock generation module is added into the model to controlthe logging operation and guarantee that the sawlog volumes willbe limited to the AAC values.
Transportin
DelimbingChipping
Loading
Roadside
Sawlog
Fuel Wood
Satellite Yard
tellite yard where the flow of merchantable wood and fuel wood are separated.
Power plantHauling
Chipping
Roadside
ee chipping harvesting system.
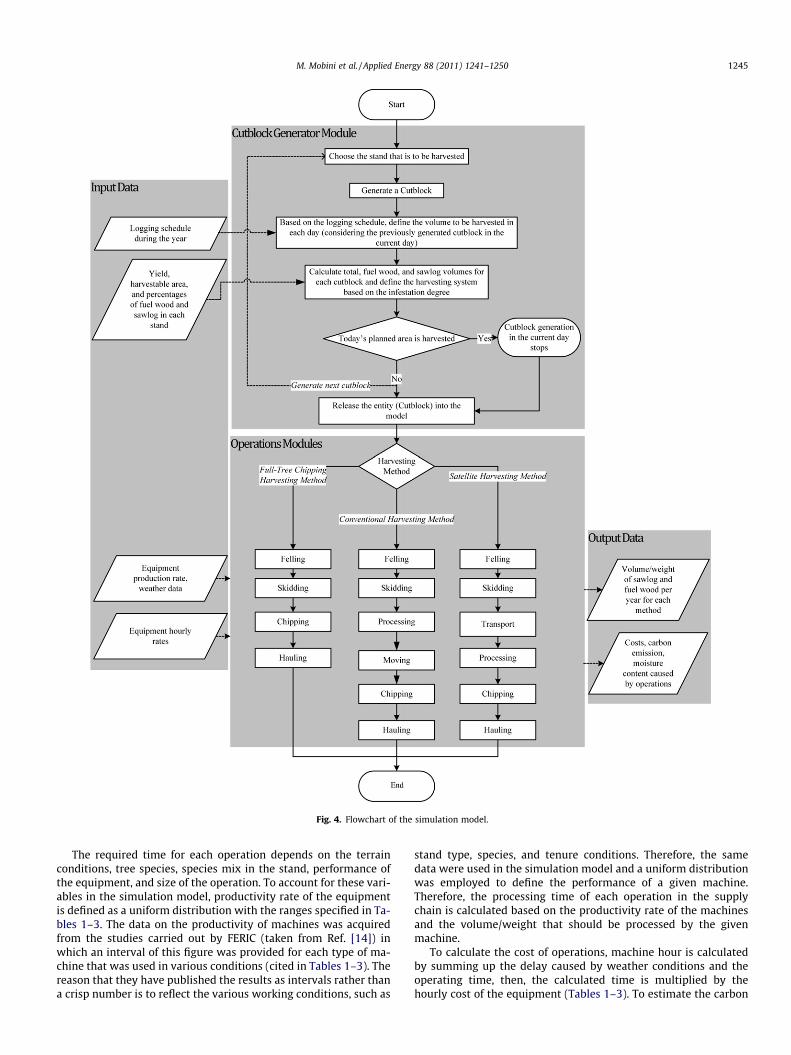
Fig. 4. Flowchart of the simulation model.
M. Mobini et al. / Applied Energy 88 (2011) 1241–1250 1245
The required time for each operation depends on the terrainconditions, tree species, species mix in the stand, performance ofthe equipment, and size of the operation. To account for these vari-ables in the simulation model, productivity rate of the equipmentis defined as a uniform distribution with the ranges specified in Ta-bles 1–3. The data on the productivity of machines was acquiredfrom the studies carried out by FERIC (taken from Ref. [14]) inwhich an interval of this figure was provided for each type of ma-chine that was used in various conditions (cited in Tables 1–3). Thereason that they have published the results as intervals rather thana crisp number is to reflect the various working conditions, such as
stand type, species, and tenure conditions. Therefore, the samedata were used in the simulation model and a uniform distributionwas employed to define the performance of a given machine.Therefore, the processing time of each operation in the supplychain is calculated based on the productivity rate of the machinesand the volume/weight that should be processed by the givenmachine.
To calculate the cost of operations, machine hour is calculatedby summing up the delay caused by weather conditions and theoperating time, then, the calculated time is multiplied by thehourly cost of the equipment (Tables 1–3). To estimate the carbon
1 Retrieved 20 June 2009, from http://www.climate.weatheroffice.ec.gc.ca/climateData.
1246 M. Mobini et al. / Applied Energy 88 (2011) 1241–1250
emissions due to each operation, energy consumption of the equip-ment, and moisture content and dry weight of the delivered bio-mass to the power plant, the equations used in [30] areemployed in the model and are included in Appendix A.
The stand group scheduled for harvesting is randomly selected,from which the cutblocks are generated with an area between 20and 40 ha (drawn from the uniform distribution). Each stand isharvested using the conventional harvesting system; i.e. the saw-log is extracted and the roadside residues are used as biofuel. Afterthe available area for conventional harvesting method is finished,which means the rest of the stand has less than 50% merchantablewood, the satellite harvesting system is used and the cost of log-ging is shared among logging companies and the power plant. Afterthat, in case there are areas with more than 95% infestation, thefull-tree chipping system is used. This assumption is based onthe suggestions made in [14] and the fact that a portion of theAAC value is covered every year. Therefore, the maximum priorityis given to conventional harvesting system and then to the satelliteharvesting system. If the stand which is harvested using these twoharvesting systems contains areas with more than 95% infestedwood, these areas are harvested using the full-tree chipping meth-od. In this way, extracting as much biomass as possible, as a by-product in conventional and satellite harvesting methods or as amain product in the full-tree chipping method, is achieved.
Currently the AAC in the Quesnel TSA is set to 5.2 million m3
[28]. This value has been increased due [31] to the mountain pinebeetle infestation. It is predicted that AAC will be reduced in thenext few years to its previous value of 2.3 m3 [31]. Hence, to reflectthe effect of this reduction in our simulation model, the AAC valueis 5.2 million m3 for the first 5 years and then it is reduced to itsprevious value of 2.3 million m3. The changes in AAC affect the re-sults as it limits the harvesting operations and consequently theavailability of biomass obtained from the conventional and satel-lite yard harvesting systems. The AAC does not limit the full-treechipping system since there is no log volume generated in thismethod and full trees are converted to chips. In practice, forestmanagement units with government-regulated AACs provided89% of the total harvest in the last 10 years, and harvests in theseunits averaged 10% below the sustainable level represented bythe provincial sum of AACs [31]. Therefore, to reflect the fact thatlogging companies operate based on their demand for log, the har-vesting operations in conventional and satellite yard harvestingsystems in our simulation model is limited by 90% of the AAC de-fined for Quesnel TSA during each year.
The model developed by Mahmoudi et al. [26] was capable ofsimulating the forest biomass logistics of the conventional harvest-ing system over a 1-year period. In this research, two other har-vesting systems (satellite yard and full-tree chipping harvestingsystems) are incorporated into the simulation model. Moreover,the simulation model is designed to cover the supply logistics overthe service life of the power plant (20 years). Since the volumes offuel wood and sawlog change as time passes, the shelf-life modeldeveloped by [14] is integrated in the simulation model and esti-mates of the volume, area, and yield are updated for each standgroup upon starting each year.
The harvesting and logging operations vary during the year inresponse to the weather condition, roads condition, soil preserva-tion policies, and market demands. These fluctuations obviously af-fect the conventional and satellite harvesting systems, therefore,they need to be considered in the simulation model. Similar tothe simulation model in [26] the logging schedule of a major log-ging company in Quesnel TSA is used in the model for the first year.This schedule is subject to change over time; hence, to reflect theeffects of the possible changes in the model, a variation of 2% fromthe schedule is added for the harvest schedule of the followingyears.
Another random factor in the simulation model is the weathercondition. Weather conditions affect logging and transportationoperations. To simulate the effect of these changes in the model,it is assumed that 1 h delay in each operation will occur for each1 mm of rain or snow and processes will be shut down for oneday during any day that temperature falls below �40 �C. Theweather data including average temperature, rain and snow pre-cipitation, and relative humidity for each day are obtained forthe period of May 1, 2006 to April 30, 2007 for Williams Lake,1 lo-cated at the center of Quesnel TSA. For different years a variation of2% is considered in the model. The weather data are also used to cal-culate the equilibrium moisture content of delivered woodchips.
3. Results and discussion
Each iteration of the simulation model consists of 20 years. Themodel is run for 10 iterations. Table 4 shows averages for harvestedarea, number of cutblocks generated, total volumes, and totalweight of delivered biomass over 20 years.
Fluctuations in the values presented in Table 4 are mostly dueto the variations in fuel wood and sawlog volumes available in dif-ferent stands and different years, plus the change in the AAC valueover time. For example, the full-tree chipping harvesting system isnot used in the first 10 years of the simulation model, as there areno stands with more than 95% of fuel wood during the first decadein the data set.
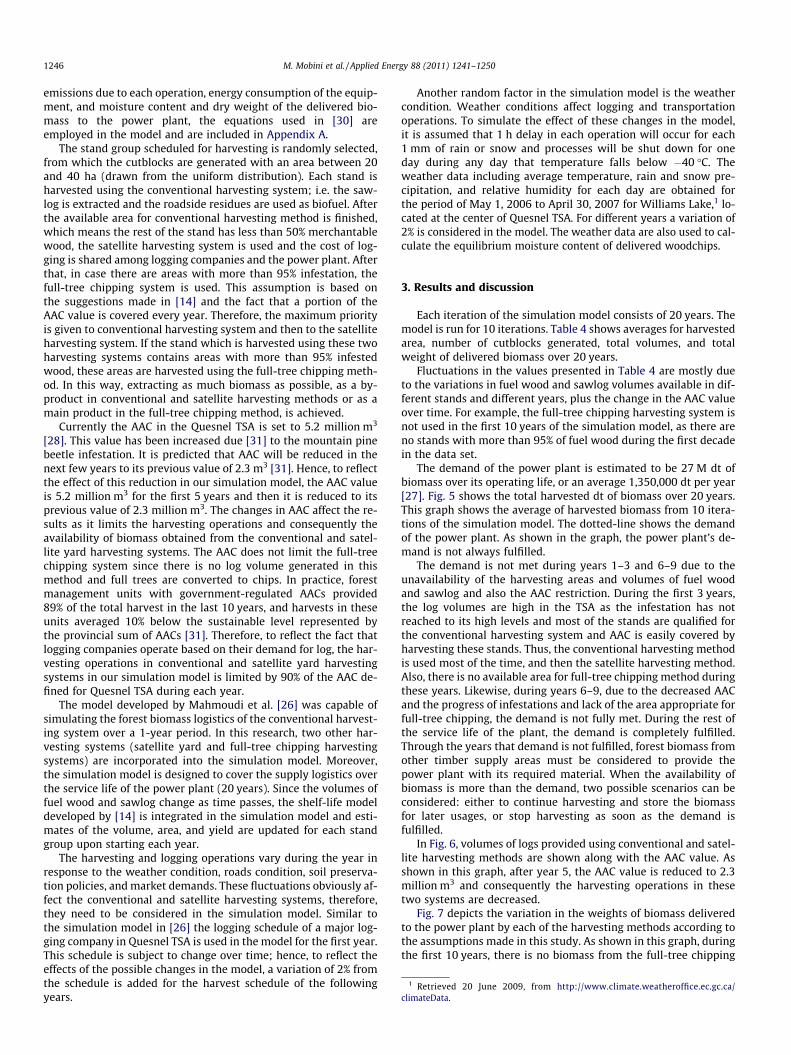
The demand of the power plant is estimated to be 27 M dt ofbiomass over its operating life, or an average 1,350,000 dt per year[27]. Fig. 5 shows the total harvested dt of biomass over 20 years.This graph shows the average of harvested biomass from 10 itera-tions of the simulation model. The dotted-line shows the demandof the power plant. As shown in the graph, the power plant’s de-mand is not always fulfilled.
The demand is not met during years 1–3 and 6–9 due to theunavailability of the harvesting areas and volumes of fuel woodand sawlog and also the AAC restriction. During the first 3 years,the log volumes are high in the TSA as the infestation has notreached to its high levels and most of the stands are qualified forthe conventional harvesting system and AAC is easily covered byharvesting these stands. Thus, the conventional harvesting methodis used most of the time, and then the satellite harvesting method.Also, there is no available area for full-tree chipping method duringthese years. Likewise, during years 6–9, due to the decreased AACand the progress of infestations and lack of the area appropriate forfull-tree chipping, the demand is not fully met. During the rest ofthe service life of the plant, the demand is completely fulfilled.Through the years that demand is not fulfilled, forest biomass fromother timber supply areas must be considered to provide thepower plant with its required material. When the availability ofbiomass is more than the demand, two possible scenarios can beconsidered: either to continue harvesting and store the biomassfor later usages, or stop harvesting as soon as the demand isfulfilled.
In Fig. 6, volumes of logs provided using conventional and satel-lite harvesting methods are shown along with the AAC value. Asshown in this graph, after year 5, the AAC value is reduced to 2.3million m3 and consequently the harvesting operations in thesetwo systems are decreased.
Fig. 7 depicts the variation in the weights of biomass deliveredto the power plant by each of the harvesting methods according tothe assumptions made in this study. As shown in this graph, duringthe first 10 years, there is no biomass from the full-tree chipping
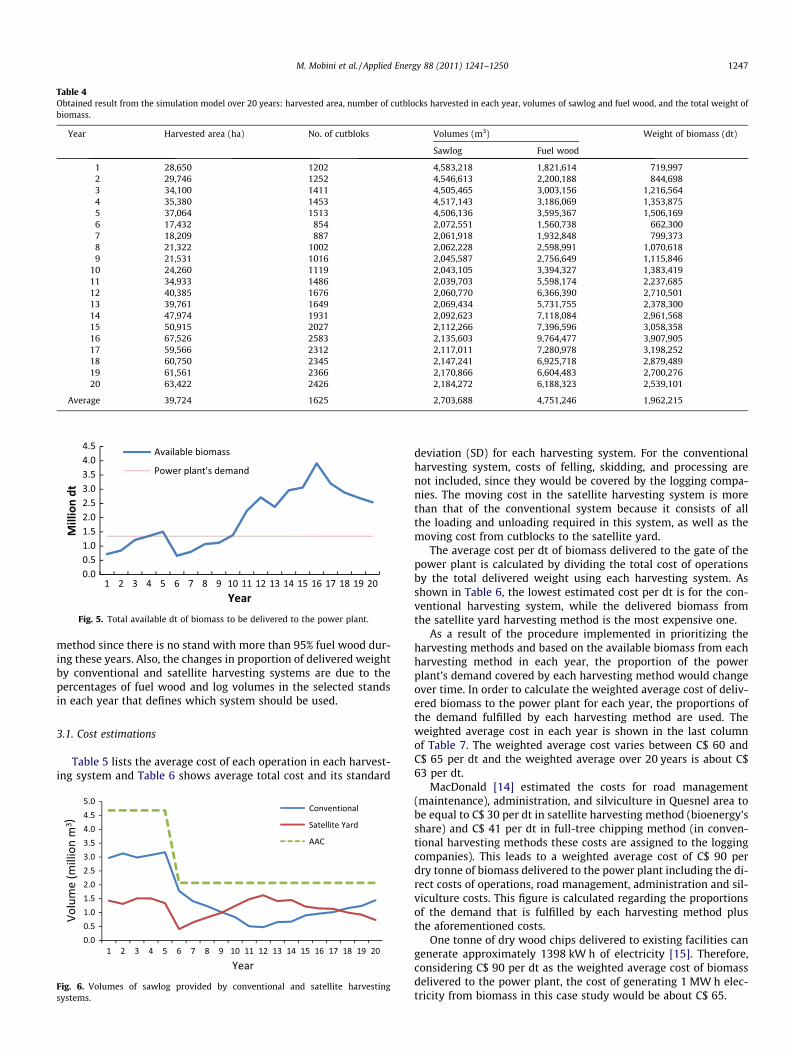
Table 4Obtained result from the simulation model over 20 years: harvested area, number of cutblocks harvested in each year, volumes of sawlog and fuel wood, and the total weight ofbiomass.
Year Harvested area (ha) No. of cutbloks Volumes (m3) Weight of biomass (dt)
Sawlog Fuel wood
1 28,650 1202 4,583,218 1,821,614 719,9972 29,746 1252 4,546,613 2,200,188 844,6983 34,100 1411 4,505,465 3,003,156 1,216,5644 35,380 1453 4,517,143 3,186,069 1,353,8755 37,064 1513 4,506,136 3,595,367 1,506,1696 17,432 854 2,072,551 1,560,738 662,3007 18,209 887 2,061,918 1,932,848 799,3738 21,322 1002 2,062,228 2,598,991 1,070,6189 21,531 1016 2,045,587 2,756,649 1,115,846
10 24,260 1119 2,043,105 3,394,327 1,383,41911 34,933 1486 2,039,703 5,598,174 2,237,68512 40,385 1676 2,060,770 6,366,390 2,710,50113 39,761 1649 2,069,434 5,731,755 2,378,30014 47,974 1931 2,092,623 7,118,084 2,961,56815 50,915 2027 2,112,266 7,396,596 3,058,35816 67,526 2583 2,135,603 9,764,477 3,907,90517 59,566 2312 2,117,011 7,280,978 3,198,25218 60,750 2345 2,147,241 6,925,718 2,879,48919 61,561 2366 2,170,866 6,604,483 2,700,27620 63,422 2426 2,184,272 6,188,323 2,539,101
Average 39,724 1625 2,703,688 4,751,246 1,962,215
Fig. 5. Total available dt of biomass to be delivered to the power plant.
M. Mobini et al. / Applied Energy 88 (2011) 1241–1250 1247
method since there is no stand with more than 95% fuel wood dur-ing these years. Also, the changes in proportion of delivered weightby conventional and satellite harvesting systems are due to thepercentages of fuel wood and log volumes in the selected standsin each year that defines which system should be used.
3.1. Cost estimations
Table 5 lists the average cost of each operation in each harvest-ing system and Table 6 shows average total cost and its standard
Fig. 6. Volumes of sawlog provided by conventional and satellite harvestingsystems.
deviation (SD) for each harvesting system. For the conventionalharvesting system, costs of felling, skidding, and processing arenot included, since they would be covered by the logging compa-nies. The moving cost in the satellite harvesting system is morethan that of the conventional system because it consists of allthe loading and unloading required in this system, as well as themoving cost from cutblocks to the satellite yard.
The average cost per dt of biomass delivered to the gate of thepower plant is calculated by dividing the total cost of operationsby the total delivered weight using each harvesting system. Asshown in Table 6, the lowest estimated cost per dt is for the con-ventional harvesting system, while the delivered biomass fromthe satellite yard harvesting method is the most expensive one.
As a result of the procedure implemented in prioritizing theharvesting methods and based on the available biomass from eachharvesting method in each year, the proportion of the powerplant’s demand covered by each harvesting method would changeover time. In order to calculate the weighted average cost of deliv-ered biomass to the power plant for each year, the proportions ofthe demand fulfilled by each harvesting method are used. Theweighted average cost in each year is shown in the last columnof Table 7. The weighted average cost varies between C$ 60 andC$ 65 per dt and the weighted average over 20 years is about C$63 per dt.
MacDonald [14] estimated the costs for road management(maintenance), administration, and silviculture in Quesnel area tobe equal to C$ 30 per dt in satellite harvesting method (bioenergy’sshare) and C$ 41 per dt in full-tree chipping method (in conven-tional harvesting methods these costs are assigned to the loggingcompanies). This leads to a weighted average cost of C$ 90 perdry tonne of biomass delivered to the power plant including the di-rect costs of operations, road management, administration and sil-viculture costs. This figure is calculated regarding the proportionsof the demand that is fulfilled by each harvesting method plusthe aforementioned costs.
One tonne of dry wood chips delivered to existing facilities cangenerate approximately 1398 kW h of electricity [15]. Therefore,considering C$ 90 per dt as the weighted average cost of biomassdelivered to the power plant, the cost of generating 1 MW h elec-tricity from biomass in this case study would be about C$ 65.
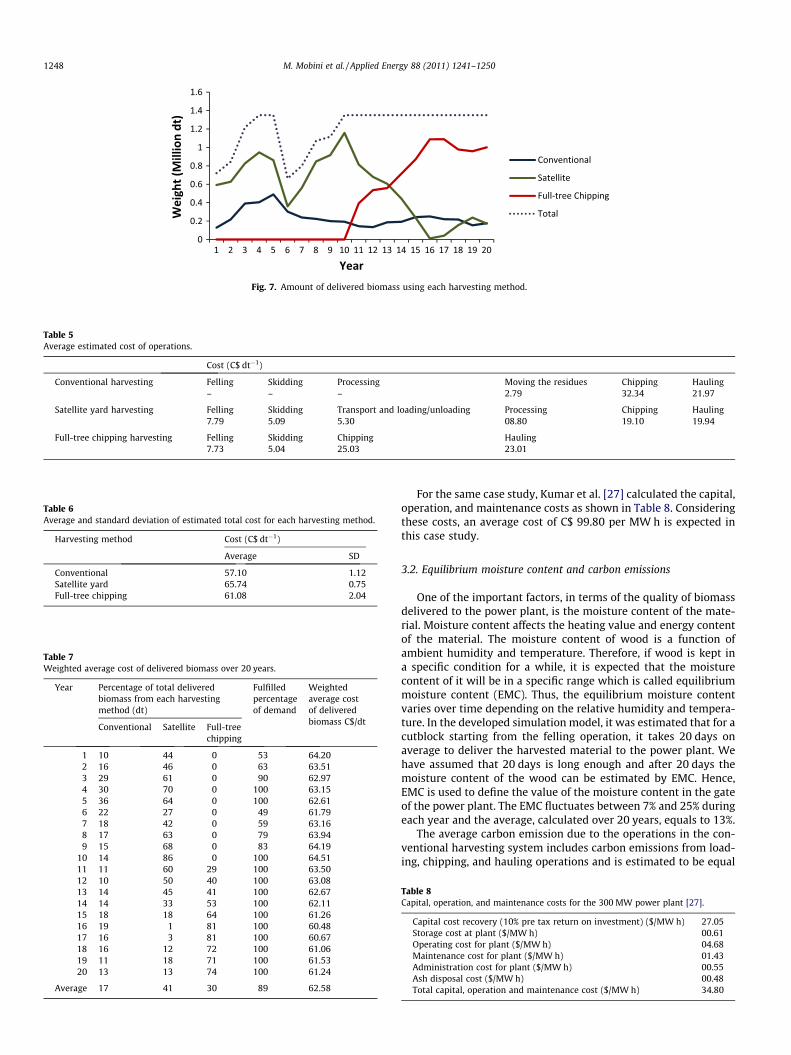
Fig. 7. Amount of delivered biomass using each harvesting method.
Table 5Average estimated cost of operations.
Cost (C$ dt�1)
Conventional harvesting Felling Skidding Processing Moving the residues Chipping Hauling– – – 2.79 32.34 21.97
Satellite yard harvesting Felling Skidding Transport and loading/unloading Processing Chipping Hauling7.79 5.09 5.30 08.80 19.10 19.94
Full-tree chipping harvesting Felling Skidding Chipping Hauling7.73 5.04 25.03 23.01
Table 6Average and standard deviation of estimated total cost for each harvesting method.
Harvesting method Cost (C$ dt�1)
Average SD
Conventional 57.10 1.12Satellite yard 65.74 0.75Full-tree chipping 61.08 2.04
Table 7Weighted average cost of delivered biomass over 20 years.
Year Percentage of total deliveredbiomass from each harvestingmethod (dt)
Fulfilledpercentageof demand
Weightedaverage costof deliveredbiomass C$/dt
Conventional Satellite Full-treechipping
1 10 44 0 53 64.202 16 46 0 63 63.513 29 61 0 90 62.974 30 70 0 100 63.155 36 64 0 100 62.616 22 27 0 49 61.797 18 42 0 59 63.168 17 63 0 79 63.949 15 68 0 83 64.19
10 14 86 0 100 64.5111 11 60 29 100 63.5012 10 50 40 100 63.0813 14 45 41 100 62.6714 14 33 53 100 62.1115 18 18 64 100 61.2616 19 1 81 100 60.4817 16 3 81 100 60.6718 16 12 72 100 61.0619 11 18 71 100 61.5320 13 13 74 100 61.24
Average 17 41 30 89 62.58
1248 M. Mobini et al. / Applied Energy 88 (2011) 1241–1250
For the same case study, Kumar et al. [27] calculated the capital,operation, and maintenance costs as shown in Table 8. Consideringthese costs, an average cost of C$ 99.80 per MW h is expected inthis case study.
3.2. Equilibrium moisture content and carbon emissions
One of the important factors, in terms of the quality of biomassdelivered to the power plant, is the moisture content of the mate-rial. Moisture content affects the heating value and energy contentof the material. The moisture content of wood is a function ofambient humidity and temperature. Therefore, if wood is kept ina specific condition for a while, it is expected that the moisturecontent of it will be in a specific range which is called equilibriummoisture content (EMC). Thus, the equilibrium moisture contentvaries over time depending on the relative humidity and tempera-ture. In the developed simulation model, it was estimated that for acutblock starting from the felling operation, it takes 20 days onaverage to deliver the harvested material to the power plant. Wehave assumed that 20 days is long enough and after 20 days themoisture content of the wood can be estimated by EMC. Hence,EMC is used to define the value of the moisture content in the gateof the power plant. The EMC fluctuates between 7% and 25% duringeach year and the average, calculated over 20 years, equals to 13%.
The average carbon emission due to the operations in the con-ventional harvesting system includes carbon emissions from load-ing, chipping, and hauling operations and is estimated to be equal
Table 8Capital, operation, and maintenance costs for the 300 MW power plant [27].
Capital cost recovery (10% pre tax return on investment) ($/MW h) 27.05Storage cost at plant ($/MW h) 00.61Operating cost for plant ($/MW h) 04.68Maintenance cost for plant ($/MW h) 01.43Administration cost for plant ($/MW h) 00.55Ash disposal cost ($/MW h) 00.48Total capital, operation and maintenance cost ($/MW h) 34.80
M. Mobini et al. / Applied Energy 88 (2011) 1241–1250 1249
to 12.86 kg C dt�1. Using the satellite harvesting method, all themachines are included in the carbon emission calculations andthe proportion for the bioenergy section is estimated to be equalto 13.04 kg C dt�1. Average carbon emission per dt in the full-treechipping method is estimated to be equal to 14.50 kg C dt�1.
4. Conclusions
In this study, a simulation model is developed based on the IB-SAL framework to evaluate the logistics of a biomass supply chainfrom forest harvesting areas to a potential power plant. Three har-vesting systems are considered in the model. The conventional har-vesting system is the current salvage method being used in thestudy area. In this method, the biomass source is limited to theroadside residues. When the percentage of fuel volume in a standexceeds a predefined limit, the logging companies are not inter-ested in those stands and hence the satellite harvesting system isused in which the main product is the biomass and logs are theby-product. In this method, the cost of processes is shared betweenthe logging companies and the power plant. When the infestationreaches to a limit that it is not economically viable to extract thelog volumes from the fuel volume, a third harvesting method, thefull-tree chipping, is used in which the whole trees are chippedon the roadside and hauled to the power plant. The simulationmodel is capable of providing estimates of cost, log volume, fuelvolume, carbon emissions, and equilibrium moisture content ofdelivered material over the life span of the power plant. The modelwas run using the most accurate and reliable data we had accessto. The data consisted of the required data for the Quesnel TSA ininterior BC, Canada. Results show that the demand for 300 MWpower plant in this area would not be always fulfilled and theavailability of biomass is the first limitation for the suggestedpower plant in the area. So, other options for providing biomassmust be considered for such a power plant. An alternative sourcecould be industrial residues from operating mills adjacent to thepower plant. Also, harvesting other areas close to the plant couldbe considered. Reducing the size of the power plant and incorpo-rating agricultural biomass are other options as well.
The estimated average cost per dt for conventional, satelliteyard and full-tree harvesting methods are C$ 57.10, C$ 65.74, andC$ 61.08, respectively. Although the cheapest way to provide bio-mass is by using the conventional harvesting method, the amountof available biomass in this system is limited to the roadside resi-dues left by logging companies. Therefore, incorporating the othertwo harvesting methods is essential. For the service life of thepower plant, it is estimated that the weighted average cost perdry tonne of delivered biomass to the gate of the power plant isabout C$ 90, including the costs for road management (mainte-nance), administration, and silviculture.
It is worth mentioning that these results are obtained based onthe assumptions made in this study. It is assumed that every yearthe logging companies would harvest up to 90% of the AAC limit.This may not be the realistic case as their harvesting operationsare based on demands and market conditions. Therefore, the per-centages of volumes harvested by each of the harvesting methodsmay not necessarily reflect the decision made in real situation. In-deed, it is assumed that once a stand is selected to be harvested, itwill undertake all the harvesting methods before moving to thenext stand. In other words, first the roadside residues are gatheredfrom the stand and if the AAC limitation is not exceeded, the areawith more than 50% fuel wood would be harvested by the satelliteharvesting system. Afterwards, in case there are areas with morethan 95% fuel wood, the full-tree chipping method is used. Anotherassumption made in the present study is the schedule of harvest-ing in logging companies. Most likely this schedule changes over
years and for various companies. Also, weather data used in themodel is for year 2007 and is extended for 20 years by incorporat-ing 2% variation. Other unforeseen variations may happen.
Potential topics for further studies include the consideration ofresource constraints in the model and tackle the optimization ofthe supply chain. Also, determining the optimum size of the powerplant based on the available biomass is interesting. Another attrac-tive topic is to consider other industries in the area, such as saw-mills, pulp and paper, and pelletizing plants, and their demandsand operations to maximize the benefit extracted from the con-sumed resources.
Acknowledgements
This research is supported in part by the British Columbia Min-istry of Forest and Range, Natural Sciences and Engineering Re-search Council of Canada, and Wood Pellet Association of Canada.The authors acknowledge the generosity of Mr. Jack MacDonaldand Mr. Tony Sauder of the FPInnovations (FERIC Division) forsharing forest harvest data and Mr. Don Gosnell for providing tech-nical advice.
Appendix A
Equations used to calculate the equilibrium moisture content ofbiomass are as follows [30]:
EMC ð%Þ ¼ 1800W
Kh1� Kh
þ K1Khþ 2K1K2K2h2
1þ K1Khþ 2K1K2K2h2
" #
where h is relative humidity and the parameters W, K, K1 and K2 de-pend on temperature. If temperature T is given in �C the followingequations define the value of these parameters.
W ¼ 349þ 1:29T þ 0:0135T2
K ¼ 0:805þ 0:000736T � 0:00000273T2
K1 ¼ 6:27� 0:00938T � 0:000303T2
K2 ¼ 1:91þ 0:0407T � 0:000293T2
The following equations are used to calculate the density ofbiomass:
q ¼ 1000Gm 1þ MC100
� �
in which q is density of wood (kg m�3) MC is the moisture content(% wet basis) and Gm is the specific gravity of wood calculate by thefollowing equations:
Gm ¼Gb
ð1� 0:265aGbÞ
A ¼ ð30�MCÞ30
References
[1] Lundmark R. Cost structure of and competition for forest-based biomass. ScandJ Forest Res 2006;21:272–80.
[2] Sedjo RA. The economics of forest-based biomass supply. Energy Policy1997;25:559–66.
[3] Berndes G, Hoogwijk M, van den Broek R. The contribution of biomass in thefuture global energy supply: a review of 17 studies. Biomass Bioenergy2003;25:1–28.
[4] Ericsson K, Nilsson LJ. Assessment of the potential biomass supply in Europeusing a resource-focused approach. Biomass Bioenergy 2006;30:1–15.
1250 M. Mobini et al. / Applied Energy 88 (2011) 1241–1250
[5] Sasaki N, Knorr W, Foster DR, Etoh H, Ninomiya H, Chay S, et al. Woodybiomass and bioenergy potentials in Southeast Asia between 1990 and 2020.Appl Energy 1990;86(2009):S140–50.
[6] Kinoshita T, Ohki T, Yamagata Y. Woody biomass supply potential for thermalpower plants in Japan. Appl Energy 2010;87:2923–7.
[7] Viana H, Cohen WB, Lopes D, Aranha J. Assessment of forest biomass for use asenergy. GIS-based analysis of geographical availability and locations of wood-fired power plants in Portugal. Appl Energy 2010;87:2551–60.
[8] Allen J, Browne M, Hunter A, Boyd J, Palmer H. Logistics management and costsof biomass fuel supply. Int J Phys Distrib Logis Manage 1998;28:463–77.
[9] Gallagher PW, Dikeman M, Fritz J, Wailes E, Gauthier W, Shapouri H. Supplyand social cost estimates for biomass from crop residues in the United States.Environ Resour Econ 2003;24:335–58.
[10] Hamelinck CN, Suurs RAA, Faaij APC. International bioenergy transport costsand energy balance. Biomass Bioenergy 2005;29:114–34.
[11] Caputo AC, Palumbo M, Pelagagge PM, Scacchia F. Economics of biomassenergy utilization in combustion and gasification plants: effects of logisticvariables. Biomass Bioenergy 2005;28:35–51.
[12] Yoshioka T, Aruga K, Nitami T, Sakai H, Kobayashi H. A case study on the costsand the fuel consumption of harvesting, transporting, and chipping chains forlogging residues in Japan. Biomass Bioenergy 2006;30:342–8.
[13] Kumar A, Flynn P, Sokhansanj S. Biopower generation from mountain pineinfested wood in Canada: an economical opportunity for greenhouse gasmitigation. Renew Energy 2008;33:1354–63.
[14] MacDonald AJ. Estimated cost for harvesting, comminuting, and transportingbeetle-killed pine in the Quesnel/Nazko area of Central British Columbia, BCMinistry of Forests and Range; 2006.
[15] Stennes B, McBeath A. Bioenergy options for woody feedstock: are trees killedby mountain pine beetle in British Columbia a viable bioenergy resource?Natural Resources Canada, Canadian Forest Service, Pacific Forestry Centre,Victoria, BC; 2006. Information Report BC-X-405E.
[16] Vera D, Carabias J, Jurado F, Ruiz-Reyes N. A Honey Bee Foraging approach foroptimal location of a biomass power plant. Appl Energy 2010;87:2119–27.
[17] Leduc S, Lundgren J, Franklin O, Dotzauer E. Location of a biomass basedmethanol production plant: a dynamic problem in northern Sweden. ApplEnergy 2010;87:68–75.
[18] Leduc S, Starfelt F, Dotzauer E, Kindermann G, McCallum I, Obersteiner M, et al.Optimal location of lignocellulosic ethanol refineries with polygeneration inSweden. Energy 2010;35:2709–16.
[19] Hall P, Gigler JK, Sims REH. Delivery systems of forest arisings for energyproduction in New Zealand. Biomass Bioenergy 2001;21:391–9.
[20] Sims REH, Venturi P. All-year-round harvesting of short rotation coppiceeucalyptus compared with the delivered costs of biomass from moreconventional short season, harvesting systems. Biomass Bioenergy 2004;26:27–37.
[21] Sokhansanj S, Kumar A, Turhollow AF. Development and implementation ofintegrated biomass supply analysis and logistics model (IBSAL). BiomassBioenergy 2006;30:838–47.
[22] Sokhansanj S, Turhollow AF, Wilkerson EG. Integrated Biomass Supply andLogistics: a modeling environment for designing feedstock supply systems forbiofuel production. Resour Eng Technol Sustain World 2008;15:15–8.
[23] Sokhansanj S, Turholow AF, Stephen J, Stumborg M, Fenton J, Mani S. Analysisof five simulated straw harvest scenarios. Can Biosyst Eng J 2008;50:28–35.
[24] Sokhansanj S, Mani S, Tagore S, Turhollow AF. Techno-economic analysis ofusing corn stover to supply heat and power to a corn ethanol plant – Part 1:cost of feedstock supply logistics. Biomass Bioenergy 2010;34:75–81.
[25] Sokhansanj S, Mani S, Turhollow A, Kumar A, Bransby D, Lynd L, et al. Large-scale production, harvest and logistics of switchgrass (Panicum virgatum L.) –current technology and envisioning a mature technology. Biofuels BioprodBiorefining 2009;3:124–41.
[26] Mahmoudi M, Sowlati T, Sokhansanj S. Logistics of supplying biomass from amountain pine beetle-infested forest to a power plant in British Columbia.Scand J Forest Res 2009;24:76–86.
[27] Kumar A, Flynn PC, Sokhansanj S. Feedstock availability and power costsassociated with using BC’s beetle-infested pine, BIOCAP Canada Foundation;2005.
[28] BC Ministry of Forests and Range (MoFR). Quesnel Timber Supply Area TimberSupply Review; 2007.
[29] Imagine That, ExtendSim simulation software, 7.0; 2009.[30] United States Department of Agriculture (USDA). Wood handbook – wood as
an engineering material, FPL–GTR–190; 2010.[31] BC Ministary of Forests and Range (MoFR). The state of British Columbia’s
forests; 2006.


