Embed Size (px)
Citation preview
Equity Research Special Report January 2013
The Bank of Nova Scotia is the parent company and a related issuer of Scotia Capital Inc. and ultimate parent company and related issuer of Scotia Capital (USA) Inc. CI Financial Corp. is a Related Issuer of Scotia Capital Inc. Scotia Capital Inc was retained by Telus Corporation to provide a fairness opinion with respect to a proposed share conversion. For Reg AC Certifi cation and important disclosures see Appendix A of this report. Analysts employed by non-U.S. affi liates are not registered/qualifi ed as research analysts with FINRA in the U.S.
Focus 2013
Bottom Line Trumping Headline

Focus 2013 January 2013
1
Contents
Director’s Comment
Bottom Line Trumping Headline 3
Portfolio Strategy: Bottom Line Trumping Headline
Revisiting 2012: S&P 500 Beats TSX for Second Consecutive Year 5
Small Cap Strategy
Small Caps Delivering Gains in 2013 21
Economic and Market Outlook
United States to Emerge Stronger Following Fiscal Cliff 35
Latin America Economic and Market Outlook
Favourable Macroeconomic & Policy Context for Latin America in 2013 41
Sector Comments
Agriculture
Weather Market Here to Stay 43
Banks, Americas
Refocused Banking System – Return of Capital – Valuation Recovery 47
Diversified Financials
Smaller Cap Plays Likely to Shine in 2013 55
Diversified Industrials
Labelling the Winners 63
Energy Infrastructure
Pipelines and Power Lines 71
Global Fertilizers
Strong Grain Fundamentals May Not Be Enough 77
Gold & Precious Minerals
A New Year… Starting Afresh 85
Industrial Products
Prefer Steel & Wheels over Big Iron in 2013 99
LatAm Airports
Fleet Expansion at Mexican Carriers to Drive Passenger Traffic 109
LatAm Construction & Infrastructure
Key Drivers: New Administration in Mexico and Private and Public Investment in Peru 115
Focus 2013 January 2013
2
Media
Advancing the Transition Toward Online Media 121
Metals & Mining
Same Challenges, New Opportunities 127
North American Life Insurance
Selective Opportunities Despite Stiff Headwinds 131
Oil & Gas
Canadian E&P – Themes for 2013 137
International E&P – Themes for 2013 144
Oilfield Services – Themes for 2013 150
Paper & Forest Products
Run, Forrest, Run! 159
Real Estate & REITs
Wash, Rinse, Repeat 165
Retailing
Consumer 2013: More of the Same – Constraint 177
Software & IT Services
Stabilization of Demand 185
Special Situations: Industrials
Engineering and Construction 189
Technology Hardware
Act III: The Internet’s Next Phase 193
Telecommunications & Cable
Dividend and Disciplined Allocation of Capital Remain a Key Focus 199
Transportation & Aerospace
Macro Tailwind Desperately Needed 211
Appendix 1 – China Outlook Published by CNC Asset Management Ltd., exclusively distributed by Scotia Capital Inc.
A Year of Recovery i
Publication date January 7, 2013.
Pricing as at December 27, 2012, unless otherwise stated.
Currencies in Canadian dollars unless otherwise stated.
Cover photo credit: www.istockphoto.com/ugurhan

Focus 2013 January 2013
John Henderson, MBA, P.Eng. (416) 945-7393 (Scotia Capital Inc. – Canada) [email protected]
3
Director’s Comment
Bottom Line Trumping Headline
It is my pleasure to introduce Focus 2013, Scotiabank GBM’s annual investment outlook for the coming year. In this report, we highlight industry outlooks, themes, and stock recommendations. We also introduce a new Focus Stock (FS) tier in our rating system to better identify changes in our analysts’ best ideas throughout the year.
This report begins with our portfolio strategy outlook prepared by Vincent Delisle, while Hugo Ste-Marie offers his perspective on implications for small cap strategy. Our general economic outlook is summarized by Derek Holt and Dov Zigler, while Pablo Bréard shares his views specific to Latin America’s economic prospects. Collectively, they outline reasons for near-term bullishness for stock markets and the economy, although perhaps more so in the United States and Latin America than in Canada. Na Liu summarizes expected impacts of developments in China, primarily on commodity markets (shown in Appendix 1). Our analysts present a brief overview of key themes expected to drive performance in their respective sectors, as well as their top stock recommendations for the year.
We caution readers that this report contains highlight commentaries only. Investors are encouraged to contact their Scotiabank salesperson or our analysts for a more complete review of our research views and recommendations. Our published research is available on our website, ScotiaView.
Thank you for your interest in this publication. We wish you a successful year of investing in 2013.
Focus 2013 January 2013
4
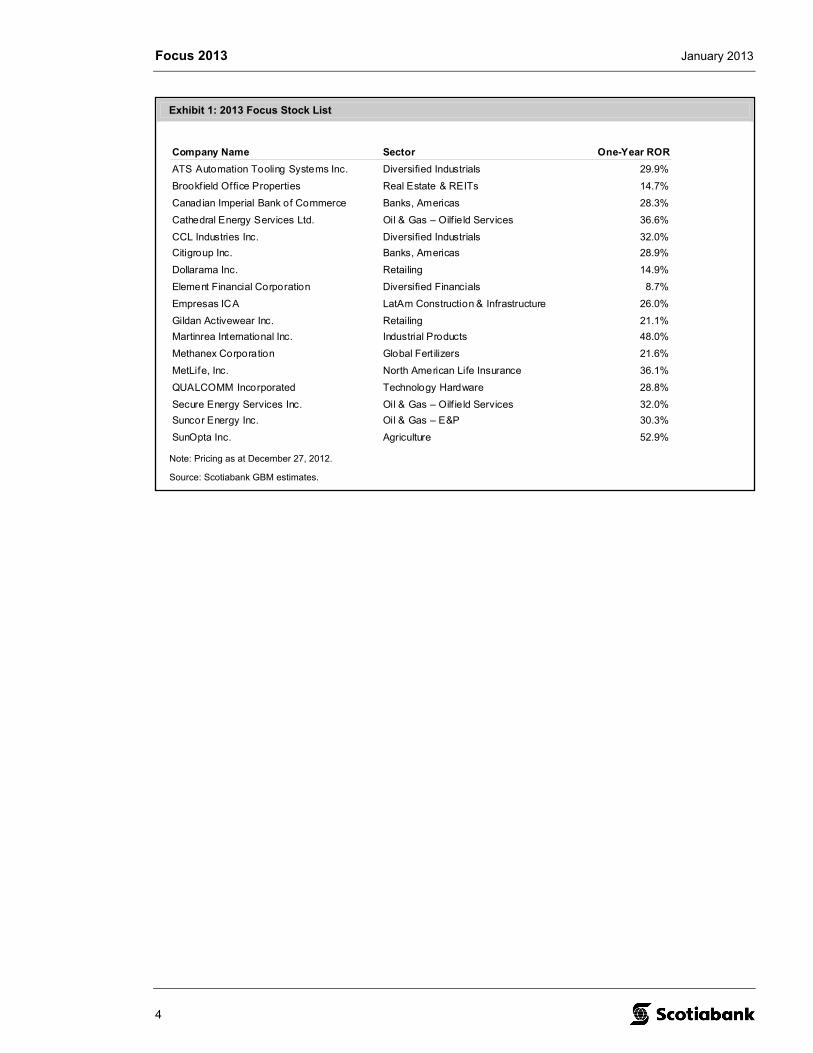
Exhibit 1: 2013 Focus Stock List
Company Name Sector One-Year ROR
ATS Automation Tooling Systems Inc. Diversified Industrials 29.9%
Brookfield Office Properties Real Estate & REITs 14.7%
Canadian Imperial Bank of Commerce Banks, Americas 28.3%
Cathedral Energy Services Ltd. Oil & Gas – Oilf ield Services 36.6%
CCL Industries Inc. Diversified Industrials 32.0%
Citigroup Inc. Banks, Americas 28.9%
Dollarama Inc. Retailing 14.9%
Element Financial Corporation Diversified Financials 8.7%
Empresas ICA LatAm Construction & Infrastructure 26.0%
Gildan Activewear Inc. Retailing 21.1%
Martinrea International Inc. Industrial Products 48.0%
Methanex Corporation Global Fert ilizers 21.6%
MetLife, Inc. North American Life Insurance 36.1%
QUALCOMM Incorporated Technology Hardware 28.8%
Secure Energy Services Inc. Oil & Gas – Oilf ield Services 32.0%
Suncor Energy Inc. Oil & Gas – E&P 30.3%
SunOpta Inc. Agriculture 52.9%
Note: Pricing as at December 27, 2012.
Source: Scotiabank GBM estimates.
Focus 2013 January 2013
Vincent Delisle, CFA (514) 287-3628 Jean-Michel Gauthier, MMF (514) 287-3661 (Scotia Capital Inc. – Canada) (Scotia Capital Inc. – Canada) [email protected] [email protected]
5
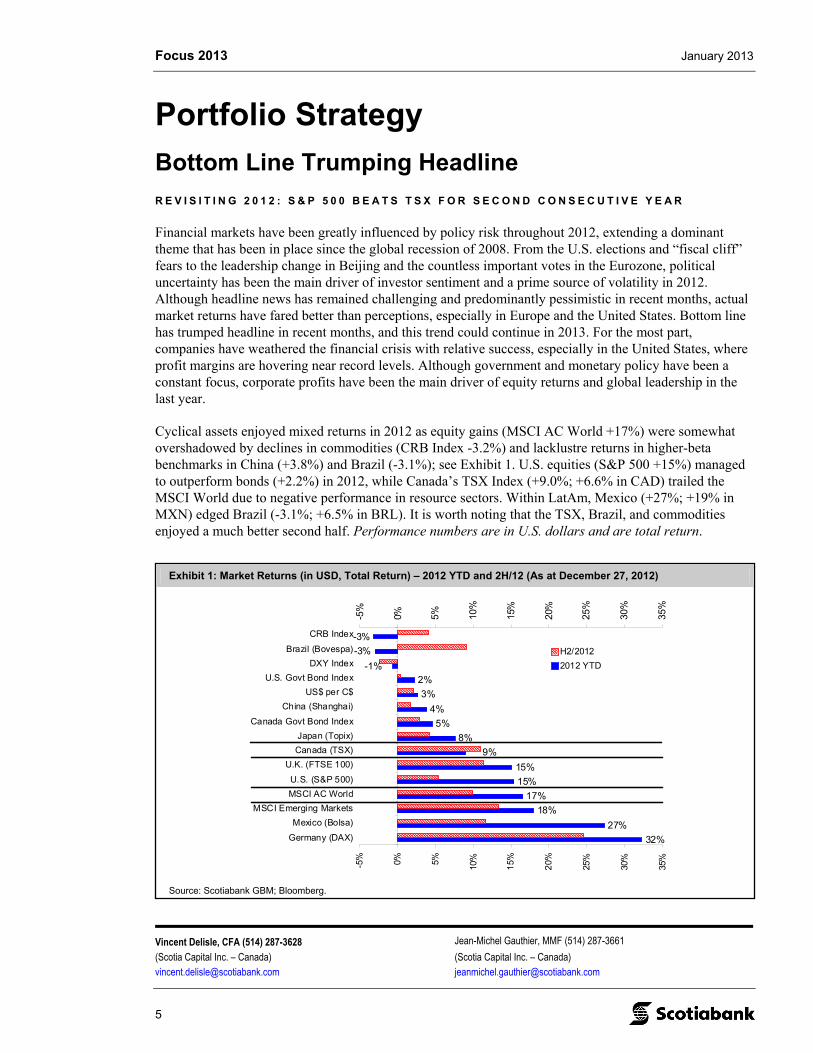
Exhibit 1: Market Returns (in USD, Total Return) – 2012 YTD and 2H/12 (As at December 27, 2012)
32%
27%
18%
17%
15%
15%
8%
5%
4%
3%
2%
-3%
-3%
-1%
9%
-5% 0% 5%
10%
15%
20%
25%
30%
35%
Germany (DAX)
Mexico (Bolsa)
MSCI Emerging Markets
MSCI AC World
U.S. (S&P 500)
U.K. (FTSE 100)
Canada (TSX)
Japan (Topix)
Canada Govt Bond Index
China (Shanghai)
US$ per C$
U.S. Govt Bond Index
DXY Index
Brazil (Bovespa)
CRB Index
-5%
0% 5% 10%
15%
20%
25%
30%
35%
H2/2012
2012 YTD
Source: Scotiabank GBM; Bloomberg.
Portfolio Strategy
Bottom Line Trumping Headline
R E V I S I T I N G 2 0 1 2 : S & P 5 0 0 B E A T S T S X F O R S E C O N D C O N S E C U T I V E Y E A R
Financial markets have been greatly influenced by policy risk throughout 2012, extending a dominant theme that has been in place since the global recession of 2008. From the U.S. elections and “fiscal cliff” fears to the leadership change in Beijing and the countless important votes in the Eurozone, political uncertainty has been the main driver of investor sentiment and a prime source of volatility in 2012. Although headline news has remained challenging and predominantly pessimistic in recent months, actual market returns have fared better than perceptions, especially in Europe and the United States. Bottom line has trumped headline in recent months, and this trend could continue in 2013. For the most part, companies have weathered the financial crisis with relative success, especially in the United States, where profit margins are hovering near record levels. Although government and monetary policy have been a constant focus, corporate profits have been the main driver of equity returns and global leadership in the last year.
Cyclical assets enjoyed mixed returns in 2012 as equity gains (MSCI AC World +17%) were somewhat overshadowed by declines in commodities (CRB Index -3.2%) and lacklustre returns in higher-beta benchmarks in China (+3.8%) and Brazil (-3.1%); see Exhibit 1. U.S. equities (S&P 500 +15%) managed to outperform bonds (+2.2%) in 2012, while Canada’s TSX Index (+9.0%; +6.6% in CAD) trailed the MSCI World due to negative performance in resource sectors. Within LatAm, Mexico (+27%; +19% in MXN) edged Brazil (-3.1%; +6.5% in BRL). It is worth noting that the TSX, Brazil, and commodities enjoyed a much better second half. Performance numbers are in U.S. dollars and are total return.
Focus 2013 January 2013
6
Exhibit 2: Real GDP Growth YOY (%) – Developed vs. Emerging Countries
-2.0
0.0
2.0
4.0
6.0
8.0
10.0
12.0
World U.S. Canada Eurozone Japan Brazil China India Mexico
2013 IMF Forecast
2012 IMF Forecast
2011
2004-2010 Average
Source: Scotiabank GBM; IMF.
Exhibit 3: Change in Forward EPS Estimates – Normalized at 100 on January 2012
90
92
94
96
98
100
102
104
106
Jan
-12
Fe
b-1
2
Ma
r-1
2
Ap
r-1
2
Ma
y-1
2
Jun
-12
Ju
l-12
Au
g-1
2
Se
p-12
Oct
-12
No
v-12
De
c-1
2
Jan
-13
90
92
94
96
98
100
102
104
106
TSX
MSCI Germany
MSCI China
MSCI Brazil
MSCI Mexico
S&P 500
Source: Scotiabank GBM; Thomson Financial.
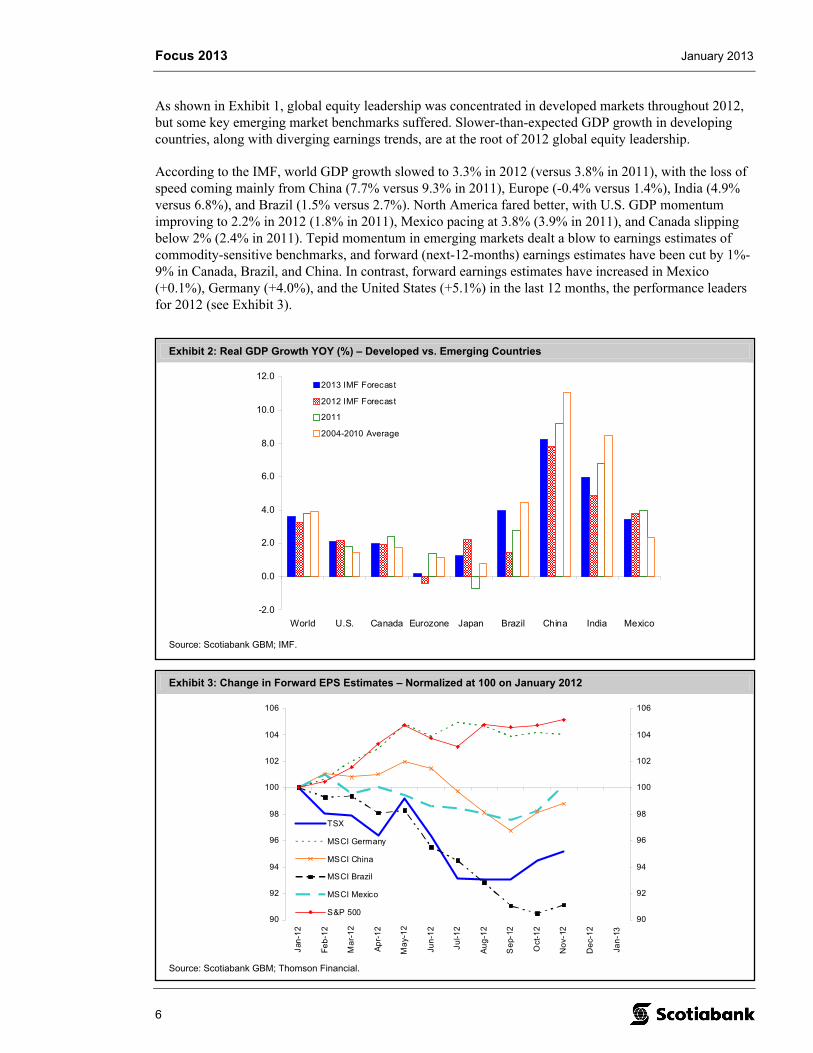
As shown in Exhibit 1, global equity leadership was concentrated in developed markets throughout 2012, but some key emerging market benchmarks suffered. Slower-than-expected GDP growth in developing countries, along with diverging earnings trends, are at the root of 2012 global equity leadership.
According to the IMF, world GDP growth slowed to 3.3% in 2012 (versus 3.8% in 2011), with the loss of speed coming mainly from China (7.7% versus 9.3% in 2011), Europe (-0.4% versus 1.4%), India (4.9% versus 6.8%), and Brazil (1.5% versus 2.7%). North America fared better, with U.S. GDP momentum improving to 2.2% in 2012 (1.8% in 2011), Mexico pacing at 3.8% (3.9% in 2011), and Canada slipping below 2% (2.4% in 2011). Tepid momentum in emerging markets dealt a blow to earnings estimates of commodity-sensitive benchmarks, and forward (next-12-months) earnings estimates have been cut by 1%-9% in Canada, Brazil, and China. In contrast, forward earnings estimates have increased in Mexico (+0.1%), Germany (+4.0%), and the United States (+5.1%) in the last 12 months, the performance leaders for 2012 (see Exhibit 3).
Focus 2013 January 2013
7
Exhibit 4: MSCI AC World Monthly Forward P/E – Level and Change YOY (1988-2012)
-40%
-30%
-20%
-10%
0%
10%
20%
30%
40%
50%
60%
De
c-8
8
De
c-9
0
De
c-9
2
De
c-9
4
De
c-9
6
De
c-9
8
De
c-0
0
De
c-0
2
Dec
-04
De
c-06
De
c-0
8
De
c-1
0
De
c-1
2
5
10
15
20
25
30
MSCI AC World Fwd P/E Level - RHS
MSCI AC World Fwd P/E YOY Change - LHS
Source: Scotiabank GBM; Thomson Financial.
Exhibit 5: World PMI vs. MSCI AC World EPS (1998-2012)
30
35
40
45
50
55
60
65
70
Jan-
98
Jan
-99
Jan-
00
Jan-
01
Jan
-02
Jan-
03
Jan
-04
Jan
-05
Jan-
06
Jan
-07
Jan
-08
Jan-
09
Jan
-10
Jan-
11
Jan
-12
Jan
-13
Jan-
14
-50%
-40%
-30%
-20%
-10%
0%
10%
20%
30%
40%
50%
World Manufacturing PMI - LHS
MSCI AC World 12M Fwd EPS YoY - RHS
Source: Scotiabank GBM; Bloomberg; Thomson Financial.
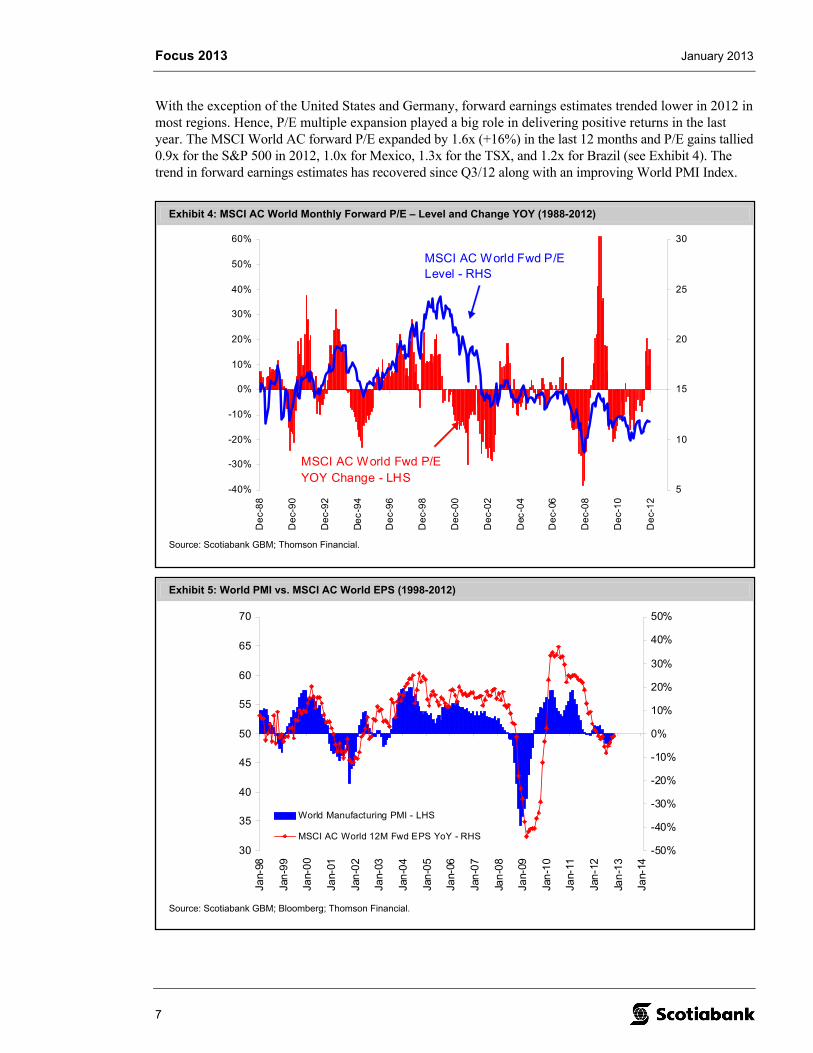
With the exception of the United States and Germany, forward earnings estimates trended lower in 2012 in most regions. Hence, P/E multiple expansion played a big role in delivering positive returns in the last year. The MSCI World AC forward P/E expanded by 1.6x (+16%) in the last 12 months and P/E gains tallied 0.9x for the S&P 500 in 2012, 1.0x for Mexico, 1.3x for the TSX, and 1.2x for Brazil (see Exhibit 4). The trend in forward earnings estimates has recovered since Q3/12 along with an improving World PMI Index.
Focus 2013 January 2013
8
Exhibit 6: Positive Mean Reversion – U.S. Housing Starts and Unemployment Rate
400
600
800
1,000
1,200
1,400
1,600
1,800
2,000
2,200
2,400
Jan
-90
Jan
-92
Jan
-94
Jan
-96
Ja
n-98
Jan
-00
Jan
-02
Jan
-04
Jan
-06
Jan
-08
Jan
-10
Ja
n-12
Jan
-14
3
4
5
6
7
8
9
10
U.S. Housing Starts ('000s) - LHS
U.S. Unemployment Rate (inverted) - RHS
Source: Scotiabank GBM; Bloomberg.
B I G P I C T U R E O U T L O O K
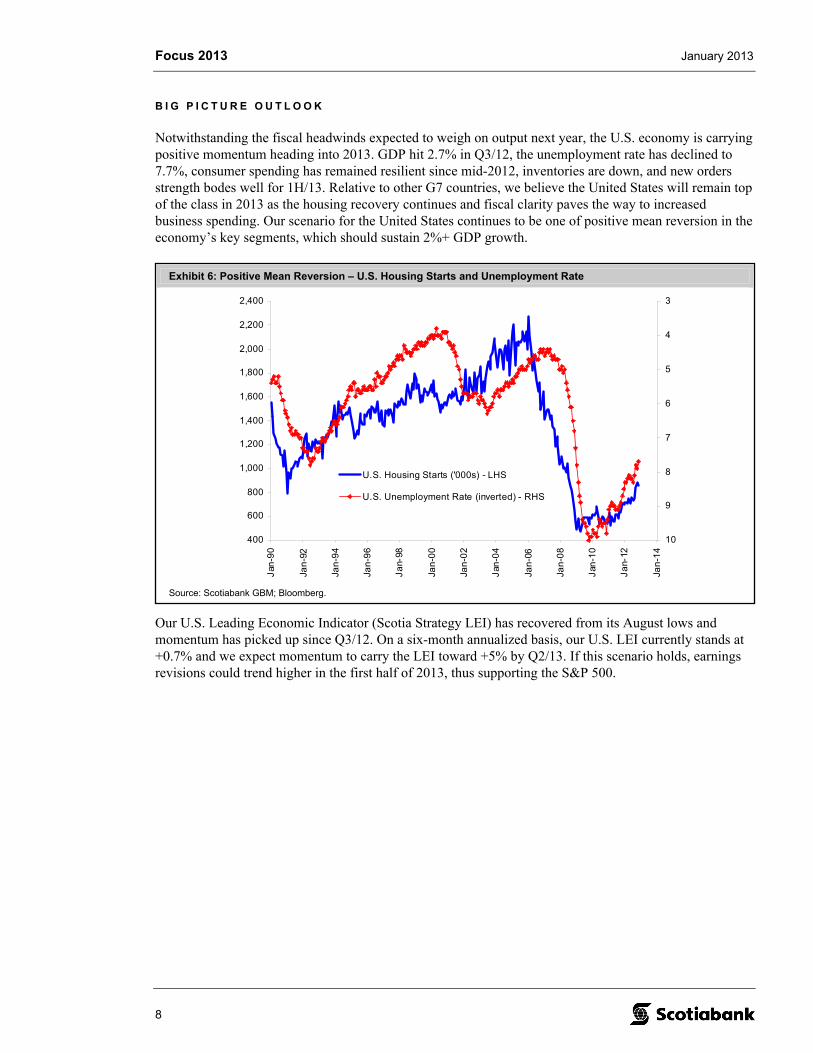
Notwithstanding the fiscal headwinds expected to weigh on output next year, the U.S. economy is carrying positive momentum heading into 2013. GDP hit 2.7% in Q3/12, the unemployment rate has declined to 7.7%, consumer spending has remained resilient since mid-2012, inventories are down, and new orders strength bodes well for 1H/13. Relative to other G7 countries, we believe the United States will remain top of the class in 2013 as the housing recovery continues and fiscal clarity paves the way to increased business spending. Our scenario for the United States continues to be one of positive mean reversion in the economy’s key segments, which should sustain 2%+ GDP growth.
Our U.S. Leading Economic Indicator (Scotia Strategy LEI) has recovered from its August lows and momentum has picked up since Q3/12. On a six-month annualized basis, our U.S. LEI currently stands at +0.7% and we expect momentum to carry the LEI toward +5% by Q2/13. If this scenario holds, earnings revisions could trend higher in the first half of 2013, thus supporting the S&P 500.
Focus 2013 January 2013
9
Exhibit 8: China PMI* and Real GDP Growth (%) – 2004-2012
40
42
44
46
48
50
52
54
56
58
60
Ap
r-0
4
Oct
-04
Apr
-05
Oct
-05
Apr
-06
Oct
-06
Apr
-07
Oct
-07
Apr
-08
Oct
-08
Apr
-09
Oct
-09
Apr
-10
Oct
-10
Apr
-11
Oct
-11
Ap
r-1
2
Oct
-12
Ap
r-1
3
6
7
8
9
10
11
12
13
14
China Manufacturing PMI* - LHS
China Real GDP YoY - RHS
* 50% Official Manufacturing PMI, 50% HSBC Manufacturing PMI.
Source: Scotiabank GBM; Bloomberg.
Exhibit 7: Scotia Strategy – U.S. Leading Economic Indicator (LEI) and S&P 500 EPS Growth
-20%
-15%
-10%
-5%
0%
5%
10%
15%
20%
Jan
-48
Jan-
51
Jan
-54
Jan
-57
Jan
-60
Jan
-63
Ja
n-6
6
Ja
n-6
9
Ja
n-7
2
Ja
n-75
Ja
n-78
Ja
n-81
Jan
-84
Jan
-87
Ja
n-9
0
Ja
n-9
3
Ja
n-9
6
Jan
-99
Jan
-02
Jan
-05
Jan
-08
Jan
-11
Jan
-14
-40%
-30%
-20%
-10%
0%
10%
20%
30%
40%
Recessions asDefined by the NBER
LEI 6M Annualized -LHS
S&P 500 Fwd EPSYoY - RHS
Source: Scotiabank GBM estimates; Bloomberg; U.S. Federal Reserve; NBER; Thomson Financial; Shiller (12M trailing EPS).
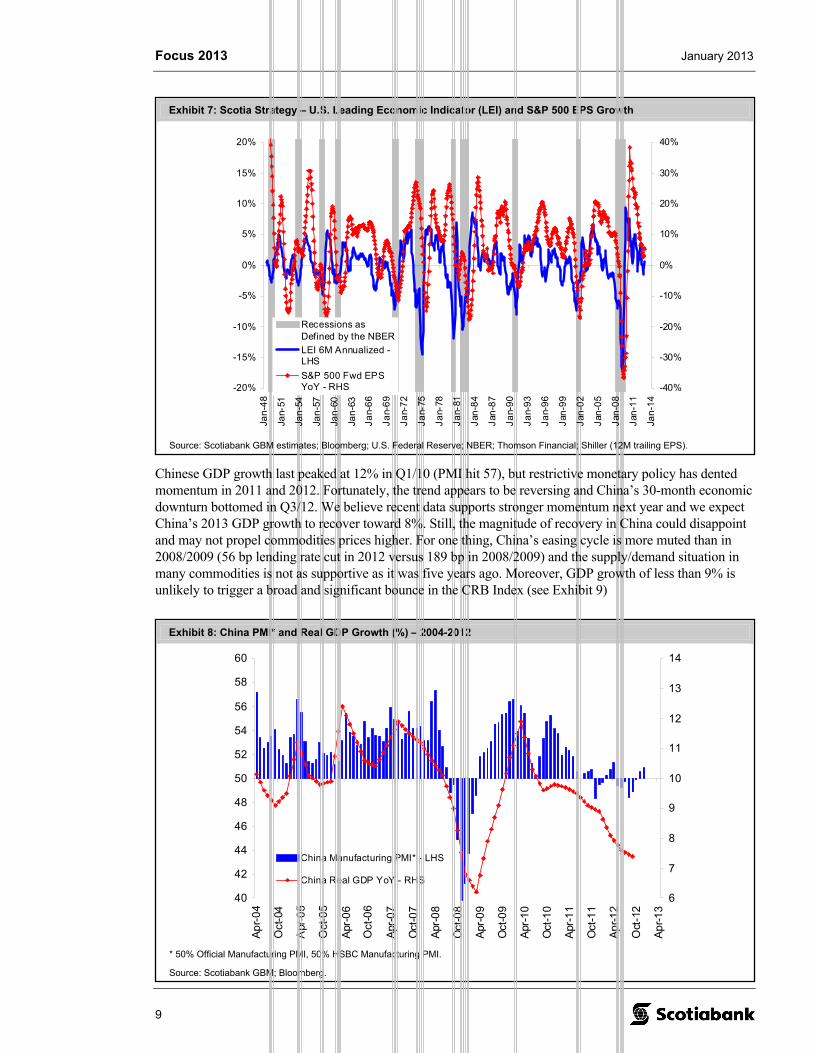
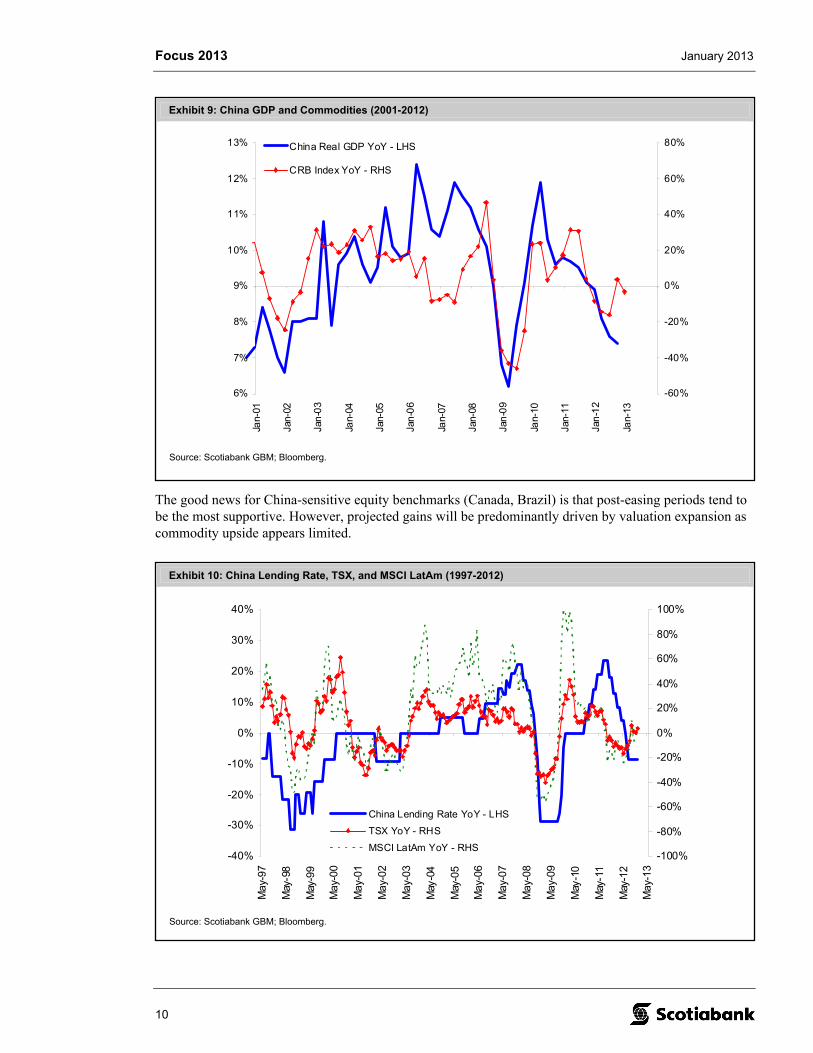
Chinese GDP growth last peaked at 12% in Q1/10 (PMI hit 57), but restrictive monetary policy has dented momentum in 2011 and 2012. Fortunately, the trend appears to be reversing and China’s 30-month economic downturn bottomed in Q3/12. We believe recent data supports stronger momentum next year and we expect China’s 2013 GDP growth to recover toward 8%. Still, the magnitude of recovery in China could disappoint and may not propel commodities prices higher. For one thing, China’s easing cycle is more muted than in 2008/2009 (56 bp lending rate cut in 2012 versus 189 bp in 2008/2009) and the supply/demand situation in many commodities is not as supportive as it was five years ago. Moreover, GDP growth of less than 9% is unlikely to trigger a broad and significant bounce in the CRB Index (see Exhibit 9)
Focus 2013 January 2013
10
Exhibit 9: China GDP and Commodities (2001-2012)
6%
7%
8%
9%
10%
11%
12%
13%
Jan-
01
Jan-
02
Jan
-03
Jan-
04
Jan-
05
Jan
-06
Jan-
07
Jan-
08
Jan
-09
Jan-
10
Jan-
11
Jan
-12
Jan-
13
-60%
-40%
-20%
0%
20%
40%
60%
80%China Real GDP YoY - LHS
CRB Index YoY - RHS
Source: Scotiabank GBM; Bloomberg.
Exhibit 10: China Lending Rate, TSX, and MSCI LatAm (1997-2012)
-40%
-30%
-20%
-10%
0%
10%
20%
30%
40%
May
-97
May
-98
May
-99
May
-00
May
-01
May
-02
May
-03
May
-04
May
-05
May
-06
May
-07
May
-08
May
-09
May
-10
May
-11
May
-12
May
-13
-100%
-80%
-60%
-40%
-20%
0%
20%
40%
60%
80%
100%
China Lending Rate YoY - LHS
TSX YoY - RHS
MSCI LatAm YoY - RHS
Source: Scotiabank GBM; Bloomberg.
The good news for China-sensitive equity benchmarks (Canada, Brazil) is that post-easing periods tend to be the most supportive. However, projected gains will be predominantly driven by valuation expansion as commodity upside appears limited.
Focus 2013 January 2013
11
Exhibit 11: U.S. Housing Starts and Household Appliances
250
500
750
1,000
1,250
1,500
1,750
2,000
2,250
2,500
De
c-9
9
De
c-0
0
De
c-0
1
De
c-0
2
Dec
-03
Dec
-04
De
c-0
5
De
c-0
6
De
c-0
7
De
c-0
8
De
c-0
9
De
c-1
0
De
c-1
1
De
c-1
21.4
1.5
1.6
1.7
1.8
1.9
2.0
2.1
2.2
Housing Starts (000s) - LHS
New Orders of Household Appliances (US$B) - RHS
Source: Scotiabank GBM; Bloomberg.
U . S . H O U S I N G T A I L W I N D C O N T I N U E S
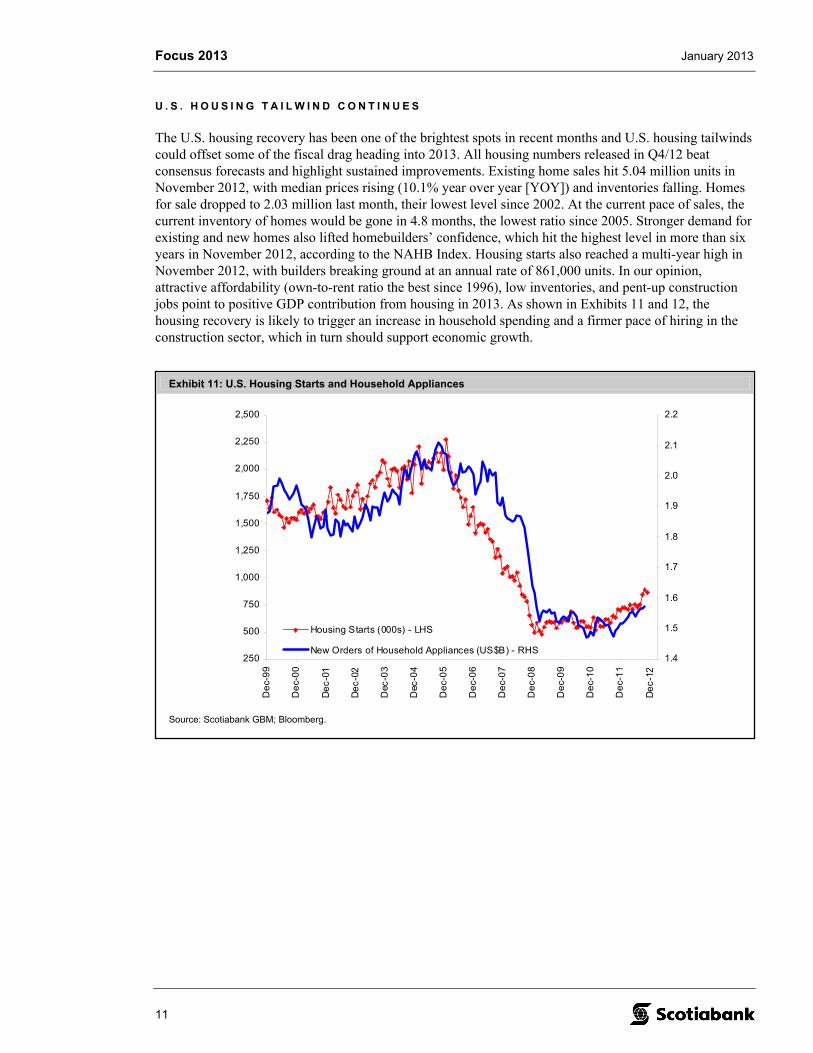
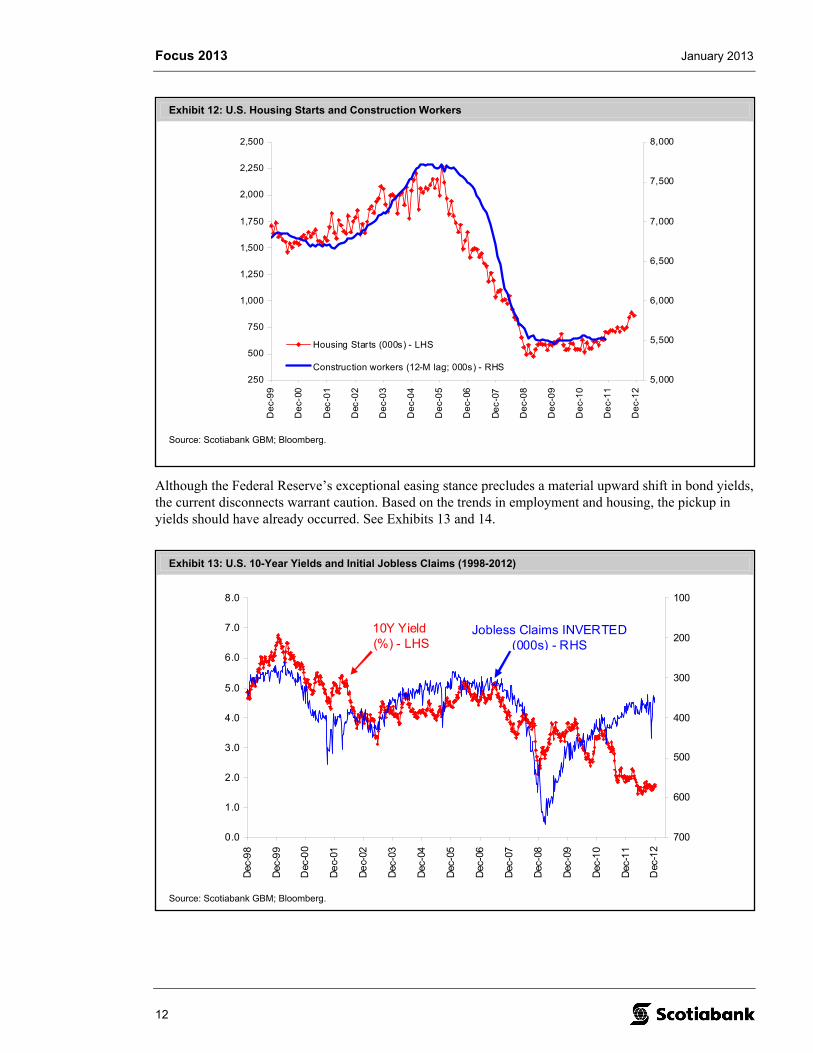
The U.S. housing recovery has been one of the brightest spots in recent months and U.S. housing tailwinds could offset some of the fiscal drag heading into 2013. All housing numbers released in Q4/12 beat consensus forecasts and highlight sustained improvements. Existing home sales hit 5.04 million units in November 2012, with median prices rising (10.1% year over year [YOY]) and inventories falling. Homes for sale dropped to 2.03 million last month, their lowest level since 2002. At the current pace of sales, the current inventory of homes would be gone in 4.8 months, the lowest ratio since 2005. Stronger demand for existing and new homes also lifted homebuilders’ confidence, which hit the highest level in more than six years in November 2012, according to the NAHB Index. Housing starts also reached a multi-year high in November 2012, with builders breaking ground at an annual rate of 861,000 units. In our opinion, attractive affordability (own-to-rent ratio the best since 1996), low inventories, and pent-up construction jobs point to positive GDP contribution from housing in 2013. As shown in Exhibits 11 and 12, the housing recovery is likely to trigger an increase in household spending and a firmer pace of hiring in the construction sector, which in turn should support economic growth.
Focus 2013 January 2013
12
Exhibit 12: U.S. Housing Starts and Construction Workers
250
500
750
1,000
1,250
1,500
1,750
2,000
2,250
2,500
De
c-9
9
De
c-00
Dec
-01
Dec
-02
De
c-0
3
De
c-0
4
De
c-0
5
De
c-06
De
c-0
7
De
c-0
8
De
c-0
9
De
c-1
0
De
c-1
1
De
c-1
2
5,000
5,500
6,000
6,500
7,000
7,500
8,000
Housing Starts (000s) - LHS
Construction workers (12-M lag; 000s) - RHS
Source: Scotiabank GBM; Bloomberg.
Exhibit 13: U.S. 10-Year Yields and Initial Jobless Claims (1998-2012)
0.0
1.0
2.0
3.0
4.0
5.0
6.0
7.0
8.0
Dec
-98
Dec
-99
Dec
-00
De
c-01
De
c-02
Dec
-03
Dec
-04
Dec
-05
Dec
-06
Dec
-07
Dec
-08
Dec
-09
Dec
-10
Dec
-11
Dec
-12
100
200
300
400
500
600
700
Jobless Claims INVERTED (000s) - RHS
10Y Yield (%) - LHS
Source: Scotiabank GBM; Bloomberg.
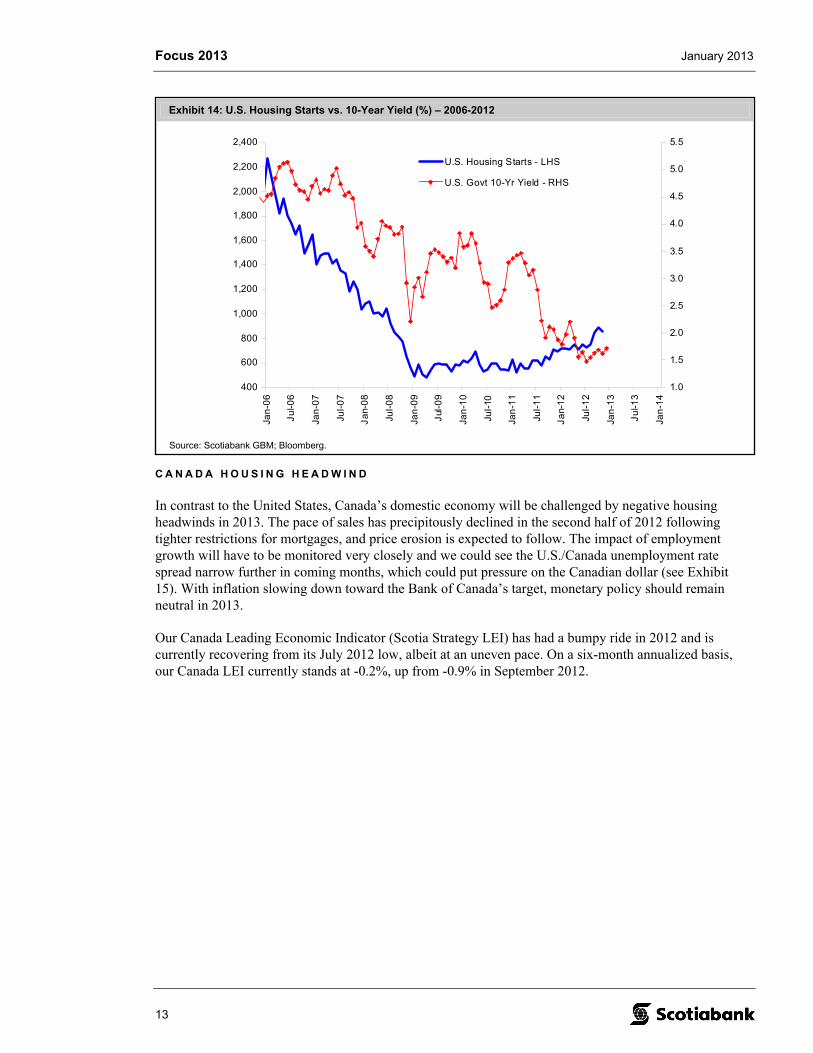
Although the Federal Reserve’s exceptional easing stance precludes a material upward shift in bond yields, the current disconnects warrant caution. Based on the trends in employment and housing, the pickup in yields should have already occurred. See Exhibits 13 and 14.
Focus 2013 January 2013
13
Exhibit 14: U.S. Housing Starts vs. 10-Year Yield (%) – 2006-2012
400
600
800
1,000
1,200
1,400
1,600
1,800
2,000
2,200
2,400
Jan
-06
Ju
l-06
Jan
-07
Jul-
07
Ja
n-0
8
Jul-
08
Jan
-09
Jul
-09
Jan
-10
Jul-
10
Jan
-11
Jul-
11
Ja
n-1
2
Jul-
12
Jan
-13
Ju
l-13
Jan
-14
1.0
1.5
2.0
2.5
3.0
3.5
4.0
4.5
5.0
5.5
U.S. Housing Starts - LHS
U.S. Govt 10-Yr Yield - RHS
Source: Scotiabank GBM; Bloomberg.
C A N A D A H O U S I N G H E A D W I N D
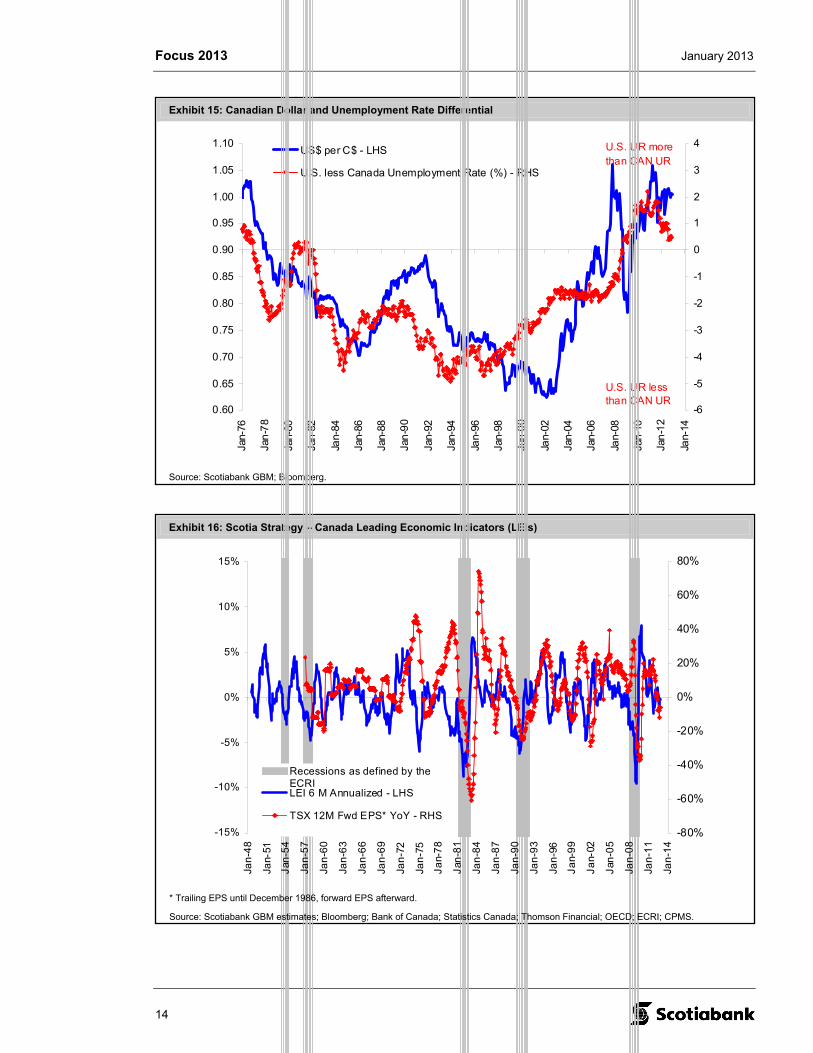
In contrast to the United States, Canada’s domestic economy will be challenged by negative housing headwinds in 2013. The pace of sales has precipitously declined in the second half of 2012 following tighter restrictions for mortgages, and price erosion is expected to follow. The impact of employment growth will have to be monitored very closely and we could see the U.S./Canada unemployment rate spread narrow further in coming months, which could put pressure on the Canadian dollar (see Exhibit 15). With inflation slowing down toward the Bank of Canada’s target, monetary policy should remain neutral in 2013.
Our Canada Leading Economic Indicator (Scotia Strategy LEI) has had a bumpy ride in 2012 and is currently recovering from its July 2012 low, albeit at an uneven pace. On a six-month annualized basis, our Canada LEI currently stands at -0.2%, up from -0.9% in September 2012.
Focus 2013 January 2013
14
Exhibit 15: Canadian Dollar and Unemployment Rate Differential
0.60
0.65
0.70
0.75
0.80
0.85
0.90
0.95
1.00
1.05
1.10
Jan-
76
Jan
-78
Jan-
80
Jan-
82
Jan-
84
Jan-
86
Jan-
88
Jan
-90
Jan-
92
Jan-
94
Jan-
96
Jan-
98
Jan
-00
Jan-
02
Jan-
04
Jan-
06
Jan-
08
Jan-
10
Jan
-12
Jan-
14
-6
-5
-4
-3
-2
-1
0
1
2
3
4US$ per C$ - LHS
U.S. less Canada Unemployment Rate (%) - RHS
U.S. UR less than CAN UR
U.S. UR more than CAN UR
Source: Scotiabank GBM; Bloomberg.
Exhibit 16: Scotia Strategy – Canada Leading Economic Indicators (LEIs)
-15%
-10%
-5%
0%
5%
10%
15%
Jan
-48
Jan-
51
Jan
-54
Jan
-57
Jan
-60
Jan
-63
Jan
-66
Jan
-69
Jan
-72
Jan
-75
Ja
n-7
8
Jan
-81
Jan
-84
Jan
-87
Jan
-90
Jan
-93
Jan
-96
Ja
n-9
9
Ja
n-02
Jan
-05
Jan
-08
Jan
-11
Jan
-14
-80%
-60%
-40%
-20%
0%
20%
40%
60%
80%
Recessions as defined by theECRILEI 6 M Annualized - LHS
TSX 12M Fwd EPS* YoY - RHS
* Trailing EPS until December 1986, forward EPS afterward.
Source: Scotiabank GBM estimates; Bloomberg; Bank of Canada; Statistics Canada; Thomson Financial; OECD; ECRI; CPMS.
Focus 2013 January 2013
15
Exhibit 17: Corporate America – Cash Hoard Is High and Capex Low
4%
6%
8%
10%
12%
14%
16%
De
c-5
1
Dec
-54
Dec
-57
Dec
-60
De
c-63
De
c-66
De
c-6
9
De
c-7
2
De
c-7
5
De
c-7
8
De
c-8
1
Dec
-84
Dec
-87
De
c-9
0
De
c-9
3
De
c-96
De
c-9
9
De
c-0
2
De
c-0
5
De
c-0
8
De
c-1
1
Liquid Assets as % of GDP
Capex as % of GDP
* Based on U.S. non-financial corporate business data.
Source: Scotiabank GBM; Bloomberg.
P E N T - U P C A P E X
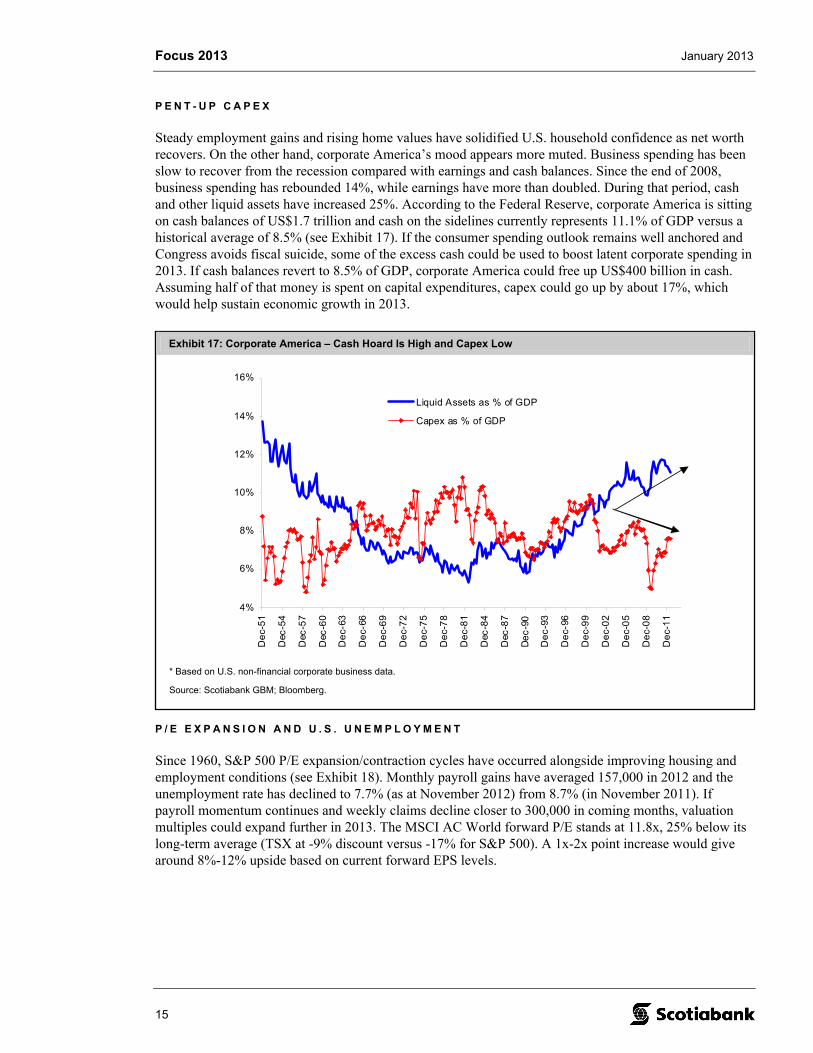
Steady employment gains and rising home values have solidified U.S. household confidence as net worth recovers. On the other hand, corporate America’s mood appears more muted. Business spending has been slow to recover from the recession compared with earnings and cash balances. Since the end of 2008, business spending has rebounded 14%, while earnings have more than doubled. During that period, cash and other liquid assets have increased 25%. According to the Federal Reserve, corporate America is sitting on cash balances of US$1.7 trillion and cash on the sidelines currently represents 11.1% of GDP versus a historical average of 8.5% (see Exhibit 17). If the consumer spending outlook remains well anchored and Congress avoids fiscal suicide, some of the excess cash could be used to boost latent corporate spending in 2013. If cash balances revert to 8.5% of GDP, corporate America could free up US$400 billion in cash. Assuming half of that money is spent on capital expenditures, capex could go up by about 17%, which would help sustain economic growth in 2013.
P / E E X P A N S I O N A N D U . S . U N E M P L O Y M E N T
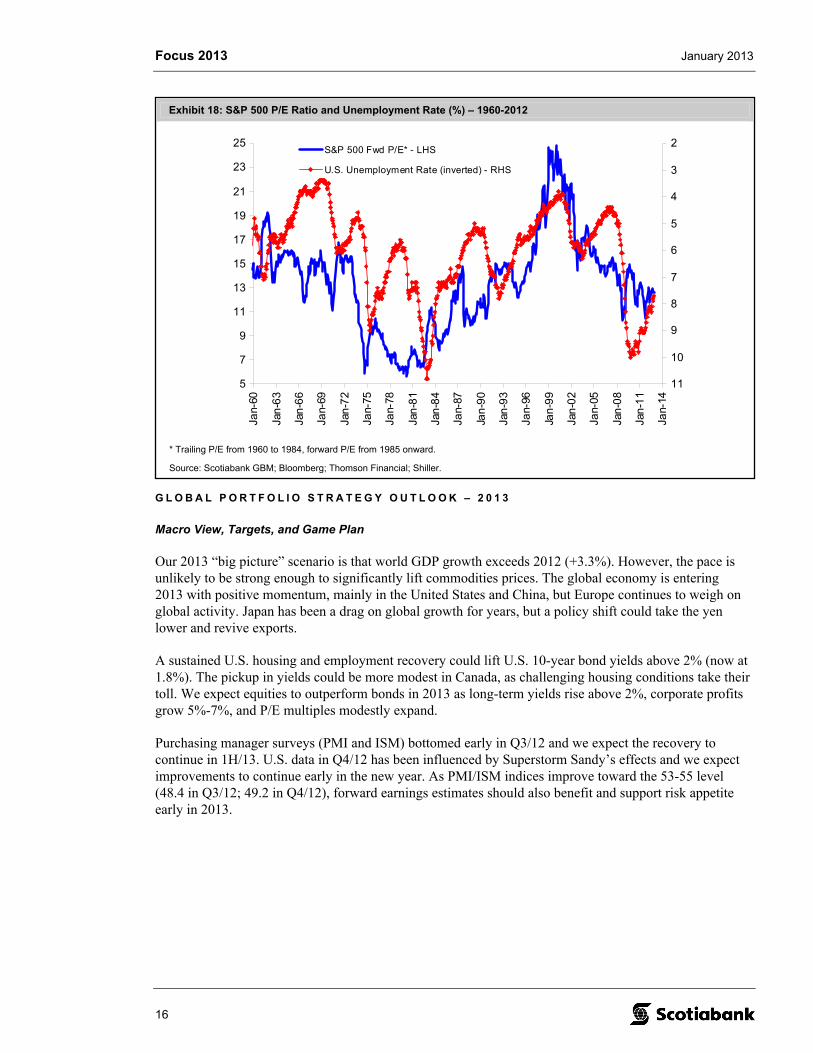
Since 1960, S&P 500 P/E expansion/contraction cycles have occurred alongside improving housing and employment conditions (see Exhibit 18). Monthly payroll gains have averaged 157,000 in 2012 and the unemployment rate has declined to 7.7% (as at November 2012) from 8.7% (in November 2011). If payroll momentum continues and weekly claims decline closer to 300,000 in coming months, valuation multiples could expand further in 2013. The MSCI AC World forward P/E stands at 11.8x, 25% below its long-term average (TSX at -9% discount versus -17% for S&P 500). A 1x-2x point increase would give around 8%-12% upside based on current forward EPS levels.
Focus 2013 January 2013
16
Exhibit 18: S&P 500 P/E Ratio and Unemployment Rate (%) – 1960-2012
5
7
9
11
13
15
17
19
21
23
25
Jan-
60
Jan
-63
Jan
-66
Jan-
69
Jan
-72
Jan-
75
Jan-
78
Jan
-81
Jan
-84
Jan-
87
Jan
-90
Jan
-93
Jan-
96
Jan
-99
Jan
-02
Jan-
05
Jan
-08
Jan
-11
Jan-
14
2
3
4
5
6
7
8
9
10
11
S&P 500 Fwd P/E* - LHS
U.S. Unemployment Rate (inverted) - RHS
* Trailing P/E from 1960 to 1984, forward P/E from 1985 onward.
Source: Scotiabank GBM; Bloomberg; Thomson Financial; Shiller.
G L O B A L P O R T F O L I O S T R A T E G Y O U T L O O K – 2 0 1 3
Macro View, Targets, and Game Plan
Our 2013 “big picture” scenario is that world GDP growth exceeds 2012 (+3.3%). However, the pace is unlikely to be strong enough to significantly lift commodities prices. The global economy is entering 2013 with positive momentum, mainly in the United States and China, but Europe continues to weigh on global activity. Japan has been a drag on global growth for years, but a policy shift could take the yen lower and revive exports.
A sustained U.S. housing and employment recovery could lift U.S. 10-year bond yields above 2% (now at 1.8%). The pickup in yields could be more modest in Canada, as challenging housing conditions take their toll. We expect equities to outperform bonds in 2013 as long-term yields rise above 2%, corporate profits grow 5%-7%, and P/E multiples modestly expand.
Purchasing manager surveys (PMI and ISM) bottomed early in Q3/12 and we expect the recovery to continue in 1H/13. U.S. data in Q4/12 has been influenced by Superstorm Sandy’s effects and we expect improvements to continue early in the new year. As PMI/ISM indices improve toward the 53-55 level (48.4 in Q3/12; 49.2 in Q4/12), forward earnings estimates should also benefit and support risk appetite early in 2013.
Focus 2013 January 2013
17
Exhibit 19: Scotia Strategy – Financial Forecasts
Forecasts 2010 2011 Dec. 2012 2013E 2014E
S&P/TSX 13,443 11,955 12,374 EPS 673 833 816 875 950S&P 500 1,258 1,258 1,418
EPS 84 96 99 105 112Bolsa 38,551 37,078 42,323
Bovespa 69,305 56,754 58,202
Equity
12,800
1,550
46,000
68,000
Source: Scotiabank GBM estimates; Bloomberg; CPMS; S&P.
Exhibit 20: Scotiabank GBM Asset Mix – Focus 2013 Update
Change FromBenchmark Recommended Last
Equities 60% 64% +2% Canada (TSX) 5% 6% -1% U.S. (S&P 500) 22% 20% -2% Europe (U.K./Germany) 12% 12% -1% Japan 6% 7% +3%
Far East ex-Japan 10% 12% +2% LatAm 5% 7% +1%
Bonds 40% 34% -2% Government 30% 20% -2% Corporate 10% 14%
Cash (91-D Tbills) 0% 2%
Asset Mix
Source: Scotiabank GBM estimates.
Exhibit 21: TSX Sector Strategy – Q1/13 Update
SectorsEnergy (Producers over Integrated)Materials (Fertilizers/Forest/Mining OW)Industrials (Capital Goods over Transport)
DiscretionaryStaplesHealthcareFinancials (Insurance Over Banks)TechnologyTelecoms (Telco over Cables)Utilities
MarketweightUnderweightUnderweight
UnderweightMarketweightMarketweightUnderweight
RecommendationOverweightOverweightOverweight
Source: Scotiabank GBM estimates.
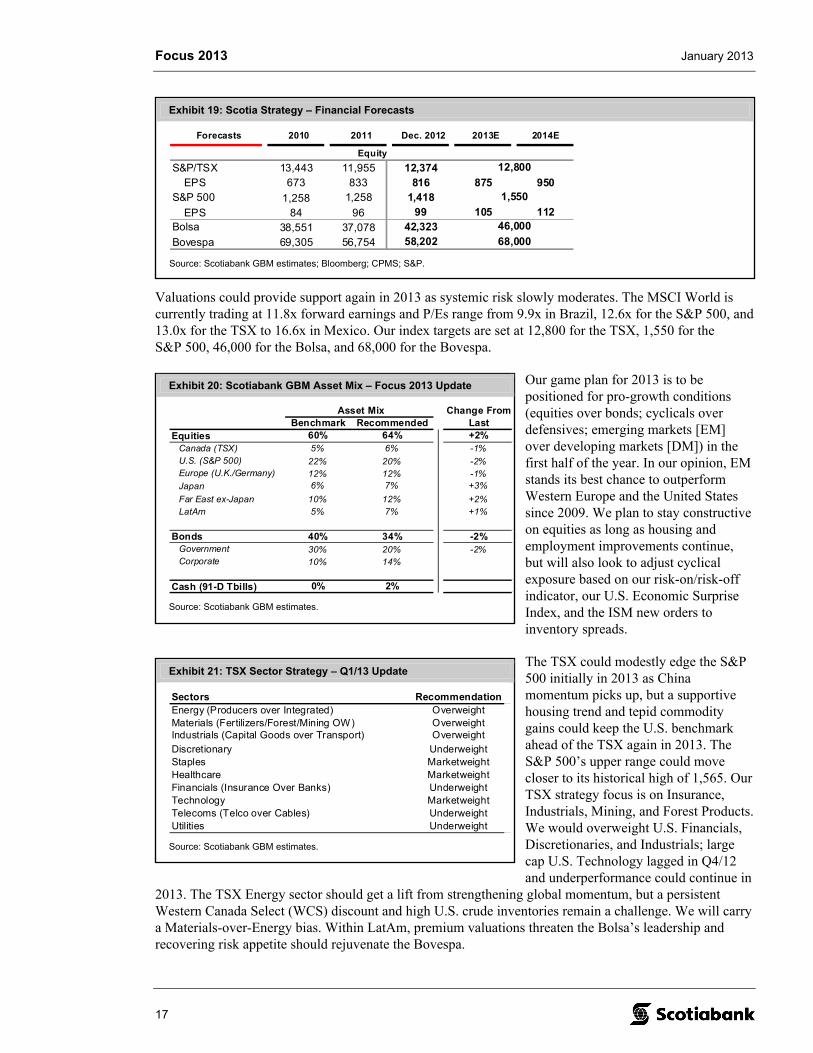
Valuations could provide support again in 2013 as systemic risk slowly moderates. The MSCI World is currently trading at 11.8x forward earnings and P/Es range from 9.9x in Brazil, 12.6x for the S&P 500, and 13.0x for the TSX to 16.6x in Mexico. Our index targets are set at 12,800 for the TSX, 1,550 for the S&P 500, 46,000 for the Bolsa, and 68,000 for the Bovespa.
Our game plan for 2013 is to be positioned for pro-growth conditions (equities over bonds; cyclicals over defensives; emerging markets [EM] over developing markets [DM]) in the first half of the year. In our opinion, EM stands its best chance to outperform Western Europe and the United States since 2009. We plan to stay constructive on equities as long as housing and employment improvements continue, but will also look to adjust cyclical exposure based on our risk-on/risk-off indicator, our U.S. Economic Surprise Index, and the ISM new orders to inventory spreads.
The TSX could modestly edge the S&P 500 initially in 2013 as China momentum picks up, but a supportive housing trend and tepid commodity gains could keep the U.S. benchmark ahead of the TSX again in 2013. The S&P 500’s upper range could move closer to its historical high of 1,565. Our TSX strategy focus is on Insurance, Industrials, Mining, and Forest Products. We would overweight U.S. Financials, Discretionaries, and Industrials; large cap U.S. Technology lagged in Q4/12 and underperformance could continue in
2013. The TSX Energy sector should get a lift from strengthening global momentum, but a persistent Western Canada Select (WCS) discount and high U.S. crude inventories remain a challenge. We will carry a Materials-over-Energy bias. Within LatAm, premium valuations threaten the Bolsa’s leadership and recovering risk appetite should rejuvenate the Bovespa.
Focus 2013 January 2013
18
1 0 T H E M E S F O R 2 0 1 3
1. Jobless claims as guide. This has been a constant theme of ours since 2009, and we are sticking to it. In our opinion, monitoring the trend in weekly jobless claims helps filter the background noise. As long as U.S. employment conditions improve, we will maintain a constructive S&P 500 bias and stand ready to buy the dips.
2. U.S. housing will dictate sentiment. Attractive affordability and low inventories point to a sustained recovery in U.S. housing activity in 2013, a development that could solidify Main Street confidence. A pickup in housing data (starts, sales, prices) could represent the biggest threat to the bond bull market. Homebuilders and lumber companies should perform well.
3. Canada’s housing sector is going the wrong way. In contrast to the situation in the United States, Canada’s domestic economy will be challenged by weaker housing activity in 2013. Although a U.S.-style downturn remains a low-probability scenario, in our opinion, the threat to wealth effect and consumer spending will weigh on growth. Canada’s 2013 GDP growth should lag that of the United States for the second consecutive year.
4. China growth picking up… modestly. Following a disappointing 2012, China GDP should rebound toward 8.0% in 2013. Commodity-sensitive markets should be supported by stronger momentum in China, but modest easing and muted European demand are likely to keep Chinese GDP below the 9% threshold and restrain commodity price gains. EM also stands its best chance to outperform Western Europe and the United States since 2009.
5. Europe bottoms, but stays in the slow lane. Fiscal consolidation, a heavy debt load, and political disagreements will restrict European growth at least through the middle of the decade. Southern Europe will remain in recession in 2013, with France struggling to grow. Germany and U.K. GDP growth could hover near 1% next year.
6. Correlations decline, slowly back to basics. Sector correlations have steadily declined in recent months and 2012 proved to be much more of a “stock picker’s market.” Company fundamentals and top-down signals should combine again to dictate market trends in 2013. Sporadic risk-on/risk-off leadership should prevail with shorter duration and lower intensity than in 2008-2011.
7. Valuations to increase from below-average levels. P/E multiples increased in 2012 and we expect the trend to continue in 2013 as systemic risk moderates. Since 1960, S&P 500 P/E expansion/contraction cycles have occurred alongside improving housing and employment conditions. The MSCI AC World forward P/E stands at 11.8x, 25% below its long-term average (TSX at -9% discount versus -17% for S&P 500). A 1x point P/E increase would provide roughly 8%-12% upside based on current forward EPS levels.
8. Challenges to TSX Energy and Financials leadership. U.S. Energy (+2.0% in 2012) and U.S. Financials (+26%) outperformed their TSX counterparts by 426 bp and 1015 bp, respectively, in 2012, and 2013 is shaping up to be challenging. Increasing U.S. energy production combined with low export capacity in Canada is weighing on TSX Energy. Commodity sentiment could improve in 1H/13, as Chinese data recovers, and the TSX Energy sector should benefit. Still, the WCS discount to West Texas Intermediate will need to recover in order to support a period of sustained outperformance. A slowdown in Canadian housing is also likely to increase background noise for Canadian Financials and could limit valuation expansion in the sector.

Focus 2013 January 2013
19
9. Play the yield theme, but mind the premium. Faith in the dividend theme is directly linked to the direction of long-term bond yields, and since U.S. monetary policy is expected to remain accommodative until 2015, a low rate environment should support dividend stocks. Still, investors should mind the valuation gap as it also influences leadership. High-dividend TSX stocks are currently trading at a 12% premium (price to book) over the non-dividend payers group (was 5% in December 2011). The yield theme has underperformed in 2H/12 after the premium hit 23%.
10. Diet and Bundestag. Political focus will shift to Japan and Germany in 2013. Japanese leadership change could trigger a more stimulative focus from the Bank of Japan through a lower yen (higher U.S. dollar) and a higher inflation target. In Germany, voters will get a chance to voice their concerns on how the country has navigated the Eurozone crisis since 2010.

Focus 2013 January 2013
20
T H I S P A G E L E F T I N T E N T I O N A L L Y B L A N K .
Focus 2013 January 2013
Hugo Ste-Marie, CFA (514) 287-4992 (Scotia Capital Inc. – Canada) [email protected]
21
Exhibit 1: Global Small Cap 2012 Performance* (As at December 27, 2012)
27.7%26.1%
24.4%
17.9%14.8% 13.3%
9.9%6.6%
1.9%
-6.4%
31.1%
26.0%
-4.3%
32.2%
-20%
-10%
0%
10%
20%
30%
40%
Indi
a
U.K
.
Ge
rma
ny
La
tAm
Eur
op
e
Bra
zil
Ch
ina
Wo
rld
S&
P 6
00
Asi
a-P
ac
ific
Au
stra
lia
Jap
an
TS
X S
ma
llCa
p(U
S$)
TS
X S
ma
llCa
p(C
$)
Performance in USD
* Performance is price only in U.S. dollars (unless otherwise stated).
Source: Scotiabank GBM; Bloomberg.
Small Cap Strategy
Small Caps Delivering Gains in 2013
2 0 1 2 I N R E V I E W : S M A L L C A P S U P D E S P I T E M A C R O N O I S E
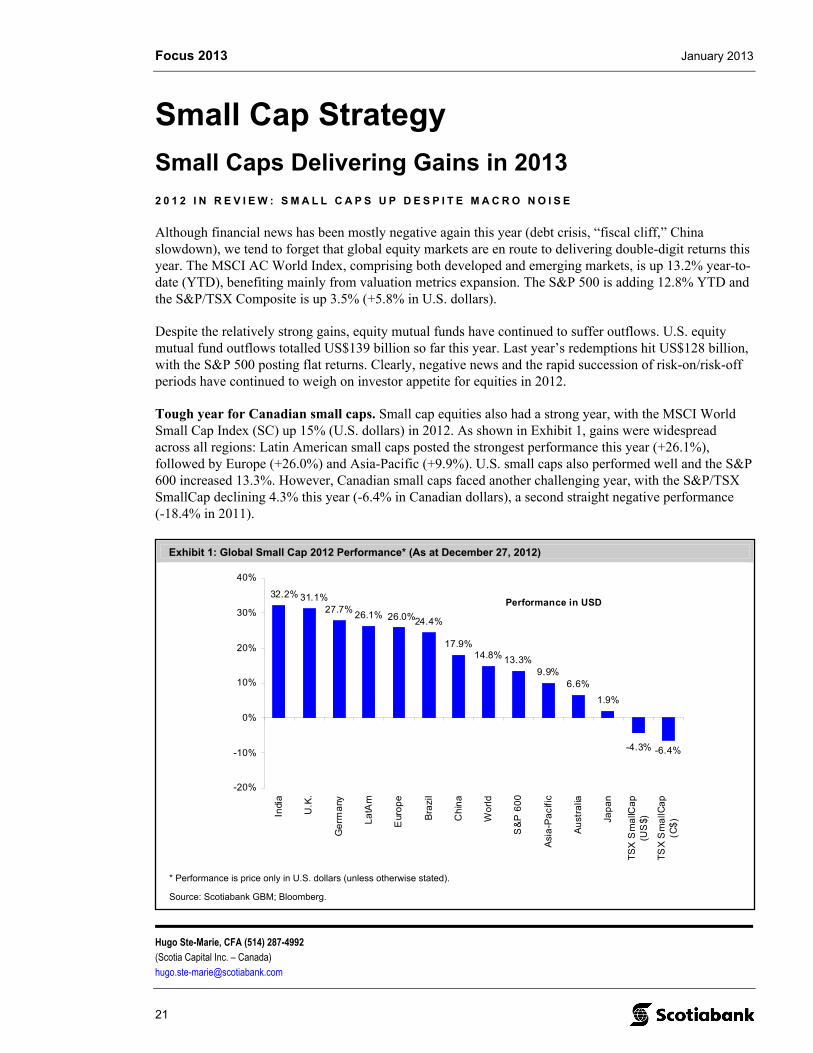
Although financial news has been mostly negative again this year (debt crisis, “fiscal cliff,” China slowdown), we tend to forget that global equity markets are en route to delivering double-digit returns this year. The MSCI AC World Index, comprising both developed and emerging markets, is up 13.2% year-to-date (YTD), benefiting mainly from valuation metrics expansion. The S&P 500 is adding 12.8% YTD and the S&P/TSX Composite is up 3.5% (+5.8% in U.S. dollars).
Despite the relatively strong gains, equity mutual funds have continued to suffer outflows. U.S. equity mutual fund outflows totalled US$139 billion so far this year. Last year’s redemptions hit US$128 billion, with the S&P 500 posting flat returns. Clearly, negative news and the rapid succession of risk-on/risk-off periods have continued to weigh on investor appetite for equities in 2012.
Tough year for Canadian small caps. Small cap equities also had a strong year, with the MSCI World Small Cap Index (SC) up 15% (U.S. dollars) in 2012. As shown in Exhibit 1, gains were widespread across all regions: Latin American small caps posted the strongest performance this year (+26.1%), followed by Europe (+26.0%) and Asia-Pacific (+9.9%). U.S. small caps also performed well and the S&P 600 increased 13.3%. However, Canadian small caps faced another challenging year, with the S&P/TSX SmallCap declining 4.3% this year (-6.4% in Canadian dollars), a second straight negative performance (-18.4% in 2011).
Focus 2013 January 2013
22
Exhibit 2: Global Small Cap YTD Relative Performance (As at December 27, 2012)
2,877
2,1482,014
987 944
175 56
-26 -37-333 -368
-951 -986-1500
-1000
-500
0
500
1000
1500
2000
2500
3000
3500
Bra
zil
La
tAm
U.K
.
Eu
rop
e
Ind
ia
Wo
rld
S&
P 6
00
Ch
ina
Ge
rma
ny
Asi
a-P
aci
fic
Jap
an
Aus
tra
lia
TS
X S
ma
llCa
p
YTD Relative Performance (bp)
Small caps outperformed
Small caps underperformed
Source: Scotiabank GBM; Bloomberg.
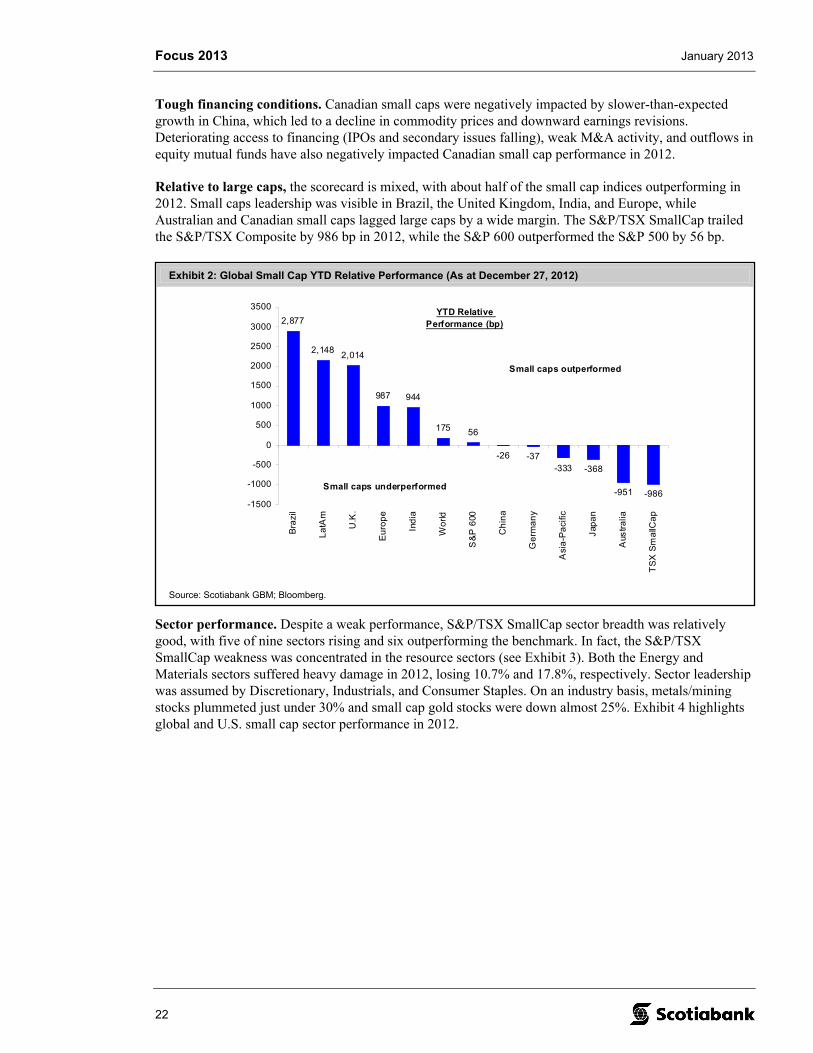
Tough financing conditions. Canadian small caps were negatively impacted by slower-than-expected growth in China, which led to a decline in commodity prices and downward earnings revisions. Deteriorating access to financing (IPOs and secondary issues falling), weak M&A activity, and outflows in equity mutual funds have also negatively impacted Canadian small cap performance in 2012.
Relative to large caps, the scorecard is mixed, with about half of the small cap indices outperforming in 2012. Small caps leadership was visible in Brazil, the United Kingdom, India, and Europe, while Australian and Canadian small caps lagged large caps by a wide margin. The S&P/TSX SmallCap trailed the S&P/TSX Composite by 986 bp in 2012, while the S&P 600 outperformed the S&P 500 by 56 bp.
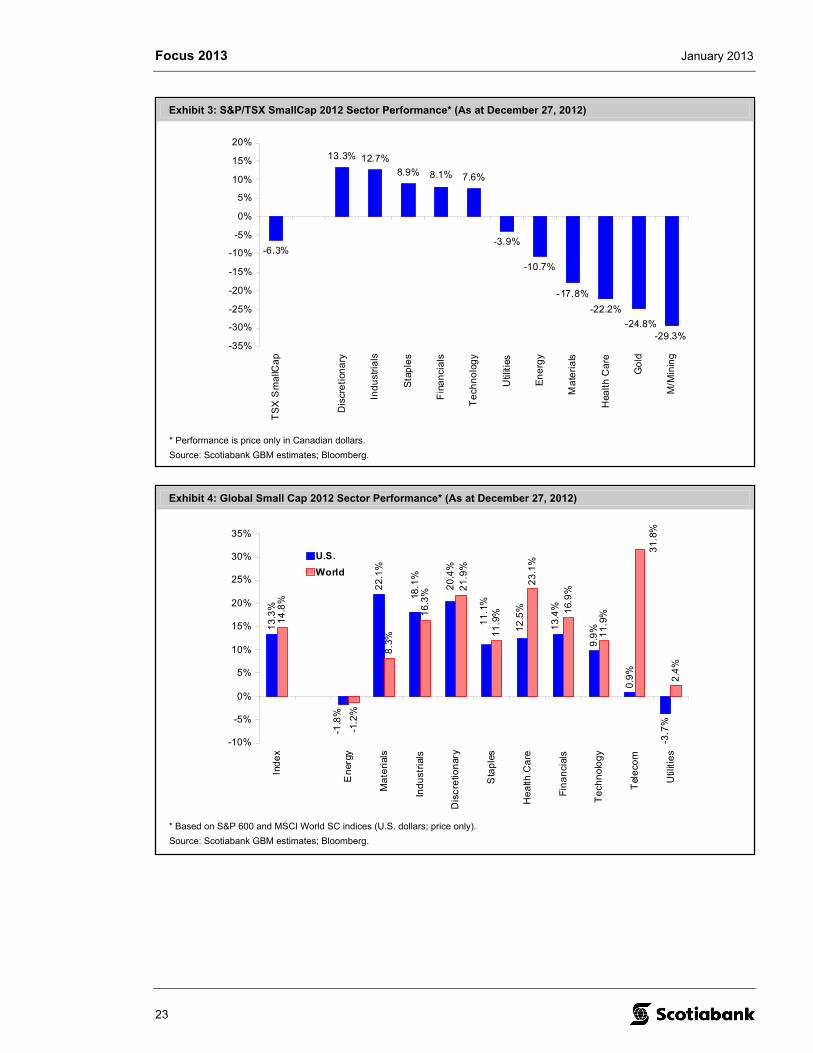
Sector performance. Despite a weak performance, S&P/TSX SmallCap sector breadth was relatively good, with five of nine sectors rising and six outperforming the benchmark. In fact, the S&P/TSX SmallCap weakness was concentrated in the resource sectors (see Exhibit 3). Both the Energy and Materials sectors suffered heavy damage in 2012, losing 10.7% and 17.8%, respectively. Sector leadership was assumed by Discretionary, Industrials, and Consumer Staples. On an industry basis, metals/mining stocks plummeted just under 30% and small cap gold stocks were down almost 25%. Exhibit 4 highlights global and U.S. small cap sector performance in 2012.
Focus 2013 January 2013
23
Exhibit 3: S&P/TSX SmallCap 2012 Sector Performance* (As at December 27, 2012)
12.7%
8.1% 7.6%
-10.7%
-17.8%
-22.2%
-29.3%-24.8%
-6.3%-3.9%
13.3%
8.9%
-35%
-30%
-25%
-20%
-15%
-10%
-5%
0%
5%
10%
15%
20%
TS
X S
ma
llCa
p
Dis
cre
tion
ary
Ind
ust
ria
ls
Sta
ple
s
Fin
an
cia
ls
Te
chn
olo
gy
Util
ities
En
erg
y
Ma
teri
als
Hea
lth
Ca
re
G
old
M
/Min
ing
* Performance is price only in Canadian dollars.
Source: Scotiabank GBM estimates; Bloomberg.
Exhibit 4: Global Small Cap 2012 Sector Performance* (As at December 27, 2012)
13
.3%
22
.1%
9.9
%
0.9
%
-3.7
%
14
.8%
-1.2
%
8.3
%
16
.3%
11
.9%
23
.1%
16.
9%
11
.9%
2.4
%
18.1
%
-1.8
%
13
.4%
12
.5%
11
.1%
20
.4%
31
.8%
21
.9%
-10%
-5%
0%
5%
10%
15%
20%
25%
30%
35%
Ind
ex
En
ergy
Ma
teri
als
Ind
ust
rial
s
Dis
cre
tion
ary
Sta
ple
s
He
alth
Ca
re
Fin
an
cial
s
Te
chn
olo
gy
Tel
eco
m
Util
itie
s
U.S.
World
* Based on S&P 600 and MSCI World SC indices (U.S. dollars; price only).
Source: Scotiabank GBM estimates; Bloomberg.
Focus 2013 January 2013
24
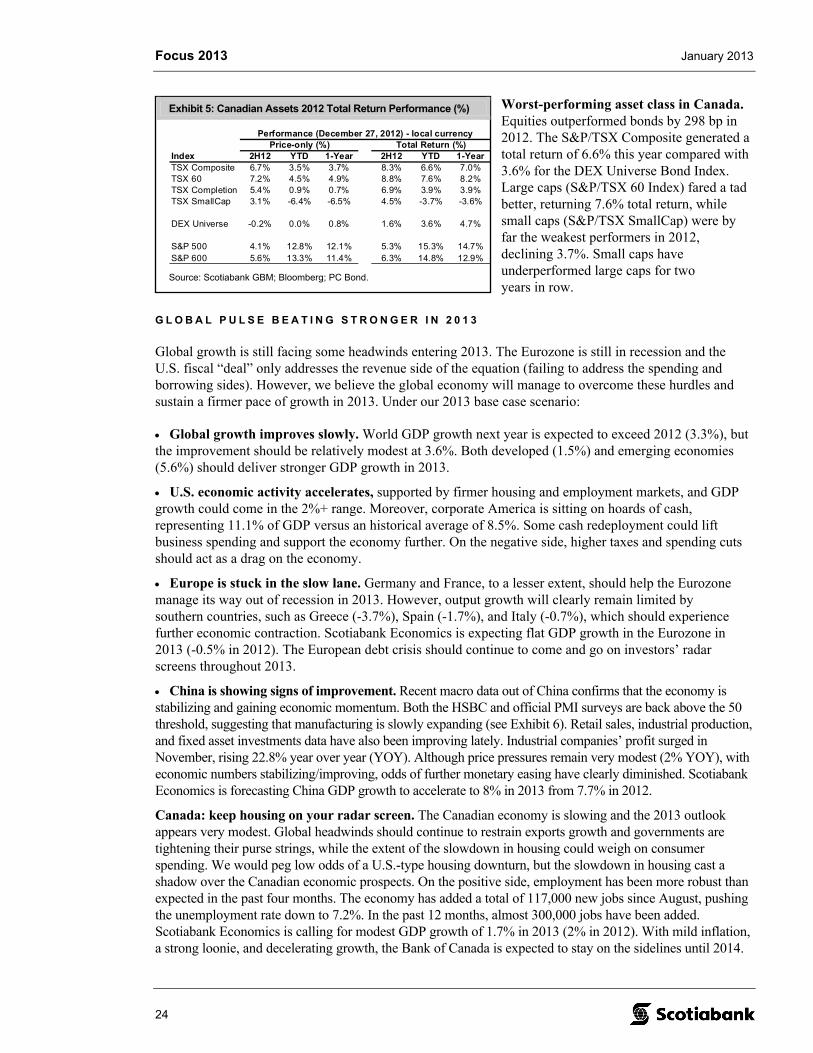
Exhibit 5: Canadian Assets 2012 Total Return Performance (%)
Index 2H12 YTD 1-Year 2H12 YTD 1-YearTSX Composite 6.7% 3.5% 3.7% 8.3% 6.6% 7.0%TSX 60 7.2% 4.5% 4.9% 8.8% 7.6% 8.2%TSX Completion 5.4% 0.9% 0.7% 6.9% 3.9% 3.9%TSX SmallCap 3.1% -6.4% -6.5% 4.5% -3.7% -3.6%
DEX Universe -0.2% 0.0% 0.8% 1.6% 3.6% 4.7%
S&P 500 4.1% 12.8% 12.1% 5.3% 15.3% 14.7%S&P 600 5.6% 13.3% 11.4% 6.3% 14.8% 12.9%
Price-only (%) Total Return (%)Performance (December 27, 2012) - local currency
Source: Scotiabank GBM; Bloomberg; PC Bond.
Worst-performing asset class in Canada. Equities outperformed bonds by 298 bp in 2012. The S&P/TSX Composite generated a total return of 6.6% this year compared with 3.6% for the DEX Universe Bond Index. Large caps (S&P/TSX 60 Index) fared a tad better, returning 7.6% total return, while small caps (S&P/TSX SmallCap) were by far the weakest performers in 2012, declining 3.7%. Small caps have underperformed large caps for two years in row.
G L O B A L P U L S E B E A T I N G S T R O N G E R I N 2 0 1 3
Global growth is still facing some headwinds entering 2013. The Eurozone is still in recession and the U.S. fiscal “deal” only addresses the revenue side of the equation (failing to address the spending and borrowing sides). However, we believe the global economy will manage to overcome these hurdles and sustain a firmer pace of growth in 2013. Under our 2013 base case scenario:
Global growth improves slowly. World GDP growth next year is expected to exceed 2012 (3.3%), but the improvement should be relatively modest at 3.6%. Both developed (1.5%) and emerging economies (5.6%) should deliver stronger GDP growth in 2013.
U.S. economic activity accelerates, supported by firmer housing and employment markets, and GDP growth could come in the 2%+ range. Moreover, corporate America is sitting on hoards of cash, representing 11.1% of GDP versus an historical average of 8.5%. Some cash redeployment could lift business spending and support the economy further. On the negative side, higher taxes and spending cuts should act as a drag on the economy.
Europe is stuck in the slow lane. Germany and France, to a lesser extent, should help the Eurozone manage its way out of recession in 2013. However, output growth will clearly remain limited by southern countries, such as Greece (-3.7%), Spain (-1.7%), and Italy (-0.7%), which should experience further economic contraction. Scotiabank Economics is expecting flat GDP growth in the Eurozone in 2013 (-0.5% in 2012). The European debt crisis should continue to come and go on investors’ radar screens throughout 2013.
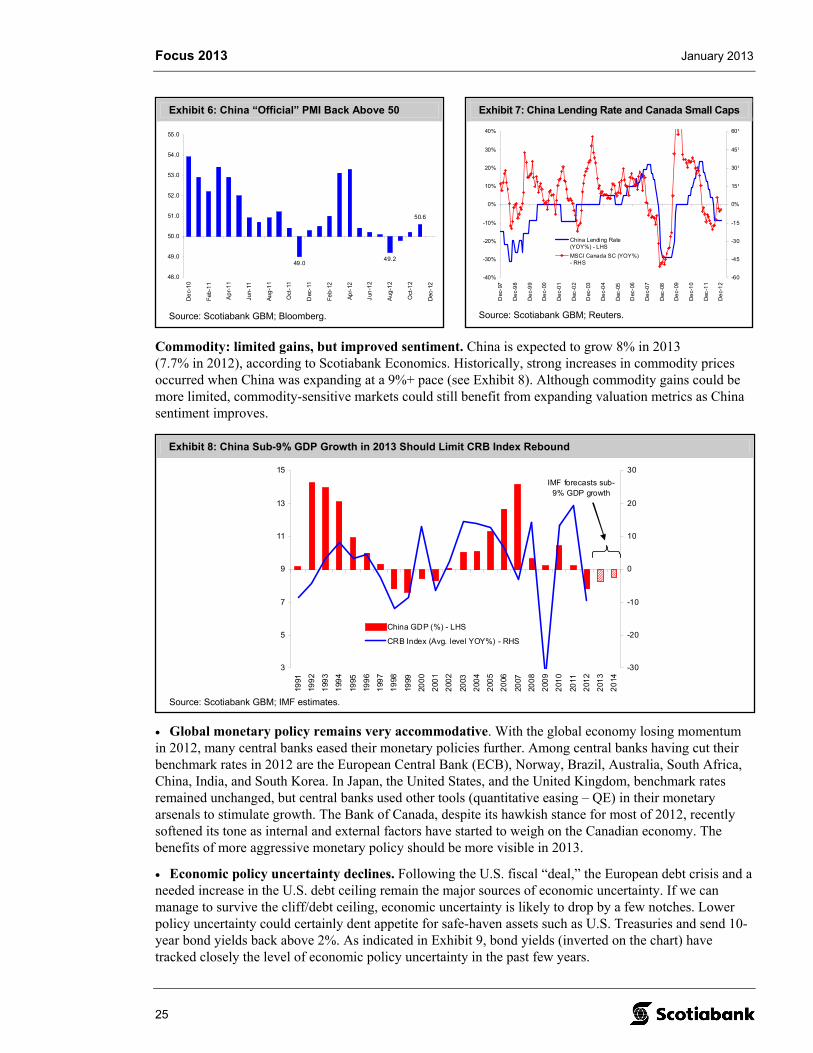
China is showing signs of improvement. Recent macro data out of China confirms that the economy is stabilizing and gaining economic momentum. Both the HSBC and official PMI surveys are back above the 50 threshold, suggesting that manufacturing is slowly expanding (see Exhibit 6). Retail sales, industrial production, and fixed asset investments data have also been improving lately. Industrial companies’ profit surged in November, rising 22.8% year over year (YOY). Although price pressures remain very modest (2% YOY), with economic numbers stabilizing/improving, odds of further monetary easing have clearly diminished. Scotiabank Economics is forecasting China GDP growth to accelerate to 8% in 2013 from 7.7% in 2012.
Canada: keep housing on your radar screen. The Canadian economy is slowing and the 2013 outlook appears very modest. Global headwinds should continue to restrain exports growth and governments are tightening their purse strings, while the extent of the slowdown in housing could weigh on consumer spending. We would peg low odds of a U.S.-type housing downturn, but the slowdown in housing cast a shadow over the Canadian economic prospects. On the positive side, employment has been more robust than expected in the past four months. The economy has added a total of 117,000 new jobs since August, pushing the unemployment rate down to 7.2%. In the past 12 months, almost 300,000 jobs have been added. Scotiabank Economics is calling for modest GDP growth of 1.7% in 2013 (2% in 2012). With mild inflation, a strong loonie, and decelerating growth, the Bank of Canada is expected to stay on the sidelines until 2014.
Focus 2013 January 2013
25
Exhibit 8: China Sub-9% GDP Growth in 2013 Should Limit CRB Index Rebound
3
5
7
9
11
13
15
1991
199
2
199
3
199
4
1995
199
6
199
7
19
98
1999
200
0
200
1
200
2
2003
200
4
200
5
20
06
2007
200
8
200
9
201
0
2011
201
2
201
3
20
14
-30
-20
-10
0
10
20
30
China GDP (%) - LHS
CRB Index (Avg. level YOY%) - RHS
IMF forecasts sub-9% GDP growth
Source: Scotiabank GBM; IMF estimates.
Exhibit 7: China Lending Rate and Canada Small Caps
-40%
-30%
-20%
-10%
0%
10%
20%
30%
40%
Dec
-97
De
c-9
8
De
c-9
9
De
c-00
De
c-0
1
Dec
-02
Dec
-03
De
c-0
4
Dec
-05
Dec
-06
De
c-0
7
Dec
-08
De
c-09
De
c-1
0
Dec
-11
De
c-1
2
-60%
-45%
-30%
-15%
0%
15%
30%
45%
60%
China Lending Rate(YOY%) - LHS
MSCI Canada SC (YOY%)- RHS
Source: Scotiabank GBM; Reuters.
Exhibit 6: China “Official” PMI Back Above 50
50.6
49.249.0
48.0
49.0
50.0
51.0
52.0
53.0
54.0
55.0
De
c-1
0
Feb
-11
Ap
r-1
1
Jun-
11
Au
g-1
1
Oct
-11
Dec
-11
Fe
b-12
Ap
r-12
Jun
-12
Aug
-12
Oct
-12
Dec
-12
Source: Scotiabank GBM; Bloomberg.
Commodity: limited gains, but improved sentiment. China is expected to grow 8% in 2013 (7.7% in 2012), according to Scotiabank Economics. Historically, strong increases in commodity prices occurred when China was expanding at a 9%+ pace (see Exhibit 8). Although commodity gains could be more limited, commodity-sensitive markets could still benefit from expanding valuation metrics as China sentiment improves.
• Global monetary policy remains very accommodative. With the global economy losing momentum in 2012, many central banks eased their monetary policies further. Among central banks having cut their benchmark rates in 2012 are the European Central Bank (ECB), Norway, Brazil, Australia, South Africa, China, India, and South Korea. In Japan, the United States, and the United Kingdom, benchmark rates remained unchanged, but central banks used other tools (quantitative easing – QE) in their monetary arsenals to stimulate growth. The Bank of Canada, despite its hawkish stance for most of 2012, recently softened its tone as internal and external factors have started to weigh on the Canadian economy. The benefits of more aggressive monetary policy should be more visible in 2013.
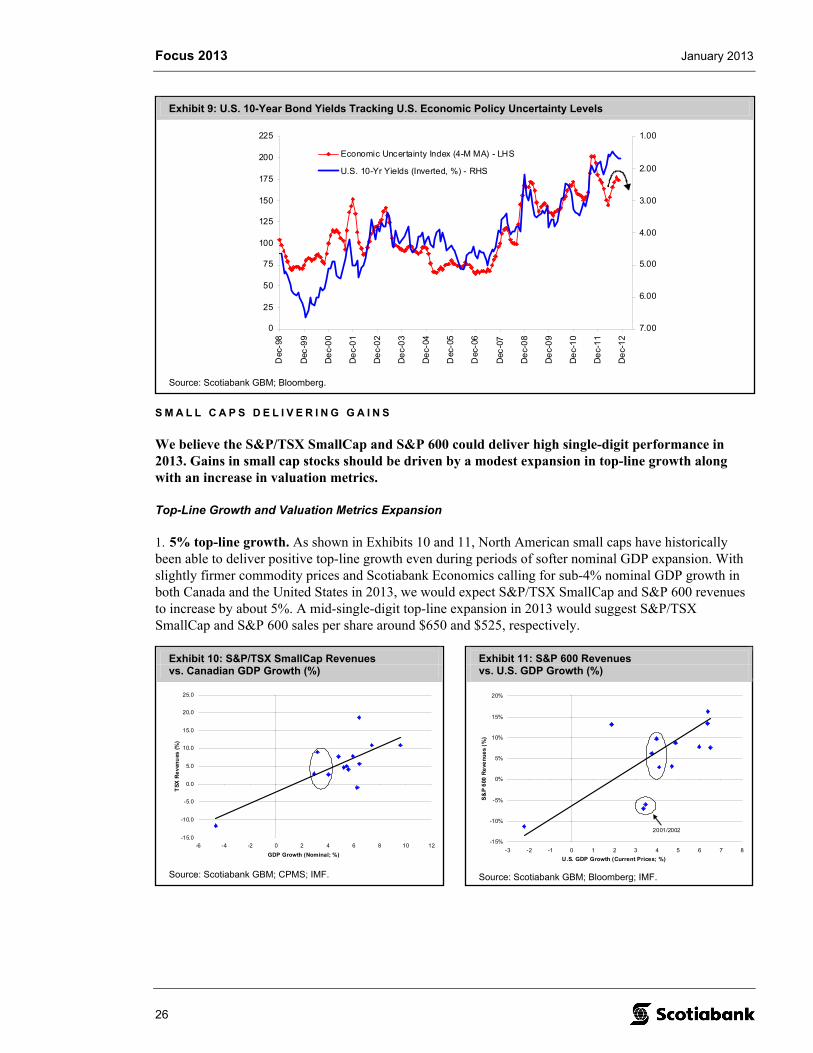
• Economic policy uncertainty declines. Following the U.S. fiscal “deal,” the European debt crisis and a needed increase in the U.S. debt ceiling remain the major sources of economic uncertainty. If we can manage to survive the cliff/debt ceiling, economic uncertainty is likely to drop by a few notches. Lower policy uncertainty could certainly dent appetite for safe-haven assets such as U.S. Treasuries and send 10-year bond yields back above 2%. As indicated in Exhibit 9, bond yields (inverted on the chart) have tracked closely the level of economic policy uncertainty in the past few years.
Focus 2013 January 2013
26
Exhibit 9: U.S. 10-Year Bond Yields Tracking U.S. Economic Policy Uncertainty Levels
0
25
50
75
100
125
150
175
200
225
Dec
-98
Dec
-99
De
c-0
0
De
c-0
1
De
c-0
2
De
c-0
3
De
c-04
Dec
-05
Dec
-06
Dec
-07
De
c-0
8
De
c-0
9
De
c-1
0
De
c-1
1
De
c-1
2
1.00
2.00
3.00
4.00
5.00
6.00
7.00
Economic Uncertainty Index (4-M MA) - LHS
U.S. 10-Yr Yields (Inverted, %) - RHS
Source: Scotiabank GBM; Bloomberg.
Exhibit 11: S&P 600 Revenues vs. U.S. GDP Growth (%)
-15%
-10%
-5%
0%
5%
10%
15%
20%
-3 -2 -1 0 1 2 3 4 5 6 7 8
U.S. GDP Growth (Current Prices; %)
S&
P 6
00 R
eve
nu
es
(%)
2001/2002
Source: Scotiabank GBM; Bloomberg; IMF.
Exhibit 10: S&P/TSX SmallCap Revenues vs. Canadian GDP Growth (%)
-15.0
-10.0
-5.0
0.0
5.0
10.0
15.0
20.0
25.0
-6 -4 -2 0 2 4 6 8 10 12
GDP Growth (Nominal; %)
TS
X R
ev
enu
es (
%)
Source: Scotiabank GBM; CPMS; IMF.
S M A L L C A P S D E L I V E R I N G G A I N S
We believe the S&P/TSX SmallCap and S&P 600 could deliver high single-digit performance in 2013. Gains in small cap stocks should be driven by a modest expansion in top-line growth along with an increase in valuation metrics.
Top-Line Growth and Valuation Metrics Expansion
1. 5% top-line growth. As shown in Exhibits 10 and 11, North American small caps have historically been able to deliver positive top-line growth even during periods of softer nominal GDP expansion. With slightly firmer commodity prices and Scotiabank Economics calling for sub-4% nominal GDP growth in both Canada and the United States in 2013, we would expect S&P/TSX SmallCap and S&P 600 revenues to increase by about 5%. A mid-single-digit top-line expansion in 2013 would suggest S&P/TSX SmallCap and S&P 600 sales per share around $650 and $525, respectively.
Focus 2013 January 2013
27
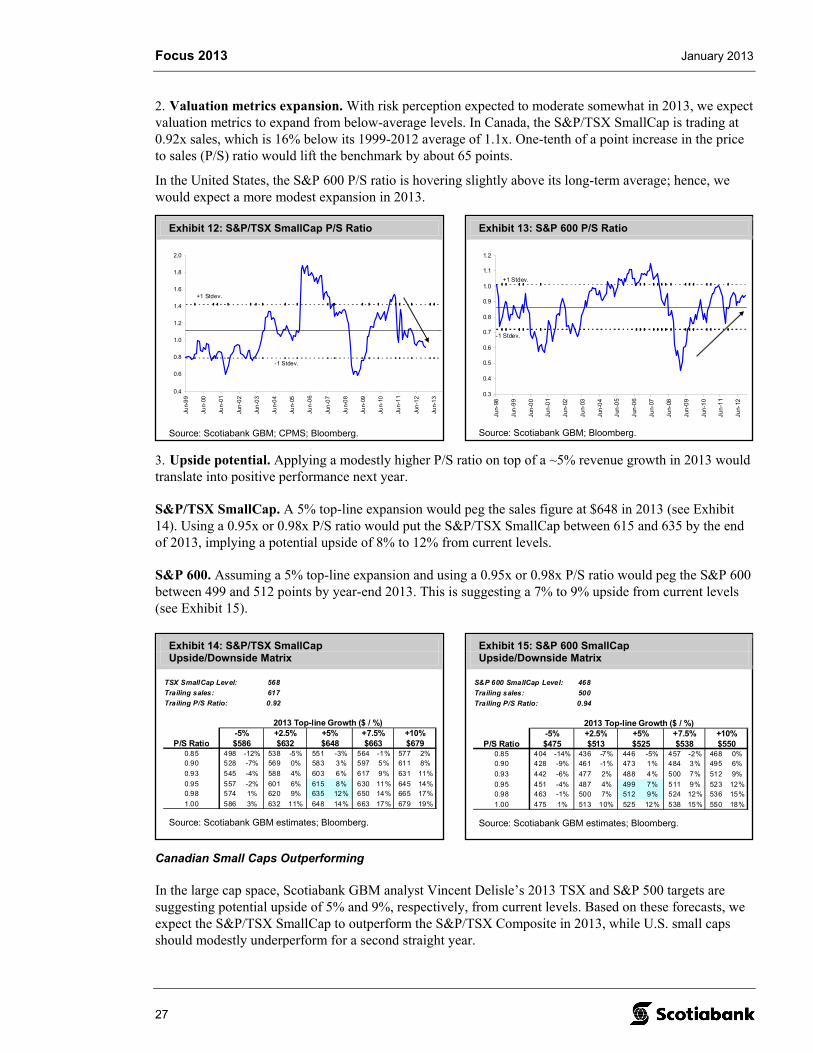
Exhibit 14: S&P/TSX SmallCap Upside/Downside Matrix
TSX SmallCap Level: 568
Trailing sales: 617
Trailing P/S Ratio: 0.92
P/S Ratio0.85 498 -12% 538 -5% 551 -3% 564 -1% 577 2%0.90 528 -7% 569 0% 583 3% 597 5% 611 8%
0.93 545 -4% 588 4% 603 6% 617 9% 631 11%
0.95 557 -2% 601 6% 615 8% 630 11% 645 14%0.98 574 1% 620 9% 635 12% 650 14% 665 17%
1.00 586 3% 632 11% 648 14% 663 17% 679 19%
$586+7.5%$663
+10%$679
2013 Top-line Growth ($ / %)+5%$648
+2.5%$632
-5%
Source: Scotiabank GBM estimates; Bloomberg.
Exhibit 15: S&P 600 SmallCap Upside/Downside Matrix
S&P 600 SmallCap Level: 468
Trailing sales: 500
Trailing P/S Ratio: 0.94
P/S Ratio0.85 404 -14% 436 -7% 446 -5% 457 -2% 468 0%0.90 428 -9% 461 -1% 473 1% 484 3% 495 6%
0.93 442 -6% 477 2% 488 4% 500 7% 512 9%
0.95 451 -4% 487 4% 499 7% 511 9% 523 12%0.98 463 -1% 500 7% 512 9% 524 12% 536 15%
1.00 475 1% 513 10% 525 12% 538 15% 550 18%
+5% +7.5% +10%$550$525 $538
+2.5%$475 $513
2013 Top-line Growth ($ / %)-5%
Source: Scotiabank GBM estimates; Bloomberg.
Exhibit 13: S&P 600 P/S Ratio
0.3
0.4
0.5
0.6
0.7
0.8
0.9
1.0
1.1
1.2
Jun-
98
Jun
-99
Jun
-00
Jun
-01
Jun-
02
Jun-
03
Jun
-04
Jun
-05
Jun
-06
Jun-
07
Jun-
08
Jun
-09
Jun
-10
Jun
-11
Jun-
12
+1 Stdev.
-1 Stdev.
Source: Scotiabank GBM; Bloomberg.
Exhibit 12: S&P/TSX SmallCap P/S Ratio
0.4
0.6
0.8
1.0
1.2
1.4
1.6
1.8
2.0
Jun-
99
Jun-
00
Jun
-01
Jun
-02
Jun
-03
Jun-
04
Jun-
05
Jun
-06
Jun
-07
Jun-
08
Jun-
09
Jun-
10
Jun
-11
Jun
-12
Jun-
13
+1 Stdev.
-1 Stdev.
Source: Scotiabank GBM; CPMS; Bloomberg.
2. Valuation metrics expansion. With risk perception expected to moderate somewhat in 2013, we expect valuation metrics to expand from below-average levels. In Canada, the S&P/TSX SmallCap is trading at 0.92x sales, which is 16% below its 1999-2012 average of 1.1x. One-tenth of a point increase in the price to sales (P/S) ratio would lift the benchmark by about 65 points.
In the United States, the S&P 600 P/S ratio is hovering slightly above its long-term average; hence, we would expect a more modest expansion in 2013.
3. Upside potential. Applying a modestly higher P/S ratio on top of a ~5% revenue growth in 2013 would translate into positive performance next year.
S&P/TSX SmallCap. A 5% top-line expansion would peg the sales figure at $648 in 2013 (see Exhibit 14). Using a 0.95x or 0.98x P/S ratio would put the S&P/TSX SmallCap between 615 and 635 by the end of 2013, implying a potential upside of 8% to 12% from current levels.
S&P 600. Assuming a 5% top-line expansion and using a 0.95x or 0.98x P/S ratio would peg the S&P 600 between 499 and 512 points by year-end 2013. This is suggesting a 7% to 9% upside from current levels (see Exhibit 15).
Canadian Small Caps Outperforming
In the large cap space, Scotiabank GBM analyst Vincent Delisle’s 2013 TSX and S&P 500 targets are suggesting potential upside of 5% and 9%, respectively, from current levels. Based on these forecasts, we expect the S&P/TSX SmallCap to outperform the S&P/TSX Composite in 2013, while U.S. small caps should modestly underperform for a second straight year.
Focus 2013 January 2013
28
Exhibit 18: China CPI vs. S&P/TSX SmallCap/ S&P 600 Ratio
-6
-4
-2
0
2
4
6
8
10
Jun-
99
Jun-
00
Jun-
01
Jun-
02
Jun-
03
Jun-
04
Jun-
05
Jun
-06
Jun
-07
Jun-
08
Jun
-09
Jun
-10
Jun
-11
Jun
-12
1.00
1.10
1.20
1.30
1.40
1.50
1.60
1.70
1.80
1.90
2.00
TSX SmallCap (USD) / S&P 600 - RHS
China CPI (%) - LHS
Source: Scotiabank GBM; Bloomberg.
Exhibit 19: China CPI vs. Small Cap Materials/Staples*
0.30
0.50
0.70
0.90
1.10
1.30
1.50
1.70
Dec
-98
De
c-9
9
De
c-0
0
De
c-0
1
Dec
-02
Dec
-03
Dec
-04
De
c-0
5
De
c-0
6
De
c-0
7
De
c-0
8
Dec
-09
Dec
-10
De
c-1
1
De
c-1
2
-4.0
-2.0
0.0
2.0
4.0
6.0
8.0
10.0
Small cap Materials / Staples* - LHS
China CPI (%) - RHS
* Based on MSCI Canada Small Cap indices.
Source: Scotiabank GBM; Reuters.
Exhibit 16: U.S. Small Caps Relative Performance and Tax Rate on Capital Gains
10
15
20
25
30
35
40
45
197
5
19
77
197
9
198
1
198
3
198
5
198
7
198
9
1991
199
3
1995
199
7
1999
200
1
2003
200
5
2007
200
9
2011
201
30.60
0.80
1.00
1.20
1.40
1.60Maximum tax rate oncapital gains (%) - LHS
Russell 1000 / Russell2000 - RHS
Top tax rate on capital gains is set to increase to 24% in 2013
Source: Scotiabank GBM; U.S. Tax Policy Center; Bloomberg.
Exhibit 17: U.S. Small Cap Relative P/S Ratio
0.2
0.3
0.4
0.5
0.6
0.7
0.8
0.9
Jun-
98
Jun
-99
Jun
-00
Jun-
01
Jun-
02
Jun
-03
Jun
-04
Jun-
05
Jun
-06
Jun
-07
Jun-
08
Jun-
09
Jun
-10
Jun
-11
Jun-
12
-1 Stdev.
+1 Stdev.
Source: Scotiabank GBM; Bloomberg.
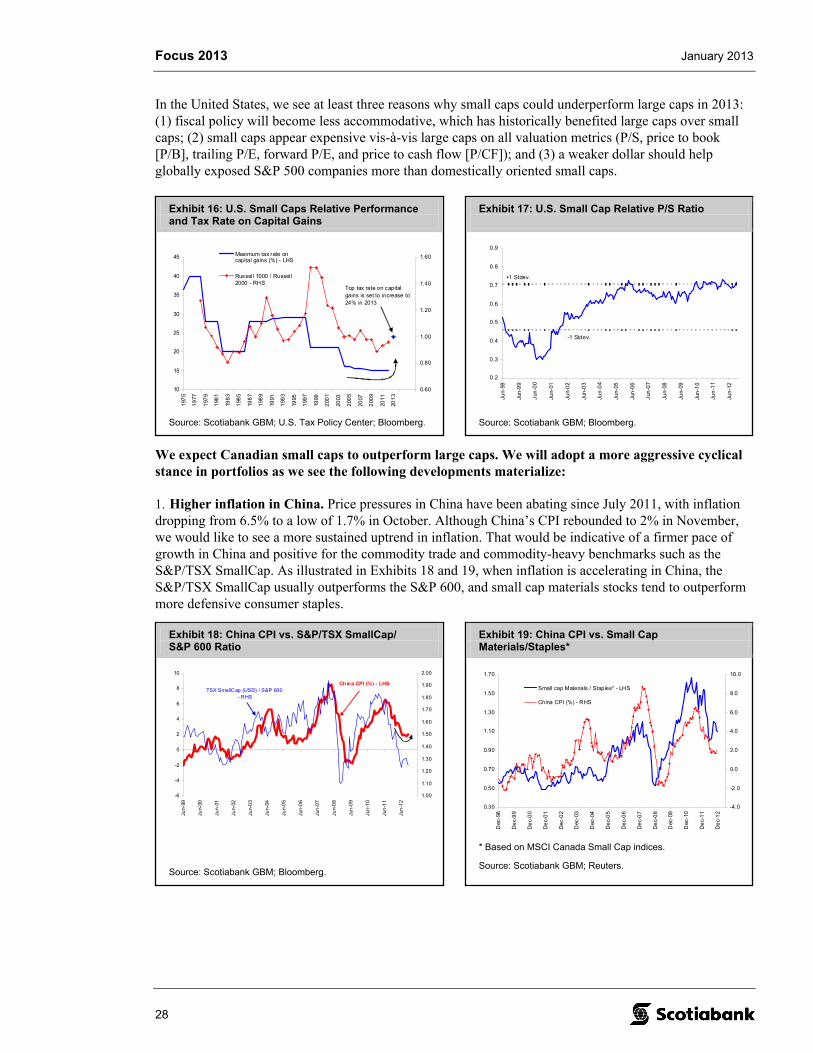
In the United States, we see at least three reasons why small caps could underperform large caps in 2013: (1) fiscal policy will become less accommodative, which has historically benefited large caps over small caps; (2) small caps appear expensive vis-à-vis large caps on all valuation metrics (P/S, price to book [P/B], trailing P/E, forward P/E, and price to cash flow [P/CF]); and (3) a weaker dollar should help globally exposed S&P 500 companies more than domestically oriented small caps.
We expect Canadian small caps to outperform large caps. We will adopt a more aggressive cyclical stance in portfolios as we see the following developments materialize:
1. Higher inflation in China. Price pressures in China have been abating since July 2011, with inflation dropping from 6.5% to a low of 1.7% in October. Although China’s CPI rebounded to 2% in November, we would like to see a more sustained uptrend in inflation. That would be indicative of a firmer pace of growth in China and positive for the commodity trade and commodity-heavy benchmarks such as the S&P/TSX SmallCap. As illustrated in Exhibits 18 and 19, when inflation is accelerating in China, the S&P/TSX SmallCap usually outperforms the S&P 600, and small cap materials stocks tend to outperform more defensive consumer staples.
Focus 2013 January 2013
29
Exhibit 20: MSCI World SC Relative Performance vs. U.S. Dollar Index
80
100
120
140
160
180
200
220
240
260
280
Dec
-06
Jun-
07
Dec
-07
Jun-
08
De
c-0
8
Jun
-09
De
c-0
9
Jun
-10
De
c-1
0
Jun
-11
De
c-1
1
Jun
-12
Dec
-12
Jun-
13
70
73
76
79
82
85
88
91
MSCI World SC - LHS
DXY (Inverted) - RHS
Source: Scotiabank GBM; Bloomberg.
Exhibit 21: S&P/TSX SmallCap Relative Performance vs. U.S. Dollar Index
0.030
0.035
0.040
0.045
0.050
0.055
0.060
0.065
De
c-0
6
Jun-
07
Dec
-07
Jun
-08
Dec
-08
Jun
-09
De
c-0
9
Jun-
10
De
c-1
0
Jun
-11
Dec
-11
Jun
-12
Dec
-12
Jun-
13
70
73
76
79
82
85
88
91
TSX SmallCap / TSX Composite - LHS
DXY (Inverted) - RHS
Source: Scotiabank GBM; Reuters.
Exhibit 23: MSCI Canada Small Cap Materials
100
300
500
700
900
1100
1300
1500
Jun-
07
De
c-0
7
Jun
-08
Dec
-08
Jun-
09
De
c-0
9
Jun
-10
De
c-1
0
Jun
-11
Dec
-11
Jun
-12
De
c-1
2
Source: Scotiabank GBM; Reuters.
Exhibit 22: MSCI Canada Small Cap Energy
300
400
500
600
700
800
900
1000
1100
1200
1300
Jun-
07
De
c-0
7
Jun
-08
Dec
-08
Jun-
09
De
c-0
9
Jun
-10
De
c-1
0
Jun
-11
Dec
-11
Jun
-12
De
c-1
2
Source: Scotiabank GBM; Reuters.
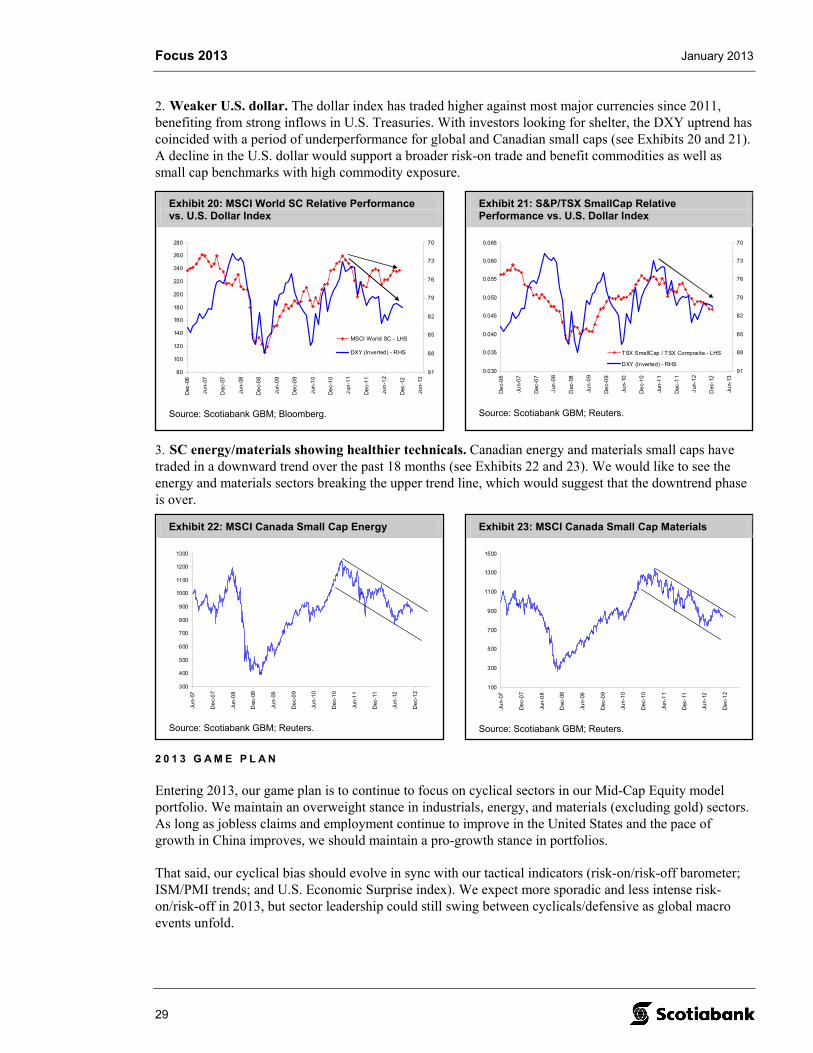
2. Weaker U.S. dollar. The dollar index has traded higher against most major currencies since 2011, benefiting from strong inflows in U.S. Treasuries. With investors looking for shelter, the DXY uptrend has coincided with a period of underperformance for global and Canadian small caps (see Exhibits 20 and 21). A decline in the U.S. dollar would support a broader risk-on trade and benefit commodities as well as small cap benchmarks with high commodity exposure.
3. SC energy/materials showing healthier technicals. Canadian energy and materials small caps have traded in a downward trend over the past 18 months (see Exhibits 22 and 23). We would like to see the energy and materials sectors breaking the upper trend line, which would suggest that the downtrend phase is over.
2 0 1 3 G A M E P L A N
Entering 2013, our game plan is to continue to focus on cyclical sectors in our Mid-Cap Equity model portfolio. We maintain an overweight stance in industrials, energy, and materials (excluding gold) sectors. As long as jobless claims and employment continue to improve in the United States and the pace of growth in China improves, we should maintain a pro-growth stance in portfolios.
That said, our cyclical bias should evolve in sync with our tactical indicators (risk-on/risk-off barometer; ISM/PMI trends; and U.S. Economic Surprise index). We expect more sporadic and less intense risk-on/risk-off in 2013, but sector leadership could still swing between cyclicals/defensive as global macro events unfold.
Focus 2013 January 2013
30
Exhibit 24: NAHB Housing Index vs. Homebuilders and Lumber Stocks (2005-2012)
0
10
20
30
40
50
60
70
80
Jan-
05
Jul-
05
Jan
-06
Jul-
06
Jan
-07
Jul-
07
Jan-
08
Jul-0
8
Jan-
09
Jul-0
9
Jan
-10
Jul-
10
Jan
-11
Jul
-11
Jan
-12
Jul-
12
Jan
-13
Jul-1
3
Jan-
14
0
20
40
60
80
100
120
140
160NAHB Housing Index - LHS
Interfor - RHS
Louisiana-Pacific - RHSWest Fraser Timber - RHS
Norbord - RHS
Stocks Normalized at 100 on Jan. 2005
Source: Scotiabank GBM; Bloomberg.
Exhibit 25: U.S. 10-Year Yields and Consumer Confidence
40.0
50.0
60.0
70.0
80.0
90.0
100.0
110.0
De
c-0
0
De
c-0
1
De
c-0
2
De
c-0
3
Dec
-04
Dec
-05
Dec
-06
De
c-0
7
De
c-0
8
De
c-0
9
De
c-1
0
De
c-1
1
Dec
-12
1.00
1.50
2.00
2.50
3.00
3.50
4.00
4.50
5.00
5.50
6.00
Consumer confidence - LHS
10-yr yields (3-M MA; %) - RHS
Source: Scotiabank GBM; Bloomberg.
Exhibit 26: U.S. 10-Year Yields and S&P/TSX SmallCap P/S
0.00
1.00
2.00
3.00
4.00
5.00
6.00
Dec
-06
Jun
-07
De
c-0
7
Jun-
08
Dec
-08
Jun
-09
De
c-0
9
Jun-
10
De
c-1
0
Jun
-11
De
c-1
1
Jun-
12
De
c-1
2
0.0
0.2
0.4
0.6
0.8
1.0
1.2
1.4
1.6
1.8
2.0
U.S. 10-Yr Yields (%) - LHS
TSX SmallCap P/S - RHS
Source: Scotiabank GBM; CPMS; Bloomberg.
2 0 1 3 M A C R O A N D E Q U I T Y T H E M E S
Macro Themes
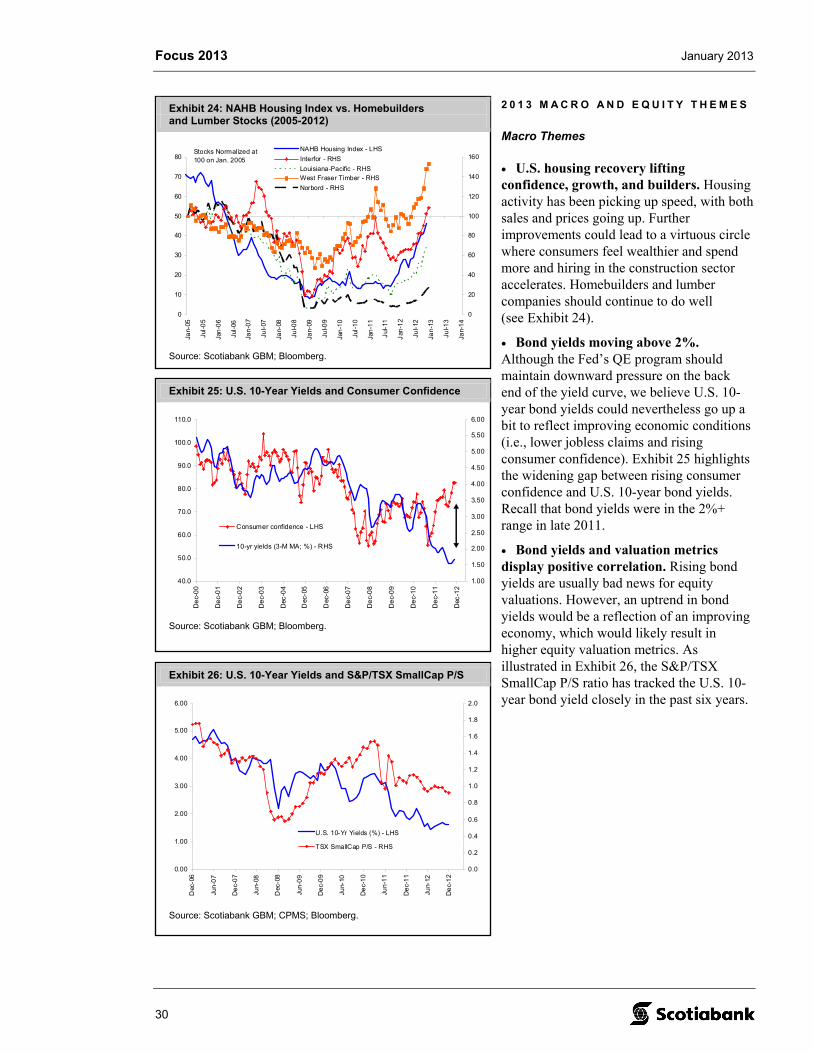
• U.S. housing recovery lifting confidence, growth, and builders. Housing activity has been picking up speed, with both sales and prices going up. Further improvements could lead to a virtuous circle where consumers feel wealthier and spend more and hiring in the construction sector accelerates. Homebuilders and lumber companies should continue to do well (see Exhibit 24).
• Bond yields moving above 2%. Although the Fed’s QE program should maintain downward pressure on the back end of the yield curve, we believe U.S. 10-year bond yields could nevertheless go up a bit to reflect improving economic conditions (i.e., lower jobless claims and rising consumer confidence). Exhibit 25 highlights the widening gap between rising consumer confidence and U.S. 10-year bond yields. Recall that bond yields were in the 2%+ range in late 2011.
• Bond yields and valuation metrics display positive correlation. Rising bond yields are usually bad news for equity valuations. However, an uptrend in bond yields would be a reflection of an improving economy, which would likely result in higher equity valuation metrics. As illustrated in Exhibit 26, the S&P/TSX SmallCap P/S ratio has tracked the U.S. 10-year bond yield closely in the past six years.
Focus 2013 January 2013
31
Exhibit 28: S&P/TSX SmallCap vs. Number of New Equity Issues in Canada*
100
300
500
700
900
1100
1300
1500
1700
De
c-0
0
Dec
-01
Dec
-02
De
c-0
3
De
c-0
4
De
c-05
Dec
-06
Dec
-07
De
c-0
8
De
c-0
9
De
c-10
Dec
-11
Dec
-12
100
200
300
400
500
600
700
800
900
# of New Equity Issues (last 12-M) - LHS
TSX SmallCap Index - RHS
Correlation: 86%
* Including IPOs and follow-on.
Source: Scotiabank GBM; FP Infomart.
Exhibit 27: Correlation Expected to Fall Following Huge Run-Up
0%
20%
40%
60%
80%
100% Correlation based on IFM GDP
estimates
10%15%20%25%30%35%40%45%50%55%60%
1994
199
6
199
8
200
0
2002
200
4
200
6
200
8
20
10
2012
2014
201
6
Canada: Small Cap
Sector Correlation
Country Correlation
(17 countries)
Source: Scotiabank GBM; IMF estimates.
Exhibit 29: S&P/TSX SmallCap and M&A Activity in Canada (Deal Size Below $500 Million)
1100
1200
1300
1400
1500
1600
1700
De
c-0
4
Dec
-05
Dec
-06
De
c-0
7
De
c-0
8
Dec
-09
De
c-1
0
De
c-1
1
De
c-1
2
300
400
500
600
700
800
900
# of M&A in Canada (12-M Rolling) - LHS
TSX SmallCap - RHS
Source: Scotiabank GBM; Bloomberg.
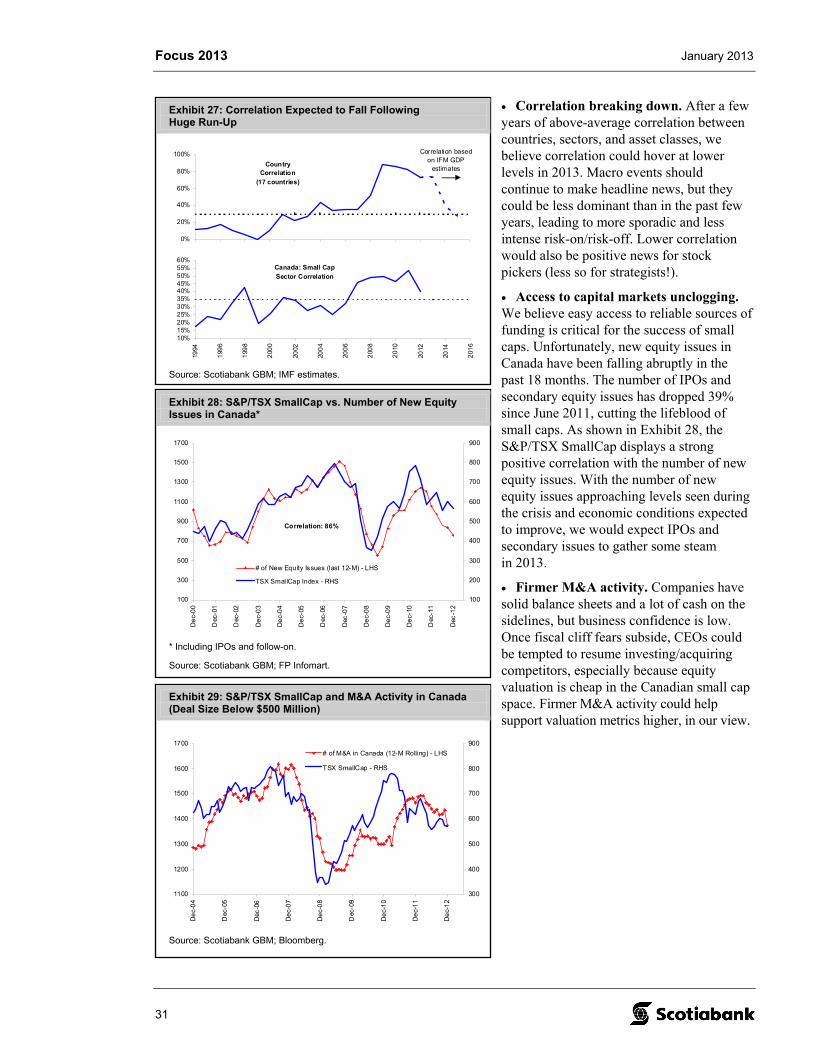
• Correlation breaking down. After a few years of above-average correlation between countries, sectors, and asset classes, we believe correlation could hover at lower levels in 2013. Macro events should continue to make headline news, but they could be less dominant than in the past few years, leading to more sporadic and less intense risk-on/risk-off. Lower correlation would also be positive news for stock pickers (less so for strategists!).
• Access to capital markets unclogging. We believe easy access to reliable sources of funding is critical for the success of small caps. Unfortunately, new equity issues in Canada have been falling abruptly in the past 18 months. The number of IPOs and secondary equity issues has dropped 39% since June 2011, cutting the lifeblood of small caps. As shown in Exhibit 28, the S&P/TSX SmallCap displays a strong positive correlation with the number of new equity issues. With the number of new equity issues approaching levels seen during the crisis and economic conditions expected to improve, we would expect IPOs and secondary issues to gather some steam in 2013.
• Firmer M&A activity. Companies have solid balance sheets and a lot of cash on the sidelines, but business confidence is low. Once fiscal cliff fears subside, CEOs could be tempted to resume investing/acquiring competitors, especially because equity valuation is cheap in the Canadian small cap space. Firmer M&A activity could help support valuation metrics higher, in our view.
Focus 2013 January 2013
32
Exhibit 30: S&P/TSX SmallCap P/B Ratio Relative to S&P/TSX Composite
0.4
0.5
0.6
0.7
0.8
0.9
1.0
1.1
1.2
Jun-
99
Jun-
00
Jun-
01
Jun
-02
Jun
-03
Jun
-04
Jun
-05
Jun
-06
Jun
-07
Jun
-08
Jun
-09
Jun
-10
Jun
-11
Jun
-12
Jun
-13
+1 Stdev.
-1 Stdev.
Source: Scotiabank GBM; Bloomberg.
Exhibit 31: Canadian Small Caps Relative to U.S. Small Caps (YOY%)
-11%
-23% -25% -21%-28%-29%
-60%
-40%
-20%
0%
20%
40%
60%
80%
Dec
-95
De
c-96
De
c-9
7
De
c-9
8
De
c-9
9
De
c-0
0
Dec
-01
Dec
-02
Dec
-03
De
c-0
4
De
c-0
5
De
c-0
6
De
c-0
7
Dec
-08
Dec
-09
Dec
-10
De
c-11
De
c-12
Canadian small caps outperforming
U.S. small caps outperforming
+1 Stdev.
-1 Stdev.
Global Manufacturing PMI (YOY%)
* Based on MSCI Canada Small Cap index (USD) and S&P 600.
Source: Scotiabank GBM; Bloomberg.
Exhibit 32: S&P/TSX SmallCap Dividend Payers Relative Valuations at the Top End of the Range
0.2
0.4
0.6
0.8
1.0
1.2
1.4
1.6
1.8
2.0
De
c-0
3
De
c-0
4
Dec
-05
De
c-0
6
De
c-0
7
De
c-08
Dec
-09
De
c-1
0
De
c-1
1
Dec
-12
Source: Scotiabank GBM; Bloomberg.
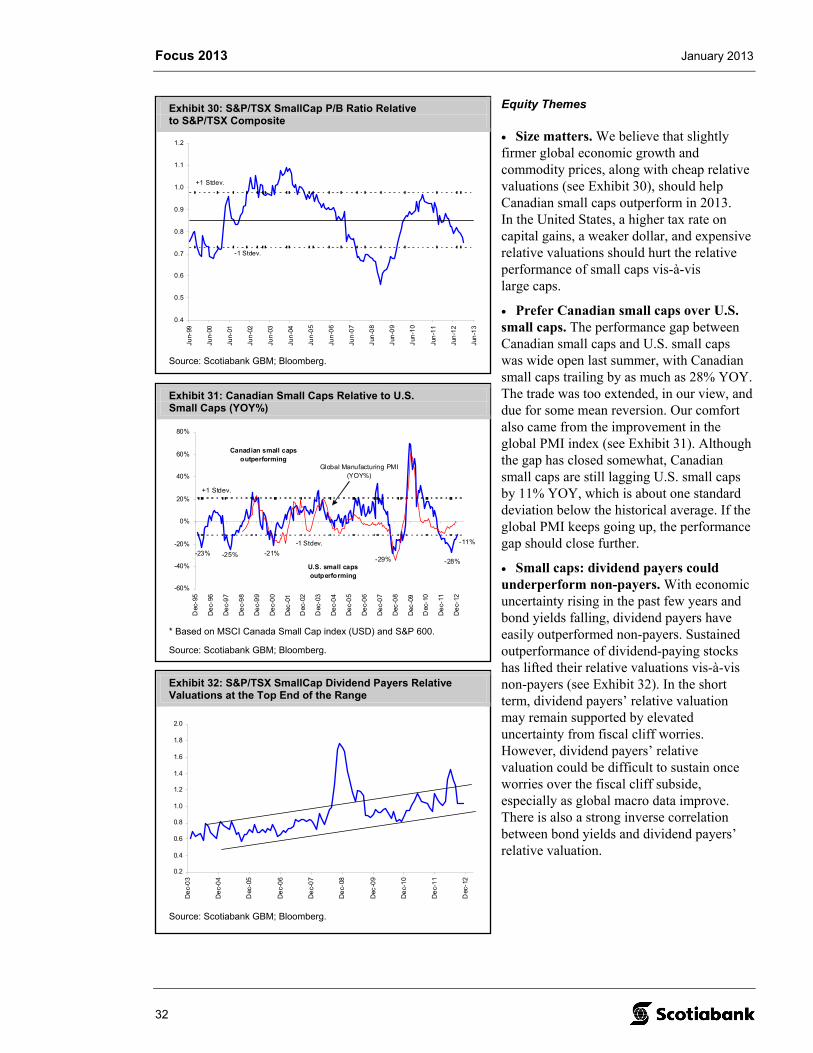
Equity Themes
• Size matters. We believe that slightly firmer global economic growth and commodity prices, along with cheap relative valuations (see Exhibit 30), should help Canadian small caps outperform in 2013. In the United States, a higher tax rate on capital gains, a weaker dollar, and expensive relative valuations should hurt the relative performance of small caps vis-à-vis large caps.
• Prefer Canadian small caps over U.S. small caps. The performance gap between Canadian small caps and U.S. small caps was wide open last summer, with Canadian small caps trailing by as much as 28% YOY. The trade was too extended, in our view, and due for some mean reversion. Our comfort also came from the improvement in the global PMI index (see Exhibit 31). Although the gap has closed somewhat, Canadian small caps are still lagging U.S. small caps by 11% YOY, which is about one standard deviation below the historical average. If the global PMI keeps going up, the performance gap should close further.
• Small caps: dividend payers could underperform non-payers. With economic uncertainty rising in the past few years and bond yields falling, dividend payers have easily outperformed non-payers. Sustained outperformance of dividend-paying stocks has lifted their relative valuations vis-à-vis non-payers (see Exhibit 32). In the short term, dividend payers’ relative valuation may remain supported by elevated uncertainty from fiscal cliff worries. However, dividend payers’ relative valuation could be difficult to sustain once worries over the fiscal cliff subside, especially as global macro data improve. There is also a strong inverse correlation between bond yields and dividend payers’ relative valuation.
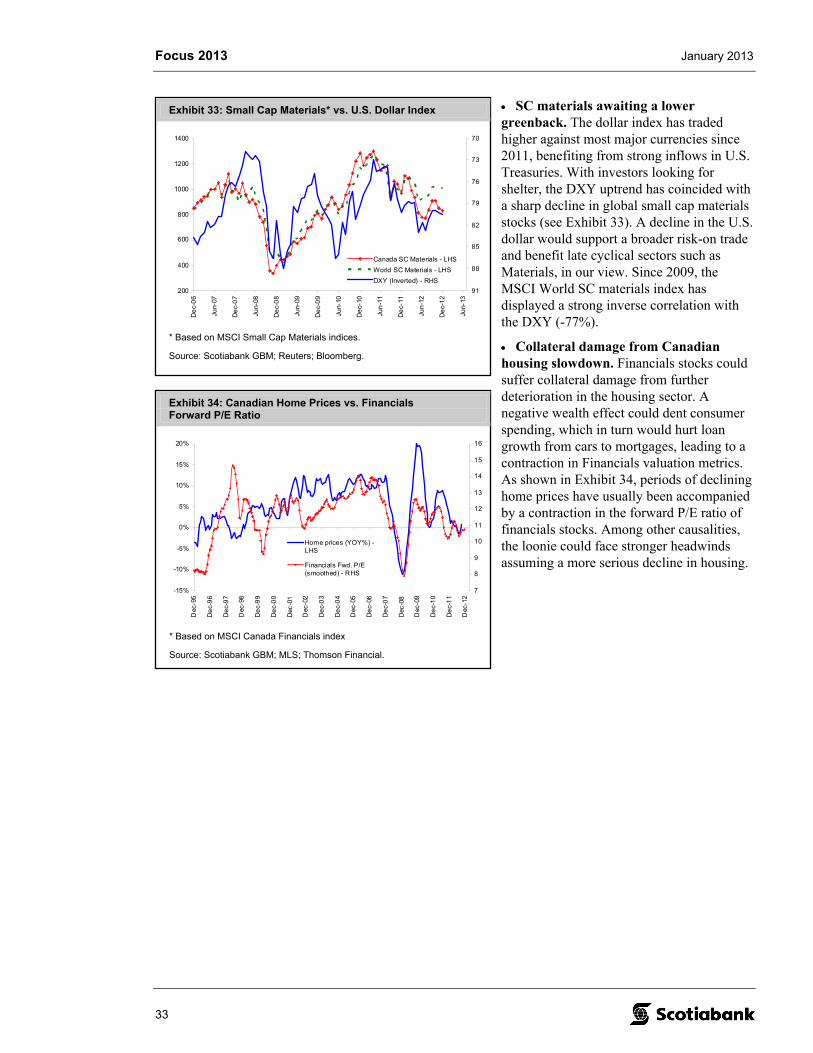
Focus 2013 January 2013
33
Exhibit 34: Canadian Home Prices vs. Financials Forward P/E Ratio
-15%
-10%
-5%
0%
5%
10%
15%
20%
Dec
-95
De
c-9
6
De
c-9
7
Dec
-98
De
c-9
9
De
c-0
0
Dec
-01
Dec
-02
De
c-0
3
De
c-0
4
Dec
-05
De
c-06
De
c-0
7
Dec
-08
Dec
-09
De
c-1
0
De
c-1
1
Dec
-12
7
8
9
10
11
12
13
14
15
16
Home prices (YOY%) -LHS
Financials Fwd. P/E(smoothed) - RHS
* Based on MSCI Canada Financials index
Source: Scotiabank GBM; MLS; Thomson Financial.
Exhibit 33: Small Cap Materials* vs. U.S. Dollar Index
200
400
600
800
1000
1200
1400
De
c-0
6
Jun-
07
De
c-0
7
Jun-
08
De
c-0
8
Jun-
09
De
c-0
9
Jun-
10
De
c-10
Jun
-11
De
c-11
Jun
-12
De
c-1
2
Jun-
13
70
73
76
79
82
85
88
91
Canada SC Materials - LHS
World SC Materials - LHS
DXY (Inverted) - RHS
* Based on MSCI Small Cap Materials indices.
Source: Scotiabank GBM; Reuters; Bloomberg.
SC materials awaiting a lower greenback. The dollar index has traded higher against most major currencies since 2011, benefiting from strong inflows in U.S. Treasuries. With investors looking for shelter, the DXY uptrend has coincided with a sharp decline in global small cap materials stocks (see Exhibit 33). A decline in the U.S. dollar would support a broader risk-on trade and benefit late cyclical sectors such as Materials, in our view. Since 2009, the MSCI World SC materials index has displayed a strong inverse correlation with the DXY (-77%).
Collateral damage from Canadian housing slowdown. Financials stocks could suffer collateral damage from further deterioration in the housing sector. A negative wealth effect could dent consumer spending, which in turn would hurt loan growth from cars to mortgages, leading to a contraction in Financials valuation metrics. As shown in Exhibit 34, periods of declining home prices have usually been accompanied by a contraction in the forward P/E ratio of financials stocks. Among other causalities, the loonie could face stronger headwinds assuming a more serious decline in housing.

Focus 2013 January 2013
34
T H I S P A G E L E F T I N T E N T I O N A L L Y B L A N K .
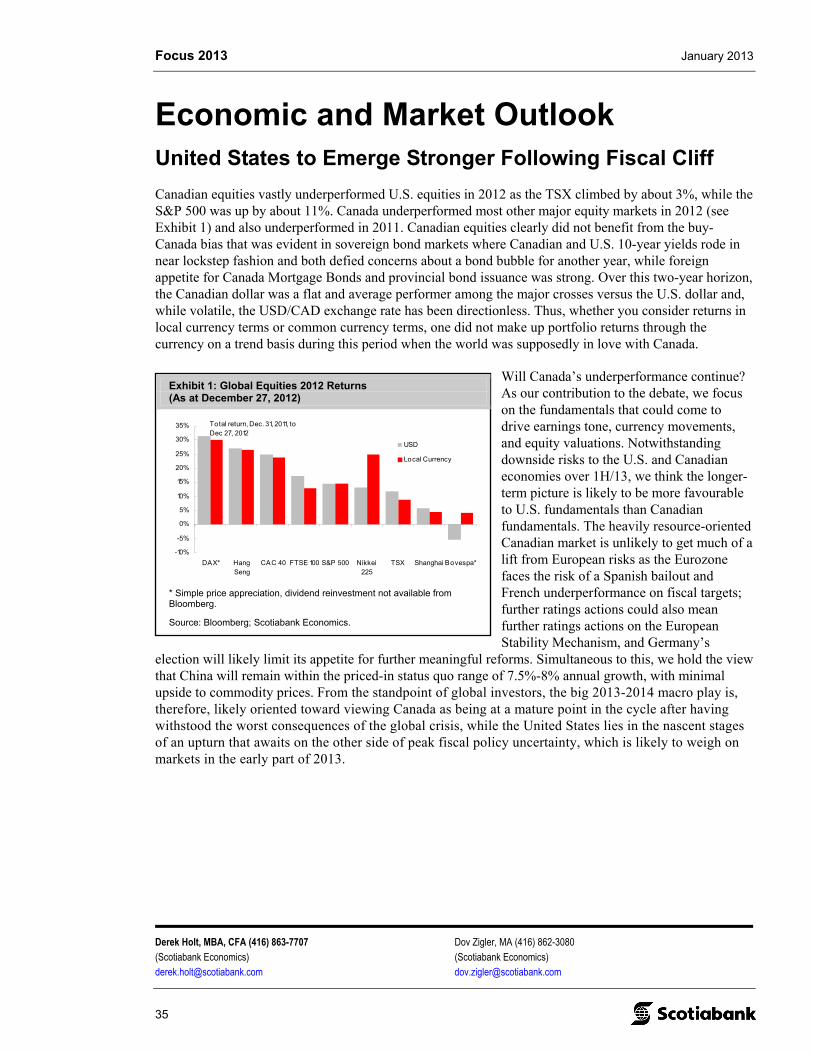
Focus 2013 January 2013
Derek Holt, MBA, CFA (416) 863-7707 Dov Zigler, MA (416) 862-3080 (Scotiabank Economics) (Scotiabank Economics) [email protected] [email protected]
35
Exhibit 1: Global Equities 2012 Returns (As at December 27, 2012)
-10%
-5%
0%
5%
10%
15%
20%
25%
30%
35%
DAX* HangSeng
CAC 40 FTSE 100 S&P 500 Nikkei225
TSX Shanghai Bovespa*
USD
Local Currency
Total return, Dec. 31, 2011, to Dec 27, 2012
* Simple price appreciation, dividend reinvestment not available from Bloomberg.
Source: Bloomberg; Scotiabank Economics.
Economic and Market Outlook
United States to Emerge Stronger Following Fiscal Cliff
Canadian equities vastly underperformed U.S. equities in 2012 as the TSX climbed by about 3%, while the S&P 500 was up by about 11%. Canada underperformed most other major equity markets in 2012 (see Exhibit 1) and also underperformed in 2011. Canadian equities clearly did not benefit from the buy-Canada bias that was evident in sovereign bond markets where Canadian and U.S. 10-year yields rode in near lockstep fashion and both defied concerns about a bond bubble for another year, while foreign appetite for Canada Mortgage Bonds and provincial bond issuance was strong. Over this two-year horizon, the Canadian dollar was a flat and average performer among the major crosses versus the U.S. dollar and, while volatile, the USD/CAD exchange rate has been directionless. Thus, whether you consider returns in local currency terms or common currency terms, one did not make up portfolio returns through the currency on a trend basis during this period when the world was supposedly in love with Canada.
Will Canada’s underperformance continue? As our contribution to the debate, we focus on the fundamentals that could come to drive earnings tone, currency movements, and equity valuations. Notwithstanding downside risks to the U.S. and Canadian economies over 1H/13, we think the longer-term picture is likely to be more favourable to U.S. fundamentals than Canadian fundamentals. The heavily resource-oriented Canadian market is unlikely to get much of a lift from European risks as the Eurozone faces the risk of a Spanish bailout and French underperformance on fiscal targets; further ratings actions could also mean further ratings actions on the European Stability Mechanism, and Germany’s
election will likely limit its appetite for further meaningful reforms. Simultaneous to this, we hold the view that China will remain within the priced-in status quo range of 7.5%-8% annual growth, with minimal upside to commodity prices. From the standpoint of global investors, the big 2013-2014 macro play is, therefore, likely oriented toward viewing Canada as being at a mature point in the cycle after having withstood the worst consequences of the global crisis, while the United States lies in the nascent stages of an upturn that awaits on the other side of peak fiscal policy uncertainty, which is likely to weigh on markets in the early part of 2013.
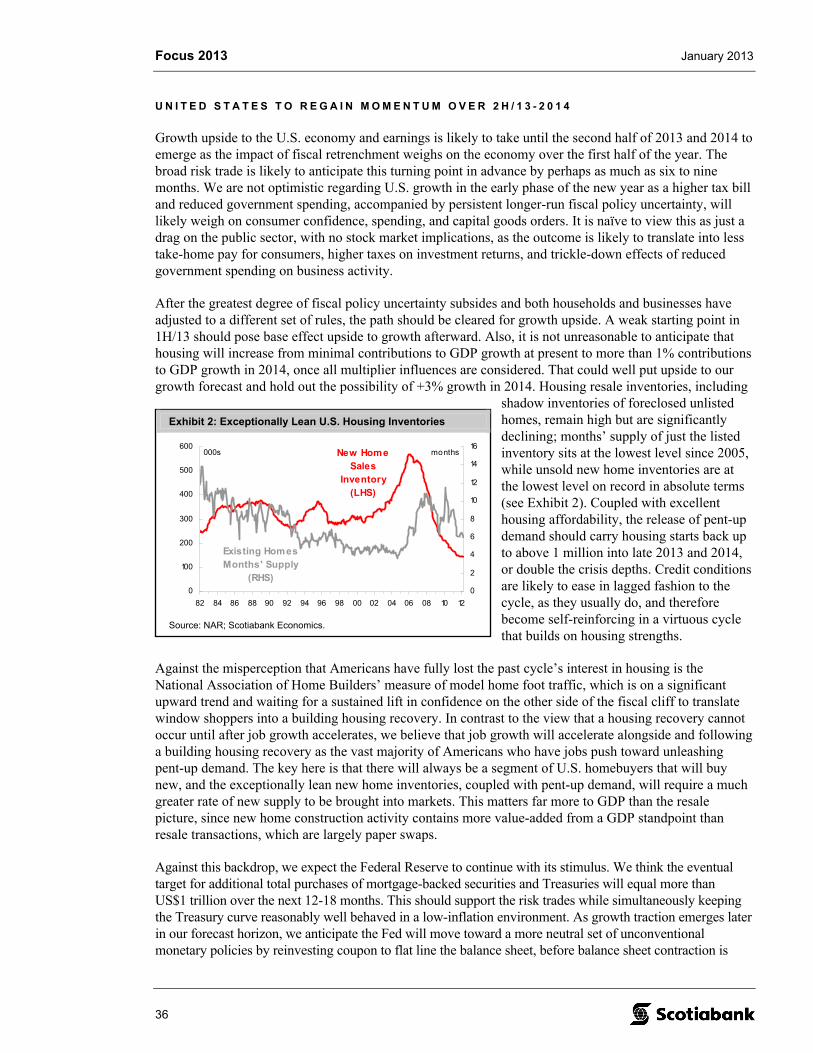
Focus 2013 January 2013
36
Exhibit 2: Exceptionally Lean U.S. Housing Inventories
0
100
200
300
400
500
600
82 84 86 88 90 92 94 96 98 00 02 04 06 08 10 12
0
2
4
6
8
10
12
14
16000s months
Existing Homes Months' Supply
(RHS)
New Home Sales
Inventory (LHS)
Source: NAR; Scotiabank Economics.
U N I T E D S T A T E S T O R E G A I N M O M E N T U M O V E R 2 H / 1 3 - 2 0 1 4
Growth upside to the U.S. economy and earnings is likely to take until the second half of 2013 and 2014 to emerge as the impact of fiscal retrenchment weighs on the economy over the first half of the year. The broad risk trade is likely to anticipate this turning point in advance by perhaps as much as six to nine months. We are not optimistic regarding U.S. growth in the early phase of the new year as a higher tax bill and reduced government spending, accompanied by persistent longer-run fiscal policy uncertainty, will likely weigh on consumer confidence, spending, and capital goods orders. It is naïve to view this as just a drag on the public sector, with no stock market implications, as the outcome is likely to translate into less take-home pay for consumers, higher taxes on investment returns, and trickle-down effects of reduced government spending on business activity.
After the greatest degree of fiscal policy uncertainty subsides and both households and businesses have adjusted to a different set of rules, the path should be cleared for growth upside. A weak starting point in 1H/13 should pose base effect upside to growth afterward. Also, it is not unreasonable to anticipate that housing will increase from minimal contributions to GDP growth at present to more than 1% contributions to GDP growth in 2014, once all multiplier influences are considered. That could well put upside to our growth forecast and hold out the possibility of +3% growth in 2014. Housing resale inventories, including
shadow inventories of foreclosed unlisted homes, remain high but are significantly declining; months’ supply of just the listed inventory sits at the lowest level since 2005, while unsold new home inventories are at the lowest level on record in absolute terms (see Exhibit 2). Coupled with excellent housing affordability, the release of pent-up demand should carry housing starts back up to above 1 million into late 2013 and 2014, or double the crisis depths. Credit conditions are likely to ease in lagged fashion to the cycle, as they usually do, and therefore become self-reinforcing in a virtuous cycle that builds on housing strengths.
Against the misperception that Americans have fully lost the past cycle’s interest in housing is the National Association of Home Builders’ measure of model home foot traffic, which is on a significant upward trend and waiting for a sustained lift in confidence on the other side of the fiscal cliff to translate window shoppers into a building housing recovery. In contrast to the view that a housing recovery cannot occur until after job growth accelerates, we believe that job growth will accelerate alongside and following a building housing recovery as the vast majority of Americans who have jobs push toward unleashing pent-up demand. The key here is that there will always be a segment of U.S. homebuyers that will buy new, and the exceptionally lean new home inventories, coupled with pent-up demand, will require a much greater rate of new supply to be brought into markets. This matters far more to GDP than the resale picture, since new home construction activity contains more value-added from a GDP standpoint than resale transactions, which are largely paper swaps.
Against this backdrop, we expect the Federal Reserve to continue with its stimulus. We think the eventual target for additional total purchases of mortgage-backed securities and Treasuries will equal more than US$1 trillion over the next 12-18 months. This should support the risk trades while simultaneously keeping the Treasury curve reasonably well behaved in a low-inflation environment. As growth traction emerges later in our forecast horizon, we anticipate the Fed will move toward a more neutral set of unconventional monetary policies by reinvesting coupon to flat line the balance sheet, before balance sheet contraction is
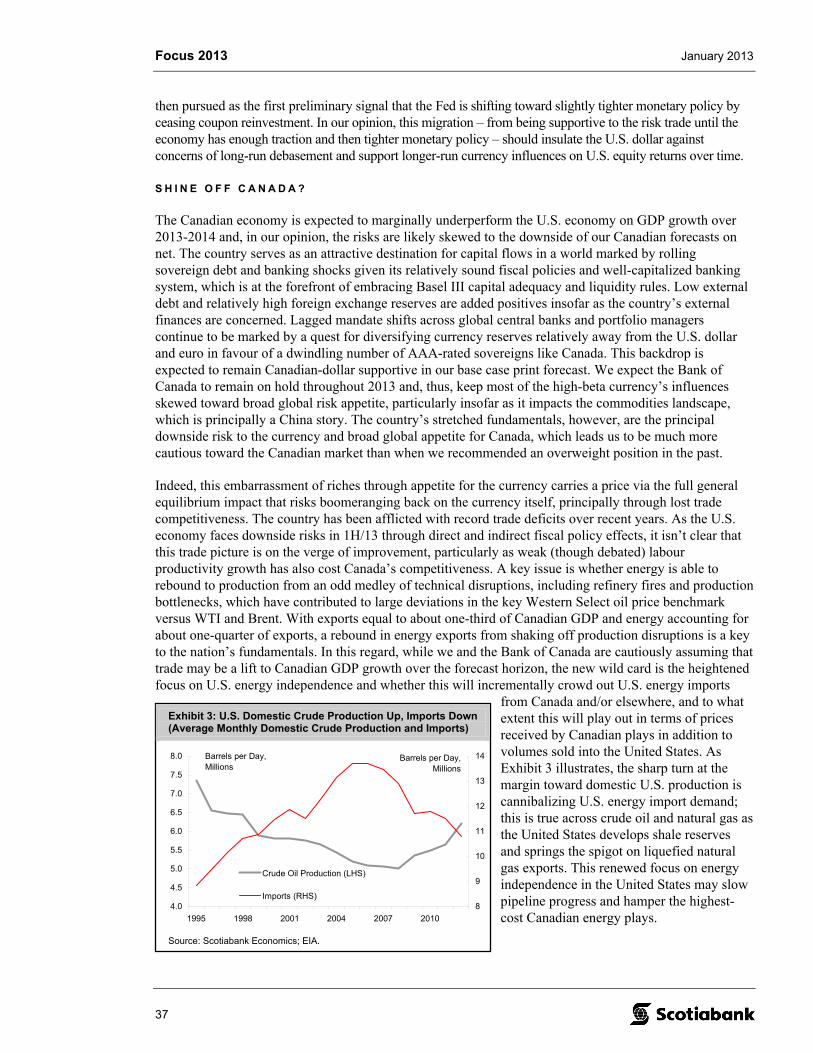
Focus 2013 January 2013
37
Exhibit 3: U.S. Domestic Crude Production Up, Imports Down (Average Monthly Domestic Crude Production and Imports)
4.0
4.5
5.0
5.5
6.0
6.5
7.0
7.5
8.0
1995 1998 2001 2004 2007 2010
8
9
10
11
12
13
14
Crude Oil Production (LHS)
Imports (RHS)
Barrels per Day,Millions
Barrels per Day,Millions
Source: Scotiabank Economics; EIA.
then pursued as the first preliminary signal that the Fed is shifting toward slightly tighter monetary policy by ceasing coupon reinvestment. In our opinion, this migration – from being supportive to the risk trade until the economy has enough traction and then tighter monetary policy – should insulate the U.S. dollar against concerns of long-run debasement and support longer-run currency influences on U.S. equity returns over time.
S H I N E O F F C A N A D A ?
The Canadian economy is expected to marginally underperform the U.S. economy on GDP growth over 2013-2014 and, in our opinion, the risks are likely skewed to the downside of our Canadian forecasts on net. The country serves as an attractive destination for capital flows in a world marked by rolling sovereign debt and banking shocks given its relatively sound fiscal policies and well-capitalized banking system, which is at the forefront of embracing Basel III capital adequacy and liquidity rules. Low external debt and relatively high foreign exchange reserves are added positives insofar as the country’s external finances are concerned. Lagged mandate shifts across global central banks and portfolio managers continue to be marked by a quest for diversifying currency reserves relatively away from the U.S. dollar and euro in favour of a dwindling number of AAA-rated sovereigns like Canada. This backdrop is expected to remain Canadian-dollar supportive in our base case print forecast. We expect the Bank of Canada to remain on hold throughout 2013 and, thus, keep most of the high-beta currency’s influences skewed toward broad global risk appetite, particularly insofar as it impacts the commodities landscape, which is principally a China story. The country’s stretched fundamentals, however, are the principal downside risk to the currency and broad global appetite for Canada, which leads us to be much more cautious toward the Canadian market than when we recommended an overweight position in the past.
Indeed, this embarrassment of riches through appetite for the currency carries a price via the full general equilibrium impact that risks boomeranging back on the currency itself, principally through lost trade competitiveness. The country has been afflicted with record trade deficits over recent years. As the U.S. economy faces downside risks in 1H/13 through direct and indirect fiscal policy effects, it isn’t clear that this trade picture is on the verge of improvement, particularly as weak (though debated) labour productivity growth has also cost Canada’s competitiveness. A key issue is whether energy is able to rebound to production from an odd medley of technical disruptions, including refinery fires and production bottlenecks, which have contributed to large deviations in the key Western Select oil price benchmark versus WTI and Brent. With exports equal to about one-third of Canadian GDP and energy accounting for about one-quarter of exports, a rebound in energy exports from shaking off production disruptions is a key to the nation’s fundamentals. In this regard, while we and the Bank of Canada are cautiously assuming that trade may be a lift to Canadian GDP growth over the forecast horizon, the new wild card is the heightened focus on U.S. energy independence and whether this will incrementally crowd out U.S. energy imports
from Canada and/or elsewhere, and to what extent this will play out in terms of prices received by Canadian plays in addition to volumes sold into the United States. As Exhibit 3 illustrates, the sharp turn at the margin toward domestic U.S. production is cannibalizing U.S. energy import demand; this is true across crude oil and natural gas as the United States develops shale reserves and springs the spigot on liquefied natural gas exports. This renewed focus on energy independence in the United States may slow pipeline progress and hamper the highest-cost Canadian energy plays.
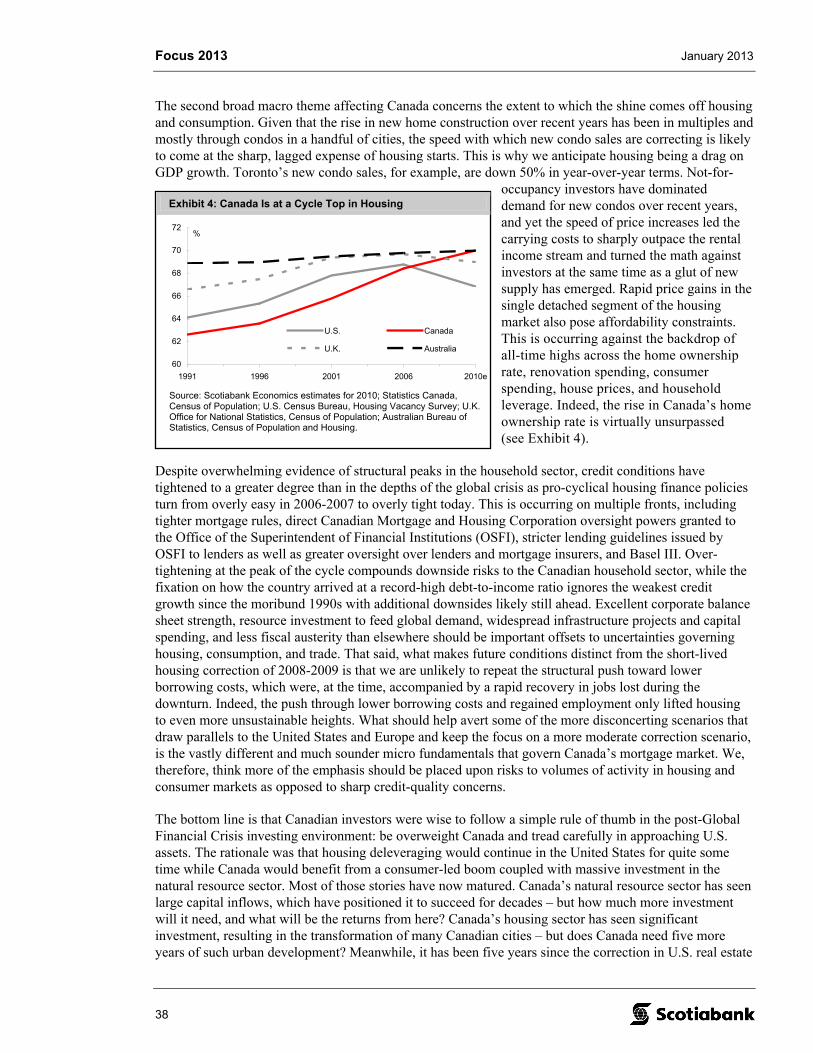
Focus 2013 January 2013
38
Exhibit 4: Canada Is at a Cycle Top in Housing
60
62
64
66
68
70
72
1991 1996 2001 2006 2010e
U.S. Canada
U.K. Australia
%
Source: Scotiabank Economics estimates for 2010; Statistics Canada, Census of Population; U.S. Census Bureau, Housing Vacancy Survey; U.K. Office for National Statistics, Census of Population; Australian Bureau of Statistics, Census of Population and Housing.
The second broad macro theme affecting Canada concerns the extent to which the shine comes off housing and consumption. Given that the rise in new home construction over recent years has been in multiples and mostly through condos in a handful of cities, the speed with which new condo sales are correcting is likely to come at the sharp, lagged expense of housing starts. This is why we anticipate housing being a drag on GDP growth. Toronto’s new condo sales, for example, are down 50% in year-over-year terms. Not-for-
occupancy investors have dominated demand for new condos over recent years, and yet the speed of price increases led the carrying costs to sharply outpace the rental income stream and turned the math against investors at the same time as a glut of new supply has emerged. Rapid price gains in the single detached segment of the housing market also pose affordability constraints. This is occurring against the backdrop of all-time highs across the home ownership rate, renovation spending, consumer spending, house prices, and household leverage. Indeed, the rise in Canada’s home ownership rate is virtually unsurpassed (see Exhibit 4).
Despite overwhelming evidence of structural peaks in the household sector, credit conditions have tightened to a greater degree than in the depths of the global crisis as pro-cyclical housing finance policies turn from overly easy in 2006-2007 to overly tight today. This is occurring on multiple fronts, including tighter mortgage rules, direct Canadian Mortgage and Housing Corporation oversight powers granted to the Office of the Superintendent of Financial Institutions (OSFI), stricter lending guidelines issued by OSFI to lenders as well as greater oversight over lenders and mortgage insurers, and Basel III. Over-tightening at the peak of the cycle compounds downside risks to the Canadian household sector, while the fixation on how the country arrived at a record-high debt-to-income ratio ignores the weakest credit growth since the moribund 1990s with additional downsides likely still ahead. Excellent corporate balance sheet strength, resource investment to feed global demand, widespread infrastructure projects and capital spending, and less fiscal austerity than elsewhere should be important offsets to uncertainties governing housing, consumption, and trade. That said, what makes future conditions distinct from the short-lived housing correction of 2008-2009 is that we are unlikely to repeat the structural push toward lower borrowing costs, which were, at the time, accompanied by a rapid recovery in jobs lost during the downturn. Indeed, the push through lower borrowing costs and regained employment only lifted housing to even more unsustainable heights. What should help avert some of the more disconcerting scenarios that draw parallels to the United States and Europe and keep the focus on a more moderate correction scenario, is the vastly different and much sounder micro fundamentals that govern Canada’s mortgage market. We, therefore, think more of the emphasis should be placed upon risks to volumes of activity in housing and consumer markets as opposed to sharp credit-quality concerns.
The bottom line is that Canadian investors were wise to follow a simple rule of thumb in the post-Global Financial Crisis investing environment: be overweight Canada and tread carefully in approaching U.S. assets. The rationale was that housing deleveraging would continue in the United States for quite some time while Canada would benefit from a consumer-led boom coupled with massive investment in the natural resource sector. Most of those stories have now matured. Canada’s natural resource sector has seen large capital inflows, which have positioned it to succeed for decades – but how much more investment will it need, and what will be the returns from here? Canada’s housing sector has seen significant investment, resulting in the transformation of many Canadian cities – but does Canada need five more years of such urban development? Meanwhile, it has been five years since the correction in U.S. real estate

Focus 2013 January 2013
39
began in earnest, and it finally looks like that sector is set for sustained gains over time. The United States has undergone an oil and gas revolution, with positive spin-offs for manufacturing, trade, and, it is hoped, lower energy prices. In a nutshell, the U.S. economic configuration now appears as though it will be stronger than Canada’s once the worst of the fiscal cliff worries are in the rear-view mirror. That’s why we’re expecting the U.S. economy to grow faster than Canada’s over our forecast horizon. The jury is out, however, on whether this medium-term story will hold over the long term. The world needs Canada’s commodities – particularly given longer-run prospects across emerging markets – and this stands in contrast to the United States, which faces years of fiscal drag effects that will cap longer-run growth compared to prior cycles.
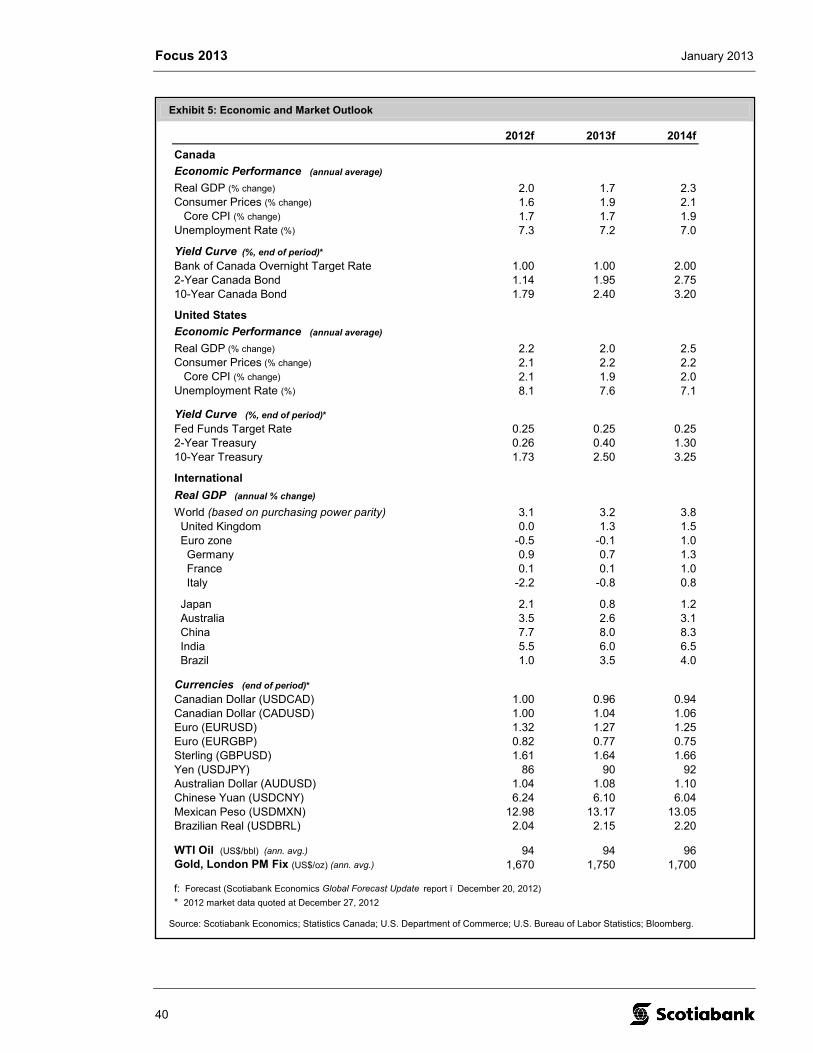
Focus 2013 January 2013
40
Exhibit 5: Economic and Market Outlook
2012f 2013f 2014f
Canada
Economic Performance (annual average)
Real GDP (% change) 2.0 1.7 2.3Consumer Prices (% change) 1.6 1.9 2.1 Core CPI (% change) 1.7 1.7 1.9Unemployment Rate (%) 7.3 7.2 7.0
Yield Curve (%, end of period)*
Bank of Canada Overnight Target Rate 1.00 1.00 2.002-Year Canada Bond 1.14 1.95 2.7510-Year Canada Bond 1.79 2.40 3.20
United States
Economic Performance (annual average)
Real GDP (% change) 2.2 2.0 2.5Consumer Prices (% change) 2.1 2.2 2.2 Core CPI (% change) 2.1 1.9 2.0Unemployment Rate (%) 8.1 7.6 7.1
Yield Curve (%, end of period)*
Fed Funds Target Rate 0.25 0.25 0.252-Year Treasury 0.26 0.40 1.3010-Year Treasury 1.73 2.50 3.25
International
Real GDP (annual % change)
World (based on purchasing power parity) 3.1 3.2 3.8 United Kingdom 0.0 1.3 1.5 Euro zone -0.5 -0.1 1.0 Germany 0.9 0.7 1.3 France 0.1 0.1 1.0 Italy -2.2 -0.8 0.8
Japan 2.1 0.8 1.2 Australia 3.5 2.6 3.1 China 7.7 8.0 8.3 India 5.5 6.0 6.5 Brazil 1.0 3.5 4.0
Currencies (end of period)*
Canadian Dollar (USDCAD) 1.00 0.96 0.94Canadian Dollar (CADUSD) 1.00 1.04 1.06Euro (EURUSD) 1.32 1.27 1.25Euro (EURGBP) 0.82 0.77 0.75Sterling (GBPUSD) 1.61 1.64 1.66Yen (USDJPY) 86 90 92Australian Dollar (AUDUSD) 1.04 1.08 1.10Chinese Yuan (USDCNY) 6.24 6.10 6.04Mexican Peso (USDMXN) 12.98 13.17 13.05Brazilian Real (USDBRL) 2.04 2.15 2.20
WTI Oil (US$/bbl) (ann. avg.) 94 94 96Gold, London PM Fix (US$/oz) (ann. avg.) 1,670 1,750 1,700
f: Forecast (Scotiabank Economics Global Forecast Update report ï December 20, 2012)
* 2012 market data quoted at December 27, 2012
Source: Scotiabank Economics; Statistics Canada; U.S. Department of Commerce; U.S. Bureau of Labor Statistics; Bloomberg.
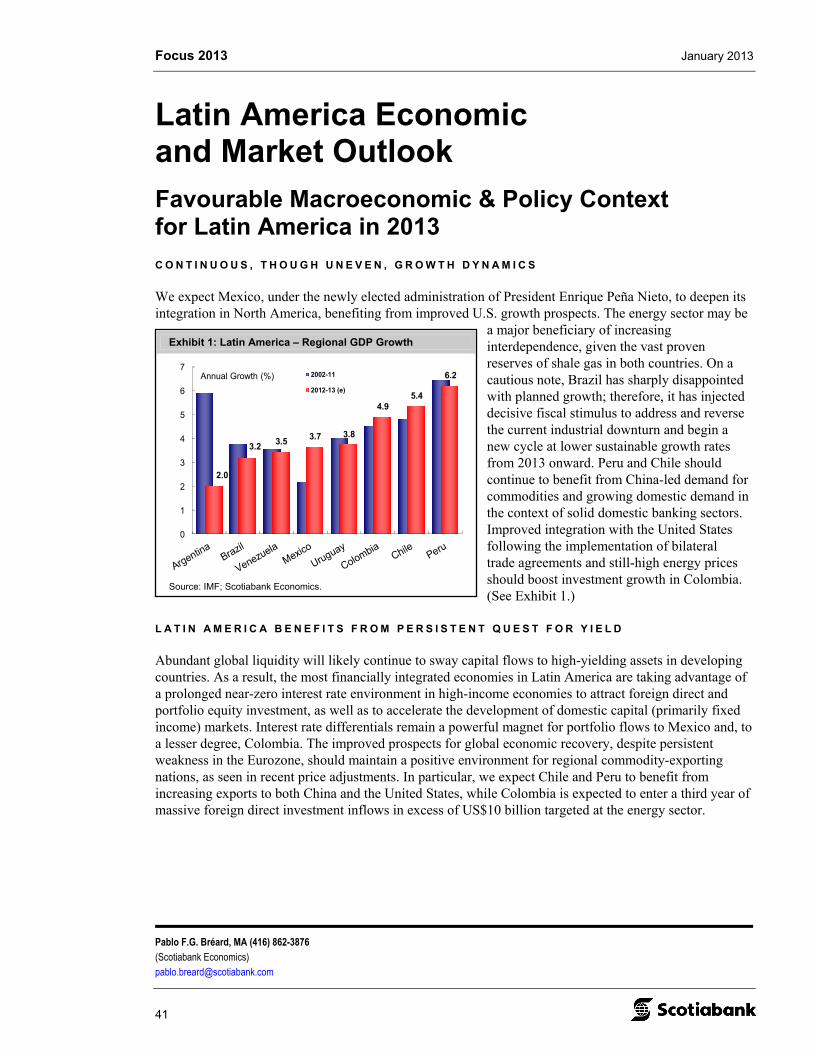
Focus 2013 January 2013
Pablo F.G. Bréard, MA (416) 862-3876 (Scotiabank Economics) [email protected]
41
Exhibit 1: Latin America – Regional GDP Growth
2.0
3.23.5 3.7 3.8
4.95.4
6.2
0
1
2
3
4
5
6
72002-11
2012-13 (e)
Annual Growth (%)
Source: IMF; Scotiabank Economics.
Latin America Economic and Market Outlook
Favourable Macroeconomic & Policy Context for Latin America in 2013
C O N T I N U O U S , T H O U G H U N E V E N , G R O W T H D Y N A M I C S
We expect Mexico, under the newly elected administration of President Enrique Peña Nieto, to deepen its integration in North America, benefiting from improved U.S. growth prospects. The energy sector may be
a major beneficiary of increasing interdependence, given the vast proven reserves of shale gas in both countries. On a cautious note, Brazil has sharply disappointed with planned growth; therefore, it has injected decisive fiscal stimulus to address and reverse the current industrial downturn and begin a new cycle at lower sustainable growth rates from 2013 onward. Peru and Chile should continue to benefit from China-led demand for commodities and growing domestic demand in the context of solid domestic banking sectors. Improved integration with the United States following the implementation of bilateral trade agreements and still-high energy prices should boost investment growth in Colombia. (See Exhibit 1.)
L A T I N A M E R I C A B E N E F I T S F R O M P E R S I S T E N T Q U E S T F O R Y I E L D
Abundant global liquidity will likely continue to sway capital flows to high-yielding assets in developing countries. As a result, the most financially integrated economies in Latin America are taking advantage of a prolonged near-zero interest rate environment in high-income economies to attract foreign direct and portfolio equity investment, as well as to accelerate the development of domestic capital (primarily fixed income) markets. Interest rate differentials remain a powerful magnet for portfolio flows to Mexico and, to a lesser degree, Colombia. The improved prospects for global economic recovery, despite persistent weakness in the Eurozone, should maintain a positive environment for regional commodity-exporting nations, as seen in recent price adjustments. In particular, we expect Chile and Peru to benefit from increasing exports to both China and the United States, while Colombia is expected to enter a third year of massive foreign direct investment inflows in excess of US$10 billion targeted at the energy sector.
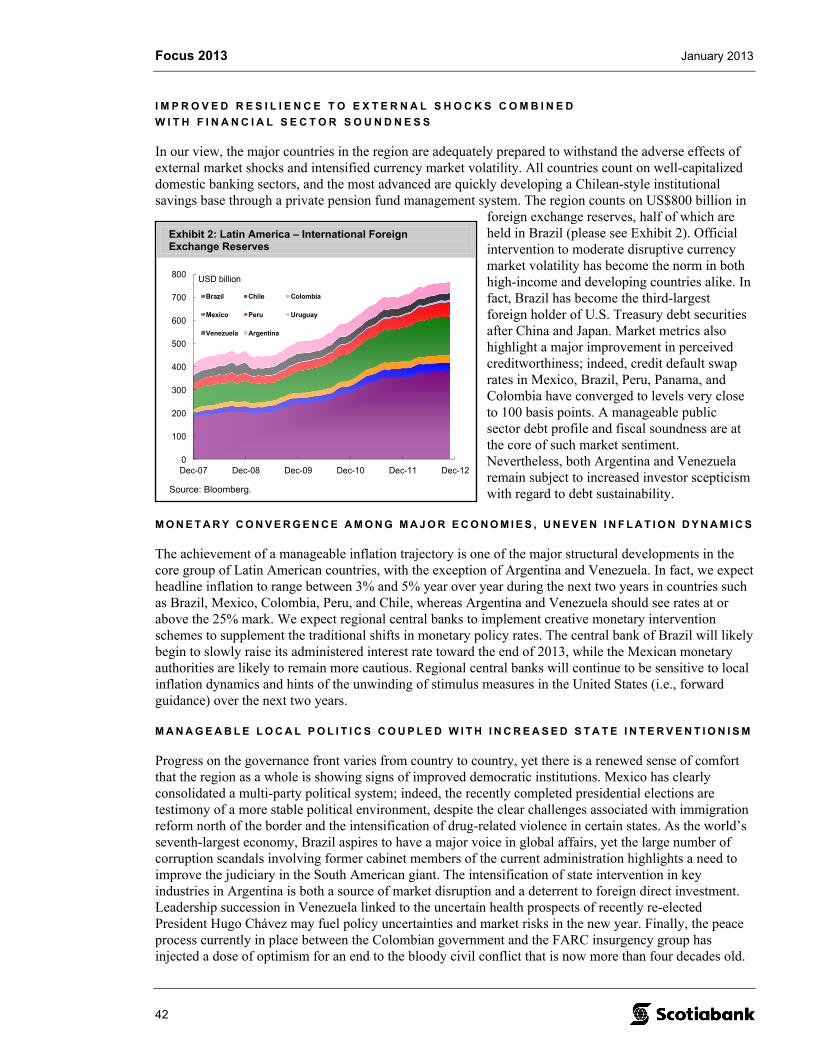
Focus 2013 January 2013
42
Exhibit 2: Latin America – International Foreign Exchange Reserves
0
100
200
300
400
500
600
700
800
Dec-07 Dec-08 Dec-09 Dec-10 Dec-11 Dec-12
Brazil Chile Colombia
Mexico Peru Uruguay
Venezuela Argentina
USD billion
Source: Bloomberg.
I M P R O V E D R E S I L I E N C E T O E X T E R N A L S H O C K S C O M B I N E D
W I T H F I N A N C I A L S E C T O R S O U N D N E S S
In our view, the major countries in the region are adequately prepared to withstand the adverse effects of external market shocks and intensified currency market volatility. All countries count on well-capitalized domestic banking sectors, and the most advanced are quickly developing a Chilean-style institutional savings base through a private pension fund management system. The region counts on US$800 billion in
foreign exchange reserves, half of which are held in Brazil (please see Exhibit 2). Official intervention to moderate disruptive currency market volatility has become the norm in both high-income and developing countries alike. In fact, Brazil has become the third-largest foreign holder of U.S. Treasury debt securities after China and Japan. Market metrics also highlight a major improvement in perceived creditworthiness; indeed, credit default swap rates in Mexico, Brazil, Peru, Panama, and Colombia have converged to levels very close to 100 basis points. A manageable public sector debt profile and fiscal soundness are at the core of such market sentiment. Nevertheless, both Argentina and Venezuela remain subject to increased investor scepticism with regard to debt sustainability.
M O N E T A R Y C O N V E R G E N C E A M O N G M A J O R E C O N O M I E S , U N E V E N I N F L A T I O N D Y N A M I C S
The achievement of a manageable inflation trajectory is one of the major structural developments in the core group of Latin American countries, with the exception of Argentina and Venezuela. In fact, we expect headline inflation to range between 3% and 5% year over year during the next two years in countries such as Brazil, Mexico, Colombia, Peru, and Chile, whereas Argentina and Venezuela should see rates at or above the 25% mark. We expect regional central banks to implement creative monetary intervention schemes to supplement the traditional shifts in monetary policy rates. The central bank of Brazil will likely begin to slowly raise its administered interest rate toward the end of 2013, while the Mexican monetary authorities are likely to remain more cautious. Regional central banks will continue to be sensitive to local inflation dynamics and hints of the unwinding of stimulus measures in the United States (i.e., forward guidance) over the next two years.
M A N A G E A B L E L O C A L P O L I T I C S C O U P L E D W I T H I N C R E A S E D S T A T E I N T E R V E N T I O N I S M
Progress on the governance front varies from country to country, yet there is a renewed sense of comfort that the region as a whole is showing signs of improved democratic institutions. Mexico has clearly consolidated a multi-party political system; indeed, the recently completed presidential elections are testimony of a more stable political environment, despite the clear challenges associated with immigration reform north of the border and the intensification of drug-related violence in certain states. As the world’s seventh-largest economy, Brazil aspires to have a major voice in global affairs, yet the large number of corruption scandals involving former cabinet members of the current administration highlights a need to improve the judiciary in the South American giant. The intensification of state intervention in key industries in Argentina is both a source of market disruption and a deterrent to foreign direct investment. Leadership succession in Venezuela linked to the uncertain health prospects of recently re-elected President Hugo Chávez may fuel policy uncertainties and market risks in the new year. Finally, the peace process currently in place between the Colombian government and the FARC insurgency group has injected a dose of optimism for an end to the bloody civil conflict that is now more than four decades old.
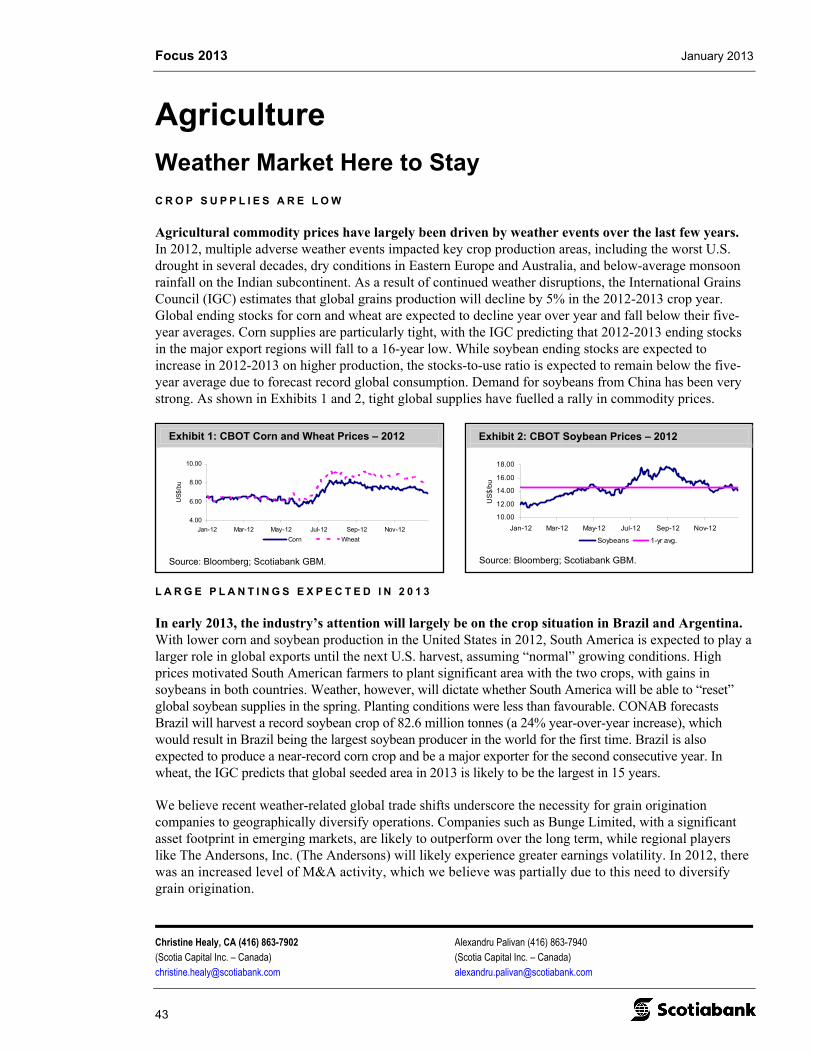
Focus 2013 January 2013
Christine Healy, CA (416) 863-7902 Alexandru Palivan (416) 863-7940 (Scotia Capital Inc. – Canada) (Scotia Capital Inc. – Canada) [email protected] [email protected]
43
Exhibit 2: CBOT Soybean Prices – 2012
10.00
12.00
14.00
16.00
18.00
Jan-12 Mar-12 May-12 Jul-12 Sep-12 Nov-12
US
$/b
u
Soybeans 1-yr avg.
Source: Bloomberg; Scotiabank GBM.
Exhibit 1: CBOT Corn and Wheat Prices – 2012
4.00
6.00
8.00
10.00
Jan-12 Mar-12 May-12 Jul-12 Sep-12 Nov-12
US
$/bu
Corn Wheat
Source: Bloomberg; Scotiabank GBM.
Agriculture
Weather Market Here to Stay
C R O P S U P P L I E S A R E L O W
Agricultural commodity prices have largely been driven by weather events over the last few years. In 2012, multiple adverse weather events impacted key crop production areas, including the worst U.S. drought in several decades, dry conditions in Eastern Europe and Australia, and below-average monsoon rainfall on the Indian subcontinent. As a result of continued weather disruptions, the International Grains Council (IGC) estimates that global grains production will decline by 5% in the 2012-2013 crop year. Global ending stocks for corn and wheat are expected to decline year over year and fall below their five-year averages. Corn supplies are particularly tight, with the IGC predicting that 2012-2013 ending stocks in the major export regions will fall to a 16-year low. While soybean ending stocks are expected to increase in 2012-2013 on higher production, the stocks-to-use ratio is expected to remain below the five-year average due to forecast record global consumption. Demand for soybeans from China has been very strong. As shown in Exhibits 1 and 2, tight global supplies have fuelled a rally in commodity prices.
L A R G E P L A N T I N G S E X P E C T E D I N 2 0 1 3
In early 2013, the industry’s attention will largely be on the crop situation in Brazil and Argentina. With lower corn and soybean production in the United States in 2012, South America is expected to play a larger role in global exports until the next U.S. harvest, assuming “normal” growing conditions. High prices motivated South American farmers to plant significant area with the two crops, with gains in soybeans in both countries. Weather, however, will dictate whether South America will be able to “reset” global soybean supplies in the spring. Planting conditions were less than favourable. CONAB forecasts Brazil will harvest a record soybean crop of 82.6 million tonnes (a 24% year-over-year increase), which would result in Brazil being the largest soybean producer in the world for the first time. Brazil is also expected to produce a near-record corn crop and be a major exporter for the second consecutive year. In wheat, the IGC predicts that global seeded area in 2013 is likely to be the largest in 15 years.
We believe recent weather-related global trade shifts underscore the necessity for grain origination companies to geographically diversify operations. Companies such as Bunge Limited, with a significant asset footprint in emerging markets, are likely to outperform over the long term, while regional players like The Andersons, Inc. (The Andersons) will likely experience greater earnings volatility. In 2012, there was an increased level of M&A activity, which we believe was partially due to this need to diversify grain origination.
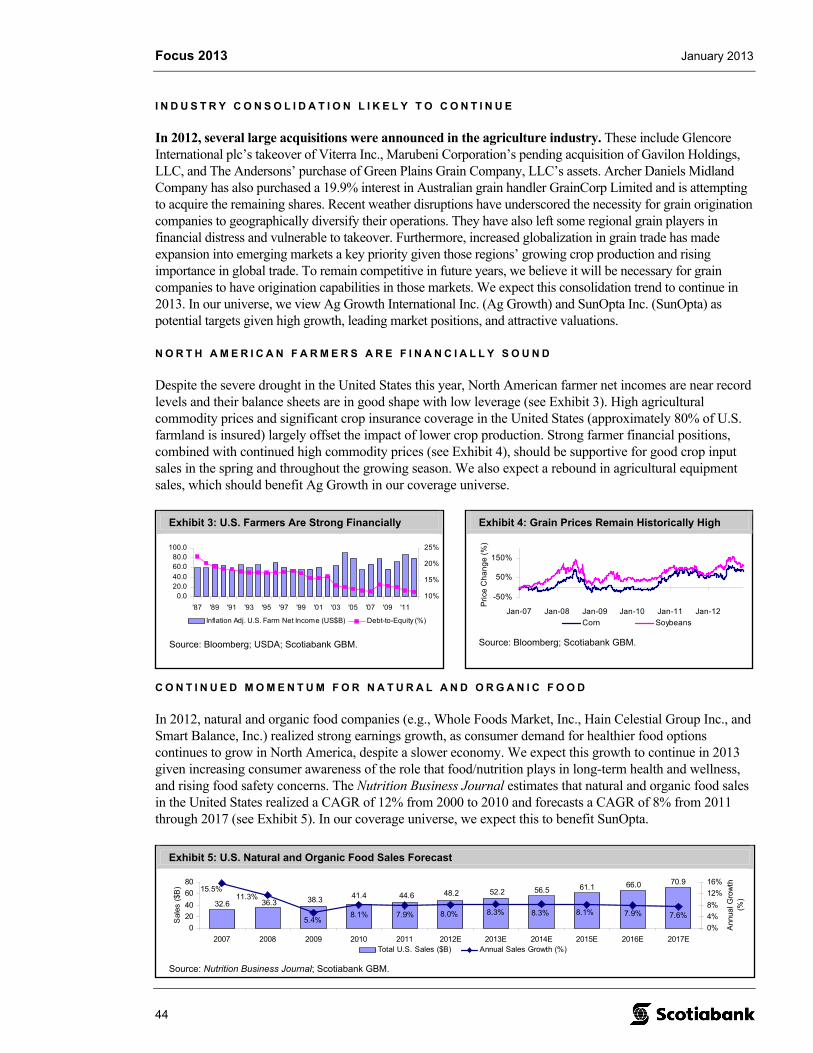
Focus 2013 January 2013
44
Exhibit 3: U.S. Farmers Are Strong Financially
0.020.040.0
60.080.0
100.0
'87 '89 '91 '93 '95 '97 '99 '01 '03 '05 '07 '09 '11
10%
15%
20%
25%
Inflation Adj. U.S. Farm Net Income (US$B) Debt-to-Equity (%)
Source: Bloomberg; USDA; Scotiabank GBM.
Exhibit 4: Grain Prices Remain Historically High
-50%
50%
150%
Jan-07 Jan-08 Jan-09 Jan-10 Jan-11 Jan-12
Pri
ce C
ha
ng
e (
%)
Corn Soybeans
Source: Bloomberg; Scotiabank GBM.
Exhibit 5: U.S. Natural and Organic Food Sales Forecast
41.4
70.9
36.3
66.061.156.552.248.244.638.332.611.3%
7.6%7.9%
15.5%
8.3%8.3%8.0%7.9%8.1%5.4%
8.1%
0
20
40
60
80
2007 2008 2009 2010 2011 2012E 2013E 2014E 2015E 2016E 2017E
Sal
es (
$B)
0%
4%
8%
12%
16%
Ann
ual G
row
th
(%)
Total U.S. Sales ($B) Annual Sales Growth (%)
Source: Nutrition Business Journal; Scotiabank GBM.
I N D U S T R Y C O N S O L I D A T I O N L I K E L Y T O C O N T I N U E
In 2012, several large acquisitions were announced in the agriculture industry. These include Glencore International plc’s takeover of Viterra Inc., Marubeni Corporation’s pending acquisition of Gavilon Holdings, LLC, and The Andersons’ purchase of Green Plains Grain Company, LLC’s assets. Archer Daniels Midland Company has also purchased a 19.9% interest in Australian grain handler GrainCorp Limited and is attempting to acquire the remaining shares. Recent weather disruptions have underscored the necessity for grain origination companies to geographically diversify their operations. They have also left some regional grain players in financial distress and vulnerable to takeover. Furthermore, increased globalization in grain trade has made expansion into emerging markets a key priority given those regions’ growing crop production and rising importance in global trade. To remain competitive in future years, we believe it will be necessary for grain companies to have origination capabilities in those markets. We expect this consolidation trend to continue in 2013. In our universe, we view Ag Growth International Inc. (Ag Growth) and SunOpta Inc. (SunOpta) as potential targets given high growth, leading market positions, and attractive valuations.
N O R T H A M E R I C A N F A R M E R S A R E F I N A N C I A L L Y S O U N D
Despite the severe drought in the United States this year, North American farmer net incomes are near record levels and their balance sheets are in good shape with low leverage (see Exhibit 3). High agricultural commodity prices and significant crop insurance coverage in the United States (approximately 80% of U.S. farmland is insured) largely offset the impact of lower crop production. Strong farmer financial positions, combined with continued high commodity prices (see Exhibit 4), should be supportive for good crop input sales in the spring and throughout the growing season. We also expect a rebound in agricultural equipment sales, which should benefit Ag Growth in our coverage universe.
C O N T I N U E D M O M E N T U M F O R N A T U R A L A N D O R G A N I C F O O D
In 2012, natural and organic food companies (e.g., Whole Foods Market, Inc., Hain Celestial Group Inc., and Smart Balance, Inc.) realized strong earnings growth, as consumer demand for healthier food options continues to grow in North America, despite a slower economy. We expect this growth to continue in 2013 given increasing consumer awareness of the role that food/nutrition plays in long-term health and wellness, and rising food safety concerns. The Nutrition Business Journal estimates that natural and organic food sales in the United States realized a CAGR of 12% from 2000 to 2010 and forecasts a CAGR of 8% from 2011 through 2017 (see Exhibit 5). In our coverage universe, we expect this to benefit SunOpta.
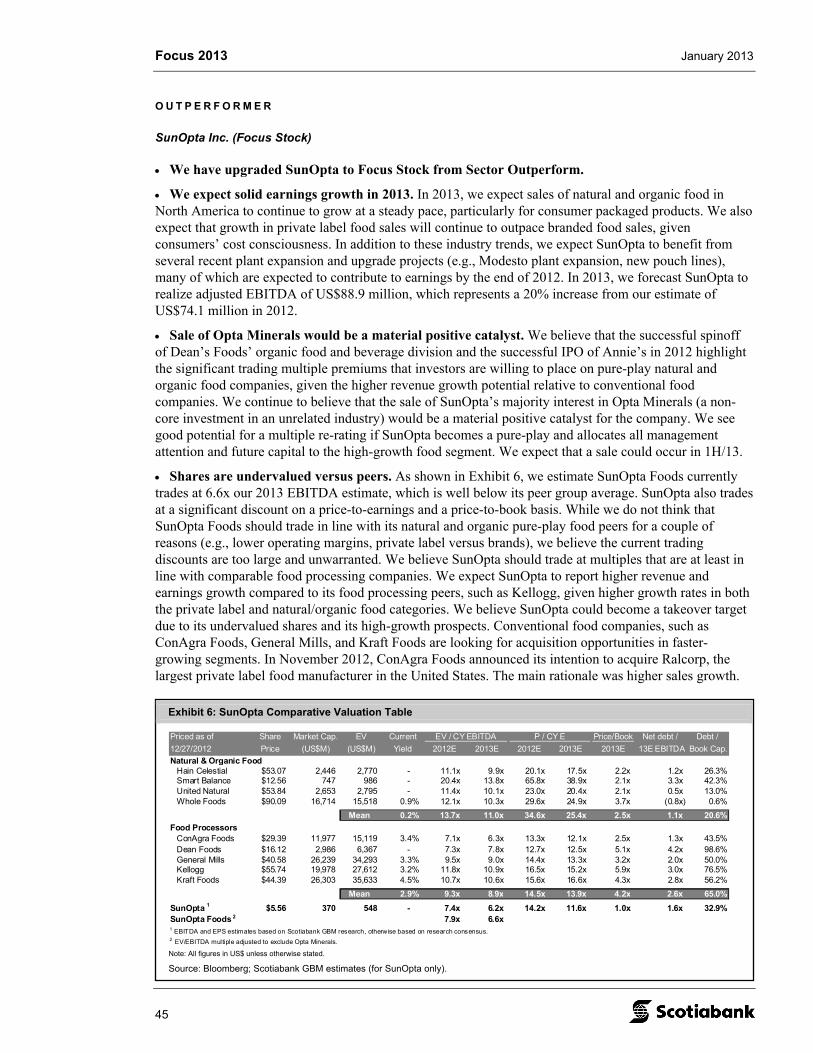
Focus 2013 January 2013
45
Exhibit 6: SunOpta Comparative Valuation Table
Priced as of Share Market Cap. EV Current EV / CY EBITDA P / CY E Price/Book Net debt / Debt /
12/27/2012 Price (US$M) (US$M) Yield 2012E 2013E 2012E 2013E 2013E 13E EBITDA Book Cap.
Natural & Organic FoodHain Celestial $53.07 2,446 2,770 - 11.1x 9.9x 20.1x 17.5x 2.2x 1.2x 26.3%Smart Balance $12.56 747 986 - 20.4x 13.8x 65.8x 38.9x 2.1x 3.3x 42.3%United Natural $53.84 2,653 2,795 - 11.4x 10.1x 23.0x 20.4x 2.1x 0.5x 13.0%Whole Foods $90.09 16,714 15,518 0.9% 12.1x 10.3x 29.6x 24.9x 3.7x (0.8x) 0.6%
Mean 0.2% 13.7x 11.0x 34.6x 25.4x 2.5x 1.1x 20.6%
Food ProcessorsConAgra Foods $29.39 11,977 15,119 3.4% 7.1x 6.3x 13.3x 12.1x 2.5x 1.3x 43.5%Dean Foods $16.12 2,986 6,367 - 7.3x 7.8x 12.7x 12.5x 5.1x 4.2x 98.6%General Mills $40.58 26,239 34,293 3.3% 9.5x 9.0x 14.4x 13.3x 3.2x 2.0x 50.0%Kellogg $55.74 19,978 27,612 3.2% 11.8x 10.9x 16.5x 15.2x 5.9x 3.0x 76.5%Kraft Foods $44.39 26,303 35,633 4.5% 10.7x 10.6x 15.6x 16.6x 4.3x 2.8x 56.2%
Mean 2.9% 9.3x 8.9x 14.5x 13.9x 4.2x 2.6x 65.0%
SunOpta 1 $5.56 370 548 - 7.4x 6.2x 14.2x 11.6x 1.0x 1.6x 32.9%SunOpta Foods 2 7.9x 6.6x 1 EBITDA and EPS estimates based on Scotiabank GBM research, otherwise based on research consensus.2 EV/EBITDA multiple adjusted to exclude Opta Minerals. Note: All figures in US$ unless otherwise stated.
Source: Bloomberg; Scotiabank GBM estimates (for SunOpta only).
O U T P E R F O R M E R
SunOpta Inc. (Focus Stock)
We have upgraded SunOpta to Focus Stock from Sector Outperform.
We expect solid earnings growth in 2013. In 2013, we expect sales of natural and organic food in North America to continue to grow at a steady pace, particularly for consumer packaged products. We also expect that growth in private label food sales will continue to outpace branded food sales, given consumers’ cost consciousness. In addition to these industry trends, we expect SunOpta to benefit from several recent plant expansion and upgrade projects (e.g., Modesto plant expansion, new pouch lines), many of which are expected to contribute to earnings by the end of 2012. In 2013, we forecast SunOpta to realize adjusted EBITDA of US$88.9 million, which represents a 20% increase from our estimate of US$74.1 million in 2012.
Sale of Opta Minerals would be a material positive catalyst. We believe that the successful spinoff of Dean’s Foods’ organic food and beverage division and the successful IPO of Annie’s in 2012 highlight the significant trading multiple premiums that investors are willing to place on pure-play natural and organic food companies, given the higher revenue growth potential relative to conventional food companies. We continue to believe that the sale of SunOpta’s majority interest in Opta Minerals (a non-core investment in an unrelated industry) would be a material positive catalyst for the company. We see good potential for a multiple re-rating if SunOpta becomes a pure-play and allocates all management attention and future capital to the high-growth food segment. We expect that a sale could occur in 1H/13.
Shares are undervalued versus peers. As shown in Exhibit 6, we estimate SunOpta Foods currently trades at 6.6x our 2013 EBITDA estimate, which is well below its peer group average. SunOpta also trades at a significant discount on a price-to-earnings and a price-to-book basis. While we do not think that SunOpta Foods should trade in line with its natural and organic pure-play food peers for a couple of reasons (e.g., lower operating margins, private label versus brands), we believe the current trading discounts are too large and unwarranted. We believe SunOpta should trade at multiples that are at least in line with comparable food processing companies. We expect SunOpta to report higher revenue and earnings growth compared to its food processing peers, such as Kellogg, given higher growth rates in both the private label and natural/organic food categories. We believe SunOpta could become a takeover target due to its undervalued shares and its high-growth prospects. Conventional food companies, such as ConAgra Foods, General Mills, and Kraft Foods are looking for acquisition opportunities in faster-growing segments. In November 2012, ConAgra Foods announced its intention to acquire Ralcorp, the largest private label food manufacturer in the United States. The main rationale was higher sales growth.
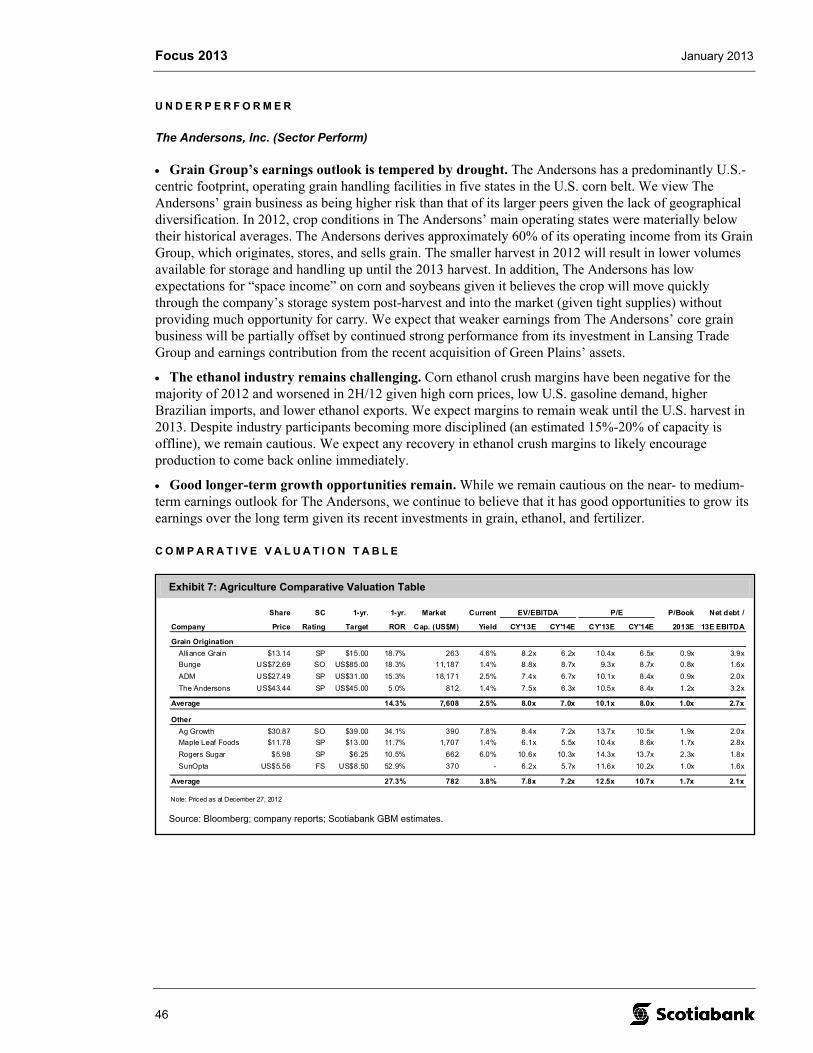
Focus 2013 January 2013
46
Exhibit 7: Agriculture Comparative Valuation Table
Share SC 1-yr. 1-yr. Market Current EV/EBITDA P/E P/Book Net debt /
Company Price Rating Target ROR Cap. (US$M) Yield CY'13E CY'14E CY'13E CY'14E 2013E 13E EBITDA
Grain Origination
Alliance Grain $13.14 SP $15.00 18.7% 263 4.6% 8.2x 6.2x 10.4x 6.5x 0.9x 3.9x
Bunge US$72.69 SO US$85.00 18.3% 11,187 1.4% 8.8x 8.7x 9.3x 8.7x 0.8x 1.6x
ADM US$27.49 SP US$31.00 15.3% 18,171 2.5% 7.4x 6.7x 10.1x 8.4x 0.9x 2.0x
The Andersons US$43.44 SP US$45.00 5.0% 812 1.4% 7.5x 6.3x 10.5x 8.4x 1.2x 3.2x
Average 14.3% 7,608 2.5% 8.0x 7.0x 10.1x 8.0x 1.0x 2.7x
Other
Ag Growth $30.87 SO $39.00 34.1% 390 7.8% 8.4x 7.2x 13.7x 10.5x 1.9x 2.0x
Maple Leaf Foods $11.78 SP $13.00 11.7% 1,707 1.4% 6.1x 5.5x 10.4x 8.6x 1.7x 2.8x
Rogers Sugar $5.98 SP $6.25 10.5% 662 6.0% 10.6x 10.3x 14.3x 13.7x 2.3x 1.8x
SunOpta US$5.56 FS US$8.50 52.9% 370 - 6.2x 5.7x 11.6x 10.2x 1.0x 1.6x
Average 27.3% 782 3.8% 7.8x 7.2x 12.5x 10.7x 1.7x 2.1x
Note: Priced as at December 27, 2012
Source: Bloomberg; company reports; Scotiabank GBM estimates.
U N D E R P E R F O R M E R
The Andersons, Inc. (Sector Perform)
Grain Group’s earnings outlook is tempered by drought. The Andersons has a predominantly U.S.-centric footprint, operating grain handling facilities in five states in the U.S. corn belt. We view The Andersons’ grain business as being higher risk than that of its larger peers given the lack of geographical diversification. In 2012, crop conditions in The Andersons’ main operating states were materially below their historical averages. The Andersons derives approximately 60% of its operating income from its Grain Group, which originates, stores, and sells grain. The smaller harvest in 2012 will result in lower volumes available for storage and handling up until the 2013 harvest. In addition, The Andersons has low expectations for “space income” on corn and soybeans given it believes the crop will move quickly through the company’s storage system post-harvest and into the market (given tight supplies) without providing much opportunity for carry. We expect that weaker earnings from The Andersons’ core grain business will be partially offset by continued strong performance from its investment in Lansing Trade Group and earnings contribution from the recent acquisition of Green Plains’ assets.
The ethanol industry remains challenging. Corn ethanol crush margins have been negative for the majority of 2012 and worsened in 2H/12 given high corn prices, low U.S. gasoline demand, higher Brazilian imports, and lower ethanol exports. We expect margins to remain weak until the U.S. harvest in 2013. Despite industry participants becoming more disciplined (an estimated 15%-20% of capacity is offline), we remain cautious. We expect any recovery in ethanol crush margins to likely encourage production to come back online immediately.
Good longer-term growth opportunities remain. While we remain cautious on the near- to medium-term earnings outlook for The Andersons, we continue to believe that it has good opportunities to grow its earnings over the long term given its recent investments in grain, ethanol, and fertilizer.
C O M P A R A T I V E V A L U A T I O N T A B L E
Focus 2013 January 2013
Kevin Choquette, CFA (416) 863-2874 Fadi Habib, MBA, CFA (416) 863-7076 (Scotia Capital Inc. – Canada) (Scotia Capital Inc. – Canada) [email protected] Marco Giurleo (416) 863-7843 (Scotia Capital Inc. – Canada)
47
Banks, Americas
Refocused Banking System – Return of Capital – Valuation Recovery
C A N A D I A N B A N K S
We maintain our overweight Canadian banks recommendation versus the TSX and neutral versus the U.S. major banks in 2013. Our overweight recommendation is based on low P/E multiples, high dividend yields, high capital levels and capital generation rates, superior profitability, and resilient business models. We continue to believe substantial upside exists for P/E multiple expansion in a period of low systemic risk and based on the expected redeployment of excess capital into significant share repurchases, accelerating EPS growth. We also believe Canadian banks with quasi-global wholesale platforms are well positioned to gain market share, especially relative to European banks, due to their favourable capital positions, reputation, credit ratings, and a more constructive regulatory environment. We believe Royal Bank of Canada (RY) is best positioned to gain market share and Bank of Nova Scotia (BNS), Bank of Montreal (BMO), and Toronto Dominion Bank (TD) to a lesser extent.
Canadian banks continue to be challenged by the persistent low interest rate environment, increasing concerns over a housing market correction and slower consumer loan growth, heightened systemic risk, and the global regulatory and political fallout. However, despite the challenges, bank stocks outperformed the TSX in 2012. Bank earnings and dividends both increased 9% in 2012, with profitability near record levels with RRWA of 2.48% and ROE of 18.8%. Capital ratios have improved by 49% since 2007 and Basel III capital requirements have been met; however, bank risk premiums relative to Canadian BBB corporate bonds remain at an all-time high.
Also, with respect to the housing market in Canada, we have analyzed the banks’ exposure to a housing correction, concluding that price declines should be very manageable for Canadian banks given their strong earnings, high levels of profitability, and the quality of their residential mortgage portfolios, with average LTVs at 54%.
Canadian bank share prices are outperforming the TSX, increasing 12% YTD versus the TSX at 4% while yielding 1.2% more in dividends; however, they are underperforming the major U.S. banks, which increased 45% as they recovered from extremely depressed financial crisis levels. The outperformance versus the TSX was despite heightened systemic risk and recurring negative headlines related to Canadian housing prices. We believe that the Canadian banks will continue to outperform the TSX in 2013, with our expected total return of 18%.
Earnings Estimates
We are forecasting earnings growth of 6.5% in 2013. Earnings growth is expected to be led by wholesale banking as capital markets activity normalizes and Canadian banks gain market share. Wealth management earnings growth is also expected to be solid. We expect domestic retail banking earnings growth to be 5%-7%, with moderate loan growth and a slower rate of margin compression. Domestic retail banking earnings are becoming more dependent on the NIM stabilizing as volume growth slows. We believe cost controls will be a major focus for the banks in this segment.
Focus 2013 January 2013
48
Profitability for the group is expected to remain strong in 2013. We are forecasting ROE of 18.0%, RTBV of 23.3%, and RRWA of 2.33%.
Domestic Retail NIM
Retail NIM will continue to be a focus as we believe margin pressures will persist in 2013, with interest rates expected to remain at very low levels. We continue to forecast net interest margin compression of 2 bps per quarter out to the end of 2013. More rational pricing is required to mitigate some of the margin pressures. However, we note that there has been a moderation in the rate of retail margin compression in recent quarters, aided by a consumer preference shift to fixed-rate mortgages. The potential for moderating margin compression may provide upside to earnings.
Loan Growth Moderating
Domestic retail loan growth is expected to moderate as we expect residential mortgages and other personal loans to grow at a slower pace. We believe the growth in residential mortgages will continue at rates similar to overall nominal GDP growth. However, we believe business and commercial loan growth will remain strong.
Strong Capital – Share Repurchases – Dividend Increases
Common Equity Tier 1 (CET1) for the bank group was 8.2% at the end of Q4/12, with all the banks already above the 7.0% minimum requirement for Q1/13 as set by the Office of the Superintendent of Financial Institutions (OSFI). The Canadian banks also remained off the Financial Stability Board (FSB) list of global systemically important financial intuitions (G-SIFIs). G-SIFIs require a 1.0%-2.5% buffer above the 7.0% CET1 ratio. While this is positive for Canadian banks, we continue to expect the implementation of a national SIFI buffer in Canada of 1.0% and banks are likely to maintain a further 50 bps cushion for an operating minimum of 8.5%.
We believe the banks’ strong capital positions in addition to their very strong capital generation rates (RRWA) will lead to further and more substantial share repurchases in 2013. RY, Canadian Imperial Bank of Commerce (CM), and BMO each announced their intention to repurchase 2% of shares outstanding. These announcements are in line with our thesis that share repurchases will become a dominant theme for Canadian banks over the next five to 10 years. The size of the announced share repurchases is still modest, but we expect them to increase to 5%+ of shares outstanding by 2014, leading to a 5%+ accretion to earnings on a run-rate basis. We continue to believe CM is the best positioned for substantial share repurchases given its industry-high capital generation rate and CET1.
We also believe the Canadian banks will continue their strong track record of dividend increases in 2013, with increases expected to be in line with earnings growth in the 6%-8% range.
Valuation
We believe the bank group’s valuation is very compelling, both on an absolute and a relative basis. On an absolute basis, bank P/E multiples, we believe, are attractive at 10.7x and 9.8x our 2013 and 2014 earnings estimates, respectively. Additionally, bank earnings yield relative to Canadian corporate BBB bonds is higher than in Financial Crisis I (Lehman Brothers collapse), which is reflective of the level of systemic risk persistent in bank valuations.
Bank dividend yield remains very attractive at 4.1% and is 5.3 standard deviations above its historical mean versus 10-year bond yields, also higher than it was in Financial Crisis I. Bank dividend yields are also extremely compelling versus other high-dividend-paying sectors, with bank yields 0.6 standard deviations above the mean versus Pipes & Utilities and 2.1 against REITs.
Focus 2013 January 2013
49
U . S . B A N K S
U.S. major bank share prices have significantly outperformed in 2012, increasing 45% compared to the S&P 500 at 13%, KBW at 29%, Canadian banks at 12%, and the S&P/TSX at 4%. We believe that the U.S. major banks will continue to outperform in 2013, with our expected total return of 20%. We maintain our overweight U.S. major banks recommendation against the S&P 500 and neutral versus the Canadian banks. On a North American bank basis, we continue to recommend in order Citigroup Inc. (C), CM, JPMorgan Chase & Co. (JPM), and RY.
Our overweight recommendation is based on significantly depressed valuations and the major strengthening in balance sheets since the financial crisis. We believe the recovery in the U.S. banking system is well underway. The banking system is refocusing on its core businesses, divesting its high risk/low return marginal businesses, reducing toxic assets, reducing long-term debt, beginning to manage risk-weighted assets, and actively managing capital. We also see banks with strong competitive positioning doing better as there has been some rationalization in the industry as well as European banks and non-bank financial companies exiting and smaller banks being more challenged.
The banking environment from an earnings and profitability standpoint remains challenging given the low level of interest rates and high regulatory burden. However, the industry is focusing on margin pressure mitigation, operating efficiency, and expense management and execution, which we believe gives the banking industry strong positive earnings leverage to an improving economy and higher interest rates. We believe, even at current profitability levels, that the banks warrant higher P/E multiples and that a highly capitalized and more focused and efficient industry is emerging.
We are forecasting reported earnings for the major U.S. banks to increase 55% in 2013 or 19% on an operating basis. Our earnings forecast is based on modest margin compression, offset by earning asset growths, continued strength in the mortgage market, improving credit quality, and solid growth in capital markets revenue, especially for the strong players such as C and JPM. In terms of profitability, in 2013 we are forecasting ROE of 10.4%, RTBV of 13.6%, and RRWA of 1.31%.
Capital Markets Activity to Improve – Bears at the Bottom
We believe the major U.S. banks are well positioned to gain market share in capital markets, especially against the European banks. We expect capital markets revenue to grow in the high single to low double digits in 2013. We expect minimal revenue impact from the Volker rule as most of the big banks have already downsized or eliminated there proprietary trading operations, although monitoring/compliance infrastructure costs are expected to increase.
The retrenchment of a number of global players such as UBS in fixed income, with over 3% market share in global bond underwriting, and the BNP Paribas sale of its U.S. energy business will likely result in better pricing and higher revenue growth for the strong committed players. Also, the Vickers Commission in the U.K. and potential further downsizing by European banks could be beneficial to the likes of C and JPM. Hence, we have a positive bias for wholesale versus retail businesses at this point, although we acknowledge that retail has been a more shareholder-friendly business over the long term.
Mortgage Market – Strong – Momentum Challenging in 2H/13
Mortgage banking will continue to be a key driver of earnings in 2013, driven by strengthening home prices and higher levels of resale/purchase activity and continued high refinancing activity, perhaps in the first half. Mortgage origination is currently very dependent on refinancing activity, accounting for 70% of total originations.
Focus 2013 January 2013
50
However, we expect purchase activity improvements to struggle to keep pace with the expected decline in refinancing activity. We also expect underwater homeowners to continue to take advantage of the Home Affordable Refinance Program (HARP), keeping related refinancing volumes robust. For the first eight months of 2012, HARP refinancings made up 21% of government-sponsored enterprise (GSE) refinancings. Overall, total originations will struggle to stay flat. The 30-year mortgage rates are near historical lows at 3.38%, down from 4.07% a year earlier and over 8% in 2000.
The other driver for mortgage banking revenue has been exceptionally high and not sustainable spreads. The 30-year mortgage and 30-year agency mortgage-backed security (MBS) rate spread is 1.27%, below the all-time September high of 1.65% but significantly above the mean spread of 0.66% (2000-2012). Thus, spreads are expected to decline with volumes challenging. Hence, we are cautious on the banks that have benefitted from the 2012 spike in mortgage banking revenue, mainly Wells Fargo & Company (WFC) and U.S. Bancorp (USB).
Expense Management
Expense management will continue to be a focus for the industry in 2013. During 2012, many of the banks made significant progress on expenses with targeted programs (Project New BAC, Compass, C’s Repositioning Actions, etc.). In 2013, we believe productivity ratios will remain noisy but that we should see year-over-year (YOY) improvement. We believe that any additional decreases in head count will be dictated by overall market conditions.
Capital Management
The major U.S. banks have improved their capital positions by more than 50% since 2007. The CET1 fully loaded at the end of Q3/12 was 8.4%. The FSB disclosed its list of banks considered to be G-SIFIs, which require additional capital buffers above the 7.0% minimum. JPM and C will need to hold an additional 2.5%, Bank of America (BAC) 1.5% and WFC 1.0%. The results from the 2013 Comprehensive Capital Analysis and Review (CCAR) are expected to be released in March 2013 (submission deadline is January 7, 2013) and we expect it will result in dividend increases and share repurchases. We expect share repurchases to be a very positive theme for banks over the next five years.
Litigation and Repurchases
Litigation related to MBS will likely continue to create noise for the industry. It is likely that we have not seen the end of civil suits related to MBS improprieties brought against the banks by government agencies.
We will also be looking for a precedent on whether banks must repurchase loans where more than 24 months of payments were made before the loans became delinquent. A finding against the banks could result in a substantial increase in repurchase losses. Unresolved repurchase claims outstanding for the five banks ended Q3/12 at $31.6 billion compared to $30.4 billion the previous quarter and $16.7 billion a year earlier. The unresolved claims of $31.6 billion compares to reserves of $22.9 billion.
Focus 2013 January 2013
51
O U T P E R F O R M E R S
Citigroup Inc. (Focus Stock)
High-Growth Platform in Emerging Markets We have upgraded C to Focus Stock from Sector Outperform.
C is our top pick in the U.S. bank group and our North American coverage universe. C has compelling valuation and a global platform positioned in high-growth markets and large deferred tax assets (DTA).
C has a true global footprint in banking, with a significant presence in higher-growth emerging markets, with Asia and LatAm representing 55% of operating earnings.
C has compelling valuation of 74% of tangible book value and 8.0x 2013 earnings estimate or as low as 5.3x to 6.6x, depending on the utilization of the large DTA (represents 50% of market capitalization). Also, Banamex would represent one-quarter of C market capitalization.
C has a strong capital position, with CET1 of 8.6%, and we expect C to be successful with its 2013 CCAR submission, resulting in a dividend increase as early as Q2/13, estimated at $0.80 per annum. We also expect it will be allowed to begin share repurchases, which are positive catalysts for the stock.
Canadian Imperial Bank of Commerce (Focus Stock)
Return of Capital to Shareholders We have upgraded CM to Focus Stock from Sector Outperform.
We expect CM to lead the Canadian banks in return of capital to shareholders due to its industry-high capital position (9.0% as at Q4/12) and capital generation rate, with CM’s 2013E RRWA leading the Canadian bank group at 2.90% versus 2.33% for the group. The high capital and capital generation rate (RRWA) are expected to be the major drivers for significant share repurchases, which could add up to an accretion of $2.00 per share by 2015. This has the potential to add $20-$30 to CM’s share price by 2015. Despite CM’s excellent position to return capital to shareholders and its industry-high profitability, with expected 2013 ROE of 22.2%, the stock trades at a 15% discount to the group based on our 2013 earnings estimates.
Additionally, we believe CM has earnings upside potential from its Wholesale and Retail banking platforms. CM’s Wholesale earnings are recovering from Financial Crisis I, aided by strong corporate lending, with corporate loans up 24% YOY. We believe CM has further earnings growth potential in the segment as it places more focus on expanding its Wholesale platform. On the Retail side, CM has the potential to gain market share in various retail and business banking products as it has an 18.6% market share in terms of a domestic branch network, yet only 8.2% market share in CIBC-branded mortgages. CM’s decision to exit the mortgage broker channel and focus on optimizing its underutilized branch distribution network, we believe, provides upside potential for the stock.
Focus 2013 January 2013
52
U N D E R P E R F O R M E R
Bank of Montreal (Sector Underperform)
Low Profitability We expect BMO to underperform the Canadian banks due to its high relative P/E multiple given its low profitability. We expect BMO to have an ROE of 15.0% in 2013, the lowest of the Canadian bank group. Additionally, BMO has the lowest capital generation rate of the Canadian bank group, with expected 2013 RRWA of 1.82%, almost 110 bps lower than the industry leader. However, the bank’s P/E discount to the group is a modest 9% despite significantly lower profitability.
Additionally, BMO’s Retail platform in Canada has been challenged, especially with increased competition in commercial lending, which has been its stronghold. BMO also has higher operating risk related to the Marshall & Ilsley Corporation (M&I) acquisition and it remains to be seen whether BMO has the ability to manage and grow the business profitably.
BMO’s earnings in 2012 benefited from significant recoveries of provisions for credit losses on M&I purchased credit-impaired loans, which added $509 million or $0.48 per share to earnings. The M&I purchased credit-impaired portfolio has a $445 million mark remaining, which is expected to be recovered over the next two years. This implies a quarterly run rate of $0.06 per share over the next eight quarters, versus $0.13 per share in Q4/12. The decline in recoveries, while expected to be gradual, should result in lower earnings growth due to tough comps.
53
Focus 2013 January 2013
Exh
ibit
1:
Can
ad
ian
Ban
ks C
om
par
ati
ve V
alu
ati
on
Ta
ble
Pric
e
52
-Wee
k
D
ivid
ends
Pa
yout
Rece
ntP
POp
erat
ing
EPS
Perc
enta
ge C
hang
eSy
mbo
l12
/27/
12Hi
ghLo
wIn
dYi
eld
RBY
Ratio
BV
TBV
/BV
/TBV
2011
A20
12A
LTM
2013
E20
14E
11/1
212
A/13
E13
E/14
E(1
)(2
)(3
)(4
)(5
)(6
)(7
)(8
)(9
)(1
0)(1
1)(1
2)(1
3)(1
4)(1
5)(1
6)(1
7)(1
8)(1
9)(2
0)
Bank
of M
ontr
eal
BM
O$6
0.82
$61.
32$5
3.15
$2.8
84.
7%26
8%46
%$4
0.25
$32.
1515
1%18
9%$5
.10
$6.0
0$6
.00
$6.2
0$6
.60
17.5
%3.
4%6.
5%Ba
nk o
f Nov
a Sc
otia
BNS
$58.
49$5
8.73
$50.
07$2
.28
3.9%
220%
45%
$29.
76$2
2.42
197%
261%
$4.3
1$4
.76
$4.7
6$5
.10
$5.6
010
.4%
7.1%
9.8%
CIBC
CM$8
0.95
$82.
61$6
9.13
$3.7
64.
6%26
2%43
%$3
7.48
$31.
6521
6%25
6%$7
.57
$8.0
7$8
.07
$8.8
0$9
.50
6.6%
9.0%
8.0%
Nat
iona
l Ban
kN
A$7
7.25
$81.
27$7
0.92
$3.3
24.
3%24
3%40
%$4
0.04
$28.
6219
3%27
0%$7
.18
$7.8
6$7
.86
$8.3
0$8
.80
9.5%
5.6%
6.0%
Roya
l Ban
kRY
$6
0.05
$60.
85$4
8.70
$2.4
04.
0%22
6%44
%$2
7.31
$20.
2722
0%29
6%$4
.66
$5.0
0$5
.00
$5.4
0$5
.90
7.3%
8.0%
9.3%
Toro
nto-
Dom
inio
n Ba
nkTD
$83.
27$8
5.85
$74.
00$3
.08
3.7%
209%
39%
$48.
17$3
3.56
173%
248%
$6.8
6$7
.41
$7.4
1$7
.80
$8.5
08.
0%5.
3%9.
0%La
uren
tian
Bank
LB$4
4.44
$48.
50$4
0.66
$1.9
64.
4%24
9%37
%$4
4.02
$36.
0610
1%12
3%$4
.93
$4.9
8$4
.98
$5.3
0$5
.90
1.0%
6.4%
11.3
%Ca
nadi
an W
este
rn B
ank
CWB
$28.
48$3
0.10
$25.
17$0
.68
2.4%
135%
27%
$15.
94$1
4.96
179%
190%
$2.1
7$2
.30
$2.3
0$2
.50
$2.8
06.
0%8.
7%12
.0%
Cana
dian
Ban
k In
dex
CDN
BNK
25,1
2925
,129
20,3
381,
024
4.1%
230%
43%
12,9
869,
724
194%
258%
2,09
12,
286
2,28
62,
426
2,63
79.
6%6.
5%8.
7%
P/E
Rel t
oTa
rget
Inve
st-
Shar
esM
arke
tM
kt.
Base
lRT
BVRR
WA
C
ash
Retu
rn o
n Eq
uity
P
/E R
atio
s (x
)
CD
NBNK
P/
E Re
l to
Shar
eTo
tal
men
tO/
SCa
pita
lW
ts.
III
2013
E20
13E
2012
A20
13E
2014
ELT
M20
13E
2014
ELT
M20
13E
2014
E20
13E
CDN
BNK
Pric
eRO
RRe
c1M
$B%
CET1
(21)
(22)
(23)
(24)
(25)
(26)
(27)
(28)
(29)
(30)
(31)
(32)
(33)
(34)
(35)
(36)
(37)
(38)
(39)
(40)
Bank
of M
ontr
eal
18.5
%1.
82%
15.5
%15
.0%
14.6
%10
.19.
89.
288
%91
%93
%10
.686
%$6
613
%SU
650.
7$3
9.6
2.65
8.7%
Bank
of N
ova
Scot
ia21
.1%
2.17
%17
.9%
16.2
%16
.1%
12.3
11.5
10.4
111%
110%
109%
12.7
106%
$65
15%
SP11
84.0
$69.
34.
627.
4%CI
BC26
.0%
2.90
%22
.6%
22.2
%21
.1%
10.0
9.2
8.5
87%
85%
86%
11.4
93%
$100
28%
FS40
4.5
$32.
72.
249.
0%N
atio
nal B
ank
27.0
%2.
20%
20.7
%19
.8%
18.6
%9.
89.
38.
886
%87
%89
%10
.687
%$8
818
%SU
162.
0$1
2.5
0.84
7.3%
Roya
l Ban
k25
.2%
2.33
%19
.6%
19.0
%18
.7%
12.0
11.1
10.2
108%
106%
105%
13.0
109%
$70
21%
SO14
45.3
$86.
85.
868.
4%To
ront
o-Do
min
ion
Bank
22.0
%2.
55%
16.3
%15
.6%
15.4
%11
.210
.79.
899
%10
0%10
0%12
.210
0%$9
518
%SP
916.
1$7
6.3
5.14
8.2%
Laur
entia
n Ba
nk14
.1%
1.01
%11
.8%
11.7
%12
.0%
8.9
8.4
7.5
79%
79%
77%
9.6
79%
$51
19%
SP28
.1$1
.20.
087.
4%Ca
nadi
an W
este
rn B
ank
16.5
%1.
33%
15.6
%14
.9%
15.0
%12
.411
.410
.210
9%10
7%10
4%13
.210
8%$3
318
%SP
78.7
$2.2
0.15
8.1%
Cana
dian
Ban
k In
dex
23.3
%2.
33%
18.8
%18
.0%
17.4
%11
.410
.79.
812
.228
,700
18%
OWT
$320
.621
.60
8.2%
CDN
BNK
P/E
Rela
tive:
LTM
2013
E20
14E
P/BV
P/TB
VP/
TBV
PE/
ROE
Pric
e Pe
rform
ance
Cana
daU.
S.U
SBN
K95
%11
4%12
2%RR
WA
2RR
WA2
RTBV
220
13E
2014
E20
1020
11YT
D10
Yr B
ond
Yiel
d1.
77%
1.71
%U
.S. B
anks
98%
103%
104%
BMO
8310
410
.20.
650.
633%
-3%
9%3M
T-B
ill0.
93%
0.05
%U
.S. R
egio
nals
92%
91%
87%
BNS
9012
012
.40.
710.
6516
%-1
1%15
%Yi
eld
Curv
e0.
84%
1.65
%Cd
n Li
feco
s97
%10
5%10
3%CM
7488
9.9
0.41
0.40
15%
-6%
10%
Prim
e Ra
te3.
00%
3.25
%Pi
pes
& U
tiliti
es50
%54
%53
%N
A88
123
10.0
0.47
0.47
14%
5%7%
S&P/
TSX/
S&P
500
Div
Yie
ld2.
98%
2.25
%
S&P/
TSX
76%
77%
73%
RY94
127
11.7
0.58
0.54
-7%
-1%
16%
GDP
(201
3E) -
Dec
/12
1.7%
2.0%
Bank
Ear
ning
s Yl
d/10
Yrs
4.97
5.30
5.77
TD68
9711
.30.
680.
6313
%3%
9%GD
P (2
014E
) - D
ec/1
22.
3%2.
5%Ba
nk D
iv Y
ield
Rel
to S
&P/T
SX (M
ean
1.45
)1.
37LB
100
122
8.7
0.72
0.63
12%
0%-7
%R
BY -
Bank
Div
Yie
ld R
el to
10-
Yr B
ond
Yiel
d (M
ean
60%
, +/-1
SD 8
5%/3
4%)
Bank
Div
Yie
ld R
el to
Pip
es &
Util
ities
(Mea
n 0.
79)
0.96
CWB
135
144
11.5
0.76
0.68
29%
-9%
10%
Div
iden
d Pa
yout
Rat
io o
n Ca
sh 2
012E
(Mea
n 41
%, +
/- 1
SD
53%
/29%
)
Bank
Div
Yie
ld R
el to
REI
Ts (M
ean
0.44
)0.
88CD
NBN
K83
111
11.1
0.59
0.56
6%-3
%12
%B
ank
Earn
ings
Yie
ld R
el to
10-
Yr B
ond
Yiel
d (M
ean
1.45
, +/-1
SD
1.9
6/0.
95)
220
13E.
IFRS
beg
inni
ng 2
011
S&P/
TSX
14%
-11%
4%1 FS
-Foc
us S
tock
, SO
-Sec
tor O
utpe
rfor
m, S
P-Se
ctor
Per
form
,
SU-
Sect
or U
nder
perfo
rm.
Sou
rce:
Reu
ters
; Com
pany
repo
rts;
Sco
tiaba
nk G
BM e
stim
ates
; IBE
S es
timat
es fo
r U.S
. Ban
ks a
nd C
anad
ian
Life
cos.
OW
T-O
verw
eigh
t, R
-Res
trict
edKe
vin
R. C
hoqu
ette
, CFA
C O M P A R A T I V E V A L U A T I O N T A B L E S
9.5%
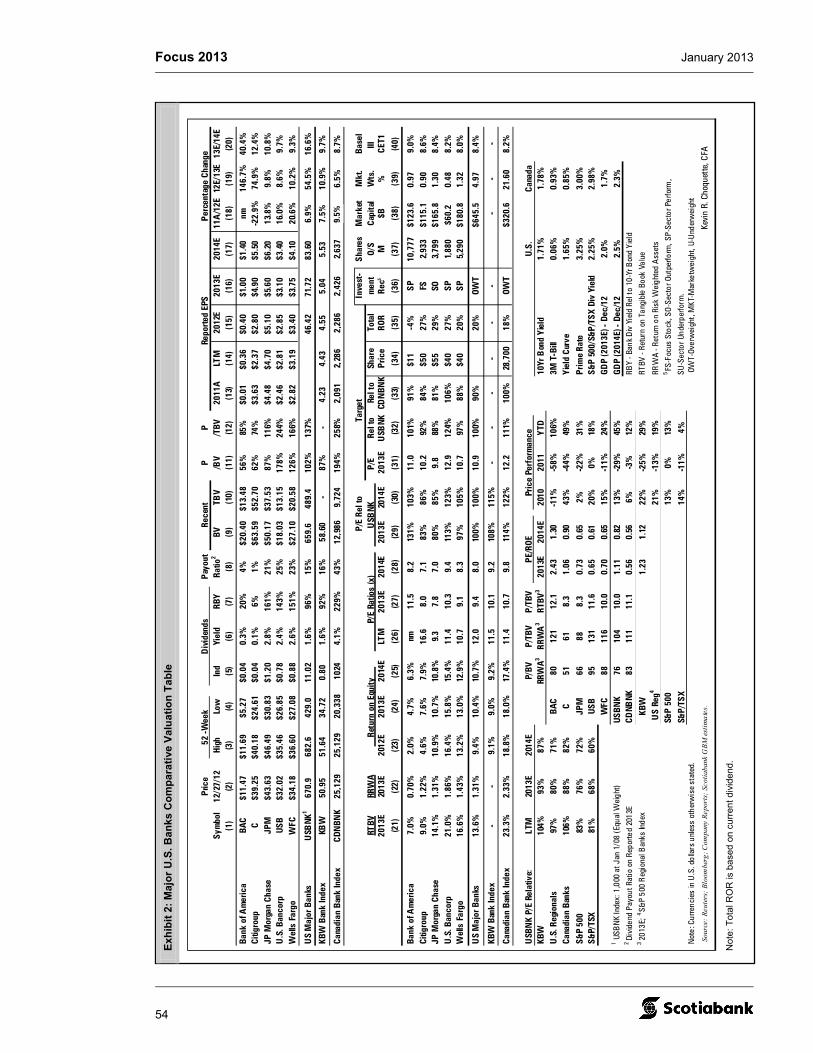
Focus 2013 January 2013
54
Exh
ibit
2:
Maj
or
U.S
. Ban
ks
Co
mp
ara
tive
Val
ua
tio
n T
ab
le
Pric
e
52
-Wee
k
D
ivid
ends
Pa
yout
Rece
ntP
PRe
porte
d EP
SPe
rcen
tage
Cha
nge
Sym
bol
12/2
7/12
High
Low
Ind
Yiel
dRB
YRa
tio2
BVTB
V/B
V/T
BV20
11A
LTM
2012
E20
13E
2014
E11
A/1
2E12
E/13
E13
E/14
E(1
)(2
)(3
)(4
)(5
)(6
)(7
)(8
)(9
)(1
0)(1
1)(1
2)(1
3)(1
4)(1
5)(1
6)(1
7)(1
8)(1
9)(2
0)
Bank
of A
mer
ica
BAC
$11.
47$1
1.69
$5.2
7$0
.04
0.3%
20%
4%$2
0.40
$13.
4856
%85
%$0
.01
$0.3
6$0
.40
$1.0
0$1
.40
nm14
6.7%
40.4
%Ci
tigro
upC
$39.
25$4
0.18
$24.
61$0
.04
0.1%
6%1%
$63.
59$5
2.70
62%
74%
$3.6
3$2
.37
$2.8
0$4
.90
$5.5
0-2
2.9%
74.9
%12
.4%
JP M
orga
n Ch
ase
JPM
$43.
63$4
6.49
$30.
83$1
.20
2.8%
161%
21%
$50.
17$3
7.53
87%
116%
$4.4
8$4
.70
$5.1
0$5
.60
$6.2
013
.8%
9.8%
10.8
%U
.S. B
anco
rpUS
B$3
2.02
$35.
46$2
6.85
$0.7
82.
4%14
3%25
%$1
8.03
$13.
1517
8%24
4%$2
.46
$2.8
1$2
.85
$3.1
0$3
.40
16.0
%8.
6%9.
7%W
ells
Far
goW
FC$3
4.18
$36.
60$2
7.08
$0.8
82.
6%15
1%23
%$2
7.10
$20.
5812
6%16
6%$2
.82
$3.1
9$3
.40
$3.7
5$4
.10
20.6
%10
.2%
9.3%
US
Maj
or B
anks
USB
NK1
670.
968
2.6
429.
011
.02
1.6%
96%
15%
659.
648
9.4
102%
137%
$42.
73$4
2.82
46.4
271
.72
83.6
06.
9%54
.5%
16.6
%
KBW
Ban
k In
dex
KBW
50.9
551
.64
34.7
20.
801.
6%92
%16
%58
.60
-87
%-
4.23
4.43
4.55
5.04
5.53
7.5%
10.9
%9.
7%
Cana
dian
Ban
k In
dex
CDN
BNK
25,1
2925
,129
20,3
3810
244.
1%22
9%43
%12
,986
9,72
419
4%25
8%2,
091
2,28
62,
286
2,42
62,
637
9.6%
6.5%
8.7%
Ta
rget
Inve
st-
Shar
esM
arke
tM
kt.
Base
lRT
BVRR
WA
R
etur
n on
Equ
ity
P/E
Rat
ios
(x)
P/
E Re
l to
Rel t
oSh
are
Tota
lm
ent
O/S
Capi
tal
Wts
.III
20
13E
2013
E20
12E
2013
E20
14E
LTM
2013
E20
14E
2013
E20
14E
2013
EU
SBNK
CDN
BNK
Pric
eRO
RRe
c5M
$B%
CET1
(21)
(22)
(23)
(24)
(25)
(26)
(27)
(28)
(29)
(30)
(31)
(32)
(33)
(34)
(35)
(36)
(37)
(38)
(39)
(40)
Bank
of A
mer
ica
7.0%
0.70
%2.
0%4.
7%6.
3%nm
11.5
8.2
131%
103%
11.0
101%
91%
$11
-4%
SP10
,777
$123
.60.
979.
0%Ci
tigro
up9.
0%1.
22%
4.6%
7.6%
7.9%
16.6
8.0
7.1
83%
86%
10.2
92%
84%
$50
27%
FS2,
933
$115
.10.
908.
6%JP
Mor
gan
Chas
e14
.1%
1.31
%10
.9%
10.7
%10
.8%
9.3
7.8
7.0
80%
85%
9.8
88%
81%
$55
29%
SO3,
799
$165
.81.
308.
4%U
.S. B
anco
rp21
.0%
1.86
%16
.4%
15.8
%15
.4%
11.4
10.3
9.4
113%
123%
12.9
124%
106%
$40
27%
SP1,
880
$60.
20.
488.
2%W
ells
Far
go16
.6%
1.43
%13
.2%
13.0
%12
.9%
10.7
9.1
8.3
97%
105%
10.7
97%
88%
$40
20%
SP5,
290
$180
.81.
328.
0%
US
Maj
or B
anks
13.6
%1.
31%
9.4%
10.4
%10
.7%
12.0
9.4
8.0
100%
100%
10.9
100%
90%
20%
OWT
$645
.54.
978.
4%
KBW
Ban
k In
dex
--
9.1%
9.0%
9.2%
11.5
10.1
9.2
108%
115%
--
--
--
--
-
Cana
dian
Ban
k In
dex
23.3
%2.
33%
18.8
%18
.0%
17.4
%11
.410
.79.
811
4%12
2%12
.211
1%10
0%28
,700
18%
OWT
$320
.621
.60
8.2%
USB
NK
P/E
Rela
tive:
LTM
2013
E20
14E
P/BV
P/TB
VP/
TBV
PE/
ROE
Pric
e Pe
rfor
man
ce
U.
S.Ca
nada
KBW
104%
93%
87%
RRW
A3RR
WA
3RT
BV3
2013
E20
14E
2010
2011
YTD
10Yr
Bon
d Yi
eld
1.71
%1.
78%
U.S
. Reg
iona
ls97
%80
%71
%BA
C80
121
12.1
2.43
1.30
-11%
-58%
106%
3M T
-Bill
0.06
%0.
93%
Cana
dian
Ban
ks10
6%88
%82
%C
5161
8.3
1.06
0.90
43%
-44%
49%
Yiel
d Cu
rve
1.65
%0.
85%
S&P
500
83%
76%
72%
JPM
6688
8.3
0.73
0.65
2%-2
2%31
%Pr
ime
Rate
3.25
%3.
00%
S&P/
TSX
81%
68%
60%
USB
9513
111
.60.
650.
6120
%0%
18%
S&P
500/
S&P/
TSX
Div
Yiel
d2.
25%
2.98
%W
FC88
116
10.0
0.70
0.65
15%
-11%
24%
GDP
(201
3E) -
Dec
/12
2.0%
1.7%
1 USB
NK
Inde
x: 1
,000
at J
an 1
/08
(Equ
al W
eigh
t)US
BNK
7610
410
.01.
110.
8213
%-2
9%45
%GD
P (2
014E
) - D
ec/1
22.
5%2.
3%2
Divi
dend
Pay
out R
atio
on
Repo
rted
2013
ECD
NBNK
8311
111
.10.
560.
566%
-3%
12%
RBY
- Ban
k D
iv Y
ield
Rel
to 1
0-Yr
Bon
d Yi
eld
3 20
13E;
4 S&
P 50
0 R
egio
nal B
anks
Inde
xKB
W1.
231.
1222
%-2
5%29
%RT
BV -
Retu
rn o
n Ta
ngib
le B
ook
Valu
e
US
Reg4
21%
-13%
19%
RRW
A - R
etur
n on
Ris
k W
eigh
ted
Ass
ets
S&P
500
13%
0%13
%5 FS
-Foc
us S
tock
, SO
-Sec
tor O
utpe
rform
, SP-
Sect
or P
erfo
rm,
S&P/
TSX
14%
-11%
4%SU
-Sec
tor U
nder
perfo
rm.
Not
e: C
urre
ncie
s in
U.S
. dol
lars
unl
ess
othe
rwis
e st
ated
.OW
T-Ov
erw
eigh
t, M
KT-M
arke
twei
ght,
U-U
nder
wei
ght
Sou
rce:
Reu
ters
; Blo
ombe
rg; C
ompa
ny R
epor
ts; S
cotia
bank
GBM
est
imat
es.
Kevi
n R.
Cho
quet
te, C
FA
P/E
Rel t
o
U
SBNK
Not
e: T
otal
RO
R is
bas
ed o
n cu
rren
t di
vide
nd.
9.5%
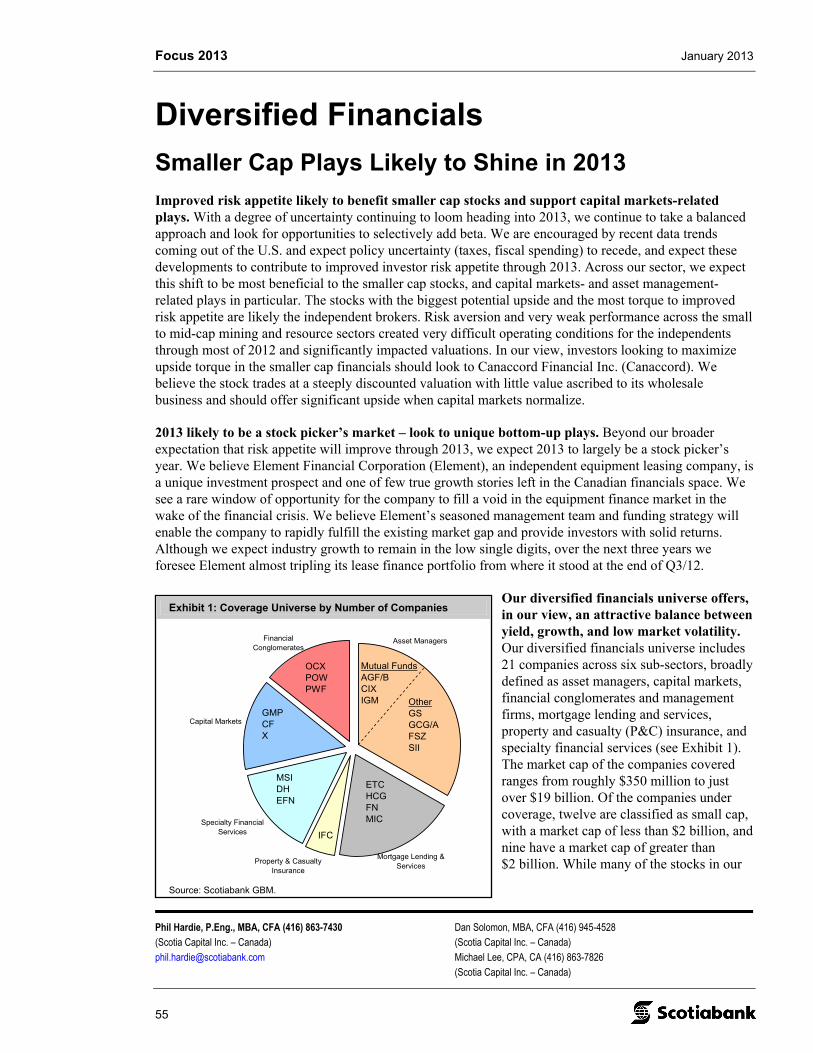
Focus 2013 January 2013
Phil Hardie, P.Eng., MBA, CFA (416) 863-7430 Dan Solomon, MBA, CFA (416) 945-4528 (Scotia Capital Inc. – Canada) (Scotia Capital Inc. – Canada) [email protected] Michael Lee, CPA, CA (416) 863-7826 (Scotia Capital Inc. – Canada)
55
Exhibit 1: Coverage Universe by Number of Companies
Property & Casualty Insurance
Specialty Financial Services
Capital Markets
Mortgage Lending & Services
Asset ManagersFinancial Conglomerates
GMPCFX
MSIDHEFN
OtherGSGCG/AFSZSII
ETCHCGFNMIC
IFC
Mutual FundsAGF/BCIXIGM
OCXPOWPWF
Source: Scotiabank GBM.
Diversified Financials
Smaller Cap Plays Likely to Shine in 2013
Improved risk appetite likely to benefit smaller cap stocks and support capital markets-related plays. With a degree of uncertainty continuing to loom heading into 2013, we continue to take a balanced approach and look for opportunities to selectively add beta. We are encouraged by recent data trends coming out of the U.S. and expect policy uncertainty (taxes, fiscal spending) to recede, and expect these developments to contribute to improved investor risk appetite through 2013. Across our sector, we expect this shift to be most beneficial to the smaller cap stocks, and capital markets- and asset management-related plays in particular. The stocks with the biggest potential upside and the most torque to improved risk appetite are likely the independent brokers. Risk aversion and very weak performance across the small to mid-cap mining and resource sectors created very difficult operating conditions for the independents through most of 2012 and significantly impacted valuations. In our view, investors looking to maximize upside torque in the smaller cap financials should look to Canaccord Financial Inc. (Canaccord). We believe the stock trades at a steeply discounted valuation with little value ascribed to its wholesale business and should offer significant upside when capital markets normalize.
2013 likely to be a stock picker’s market – look to unique bottom-up plays. Beyond our broader expectation that risk appetite will improve through 2013, we expect 2013 to largely be a stock picker’s year. We believe Element Financial Corporation (Element), an independent equipment leasing company, is a unique investment prospect and one of few true growth stories left in the Canadian financials space. We see a rare window of opportunity for the company to fill a void in the equipment finance market in the wake of the financial crisis. We believe Element’s seasoned management team and funding strategy will enable the company to rapidly fulfill the existing market gap and provide investors with solid returns. Although we expect industry growth to remain in the low single digits, over the next three years we foresee Element almost tripling its lease finance portfolio from where it stood at the end of Q3/12.
Our diversified financials universe offers, in our view, an attractive balance between yield, growth, and low market volatility. Our diversified financials universe includes 21 companies across six sub-sectors, broadly defined as asset managers, capital markets, financial conglomerates and management firms, mortgage lending and services, property and casualty (P&C) insurance, and specialty financial services (see Exhibit 1). The market cap of the companies covered ranges from roughly $350 million to just over $19 billion. Of the companies under coverage, twelve are classified as small cap, with a market cap of less than $2 billion, and nine have a market cap of greater than $2 billion. While many of the stocks in our
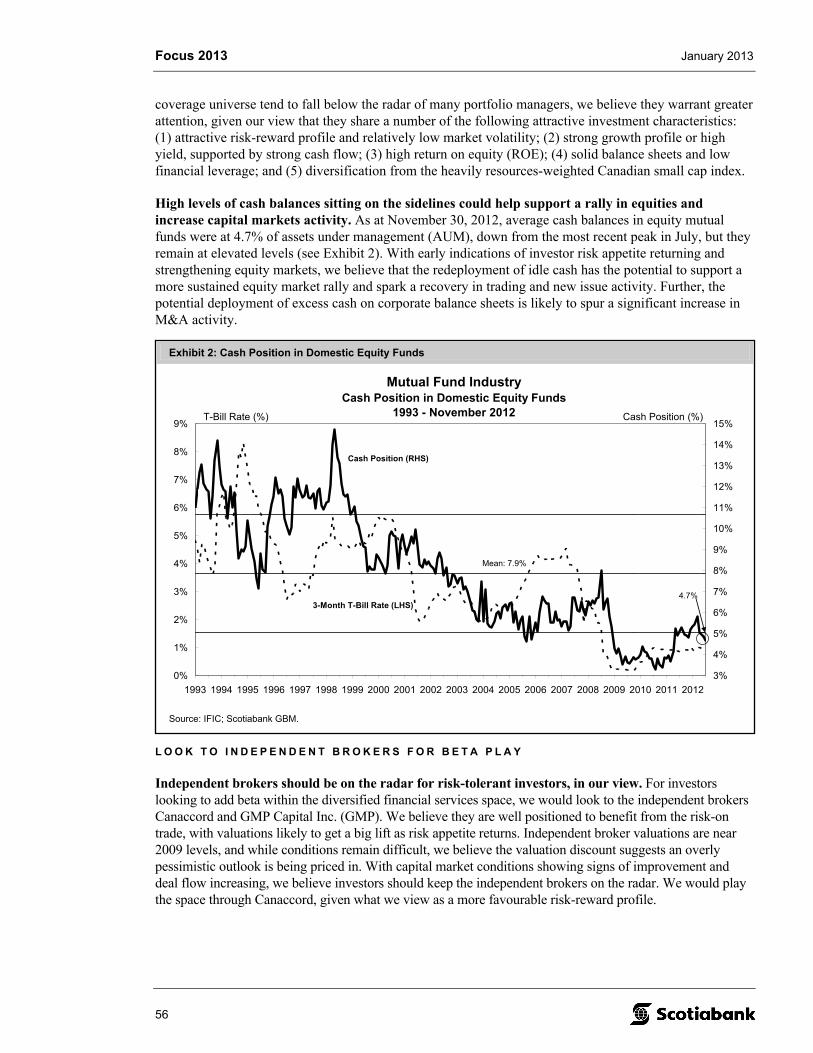
Focus 2013 January 2013
56
Exhibit 2: Cash Position in Domestic Equity Funds
Mutual Fund Industry Cash Position in Domestic Equity Funds
1993 - November 2012
0%
1%
2%
3%
4%
5%
6%
7%
8%
9%
1993 1994 1995 1996 1997 1998 1999 2000 2001 2002 2003 2004 2005 2006 2007 2008 2009 2010 2011 2012
3%
4%
5%
6%
7%
8%
9%
10%
11%
12%
13%
14%
15%
Cash Position (RHS)
3-Month T-Bill Rate (LHS)
T-Bill Rate (%) Cash Position (%)
Mean: 7.9%
4.7%
Source: IFIC; Scotiabank GBM.
coverage universe tend to fall below the radar of many portfolio managers, we believe they warrant greater attention, given our view that they share a number of the following attractive investment characteristics: (1) attractive risk-reward profile and relatively low market volatility; (2) strong growth profile or high yield, supported by strong cash flow; (3) high return on equity (ROE); (4) solid balance sheets and low financial leverage; and (5) diversification from the heavily resources-weighted Canadian small cap index.
High levels of cash balances sitting on the sidelines could help support a rally in equities and increase capital markets activity. As at November 30, 2012, average cash balances in equity mutual funds were at 4.7% of assets under management (AUM), down from the most recent peak in July, but they remain at elevated levels (see Exhibit 2). With early indications of investor risk appetite returning and strengthening equity markets, we believe that the redeployment of idle cash has the potential to support a more sustained equity market rally and spark a recovery in trading and new issue activity. Further, the potential deployment of excess cash on corporate balance sheets is likely to spur a significant increase in M&A activity.
L O O K T O I N D E P E N D E N T B R O K E R S F O R B E T A P L A Y
Independent brokers should be on the radar for risk-tolerant investors, in our view. For investors looking to add beta within the diversified financial services space, we would look to the independent brokers Canaccord and GMP Capital Inc. (GMP). We believe they are well positioned to benefit from the risk-on trade, with valuations likely to get a big lift as risk appetite returns. Independent broker valuations are near 2009 levels, and while conditions remain difficult, we believe the valuation discount suggests an overly pessimistic outlook is being priced in. With capital market conditions showing signs of improvement and deal flow increasing, we believe investors should keep the independent brokers on the radar. We would play the space through Canaccord, given what we view as a more favourable risk-reward profile.
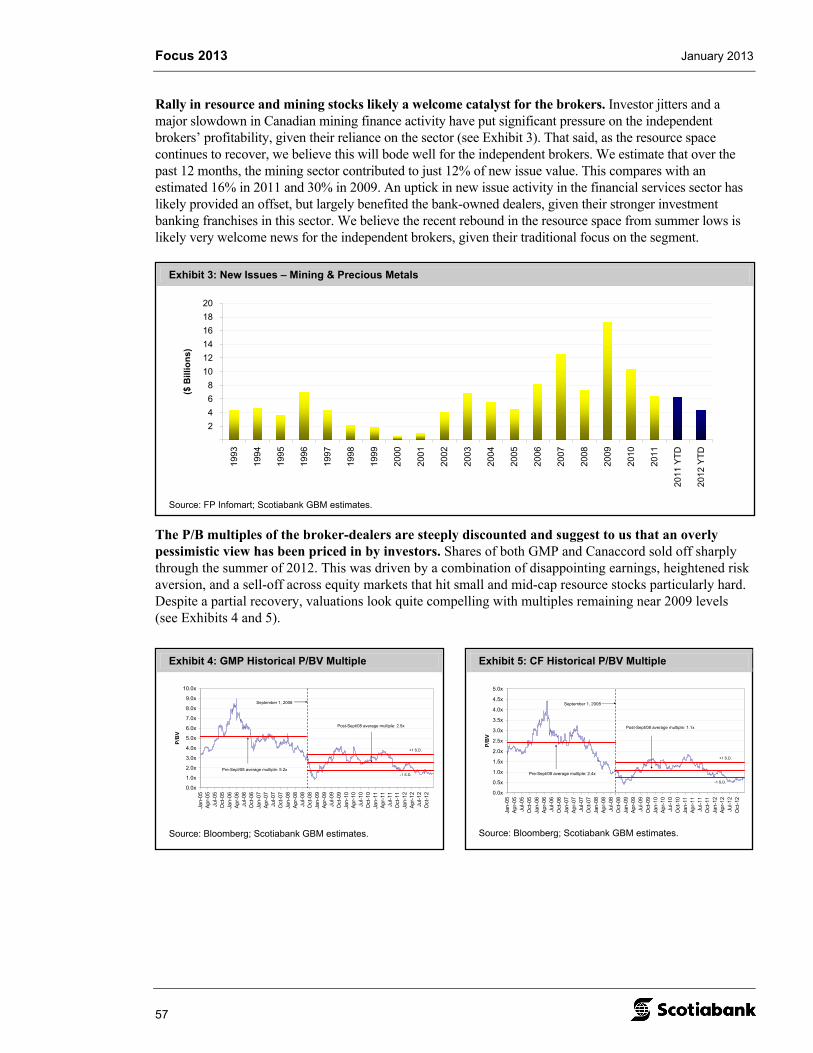
Focus 2013 January 2013
57
Exhibit 3: New Issues – Mining & Precious Metals
-
2
4
6
8
10
12
14
16
18
20
1993
1994
1995
1996
1997
1998
1999
2000
2001
2002
2003
2004
2005
2006
2007
2008
2009
2010
2011
2011
YT
D
2012
YT
D
($ B
illio
ns)
Source: FP Infomart; Scotiabank GBM estimates.
Exhibit 4: GMP Historical P/BV Multiple
0.0x
1.0x
2.0x
3.0x
4.0x
5.0x
6.0x
7.0x
8.0x
9.0x
10.0x
Jan-
05
Ap
r-0
5Ju
l-05
Oct
-05
Jan-
06
Ap
r-0
6Ju
l-06
Oct
-06
Jan-
07
Ap
r-0
7Ju
l-07
Oct
-07
Jan-
08
Ap
r-0
8Ju
l-08
Oct
-08
Jan-
09
Ap
r-0
9Ju
l-09
Oct
-09
Jan-
10
Ap
r-1
0Ju
l-10
Oct
-10
Jan-
11
Ap
r-1
1Ju
l-11
Oct
-11
Jan-
12
Ap
r-1
2Ju
l-12
Oct
-12
P/B
V
September 1, 2008
Pre-Sept/08 average multiple: 5.2x
Post-Sept/08 average multiple: 2.5x
+1 S.D.
-1 S.D.
Source: Bloomberg; Scotiabank GBM estimates.
Exhibit 5: CF Historical P/BV Multiple
0.0x
0.5x
1.0x
1.5x
2.0x
2.5x
3.0x
3.5x
4.0x
4.5x
5.0x
Jan-
05A
pr-0
5Ju
l-05
Oct
-05
Jan-
06A
pr-0
6Ju
l-06
Oct
-06
Jan-
07A
pr-0
7Ju
l-07
Oct
-07
Jan-
08A
pr-0
8Ju
l-08
Oct
-08
Jan-
09A
pr-0
9Ju
l-09
Oct
-09
Jan-
10A
pr-1
0Ju
l-10
Oct
-10
Jan-
11A
pr-1
1Ju
l-11
Oct
-11
Jan-
12A
pr-1
2Ju
l-12
Oct
-12
P/B
V
September 1, 2008
Pre-Sept/08 average multiple: 2.4x
Post-Sept/08 average multiple: 1.1x
+1 S.D.
-1 S.D.
Source: Bloomberg; Scotiabank GBM estimates.
Rally in resource and mining stocks likely a welcome catalyst for the brokers. Investor jitters and a major slowdown in Canadian mining finance activity have put significant pressure on the independent brokers’ profitability, given their reliance on the sector (see Exhibit 3). That said, as the resource space continues to recover, we believe this will bode well for the independent brokers. We estimate that over the past 12 months, the mining sector contributed to just 12% of new issue value. This compares with an estimated 16% in 2011 and 30% in 2009. An uptick in new issue activity in the financial services sector has likely provided an offset, but largely benefited the bank-owned dealers, given their stronger investment banking franchises in this sector. We believe the recent rebound in the resource space from summer lows is likely very welcome news for the independent brokers, given their traditional focus on the segment.
The P/B multiples of the broker-dealers are steeply discounted and suggest to us that an overly pessimistic view has been priced in by investors. Shares of both GMP and Canaccord sold off sharply through the summer of 2012. This was driven by a combination of disappointing earnings, heightened risk aversion, and a sell-off across equity markets that hit small and mid-cap resource stocks particularly hard. Despite a partial recovery, valuations look quite compelling with multiples remaining near 2009 levels (see Exhibits 4 and 5).
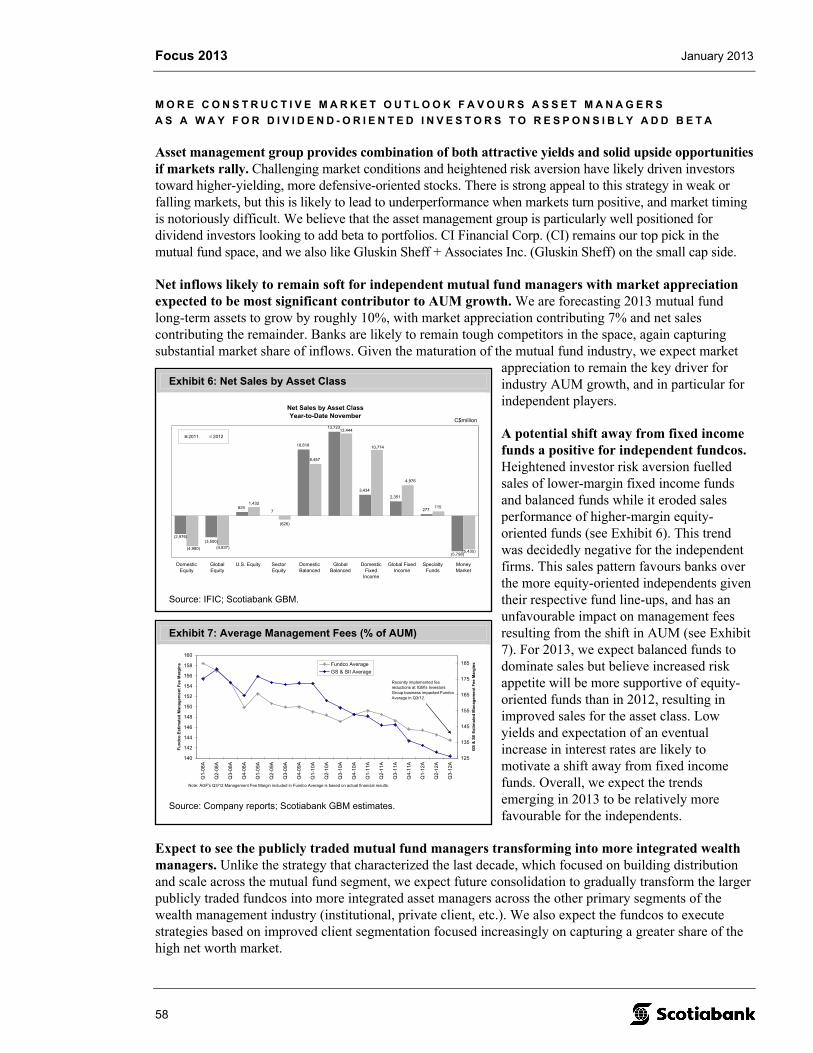
Focus 2013 January 2013
58
Exhibit 7: Average Management Fees (% of AUM)
140
142
144
146
148
150
152
154
156
158
160
Q1-
08A
Q2-
08A
Q3-
08A
Q4-
08A
Q1-
09A
Q2-
09A
Q3-
09A
Q4-
09A
Q1-
10A
Q2-
10A
Q3-
10A
Q4-
10A
Q1-
11A
Q2-
11A
Q3-
11A
Q4-
11A
Q1-
12A
Q2-
12A
Q3-
12A
Fu
nd
co E
stim
ated
Man
agem
ent
Fee
Mar
gin
s
125
135
145
155
165
175
185
GS
& S
II E
stim
ated
Man
agem
ent
Fee
Mar
gin
s Fundco Average
GS & SII Average
Note: AGF's Q3/12 Management Fee Margin included in Fundco Average is based on actual financial results.
Recently implemented fee reductions at IGM's Investors Group business impacted Fundco Average in Q3/12.
Source: Company reports; Scotiabank GBM estimates.
Exhibit 6: Net Sales by Asset Class
Net Sales by Asset ClassYear-to-Date November
(3,500)
6247
10,818
13,723
3,434
2,351
277
(626)
8,457
715
(2,976)
(5,798)
(4,837)
1,432
4,976
(5,435)
10,774
13,444
(4,980)
DomesticEquity
GlobalEquity
U.S. Equity SectorEquity
DomesticBalanced
GlobalBalanced
DomesticFixed
Income
Global FixedIncome
SpecialtyFunds
MoneyMarket
2011 2012
C$million
Source: IFIC; Scotiabank GBM.
M O R E C O N S T R U C T I V E M A R K E T O U T L O O K F A V O U R S A S S E T M A N A G E R S
A S A W A Y F O R D I V I D E N D - O R I E N T E D I N V E S T O R S T O R E S P O N S I B L Y A D D B E T A
Asset management group provides combination of both attractive yields and solid upside opportunities if markets rally. Challenging market conditions and heightened risk aversion have likely driven investors toward higher-yielding, more defensive-oriented stocks. There is strong appeal to this strategy in weak or falling markets, but this is likely to lead to underperformance when markets turn positive, and market timing is notoriously difficult. We believe that the asset management group is particularly well positioned for dividend investors looking to add beta to portfolios. CI Financial Corp. (CI) remains our top pick in the mutual fund space, and we also like Gluskin Sheff + Associates Inc. (Gluskin Sheff) on the small cap side.
Net inflows likely to remain soft for independent mutual fund managers with market appreciation expected to be most significant contributor to AUM growth. We are forecasting 2013 mutual fund long-term assets to grow by roughly 10%, with market appreciation contributing 7% and net sales contributing the remainder. Banks are likely to remain tough competitors in the space, again capturing substantial market share of inflows. Given the maturation of the mutual fund industry, we expect market
appreciation to remain the key driver for industry AUM growth, and in particular for independent players.
A potential shift away from fixed income funds a positive for independent fundcos. Heightened investor risk aversion fuelled sales of lower-margin fixed income funds and balanced funds while it eroded sales performance of higher-margin equity-oriented funds (see Exhibit 6). This trend was decidedly negative for the independent firms. This sales pattern favours banks over the more equity-oriented independents given their respective fund line-ups, and has an unfavourable impact on management fees resulting from the shift in AUM (see Exhibit 7). For 2013, we expect balanced funds to dominate sales but believe increased risk appetite will be more supportive of equity-oriented funds than in 2012, resulting in improved sales for the asset class. Low yields and expectation of an eventual increase in interest rates are likely to motivate a shift away from fixed income funds. Overall, we expect the trends emerging in 2013 to be relatively more favourable for the independents.
Expect to see the publicly traded mutual fund managers transforming into more integrated wealth managers. Unlike the strategy that characterized the last decade, which focused on building distribution and scale across the mutual fund segment, we expect future consolidation to gradually transform the larger publicly traded fundcos into more integrated asset managers across the other primary segments of the wealth management industry (institutional, private client, etc.). We also expect the fundcos to execute strategies based on improved client segmentation focused increasingly on capturing a greater share of the high net worth market.
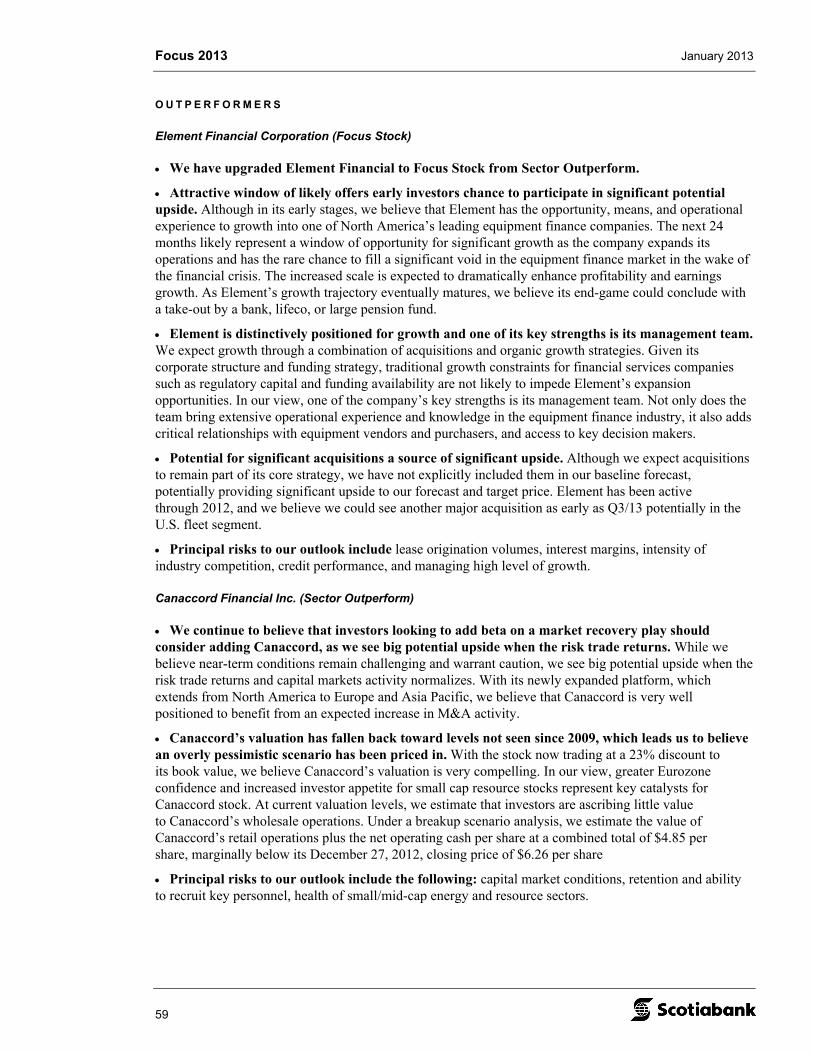
Focus 2013 January 2013
59
O U T P E R F O R M E R S
Element Financial Corporation (Focus Stock)
We have upgraded Element Financial to Focus Stock from Sector Outperform.
Attractive window of likely offers early investors chance to participate in significant potential upside. Although in its early stages, we believe that Element has the opportunity, means, and operational experience to growth into one of North America’s leading equipment finance companies. The next 24 months likely represent a window of opportunity for significant growth as the company expands its operations and has the rare chance to fill a significant void in the equipment finance market in the wake of the financial crisis. The increased scale is expected to dramatically enhance profitability and earnings growth. As Element’s growth trajectory eventually matures, we believe its end-game could conclude with a take-out by a bank, lifeco, or large pension fund.
Element is distinctively positioned for growth and one of its key strengths is its management team. We expect growth through a combination of acquisitions and organic growth strategies. Given its corporate structure and funding strategy, traditional growth constraints for financial services companies such as regulatory capital and funding availability are not likely to impede Element’s expansion opportunities. In our view, one of the company’s key strengths is its management team. Not only does the team bring extensive operational experience and knowledge in the equipment finance industry, it also adds critical relationships with equipment vendors and purchasers, and access to key decision makers.
Potential for significant acquisitions a source of significant upside. Although we expect acquisitions to remain part of its core strategy, we have not explicitly included them in our baseline forecast, potentially providing significant upside to our forecast and target price. Element has been active through 2012, and we believe we could see another major acquisition as early as Q3/13 potentially in the U.S. fleet segment.
Principal risks to our outlook include lease origination volumes, interest margins, intensity of industry competition, credit performance, and managing high level of growth.
Canaccord Financial Inc. (Sector Outperform)
We continue to believe that investors looking to add beta on a market recovery play should consider adding Canaccord, as we see big potential upside when the risk trade returns. While we believe near-term conditions remain challenging and warrant caution, we see big potential upside when the risk trade returns and capital markets activity normalizes. With its newly expanded platform, which extends from North America to Europe and Asia Pacific, we believe that Canaccord is very well positioned to benefit from an expected increase in M&A activity.
Canaccord’s valuation has fallen back toward levels not seen since 2009, which leads us to believe an overly pessimistic scenario has been priced in. With the stock now trading at a 23% discount to its book value, we believe Canaccord’s valuation is very compelling. In our view, greater Eurozone confidence and increased investor appetite for small cap resource stocks represent key catalysts for Canaccord stock. At current valuation levels, we estimate that investors are ascribing little value to Canaccord’s wholesale operations. Under a breakup scenario analysis, we estimate the value of Canaccord’s retail operations plus the net operating cash per share at a combined total of $4.85 per share, marginally below its December 27, 2012, closing price of $6.26 per share
Principal risks to our outlook include the following: capital market conditions, retention and ability to recruit key personnel, health of small/mid-cap energy and resource sectors.

Focus 2013 January 2013
60
U N D E R P E R F O R M E R
Morneau Shepell Inc. (Sector Underperform)
We like Morneau’s business, but at current levels shares appear expensive, in our view. We like Morneau given its relatively defensive nature, recurring revenue model, and attractive yield. That said, we believe its share price is fairly valued and see little opportunity for near-term price appreciation. Morneau has generated strong EBITDA/share growth in the first half of 2012, and while we expect continued benefits from a high degree of recurring revenue, we expect a more moderate pace of earnings growth over our forecast period, more reflective of historical experience of 6%-7% annually. Morneau shares currently trade at an EV/EBITDA multiple of 10.4x based on our next-12-month forecast. Including a 6.1% yield, our one-year expected ROR based on December 27, 2012, close is 0.6%, well below the 17.3% average for our small cap coverage universe.
Principal risks to our outlook include the following: potential loss of long-term service contacts, slower-than-expected EAP growth, direct competition from U.S. peers.
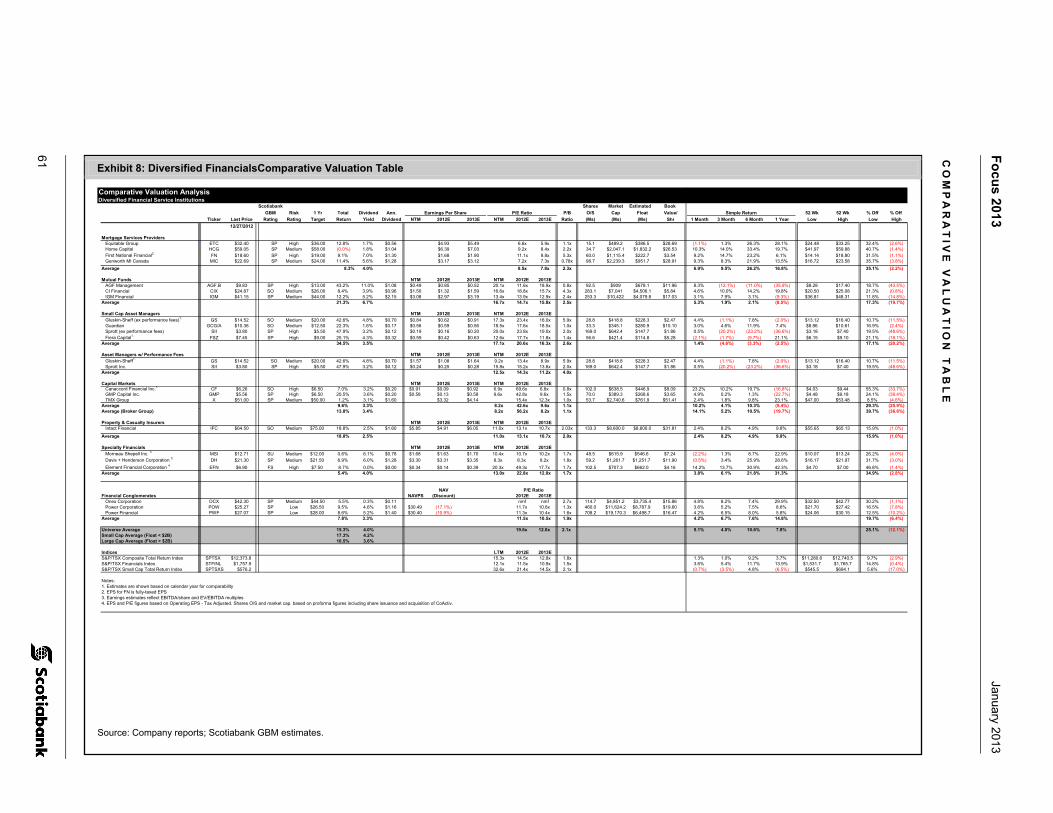
61
Fo
cus 2013
January 2013
Exhibit 8: Diversified FinancialsComparative Valuation Table
Comparative Valuation AnalysisDiversified Financial Service Institutions
Scotiabank Shares Market Estimated Book
GBM Risk 1 Yr Total Dividend Ann. Earnings Per Share P/E Ratio P/B O/S Cap Float Value/ Simple Return 52 Wk 52 Wk % Off % Off
Ticker Last Price Rating Rating Target Return Yield Dividend NTM 2012E 2013E NTM 2012E 2013E Ratio (Ms) (Ms) (Ms) Shr 1 Month 3 Month 6 Month 1 Year Low High Low High
12/27/2012
Mortgage Services ProvidersEquitable Group ETC $32.40 SP High $36.00 12.8% 1.7% $0.56 $4.93 $5.49 6.6x 5.9x 1.1x 15.1 $489.2 $386.5 $28.69 (1.1%) 1.3% 26.3% 28.1% $24.48 $33.25 32.4% (2.6%)Home Capital HCG $59.05 SP Medium $58.00 (0.0%) 1.8% $1.04 $6.39 $7.03 9.2x 8.4x 2.2x 34.7 $2,047.1 $1,832.2 $26.53 10.3% 14.0% 33.4% 19.7% $41.97 $59.88 40.7% (1.4%)First National Financial2. FN $18.60 SP High $19.00 9.1% 7.0% $1.30 $1.68 $1.90 11.1x 9.8x 5.3x 60.0 $1,115.4 $222.7 $3.54 9.2% 14.7% 23.2% 6.1% $14.14 $18.80 31.5% (1.1%)Genworth MI Canada MIC $22.69 SP Medium $24.00 11.4% 5.6% $1.28 $3.17 $3.12 7.2x 7.3x 0.78x 98.7 $2,239.3 $951.7 $28.91 9.3% 8.3% 21.9% 13.5% $16.72 $23.58 35.7% (3.8%)
Average 8.3% 4.0% 8.5x 7.8x 2.3x 6.9% 9.5% 26.2% 16.8% 35.1% (2.2%)
Mutual Funds NTM 2012E 2013E NTM 2012E 2013EAGF Management AGF.B $9.83 SP High $13.00 43.2% 11.0% $1.08 $0.49 $0.85 $0.52 20.1x 11.6x 18.9x 0.8x 92.5 $909 $678.1 $11.96 8.3% (12.1%) (11.0%) (35.9%) $8.28 $17.40 18.7% (43.5%)CI Financial CIX $24.87 SO Medium $26.00 8.4% 3.9% $0.96 $1.50 $1.32 $1.59 16.6x 18.8x 15.7x 4.3x 283.1 $7,041 $4,506.1 $5.84 4.6% 10.0% 14.2% 19.8% $20.50 $25.08 21.3% (0.8%)IGM Financial IGM $41.15 SP Medium $44.00 12.2% 5.2% $2.15 $3.08 $2.97 $3.19 13.4x 13.9x 12.9x 2.4x 253.3 $10,422 $4,079.8 $17.03 3.1% 7.9% 3.1% (9.3%) $36.81 $48.31 11.8% (14.8%)
Average 21.3% 6.7% 16.7x 14.7x 15.8x 2.5x 5.3% 1.9% 2.1% (8.5%) 17.3% (19.7%)
Small Cap Asset Managers NTM 2012E 2013E NTM 2012E 2013EGluskin-Sheff (ex performance fees)1. GS $14.52 SO Medium $20.00 42.6% 4.8% $0.70 $0.84 $0.62 $0.91 17.3x 23.4x 16.0x 5.9x 28.8 $418.8 $228.3 $2.47 4.4% (1.1%) 7.8% (2.0%) $13.12 $16.40 10.7% (11.5%)Guardian GCG/A $10.36 SO Medium $12.50 22.3% 1.6% $0.17 $0.56 $0.59 $0.56 18.5x 17.6x 18.5x 1.0x 33.3 $345.1 $280.9 $10.10 3.0% 4.6% 11.9% 7.4% $8.86 $10.61 16.9% (2.4%)Sprott (ex performance fees) SII $3.80 SP High $5.50 47.9% 3.2% $0.12 $0.19 $0.16 $0.20 20.0x 23.8x 19.0x 2.0x 169.0 $642.4 $147.7 $1.86 0.5% (20.2%) (23.2%) (36.6%) $3.18 $7.40 19.5% (48.6%)Fiera Capital1. FSZ $7.45 SP High $9.00 25.1% 4.3% $0.32 $0.59 $0.42 $0.63 12.6x 17.7x 11.8x 1.4x 56.6 $421.4 $114.8 $5.28 (2.1%) (1.7%) (9.7%) 21.1% $6.15 $9.10 21.1% (18.1%)
Average 34.5% 3.5% 17.1x 20.6x 16.3x 2.6x 1.4% (4.6%) (3.3%) (2.5%) 17.1% (20.2%)
Asset Managers w/ Performance Fees NTM 2012E 2013E NTM 2012E 2013EGluskin-Sheff1. GS $14.52 SO Medium $20.00 42.6% 4.8% $0.70 $1.57 $1.08 $1.64 9.2x 13.4x 8.9x 5.9x 28.8 $418.8 $228.3 $2.47 4.4% (1.1%) 7.8% (2.0%) $13.12 $16.40 10.7% (11.5%)Sprott Inc. SII $3.80 SP High $5.50 47.9% 3.2% $0.12 $0.24 $0.25 $0.28 15.8x 15.2x 13.6x 2.0x 169.0 $642.4 $147.7 $1.86 0.5% (20.2%) (23.2%) (36.6%) $3.18 $7.40 19.5% (48.6%)
Average 12.5x 14.3x 11.2x 4.0x
Capital Markets NTM 2012E 2013E NTM 2012E 2013ECanaccord Financial Inc.1. CF $6.26 SO High $6.50 7.0% 3.2% $0.20 $0.91 $0.09 $0.92 6.9x 69.6x 6.8x 0.8x 102.0 $638.5 $446.9 $8.09 23.2% 10.2% 19.7% (16.8%) $4.03 $9.44 55.3% (33.7%)GMP Capital Inc. GMP $5.56 SP High $6.50 20.5% 3.6% $0.20 $0.58 $0.13 $0.58 9.6x 42.8x 9.6x 1.5x 70.0 $389.3 $268.6 $3.65 4.9% 0.2% 1.3% (22.7%) $4.48 $9.18 24.1% (39.4%)TMX Group X $51.00 SP Medium $50.00 1.2% 3.1% $1.60 $3.32 $4.14 15.4x 12.3x 1.0x 53.7 $2,740.6 $761.9 $51.41 2.4% 1.8% 9.8% 23.1% $47.00 $53.48 8.5% (4.6%)
Average 9.6% 3.3% 8.2x 42.6x 9.6x 1.1x 10.2% 4.1% 10.3% (5.4%) 29.3% (25.9%)Average (Broker Group) 13.8% 3.4% 8.2x 56.2x 8.2x 1.1x 14.1% 5.2% 10.5% (19.7%) 39.7% (36.6%)
Property & Casualty Insurers NTM 2012E 2013E NTM 2012E 2013EIntact Financial IFC $64.50 SO Medium $75.00 18.8% 2.5% $1.60 $5.85 $4.91 $6.05 11.0x 13.1x 10.7x 2.03x 133.3 $8,600.0 $8,600.0 $31.81 2.4% 8.2% 4.9% 9.8% $55.65 $65.13 15.9% (1.0%)
Average 18.8% 2.5% 11.0x 13.1x 10.7x 2.0x 2.4% 8.2% 4.9% 9.8% 15.9% (1.0%)
Specialty Financials NTM 2012E 2013E NTM 2012E 2013EMorneau Shepell Inc. 3. MSI $12.71 SU Medium $12.00 0.6% 6.1% $0.78 $1.68 $1.63 $1.70 10.4x 10.7x 10.2x 1.7x 48.5 $615.9 $546.6 $7.24 (2.2%) 1.3% 8.7% 22.9% $10.07 $13.24 26.2% (4.0%)Davis + Henderson Corporation 3. DH $21.30 SP Medium $21.50 6.9% 6.0% $1.28 $3.30 $3.31 $3.35 8.3x 8.3x 8.2x 1.8x 59.2 $1,261.7 $1,251.7 $11.90 (0.5%) 3.4% 25.9% 28.6% $16.17 $21.97 31.7% (3.0%)
Element Financial Corporation 4. EFN $6.90 FS High $7.50 8.7% 0.0% $0.00 $0.34 $0.14 $0.39 20.3x 49.3x 17.7x 1.7x 102.5 $707.3 $662.0 $4.16 14.2% 13.7% 30.9% 42.3% $4.70 $7.00 46.8% (1.4%)Average 5.4% 4.0% 13.0x 22.8x 12.0x 1.7x 3.8% 6.1% 21.8% 31.3% 34.9% (2.8%)
NAV P/E RatioFinancial Conglomerates NAVPS (Discount) 2012E 2013E
Onex Corporation OCX $42.30 SP Medium $44.50 5.5% 0.3% $0.11 nmf nmf 2.7x 114.7 $4,851.2 $3,735.4 $15.86 4.8% 8.2% 7.4% 29.9% $32.50 $42.77 30.2% (1.1%)Power Corporation POW $25.27 SP Low $26.50 9.5% 4.6% $1.16 $30.49 (17.1%) 11.7x 10.6x 1.3x 460.0 $11,624.2 $8,787.9 $19.60 3.6% 5.2% 7.5% 8.6% $21.70 $27.42 16.5% (7.8%)Power Financial PWF $27.07 SP Low $28.00 8.6% 5.2% $1.40 $30.40 (10.9%) 11.3x 10.4x 1.6x 708.2 $19,170.3 $6,498.7 $16.47 4.2% 6.5% 8.0% 5.8% $24.06 $30.15 12.5% (10.2%)
Average 7.8% 3.3% 11.5x 10.5x 1.9x 4.2% 6.7% 7.6% 14.8% 19.7% (6.4%)
Universe Average 15.3% 4.0% 19.6x 12.0x 2.1x 5.1% 4.0% 10.6% 7.8% 25.1% (12.1%)Small Cap Average (Float < $2B) 17.3% 4.2%Large Cap Average (Float > $2B) 10.5% 3.6%
Indices LTM 2012E 2013ES&P/TSX Composite Total Return Index SPTSX $12,373.8 15.3x 14.5x 12.8x 1.8x 1.3% 1.0% 9.2% 3.7% $11,280.6 $12,740.5 9.7% (2.9%)S&P/TSX Financials Index STFINL $1,757.9 12.1x 11.5x 10.9x 1.5x 3.6% 5.4% 11.7% 13.9% $1,531.7 $1,765.7 14.8% (0.4%)S&P/TSX Small Cap Total Return Index SPTSXS $576.2 32.6x 21.4x 14.5x 2.1x (0.7%) (3.5%) 4.8% (6.5%) $545.5 $694.1 5.6% (17.0%)
Notes: 1. Estimates are shown based on calendar year for comparability2. EPS for FN is fully-taxed EPS3. Earnings estimates reflect EBITDA/share and EV/EBITDA multiples4. EPS and P/E figures based on Operating EPS - Tax Adjusted. Shares O/S and market cap. based on proforma figures including share issuance and acquisition of CoActiv.
Source: Company reports; Scotiabank GBM estimates.
CO
MP
AR
AT
IVE
VA
LU
AT
ION
TA
BL
E

Focus 2013 January 2013
62
T H I S P A G E L E F T I N T E N T I O N A L L Y B L A N K .
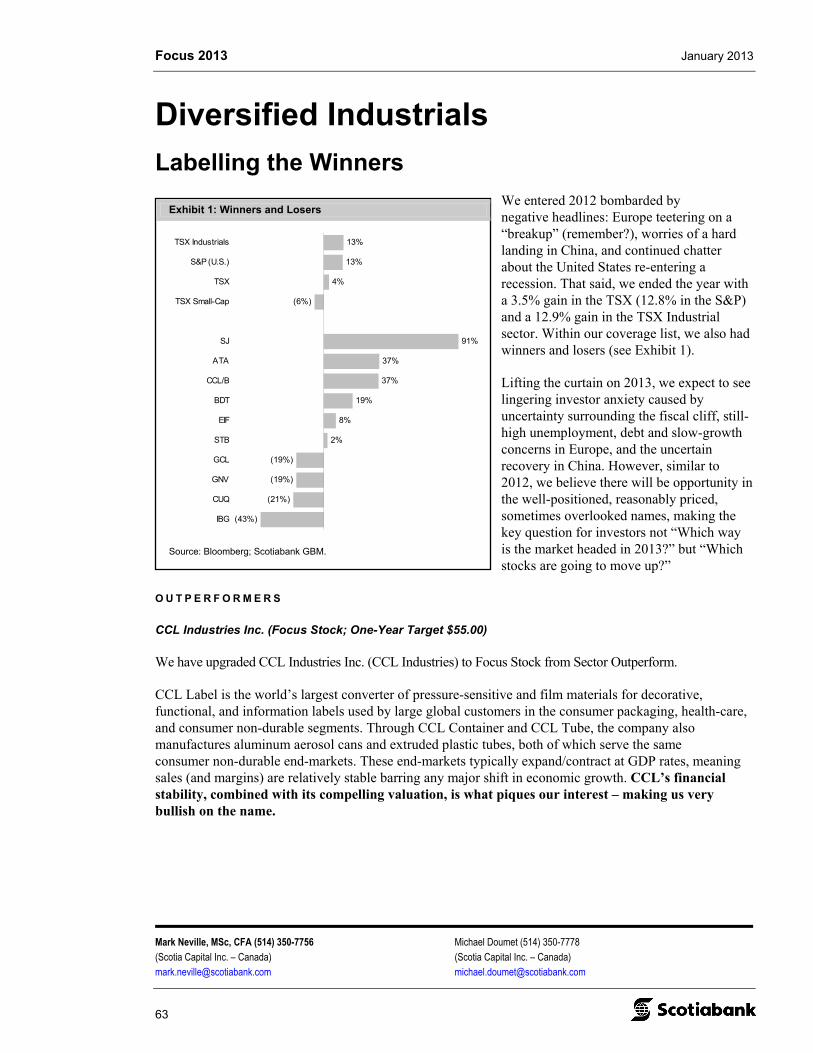
Focus 2013 January 2013
Mark Neville, MSc, CFA (514) 350-7756 Michael Doumet (514) 350-7778 (Scotia Capital Inc. – Canada) (Scotia Capital Inc. – Canada) [email protected] [email protected]
63
Exhibit 1: Winners and Losers
(43%)
(21%)
(19%)
(19%)
2%
8%
19%
37%
37%
91%
(6%)
4%
13%
13%
IBG
CUQ
GNV
GCL
STB
EIF
BDT
CCL/B
ATA
SJ
TSX Small-Cap
TSX
S&P (U.S.)
TSX Industrials
Source: Bloomberg; Scotiabank GBM.
Diversified Industrials
Labelling the Winners
We entered 2012 bombarded by negative headlines: Europe teetering on a “breakup” (remember?), worries of a hard landing in China, and continued chatter about the United States re-entering a recession. That said, we ended the year with a 3.5% gain in the TSX (12.8% in the S&P) and a 12.9% gain in the TSX Industrial sector. Within our coverage list, we also had winners and losers (see Exhibit 1).
Lifting the curtain on 2013, we expect to see lingering investor anxiety caused by uncertainty surrounding the fiscal cliff, still-high unemployment, debt and slow-growth concerns in Europe, and the uncertain recovery in China. However, similar to 2012, we believe there will be opportunity in the well-positioned, reasonably priced, sometimes overlooked names, making the key question for investors not “Which way is the market headed in 2013?” but “Which stocks are going to move up?”
O U T P E R F O R M E R S
CCL Industries Inc. (Focus Stock; One-Year Target $55.00)
We have upgraded CCL Industries Inc. (CCL Industries) to Focus Stock from Sector Outperform.
CCL Label is the world’s largest converter of pressure-sensitive and film materials for decorative, functional, and information labels used by large global customers in the consumer packaging, health-care, and consumer non-durable segments. Through CCL Container and CCL Tube, the company also manufactures aluminum aerosol cans and extruded plastic tubes, both of which serve the same consumer non-durable end-markets. These end-markets typically expand/contract at GDP rates, meaning sales (and margins) are relatively stable barring any major shift in economic growth. CCL’s financial stability, combined with its compelling valuation, is what piques our interest – making us very bullish on the name.
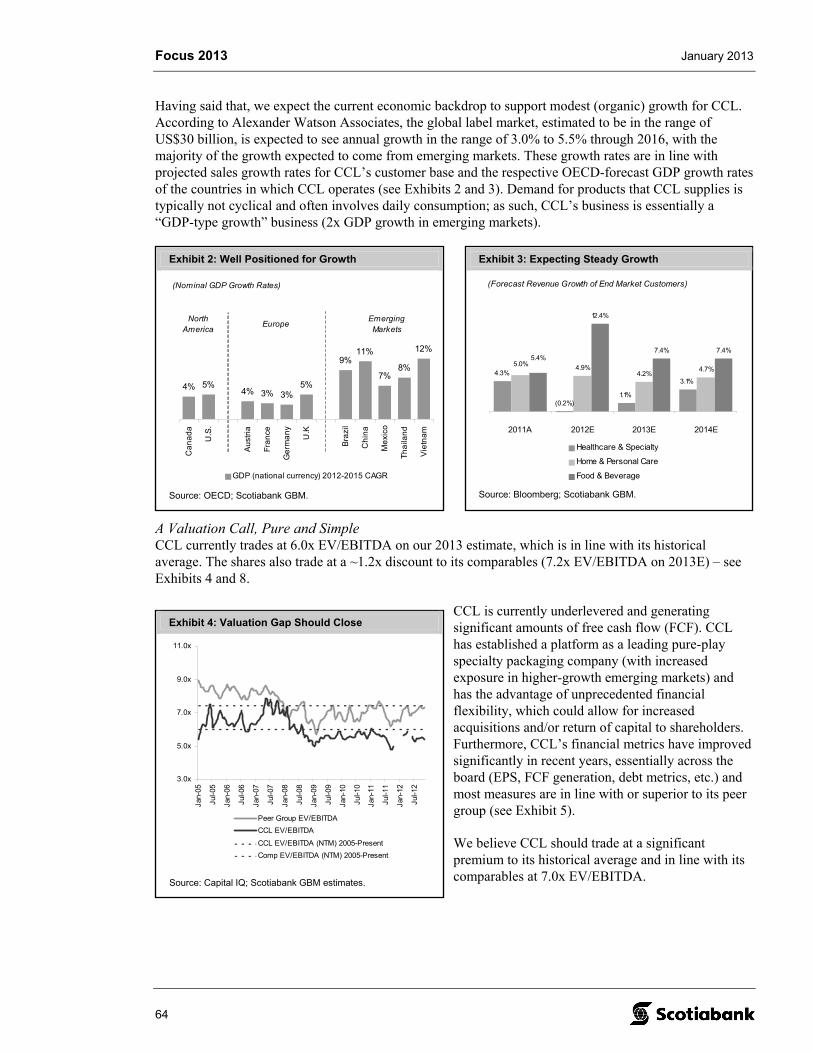
Focus 2013 January 2013
64
Exhibit 2: Well Positioned for Growth
4% 5%4% 3% 3%
5%
9%11%
7%8%
12%
Ca
na
da
U.S
.
Au
stri
a
Fra
nce
Ge
rma
ny
U.K
Bra
zil
Ch
ina
Me
xico
Th
aila
nd
Vie
tna
m
GDP (national currency) 2012-2015 CAGR
North America
EuropeEmerging Markets
(Nominal GDP Growth Rates)
Source: OECD; Scotiabank GBM.
Exhibit 4: Valuation Gap Should Close
3.0x
5.0x
7.0x
9.0x
11.0x
Jan-
05
Jul-0
5
Jan-
06
Jul-0
6
Jan-
07
Jul-0
7
Jan-
08
Jul-0
8
Jan-
09
Jul-0
9
Jan-
10
Jul-1
0
Jan-
11
Jul-1
1
Jan-
12
Jul-1
2
Peer Group EV/EBITDA
CCL EV/EBITDA
CCL EV/EBITDA (NTM) 2005-Present
Comp EV/EBITDA (NTM) 2005-Present
Source: Capital IQ; Scotiabank GBM estimates.
Exhibit 3: Expecting Steady Growth
(0.2%)1.1%
3.1%
4.9%4.2%
4.7%
12.4%
7.4% 7.4%
4.3%5.0%
5.4%
2011A 2012E 2013E 2014E
Healthcare & Specialty
Home & Personal Care
Food & Beverage
(Forecast Revenue Growth of End Market Customers)
Source: Bloomberg; Scotiabank GBM.
Having said that, we expect the current economic backdrop to support modest (organic) growth for CCL. According to Alexander Watson Associates, the global label market, estimated to be in the range of US$30 billion, is expected to see annual growth in the range of 3.0% to 5.5% through 2016, with the majority of the growth expected to come from emerging markets. These growth rates are in line with projected sales growth rates for CCL’s customer base and the respective OECD-forecast GDP growth rates of the countries in which CCL operates (see Exhibits 2 and 3). Demand for products that CCL supplies is typically not cyclical and often involves daily consumption; as such, CCL’s business is essentially a “GDP-type growth” business (2x GDP growth in emerging markets).
A Valuation Call, Pure and Simple CCL currently trades at 6.0x EV/EBITDA on our 2013 estimate, which is in line with its historical average. The shares also trade at a ~1.2x discount to its comparables (7.2x EV/EBITDA on 2013E) – see Exhibits 4 and 8.
CCL is currently underlevered and generating significant amounts of free cash flow (FCF). CCL has established a platform as a leading pure-play specialty packaging company (with increased exposure in higher-growth emerging markets) and has the advantage of unprecedented financial flexibility, which could allow for increased acquisitions and/or return of capital to shareholders. Furthermore, CCL’s financial metrics have improved significantly in recent years, essentially across the board (EPS, FCF generation, debt metrics, etc.) and most measures are in line with or superior to its peer group (see Exhibit 5).
We believe CCL should trade at a significant premium to its historical average and in line with its comparables at 7.0x EV/EBITDA.
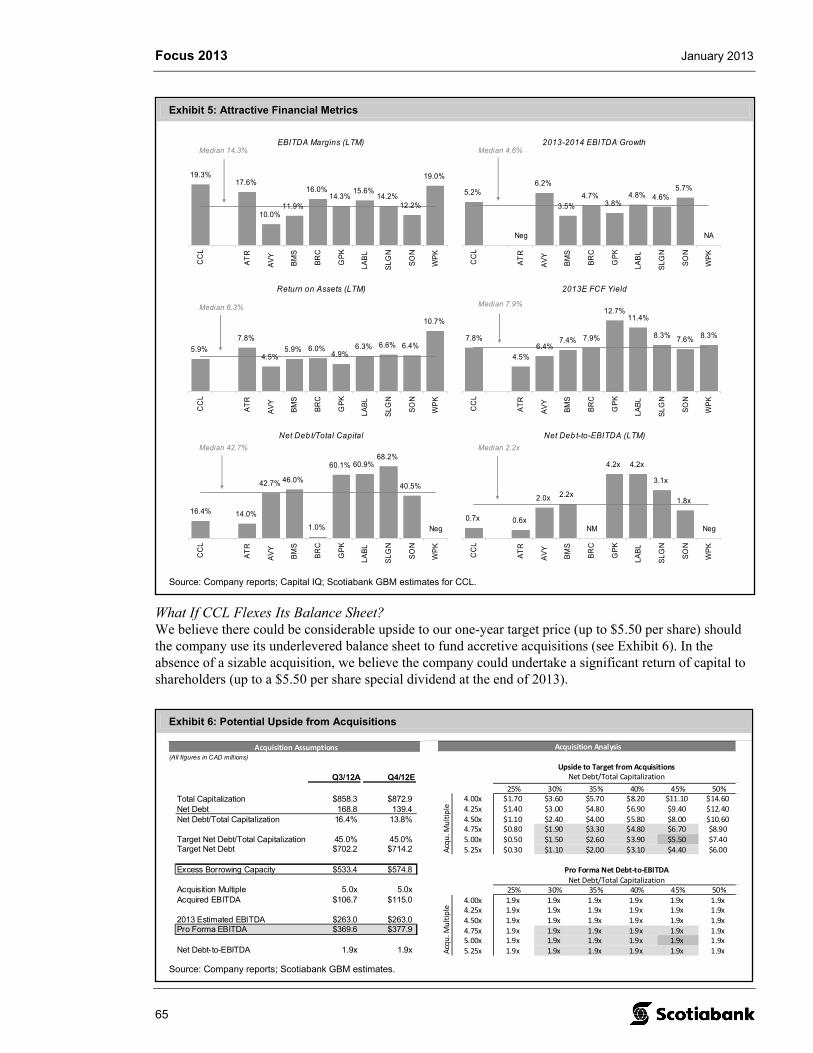
Focus 2013 January 2013
65
Exhibit 6: Potential Upside from Acquisitions
Acquisition Assumptions(All figures in CAD mill ions)
Q3/12A Q4/12E
Total Capitalization $858.3 $872.9Net Debt 168.8 139.4Net Debt/Total Capitalization 16.4% 13.8%
Target Net Debt/Total Capitalization 45.0% 45.0%Target Net Debt $702.2 $714.2
Excess Borrowing Capacity $533.4 $574.8
Acquisition Multiple 5.0x 5.0xAcquired EBITDA $106.7 $115.0
2013 Estimated EBITDA $263.0 $263.0Pro Forma EBITDA $369.6 $377.9
Net Debt-to-EBITDA 1.9x 1.9x
Acquisition Analysis
Upside to Target from AcquisitionsNet Debt/Total Capitalization
549.3% 25% 30% 35% 40% 45% 50%4.00x $1.70 $3.60 $5.70 $8.20 $11.10 $14.604.25x $1.40 $3.00 $4.80 $6.90 $9.40 $12.404.50x $1.10 $2.40 $4.00 $5.80 $8.00 $10.604.75x $0.80 $1.90 $3.30 $4.80 $6.70 $8.905.00x $0.50 $1.50 $2.60 $3.90 $5.50 $7.405.25x $0.30 $1.10 $2.00 $3.10 $4.40 $6.00
Pro Forma Net Debt-to-EBITDANet Debt/Total Capitalization
189.0% 25% 30% 35% 40% 45% 50%4.00x 1.9x 1.9x 1.9x 1.9x 1.9x 1.9x4.25x 1.9x 1.9x 1.9x 1.9x 1.9x 1.9x4.50x 1.9x 1.9x 1.9x 1.9x 1.9x 1.9x4.75x 1.9x 1.9x 1.9x 1.9x 1.9x 1.9x5.00x 1.9x 1.9x 1.9x 1.9x 1.9x 1.9x5.25x 1.9x 1.9x 1.9x 1.9x 1.9x 1.9x
Acqu
. Mul
tiple
Acqu
. Mul
tiple
Source: Company reports; Scotiabank GBM estimates.
Exhibit 5: Attractive Financial Metrics
EBITDA Margins (LTM)
19.3%17.6%
10.0%11.9%
16.0%14.3%
15.6%14.2%
12.2%
19.0%
CC
L
AT
R
AV
Y
BM
S
BR
C
GP
K
LAB
L
SLG
N
SO
N
WP
K
Return on Assets (LTM)
5.9%
7.8%
4.5%5.9% 6.0%
4.9%6.3% 6.6% 6.4%
10.7%
CC
L
AT
R
AV
Y
BM
S
BR
C
GP
K
LAB
L
SLG
N
SO
N
WP
KNet Deb t/Total Capital
16.4% 14.0%
42.7% 46.0%
1.0%
60.1% 60.9%68.2%
40.5%
Neg
CC
L
AT
R
AV
Y
BM
S
BR
C
GP
K
LAB
L
SLG
N
SO
N
WP
KNet Deb t-to-EBITDA (LTM)
0.7x 0.6x
2.0x 2.2x
4.2x 4.2x
3.1x
1.8x
NM Neg
CC
L
AT
R
AV
Y
BM
S
BR
C
GP
K
LAB
L
SLG
N
SO
N
WP
K
2013E FCF Yield
7.8%
4.5%6.4%
7.4% 7.9%
12.7%11.4%
8.3% 7.6% 8.3%
CC
L
AT
R
AV
Y
BM
S
BR
C
GP
K
LAB
L
SLG
N
SO
N
WP
K
2013-2014 EBITDA Growth
5.2%6.2%
3.5%4.7%
3.8%4.8% 4.6%
5.7%
Neg NA
CC
L
AT
R
AV
Y
BM
S
BR
C
GP
K
LAB
L
SLG
N
SO
N
WP
K
Median 6.3% Median 7.9%
Median 4.6%Median 14.3%
Median 42.7% Median 2.2x
Source: Company reports; Capital IQ; Scotiabank GBM estimates for CCL.
What If CCL Flexes Its Balance Sheet? We believe there could be considerable upside to our one-year target price (up to $5.50 per share) should the company use its underlevered balance sheet to fund accretive acquisitions (see Exhibit 6). In the absence of a sizable acquisition, we believe the company could undertake a significant return of capital to shareholders (up to a $5.50 per share special dividend at the end of 2013).
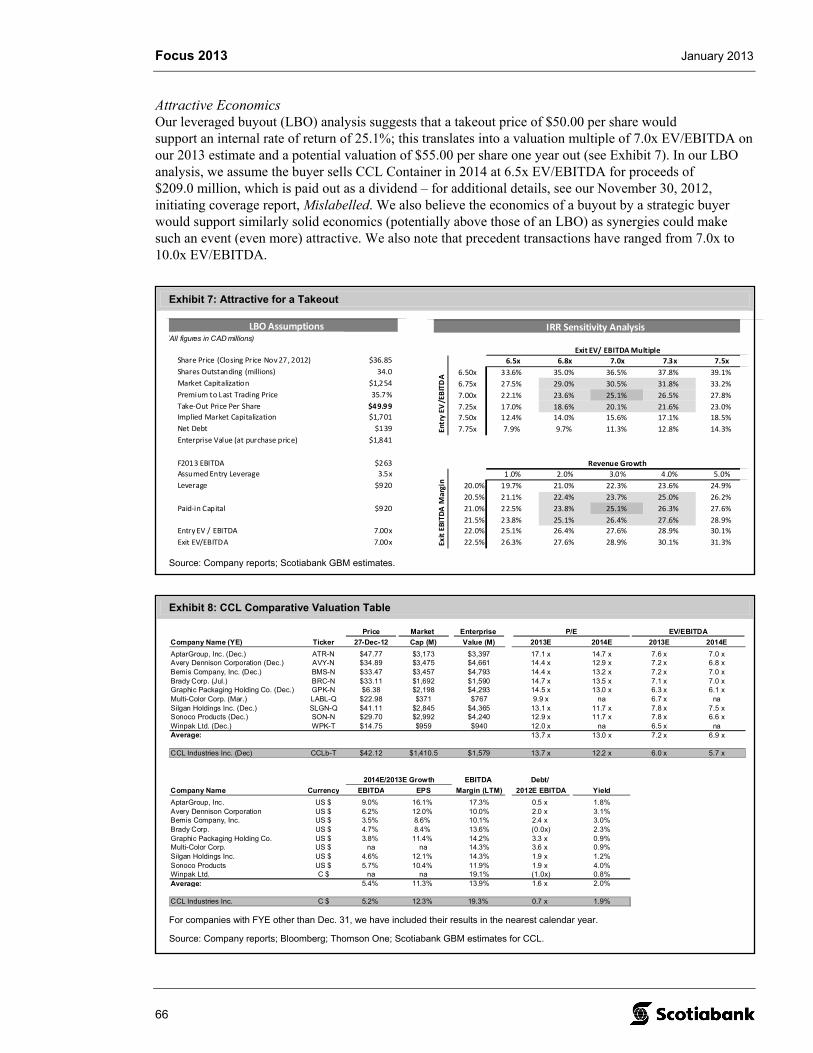
Focus 2013 January 2013
66
Exhibit 7: Attractive for a Takeout
LBO Assumptions(All figures in CAD millions)
Share Price (Closing Price Nov 27, 2012) $36.85Shares Outstanding (millions) 34.0Market Capitalization $1,254Premium to Last Trading Price 35.7%Take-Out Price Per Share $49.99Implied Market Capitalization $1,701Net Debt $139Enterprise Value (at purchase price) $1,841
F2013 EBITDA $263Assumed Entry Leverage 3.5xLeverage $920
Paid-in Capital $920
Entry EV / EBITDA 7.00xExit EV/EBITDA 7.00x
IRR Sensitivity Analysis
Exit EV/ EBITDA Multiple25.1% 6.5x 6.8x 7.0x 7.3x 7.5x
6.50x 33.6% 35.0% 36.5% 37.8% 39.1%6.75x 27.5% 29.0% 30.5% 31.8% 33.2%7.00x 22.1% 23.6% 25.1% 26.5% 27.8%7.25x 17.0% 18.6% 20.1% 21.6% 23.0%7.50x 12.4% 14.0% 15.6% 17.1% 18.5%7.75x 7.9% 9.7% 11.3% 12.8% 14.3%
Revenue Growth25.1% 1.0% 2.0% 3.0% 4.0% 5.0%20.0% 19.7% 21.0% 22.3% 23.6% 24.9%20.5% 21.1% 22.4% 23.7% 25.0% 26.2%21.0% 22.5% 23.8% 25.1% 26.3% 27.6%21.5% 23.8% 25.1% 26.4% 27.6% 28.9%22.0% 25.1% 26.4% 27.6% 28.9% 30.1%22.5% 26.3% 27.6% 28.9% 30.1% 31.3%
Entr
y EV
/EB
ITD
AEx
it EB
ITD
A M
argi
n
Source: Company reports; Scotiabank GBM estimates.
Exhibit 8: CCL Comparative Valuation Table
Price Market Enterprise P/E EV/EBITDA
Company Name (YE) Ticker 27-Dec-12 Cap (M) Value (M) 2013E 2014E 2013E 2014E
AptarGroup, Inc. (Dec.) ATR-N $47.77 $3,173 $3,397 17.1 x 14.7 x 7.6 x 7.0 xAvery Dennison Corporation (Dec.) AVY-N $34.89 $3,475 $4,661 14.4 x 12.9 x 7.2 x 6.8 xBemis Company, Inc. (Dec.) BMS-N $33.47 $3,457 $4,793 14.4 x 13.2 x 7.2 x 7.0 xBrady Corp. (Jul.) BRC-N $33.11 $1,692 $1,590 14.7 x 13.5 x 7.1 x 7.0 xGraphic Packaging Holding Co. (Dec.) GPK-N $6.38 $2,198 $4,293 14.5 x 13.0 x 6.3 x 6.1 xMulti-Color Corp. (Mar.) LABL-Q $22.98 $371 $767 9.9 x na 6.7 x naSilgan Holdings Inc. (Dec.) SLGN-Q $41.11 $2,845 $4,365 13.1 x 11.7 x 7.8 x 7.5 xSonoco Products (Dec.) SON-N $29.70 $2,992 $4,240 12.9 x 11.7 x 7.8 x 6.6 xWinpak Ltd. (Dec.) WPK-T $14.75 $959 $940 12.0 x na 6.5 x naAverage: 13.7 x 13.0 x 7.2 x 6.9 x
CCL Industries Inc. (Dec) CCLb-T $42.12 $1,410.5 $1,579 13.7 x 12.2 x 6.0 x 5.7 x
2014E/2013E Growth EBITDA Debt/
Company Name Currency EBITDA EPS Margin (LTM) 2012E EBITDA Yield
AptarGroup, Inc. US $ 9.0% 16.1% 17.3% 0.5 x 1.8%Avery Dennison Corporation US $ 6.2% 12.0% 10.0% 2.0 x 3.1%Bemis Company, Inc. US $ 3.5% 8.6% 10.1% 2.4 x 3.0%Brady Corp. US $ 4.7% 8.4% 13.6% (0.0x) 2.3%Graphic Packaging Holding Co. US $ 3.8% 11.4% 14.2% 3.3 x 0.9%Multi-Color Corp. US $ na na 14.3% 3.6 x 0.9%Silgan Holdings Inc. US $ 4.6% 12.1% 14.3% 1.9 x 1.2%Sonoco Products US $ 5.7% 10.4% 11.9% 1.9 x 4.0%Winpak Ltd. C $ na na 19.1% (1.0x) 0.8%Average: 5.4% 11.3% 13.9% 1.6 x 2.0%
CCL Industries Inc. C $ 5.2% 12.3% 19.3% 0.7 x 1.9%
For companies with FYE other than Dec. 31, we have included their results in the nearest calendar year.
Source: Company reports; Bloomberg; Thomson One; Scotiabank GBM estimates for CCL.
Attractive Economics Our leveraged buyout (LBO) analysis suggests that a takeout price of $50.00 per share would support an internal rate of return of 25.1%; this translates into a valuation multiple of 7.0x EV/EBITDA on our 2013 estimate and a potential valuation of $55.00 per share one year out (see Exhibit 7). In our LBO analysis, we assume the buyer sells CCL Container in 2014 at 6.5x EV/EBITDA for proceeds of $209.0 million, which is paid out as a dividend – for additional details, see our November 30, 2012, initiating coverage report, Mislabelled. We also believe the economics of a buyout by a strategic buyer would support similarly solid economics (potentially above those of an LBO) as synergies could make such an event (even more) attractive. We also note that precedent transactions have ranged from 7.0x to 10.0x EV/EBITDA.
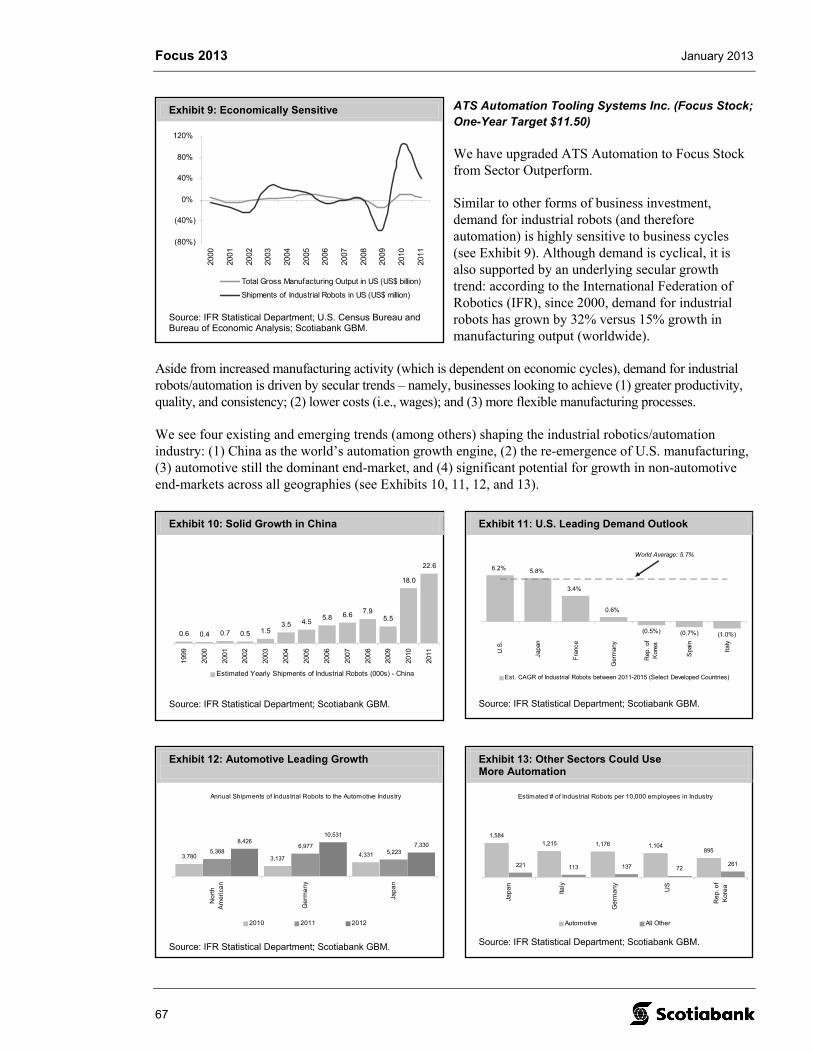
Focus 2013 January 2013
67
Exhibit 9: Economically Sensitive
(80%)
(40%)
0%
40%
80%
120%
2000
2001
2002
2003
2004
2005
2006
2007
2008
2009
2010
2011
Total Gross Manufacturing Output in US (US$ billion)
Shipments of Industrial Robots in US (US$ million)
Source: IFR Statistical Department; U.S. Census Bureau and Bureau of Economic Analysis; Scotiabank GBM.
Exhibit 10: Solid Growth in China
0.6 0.4 0.7 0.5 1.53.5 4.5
5.8 6.6 7.95.5
18.0
22.6
1999
2000
2001
2002
2003
2004
2005
2006
2007
2008
2009
2010
2011
Estimated Yearly Shipments of Industrial Robots (000s) - China
Source: IFR Statistical Department; Scotiabank GBM.
Exhibit 11: U.S. Leading Demand Outlook
6.2% 5.8%
3.4%
0.6%
(0.5%) (0.7%) (1.0%)
U.S
.
Japa
n
Fra
nce
Ger
man
y
Rep
. of
Kor
ea
Spa
in
Ital
y
Est. CAGR of Industrial Robots between 2011-2015 (Select Developed Countries)
World Average: 5.7%
Source: IFR Statistical Department; Scotiabank GBM.
Exhibit 12: Automotive Leading Growth
Annual Shipments of Industrial Robots to the Automotive Industry
3,780 3,1374,3315,368
6,9775,223
8,42610,531
7,330
No
rth
Am
eri
can
Ge
rma
ny
Jap
an
2010 2011 2012
Source: IFR Statistical Department; Scotiabank GBM.
Exhibit 13: Other Sectors Could Use More Automation
Estimated # of Industrial Robots per 10,000 employees in Industry
1,5841,215 1,176 1,104
895
221 113 137 72261
Jap
an
Italy
Ge
rma
ny
US
Re
p. o
fK
ore
a
Automotive All Other
Source: IFR Statistical Department; Scotiabank GBM.
ATS Automation Tooling Systems Inc. (Focus Stock; One-Year Target $11.50)
We have upgraded ATS Automation to Focus Stock from Sector Outperform.
Similar to other forms of business investment, demand for industrial robots (and therefore automation) is highly sensitive to business cycles (see Exhibit 9). Although demand is cyclical, it is also supported by an underlying secular growth trend: according to the International Federation of Robotics (IFR), since 2000, demand for industrial robots has grown by 32% versus 15% growth in manufacturing output (worldwide).
Aside from increased manufacturing activity (which is dependent on economic cycles), demand for industrial robots/automation is driven by secular trends – namely, businesses looking to achieve (1) greater productivity, quality, and consistency; (2) lower costs (i.e., wages); and (3) more flexible manufacturing processes.
We see four existing and emerging trends (among others) shaping the industrial robotics/automation industry: (1) China as the world’s automation growth engine, (2) the re-emergence of U.S. manufacturing, (3) automotive still the dominant end-market, and (4) significant potential for growth in non-automotive end-markets across all geographies (see Exhibits 10, 11, 12, and 13).
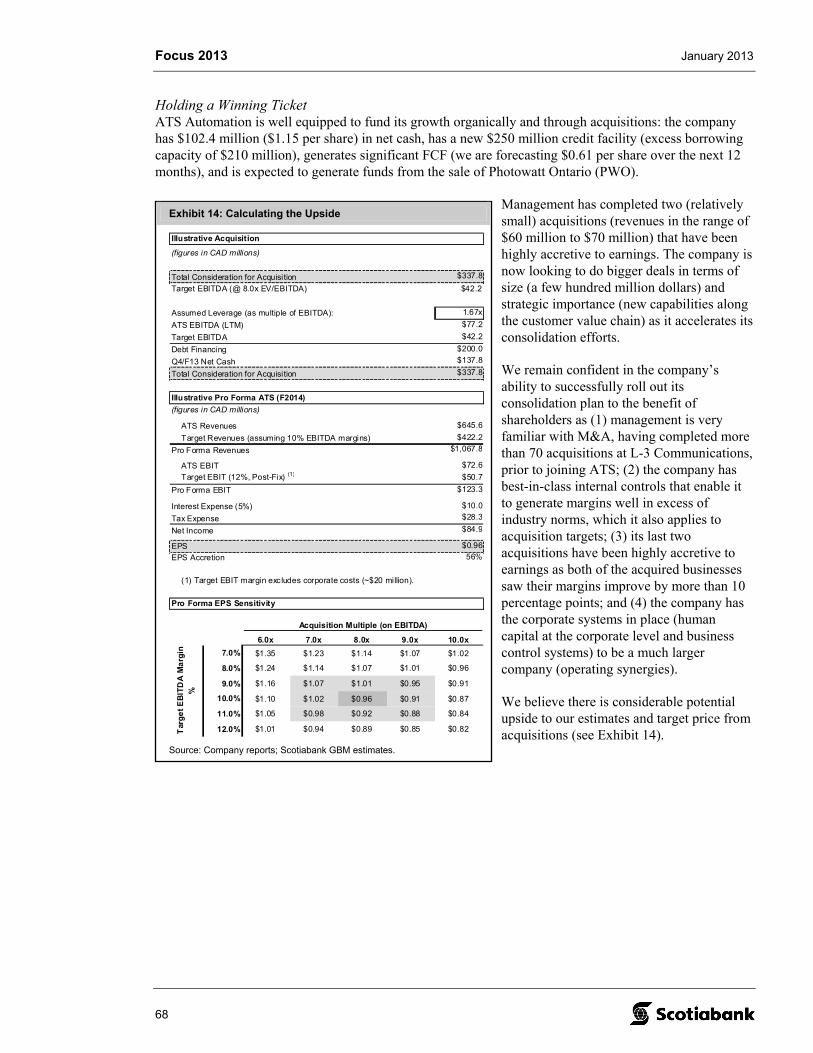
Focus 2013 January 2013
68
Exhibit 14: Calculating the Upside
Illustrative Acquisition
(figures in CAD millions)
Total Consideration for Acquisition $337.8
Target EBITDA (@ 8.0x EV/EBITDA) $42.2
Assumed Leverage (as multiple of EBITDA): 1.67x
ATS EBITDA (LTM) $77.2
Target EBITDA $42.2
Debt Financing $200.0
Q4/F13 Net Cash $137.8
Total Consideration for Acquisition $337.8
Illustrative Pro Forma ATS (F2014)
(figures in CAD millions)
ATS Revenues $645.6
Target Revenues (assuming 10% EBITDA margins) $422.2
Pro Forma Revenues $1,067.8
ATS EBIT $72.6
Target EBIT (12%, Post-Fix) (1) $50.7
Pro Forma EBIT $123.3
Interest Expense (5%) $10.0
Tax Expense $28.3
Net Income $84.9
EPS $0.96
EPS Accretion 56%
(1) Target EBIT margin excludes corporate costs (~$20 million).
Pro Forma EPS Sensitivity
Acquisition Multiple (on EBITDA)
0.96 6.0x 7.0x 8.0x 9.0x 10.0x
7.0% $1.35 $1.23 $1.14 $1.07 $1.02
8.0% $1.24 $1.14 $1.07 $1.01 $0.96
9.0% $1.16 $1.07 $1.01 $0.95 $0.91
10.0% $1.10 $1.02 $0.96 $0.91 $0.87
11.0% $1.05 $0.98 $0.92 $0.88 $0.84
12.0% $1.01 $0.94 $0.89 $0.85 $0.82Tar
ge
t E
BIT
DA
Ma
rgin
%
Source: Company reports; Scotiabank GBM estimates.
Holding a Winning Ticket ATS Automation is well equipped to fund its growth organically and through acquisitions: the company has $102.4 million ($1.15 per share) in net cash, has a new $250 million credit facility (excess borrowing capacity of $210 million), generates significant FCF (we are forecasting $0.61 per share over the next 12 months), and is expected to generate funds from the sale of Photowatt Ontario (PWO).
Management has completed two (relatively small) acquisitions (revenues in the range of $60 million to $70 million) that have been highly accretive to earnings. The company is now looking to do bigger deals in terms of size (a few hundred million dollars) and strategic importance (new capabilities along the customer value chain) as it accelerates its consolidation efforts.
We remain confident in the company’s ability to successfully roll out its consolidation plan to the benefit of shareholders as (1) management is very familiar with M&A, having completed more than 70 acquisitions at L-3 Communications, prior to joining ATS; (2) the company has best-in-class internal controls that enable it to generate margins well in excess of industry norms, which it also applies to acquisition targets; (3) its last two acquisitions have been highly accretive to earnings as both of the acquired businesses saw their margins improve by more than 10 percentage points; and (4) the company has the corporate systems in place (human capital at the corporate level and business control systems) to be a much larger company (operating synergies).
We believe there is considerable potential upside to our estimates and target price from acquisitions (see Exhibit 14).
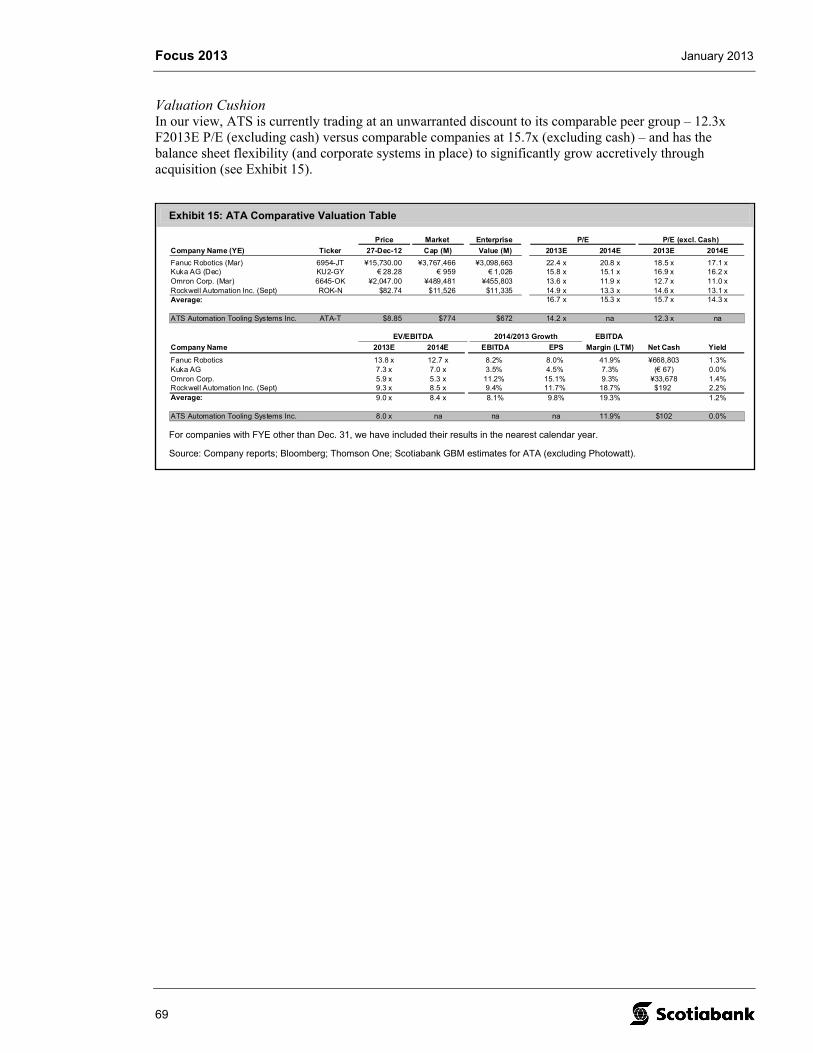
Focus 2013 January 2013
69
Exhibit 15: ATA Comparative Valuation Table
Price Market Enterprise P/E P/E (excl. Cash)
Company Name (YE) Ticker 27-Dec-12 Cap (M) Value (M) 2013E 2014E 2013E 2014E
Fanuc Robotics (Mar) 6954-JT ¥15,730.00 ¥3,767,466 ¥3,098,663 22.4 x 20.8 x 18.5 x 17.1 xKuka AG (Dec) KU2-GY € 28.28 € 959 € 1,026 15.8 x 15.1 x 16.9 x 16.2 xOmron Corp. (Mar) 6645-OK ¥2,047.00 ¥489,481 ¥455,803 13.6 x 11.9 x 12.7 x 11.0 xRockwell Automation Inc. (Sept) ROK-N $82.74 $11,526 $11,335 14.9 x 13.3 x 14.6 x 13.1 xAverage: 16.7 x 15.3 x 15.7 x 14.3 x
ATS Automation Tooling Systems Inc. ATA-T $8.85 $774 $672 14.2 x na 12.3 x na
EV/EBITDA 2014/2013 Growth EBITDA
Company Name 2013E 2014E EBITDA EPS Margin (LTM) Net Cash Yield
Fanuc Robotics 13.8 x 12.7 x 8.2% 8.0% 41.9% ¥668,803 1.3%Kuka AG 7.3 x 7.0 x 3.5% 4.5% 7.3% (€ 67) 0.0%Omron Corp. 5.9 x 5.3 x 11.2% 15.1% 9.3% ¥33,678 1.4%Rockwell Automation Inc. (Sept) 9.3 x 8.5 x 9.4% 11.7% 18.7% $192 2.2%Average: 9.0 x 8.4 x 8.1% 9.8% 19.3% 1.2%
ATS Automation Tooling Systems Inc. 8.0 x na na na 11.9% $102 0.0%
For companies with FYE other than Dec. 31, we have included their results in the nearest calendar year.
Source: Company reports; Bloomberg; Thomson One; Scotiabank GBM estimates for ATA (excluding Photowatt).
Valuation Cushion In our view, ATS is currently trading at an unwarranted discount to its comparable peer group – 12.3x F2013E P/E (excluding cash) versus comparable companies at 15.7x (excluding cash) – and has the balance sheet flexibility (and corporate systems in place) to significantly grow accretively through acquisition (see Exhibit 15).

Focus 2013 January 2013
70
T H I S P A G E L E F T I N T E N T I O N A L L Y B L A N K .
Focus 2013 January 2013
Matthew Akman, MBA (416) 863-7798 Tuc Tuncay, P.Eng., CFA (416) 865-6337 (Scotia Capital Inc. – Canada) (Scotia Capital Inc. – Canada) [email protected] Rusty Wong, CA, CFA (416) 863-5915 (Scotia Capital Inc. – Canada)
71
Energy Infrastructure
Pipelines and Power Lines
Our outlook for 2013 highlights several key themes that should drive stock values going forward, namely, organic growth and commodity exposures. Given this set of drivers, we expect Enbridge Inc. (ENB-T; SO; one-year target $48.00) and Canadian Utilities Limited (CU-T; SO; one-year target $82.00) to thrive due to their robust expansion plans and, consequentially, TransAlta Corp. (TA-T; SU; one-year target $14.00) and Capital Power Corporation (CPX-T; SU; one-year target $20.00) to continue facing headwinds due to merchant power market exposures. We also note that there will be a critical decision by the U.S. government that may very well determine the fate of the Keystone XL pipeline and set the tone for the performance of TransCanada Corporation (TRP-T; SO; one-year target $55.00) over the next year. If the Keystone XL pipeline is approved (decision expected in Q1/13), we expect upside to TransCanada’s stock. Announcements such as the conversion of a portion of the mainline to oil transportation could also be another catalyst.
O R G A N I C G R O W T H R E M A I N S R O B U S T
The rapid pace of organic growth in the Canadian pipeline and midstream sector persists. At the same time, returns on capital remain robust while the cost of capital has fallen. As a result, companies with advantageous costs of capital and robust organic growth budgets appear poised to generate meaningful shareholder value. In the four-year period 2013 to 2016, we estimate that midstream and pipeline companies in our coverage universe will spend over $25 billion on new energy infrastructure. While we generally expect balanced sources of funding for our companies, the cost of mezzanine and debt financing has fallen to particularly astounding lows – driving the cost of capital down. Companies in our sector are issuing billions of dollars of preferred shares with 4%-5% coupons and receiving up to 50% equity credit for them from the rating agencies. At the same time, many midstream companies are issuing medium-term notes with 3%-5% coupons. Many of the companies in our coverage universe have U.S. assets and are hedging currency by issuing U.S.-dollar-denominated debt. The base rates are so low in the U.S. that the cost of debt for high-quality pipeline companies has dropped to 2%-3%. We expect ENB, TRP, CU, and Pembina Pipeline Corporation (PPL-T; SO; one-year target $31.00) to be the primary beneficiaries of this trend in 2013.
W E A K P O W E R P R I C E S L I K E L Y T O P E R S I S T
Commodity exposure remains an area of concern for our stocks, namely, companies that have merchant power exposure. Forward power prices are generally driven by the supply/demand balance and forward natural gas pricing. We see generous sources of supply in several markets, particularly in Mid-C, where hydroelectric production has been at record highs, and in Alberta, where new power projects entering service and the return of the Sundance A units have increased the supply cushion. Expectations for natural gas prices continue to be low due to abundant supplies of shale gas and well-stocked storage pools (due to warmer-than-average weather). In a nutshell, we expect forward power prices to remain weak in Alberta ($50-$55/MWh range), the Pacific Northwest ($35/MWh or less), and the U.S. Northeast. We expect the power price headwind to primarily impact CPX, TA, and AltaGas Ltd. (ALA-T; SU; one-year target $28.00), but to a lesser extent, CU, ATCO Ltd. (ACO.X-T; SP; one-year target $82.00), and TRP could also be impacted.
Focus 2013 January 2013
72
N G L P R I C I N G A P P E A R S T O B E P O I S E D F O R R E C O V E R Y
FRAC spreads and NGL prices weakened in 2012 due to high inventories of propane and ethane, despite strong demand for condensate. The propane market has been soft due to moderate weather driving up inventories. The commissioning of several propane export facilities on the U.S. Gulf Coast, increasing export capacity from 4 MMbbl/month to about 12 MMbbl/month by the end of 2013, should help relieve the oversupply situation as products move offshore to capture higher international market prices. A return to normalized weather patterns should also help boost domestic demand. Ethane has also been weak due to turnarounds at petrochemical facilities, driving inventories above long-term averages. While we expect the ethane market to remain relatively soft until new crackers are ultimately commissioned (mid-decade), new NGL pipelines entering service in the next year should help relieve some of the basis differential between Mont Belvieu and Conway. A lift in FRAC spreads and NGL pricing would generally be beneficial to the likes of Inter Pipeline Fund (IPL.UN-T; SO; one-year target $24.00), PPL, Spectra Energy Corp. (SE-N; SP; one-year target US$30.00), Veresen Inc. (VSN-T; SO; one-year target $14.00), Keyera Corp. (KEY-T; SP; one-year target $47.00), and ALA.
O U T P E R F O R M E R S
Enbridge Inc. (ENB-T; Sector Outperform; One-Year Target $48.00)
We expect significant EPS and dividend growth under the CTS tolling arrangement whereby ENB benefits with rising volumes (and tolls, capturing returns on capital expenditures) on its mainline. In addition, near-term volume growth from the Seaway pipeline project reversal (400 thousand barrels per day [kbpd] expected in Q1/13, up from about 150 kbpd) and growth in the regional oil sands segment (new pipelines and expansions entering service) should add meaningful contribution to earnings. Further announcements of commercial agreements could also serve as positive catalysts as over $5.5 billion of risked unsecured project announcements remain on the horizon.
Low-cost debt/preferred share financing should help balance funding sources and keep the cost of capital low. Contribution from sponsored investment vehicles, such as Enbridge Income Fund Holdings Inc. (ENF-T; SP; one-year target $25.50) and Enbridge Energy Partners should also continue to add earnings, in addition to being a low-cost source of capital from dropdowns.
Potential risks include volume levels on the mainline, maintenance capital (integrity spending), and, to a lesser extent, impacts of commodities at Aux Sable and gas midstream segments.
Canadian Utilities Limited (CU-T; Sector Outperform; One-Year Target $82)
CU stands out in the sector for growth and achieved returns on capital. While many utility companies are buying regulated utility for 1.5x book value, CU is building it at 1.0x. The regulated utility rate base is expected to nearly double between 2012 and 2014 due to a significant amount of investment in electricity transmission, driving strong earnings and dividend growth. The payout ratio could also increase to keep up with earnings momentum, implying double-digit dividend growth in the future.
The stock remains attractive on valuation, trading at a significant discount (16.5x 2013E earnings) to regulated utility peers (19x and above).
Potential risks include Alberta power prices and spark spreads, regulatory risk from the outcome of the final PBR structure (impacts electric/gas utilities, transmission excluded), and regulated ROEs.
Focus 2013 January 2013
73
U N D E R P E R F O R M E R S
TransAlta Corporation (TA-T; Sector Underperform; One-Year Target $14.00)
We question the sustainability of TA’s cash flows and dividend as the company navigates though a period of high maintenance spending and low power prices. In our view, consensus estimates and management guidance are not factoring in significant headwinds such as the decline of above-market contracts at Centralia, lower power prices ($1/MWh change in Pacific Northwest or Alberta power prices impacts TA’s EBITDA by $6 million), and a return to normal hydrology in Alberta.
Despite management cutting maintenance capital budgets and implementing cost savings by way of headcount reductions, we expect a payout ratio of above 100% for the foreseeable future. In our view, the risk of a dividend cut remains high despite heavy utilization from DRIP proceeds, which in we believe is unsustainable.
Potential risks to our thesis include a significant increase in power prices, execution of above-market contracts, JV announcements, and persistent higher-than-normal hydrology levels in Alberta.
Capital Power Corporation (CPX-T; Sector Underperform; One-Year Target $20.00)
In contrast to TransAlta, Capital Power has newer assets but still significant exposure to the Alberta merchant power market, which we expect will remain depressed in 2013. Despite the recent deal with ENMAX for 50% of the Shepard power plant (commercial operations expected in 2015), CPX has entered into forward contracts in the $50-$55/MWh range and potentially locked in lower realized earnings for the foreseeable future.
Any potential for significant recovery in the U.S. Northeast power market also appears unlikely. In New England, as in many other power markets, utilities are signing contracts with new power developers, which in turn reduces capacity prices for incumbents. A recent FERC ruling appears to direct the New England ISO to implement minimum capacity offer prices. But as in any recovery in Alberta power, these capacity price changes and improvements appear unlikely to have an impact until 2017.
We don’t see a catalyst for meaningful dividend increases in that timeframe. Finally, EPCOR still owns 29% of CPX; secondary issues may keep downward pressure on the stock, despite improving liquidity longer term.
Potential risks to our thesis include a significant increase in power prices and execution of above-market contracts.
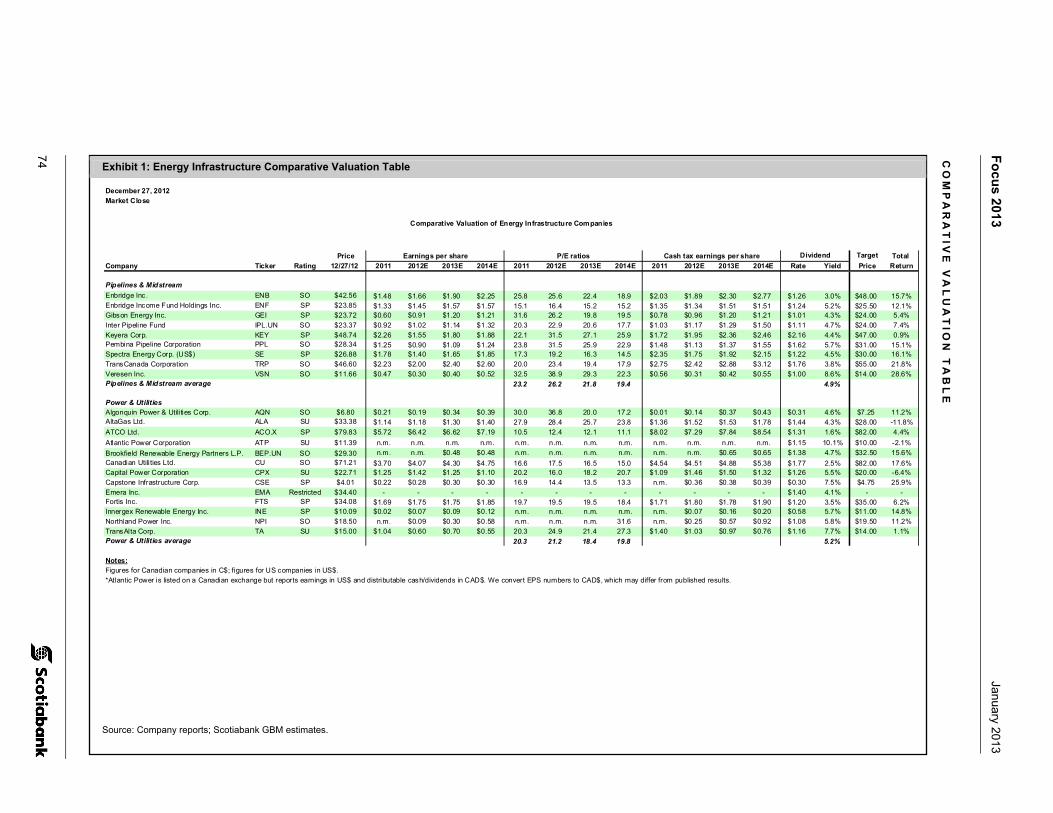
74
Fo
cus 2013
January 2013
Exhibit 1: Energy Infrastructure Comparative Valuation Table
December 27, 2012
Market Close
Price Target Total
Company Ticker Rating 12/27/12 2011 2012E 2013E 2014E 2011 2012E 2013E 2014E 2011 2012E 2013E 2014E Rate Yield Price Return
Pipelines & Midstream
Enbridge Inc. ENB SO $42.56 $1.48 $1.66 $1.90 $2.25 25.8 25.6 22.4 18.9 $2.03 $1.89 $2.30 $2.77 $1.26 3.0% $48.00 15.7%Enbridge Income Fund Holdings Inc. ENF SP $23.85 $1.33 $1.45 $1.57 $1.57 15.1 16.4 15.2 15.2 $1.35 $1.34 $1.51 $1.51 $1.24 5.2% $25.50 12.1%Gibson Energy Inc. GEI SP $23.72 $0.60 $0.91 $1.20 $1.21 31.6 26.2 19.8 19.5 $0.78 $0.96 $1.20 $1.21 $1.01 4.3% $24.00 5.4%
Inter Pipeline Fund IPL.UN SO $23.37 $0.92 $1.02 $1.14 $1.32 20.3 22.9 20.6 17.7 $1.03 $1.17 $1.29 $1.50 $1.11 4.7% $24.00 7.4%
Keyera Corp. KEY SP $48.74 $2.26 $1.55 $1.80 $1.88 22.1 31.5 27.1 25.9 $1.72 $1.95 $2.36 $2.46 $2.16 4.4% $47.00 0.9%Pembina Pipeline Corporation PPL SO $28.34 $1.25 $0.90 $1.09 $1.24 23.8 31.5 25.9 22.9 $1.48 $1.13 $1.37 $1.55 $1.62 5.7% $31.00 15.1%Spectra Energy Corp. (US$) SE SP $26.88 $1.78 $1.40 $1.65 $1.85 17.3 19.2 16.3 14.5 $2.35 $1.75 $1.92 $2.15 $1.22 4.5% $30.00 16.1%
TransCanada Corporation TRP SO $46.60 $2.23 $2.00 $2.40 $2.60 20.0 23.4 19.4 17.9 $2.75 $2.42 $2.88 $3.12 $1.76 3.8% $55.00 21.8%
Veresen Inc. VSN SO $11.66 $0.47 $0.30 $0.40 $0.52 32.5 38.9 29.3 22.3 $0.56 $0.31 $0.42 $0.55 $1.00 8.6% $14.00 28.6%Pipelines & Midstream average 23.2 26.2 21.8 19.4 4.9%
Power & Utilities Algonquin Power & Utilities Corp. AQN SO $6.80 $0.21 $0.19 $0.34 $0.39 30.0 36.8 20.0 17.2 $0.01 $0.14 $0.37 $0.43 $0.31 4.6% $7.25 11.2%AltaGas Ltd. ALA SU $33.38 $1.14 $1.18 $1.30 $1.40 27.9 28.4 25.7 23.8 $1.36 $1.52 $1.53 $1.78 $1.44 4.3% $28.00 -11.8%
ATCO Ltd. ACO.X SP $79.83 $5.72 $6.42 $6.62 $7.19 10.5 12.4 12.1 11.1 $8.02 $7.29 $7.84 $8.54 $1.31 1.6% $82.00 4.4%
Atlantic Power Corporation ATP SU $11.39 n.m. n.m. n.m. n.m. n.m. n.m. n.m. n.m. n.m. n.m. n.m. n.m. $1.15 10.1% $10.00 -2.1%
Brookfield Renewable Energy Partners L.P. BEP.UN SO $29.30 n.m. n.m. $0.48 $0.48 n.m. n.m. n.m. n.m. n.m. n.m. $0.65 $0.65 $1.38 4.7% $32.50 15.6%
Canadian Utilities Ltd. CU SO $71.21 $3.70 $4.07 $4.30 $4.75 16.6 17.5 16.5 15.0 $4.54 $4.51 $4.88 $5.38 $1.77 2.5% $82.00 17.6%Capital Power Corporation CPX SU $22.71 $1.25 $1.42 $1.25 $1.10 20.2 16.0 18.2 20.7 $1.09 $1.46 $1.50 $1.32 $1.26 5.5% $20.00 -6.4%
Capstone Infrastructure Corp. CSE SP $4.01 $0.22 $0.28 $0.30 $0.30 16.9 14.4 13.5 13.3 n.m. $0.36 $0.38 $0.39 $0.30 7.5% $4.75 25.9%
Emera Inc. EMA Restricted $34.40 - - - - - - - - - - - - $1.40 4.1% - -Fortis Inc. FTS SP $34.08 $1.69 $1.75 $1.75 $1.85 19.7 19.5 19.5 18.4 $1.71 $1.80 $1.78 $1.90 $1.20 3.5% $35.00 6.2%Innergex Renewable Energy Inc. INE SP $10.09 $0.02 $0.07 $0.09 $0.12 n.m. n.m. n.m. n.m. n.m. $0.07 $0.16 $0.20 $0.58 5.7% $11.00 14.8%
Northland Power Inc. NPI SO $18.50 n.m. $0.09 $0.30 $0.58 n.m. n.m. n.m. 31.6 n.m. $0.25 $0.57 $0.92 $1.08 5.8% $19.50 11.2%
TransAlta Corp. TA SU $15.00 $1.04 $0.60 $0.70 $0.55 20.3 24.9 21.4 27.3 $1.40 $1.03 $0.97 $0.76 $1.16 7.7% $14.00 1.1%Power & Utilities average 20.3 21.2 18.4 19.8 5.2%
Notes:Figures for Canadian companies in C$; figures for US companies in US$.
*Atlantic Power is listed on a Canadian exchange but reports earnings in US$ and distributable cash/dividends in CAD$. We convert EPS numbers to CAD$, which may differ from published results.
Comparative Valuation of Energy Infrastructure Companies
Cash tax earnings per shareP/E ratiosEarnings per share Dividend
Source: Company reports; Scotiabank GBM estimates.
CO
MP
AR
AT
IVE
VA
LU
AT
ION
TA
BL
E
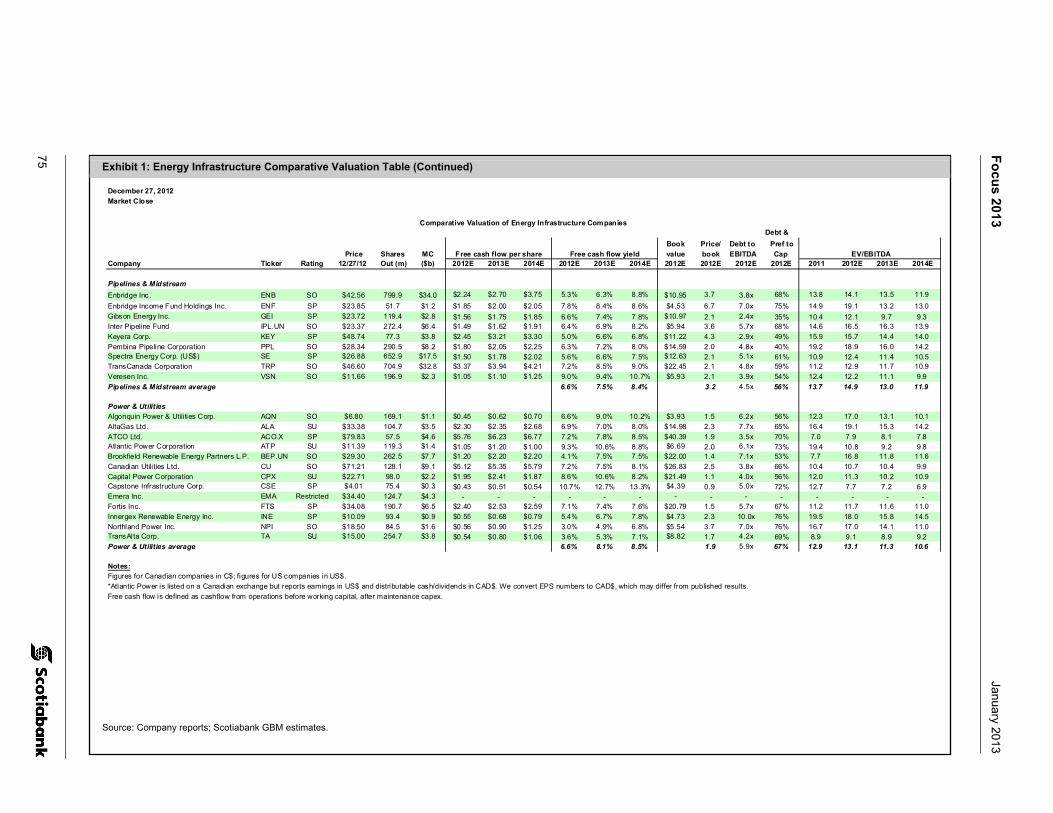
75
Fo
cus 2013
January 2013
Exhibit 1: Energy Infrastructure Comparative Valuation Table (Continued)
December 27, 2012 Market Close
Debt &
Book Price/ Debt to Pref to
Price Shares MC value book EBITDA Cap Company Ticker Rating 12/27/12 Out (m) ($b) 2012E 2013E 2014E 2012E 2013E 2014E 2012E 2012E 2012E 2012E 2011 2012E 2013E 2014E
Pipelines & Midstream
Enbridge Inc. ENB SO $42.56 799.9 $34.0 $2.24 $2.70 $3.75 5.3% 6.3% 8.8% $10.95 3.7 3.8x 68% 13.8 14.1 13.5 11.9
Enbridge Income Fund Holdings Inc. ENF SP $23.85 51.7 $1.2 $1.85 $2.00 $2.05 7.8% 8.4% 8.6% $4.53 6.7 7.0x 75% 14.9 19.1 13.2 13.0
Gibson Energy Inc. GEI SP $23.72 119.4 $2.8 $1.56 $1.75 $1.85 6.6% 7.4% 7.8% $10.97 2.1 2.4x 35% 10.4 12.1 9.7 9.3Inter Pipeline Fund IPL.UN SO $23.37 272.4 $6.4 $1.49 $1.62 $1.91 6.4% 6.9% 8.2% $5.94 3.6 5.7x 68% 14.6 16.5 16.3 13.9
Keyera Corp. KEY SP $48.74 77.3 $3.8 $2.45 $3.21 $3.30 5.0% 6.6% 6.8% $11.22 4.3 2.9x 49% 15.9 15.7 14.4 14.0
Pembina Pipeline Corporation PPL SO $28.34 290.5 $8.2 $1.80 $2.05 $2.25 6.3% 7.2% 8.0% $14.59 2.0 4.8x 40% 19.2 18.9 16.0 14.2Spectra Energy Corp. (US$) SE SP $26.88 652.9 $17.5 $1.50 $1.78 $2.02 5.6% 6.6% 7.5% $12.63 2.1 5.1x 61% 10.9 12.4 11.4 10.5TransCanada Corporation TRP SO $46.60 704.9 $32.8 $3.37 $3.94 $4.21 7.2% 8.5% 9.0% $22.45 2.1 4.8x 59% 11.2 12.9 11.7 10.9
Veresen Inc. VSN SO $11.66 196.9 $2.3 $1.05 $1.10 $1.25 9.0% 9.4% 10.7% $5.93 2.1 3.9x 54% 12.4 12.2 11.1 9.9
Pipelines & Midstream average 6.6% 7.5% 8.4% 3.2 4.5x 56% 13.7 14.9 13.0 11.9
Power & Utilities Algonquin Power & Utilities Corp. AQN SO $6.80 169.1 $1.1 $0.45 $0.62 $0.70 6.6% 9.0% 10.2% $3.93 1.5 6.2x 56% 12.3 17.0 13.1 10.1
AltaGas Ltd. ALA SU $33.38 104.7 $3.5 $2.30 $2.35 $2.68 6.9% 7.0% 8.0% $14.98 2.3 7.7x 65% 16.4 19.1 15.3 14.2
ATCO Ltd. ACO.X SP $79.83 57.5 $4.6 $5.76 $6.23 $6.77 7.2% 7.8% 8.5% $40.39 1.9 3.5x 70% 7.0 7.9 8.1 7.8Atlantic Power Corporation ATP SU $11.39 119.3 $1.4 $1.05 $1.20 $1.00 9.3% 10.6% 8.8% $6.69 2.0 6.1x 73% 19.4 10.8 9.2 9.8Brookfield Renewable Energy Partners L.P. BEP.UN SO $29.30 262.5 $7.7 $1.20 $2.20 $2.20 4.1% 7.5% 7.5% $22.00 1.4 7.1x 53% 7.7 16.8 11.8 11.6
Canadian Utilities Ltd. CU SO $71.21 128.1 $9.1 $5.12 $5.35 $5.79 7.2% 7.5% 8.1% $26.83 2.5 3.8x 66% 10.4 10.7 10.4 9.9
Capital Power Corporation CPX SU $22.71 98.0 $2.2 $1.95 $2.41 $1.87 8.6% 10.6% 8.2% $21.49 1.1 4.0x 56% 12.0 11.3 10.2 10.9Capstone Infrastructure Corp. CSE SP $4.01 75.4 $0.3 $0.43 $0.51 $0.54 10.7% 12.7% 13.3% $4.39 0.9 5.0x 72% 12.7 7.7 7.2 6.9Emera Inc. EMA Restricted $34.40 124.7 $4.3 - - - - - - - - - - - - - -Fortis Inc. FTS SP $34.08 190.7 $6.5 $2.40 $2.53 $2.59 7.1% 7.4% 7.6% $20.79 1.5 5.7x 67% 11.2 11.7 11.6 11.0
Innergex Renewable Energy Inc. INE SP $10.09 93.4 $0.9 $0.55 $0.68 $0.79 5.4% 6.7% 7.8% $4.73 2.3 10.0x 76% 19.5 18.0 15.8 14.5
Northland Power Inc. NPI SO $18.50 84.5 $1.6 $0.56 $0.90 $1.25 3.0% 4.9% 6.8% $5.54 3.7 7.0x 76% 16.7 17.0 14.1 11.0TransAlta Corp. TA SU $15.00 254.7 $3.8 $0.54 $0.80 $1.06 3.6% 5.3% 7.1% $8.82 1.7 4.2x 69% 8.9 9.1 8.9 9.2Power & Utilities average 6.6% 8.1% 8.5% 1.9 5.9x 67% 12.9 13.1 11.3 10.6
Notes:Figures for Canadian companies in C$; figures for US companies in US$.
*Atlantic Power is listed on a Canadian exchange but reports earnings in US$ and distributable cash/dividends in CAD$. We convert EPS numbers to CAD$, which may differ from published results.
Free cash flow is defined as cashflow from operations before working capital, after maintenance capex.
Free cash flow per share
Comparative Valuation of Energy Infrastructure Companies
Free cash flow yield EV/EBITDA
Source: Company reports; Scotiabank GBM estimates.

Focus 2013 January 2013
76
T H I S P A G E L E F T I N T E N T I O N A L L Y B L A N K .
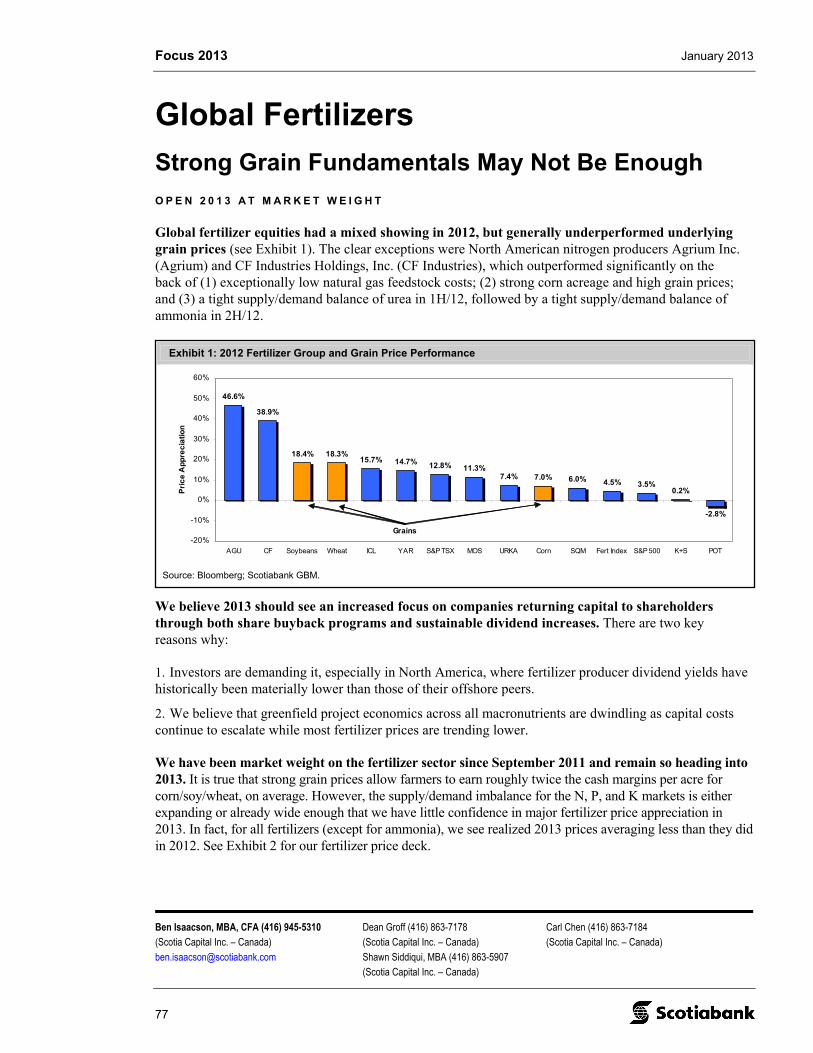
Focus 2013 January 2013
Ben Isaacson, MBA, CFA (416) 945-5310 Dean Groff (416) 863-7178 Carl Chen (416) 863-7184 (Scotia Capital Inc. – Canada) (Scotia Capital Inc. – Canada) (Scotia Capital Inc. – Canada) [email protected] Shawn Siddiqui, MBA (416) 863-5907 (Scotia Capital Inc. – Canada)
77
Exhibit 1: 2012 Fertilizer Group and Grain Price Performance
46.6%
38.9%
18.4% 18.3%15.7% 14.7% 12.8% 11.3%
7.4% 7.0% 6.0% 4.5% 3.5%0.2%
-2.8%
-20%
-10%
0%
10%
20%
30%
40%
50%
60%
AGU CF Soybeans Wheat ICL YAR S&P TSX MOS URKA Corn SQM Fert Index S&P 500 K+S POT
Pri
ce
Ap
pre
cia
tio
n
Grains
Source: Bloomberg; Scotiabank GBM.
Global Fertilizers
Strong Grain Fundamentals May Not Be Enough
O P E N 2 0 1 3 A T M A R K E T W E I G H T
Global fertilizer equities had a mixed showing in 2012, but generally underperformed underlying grain prices (see Exhibit 1). The clear exceptions were North American nitrogen producers Agrium Inc. (Agrium) and CF Industries Holdings, Inc. (CF Industries), which outperformed significantly on the back of (1) exceptionally low natural gas feedstock costs; (2) strong corn acreage and high grain prices; and (3) a tight supply/demand balance of urea in 1H/12, followed by a tight supply/demand balance of ammonia in 2H/12.
We believe 2013 should see an increased focus on companies returning capital to shareholders through both share buyback programs and sustainable dividend increases. There are two key reasons why:
1. Investors are demanding it, especially in North America, where fertilizer producer dividend yields have historically been materially lower than those of their offshore peers.
2. We believe that greenfield project economics across all macronutrients are dwindling as capital costs continue to escalate while most fertilizer prices are trending lower.
We have been market weight on the fertilizer sector since September 2011 and remain so heading into 2013. It is true that strong grain prices allow farmers to earn roughly twice the cash margins per acre for corn/soy/wheat, on average. However, the supply/demand imbalance for the N, P, and K markets is either expanding or already wide enough that we have little confidence in major fertilizer price appreciation in 2013. In fact, for all fertilizers (except for ammonia), we see realized 2013 prices averaging less than they did in 2012. See Exhibit 2 for our fertilizer price deck.
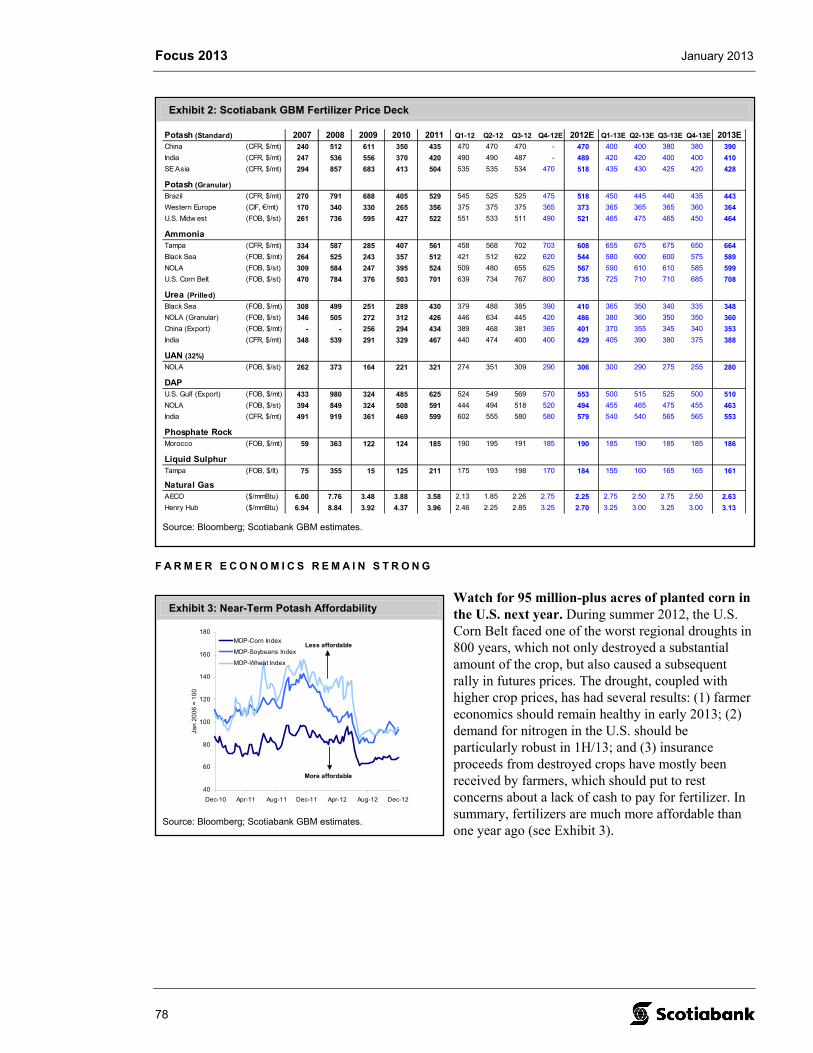
Focus 2013 January 2013
78
Exhibit 3: Near-Term Potash Affordability
40
60
80
100
120
140
160
180
Dec-10 Apr-11 Aug-11 Dec-11 Apr-12 Aug-12 Dec-12
Jan
20
06
= 1
00
MOP-Corn Index
MOP-Soybeans Index
MOP-Wheat Index
More affordable
Less affordable
Source: Bloomberg; Scotiabank GBM estimates.
Exhibit 2: Scotiabank GBM Fertilizer Price Deck
Potash (Standard) 2007 2008 2009 2010 2011 Q1-12 Q2-12 Q3-12 Q4-12E 2012E Q1-13E Q2-13E Q3-13E Q4-13E 2013EChina (CFR, $/mt) 240 512 611 350 435 470 470 470 - 470 400 400 380 380 390
India (CFR, $/mt) 247 536 556 370 420 490 490 487 - 489 420 420 400 400 410
SE Asia (CFR, $/mt) 294 857 683 413 504 535 535 534 470 518 435 430 425 420 428
Potash (Granular)
Brazil (CFR, $/mt) 270 791 688 405 529 545 525 525 475 518 450 445 440 435 443
Western Europe (CIF, €/mt) 170 340 330 265 356 375 375 375 365 373 365 365 365 360 364
U.S. Midw est (FOB, $/st) 261 736 595 427 522 551 533 511 490 521 465 475 465 450 464
AmmoniaTampa (CFR, $/mt) 334 587 285 407 561 458 568 702 703 608 655 675 675 650 664
Black Sea (FOB, $/mt) 264 525 243 357 512 421 512 622 620 544 580 600 600 575 589
NOLA (FOB, $/st) 309 584 247 395 524 509 480 655 625 567 590 610 610 585 599
U.S. Corn Belt (FOB, $/st) 470 784 376 503 701 639 734 767 800 735 725 710 710 685 708
Urea (Prilled)
Black Sea (FOB, $/mt) 308 499 251 289 430 379 488 385 390 410 365 350 340 335 348
NOLA (Granular) (FOB, $/st) 346 505 272 312 426 446 634 445 420 486 380 360 350 350 360
China (Export) (FOB, $/mt) - - 256 294 434 389 468 381 365 401 370 355 345 340 353
India (CFR, $/mt) 348 539 291 329 467 440 474 400 400 429 405 390 380 375 388
UAN (32%)
NOLA (FOB, $/st) 262 373 164 221 321 274 351 309 290 306 300 290 275 255 280
DAPU.S. Gulf (Export) (FOB, $/mt) 433 980 324 485 625 524 549 569 570 553 500 515 525 500 510
NOLA (FOB, $/st) 394 849 324 508 591 444 494 518 520 494 455 465 475 455 463
India (CFR, $/mt) 491 919 361 469 599 602 555 580 580 579 540 540 565 565 553
Phosphate RockMorocco (FOB, $/mt) 59 363 122 124 185 190 195 191 185 190 185 190 185 185 186
Liquid SulphurTampa (FOB, $/lt) 75 355 15 125 211 175 193 198 170 184 155 160 165 165 161
Natural GasAECO ($/mmBtu) 6.00 7.76 3.48 3.88 3.58 2.13 1.85 2.26 2.75 2.25 2.75 2.50 2.75 2.50 2.63
Henry Hub ($/mmBtu) 6.94 8.84 3.92 4.37 3.96 2.46 2.25 2.85 3.25 2.70 3.25 3.00 3.25 3.00 3.13
Source: Bloomberg; Scotiabank GBM estimates.
F A R M E R E C O N O M I C S R E M A I N S T R O N G
Watch for 95 million-plus acres of planted corn in the U.S. next year. During summer 2012, the U.S. Corn Belt faced one of the worst regional droughts in 800 years, which not only destroyed a substantial amount of the crop, but also caused a subsequent rally in futures prices. The drought, coupled with higher crop prices, has had several results: (1) farmer economics should remain healthy in early 2013; (2) demand for nitrogen in the U.S. should be particularly robust in 1H/13; and (3) insurance proceeds from destroyed crops have mostly been received by farmers, which should put to rest concerns about a lack of cash to pay for fertilizer. In summary, fertilizers are much more affordable than one year ago (see Exhibit 3).
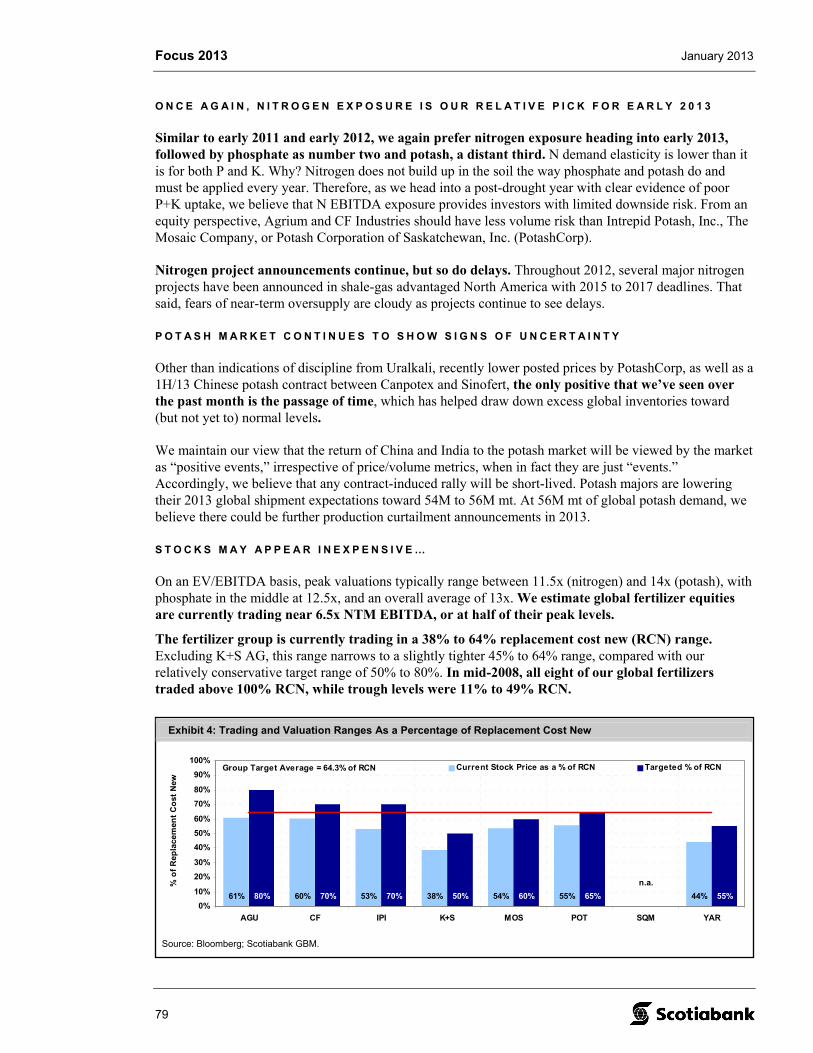
Focus 2013 January 2013
79
Exhibit 4: Trading and Valuation Ranges As a Percentage of Replacement Cost New
61% 60% 53% 38% 54% 55% 44%80% 70% 70% 50% 60% 65% 55%0%
10%
20%
30%
40%
50%
60%
70%
80%
90%
100%
AGU CF IPI K+S MOS POT SQM YAR
% o
f R
epla
cem
ent
Co
st N
ew
Current Stock Price as a % of RCN Targeted % of RCNGroup Target Average = 64.3% of RCN
n.a.
Source: Bloomberg; Scotiabank GBM.
O N C E A G A I N , N I T R O G E N E X P O S U R E I S O U R R E L A T I V E P I C K F O R E A R L Y 2 0 1 3
Similar to early 2011 and early 2012, we again prefer nitrogen exposure heading into early 2013, followed by phosphate as number two and potash, a distant third. N demand elasticity is lower than it is for both P and K. Why? Nitrogen does not build up in the soil the way phosphate and potash do and must be applied every year. Therefore, as we head into a post-drought year with clear evidence of poor P+K uptake, we believe that N EBITDA exposure provides investors with limited downside risk. From an equity perspective, Agrium and CF Industries should have less volume risk than Intrepid Potash, Inc., The Mosaic Company, or Potash Corporation of Saskatchewan, Inc. (PotashCorp).
Nitrogen project announcements continue, but so do delays. Throughout 2012, several major nitrogen projects have been announced in shale-gas advantaged North America with 2015 to 2017 deadlines. That said, fears of near-term oversupply are cloudy as projects continue to see delays.
P O T A S H M A R K E T C O N T I N U E S T O S H O W S I G N S O F U N C E R T A I N T Y
Other than indications of discipline from Uralkali, recently lower posted prices by PotashCorp, as well as a 1H/13 Chinese potash contract between Canpotex and Sinofert, the only positive that we’ve seen over the past month is the passage of time, which has helped draw down excess global inventories toward (but not yet to) normal levels.
We maintain our view that the return of China and India to the potash market will be viewed by the market as “positive events,” irrespective of price/volume metrics, when in fact they are just “events.” Accordingly, we believe that any contract-induced rally will be short-lived. Potash majors are lowering their 2013 global shipment expectations toward 54M to 56M mt. At 56M mt of global potash demand, we believe there could be further production curtailment announcements in 2013.
S T O C K S M A Y A P P E A R I N E X P E N S I V E …
On an EV/EBITDA basis, peak valuations typically range between 11.5x (nitrogen) and 14x (potash), with phosphate in the middle at 12.5x, and an overall average of 13x. We estimate global fertilizer equities are currently trading near 6.5x NTM EBITDA, or at half of their peak levels.
The fertilizer group is currently trading in a 38% to 64% replacement cost new (RCN) range. Excluding K+S AG, this range narrows to a slightly tighter 45% to 64% range, compared with our relatively conservative target range of 50% to 80%. In mid-2008, all eight of our global fertilizers traded above 100% RCN, while trough levels were 11% to 49% RCN.
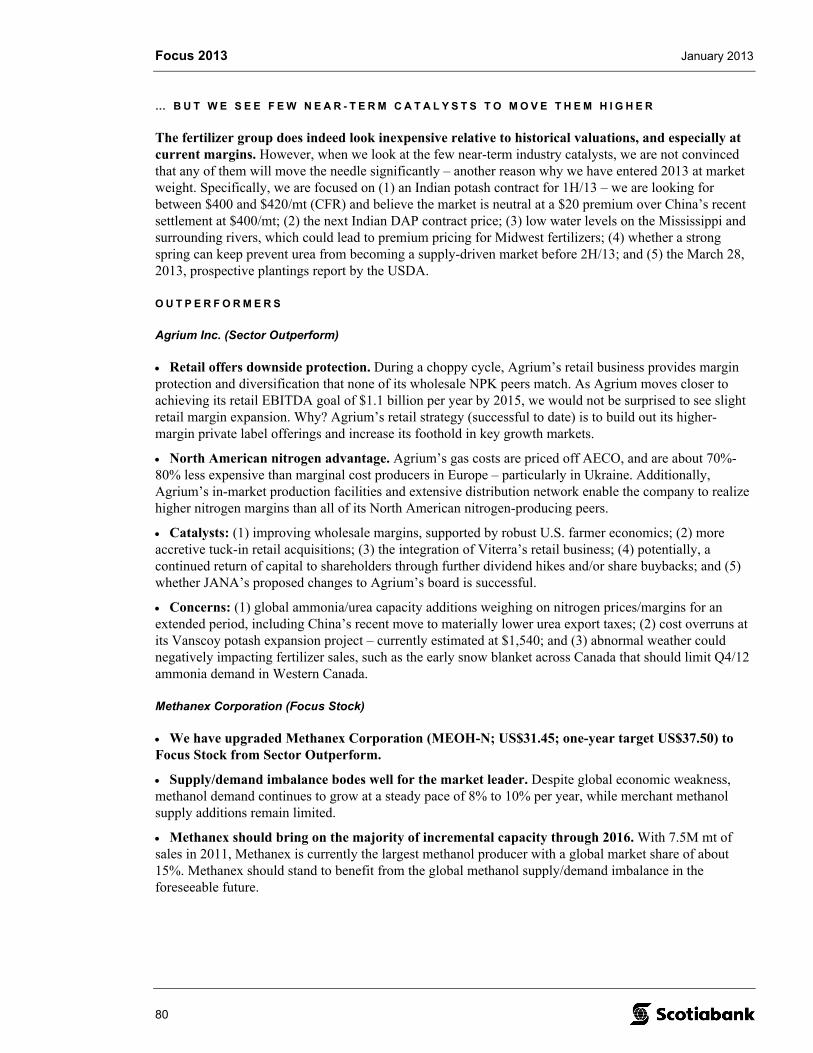
Focus 2013 January 2013
80
… B U T W E S E E F E W N E A R - T E R M C A T A L Y S T S T O M O V E T H E M H I G H E R
The fertilizer group does indeed look inexpensive relative to historical valuations, and especially at current margins. However, when we look at the few near-term industry catalysts, we are not convinced that any of them will move the needle significantly – another reason why we have entered 2013 at market weight. Specifically, we are focused on (1) an Indian potash contract for 1H/13 – we are looking for between $400 and $420/mt (CFR) and believe the market is neutral at a $20 premium over China’s recent settlement at $400/mt; (2) the next Indian DAP contract price; (3) low water levels on the Mississippi and surrounding rivers, which could lead to premium pricing for Midwest fertilizers; (4) whether a strong spring can keep prevent urea from becoming a supply-driven market before 2H/13; and (5) the March 28, 2013, prospective plantings report by the USDA.
O U T P E R F O R M E R S
Agrium Inc. (Sector Outperform)
Retail offers downside protection. During a choppy cycle, Agrium’s retail business provides margin protection and diversification that none of its wholesale NPK peers match. As Agrium moves closer to achieving its retail EBITDA goal of $1.1 billion per year by 2015, we would not be surprised to see slight retail margin expansion. Why? Agrium’s retail strategy (successful to date) is to build out its higher-margin private label offerings and increase its foothold in key growth markets.
North American nitrogen advantage. Agrium’s gas costs are priced off AECO, and are about 70%-80% less expensive than marginal cost producers in Europe – particularly in Ukraine. Additionally, Agrium’s in-market production facilities and extensive distribution network enable the company to realize higher nitrogen margins than all of its North American nitrogen-producing peers.
Catalysts: (1) improving wholesale margins, supported by robust U.S. farmer economics; (2) more accretive tuck-in retail acquisitions; (3) the integration of Viterra’s retail business; (4) potentially, a continued return of capital to shareholders through further dividend hikes and/or share buybacks; and (5) whether JANA’s proposed changes to Agrium’s board is successful.
Concerns: (1) global ammonia/urea capacity additions weighing on nitrogen prices/margins for an extended period, including China’s recent move to materially lower urea export taxes; (2) cost overruns at its Vanscoy potash expansion project – currently estimated at $1,540; and (3) abnormal weather could negatively impacting fertilizer sales, such as the early snow blanket across Canada that should limit Q4/12 ammonia demand in Western Canada.
Methanex Corporation (Focus Stock)
We have upgraded Methanex Corporation (MEOH-N; US$31.45; one-year target US$37.50) to Focus Stock from Sector Outperform.
Supply/demand imbalance bodes well for the market leader. Despite global economic weakness, methanol demand continues to grow at a steady pace of 8% to 10% per year, while merchant methanol supply additions remain limited.
Methanex should bring on the majority of incremental capacity through 2016. With 7.5M mt of sales in 2011, Methanex is currently the largest methanol producer with a global market share of about 15%. Methanex should stand to benefit from the global methanol supply/demand imbalance in the foreseeable future.
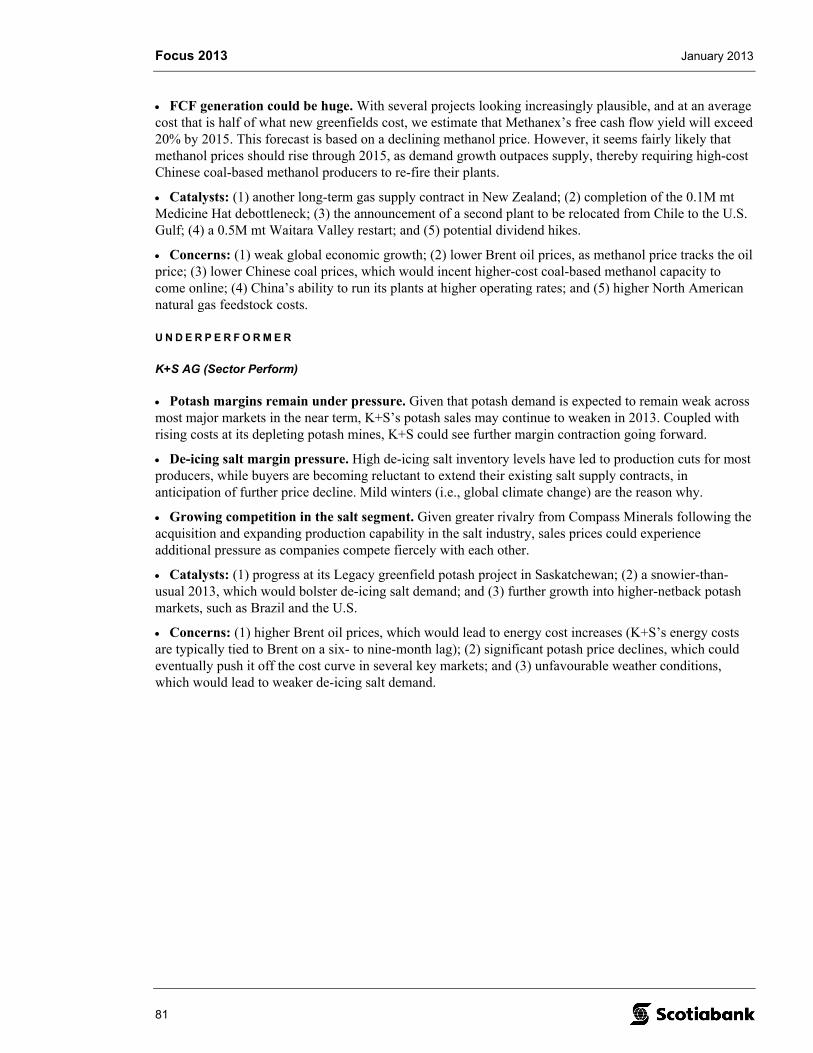
Focus 2013 January 2013
81
FCF generation could be huge. With several projects looking increasingly plausible, and at an average cost that is half of what new greenfields cost, we estimate that Methanex’s free cash flow yield will exceed 20% by 2015. This forecast is based on a declining methanol price. However, it seems fairly likely that methanol prices should rise through 2015, as demand growth outpaces supply, thereby requiring high-cost Chinese coal-based methanol producers to re-fire their plants.
Catalysts: (1) another long-term gas supply contract in New Zealand; (2) completion of the 0.1M mt Medicine Hat debottleneck; (3) the announcement of a second plant to be relocated from Chile to the U.S. Gulf; (4) a 0.5M mt Waitara Valley restart; and (5) potential dividend hikes.
Concerns: (1) weak global economic growth; (2) lower Brent oil prices, as methanol price tracks the oil price; (3) lower Chinese coal prices, which would incent higher-cost coal-based methanol capacity to come online; (4) China’s ability to run its plants at higher operating rates; and (5) higher North American natural gas feedstock costs.
U N D E R P E R F O R M E R
K+S AG (Sector Perform)
Potash margins remain under pressure. Given that potash demand is expected to remain weak across most major markets in the near term, K+S’s potash sales may continue to weaken in 2013. Coupled with rising costs at its depleting potash mines, K+S could see further margin contraction going forward.
De-icing salt margin pressure. High de-icing salt inventory levels have led to production cuts for most producers, while buyers are becoming reluctant to extend their existing salt supply contracts, in anticipation of further price decline. Mild winters (i.e., global climate change) are the reason why.
Growing competition in the salt segment. Given greater rivalry from Compass Minerals following the acquisition and expanding production capability in the salt industry, sales prices could experience additional pressure as companies compete fiercely with each other.
Catalysts: (1) progress at its Legacy greenfield potash project in Saskatchewan; (2) a snowier-than-usual 2013, which would bolster de-icing salt demand; and (3) further growth into higher-netback potash markets, such as Brazil and the U.S.
Concerns: (1) higher Brent oil prices, which would lead to energy cost increases (K+S’s energy costs are typically tied to Brent on a six- to nine-month lag); (2) significant potash price declines, which could eventually push it off the cost curve in several key markets; and (3) unfavourable weather conditions, which would lead to weaker de-icing salt demand.
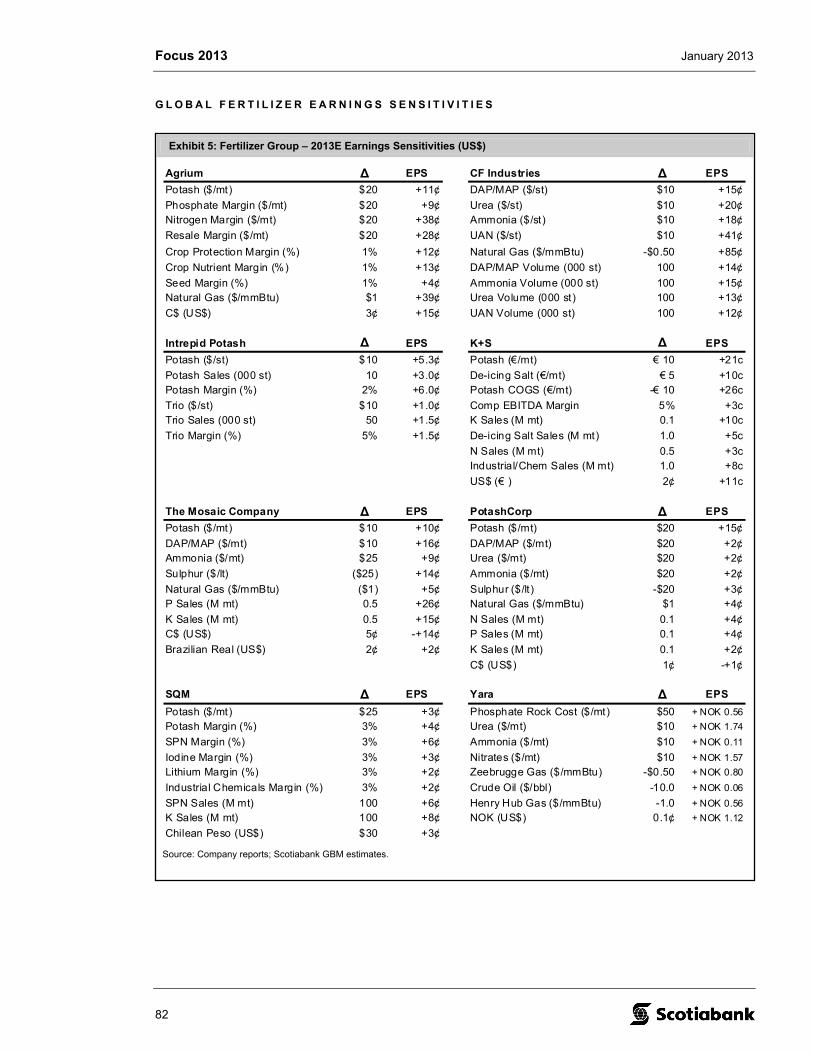
Focus 2013 January 2013
82
Exhibit 5: Fertilizer Group – 2013E Earnings Sensitivities (US$)
Agrium Δ CF Industries ΔPotash ($/mt) $20 +11¢ DAP/MAP ($/st) $10 +15¢
Phosphate Margin ($/mt) $20 +9¢ Urea ($/st) $10 +20¢Nitrogen Margin ($/mt) $20 +38¢ Ammonia ($/st) $10 +18¢
Resale Margin ($/mt) $20 +28¢ UAN ($/st) $10 +41¢
Crop Protection Margin (%) 1% +12¢ Natural Gas ($/mmBtu) -$0.50 +85¢
Crop Nutrient Margin (%) 1% +13¢ DAP/MAP Volume (000 st) 100 +14¢
Seed Margin (%) 1% +4¢ Ammonia Volume (000 st) 100 +15¢Natural Gas ($/mmBtu) $1 +39¢ Urea Volume (000 st) 100 +13¢
C$ (US$) 3¢ +15¢ UAN Volume (000 st) 100 +12¢
Intrepid Potash Δ K+S ΔPotash ($/st) $10 +5.3¢ Potash (€/mt) € 10 +21c
Potash Sales (000 st) 10 +3.0¢ De-icing Salt (€/mt) € 5 +10cPotash Margin (%) 2% +6.0¢ Potash COGS (€/mt) -€ 10 +26c
Trio ($/st) $10 +1.0¢ Comp EBITDA Margin 5% +3cTrio Sales (000 st) 50 +1.5¢ K Sales (M mt) 0.1 +10c
Trio Margin (%) 5% +1.5¢ De-icing Salt Sales (M mt) 1.0 +5c
N Sales (M mt) 0.5 +3cIndustrial/Chem Sales (M mt) 1.0 +8c
US$ (€ ) 2¢ +11c
The Mosaic Company Δ PotashCorp ΔPotash ($/mt) $10 +10¢ Potash ($/mt) $20 +15¢
DAP/MAP ($/mt) $10 +16¢ DAP/MAP ($/mt) $20 +2¢Ammonia ($/mt) $25 +9¢ Urea ($/mt) $20 +2¢
Sulphur ($/lt) ($25) +14¢ Ammonia ($/mt) $20 +2¢
Natural Gas ($/mmBtu) ($1) +5¢ Sulphur ($/lt) -$20 +3¢P Sales (M mt) 0.5 +26¢ Natural Gas ($/mmBtu) $1 +4¢
K Sales (M mt) 0.5 +15¢ N Sales (M mt) 0.1 +4¢C$ (US$) 5¢ -+14¢ P Sales (M mt) 0.1 +4¢
Brazilian Real (US$) 2¢ +2¢ K Sales (M mt) 0.1 +2¢
C$ (US$) 1¢ -+1¢
SQM Δ Yara ΔPotash ($/mt) $25 +3¢ Phosphate Rock Cost ($/mt) $50 + NOK 0.56
Potash Margin (%) 3% +4¢ Urea ($/mt) $10 + NOK 1.74
SPN Margin (%) 3% +6¢ Ammonia ($/mt) $10 + NOK 0.11
Iodine Margin (%) 3% +3¢ Nitrates ($/mt) $10 + NOK 1.57
Lithium Margin (%) 3% +2¢ Zeebrugge Gas ($/mmBtu) -$0.50 + NOK 0.80
Industrial Chemicals Margin (%) 3% +2¢ Crude Oil ($/bbl) -10.0 + NOK 0.06
SPN Sales (M mt) 100 +6¢ Henry Hub Gas ($/mmBtu) -1.0 + NOK 0.56
K Sales (M mt) 100 +8¢ NOK (US$) 0.1¢ + NOK 1.12
Chilean Peso (US$) $30 +3¢
EPS
EPS
EPS
EPS EPS
EPS EPS
EPS
Source: Company reports; Scotiabank GBM estimates.
G L O B A L F E R T I L I Z E R E A R N I N G S S E N S I T I V I T I E S
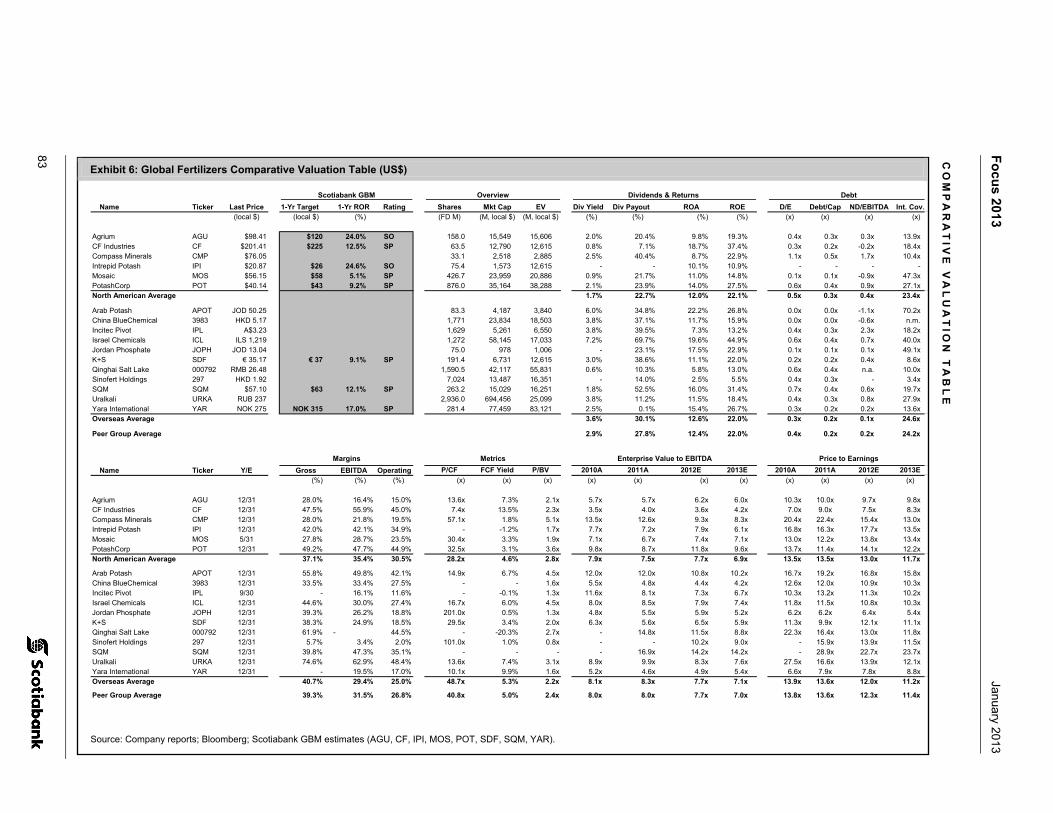
83
Fo
cus 2013
January 2013
Exhibit 6: Global Fertilizers Comparative Valuation Table (US$)
Dividends & Returns Debt
Name Ticker Last Price 1-Yr Target 1-Yr ROR Rating Shares Mkt Cap EV Div Yield Div Payout ROA ROE D/E Debt/Cap ND/EBITDA Int. Cov.(local $) (local $) (%) (FD M) (M, local $) (M, local $) (%) (%) (%) (%) (x) (x) (x) (x)
Agrium AGU $98.41 $120 24.0% SO 158.0 15,549 15,606 2.0% 20.4% 9.8% 19.3% 0.4x 0.3x 0.3x 13.9xCF Industries CF $201.41 $225 12.5% SP 63.5 12,790 12,615 0.8% 7.1% 18.7% 37.4% 0.3x 0.2x -0.2x 18.4xCompass Minerals CMP $76.05 33.1 2,518 2,885 2.5% 40.4% 8.7% 22.9% 1.1x 0.5x 1.7x 10.4xIntrepid Potash IPI $20.87 $26 24.6% SO 75.4 1,573 12,615 - - 10.1% 10.9% - - - -Mosaic MOS $56.15 $58 5.1% SP 426.7 23,959 20,886 0.9% 21.7% 11.0% 14.8% 0.1x 0.1x -0.9x 47.3xPotashCorp POT $40.14 $43 9.2% SP 876.0 35,164 38,288 2.1% 23.9% 14.0% 27.5% 0.6x 0.4x 0.9x 27.1xNorth American Average 1.7% 22.7% 12.0% 22.1% 0.5x 0.3x 0.4x 23.4x
Arab Potash APOT JOD 50.25 83.3 4,187 3,840 6.0% 34.8% 22.2% 26.8% 0.0x 0.0x -1.1x 70.2xChina BlueChemical 3983 HKD 5.17 1,771 23,834 18,503 3.8% 37.1% 11.7% 15.9% 0.0x 0.0x -0.6x n.m.Incitec Pivot IPL A$3.23 1,629 5,261 6,550 3.8% 39.5% 7.3% 13.2% 0.4x 0.3x 2.3x 18.2xIsrael Chemicals ICL ILS 1,219 1,272 58,145 17,033 7.2% 69.7% 19.6% 44.9% 0.6x 0.4x 0.7x 40.0xJordan Phosphate JOPH JOD 13.04 75.0 978 1,006 - 23.1% 17.5% 22.9% 0.1x 0.1x 0.1x 49.1xK+S SDF € 35.17 € 37 9.1% SP 191.4 6,731 12,615 3.0% 38.6% 11.1% 22.0% 0.2x 0.2x 0.4x 8.6xQinghai Salt Lake 000792 RMB 26.48 1,590.5 42,117 55,831 0.6% 10.3% 5.8% 13.0% 0.6x 0.4x n.a. 10.0xSinofert Holdings 297 HKD 1.92 7,024 13,487 16,351 - 14.0% 2.5% 5.5% 0.4x 0.3x - 3.4xSQM SQM $57.10 $63 12.1% SP 263.2 15,029 16,251 1.8% 52.5% 16.0% 31.4% 0.7x 0.4x 0.6x 19.7xUralkali URKA RUB 237 2,936.0 694,456 25,099 3.8% 11.2% 11.5% 18.4% 0.4x 0.3x 0.8x 27.9xYara International YAR NOK 275 NOK 315 17.0% SP 281.4 77,459 83,121 2.5% 0.1% 15.4% 26.7% 0.3x 0.2x 0.2x 13.6xOverseas Average 3.6% 30.1% 12.6% 22.0% 0.3x 0.2x 0.1x 24.6x
Peer Group Average 2.9% 27.8% 12.4% 22.0% 0.4x 0.2x 0.2x 24.2x
Margins Metrics Enterprise Value to EBITDA Price to Earnings
Name Ticker Y/E Gross EBITDA Operating P/CF FCF Yield P/BV 2010A 2011A 2012E 2013E 2010A 2011A 2012E 2013E
(%) (%) (%) (x) (x) (x) (x) (x) (x) (x) (x) (x) (x) (x)
Agrium AGU 12/31 28.0% 16.4% 15.0% 13.6x 7.3% 2.1x 5.7x 5.7x 6.2x 6.0x 10.3x 10.0x 9.7x 9.8xCF Industries CF 12/31 47.5% 55.9% 45.0% 7.4x 13.5% 2.3x 3.5x 4.0x 3.6x 4.2x 7.0x 9.0x 7.5x 8.3xCompass Minerals CMP 12/31 28.0% 21.8% 19.5% 57.1x 1.8% 5.1x 13.5x 12.6x 9.3x 8.3x 20.4x 22.4x 15.4x 13.0xIntrepid Potash IPI 12/31 42.0% 42.1% 34.9% - -1.2% 1.7x 7.7x 7.2x 7.9x 6.1x 16.8x 16.3x 17.7x 13.5xMosaic MOS 5/31 27.8% 28.7% 23.5% 30.4x 3.3% 1.9x 7.1x 6.7x 7.4x 7.1x 13.0x 12.2x 13.8x 13.4xPotashCorp POT 12/31 49.2% 47.7% 44.9% 32.5x 3.1% 3.6x 9.8x 8.7x 11.8x 9.6x 13.7x 11.4x 14.1x 12.2xNorth American Average 37.1% 35.4% 30.5% 28.2x 4.6% 2.8x 7.9x 7.5x 7.7x 6.9x 13.5x 13.5x 13.0x 11.7x
Arab Potash APOT 12/31 55.8% 49.8% 42.1% 14.9x 6.7% 4.5x 12.0x 12.0x 10.8x 10.2x 16.7x 19.2x 16.8x 15.8xChina BlueChemical 3983 12/31 33.5% 33.4% 27.5% - - 1.6x 5.5x 4.8x 4.4x 4.2x 12.6x 12.0x 10.9x 10.3xIncitec Pivot IPL 9/30 - 16.1% 11.6% - -0.1% 1.3x 11.6x 8.1x 7.3x 6.7x 10.3x 13.2x 11.3x 10.2xIsrael Chemicals ICL 12/31 44.6% 30.0% 27.4% 16.7x 6.0% 4.5x 8.0x 8.5x 7.9x 7.4x 11.8x 11.5x 10.8x 10.3xJordan Phosphate JOPH 12/31 39.3% 26.2% 18.8% 201.0x 0.5% 1.3x 4.8x 5.5x 5.9x 5.2x 6.2x 6.2x 6.4x 5.4xK+S SDF 12/31 38.3% 24.9% 18.5% 29.5x 3.4% 2.0x 6.3x 5.6x 6.5x 5.9x 11.3x 9.9x 12.1x 11.1xQinghai Salt Lake 000792 12/31 61.9% - 44.5% - -20.3% 2.7x - 14.8x 11.5x 8.8x 22.3x 16.4x 13.0x 11.8xSinofert Holdings 297 12/31 5.7% 3.4% 2.0% 101.0x 1.0% 0.8x - - 10.2x 9.0x - 15.9x 13.9x 11.5xSQM SQM 12/31 39.8% 47.3% 35.1% - - - - 16.9x 14.2x 14.2x - 28.9x 22.7x 23.7xUralkali URKA 12/31 74.6% 62.9% 48.4% 13.6x 7.4% 3.1x 8.9x 9.9x 8.3x 7.6x 27.5x 16.6x 13.9x 12.1xYara International YAR 12/31 - 19.5% 17.0% 10.1x 9.9% 1.6x 5.2x 4.6x 4.9x 5.4x 6.6x 7.9x 7.8x 8.8xOverseas Average 40.7% 29.4% 25.0% 48.7x 5.3% 2.2x 8.1x 8.3x 7.7x 7.1x 13.9x 13.6x 12.0x 11.2x
Peer Group Average 39.3% 31.5% 26.8% 40.8x 5.0% 2.4x 8.0x 8.0x 7.7x 7.0x 13.8x 13.6x 12.3x 11.4x
OverviewScotiabank GBM
Source: Company reports; Bloomberg; Scotiabank GBM estimates (AGU, CF, IPI, MOS, POT, SDF, SQM, YAR).
CO
MP
AR
AT
IVE
VA
LU
AT
ION
TA
BL
E

Focus 2013 January 2013
84
T H I S P A G E L E F T I N T E N T I O N A L L Y B L A N K .
Focus 2013 January 2013
Tanya Jakusconek, MSc, Applied (416) 945-4083 Leily Omoumi, MBA (416) 945-4527 (Scotia Capital Inc. – Canada) (Scotia Capital Inc. – Canada) Trevor Turnbull, MBA, MSc (416) 863-7427 Ovais Habib (416) 863-7141 (Scotia Capital Inc. – Canada) (Scotia Capital Inc. – Canada)
85
Gold & Precious Minerals
A New Year… Starting Afresh
W H A T ’ S D R I V I N G G O L D
Since last year’s Gold & Precious Minerals Focus piece, while much has appeared to change in the world, much has also stayed the same. Economic turmoil remains, though now spread to the European Union. China added another level of uncertainty as it released data showing a potential slowdown in its economy (albeit from a high level). Geopolitical tensions in the Middle East continue to persist, the United States has just re-elected Obama for another four-year term, and a fiscal cliff deal was reached on January 1, 2013, just after the deadline. In our view, the factors that favoured a higher gold price in 2012 continue to support a higher gold price in 2013.
Outlook
Our gold price outlook is supported by the following:
Gold as a currency. We believe gold will remain the currency of choice given debt levels around the world and outlook for the key currencies (U.S. dollar, euro, etc.).
Gold as an inflation hedge. Higher oil price, higher commodity prices, and food inflation support a higher gold price. In addition, the expectation for additional stimulus in numerous economies is indicative of an expectation of higher inflation.
Gold as a “preferable” asset class. A negative real rate environment bodes well for gold. This is expected to persist into 2015.
Gold as portfolio diversification. With uncertainty in equity markets, investors hold gold as a store of value and as a safe-haven asset (insurance policy).
T R E N D S F O R 2 0 1 3
Operating costs continue to rise. With the higher gold price for reserve calculations for year-end 2012 versus 2011, overall grades will be negatively impacted. This, combined with inflationary pressure in labour, power/fuel, and consumables, should continue to drive operating costs higher.
Capital cost – have we seen the peak with deferral of projects? In 2012, we saw the mining industry put various projects on hold, which deferred overall capital of about US$65 billion globally. This has helped some inputs into capital costs. Although capital costs remain high, with the deferral of projects, we may have seen the peak in development capex in 2012 (which we have at about US$427/oz, up from US$280/oz in 2011). We expect sustaining capital to remain high.
Royalties/taxation – host countries demanding more. During 2012, we saw several countries come to the table with increases or proposals to increase royalties/taxation in their mining jurisdictions. With the increase in the gold price, host countries are looking to further participate in profits. We expect this to continue into 2013. Countries that do not have royalties in place include the United States, Mexico, and Greece.
Focus 2013 January 2013
86
I N V E S T M E N T H I G H L I G H T S F O R 2 0 1 3
We believe that gold companies that meet operating targets set for the year (in addition to containing or lowering all-in costs), generate positive free cash flow (FCF), and have capital discipline in how they redeploy FCF will outperform. Companies will be announcing 2013 guidance starting mid-January to end of February. Our research shows that a gold price of US$1,825/oz is required for the gold group to be FCF positive. We believe that the equities will begin to outperform bullion at a gold price of more than US$1,825/oz, as FCF leverage above that gold price is greater by a factor of about 6x (i.e., for a 10% move in bullion over US$1,825/oz, group FCF increases by 60%).
T O P P I C K S
Top pick in the large cap space: Yamana Gold Inc. (YRI). Operating in the Americas, the stock is liquid (trading on the Toronto Stock Exchange [TSX] and New York Stock Exchange [NYSE]), with a strong balance sheet. YRI was one of the few companies under coverage to meet its operating targets in 2012. We expect strong FCF growth over the next two years as capital costs for its pipeline are spent (largest capex spend year is 2012) and new mines enter production and contribute to revenue. YRI also has the ability to further increase its dividend in 2013 given the FCF generation. We are expecting further increases in reserves/resources with year-end numbers from its exploration efforts.
Top pick in the intermediate gold space – New Gold Inc. (New Gold). We continue to recommend New Gold based on its strong operating asset base, now led by the still-expanding New Afton copper-gold mine. With construction capital behind it, New Gold is in FCF-generation mode, with financial and managerial capacity to seek corporate opportunities that could yield a fifth mine.
Top pick in the intermediate gold space – Dundee Precious Metals Inc. (DPM). We believe DPM offers strong production and earnings growth. The underground mine expansion at Chelopech is nearly completed and gold production is expected to grow by about 20% in 2013 year over year (YOY). Additionally, its developing projects in the pipeline are to contribute to expanding production starting in 2014 and more materially in 2015. In our view, DPM also offers unique upside through its holdings in three exploration companies.
Top pick in the small cap gold space – B2Gold Corp. (B2Gold). We recommend B2Gold as the company is led by a proven management team that is progressively growing the company’s production profile by optimizing current operations, expanding reserves at existing mines, and capitalizing on strategic mergers and acquisitions.
Top pick in the silver space – Silver Wheaton Corp. (Silver Wheaton). We continue to recommend Silver Wheaton for its low-risk production and cash flow growth profile, driven by its 25% silver interest in Barrick Gold Corporation’s (Barrick’s) world-class Pascua-Lama project. With the initial US$500 million payment to HudBay Minerals Inc. (HudBay) for the Constancia and 777 transaction in the rear-view mirror, we estimate Silver Wheaton to have purchasing power of more than US$1 billion as at December 31, 2012.
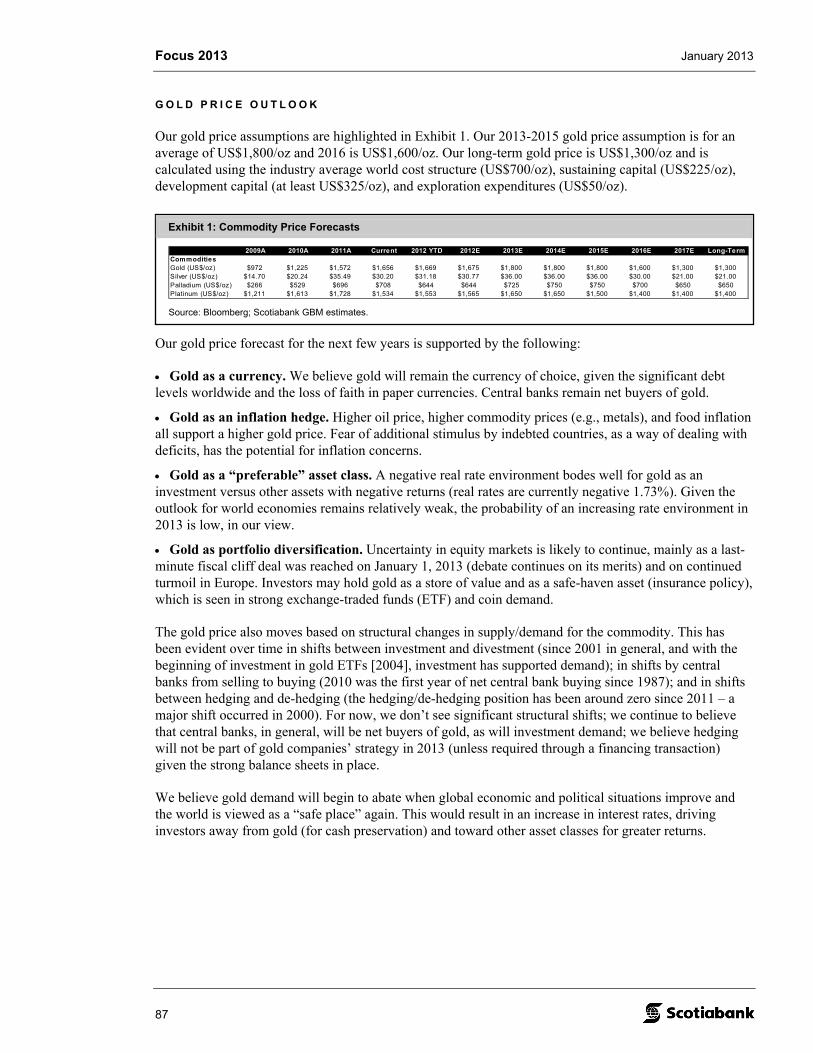
Focus 2013 January 2013
87
Exhibit 1: Commodity Price Forecasts
2009A 2010A 2011A Current 2012 YTD 2012E 2013E 2014E 2015E 2016E 2017E Long-TermCommoditiesGold (US$/oz) $972 $1,225 $1,572 $1,656 $1,669 $1,675 $1,800 $1,800 $1,800 $1,600 $1,300 $1,300Silver (US$/oz) $14.70 $20.24 $35.49 $30.20 $31.18 $30.77 $36.00 $36.00 $36.00 $30.00 $21.00 $21.00Palladium (US$/oz) $266 $529 $696 $708 $644 $644 $725 $750 $750 $700 $650 $650Platinum (US$/oz) $1,211 $1,613 $1,728 $1,534 $1,553 $1,565 $1,650 $1,650 $1,500 $1,400 $1,400 $1,400
Source: Bloomberg; Scotiabank GBM estimates.
G O L D P R I C E O U T L O O K
Our gold price assumptions are highlighted in Exhibit 1. Our 2013-2015 gold price assumption is for an average of US$1,800/oz and 2016 is US$1,600/oz. Our long-term gold price is US$1,300/oz and is calculated using the industry average world cost structure (US$700/oz), sustaining capital (US$225/oz), development capital (at least US$325/oz), and exploration expenditures (US$50/oz).
Our gold price forecast for the next few years is supported by the following:
Gold as a currency. We believe gold will remain the currency of choice, given the significant debt levels worldwide and the loss of faith in paper currencies. Central banks remain net buyers of gold.
Gold as an inflation hedge. Higher oil price, higher commodity prices (e.g., metals), and food inflation all support a higher gold price. Fear of additional stimulus by indebted countries, as a way of dealing with deficits, has the potential for inflation concerns.
Gold as a “preferable” asset class. A negative real rate environment bodes well for gold as an investment versus other assets with negative returns (real rates are currently negative 1.73%). Given the outlook for world economies remains relatively weak, the probability of an increasing rate environment in 2013 is low, in our view.
Gold as portfolio diversification. Uncertainty in equity markets is likely to continue, mainly as a last-minute fiscal cliff deal was reached on January 1, 2013 (debate continues on its merits) and on continued turmoil in Europe. Investors may hold gold as a store of value and as a safe-haven asset (insurance policy), which is seen in strong exchange-traded funds (ETF) and coin demand.
The gold price also moves based on structural changes in supply/demand for the commodity. This has been evident over time in shifts between investment and divestment (since 2001 in general, and with the beginning of investment in gold ETFs [2004], investment has supported demand); in shifts by central banks from selling to buying (2010 was the first year of net central bank buying since 1987); and in shifts between hedging and de-hedging (the hedging/de-hedging position has been around zero since 2011 – a major shift occurred in 2000). For now, we don’t see significant structural shifts; we continue to believe that central banks, in general, will be net buyers of gold, as will investment demand; we believe hedging will not be part of gold companies’ strategy in 2013 (unless required through a financing transaction) given the strong balance sheets in place.
We believe gold demand will begin to abate when global economic and political situations improve and the world is viewed as a “safe place” again. This would result in an increase in interest rates, driving investors away from gold (for cash preservation) and toward other asset classes for greater returns.
Focus 2013 January 2013
88
Exhibit 2: World Gold Supply and Demand
2000 2001 2002 2003 2004 2005 2006 2007 2008 2009 2010 2011 2012E% Chg
Y/YSupply (tonnes)Total Gold Production 2,620 2,646 2,625 2,631 2,504 2,561 2,495 2,497 2,429 2,611 2,740 2,822 2,900 3%Scrap Recovery 620 749 874 991 881 902 1,133 1,005 1,350 1,735 1,719 1,671 1,650 -1%Chg In Official Holdings/Sales/Purchases 479 520 547 620 479 663 365 484 235 34 (77) (457) (500) 9%Net Hedging Transactions (15) (151) (379) (289) (438) (92) (434) (432) (357) (234) (108) 10 (20) -300%Total Supply 3,704 3,764 3,667 3,953 3,426 4,034 3,559 3,554 3,657 4,146 4,274 4,046 4,030 0%
Demand (tonnes)Jewellery Demand 3,205 3,009 2,662 2,484 2,616 2,719 2,300 2,423 2,304 1,814 2,017 1,972 1,900 -4%Total Other 799 733 713 696 779 837 891 920 1,344 1,201 1,649 1,985 1,900 -4%Total Fabrication Demand 4,004 3,742 3,375 3,180 3,395 3,556 3,191 3,343 3,648 3,015 3,666 3,957 3,800 -4%
Investment/(Disinvestment) (300) 22 292 773 31 478 368 211 9 1,131 608 89 230 158%Total Physical Demand 3,704 3,764 3,667 3,953 3,426 4,034 3,559 3,554 3,657 4,146 4,274 4,046 4,030 0%
Gold Price (US$/oz) 279 271 310 363 409 444 604 695 872 972 1,225 1,572 1,675 7%
Source: GFMS; Scotiabank GBM estimates.
Exhibit 3: Mine Production Alone Projected to Outpace Silver Fabrication Demand in 2012
500
600
700
800
900
1,000
2000 2001 2002 2003 2004 2005 2006 2007 2008 2009 2010 2011 2012E
Mill
ion
Ou
nces
Silver Mine Production Silver Fabrication Demand (excl. coins)
Source: Thomson Reuters; GFMS; Scotiabank GBM estimates.
S I L V E R
Our constructive outlook for gold implies silver bullion should also perform well. However, for silver prices to outperform gold, we believe industrial demand needs to increase. Our silver price forecast, as shown in Exhibit 1, assumes a 50:1 gold-to-silver ratio. The net result is a US$36.00/oz silver price assumption for the next three years and then a decline to our long-term silver price of US$21.00/oz beginning in 2017 based on a 62:1 ratio to our long-term gold price of US$1,300/oz.
As in previous years, we should expect silver to trade in a fairly wide range in 2013 if global economic forecasts remain uncertain and volatile. Recall that silver supply continues to increase steadily each year as more silver production comes online. Many of the new sources of mine supply are
not primary silver operations, but often copper, lead, and zinc ones. It is also important to note that while the uses of silver are expanding significantly, the overall consumption of bullion is still trending downward given economic conditions worldwide. These points are illustrated in Exhibit 3.
Our forecast could be negatively impacted if economic outlooks dim and, conversely, we would expect outperformance if consumer spending were to rebound, especially with respect to electronics, a major source of industrial demand in silver. Our current forecasts are based on a combination of our gold predictions, and our copper outlook and will be adjusted as warranted.
Focus 2013 January 2013
89
P A L L A D I U M
Johnson Matthey expects supplies of palladium to fall in 2013. Output from Russia has been declining and the disruptions in South Africa, which continue to threaten the commercial viability of certain operations in the country, are the reasons Johnson Matthey expects supplies to fall. Johnson Matthey forecasts newly refined supplies of palladium to fall in 2013, and expects considerably lower sales of Russian state stockpiles amounting to an estimated 250,000 ounces (250 koz) in 2012, a 500 koz drop from 2011. Johnson Matthey maintains the view that the sale of material in Russia this year represents most of its remaining state inventory. The total supply and demand in 2012 are estimated at 6.57 million ounces (Moz) and 9.73 Moz (relative to supply of 7.42 Moz and demand of 6.70 Moz in 2011).
In 2013, we believe the key demand driver for palladium will be growth in auto production. Auto catalyst demand is expected to remain strong as North American consumers are expected to continue to take advantage of cheap credit to buy new cars and as higher vehicle production in China and India continues. As an example, in China there are 70 vehicles per 1,000 people, far below the G7 nations’ average of 677 vehicles per 1,000 people. Scotiabank Economics predicts 2013 auto sales growth of 10% in China and 4% globally. Stronger growth in gasoline vehicle production and greater use of palladium in diesel emission controls are expected to result in 7% growth in palladium demand in auto catalysts to a record high of almost 6.5 Moz in 2012. Auto catalyst demand makes up more than 60% of global palladium demand.
In terms of other sources of demand, gross demand for palladium from the jewellery sector in 2012 is forecast to dampen again, by 11%, to 450 koz. The metal continues to suffer from a lack of positioning and effective marketing in China, the biggest market, where Johnson Matthey forecasts gross demand will decline by 21% to 240 koz in 2012. Industrial demand for palladium is forecast to soften by 3% in 2012 to 2.41 Moz. Looking forward to 2013, growth in industrial demand for palladium is expected to be driven by a wave of construction of new chemical plants in China, but palladium use is expected to soften in the long term as palladium faces competition from cheaper alternatives in the electrical and dental sectors. A niche market for palladium in men’s jewellery has developed in Europe and North America; however, palladium jewellery continues to face diminishing demand in China as it faces competition from other alternative metals. A long-term trend toward replacing palladium-containing components with cheaper base metal alternatives in all but niche and high-end applications continues to drive palladium use lower.
We forecast palladium to average US$725/oz in 2013, US$750/oz in 2014 and 2015, and US$700/oz in 2016, with our long-term price forecast at US$650/oz. As at year-end 2012, the price of palladium rose 6% to more than US$700/oz in December from trading around US$662/oz.
T R E N D S I N T H E G O L D I N D U S T R Y
We see various trends in the gold industry for 2013, some continuing from 2012. These include:
• Higher gold price to impact reserves/resources. Gold companies use the three-year rolling average as a benchmark for the gold price to be used in annual reserve and resource calculations (with resources using a gold price approximately US$200/oz higher than reserves). Reserves will likely use an average gold price of about US$1,350/oz, with overall resources at approximately US$1,550/oz, versus 2011 reserves at US$1,150/oz and resources at about US$1,350/oz-US$1,400/oz. The increase in the gold price has an impact on grade, particularly for companies with open-pit mining operations. The increase in gold price will generally add more ounces, but at lower grade (assuming no additional new ounces are discovered). Since the early 1990s, with the increase in gold price from about US$400/oz used to calculate reserves (which then dipped to ~US$300/oz in the early 2000s), reserve grades have almost halved.
Focus 2013 January 2013
90
Exhibit 5: Total Cash Costs Variance
To
tal C
ash
Co
sts
- 20
11
By-
prod
uct C
redi
ts
Mis
cella
neou
s
Pro
cess
Rec
over
y
Pow
er
Str
ip R
atio
Roy
altie
s
Fue
l
Labo
ur
FX
Gra
des
Tota
l Cas
h C
osts
- 2
010
480
500
520
540
560
580
600
620
640
660
680
US
$/o
z
560
+28
+18
+8
+18
+8 +3+3 +3
+4 -10
643
Source: GFMS.
Exhibit 4: North American Reserves and Reserve Grade
0
50,000
100,000
150,000
200,000
250,000
300,000
350,000
400,000
450,000
500,000
1985 1987 1989 1991 1993 1995 1997 1999 2001 2003 2005 2007 2009 2011
000
of
ou
nce
s
$-
$200
$400
$600
$800
$1,000
$1,200
US
$/o
z
Reserves Reserve pr ice
Reserve Price (US$/oz)
Year Reserve Grade1990 0.0821991 0.0831992 0.0831993 0.0941994 0.088
1995 0.0861996 0.0751997 0.0631998 0.0671999 0.0562000 0.0672001 0.0802002 0.080
2003 0.0872004 0.0842005 0.0572006 0.0612007 0.0542008 0.0512009 0.0522010 0.049
2011 0.044
Reserve Grade (oz/t)
Source: Company reports; Scotiabank GBM.
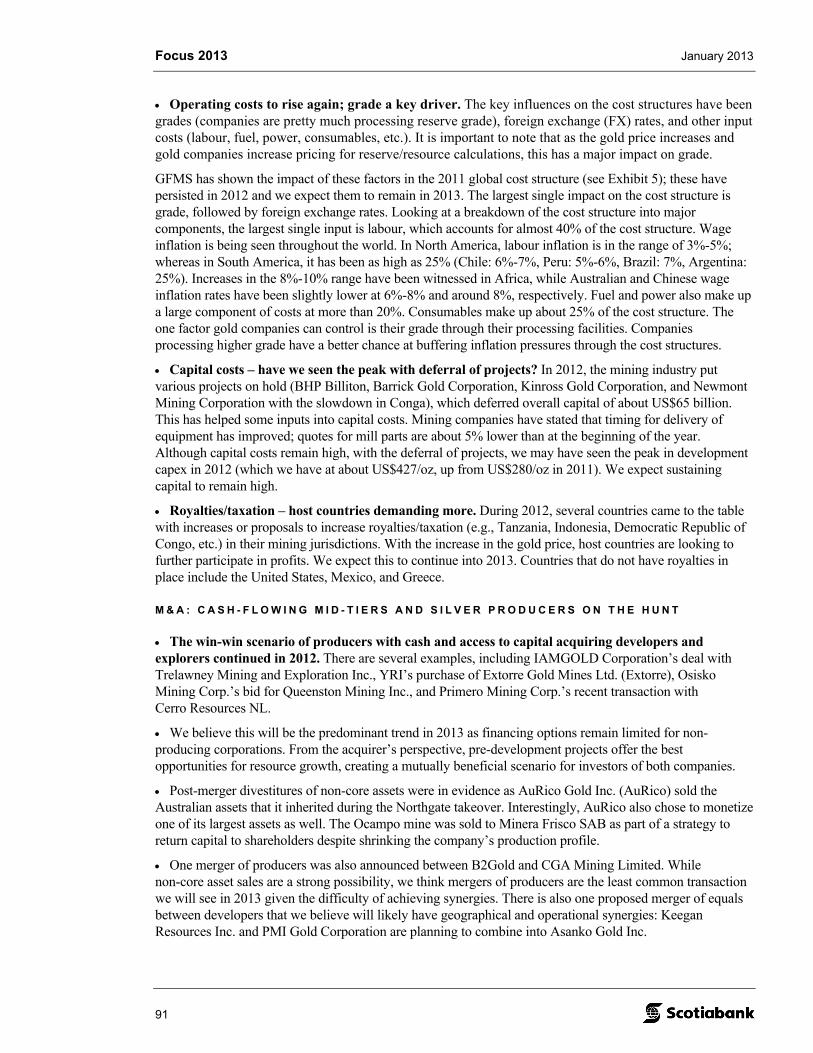
Focus 2013 January 2013
91
Operating costs to rise again; grade a key driver. The key influences on the cost structures have been grades (companies are pretty much processing reserve grade), foreign exchange (FX) rates, and other input costs (labour, fuel, power, consumables, etc.). It is important to note that as the gold price increases and gold companies increase pricing for reserve/resource calculations, this has a major impact on grade.
GFMS has shown the impact of these factors in the 2011 global cost structure (see Exhibit 5); these have persisted in 2012 and we expect them to remain in 2013. The largest single impact on the cost structure is grade, followed by foreign exchange rates. Looking at a breakdown of the cost structure into major components, the largest single input is labour, which accounts for almost 40% of the cost structure. Wage inflation is being seen throughout the world. In North America, labour inflation is in the range of 3%-5%; whereas in South America, it has been as high as 25% (Chile: 6%-7%, Peru: 5%-6%, Brazil: 7%, Argentina: 25%). Increases in the 8%-10% range have been witnessed in Africa, while Australian and Chinese wage inflation rates have been slightly lower at 6%-8% and around 8%, respectively. Fuel and power also make up a large component of costs at more than 20%. Consumables make up about 25% of the cost structure. The one factor gold companies can control is their grade through their processing facilities. Companies processing higher grade have a better chance at buffering inflation pressures through the cost structures.
Capital costs – have we seen the peak with deferral of projects? In 2012, the mining industry put various projects on hold (BHP Billiton, Barrick Gold Corporation, Kinross Gold Corporation, and Newmont Mining Corporation with the slowdown in Conga), which deferred overall capital of about US$65 billion. This has helped some inputs into capital costs. Mining companies have stated that timing for delivery of equipment has improved; quotes for mill parts are about 5% lower than at the beginning of the year. Although capital costs remain high, with the deferral of projects, we may have seen the peak in development capex in 2012 (which we have at about US$427/oz, up from US$280/oz in 2011). We expect sustaining capital to remain high.
Royalties/taxation – host countries demanding more. During 2012, several countries came to the table with increases or proposals to increase royalties/taxation (e.g., Tanzania, Indonesia, Democratic Republic of Congo, etc.) in their mining jurisdictions. With the increase in the gold price, host countries are looking to further participate in profits. We expect this to continue into 2013. Countries that do not have royalties in place include the United States, Mexico, and Greece.
M & A : C A S H - F L O W I N G M I D - T I E R S A N D S I L V E R P R O D U C E R S O N T H E H U N T
The win-win scenario of producers with cash and access to capital acquiring developers and explorers continued in 2012. There are several examples, including IAMGOLD Corporation’s deal with Trelawney Mining and Exploration Inc., YRI’s purchase of Extorre Gold Mines Ltd. (Extorre), Osisko Mining Corp.’s bid for Queenston Mining Inc., and Primero Mining Corp.’s recent transaction with Cerro Resources NL.
We believe this will be the predominant trend in 2013 as financing options remain limited for non-producing corporations. From the acquirer’s perspective, pre-development projects offer the best opportunities for resource growth, creating a mutually beneficial scenario for investors of both companies.
Post-merger divestitures of non-core assets were in evidence as AuRico Gold Inc. (AuRico) sold the Australian assets that it inherited during the Northgate takeover. Interestingly, AuRico also chose to monetize one of its largest assets as well. The Ocampo mine was sold to Minera Frisco SAB as part of a strategy to return capital to shareholders despite shrinking the company’s production profile.
One merger of producers was also announced between B2Gold and CGA Mining Limited. While non-core asset sales are a strong possibility, we think mergers of producers are the least common transaction we will see in 2013 given the difficulty of achieving synergies. There is also one proposed merger of equals between developers that we believe will likely have geographical and operational synergies: Keegan Resources Inc. and PMI Gold Corporation are planning to combine into Asanko Gold Inc.
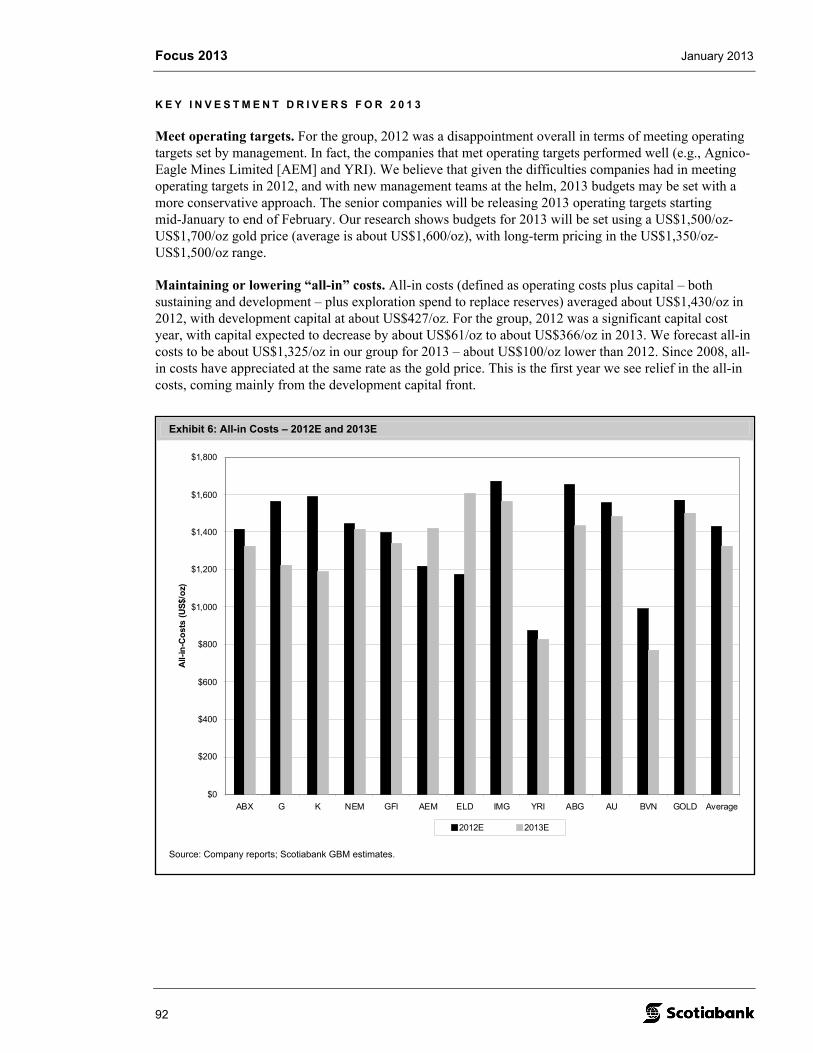
Focus 2013 January 2013
92
Exhibit 6: All-in Costs – 2012E and 2013E
$0
$200
$400
$600
$800
$1,000
$1,200
$1,400
$1,600
$1,800
ABX G K NEM GFI AEM ELD IMG YRI ABG AU BVN GOLD Average
All-
in-C
ost
s (U
S$/
oz)
2012E 2013E
Source: Company reports; Scotiabank GBM estimates.
K E Y I N V E S T M E N T D R I V E R S F O R 2 0 1 3
Meet operating targets. For the group, 2012 was a disappointment overall in terms of meeting operating targets set by management. In fact, the companies that met operating targets performed well (e.g., Agnico-Eagle Mines Limited [AEM] and YRI). We believe that given the difficulties companies had in meeting operating targets in 2012, and with new management teams at the helm, 2013 budgets may be set with a more conservative approach. The senior companies will be releasing 2013 operating targets starting mid-January to end of February. Our research shows budgets for 2013 will be set using a US$1,500/oz-US$1,700/oz gold price (average is about US$1,600/oz), with long-term pricing in the US$1,350/oz-US$1,500/oz range.
Maintaining or lowering “all-in” costs. All-in costs (defined as operating costs plus capital – both sustaining and development – plus exploration spend to replace reserves) averaged about US$1,430/oz in 2012, with development capital at about US$427/oz. For the group, 2012 was a significant capital cost year, with capital expected to decrease by about US$61/oz to about US$366/oz in 2013. We forecast all-in costs to be about US$1,325/oz in our group for 2013 – about US$100/oz lower than 2012. Since 2008, all-in costs have appreciated at the same rate as the gold price. This is the first year we see relief in the all-in costs, coming mainly from the development capital front.
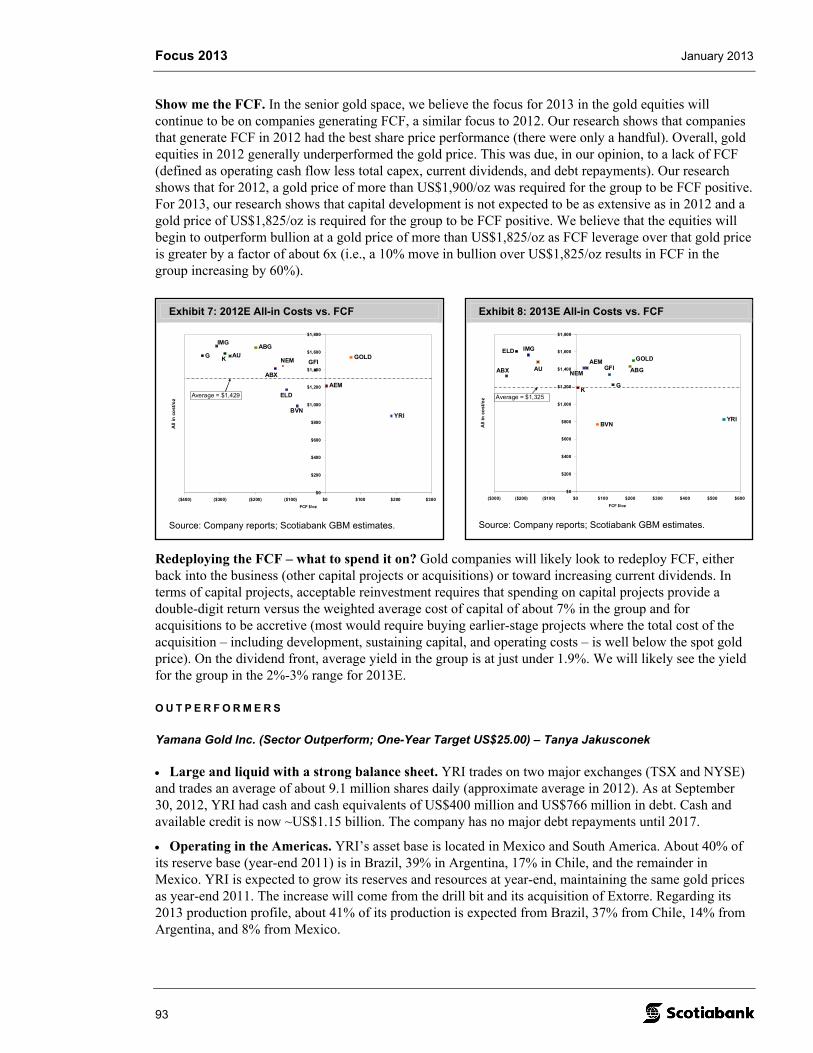
Focus 2013 January 2013
93
Exhibit 7: 2012E All-in Costs vs. FCF
G
YRI
ABG
AEM
AU
ABX
BVN
ELD
GFI
IMG
K NEMGOLD
$0
$200
$400
$600
$800
$1,000
$1,200
$1,400
$1,600
$1,800
($400) ($300) ($200) ($100) $0 $100 $200 $300
FCF $/oz
All
in c
ost
/oz
Average = $1,429
Source: Company reports; Scotiabank GBM estimates.
Exhibit 8: 2013E All-in Costs vs. FCF
BVNYRI
ABGAEM
AUABX
ELD
GFI
G
IMG
K
NEM
GOLD
$0
$200
$400
$600
$800
$1,000
$1,200
$1,400
$1,600
$1,800
($300) ($200) ($100) $0 $100 $200 $300 $400 $500 $600
FCF $/oz
All
in c
ost
/oz Average = $1,325
Source: Company reports; Scotiabank GBM estimates.
Show me the FCF. In the senior gold space, we believe the focus for 2013 in the gold equities will continue to be on companies generating FCF, a similar focus to 2012. Our research shows that companies that generate FCF in 2012 had the best share price performance (there were only a handful). Overall, gold equities in 2012 generally underperformed the gold price. This was due, in our opinion, to a lack of FCF (defined as operating cash flow less total capex, current dividends, and debt repayments). Our research shows that for 2012, a gold price of more than US$1,900/oz was required for the group to be FCF positive. For 2013, our research shows that capital development is not expected to be as extensive as in 2012 and a gold price of US$1,825/oz is required for the group to be FCF positive. We believe that the equities will begin to outperform bullion at a gold price of more than US$1,825/oz as FCF leverage over that gold price is greater by a factor of about 6x (i.e., a 10% move in bullion over US$1,825/oz results in FCF in the group increasing by 60%).
Redeploying the FCF – what to spend it on? Gold companies will likely look to redeploy FCF, either back into the business (other capital projects or acquisitions) or toward increasing current dividends. In terms of capital projects, acceptable reinvestment requires that spending on capital projects provide a double-digit return versus the weighted average cost of capital of about 7% in the group and for acquisitions to be accretive (most would require buying earlier-stage projects where the total cost of the acquisition – including development, sustaining capital, and operating costs – is well below the spot gold price). On the dividend front, average yield in the group is at just under 1.9%. We will likely see the yield for the group in the 2%-3% range for 2013E.
O U T P E R F O R M E R S
Yamana Gold Inc. (Sector Outperform; One-Year Target US$25.00) – Tanya Jakusconek
Large and liquid with a strong balance sheet. YRI trades on two major exchanges (TSX and NYSE) and trades an average of about 9.1 million shares daily (approximate average in 2012). As at September 30, 2012, YRI had cash and cash equivalents of US$400 million and US$766 million in debt. Cash and available credit is now ~US$1.15 billion. The company has no major debt repayments until 2017.
Operating in the Americas. YRI’s asset base is located in Mexico and South America. About 40% of its reserve base (year-end 2011) is in Brazil, 39% in Argentina, 17% in Chile, and the remainder in Mexico. YRI is expected to grow its reserves and resources at year-end, maintaining the same gold prices as year-end 2011. The increase will come from the drill bit and its acquisition of Extorre. Regarding its 2013 production profile, about 41% of its production is expected from Brazil, 37% from Chile, 14% from Argentina, and 8% from Mexico.
Focus 2013 January 2013
94
Solid growth profile with low operating cost structure. We are forecasting production to grow to about 1.7 Moz by 2014 from 1.2 Moz in 2012. In 2012, YRI was one of the few companies to meet its operating targets. The large increase in production by 2014 is mainly due to the start of production at C1 Santa Luz, Pilar, and Ernesto/Pau-a-Pique. In 2015, we expect another production bump to the 1.8 Moz level with the initial production from Cerro Moro coming onstream. We estimate total cash costs to be US$524/oz (co-product) and they are expected to remain flattish into 2015.
All-in costs decreasing. We anticipate YRI’s all-in costs to decrease over the next several years, mainly as a result of the company’s higher capex years moving behind it. YRI’s all-in costs are expected to decrease to about ~US$865/oz in 2014 from ~US$1,070/oz in 2012 – an expected 19% decrease.
Expecting FCF and dividend growth. We are forecasting FCF growth from YRI over the next two years, to US$1.16 per share in 2013E and US$1.43 per share in 2014E based on an increasing production profile (flat gold price) and lower capital spend. On the dividend front, its dividend yield is currently lower than the average for our companies under coverage. We expect YRI to review its dividend again in 2013, particularly since the company will have three new mines in place and contributing to revenue by the end of the year.
NAVPS to grow by 7% by 2014E. We estimate YRI’s NAVPS to grow to US$14.75 from our current estimate of US$13.80 for 2012. This is above the North American group average growth rate of 5% over the same period. The stock is trading at 1.22x P/NAV, 10.2x 2013E P/EPS, and 7.2x 2013E P/CFPS.
New Gold Inc. (Sector Outperform; One-Year Target US$14.00) – Trevor Turnbull
Successful delivery of New Afton operation drives growth in 2013. New Gold brought its fourth mine into commercial production ahead of schedule in the summer of 2012. As a low-cost copper and gold producer, New Afton is forecast to lower the company’s overall operating expenses and enhance free cash flow generation in 2013 during its first full year of output.
Strong balance sheet with approximately US$650 million in cash. New Gold recently eliminated its near-term debt; it now has long-term debt of US$300 million at 7% maturing in 2020 and an additional US$500 million at 6.25% due in 2022. The most significant capital spending is behind the company and we expect cash to continue to accrue.
Blackwater project still expanding as eventual flagship operation. The recent preliminary economic assessment indicated the project could produce 6.2 Moz of gold. Exploration is ongoing, not just in the area of the 10 Moz resource, but also on the greater Blackwater property in central British Columbia.
Capable management with capacity for corporate opportunities and a fifth mine. Following the completion of the New Afton mine, New Gold is well positioned financially. In addition, we believe it has the depth of mine building experience to handle an acquisition and further development.
NAV to grow by 21% by 2014E. We estimate New Gold’s NAV will grow to US$11.49 per share from our current estimate of US$9.46 per share for 2012. This is above the group average growth rate of 9% over the same period. The stock is currently trading at 1.13x P/NAV, 14.5x 2013E P/EPS, and 9.5x 2013E P/CFPS.
Dundee Precious Metals Inc. (Sector Outperform; One-Year Target $13.00) – Leily Omoumi
DPM has production and earnings growth. We expect gold and copper production to increase by about 20% YOY to 174 koz and 12% YOY to 51 Mlb, respectively, in 2013. We expect EPS to grow by 62% to US$0.92 in 2013 as DPM realizes the increased production. At Chelopech, the underground expansion is progressing with the commissioning underway for the expansion to 2.0 million tonnes per annum (Mtpa).
Focus 2013 January 2013
95
DPM is a low-cost producer. We expect total cash costs to be about US$400/oz in 2013 and US$365/oz in 2014 (co-product basis, net of silver credit). We believe there is potential for cash costs to be even lower if the potential savings from the underground expansion at Chelopech is realized in full starting in mid- to late 2013. At Chelopech, DPM expects to see costs drop to ~US$35/t from ~US$45/t as the decommissioning of the shaft is completed and the new conveying system is stabilized. We have modelled only some of this upside, until all milestones are achieved.
DPM has development projects in the pipeline. We expect the Krumovgrad development project to add ounces to the production profile beginning in Q3/15. The final permitting decision is expected in Q1/13. We expect a positive decision. If the final permit is granted in early 2013, production could start as early as Q1/15. We forecast life-of-mine gold production of 78 koz at US$422/oz over a nine-year mine life. Company-wide, we forecast gold production to grow to more than 230 koz in 2015.
DPM is also moving ahead with its pyrite recovery project at Chelopech to generate incremental cash flow. This project aims to recover the unrecovered metals currently rejected to tailings, and involves two stages. Stage 1 is expected to be complete by late 2013 and will create a pyrite concentration circuit. At a cost of about US$22 million, approximately 200,000 tonnes of concentrate will be processed in a Chinese smelter to generate about 30 koz of gold. Stage 2 is slated to be completed by 2016 and will involve processing the concentrate (~400,000 tonnes annually) at Chelopech using a POX (partial oxidation) plant (autoclaves). The cost estimate is roughly US$180 million and is expected to be funded through internal cash flow and potentially some debt.
DPM offers upside through its strategic investments. DPM owns 10.7% of Sabina Gold & Silver Corp. (Sabina), 51.4% of Avala Resources Ltd. (Avala), and 47.3% of Dunav Resources Ltd. (Dunav). Sabina expects to complete a pre-feasibility study on its flagship Back River project in Q3/13. Preliminary economic assessments for Avala’s Timok gold project and Dunav’s Kiseljak copper-gold porphyry project are both underway.
Namibia Custom Smelter (NCS) – the Tsumeb smelter – as a strategic asset. In addition to its strategic importance to process Chelopech’s copper concentrate, NCS’s capabilities to process concentrates with high arsenic levels make it a unique asset. Although operations are currently breakeven, DPM expects margins to significantly expand when better tolling terms begin in late 2013. With the new arrangement, DPM expects blended revenues of ~US$550/t. Based on our estimates margins could expand to ~US$225/t in 2014 versus ~US$35/t in 2012.
NAV to grow by 5% by 2014E. We estimate DPM’s NAVPS to grow to $10.39 by 2014 from our current estimate of $9.86 for 2012. The stock is trading at 0.83x P/NAV, 8.9x 2013E P/EPS, and 6.2x 2013E P/CFPS.
B2Gold Corp. (Sector Outperform; One-Year Target $6.00) – Ovais Habib
Stable production of ~155,000 oz at cash costs of US$584/oz expected in 2012. B2Gold’s operations in Nicaragua have been providing a profitable and sustainable platform, which should be enhanced by the development of the Otjikoto project (mid-2015) in Namibia.
Gold production in the next two years is expected to ramp up by 172% to ~393,000 oz in 2014. We believe this impressive growth profile is achievable because: (1) higher-grade ore from the Jabali deposit is expected to increase La Libertad’s production by 36% over the next two years; and (2) the Masbate mine (CGA Mining Ltd.) is expected to add ~178 koz to B2Gold’s production profile in 2013 and ~195 koz in 2014.
Well-respected management team that has financial, operating, and exploration expertise. B2Gold was founded by the former executive and management team that led Bema Gold Corporation from being an exploration company through to production, before being acquired by Kinross Gold Corporation for $3.5 billion in February 2007.
Focus 2013 January 2013
96
Low-cost production growth makes B2Gold an attractive acquisition target. B2Gold plans to expand production to more than 500,000 oz in the next three years. Costs are expected to remain stable, and it appears additional upside for expansion remains from several exploration targets. We believe that this combination creates a suitable target for a major or mid-cap producer looking to augment its production profile with low-cost ounces.
In our view, the valuation of B2Gold stock is attractive. Currently B2Gold is trading at 0.78x P/NAV and 7.7x 2013E P/CFPS; comparable companies are currently trading at 0.85x P/NAV and 9.1x P/CFPS. We expect to see a positive re-rating in B2Gold’s trading multiple with the closing of the CGA Mining Ltd. deal, propelling B2Gold to the status of a mid-tier gold producer.
Silver Wheaton Corp. (Sector Outperform; One-Year Target US$51.00) – Trevor Turnbull
Low-risk near-term growth embedded with 777 and Pascua-Lama. Silver Wheaton’s recent HudBay transaction adds immediate growth to its production and cash flow, as we estimate HudBay’s 777 mine to produce 60,000 oz of gold and 730,000 oz of silver attributable to Silver Wheaton in 2013. We estimate Barrick’s Pascua-Lama project to come online in late 2014, producing more than 8 Moz of silver attributable to Silver Wheaton on an annual basis. To date, Barrick has spent about US$3.7 billion building Pascua-Lama, demonstrating its commitment to bringing the project into its production phase.
Constancia and Rosemont driving long-term growth. Silver Wheaton’s 100% silver interest in HudBay’s Constancia project and Augusta Resource Corporation’s Rosemont project are expected to add a respective 2.2 Moz and 2.4 Moz annually to Silver Wheaton’s high-margin production profile. Silver Wheaton’s embedded near-term and long-term production growth is anticipated to total 70% by 2016.
Purchasing power of more than US$1 billion and growing. Tight financing conditions for mining companies make for a favourable environment for Silver Wheaton to enter into accretive transactions for its shareholders and those of its counterparty. We estimate that at December 31, 2012, Silver Wheaton will have US$730 million in cash and US$400 million in available credit facility, which the company has indicated it could increase to upwards of US$1 billion, if needed.
Canada Revenue Agency (CRA) audit remains an overhang on the stock. We believe the stock’s performance continues to be weighed down by the company’s overhanging CRA audit of its international transactions from 2005-2010. The audit is a normal course routine audit, and the company believes its corporate structure, which is similar to many mining companies, is conservative in nature and meets or exceeds all requirements to be fully operational out of the Cayman Islands. It is our understanding that this belief is shared by the company’s various legal, accounting, and tax consultants. Therefore, albeit a risk, we believe it is not worth the attention the market has given it.
Trading at 1.25x NAV3% and 12.9x 2013E P/CFPS. Silver Wheaton continues to trade at a relatively large discount to Franco-Nevada Corporation (Franco) on a P/NAV, P/CF, and P/E basis. Silver Wheaton trades at 1.25x P/NAV3% and 12.9x 2013E P/CFPS.
Focus 2013 January 2013
97
U N D E R P E R F O R M E R
African Barrick Gold plc (Sector Underperform; One-Year Target US$7.50) – Tanya Jakusconek
Restricted to one exchange with a major shareholder. African Barrick Gold (ABG) trades on the LSE (London Stock Exchange) and trades an average of about 620,000 shares daily (approximate average in 2012). As at September 30, 2012, it had cash and cash equivalents of US$452 million and no debt. Barrick holds a 73.9% interest in ABG and is currently trying to sell its interest. China National Gold Group Corporation (China Gold) has expressed interest in the share block.
Difficult operating environment. ABG’s asset base is located entirely in Tanzania. Negative headline news in the region surrounding workforce issues, artisanal miners, and violence weighed heavily on the stock throughout 2012. We expect these issues to persist into 2013.
Production decreasing at higher operating costs. We are forecasting production to dip to ~700 koz in 2014 and 2015, from ~750 koz in 2013E. The expected decrease in production is mainly due to the cessation of production at Tulawaka in 2014. Total cash costs are estimated to be US$795/oz in 2013 and are expected to increase to the US$815/oz level in 2015. These operating costs are above the group average. In addition, management does not have a track record of meeting its operating targets.
Sale talks continue. Barrick announced in mid-2012 that it is in preliminary discussion with China Gold regarding its interest in ABG. At this stage, there can be no certainty that these discussions will result in an offer for Barrick’s holding in ABG. Should China Gold acquire more than 30% of the voting interest in ABG, it would then be required to make an offer for the whole of ABG’s issued ordinary share capital. ABG mentioned in its Q3/12 release that China Gold is currently in the due diligence process. We believe the ABG stock price reflects a takeover premium with currently only one potential buyer.
Growth not well defined. We are forecasting FCF to grow from negative US$0.30 per share in 2012E to positive US$0.40 per share in 2015, mainly due to our higher gold price assumption. Also, we have not factored in capital for some of its development pipeline as it continues to work on studies to further define the projects. On the dividend front, ABG pays out 15%-30% of its annual earnings as dividends. We expect ABG to review its dividend again in 2013 with its year-end results. Its dividend yield is in line with its peers.
Negative NAV growth. We estimate ABG’s NAV to decrease to US$8.05 per share in 2014 from our current estimate of US$8.30 per share for 2012. This is well below the international group average growth rate of 5% and ABG is our only covered company within the international group with negative NAV growth. The stock is trading at 0.87x P/NAV, 8.8x 2013E P/EPS, and 4.7x 2013E P/CFPS.
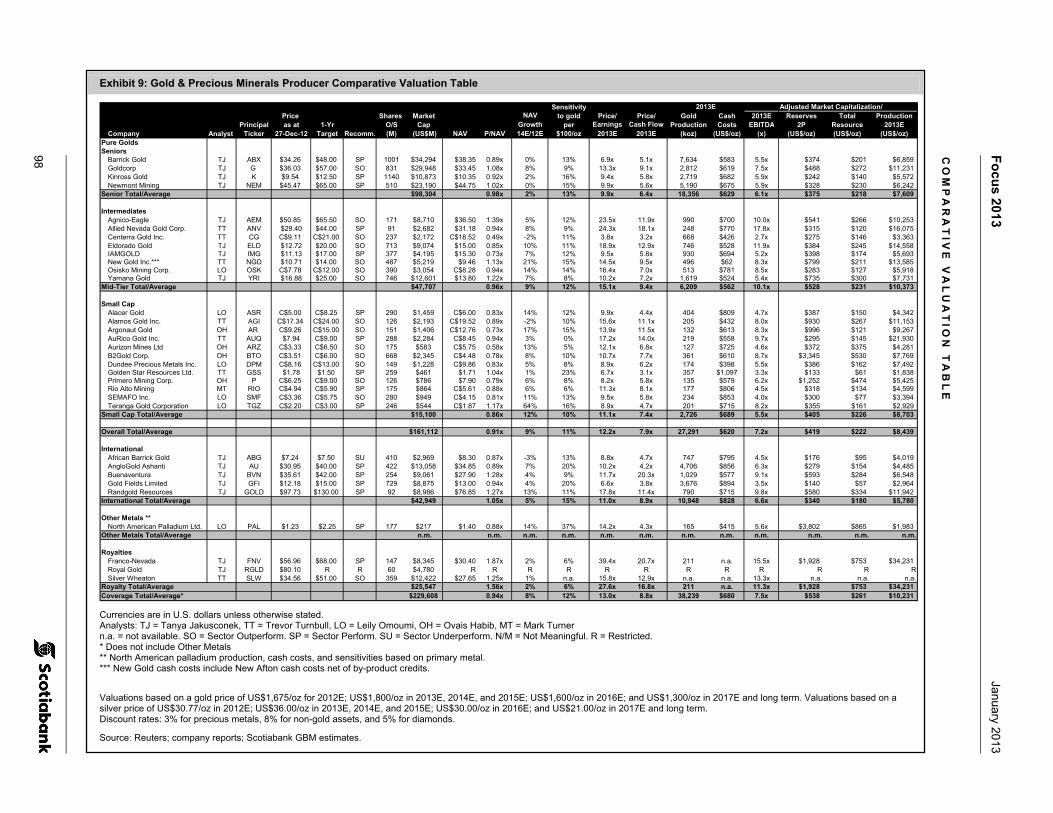
Fo
cus 2013
January 2013
98
Exhibit 9: Gold & Precious Minerals Producer Comparative Valuation Table
SensitivityPrice Shares Market NAV to gold Price/ Price/ Gold Cash 2013E Reserves Total Production
Principal as at 1-Yr O/S Cap Growth per Production Costs EBITDA 2P Resource 2013ECompany Analyst Ticker 27-Dec-12 Target Recomm. (M) (US$M) NAV P/NAV 14E/12E $100/oz 2013E 2013E (koz) (US$/oz) (x) (US$/oz) (US$/oz) (US$/oz)
Pure GoldsSeniors
Barrick Gold TJ ABX $34.26 $48.00 SP 1001 $34,294 $38.35 0.89x 0% 13% 6.9x 5.1x 7,634 $583 5.5x $374 $201 $6,859Goldcorp TJ G $36.03 $57.00 SO 831 $29,948 $33.45 1.08x 8% 9% 13.3x 9.1x 2,812 $619 7.5x $488 $272 $11,231Kinross Gold TJ K $9.54 $12.50 SP 1140 $10,873 $10.35 0.92x 2% 16% 9.4x 5.8x 2,719 $682 5.9x $242 $140 $5,572Newmont Mining TJ NEM $45.47 $65.00 SP 510 $23,190 $44.75 1.02x 0% 15% 9.9x 5.6x 5,190 $675 5.9x $328 $230 $6,242
Senior Total/Average $98,304 0.98x 2% 13% 9.9x 6.4x 18,356 $629 6.1x $375 $218 $7,609
IntermediatesAgnico-Eagle TJ AEM $50.85 $65.50 SO 171 $8,710 $36.50 1.39x 5% 12% 23.5x 11.9x 990 $700 10.0x $541 $266 $10,253Allied Nevada Gold Corp. TT ANV $29.40 $44.00 SP 91 $2,682 $31.18 0.94x 8% 9% 24.3x 18.1x 248 $770 17.8x $315 $120 $16,075Centerra Gold Inc. TT CG C$9.11 C$21.00 SO 237 $2,172 C$18.52 0.49x -2% 11% 3.8x 3.2x 668 $426 2.7x $275 $146 $3,363Eldorado Gold TJ ELD $12.72 $20.00 SO 713 $9,074 $15.00 0.85x 10% 11% 18.9x 12.9x 746 $528 11.9x $384 $245 $14,558IAMGOLD TJ IMG $11.13 $17.00 SP 377 $4,195 $15.30 0.73x 7% 12% 9.5x 5.8x 930 $694 5.2x $398 $174 $5,693New Gold Inc.*** TT NGD $10.71 $14.00 SO 487 $5,219 $9.46 1.13x 21% 15% 14.5x 9.5x 496 $62 8.3x $799 $211 $13,585Osisko Mining Corp. LO OSK C$7.78 C$12.00 SO 390 $3,054 C$8.28 0.94x 14% 14% 16.4x 7.0x 513 $781 8.5x $283 $127 $5,918Yamana Gold TJ YRI $16.88 $25.00 SO 746 $12,601 $13.80 1.22x 7% 8% 10.2x 7.2x 1,619 $524 5.4x $735 $300 $7,731
Mid-Tier Total/Average $47,707 0.96x 9% 12% 15.1x 9.4x 6,209 $562 10.1x $528 $231 $10,373
Small CapAlacer Gold LO ASR C$5.00 C$8.25 SP 290 $1,459 C$6.00 0.83x 14% 12% 9.9x 4.4x 404 $809 4.7x $387 $150 $4,342Alamos Gold Inc. TT AGI C$17.34 C$24.00 SO 126 $2,193 C$19.52 0.89x -2% 10% 15.6x 11.1x 205 $432 8.0x $930 $267 $11,153Argonaut Gold OH AR C$9.26 C$15.00 SO 151 $1,406 C$12.76 0.73x 17% 15% 13.9x 11.5x 132 $613 8.3x $996 $121 $9,267AuRico Gold Inc. TT AUQ $7.94 C$9.00 SP 288 $2,284 C$8.45 0.94x 3% 0% 17.2x 14.0x 219 $558 9.7x $295 $145 $21,930Aurizon Mines Ltd OH ARZ C$3.33 C$6.50 SO 175 $583 C$5.75 0.58x 13% 5% 12.1x 6.8x 127 $725 4.6x $372 $375 $4,281B2Gold Corp. OH BTO C$3.51 C$6.00 SO 668 $2,345 C$4.48 0.78x 8% 10% 10.7x 7.7x 361 $610 8.7x $3,345 $530 $7,769Dundee Precious Metals Inc. LO DPM C$8.16 C$13.00 SO 149 $1,228 C$9.86 0.83x 5% 8% 8.9x 6.2x 174 $398 5.5x $386 $162 $7,492Golden Star Resources Ltd. TT GSS $1.78 $1.50 SP 259 $461 $1.71 1.04x 1% 23% 6.7x 3.1x 357 $1,097 3.3x $133 $61 $1,838Primero Mining Corp. OH P C$6.25 C$9.00 SO 126 $786 $7.90 0.79x 6% 8% 8.2x 5.8x 135 $579 6.2x $1,252 $474 $5,425Rio Alto Mining MT RIO C$4.94 C$5.90 SP 175 $864 C$5.61 0.88x 6% 6% 11.3x 8.1x 177 $806 4.5x $318 $134 $4,599SEMAFO Inc. LO SMF C$3.36 C$5.75 SO 280 $949 C$4.15 0.81x 11% 13% 9.5x 5.8x 234 $853 4.0x $300 $77 $3,394Teranga Gold Corporation LO TGZ C$2.20 C$3.00 SP 246 $544 C$1.87 1.17x 64% 16% 8.9x 4.7x 201 $715 8.2x $355 $161 $2,929
Small Cap Total/Average $15,100 0.86x 12% 10% 11.1x 7.4x 2,726 $689 5.5x $405 $226 $8,703
Overall Total/Average $161,112 0.91x 9% 11% 12.2x 7.9x 27,291 $620 7.2x $419 $222 $8,439
InternationalAfrican Barrick Gold TJ ABG $7.24 $7.50 SU 410 $2,969 $8.30 0.87x -3% 13% 8.8x 4.7x 747 $795 4.5x $176 $95 $4,019AngloGold Ashanti TJ AU $30.95 $40.00 SP 422 $13,058 $34.85 0.89x 7% 20% 10.2x 4.2x 4,706 $856 6.3x $279 $154 $4,485Buenaventura TJ BVN $35.61 $42.00 SP 254 $9,061 $27.90 1.28x 4% 9% 11.7x 20.3x 1,029 $577 9.1x $593 $284 $6,548Gold Fields Limited TJ GFI $12.18 $15.00 SP 729 $8,875 $13.00 0.94x 4% 20% 6.6x 3.8x 3,676 $894 3.5x $140 $57 $2,964Randgold Resources TJ GOLD $97.73 $130.00 SP 92 $8,986 $76.85 1.27x 13% 11% 17.8x 11.4x 790 $715 9.8x $580 $334 $11,942
International Total/Average $42,949 1.05x 5% 15% 11.0x 8.9x 10,948 $828 6.6x $340 $180 $5,780
Other Metals **North American Palladium Ltd. LO PAL $1.23 $2.25 SP 177 $217 $1.40 0.88x 14% 37% 14.2x 4.3x 165 $415 5.6x $3,802 $865 $1,983
Other Metals Total/Average n.m. n.m. n.m. n.m. n.m. n.m. n.m. n.m. n.m. n.m. n.m. n.m.
RoyaltiesFranco-Nevada TJ FNV $56.96 $68.00 SP 147 $8,345 $30.40 1.87x 2% 6% 39.4x 20.7x 211 n.a. 15.5x $1,928 $753 $34,231Royal Gold TJ RGLD $80.10 R R 60 $4,780 R R R R R R R R R R R RSilver Wheaton TT SLW $34.56 $51.00 SO 359 $12,422 $27.65 1.25x 1% n.a. 15.8x 12.9x n.a. n.a. 13.3x n.a. n.a. n.a.
Royalty Total/Average $25,547 1.56x 2% 6% 27.6x 16.8x 211 n.a. 11.3x $1,928 $753 $34,231Coverage Total/Average* $229,608 0.94x 8% 12% 13.0x 8.8x 38,239 $680 7.5x $538 $261 $10,231
Earnings Cash Flow
2013E Adjusted Market Capitalization/
Currencies are in U.S. dollars unless otherwise stated. Analysts: TJ = Tanya Jakusconek, TT = Trevor Turnbull, LO = Leily Omoumi, OH = Ovais Habib, MT = Mark Turner n.a. = not available. SO = Sector Outperform. SP = Sector Perform. SU = Sector Underperform. N/M = Not Meaningful. R = Restricted. * Does not include Other Metals ** North American palladium production, cash costs, and sensitivities based on primary metal. *** New Gold cash costs include New Afton cash costs net of by-product credits.
Valuations based on a gold price of US$1,675/oz for 2012E; US$1,800/oz in 2013E, 2014E, and 2015E; US$1,600/oz in 2016E; and US$1,300/oz in 2017E and long term. Valuations based on a silver price of US$30.77/oz in 2012E; US$36.00/oz in 2013E, 2014E, and 2015E; US$30.00/oz in 2016E; and US$21.00/oz in 2017E and long term. Discount rates: 3% for precious metals, 8% for non-gold assets, and 5% for diamonds.
Source: Reuters; company reports; Scotiabank GBM estimates.
CO
MP
AR
AT
IVE
VA
LU
AT
ION
TA
BL
E
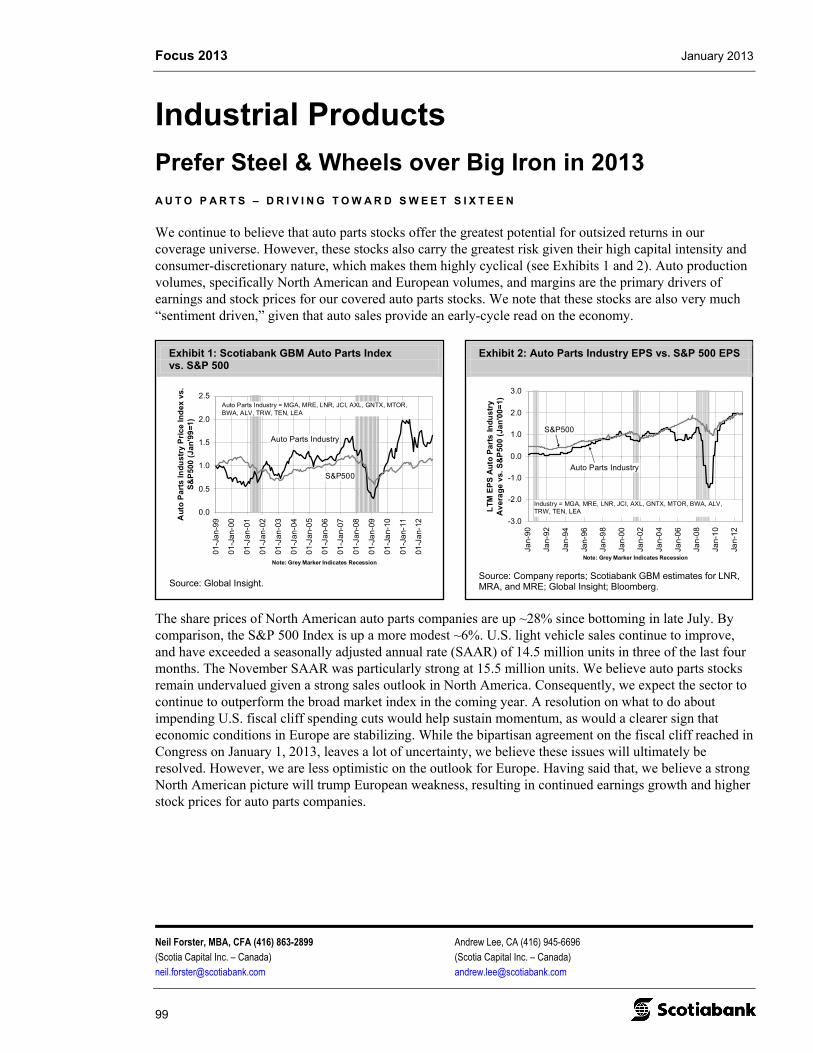
Focus 2013 January 2013
Neil Forster, MBA, CFA (416) 863-2899 Andrew Lee, CA (416) 945-6696 (Scotia Capital Inc. – Canada) (Scotia Capital Inc. – Canada) [email protected] [email protected]
99
Exhibit 1: Scotiabank GBM Auto Parts Index vs. S&P 500
0.0
0.5
1.0
1.5
2.0
2.5
01
-Ja
n-9
9
01
-Ja
n-00
01
-Ja
n-01
01
-Ja
n-02
01
-Ja
n-03
01
-Ja
n-04
01
-Ja
n-0
5
01
-Ja
n-06
01
-Ja
n-07
01
-Ja
n-08
01
-Ja
n-0
9
01
-Ja
n-10
01
-Ja
n-11
01
-Ja
n-12
Note: Grey Marker Indicates Recession
Au
to P
art
s In
du
stry
Pri
ce
Ind
ex
vs.
S
&P
500
(J
an
'99
=1)
S&P500
Auto Parts Industry
Auto Parts Industry = MGA, MRE, LNR, JCI, AXL, GNTX, MTOR, BWA, ALV, TRW, TEN, LEA
Source: Global Insight.
Exhibit 2: Auto Parts Industry EPS vs. S&P 500 EPS
-3.0
-2.0
-1.0
0.0
1.0
2.0
3.0
Jan-
90
Jan-
92
Jan-
94
Jan-
96
Jan-
98
Jan-
00
Jan-
02
Jan-
04
Jan-
06
Jan-
08
Jan-
10
Jan-
12
Note: Grey Marker Indicates Recession
LT
M E
PS
Au
to P
art
s In
du
str
y
Av
era
ge
vs.
S&
P50
0 (J
an
'00
=1
)
Auto Parts Industry
S&P500
Industry = MGA, MRE, LNR, JCI, AXL, GNTX, MTOR, BWA, ALV, TRW, TEN, LEA
Source: Company reports; Scotiabank GBM estimates for LNR, MRA, and MRE; Global Insight; Bloomberg.
Industrial Products
Prefer Steel & Wheels over Big Iron in 2013
A U T O P A R T S – D R I V I N G T O W A R D S W E E T S I X T E E N
We continue to believe that auto parts stocks offer the greatest potential for outsized returns in our coverage universe. However, these stocks also carry the greatest risk given their high capital intensity and consumer-discretionary nature, which makes them highly cyclical (see Exhibits 1 and 2). Auto production volumes, specifically North American and European volumes, and margins are the primary drivers of earnings and stock prices for our covered auto parts stocks. We note that these stocks are also very much “sentiment driven,” given that auto sales provide an early-cycle read on the economy.
The share prices of North American auto parts companies are up ~28% since bottoming in late July. By comparison, the S&P 500 Index is up a more modest ~6%. U.S. light vehicle sales continue to improve, and have exceeded a seasonally adjusted annual rate (SAAR) of 14.5 million units in three of the last four months. The November SAAR was particularly strong at 15.5 million units. We believe auto parts stocks remain undervalued given a strong sales outlook in North America. Consequently, we expect the sector to continue to outperform the broad market index in the coming year. A resolution on what to do about impending U.S. fiscal cliff spending cuts would help sustain momentum, as would a clearer sign that economic conditions in Europe are stabilizing. While the bipartisan agreement on the fiscal cliff reached in Congress on January 1, 2013, leaves a lot of uncertainty, we believe these issues will ultimately be resolved. However, we are less optimistic on the outlook for Europe. Having said that, we believe a strong North American picture will trump European weakness, resulting in continued earnings growth and higher stock prices for auto parts companies.
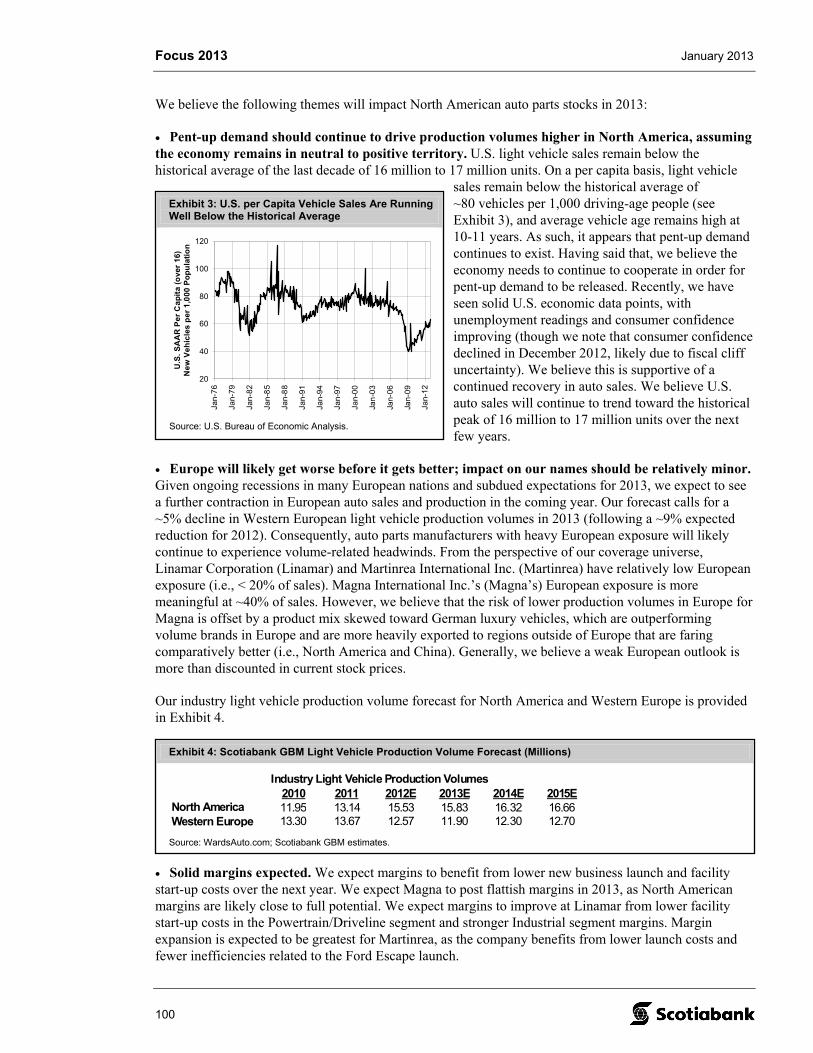
Focus 2013 January 2013
100
Exhibit 3: U.S. per Capita Vehicle Sales Are Running Well Below the Historical Average
20
40
60
80
100
120
Jan
-76
Jan
-79
Jan
-82
Jan
-85
Jan
-88
Jan
-91
Jan
-94
Jan
-97
Jan
-00
Jan
-03
Jan
-06
Jan
-09
Jan
-12
U.S
. S
AA
R P
er
Ca
pit
a (
ov
er 1
6)
Ne
w V
eh
icle
s p
er 1
,00
0 P
op
ula
tio
n
Source: U.S. Bureau of Economic Analysis.
Exhibit 4: Scotiabank GBM Light Vehicle Production Volume Forecast (Millions)
2010 2011 2012E 2013E 2014E 2015ENorth America 11.95 13.14 15.53 15.83 16.32 16.66Western Europe 13.30 13.67 12.57 11.90 12.30 12.70
Industry Light Vehicle Production Volumes
Source: WardsAuto.com; Scotiabank GBM estimates.
We believe the following themes will impact North American auto parts stocks in 2013:
• Pent-up demand should continue to drive production volumes higher in North America, assuming the economy remains in neutral to positive territory. U.S. light vehicle sales remain below the historical average of the last decade of 16 million to 17 million units. On a per capita basis, light vehicle
sales remain below the historical average of ~80 vehicles per 1,000 driving-age people (see Exhibit 3), and average vehicle age remains high at 10-11 years. As such, it appears that pent-up demand continues to exist. Having said that, we believe the economy needs to continue to cooperate in order for pent-up demand to be released. Recently, we have seen solid U.S. economic data points, with unemployment readings and consumer confidence improving (though we note that consumer confidence declined in December 2012, likely due to fiscal cliff uncertainty). We believe this is supportive of a continued recovery in auto sales. We believe U.S. auto sales will continue to trend toward the historical peak of 16 million to 17 million units over the next few years.
• Europe will likely get worse before it gets better; impact on our names should be relatively minor. Given ongoing recessions in many European nations and subdued expectations for 2013, we expect to see a further contraction in European auto sales and production in the coming year. Our forecast calls for a ~5% decline in Western European light vehicle production volumes in 2013 (following a ~9% expected reduction for 2012). Consequently, auto parts manufacturers with heavy European exposure will likely continue to experience volume-related headwinds. From the perspective of our coverage universe, Linamar Corporation (Linamar) and Martinrea International Inc. (Martinrea) have relatively low European exposure (i.e., < 20% of sales). Magna International Inc.’s (Magna’s) European exposure is more meaningful at ~40% of sales. However, we believe that the risk of lower production volumes in Europe for Magna is offset by a product mix skewed toward German luxury vehicles, which are outperforming volume brands in Europe and are more heavily exported to regions outside of Europe that are faring comparatively better (i.e., North America and China). Generally, we believe a weak European outlook is more than discounted in current stock prices.
Our industry light vehicle production volume forecast for North America and Western Europe is provided in Exhibit 4.
• Solid margins expected. We expect margins to benefit from lower new business launch and facility start-up costs over the next year. We expect Magna to post flattish margins in 2013, as North American margins are likely close to full potential. We expect margins to improve at Linamar from lower facility start-up costs in the Powertrain/Driveline segment and stronger Industrial segment margins. Margin expansion is expected to be greatest for Martinrea, as the company benefits from lower launch costs and fewer inefficiencies related to the Ford Escape launch.
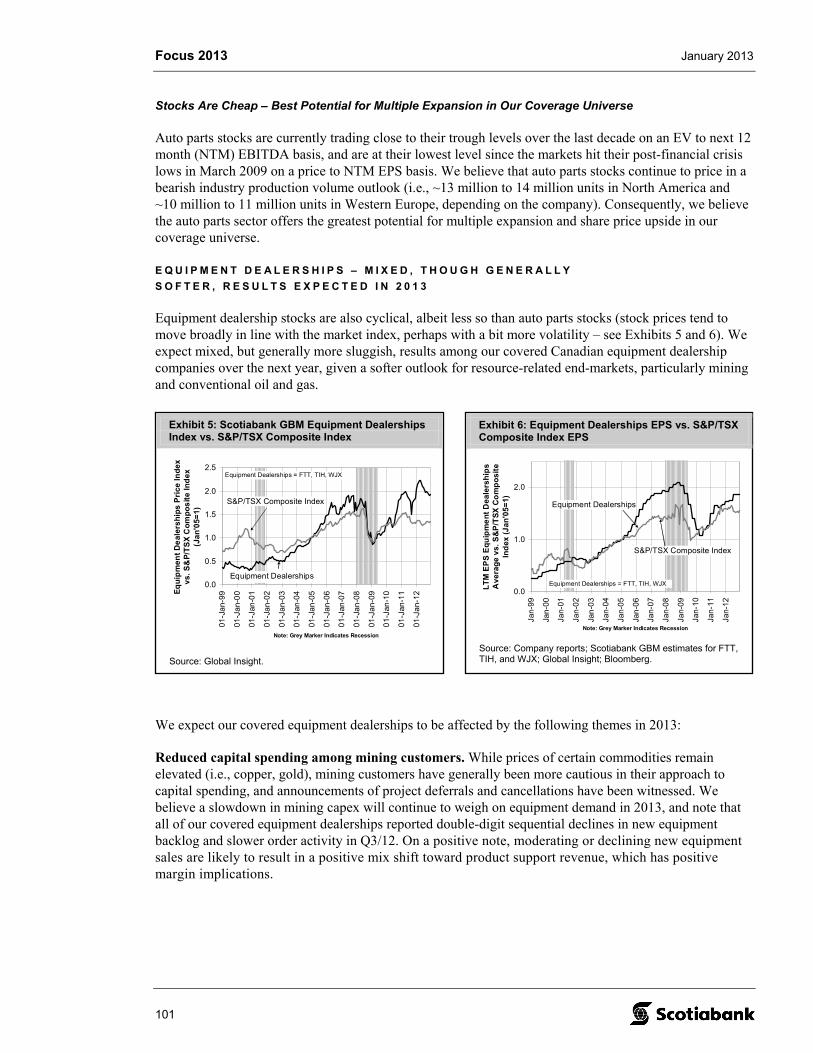
Focus 2013 January 2013
101
Exhibit 5: Scotiabank GBM Equipment Dealerships Index vs. S&P/TSX Composite Index
0.0
0.5
1.0
1.5
2.0
2.5
01
-Ja
n-9
9
01
-Ja
n-0
0
01
-Ja
n-0
1
01
-Ja
n-0
2
01
-Ja
n-0
3
01
-Ja
n-0
4
01
-Ja
n-0
5
01
-Ja
n-0
6
01
-Ja
n-0
7
01
-Ja
n-0
8
01
-Ja
n-0
9
01
-Ja
n-1
0
01
-Ja
n-1
1
01
-Ja
n-1
2
Note: Grey Marker Indicates Recession
Eq
uip
me
nt
De
ale
rsh
ips
Pri
ce
In
de
x
vs
. S
&P
/TS
X C
om
po
sit
e I
nd
ex
(J
an
'05
=1
)
S&P/TSX Composite Index
Equipment Dealerships
Equipment Dealerships = FTT, TIH, WJX
Source: Global Insight.
Exhibit 6: Equipment Dealerships EPS vs. S&P/TSX Composite Index EPS
0.0
1.0
2.0
Jan
-99
Jan
-00
Jan
-01
Jan
-02
Jan
-03
Jan
-04
Jan
-05
Jan
-06
Jan
-07
Jan
-08
Jan
-09
Jan
-10
Jan
-11
Jan
-12
Note: Grey Marker Indicates Recession
LT
M E
PS
Eq
uip
me
nt
Dea
lers
hip
s
Av
era
ge
vs
. S&
P/T
SX
Co
mp
os
ite
In
dex
(J
an
'05
=1)Equipment Dealerships
S&P/TSX Composite Index
Equipment Dealerships = FTT, TIH, WJX
Source: Company reports; Scotiabank GBM estimates for FTT, TIH, and WJX; Global Insight; Bloomberg.
Stocks Are Cheap – Best Potential for Multiple Expansion in Our Coverage Universe
Auto parts stocks are currently trading close to their trough levels over the last decade on an EV to next 12 month (NTM) EBITDA basis, and are at their lowest level since the markets hit their post-financial crisis lows in March 2009 on a price to NTM EPS basis. We believe that auto parts stocks continue to price in a bearish industry production volume outlook (i.e., ~13 million to 14 million units in North America and ~10 million to 11 million units in Western Europe, depending on the company). Consequently, we believe the auto parts sector offers the greatest potential for multiple expansion and share price upside in our coverage universe.
E Q U I P M E N T D E A L E R S H I P S – M I X E D , T H O U G H G E N E R A L L Y
S O F T E R , R E S U L T S E X P E C T E D I N 2 0 1 3
Equipment dealership stocks are also cyclical, albeit less so than auto parts stocks (stock prices tend to move broadly in line with the market index, perhaps with a bit more volatility – see Exhibits 5 and 6). We expect mixed, but generally more sluggish, results among our covered Canadian equipment dealership companies over the next year, given a softer outlook for resource-related end-markets, particularly mining and conventional oil and gas.
We expect our covered equipment dealerships to be affected by the following themes in 2013:
Reduced capital spending among mining customers. While prices of certain commodities remain elevated (i.e., copper, gold), mining customers have generally been more cautious in their approach to capital spending, and announcements of project deferrals and cancellations have been witnessed. We believe a slowdown in mining capex will continue to weigh on equipment demand in 2013, and note that all of our covered equipment dealerships reported double-digit sequential declines in new equipment backlog and slower order activity in Q3/12. On a positive note, moderating or declining new equipment sales are likely to result in a positive mix shift toward product support revenue, which has positive margin implications.
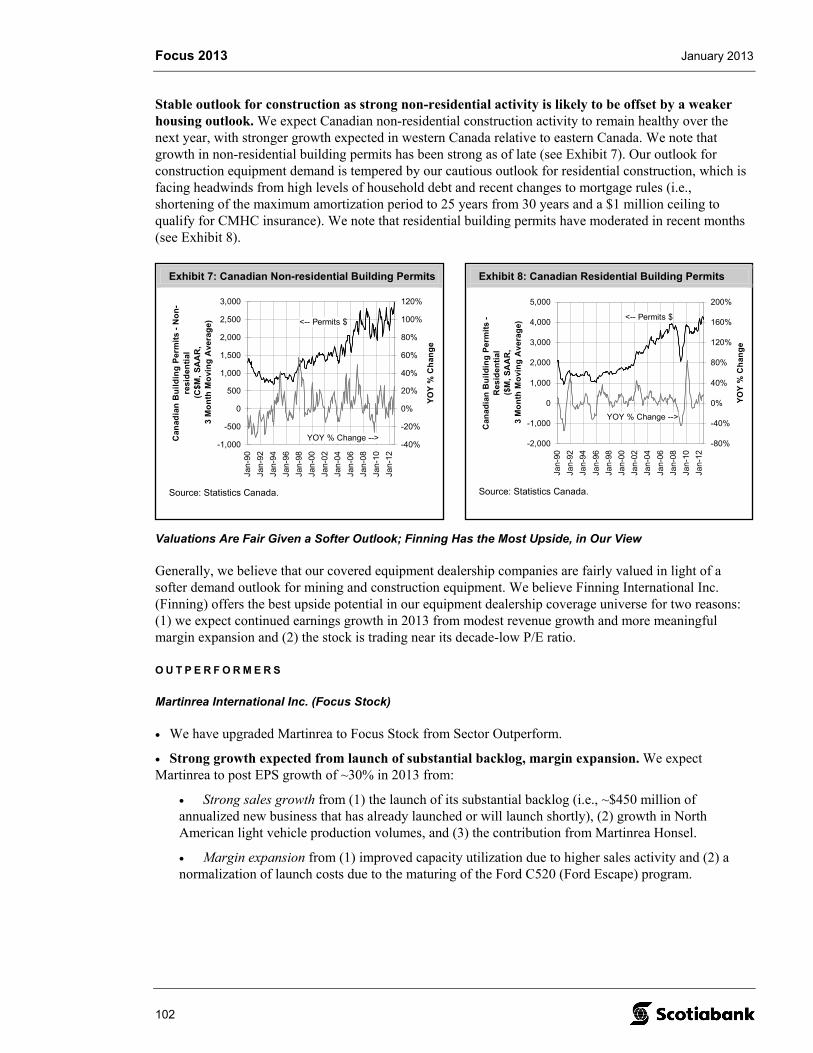
Focus 2013 January 2013
102
Exhibit 8: Canadian Residential Building Permits
-2,000
-1,000
0
1,000
2,000
3,000
4,000
5,000
Jan-
90
Jan-
92
Jan-
94
Jan-
96
Jan-
98
Jan-
00
Jan-
02
Jan-
04
Jan-
06
Jan-
08
Jan-
10
Jan-
12
Can
ad
ian
Bu
ild
ing
Pe
rmit
s -
Res
ide
nti
al
($M
, S
AA
R,
3 M
on
th M
ovi
ng
Av
era
ge)
-80%
-40%
0%
40%
80%
120%
160%
200%
YO
Y %
Ch
ang
e
<-- Permits $
YOY % Change -->
Source: Statistics Canada.
Exhibit 7: Canadian Non-residential Building Permits
-1,000
-500
0
500
1,000
1,500
2,000
2,500
3,000
Jan-
90
Jan-
92
Jan-
94
Jan-
96
Jan-
98
Jan-
00
Jan-
02
Jan-
04
Jan-
06
Jan-
08
Jan-
10
Jan-
12
Can
adia
n B
uil
din
g P
erm
its
- N
on
-re
sid
enti
al(C
$M,
SA
AR
,3
Mo
nth
Mo
vin
g A
vera
ge)
-40%
-20%
0%
20%
40%
60%
80%
100%
120%
YO
Y %
Ch
ang
e
<-- Permits $
YOY % Change -->
Source: Statistics Canada.
Stable outlook for construction as strong non-residential activity is likely to be offset by a weaker housing outlook. We expect Canadian non-residential construction activity to remain healthy over the next year, with stronger growth expected in western Canada relative to eastern Canada. We note that growth in non-residential building permits has been strong as of late (see Exhibit 7). Our outlook for construction equipment demand is tempered by our cautious outlook for residential construction, which is facing headwinds from high levels of household debt and recent changes to mortgage rules (i.e., shortening of the maximum amortization period to 25 years from 30 years and a $1 million ceiling to qualify for CMHC insurance). We note that residential building permits have moderated in recent months (see Exhibit 8).
Valuations Are Fair Given a Softer Outlook; Finning Has the Most Upside, in Our View
Generally, we believe that our covered equipment dealership companies are fairly valued in light of a softer demand outlook for mining and construction equipment. We believe Finning International Inc. (Finning) offers the best upside potential in our equipment dealership coverage universe for two reasons: (1) we expect continued earnings growth in 2013 from modest revenue growth and more meaningful margin expansion and (2) the stock is trading near its decade-low P/E ratio.
O U T P E R F O R M E R S
Martinrea International Inc. (Focus Stock)
• We have upgraded Martinrea to Focus Stock from Sector Outperform.
• Strong growth expected from launch of substantial backlog, margin expansion. We expect Martinrea to post EPS growth of ~30% in 2013 from:
• Strong sales growth from (1) the launch of its substantial backlog (i.e., ~$450 million of annualized new business that has already launched or will launch shortly), (2) growth in North American light vehicle production volumes, and (3) the contribution from Martinrea Honsel.
• Margin expansion from (1) improved capacity utilization due to higher sales activity and (2) a normalization of launch costs due to the maturing of the Ford C520 (Ford Escape) program.
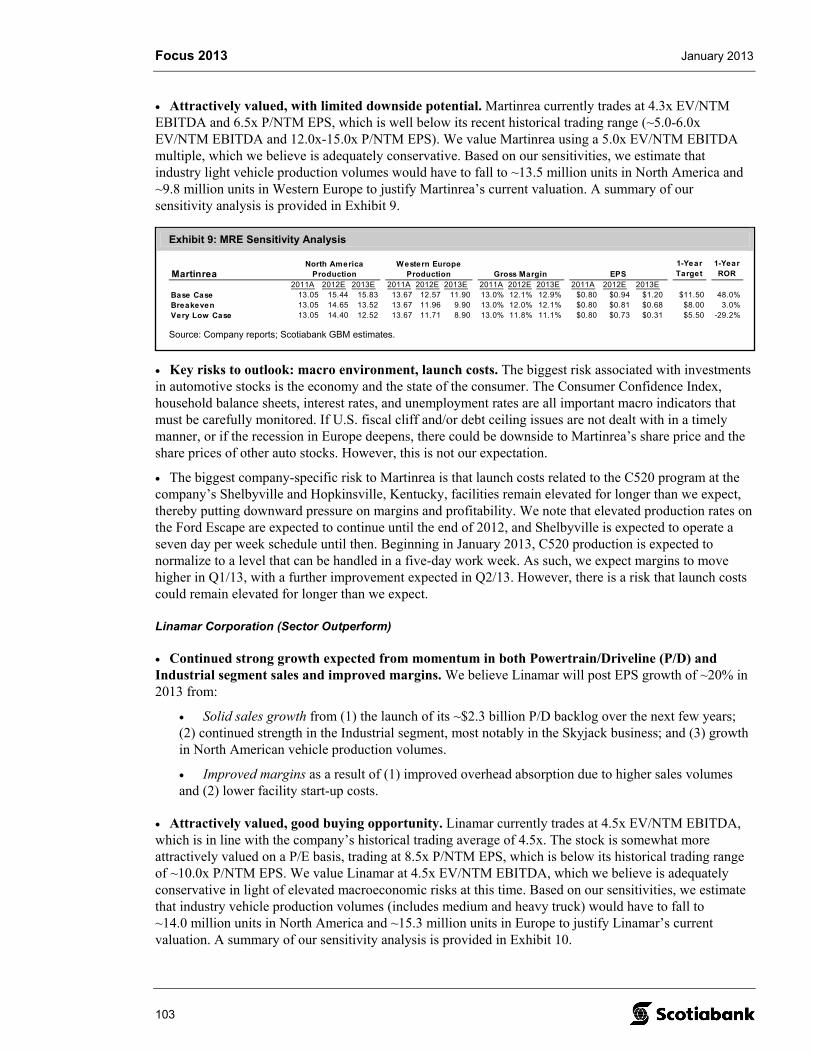
Focus 2013 January 2013
103
Exhibit 9: MRE Sensitivity Analysis
Martinrea1-Year Target
1-Year ROR
2011A 2012E 2013E 2011A 2012E 2013E 2011A 2012E 2013E 2011A 2012E 2013EBase Case 13.05 15.44 15.83 13.67 12.57 11.90 13.0% 12.1% 12.9% $0.80 $0.94 $1.20 $11.50 48.0%Breakeven 13.05 14.65 13.52 13.67 11.96 9.90 13.0% 12.0% 12.1% $0.80 $0.81 $0.68 $8.00 3.0%Very Low Case 13.05 14.40 12.52 13.67 11.71 8.90 13.0% 11.8% 11.1% $0.80 $0.73 $0.31 $5.50 -29.2%
North America Production
Western Europe Production Gross Margin EPS
Source: Company reports; Scotiabank GBM estimates.
• Attractively valued, with limited downside potential. Martinrea currently trades at 4.3x EV/NTM EBITDA and 6.5x P/NTM EPS, which is well below its recent historical trading range (~5.0-6.0x EV/NTM EBITDA and 12.0x-15.0x P/NTM EPS). We value Martinrea using a 5.0x EV/NTM EBITDA multiple, which we believe is adequately conservative. Based on our sensitivities, we estimate that industry light vehicle production volumes would have to fall to ~13.5 million units in North America and ~9.8 million units in Western Europe to justify Martinrea’s current valuation. A summary of our sensitivity analysis is provided in Exhibit 9.
• Key risks to outlook: macro environment, launch costs. The biggest risk associated with investments in automotive stocks is the economy and the state of the consumer. The Consumer Confidence Index, household balance sheets, interest rates, and unemployment rates are all important macro indicators that must be carefully monitored. If U.S. fiscal cliff and/or debt ceiling issues are not dealt with in a timely manner, or if the recession in Europe deepens, there could be downside to Martinrea’s share price and the share prices of other auto stocks. However, this is not our expectation.
• The biggest company-specific risk to Martinrea is that launch costs related to the C520 program at the company’s Shelbyville and Hopkinsville, Kentucky, facilities remain elevated for longer than we expect, thereby putting downward pressure on margins and profitability. We note that elevated production rates on the Ford Escape are expected to continue until the end of 2012, and Shelbyville is expected to operate a seven day per week schedule until then. Beginning in January 2013, C520 production is expected to normalize to a level that can be handled in a five-day work week. As such, we expect margins to move higher in Q1/13, with a further improvement expected in Q2/13. However, there is a risk that launch costs could remain elevated for longer than we expect.
Linamar Corporation (Sector Outperform)
• Continued strong growth expected from momentum in both Powertrain/Driveline (P/D) and Industrial segment sales and improved margins. We believe Linamar will post EPS growth of ~20% in 2013 from:
• Solid sales growth from (1) the launch of its ~$2.3 billion P/D backlog over the next few years; (2) continued strength in the Industrial segment, most notably in the Skyjack business; and (3) growth in North American vehicle production volumes.
• Improved margins as a result of (1) improved overhead absorption due to higher sales volumes and (2) lower facility start-up costs.
• Attractively valued, good buying opportunity. Linamar currently trades at 4.5x EV/NTM EBITDA, which is in line with the company’s historical trading average of 4.5x. The stock is somewhat more attractively valued on a P/E basis, trading at 8.5x P/NTM EPS, which is below its historical trading range of ~10.0x P/NTM EPS. We value Linamar at 4.5x EV/NTM EBITDA, which we believe is adequately conservative in light of elevated macroeconomic risks at this time. Based on our sensitivities, we estimate that industry vehicle production volumes (includes medium and heavy truck) would have to fall to ~14.0 million units in North America and ~15.3 million units in Europe to justify Linamar’s current valuation. A summary of our sensitivity analysis is provided in Exhibit 10.
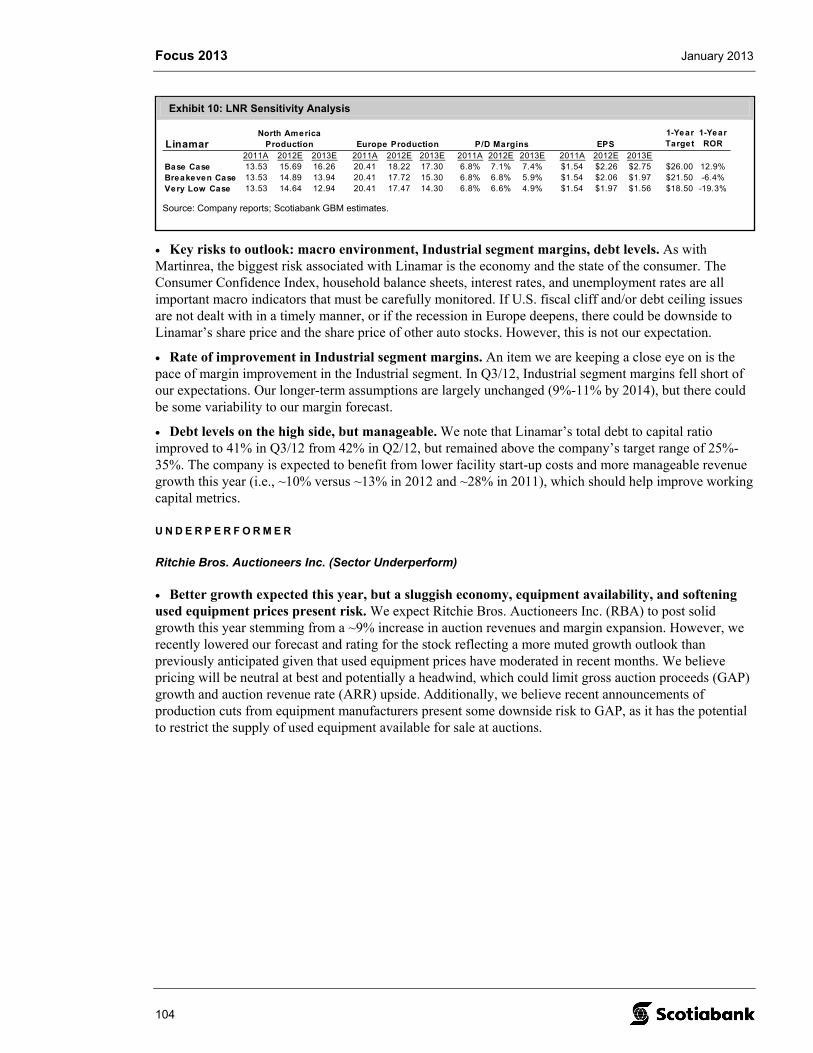
Focus 2013 January 2013
104
Exhibit 10: LNR Sensitivity Analysis
Linamar1-Year Target
1-Year ROR
2011A 2012E 2013E 2011A 2012E 2013E 2011A 2012E 2013E 2011A 2012E 2013EBase Case 13.53 15.69 16.26 20.41 18.22 17.30 6.8% 7.1% 7.4% $1.54 $2.26 $2.75 $26.00 12.9%Breakeven Case 13.53 14.89 13.94 20.41 17.72 15.30 6.8% 6.8% 5.9% $1.54 $2.06 $1.97 $21.50 -6.4%Very Low Case 13.53 14.64 12.94 20.41 17.47 14.30 6.8% 6.6% 4.9% $1.54 $1.97 $1.56 $18.50 -19.3%
North America Production Europe Production P/D Margins EPS
Source: Company reports; Scotiabank GBM estimates.
• Key risks to outlook: macro environment, Industrial segment margins, debt levels. As with Martinrea, the biggest risk associated with Linamar is the economy and the state of the consumer. The Consumer Confidence Index, household balance sheets, interest rates, and unemployment rates are all important macro indicators that must be carefully monitored. If U.S. fiscal cliff and/or debt ceiling issues are not dealt with in a timely manner, or if the recession in Europe deepens, there could be downside to Linamar’s share price and the share price of other auto stocks. However, this is not our expectation.
• Rate of improvement in Industrial segment margins. An item we are keeping a close eye on is the pace of margin improvement in the Industrial segment. In Q3/12, Industrial segment margins fell short of our expectations. Our longer-term assumptions are largely unchanged (9%-11% by 2014), but there could be some variability to our margin forecast.
• Debt levels on the high side, but manageable. We note that Linamar’s total debt to capital ratio improved to 41% in Q3/12 from 42% in Q2/12, but remained above the company’s target range of 25%-35%. The company is expected to benefit from lower facility start-up costs and more manageable revenue growth this year (i.e., ~10% versus ~13% in 2012 and ~28% in 2011), which should help improve working capital metrics.
U N D E R P E R F O R M E R
Ritchie Bros. Auctioneers Inc. (Sector Underperform)
• Better growth expected this year, but a sluggish economy, equipment availability, and softening used equipment prices present risk. We expect Ritchie Bros. Auctioneers Inc. (RBA) to post solid growth this year stemming from a ~9% increase in auction revenues and margin expansion. However, we recently lowered our forecast and rating for the stock reflecting a more muted growth outlook than previously anticipated given that used equipment prices have moderated in recent months. We believe pricing will be neutral at best and potentially a headwind, which could limit gross auction proceeds (GAP) growth and auction revenue rate (ARR) upside. Additionally, we believe recent announcements of production cuts from equipment manufacturers present some downside risk to GAP, as it has the potential to restrict the supply of used equipment available for sale at auctions.
Focus 2013 January 2013
105
• What would lead us to become more positive on RBA? While we see potential headwinds to the RBA story, the following factors would increase our comfort level with the name:
• More meaningful GAP growth. We expect GAP to improve this year as management has seen improved equipment availability as a result of a more balanced supply-and-demand environment for used equipment. Having said that, we believe GAP growth will remain below potential given softer used equipment prices. More meaningful GAP growth would increase our confidence that RBA could return to historical earnings growth rates.
• Improved performance of at-risk business. Management expects at-risk business as a percentage of total GAP to decline gradually over the next year, as easing competition results in less-aggressive underwriting of at-risk deals and, therefore, more consignors opting for straight commission arrangements. This would imply improved performance of at-risk business and a higher ARR, assuming a stable used equipment pricing environment. We expect a gradual improvement in the ARR in 2013. A more meaningful improvement would increase our confidence in the outlook.
• Lower multiples. Currently, RBA trades at elevated multiples. If the share price were to come down, we may become more constructive on the name.
• Valuation reasonable by historical standards, but lofty in an absolute sense. RBA currently trades at 23.0x P/NTM EPS and 13.0x EV/NTM EBITDA, which is at the low end of the company’s historical trading range. However, we believe that RBA should trade at lower multiples than in recent years given (1) greater earnings variability in recent years and (2) our view that historical multiples reflected a view that RBA could grow earnings in any economic environment. We believe premium multiples need to be supported by premium growth, which we are not seeing in a meaningful way right now. If sustainable growth rates prove to be lower versus history, our valuation multiples may still prove to be too high.
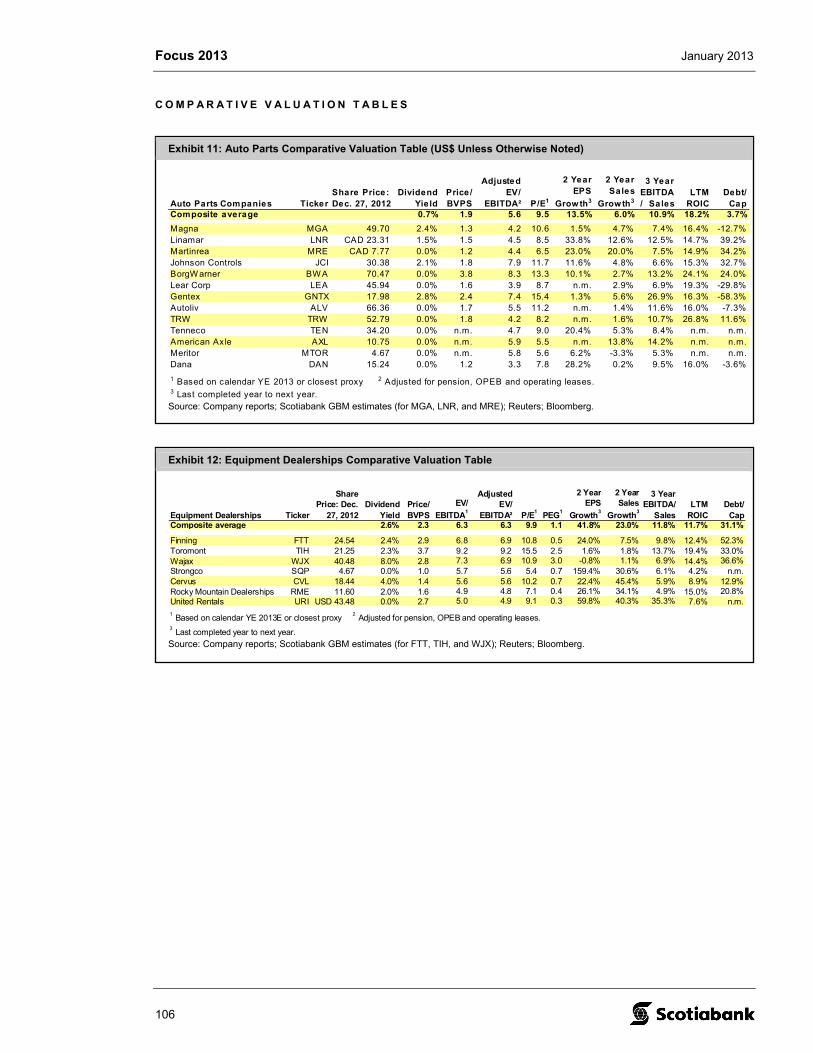
Focus 2013 January 2013
106
Exhibit 11: Auto Parts Comparative Valuation Table (US$ Unless Otherwise Noted)
Auto Parts Companies TickerShare Price: Dec. 27, 2012
Dividend Yield
Price/ BVPS
Adjusted EV/
EBITDA² P/E1
2 Year EPS
Grow th3
2 Year Sales
Growth3
3 Year EBITDA/ Sales
LTM ROIC
Debt/ Cap
Composite average 0.7% 1.9 5.6 9.5 13.5% 6.0% 10.9% 18.2% 3.7%
Magna MGA 49.70 2.4% 1.3 4.2 10.6 1.5% 4.7% 7.4% 16.4% -12.7%Linamar LNR CAD 23.31 1.5% 1.5 4.5 8.5 33.8% 12.6% 12.5% 14.7% 39.2%Martinrea MRE CAD 7.77 0.0% 1.2 4.4 6.5 23.0% 20.0% 7.5% 14.9% 34.2%Johnson Controls JCI 30.38 2.1% 1.8 7.9 11.7 11.6% 4.8% 6.6% 15.3% 32.7%BorgW arner BW A 70.47 0.0% 3.8 8.3 13.3 10.1% 2.7% 13.2% 24.1% 24.0%Lear Corp LEA 45.94 0.0% 1.6 3.9 8.7 n.m. 2.9% 6.9% 19.3% -29.8%Gentex GNTX 17.98 2.8% 2.4 7.4 15.4 1.3% 5.6% 26.9% 16.3% -58.3%Autoliv ALV 66.36 0.0% 1.7 5.5 11.2 n.m. 1.4% 11.6% 16.0% -7.3%TRW TRW 52.79 0.0% 1.8 4.2 8.2 n.m. 1.6% 10.7% 26.8% 11.6%Tenneco TEN 34.20 0.0% n.m. 4.7 9.0 20.4% 5.3% 8.4% n.m. n.m.American Axle AXL 10.75 0.0% n.m. 5.9 5.5 n.m. 13.8% 14.2% n.m. n.m.Meritor MTOR 4.67 0.0% n.m. 5.8 5.6 6.2% -3.3% 5.3% n.m. n.m.Dana DAN 15.24 0.0% 1.2 3.3 7.8 28.2% 0.2% 9.5% 16.0% -3.6%
1 Based on calendar YE 2013 or closest proxy 2 Adjusted for pension, OPEB and operating leases.3 Last completed year to next year.
Source: Company reports; Scotiabank GBM estimates (for MGA, LNR, and MRE); Reuters; Bloomberg.
Exhibit 12: Equipment Dealerships Comparative Valuation Table
Equipment Dealerships Ticker
Share Price: Dec.
27, 2012Dividend
YieldPrice/ BVPS
EV/
EBITDA1
Adjusted EV/
EBITDA² P/E1
PEG1
2 Year EPS
Growth3
2 Year Sales
Growth3
3 Year EBITDA/
SalesLTM
ROICDebt/
CapComposite average 2.6% 2.3 6.3 6.3 9.9 1.1 41.8% 23.0% 11.8% 11.7% 31.1%
Finning FTT 24.54 2.4% 2.9 6.8 6.9 10.8 0.5 24.0% 7.5% 9.8% 12.4% 52.3%Toromont TIH 21.25 2.3% 3.7 9.2 9.2 15.5 2.5 1.6% 1.8% 13.7% 19.4% 33.0%Wajax WJX 40.48 8.0% 2.8 7.3 6.9 10.9 3.0 -0.8% 1.1% 6.9% 14.4% 36.6%Strongco SQP 4.67 0.0% 1.0 5.7 5.6 5.4 0.7 159.4% 30.6% 6.1% 4.2% n.m.Cervus CVL 18.44 4.0% 1.4 5.6 5.6 10.2 0.7 22.4% 45.4% 5.9% 8.9% 12.9%Rocky Mountain Dealerships RME 11.60 2.0% 1.6 4.9 4.8 7.1 0.4 26.1% 34.1% 4.9% 15.0% 20.8%United Rentals URI USD 43.48 0.0% 2.7 5.0 4.9 9.1 0.3 59.8% 40.3% 35.3% 7.6% n.m.1 Based on calendar YE 2013E or closest proxy
2 Adjusted for pension, OPEB and operating leases.
3 Last completed year to next year.
Source: Company reports; Scotiabank GBM estimates (for FTT, TIH, and WJX); Reuters; Bloomberg.
C O M P A R A T I V E V A L U A T I O N T A B L E S
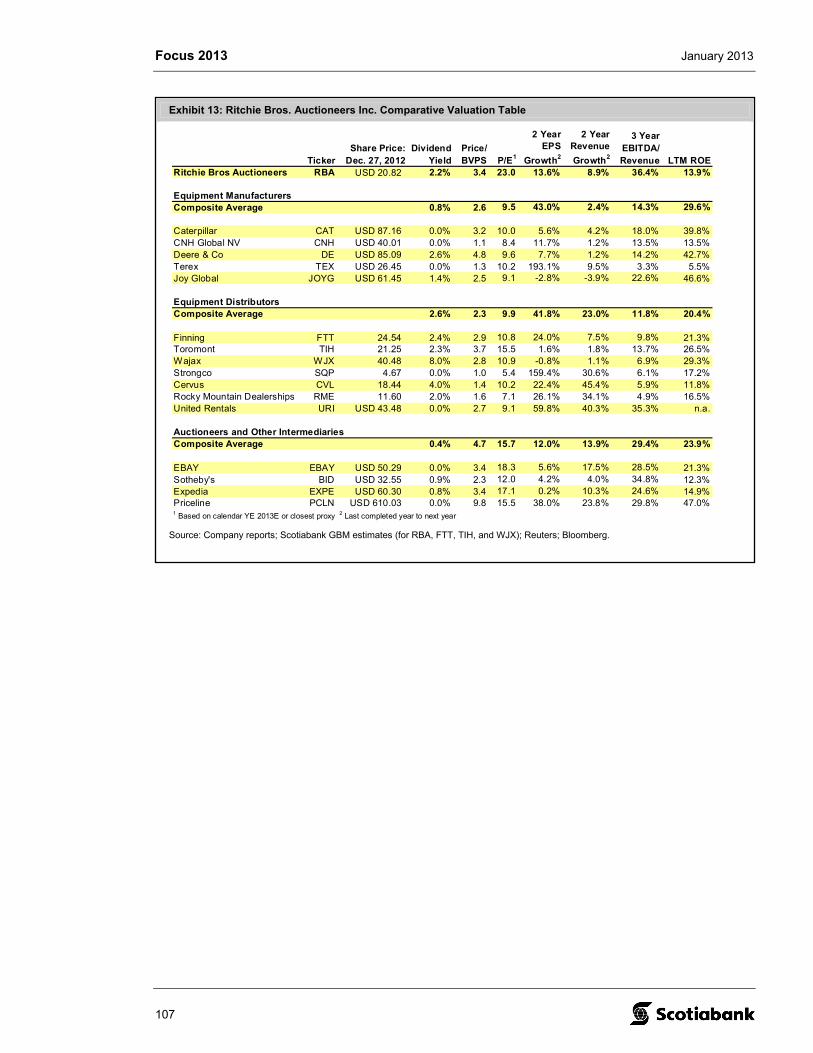
Focus 2013 January 2013
107
Exhibit 13: Ritchie Bros. Auctioneers Inc. Comparative Valuation Table
TickerShare Price:
Dec. 27, 2012Dividend
YieldPrice/ BVPS P/E1
2 Year EPS
Growth2
2 Year Revenue
Growth2
3 Year EBITDA/ Revenue LTM ROE
Ritchie Bros Auctioneers RBA USD 20.82 2.2% 3.4 23.0 13.6% 8.9% 36.4% 13.9%
Equipment ManufacturersComposite Average 0.8% 2.6 9.5 43.0% 2.4% 14.3% 29.6%
Caterpillar CAT USD 87.16 0.0% 3.2 10.0 5.6% 4.2% 18.0% 39.8%CNH Global NV CNH USD 40.01 0.0% 1.1 8.4 11.7% 1.2% 13.5% 13.5%Deere & Co DE USD 85.09 2.6% 4.8 9.6 7.7% 1.2% 14.2% 42.7%Terex TEX USD 26.45 0.0% 1.3 10.2 193.1% 9.5% 3.3% 5.5%Joy Global JOYG USD 61.45 1.4% 2.5 9.1 -2.8% -3.9% 22.6% 46.6%
Equipment DistributorsComposite Average 2.6% 2.3 9.9 41.8% 23.0% 11.8% 20.4%
Finning FTT 24.54 2.4% 2.9 10.8 24.0% 7.5% 9.8% 21.3%Toromont TIH 21.25 2.3% 3.7 15.5 1.6% 1.8% 13.7% 26.5%Wajax WJX 40.48 8.0% 2.8 10.9 -0.8% 1.1% 6.9% 29.3%Strongco SQP 4.67 0.0% 1.0 5.4 159.4% 30.6% 6.1% 17.2%Cervus CVL 18.44 4.0% 1.4 10.2 22.4% 45.4% 5.9% 11.8%Rocky Mountain Dealerships RME 11.60 2.0% 1.6 7.1 26.1% 34.1% 4.9% 16.5%United Rentals URI USD 43.48 0.0% 2.7 9.1 59.8% 40.3% 35.3% n.a.
Auctioneers and Other IntermediariesComposite Average 0.4% 4.7 15.7 12.0% 13.9% 29.4% 23.9%
EBAY EBAY USD 50.29 0.0% 3.4 18.3 5.6% 17.5% 28.5% 21.3%Sotheby's BID USD 32.55 0.9% 2.3 12.0 4.2% 4.0% 34.8% 12.3%Expedia EXPE USD 60.30 0.8% 3.4 17.1 0.2% 10.3% 24.6% 14.9%Priceline PCLN USD 610.03 0.0% 9.8 15.5 38.0% 23.8% 29.8% 47.0%1 Based on calendar YE 2013E or closest proxy 2 Last completed year to next year
Source: Company reports; Scotiabank GBM estimates (for RBA, FTT, TIH, and WJX); Reuters; Bloomberg.

Focus 2013 January 2013
108
T H I S P A G E I N T E N T I O N A L L Y L E F T B L A N K .
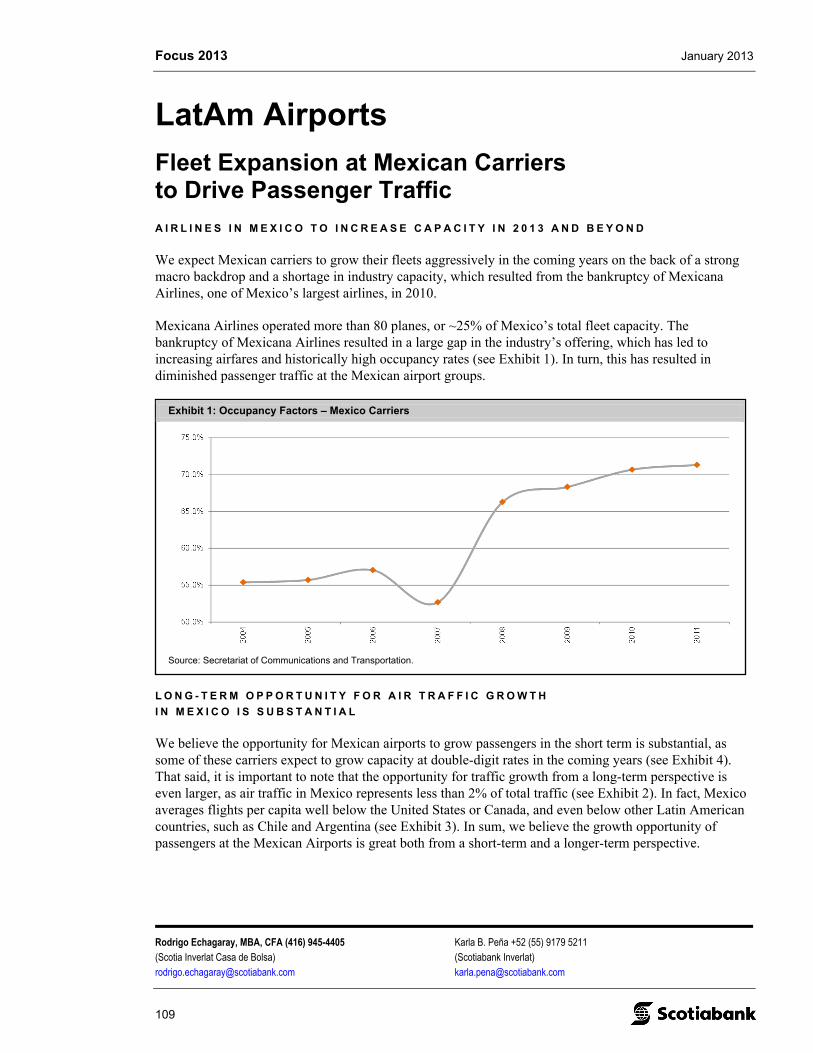
Focus 2013 January 2013
Rodrigo Echagaray, MBA, CFA (416) 945-4405 Karla B. Peña +52 (55) 9179 5211 (Scotia Inverlat Casa de Bolsa) (Scotiabank Inverlat) [email protected] [email protected]
109
Exhibit 1: Occupancy Factors – Mexico Carriers
Source: Secretariat of Communications and Transportation.
LatAm Airports
Fleet Expansion at Mexican Carriers to Drive Passenger Traffic
A I R L I N E S I N M E X I C O T O I N C R E A S E C A P A C I T Y I N 2 0 1 3 A N D B E Y O N D
We expect Mexican carriers to grow their fleets aggressively in the coming years on the back of a strong macro backdrop and a shortage in industry capacity, which resulted from the bankruptcy of Mexicana Airlines, one of Mexico’s largest airlines, in 2010.
Mexicana Airlines operated more than 80 planes, or ~25% of Mexico’s total fleet capacity. The bankruptcy of Mexicana Airlines resulted in a large gap in the industry’s offering, which has led to increasing airfares and historically high occupancy rates (see Exhibit 1). In turn, this has resulted in diminished passenger traffic at the Mexican airport groups.
L O N G - T E R M O P P O R T U N I T Y F O R A I R T R A F F I C G R O W T H
I N M E X I C O I S S U B S T A N T I A L
We believe the opportunity for Mexican airports to grow passengers in the short term is substantial, as some of these carriers expect to grow capacity at double-digit rates in the coming years (see Exhibit 4). That said, it is important to note that the opportunity for traffic growth from a long-term perspective is even larger, as air traffic in Mexico represents less than 2% of total traffic (see Exhibit 2). In fact, Mexico averages flights per capita well below the United States or Canada, and even below other Latin American countries, such as Chile and Argentina (see Exhibit 3). In sum, we believe the growth opportunity of passengers at the Mexican Airports is great both from a short-term and a longer-term perspective.
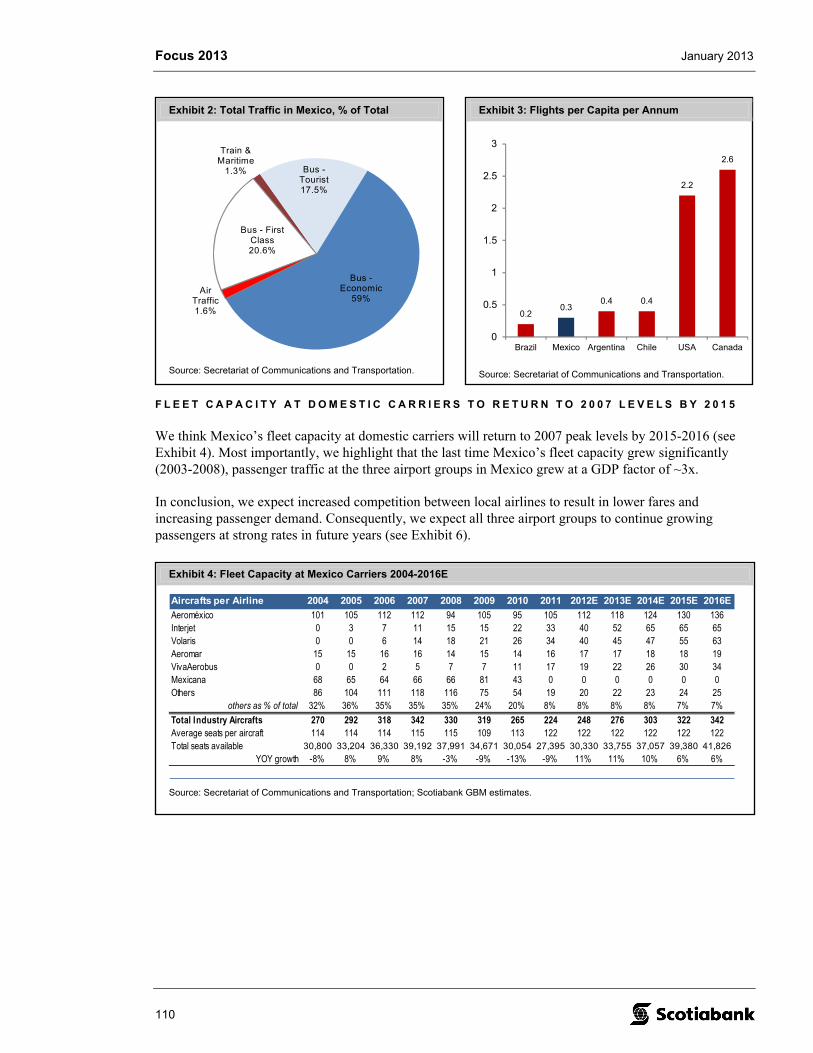
Focus 2013 January 2013
110
Exhibit 3: Flights per Capita per Annum
0.20.3
0.4 0.4
2.2
2.6
0
0.5
1
1.5
2
2.5
3
Brazil Mexico Argentina Chile USA Canada
Source: Secretariat of Communications and Transportation.
Exhibit 2: Total Traffic in Mexico, % of Total
Train & Maritime
1.3% Bus -Tourist17.5%
Bus -Economic
59%Air
Traffic1.6%
Bus - First Class20.6%
Source: Secretariat of Communications and Transportation.
Exhibit 4: Fleet Capacity at Mexico Carriers 2004-2016E
Aircrafts per Airline 2004 2005 2006 2007 2008 2009 2010 2011 2012E 2013E 2014E 2015E 2016E
Aeroméxico 101 105 112 112 94 105 95 105 112 118 124 130 136Interjet 0 3 7 11 15 15 22 33 40 52 65 65 65Volaris 0 0 6 14 18 21 26 34 40 45 47 55 63Aeromar 15 15 16 16 14 15 14 16 17 17 18 18 19VivaAerobus 0 0 2 5 7 7 11 17 19 22 26 30 34Mexicana 68 65 64 66 66 81 43 0 0 0 0 0 0Others 86 104 111 118 116 75 54 19 20 22 23 24 25
others as % of total 32% 36% 35% 35% 35% 24% 20% 8% 8% 8% 8% 7% 7%Total Industry Aircrafts 270 292 318 342 330 319 265 224 248 276 303 322 342Average seats per aircraft 114 114 114 115 115 109 113 122 122 122 122 122 122Total seats available 30,800 33,204 36,330 39,192 37,991 34,671 30,054 27,395 30,330 33,755 37,057 39,380 41,826
YOY growth -8% 8% 9% 8% -3% -9% -13% -9% 11% 11% 10% 6% 6%
Source: Secretariat of Communications and Transportation; Scotiabank GBM estimates.
F L E E T C A P A C I T Y A T D O M E S T I C C A R R I E R S T O R E T U R N T O 2 0 0 7 L E V E L S B Y 2 0 1 5
We think Mexico’s fleet capacity at domestic carriers will return to 2007 peak levels by 2015-2016 (see Exhibit 4). Most importantly, we highlight that the last time Mexico’s fleet capacity grew significantly (2003-2008), passenger traffic at the three airport groups in Mexico grew at a GDP factor of ~3x.
In conclusion, we expect increased competition between local airlines to result in lower fares and increasing passenger demand. Consequently, we expect all three airport groups to continue growing passengers at strong rates in future years (see Exhibit 6).
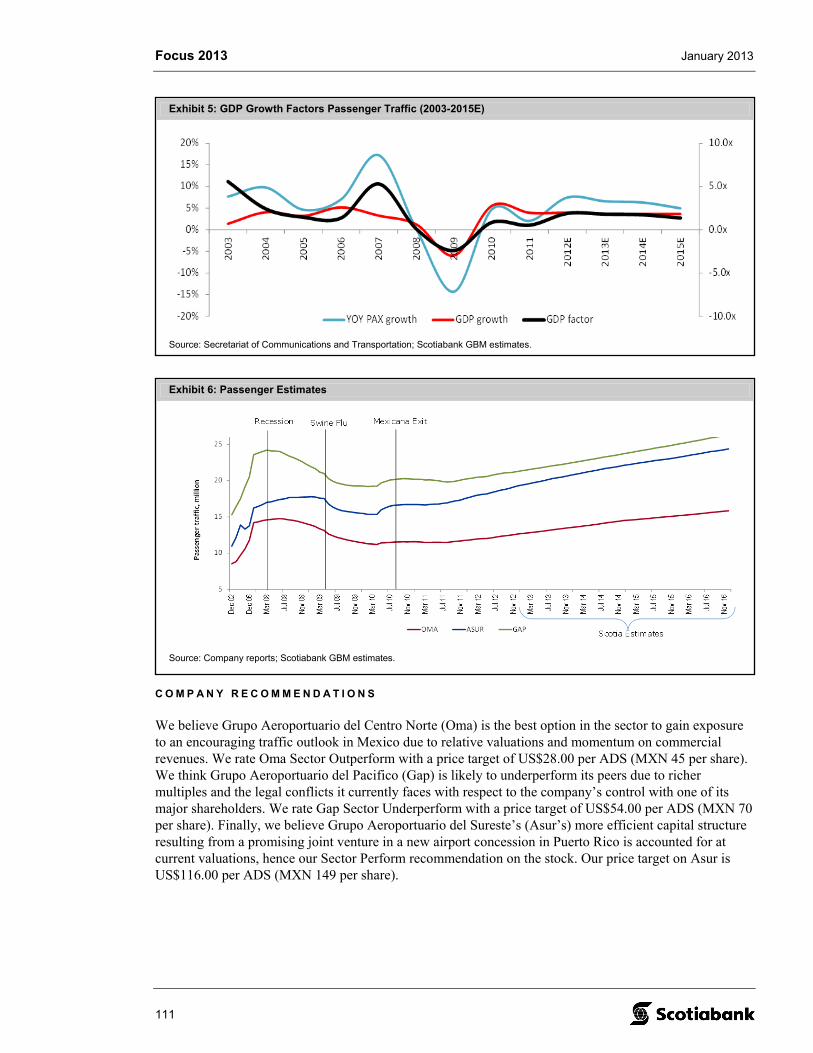
Focus 2013 January 2013
111
Exhibit 6: Passenger Estimates
Source: Company reports; Scotiabank GBM estimates.
Exhibit 5: GDP Growth Factors Passenger Traffic (2003-2015E)
Source: Secretariat of Communications and Transportation; Scotiabank GBM estimates.
C O M P A N Y R E C O M M E N D A T I O N S
We believe Grupo Aeroportuario del Centro Norte (Oma) is the best option in the sector to gain exposure to an encouraging traffic outlook in Mexico due to relative valuations and momentum on commercial revenues. We rate Oma Sector Outperform with a price target of US$28.00 per ADS (MXN 45 per share). We think Grupo Aeroportuario del Pacifico (Gap) is likely to underperform its peers due to richer multiples and the legal conflicts it currently faces with respect to the company’s control with one of its major shareholders. We rate Gap Sector Underperform with a price target of US$54.00 per ADS (MXN 70 per share). Finally, we believe Grupo Aeroportuario del Sureste’s (Asur’s) more efficient capital structure resulting from a promising joint venture in a new airport concession in Puerto Rico is accounted for at current valuations, hence our Sector Perform recommendation on the stock. Our price target on Asur is US$116.00 per ADS (MXN 149 per share).
Focus 2013 January 2013
112
O U T P E R F O R M E R S
Grupo Aeroportuario Centro Norte (OMAB-Q: US$21.41; Sector Outperform)
Our Sector Outperform rating on Oma is largely a relative valuation call as it trades at a significant discount to both Asur and Gap. We acknowledge a discount is warranted given Oma’s lower profitability, but we think that discount will continue to shrink as Oma’s operating margins continue to improve.
Our valuation call is further supported by momentum on the commercial revenue front. In fact, Oma has been able to grow its commercial revenues per PAX at the fastest rate in the sector on the back of its hotel operations in the Mexico City airport. We think this may continue due to initiatives such as the company’s industrial park facility at the Monterrey airport.
Also, we believe that VivaAerobus airlines has high growth potential and Oma is the airport group to benefit the most, as VivaAerobus airlines is based out of Oma’s Monterrey airport.
Grupo Aeroportuario del Sureste (ASR-N: US$112.11; Sector Perform)
The inclusion of Asur’s new Luis Muñoz Marin airport concession in Puerto Rico should take place in Q1/13. We think this is a positive development for the company as it reduces its dependency on the Cancun airport and improves the capital structure of the company.
That said, we are a bit cautious as we think the turnaround of those operations may be somewhat slow and capex intensive. Bottom line, we think current valuations accurately reflect the risk/reward opportunity in Puerto Rico but leave little upside, hence our Sector Perform recommendation.
We believe Asur is well positioned to outperform peers in terms of PAX growth in 2013 due to Cancun, especially as domestic traffic continues to gain weight and outperform international PAX growth.
U N D E R P E R F O R M E R
Grupo Aeroportuario del Pacifico (PAC-N: US$56.30; Sector Underperform)
We rate Gap Sector Underperform due to its rich multiples and its legal troubles with Grupo Mexico, which currently owns ~30% of the company. In sum, Grupo Mexico wants control of the company but Gap’s bylaws prohibit ownership in excess of 10% before losing voting rights. Grupo Mexico has taken matters to court, but for now it has not been able to carry on with a full takeover.
We think this may result in Grupo Mexico exiting its investment in the company, which could lead to a material overhang on the shares. Furthermore, we believe that at ~12x 2013E EV/EBITDA, current prices already partially reflect a potential takeover premium.
Finally, we note that the current legal issues among majority shareholders are already having a negative impact on Gap’s minorities. A total of MXN 740 million in dividend payments are currently retained at Mexico’s depository institution, Indeval, following a judge’s order, which in turn resulted from Grupo Mexico’s legal proceeding against Gap’s most recent shareholder assembly, during which the dividends were declared.
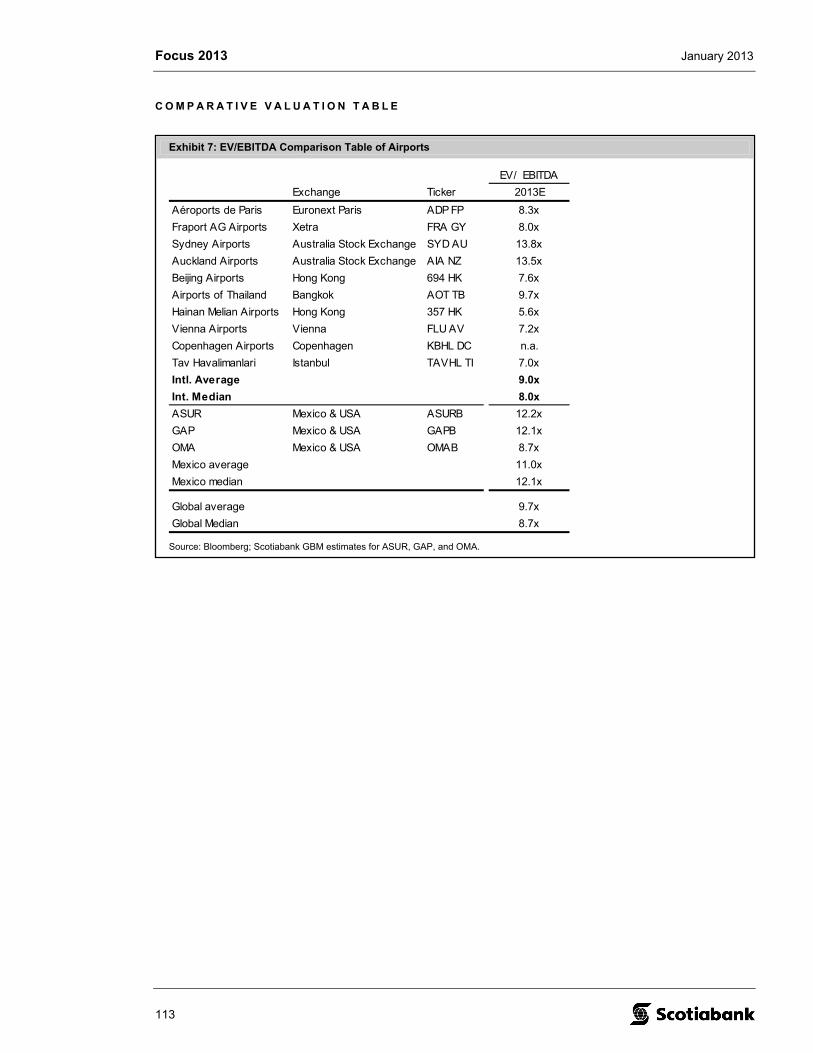
Focus 2013 January 2013
113
Exhibit 7: EV/EBITDA Comparison Table of Airports
Exchange Ticker 2013E
Aéroports de Paris Euronext Paris ADP FP 8.3x
Fraport AG Airports Xetra FRA GY 8.0x
Sydney Airports Australia Stock Exchange SYD AU 13.8x
Auckland Airports Australia Stock Exchange AIA NZ 13.5x
Beijing Airports Hong Kong 694 HK 7.6x
Airports of Thailand Bangkok AOT TB 9.7x
Hainan Melian Airports Hong Kong 357 HK 5.6x
Vienna Airports Vienna FLU AV 7.2x
Copenhagen Airports Copenhagen KBHL DC n.a.
Tav Havalimanlari Istanbul TAVHL TI 7.0x
Intl. Average 9.0x
Int. Median 8.0x
ASUR Mexico & USA ASURB 12.2x
GAP Mexico & USA GAPB 12.1x
OMA Mexico & USA OMAB 8.7x
Mexico average 11.0x
Mexico median 12.1x
Global average 9.7x
Global Median 8.7x
EV/ EBITDA
Source: Bloomberg; Scotiabank GBM estimates for ASUR, GAP, and OMA.
C O M P A R A T I V E V A L U A T I O N T A B L E

Focus 2013 January 2013
114
T H I S P A G E L E F T I N T E N T I O N A L L Y B L A N K .
Focus 2013 January 2013
Marcos Durán y Casahonda, MBA, CFA +52 (55) 9179 5209 Paul Figueroa Mantero, MSc, MBA +51 (1) 211 6040 x16474 (Scotiabank Inverlat) (Scotia Sociedad Agente de Bolsa SA) [email protected] [email protected]
115
LatAm Construction & Infrastructure
Key Drivers: New Administration in Mexico and Private and Public Investment in Peru
M E X I C A N C O N S T R U C T I O N S E C T O R S H O U L D B E N E F I T
F R O M I N C R E A S E D I N V E S T M E N T S
The 2013 proposed fiscal budget showed infrastructure investment will remain a priority for the new Mexican administration. The Ministry of Finance has proposed allocating funds amounting to 4.3% of GDP for infrastructure investment in 2013, exceeding the investment budgeted in any year of the Felipe Calderón administration and 6.6% higher than the amount disbursed the prior year. In our view, the MXN 720 billion investment budget is daring. Mr. Calderón’s term was marked by an increased focus on infrastructure investment. Nevertheless, during his first year in office, Mr. Calderón committed 77% more to investment than what President Enrique Peña Nieto is proposing.
The national infrastructure agenda entails US$416 billion. Of the US$416 billion in projects that are likely to form the backbone of the Peña Nieto administration’s infrastructure agenda, the civil construction unit of Empresas ICA (ICA) has identified US$135 billion that may surface between 2013 and 2017 and on which it may bid. These projects are centred on rail, highway, and water infrastructure.
P E R U ’ S C O N S T R U C T I O N S E C T O R S H O U L D B E N E F I T F R O M H I G H
P U B L I C A N D P R I V A T E I N V E S T M E N T
The Peruvian economy is expected to continue posting one of the highest growth rates in LatAm in 2013. In that sense, we expect 6.0% growth for the year, mainly driven by the dynamism of Peru’s domestic demand. Private investment could grow approximately 9% on higher foreign investment, mainly allocated to mining projects, and higher domestic investment, which will be more focused on the construction sector. We also expect public investment to grow about 10%, in accordance to the government’s budget for 2013. In our view, social conflicts, political risks, and government inefficiencies will continue to slow higher investment in Peru in 2013.
We expect more moderate growth for the construction sector in Peru in 2013; however, it should remain one of the highest-growing sectors (8.3% year over year [YOY]). The country’s big housing gap (approximately 1.86 million houses), a stronger and more bankable middle class, the low penetration of mortgage credits, and an increasing effort by the government to reinforce housing funds such as MIVIVIENDA should continue to boost the dynamism of the real estate market in Peru. We expect interest rates to rise given the recent decision by Peru’s Banking Superintendent to eliminate some commissions charged by banks as of January 1, 2013. However, in our view, the effect will not be material as we expect a mild increase from historically low levels.
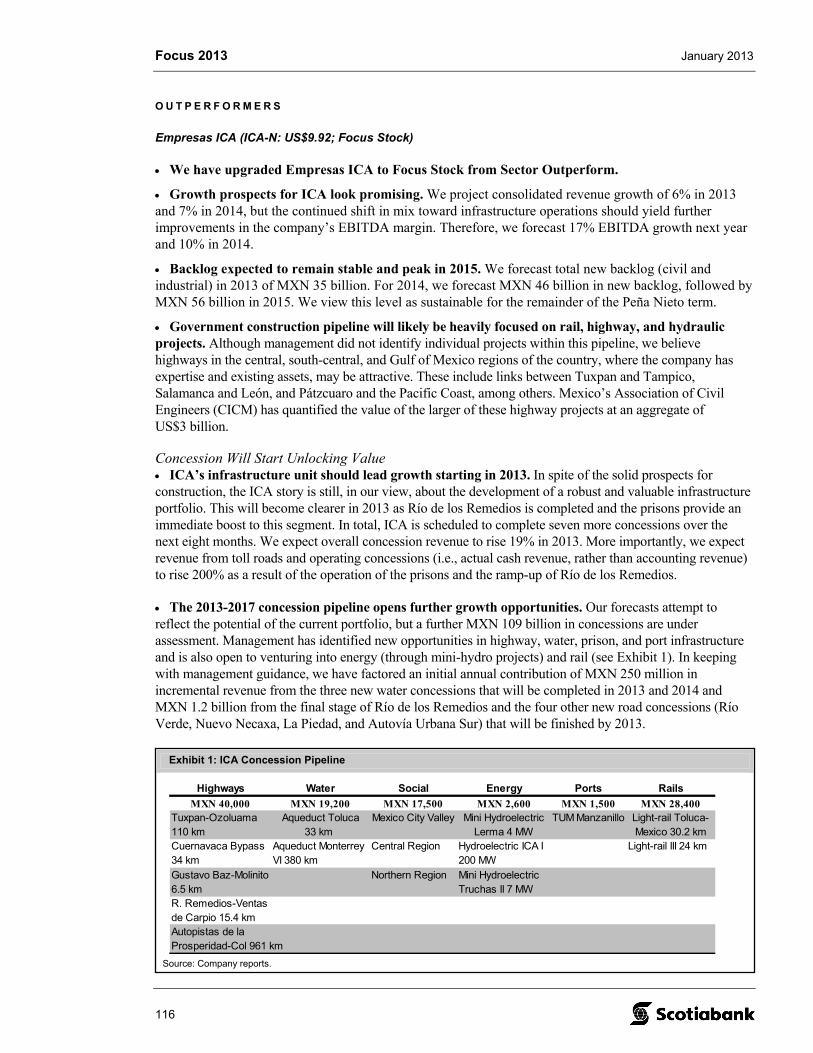
Focus 2013 January 2013
116
Exhibit 1: ICA Concession Pipeline
Highways Water Social Energy Ports Rails
MXN 40,000 MXN 19,200 MXN 17,500 MXN 2,600 MXN 1,500 MXN 28,400Tuxpan-Ozoluama Aqueduct Toluca Mexico City Valley Mini Hydroelectric TUM Manzanillo Light-rail Toluca-110 km 33 km Lerma 4 MW Mexico 30.2 kmCuernavaca Bypass Aqueduct Monterrey Central Region Hydroelectric ICA I Light-rail III 24 km34 km VI 380 km 200 MW
Gustavo Baz-Molinito Northern Region Mini Hydroelectric6.5 km Truchas II 7 MWR. Remedios-Ventasde Carpio 15.4 kmAutopistas de laProsperidad-Col 961 km
Source: Company reports.
O U T P E R F O R M E R S
Empresas ICA (ICA-N: US$9.92; Focus Stock)
We have upgraded Empresas ICA to Focus Stock from Sector Outperform.
Growth prospects for ICA look promising. We project consolidated revenue growth of 6% in 2013 and 7% in 2014, but the continued shift in mix toward infrastructure operations should yield further improvements in the company’s EBITDA margin. Therefore, we forecast 17% EBITDA growth next year and 10% in 2014.
Backlog expected to remain stable and peak in 2015. We forecast total new backlog (civil and industrial) in 2013 of MXN 35 billion. For 2014, we forecast MXN 46 billion in new backlog, followed by MXN 56 billion in 2015. We view this level as sustainable for the remainder of the Peña Nieto term.
Government construction pipeline will likely be heavily focused on rail, highway, and hydraulic projects. Although management did not identify individual projects within this pipeline, we believe highways in the central, south-central, and Gulf of Mexico regions of the country, where the company has expertise and existing assets, may be attractive. These include links between Tuxpan and Tampico, Salamanca and León, and Pátzcuaro and the Pacific Coast, among others. Mexico’s Association of Civil Engineers (CICM) has quantified the value of the larger of these highway projects at an aggregate of US$3 billion.
Concession Will Start Unlocking Value ICA’s infrastructure unit should lead growth starting in 2013. In spite of the solid prospects for construction, the ICA story is still, in our view, about the development of a robust and valuable infrastructure portfolio. This will become clearer in 2013 as Río de los Remedios is completed and the prisons provide an immediate boost to this segment. In total, ICA is scheduled to complete seven more concessions over the next eight months. We expect overall concession revenue to rise 19% in 2013. More importantly, we expect revenue from toll roads and operating concessions (i.e., actual cash revenue, rather than accounting revenue) to rise 200% as a result of the operation of the prisons and the ramp-up of Río de los Remedios.
The 2013-2017 concession pipeline opens further growth opportunities. Our forecasts attempt to reflect the potential of the current portfolio, but a further MXN 109 billion in concessions are under assessment. Management has identified new opportunities in highway, water, prison, and port infrastructure and is also open to venturing into energy (through mini-hydro projects) and rail (see Exhibit 1). In keeping with management guidance, we have factored an initial annual contribution of MXN 250 million in incremental revenue from the three new water concessions that will be completed in 2013 and 2014 and MXN 1.2 billion from the final stage of Río de los Remedios and the four other new road concessions (Río Verde, Nuevo Necaxa, La Piedad, and Autovía Urbana Sur) that will be finished by 2013.
Focus 2013 January 2013
117
The prison business should augment revenue. Our estimates include MXN 2.14 billion in revenue in 2013 from the two prisons. A significant advantage of these concessions is their almost immediate seasoning. Unlike highways, which can take seven to 10 years to reach full maturity, these assets will be populated immediately. Therefore, we are forecasting revenue starting in Q4/12 and reaching MXN 535 million per quarter by Q1/13. Our forecasts for the prisons incorporate management’s guidance of a 45% to 48% EBITDA margin.
The airport unit is thriving, too. Our ICA model incorporates forecasts for Grupo Aeroportuario Centro Norte (OMA), covered by Scotiabank GBM analyst Rodrigo Echagaray. The forecasts for 2013 and 2014 are built assuming 5% passenger traffic growth, a view that is predicated on the Mexican airline’s fleet expansion plans. Passenger growth should be bolstered by higher non-aeronautical revenue per passenger as a result of the numerous commercial initiatives undertaken by OMA. This, in turn, should bolster profitability. All told, we have incorporated MXN 1.6 billion in 2013E EBITDA from OMA (+10.5% YOY) and MXN 1.769 billion in 2014E EBITDA (+10.1%).
Least Profitable Business Is Now a JV Mexican low-income housing operations merged with Servicios Corporativos Javer (Javer). Housing represents about 7% of consolidated revenue. Early in December 2012, ICA and Javer, a homebuilder based in northern Mexico, agreed to merge their housing assets. We view the deal as positive as it does not involve any exchange of cash and is expected to bolster the profitability of the combined entity through improved economies of scale. ICA will contribute 20 affordable housing developments (of the 27 it operates) and receive 23% of the new merged entity in exchange.
Company Will Focus on Returns Managing focus on delivering returns. At its last investor presentation in November 2012, ICA’s Chief Financial Officer emphasized the importance of improving profitability in terms of returns. ICA estimates that in 2013 it will pass the 10% ROE level. Two takeaways from the management presentation related to the construction business: (1) ICA appears set to become more assertive in proactively proposing projects to the government to capitalize on the new law governing public-private partnerships and (2) a project that had been mentioned in management’s initial meetings with President Peña Nieto’s transition team is a new, alternative Mexico City airport. According to the CICM, this project would entail investment of US$3.2 billion.
Debt Is Not a Concern Debt is set to decrease. ICA will continue to be a highly leveraged company, even after the payment for the turbines delivered to La Yesca, but in a manner that is consistent with the current stage of its concession build; that is, with concession-specific project financing with no recourse to the holding company and maturity profiles and interest and amortizations that are tailored to each asset. Management has guided toward year-end 2012 debt levels similar to those of the end of 2011. In terms of leverage, we expect the consolidated net debt to EBITDA ratio to end 2013 at 5.6x.
Reforms Present Opportunities to ICA and Its Clients A reform in energy bodes well for ICA. The prospect of a deeper reform of the energy sector bodes well for ICA for the same reasons that it bodes well for Alfa and for Mexichem. Additional investments in the sector would likely create new opportunities for ICA-Fluor. Work done for Braskem and IDESA’s Etileno XXI project is indicative of the contracts that deeper energy reform could generate for the company. After six years of working almost exclusively for Petróleos Mexicanos (PEMEX), the potential private-sector work would provide an additional boost to backlog and revenue. We expect PEMEX to add MXN 6 billion in backlog by 2014.
Focus 2013 January 2013
118
Valuation. On November 9, 2012, we set a new 12-month target price for ICA’s ADS of US$12.50. Our sum-of-the-parts target is consistent with an 8.0x EV/EBITDA multiple. Our main valuation assumptions are year-end 2013 EV/EBITDA (NTM) target multiples of 5x for the construction business and 10.5x for the concession business, which result in estimated equity values of MXN 11.7 billion (US$880 million) for ICA’s civil construction business and MXN 9.06 billion (US$690 million) for its concession business.
Main risks. We believe the market has in the past perceived ICA as overleveraged. Even though the actual level of debt is more consistent with that of an infrastructure operator in the construction phase or the early stages of operations, investors may feel uncomfortable should ICA undertake the financing of a large-scale project such as La Yesca. Slower traffic than expected at its highway concession could undermine the company’s positive prospects in the near term.
Graña y Montero SAA (GRAMONC1-LM: PEN 9.65; Sector Outperform)
Graña y Montero (Graña) should continue to be one of the main beneficiaries of higher investment in Peru. The company should be in a more favourable position than its competitors given its position as market leader in almost all the sectors in which it participates. We estimate more than US$60 billion of investment across the country in 2013, which will be allocated to power-generation, mining, transportation infrastructure, housing, and hydrocarbon projects.
High growth should continue in 2013. We estimate Graña’s consolidated revenue will grow 20% YOY in 2012 and 18% in 2013. We forecast higher margins on the back of higher cash flows generated by the electric train and the start of operations of La Chira (a sewage treatment plant in Lima). Therefore, we forecast the EBITDA margin to increase to 15% in 2013 from 13% in 2012.
Backlog should maintain its dynamism. We forecast that total backlog in 2013 will not be lower than US$5.5 billion. Backlog has grown more than 40% each year since 2009. Current backlog is well diversified into different sectors; however, we expect it to increase its allocation to mining-related projects in the following years given additional mining expertise since the acquisition of Vial y Vives.
Adjusted capex estimates upward. We increased capex estimates for the next five years related to upcoming infrastructure projects and on the back of the acquisition of electric trains. In that sense, we estimate investment expenditures of US$293 million for 2013.
Still conservative leverage position. We expect the debt coverage ratio to increase in our baseline scenario. For year-end 2012, we estimate the EBITDA to interest expense ratio will reach 17.7x, down from the 66.3x reported on 2011. In the same manner, the company’s coverage ratio is expected to reach 31.5x by the end of 2013. Debt is not a main concern for the company yet; nevertheless, a new debt issuance scenario (likely through bond issuance) could show up next year as the company taps into historically low interest rates and favourable financing conditions to finance its project pipeline, which has been enhanced by a constantly increasing backlog.
Valuation. On November 15, 2012, we raised our 12-month target price for Graña’s common shares to PEN 10.30 on the outlook of higher growth and a more consolidated position in the Construction and Engineering Division given the recent acquisition of Vial y Vives. Our target price is equivalent to 7.0x EV/EBITDA (2013E) and a P/E multiple of 11.5x (2013E). As mentioned, main risks to our target price come from potential delays on investment activity associated with political and bureaucratic issues, which could result in lower activity and constrained margins as well as affect backlog dynamism.

Focus 2013 January 2013
119
U N D E R P E R F O R M E R
Alfa (ALFA A-MX: MXN 27.52; Sector Underperform)
The Mexican conglomerate’s stock price rose more than 80% in 2012, outperforming the IPC Index. Alfa’s main subsidiaries posted strong results last year, driven by organic growth and acquisitions. Alpek (petrochemicals and plastics) will likely have a challenging year as pricing is being pressured by demand slowdown and margins are contracting as a result of the increases in feedstock. Still, we anticipate modest growth of 4% for Alpek in 2013. Nemak (auto parts) should sustain growth in 2013 as the auto industry enjoys good momentum.
A PEMEX reform will offer opportunities, but it will not likely materialize in the near term. In our opinion, Alfa’s stock recorded strong performance in 2012 partly due to optimism about reform in the energy sector, such as opening the state-run oil company, PEMEX, to investment from the private sector. Under this scenario, Alfa (and Alpek) would seek to win contracts that were previously given exclusively to PEMEX and its subsidiaries. However, the new government has expressed that it will seek to implement the energy reforms only after reforms in other sectors have been achieved (e.g., labour, education, fiscal, etc.); therefore, energy reform will likely not materialize in the near term.
Valuation looks rich. From a valuation standpoint, Alfa’s stock appears to already incorporate the company’s growth prospects. The stock is currently trading near our 12-month target price. Our sum-of-the-parts valuation assumes sector-topping EV/EBITDA multiples for Alpek (9x) and Nemak (5.5x). Alpek’s competitor Indorama is currently trading at 8.8x EV/EBITDA (2013E), but global chemical industry competitors are valued more modestly. DuPont and Honeywell Inc. are the only global competitors valued above 7x. In the auto-parts sector, only Johnson Controls Inc. and BorgWarner Inc. trade above 5x, with all other competitors in our sample trading at less than 4x EV/EBITDA (2013E). In the case of Sigma Alimentos Inc., our 8.5x EV/EBITDA target multiple is below that of Grupo Bimbo (10x), but does exceed all U.S. food companies other than General Mills. Finally, we incorporate US$239 million in equity to Alfa from its 8.7% stake in the Eagle Ford Shale venture with Pioneer Natural Resources Company and Reliance Industries Limited. Our valuation is based on a 10% conglomerate discount (see Exhibit 3).
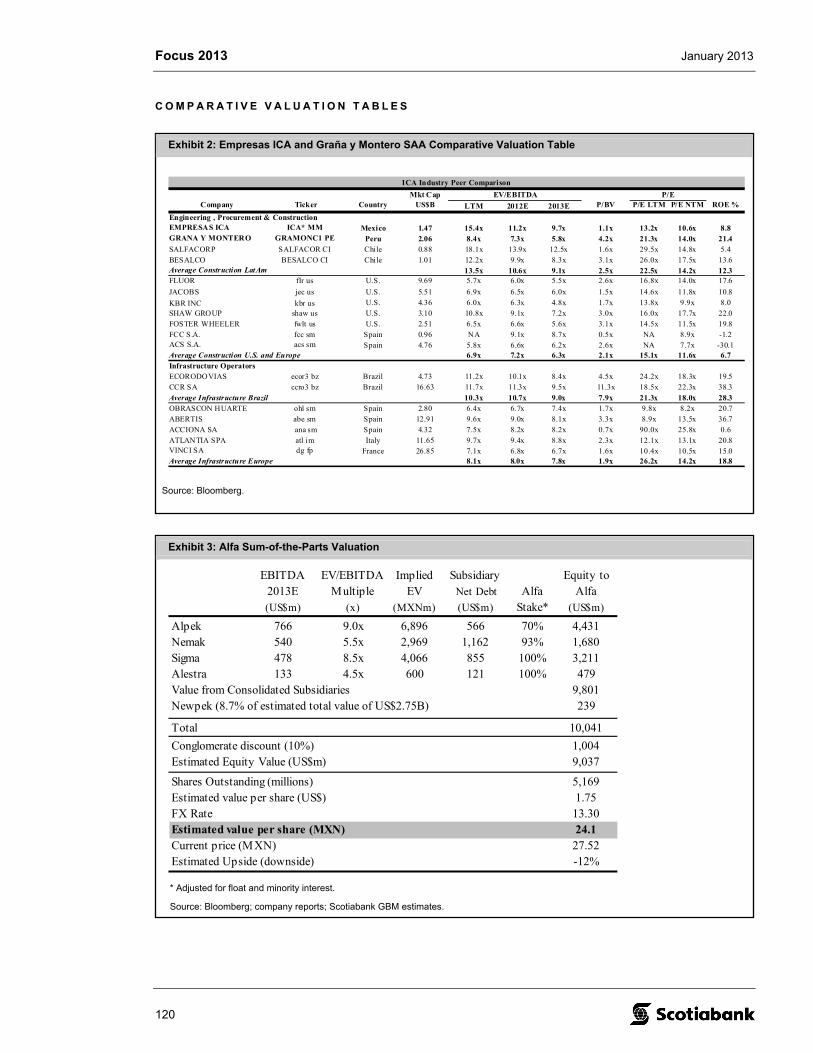
Focus 2013 January 2013
120
Exhibit 2: Empresas ICA and Graña y Montero SAA Comparative Valuation Table
ICA Industry Peer Comparison
Mkt Cap Company Ticker Country US$B LTM 2012E 2013E P/BV P/E LTM P/E NTM ROE %
Engineering , Procurement & ConstructionEMPRESAS ICA ICA* MM Mexico 1.47 15.4x 11.2x 9.7x 1.1x 13.2x 10.6x 8.8GRANA Y MONTERO GRAMONC1 PE Peru 2.06 8.4x 7.3x 5.8x 4.2x 21.3x 14.0x 21.4SALFACORP SALFACOR CI Chile 0.88 18.1x 13.9x 12.5x 1.6x 29.5x 14.8x 5.4BESALCO BESALCO CI Chile 1.01 12.2x 9.9x 8.3x 3.1x 26.0x 17.5x 13.6Average Construction LatAm 13.5x 10.6x 9.1x 2.5x 22.5x 14.2x 12.3FLUOR flr us U.S. 9.69 5.7x 6.0x 5.5x 2.6x 16.8x 14.0x 17.6
JACOBS jec us U.S. 5.51 6.9x 6.5x 6.0x 1.5x 14.6x 11.8x 10.8
KBR INC kbr us U.S. 4.36 6.0x 6.3x 4.8x 1.7x 13.8x 9.9x 8.0SHAW GROUP shaw us U.S. 3.10 10.8x 9.1x 7.2x 3.0x 16.0x 17.7x 22.0FOSTER WHEELER fwlt us U.S. 2.51 6.5x 6.6x 5.6x 3.1x 14.5x 11.5x 19.8FCC S.A. fcc sm Spain 0.96 NA 9.1x 8.7x 0.5x NA 8.9x -1.2ACS S.A. acs sm Spain 4.76 5.8x 6.6x 6.2x 2.6x NA 7.7x -30.1Average Construction U.S. and Europe 6.9x 7.2x 6.3x 2.1x 15.1x 11.6x 6.7Infrastructure OperatorsECORODOVIAS ecor3 bz Brazil 4.73 11.2x 10.1x 8.4x 4.5x 24.2x 18.3x 19.5CCR SA ccro3 bz Brazil 16.63 11.7x 11.3x 9.5x 11.3x 18.5x 22.3x 38.3Average Infrastructure Brazil 10.3x 10.7x 9.0x 7.9x 21.3x 18.0x 28.3OBRASCON HUARTE ohl sm Spain 2.80 6.4x 6.7x 7.4x 1.7x 9.8x 8.2x 20.7ABERTIS abe sm Spain 12.91 9.6x 9.0x 8.1x 3.3x 8.9x 13.5x 36.7ACCIONA SA ana sm Spain 4.32 7.5x 8.2x 8.2x 0.7x 90.0x 25.8x 0.6ATLANTIA SPA atl im Italy 11.65 9.7x 9.4x 8.8x 2.3x 12.1x 13.1x 20.8VINCI SA dg fp France 26.85 7.1x 6.8x 6.7x 1.6x 10.4x 10.5x 15.0Average Infrastructure Europe 8.1x 8.0x 7.8x 1.9x 26.2x 14.2x 18.8
EV/EBITDA P/E
Source: Bloomberg.
Exhibit 3: Alfa Sum-of-the-Parts Valuation
EBITDA EV/EBITDA Implied Subsidiary Equity to2013E Multiple EV Net Debt Alfa Alfa(US$m) (x) (MXNm) (US$m) Stake* (US$m)
Alpek 766 9.0x 6,896 566 70% 4,431Nemak 540 5.5x 2,969 1,162 93% 1,680Sigma 478 8.5x 4,066 855 100% 3,211Alestra 133 4.5x 600 121 100% 479Value from Consolidated Subsidiaries 9,801Newpek (8.7% of estimated total value of US$2.75B) 239
Total 10,041
Conglomerate discount (10%) 1,004Estimated Equity Value (US$m) 9,037
Shares Outstanding (millions) 5,169Estimated value per share (US$) 1.75FX Rate 13.30Estimated value per share (MXN) 24.1Current price (MXN) 27.52Estimated Upside (downside) -12%
* Adjusted for float and minority interest.
Source: Bloomberg; company reports; Scotiabank GBM estimates.
C O M P A R A T I V E V A L U A T I O N T A B L E S
Focus 2013 January 2013
Paul Steep, MBA (416) 945-4310 Andy Ko, MBA, CFA (416) 863-7993 (Scotia Capital Inc. – Canada) (Scotia Capital Inc. – Canada) [email protected] [email protected]
121
Media
Advancing the Transition Toward Online Media
S O F T O U T L O O K O N A D D E M A N D
We remain cautious regarding the outlook for the Canadian media sector, maintaining our market weight recommendation, given an anticipated soft outlook for advertising spend in 2013. Our bias is toward stocks that have meaningful catalysts, exposure to our preferred media segments, and solid financial performance geared toward actively reinvesting in shareholder value initiatives.
Our expectation is that online media will continue to grow faster than all other media segments and become the single largest media category beyond 2013. Growth in consumer demand for online video and interaction through mobile devices is expected to fuel the expansion in online advertising. We remain constructive on the out-of-home and specialty TV segments, and anticipate longer-term pressures on pay TV and radio. Conventional television, newspaper publishers, magazines, and printing face a series of challenges as advertisers closely evaluate ad spending, while printed directories are expected to experience sustained print decay rates.
Specifically, drivers include the following:
• Macro outlook points to weak spending environment. Given a modest outlook for the Canadian economy (Scotiabank Economics forecasts 2013 nominal GDP growth of 3.3%), our view is that revenue growth in the Canadian advertising market will remain soft (0.7% in 2012 and 2.0% in 2013), supported by spending by national advertisers in key segments while local advertising is constrained.
• Valuations pricing in slowdown in ad demand. We believe that the share prices of stocks within our coverage universe reflect investors’ expectations of ongoing softness in advertising demand. Our view is that media stocks in Canada have priced in softer ad revenues and are still trading at a discount to fair value, due to negative investor sentiment toward traditional media companies. Reviewing the valuation levels of the Scotiabank GBM Canadian Media Index shows that the majority of firms are trading slightly above historical lows on an EV/EBITDA basis. We believe media stock prices currently reflect the potential for a longer-term cyclical bounce related to a potential recovery in advertising; however, investor concerns about changes in media consumption continue to be a secular challenge to multiple expansion.
• Firms remain focused on shareholder returns. We believe that many Canadian media industry operators are committed to actively pursuing initiatives targeted at increasing shareholder value. Our view remains that many of the media companies in our universe of coverage will continue to focus on returning value to shareholders through a combination of dividends, share repurchase programs, debt reduction, and selected acquisition and organic growth initiatives. As advertising demand remains challenging, we anticipate that the Canadian media industry will renew efforts to control costs to sustain improvements in free cash flow (FCF) generation experienced in the past year.
Focus 2013 January 2013
122
K E Y T H E M E S I N 2 0 1 3 A N D B E Y O N D
Canadian and global media markets continue to undergo a profound change as they respond to the combination of changing consumption habits, the influence of new technologies, and advertisers’ response to the new media environment. As a result of the influx of digital offerings, especially online, the Canadian media industry is facing increased competition and pricing pressure. We continue to track the progress of the industry against key trends that were first highlighted in our October 2008 report, Signal Trouble Is Temporary. We believe shifting demographics, technology advancements, and shareholder value opportunities remain enduring themes that impact the direction and development of media businesses across Canada. This year’s new theme of commerce-driven advertising represents an emerging trend that we believe is poised to impact the market. As media companies continue to adapt to a challenging environment that has accelerated the pace of change impacting their businesses, we anticipate that the four trends outlined below will continue to influence the development of the media industry.
1. Demographic changes impacting the Canadian media market. We believe that demographic shifts will continue to have a meaningful impact on the Canadian media industry and will help to determine the preferred distribution platforms for receiving content. While a number of key differences persist across various age cohorts, we are now witnessing a fundamental shift in media consumption and interaction patterns (e.g., increased adoption of web, mobile, and social media). We believe that advertisers will respond to this shift by accelerating the development of their own mobile and online platform offerings.
2. Technology redefining consumers’ relationship with media. Our view is that the adoption of new technology is dramatically enhancing consumers’ ability to access content anywhere, anytime, resulting in substantial impacts across the entire media landscape. We believe that the accelerated adoption of enabling technologies represents the single biggest trend affecting the media industry in Canada and beyond. Media companies continue to evolve their traditional business models in an effort to position themselves for the radically changing environment driven by increasing distribution and access to new technologies, particularly the Internet, social media, and mobile data. Our view is that a strong digital strategy is critical to ensuring that media companies connect with consumers and sustain their interest, especially as mobile devices gain importance.
3. Media options – shifting to commerce-driven advertising. We view the proliferation of online media as a disruption to other traditional media in Canada, creating the potential for a fundamental shift in the industry’s business models. We believe the confluence of changing demographics and new technology has resulted in a significant transformation of the way consumers behave and interact with the media. We believe that this should drive a gradual evolution of traditional media firms and advertisers toward extending their commerce-driven channels and getting closer to the point of sale. We believe a variety of applications for mobile and tablet platforms will help extend media companies’ ability to host the shift toward online commerce-based advertising.
4. Shareholder value opportunities. We believe that many Canadian media industry operators are committed to actively pursuing initiatives targeted at increasing shareholder value, through a combination of dividends, share repurchase programs, debt reduction, and selected acquisition and organic growth initiatives.
Based on their exposure to these key themes, we continue to favour the following media segments: online, specialty television, radio, and out-of-home. As consumers replace traditional media channels with new technologies and digital properties, we foresee a shift in the future role and value of the media. Our bias toward these media segments remains based upon the view that they are best positioned to meet these and other changes affecting the media industry.
Focus 2013 January 2013
123
F U R T H E R C O N S I D E R A T I O N S O N I N D U S T R Y C O N S O L I D A T I O N
In November 2012, Astral Media Inc. (Astral) and Bell amended their arrangement agreement and submitted a new proposal to the CRTC for approval. The updated application for transaction approval aims to address the CRTC’s concerns, including viewership share thresholds, potentially by divesting some Astral as well as Bell Media assets. Recall that in October 2012 the CRTC denied BCE Inc.’s (BCE’s) application to acquire Astral, concluding that the transaction was not in the interest of Canadians and Canada’s broadcasting system. In our view, the decision by the CRTC related to the new BCE/Astral proposal would set the direction for the potential further vertical integration. The commission reinforced in its decision that the onus is on applicants to “clearly demonstrate significant and unequivocal tangible and intangible benefits.”
V A L U A T I O N
Valuations Pricing In Slowdown in Ad Demand
We believe media stock prices currently reflect the potential for a longer-term cyclical bounce related to a potential recovery in advertising; however, investor concerns about changes in media consumption continue to be a secular challenge to multiple expansion. Over the past several years, Canadian media companies within our coverage universe have experienced meaningful multiple contraction, falling from pre-recession levels of ~10.3x EV/EBITDA to trough valuations of ~5.6x reached in March 2009. Valuations recovered in the fall of 2010 based on improved operating results from a stronger demand environment and expectations related to consolidation within the sector; however, they remain well below pre-recession levels. We believe that media stocks in Canada have priced in softer ad revenues and are still trading at a discount to fair value, due to negative investor sentiment toward traditional media companies.
O U T P E R F O R M E R
Corus Entertainment Inc. (Sector Outperform; One-Year Target $27.00)
We remain cautious on the media sector given the soft advertising outlook, with a preference for stocks that have strong balance sheets and the ability to generate strong sustained FCF. Corus Entertainment Inc. (Corus) meets these criteria, despite being impacted by a weaker ad market.
Specialty TV assets should benefit from new channels launched. In our view, Corus will continue to benefit from advertisers’ focus on more targeted audiences (e.g., women and kids demographics). ABC Spark is delivering to expectations as a solid addition to Corus’ kids and family vertical, leveraging the firm’s strategic co-viewing initiative, which continues to show signs of traction. We believe that OWN provides Corus with a boost by strengthening its position in delivering a key women’s demographic to advertisers. Corus is making progress in the development of this important brand as OWN continues to launch new programming.
M&A opportunity in F2013. Our view is that Corus is well positioned to benefit from potential M&A activity resulting from BCE’s proposed acquisition of Astral. The company indicated that it would actively consider the purchase of certain TV and radio assets. We believe that the purchase of Teletoon/Teletoon Retro represents an accretive transaction for Corus in consolidating its ownership of these channels.
TV Everywhere initiative to drive growth. We believe that the launch of the firm’s HBO GO offering is a key initiative in retaining Pay TV subscribers in an increasingly competitive market given the threat from OTT viewing options (e.g., Netflix). Shaw recently launched Shaw Go, its TV everywhere service. The first phase of Shaw Go is the Movie Central app, delivering the latest seasons of HBO Canada and Movie Central programming direct to Internet-enabled devices of Shaw and Shaw Direct customers who subscribe to Movie Central.
Focus 2013 January 2013
124
Licensing of kids’ content library. We believe that Corus is positioned to capitalize on the shift toward increased multi-screen viewing by consumers, particularly as it relates to kids’ content. Children’s content is among the most popular genres on existing OTT services. In our view, Corus is in a unique position among major Canadian broadcasters with its large library of owned content (>4,000 half-hour episodes) within its Nelvana business that is available to license to various OTT providers, as the firm seeks to monetize its current and back library.
Strong FCF supports shareholder value initiatives. In our view, Corus’s financial position will continue to improve (~1.7x leverage at the end of F2012), and as the firm continues to generate substantial FCF. We believe that Corus will continue to focus on delivering shareholder value through: (1) possible large M&A resulting from the BCE/Astral transaction; (2) internal growth initiatives; (3) tuck-under acquisitions; and (4) return of capital to shareholders (e.g., dividends, share repurchases, potential to repurchase the high-yield notes starting in February 2013).
U N D E R P E R F O R M E R
Postmedia Network Canada Corp. (Sector Underperform; One-Year Target $1.25)
In our view, Postmedia Network Canada Corp.’s (Postmedia’s) underlying operations reflect a soft advertising sales environment and the ongoing secular pressure facing the newspaper industry. We believe financial leverage leaves Postmedia more exposed to the impact of ongoing secular change in the newspaper market as the shift from print to online products accelerates.
Postmedia remains active on a variety of initiatives designed to adapt to a challenging advertising environment, including staff reductions, outsourcing of its call centre operations, and recently selling its head office in Toronto, with funds being deployed for debt reduction. Our expectation is that the initiatives put in place by Postmedia should result in improvements in the firm’s cost structure but be partially offset by declines in traditional print revenues.
Initiatives to improve near-term financial flexibility. Postmedia continues to pursue a variety of options to increase the efficiency of its operations and adapt to a challenging advertising environment. Our view is that the transaction to sell the firm’s Toronto head office (for ~$24 million) and move its staff to smaller facilities is positive in helping to reduce financial leverage. In addition, the firm has refinanced its existing term loan facility with the issuance of $250 million in 8.25% senior secured notes due August 16, 2017, providing increased financial flexibility and eliminating financial maintenance covenants.
“Digital First” strategy remains a challenge. We believe the firm is actively working to implement its “Digital First” strategy in an effort to increase revenues from its digital products through new product development, product enhancements, and targeted acquisitions. Our view is that the firm is taking positive action to transition its business model online, but that it remains at an early stage of development. The firm announced that in 2013 it would roll out paywalls to all of its newspapers in an effort to improve monetization of its content. Postmedia has been focused on working to increase the number of subscribers taking its all-access bundle (e.g., print and digital) over its digital-only bundle.
Ongoing secular pressure. The profound secular change facing newspaper publishers – as both consumers’ and advertisers’ focus increasingly shifts toward digital platforms and away from print – represents a major threat to firms such as Postmedia. Postmedia is vulnerable to an acceleration in the rate of decline for print revenues (e.g., advertising and subscriptions) as it remains significantly exposed to printed newspapers, which represent approximately 90% of all revenues.
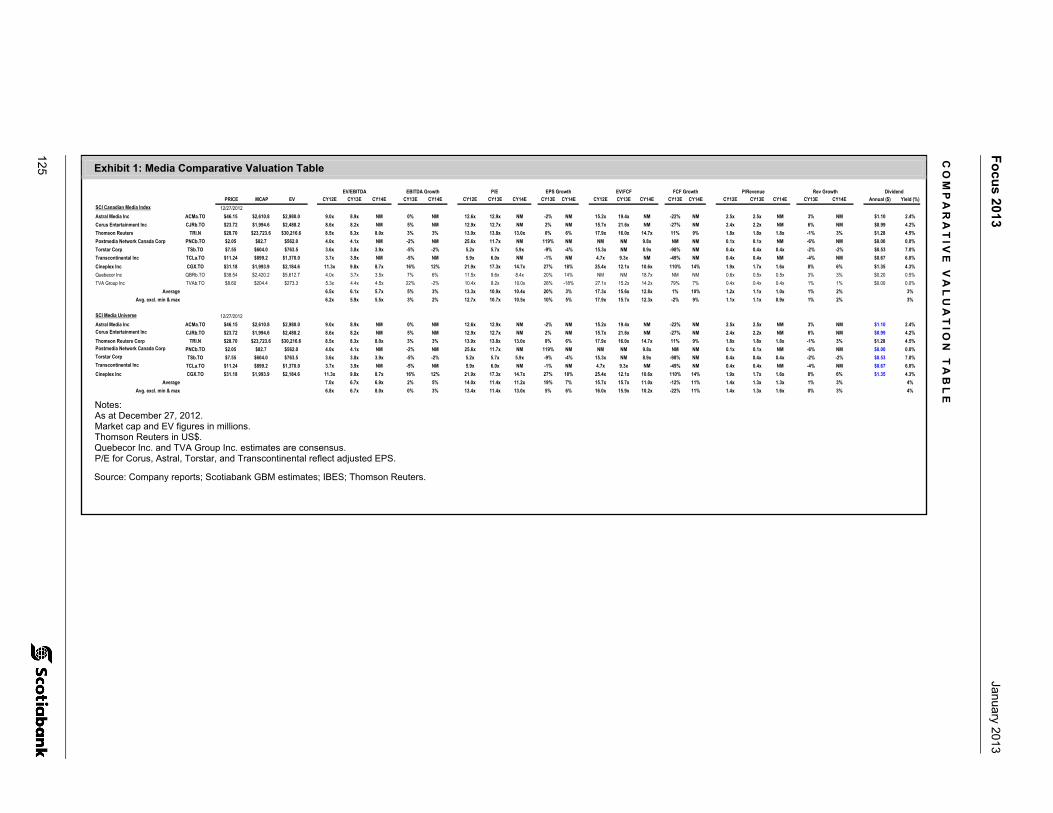
125
Fo
cus 2013
January 2013
Exhibit 1: Media Comparative Valuation Table
EV/EBITDA EBITDA Growth P/E EPS Growth EV/FCF FCF Growth P/Revenue Rev Growth DividendPRICE MCAP EV CY12E CY13E CY14E CY13E CY14E CY12E CY13E CY14E CY13E CY14E CY12E CY13E CY14E CY13E CY14E CY12E CY13E CY14E CY13E CY14E Annual ($) Yield (%)
SCI Canadian Media Index 12/27/2012Astral Media Inc ACMa.TO $46.15 $2,610.8 $2,980.0 9.0x 8.9x NM 0% NM 12.6x 12.9x NM -2% NM 15.2x 19.4x NM -22% NM 2.5x 2.5x NM 3% NM $1.10 2.4%Corus Entertainment Inc CJRb.TO $23.72 $1,994.6 $2,488.2 8.6x 8.2x NM 5% NM 12.9x 12.7x NM 2% NM 15.7x 21.6x NM -27% NM 2.4x 2.2x NM 6% NM $0.99 4.2%Thomson Reuters TRI.N $28.70 $23,723.6 $30,216.6 8.5x 8.3x 8.0x 3% 3% 13.9x 13.8x 13.0x 0% 6% 17.9x 16.0x 14.7x 11% 9% 1.8x 1.8x 1.8x -1% 3% $1.28 4.5%Postmedia Network Canada Corp PNCb.TO $2.05 $82.7 $562.0 4.0x 4.1x NM -2% NM 25.6x 11.7x NM 119% NM NM NM 9.8x NM NM 0.1x 0.1x NM -6% NM $0.00 0.0%Torstar Corp TSb.TO $7.55 $604.0 $763.5 3.6x 3.8x 3.9x -5% -2% 5.2x 5.7x 5.9x -9% -4% 15.3x NM 8.9x -98% NM 0.4x 0.4x 0.4x -2% -2% $0.53 7.0%Transcontinental Inc TCLa.TO $11.24 $899.2 $1,370.0 3.7x 3.9x NM -5% NM 5.9x 6.0x NM -1% NM 4.7x 9.3x NM -49% NM 0.4x 0.4x NM -4% NM $0.67 6.0%Cineplex Inc CGX.TO $31.18 $1,993.9 $2,184.6 11.3x 9.8x 8.7x 16% 12% 21.9x 17.3x 14.7x 27% 18% 25.4x 12.1x 10.6x 110% 14% 1.9x 1.7x 1.6x 8% 6% $1.35 4.3%Quebecor Inc QBRb.TO $38.54 $2,420.2 $5,612.7 4.0x 3.7x 3.5x 7% 6% 11.5x 9.6x 8.4x 20% 14% NM NM 18.7x NM NM 0.6x 0.5x 0.5x 3% 3% $0.20 0.5%TVA Group Inc TVAb.TO $8.60 $204.4 $273.3 5.3x 4.4x 4.5x 22% -2% 10.4x 8.2x 10.0x 28% -18% 27.1x 15.2x 14.2x 79% 7% 0.4x 0.4x 0.4x 1% 1% $0.00 0.0%
Average 6.5x 6.1x 5.7x 5% 3% 13.3x 10.9x 10.4x 20% 3% 17.3x 15.6x 12.8x 1% 10% 1.2x 1.1x 1.0x 1% 2% 3%Avg. excl. min & max 6.2x 5.9x 5.5x 3% 2% 12.7x 10.7x 10.5x 10% 5% 17.9x 15.7x 12.3x -2% 9% 1.1x 1.1x 0.9x 1% 2% 3%
SCI Media Universe 12/27/2012Astral Media Inc ACMa.TO $46.15 $2,610.8 $2,980.0 9.0x 8.9x NM 0% NM 12.6x 12.9x NM -2% NM 15.2x 19.4x NM -22% NM 2.5x 2.5x NM 3% NM $1.10 2.4%Corus Entertainment Inc CJRb.TO $23.72 $1,994.6 $2,488.2 8.6x 8.2x NM 5% NM 12.9x 12.7x NM 2% NM 15.7x 21.6x NM -27% NM 2.4x 2.2x NM 6% NM $0.99 4.2%Thomson Reuters Corp TRI.N $28.70 $23,723.6 $30,216.6 8.5x 8.3x 8.0x 3% 3% 13.9x 13.8x 13.0x 0% 6% 17.9x 16.0x 14.7x 11% 9% 1.8x 1.8x 1.8x -1% 3% $1.28 4.5%Postmedia Network Canada Corp PNCb.TO $2.05 $82.7 $562.0 4.0x 4.1x NM -2% NM 25.6x 11.7x NM 119% NM NM NM 9.8x NM NM 0.1x 0.1x NM -6% NM $0.00 0.0%Torstar Corp TSb.TO $7.55 $604.0 $763.5 3.6x 3.8x 3.9x -5% -2% 5.2x 5.7x 5.9x -9% -4% 15.3x NM 8.9x -98% NM 0.4x 0.4x 0.4x -2% -2% $0.53 7.0%Transcontinental Inc TCLa.TO $11.24 $899.2 $1,370.0 3.7x 3.9x NM -5% NM 5.9x 6.0x NM -1% NM 4.7x 9.3x NM -49% NM 0.4x 0.4x NM -4% NM $0.67 6.0%Cineplex Inc CGX.TO $31.18 $1,993.9 $2,184.6 11.3x 9.8x 8.7x 16% 12% 21.9x 17.3x 14.7x 27% 18% 25.4x 12.1x 10.6x 110% 14% 1.9x 1.7x 1.6x 8% 6% $1.35 4.3%
Average 7.0x 6.7x 6.9x 2% 5% 14.0x 11.4x 11.2x 19% 7% 15.7x 15.7x 11.0x -12% 11% 1.4x 1.3x 1.3x 1% 3% 4%Avg. excl. min & max 6.8x 6.7x 8.0x 0% 3% 13.4x 11.4x 13.0x 5% 6% 16.0x 15.9x 10.2x -22% 11% 1.4x 1.3x 1.6x 0% 3% 4%
Notes: As at December 27, 2012. Market cap and EV figures in millions. Thomson Reuters in US$. Quebecor Inc. and TVA Group Inc. estimates are consensus. P/E for Corus, Astral, Torstar, and Transcontinental reflect adjusted EPS.
Source: Company reports; Scotiabank GBM estimates; IBES; Thomson Reuters.
CO
MP
AR
AT
IVE
VA
LU
AT
ION
TA
BL
E

Focus 2013 January 2013
126
T H I S P A G E L E F T I N T E N T I O N A L L Y B L A N K .
Focus 2013 January 2013
Mark Turner, MBA, P.Eng. (416) 863-7484 Samar Sidhu, MBA, CFA (416) 863-7284 (Scotia Capital Inc. – Canada) (Scotia Capital Inc. – Canada) [email protected] [email protected]
127
Metals & Mining
Same Challenges, New Opportunities
This past year was marked by capital inflation; several project delays caused by permitting or infrastructure issues; a weak steel market, which affected steelmaking commodity prices; and rather flat copper prices, all laden with fears of an economic slowdown in China and emerging markets. As a result (and not surprisingly), performance of base metals equities was significantly affected, and it often seemed that the market was overreacting to negative news while barely acknowledging some positive company-specific developments. Unfortunately, we see some of the 2012 challenges continuing in 2013; however, we have noticed the start of some subtle but persistent trends that should provide some attractive investment opportunities.
C H A L L E N G E S L I K E L Y T O C O N T I N U E I N 2 0 1 3
Energy infrastructure constraints. As economic activity increases and grades fall, more energy is required to produce metal. In some jurisdictions such as Chile, for example, where water is in short supply, pumping desalinated seawater uphill, sometimes to an elevation above 4,000 metres, is extremely energy intensive and adds to the overall energy bill. We anticipate infrastructure constraints to remain a dominant theme for the next few years.
Capital budget reviews and project delays. Following announcements of significant cost overruns over the past year or so, it is likely that some companies will scrutinize 2013 budgets much more closely and, as such, we could see some modest project deferrals. At the same time, we would not be surprised to see some exploration budgets reduced as companies choose to focus on corporate cost reductions. In addition, with permitting issues in a number of jurisdictions still somewhat challenged, it may be difficult to fund aggressive programs without certainty on the permitting timeline.
Difficult financing environment for junior producers. Financing conditions have been particularly difficult for junior producers, especially in the second half of 2012, and we believe this is unlikely to change, at least in the first half of 2013. However, we would not discount the possibility that, with less of their budgets spent on exploration, producers might turn their attention to the most attractive projects, if not via acquisitions then likely through buy-in option agreements or minority equity stakes.
Mine supply uncertainty continues. With the permitting and infrastructure issues and the capital budget cuts we foresee, supply will continue to be constrained in 2013. While such constraint might not act as a catalyst for higher metal prices, in our opinion it may very well exacerbate the uptick in prices should global growth surprise to the upside.
Dividends. Faced with rising shareholder pressure, we believe mining companies might choose to distribute any cash flow to shareholders that cannot be wisely reinvested. As any company operating in a cyclical market might be reluctant to implement a permanent dividend increase, we may see more special dividends and, possibly, share buybacks in 2013 versus 2012.
Focus 2013 January 2013
128
L I K E L Y D E V E L O P M E N T S F O R 2 0 1 3
Growth reward for time and budget investments. In our view, the market has been discounting heavily the mining projects that are currently under construction. However, with the scarcity of permitted and financed economic projects, we believe that, in 2013, the market will start rewarding companies that are still investing time and budget in new production despite an overall pessimistic and difficult economic environment.
Steelmaking commodities to rebound. We believe that the correction in the steelmaking commodities that took place during the second half of 2012 over concern of a Chinese slowdown was overdone. The low prices had a severe impact on several producers, which cut back on both production and project development. We believe nickel and molybdenum prices are on the rebound and should be supported by the recent supply curtailments.
M&A activity to pick up. With healthy balance sheets, relatively low equity valuations, and a scarcity of permitted and economic projects in general, we anticipate an increase in M&A deals in 2013. In particular, we expect projects in safe jurisdictions or projects with high strategic value to be attractive targets. We continue to believe that foreign entities will be attracted by the relatively low values at which Canadian-listed equities presently trade.
O U T P E R F O R M E R S
Copper Mountain Mining Corporation (Sector Outperform; One-Year Target $5.50)
Marked operational improvement expected in 2013. Following the replacement of the much-discussed SAG mill grates with a new design late last summer, mill availability has been reported to have improved significantly. We expect a meaningful improvement to have been achieved in Q4/12 and to continue in 1H/13, particularly as a greater percentage of mill feed is expected to be the relatively softer Pit 2 ore. We estimate 2013 full-year production of 81.2 million pounds (Mlb), 60.9 Mlb attributable to shareholders, at an average C1 cash cost of US$1.80/payable pound of production – a 35% production improvement over our 2012 estimate and 30% reduction in cash costs.
Takeout potential. While not part of our investment thesis, we view, as do many others, Copper Mountain as an attractive M&A target within the junior producer ranks. In particular, we believe the North American address, long-life reserve and resource base, unhedged copper production, and gold and silver by-product credits to be attractive to mid-tier and other junior producers. In our view, a friendly transaction is unlikely to occur before management has been able to demonstrate achievement of the designed 35,000 tonne per day (tpd) throughput rate. As 100% of the concentrate is committed at market rates to the project’s 25% owner, Mitsubishi Materials Corporation, we believe interested parties will be limited to those indifferent to where the concentrate is sold.
We reiterate our Sector Outperform rating on Copper Mountain with a one-year target price of $5.50 per share. Our valuation is based on a 1.0x multiple applied to our NAVPS8% estimate of $8.15 for Copper Mountain’s 75% stake in the Copper Mountain project and a 1.0x multiple to our NAVPS of net cash and corporate adjustments of negative $2.71.
Upcoming Catalysts 2013 and “longer-term” mine plan update – expected early Q1/13.
Q4/12 production and sales – expected mid January 2013.
Capstone Mining Corp. (Sector Outperform; One-Year Target $4.20)
Balance-sheet strength for the “right” acquisition… or distribution of cash. In our view, Capstone continues to maintain the strongest, most flexible balance sheet of the junior producers in our coverage universe. With estimated 2012 year-end cash of $514 million, positive free cash flow from the Minto and
Focus 2013 January 2013
129
Cozamin operations, $200 million in an untapped credit facility, and Korea Resources Corporation (KORES) as a strategic partner (whose ultimate aim is to secure copper off-take), we believe Capstone is in a strong position to deploy capital opportunistically. Should an accretive opportunity to acquire existing or near-term production not be found, we believe return of capital to shareholders to be a real possibility in 2013 via recently announced share buyback program or a potential cash dividend.
Unhedged, steady, middle-of-the-cost-curve production in the Americas. The first three quarters of 2012 saw production as planned and below budgeted cash costs – divergent from the industry trend of ongoing production constraints and rising costs. We believe Q4/12 to be no different and estimate full-year production to be 83 Mlb, at the high end of the guidance given in early 2012. We expect 2013 to be more of the same – after the successful transition at Minto to the new Area 2/Area 118 open pit in 2012 – and forecast total copper production of 84.7 Mlb at a moderately higher average C1 cash cost of US$1.75/lb of payable copper. We believe Capstone has a moderate risk profile relative to other equities in our universe owing to the location of its assets and strong financial position.
We reiterate our Sector Outperform rating on Capstone with a one-year target price of $4.20 per share. Our valuation is based on a blended multiple of 0.83x applied to our NAVPS8% of US$4.11 for the producing and non-producing mineral assets and a 1.0x multiple to our NAVPS of net cash and corporate adjustments of US$0.98.
Upcoming Catalysts Q4/12 production – expected mid January 2013.
Update to Mala Noche Footwall Zone (MNFWZ) resource estimate at Cozamin operation in Mexico – expected in January 2013.
U N D E R P E R F O R M E R
New Millennium Iron Corporation (Sector Perform; One-Year Target $2.65)
Construction timeline extension risk for DSO. Tata Steel Minerals Canada (TSMC), the joint venture (JV) owned 20% by NML, believes it is on track to produce 2.0 Mt of sinter and super fines next year from the DSO project. The delivery and installation of the major process equipment is planned to continue in 1H/13. We continue to believe that significant construction timeline risk remains in the construction schedule, and estimate commercial production/sales of 0.5 Mt in 2013. In 2014, TSMC expects to be producing at full design rates of 4.2 Mtpa compared with our estimate of 3.75 Mt.
Tata’s Taconite project decision. Within four months of the Taconite project feasibility study (FS) completion, Tata is to decide whether or not to join the development of the project. We believe that Tata will exercise its option to acquire a controlling stake in the project; however, not necessarily to move expeditiously to begin construction, given the presently poor steel market conditions around the world. Further, the equity or the project debt financing to be arranged by Tata to fund the $6.6 billion initial capital cost (Scotiabank GBM estimate) may not be available at economically beneficial terms when desired and could result in delays to the project development schedule. We conservatively model construction of the Taconite project to begin in 2016, with commercial production starting in 2019.
We reiterate our Sector Perform rating on New Millennium with a one-year target price of $2.65 per share. Our valuation is based on a 0.8x P/NAV target multiple applied to our NAV estimate of NML’s 20% ownership in the DSO project and a 0.3x target multiple to our valuation of the Taconite project.
Upcoming Catalysts Taconite project feasibility results – recently delayed, expected in Q1/13.
Tata steel investment decision in Taconite project – expected Q2/13 (based on delivery of FS).
Focus 2013 January 2013
130
Exhibit 1: Metals & Mining Comparative Valuation Table
December 27, 2012Symbol
Share Price ($) Rating1 1-Year
TargetRate of Return
Basic Shares
(M)
Market Cap (US$M)
2012E EV
(US$M)2 NAV8%3 P/NAV Analyst4
ProducersCapstone Mining Corp. CS.TO C$ 2.31 SO C$ 4.20 82% 381.4 886 332 US$ 5.09 0.46 MTCopper Mountain Mining Corporation CUM.TO C$ 3.84 SO C$ 5.50 43% 98.5 381 650 C$ 5.44 0.71 MTLabrador Iron Mines Holdings Limited LIM.TO C$ 0.89 SO C$ 1.60 80% 97.8 88 254 C$ 1.72 0.52 MTLabrador Iron Ore Royalty Corp. LIF.TO C$ 33.76 SP C$ 34.00 5% 64.0 2,173 2,136 C$ 34.72 0.97 MTMercator Minerals Ltd. ML.TO C$ 0.47 SP C$ 2.00 326% 314.8 149 243 US$ 2.16 0.22 MTRio Alto Mining Limited RIO.TO C$ 4.94 SP C$ 5.90 19% 174.9 869 848 US$ 5.61 0.89 MTTaseko Mines Limited TKO.TO C$ 2.90 SP C$ 5.00 72% 190.6 556 607 C$ 4.87 0.60 MTWeighted Average 42% 0.78
DevelopersAlderon Iron Ore Corp. ADV.TO C$ 1.75 SO C$ 4.00 129% 129.9 229 214 C$ 6.69 0.26 MTChampion Iron Mines Limited CHM.TO C$ 0.60 SO C$ 2.40 300% 119.3 72 167 C$ 5.10 0.12 MTNevada Copper Corp. NCU.TO C$ 3.25 SO C$ 6.70 106% 80.5 263 96 US$ 7.64 0.43 MTNew Millennium Iron Corporation NML.TO C$ 1.13 SP C$ 2.65 135% 178.8 203 145 C$ 7.36 0.15 MTRoyal Nickel Corporation RNX.TO C$ 0.41 SP C$ 2.00 394% 90.1 37 34 C$ 3.12 0.13 MTWeighted Average 150% 0.27
1 SO = Sector Outperform; SP = Sector Perform; SU = Sector Underperform; R = Restricted; UR = Under Review; T = Tender.
3 Net asset value per fully diluted share calculated at 8% real discount rate in constant dollars.4 MT = Mark Turner.
2011A Spot Price 2012E 2013E 2014E 2015E Long-termCopper (US$/lb) 4.00 3.55 3.70 4.29 4.80 4.95 2.75Nickel (US$/lb) 10.38 7.93 8.15 10.50 12.50 13.00 10.50Molybdenum Oxide (US$/lb) 15.81 n.a. 13.36 15.38 17.00 17.00 16.50Zinc (US$/lb) 1.00 0.92 0.91 1.09 1.21 1.20 1.15Lead (US$/lb) 1.09 1.04 0.94 1.10 1.20 1.25 0.85Gold (US$/oz) 1,572 1,663 1,675 1,800 1,800 1,800 1,300Silver (US$/oz) 35.31 30.09 30.77 36.00 36.00 36.00 21.00Iron Ore Fines - 63.5% CFR China (US$/t) 168 n.a. 129 130 150 145 120USD/CAD 0.99 0.99 0.99 0.96 0.96 0.95 0.95
2 Enterprise Value (EV) = fully diluted market cap at current share price and spot exchange rate + year-end net debt + buy-out of minority interest - peripheral assets (end of year).
Source: Company reports; Bloomberg; Reuters; Scotiabank GBM estimates.
C O M P A R A T I V E V A L U A T I O N T A B L E
Focus 2013 January 2013
Joanne Smith, CFA (212) 225-5071 Jeff Flynn, MBA (212) 225-5039 (Scotia Capital (USA) Inc.) (Scotia Capital (USA) Inc.) [email protected] [email protected]
131
North American Life Insurance
Selective Opportunities Despite Stiff Headwinds
H I G H Q U A L I T Y , L O W V A L U A T I O N ; S P E C I F I C C A T A L Y S T S ; B O O K V A L U E
P E R S H A R E G R O W T H
For 2013, we have a smaller list of Sector Outperform-rated stocks, as we expect – after some strong gains in a number of stocks in our universe – there to be more limited opportunities for substantial outperformance, as the headwinds associated with low interest rates remain stiff and earnings growth will likely be constrained until some relief is at hand. We are introducing one Focus Stock, MetLife, Inc. (MET), which represents our best idea in the outperform category, as we expect the stock to significantly outperform the average 12-month total return of our coverage universe. Our Sector Outperform-rated companies are Aflac Incorporated (AFL) and Manulife Financial Corporation (MFC).
Life insurance stocks had a good run in the second half of 2012, ending the year up an average of 19.8% p(through December 27, 2012). Furthermore, while P/E multiples have risen as earnings estimates have steadily moved down, reflecting the impact of low interest rates, valuation, on a price to book value (P/BV) basis, has barely budged and stands at 0.9x 2013E BVPS. We continue to weigh P/BV more heavily when deriving our price targets than we do P/E, as we believe investor focus will remain on life insurers’ balance sheets until interest rates begin to rise and investors anticipate acceleration in earnings growth.
B U Y H I G H Q U A L I T Y
In the current environment, we have focused our top picks on stocks of the highest-quality companies. In our view, investors should not be compelled to take outsized risks because, with very few exceptions, there is little difference between valuations of higher-quality and lower-quality stocks. Companies that have an established track record of achieving earnings and return targets and have mapped out a clear path to future goals leave less to chance and the whims of the macroeconomic environment than companies that are more dependent on an improved climate to see better growth and returns than the peer group. Companies that have typically delivered in a variety of market conditions include MET and AFL.
T A K E A D V A N T A G E O F A T T R A C T I V E V A L U A T I O N
We continue to believe there are opportunities to realize significant returns by looking for good companies trading at unusually attractive valuations, including AFL, MET, and MFC.
Life insurance stocks currently trade at 8.0x 2013E EPS and 0.9x 2013E BVPS, valuation levels that overstate the downside risk to earnings and the possibility that balance sheet actions will be required, either in the form of increases to reserves or write-offs to deferred acquisition costs (DAC), goodwill, or other intangible assets, in our opinion. Life insurance stocks are 25% and 27% below their 10-year historical average P/B and P/E, respectively, although we do not expect a recovery in those levels until the macroeconomic environment improves and interest rates rise. That does not preclude, however, substantial upside in a number of stocks, primarily those rated Sector Outperform. Our 12-month price targets are based on reasonably modest valuation expansion to levels well below the 10-year averages. For example, our 12-month target price of US$44.00 for MET is based on a P/BV multiple of 0.8x, only slightly above the current multiple of 0.7x, and a P/E multiple of 9x.
Focus 2013 January 2013
132
L O O K F O R C A T A L Y S T S
In a relatively unfriendly macroeconomic environment for life insurers, especially where it relates to low interest rates, we look for stocks where there is a specific catalyst that could move the shares despite the stiff headwinds facing the sector. We believe catalysts exist for AFL, MET, and MFC.
B V P S G R O W T H
An important component of our investment thesis is to own the stocks of companies that can grow book value at rates that can drive stock outperformance versus peers. This has gained even more relevance given the current interest rate headwinds facing the industry, especially because we continue to believe multiple expansion is limited until those headwinds subside. A recent analysis we completed suggests AFL, MET, Lincoln National Corporation (LNC), and MFC are best positioned to grow BVPS regardless of the impact of low interest rates over the 2013-2015 period.
I N D U S T R Y O U T L O O K : I N T E R E S T R A T E H E A D W I N D S , M O D E S T R O E E X P A N S I O N ,
R E G U L A T O R Y O V E R H A N G
We expect a mixed earnings picture in 2013. As was the case in 2012, interest rates remain top of mind to investors in life insurance stocks in 2013 and stiff headwinds remain, which will limit top- and bottom-line growth and ROE improvement. While insurers have repeatedly increased prices and restructured products to reduce risk, these changes have barely kept pace with the declines in portfolio yields, although new product pricing more likely reflects current new money rates. Revenue growth will likely be sluggish in 2013, largely due to the impact of low interest rates, but also as several insurers pull back from riskier, more capital-intense products and work to refocus sales on products with more capital-friendly characteristics. Fixed and variable annuities, universal life insurance with no-lapse guarantees, segregated funds with guaranteed minimum withdrawal benefits, and certain long-term pension products are likely to see sales declines, while more traditional life insurance and retirement products, in addition to all types of group products, are being emphasized by a growing number of players, which will begin to exert more competitive pressure on these products. So, while we expect mid-single-digit growth in earnings and modest improvement in ROEs, we do not believe 2013 will bring major revaluation in the shares of life insurers.
We look for ROEs to average 11.2% in 2012, rising to 11.6% in 2013, primarily a function of only modest earnings growth. We expect most lifecos to maintain strong capital levels, with RBC ratios staying well above 400% and MCCSRs, in most cases, modestly above 200%. We look for some capital management in 2013 from companies with substantial excess capital, such as LNC, Protective Life Corporation (PL), and Prudential Financial, Inc. (PRU), and we expect some companies to either add to modest activity in 2012 (AFL) or initiate new plans in 2013 (MET), while others will pull back from activity, such as Principal Financial Group, Inc. (PFG) as a result of a large acquisition. The Canadian lifecos remain constrained in their capital activity and dividend payout ratios remain high.
P R I M A R Y R I S K S A R E I N T E R E S T R A T E A N D R E G U L A T O R Y C H A N G E
While interest rate risk remains elevated, we believe the risk to BVPS growth is less than that reflected in the stocks; this is based on the analysis we published in our November 19, 2012, Daily Edge note, “It’s All About Growth in Book Value – Despite Headwinds.” With interest rate levels near all-time lows, there is downside risk to earnings and the possibility that balance sheet actions will be required, either in the form of increases to reserves or write-offs to DAC, goodwill, or other intangible assets, in our opinion.
Focus 2013 January 2013
133
Regulatory risk remains elevated for the sector, particularly for those companies that have the potential to have additional oversight, either because of being named non-bank systemically important financial institutions or because they have some sort of banking subsidiary that will be included in a less-restrictive level of federal regulation. Capital requirements are likely to remain high or rise, depending on the development of a number of initiatives in the United States and Canada. As a result, we expect most companies to continue to deleverage and simplify capital structures.
O U T P E R F O R M E R S
Aflac, Inc. (Sector Outperform)
AFL is a high-quality, well-managed company with a unique business model and a solid competitive advantage in its largest market, Japan, owing to its 38-year history in the country and it being the first insurer to bring standalone cancer insurance coverage to the market.
As a number of initiatives take hold and the company regains investor confidence in its growth prospects, 2013 could be a milestone year for the company. Earnings transparency, an uncomplicated business model, management’s conservatism, and a focus on the creation of shareholder value are characteristics that make AFL stand apart from most peers.
AFL is unique to our universe in that it has historically been valued more on a P/E basis than on P/BV as a result of its less capital-intense product mix, earnings transparency, and high ROE. When deriving our 12-month price target, we use a weighting of 60%/40% price-to-earnings/price to book value. At a current valuation of 7.6x and 1.5x our 2013E EPS and 2013E BVPS, respectively, we find the AFL stock to be particularly compelling. We expect BVPS to increase 18% in 2013 and at a CAGR of 12.2% over 2013-2015 period, even under a scenario where the company has an additional US$1.6 billion in investment losses.
We believe 2013 could be the inflection year for earnings growth, and given the current interest rate and general macroeconomic climate, we expect investors to reward those that can accelerate earnings growth with higher valuation. Our 12-month price target of US$59.00 is based on a target P/E of 9x our 2013E EPS and a target P/B of 1.5x on our 2013E BVPS.
MetLife, Inc. (Focus Stock)
We have upgraded MET to Focus Stock from Sector Outperform.
MET has consistently outperformed earnings expectations and peers, and with a strategy to emphasize businesses that are less capital intense and less interest rate and equity market sensitive, we believe the trend can continue. Key differentiators for MET include superior growth, a strong risk management culture, financial discipline, the most diversified business model among its peers, and scale in all core businesses; these are factors behind its relative strength versus peers in quality, quantity, and consistency.
While the company has been limited in terms of capital deployment due to the pending sale of its bank assets, there may be a light at the end of the tunnel as the sale received preliminary approval from the OCC. Longer term, we believe the intrinsic value of the stock is in the company’s ability to generate free cash flow, which will likely be limited in 2013 by one-time and non-recurring items.
MET’s stock has traded in a very tight valuation range, particularly since February 2012, when its 2012 capital plan was denied by the Federal Reserve; however, as the company takes the final steps to de-bank, we expect the company to re-evaluate its options with respect to capital return to shareholders.
We believe the ability and willingness to pay out more earnings to shareholders, over time, is currently underappreciated by the market, as represented by the stock’s valuation at 6.3x our 2013E EPS and 0.6x our 2013E BVPS. We look for MET’s BVPS to rise 9% in 2013 and at a CAGR of 8% over 2013-2015 period even with interest rate headwinds.
Focus 2013 January 2013
134
Manulife Financial Corporation (Sector Outperform)
MFC is in the process of earning back its status as a high-quality company as it works through a number of legacy issues that have been compounded by a harsh accounting and regulatory regime, which are particularly punitive under adverse conditions. Strong brand presence, distribution depth, and an international footprint have played substantial roles in the company’s process of recovery over the past few years, and we expect the company to realize the potential that these important assets provide for future growth, profitability, and returns.
MFC continues to trade well below its 10-year average and, while we do not believe any lifeco can achieve its historical valuation in the current environment, we do believe valuation should be directly related to a company’s ROE prospects, and this is where we believe the value lies in the MFC stock. Even under ongoing adverse market conditions, specifically an extension of the current interest rate environment, we expect MFC’s ROE to rise to 11.5% by 2015.
We expect the main driver of the stock, over the next several months, to be a lifting of the storm clouds surrounding the company and distance from the string of charges associated with legacy issues and low interest rates. We believe the risk of significant future charges, beyond those that have been disclosed and quantified by management, has declined, and the gradual acceptance by investors of that expectation should allow the stock’s multiple to expand.
U N D E R P E R F O R M E R S
Industrial-Alliance Insurance and Financial Services Inc. (Sector Underperform)
We believe Industrial-Alliance Insurance and Financial Services Inc. may face additional significant charges associated with low interest rates if they remain at or near current levels. While the risk of substantial charges in 2013 is mitigated by the company’s expected Q4/12 action, which should buy the company some time, the risk increases as we move into the latter part of 2013, as the stock will likely begin to discount around mid-year.
Genworth Financial, Inc. (Sector Underperform)
Genworth Financial, Inc.’s (GNW’s) recent announcements regarding a new member of the board of directors and the appointment of a new CEO – in addition to sector news that Mortgage Guarantee Insurance Corporation is allowed to continue to write new private mortgage insurance and that a private mortgage insurer, which filed for Chapter 11 in 2011, has received an indication of interest in a potential capital injection from a well-known private equity investor – have combined to move the stock up more than 30% since the end of Q3/12. We believe it may have gotten a bit ahead of itself.
A substantial number of risks remain for GNW, which could limit the amount of capital flexibility the company has and how much it could unlock over the next several months. While the U.S. mortgage insurance business appears to have bottomed, it could be a long process of recovery for the business given the weak macroeconomic climate; in addition, further delays in the partial IPO of the company’s Australian mortgage insurance business could further frustrate investors. Finally, we expect the pressure exerted on many of the company’s businesses from low interest rates could delay or diminish potential sale opportunities.
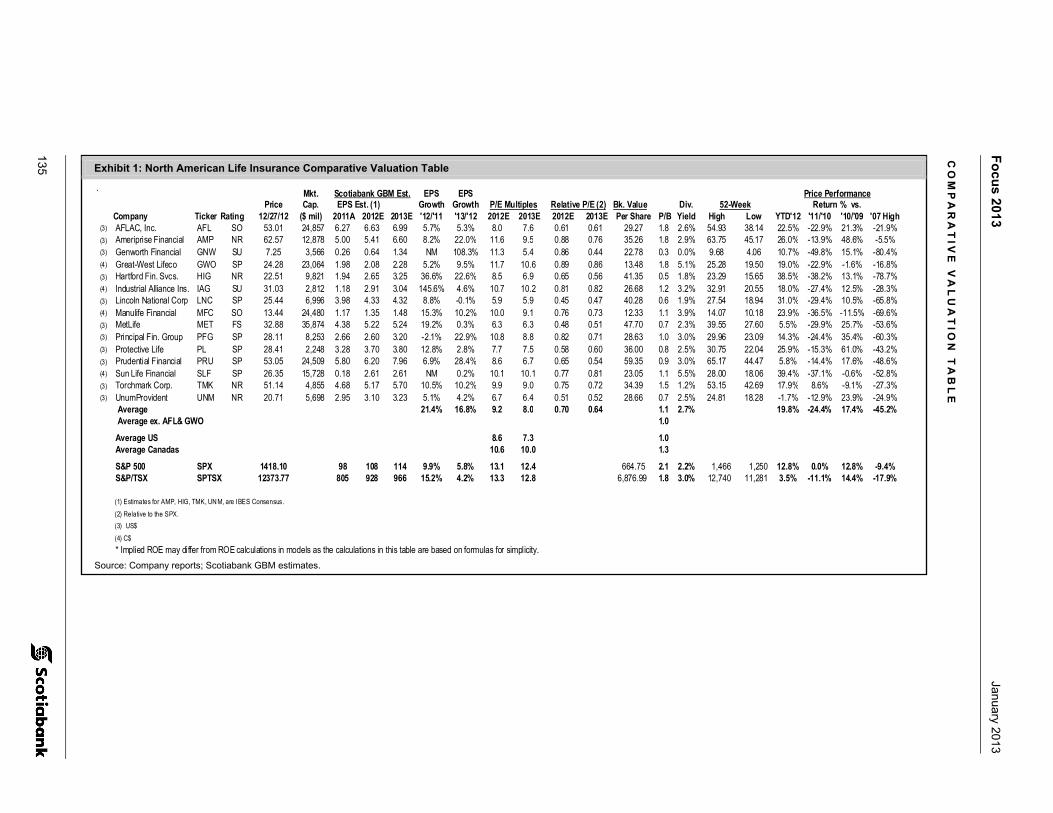
135
Fo
cus 2013
January 2013
Exhibit 1: North American Life Insurance Comparative Valuation Table
` Mkt. EPS EPSPrice Cap. Growth Growth Bk. Value Div. 52-Week
Company Ticker Rating 12/27/12 ($ mil) 2011A 2012E 2013E '12/'11 '13/'12 2012E 2013E 2012E 2013E Per Share P/B Yield High Low YTD'12 '11/'10 '10/'09 '07 High(3) AFLAC, Inc. AFL SO 53.01 24,857 6.27 6.63 6.99 5.7% 5.3% 8.0 7.6 0.61 0.61 29.27 1.8 2.6% 54.93 38.14 22.5% -22.9% 21.3% -21.9%(3) Ameriprise Financial AMP NR 62.57 12,878 5.00 5.41 6.60 8.2% 22.0% 11.6 9.5 0.88 0.76 35.26 1.8 2.9% 63.75 45.17 26.0% -13.9% 48.6% -5.5%(3) Genworth Financial GNW SU 7.25 3,566 0.26 0.64 1.34 NM 108.3% 11.3 5.4 0.86 0.44 22.78 0.3 0.0% 9.68 4.06 10.7% -49.8% 15.1% -80.4%(4) Great-West Lifeco GWO SP 24.28 23,064 1.98 2.08 2.28 5.2% 9.5% 11.7 10.6 0.89 0.86 13.48 1.8 5.1% 25.28 19.50 19.0% -22.9% -1.6% -16.8%(3) Hartford Fin. Svcs. HIG NR 22.51 9,821 1.94 2.65 3.25 36.6% 22.6% 8.5 6.9 0.65 0.56 41.35 0.5 1.8% 23.29 15.65 38.5% -38.2% 13.1% -78.7%(4) Industrial Alliance Ins. IAG SU 31.03 2,812 1.18 2.91 3.04 145.6% 4.6% 10.7 10.2 0.81 0.82 26.68 1.2 3.2% 32.91 20.55 18.0% -27.4% 12.5% -28.3%(3) Lincoln National Corp LNC SP 25.44 6,996 3.98 4.33 4.32 8.8% -0.1% 5.9 5.9 0.45 0.47 40.28 0.6 1.9% 27.54 18.94 31.0% -29.4% 10.5% -65.8%(4) Manulife Financial MFC SO 13.44 24,480 1.17 1.35 1.48 15.3% 10.2% 10.0 9.1 0.76 0.73 12.33 1.1 3.9% 14.07 10.18 23.9% -36.5% -11.5% -69.6%(3) MetLife MET FS 32.88 35,874 4.38 5.22 5.24 19.2% 0.3% 6.3 6.3 0.48 0.51 47.70 0.7 2.3% 39.55 27.60 5.5% -29.9% 25.7% -53.6%(3) Principal Fin. Group PFG SP 28.11 8,253 2.66 2.60 3.20 -2.1% 22.9% 10.8 8.8 0.82 0.71 28.63 1.0 3.0% 29.96 23.09 14.3% -24.4% 35.4% -60.3%(3) Protective Life PL SP 28.41 2,248 3.28 3.70 3.80 12.8% 2.8% 7.7 7.5 0.58 0.60 36.00 0.8 2.5% 30.75 22.04 25.9% -15.3% 61.0% -43.2%(3) Prudential Financial PRU SP 53.05 24,509 5.80 6.20 7.96 6.9% 28.4% 8.6 6.7 0.65 0.54 59.35 0.9 3.0% 65.17 44.47 5.8% -14.4% 17.6% -48.6%(4) Sun Life Financial SLF SP 26.35 15,728 0.18 2.61 2.61 NM 0.2% 10.1 10.1 0.77 0.81 23.05 1.1 5.5% 28.00 18.06 39.4% -37.1% -0.6% -52.8%(3) Torchmark Corp. TMK NR 51.14 4,855 4.68 5.17 5.70 10.5% 10.2% 9.9 9.0 0.75 0.72 34.39 1.5 1.2% 53.15 42.69 17.9% 8.6% -9.1% -27.3%(3) UnumProvident UNM NR 20.71 5,698 2.95 3.10 3.23 5.1% 4.2% 6.7 6.4 0.51 0.52 28.66 0.7 2.5% 24.81 18.28 -1.7% -12.9% 23.9% -24.9%
Average 21.4% 16.8% 9.2 8.0 0.70 0.64 1.1 2.7% 19.8% -24.4% 17.4% -45.2% Average ex. AFL& GWO 1.0
Average US 8.6 7.3 1.0Average Canadas 10.6 10.0 1.3
S&P 500 SPX 1418.10 98 108 114 9.9% 5.8% 13.1 12.4 664.75 2.1 2.2% 1,466 1,250 12.8% 0.0% 12.8% -9.4%S&P/TSX SPTSX 12373.77 805 928 966 15.2% 4.2% 13.3 12.8 6,876.99 1.8 3.0% 12,740 11,281 3.5% -11.1% 14.4% -17.9%
(1) Estimates for AMP, HIG, TMK, UNM, are IBES Consensus.(2) Relative to the SPX.(3) US$(4) C$* Implied ROE may differ from ROE calculations in models as the calculations in this table are based on formulas for simplicity.
Return % vs.Price Performance
Relative P/E (2)EPS Est. (1)Scotiabank GBM Est.
P/E Multiples
Source: Company reports; Scotiabank GBM estimates.
CO
MP
AR
AT
IVE
VA
LU
AT
ION
TA
BL
E

Focus 2013 January 2013
136
T H I S P A G E L E F T I N T E N T I O N A L L Y B L A N K .
Focus 2013 January 2013
Jason Bouvier, CFA (403) 213-7345 William S. Lee, P.Eng. (403) 213-7331 Gavin Wylie (403) 213-7333 (Scotia Capital Inc. – Canada) (Scotia Capital Inc. – Canada) (Scotia Capital Inc. – Canada) Patrick Bryden, CFA (403) 213-7750 Mark Polak, CFA (403) 213-7349 Vladislav C. Vlad, MBA, P.Eng. (403) 213-7759 (Scotia Capital Inc. – Canada) (Scotia Capital Inc. – Canada) (Scotia Capital Inc. – Canada)
137
Oil & Gas
Striking Black Gold in 2013
Canadian E&P – Themes for 2013
O I L A N D L I Q U I D S - R I C H G A S D R I L L I N G T O C O N T I N U E F U L L S T E A M A H E A D
Although natural gas prices have stabilized from the lows of 2012 – less than US$2/mcf – many producers have shifted their asset base to include significant oil and liquids-rich gas plays. In the United States, the percentage of rigs drilling for oil has increased to ~77% from ~59% one year ago and from only ~46% two years ago. In Canada, more than 71% of drilling and completion activity is now focused on oil (up from ~50% in 2010). The oil to gas price ratio is currently at ~30:1. This pricing ratio has improved from the high of ~60:1 during the summer months and, therefore, we expect the rapid decline in natural gas-directed rigs to stop and eventually begin to increase. That said, we continue to believe oil and liquids-rich plays will garner the majority of capital allocation. We expect the appetite for oil to continue in 2013, with several sub-themes:
Wide heavy-light differentials in 1H/13, followed by longer-term trend of narrowing beginning in 2H/13. The Marathon Oil Corporation (Marathon) Detroit Heavy Oil Upgrade Project (DHOUP) is now essentially complete, with the facility ramping up to capacity; BP’s Whiting upgrade should be complete in Q3/13. The impact of these expansions is twofold:
1. With the facilities back up and running, there is additional capacity online in the PADD II market, while the expansions themselves add ~340 mbbl/d of new heavy oil capacity. Pipeline downtime feeding into the PADD II area and the backlog it has created in the system should be largely resolved, while access to PADD III will expand to 400 mbbl/d when the Seaway expansion ramps up early in the year and the Keystone XL U.S. Gulf Coast (USGC) leg is commissioned late in 2013. We expect inventories at Cushing should begin to draw down as USGC refiners expand access to discounted WTI crude and push out imports, narrowing the WTI-Brent spread, thereby providing support to the benchmark price.
2. Additionally, the expanded access to the region should allow for heavy Canadian crudes to displace premium-priced seaborne USGC heavy imports. As the timing of both supply and demand projects is sporadic, we expect differentials to be volatile throughout the year but ultimately end up narrowing in the second half.
Light oil differentials to remain choppy. While the USGC access expansions should generally provide support to the price of continental crudes, light Canadian production faces some unique headwinds. The DHOUP and Whiting expansion and conversion result in ~300 mbbl/d of demand destruction for light oil in PADD II. Enbridge Inc. will also be increasing the amount of Bakken crude in its system with the 120 mbbl/d expansion at Cromer, Saskatchewan, expected to be onstream in 2013, although part of this impact will likely be offset by the 50 mbbl/d Line 5 expansion, with increased access into Sarnia. Overall, we expect light oil spreads to remain variable given facility downtime and the timing of pipeline projects.
Focus 2013 January 2013
138
G A S P R I C E R E C O V E R Y T O C O N T I N U E
The natural gas rig count has decreased to ~400 from just below 1,000 in mid-2010 (down 60%); however, natural gas production has remained relatively flat. This was due to continued increases in efficiency (more gas was put onstream per rig utilized), a significant backlog of drilled and uncompleted wells, and some drilling that was done solely to keep land (i.e., wasn’t economic when gas prices were less than US$2/mcf). With the backlog of uncompleted wells reduced and the natural gas rig count at a multi-year low, we expect natural gas production to begin to fall in 2013 and stronger natural gas prices (US$3.50+/mcf) to persist.
S I G N I F I C A N T D E L I N E A T I O N O F M A J O R P L A Y S – A R I S K T O N G L P R I C I N G ?
In our view, several emerging plays will receive significant capital allocation (drill and completions) in 2013:
Allocation of US$25 billion-US$30 billion in each of the Permian and Eagle Ford plays.
Allocation of US$4 billion-US$5 billion in each of the Utica and Mississippi plays.
Allocation of US$2.5 billion in the Niobrara formation.
Allocation of more than $1 billion in the Duvernay formation in Canada.
If proven commercial, it is clearly a “win” for producers with significant footprints in the core areas. However, the success of these plays, coupled with significant capital allocation, will continue to put pressure on both natural gas and natural gas liquids (NGL) prices. Ethane and propane already showed significant deterioration in 2012 and if a few major liquids-rich plays are proven up in 2013, low NGL prices are likely to continue and could potentially worsen. This will have the effect of making marginal liquids-rich gas plays uncompetitive. It will not be enough to simply have liquids content; to be competitive will require higher levels or else higher concentrations of condensate (highest-priced NGL, which we expect to maintain its current pricing levels).
In our view, the highest liquids yields (in major plays) come from the Eagle Ford in Texas and the Kaybob Duvernay in Alberta.
C O M P L E T I O N S E R V I C E S – A N I M P R O V E M E N T I N C O S T S F O R E & P C O M P A N I E S
We expect continued demand for completion services, but at lower rates. An oversupply of pressure-pumping capacity in the United States and to a lesser extent in Canada will likely continue to weigh on pricing through 2013. In the United States, pricing and margins look to be reaching bottom (notably in the southern United States) as pumpers have sacrificed utilization in order to preserve equipment; however, there is elevated risk of further price weakness in the northern United States and Canada as some of the larger players appear to be chasing utilization at the expense of profitability. We do not anticipate a material pickup in completion activity at the start of 2013, a symptom of the weak 2012 rig count (11% below 2011). Fresh E&P budgets could see a quick start to drilling activity in 2013 and should subsequently result in improving completion levels toward the end of Q1/13 and post-breakup.
T A R G E T E D C O N S O L I D A T I O N T O C O N T I N U E
As we enter 2013, we anticipate continued (but moderated) M&A activity, most notably in the large, capital-intensive plays. We believe senior and large intermediate producers will continue to consolidate their positions (leading to economies of scale and production growth) in resource-type plays. Those companies (juniors and intermediates) with focused asset bases and large development inventories (largely de-risked) will be the most attractive in our opinion.
Focus 2013 January 2013
139
With customers in Asia (notably Japan) paying more than US$16/mcf for liquefied natural gas (LNG), and western Canada suppliers receiving only ~US$3.50/mcf, the push toward exporting LNG overseas is gaining momentum. With new guidelines and a cautious tone from the federal government regarding state-owned entities acquiring Canadian resources, we anticipate companies will look to joint ventures to gain much-needed capital to develop longer-term capital-intensive projects.
C O N T I N U E D F O C U S O N S E C O N D A R Y R E C O V E R Y M E T H O D S ( T I G H T O I L )
In our view, there are several objectives that have motivated (and are likely to continue to motivate) producers to test and implement tight oil secondary (waterfloods) and tertiary (miscible and chemical flooding) recovery methods, including the following:
Capturing incremental production and reserves efficiently and cost effectively.
Strategic moderation of corporate decline rates.
Adding value to assets where many costs (e.g., land facilities) are already sunk.
A more controlled development pace for recently commercialized resource plays.
The potential to implement enhanced oil recovery projects appears positive and, in addition to attentive asset management, key considerations include the following:
Attractive remaining oil in place.
Sufficient permeability, in excess of 0.5 millidarcies (mD).
Reservoir homogeneity.
Good mobility ratio.
C A N A D I A N E & P – R I S K S
Commodity Prices
Crude oil and natural gas prices are inherently volatile and, therefore, present risk to the level and stability of revenue generated by E&P companies. A material decline in prices could result in reserve writedowns and reduce a company’s ability to refinance its credit facilities.
Regulatory
Changes in regulatory requirements, such as royalty, environmental, and tax policies, can materially affect the value of an oil and gas company.
Horizontal Drilling and Multi-staged Fracture Completion Execution
While horizontal, multi-stage fractured wells offer the potential for increased production rates and recoveries, well costs tend to be higher, the complexity of the operations can increase, and production declines and associated recoveries may be subject to uncertainties.
Production and Reserve Replacement
Crude oil and natural gas assets exhibit production declines and a depletion of reserves over time. A going-concern company depends on management’s ability to replace production and reserves through the development of assets already owned or the acquisition of new assets and land for exploration and development.
Focus 2013 January 2013
140
C A N A D I A N E & P – T O P I D E A S F O R 2 0 1 3
Taking our themes into account, as well as our views on management teams, balance sheets, asset quality, and valuation levels, we expect the following companies to outperform in 2013.
O U T P E R F O R M E R S – I N T E G R A T E D S / L A R G E C A P S
Suncor Energy Inc. (Focus Stock) – Growth, Free Cash Flow, and Increasing Discipline – Mark Polak, CFA
We have upgraded Suncor Energy Inc. (Suncor) to Focus Stock from Sector Outperform.
Integration provides shelter from heavy differentials in the near term; minimal WTI exposure. Suncor’s 455 mbbl/d of refining capacity effectively insulates the company from heavy-light differentials and results in much greater Brent oil exposure than is generally understood by the market. Given our expectation that heavy-light differentials will remain wide through the first half of 2013, this integration positions Suncor very well in the near term, while over the intermediate to long term, the company will be growing heavy oil production into what we expect will be a stronger pricing environment. With 28% of oil production linked to Brent-based prices (East Coast North America and United Kingdom) and with refined products being priced off Brent, only 2% of the company’s oil production is linked to depressed WTI-based prices.
Best mix of growth and free cash flow. Production in 2013 is estimated to grow 9% over 2012 while also generating ~$2 billion in free cash flow. While there have been concerns that this free cash flow will shrink in coming years and be invested in three large mining and upgrading projects with high capital intensity and low returns, we now expect at least one and possibly two of these projects will be deferred. In addition to a demonstrated renewed focus on returns, such deferrals will enable the company to consider a more substantial increase in the quarterly dividend, continued share repurchases, and continued expansions at Firebag, where the capital intensity is roughly half of that expected for the company’s other mining projects.
Attractive valuation. At a 14% discount to 2P NAV, a 26% discount to risked 2P+2C NAV, and 6.0x EV/DACF (2013E), Suncor is the most attractively valued Canadian integrated company and one of the least expensive large caps. We believe it is unlikely that an integrated oil sands company with an industry-leading mix of growth and free cash flow will remain at a multiple similar to E&P companies.
Canadian Natural Resources Limited (Sector Outperform) – Oil Growth at a Discount – Mark Polak, CFA
Differentials and operational setbacks will be resolved over time. Canadian Natural Resources Limited (CNQ) offers a vast resource base that provides operational flexibility, which is currently being slanted toward oil growth, with the company anticipating 11% primary heavy oil growth in 2013 to be followed by substantial growth in thermal production when Kirby South comes online in 2014. This growth in heavy oil production coincides with our view of narrowing heavy oil differentials. Recent and ongoing investments at Horizon should improve reliability and expand operable capacity, neither of which we believe are being priced into the current valuation. While the broader portfolio is expected to grow only ~4% year over year (YOY) in 2013, oil and NGL production is forecast to increase 8%, with the majority of growth second-half weighted, offset by an annual decline of ~6% in natural gas production.
Focus on oil, but maintaining gas option. Despite the company’s focus on oil and allowing its natural gas production to decline, there remains future potential for natural gas positions with more than 16 million net acres. As we see continued strength in natural gas prices over the coming year, we believe CNQ is well positioned to expand its liquids-rich gas developments moving forward. We believe investors were quick to punish the company for its gas position and slow to reward potential upside in the same fashion that has been applied to its peers.
Focus 2013 January 2013
141
• Too cheap to ignore. In combination with the upside outlined above, the company is trading at the bottom end of its peer group on forward cash flow and resource multiples as well as well below its historical trading range. We believe that once the presence of wide heavy oil differentials begins to reverse, capital will be deployed on these undervalued assets. From a funds flow perspective, we also believe CNQ will be the biggest beneficiary from an expected approval of the Keystone XL pipeline in 2013.
O U T P E R F O R M E R S – J U N I O R P R O D U C E R S
Paramount Resources Ltd. (Sector Outperform) – Musreau Brings a Step Change – William S. Lee, P.Eng.
• Musreau facility is transformational. Paramount’s 200 mmcf/d Musreau deep-cut facility is expected to be commissioned in the second half of 2013 and will represent a significant transition for the company. Under our estimates, production growth in 2014 will be ~108%, pushing corporate volumes to average ~54,000 boe/d for the year, with cash flow set to increase roughly threefold on account of growth in higher-value liquids production.
• Leverage to gas. In addition to the cash flow bump on account of liquids growth, Paramount’s Musreau facility adds significant natural gas production, resulting in 2014 forecasted production weighted 68% to natural gas, positioning the company to further benefit should gas prices strengthen.
• Growth leading the pack. We like Paramount on account of its peer-leading cash flow and production per share growth potential into 2014. Under 2014 estimates, the company is trading at 5.8x EV/DACF (adjusted for equity and oil sands assets). We believe that Musreau’s potential to triple Paramount’s cash flow (owing to the increasing proportion of production from higher-value liquids) should drive the stock to perform well into 2013.
BlackPearl Resources Inc. (Sector Outperform) – All Eyes on Blackrod – William S. Lee, P.Eng.
• Blackrod financing decision expected in 2013. In our opinion, the Street holds management in high regard and views BlackPearl’s assets positively but an overhang on the stock remains due to the funding uncertainty with its flagship SAGD project, Blackrod (Phase 1 20,000 bbl/d). We believe that a financing strategy will be announced in the coming year and could potentially include a combination of notes and asset sales. Once a clear picture of the project funding is in place, we believe that the stock will respond favourably.
• Mooney brings the near-term growth. With BlackPearl’s Onion asset expected to produce in the 6,000 bbl/d range going forward, we see Mooney as providing near- to medium-term growth via its Phase 1 polymer flood and primary horizontal drilling in Phase 2. Production from the flood has ramped significantly from ~100 bbl/d in May 2011 to current rates in excess of 1,000+ bbl/d. Peak rates of 3,000-4,000 bbl/d should be achievable in 2013 providing a much needed production boost.
• Valuation is attractive. The company trades at 5.6x EV/DACF (2013E, adjusted for contingent resource) versus its peers at 7.3x, which we believe is attractive and offers a good entry point for investors given BlackPearl’s long-term growth potential and high quality asset base.
O U T P E R F O R M E R S – I N T E R M E D I A T E P R O D U C E R S
Baytex Energy Corporation (Sector Outperform) – Thermal Projects to Shoulder 6% CAGR out to 2017 – Patrick Bryden, CFA
• Steady as she goes into 2013, following another solid year of execution. Baytex continues to be one of the most capital efficient names in the business through its heavy oil program and typically targets production growth of 6-10% year over year. The company continues to deliver on its production and budget targets and we would anticipate solid execution to continue in 2013.
Focus 2013 January 2013
142
Good entry point, with current wide differentials on heavy oil. The company moves in concert with heavy oil spreads on Western Canadian Select, which have recently felt pressure due to multiple factors. We are of the view that the heavy differential to WTI is ultimately going to reverse toward the end of 2013, at which point BTE could realize price appreciation. We continue to view commodity pricing and heavy differentials as key risks toward interim volatility in the stock. Baytex is currently trading at 10.1x 2013E EV/DACF versus the peer group at 8.9x EV/DACF. The balance sheet is also in good shape with 2013E D/CF of 1.4x versus 2.4x for the peer group.
Good visibility for growth in 2014 and beyond. Baytex has exceptional growth visibility out to 2017 through its cold multi-lateral program along with the increased use of thermal. Thermal projects in the future include CSS at Cliffdale and Seal, along with an acquired SAGD project at Cold Lake.
Peyto Exploration & Development Corp. (Sector Outperform) – Capital Efficiency, Low Cost Structure, and Exceptional Growth Continue to Impress – Patrick Bryden, CFA
Capital efficiencies remain strong. As shown in our publication The Statsbook, the company has posted top decile onstream capital efficiencies at approximately $17,500/boe/d for the past two years. We view this level of efficiency for organic production additions as highly repeatable for the company in the year ahead based on the geographical concentration of its asset base in the Deep Basin of Alberta, which also affords shareholders strong geological diversification plus significant inventory depth.
Focus on lowest cost producer mantra continues to serve shareholders well. The business remains the lowest cost operator in the sector, with an all-in cash cost structure that is sub-$6/boe. Based on the low cost operations of the company, plus the efficiency of its onstream and reserve additions costs, we view the business as uniquely positioned versus its peers to organically prosper in a $3/mcf AECO price environment, plus the balance sheet and hedge book are well positioned should prices prove weaker than our forecast. Netbacks are also expected to further benefit from the implementation of “cheap cut” facilities that will recover higher percentages of natural gas liquids and enhance the revenues of the company.
Exceptional growth expected to continue based on unmatched execution capabilities. Management has endeavoured to invest relatively aggressively and counter-cyclically such that we see debt and dividend-adjusted production per share growth in 2013 of 35%, which is a growth metric essentially unmatched versus its intermediate peers. From an execution reliability standpoint, Peyto’s projected growth is also notably backed up by 14 sequential quarters of production growth since mid-2009. At our 2013 exit rate, we see annualized cash flow that could comfortably put the company at $3.50 per share of cash flow or better and historically the company has traded at approximately 10x EV/DACF.
Tourmaline Oil Corp. (Sector Outperform) – Premium Gas Producer Delivers Growth – Jason Bouvier, CFA
Emerging northeastern B.C. (NE BC) Montney leader. With ~185 sections of NE BC Montney rights and a second gas plant (50 mmcf/d capacity) expected online in early Q2/13, Tourmaline is poised to increase its volumes from the area to ~30 mboe/d, making it a top five NE BC Montney producer. The company will run a two rig program in the area in 2013, targeting the liquids rich (60 bbl/mmcf) Montney lobes and the delineation of its recently acquired lands. With an impressive cost base (~$3.6 million/well D&C on a recent four well pad at Dawson), operated infrastructure and an extensive inventory, we see Tourmaline’s Montney activity as a key contributor for continued top-tier growth.
Deep Basin moving forward. In 2013, we will see active horizontal drilling on Tourmaline’s extensive Deep Basin land base. The majority of the program will be directed toward Wilrich targets (~40 wells), where Tourmaline has brought a series of impressive wells (IP rates exceeding our 4.8 Bcfe type curve) onstream in recent months. With additional processing capacity from the recent Musreau plant expansion online augmenting the company’s infrastructure network, we believe Tourmaline is well positioned for low cost growth from the area.
Focus 2013 January 2013
143
Premium natural gas producer. Tourmaline’s top decile growth profile (~36% 2013E debt-adjusted per share production growth), low cost structure (~$0.60/mcf operating costs), and healthy balance sheet make it one of the most attractive natural gas names in our universe. Trading at a 2013E EV/DACF multiple of 10.6x (7.6x on 2014 estimates), Tourmaline continues to grow in step with its premium valuation and deliver consistently strong results in the top decile of the industry.
C A N A D I A N E & P – N A M E S W E A R E C A U T I O U S O N
Taking our themes into account, as well as our views on management teams, balance sheets, asset quality, and valuation levels, we are cautious on the following names.
U N D E R P E R F O R M E R – I N T E G R A T E D S / L A R G E C A P S
Imperial Oil Limited (Sector Underperform) – Multiple Erosion from Declining ROCE – Mark Polak, CFA
Fully valued. At 9.3x 2013E EV/DACF, Imperial Oil Limited (IMO) trades at by far the highest multiple among the large caps and we also believe it is fairly valued on a NAV basis.
Declining ROCE expected. We believe the high multiple is due largely to its high return on capital employed (ROCE). However, with the company investing heavily in mining projects with low double digit returns and also in major Syncrude projects with no growth, we expect ROCE to decline in the coming years and in turn lead to a lower multiple.
U N D E R P E R F O R M E R – I N T E R M E D I A T E P R O D U C E R S
Perpetual Energy Inc. (Sector Underperform) – High Financial Leverage and Natural Gas Exposure – Patrick Bryden, CFA
Perpetual’s management team has taken significant strides to reposition its asset base given its historical niche in shallow natural gas in northeast Alberta. We view its “game changer” and “option value” initiatives as positive value-creation opportunities, but we also view its financial leverage at less than 7x D/CF 2013E and exposure to natural gas as key constraints for the business in 2013. The reduced credit capacity displays the company’s financial difficulty in a low gas price environment, which has in turn forced asset sales. For those with a more positive outlook for natural gas prices in the coming 12 months, this company could represent a contrarian call.
Focus 2013 January 2013
144
International E&P – Themes for 2013
E X E C U T I O N T O U N L O C K T H E V A L U E
After a tough couple of years marred by missing production/reserve guidance, political turmoil, and increasing regulatory delays, the International E&P sector has seen a significant decline in overall valuation that we continue to characterize as oversold. That said, the path to see additional multiple accretion on either a cash flow or NAV basis remains highly contingent on companies’ ability to demonstrate production/reserve growth visibility and consistency. As such, we anticipate those companies that are able to execute a lower risk growth strategy (enhanced recovery/infill drilling) as potentially leading the charge in 1H/13, while the higher-impact exploration stories are likely to trade more on a catalyst-to-catalyst basis. While Brent prices continue to see a strong premium to WTI, we remain bullish on the consolidation theme as larger/NOC buyers continue to actively pursue larger resource opportunities.
P R O D U C T I O N A N D R E S E R V E G R O W T H R E M A I N T H E K E Y
One of the leading challenges facing the International E&Ps has been the inconsistency of production/reserves growth and numerous companies unable to achieve annual guidance forecasts. With this in mind, we continue to view those companies offering lower risk growth of 20%-30% per annum through a backlog of discoveries/well locations – for example, TransGlobe Energy Corporation (TGL), Parex Resources Inc. (PXT), and Lundin Petroleum AB (LUP) – as potentially outperforming the higher risk exploration names through 1H/13E. As the market regains confidence and risk aversion reduces, we would look to a select number of more exploration-focused names. The ability to remain within guidance (likely wide ranges for 2013) and show material 2012 reserve growth (released in Q1/13) are likely to play the biggest near-term role in share price performance.
Strong crude prices are expected to drive higher activity levels in 2013, which could imply higher exploration budgets during the year. We look on the market’s general risk aversion as a potential limiting factor in new funds moving to higher-impact exploration drilling and one that could increase exploration volatility around individual catalysts.
R E G I O N A L H O T S P O T S – E A S T A F R I C A – A C T I V I T Y R A M P I N G U P I N 2 0 1 3
East Africa – activity up significantly in 2013. In our view, some of the most prospective and underexplored basins in the world remain situated in sub-Saharan Africa, where the new onshore rift plays and six massive offshore discoveries are leading the way. The early success of such names as Tullow Oil plc and Africa Oil Corp. onshore Kenya in 2012 highlighted the region’s vast potential and a follow-up to success in Uganda. With six sedimentary basins in Kenya, we expect to see a surge in exploration as Anadarko Petroleum Corporation, BG Group, and Total SA drill commitment wells offshore, and Tullow and others continue onshore programs. Furthermore, in 2012 six new deepwater exploration blocks were awarded to Eni SpA, Total, and CAMAC Energy Inc., which plan to acquire seismic and complete geological and geophysical studies.
Independents have thus far led the industry and opened up a variety of new sub-Saharan plays, which also raises the question of the path of new entrants (via consolidation) from a likely long list of potential Asian and major buyers. However, lack of infrastructure and limited exploration in the region could make any sizable acquisitions challenging until further progression is made. With working hydrocarbon systems established, further exploration success offers significant potential for the region and for those companies with established exposure.
Focus 2013 January 2013
145
C O N S O L I D A T I O N W I L D C A R D – K U R D I S T A N A N D C O L O M B I A
We anticipate M&A activity to increase in 2013 as exploration success has delivered material resource potential in areas such as Kurdistan and East Africa. The overarching trend in the Middle East over the last two decades has been one of increased engagement with international oil companies, where the number of licence awards increased dramatically from the mid-1990s. The increase in overall activity, however, has been somewhat limited by numerous political factors and challenging geology (increased well costs), which could ultimately lead to a significant round of M&A. We look at the numerous new /large entrants into Kurdistan, additional exploration success, and the ability to commence and maintain exports as key factors behind the consolidation theme of small to mid-sized players – for example, WesternZagros Resources Ltd. (WZR) and ShaMaran Petroleum Corp. (SNM).
New consolidation trend in Colombia – focus on light oil. We look to areas such as South America for additional consolidation as larger heavy oil players (Pacific Rubiales Energy Corp. [PRE] and Ecopetrol SA [ECP]) are expected to continue to look for light oil supply for diluent purposes. Colombia’s growing competition for light oil in the Llanos Basin is expected to create a new dynamic in the region, one that we see increasing the value of regional light oil producers of more than 20,000 bbl/d. The benefit appears to be twofold: (1) as light oil production becomes more valuable, it could potentially increase the relative margin received on sales and (2) producers that are proximate to significant heavy oil developments (i.e., the Rubiales and Castilla fields) could become takeover targets. Overall, we look at Colombia as offering attractive economics to fund active exploration programs, which could offer material potential for small cap to mid-cap players.
In addition, those names that have struggled to show production and reserve growth, but with balance sheets that have benefited from industry-leading netbacks, could also look to acquire to offset declines. Given the relatively high work programs committed during bid rounds in 2008 and 2009 in regions such as Colombia, we anticipate companies will look to farm out certain interests in blocks where activity has been stalled due to limited financial capacity. The beneficiaries of this are likely to be those regional players with ample cash (potentially opportunity constrained) that could emerge as joint ventures (favoured by small and mid-cap players) or outright acquisitions (by larger independents).
V A L U A T I O N – T R A D I N G B E L O W S T R I P
Our NAV analysis indicates that the International E&Ps continue to trade at a discount value vis-à-vis the long-dated strip. Current long-date forward strip pricing remains above US$85/bbl, with our International E&P universe discounting an implied price of US$83/boe (see Exhibit 1).
With strip pricing hovering above US$85/bbl for 2013E and a potentially tempered pace of global GDP growth for 2013, a significant uplift in commodity prices may not be the clearest path to realizing NAV accretion. As such, we believe year-end reserve updates (Q1/13) will play an increasingly important role in determining reasonable base valuation levels. This, to us, emphasizes the importance of execution and the ability to deliver material production and reserve growth, coupled with some exploration catalyst.
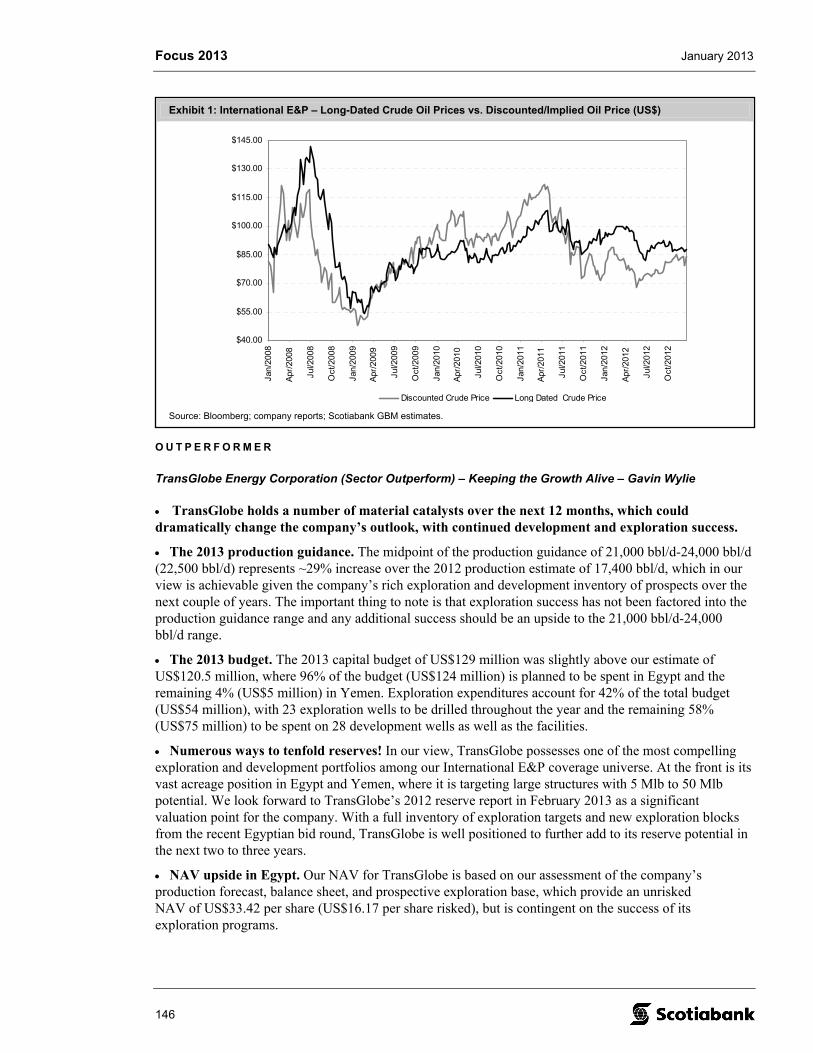
Focus 2013 January 2013
146
Exhibit 1: International E&P – Long-Dated Crude Oil Prices vs. Discounted/Implied Oil Price (US$)
$40.00
$55.00
$70.00
$85.00
$100.00
$115.00
$130.00
$145.00
Jan/
2008
Apr
/200
8
Jul/2
008
Oct
/200
8
Jan/
2009
Apr
/200
9
Jul/2
009
Oct
/200
9
Jan/
2010
Apr
/201
0
Jul/2
010
Oct
/201
0
Jan/
2011
Apr
/201
1
Jul/2
011
Oct
/201
1
Jan/
2012
Apr
/201
2
Jul/2
012
Oct
/201
2
Discounted Crude Price Long Dated Crude Price
Source: Bloomberg; company reports; Scotiabank GBM estimates.
O U T P E R F O R M E R
TransGlobe Energy Corporation (Sector Outperform) – Keeping the Growth Alive – Gavin Wylie
TransGlobe holds a number of material catalysts over the next 12 months, which could dramatically change the company’s outlook, with continued development and exploration success.
The 2013 production guidance. The midpoint of the production guidance of 21,000 bbl/d-24,000 bbl/d (22,500 bbl/d) represents ~29% increase over the 2012 production estimate of 17,400 bbl/d, which in our view is achievable given the company’s rich exploration and development inventory of prospects over the next couple of years. The important thing to note is that exploration success has not been factored into the production guidance range and any additional success should be an upside to the 21,000 bbl/d-24,000 bbl/d range.
The 2013 budget. The 2013 capital budget of US$129 million was slightly above our estimate of US$120.5 million, where 96% of the budget (US$124 million) is planned to be spent in Egypt and the remaining 4% (US$5 million) in Yemen. Exploration expenditures account for 42% of the total budget (US$54 million), with 23 exploration wells to be drilled throughout the year and the remaining 58% (US$75 million) to be spent on 28 development wells as well as the facilities.
Numerous ways to tenfold reserves! In our view, TransGlobe possesses one of the most compelling exploration and development portfolios among our International E&P coverage universe. At the front is its vast acreage position in Egypt and Yemen, where it is targeting large structures with 5 Mlb to 50 Mlb potential. We look forward to TransGlobe’s 2012 reserve report in February 2013 as a significant valuation point for the company. With a full inventory of exploration targets and new exploration blocks from the recent Egyptian bid round, TransGlobe is well positioned to further add to its reserve potential in the next two to three years.
NAV upside in Egypt. Our NAV for TransGlobe is based on our assessment of the company’s production forecast, balance sheet, and prospective exploration base, which provide an unrisked NAV of US$33.42 per share (US$16.17 per share risked), but is contingent on the success of its exploration programs.
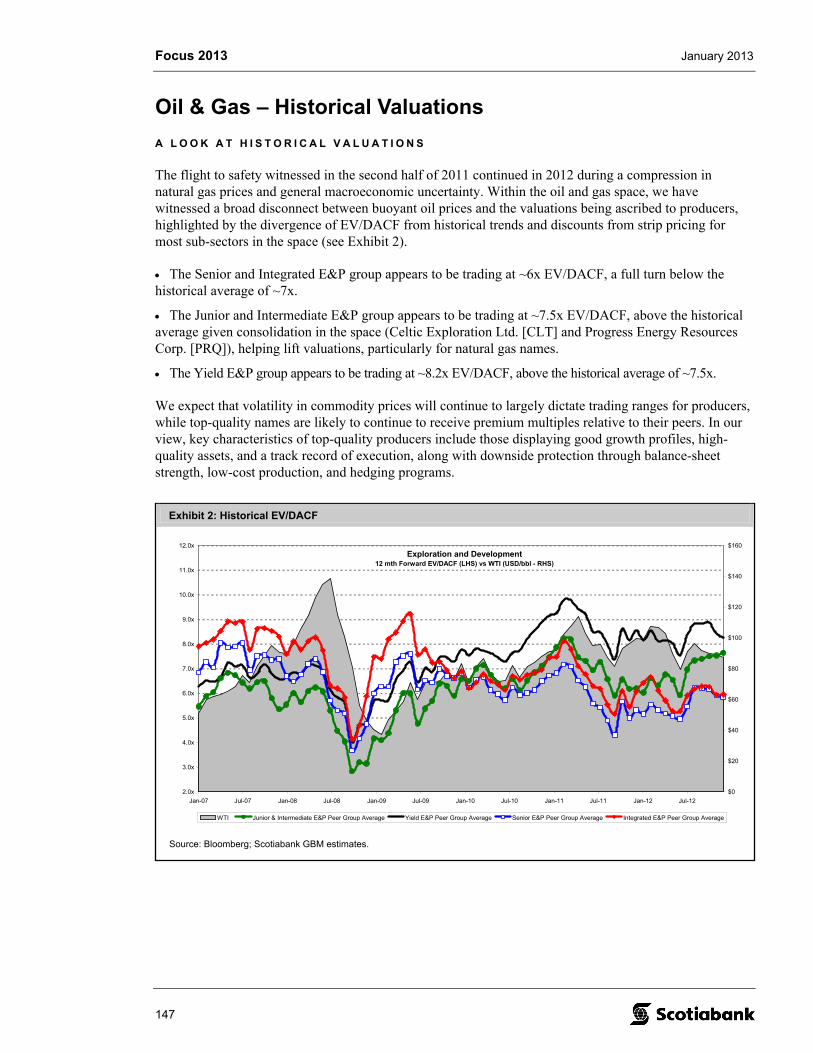
Focus 2013 January 2013
147
Exhibit 2: Historical EV/DACF
Exploration and Development 12 mth Forward EV/DACF (LHS) vs WTI (USD/bbl - RHS)
2.0x
3.0x
4.0x
5.0x
6.0x
7.0x
8.0x
9.0x
10.0x
11.0x
12.0x
Jan-07 Jul-07 Jan-08 Jul-08 Jan-09 Jul-09 Jan-10 Jul-10 Jan-11 Jul-11 Jan-12 Jul-12
$0
$20
$40
$60
$80
$100
$120
$140
$160
WTI Junior & Intermediate E&P Peer Group Average Yield E&P Peer Group Average Senior E&P Peer Group Average Integrated E&P Peer Group Average
Source: Bloomberg; Scotiabank GBM estimates.
Oil & Gas – Historical Valuations
A L O O K A T H I S T O R I C A L V A L U A T I O N S
The flight to safety witnessed in the second half of 2011 continued in 2012 during a compression in natural gas prices and general macroeconomic uncertainty. Within the oil and gas space, we have witnessed a broad disconnect between buoyant oil prices and the valuations being ascribed to producers, highlighted by the divergence of EV/DACF from historical trends and discounts from strip pricing for most sub-sectors in the space (see Exhibit 2).
The Senior and Integrated E&P group appears to be trading at ~6x EV/DACF, a full turn below the historical average of ~7x.
The Junior and Intermediate E&P group appears to be trading at ~7.5x EV/DACF, above the historical average given consolidation in the space (Celtic Exploration Ltd. [CLT] and Progress Energy Resources Corp. [PRQ]), helping lift valuations, particularly for natural gas names.
The Yield E&P group appears to be trading at ~8.2x EV/DACF, above the historical average of ~7.5x.
We expect that volatility in commodity prices will continue to largely dictate trading ranges for producers, while top-quality names are likely to continue to receive premium multiples relative to their peers. In our view, key characteristics of top-quality producers include those displaying good growth profiles, high-quality assets, and a track record of execution, along with downside protection through balance-sheet strength, low-cost production, and hedging programs.
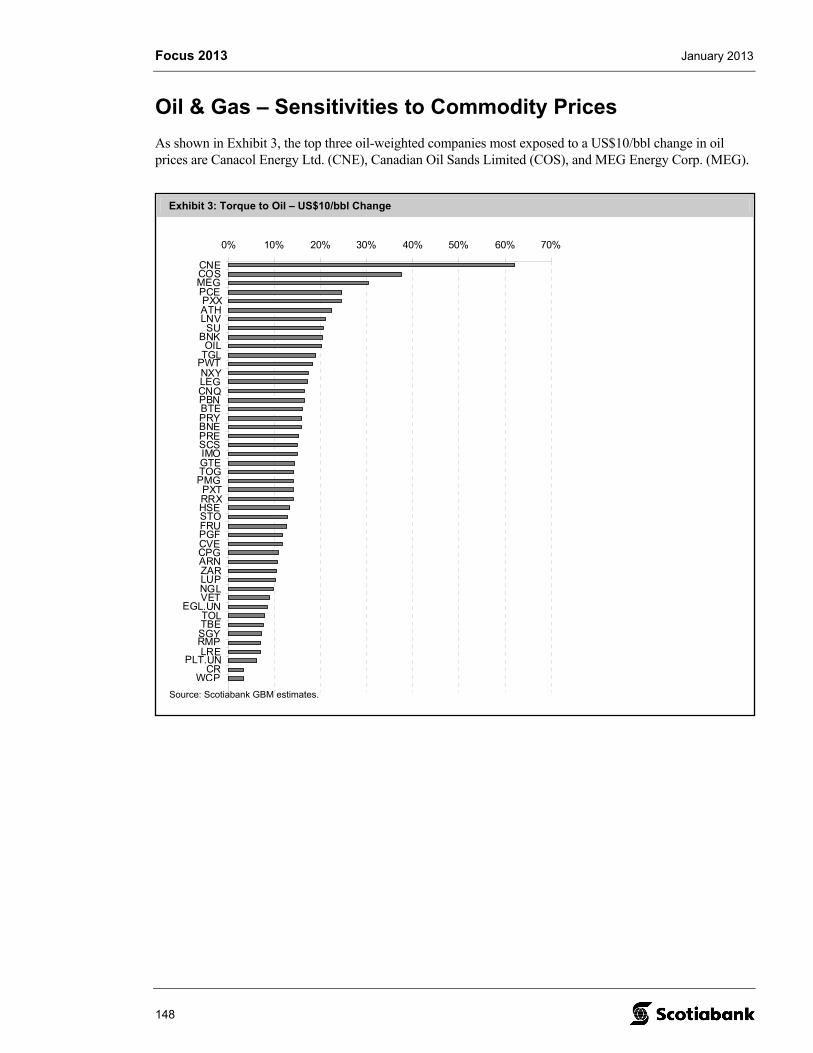
Focus 2013 January 2013
148
Exhibit 3: Torque to Oil – US$10/bbl Change
0% 10% 20% 30% 40% 50% 60% 70%
CNECOSMEGPCEPXXATHLNVSU
BNKOIL
TGLPWTNXYLEGCNQPBNBTEPRYBNEPRESCSIMOGTETOGPMGPXTRRXHSESTOFRUPGFCVECPGARNZARLUPNGLVET
EGL.UNTOLTBESGYRMPLRE
PLT.UNCR
WCP
Source: Scotiabank GBM estimates.
Oil & Gas – Sensitivities to Commodity Prices
As shown in Exhibit 3, the top three oil-weighted companies most exposed to a US$10/bbl change in oil prices are Canacol Energy Ltd. (CNE), Canadian Oil Sands Limited (COS), and MEG Energy Corp. (MEG).
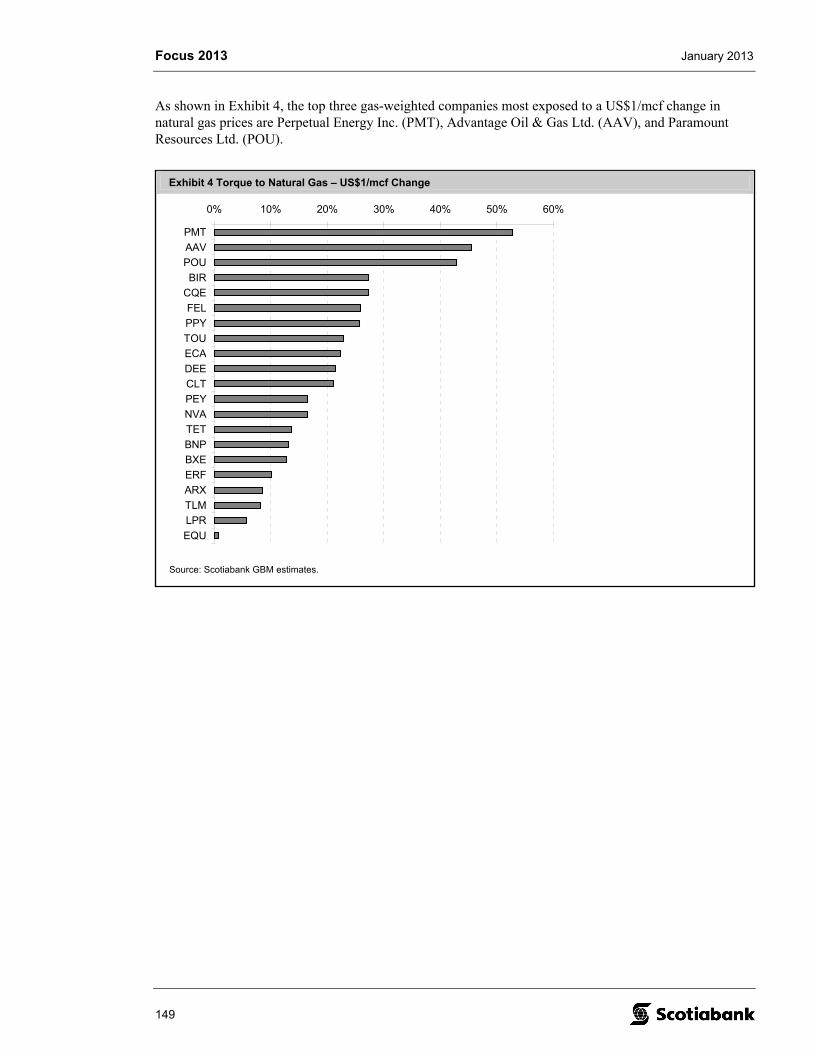
Focus 2013 January 2013
149
Exhibit 4 Torque to Natural Gas – US$1/mcf Change
0% 10% 20% 30% 40% 50% 60%
PMT
AAV
POU
BIR
CQE
FEL
PPY
TOU
ECA
DEE
CLT
PEY
NVA
TET
BNP
BXE
ERF
ARX
TLM
LPR
EQU
Source: Scotiabank GBM estimates.
As shown in Exhibit 4, the top three gas-weighted companies most exposed to a US$1/mcf change in natural gas prices are Perpetual Energy Inc. (PMT), Advantage Oil & Gas Ltd. (AAV), and Paramount Resources Ltd. (POU).
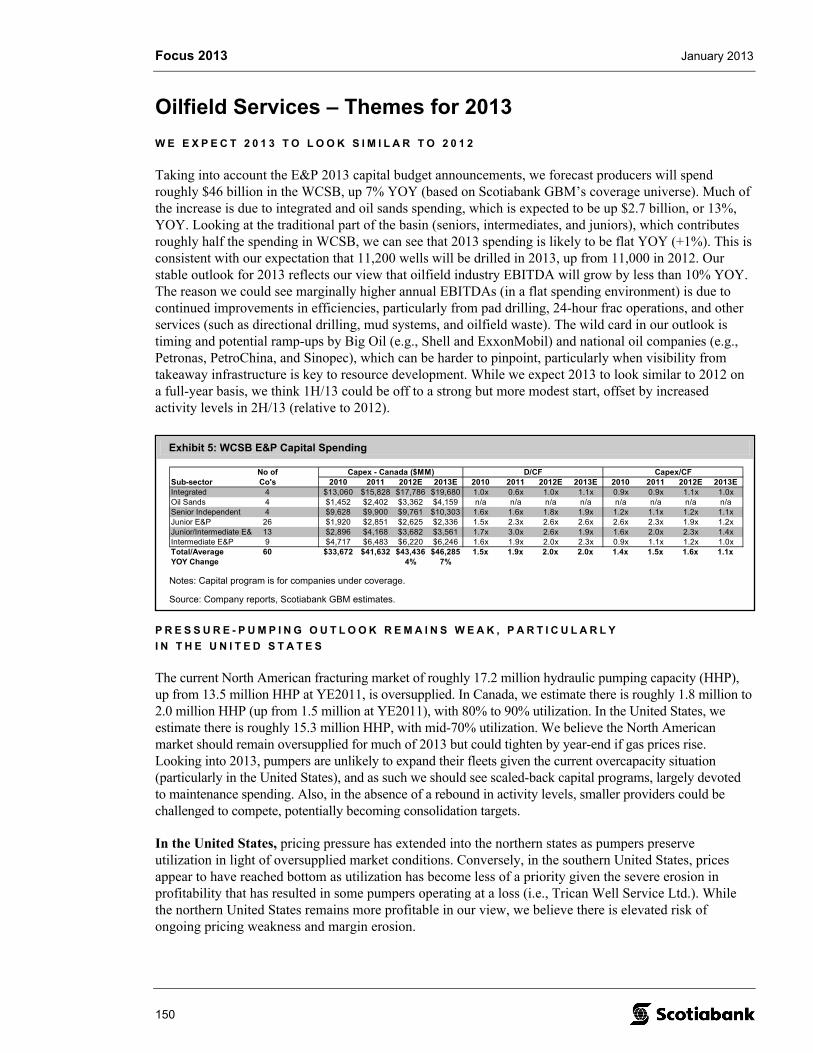
Focus 2013 January 2013
150
Exhibit 5: WCSB E&P Capital Spending
No of Capex - Canada ($MM) D/CF Capex/CFSub-sector Co's 2010 2011 2012E 2013E 2010 2011 2012E 2013E 2010 2011 2012E 2013EIntegrated 4 $13,060 $15,828 $17,786 $19,680 1.0x 0.6x 1.0x 1.1x 0.9x 0.9x 1.1x 1.0xOil Sands 4 $1,452 $2,402 $3,362 $4,159 n/a n/a n/a n/a n/a n/a n/a n/aSenior Independent 4 $9,628 $9,900 $9,761 $10,303 1.6x 1.6x 1.8x 1.9x 1.2x 1.1x 1.2x 1.1xJunior E&P 26 $1,920 $2,851 $2,625 $2,336 1.5x 2.3x 2.6x 2.6x 2.6x 2.3x 1.9x 1.2xJunior/Intermediate E& 13 $2,896 $4,168 $3,682 $3,561 1.7x 3.0x 2.6x 1.9x 1.6x 2.0x 2.3x 1.4xIntermediate E&P 9 $4,717 $6,483 $6,220 $6,246 1.6x 1.9x 2.0x 2.3x 0.9x 1.1x 1.2x 1.0xTotal/Average 60 $33,672 $41,632 $43,436 $46,285 1.5x 1.9x 2.0x 2.0x 1.4x 1.5x 1.6x 1.1xYOY Change 4% 7%
Notes: Capital program is for companies under coverage.
Source: Company reports, Scotiabank GBM estimates.
Oilfield Services – Themes for 2013
W E E X P E C T 2 0 1 3 T O L O O K S I M I L A R T O 2 0 1 2
Taking into account the E&P 2013 capital budget announcements, we forecast producers will spend roughly $46 billion in the WCSB, up 7% YOY (based on Scotiabank GBM’s coverage universe). Much of the increase is due to integrated and oil sands spending, which is expected to be up $2.7 billion, or 13%, YOY. Looking at the traditional part of the basin (seniors, intermediates, and juniors), which contributes roughly half the spending in WCSB, we can see that 2013 spending is likely to be flat YOY (+1%). This is consistent with our expectation that 11,200 wells will be drilled in 2013, up from 11,000 in 2012. Our stable outlook for 2013 reflects our view that oilfield industry EBITDA will grow by less than 10% YOY. The reason we could see marginally higher annual EBITDAs (in a flat spending environment) is due to continued improvements in efficiencies, particularly from pad drilling, 24-hour frac operations, and other services (such as directional drilling, mud systems, and oilfield waste). The wild card in our outlook is timing and potential ramp-ups by Big Oil (e.g., Shell and ExxonMobil) and national oil companies (e.g., Petronas, PetroChina, and Sinopec), which can be harder to pinpoint, particularly when visibility from takeaway infrastructure is key to resource development. While we expect 2013 to look similar to 2012 on a full-year basis, we think 1H/13 could be off to a strong but more modest start, offset by increased activity levels in 2H/13 (relative to 2012).
P R E S S U R E - P U M P I N G O U T L O O K R E M A I N S W E A K , P A R T I C U L A R L Y
I N T H E U N I T E D S T A T E S
The current North American fracturing market of roughly 17.2 million hydraulic pumping capacity (HHP), up from 13.5 million HHP at YE2011, is oversupplied. In Canada, we estimate there is roughly 1.8 million to 2.0 million HHP (up from 1.5 million at YE2011), with 80% to 90% utilization. In the United States, we estimate there is roughly 15.3 million HHP, with mid-70% utilization. We believe the North American market should remain oversupplied for much of 2013 but could tighten by year-end if gas prices rise. Looking into 2013, pumpers are unlikely to expand their fleets given the current overcapacity situation (particularly in the United States), and as such we should see scaled-back capital programs, largely devoted to maintenance spending. Also, in the absence of a rebound in activity levels, smaller providers could be challenged to compete, potentially becoming consolidation targets.
In the United States, pricing pressure has extended into the northern states as pumpers preserve utilization in light of oversupplied market conditions. Conversely, in the southern United States, prices appear to have reached bottom as utilization has become less of a priority given the severe erosion in profitability that has resulted in some pumpers operating at a loss (i.e., Trican Well Service Ltd.). While the northern United States remains more profitable in our view, we believe there is elevated risk of ongoing pricing weakness and margin erosion.
Focus 2013 January 2013
151
In Canada, we have experienced a modest rig count in 2H/12, which is unlikely to result in a material backlog of uncompleted wells to start Q1/13. We expect the rig count to start strong in 2013 (but not as strong as 2012), which could lead to a tight pressure-pumping market by the end of Q1/13. Pricing has essentially plateaued at 10% to 15% below Q1/12 levels, and we expect pricing to remain flat in 1H/13, with upside bias for 2H/13 given the potential for increased joint venture activity and rising gas prices.
D R I L L E R S : F O C U S S H O U L D C O N T I N U E T O B E O N T O P - T I E R F L E E T S
We continue to believe pricing and margins are tied to fleet quality. We expect the Tier 1 rigs (i.e., more than 3,000 metres) to experience relatively stable pricing, while Tier 3 rigs could see price declines (as much as +20% YOY) or be decommissioned in some cases. Despite the optics of the market, unemployment in the service space is essentially zero. As such, we expect utilization to remain strong (i.e., to maintain the labour pool) at the expense of pricing, which should result in lower margins, particularly for sub-Tier 1 drillers. We will be watching for emerging industry trends, including pad rigs (i.e., moving systems), mono-bore drilling, and innovations in power systems (specifically natural gas and bi-fuel engine conversions). We expect the drillers should offer a stable operating environment relative to that of the pumpers in 2013.
E X P E C T I N G M I X E D R E S U L T S F R O M O U R O T H E R O I L F I E L D S E R V I C E S C O M P A N I E S
We expect the outlook for most of the service providers in our coverage universe (i.e., drilling fluids, directional drilling, tank rentals, and compression and processing) to be correlated to drilling activities, which we generally expect to perform in line with the drillers. One of our favourite sub-sectors is the oilfield waste business, which we expect should see stable growth (even in a flat drilling environment) and further consolidation as producers continue to outsource this service and the volume of produced water from existing wells continues to grow. We have a negative bias toward tank rentals as we believe the market is saturated and is likely to see ongoing price declines and margin erosion throughout 2013 (unless gas prices rebound); however, we believe much of this could already be priced into the markets.
Taking our themes into account, as well as our views on management teams, balance sheets, asset quality, and valuation levels, we have selected Secure Energy Services Inc. (SES) and Cathedral Energy Services Ltd. (CET) as our focus picks for 2013. We remain cautious on Trican and GasFrac Energy Services Inc. (GFS).
O U T P E R F O R M E R S
Secure Energy Services Inc. (Focus Stock) – Stability Is Scarce – Vladislav C. Vlad, MBA, P.Eng.
We have upgraded Secure Energy Services Inc. to Focus Stock from Sector Outperform.
Among the most defensive names in the oilfield services industry. Roughly 65% of Secure’s Processing, Recovery, and Disposal division’s revenue can be attributed to produced waste from existing wells, providing insulation from the recent volatility in drilling and completion activity levels. We believe this weighting will continue to grow and provide stability as Secure pursues its growth strategy over the next five years. Taking into account its recently announced 2013 capital budget, we estimate 10 facilities will be added during 2013 (including carryover from 2012).
Upside from the United States, which is a relatively untapped market. Secure acquired two fully operational stand-alone water disposal (SWD) facilities in North Dakota over the summer and plans to add a third by the end of Q4/12. We would not be surprised to see further SWD additions and conversions to full-service terminals (FSTs) in North Dakota (and Colorado) as Secure continues to establish key customer relationships in these growing markets. We believe growth from their Drilling Services operations in the United States is a positive indicator in this respect given the complementary nature of the company’s drilling fluids and waste management business lines.
Focus 2013 January 2013
152
Premium oilfield services valuation warranted. Secure trades at 8.4x 2013E EV/EBITDA versus its waste management and midstream peer group average of 9.6x. We believe midstream companies Gibson Energy Inc. (Sector Perform), Keyera Corp. (Sector Perform), and Pembina Pipeline Corporation (Sector Outperform), covered by Scotiabank GBM analyst Matthew Akman (see the Energy Infrastructure section), provide a better comparison than the oilfield services (OFS) group given that these companies are essentially non-cyclical, infrastructure-based businesses.
Cathedral Energy Services Ltd. (Focus Stock) – Revving Up in 2013 – Vladislav C. Vlad, MBA, P.Eng.
We have upgraded Cathedral Energy Services Ltd. to Focus Stock from Sector Outperform.
Patient investors likely to be rewarded from expanding operations in the United States, cost efficiencies, and potential upside from Venezuela. Weaker-than-expected 2H/12 activity levels delayed the rollout of Cathedral’s proprietary CAT mud motor as the company needed to work through its existing inventory before fully implementing the new systems. We believe improved 2013 activity levels, particularly in the United States, could see 50% to 60% of Cathedral’s CAT fleet rolled out by YE2013. We expect to see evidence of improved margins in 2H/13 and more fully in 2014, when the rollout should be complete. Also, we could see upside from Venezuelan operations in 2013.
Share buybacks provide support. As of early December 2012, Cathedral had repurchased 673,077 shares at an average price of $5.29 per share, largely post-Q3/12. We believe this should remain a base level of support for the stock as management has capacity to purchase another roughly 1.2 million shares up until June 19, 2013 (excluding blackout periods). We continue to believe the stock is oversold at these levels but remain cautious on the potential for soft industry-wide activity levels in Q4/12.
Attractive valuation with a solid dividend yield. Cathedral trades at 3.6x 2013E EV/EBITDA, below our one standard deviation historical trading band of 4.3x to 7.0x. We believe this level of discount is unjustified, particularly since the company also pays an attractive dividend, whose yield (5.3%), in our view, is sustainable despite weakened activity levels.
U N D E R P E R F O R M E R S
Trican Well Service Ltd. (Sector Underperform) – Vladislav C. Vlad, MBA, P.Eng.
U.S. operations likely to continue to be under pressure in 2013. Trican’s operating earnings have been in the red in the United States over the past two quarters, a trend we expect to continue into 2013. While we do anticipate improvement over the course of the year, we believe the market and our peers are being too optimistic in this regard. An improvement in gas and liquids pricing could change our view; however, we note Trican is not leveraged to the Marcellus (and Utica) like some of its peers, implying it would not benefit to the same degree.
High valuation relative to peers. Trican trades at 6.7x 2013E EV/EBITDA versus its North American peer group average of 4.8x. We view the current valuation as expensive and believe markets are pricing in an overly optimistic rebound in U.S. operations for 2013.
GasFrac Energy Services Inc. (Sector Underperform) – Vladislav C. Vlad, MBA, P.Eng.
Looking to new management in 2013; bank facility remains primary concern. The first half of 2013 will be a defining period for GasFrac as it realizes the full impact of the cost-reduction strategies implemented in 2012. In its Q3/12 release, GasFrac noted that it will scale back its operations and focus on key areas in the WCSB, South Texas, and Colorado. While we believe that these moves should result in stronger earnings in 2013, we do not anticipate the company to be on side with its debt covenants until Q2/13. As such, we will look to positive direction from new management (CEO expected in Q1/13) and continued patience on the part of lenders as catalysts for the name.
Focus 2013 January 2013
153
Going concern takes precedent over valuation. GasFrac trades at 4.2x 2013E EV/EBITDA versus its Canadian peer group average of 5.2x. We recommend investors focus on GasFrac’s ability to remain a going concern over current valuation levels. Assuming GasFrac is able to return to covenant compliance, we would view the current valuation attractively. For now, we maintain a cautious stance.
O I L F I E L D S E R V I C E S – K E Y R I S K S
Commodity price risk. Sharp declines in energy prices can cause E&P companies to reduce their capital programs, resulting in lower utilization rates and also lower day rates for oil and gas service providers.
Weather-related risk. In Canada, spring breakup annually curtails field activity during the second quarter, when wet ground conditions make it more difficult to move equipment to the next job site. Sustained rainfall and floods can have a similar effect, regardless of seasonality or geography.
Attracting and maintaining labour. When industry activity declines, service providers are often led to trim costs, usually by laying off skilled workers. After a rebound in energy prices, hiring and training take time, which usually puts service providers in a position of playing catch-up with demand.
Contract risk. Service companies’ use of contracts exposes them to risk from E&P companies reneging on contracts or, the more likely scenario, contract renegotiations in periods of weak industry activity. This can occur when there are notable variances between contract rates and spot market rates, which can be much lower. However, given the recent uptick in industry activity, we view this risk as minimal.
Currency risk. A growing number of service companies carry out their business activities in the United States, and the international segment is also poised to grow in the medium to long term. The hit from the weak U.S. dollar could be two-pronged: first, service companies could be affected by their revenue exposure to the weaker U.S. dollar; second, U.S. producers might shy away from activity in Canada because expenses will be paid in Canadian dollars while revenues may be received in U.S. dollars.
Political risk. While our service companies operate predominantly in North America, which arguably has lower political risk than developing nations, the companies are still subject to tax risk (e.g., tax treatment of income trusts and U.S. partnership structures) and regulatory risk (e.g., Alberta’s royalty structure, suspension of deep-well drilling in the Gulf of Mexico, and shale drilling moratoriums in Quebec, New York, and Pennsylvania). Such risks can occur in any jurisdiction as governments balance public safety and public concerns with maximizing their fair share of revenues. Entering international markets such as Mexico, Colombia, and the United Arab Emirates (UAE) can pose additional risks unique to each region and political environment.
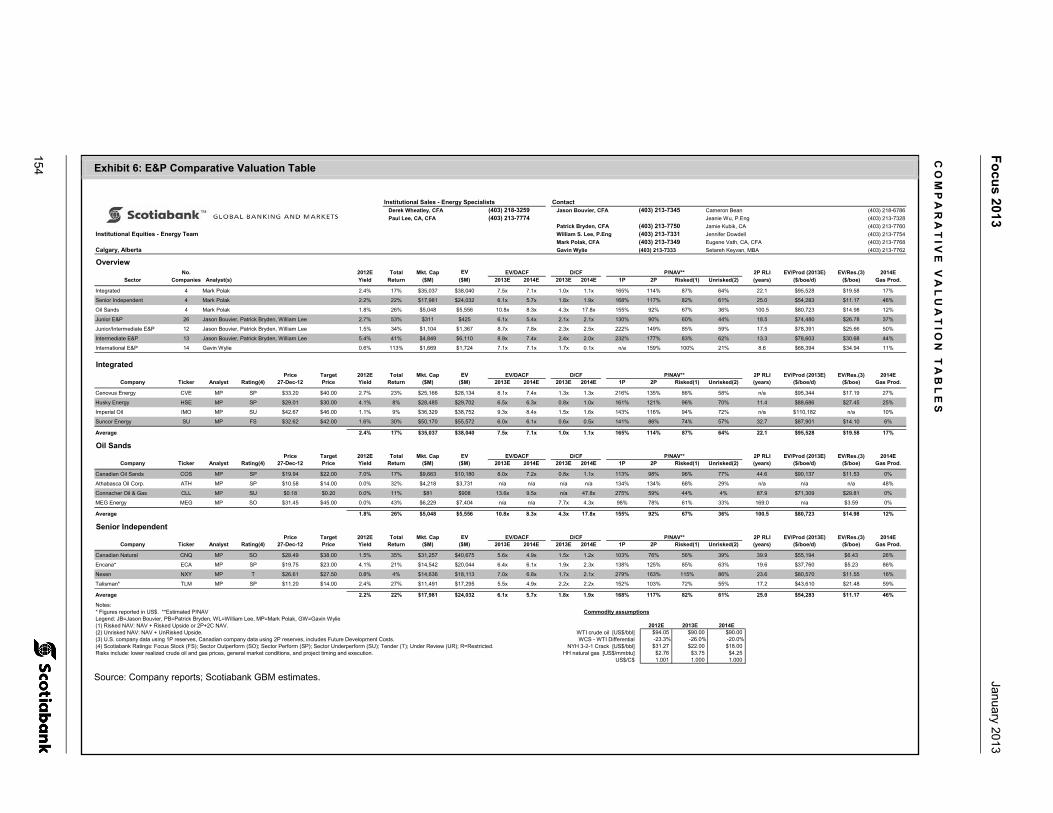
Fo
cus 2013
January 20
13
154 Exhibit 6: E&P Comparative Valuation Table
Institutional Sales - Energy Specialists Contact
Derek Wheatley, CFA (403) 218-3259 Jason Bouvier, CFA (403) 213-7345 Cameron Bean (403) 218-6786
Paul Lee, CA, CFA (403) 213-7774 Jeanie Wu, P.Eng (403) 213-7328
Patrick Bryden, CFA (403) 213-7750 Jamie Kubik, CA (403) 213-7760
Institutional Equities - Energy Team William S. Lee, P.Eng (403) 213-7331 Jennifer Dowdell (403) 213-7754
Mark Polak, CFA (403) 213-7349 Eugene Vath, CA, CFA (403) 213-7768
Calgary, Alberta Gavin Wylie (403) 213-7333 Setareh Keyvan, MBA (403) 213-7762
OverviewNo. 2012E Total Mkt. Cap EV EV/DACF D/CF P/NAV** 2P RLI EV/Prod (2013E) EV/Res.(3) 2014E
Sector Companies Analyst(s) Yield Return ($M) ($M) 2013E 2014E 2013E 2014E 1P 2P Risked(1) Unrisked(2) (years) ($/boe/d) ($/boe) Gas Prod.
Integrated 4 Mark Polak 2.4% 17% $35,037 $38,040 7.5x 7.1x 1.0x 1.1x 165% 114% 87% 64% 22.1 $95,528 $19.58 17%
Senior Independent 4 Mark Polak 2.2% 22% $17,981 $24,032 6.1x 5.7x 1.8x 1.9x 168% 117% 82% 61% 25.0 $54,283 $11.17 46%
Oil Sands 4 Mark Polak 1.8% 26% $5,048 $5,556 10.8x 8.3x 4.3x 17.8x 155% 92% 67% 36% 100.5 $80,723 $14.98 12%
Junior E&P 26 Jason Bouvier, Patrick Bryden, William Lee 2.7% 53% $311 $425 6.1x 5.4x 2.1x 2.1x 130% 90% 60% 44% 18.5 $74,480 $26.78 37%
Junior/Intermediate E&P 12 Jason Bouvier, Patrick Bryden, William Lee 1.5% 34% $1,104 $1,367 8.7x 7.8x 2.3x 2.5x 222% 149% 85% 59% 17.5 $78,391 $25.66 50%
Intermediate E&P 13 Jason Bouvier, Patrick Bryden, William Lee 5.4% 41% $4,849 $6,110 8.9x 7.4x 2.4x 2.0x 232% 177% 83% 62% 13.3 $78,603 $30.68 44%
International E&P 14 Gavin Wylie 0.6% 113% $1,669 $1,724 7.1x 7.1x 1.7x 0.1x n/a 159% 100% 21% 8.6 $68,394 $34.94 11%
IntegratedPrice Target 2012E Total Mkt. Cap EV EV/DACF D/CF P/NAV** 2P RLI EV/Prod (2013E) EV/Res.(3) 2014E
Company Ticker Analyst Rating(4) 27-Dec-12 Price Yield Return ($M) ($M) 2013E 2014E 2013E 2014E 1P 2P Risked(1) Unrisked(2) (years) ($/boe/d) ($/boe) Gas Prod.
Cenovus Energy CVE MP SP $33.20 $40.00 2.7% 23% $25,166 $28,134 8.1x 7.4x 1.3x 1.3x 216% 135% 86% 58% n/a $95,344 $17.19 27%
Husky Energy HSE MP SP $29.01 $30.00 4.1% 8% $28,485 $29,702 6.5x 6.3x 0.8x 1.0x 161% 121% 96% 70% 11.4 $88,686 $27.45 25%
Imperial Oil IMO MP SU $42.67 $46.00 1.1% 9% $36,329 $38,752 9.3x 8.4x 1.5x 1.6x 143% 116% 94% 72% n/a $110,182 n/a 10%
Suncor Energy SU MP FS $32.62 $42.00 1.6% 30% $50,170 $55,572 6.0x 6.1x 0.6x 0.5x 141% 86% 74% 57% 32.7 $87,901 $14.10 6%
Average 2.4% 17% $35,037 $38,040 7.5x 7.1x 1.0x 1.1x 165% 114% 87% 64% 22.1 $95,528 $19.58 17%
Oil SandsPrice Target 2012E Total Mkt. Cap EV EV/DACF D/CF P/NAV** 2P RLI EV/Prod (2013E) EV/Res.(3) 2014E
Company Ticker Analyst Rating(4) 27-Dec-12 Price Yield Return ($M) ($M) 2013E 2014E 2013E 2014E 1P 2P Risked(1) Unrisked(2) (years) ($/boe/d) ($/boe) Gas Prod.
Canadian Oil Sands COS MP SP $19.94 $22.00 7.0% 17% $9,663 $10,180 8.0x 7.2x 0.8x 1.1x 113% 98% 96% 77% 44.6 $90,137 $11.53 0%
Athabasca Oil Corp. ATH MP SP $10.58 $14.00 0.0% 32% $4,218 $3,731 n/a n/a n/a n/a 134% 134% 68% 29% n/a n/a n/a 48%
Connacher Oil & Gas CLL MP SU $0.18 $0.20 0.0% 11% $81 $908 13.6x 9.5x n/a 47.8x 275% 59% 44% 4% 87.9 $71,309 $29.81 0%
MEG Energy MEG MP SO $31.45 $45.00 0.0% 43% $6,229 $7,404 n/a n/a 7.7x 4.3x 98% 78% 61% 33% 169.0 n/a $3.59 0%
Average 1.8% 26% $5,048 $5,556 10.8x 8.3x 4.3x 17.8x 155% 92% 67% 36% 100.5 $80,723 $14.98 12%
Senior IndependentPrice Target 2012E Total Mkt. Cap EV EV/DACF D/CF P/NAV** 2P RLI EV/Prod (2013E) EV/Res.(3) 2014E
Company Ticker Analyst Rating(4) 27-Dec-12 Price Yield Return ($M) ($M) 2013E 2014E 2013E 2014E 1P 2P Risked(1) Unrisked(2) (years) ($/boe/d) ($/boe) Gas Prod.
Canadian Natural CNQ MP SO $28.49 $38.00 1.5% 35% $31,257 $40,675 5.6x 4.9x 1.5x 1.2x 103% 76% 56% 39% 39.9 $55,194 $6.43 26%
Encana* ECA MP SP $19.75 $23.00 4.1% 21% $14,542 $20,044 6.4x 6.1x 1.9x 2.3x 138% 125% 85% 63% 19.6 $37,760 $5.23 86%
Nexen NXY MP T $26.61 $27.50 0.8% 4% $14,636 $18,113 7.0x 6.8x 1.7x 2.1x 279% 163% 115% 86% 23.6 $80,570 $11.55 16%
Talisman* TLM MP SP $11.20 $14.00 2.4% 27% $11,491 $17,295 5.5x 4.9x 2.2x 2.2x 152% 103% 72% 55% 17.2 $43,610 $21.48 59%
Average 2.2% 22% $17,981 $24,032 6.1x 5.7x 1.8x 1.9x 168% 117% 82% 61% 25.0 $54,283 $11.17 46%
Notes:* Figures reported in US$. **Estimated P/NAV Commodity assumptionsLegend: JB=Jason Bouvier, PB=Patrick Bryden, WL=William Lee, MP=Mark Polak, GW=Gavin Wylie(1) Risked NAV: NAV + Risked Upside or 2P+2C NAV. 2012E 2013E 2014E(2) Unrisked NAV: NAV + UnRisked Upside. WTI crude oil [US$/bbl] $94.05 $90.00 $90.00(3) U.S. company data using 1P reserves, Canadian company data using 2P reserves, includes Future Development Costs. WCS - WTI Differential -23.3% -26.0% -20.0%(4) Scotiabank Ratings: Focus Stock (FS); Sector Outperform (SO); Sector Perform (SP); Sector Underperform (SU); Tender (T); Under Review (UR); R=Restricted. NYH 3-2-1 Crack [US$/bbl] $31.27 $22.00 $18.00Risks include: lower realized crude oil and gas prices, general market conditions, and project timing and execution. HH natural gas [US$/mmbtu] $2.76 $3.75 $4.25
US$/C$ 1.001 1.000 1.000
Source: Company reports; Scotiabank GBM estimates.
CO
MP
AR
AT
IVE
VA
LU
AT
ION
TA
BL
ES
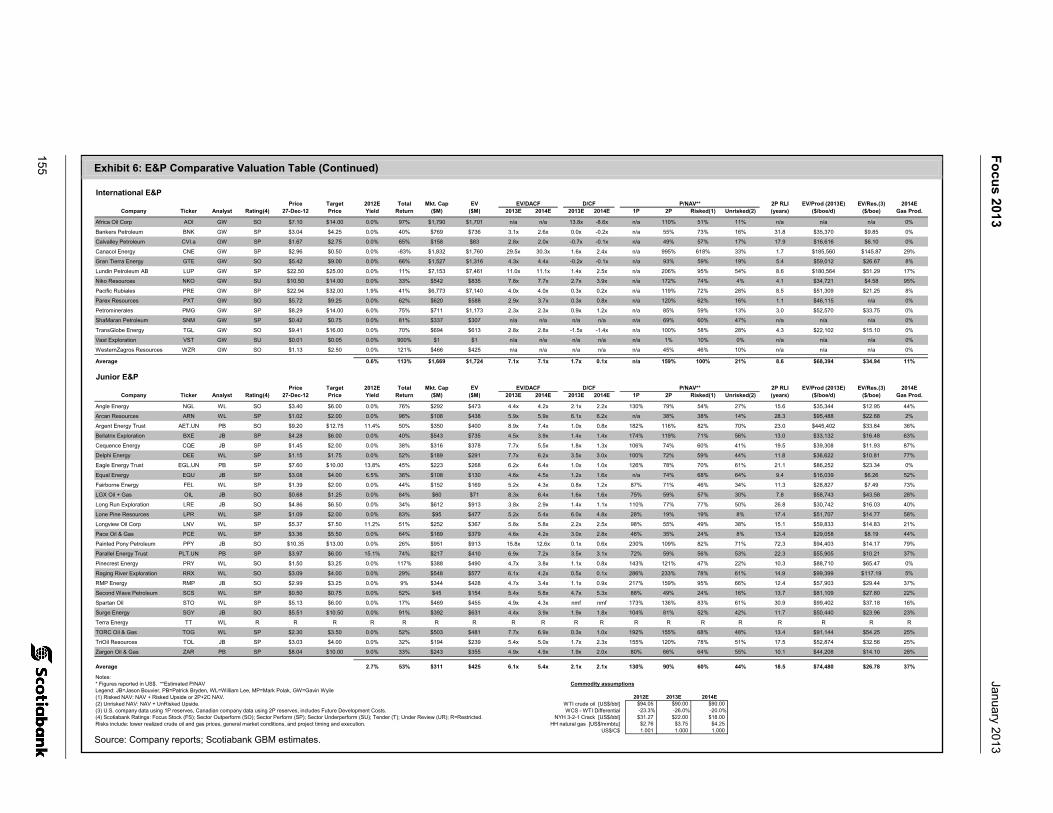
155
Fo
cus 2013
January 20
13
Exhibit 6: E&P Comparative Valuation Table (Continued)
International E&PPrice Target 2012E Total Mkt. Cap EV EV/DACF D/CF P/NAV** 2P RLI EV/Prod (2013E) EV/Res.(3) 2014E
Company Ticker Analyst Rating(4) 27-Dec-12 Price Yield Return ($M) ($M) 2013E 2014E 2013E 2014E 1P 2P Risked(1) Unrisked(2) (years) ($/boe/d) ($/boe) Gas Prod.
Africa Oil Corp AOI GW SO $7.10 $14.00 0.0% 97% $1,790 $1,701 n/a n/a 13.8x -8.6x n/a 110% 51% 11% n/a n/a n/a 0%
Bankers Petroleum BNK GW SP $3.04 $4.25 0.0% 40% $769 $736 3.1x 2.6x 0.0x -0.2x n/a 55% 73% 16% 31.8 $35,370 $9.85 0%
Calvalley Petroleum CVI.a GW SP $1.67 $2.75 0.0% 65% $158 $83 2.8x 2.0x -0.7x -0.1x n/a 49% 57% 17% 17.9 $16,616 $6.10 0%
Canacol Energy CNE GW SP $2.96 $0.50 0.0% -83% $1,832 $1,760 29.5x 30.3x 1.6x 2.4x n/a 995% 618% 33% 1.7 $185,560 $145.87 29%
Gran Tierra Energy GTE GW SO $5.42 $9.00 0.0% 66% $1,527 $1,316 4.3x 4.4x -0.2x -0.1x n/a 93% 59% 19% 5.4 $59,012 $26.67 8%
Lundin Petroleum AB LUP GW SP $22.50 $25.00 0.0% 11% $7,153 $7,461 11.0x 11.1x 1.4x 2.5x n/a 206% 95% 54% 8.6 $180,564 $51.29 17%
Niko Resources NKO GW SU $10.50 $14.00 0.0% 33% $542 $835 7.8x 7.7x 2.7x 3.9x n/a 172% 74% 4% 4.1 $34,721 $4.58 95%
Pacific Rubiales PRE GW SP $22.94 $32.00 1.9% 41% $6,773 $7,140 4.0x 4.0x 0.3x 0.2x n/a 119% 72% 28% 8.5 $51,309 $21.25 8%
Parex Resources PXT GW SO $5.72 $9.25 0.0% 62% $620 $588 2.9x 3.7x 0.3x 0.8x n/a 120% 62% 16% 1.1 $46,115 n/a 0%
Petrominerales PMG GW SP $8.29 $14.00 6.0% 75% $711 $1,173 2.3x 2.3x 0.9x 1.2x n/a 85% 59% 13% 3.0 $52,570 $33.75 0%
ShaMaran Petroleum SNM GW SP $0.42 $0.75 0.0% 81% $337 $307 n/a n/a n/a n/a n/a 69% 60% 47% n/a n/a n/a 0%
TransGlobe Energy TGL GW SO $9.41 $16.00 0.0% 70% $694 $613 2.8x 2.8x -1.5x -1.4x n/a 100% 58% 28% 4.3 $22,102 $15.10 0%
Vast Exploration VST GW SU $0.01 $0.05 0.0% 900% $1 $1 n/a n/a n/a n/a n/a 1% 10% 0% n/a n/a n/a 0%
WesternZagros Resources WZR GW SO $1.13 $2.50 0.0% 121% $466 $425 n/a n/a n/a n/a n/a 45% 46% 10% n/a n/a n/a 0%
Average 0.6% 113% $1,669 $1,724 7.1x 7.1x 1.7x 0.1x n/a 159% 100% 21% 8.6 $68,394 $34.94 11%
Junior E&PPrice Target 2012E Total Mkt. Cap EV EV/DACF D/CF P/NAV** 2P RLI EV/Prod (2013E) EV/Res.(3) 2014E
Company Ticker Analyst Rating(4) 27-Dec-12 Price Yield Return ($M) ($M) 2013E 2014E 2013E 2014E 1P 2P Risked(1) Unrisked(2) (years) ($/boe/d) ($/boe) Gas Prod.
Angle Energy NGL WL SO $3.40 $6.00 0.0% 76% $292 $473 4.4x 4.2x 2.1x 2.2x 130% 79% 54% 27% 15.6 $35,344 $12.95 44%
Arcan Resources ARN WL SP $1.02 $2.00 0.0% 96% $108 $438 5.9x 5.9x 6.1x 6.2x n/a 38% 38% 14% 28.3 $95,488 $22.68 2%
Argent Energy Trust AET.UN PB SO $9.20 $12.75 11.4% 50% $350 $400 8.9x 7.4x 1.0x 0.8x 182% 116% 82% 70% 23.0 $445,402 $33.84 36%
Bellatrix Exploration BXE JB SP $4.28 $6.00 0.0% 40% $543 $735 4.5x 3.9x 1.4x 1.4x 174% 119% 71% 56% 13.0 $33,132 $16.48 63%
Cequence Energy CQE JB SP $1.45 $2.00 0.0% 38% $316 $378 7.7x 5.5x 1.8x 1.3x 106% 74% 60% 41% 19.5 $39,308 $11.93 87%
Delphi Energy DEE WL SP $1.15 $1.75 0.0% 52% $189 $291 7.7x 6.2x 3.5x 3.0x 100% 72% 59% 44% 11.8 $36,622 $10.81 77%
Eagle Energy Trust EGL.UN PB SP $7.60 $10.00 13.8% 45% $223 $268 6.2x 6.4x 1.0x 1.0x 126% 78% 70% 61% 21.1 $86,252 $23.34 0%
Equal Energy EQU JB SP $3.08 $4.00 6.5% 36% $108 $130 4.6x 4.5x 1.2x 1.6x n/a 74% 68% 64% 9.4 $16,039 $6.26 52%
Fairborne Energy FEL WL SP $1.39 $2.00 0.0% 44% $152 $169 5.2x 4.3x 0.8x 1.2x 87% 71% 46% 34% 11.3 $28,827 $7.49 73%
LGX Oil + Gas OIL JB SO $0.68 $1.25 0.0% 84% $60 $71 8.3x 6.4x 1.6x 1.6x 75% 59% 57% 30% 7.8 $58,743 $43.58 28%
Long Run Exploration LRE JB SO $4.86 $6.50 0.0% 34% $612 $913 3.8x 2.9x 1.4x 1.1x 110% 77% 77% 50% 26.8 $30,742 $16.03 40%
Lone Pine Resources LPR WL SP $1.09 $2.00 0.0% 83% $95 $477 5.2x 5.4x 6.0x 4.8x 28% 19% 19% 8% 17.4 $51,707 $14.77 58%
Longview Oil Corp LNV WL SP $5.37 $7.50 11.2% 51% $252 $367 5.8x 5.8x 2.2x 2.5x 98% 55% 49% 38% 15.1 $59,833 $14.83 21%
Pace Oil & Gas PCE WL SP $3.36 $5.50 0.0% 64% $169 $379 4.6x 4.2x 3.0x 2.8x 46% 35% 24% 8% 13.4 $29,058 $8.19 44%
Painted Pony Petroleum PPY JB SO $10.35 $13.00 0.0% 26% $951 $913 15.8x 12.6x 0.1x 0.6x 230% 109% 82% 71% 72.3 $94,403 $14.17 79%
Parallel Energy Trust PLT.UN PB SP $3.97 $6.00 15.1% 74% $217 $410 6.9x 7.2x 3.5x 3.1x 72% 59% 56% 53% 22.3 $55,905 $10.21 37%
Pinecrest Energy PRY WL SO $1.50 $3.25 0.0% 117% $388 $490 4.7x 3.8x 1.1x 0.8x 143% 121% 47% 22% 10.3 $88,710 $65.47 0%
Raging River Exploration RRX WL SO $3.09 $4.00 0.0% 29% $548 $577 6.1x 4.2x 0.5x 0.1x 286% 233% 78% 61% 14.9 $99,399 $117.19 5%
RMP Energy RMP JB SO $2.99 $3.25 0.0% 9% $344 $428 4.7x 3.4x 1.1x 0.9x 217% 159% 95% 66% 12.4 $57,903 $29.44 37%
Second Wave Petroleum SCS WL SP $0.50 $0.75 0.0% 52% $45 $154 5.4x 5.8x 4.7x 5.3x 88% 49% 24% 16% 13.7 $81,109 $27.80 22%
Spartan Oil STO WL SP $5.13 $6.00 0.0% 17% $469 $455 4.9x 4.3x nmf nmf 173% 136% 83% 61% 30.9 $99,402 $37.18 16%
Surge Energy SGY JB SO $5.51 $10.50 0.0% 91% $392 $631 4.4x 3.9x 1.9x 1.8x 104% 81% 52% 42% 11.7 $50,440 $23.96 23%
Terra Energy TT WL R R R R R R R R R R R R R R R R R R R
TORC Oil & Gas TOG WL SP $2.30 $3.50 0.0% 52% $503 $481 7.7x 6.9x 0.3x 1.0x 192% 155% 68% 48% 13.4 $91,144 $54.25 25%
TriOil Resources TOL JB SP $3.03 $4.00 0.0% 32% $194 $239 5.4x 5.0x 1.7x 2.3x 155% 120% 78% 51% 17.5 $52,874 $32.56 25%
Zargon Oil & Gas ZAR PB SP $8.04 $10.00 9.0% 33% $243 $355 4.9x 4.9x 1.9x 2.0x 80% 66% 64% 55% 10.1 $44,208 $14.10 28%
Average 2.7% 53% $311 $425 6.1x 5.4x 2.1x 2.1x 130% 90% 60% 44% 18.5 $74,480 $26.78 37%
Notes:* Figures reported in US$. **Estimated P/NAV Commodity assumptionsLegend: JB=Jason Bouvier, PB=Patrick Bryden, WL=William Lee, MP=Mark Polak, GW=Gavin Wylie(1) Risked NAV: NAV + Risked Upside or 2P+2C NAV. 2012E 2013E 2014E(2) Unrisked NAV: NAV + UnRisked Upside. WTI crude oil [US$/bbl] $94.05 $90.00 $90.00(3) U.S. company data using 1P reserves, Canadian company data using 2P reserves, includes Future Development Costs. WCS - WTI Differential -23.3% -26.0% -20.0%(4) Scotiabank Ratings: Focus Stock (FS); Sector Outperform (SO); Sector Perform (SP); Sector Underperform (SU); Tender (T); Under Review (UR); R=Restricted. NYH 3-2-1 Crack [US$/bbl] $31.27 $22.00 $18.00Risks include: lower realized crude oil and gas prices, general market conditions, and project timing and execution. HH natural gas [US$/mmbtu] $2.76 $3.75 $4.25
US$/C$ 1.001 1.000 1.000 Source: Company reports; Scotiabank GBM estimates.
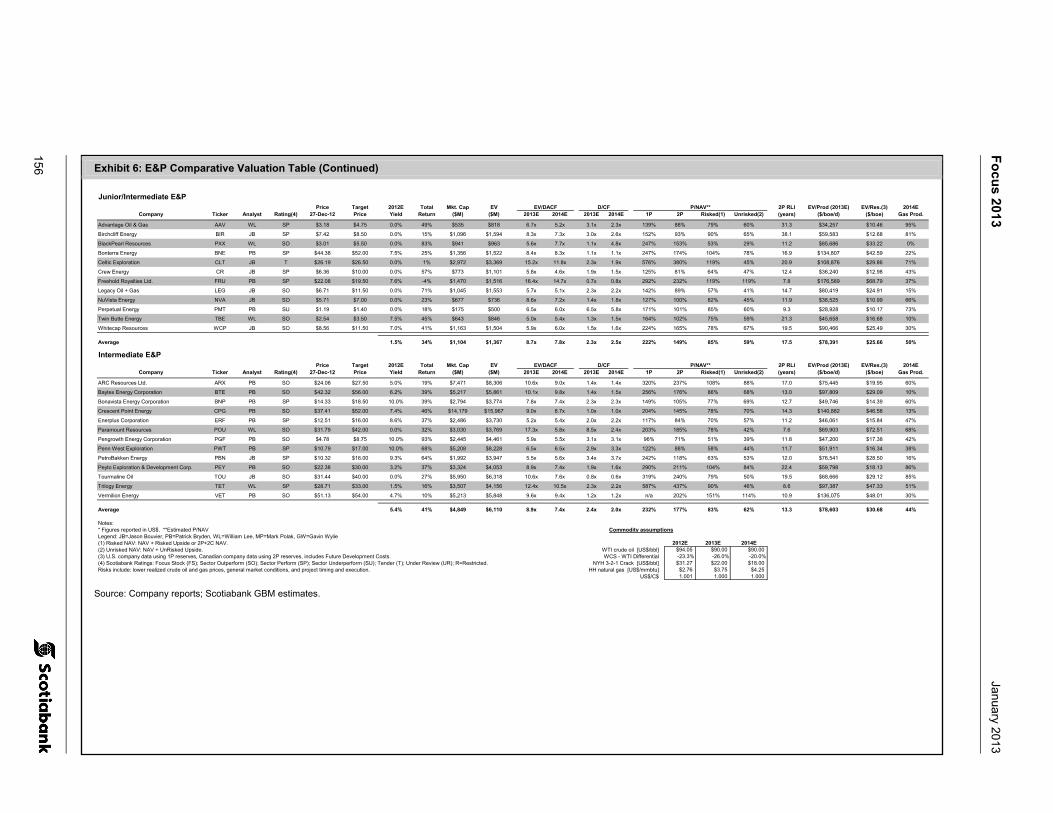
Fo
cus 2013
January 2013
156 Exhibit 6: E&P Comparative Valuation Table (Continued)
Junior/Intermediate E&P Price Target 2012E Total Mkt. Cap EV EV/DACF D/CF P/NAV** 2P RLI EV/Prod (2013E) EV/Res.(3) 2014E
Company Ticker Analyst Rating(4) 27-Dec-12 Price Yield Return ($M) ($M) 2013E 2014E 2013E 2014E 1P 2P Risked(1) Unrisked(2) (years) ($/boe/d) ($/boe) Gas Prod.
Advantage Oil & Gas AAV WL SP $3.18 $4.75 0.0% 49% $535 $818 6.7x 5.2x 3.1x 2.3x 139% 88% 79% 60% 31.3 $34,257 $10.46 95%
Birchcliff Energy BIR JB SP $7.42 $8.50 0.0% 15% $1,096 $1,594 8.3x 7.3x 3.0x 2.6x 152% 93% 90% 65% 38.1 $59,583 $12.68 81%
BlackPearl Resources PXX WL SO $3.01 $5.50 0.0% 83% $941 $963 5.6x 7.7x 1.1x 4.8x 247% 153% 53% 29% 11.2 $85,686 $33.22 0%
Bonterra Energy BNE PB SP $44.38 $52.00 7.5% 25% $1,356 $1,522 8.4x 8.3x 1.1x 1.1x 247% 174% 104% 78% 16.9 $134,807 $42.59 22%
Celtic Exploration CLT JB T $26.19 $26.50 0.0% 1% $2,972 $3,369 15.2x 11.8x 2.3x 1.9x 576% 380% 119% 45% 20.9 $108,876 $29.86 71%
Crew Energy CR JB SP $6.36 $10.00 0.0% 57% $773 $1,101 5.8x 4.6x 1.9x 1.5x 125% 81% 64% 47% 12.4 $36,240 $12.98 43%
Freehold Royalties Ltd. FRU PB SP $22.08 $19.50 7.6% -4% $1,470 $1,516 16.4x 14.7x 0.7x 0.8x 292% 232% 119% 119% 7.8 $176,589 $68.79 37%
Legacy Oil + Gas LEG JB SO $6.71 $11.50 0.0% 71% $1,045 $1,553 5.7x 5.1x 2.3x 2.2x 142% 89% 57% 41% 14.7 $80,419 $24.91 15%
NuVista Energy NVA JB SO $5.71 $7.00 0.0% 23% $677 $736 8.6x 7.2x 1.4x 1.8x 127% 100% 82% 45% 11.9 $38,525 $10.99 66%
Perpetual Energy PMT PB SU $1.19 $1.40 0.0% 18% $175 $500 6.5x 6.0x 6.5x 5.8x 171% 101% 85% 60% 9.3 $28,928 $10.17 73%
Twin Butte Energy TBE WL SO $2.54 $3.50 7.5% 45% $643 $846 5.0x 5.4x 1.3x 1.5x 164% 102% 75% 59% 21.3 $45,658 $16.68 10%
Whitecap Resources WCP JB SO $8.56 $11.50 7.0% 41% $1,163 $1,504 5.9x 6.0x 1.5x 1.6x 224% 165% 78% 67% 19.5 $90,466 $25.49 30%
Average 1.5% 34% $1,104 $1,367 8.7x 7.8x 2.3x 2.5x 222% 149% 85% 59% 17.5 $78,391 $25.66 50%
Intermediate E&P Price Target 2012E Total Mkt. Cap EV EV/DACF D/CF P/NAV** 2P RLI EV/Prod (2013E) EV/Res.(3) 2014E
Company Ticker Analyst Rating(4) 27-Dec-12 Price Yield Return ($M) ($M) 2013E 2014E 2013E 2014E 1P 2P Risked(1) Unrisked(2) (years) ($/boe/d) ($/boe) Gas Prod.
ARC Resources Ltd. ARX PB SO $24.08 $27.50 5.0% 19% $7,471 $8,306 10.6x 9.0x 1.4x 1.4x 320% 237% 108% 88% 17.0 $75,445 $19.95 60%
Baytex Energy Corporation BTE PB SO $42.32 $56.00 6.2% 39% $5,217 $5,861 10.1x 9.8x 1.4x 1.5x 256% 176% 86% 68% 13.0 $97,809 $29.09 10%
Bonavista Energy Corporation BNP PB SP $14.33 $18.50 10.0% 39% $2,794 $3,774 7.8x 7.4x 2.3x 2.3x 149% 105% 77% 69% 12.7 $49,746 $14.39 60%
Crescent Point Energy CPG PB SO $37.41 $52.00 7.4% 46% $14,179 $15,967 9.0x 8.7x 1.0x 1.0x 204% 145% 78% 70% 14.3 $140,882 $46.58 13%
Enerplus Corporation ERF PB SP $12.51 $16.00 8.6% 37% $2,486 $3,730 5.2x 5.4x 2.0x 2.2x 117% 84% 70% 57% 11.2 $46,061 $15.84 47%
Paramount Resources POU WL SO $31.79 $42.00 0.0% 32% $3,030 $3,769 17.3x 5.8x 8.5x 2.4x 203% 185% 78% 42% 7.6 $69,903 $72.51 68%
Pengrowth Energy Corporation PGF PB SO $4.78 $8.75 10.0% 93% $2,445 $4,461 5.9x 5.5x 3.1x 3.1x 96% 71% 51% 39% 11.8 $47,200 $17.38 42%
Penn West Exploration PWT PB SP $10.79 $17.00 10.0% 68% $5,208 $8,228 6.5x 6.5x 2.9x 3.3x 122% 88% 58% 44% 11.7 $51,911 $16.34 38%
PetroBakken Energy PBN JB SP $10.32 $16.00 9.3% 64% $1,992 $3,947 5.5x 5.6x 3.4x 3.7x 242% 118% 63% 53% 12.0 $76,541 $28.50 16%
Peyto Exploration & Development Corp. PEY PB SO $22.38 $30.00 3.2% 37% $3,324 $4,053 8.9x 7.4x 1.9x 1.6x 290% 211% 104% 84% 22.4 $59,798 $18.13 86%
Tourmaline Oil TOU JB SO $31.44 $40.00 0.0% 27% $5,950 $6,318 10.6x 7.6x 0.8x 0.6x 319% 240% 79% 50% 19.5 $68,666 $29.12 85%
Trilogy Energy TET WL SP $28.71 $33.00 1.5% 16% $3,507 $4,156 12.4x 10.5x 2.3x 2.2x 587% 437% 90% 46% 8.6 $97,387 $47.33 51%
Vermilion Energy VET PB SO $51.13 $54.00 4.7% 10% $5,213 $5,848 9.6x 9.4x 1.2x 1.2x n/a 202% 151% 114% 10.9 $136,075 $48.01 30%
Average 5.4% 41% $4,849 $6,110 8.9x 7.4x 2.4x 2.0x 232% 177% 83% 62% 13.3 $78,603 $30.68 44%
Notes:* Figures reported in US$. **Estimated P/NAV Commodity assumptionsLegend: JB=Jason Bouvier, PB=Patrick Bryden, WL=William Lee, MP=Mark Polak, GW=Gavin Wylie(1) Risked NAV: NAV + Risked Upside or 2P+2C NAV. 2012E 2013E 2014E(2) Unrisked NAV: NAV + UnRisked Upside. WTI crude oil [US$/bbl] $94.05 $90.00 $90.00(3) U.S. company data using 1P reserves, Canadian company data using 2P reserves, includes Future Development Costs. WCS - WTI Differential -23.3% -26.0% -20.0%(4) Scotiabank Ratings: Focus Stock (FS); Sector Outperform (SO); Sector Perform (SP); Sector Underperform (SU); Tender (T); Under Review (UR); R=Restricted. NYH 3-2-1 Crack [US$/bbl] $31.27 $22.00 $18.00Risks include: lower realized crude oil and gas prices, general market conditions, and project timing and execution. HH natural gas [US$/mmbtu] $2.76 $3.75 $4.25
US$/C$ 1.001 1.000 1.000
Source: Company reports; Scotiabank GBM estimates.
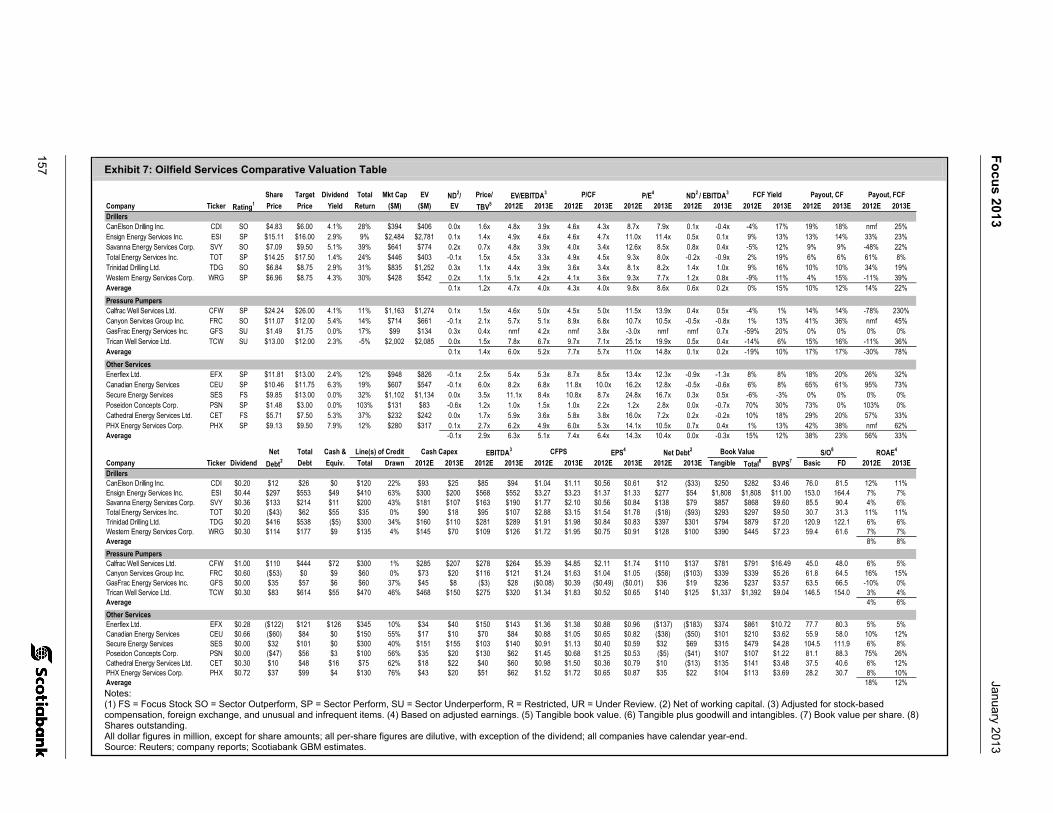
157
Fo
cus 2013
January 2013
Exhibit 7: Oilfield Services Comparative Valuation Table
Share Target Dividend Total Mkt Cap EV ND2/ Price/ EV/EBITDA3 P/CF P/E4 ND2 / EBITDA3 FCF Yield Payout, CF Payout, FCFCompany Ticker Rating1 Price Price Yield Return ($M) ($M) EV TBV5 2012E 2013E 2012E 2013E 2012E 2013E 2012E 2013E 2012E 2013E 2012E 2013E 2012E 2013EDrillersCanElson Drilling Inc. CDI SO $4.83 $6.00 4.1% 28% $394 $406 0.0x 1.6x 4.8x 3.9x 4.6x 4.3x 8.7x 7.9x 0.1x -0.4x -4% 17% 19% 18% nmf 25%Ensign Energy Services Inc. ESI SP $15.11 $16.00 2.9% 9% $2,484 $2,781 0.1x 1.4x 4.9x 4.6x 4.6x 4.7x 11.0x 11.4x 0.5x 0.1x 9% 13% 13% 14% 33% 23%Savanna Energy Services Corp. SVY SO $7.09 $9.50 5.1% 39% $641 $774 0.2x 0.7x 4.8x 3.9x 4.0x 3.4x 12.6x 8.5x 0.8x 0.4x -5% 12% 9% 9% -48% 22%Total Energy Services Inc. TOT SP $14.25 $17.50 1.4% 24% $446 $403 -0.1x 1.5x 4.5x 3.3x 4.9x 4.5x 9.3x 8.0x -0.2x -0.9x 2% 19% 6% 6% 61% 8%Trinidad Drilling Ltd. TDG SO $6.84 $8.75 2.9% 31% $835 $1,252 0.3x 1.1x 4.4x 3.9x 3.6x 3.4x 8.1x 8.2x 1.4x 1.0x 9% 16% 10% 10% 34% 19%Western Energy Services Corp. WRG SP $6.96 $8.75 4.3% 30% $428 $542 0.2x 1.1x 5.1x 4.2x 4.1x 3.6x 9.3x 7.7x 1.2x 0.8x -9% 11% 4% 15% -11% 39%Average 0.1x 1.2x 4.7x 4.0x 4.3x 4.0x 9.8x 8.6x 0.6x 0.2x 0% 15% 10% 12% 14% 22%Pressure PumpersCalfrac Well Services Ltd. CFW SP $24.24 $26.00 4.1% 11% $1,163 $1,274 0.1x 1.5x 4.6x 5.0x 4.5x 5.0x 11.5x 13.9x 0.4x 0.5x -4% 1% 14% 14% -78% 230%Canyon Services Group Inc. FRC SO $11.07 $12.00 5.4% 14% $714 $661 -0.1x 2.1x 5.7x 5.1x 8.9x 6.8x 10.7x 10.5x -0.5x -0.8x 1% 13% 41% 36% nmf 45%GasFrac Energy Services Inc. GFS SU $1.49 $1.75 0.0% 17% $99 $134 0.3x 0.4x nmf 4.2x nmf 3.8x -3.0x nmf nmf 0.7x -59% 20% 0% 0% 0% 0%Trican Well Service Ltd. TCW SU $13.00 $12.00 2.3% -5% $2,002 $2,085 0.0x 1.5x 7.8x 6.7x 9.7x 7.1x 25.1x 19.9x 0.5x 0.4x -14% 6% 15% 16% -11% 36%Average 0.1x 1.4x 6.0x 5.2x 7.7x 5.7x 11.0x 14.8x 0.1x 0.2x -19% 10% 17% 17% -30% 78%Other ServicesEnerflex Ltd. EFX SP $11.81 $13.00 2.4% 12% $948 $826 -0.1x 2.5x 5.4x 5.3x 8.7x 8.5x 13.4x 12.3x -0.9x -1.3x 8% 8% 18% 20% 26% 32%Canadian Energy Services CEU SP $10.46 $11.75 6.3% 19% $607 $547 -0.1x 6.0x 8.2x 6.8x 11.8x 10.0x 16.2x 12.8x -0.5x -0.6x 6% 8% 65% 61% 95% 73%Secure Energy Services SES FS $9.85 $13.00 0.0% 32% $1,102 $1,134 0.0x 3.5x 11.1x 8.4x 10.8x 8.7x 24.8x 16.7x 0.3x 0.5x -6% -3% 0% 0% 0% 0%Poseidon Concepts Corp. PSN SP $1.48 $3.00 0.0% 103% $131 $83 -0.6x 1.2x 1.0x 1.5x 1.0x 2.2x 1.2x 2.8x 0.0x -0.7x 70% 30% 73% 0% 103% 0%Cathedral Energy Services Ltd. CET FS $5.71 $7.50 5.3% 37% $232 $242 0.0x 1.7x 5.9x 3.6x 5.8x 3.8x 16.0x 7.2x 0.2x -0.2x 10% 18% 29% 20% 57% 33%PHX Energy Services Corp. PHX SP $9.13 $9.50 7.9% 12% $280 $317 0.1x 2.7x 6.2x 4.9x 6.0x 5.3x 14.1x 10.5x 0.7x 0.4x 1% 13% 42% 38% nmf 62%Average -0.1x 2.9x 6.3x 5.1x 7.4x 6.4x 14.3x 10.4x 0.0x -0.3x 15% 12% 38% 23% 56% 33%
Net Total Cash & Line(s) of Credit Cash Capex EBITDA3 CFPS EPS4 Net Debt2 Book Value S/O8 ROAE4
Company Ticker Dividend Debt2 Debt Equiv. Total Drawn 2012E 2013E 2012E 2013E 2012E 2013E 2012E 2013E 2012E 2013E Tangible Total6 BVPS7 Basic FD 2012E 2013EDrillersCanElson Drilling Inc. CDI $0.20 $12 $26 $0 $120 22% $93 $25 $85 $94 $1.04 $1.11 $0.56 $0.61 $12 ($33) $250 $282 $3.46 76.0 81.5 12% 11%Ensign Energy Services Inc. ESI $0.44 $297 $553 $49 $410 63% $300 $200 $568 $552 $3.27 $3.23 $1.37 $1.33 $277 $54 $1,808 $1,808 $11.00 153.0 164.4 7% 7%Savanna Energy Services Corp. SVY $0.36 $133 $214 $11 $200 43% $181 $107 $163 $190 $1.77 $2.10 $0.56 $0.84 $138 $79 $857 $868 $9.60 85.5 90.4 4% 6%Total Energy Services Inc. TOT $0.20 ($43) $62 $55 $35 0% $90 $18 $95 $107 $2.88 $3.15 $1.54 $1.78 ($18) ($93) $293 $297 $9.50 30.7 31.3 11% 11%Trinidad Drilling Ltd. TDG $0.20 $416 $538 ($5) $300 34% $160 $110 $281 $289 $1.91 $1.98 $0.84 $0.83 $397 $301 $794 $879 $7.20 120.9 122.1 6% 6%Western Energy Services Corp. WRG $0.30 $114 $177 $9 $135 4% $145 $70 $109 $126 $1.72 $1.95 $0.75 $0.91 $128 $100 $390 $445 $7.23 59.4 61.6 7% 7%Average 8% 8%Pressure PumpersCalfrac Well Services Ltd. CFW $1.00 $110 $444 $72 $300 1% $285 $207 $278 $264 $5.39 $4.85 $2.11 $1.74 $110 $137 $781 $791 $16.49 45.0 48.0 6% 5%Canyon Services Group Inc. FRC $0.60 ($53) $0 $9 $60 0% $73 $20 $116 $121 $1.24 $1.63 $1.04 $1.05 ($58) ($103) $339 $339 $5.26 61.8 64.5 16% 15%GasFrac Energy Services Inc. GFS $0.00 $35 $57 $6 $60 37% $45 $8 ($3) $28 ($0.08) $0.39 ($0.49) ($0.01) $36 $19 $236 $237 $3.57 63.5 66.5 -10% 0%Trican Well Service Ltd. TCW $0.30 $83 $614 $55 $470 46% $468 $150 $275 $320 $1.34 $1.83 $0.52 $0.65 $140 $125 $1,337 $1,392 $9.04 146.5 154.0 3% 4%Average 4% 6%Other ServicesEnerflex Ltd. EFX $0.28 ($122) $121 $126 $345 10% $34 $40 $150 $143 $1.36 $1.38 $0.88 $0.96 ($137) ($183) $374 $861 $10.72 77.7 80.3 5% 5%Canadian Energy Services CEU $0.66 ($60) $84 $0 $150 55% $17 $10 $70 $84 $0.88 $1.05 $0.65 $0.82 ($38) ($50) $101 $210 $3.62 55.9 58.0 10% 12%Secure Energy Services SES $0.00 $32 $101 $0 $300 40% $151 $155 $103 $140 $0.91 $1.13 $0.40 $0.59 $32 $69 $315 $479 $4.28 104.5 111.9 6% 8%Poseidon Concepts Corp. PSN $0.00 ($47) $56 $3 $100 56% $35 $20 $130 $62 $1.45 $0.68 $1.25 $0.53 ($5) ($41) $107 $107 $1.22 81.1 88.3 75% 26%Cathedral Energy Services Ltd. CET $0.30 $10 $48 $16 $75 62% $18 $22 $40 $60 $0.98 $1.50 $0.36 $0.79 $10 ($13) $135 $141 $3.48 37.5 40.6 6% 12%PHX Energy Services Corp. PHX $0.72 $37 $99 $4 $130 76% $43 $20 $51 $62 $1.52 $1.72 $0.65 $0.87 $35 $22 $104 $113 $3.69 28.2 30.7 8% 10%Average 18% 12% Notes: (1) FS = Focus Stock SO = Sector Outperform, SP = Sector Perform, SU = Sector Underperform, R = Restricted, UR = Under Review. (2) Net of working capital. (3) Adjusted for stock-based compensation, foreign exchange, and unusual and infrequent items. (4) Based on adjusted earnings. (5) Tangible book value. (6) Tangible plus goodwill and intangibles. (7) Book value per share. (8) Shares outstanding. All dollar figures in million, except for share amounts; all per-share figures are dilutive, with exception of the dividend; all companies have calendar year-end. Source: Reuters; company reports; Scotiabank GBM estimates.

Focus 2013 January 2013
158
T H I S P A G E L E F T I N T E N T I O N A L L Y B L A N K .
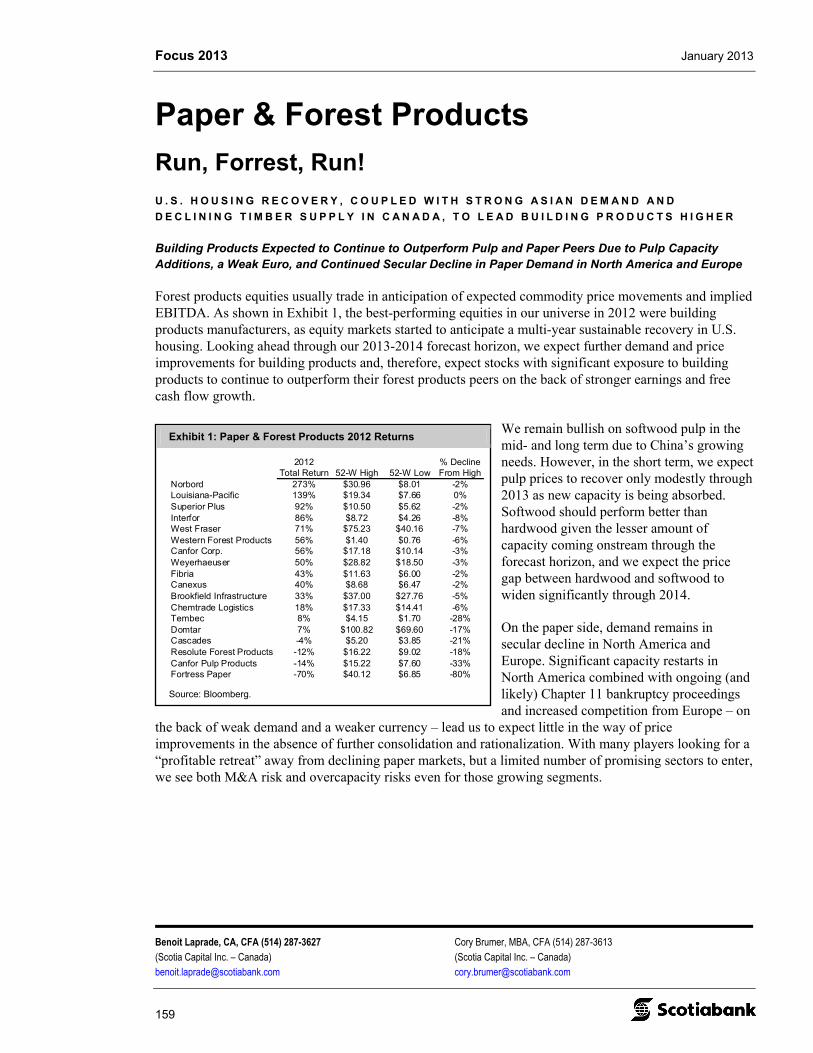
Focus 2013 January 2013
Benoit Laprade, CA, CFA (514) 287-3627 Cory Brumer, MBA, CFA (514) 287-3613 (Scotia Capital Inc. – Canada) (Scotia Capital Inc. – Canada) [email protected] [email protected]
159
Exhibit 1: Paper & Forest Products 2012 Returns
2012 % DeclineTotal Return 52-W High 52-W Low From High
Norbord 273% $30.96 $8.01 -2%Louisiana-Pacific 139% $19.34 $7.66 0%Superior Plus 92% $10.50 $5.62 -2%Interfor 86% $8.72 $4.26 -8%West Fraser 71% $75.23 $40.16 -7%Western Forest Products 56% $1.40 $0.76 -6%Canfor Corp. 56% $17.18 $10.14 -3%Weyerhaeuser 50% $28.82 $18.50 -3%Fibria 43% $11.63 $6.00 -2%Canexus 40% $8.68 $6.47 -2%Brookfield Infrastructure 33% $37.00 $27.76 -5%Chemtrade Logistics 18% $17.33 $14.41 -6%Tembec 8% $4.15 $1.70 -28%Domtar 7% $100.82 $69.60 -17%Cascades -4% $5.20 $3.85 -21%Resolute Forest Products -12% $16.22 $9.02 -18%Canfor Pulp Products -14% $15.22 $7.60 -33%Fortress Paper -70% $40.12 $6.85 -80%
Source: Bloomberg.
Paper & Forest Products
Run, Forrest, Run!
U . S . H O U S I N G R E C O V E R Y , C O U P L E D W I T H S T R O N G A S I A N D E M A N D A N D
D E C L I N I N G T I M B E R S U P P L Y I N C A N A D A , T O L E A D B U I L D I N G P R O D U C T S H I G H E R
Building Products Expected to Continue to Outperform Pulp and Paper Peers Due to Pulp Capacity Additions, a Weak Euro, and Continued Secular Decline in Paper Demand in North America and Europe
Forest products equities usually trade in anticipation of expected commodity price movements and implied EBITDA. As shown in Exhibit 1, the best-performing equities in our universe in 2012 were building products manufacturers, as equity markets started to anticipate a multi-year sustainable recovery in U.S. housing. Looking ahead through our 2013-2014 forecast horizon, we expect further demand and price improvements for building products and, therefore, expect stocks with significant exposure to building products to continue to outperform their forest products peers on the back of stronger earnings and free cash flow growth.
We remain bullish on softwood pulp in the mid- and long term due to China’s growing needs. However, in the short term, we expect pulp prices to recover only modestly through 2013 as new capacity is being absorbed. Softwood should perform better than hardwood given the lesser amount of capacity coming onstream through the forecast horizon, and we expect the price gap between hardwood and softwood to widen significantly through 2014.
On the paper side, demand remains in secular decline in North America and Europe. Significant capacity restarts in North America combined with ongoing (and likely) Chapter 11 bankruptcy proceedings and increased competition from Europe – on
the back of weak demand and a weaker currency – lead us to expect little in the way of price improvements in the absence of further consolidation and rationalization. With many players looking for a “profitable retreat” away from declining paper markets, but a limited number of promising sectors to enter, we see both M&A risk and overcapacity risks even for those growing segments.
Focus 2013 January 2013
160
U.S. Housing Starts Expected to Revert to 1.4 Million Units in the Next Few Years
According to average estimates, U.S. housing starts increased by about 24% in 2012, and should rise by about 21% to 913,000 units in 2013 and 31% to 1.193 million units in 2014. U.S. starts should continue to climb thereafter back to the long-term underlying demand trend of about 1.4 million homes. With net household formations averaging in excess of 1.1 million per annum, and with an average of about 300,000 homes lost to demolition, fires, and other natural disasters, underlying long-term demand should go back up to 1.4 million-plus starts in the next several years.
We expect the combination of record-low inventory of new unsold homes, falling inventory of unsold existing homes, declining foreclosures, very high affordability, a reversal in the number of shared households – which grew by 2.25 million between 2007 and 2010 – and rebounding home prices (likely to bring those waiting on the sidelines back into the action) to yield solid gains in U.S. housing starts in the coming years, with a peak likely occurring in the next three to five years, just as British Columbia’s timber supply is expected to drop significantly.
Asian Demand Expected to Remain Strong
Shipments to China are expected to remain significantly higher than they were in the last cycle (in 2011 they were the equivalent of more than 250,000 U.S. starts), especially for Canadian producers facing an export tax on shipments to the United States and for B.C. producers dealing with a higher proportion of lower-value items due to the amount of beetle-killed timber processed.
Moreover, Japan is finally showing signs of a pickup in demand for reconstruction of areas destroyed by the 2011 earthquake and tsunami. Japanese starts were up 13% month over month in October 2012, reaching the highest level since October 2008.
Declining Timber Availability in Canada
While Quebec’s annual allowable cut (AAC) is down about 24% from its 2005 level, it is expected to drop by another 12% in 2013, which, combined with a declining pulp and paper industry needing fewer residual chips, will likely limit the province’s ability to increase production even as demand increases.
In British Columbia, we expect AAC to drop by more than 25% sometime over the next three to five years, as about 80% of the lodgepole pine resource is expected to be dead by 2020.
Consolidation Could Accelerate – Solid Balance Sheets in Early Innings of Multi-year Recovery
We expect companies with building products exposure to generate significant free cash flow over the 2013-2014 forecast horizon. Given the already strong balance sheets, in most cases we expect a significant increase either in the amount of capital returned to shareholders though dividends and/or share repurchases or in the number of growth projects (mainly through acquisitions).
We are firm believers that further consolidation is desirable in the North American (Canadian, in particular) forest products industry. Industry leaders remain relatively small in terms of market capitalization, which impacts their access to, and cost of, capital. The expected drop in timber availability in British Columbia in the not-too-distant future could be one of the catalysts for building products consolidation.
Focus 2013 January 2013
161
We strongly believe that the creation of a domestic champion enjoying a large(r) market capitalization and enhanced trading liquidity, while paying an attractive and sustainable dividend, would become the “go-to” name in the sector and could be a significant component of major indices. For paper producers, the closure of unnecessary production capacity is also an incentive for consolidation and rationalization, but most players appear to look beyond their traditional – in most cases, declining – segments, aiming for a profitable retreat from declining markets into more stable and growing markets.
Timber Prices the Key Known Unknown
While it is difficult to imagine a scenario in which building product demand and prices would not increase significantly over the coming years, one of the wild cards, in terms of implied profitability, remains timber pricing. In British Columbia, stumpages have been trending down significantly as a percentage of lumber prices over the last several years due to the low-priced beetle-killed wood. However, the province’s new auction-based stumpage system was introduced in 2007 and, therefore, has never been “tested” in a very strong demand and pricing environment. In the U.S. South, a growing fibre basket – timber volumes harvested have been less than natural growth every year for the last six years or so – could mean less value being captured by the landowners than in previous cycles. In the U.S. Pacific Northwest, log prices have been more volatile than in the U.S. South or British Columbia, impacted by growing domestic demand at times exacerbated by strong demand from Asia. However, timber prices may be volatile and have a significant impact on profitability.
Capacity restarts, primarily in building products and paper, could have a temporary impact on prices; while European imports, supported by a weak euro, could also impact trade flows and prices.
Persistent low interest rates – and discount rates – are translating into significant pension plan solvency issues for many defined benefit pension plans, which could require significant cash contributions in the near future.
Valuation – Reflecting Positive Outlook for Housing
While they have performed very well in 2012, most building products stocks trade at relatively low multiples of 2014E, trend, or peak earnings. Balance sheets are solid, and we forecast significant free cash flows, which should result in dividend increases and/or share repurchases and/or growth in coming years, as we believe we are in the early innings of the U.S. housing recovery. Paper stocks trade at attractive EV/EBITDA multiples, due to the secular decline in demand and implied M&A risk. Pulp stocks, with the exception of Fibria Celulose S.A., trade at attractive valuations when considering mid- to long-term earnings potential.
O U T P E R F O R M E R S
Canfor Corporation (Sector Outperform)
Solid balance sheet with 19% net debt to cap as we enter what we expect to be a multi-year cyclical upswing in building products and significant free cash flow generation available for growth or to be returned to shareholders.
Significant cost benefits expected in 2013+ stemming from recent capital spending program.
Diversified asset base in British Columbia, Alberta, and the U.S. South, providing flexibility to arbitrage between North American and Asian markets while mitigating the impact of the mountain pine beetle epidemic.
Main risks remain weaker-than-expected lumber (and to a certain extent pulp) prices and a stronger-than-forecast Canadian dollar.
Focus 2013 January 2013
162
Western Forest Products Inc. (Sector Outperform)
Cheapest building products stock in our universe of coverage.
Pure play on building products providing geographic and products diversification.
Strong balance sheet with 5% net debt to cap.
Key risks are weaker-than-expected lumber prices, a stronger-than-expected Canadian dollar, and execution risks on its $125 million strategic capital spending program.
U N D E R P E R F O R M E R S
Fibria Celulose S.A. (Sector Underperform)
Expensive valuation at 9.8x EV/EBITDA (2013E) and 8.8x EV/EBITDA (2014E).
Leveraged balance sheet and Brazilian inflation limiting growth prospects and returns on contemplated investments.
Significant new bleached eucalyptus kraft (BEK) capacity starting up in Latin America over the 2013-2014 horizon.
Weaker-than-expected pulp prices or a stronger-than-forecast Brazilian real are the key risks given the focus on exports (~90% of production), as well as high financial leverage.
Resolute Forest Products (Sector Underperform)
Although Resolute Forest Products (RFP) shares are inexpensive at 3.7x 2013E EV/EBITDA, we believe this may be a value trap as demand for ~75% of RFP’s EBITDA (newsprint, coated, and specialty papers) remains in secular decline. In addition, paper supply/demand dynamics remain fragile, with North American exports down significantly (due to a weak euro and low old newsprint [ONP] prices), while capacity is coming onstream (e.g., Stadacona and Port Hawkesbury). With a strong balance sheet, the company has the ability to repurpose assets or grow into more promising segments, but this will be difficult to do accretively given the cheap valuation.
In addition, pension fund solvency issues remain, with the company’s pensions underfunded by approximately $1.5 billion. The company estimates that a 100 bp change in the discount rate used to value the pension obligation equals an approximate $450 million change in the solvency deficit; however, further pension contributions are possible should interest rates remain depressed.
The main risk to our forecast is better-than-expected EBITDA and free cash flow generation, which could lead to further share repurchases or acquisitions.
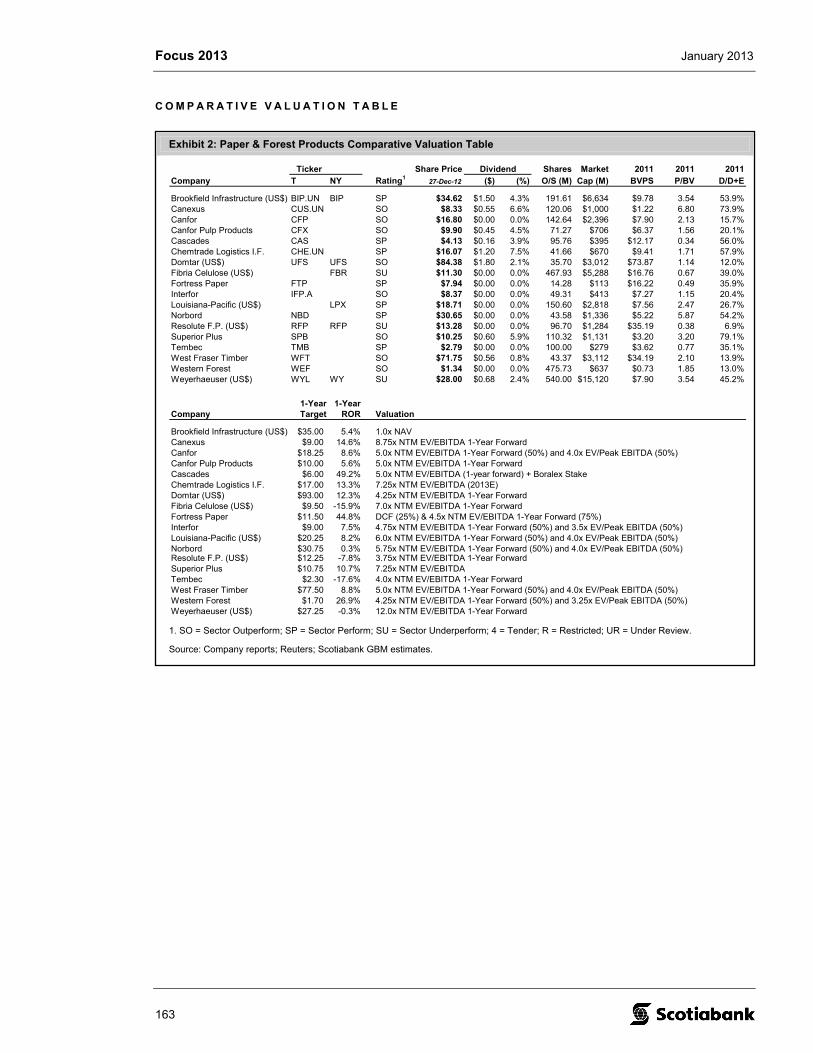
Focus 2013 January 2013
163
Exhibit 2: Paper & Forest Products Comparative Valuation Table
Ticker Share Price Shares Market 2011 2011 2011Company T NY Rating1
27-Dec-12 ($) (%) O/S (M) Cap (M) BVPS P/BV D/D+E
Brookfield Infrastructure (US$) BIP.UN BIP SP $34.62 $1.50 4.3% 191.61 $6,634 $9.78 3.54 53.9%Canexus CUS.UN SO $8.33 $0.55 6.6% 120.06 $1,000 $1.22 6.80 73.9%Canfor CFP SO $16.80 $0.00 0.0% 142.64 $2,396 $7.90 2.13 15.7%Canfor Pulp Products CFX SO $9.90 $0.45 4.5% 71.27 $706 $6.37 1.56 20.1%Cascades CAS SP $4.13 $0.16 3.9% 95.76 $395 $12.17 0.34 56.0%Chemtrade Logistics I.F. CHE.UN SP $16.07 $1.20 7.5% 41.66 $670 $9.41 1.71 57.9%Domtar (US$) UFS UFS SO $84.38 $1.80 2.1% 35.70 $3,012 $73.87 1.14 12.0%Fibria Celulose (US$) FBR SU $11.30 $0.00 0.0% 467.93 $5,288 $16.76 0.67 39.0%Fortress Paper FTP SP $7.94 $0.00 0.0% 14.28 $113 $16.22 0.49 35.9%Interfor IFP.A SO $8.37 $0.00 0.0% 49.31 $413 $7.27 1.15 20.4%Louisiana-Pacific (US$) LPX SP $18.71 $0.00 0.0% 150.60 $2,818 $7.56 2.47 26.7%Norbord NBD SP $30.65 $0.00 0.0% 43.58 $1,336 $5.22 5.87 54.2%Resolute F.P. (US$) RFP RFP SU $13.28 $0.00 0.0% 96.70 $1,284 $35.19 0.38 6.9%Superior Plus SPB SO $10.25 $0.60 5.9% 110.32 $1,131 $3.20 3.20 79.1%Tembec TMB SP $2.79 $0.00 0.0% 100.00 $279 $3.62 0.77 35.1%West Fraser Timber WFT SO $71.75 $0.56 0.8% 43.37 $3,112 $34.19 2.10 13.9%Western Forest WEF SO $1.34 $0.00 0.0% 475.73 $637 $0.73 1.85 13.0%Weyerhaeuser (US$) WYL WY SU $28.00 $0.68 2.4% 540.00 $15,120 $7.90 3.54 45.2%
1-Year 1-YearCompany Target ROR Valuation
Brookfield Infrastructure (US$) $35.00 5.4% 1.0x NAVCanexus $9.00 14.6% 8.75x NTM EV/EBITDA 1-Year ForwardCanfor $18.25 8.6% 5.0x NTM EV/EBITDA 1-Year Forward (50%) and 4.0x EV/Peak EBITDA (50%)Canfor Pulp Products $10.00 5.6% 5.0x NTM EV/EBITDA 1-Year ForwardCascades $6.00 49.2% 5.0x NTM EV/EBITDA (1-year forward) + Boralex StakeChemtrade Logistics I.F. $17.00 13.3% 7.25x NTM EV/EBITDA (2013E)Domtar (US$) $93.00 12.3% 4.25x NTM EV/EBITDA 1-Year ForwardFibria Celulose (US$) $9.50 -15.9% 7.0x NTM EV/EBITDA 1-Year ForwardFortress Paper $11.50 44.8% DCF (25%) & 4.5x NTM EV/EBITDA 1-Year Forward (75%) Interfor $9.00 7.5% 4.75x NTM EV/EBITDA 1-Year Forward (50%) and 3.5x EV/Peak EBITDA (50%)Louisiana-Pacific (US$) $20.25 8.2% 6.0x NTM EV/EBITDA 1-Year Forward (50%) and 4.0x EV/Peak EBITDA (50%)Norbord $30.75 0.3% 5.75x NTM EV/EBITDA 1-Year Forward (50%) and 4.0x EV/Peak EBITDA (50%)Resolute F.P. (US$) $12.25 -7.8% 3.75x NTM EV/EBITDA 1-Year ForwardSuperior Plus $10.75 10.7% 7.25x NTM EV/EBITDA Tembec $2.30 -17.6% 4.0x NTM EV/EBITDA 1-Year ForwardWest Fraser Timber $77.50 8.8% 5.0x NTM EV/EBITDA 1-Year Forward (50%) and 4.0x EV/Peak EBITDA (50%)Western Forest $1.70 26.9% 4.25x NTM EV/EBITDA 1-Year Forward (50%) and 3.25x EV/Peak EBITDA (50%)Weyerhaeuser (US$) $27.25 -0.3% 12.0x NTM EV/EBITDA 1-Year Forward
Dividend
1. SO = Sector Outperform; SP = Sector Perform; SU = Sector Underperform; 4 = Tender; R = Restricted; UR = Under Review.
Source: Company reports; Reuters; Scotiabank GBM estimates.
C O M P A R A T I V E V A L U A T I O N T A B L E
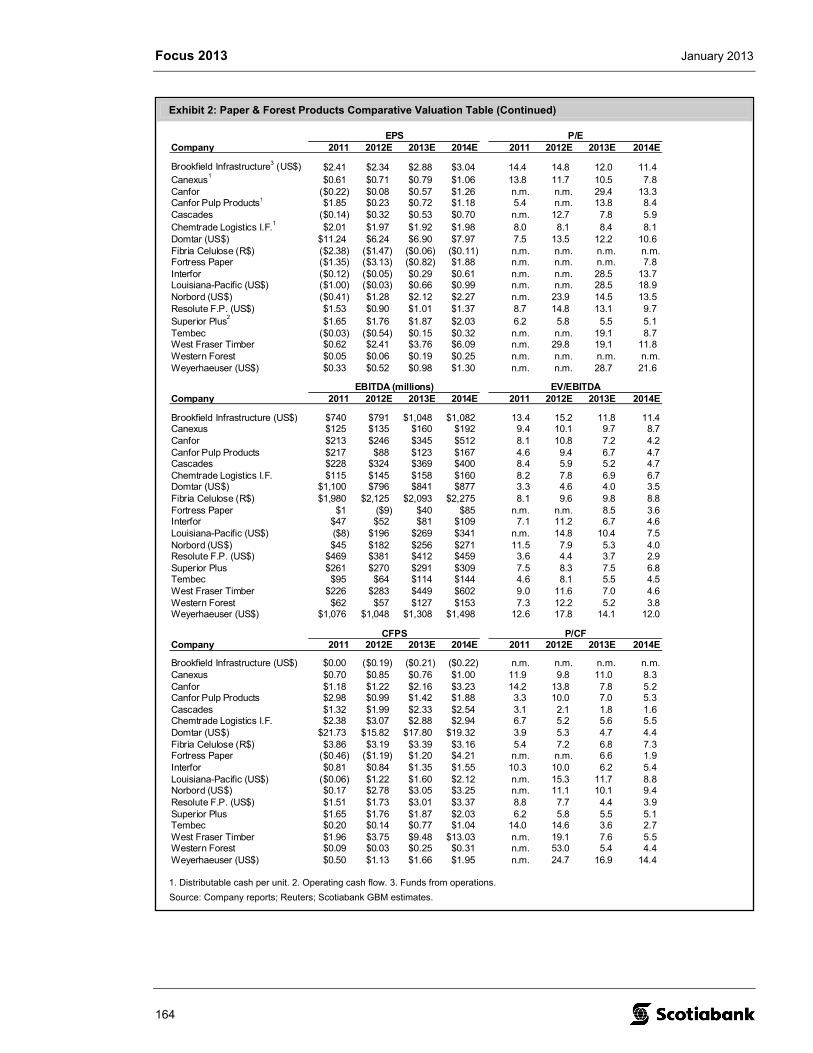
Focus 2013 January 2013
164
Exhibit 2: Paper & Forest Products Comparative Valuation Table (Continued)
Company 2011 2012E 2013E 2014E 2011 2012E 2013E 2014E2011 2012 2013 2014
Brookfield Infrastructure3 (US$) $2.41 $2.34 $2.88 $3.04 14.4 14.8 12.0 11.4Canexus
1$0.61 $0.71 $0.79 $1.06 13.8 11.7 10.5 7.8
Canfor ($0.22) $0.08 $0.57 $1.26 n.m. n.m. 29.4 13.3Canfor Pulp Products1 $1.85 $0.23 $0.72 $1.18 5.4 n.m. 13.8 8.4Cascades ($0.14) $0.32 $0.53 $0.70 n.m. 12.7 7.8 5.9Chemtrade Logistics I.F.
1$2.01 $1.97 $1.92 $1.98 8.0 8.1 8.4 8.1
Domtar (US$) $11.24 $6.24 $6.90 $7.97 7.5 13.5 12.2 10.6Fibria Celulose (R$) ($2.38) ($1.47) ($0.06) ($0.11) n.m. n.m. n.m. n.m.Fortress Paper ($1.35) ($3.13) ($0.82) $1.88 n.m. n.m. n.m. 7.8Interfor ($0.12) ($0.05) $0.29 $0.61 n.m. n.m. 28.5 13.7Louisiana-Pacific (US$) ($1.00) ($0.03) $0.66 $0.99 n.m. n.m. 28.5 18.9Norbord (US$) ($0.41) $1.28 $2.12 $2.27 n.m. 23.9 14.5 13.5Resolute F.P. (US$) $1.53 $0.90 $1.01 $1.37 8.7 14.8 13.1 9.7Superior Plus
2$1.65 $1.76 $1.87 $2.03 6.2 5.8 5.5 5.1
Tembec ($0.03) ($0.54) $0.15 $0.32 n.m. n.m. 19.1 8.7West Fraser Timber $0.62 $2.41 $3.76 $6.09 n.m. 29.8 19.1 11.8Western Forest $0.05 $0.06 $0.19 $0.25 n.m. n.m. n.m. n.m.Weyerhaeuser (US$) $0.33 $0.52 $0.98 $1.30 n.m. n.m. 28.7 21.6
Company 2011 2012E 2013E 2014E 2011 2012E 2013E 2014E
Brookfield Infrastructure (US$) $740 $791 $1,048 $1,082 13.4 15.2 11.8 11.4Canexus $125 $135 $160 $192 9.4 10.1 9.7 8.7Canfor $213 $246 $345 $512 8.1 10.8 7.2 4.2Canfor Pulp Products $217 $88 $123 $167 4.6 9.4 6.7 4.7Cascades $228 $324 $369 $400 8.4 5.9 5.2 4.7Chemtrade Logistics I.F. $115 $145 $158 $160 8.2 7.8 6.9 6.7Domtar (US$) $1,100 $796 $841 $877 3.3 4.6 4.0 3.5Fibria Celulose (R$) $1,980 $2,125 $2,093 $2,275 8.1 9.6 9.8 8.8Fortress Paper $1 ($9) $40 $85 n.m. n.m. 8.5 3.6Interfor $47 $52 $81 $109 7.1 11.2 6.7 4.6Louisiana-Pacific (US$) ($8) $196 $269 $341 n.m. 14.8 10.4 7.5Norbord (US$) $45 $182 $256 $271 11.5 7.9 5.3 4.0Resolute F.P. (US$) $469 $381 $412 $459 3.6 4.4 3.7 2.9Superior Plus $261 $270 $291 $309 7.5 8.3 7.5 6.8Tembec $95 $64 $114 $144 4.6 8.1 5.5 4.5West Fraser Timber $226 $283 $449 $602 9.0 11.6 7.0 4.6Western Forest $62 $57 $127 $153 7.3 12.2 5.2 3.8Weyerhaeuser (US$) $1,076 $1,048 $1,308 $1,498 12.6 17.8 14.1 12.0
Company 2011 2012E 2013E 2014E 2011 2012E 2013E 2014E
Brookfield Infrastructure (US$) $0.00 ($0.19) ($0.21) ($0.22) n.m. n.m. n.m. n.m.Canexus $0.70 $0.85 $0.76 $1.00 11.9 9.8 11.0 8.3Canfor $1.18 $1.22 $2.16 $3.23 14.2 13.8 7.8 5.2Canfor Pulp Products $2.98 $0.99 $1.42 $1.88 3.3 10.0 7.0 5.3Cascades $1.32 $1.99 $2.33 $2.54 3.1 2.1 1.8 1.6Chemtrade Logistics I.F. $2.38 $3.07 $2.88 $2.94 6.7 5.2 5.6 5.5Domtar (US$) $21.73 $15.82 $17.80 $19.32 3.9 5.3 4.7 4.4Fibria Celulose (R$) $3.86 $3.19 $3.39 $3.16 5.4 7.2 6.8 7.3Fortress Paper ($0.46) ($1.19) $1.20 $4.21 n.m. n.m. 6.6 1.9Interfor $0.81 $0.84 $1.35 $1.55 10.3 10.0 6.2 5.4Louisiana-Pacific (US$) ($0.06) $1.22 $1.60 $2.12 n.m. 15.3 11.7 8.8Norbord (US$) $0.17 $2.78 $3.05 $3.25 n.m. 11.1 10.1 9.4Resolute F.P. (US$) $1.51 $1.73 $3.01 $3.37 8.8 7.7 4.4 3.9Superior Plus $1.65 $1.76 $1.87 $2.03 6.2 5.8 5.5 5.1Tembec $0.20 $0.14 $0.77 $1.04 14.0 14.6 3.6 2.7West Fraser Timber $1.96 $3.75 $9.48 $13.03 n.m. 19.1 7.6 5.5Western Forest $0.09 $0.03 $0.25 $0.31 n.m. 53.0 5.4 4.4Weyerhaeuser (US$) $0.50 $1.13 $1.66 $1.95 n.m. 24.7 16.9 14.4
CFPS P/CF
EPS P/E
EBITDA (millions) EV/EBITDA
1. Distributable cash per unit. 2. Operating cash flow. 3. Funds from operations.
Source: Company reports; Reuters; Scotiabank GBM estimates.
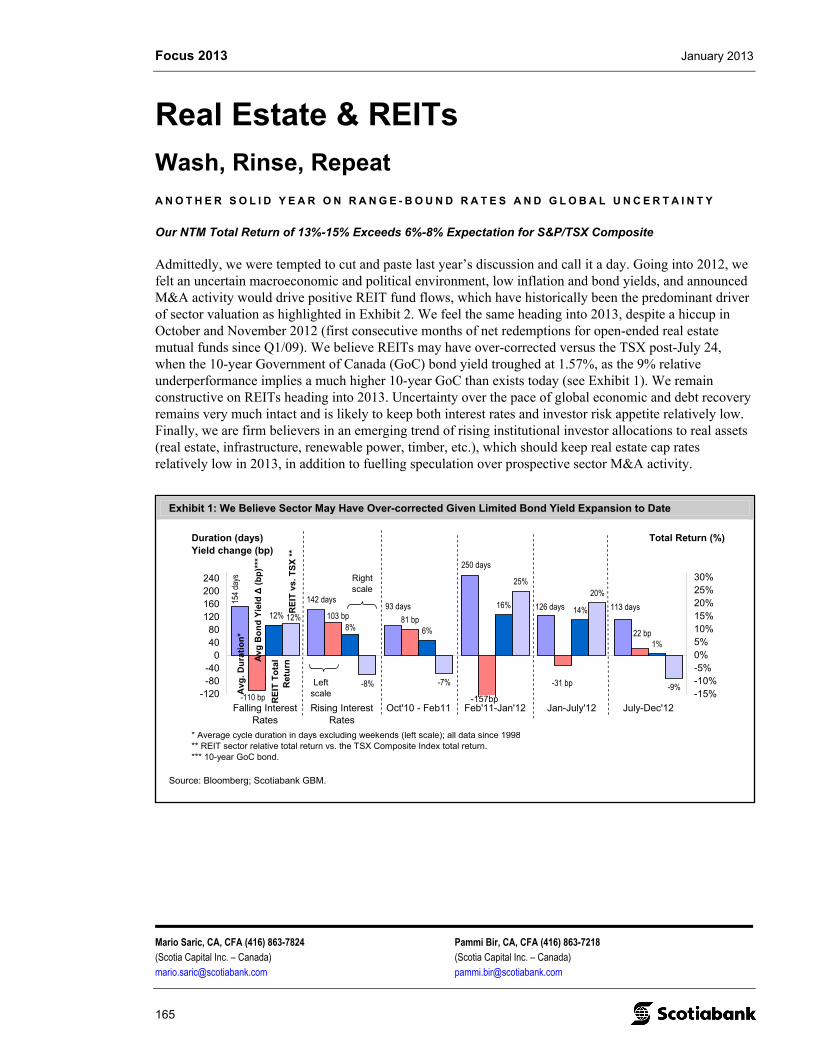
Focus 2013 January 2013
Mario Saric, CA, CFA (416) 863-7824 Pammi Bir, CA, CFA (416) 863-7218 (Scotia Capital Inc. – Canada) (Scotia Capital Inc. – Canada) [email protected] [email protected]
165
Exhibit 1: We Believe Sector May Have Over-corrected Given Limited Bond Yield Expansion to Date
81 bp
142 days93 days15
4 day
s
113 days
250 days
126 days
22 bp
-31 bp-110 bp
103 bp6%
16% 14%
1%
-8% -7%
25%20%
-9%
12%8%
12%
-120-80-40
04080
120160200240
Falling InterestRates
Rising InterestRates
Oct'10 - Feb11 Feb'11-Jan'12 Jan-July'12 July-Dec'12
-15%-10%-5%0%5%10%15%20%25%30%
Duration (days)Yield change (bp)
Total Return (%)
* Average cycle duration in days excluding weekends (left scale); all data since 1998** REIT sector relative total return vs. the TSX Composite Index total return.*** 10-year GoC bond.
Avg
. Du
rati
on
*
RE
IT v
s. T
SX
**
RE
IT T
ota
l R
etu
rn
Avg
Bo
nd
Yie
ld Δ
(b
p)*
**
Left scale
Right scale
-157bp
Source: Bloomberg; Scotiabank GBM.
Real Estate & REITs
Wash, Rinse, Repeat
A N O T H E R S O L I D Y E A R O N R A N G E - B O U N D R A T E S A N D G L O B A L U N C E R T A I N T Y
Our NTM Total Return of 13%-15% Exceeds 6%-8% Expectation for S&P/TSX Composite
Admittedly, we were tempted to cut and paste last year’s discussion and call it a day. Going into 2012, we felt an uncertain macroeconomic and political environment, low inflation and bond yields, and announced M&A activity would drive positive REIT fund flows, which have historically been the predominant driver of sector valuation as highlighted in Exhibit 2. We feel the same heading into 2013, despite a hiccup in October and November 2012 (first consecutive months of net redemptions for open-ended real estate mutual funds since Q1/09). We believe REITs may have over-corrected versus the TSX post-July 24, when the 10-year Government of Canada (GoC) bond yield troughed at 1.57%, as the 9% relative underperformance implies a much higher 10-year GoC than exists today (see Exhibit 1). We remain constructive on REITs heading into 2013. Uncertainty over the pace of global economic and debt recovery remains very much intact and is likely to keep both interest rates and investor risk appetite relatively low. Finally, we are firm believers in an emerging trend of rising institutional investor allocations to real assets (real estate, infrastructure, renewable power, timber, etc.), which should keep real estate cap rates relatively low in 2013, in addition to fuelling speculation over prospective sector M&A activity.
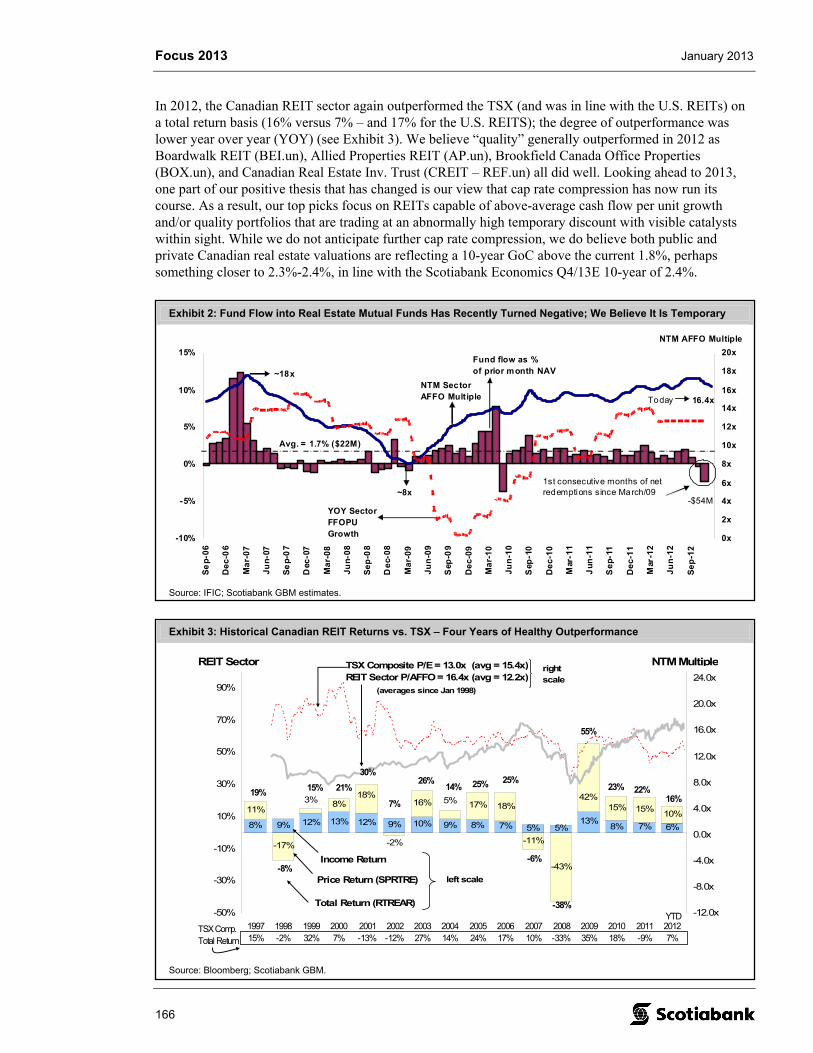
Focus 2013 January 2013
166
Exhibit 3: Historical Canadian REIT Returns vs. TSX – Four Years of Healthy Outperformance
8% 9% 12% 13% 12% 9% 10% 9% 8% 7% 5% 5% 6%
11%
-17%
8% 16% 17% 18%
-11%
-43%
10%13%
8% 7%
5%15%
3%18%
-2%
42%
15%
-50%
-30%
-10%
10%
30%
50%
70%
90%
199715%
1998-2%
199932%
20007%
2001-13%
2002-12%
200327%
200414%
200524%
200617%
200710%
2008-33%
200935%
201018%
2011-9%
20127%
-12.0x
-8.0x
-4.0x
0.0x
4.0x
8.0x
12.0x
16.0x
20.0x
24.0x
19%
Price Return (SPRTRE)
YTDTSX Comp. Total Return
REIT Sector NTM Multiple
-8%
55%
-38%
-6%
25%25%14%26%
7%
30%21%15%
Total Return (RTREAR)
Income Return
left scale
TSX Composite P/E = 13.0x (avg = 15.4x)REIT Sector P/AFFO = 16.4x (avg = 12.2x)
right scale
(averages since Jan 1998)
23% 22%16%
Source: Bloomberg; Scotiabank GBM.
Exhibit 2: Fund Flow into Real Estate Mutual Funds Has Recently Turned Negative; We Believe It Is Temporary
-10%
-5%
0%
5%
10%
15%
Se
p-0
6
De
c-0
6
Ma
r-0
7
Ju
n-0
7
Se
p-0
7
Dec
-07
Ma
r-0
8
Ju
n-0
8
Se
p-0
8
De
c-0
8
Ma
r-0
9
Ju
n-0
9
Sep
-09
De
c-0
9
Ma
r-1
0
Ju
n-1
0
Sep
-10
De
c-1
0
Mar
-11
Ju
n-1
1
Se
p-1
1
De
c-1
1
Mar
-12
Ju
n-1
2
Se
p-1
2
0x
2x
4x
6x
8x
10x
12x
14x
16x
18x
20x
NTM AFFO Multiple
NTM SectorAFFO Multiple
Fund flow as %of prior month NAV
Avg. = 1.7% ($22M)
YOY Sector FFOPU Growth
16.4xToday
~18x
~8x-$54M
1st consecutive months of net redemptions since March/09
Source: IFIC; Scotiabank GBM estimates.
In 2012, the Canadian REIT sector again outperformed the TSX (and was in line with the U.S. REITs) on a total return basis (16% versus 7% – and 17% for the U.S. REITS); the degree of outperformance was lower year over year (YOY) (see Exhibit 3). We believe “quality” generally outperformed in 2012 as Boardwalk REIT (BEI.un), Allied Properties REIT (AP.un), Brookfield Canada Office Properties (BOX.un), and Canadian Real Estate Inv. Trust (CREIT – REF.un) all did well. Looking ahead to 2013, one part of our positive thesis that has changed is our view that cap rate compression has now run its course. As a result, our top picks focus on REITs capable of above-average cash flow per unit growth and/or quality portfolios that are trading at an abnormally high temporary discount with visible catalysts within sight. While we do not anticipate further cap rate compression, we do believe both public and private Canadian real estate valuations are reflecting a 10-year GoC above the current 1.8%, perhaps something closer to 2.3%-2.4%, in line with the Scotiabank Economics Q4/13E 10-year of 2.4%.
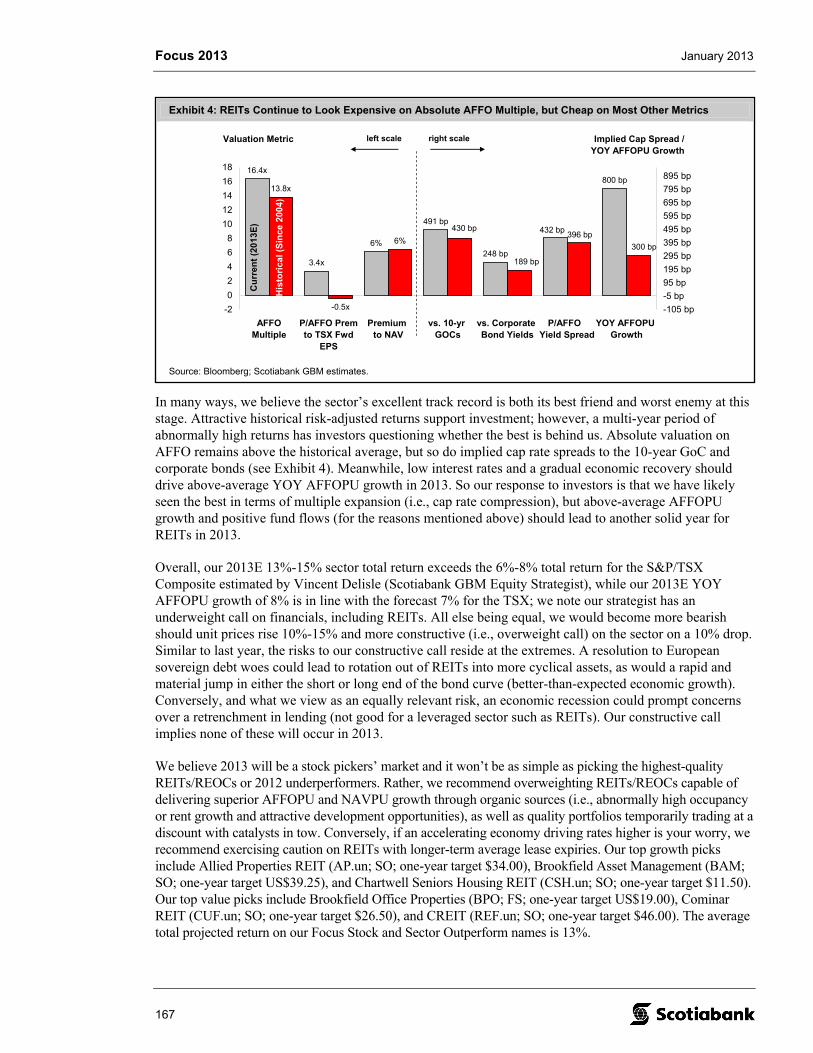
Focus 2013 January 2013
167
Exhibit 4: REITs Continue to Look Expensive on Absolute AFFO Multiple, but Cheap on Most Other Metrics
16.4x
13.8x
6%
3.4x
6%
-0.5x
491 bp
248 bp
800 bp
432 bp396 bp
430 bp
189 bp
300 bp
-2
0
2
4
6
8
10
12
14
16
18
AFFOMultiple
P/AFFO Premto TSX Fwd
EPS
Premium to NAV
vs. 10-yr GOCs
vs. Corporate Bond Yields
P/AFFO Yield Spread
YOY AFFOPU Growth
-105 bp
-5 bp
95 bp
195 bp
295 bp
395 bp
495 bp
595 bp
695 bp
795 bp
895 bp
Implied Cap Spread /YOY AFFOPU Growth
Cu
rren
t (2
013E
)
His
tori
cal
(Sin
ce 2
004)
left scale right scaleValuation Metric
Source: Bloomberg; Scotiabank GBM estimates.
In many ways, we believe the sector’s excellent track record is both its best friend and worst enemy at this stage. Attractive historical risk-adjusted returns support investment; however, a multi-year period of abnormally high returns has investors questioning whether the best is behind us. Absolute valuation on AFFO remains above the historical average, but so do implied cap rate spreads to the 10-year GoC and corporate bonds (see Exhibit 4). Meanwhile, low interest rates and a gradual economic recovery should drive above-average YOY AFFOPU growth in 2013. So our response to investors is that we have likely seen the best in terms of multiple expansion (i.e., cap rate compression), but above-average AFFOPU growth and positive fund flows (for the reasons mentioned above) should lead to another solid year for REITs in 2013.
Overall, our 2013E 13%-15% sector total return exceeds the 6%-8% total return for the S&P/TSX Composite estimated by Vincent Delisle (Scotiabank GBM Equity Strategist), while our 2013E YOY AFFOPU growth of 8% is in line with the forecast 7% for the TSX; we note our strategist has an underweight call on financials, including REITs. All else being equal, we would become more bearish should unit prices rise 10%-15% and more constructive (i.e., overweight call) on the sector on a 10% drop. Similar to last year, the risks to our constructive call reside at the extremes. A resolution to European sovereign debt woes could lead to rotation out of REITs into more cyclical assets, as would a rapid and material jump in either the short or long end of the bond curve (better-than-expected economic growth). Conversely, and what we view as an equally relevant risk, an economic recession could prompt concerns over a retrenchment in lending (not good for a leveraged sector such as REITs). Our constructive call implies none of these will occur in 2013.
We believe 2013 will be a stock pickers’ market and it won’t be as simple as picking the highest-quality REITs/REOCs or 2012 underperformers. Rather, we recommend overweighting REITs/REOCs capable of delivering superior AFFOPU and NAVPU growth through organic sources (i.e., abnormally high occupancy or rent growth and attractive development opportunities), as well as quality portfolios temporarily trading at a discount with catalysts in tow. Conversely, if an accelerating economy driving rates higher is your worry, we recommend exercising caution on REITs with longer-term average lease expiries. Our top growth picks include Allied Properties REIT (AP.un; SO; one-year target $34.00), Brookfield Asset Management (BAM; SO; one-year target US$39.25), and Chartwell Seniors Housing REIT (CSH.un; SO; one-year target $11.50). Our top value picks include Brookfield Office Properties (BPO; FS; one-year target US$19.00), Cominar REIT (CUF.un; SO; one-year target $26.50), and CREIT (REF.un; SO; one-year target $46.00). The average total projected return on our Focus Stock and Sector Outperform names is 13%.
Focus 2013 January 2013
168
Recent Pullback Provides Better Entry Point into Our Top Picks; Sector Appears Reasonably Valued
Our 2013E total return reflects a sustainable and growing 5%-6% distribution yield (2013E AFFO payout ratio is 86% versus 91% YOY; 2013E YOY distribution growth of 2.0% versus 2.3% in 2012), plus solid capital upside due to 8% 2013E YOY AFFOPU growth. Canadian REITs trade at 16.4x and 15.4x 2013E and 2014E AFFO, implying a 432 bp and 405 bp 2013E AFFO yield spread to the current and the Scotiabank Economics 2013E average 10-year GoC, respectively, and an implied cap rate and implied cap rate spread (to 10-year) of 6.7% and 491 bp, respectively (see Exhibit 4). Canadian REITs trade at a 1.2x and 0.8x discount to U.S. REITs on 2013E and 2014E AFFO (based on U.S. consensus), tighter than the historical 2x-3x AFFO discount. Sector valuation does look more expensive relative to the TSX (3.4x premium versus historical 0.5x discount).
M&A Back on the Radar Following Bid for Primaris
On Wednesday, December 5, 2012, a consortium including KingSett Capital announced its intention to make a hostile $4.4 billion all-cash offer for Primaris Retail REIT (PMZ.un; SP; one-year target $27.50), valuing the REIT at $26.00 per unit. Three other transactions took place in 2012, including Dundee REIT acquiring Whiterock REIT (January), NorthWest Healthcare Properties REIT acquiring GT Canada, and Starlight Investments Ltd. acquiring TransGlobe Apartment REIT (both in April); TransGlobe was on our 2012 list of potential privatizations (note Cominar REIT’s acquisition of CANMARC REIT was completed in February 2012, but was announced in November 2011). As we have discussed in the past, the two biggest AFFO multiple drivers historically for REITs have been market capitalization (proxy for liquidity) and AFFOPU growth. Combined with accommodative real estate debt and equity capital markets, we believe 2013 may bring additional M&A possibilities. With REITs enjoying healthy access to both debt and equity capital, we look to scenarios where both significant operational synergies (portfolio overlap) and a significant variance in relative AFFO valuation exist. We think the apartment sector may remain in the spotlight as currently underweight pension funds allocate incremental capital to apartments, while strategic portfolio overlap exists among several of the REITs. Our list of M&A candidates heading into 2013 includes Artis REIT, BPO, Boardwalk, Chartwell, CREIT, and Killam Properties Inc. (KMP).
Another Year of Above-Average Cash Flow Growth on Tap, Although Drivers Are Shifting
Our forecasts reflect 7.6% 2012E-2014E AFFOPU CAGR, well above the sector’s historical ~3% average. Notwithstanding soft projections for domestic economic growth, our 2013E-2014E AFFOPU reflects another year of above-trend cash flow gains. For the year ahead, we estimate 9% growth for our coverage universe (excluding BPO and RYL), followed by 6% in 2014 (versus 6.5% 2012E). Much like 2012, we expect similar forces will remain at work, including debt refinancing savings, accretive external growth, and modest same-property NOI gains (average +2% 2013E). However, growth is increasingly being driven by organic sources (60%-70% in 2013-14) and, to a lesser extent, by acquisitions and rolling debt at lower rates. By segment (excluding hotels), we expect growth leadership from the office REITs (+8.3% 2012E-2014E AFFO CAGR), followed by multi-family (+7.4%), diversified (7.2%), retail (+5.3%), and seniors housing (+5%), although we caution that the ranges are wide within each segment. The primary risks to our call include a deterioration in fundamentals, prompted by a weaker-than-expected economy, a material pullback in credit availability, a spike in bond yields, and the inability to meet acquisition forecasts.
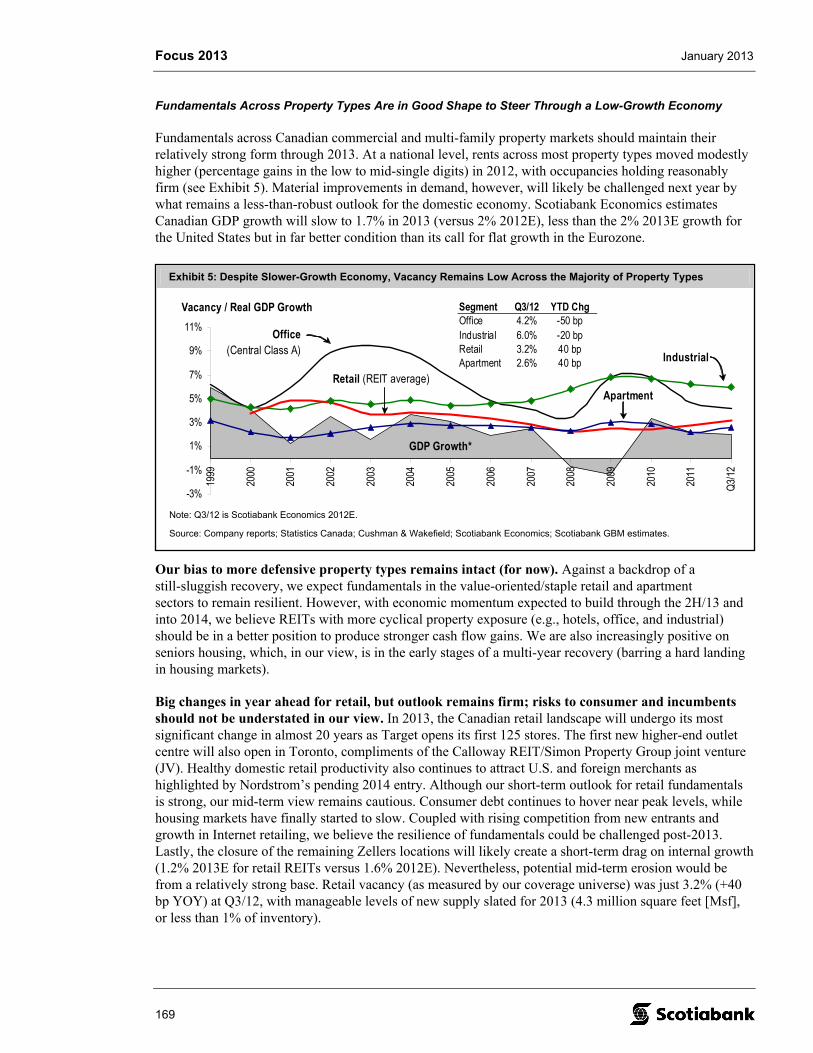
Focus 2013 January 2013
169
Exhibit 5: Despite Slower-Growth Economy, Vacancy Remains Low Across the Majority of Property Types
-3%
-1%
1%
3%
5%
7%
9%
11%
1999
2000
2001
2002
2003
2004
2005
2006
2007
2008
2009
2010
2011
Q3/12
Office (Central Class A)
GDP Growth*
Vacancy / Real GDP Growth
Retail (REIT average)Apartment
Industrial
Segment Q3/12 YTD ChgOffice 4.2% -50 bpIndustrial 6.0% -20 bpRetail 3.2% 40 bpApartment 2.6% 40 bp
Note: Q3/12 is Scotiabank Economics 2012E.
Source: Company reports; Statistics Canada; Cushman & Wakefield; Scotiabank Economics; Scotiabank GBM estimates.
Fundamentals Across Property Types Are in Good Shape to Steer Through a Low-Growth Economy
Fundamentals across Canadian commercial and multi-family property markets should maintain their relatively strong form through 2013. At a national level, rents across most property types moved modestly higher (percentage gains in the low to mid-single digits) in 2012, with occupancies holding reasonably firm (see Exhibit 5). Material improvements in demand, however, will likely be challenged next year by what remains a less-than-robust outlook for the domestic economy. Scotiabank Economics estimates Canadian GDP growth will slow to 1.7% in 2013 (versus 2% 2012E), less than the 2% 2013E growth for the United States but in far better condition than its call for flat growth in the Eurozone.
Our bias to more defensive property types remains intact (for now). Against a backdrop of a still-sluggish recovery, we expect fundamentals in the value-oriented/staple retail and apartment sectors to remain resilient. However, with economic momentum expected to build through the 2H/13 and into 2014, we believe REITs with more cyclical property exposure (e.g., hotels, office, and industrial) should be in a better position to produce stronger cash flow gains. We are also increasingly positive on seniors housing, which, in our view, is in the early stages of a multi-year recovery (barring a hard landing in housing markets).
Big changes in year ahead for retail, but outlook remains firm; risks to consumer and incumbents should not be understated in our view. In 2013, the Canadian retail landscape will undergo its most significant change in almost 20 years as Target opens its first 125 stores. The first new higher-end outlet centre will also open in Toronto, compliments of the Calloway REIT/Simon Property Group joint venture (JV). Healthy domestic retail productivity also continues to attract U.S. and foreign merchants as highlighted by Nordstrom’s pending 2014 entry. Although our short-term outlook for retail fundamentals is strong, our mid-term view remains cautious. Consumer debt continues to hover near peak levels, while housing markets have finally started to slow. Coupled with rising competition from new entrants and growth in Internet retailing, we believe the resilience of fundamentals could be challenged post-2013. Lastly, the closure of the remaining Zellers locations will likely create a short-term drag on internal growth (1.2% 2013E for retail REITs versus 1.6% 2012E). Nevertheless, potential mid-term erosion would be from a relatively strong base. Retail vacancy (as measured by our coverage universe) was just 3.2% (+40 bp YOY) at Q3/12, with manageable levels of new supply slated for 2013 (4.3 million square feet [Msf], or less than 1% of inventory).
Focus 2013 January 2013
170
Office market remains in good shape for now. National Central Business District (CBD) and suburban Class A vacancies are down 50 bp and 20 bp YTD, respectively, contributing to strong net rent/sf growth of 7.8% in the CBD, but a much more modest 1.1% increase in the suburbs. We expect decent GDP growth, combined with limited new supply, should lead to decent demand and rent growth in 2013. Most of the office REITs in our universe also maintain a positive mark-to-market position on 2013 lease expiries (i.e., expiring rent is below current market rent), suggesting NOI growth may exceed market rent growth in 2013. Indeed, this is one of the factors driving our solid 2013 office REIT AFFOPU growth. Longer term, we believe supply discipline (limited speculative development) remains critical to our positive office sector thesis.
Apartments should still provide shelter against a possible housing market correction or higher rates. Based on the Canada Mortgage and Housing Corporation (CMHC) Fall Rental Market Survey, national vacancy was +40 bp YOY to 2.6%, while same-property rent was +2.2% YOY. Slowing household formation arising from weak youth labour markets and higher supply were cited as factors driving higher vacancy YOY. Apartment results versus condominium rentals were mixed. Condominiums generally outperformed on vacancy, but underperformed on rent growth. CMHC maintained its 2013E forecast, calling for national vacancy to decline 60 bp YOY, driving healthy 3.2% rent growth. While it varies by REIT, our average YOY forecast vacancy and rent change is -10 bp (range is KMP at -70 bp to BEI at +40 bp) and +3.1% (KMP at +4.8%, Northern Property REIT [NPR] at +1%), respectively. Looking forward, we believe a gradually improving economy should facilitate improving youth employment, while a possible correction in the housing market may incentivize renters to stay longer.
Material gains in industrial demand will likely be limited, although conditions are well balanced. To Q3/12, national vacancy improved to 6% (-20 bp YTD, according to Cushman & Wakefield), although rents appear to have slipped 2% YTD (we note that CB Richard Ellis [CBRE] data points to 3% rent growth). Nevertheless, the gulf between western and eastern Canada remains evident. Across major markets, vacancy rates in Vancouver and Calgary remain the lowest, at 3.5% (-120 bp YOY) and 4.3% (+10 bp), respectively, followed by Toronto at 6.1% (-10 bp) and Montreal at 8.2% (-60 bp). Amid projections for sub-2% economic growth and a Canadian dollar near parity, we find it difficult to make a bullish case for 2013 industrial demand. That said, we believe conditions will remain well balanced, with limited expected new supply growth (less than 1% of inventory) and flat-to-modest rent growth expectations. Availability is expected to remain firm at 6.3% (flat YOY).
Seniors housing continues to move along the road to recovery. Our outlook for Canadian seniors housing has become increasingly constructive over the last year. CMHC’s mid-year 2012 national vacancy estimate for standard spaces was 10.6% (-10 bp YOY) with average monthly rents up 3.3% to $1,966. Though the YOY improvement was modest, we expect additional momentum to build as new supply growth wanes, particularly in select overbuilt markets. For example, Ontario’s retirement home inventory is expected to grow by 2.7% in 2013, well below the 5.8% annual average growth from 2010-2012. Coupled with steady demand and provided Canadian housing markets avoid a hard landing, we expect occupancy rates to move higher. On the long-term care front, we believe a resolution between the CMHC and Ontario’s Ministry of Health and Long-Term Care for the former to make CMHC financing available could create new financing options and boost facility owner returns for the province’s Class B and C bed rebuild program.
We are still hitting the snooze button on hotels for now. We believe 2012 was disappointing in terms of room rate growth, which has yet to fully materialize. As of October, national occupancy and room rates were +0.8% and +1.5% YTD, respectively. Looking into 2013, Pannell Kerr Forster Consulting Inc. (PKF) is forecasting national occupancy and average room rate of 63% and $132, up 1% and 2.3%, respectively. We believe risks to the forecast include a meaningful housing market correction and decline in discretionary spending arising from a debt-burdened consumer. While we are neutral on the sector for now, accelerating economic growth may see us become more positive in 2H/13.
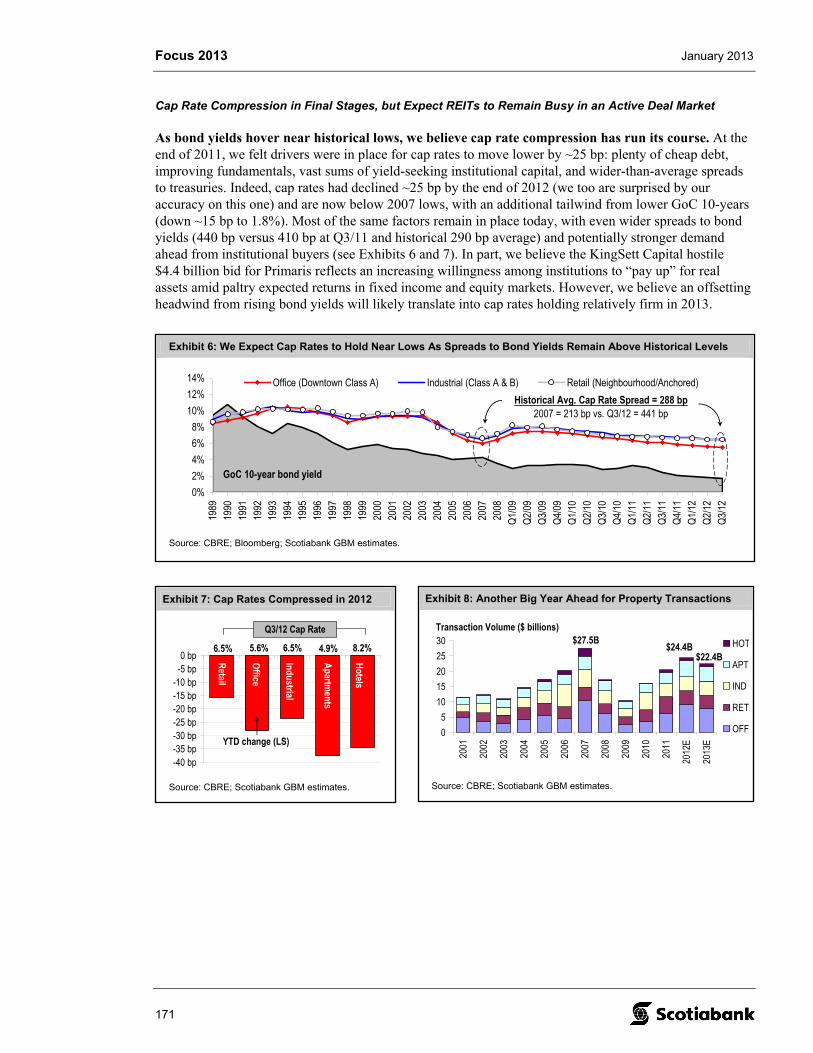
Focus 2013 January 2013
171
Exhibit 6: We Expect Cap Rates to Hold Near Lows As Spreads to Bond Yields Remain Above Historical Levels
0%2%4%6%8%
10%12%14%
1989
1990
1991
1992
1993
1994
1995
1996
1997
1998
1999
2000
2001
2002
2003
2004
2005
2006
2007
2008
Q1/09
Q2/09
Q3/09
Q4/09
Q1/10
Q2/10
Q3/10
Q4/10
Q1/11
Q2/11
Q3/11
Q4/11
Q1/12
Q2/12
Q3/12
Office (Downtown Class A) Industrial (Class A & B) Retail (Neighbourhood/Anchored)
GoC 10-year bond yield
Historical Avg. Cap Rate Spread = 288 bp2007 = 213 bp vs. Q3/12 = 441 bp
Source: CBRE; Bloomberg; Scotiabank GBM estimates.
Exhibit 7: Cap Rates Compressed in 2012
-40 bp-35 bp-30 bp-25 bp-20 bp-15 bp-10 bp-5 bp0 bp
Q3/12 Cap Rate
6.5% 5.6% 6.5% 4.9% 8.2%
YTD change (LS)
Retail
Office
Industrial
Apartments
Hotels
Source: CBRE; Scotiabank GBM estimates.
Exhibit 8: Another Big Year Ahead for Property Transactions
05
1015202530
2001
2002
2003
2004
2005
2006
2007
2008
2009
2010
2011
2012
E
2013
E
HOT
APT
IND
RET
OFF
Transaction Volume ($ billions)$27.5B $24.4B
$22.4B
Source: CBRE; Scotiabank GBM estimates.
Cap Rate Compression in Final Stages, but Expect REITs to Remain Busy in an Active Deal Market
As bond yields hover near historical lows, we believe cap rate compression has run its course. At the end of 2011, we felt drivers were in place for cap rates to move lower by ~25 bp: plenty of cheap debt, improving fundamentals, vast sums of yield-seeking institutional capital, and wider-than-average spreads to treasuries. Indeed, cap rates had declined ~25 bp by the end of 2012 (we too are surprised by our accuracy on this one) and are now below 2007 lows, with an additional tailwind from lower GoC 10-years (down ~15 bp to 1.8%). Most of the same factors remain in place today, with even wider spreads to bond yields (440 bp versus 410 bp at Q3/11 and historical 290 bp average) and potentially stronger demand ahead from institutional buyers (see Exhibits 6 and 7). In part, we believe the KingSett Capital hostile $4.4 billion bid for Primaris reflects an increasing willingness among institutions to “pay up” for real assets amid paltry expected returns in fixed income and equity markets. However, we believe an offsetting headwind from rising bond yields will likely translate into cap rates holding relatively firm in 2013.
Focus 2013 January 2013
172
Expect REITs to remain active buyers, although accretion is getting squeezed. Ease of access to both debt and equity capital at significantly improved costs has made Canadian REITs formidable competitors in investment markets. In 2012, the group accounted for ~40% of transaction volume, the largest share among its competitors. Not only were REITs dominant, but they also won competitive processes for “trophy” assets, historically the domain of pension funds (e.g., the $1.3 billion purchase of Scotia Plaza by Dundee REIT and H&R REIT). The year also set a new record for capital raising, with more than $7 billion of REIT debt, equity, and preferred securities issued. Looking ahead, despite a 20% YOY increase in 2012 deal flow, we expect investment markets to remain active as owners continue to capitalize on strong demand (see Exhibit 8). Provided access to capital remains favourable, we expect REITs to be active buyers. Escalating competition, however, could put further pressure on already skinny levels of accretion. We also expect to see portfolio repositioning among a select few to recycle equity.
O U T P E R F O R M E R S
Brookfield Office Properties (Focus Stock; One-Year Target US$19.00) – Mario Saric, CA, CFA
• We have upgraded BPO to Focus Stock from Sector Outperform.
• Trading at a significant discount to NAV; visible catalyst awaits. BPO trades at a 13% discount to our NAVPS estimate, one of the largest discounts in our universe of coverage. While BPO produced a respectable 13% total return in 2012, we were disappointed with the lack of leasing at Brookfield Place in New York (formerly World Financial Center).
• That said, we are returning with BPO as an outperformer in 2013 as it provides investors with attractively valued cyclical exposure to a U.S. recovery. The tenant discussion pipeline at Brookfield Place stands at 5.3 Msf, the largest in more than two years, while improving corporate visibility since the U.S. elections, the resolution of the fiscal cliff, and financial reform legislation should create an environment supportive of executing long-term leases.
• Paying very little for expiring Bank of America Merrill Lynch space in New York. Our sum-of-the-parts NAVPS estimate suggests investors are paying $1.16 per share for the remaining 3 Msf of exposure in lower Manhattan, space that we value at ~$2.75 per share (i.e., current share price implies 58% of the 3 Msf will remain vacant forever). We believe the share price will respond positively to significant lease announcements going forward.
• Potential privatization candidate as Brookfield Property Partners (BPY) emerges. Over the long term, we believe BPO may end up within BPY, BAM’s soon to be publicly listed flagship (externally managed) vehicle. We believe this provides existing BPO shareholders with attractive downside protection should Lower Manhattan leasing go more slowly than anticipated or the United States revert to an economic recession (leading to a retrenchment in lending), the two primary risks to our favourable outlook.
Focus 2013 January 2013
173
Allied Properties REIT (Sector Outperform; One-Year Target $34.00) – Mario Saric, CA, CFA
Providing both sector bulls and bears with reasons to own. Allied fits our growth focus very well, with growth coming from a positive mark-to-market position (in-place leases are 9% below current market rent for lease expiries through 2014), accretive acquisitions (Allied has the lowest cost of capital of the players in the Canadian class I office market), and a unique intensification pipeline (2.2 Msf pipeline equates to 25% of current total portfolio gross leasable area [GLA]). We also believe a very conservative balance sheet provides attractive unit price downside support in the event rates start to rise.
Near sector-leading AFFOPU growth potential at a reasonable valuation. Our 2012E-2014E AFFOPU CAGR of 12.3% for Allied trails that of only InnVest REIT (INN.un; SP; one-year target $5.00) and KMP (SP; one-year target $14.00) in our universe of coverage. We believe Allied is capable of delivering close to a 10% AFFOPU CAGR over the next five years on the back of an attractive mark-to-market and development pipeline, with the latter valued at our estimated $5.00-$6.00 per unit, or 15%-18% upside from its current unit price.
Higher AFFO multiple premium warranted; upside to our target price exists. Allied is trading at 17.2x 2014E AFFO versus 15.4x for our universe of coverage, ahead of Allied’s historical 1x AFFO premium. We believe a 2x AFFO multiple premium is warranted given its conservative balance sheet and attractive growth prospects. Our current 18x valuation multiple reflects a 1.4x premium to our universe of coverage; an 18.6x AFFO valuation multiple would imply a $35.00 target price, or 3% additional upside.
Canadian Real Estate Inv. Trust (Sector Outperform; One-Year Target $46.00) – Pammi Bir, CA, CFA
Defensive strengths create offensive opportunities. Our 2012E-2014E AFFOPU reflects a moderate 5% CAGR (versus 7.6% for the sector), although our acquisition assumptions are relatively low ($100 million annually). For higher-quality assets with strong strategic fit, CREIT’s under-leveraged balance sheet and high levels of retained cash create the financial flexibility to bid aggressively, which may once again translate into upside in our estimates. We estimate incremental debt capacity at ~$300 million-$400 million, although in theory it could add more than $600 million before reaching its 8x debt to EBITDA limit (versus 6.8x current). Its balance sheet strength enabled it to complete ~$350 million of 2012 acquisitions (most active year since 2002), putting it on track to deliver above-average 8.6% YOY AFFO growth.
Building a multi-year pipeline of growth; expect CREIT to go 12 for 12 on distributions. Over the last two years, CREIT has quietly built up a sizable industrial and retail development pipeline amid stiff competition for acquisitions. Developable GLA sits at 3.1 Msf (16% of portfolio), with total costs of $397 million (+42% YOY, 5% of assets) and yields at an attractive ~8.5%. Completions are set to accelerate in 2013 ($75 million), although management continues to seek new opportunities. Also, following its 11th straight year of distribution hikes, we expect another increase in Q2/13. Despite ample capacity for a more aggressive bump (2013E payout ratio of 61%), we believe a hike in the 3% range is likely.
Modest premium for one of the highest-quality names; attractive risk-adjusted return. CREIT is trading at 17.5x 2013E AFFO/6% implied cap rate versus 19.5x/5.4% for RioCan REIT and 16.4x/6.7% for the sector. In our view, the current valuation fails to fully capture its solid balance sheet, high-quality portfolio, track record of superior growth, and management strength. Given institutional appetite for real assets, CREIT may also be viewed as an attractive takeover candidate considering the absence of any control blocks, its low leverage, and its high-quality platform. The primary risks to our call are a deterioration in fundamentals and slower-than-expected development completions.
Focus 2013 January 2013
174
Chartwell Seniors Housing REIT (Sector Outperform; One-Year Target $11.50) – Pammi Bir, CA, CFA
Organic sources driving a compelling AFFO and NAV growth story. Our forecasts reflect a 9.9% 2012E-2014E AFFO CAGR, nicely above the 7.6% sector average. However, with seniors housing in the early stages of a multi-year recovery on both sides of the border, we believe our internal growth outlook (~3% 2013E-2014E versus 5.6% 2012E) may prove light. Specifically, we forecast same-property occupancy rising to 90.9% by Q4/14 (+60 bp from Q3/12), still below Chartwell’s pre-credit crisis ~92.5% average. We highlight that each 1% change in rent or occupancy equates to ~$0.025 of AFFOPU (3.5% of 2013E).
De-risking at work, despite recent setback on non-core U.S. asset sales. In our view, the recent termination of its previously announced sale of $165 million of non-core U.S. properties is a modest setback in management’s goal of de-leveraging its balance sheet. That said, we believe the assets will be sold in 2H/13, which, coupled with the Bristol portfolio sale closing in Q1/13 and the sale of the remaining seven non-core assets expected in 1H/13, should reduce leverage to a more comfortable ~55% debt to gross book value (GBV – versus 60% currently) and 8x 2013E debt to EBITDA (versus 8.7x 2012E). Moreover, the reduced NOI exposure to the United States should also result in less cash flow volatility, supporting further multiple expansion.
Discount valuation with levers at work to narrow the gap. Chartwell is trading at 14.4x 2013E AFFO/7% implied cap rate versus 16.4x/6.7% for the sector. We continue to believe management is executing a well laid out turnaround plan, with sufficient catalysts ahead to narrow its discount to the sector, which remains in excess of historical levels (0.8x). Despite its 2012 YTD outperformance, we continue to see good money on the table for 2013 for investors with a higher risk tolerance. Key risks to our positive thesis are slower-than-expected lease-ups, a hard landing in Canadian housing markets, and a weakening of the U.S. housing market.
U N D E R P E R F O R M E R
Royal Host Inc. (Sector Underperform; One-Year Target $1.20) – Mario Saric, CA, CFA
Lower-quality portfolio and high leverage limit flexibility. Despite Q3/12 debt to GBV (including converts) of 79%, moving down 60 bp quarter over quarter (QOQ) and 490 bp YOY, we continue to believe leverage is too high. Ultimately, we continue to believe an equity injection may be required to rightsize the balance sheet.
Preference is for InnVest REIT in the Canadian hotel sector. Royal Host trades at a 10.5% implied cap rate versus 6.7% for the sector. We believe InnVest reflects better value (8.7x 2013E P/AFFO and 9.2% implied cap), while offering investors a higher-quality portfolio, lower leverage, and attractive distribution yield.
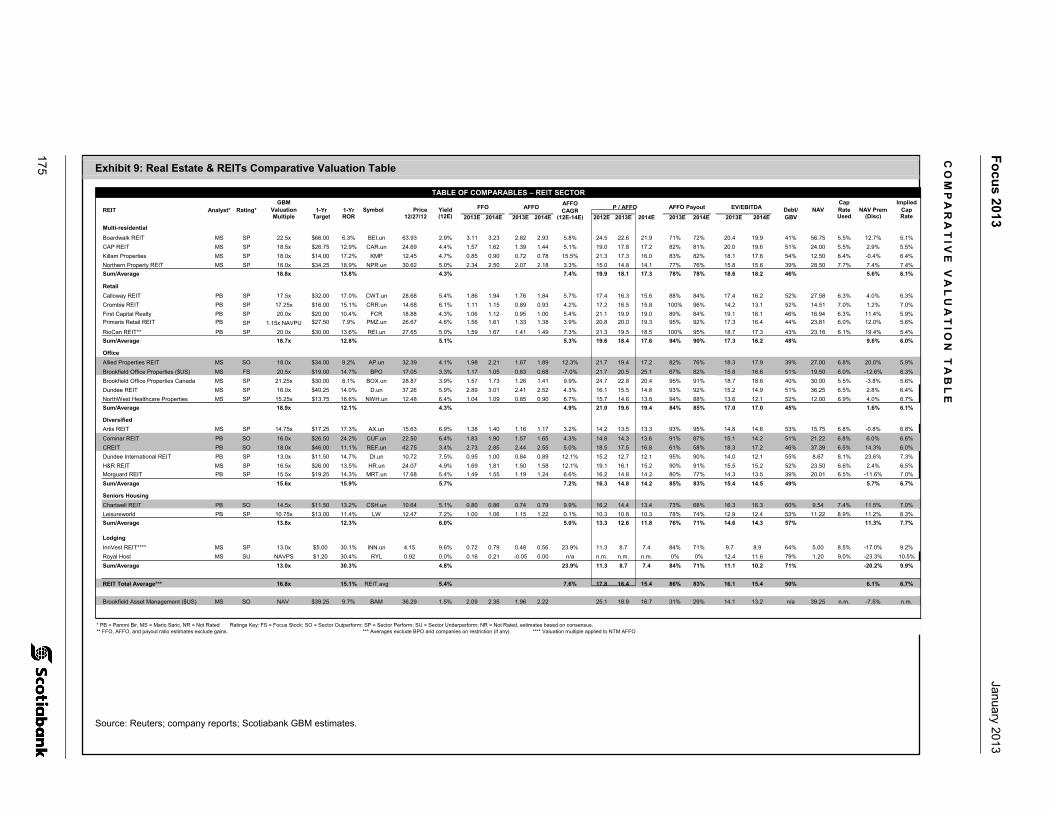
175
Fo
cus 2013
January 2013
Exhibit 9: Real Estate & REITs Comparative Valuation Table
TABLE OF COMPARABLES – REIT SECTOR
REIT Analyst* Rating*GBM
Valuation 1-Yr 1-Yr Symbol Price Yield FFO AFFOAFFO CAGR
P / AFFO AFFO Payout EV/EBITDA Debt/ NAVCap Rate NAV Prem
Implied Cap
Multiple Target ROR 12/27/12 (12E) 2013E 2014E 2013E 2014E (12E-14E) 2012E 2013E 2014E 2013E 2014E 2013E 2014E GBV Used (Disc) Rate
Multi-residential
Boardwalk REIT MS SP 22.5x $66.00 6.3% BEI.un 63.93 2.9% 3.11 3.23 2.82 2.93 5.8% 24.5 22.6 21.9 71% 72% 20.4 19.9 41% 56.75 5.5% 12.7% 5.1%
CAP REIT MS SP 18.5x $26.75 12.9% CAR.un 24.69 4.4% 1.57 1.62 1.39 1.44 5.1% 19.0 17.8 17.2 82% 81% 20.0 19.6 51% 24.00 5.5% 2.9% 5.5%
Killam Properties MS SP 18.0x $14.00 17.2% KMP 12.45 4.7% 0.85 0.90 0.72 0.78 15.5% 21.3 17.3 16.0 83% 82% 18.1 17.6 54% 12.50 6.4% -0.4% 6.4%
Northern Property REIT MS SP 16.0x $34.25 18.9% NPR.un 30.62 5.0% 2.34 2.50 2.07 2.18 3.3% 15.0 14.8 14.1 77% 76% 15.8 15.6 39% 28.50 7.7% 7.4% 7.4%
Sum/Average 18.8x 13.8% Apt.avg 4.3% 7.4% 19.9 18.1 17.3 78% 78% 18.6 18.2 46% 5.6% 6.1%
Retail
Calloway REIT PB SP 17.5x $32.00 17.0% CWT.un 28.68 5.4% 1.86 1.94 1.76 1.84 5.7% 17.4 16.3 15.6 88% 84% 17.4 16.2 52% 27.58 6.3% 4.0% 6.3%
Crombie REIT PB SP 17.25x $16.00 15.1% CRR.un 14.68 6.1% 1.11 1.15 0.89 0.93 4.2% 17.2 16.5 15.8 100% 96% 14.2 13.1 52% 14.51 7.0% 1.2% 7.0%
First Capital Realty PB SP 20.0x $20.00 10.4% FCR 18.88 4.3% 1.06 1.12 0.95 1.00 5.4% 21.1 19.9 19.0 89% 84% 19.1 18.1 46% 16.94 6.3% 11.4% 5.9%
Primaris Retail REIT PB SP 1.15x NAVPU $27.50 7.9% PMZ.un 26.67 4.6% 1.56 1.61 1.33 1.38 3.9% 20.8 20.0 19.3 95% 92% 17.3 16.4 44% 23.81 6.0% 12.0% 5.6%
RioCan REIT** PB SP 20.0x $30.00 13.6% REI.un 27.65 5.0% 1.59 1.67 1.41 1.49 7.3% 21.3 19.5 18.5 100% 95% 18.7 17.3 43% 23.16 6.1% 19.4% 5.4%
Sum/Average 18.7x 12.8% Ret.avg 5.1% 5.3% 19.6 18.4 17.6 94% 90% 17.3 16.2 48% 9.6% 6.0%
Office
Allied Properties REIT MS SO 18.0x $34.00 9.2% AP.un 32.39 4.1% 1.98 2.21 1.67 1.89 12.3% 21.7 19.4 17.2 82% 76% 18.3 17.9 39% 27.00 6.8% 20.0% 5.9%
Brookfield Office Properties ($US) MS FS 20.5x $19.00 14.7% BPO 17.05 3.3% 1.17 1.05 0.83 0.68 -7.0% 21.7 20.5 25.1 67% 82% 15.8 16.6 51% 19.50 6.0% -12.6% 6.3%
Brookfield Office Properties Canada MS SP 21.25x $30.00 8.1% BOX.un 28.87 3.9% 1.57 1.73 1.26 1.41 9.9% 24.7 22.8 20.4 95% 91% 18.7 18.6 40% 30.00 5.5% -3.8% 5.6%
Dundee REIT MS SP 16.0x $40.25 14.0% D.un 37.26 5.9% 2.89 3.01 2.41 2.52 4.3% 16.1 15.5 14.8 93% 92% 15.2 14.9 51% 36.25 6.5% 2.8% 6.4%
NorthWest Healthcare Properties MS SP 15.25x $13.75 16.6% NWH.un 12.48 6.4% 1.04 1.09 0.85 0.90 6.7% 15.7 14.6 13.8 94% 88% 13.6 12.1 52% 12.00 6.9% 4.0% 6.7%
Sum/Average 18.9x 12.1% Off.avg 4.3% 4.9% 21.0 19.6 19.4 84% 85% 17.0 17.0 45% 1.6% 6.1%
Diversified
Artis REIT MS SP 14.75x $17.25 17.3% AX.un 15.63 6.9% 1.38 1.40 1.16 1.17 3.2% 14.2 13.5 13.3 93% 95% 14.8 14.6 53% 15.75 6.8% -0.8% 6.8%
Cominar REIT PB SO 16.0x $26.50 24.2% CUF.un 22.50 6.4% 1.83 1.90 1.57 1.65 4.3% 14.8 14.3 13.6 91% 87% 15.1 14.2 51% 21.22 6.8% 6.0% 6.6%
CREIT PB SO 18.0x $46.00 11.1% REF.un 42.75 3.4% 2.73 2.85 2.44 2.55 5.0% 18.5 17.5 16.8 61% 58% 18.3 17.2 46% 37.39 6.5% 14.3% 6.0%
Dundee International REIT PB SP 13.0x $11.50 14.7% DI.un 10.72 7.5% 0.95 1.00 0.84 0.89 12.1% 15.2 12.7 12.1 95% 90% 14.0 12.1 55% 8.67 8.1% 23.6% 7.3%
H&R REIT MS SP 16.5x $26.00 13.5% HR.un 24.07 4.9% 1.69 1.81 1.50 1.58 12.1% 19.1 16.1 15.2 90% 91% 15.5 15.2 52% 23.50 6.6% 2.4% 6.5%
Morguard REIT PB SP 15.5x $19.25 14.3% MRT.un 17.68 5.4% 1.49 1.55 1.19 1.24 6.6% 16.2 14.8 14.2 80% 77% 14.3 13.5 39% 20.01 6.5% -11.6% 7.0%
Sum/Average 15.6x 15.9% Div.avg 5.7% 7.2% 16.3 14.8 14.2 85% 83% 15.4 14.5 49% 5.7% 6.7%
Seniors Housing
Chartwell REIT PB SO 14.5x $11.50 13.2% CSH.un 10.64 5.1% 0.80 0.86 0.74 0.79 9.9% 16.2 14.4 13.4 73% 68% 16.3 16.3 60% 9.54 7.4% 11.5% 7.0%
Leisureworld PB SP 10.75x $13.00 11.4% LW 12.47 7.2% 1.00 1.06 1.15 1.22 0.1% 10.3 10.8 10.3 78% 74% 12.9 12.4 53% 11.22 8.9% 11.2% 8.3%
Sum/Average 13.8x 12.3% Sen.avg 6.0% 5.0% 13.3 12.6 11.8 76% 71% 14.6 14.3 57% 11.3% 7.7%
Lodging
InnVest REIT**** MS SP 13.0x $5.00 30.1% INN.un 4.15 9.6% 0.72 0.79 0.48 0.56 23.9% 11.3 8.7 7.4 84% 71% 9.7 8.9 64% 5.00 8.5% -17.0% 9.2%
Royal Host MS SU NAVPS $1.20 30.4% RYL 0.92 0.0% 0.16 0.21 -0.05 0.00 n/a n.m. n.m. n.m. 0% 0% 12.4 11.6 79% 1.20 9.0% -23.3% 10.5%
Sum/Average 13.0x 30.3% Lod.avg 4.8% 23.9% 11.3 8.7 7.4 84% 71% 11.1 10.2 71% -20.2% 9.9%
REIT Total Average*** 16.8x 15.1% REIT.avg 5.4% 7.6% 17.8 16.4 15.4 86% 83% 16.1 15.4 50% 6.1% 6.7%
Brookfield Asset Management ($US) MS SO NAV $39.25 9.7% BAM 36.29 1.5% 2.09 2.35 1.96 2.22 25.1 18.9 16.7 31% 29% 14.1 13.2 n/a 39.25 n.m. -7.5% n.m.
* PB = Pammi Bir, MS = Mario Saric, NR = Not Rated Ratings Key: FS = Focus Stock; SO = Sector Outperform; SP = Sector Perform; SU = Sector Underperform; NR = Not Rated, estimates based on consensus.** FFO, AFFO, and payout ratio estimates exclude gains. *** Averages exclude BPO and companies on restriction (if any). **** Valuation multiple applied to NTM AFFO
Source: Reuters; company reports; Scotiabank GBM estimates.
CO
MP
AR
AT
IVE
VA
LU
AT
ION
TA
BL
E

Focus 2013 January 2013
176
T H I S P A G E L E F T I N T E N T I O N A L L Y B L A N K
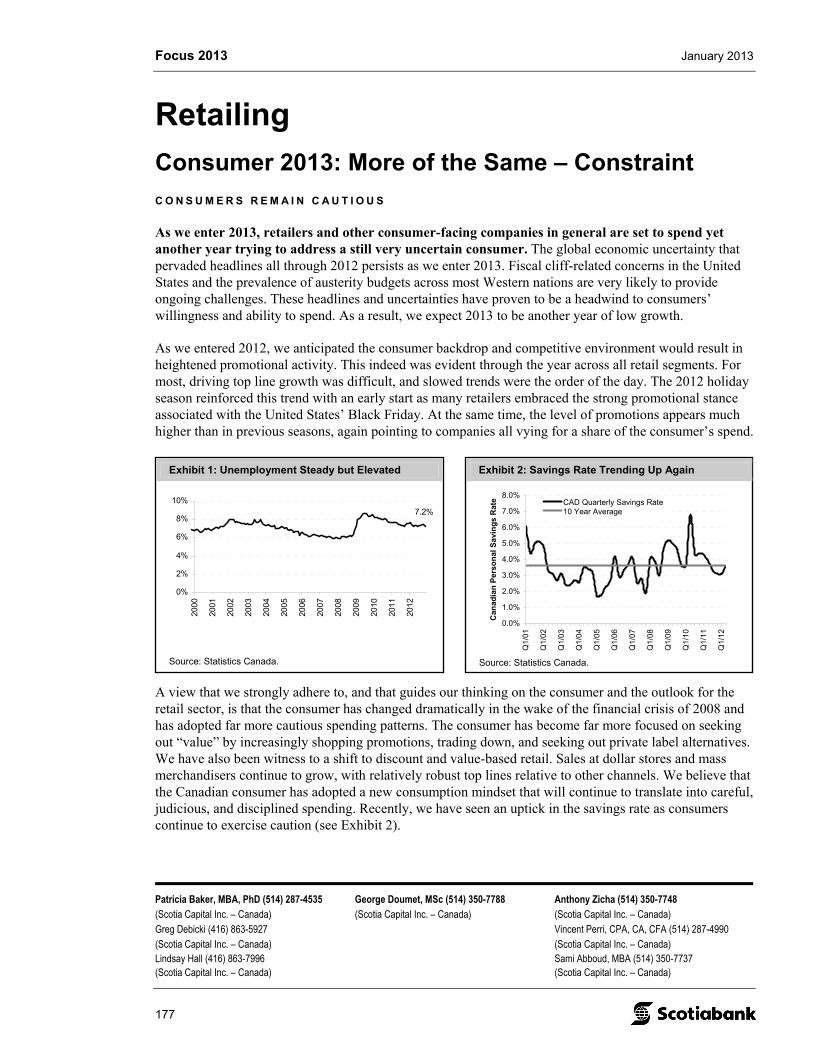
Focus 2013 January 2013
Patricia Baker, MBA, PhD (514) 287-4535 George Doumet, MSc (514) 350-7788 Anthony Zicha (514) 350-7748 (Scotia Capital Inc. – Canada) (Scotia Capital Inc. – Canada) (Scotia Capital Inc. – Canada) Greg Debicki (416) 863-5927 Vincent Perri, CPA, CA, CFA (514) 287-4990 (Scotia Capital Inc. – Canada) (Scotia Capital Inc. – Canada) Lindsay Hall (416) 863-7996 Sami Abboud, MBA (514) 350-7737 (Scotia Capital Inc. – Canada) (Scotia Capital Inc. – Canada)
177
Exhibit 1: Unemployment Steady but Elevated
7.2%
0%
2%
4%
6%
8%
10%
2000
2001
2002
2003
2004
2005
2006
2007
2008
2009
2010
2011
2012
Source: Statistics Canada.
Retailing
Consumer 2013: More of the Same – Constraint
C O N S U M E R S R E M A I N C A U T I O U S
As we enter 2013, retailers and other consumer-facing companies in general are set to spend yet another year trying to address a still very uncertain consumer. The global economic uncertainty that pervaded headlines all through 2012 persists as we enter 2013. Fiscal cliff-related concerns in the United States and the prevalence of austerity budgets across most Western nations are very likely to provide ongoing challenges. These headlines and uncertainties have proven to be a headwind to consumers’ willingness and ability to spend. As a result, we expect 2013 to be another year of low growth.
As we entered 2012, we anticipated the consumer backdrop and competitive environment would result in heightened promotional activity. This indeed was evident through the year across all retail segments. For most, driving top line growth was difficult, and slowed trends were the order of the day. The 2012 holiday season reinforced this trend with an early start as many retailers embraced the strong promotional stance associated with the United States’ Black Friday. At the same time, the level of promotions appears much higher than in previous seasons, again pointing to companies all vying for a share of the consumer’s spend.
A view that we strongly adhere to, and that guides our thinking on the consumer and the outlook for the retail sector, is that the consumer has changed dramatically in the wake of the financial crisis of 2008 and has adopted far more cautious spending patterns. The consumer has become far more focused on seeking out “value” by increasingly shopping promotions, trading down, and seeking out private label alternatives. We have also been witness to a shift to discount and value-based retail. Sales at dollar stores and mass merchandisers continue to grow, with relatively robust top lines relative to other channels. We believe that the Canadian consumer has adopted a new consumption mindset that will continue to translate into careful, judicious, and disciplined spending. Recently, we have seen an uptick in the savings rate as consumers continue to exercise caution (see Exhibit 2).
Exhibit 2: Savings Rate Trending Up Again
0.0%
1.0%
2.0%
3.0%
4.0%
5.0%
6.0%
7.0%
8.0%
Q1/
01
Q1/
02
Q1/
03
Q1/
04
Q1/
05
Q1/
06
Q1/
07
Q1/
08
Q1/
09
Q1/
10
Q1/
11
Q1/
12
Can
adia
n P
erso
nal
Sav
ing
s R
ate CAD Quarterly Savings Rate
10 Year Average
Source: Statistics Canada.
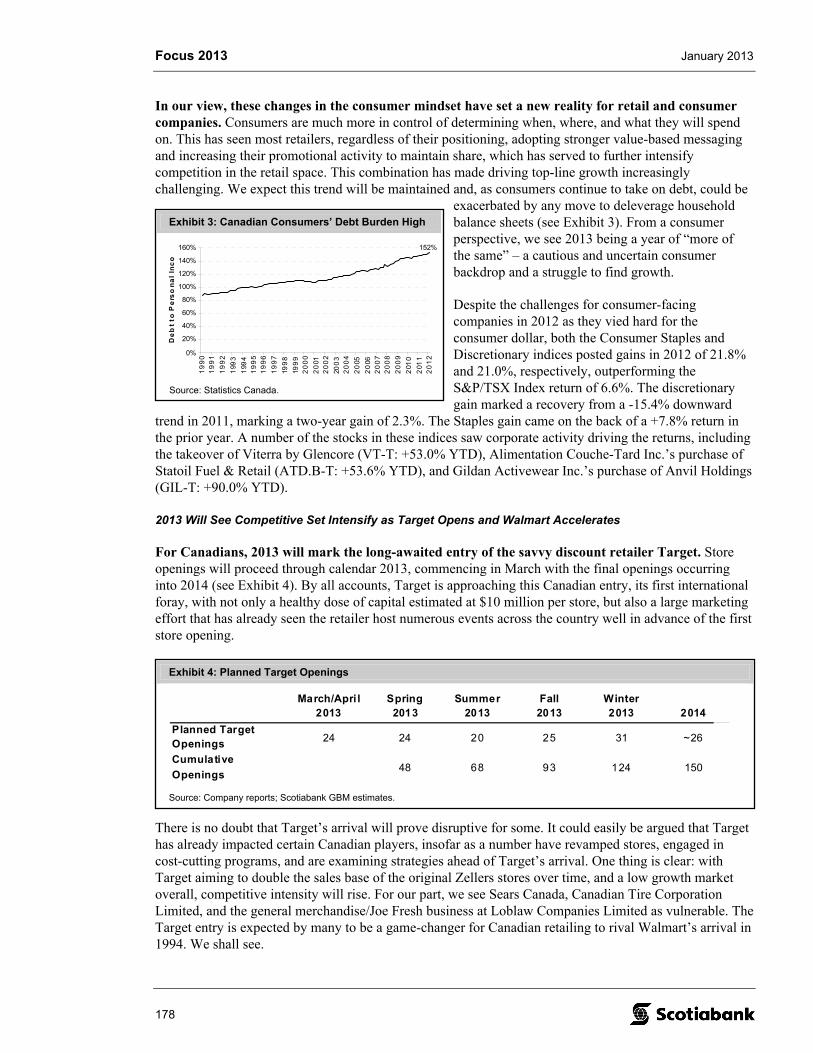
Focus 2013 January 2013
178
Exhibit 3: Canadian Consumers’ Debt Burden High
152%
0%
20%
40%
60%
80%
100%
120%
140%
160%
19
90
19
91
19
92
199
3
199
41
99
51
99
6
19
97
199
8
199
92
00
0
20
012
00
2
200
32
00
4
20
05
20
062
00
72
00
8
20
09
201
0
201
12
01
2
De
bt
to P
ers
on
al
Inc
o
Source: Statistics Canada.
Exhibit 4: Planned Target Openings
March/Apri l2013
Spring2013
Summer2013
Fall2013
Winter2013 2014
Planned Target Openings
24 24 20 25 31 ~26
Cumulative
Openings48 68 93 124 150
Source: Company reports; Scotiabank GBM estimates.
In our view, these changes in the consumer mindset have set a new reality for retail and consumer companies. Consumers are much more in control of determining when, where, and what they will spend on. This has seen most retailers, regardless of their positioning, adopting stronger value-based messaging and increasing their promotional activity to maintain share, which has served to further intensify competition in the retail space. This combination has made driving top-line growth increasingly challenging. We expect this trend will be maintained and, as consumers continue to take on debt, could be
exacerbated by any move to deleverage household balance sheets (see Exhibit 3). From a consumer perspective, we see 2013 being a year of “more of the same” – a cautious and uncertain consumer backdrop and a struggle to find growth.
Despite the challenges for consumer-facing companies in 2012 as they vied hard for the consumer dollar, both the Consumer Staples and Discretionary indices posted gains in 2012 of 21.8% and 21.0%, respectively, outperforming the S&P/TSX Index return of 6.6%. The discretionary gain marked a recovery from a -15.4% downward
trend in 2011, marking a two-year gain of 2.3%. The Staples gain came on the back of a +7.8% return in the prior year. A number of the stocks in these indices saw corporate activity driving the returns, including the takeover of Viterra by Glencore (VT-T: +53.0% YTD), Alimentation Couche-Tard Inc.’s purchase of Statoil Fuel & Retail (ATD.B-T: +53.6% YTD), and Gildan Activewear Inc.’s purchase of Anvil Holdings (GIL-T: +90.0% YTD).
2013 Will See Competitive Set Intensify as Target Opens and Walmart Accelerates
For Canadians, 2013 will mark the long-awaited entry of the savvy discount retailer Target. Store openings will proceed through calendar 2013, commencing in March with the final openings occurring into 2014 (see Exhibit 4). By all accounts, Target is approaching this Canadian entry, its first international foray, with not only a healthy dose of capital estimated at $10 million per store, but also a large marketing effort that has already seen the retailer host numerous events across the country well in advance of the first store opening.
There is no doubt that Target’s arrival will prove disruptive for some. It could easily be argued that Target has already impacted certain Canadian players, insofar as a number have revamped stores, engaged in cost-cutting programs, and are examining strategies ahead of Target’s arrival. One thing is clear: with Target aiming to double the sales base of the original Zellers stores over time, and a low growth market overall, competitive intensity will rise. For our part, we see Sears Canada, Canadian Tire Corporation Limited, and the general merchandise/Joe Fresh business at Loblaw Companies Limited as vulnerable. The Target entry is expected by many to be a game-changer for Canadian retailing to rival Walmart’s arrival in 1994. We shall see.
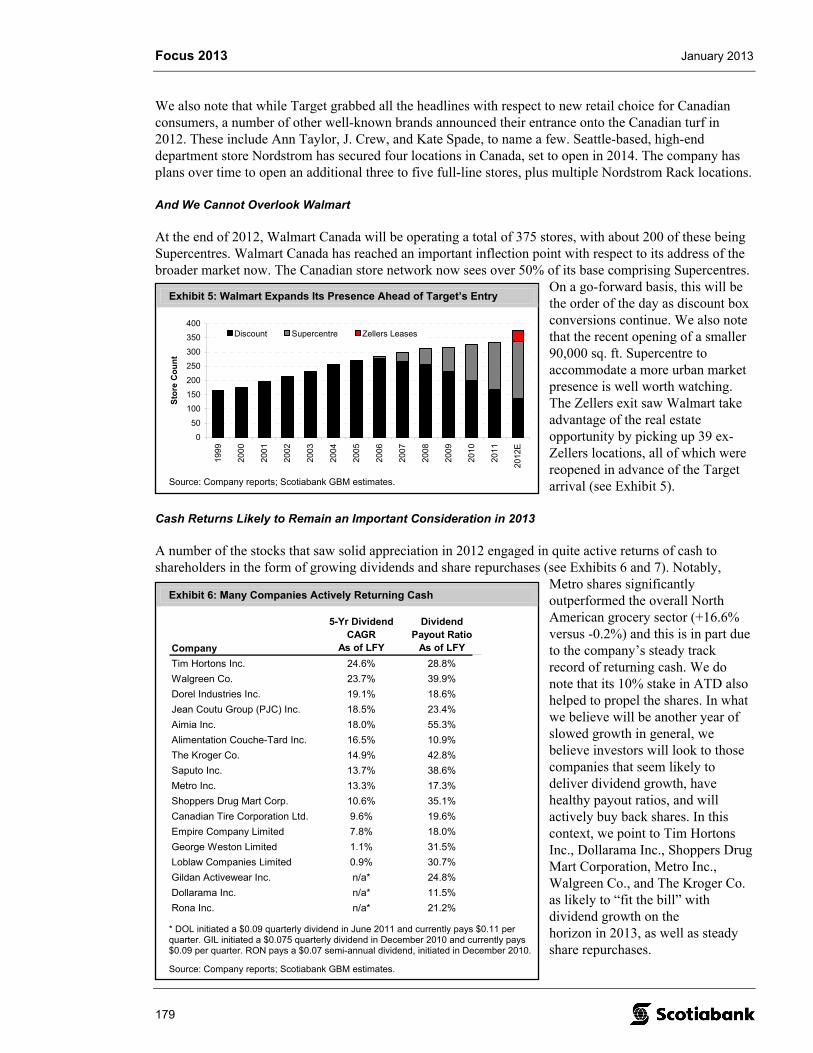
Focus 2013 January 2013
179
We also note that while Target grabbed all the headlines with respect to new retail choice for Canadian consumers, a number of other well-known brands announced their entrance onto the Canadian turf in 2012. These include Ann Taylor, J. Crew, and Kate Spade, to name a few. Seattle-based, high-end department store Nordstrom has secured four locations in Canada, set to open in 2014. The company has plans over time to open an additional three to five full-line stores, plus multiple Nordstrom Rack locations.
And We Cannot Overlook Walmart
At the end of 2012, Walmart Canada will be operating a total of 375 stores, with about 200 of these being Supercentres. Walmart Canada has reached an important inflection point with respect to its address of the broader market now. The Canadian store network now sees over 50% of its base comprising Supercentres.
On a go-forward basis, this will be the order of the day as discount box conversions continue. We also note that the recent opening of a smaller 90,000 sq. ft. Supercentre to accommodate a more urban market presence is well worth watching. The Zellers exit saw Walmart take advantage of the real estate opportunity by picking up 39 ex-Zellers locations, all of which were reopened in advance of the Target arrival (see Exhibit 5).
Cash Returns Likely to Remain an Important Consideration in 2013
A number of the stocks that saw solid appreciation in 2012 engaged in quite active returns of cash to shareholders in the form of growing dividends and share repurchases (see Exhibits 6 and 7). Notably,
Metro shares significantly outperformed the overall North American grocery sector (+16.6% versus -0.2%) and this is in part due to the company’s steady track record of returning cash. We do note that its 10% stake in ATD also helped to propel the shares. In what we believe will be another year of slowed growth in general, we believe investors will look to those companies that seem likely to deliver dividend growth, have healthy payout ratios, and will actively buy back shares. In this context, we point to Tim Hortons Inc., Dollarama Inc., Shoppers Drug Mart Corporation, Metro Inc., Walgreen Co., and The Kroger Co. as likely to “fit the bill” with dividend growth on the horizon in 2013, as well as steady share repurchases.
Exhibit 5: Walmart Expands Its Presence Ahead of Target’s Entry
0
50
100
150
200
250
300
350
400
1999
2000
2001
2002
2003
2004
2005
2006
2007
2008
2009
2010
2011
2012
E
Sto
re C
ou
nt
Discount Supercentre Zellers Leases
Source: Company reports; Scotiabank GBM estimates.
Exhibit 6: Many Companies Actively Returning Cash
Company
5-Yr Dividend CAGR
As of LFY
Dividend Payout Ratio
As of LFY
Tim Hortons Inc. 24.6% 28.8%
Walgreen Co. 23.7% 39.9%
Dorel Industries Inc. 19.1% 18.6%
Jean Coutu Group (PJC) Inc. 18.5% 23.4%
Aimia Inc. 18.0% 55.3%
Alimentation Couche-Tard Inc. 16.5% 10.9%
The Kroger Co. 14.9% 42.8%
Saputo Inc. 13.7% 38.6%
Metro Inc. 13.3% 17.3%
Shoppers Drug Mart Corp. 10.6% 35.1%
Canadian Tire Corporation Ltd. 9.6% 19.6%
Empire Company Limited 7.8% 18.0%
George Weston Limited 1.1% 31.5%
Loblaw Companies Limited 0.9% 30.7%
Gildan Activewear Inc. n/a* 24.8%
Dollarama Inc. n/a* 11.5%
Rona Inc. n/a* 21.2%
* DOL initiated a $0.09 quarterly dividend in June 2011 and currently pays $0.11 per quarter. GIL initiated a $0.075 quarterly dividend in December 2010 and currently pays $0.09 per quarter. RON pays a $0.07 semi-annual dividend, initiated in December 2010.
Source: Company reports; Scotiabank GBM estimates.
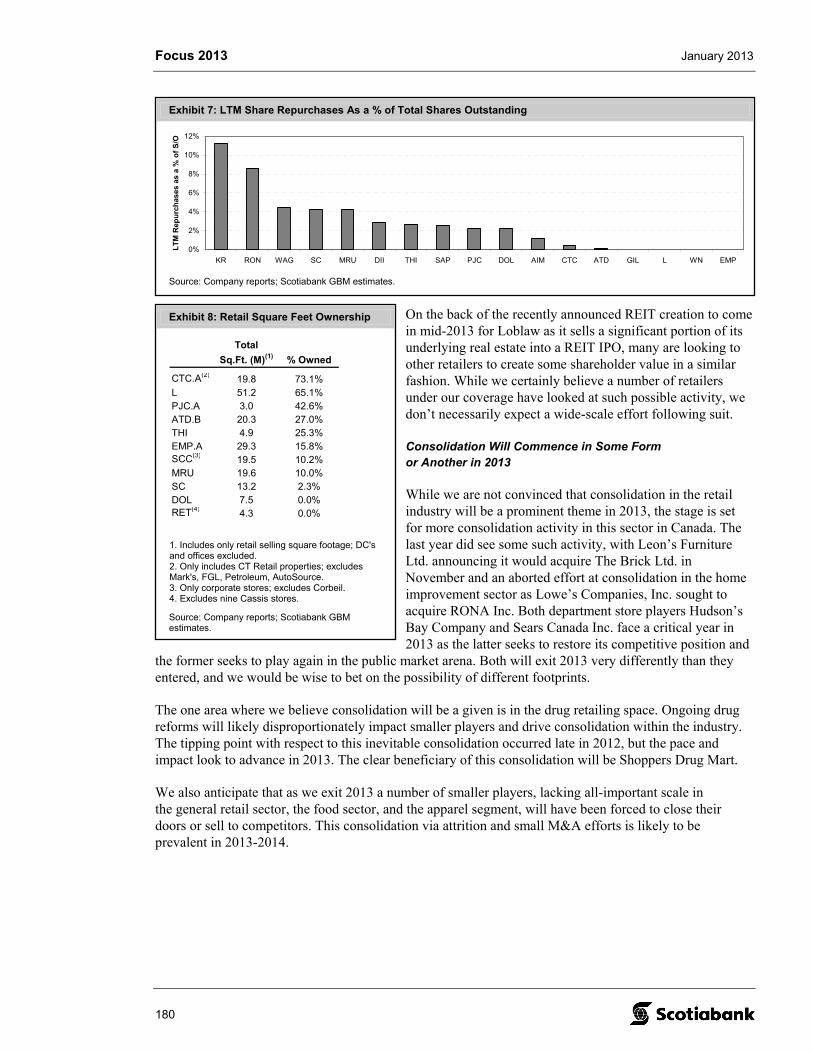
Focus 2013 January 2013
180
On the back of the recently announced REIT creation to come in mid-2013 for Loblaw as it sells a significant portion of its underlying real estate into a REIT IPO, many are looking to other retailers to create some shareholder value in a similar fashion. While we certainly believe a number of retailers under our coverage have looked at such possible activity, we don’t necessarily expect a wide-scale effort following suit.
Consolidation Will Commence in Some Form or Another in 2013
While we are not convinced that consolidation in the retail industry will be a prominent theme in 2013, the stage is set for more consolidation activity in this sector in Canada. The last year did see some such activity, with Leon’s Furniture Ltd. announcing it would acquire The Brick Ltd. in November and an aborted effort at consolidation in the home improvement sector as Lowe’s Companies, Inc. sought to acquire RONA Inc. Both department store players Hudson’s Bay Company and Sears Canada Inc. face a critical year in 2013 as the latter seeks to restore its competitive position and
the former seeks to play again in the public market arena. Both will exit 2013 very differently than they entered, and we would be wise to bet on the possibility of different footprints.
The one area where we believe consolidation will be a given is in the drug retailing space. Ongoing drug reforms will likely disproportionately impact smaller players and drive consolidation within the industry. The tipping point with respect to this inevitable consolidation occurred late in 2012, but the pace and impact look to advance in 2013. The clear beneficiary of this consolidation will be Shoppers Drug Mart.
We also anticipate that as we exit 2013 a number of smaller players, lacking all-important scale in the general retail sector, the food sector, and the apparel segment, will have been forced to close their doors or sell to competitors. This consolidation via attrition and small M&A efforts is likely to be prevalent in 2013-2014.
Exhibit 7: LTM Share Repurchases As a % of Total Shares Outstanding
0%
2%
4%
6%
8%
10%
12%
KR RON WAG SC MRU DII THI SAP PJC DOL AIM CTC ATD GIL L WN EMP
LT
M R
epu
rch
ases
as
a %
of
S/O
Source: Company reports; Scotiabank GBM estimates.
Exhibit 8: Retail Square Feet Ownership
Total
Sq.Ft. (M)(1) % Owned
CTC.A(2)19.8 73.1%
L 51.2 65.1%PJC.A 3.0 42.6%ATD.B 20.3 27.0%THI 4.9 25.3%EMP.A 29.3 15.8%SCC(3)
19.5 10.2%MRU 19.6 10.0%SC 13.2 2.3%DOL 7.5 0.0%RET(4)
4.3 0.0%
1. Includes only retail selling square footage; DC's and offices excluded. 2. Only includes CT Retail properties; excludes Mark's, FGL, Petroleum, AutoSource. 3. Only corporate stores; excludes Corbeil. 4. Excludes nine Cassis stores.
Source: Company reports; Scotiabank GBM estimates.
Focus 2013 January 2013
181
O U T P E R F O R M E R S
Dollarama Inc. (DOL-T; Focus Stock; One-Year Target $67.00) – Patricia Baker
We have upgraded Dollarama to Focus Stock from Sector Outperform.
A possible Target winner. A recent pullback in Dollarama shares (-10.0% from peak) provides a good entry point on these shares, in our view, and sets the stage for another year of likely outperformance. Dollarama, we believe, will benefit from the Target openings throughout 2013. Dollarama outlets tend to outperform when located adjacent to or near large discount boxes. Dollarama has 59 locations, 8% of its store base, located within the same shopping malls as planned Target stores, and close to 15% of its store base (106 stores) located within 2.5 km of planned Target stores; well within a reasonable shopping radius. The outperformance has been well borne out by Dollarama’s experience to date competing with Walmart in Canada. There is every expectation that the Dollarama sales performance for stores near or adjacent to Target should be similar.
Strong growth profile with defensive characteristics. Dollarama also possesses solid defensive characteristics, which should see it continue to perform well in an uncertain economy. Indeed, since its debut as a public company in 2009, the economic backdrop has been anything but robust and Dollarama has experienced exceptional sales and earnings growth. Over the past five years, sales growth has averaged 12.5% per year, translating into 41.7% annual EPS growth. Dollarama also sports among the strongest store growth profiles in Canadian retail; the company looks to add 75 to 85 net new stores in F2013, up from 52 in F2012.
Higher price points are a catalyst for growth and share. Dollarama introduced price points above $1 in 2009 and this has proved quite a successful strategy in driving not only basket, but also items, and in turn same store sales growth and operating leverage. The recent decision (in June 2012) to add some $3 items, we believe, will prove equally successful. This move will permit Dollarama to offer Canadian consumers even more choice in general merchandise and, as a result, see added share gains.
Recent pullback presents opportunity. The recent 10.0% pullback in the shares is, in our view, related to some fatigue and worry around the dollar store segment in the United States. Dollar General made cautious comments regarding the state of the consumer during its Q3 earnings call, noting that consumers were fatigued, spending closer to their needs, responding to promotional cycles, and fearful of the fiscal cliff. This could see the competitive environment heat up in response as retailers try to hold onto sales. Dollar General is also entering tobacco – a category with a dwindling customer base and low margins. The related sell-off of the dollar store space was, in our view, unwarranted. Dollarama’s operating model remains strong and its value proposition continues to resonate well with consumers. The recently instated dividend and the 3.5% NCIB program ticks the box for us with Dollarama with respect to important return of cash to shareholders in 2013. We are upgrading Dollarama to a Focus Stock at this time.
Gildan Activewear Inc. (GIL-T; Focus Stock; One-Year Target $43.00) – Anthony Zicha
We have upgraded Gildan to Focus Stock from Sector Outperform.
Positive outlook. Gildan recently initiated guidance for F2013 with an EPS range of $2.60 to $2.70. This compares with the $1.28 in earnings per share generated in F2012. The earnings improvement over last year reflects lower cotton costs, higher unit sales volumes, a favourable product mix, increased efficiencies and impact from acquisitions offset by lower selling prices, increased promotional activity, inflation in some input costs, and higher SG&A.
Focus 2013 January 2013
182
New branded programs support retail initiative. The company has recently secured new branded programs for F2013 with national and regional chains, which we believe should continue to support the company’s retail initiatives. These programs are expected to begin shipment in 2H/F2013. New business is estimated at roughly $100 million on an annualized basis, with $50 million expected to be shipped in F2013 and the balance in F2014. Gildan expects the Branded Apparel segment to generate sales of roughly $0.7 billion in F2013. We expect this implied growth of approximately 14% to be supported by the Anvil acquisition as well as new branded programs.
Lower cotton prices to support margins. We expect margins to continue to improve, supported by lower cotton prices and initiatives taken by the company. We note that a $0.01 change in cotton prices translates into an EPS impact of roughly $0.03. Corporate initiatives to improve profitability include: (1) an increased focus on higher-value branded programs and exit from unprofitable private label programs, (2) repatriation of socks sourced from Asia into Gildan’s low-cost Honduran operations, and (3) synergies stemming from the Anvil acquisition. We note that management expects Anvil acquisition synergies to result in approximately US$0.10 EPS accretion in F2013.
Tim Hortons Inc. (THI-T; Sector Outperform; One-Year Target $57.00) – Patricia Baker
Recent trading in THI has seen the shares off 15.9% from a peak of $57.91 in May. Slowed sales trends caused a shift to a more cautious sentiment on the stock and some profit taking. Commencing in Q2, same-store sales have trended much lower than in the past, with the company reporting SSS growth of 1.9% and 1.8% in Q3 and Q2, respectively, down from 5.2% in Q1. We believe, however, performance relative to the market is what is critical. With no shortage of economic concerns on both sides of the border, consumption trends are weak generally and competitive activity is up. Relative to the market, we see THI executing well in a tough market and poised to further outperform. THI is holding its own and is actually gaining share. The appointment of a new CEO in 2013 should alleviate uncertainty for investors and will more than likely prove to be a positive catalyst.
Seeing market share gains across all dayparts. THI has seen steady growth in overall QSR market share across all dayparts over the last five years, according to Crest Industry Research. Notably, the largest gains have been in the lunchtime daypart, where share has expanded 350 bp. Lunch is a major focus for THI and should see further gains, we believe, on the back of the “Panini” rollout and other such menu adds.
Favourable commodities outlook. THI is facing a favourable commodities market in 2013. While wheat prices have been driven up as a result of drought, the prices of coffee, sugar, and cooking oils are seeing declines. This bodes well for restaurant operators who have had to endure rapidly rising commodity costs while raising prices only modestly.
Potential for >4,000 restaurants in Canada may be conservative. THI sees considerably greater opportunity for restaurant development in the Canadian market than had earlier been expected and is now pointing to a stated goal of approximately 4,000 units as conservative. THI sees a greater acceptance and potential for the brand in more urban markets. Downtown Toronto, to name one, is a particularly underpenetrated market for THI with significant potential. Certainly, as the THI menu expands and it gains share across dayparts, this too increases the appeal and potential for the brand. Further, THI faces capacity constraints in certain markets where demand continues to grow. THI is addressing this through new restaurant development, rollout of double drive-throughs, and other operational initiatives to improve productivity and throughput at existing locations.
Focus 2013 January 2013
183
U N D E R P E R F O R M E R S
Canadian Tire Corporation Limited (CTC.A-T; Sector Perform; One-Year Target $70.00) – Patricia Baker
Shares will remain range-bound. Given that consumers have adopted a much more cautious outlook that looks set to stay, and spending appears to be muted through 2013, we remain fairly cautious on the more discretionary plays in the retail space in the coming year. As a result, we hold a less favourable view of Canadian Tire shares than most. Further, we believe the business is vulnerable to the entry of Target, which will serve to shake up the Canadian retailing market. We would advocate taking more of a trading stance on the shares, as the company tends to present such opportunities. We would look to taking profits above the $70 level and look to add in the sub-$65 range, rather than aggressively pursuing the shares in the $65+ range.
Aimia (AIM-T; Sector Underperform; One-Year Target $13.50) – Anthony Zicha
Guidance reiterated. During its most recent quarterly results, Aimia reiterated its 2012 guidance with gross billings growth between 3% and 5%, adjusted EBITDA (AEBITDA) of $370 million to $380 million, and free cash flow of $220 million to $240 million.
Partnerships to create value. We believe investments in Club Premier and China Rewards should create shareholder value over the next few years. We note that Aimia’s investment in Club Premier ($121.8 million paid for 49% share) has already doubled in value (based on management’s valuation of Club Premier at $518 million).
Potential challenges. While we expect Aimia’s strategy to develop new partnerships, and investments should support growth going forward, we believe 2013 could be a challenging year given the potential impact of the pending Canadian Competition Tribunal’s ruling on the “no surcharge” rule imposed by Visa (V-N) and MasterCard (MA-N) on Canadian merchants and the current economic environment characterized by low consumer sentiment.
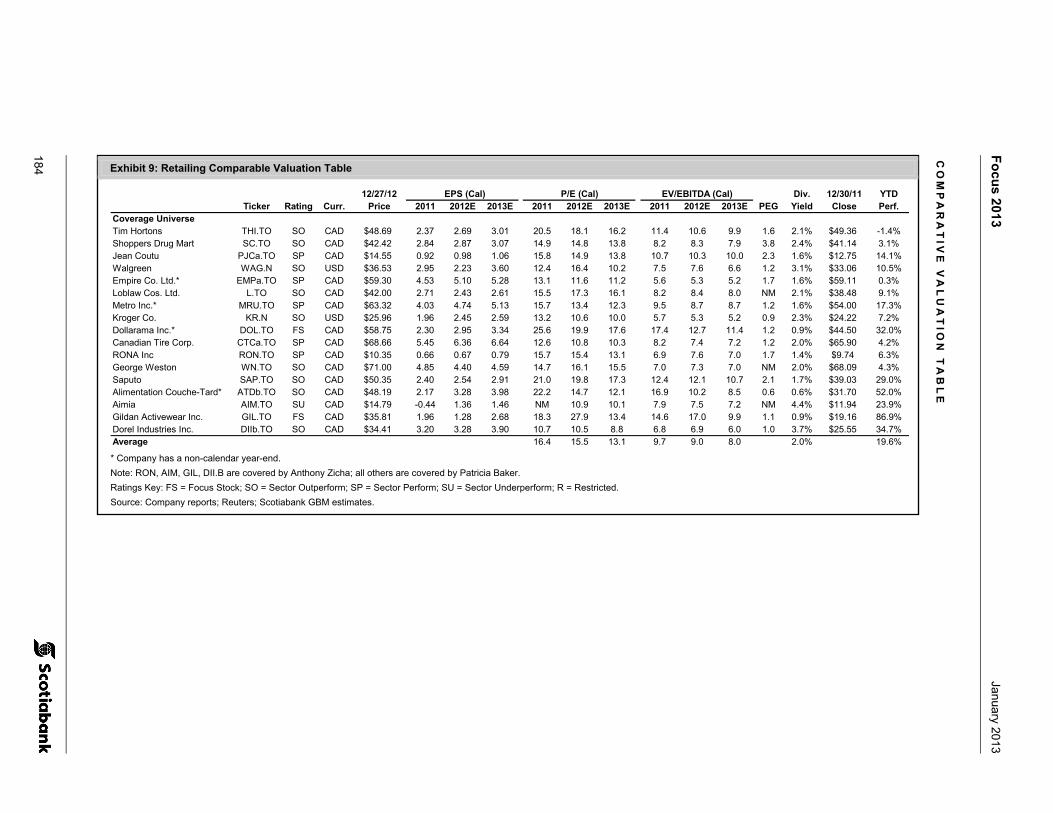
Fo
cus 2013
January 2013
184 Exhibit 9: Retailing Comparable Valuation Table
12/27/12 EPS (Cal) P/E (Cal) EV/EBITDA (Cal) Div. 12/30/11 YTDTicker Rating Curr. Price 2011 2012E 2013E 2011 2012E 2013E 2011 2012E 2013E PEG Yield Close Perf.
Coverage UniverseTim Hortons THI.TO SO CAD $48.69 2.37 2.69 3.01 20.5 18.1 16.2 11.4 10.6 9.9 1.6 2.1% $49.36 -1.4%Shoppers Drug Mart SC.TO SO CAD $42.42 2.84 2.87 3.07 14.9 14.8 13.8 8.2 8.3 7.9 3.8 2.4% $41.14 3.1%Jean Coutu PJCa.TO SP CAD $14.55 0.92 0.98 1.06 15.8 14.9 13.8 10.7 10.3 10.0 2.3 1.6% $12.75 14.1%Walgreen WAG.N SO USD $36.53 2.95 2.23 3.60 12.4 16.4 10.2 7.5 7.6 6.6 1.2 3.1% $33.06 10.5%Empire Co. Ltd.* EMPa.TO SP CAD $59.30 4.53 5.10 5.28 13.1 11.6 11.2 5.6 5.3 5.2 1.7 1.6% $59.11 0.3%Loblaw Cos. Ltd. L.TO SO CAD $42.00 2.71 2.43 2.61 15.5 17.3 16.1 8.2 8.4 8.0 NM 2.1% $38.48 9.1%Metro Inc.* MRU.TO SP CAD $63.32 4.03 4.74 5.13 15.7 13.4 12.3 9.5 8.7 8.7 1.2 1.6% $54.00 17.3%Kroger Co. KR.N SO USD $25.96 1.96 2.45 2.59 13.2 10.6 10.0 5.7 5.3 5.2 0.9 2.3% $24.22 7.2%Dollarama Inc.* DOL.TO FS CAD $58.75 2.30 2.95 3.34 25.6 19.9 17.6 17.4 12.7 11.4 1.2 0.9% $44.50 32.0%Canadian Tire Corp. CTCa.TO SP CAD $68.66 5.45 6.36 6.64 12.6 10.8 10.3 8.2 7.4 7.2 1.2 2.0% $65.90 4.2%RONA Inc RON.TO SP CAD $10.35 0.66 0.67 0.79 15.7 15.4 13.1 6.9 7.6 7.0 1.7 1.4% $9.74 6.3%George Weston WN.TO SO CAD $71.00 4.85 4.40 4.59 14.7 16.1 15.5 7.0 7.3 7.0 NM 2.0% $68.09 4.3%Saputo SAP.TO SO CAD $50.35 2.40 2.54 2.91 21.0 19.8 17.3 12.4 12.1 10.7 2.1 1.7% $39.03 29.0%Alimentation Couche-Tard* ATDb.TO SO CAD $48.19 2.17 3.28 3.98 22.2 14.7 12.1 16.9 10.2 8.5 0.6 0.6% $31.70 52.0%Aimia AIM.TO SU CAD $14.79 -0.44 1.36 1.46 NM 10.9 10.1 7.9 7.5 7.2 NM 4.4% $11.94 23.9%Gildan Activewear Inc. GIL.TO FS CAD $35.81 1.96 1.28 2.68 18.3 27.9 13.4 14.6 17.0 9.9 1.1 0.9% $19.16 86.9%Dorel Industries Inc. DIIb.TO SO CAD $34.41 3.20 3.28 3.90 10.7 10.5 8.8 6.8 6.9 6.0 1.0 3.7% $25.55 34.7%Average 16.4 15.5 13.1 9.7 9.0 8.0 2.0% 19.6% * Company has a non-calendar year-end.
Note: RON, AIM, GIL, DII.B are covered by Anthony Zicha; all others are covered by Patricia Baker.
Ratings Key: FS = Focus Stock; SO = Sector Outperform; SP = Sector Perform; SU = Sector Underperform; R = Restricted.
Source: Company reports; Reuters; Scotiabank GBM estimates.
CO
MP
AR
AT
IVE
VA
LU
AT
ION
TA
BL
E
Focus 2013 January 2013
Paul Steep, MBA (416) 945-4310 Andy Ko, MBA, CFA (416) 863-7993 (Scotia Capital Inc. – Canada) (Scotia Capital Inc. – Canada) [email protected] [email protected]
185
Software & IT Services
Stabilization of Demand
G R O W T H S T A B I L I Z E S A S S O F T W A R E A N D I T S P E N D I N G D A M P E N E D
According to Gartner Inc., global enterprise IT spending is expected to grow by 2.5% in 2013 (versus an estimated increase of 2.3% in 2011), citing a flat environment given global economic weakness. IT spending within the public sector is expected to decline by 2% in 2013 given budget restrictions, while transportation and insurance are forecast to grow by 4%.
T E C H N O L O G Y T H E M E S A N T I C I P A T E D T O I N F L U E N C E 2 0 1 3 R E S U L T S
Volume of M&A Expected to Remain High
Our expectation is that 2013 will be a busy year for M&A activity across the software and IT services industry, fuelled by a combination of disruptive technology changes (e.g., software as a service [SaaS] and mobile) and low returns on cash. In 2012, acquisition activity across the sector remained at a high pace as leading vendors sought to expand their portfolios of software businesses. Our expectation is that in 2013 investors will see further consolidation across various software markets in particular as firms aggressively bid for companies that are centred on emerging technology themes.
Organizations Adopting Tools to Manage Flood of Data
The emergence of big data and analytics tools remains one of the key areas of focus by large technology vendors. Over the past several years, we have witnessed businesses begin to actively invest in a new generation of tools designed to manage increasing quantities of data from a variety of sources. We believe that organizations remain in a multi-year transition as enterprises increasingly adopt new tools to assist in managing and monitoring their operations.
Transition Toward Cloud-based Services
Over the past several years, customers have increasingly sought to deploy cloud-based enterprise software solutions across a number of application areas. In our opinion, the market continues to adapt to changes in customer-buying behaviour and their willingness to transition to hosted application solutions. We believe that the evolution toward a greater percentage of customers opting to purchase software under an SaaS agreement is a positive step for the industry, helping to bring the economics of software vendors into alignment with the value received by customers. Our expectation is that this transition period is likely to remain a key trend in the industry over the next five years as customers’ buying patterns adapt to this shift. While few of our covered companies have exposure to this market, we continue to expect to see increased efforts in product development and selective acquisitions to increase their focus in this area. In 2012, Open Text Corporation (Open Text) acquired EasyLink, enabling the firm to offer cloud-based services to customers across a range of messaging solutions. During 2012, a number of noteworthy acquisitions occurred as IBM, Oracle, and SAP all pursued deals designed to further increase their SaaS revenue base.
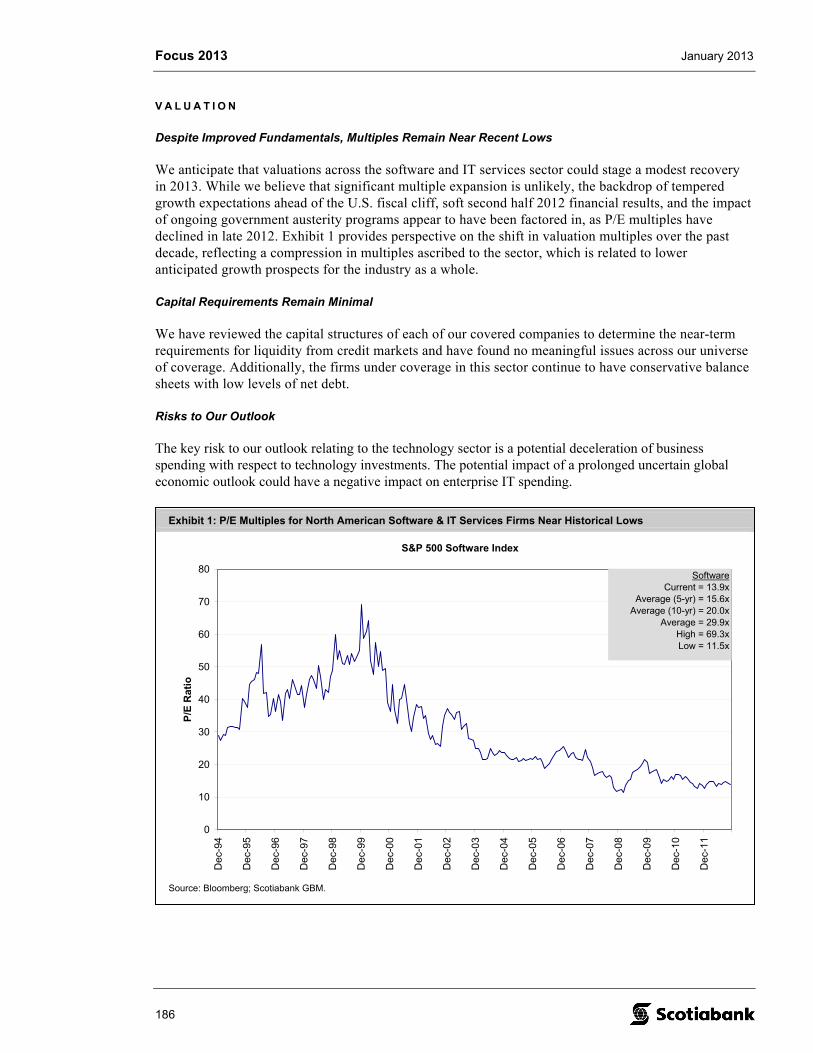
Focus 2013 January 2013
186
V A L U A T I O N
Despite Improved Fundamentals, Multiples Remain Near Recent Lows
We anticipate that valuations across the software and IT services sector could stage a modest recovery in 2013. While we believe that significant multiple expansion is unlikely, the backdrop of tempered growth expectations ahead of the U.S. fiscal cliff, soft second half 2012 financial results, and the impact of ongoing government austerity programs appear to have been factored in, as P/E multiples have declined in late 2012. Exhibit 1 provides perspective on the shift in valuation multiples over the past decade, reflecting a compression in multiples ascribed to the sector, which is related to lower anticipated growth prospects for the industry as a whole.
Capital Requirements Remain Minimal
We have reviewed the capital structures of each of our covered companies to determine the near-term requirements for liquidity from credit markets and have found no meaningful issues across our universe of coverage. Additionally, the firms under coverage in this sector continue to have conservative balance sheets with low levels of net debt.
Risks to Our Outlook
The key risk to our outlook relating to the technology sector is a potential deceleration of business spending with respect to technology investments. The potential impact of a prolonged uncertain global economic outlook could have a negative impact on enterprise IT spending.
Exhibit 1: P/E Multiples for North American Software & IT Services Firms Near Historical Lows
S&P 500 Software Index
0
10
20
30
40
50
60
70
80
Dec
-94
Dec
-95
Dec
-96
Dec
-97
Dec
-98
Dec
-99
Dec
-00
Dec
-01
Dec
-02
Dec
-03
Dec
-04
Dec
-05
Dec
-06
Dec
-07
Dec
-08
Dec
-09
Dec
-10
Dec
-11
P/E
Rat
io
SoftwareCurrent = 13.9x
Average (5-yr) = 15.6xAverage (10-yr) = 20.0x
Average = 29.9xHigh = 69.3xLow = 11.5x
Source: Bloomberg; Scotiabank GBM.
Focus 2013 January 2013
187
O U T P E R F O R M E R
Open Text Corporation (Sector Outperform; One-Year Target US$64.00)
We believe the primary arguments for owning Open Text’s stock in the longer term are the following: (1) strong return on invested capital (ROIC) forecast at > 20%; (2) the firm’s position as a consolidator in the enterprise information management (EIM) market; and (3) potential acquisition target.
1. Focus on EIM creates a larger market opportunity. Our view is that Open Text is positioned to benefit from a broader strategy vision as it moves past a period of transition within its sales force. The firm articulated a strategy to pursue growth across a more broadly defined market space (e.g., EIM), which creates coherence across its product offerings and expands the potential market opportunity.
2. Aiming to deliver sustained profitability while investing for growth in EIM. Open Text has committed to a strategy that will see the firm continue to deliver solid free cash flow (FCF) returns to investors. Management is focused on returning the firm to above-market organic licence revenue growth by F2014 through reinvestment in new products. Additionally, we believe that Open Text will be positioned to pursue further acquisitions as it integrates EasyLink and begins to deliver its balance sheet.
Key risks. Our call on Open Text is exposed to a number of risks, most notably the firm’s ability to deliver consistent growth in licence revenues. Over the past few quarters, the firm has undergone significant organizational change, having made a number of changes to the senior management team. In F2012, the firm executed a sales force reorganization designed to improve operating results, particularly licence revenues. Given the scrutiny placed on licence revenue growth, the stock is subject to significant quarterly volatility around earnings.
U N D E R P E R F O R M E R
Absolute Software Corporation (Sector Perform; One-Year Target $5.00)
1. Quarterly volatility in sales contracts. Our view is that Absolute remains exposed to significant quarter-to-quarter volatility in pipeline execution and sales contracts. A combination of challenging economic conditions and a major transition in customers’ computing environments are anticipated to contribute to volatility in the firm’s results. The firm remains significantly exposed to the market for new personal computers, which remains under pressure as tablets take market share and replacement cycles for PCs remain extended.
2. Potential execution risk in transformation. We continue to believe that the firm is going through a period of significant change as it seeks to evolve its product set to adjust to a changing PC market. We anticipate that Absolute will continue to actively work toward becoming an end-point security company through internal product development and selective acquisitions. The acquisition of LiveTime helps build out Absolute’s product offering in the lifecycle management market.
Key risks. We note that the recent appointments of Eric Rosenfeld and Gregory Monahan from Crescendo Partners to the firm’s board of directors creates the potential for new initiatives to unlock shareholder value. Crescendo Partners have been an active investor and board member in a number of Canadian software and technology firms, which have resulted in a number of acquisitions.
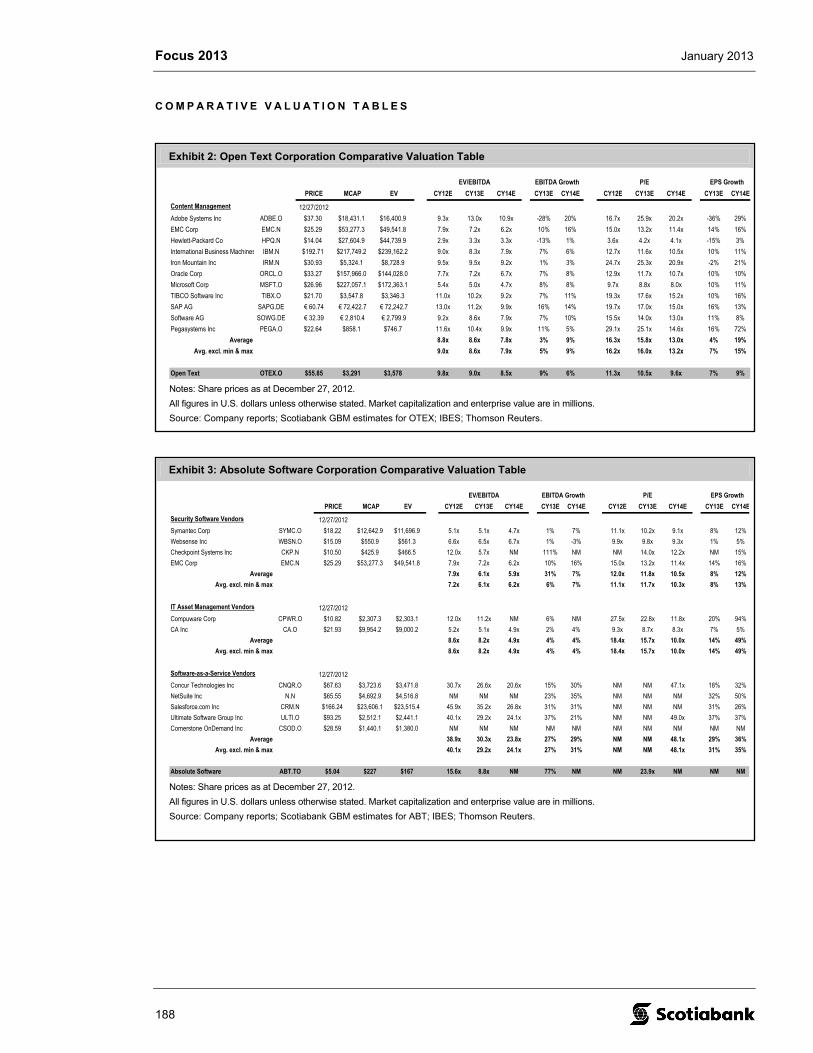
Focus 2013 January 2013
188
Exhibit 2: Open Text Corporation Comparative Valuation Table
EV/EBITDA EBITDA Growth P/E EPS GrowthPRICE MCAP EV CY12E CY13E CY14E CY13E CY14E CY12E CY13E CY14E CY13E CY14E
Content Management 12/27/2012Adobe Systems Inc ADBE.O $37.30 $18,431.1 $16,400.9 9.3x 13.0x 10.9x -28% 20% 16.7x 25.9x 20.2x -36% 29%EMC Corp EMC.N $25.29 $53,277.3 $49,541.8 7.9x 7.2x 6.2x 10% 16% 15.0x 13.2x 11.4x 14% 16%Hewlett-Packard Co HPQ.N $14.04 $27,604.9 $44,739.9 2.9x 3.3x 3.3x -13% 1% 3.6x 4.2x 4.1x -15% 3%International Business Machines IBM.N $192.71 $217,749.2 $239,162.2 9.0x 8.3x 7.9x 7% 6% 12.7x 11.6x 10.5x 10% 11%Iron Mountain Inc IRM.N $30.93 $5,324.1 $8,728.9 9.5x 9.5x 9.2x 1% 3% 24.7x 25.3x 20.9x -2% 21%Oracle Corp ORCL.O $33.27 $157,966.0 $144,028.0 7.7x 7.2x 6.7x 7% 8% 12.9x 11.7x 10.7x 10% 10%Microsoft Corp MSFT.O $26.96 $227,057.1 $172,363.1 5.4x 5.0x 4.7x 8% 8% 9.7x 8.8x 8.0x 10% 11%TIBCO Software Inc TIBX.O $21.70 $3,547.8 $3,346.3 11.0x 10.2x 9.2x 7% 11% 19.3x 17.6x 15.2x 10% 16%SAP AG SAPG.DE € 60.74 € 72,422.7 € 72,242.7 13.0x 11.2x 9.9x 16% 14% 19.7x 17.0x 15.0x 16% 13%Software AG SOWG.DE € 32.39 € 2,810.4 € 2,799.9 9.2x 8.6x 7.9x 7% 10% 15.5x 14.0x 13.0x 11% 8%Pegasystems Inc PEGA.O $22.64 $858.1 $746.7 11.6x 10.4x 9.9x 11% 5% 29.1x 25.1x 14.6x 16% 72%
Average 8.8x 8.6x 7.8x 3% 9% 16.3x 15.8x 13.0x 4% 19%Avg. excl. min & max 9.0x 8.6x 7.9x 5% 9% 16.2x 16.0x 13.2x 7% 15%
Open Text OTEX.O $55.85 $3,291 $3,578 9.8x 9.0x 8.5x 9% 6% 11.3x 10.5x 9.6x 7% 9% Notes: Share prices as at December 27, 2012.
All figures in U.S. dollars unless otherwise stated. Market capitalization and enterprise value are in millions.
Source: Company reports; Scotiabank GBM estimates for OTEX; IBES; Thomson Reuters.
Exhibit 3: Absolute Software Corporation Comparative Valuation Table
EV/EBITDA EBITDA Growth P/E EPS GrowthPRICE MCAP EV CY12E CY13E CY14E CY13E CY14E CY12E CY13E CY14E CY13E CY14E
Security Software Vendors 12/27/2012Symantec Corp SYMC.O $18.22 $12,642.9 $11,696.9 5.1x 5.1x 4.7x 1% 7% 11.1x 10.2x 9.1x 8% 12%Websense Inc WBSN.O $15.09 $550.9 $561.3 6.6x 6.5x 6.7x 1% -3% 9.9x 9.8x 9.3x 1% 5%Checkpoint Systems Inc CKP.N $10.50 $425.9 $466.5 12.0x 5.7x NM 111% NM NM 14.0x 12.2x NM 15%EMC Corp EMC.N $25.29 $53,277.3 $49,541.8 7.9x 7.2x 6.2x 10% 16% 15.0x 13.2x 11.4x 14% 16%
Average 7.9x 6.1x 5.9x 31% 7% 12.0x 11.8x 10.5x 8% 12%Avg. excl. min & max 7.2x 6.1x 6.2x 6% 7% 11.1x 11.7x 10.3x 8% 13%
IT Asset Management Vendors 12/27/2012Compuware Corp CPWR.O $10.82 $2,307.3 $2,303.1 12.0x 11.2x NM 6% NM 27.5x 22.8x 11.8x 20% 94%CA Inc CA.O $21.93 $9,954.2 $9,000.2 5.2x 5.1x 4.9x 2% 4% 9.3x 8.7x 8.3x 7% 5%
Average 8.6x 8.2x 4.9x 4% 4% 18.4x 15.7x 10.0x 14% 49%Avg. excl. min & max 8.6x 8.2x 4.9x 4% 4% 18.4x 15.7x 10.0x 14% 49%
Software-as-a-Service Vendors 12/27/2012Concur Technologies Inc CNQR.O $67.63 $3,723.6 $3,471.8 30.7x 26.6x 20.6x 15% 30% NM NM 47.1x 18% 32%NetSuite Inc N.N $65.55 $4,692.9 $4,516.8 NM NM NM 23% 35% NM NM NM 32% 50%Salesforce.com Inc CRM.N $166.24 $23,606.1 $23,515.4 45.9x 35.2x 26.8x 31% 31% NM NM NM 31% 26%Ultimate Software Group Inc ULTI.O $93.25 $2,512.1 $2,441.1 40.1x 29.2x 24.1x 37% 21% NM NM 49.0x 37% 37%Cornerstone OnDemand Inc CSOD.O $28.59 $1,440.1 $1,380.0 NM NM NM NM NM NM NM NM NM NM
Average 38.9x 30.3x 23.8x 27% 29% NM NM 48.1x 29% 36%Avg. excl. min & max 40.1x 29.2x 24.1x 27% 31% NM NM 48.1x 31% 35%
Absolute Software ABT.TO $5.04 $227 $167 15.6x 8.8x NM 77% NM NM 23.9x NM NM NM Notes: Share prices as at December 27, 2012.
All figures in U.S. dollars unless otherwise stated. Market capitalization and enterprise value are in millions.
Source: Company reports; Scotiabank GBM estimates for ABT; IBES; Thomson Reuters.
C O M P A R A T I V E V A L U A T I O N T A B L E S

Focus 2013 January 2013
Anthony Zicha (514) 350-7748 Sami Abboud, MBA (514) 350-7737 (Scotia Capital Inc. – Canada) (Scotia Capital Inc. – Canada) [email protected] Vincent Perri, CPA, CA, CFA (514) 287-4990 (Scotia Capital Inc. – Canada)
189
Exhibit 1: Engineering and Construction Sector Valuation Multiples on Next 12 Months Estimates
Average Historical 1 YR Multiple Discount/PremiumDec-11 Dec-12 Average Discount/Premium to Historical Multiple Multiple
Engineering and Design 11.9x 11.5x 16.6x -4% -31% P/EConstruction 5.6x 6.6x 6.8x 17% -3% EV/EBITDA
Note: Engineering and Design comps include SNC-T, STN-T, GNV-T, IBG-T, FLR-N, JEC-N, ACM-N, KBR-N, and URS-N
Construction comps include ARE-T, BDT-T, CUQ-T, GVA-N, EME-N, MTZ-N, and PWR-N
Source: Capital IQ; Scotiabank GBM.
Special Situations: Industrials
Engineering and Construction
2 0 1 3 : B E T O N H O M E F A V O U R I T E S
In 2012, the TSX Industrial index posted a yearly gain of 13%, mainly driven by strong U.S. industrial production, auto, and manufacturing sectors, offset by continued weakness in Canadian non-residential construction activity. In 2011, the Industrial index increased 2% as Infrastructure Canada funding decreased to approximately $6 billion from approximately $8 billion in 2010. In 2013, we expect companies with (1) North American exposure, (2) operational diversification across industries, (3) limited exposure to commodity-driven sectors, (4) strong backlogs, and (5) solid balance sheets to outperform their sector peers. The risks to our outlook include contagion from the European debt crisis, a weak resolution to the U.S. fiscal cliff, and weakness in the global economic environment.
A Potentially Undervalued Engineering and Design Sector
We believe the engineering and design sector has greater potential for valuation multiple expansion should the risks to our 2013 outlook not fully materialize as expected by current market sentiment. This is supported by the current 4% valuation multiple discount compared with the same period last year (11.5x versus 11.9x) and 31% discount to a historical average of 16.6x (see Exhibit 1). We are more cautious on companies within the construction sector due to (1) higher commodity price risk and lower expected federal and municipal spending as governments focus on reducing budget deficits and (2) limited potential upside to valuation multiple expansion given that current construction valuation multiples are trading relatively in line with historical levels (see Exhibit 1).
Focus 2013 January 2013
190
O U T P E R F O R M E R
Stantec Inc. (STN-T; Sector Outperform; One-Year Target $42.00)
• Bullish outlook. We expect solid organic revenue growth to continue into 2013 and 2014, driven mainly by the mining, oil and gas, and power sectors. We are modeling organic growth of 5% in 2013 and 2014. We note that management has recently revised its 2012 guidance upwards, targeting organic revenue growth of 4%-5% from 2%-3%.
• Strong Canadian market. Going forward, we expect strong organic growth in Stantec’s Canadian (57% of year-to-date [YTD] revenues) markets, mainly driven by continued demand for design services in the oil and gas sector. Furthermore, we expect moderate demand for P3 projects as public sector deficits continue to tighten budget spending.
• Moderately weak U.S. market. We expect moderate weakness in the United States (39% of YTD revenues) in 2013, mainly driven by tighter fiscal spending. This is expected to be slightly offset by strong activity in the U.S. resource sector supported by strong demand for design services in the U.S. oil and gas shale plays (Marcellus, Bakken, and Eagle Ford). Furthermore, a continued housing market recovery in 2013 is expected to support an overall U.S. economic recovery in 2014.
• Target-rich acquisition pipeline. We expect Stantec to continue its focused and targeted acquisition strategy within the United States and Canada. We believe the company could seize new growth opportunities through large U.S.-based acquisitions ($100 million-$500 million). However, we believe there is currently a greater availability of smaller opportunities ($50 million-$100 million). This is supported by a solid balance sheet (net debt to EBITDA [LTM] of 1.3x, net debt to equity of 40%), and strong FCF (2014E FCF of $3.28 per share; yield of 8.6%).
• Attractive valuation. Stantec is currently trading at 13.7x and 12.4x our 2013 and 2014 estimates, respectively. This represents a 7% discount to its historical P/E (NTM) of 14.6x. We do not believe this discount is warranted, given Stantec’s solid organic revenue growth outlook, solid balance sheet (Q3/12 net debt to EBITDA of 1.3x), and strong record backlog of $1.2 billion. We value Stantec shares using a 13x P/E multiple on our 2014 estimate. We are buyers of Stantec shares.
U N D E R P E R F O R M E R
Armtec Infrastructure Inc. (ARF-T; Sector Perform; One-Year Target $3.00)
• Cautious outlook. We maintain a High risk ranking on Armtec Infrastructure shares. Our view is supported by (1) increased balance-sheet risk stemming from the Brookfield credit facility, (2) a cautious infrastructure market outlook, and (3) material impact to net earnings given the increased interest expense stemming from the Brookfield facility charge (12.2% interest charge per annum on Brookfield facility).
• Near-term demand weakness. We expect modest growth in Q4/12 and 2013, driven mainly by continued weakness in central and eastern Canada construction activity. Management expects softer demand for its products in the near term, especially the infrastructure and residential end-user markets. A stable to moderate outlook is expected in the commercial facility construction and natural resources end-user markets. Management indicated on a recent conference call that it expects Q4/12 EBITDA to be relatively in line with results from the same period last year.
• Improving margin trend. We are modeling 2013 and 2014 EBITDA margin expansion of 380 bp and 60 bp to 12.8% and 13.4%, respectively. We believe margin expansion will be mainly driven by improved manufacturing capacity utilization and enhanced operational efficiencies reinforced by the further utilization of the current ERP system. The company expects a $2 million EBITDA benefit from its Turnaround Plan to be realized in Q4/12. This should result in the realization of the full $20 million EBITDA benefit targeted by the plan. Consequently, we do not expect material margin improvements in 2013.
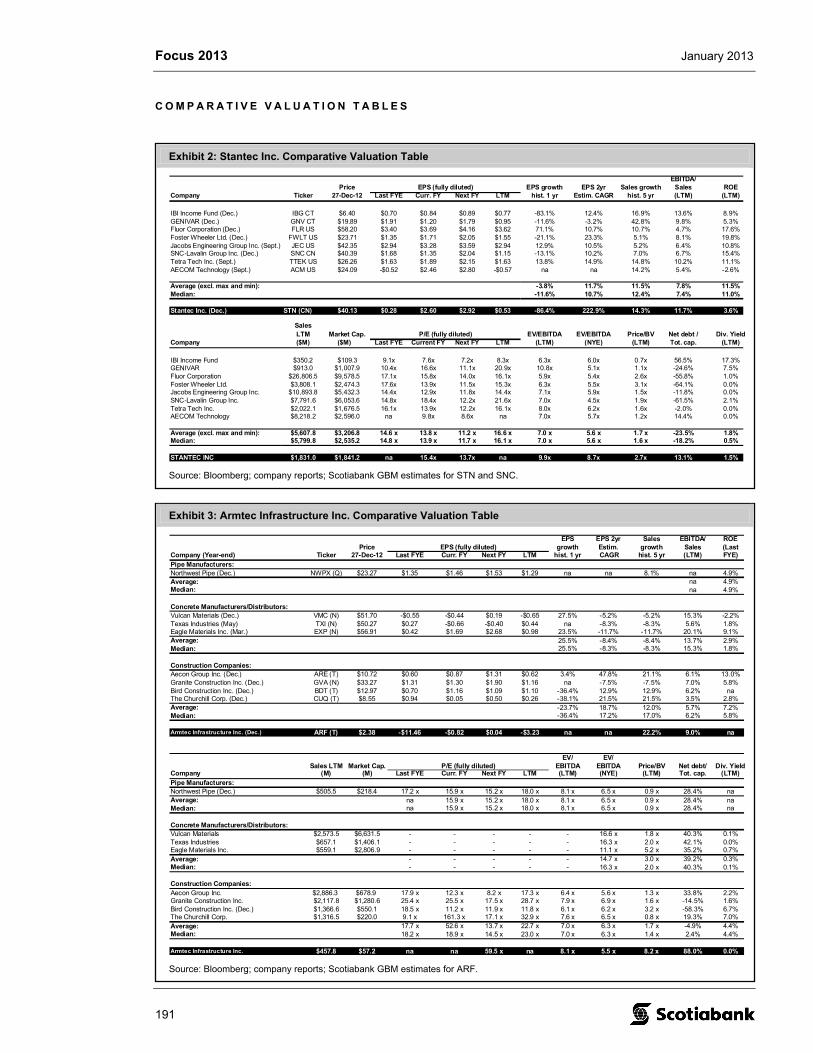
Focus 2013 January 2013
191
Exhibit 3: Armtec Infrastructure Inc. Comparative Valuation Table
Price EPS (fully diluted)EPS
growthEPS 2yr Estim.
Sales growth
EBITDA/ Sales
ROE (Last
Company (Year-end) Ticker 27-Dec-12 Last FYE Curr. FY Next FY LTM hist. 1 yr CAGR hist. 5 yr (LTM) FYE)Pipe Manufacturers:Northwest Pipe (Dec.) NWPX (Q) $23.27 $1.35 $1.46 $1.53 $1.29 na na 8.1% na 4.9%Average: na 4.9%Median: na 4.9%
Concrete Manufacturers/Distributors:Vulcan Materials (Dec.) VMC (N) $51.70 -$0.55 -$0.44 $0.19 -$0.65 27.5% -5.2% -5.2% 15.3% -2.2%Texas Industries (May) TXI (N) $50.27 $0.27 -$0.66 -$0.40 $0.44 na -8.3% -8.3% 5.6% 1.8%Eagle Materials Inc. (Mar.) EXP (N) $56.91 $0.42 $1.69 $2.68 $0.98 23.5% -11.7% -11.7% 20.1% 9.1%Average: 25.5% -8.4% -8.4% 13.7% 2.9%Median: 25.5% -8.3% -8.3% 15.3% 1.8%
Construction Companies:Aecon Group Inc. (Dec.) ARE (T) $10.72 $0.60 $0.87 $1.31 $0.62 3.4% 47.8% 21.1% 6.1% 13.0%Granite Construction Inc. (Dec.) GVA (N) $33.27 $1.31 $1.30 $1.90 $1.16 na -7.5% -7.5% 7.0% 5.8%Bird Construction Inc. (Dec.) BDT (T) $12.97 $0.70 $1.16 $1.09 $1.10 -36.4% 12.9% 12.9% 6.2% naThe Churchill Corp. (Dec.) CUQ (T) $8.55 $0.94 $0.05 $0.50 $0.26 -38.1% 21.5% 21.5% 3.5% 2.8%Average: -23.7% 18.7% 12.0% 5.7% 7.2%Median: -36.4% 17.2% 17.0% 6.2% 5.8%
Armtec Infrastructure Inc. (Dec.) ARF (T) $2.38 -$11.46 -$0.82 $0.04 -$3.23 na na 22.2% 9.0% na
Sales LTM Market Cap. P/E (fully diluted)EV/
EBITDAEV/
EBITDA Price/BV Net debt/ Div. YieldCompany (M) (M) Last FYE Curr. FY Next FY LTM (LTM) (NYE) (LTM) Tot. cap. (LTM)Pipe Manufacturers:Northwest Pipe (Dec.) $505.5 $218.4 17.2 x 15.9 x 15.2 x 18.0 x 8.1 x 6.5 x 0.9 x 28.4% naAverage: na 15.9 x 15.2 x 18.0 x 8.1 x 6.5 x 0.9 x 28.4% naMedian: na 15.9 x 15.2 x 18.0 x 8.1 x 6.5 x 0.9 x 28.4% na
Concrete Manufacturers/Distributors:Vulcan Materials $2,573.5 $6,631.5 - - - - - 16.6 x 1.8 x 40.3% 0.1%Texas Industries $657.1 $1,406.1 - - - - - 16.3 x 2.0 x 42.1% 0.0%Eagle Materials Inc. $559.1 $2,806.9 - - - - - 11.1 x 5.2 x 35.2% 0.7%Average: - - - - - 14.7 x 3.0 x 39.2% 0.3%Median: - - - - - 16.3 x 2.0 x 40.3% 0.1%
Construction Companies:Aecon Group Inc. $2,886.3 $678.9 17.9 x 12.3 x 8.2 x 17.3 x 6.4 x 5.6 x 1.3 x 33.8% 2.2%Granite Construction Inc. $2,117.8 $1,280.6 25.4 x 25.5 x 17.5 x 28.7 x 7.9 x 6.9 x 1.6 x -14.5% 1.6%Bird Construction Inc. (Dec.) $1,366.6 $550.1 18.5 x 11.2 x 11.9 x 11.8 x 6.1 x 6.2 x 3.2 x -58.3% 6.7%The Churchill Corp. $1,316.5 $220.0 9.1 x 161.3 x 17.1 x 32.9 x 7.6 x 6.5 x 0.8 x 19.3% 7.0%Average: 17.7 x 52.6 x 13.7 x 22.7 x 7.0 x 6.3 x 1.7 x -4.9% 4.4%Median: 18.2 x 18.9 x 14.5 x 23.0 x 7.0 x 6.3 x 1.4 x 2.4% 4.4%
Armtec Infrastructure Inc. $457.8 $57.2 na na 59.5 x na 8.1 x 5.5 x 8.2 x 88.0% 0.0%
Source: Bloomberg; company reports; Scotiabank GBM estimates for ARF.
Exhibit 2: Stantec Inc. Comparative Valuation Table
Price EPS (fully diluted) EPS growth EPS 2yr Sales growthEBITDA/
Sales ROECompany Ticker 27-Dec-12 Last FYE Curr. FY Next FY LTM hist. 1 yr Estim. CAGR hist. 5 yr (LTM) (LTM)
IBI Income Fund (Dec.) IBG CT $6.40 $0.70 $0.84 $0.89 $0.77 -83.1% 12.4% 16.9% 13.6% 8.9%GENIVAR (Dec.) GNV CT $19.89 $1.91 $1.20 $1.79 $0.95 -11.6% -3.2% 42.8% 9.8% 5.3%Fluor Corporation (Dec.) FLR US $58.20 $3.40 $3.69 $4.16 $3.62 71.1% 10.7% 10.7% 4.7% 17.6%Foster Wheeler Ltd. (Dec.) FWLT US $23.71 $1.35 $1.71 $2.05 $1.55 -21.1% 23.3% 5.1% 8.1% 19.8%Jacobs Engineering Group Inc. (Sept.) JEC US $42.35 $2.94 $3.28 $3.59 $2.94 12.9% 10.5% 5.2% 6.4% 10.8%SNC-Lavalin Group Inc. (Dec.) SNC CN $40.39 $1.68 $1.35 $2.04 $1.15 -13.1% 10.2% 7.0% 6.7% 15.4%Tetra Tech Inc. (Sept.) TTEK US $26.26 $1.63 $1.89 $2.15 $1.63 13.8% 14.9% 14.8% 10.2% 11.1%AECOM Technology (Sept.) ACM US $24.09 -$0.52 $2.46 $2.80 -$0.57 na na 14.2% 5.4% -2.6%
Average (excl. max and min): -3.8% 11.7% 11.5% 7.8% 11.5%Median: -11.6% 10.7% 12.4% 7.4% 11.0%
Stantec Inc. (Dec.) STN (CN) $40.13 $0.28 $2.60 $2.92 $0.53 -86.4% 222.9% 14.3% 11.7% 3.6%
SalesLTM Market Cap. P/E (fully diluted) EV/EBITDA EV/EBITDA Price/BV Net debt / Div. Yield
Company ($M) ($M) Last FYE Current FY Next FY LTM (LTM) (NYE) (LTM) Tot. cap. (LTM)
IBI Income Fund $350.2 $109.3 9.1x 7.6x 7.2x 8.3x 6.3x 6.0x 0.7x 56.5% 17.3%GENIVAR $913.0 $1,007.9 10.4x 16.6x 11.1x 20.9x 10.8x 5.1x 1.1x -24.6% 7.5%Fluor Corporation $26,806.5 $9,578.5 17.1x 15.8x 14.0x 16.1x 5.9x 5.4x 2.6x -55.8% 1.0%Foster Wheeler Ltd. $3,808.1 $2,474.3 17.6x 13.9x 11.5x 15.3x 6.3x 5.5x 3.1x -64.1% 0.0%Jacobs Engineering Group Inc. $10,893.8 $5,432.3 14.4x 12.9x 11.8x 14.4x 7.1x 5.9x 1.5x -11.8% 0.0%SNC-Lavalin Group Inc. $7,791.6 $6,053.6 14.8x 18.4x 12.2x 21.6x 7.0x 4.5x 1.9x -61.5% 2.1%Tetra Tech Inc. $2,022.1 $1,676.5 16.1x 13.9x 12.2x 16.1x 8.0x 6.2x 1.6x -2.0% 0.0%AECOM Technology $8,218.2 $2,596.0 na 9.8x 8.6x na 7.0x 5.7x 1.2x 14.4% 0.0%
Average (excl. max and min): $5,607.8 $3,206.8 14.6 x 13.8 x 11.2 x 16.6 x 7.0 x 5.6 x 1.7 x -23.5% 1.8%Median: $5,799.8 $2,535.2 14.8 x 13.9 x 11.7 x 16.1 x 7.0 x 5.6 x 1.6 x -18.2% 0.5%
STANTEC INC $1,831.0 $1,841.2 na 15.4x 13.7x na 9.9x 8.7x 2.7x 13.1% 1.5%
Source: Bloomberg; company reports; Scotiabank GBM estimates for STN and SNC.
C O M P A R A T I V E V A L U A T I O N T A B L E S

Focus 2013 January 2013
192
T H I S P A G E L E F T I N T E N T I O N A L L Y B L A N K
Focus 2013 January 2013
Gus Papageorgiou, MBA, CFA (416) 863-7552 Daniel Chan, MBA (416) 863-7237 (Scotia Capital Inc. – Canada) (Scotia Capital Inc. – Canada) [email protected] John MaGee (416) 863-7289 (Scotia Capital Inc. – Canada)
193
Technology Hardware
Act III: The Internet’s Next Phase
Mobility and the Internet have had a dramatic impact on how we live our lives, driving incredible growth in many industries while laying waste to others. The Internet was originally established to connect places. Mobility has allowed it to connect people. We believe the next phase of the Internet’s development will be to connect things. This next phase is commonly referred to as Machine to Machine (M2M), the Internet of Things (IOT), or Hyperconnectivity. Investors can think about this phenomenon in the following way: Anything that can benefit from being connected to the network will be connected to the network.
Some of the key expectations related to this trend are as follows:
50 billion connections projected by 2020. By 2020, Telefonaktiebolaget LM Ericsson (Ericsson) estimates 50 billion machines will be connected to the Internet versus an estimated 140 million today.
6.1 billion cellular M2M connections estimated by 2022. We estimate that by 2022, there will be 6.1 billion devices with a cellular connection to the network, with 2.3 billion added that same year.
Auto and medical will likely be the biggest markets – these two segments alone would represent an estimated $1.2 trillion by 2020 (source: Harbor Research). Although M2M inspires many usage scenarios, we believe automobile and medical will be the biggest markets. Connecting cars is already underway, and remote monitoring and assisted living can help save lives and reduce health-care costs in an aging Western world.
Catalysts in place. Smaller, more powerful processors, growing availability of LTE, higher-resolution sensors, and technologies such as thin-film and embedded software are helping make M2M a reality.
Regulatory and technical hurdles. Spectrum limitations and a limited supply of phone numbers are regulatory hurdles that need to be addressed. Security will likely be an issue for the industry. But we believe the biggest hurdle will be simplifying M2M for industries that are not accustomed to dealing with network connectivity.
M2M promises to expand Internet connectivity beyond just personal computers (PCs) and smartphones and into devices that traditionally have not been associated with network connectivity, such as automobiles, medical equipment, industrial equipment, and even household appliances. As such, it will blur the lines between what is and is not a computing device. When we look into that future, we believe the PC will eventually die. Tablets may or may not survive, but what is, in our mind, inevitable, is that the smartphone will become increasingly dominant. In this world, the smartphone will be your PC, wallet, keys, ID, and potentially home entertainment system (oh, and also your phone). The smartphone will be the bridge into a host of cloud-based services that will be delivered to multiple terminals, many of which (cars, televisions, appliances) are not traditionally thought of as computing devices. This next phase of the Internet promises a much more mobile, personal, and productive user experience whereby the Internet is unleashed to add value to products that traditionally have not been known for connectivity. It promises to be an exciting time, full of opportunity for some players, while posing great threats for others. Within our coverage universe, we see significant potential for some of our companies.
Focus 2013 January 2013
194
Top Pick: QUALCOMM Incorporated (Qualcomm), Focus Stock. In our view, Qualcomm does not need to make any changes to its business model to benefit from M2M. Its licensing and chip businesses stand to gain as 3G and LTE technologies are used in more and more devices. We have upgraded Qualcomm to Focus Stock from Sector Outperform.
Dark Horse: Research In Motion Limited (RIM), Sector Perform. We believe RIM has the potential to do in M2M what it did in enterprise mobility. RIM’s QNX-embedded software platform has captured roughly 60% of the automobile market and dominates medical equipment. In addition, RIM’s connection with 600 carriers and its base of roughly 250,000 BlackBerry Enterprise Servers (BESs) could help make M2M a reality for original equipment manufacturers (OEMs) globally.
Underperform: Novatel Wireless, Inc. (Novatel), Sector Underperform. We believe Novatel’s traditional business lines will continue to face increasing challenges, while its attempts to break into the M2M segment have thus far not been successful.
O U T P E R F O R M E R S
QUALCOMM Incorporated (Focus Stock; One-Year Target US$78.20): Top Pick
We have upgraded Qualcomm to Focus Stock from Sector Outperform. Of all the companies in our coverage universe, we believe Qualcomm is the lowest-risk play on M2M. Our highlights are below:
M2M royalties have a fair value of $5.50 per share. Using assumptions from various industry sources, we believe 5%-10% of connected devices sold in 2020 could be cellular (M2M devices). We estimate the royalty stream from these sales could be worth $5.50 per share. Using the assumption from these same sources, we estimate the per-share royalties from non-M2M devices could be worth $86, which is significantly higher than our previous estimate of $38.
M2M could boost chip sales by $7 billion by 2020. We estimate M2M could generate additional volumes of 900 million mobile units per year by 2020. If Qualcomm maintains 40% market share and experiences some assumed average sale price (ASP) decline that represents an additional $7 billion opportunity by 2020.
Qualcomm to leverage its strength in cellular IP. If cellular technology becomes a dominant communications channel for M2M, Qualcomm stands to benefit from 3G/4G royalties on all machines connected via the cellular network. As the paradigm shifts from one to two devices per person to many devices per person, the royalty opportunity from M2M devices can be quite material.
No change to business model required. Unlike some of the other names we highlight, we believe Qualcomm does not really have to change its business model to capitalize on M2M. For Qualcomm, M2M simply increases its addressable market.
Qualcomm remains our top pick due to its highly profitable licensing operations, growing strength in mobile silicon chips, strong balance sheet, and decent dividend yield. We continue to like Qualcomm’s prospects in both the near and long term. In the near term, Qualcomm should continue to benefit from the ever-growing use of smartphones as more and more feature-phone users turn to smartphones. Qualcomm has a dual benefit as a result of this trend: first, it collects the royalty from any 3G handsets and second, it is highly probable that the company’s chipsets are being used in these devices.
Focus 2013 January 2013
195
In the longer term, we believe Qualcomm is a low-risk play on M2M because as more and more devices get connected to the network, Qualcomm’s addressable market grows. Although a big portion of the M2M market will use 2G technology (predominantly meter-reading applications) much of the market will likely go to 3G and even LTE. In many markets, using 2G will not be possible as some carriers are planning to shut down their 2G networks altogether. Here again, Qualcomm should see the dual benefit of collecting a royalty fee from the actual mobile connection and also potentially selling the chip that connects the device.
We believe the only main issue with Qualcomm shares is the valuation. Qualcomm is currently trading well ahead of stocks such as Apple Inc., at roughly 14x, whereas Apple is trading at about 10x, with better growth characteristics and comparable profitability. However, we would argue that Qualcomm has a lower risk profile. First, its licensing business is highly profitable and stable, with many of its licensing customers having signed 15-year deals. This source of revenue, therefore, is very secure. In handsets, Qualcomm is now the main LTE supplier to almost all major OEMs, including Apple, Samsung, Nokia Corporation, RIM, and HTC. Apple runs the risk of missing a product cycle. However, with Qualcomm, it does not really matter who wins or loses because the company is represented in all of the main vendors’ products. Given Qualcomm’s dominant position in mobile technology, strong balance sheet, growing dividends, and its prospects in M2M, we have upgraded QCOM to Focus Stock from Sector Outperform.
Research In Motion Limited (Sector Perform; One-Year Target $18.60): Dark Horse
Although RIM has fallen out of favour and does face significant challenges, we believe the company is uniquely positioned to benefit from the coming M2M trend. Our main thoughts are outlined below:
M2M technology can leverage RIM’s high-margin service model. RIM built its business around connecting people to their enterprises, but these same assets can be extended to connecting machines. In automobiles alone, we see a service opportunity of $5 billion-plus per year by 2017.
Provides incentive to license OS. We believe RIM’s network can expedite the delivery of M2M services. By adopting the new BlackBerry 10 (BB10) operating system, other handset OEMs can tap into those services and, as a result, extend RIM’s service fees to more and more subscribers. If BB10 is a success, we believe licensing is virtually inevitable, could be highly profitable, and would likely precede RIM splitting its handset and service/software business.
RIM’s network operating system (NOC) and embedded QNX OS combo can remove the complexities around M2M. From delivering unparalleled security, reducing network traffic, and providing a robust developer ecosystem to extending control over connected devices, we believe RIM’s NOC-QNX can solve many of the M2M issues OEMs face.
Sounds great, but RIM needs to make BB10 work. RIM needs BB10 to be a success. If it is, we believe the company can push into more verticals in an aggressive and profitable way. If it doesn’t, the company will likely have to seek a partner or acquirer to bring its potential to market.
RIM’s recent decline has been well publicized. Management missteps in 2010 and 2011 caused RIM to fall behind other smartphone players, as evidenced in both its market share and financial performance. Before we begin to dive into RIM as an M2M play, we want to be clear: until the new operating system, BB10, is released, there is nothing, in our opinion, that can improve the company’s fortunes.
But if RIM’s new OS is a success, we believe RIM has a unique set of assets that put the company in a very strong position for the coming M2M tide. RIM’s new OS is based on the QNX real-time operating system – QNX was acquired by RIM in 2010. QNX as an OS is well deployed in automobiles, industrial equipment, tablets, medical equipment, networking, gaming (slot machines), and defence industries, and most recently is being deployed in smart appliances. QNX dominates in both medical and auto, which are predicted by Harbor Research to be the two biggest M2M markets.
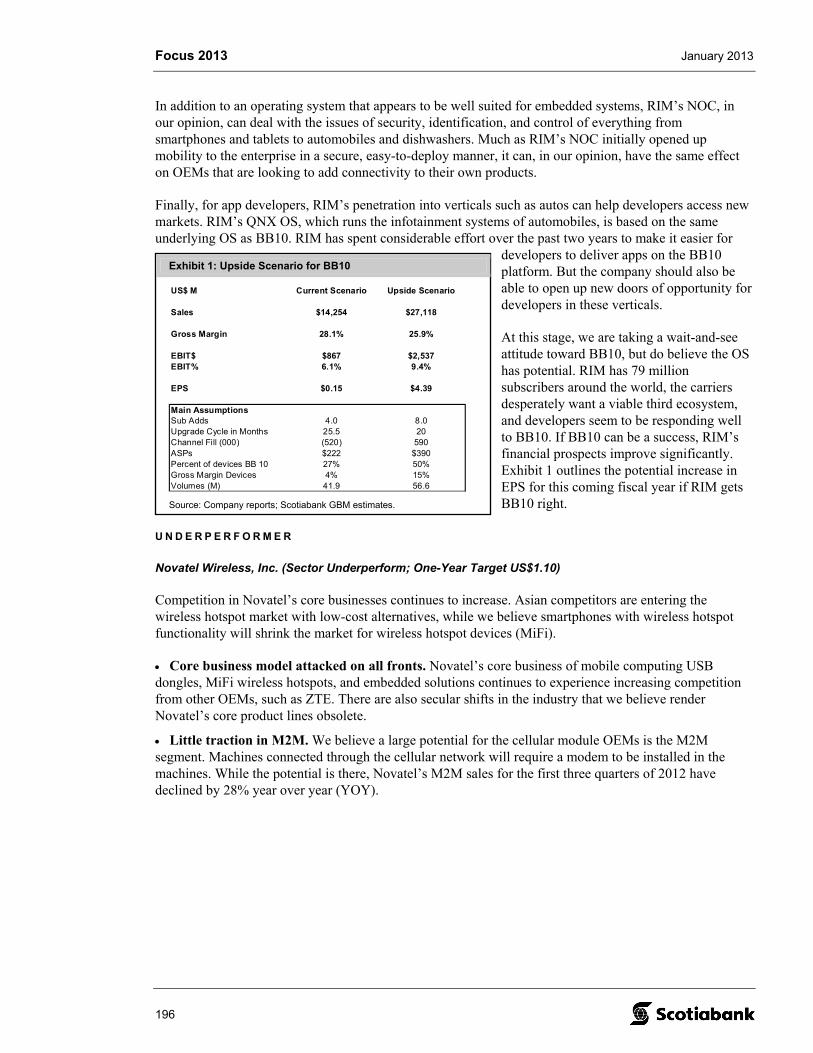
Focus 2013 January 2013
196
Exhibit 1: Upside Scenario for BB10
US$ M Current Scenario Upside Scenario
Sales $14,254 $27,118
Gross Margin 28.1% 25.9%
EBIT$ $867 $2,537EBIT% 6.1% 9.4%
EPS $0.15 $4.39
Main AssumptionsSub Adds 4.0 8.0Upgrade Cycle in Months 25.5 20Channel Fill (000) (520) 590ASPs $222 $390Percent of devices BB 10 27% 50%Gross Margin Devices 4% 15%Volumes (M) 41.9 56.6
Source: Company reports; Scotiabank GBM estimates.
In addition to an operating system that appears to be well suited for embedded systems, RIM’s NOC, in our opinion, can deal with the issues of security, identification, and control of everything from smartphones and tablets to automobiles and dishwashers. Much as RIM’s NOC initially opened up mobility to the enterprise in a secure, easy-to-deploy manner, it can, in our opinion, have the same effect on OEMs that are looking to add connectivity to their own products.
Finally, for app developers, RIM’s penetration into verticals such as autos can help developers access new markets. RIM’s QNX OS, which runs the infotainment systems of automobiles, is based on the same underlying OS as BB10. RIM has spent considerable effort over the past two years to make it easier for
developers to deliver apps on the BB10 platform. But the company should also be able to open up new doors of opportunity for developers in these verticals.
At this stage, we are taking a wait-and-see attitude toward BB10, but do believe the OS has potential. RIM has 79 million subscribers around the world, the carriers desperately want a viable third ecosystem, and developers seem to be responding well to BB10. If BB10 can be a success, RIM’s financial prospects improve significantly. Exhibit 1 outlines the potential increase in EPS for this coming fiscal year if RIM gets BB10 right.
U N D E R P E R F O R M E R
Novatel Wireless, Inc. (Sector Underperform; One-Year Target US$1.10)
Competition in Novatel’s core businesses continues to increase. Asian competitors are entering the wireless hotspot market with low-cost alternatives, while we believe smartphones with wireless hotspot functionality will shrink the market for wireless hotspot devices (MiFi).
Core business model attacked on all fronts. Novatel’s core business of mobile computing USB dongles, MiFi wireless hotspots, and embedded solutions continues to experience increasing competition from other OEMs, such as ZTE. There are also secular shifts in the industry that we believe render Novatel’s core product lines obsolete.
Little traction in M2M. We believe a large potential for the cellular module OEMs is the M2M segment. Machines connected through the cellular network will require a modem to be installed in the machines. While the potential is there, Novatel’s M2M sales for the first three quarters of 2012 have declined by 28% year over year (YOY).
Focus 2013 January 2013
197
Several changes in the industry leave us cautious on Novatel’s traditional products:
1. Smartphones with wireless hotspot apps are becoming increasingly popular. Android, BlackBerry, iPhone, and Windows Phone devices are now all capable of acting as wireless hotspots. Other than for niche applications, we do not see a compelling reason for consumers to own two devices that perform the same function. As smartphone penetration continues to increase, we believe the total addressable market for wireless hotspot products decreases.
2. Growth in tablets as PCs stagnate. Tablets have been outpacing PC growth over the last year, which is negative for Novatel since most tablets use the same components under the covers as a smartphone. Large-scale integration by mobile chipset manufacturers, such as Qualcomm, is making it easier for OEMs to create cellular devices, which also decreases the value that Novatel adds. Microsoft has also started to support these mobile chipsets, which implies that future PCs may no longer need a separate cellular modem card, displacing Novatel in the process.
3. Competition from Asian competitors. Low-cost Asian competitors gained market share in the USB dongle market and are now taking hotspot contracts from Novatel. In Q3/12, Novatel lost share to a lower-priced Chinese competitor at its largest customer.
In our opinion, the largest opportunity for cellular module OEMs is the M2M opportunity. Cars, industrial machines, and medical devices could all benefit from being cellularly connected to the Internet. Novatel could leverage its expertise to expand to adjacent verticals. The company acquired Enfora, Inc. in late 2010 for $64.5 million to enter the M2M market, but little progress has been made. As of Q3/12, M2M revenue still comprises only 9% of last 12 months (LTM) sales. Also, the company took goodwill impairment charges of $29.3 million in Q1/12 and $20.5 million in Q3/12 related to the Enfora acquisition.
Given increasing pressure on Novatel’s traditional business lines and lack of traction in its new M2M business, we maintain our Sector Underperform rating on Novatel.
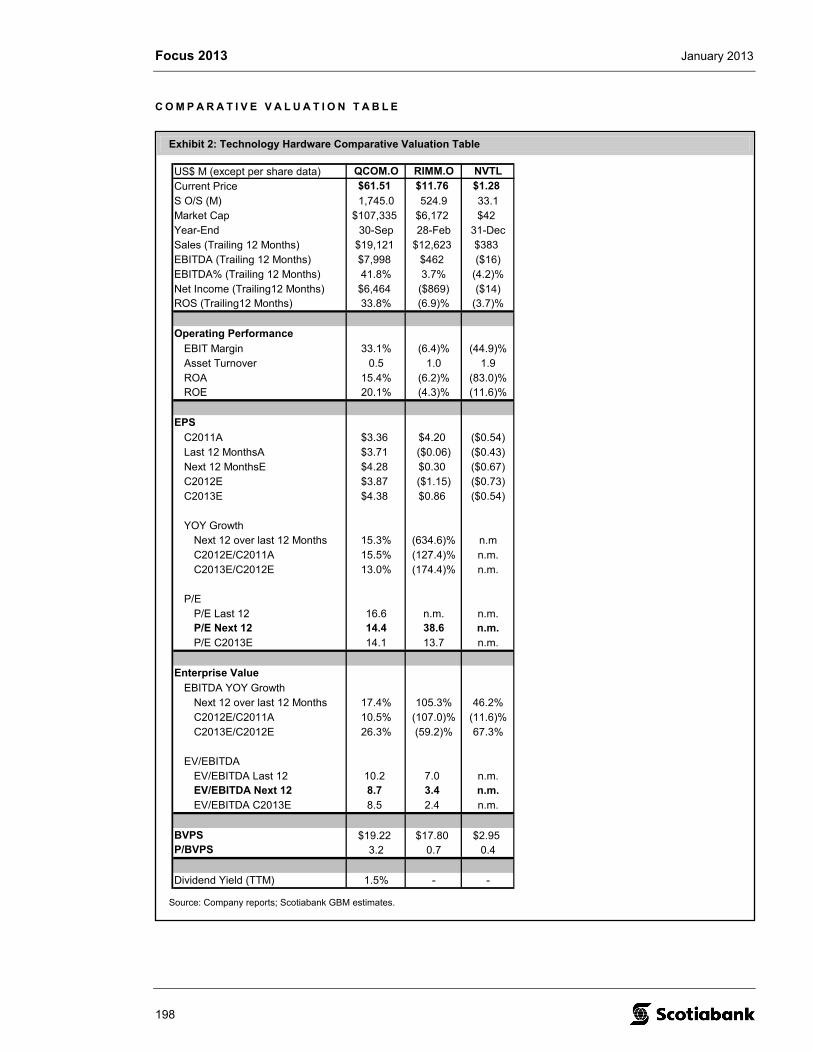
Focus 2013 January 2013
198
Exhibit 2: Technology Hardware Comparative Valuation Table
US$ M (except per share data) QCOM.O RIMM.O NVTL
Current Price $61.51 $11.76 $1.28
S O/S (M) 1,745.0 524.9 33.1Market Cap $107,335 $6,172 $42Year-End 30-Sep 28-Feb 31-DecSales (Trailing 12 Months) $19,121 $12,623 $383EBITDA (Trailing 12 Months) $7,998 $462 ($16)EBITDA% (Trailing 12 Months) 41.8% 3.7% (4.2)%Net Income (Trailing12 Months) $6,464 ($869) ($14)ROS (Trailing12 Months) 33.8% (6.9)% (3.7)%
Operating Performance
EBIT Margin 33.1% (6.4)% (44.9)%Asset Turnover 0.5 1.0 1.9ROA 15.4% (6.2)% (83.0)%ROE 20.1% (4.3)% (11.6)%
EPS
C2011A $3.36 $4.20 ($0.54)Last 12 MonthsA $3.71 ($0.06) ($0.43)Next 12 MonthsE $4.28 $0.30 ($0.67)C2012E $3.87 ($1.15) ($0.73)C2013E $4.38 $0.86 ($0.54)
YOY GrowthNext 12 over last 12 Months 15.3% (634.6)% n.mC2012E/C2011A 15.5% (127.4)% n.m.C2013E/C2012E 13.0% (174.4)% n.m.
P/EP/E Last 12 16.6 n.m. n.m.P/E Next 12 14.4 38.6 n.m.P/E C2013E 14.1 13.7 n.m.
Enterprise Value
EBITDA YOY GrowthNext 12 over last 12 Months 17.4% 105.3% 46.2%C2012E/C2011A 10.5% (107.0)% (11.6)%C2013E/C2012E 26.3% (59.2)% 67.3%
EV/EBITDAEV/EBITDA Last 12 10.2 7.0 n.m.EV/EBITDA Next 12 8.7 3.4 n.m.EV/EBITDA C2013E 8.5 2.4 n.m.
BVPS $19.22 $17.80 $2.95P/BVPS 3.2 0.7 0.4
Dividend Yield (TTM) 1.5% - -
Source: Company reports; Scotiabank GBM estimates.
C O M P A R A T I V E V A L U A T I O N T A B L E
Focus 2013 January 2013
Jeff Fan, CA, CFA (416) 863-7780 Andres Coello +52 (55) 5123 2852 (Scotia Capital Inc. – Canada) (Scotiabank Inverlat) [email protected] [email protected]
199
Telecommunications & Cable
Dividend and Disciplined Allocation of Capital Remain a Key Focus
The U.S. and Canadian valuation gap has narrowed from a dividend yield perspective, and the Canadians are now more attractive relative to their historical levels. Relative to 10-year rates, heading into 2012 the U.S. telecom and cable sector’s dividend yield was more attractively priced. Heading into 2013, the U.S. has effectively caught up to Canada, and their dividend yields relative to their respective 10-year rates are essentially in line. Relative to historical levels, we believe the Canadian sector is more attractively priced on this basis.
Dividend-focused investors should overweight Comcast Corporation (CMCSA), Time Warner Cable Inc. (TWC), Rogers Communications Inc. (RCI), and TELUS Corporation (T-T). In the United States, we expect the cables to lead the dividend growth this year, with CMCSA at 44% and TWC at 15%. In Canada, we expect RCI and T-T to provide the highest dividend growth potential at 10% in 2013. We believe all four companies have the potential for additional cash returns through share buybacks.
High dividend payers are already trading at a valuation premium, with lower cash flow growth and low dividend growth potential, and should be avoided. These include AT&T Inc. (T-N), BCE Inc. (BCE), Bell Aliant Inc. (BA), and Manitoba Telecom Services Inc. (MTS). We believe BA’s dividend yield has the highest probability of rising to account for the higher risk with the dividend payout ratio increasing to around 100% in 2013, despite management’s assertion that it does not plan to cut the dividend. For MTS, the longer the sale of Allstream takes, the greater the risk that its pension funding will ultimately have an impact on the dividend. For BCE, we now expect the Fibe rollout to be slower than anticipated in 2013, which will likely keep wireline capex relatively flat to support free cash flow (FCF) growth to generate 5% dividend growth in 2013. From a timing perspective, we do not expect this until the pending Astral Media Inc. (ACM) acquisition is resolved in mid-2013.
P O S I T I V E O U T L O O K O N W I R E L E S S A S S C A L E C O N T I N U E S T O F A V O U R
T H E L A R G E R O P E R A T O R S
In the United States, we favour Verizon Communications Inc. (VZ) over AT&T, and we expect VZ’s leadership in 4G LTE coverage, spectrum position, and mobile applications will enable it to differentiate itself in the post-paid market and continue to gain share.
In Canada, we believe all three incumbents will enjoy good financial performance again in 2013. We expect BCE and TELUS will continue to enjoy relatively higher growth than Rogers, but we expect the gap to narrow in 2013, with Rogers wireless growth improving based on a return to positive average revenue per user (ARPU), lower churn, better management of smartphone subsidies, and overall cost control.
We expect the wireless industry in both Canada and the United States to enjoy strong EBITDA growth in 2013 from healthy service revenue growth, driven by smartphone penetration and data growth and the continued mix shift from prepaid to post-paid. We also expect margin improvement to continue to be driven by improving churn and better control over smartphone subsidies through more stringent upgrade policies.
Focus 2013 January 2013
200
W E E X P E C T A S T A B L E C O M P E T I T I V E E N V I R O N M E N T B E T W E E N
C A B L E C O S A N D T E L C O S I N 2 0 1 3
In the United States, we believe there has already been stability in 2012, and we expect more of the same in 2013. Both CMCSA’s and TWC’s overlap with T-N’s U-verse and VZ’s FiOS triple-play services are below 40%. In markets where they do not face U-verse or FiOS, cablecos are gaining significant broadband share. In FiOS markets, VZ has raised prices in order to improve the return on FiOS. While T-N has expanded its U-verse footprint, its TV/triple-play footprint has increased by only 10%, or less than 3% of CMCSA and TWC homes.
In Canada, 2012 was a very competitively intense year, both in the west and in the east, and we expect stability will start to materialize in 2013. In the west, both TELUS and Shaw Communications Inc. (SJR) raised prices in the second half of 2012. TELUS also removed promotion stacking (subscribers were only eligible for either free set-top boxes or monthly rate discounts, which were reduced from twelve months to six months). We also believe TELUS does not intend to reignite its TV subscriber net additions to its prior peak of 50,000+ and is content to grow at 40,000+ per quarter. We believe this will put much less ARPU and margin pressure on TELUS’s wireline results and Shaw’s cable results in 2013.
Slower Fibe Internet Protocol television (IPTV) expansion in 2013 and wireline price increases for BCE should benefit its cable competitors in the east. BCE will likely end 2012 at approximately 50% of homes passed with Fibe TV, up from approximately 30% last year, which reflects expansion of 20%. In 2013, we expect the footprint expansion will slow to approximately 15%, and BCE will focus more on gains in territories that are already covered. We also believe BCE’s focus will be to maintain cash flow growth in 2013 to support further dividend growth. The difference between BCE and TELUS is that TELUS is almost 70% covered with Optik TV, compared with 50% for BCE. BCE has also introduced price increases across its entire footprint, effective January 1, 2013. Overall, we believe this is good news for BCE shareholders and for its main cable competitors, Rogers and Quebecor Inc. (QBR). BCE’s focus on cash flow is also positive for dividend investors. However, it leaves BCE in a more vulnerable position, with 50% of homes exposed to Rogers and to Quebecor’s Vidéotron. We believe BCE’s approach in wireline will enable Rogers and Quebecor to continue to generate profitable subscriber growth in 2013.
M I X E D O U T L O O K O N W I R E L I N E F O R T H E T E L C O S
We expect the EBITDA of all major wireline telcos to be under pressure in 2013. For most in the industry, we expect the trend will be generally flat. We expect BCE’s wireline EBITDA will be under the most pressure because of dilution related to IPTV rollout and revenue mix shift from high-margin legacy services to lower-margin TV services, including the cannibalization of satellite TV subscribers with IPTV subscribers. For the four major incumbent local exchange carriers (ILECs), the higher the IPTV penetration, the lower the EBITDA margin. For BCE, we expect IPTV penetration growth and the migration of higher-ARPU satellite subscribers to low-ARPU IPTV subscribers will put significant pressure on wireline margins in 2013.
W I R E L E S S C O N S O L I D A T I O N , C A B L E C O W I R E L E S S P A R T N E R S H I P ,
A N D F O R E I G N S T R A T E G I C I N V E S T O R I N C A N A D A
Barring a major strategic partner stepping up with capital, we expect the Canadian private new entrants will struggle in 2013. The Canadian wireless new entrants (Wind, Mobilicity, and Public Mobile) are looking for capital as they position themselves for the 700 megahertz (MHz) spectrum auction. We foresee potential consolidation between the private new entrants ahead of the 700 MHz auction in mid-2013. This will avoid the scenario of them bidding against each other and should at least help their cause in raising capital ahead of the auction.
Focus 2013 January 2013
201
Cableco partnership will also likely materialize in 2013. We do not believe Quebecor will consider wireless deployment outside Quebec, nor do we expect Shaw to reverse its position to support WiFi and become a traditional cellular operator. However, given the spectrum cap and the potential that the new entrants will not be serious bidders, the cablecos may form strategic partnerships with Rogers to acquire 700 MHz spectrum across the country.
We do not expect to see a foreign strategic wireless investor in Canada in 2013. In the United States in 2012, the surprise $20 billion injection by SOFTBANK CORP. (SoftBank) into Sprint Nextel Corporation and the pending combination of T-Mobile USA and MetroPCS Communications, Inc. created a glimmer of hope for the challengers to become a legitimate third national operator against VZ and T-N. We do not foresee a SoftBank-like investor in Canada in 2013 given the size of the Canadian market, the lack of success by Orascom Telecom Holding SAE/VimpelCom Ltd. in the past four years, and the fact that the combined new entrants’ share is still well below scale.
A foreign wireline investor may emerge, but valuation and timing remain uncertain. MTS is also looking for a buyer or partner for Allstream. This process has been ongoing officially since September 2012 (but we suspect it has been going on since the announcement that foreign ownership limits would be removed for small telcos in March 2012). We continue to think there is a lack of interest from AT&T and Verizon, which were the most likely buyers with cost synergies. Without their participation, we believe the other potential buyers will not pay up, which raises valuation and timing risk for MTS.
V A L U A T I O N S C R E E N B A S E D O N C A S H E B I T
We believe cash EBIT is a good indicator of value creation. Due to the limitations of some traditional metrics, we believe investors should start to pay more attention to EV/cash EBIT (cash EBIT is defined as EBITDA minus capex). EV/EBITDA has been the traditional valuation metric for the telecom and cable sector. The issue with EBITDA is that it does not take into account the impact of capex, which we can all agree has an impact on returns and valuation. EV/EBITDA has also been more popular in a more growth-oriented environment. With fewer growth prospects, we believe the merit of using EV/EBITDA could diminish. An alternative is price to FCF multiple (or FCF yield). While it does capture the impact of capex, it is also impacted by a company’s capital structure and tax status, which we believe may distort comparability.
Cash EBIT takes into account the impact of capex but avoids the potential distortions that can be caused by different capital and tax structures. In Exhibit 1, we mapped companies’ cash EBIT growth outlook for 2013 (x-axis) against their EV/cash EBIT multiples (y-axis).
Based on this perspective of cash EBIT growth and EV/cash EBIT, Comcast and Rogers rank ahead of their peers in the United States and Canada, respectively. They are both above the median growth and at or below the weighted-average multiple.
On the other hand, AT&T and Bell Aliant rank well below their peers. Both are expected to experience cash EBIT decline in 2013 well below their peers, but their EV/cash EBIT multiples are above the weighted average.
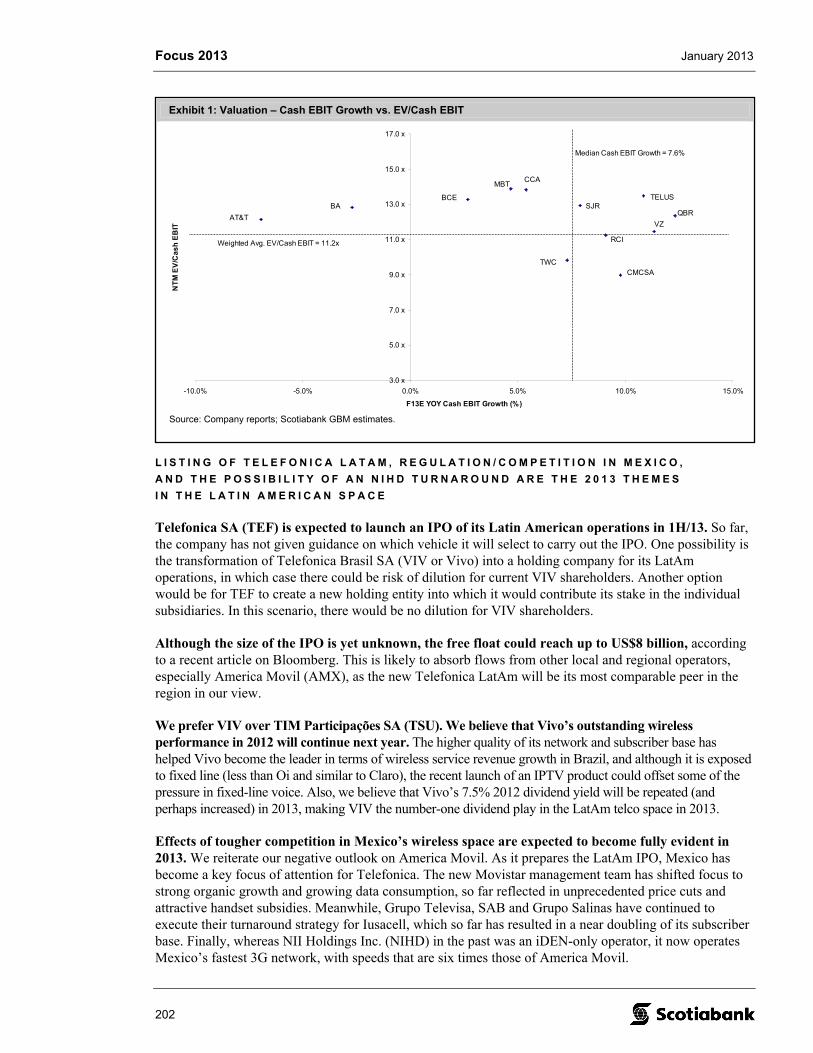
Focus 2013 January 2013
202
Exhibit 1: Valuation – Cash EBIT Growth vs. EV/Cash EBIT
3.0 x
5.0 x
7.0 x
9.0 x
11.0 x
13.0 x
15.0 x
17.0 x
-10.0% -5.0% 0.0% 5.0% 10.0% 15.0%
F13E YOY Cash EBIT Growth (%)
NT
M E
V/C
as
h E
BIT
Weighted Avg. EV/Cash EBIT = 11.2x
Median Cash EBIT Growth = 7.6%
TELUS
VZ
CMCSATWC
RCI
SJRBCE
AT&T
CCA
QBR
MBT
BA
Source: Company reports; Scotiabank GBM estimates.
L I S T I N G O F T E L E F O N I C A L A T A M , R E G U L A T I O N / C O M P E T I T I O N I N M E X I C O ,
A N D T H E P O S S I B I L I T Y O F A N N I H D T U R N A R O U N D A R E T H E 2 0 1 3 T H E M E S
I N T H E L A T I N A M E R I C A N S P A C E
Telefonica SA (TEF) is expected to launch an IPO of its Latin American operations in 1H/13. So far, the company has not given guidance on which vehicle it will select to carry out the IPO. One possibility is the transformation of Telefonica Brasil SA (VIV or Vivo) into a holding company for its LatAm operations, in which case there could be risk of dilution for current VIV shareholders. Another option would be for TEF to create a new holding entity into which it would contribute its stake in the individual subsidiaries. In this scenario, there would be no dilution for VIV shareholders.
Although the size of the IPO is yet unknown, the free float could reach up to US$8 billion, according to a recent article on Bloomberg. This is likely to absorb flows from other local and regional operators, especially America Movil (AMX), as the new Telefonica LatAm will be its most comparable peer in the region in our view.
We prefer VIV over TIM Participações SA (TSU). We believe that Vivo’s outstanding wireless performance in 2012 will continue next year. The higher quality of its network and subscriber base has helped Vivo become the leader in terms of wireless service revenue growth in Brazil, and although it is exposed to fixed line (less than Oi and similar to Claro), the recent launch of an IPTV product could offset some of the pressure in fixed-line voice. Also, we believe that Vivo’s 7.5% 2012 dividend yield will be repeated (and perhaps increased) in 2013, making VIV the number-one dividend play in the LatAm telco space in 2013.
Effects of tougher competition in Mexico’s wireless space are expected to become fully evident in 2013. We reiterate our negative outlook on America Movil. As it prepares the LatAm IPO, Mexico has become a key focus of attention for Telefonica. The new Movistar management team has shifted focus to strong organic growth and growing data consumption, so far reflected in unprecedented price cuts and attractive handset subsidies. Meanwhile, Grupo Televisa, SAB and Grupo Salinas have continued to execute their turnaround strategy for Iusacell, which so far has resulted in a near doubling of its subscriber base. Finally, whereas NII Holdings Inc. (NIHD) in the past was an iDEN-only operator, it now operates Mexico’s fastest 3G network, with speeds that are six times those of America Movil.
Focus 2013 January 2013
203
On the regulatory front, we expect Cofetel to implement asymmetric mobile termination rates (MTRs) next year under a potentially more aggressive framework than the Colombian case. A Mexican Supreme Court ruling expected in February 2013 could potentially give Cofetel powers to implement asymmetric MTRs. The impact of asymmetric MTRs could be from 1% to 3% of AMX’s EBITDA, depending on the aggressiveness of the rules, but the impact would go beyond financials: asymmetry would allow AMX’s competitors to offer attractive rates and big baskets of off-net minutes.
Changes to Mexico’s foreign investment law could open attractive opportunities in the competitive local exchange carrier (CLEC) and cable segments. Currently, foreign investors cannot control fixed, satellite, or cable operators in Mexico. A proposal in Congress, which we believe has a good probability of being passed in 2013, was recently presented by the opposition party, PAN (but we believe it will also have the support of the incumbent PRI).
Investors willing to play the possibility of consolidation in the Mexican CLECs and cable segments could diversify with a basket composed of 61% Megacable Holdings, 34% Maxcom Telecomunicaciones, and 5% Axtel (there is already an offer for Maxcom at MXN 2.90 per CPO, but we don’t think that the shares will be delisted or that the new controlling group will sell the company if it receives an attractive offer).
The NIHD turnaround could become the biggest source of value creation in the space in 2013. Nextel already launched 3G in Chile, Mexico, Peru, and, partially, Brazil. The migration to 3G was more difficult than we originally expected, and there were significant delays. However, except for the final launch in Brazil, the evolution to 3G is now a reality, and with it the possibility for the company to expand to niches it was not addressing before, as well as to gain scale with a network far more flexible than iDEN. The challenge, however, will be to deal with the first LTE launches in the region and to find sources of cash to de-leverage the company, including selling towers or divesting from Peru.
I N D U S T R Y E V E N T S T O W A T C H I N 2 0 1 3
BCE/Astral CRTC regulatory process in Canada. At this point, we expect the Canadian Radio-television and Telecommunications Commission (CRTC) will begin the public consultation process in late January 2013, followed by a public hearing in April and a decision in May. We expect potential buyers would be lined up for the assets that BCE and Astral decide to divest in their application to the CRTC. English TV assets in the family/children genre will likely be coveted by Corus Entertainment Inc. (CJR). Marquee assets such as TMN, if identified for sale, will likely be coveted by Rogers.
Allstream strategic review. We expect MTS Allstream will conclude its strategic review in the first half of 2013. We believe the best course of action for MTS is to divest Allstream and use the proceeds to top up its pension and/or buy back shares to relieve the pressure on the dividend in the long run. We believe a sale will likely occur, but we are skeptical about the valuation since it is our view that the deep-pocketed large U.S. operators (Verizon and AT&T) with cost synergies are not interested in Allstream. Once MTS parts with Allstream, we expect the MTS segment will be put “in play” and we expect both BCE and TELUS will show interest, particularly in the MTS wireless business in Manitoba.
The 700 MHz spectrum auction in Canada. We expect the final rules will be released in early 2013, with the auction taking place in late Q2/mid-2013. As noted above in our wireless comments, we believe new-entrant consolidation and a cableco wireless strategic alliance could be formed ahead of the auction.
Focus 2013 January 2013
204
Regulatory developments:
Broadband Internet (wholesale cost). The CRTC is assessing the wholesale pricing/costing regime for broadband Internet services resellers. These decisions are expected in Q1/13 and could impact the broadband network providers’ wholesale cost and resellers’ profitability. We believe it will either be status quo or move in the direction that favours the facility-based providers (e.g., Rogers, BCE, Shaw, etc.).
Finalization of roaming and tower share policies. This is expected in early 2013.
CRTC national wireless code of conduct. The hearing is scheduled for February 2013.
Wild cards in 2013:
Shaw buys Corus. As Shaw’s core cable operations stabilize, it may look to fold in Corus assets as the combination could create significant synergies between Shaw Media and Corus.
BCE buys the rest of Bell Aliant. If Astral falls through for BCE, it may consider taking in the rest of BA it does not already own. For this to make sense for BCE, we believe the BA valuation would have to be a lot lower.
RCI’s Toronto Blue Jays win the World Series.
O U T P E R F O R M E R S
Comcast Corporation (Sector Outperform) – Stay the Course for 2013
We expect superior Cable segment growth to continue in 2013. Comcast (CMCSA) has invested significantly to improve its video product, and we believe the enhancement will continue to drive video subscriber improvement and a balance of subscriber and ARPU growth in 2013. On the business front, we recently increased our business revenue growth forecast to 25% in 2013, based on the momentum and share gains against the telcos through 2012. On costs, we expect management will remain focused on controlling costs, even with the headwind generated by programming, as it has done in the past three years. For the Cable segment, we estimate 2013 revenue growth of 5% and EBITDA growth of approximately 6.5%, which would be consistent with 2012.
Improving trends at NBCU. We expect Cable Networks performance to remain steady in 2013, supported by Theme Parks. We expect the Filmed Entertainment segment to be unpredictable as usual, and we have very conservative estimates built in for 2013. What is new for 2013 could be the start of a turnaround at Broadcast Networks, based on the improving results we started to see in Q3/12. For NBCU, we estimate revenue growth of 5% and EBITDA growth of approximately 6% in 2013, with easier comparison due to the high costs related to the London Olympics in 2012.
Strong FCF generation and disciplined use of cash. We estimate CMCSA will generate FCF growth of approximately 15% in 2013 to $7.50 billion and FCF per share of $2.93. With the FCF and excess cash from the SpectrumCo spectrum sale, we estimate the share buyback program will increase from its original guidance of $6.5 billion (2012-2013) to approximately $8.5 billion, with approximately $5.5 billion of that coming in 2013. With respect to the dividend, we estimate another 40% dividend increase in early 2013 due to the low dividend payout ratio (approximately 33% of 2012E EPS and 27% of FCF per share).
Despite the strong share price performance in 2012, we believe CMCSA shares are still attractively valued. CMCSA is trading at 7.9% NTM FCF yield (assuming full cash taxes and excluding the stimulus impact), which is the third-highest in our coverage universe (lower than only TWC and VZ), and 9.0x EV/cash EBIT (lowest in our coverage universe). In our view, no other company under our coverage can deliver CMCSA’s balance of growth, profitability, cash flow, dividend growth, and cash return to shareholders.
Focus 2013 January 2013
205
Rogers Communications Inc. (Sector Outperform) – Upside to Consensus Estimates and Valuation
Wireless recovery should lead to improving overall trends. We expect wireless results to drive RCI’s share price, and we expect the wireless results will exceed consensus for Q4/12 and help bring 2013 consensus higher given the strong exit in 2012.
We expect blended ARPU will stay positive in Q4/12 and remain positive in 2013 for the full year for the first time since 2008, driven by data revenue growth, stable voice revenue erosion, and the continued shift of emphasis away from prepaid to post-paid. Wireless promotions have been a little more intense than in a typical Q4, but we are not too concerned because the promotions are limited-time offers and many are restricted to lower-end smartphones that have lower subsidies, which enables RCI to maintain margins and the lifetime value of the subscriber. We expect this will help accelerate wireless service revenue growth to 3.5% in 2013, compared with +3% in Q4/12 and +1.5% in 2012.
We estimate 7% wireless EBITDA growth in 2013 and believe this will be driven by the combination of service revenue growth acceleration, improving churn, more stringent smartphone upgrade policy, and general cost control. This is in line with the 7% exit growth rate in Q4/12, which we believe will be a record quarter for smartphone activation and a significant improvement from the 2% growth in 2012.
Disciplined competition in cable. We expect RCI’s major telco competitor, BCE, will focus on maintaining cash flow growth in 2013, with price increases and slower Fibe TV network build-out. With approximately 50% Fibe IPTV coverage for BCE, we believe Rogers will focus on subscriber growth in the non-Fibe territories and remain price disciplined in the Fibe TV markets as it has in the second half of 2012. We believe this strategy will help maintain cable operations revenue growth at 1% and with cost control, we expect cable to grow EBITDA at 2% driven by margin improvement.
Focus on cost control and productivity improvement. Heading into 2013, Rogers should benefit from a full year of benefit from its renewed focus on cost control and productivity improvement across the organization. We believe management’s target of 3%-5% annual productivity improvement will contribute to approximately 2.5% revenue growth in 2013 and approximately 5% consolidated EBITDA growth. These would be the highest growth rates for Rogers since 2010 and would peg it in line with TELUS and well ahead of BCE. More importantly, with stable capex we estimate cash EBIT growth will be approximately 10%.
Attractive valuation relative to its cash EBIT growth. We estimate RCI will grow cash EBIT by approximately 10% in 2013, which is above average among its peers, but it is trading at approximately 11x EV/cash EBIT, which is below BCE and TELUS. RCI is also trading at a discount on EV/EBITDA, P/E, and FCF.
Consistent dividend growth. With a relatively low payout ratio of 53% of FCF fully taxed and growing FCF, we believe there is plenty of room for RCI to sustain 10% dividend growth over the next several years. We expect RCI will announce the next dividend increase of 10% in February 2013.
Telefonica Brasil SA (Sector Outperform)
Telefonica’s service revenue growth is likely to continue outperforming peers’ on better-quality metrics and greater 3G coverage.
The fixed-line division could be helped by stronger pay TV proposition with IPTV.
Dividend yield likely to remain highest in LatAm telco space.
Telefonica’s plans to list LatAm assets could imply a change in profile for VIV should Telefonica use the company as a vehicle to carry out the IPO (not necessarily bad for VIV, but valuation would be uncertain). TEF may prefer to create a new holding entity, in which case VIV would not be affected.
Focus 2013 January 2013
206
NII Holdings, Inc. (Sector Outperform)
Evolution to 3G is now a reality in Chile, Mexico, and Peru. Preliminary launches in Brazil have already occurred, with full launch expected before May 2013 (partial bill-and-keep in Brazil should help NIHD to offer attractive packages).
NIHD’s new network is substantially faster than that of its peers, helping the company improve its value proposition. If PTT does not sell well, NIHD could still opt to go mainstream (non-PTT).
Larger 3G scale and gradual phase-out of iDEN network could help the company gain efficiencies and increase its target niche.
The company could sell towers or divest Peru assets as means of decreasing leverage levels, which remain high.
Abundant spectrum holdings should help NIHD to launch LTE in key markets except Argentina (approval by Anatel of Unicel acquisition very relevant for future LTE deployments in Brazil).
The key risk to our investment thesis is that new 3G network does not help company to decrease iDEN churn and future LTE substitutes.
U N D E R P E R F O R M E R S
Bell Aliant Inc. (Sector Underperform) – Dividend Expected to Be Maintained but Payout Ratio Expected to Rise
Sector Underperform rating. In 2012, BA shares’ total return was roughly flat, with the dividend offset by capital depreciation, and they underperformed relative to peers. We believe this was due to EBITDA and FCF decline in 2012. We believe the challenges faced by the company will be greater in 2013 due to higher cash taxes. We expect that the EBITDA decline will remain stable, but that the higher cash taxes will reduce FCF by about 20% in 2013 unless there is a significant capex reduction or relief on cash taxes.
Management is making the right strategic move by investing in FibreOp, in our view, and has done a great job in controlling cost. BA management has executed well in managing the decline of the legacy business while continuing to invest in FibreOp to improve the revenue trajectory. We expect the revenue trend will improve slightly and will be relatively flat in 2013 versus 2012. However due to the FibreOp TV content cost and the changes to the revenue mix, we believe EBITDA margin will remain under pressure even with solid cost control.
We estimate cash taxes will increase by approximately $110 million in 2013 and the dividend payout ratio will be over 100% (above its 75%-85% policy) unless BA reduces capex or finds relief on cash taxes. We believe one possible solution for BA would be a meaningful reduction of capex by slowing the pace of the FibreOp network expansion in 2013. By year-end 2012, we estimate BA would have added approximately 190,000 FibreOp homes. We currently estimate BA will add approximately 120,000 homes in 2013, which would already be a much slower pace of expansion. This assumes that BA will reach its goal of 1 million homes passed in three years by the end of 2015. Another potential solution would be to seek relief on cash taxes in 2013. Of the $110 million increase, some is related to the $55 million due to changes in the partnership tax rules, which management had indicated could slip into 2014. Regardless, the cash tax increase in 2013 and 2014 combined is expected to be in the range of $250 million to $300 million, including the $55 million noted above.
We expect management to maintain the current dividend. However, we believe a higher dividend payout ratio increases risk of a cut, which would result in a higher dividend yield even if BA were to maintain the dividend. Over the past 24 months, BA’s dividend yield has ranged from 6.5% to 7.8%, with the payout ratio at approximately 80%. With a higher dividend payout ratio in 2013, we believe the dividend yield range will rise to account for the higher risk.
Focus 2013 January 2013
207
We do not believe BCE will attempt to acquire the rest of BA at the current valuation. We believe the market expects BCE to buy out the remaining 55% of BA in the future. We do not believe this will be a 2013 event unless BA’s valuation is more reasonable. Based on fundamental valuation metrics, BA is trading at a premium relative to many of its peers that are exhibiting cash EBIT and FCF growth. On cash EBIT, it is trading at approximately 13x and on FCF, it is yielding 6.1% (full cash tax) or 6.6% (actual cash tax), below its dividend yield.
AT&T Inc. (Sector Underperform) – Premium Valuation with Cash Flow Decline Due to Rising Capex
Sector Underperform rating. In 2012, T shares generated a total return of approximately 17%, which is ahead of VZ and the S&P 500. We expect 2013 will be a more challenging year for T shares based on the looming competitive threats on wireless, the high capex and cash flow outlook, and valuation.
Capex catch-up for the next three years under Project Velocity IP. We estimate T’s capex intensity will rise by about 200 bp in 2013 due to both wireless and wireline capex increases of 22% and 10%, respectively, to approximately $22 billion in 2013. The expected wireless increase is due to the acceleration of 4G LTE coverage to 300 million POPs by the end of 2014. We believe T is utilizing fewer spectrum frequencies (than VZW) in its current 4G LTE deployment, which means T needs to have a denser network, which requires more capital. The higher wireline capex is to expand U-verse network coverage to approximately 75% of homes, which puts it about in line with its peers.
Premium valuation is not justified due to declining cash EBIT in 2013. With the higher capex, we estimate T’s cash EBIT will decline by approximately 8% in 2013, compared with approximately 7% growth in 2012. We estimate EBITDA growth will remain consistent at approximately 3% in 2013. On cash EBIT, T is trading at approximately 12x. Others trading at that level have much higher cash EBIT growth in 2013. While it may look attractive on EV/EBITDA, we think it is trading at a premium on cash EBIT and FCF, which we believe is not justified.
Wireless competitive threats. We believe VZW continues to gain post-paid subscriber share in a profitable fashion against T by differentiating on 4G LTE coverage and/or the data share plans. Since losing iPhone exclusivity, T has been giving up share to VZW and we believe this will continue in 2013. For the past few years, there has been minimal threat from the third and fourth national operators in the United States – namely, Sprint (S) and T-Mobile USA (Tmo). Looking ahead to 2013, we expect S will be a more legitimate competitor and the combination of Tmo and MetroPCS may help them compete slightly more effectively as well. We believe a stronger third national operator would impact T more than VZW given VZW’s network differentiation.
Wireline is still vulnerable to cable MSO competition in non–U-verse territories. Although Project VIP will expand U-verse network coverage to approximately 75%, the U-verse TV service will only be available to 33 million homes, or about 40%-45% of homes, because the bandwidth of approximately 24 million homes will only be sufficient for broadband service. Without a viable triple-play service to over half of its wireline homes, we believe T is still vulnerable to voice and broadband subscriber losses to cablecos in these territories. We estimate wireline EBITDA decline of approximately 2% in 2013.
America Movil (Sector Underperform)
The competitive environment is rapidly deteriorating in Mexico, the market where AMX generates nearly 80% of operating cash flow.
Iusacell and Telefonica now offer prepaid rates that are 30% to 78% cheaper than AMX’s rates. Aggressive post-paid promotions and handset subsidies could result in rising fixed-to-mobile substitution, higher wireless churn, and rising equipment costs, potentially resulting in aggressive contraction of Mexico’s margins.
Focus 2013 January 2013
208
Likely implementation of asymmetric MTRs in Mexico could result in aggressive loss of market share as competitors could have a pricing advantage. In Colombia, asymmetry is effective as of January 1, 2013.
The situation in Brazil remains complicated. Depreciation of local currency should continue to impact AMX’s results, resulting in a potential contraction of consolidated EBITDA during the first half of 2013.
Valuation remains high compared with local peers but average compared with U.S. or Canadian peers.
Grupo Televisa, SAB (Sector Perform)
Asymmetric regulation could help Televisa to more rapidly ensure a successful turnaround of Iusacell, which in our view remains a growth opportunity for TV and a necessary strategy to ensure long-term diversification as content business gradually migrates to mobile platforms.
However, in the short term, we expect Iusacell to continue absorbing cash resources from Televisa, especially as handset subsidies remain high.
Sponsorship of soccer teams by AMX and of soap operas by TV’s competitors raises the possibility of tougher competition in the business that generates 75% of Televisa’s cash.
Auction of two free-to-air licences remains a risk, especially if AMX partners with other groups that could be interested in producing television content. AMX’s control option to acquire Dish means this pay TV operator could distribute the AMX content in very much the same way as SKY or Cablevision distributes Televisa’s.
After a recent rally, Televisa’s valuation appears unappealing. We have a Sector Perform rating on TV, but we believe there is downside risk to our current estimates.
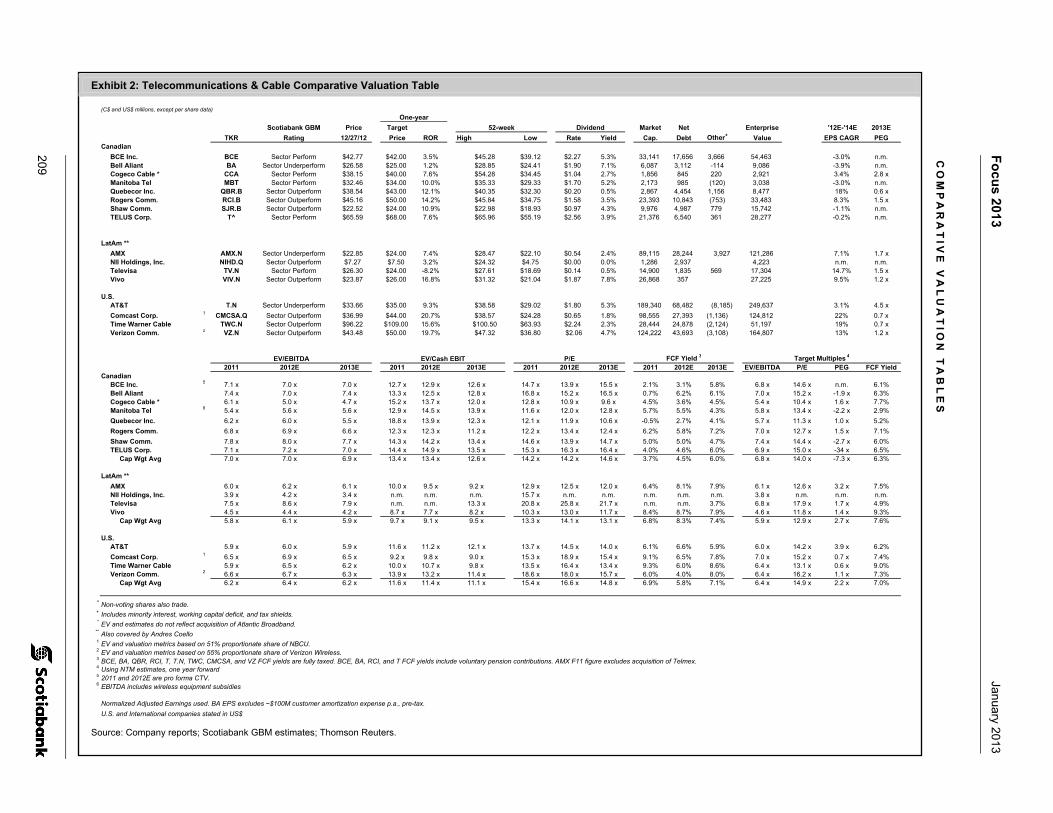
209
Fo
cus 2013
January 2013
Exhibit 2: Telecommunications & Cable Comparative Valuation Table
(C$ and US$ millions, except per share data)
One-year
Scotiabank GBM Price Target 52-week Dividend Market Net Enterprise '12E-'14E 2013E
TKR Rating 12/27/12 Price ROR High Low Rate Yield Cap. Debt Other+ Value EPS CAGR PEGCanadian
BCE Inc. BCE Sector Perform $42.77 $42.00 3.5% $45.28 $39.12 $2.27 5.3% 33,141 17,656 3,666 54,463 -3.0% n.m.Bell Aliant BA Sector Underperform $26.58 $25.00 1.2% $28.85 $24.41 $1.90 7.1% 6,087 3,112 -114 9,086 -3.9% n.m.Cogeco Cable * CCA Sector Perform $38.15 $40.00 7.6% $54.28 $34.45 $1.04 2.7% 1,856 845 220 2,921 3.4% 2.8 xManitoba Tel MBT Sector Perform $32.46 $34.00 10.0% $35.33 $29.33 $1.70 5.2% 2,173 985 (120) 3,038 -3.0% n.m.Quebecor Inc. QBR.B Sector Outperform $38.54 $43.00 12.1% $40.35 $32.30 $0.20 0.5% 2,867 4,454 1,156 8,477 18% 0.6 xRogers Comm. RCI.B Sector Outperform $45.16 $50.00 14.2% $45.84 $34.75 $1.58 3.5% 23,393 10,843 (753) 33,483 8.3% 1.5 xShaw Comm. SJR.B Sector Outperform $22.52 $24.00 10.9% $22.98 $18.93 $0.97 4.3% 9,976 4,987 779 15,742 -1.1% n.m.TELUS Corp. T^ Sector Perform $65.59 $68.00 7.6% $65.96 $55.19 $2.56 3.9% 21,376 6,540 361 28,277 -0.2% n.m.
LatAm **
AMX AMX.N Sector Underperform $22.85 $24.00 7.4% $28.47 $22.10 $0.54 2.4% 89,115 28,244 3,927 121,286 7.1% 1.7 xNII Holdings, Inc. NIHD.Q Sector Outperform $7.27 $7.50 3.2% $24.32 $4.75 $0.00 0.0% 1,286 2,937 4,223 n.m. n.m.Televisa TV.N Sector Perform $26.30 $24.00 -8.2% $27.61 $18.69 $0.14 0.5% 14,900 1,835 569 17,304 14.7% 1.5 xVivo VIV.N Sector Outperform $23.87 $26.00 16.8% $31.32 $21.04 $1.87 7.8% 26,868 357 27,225 9.5% 1.2 x
U.S.AT&T T.N Sector Underperform $33.66 $35.00 9.3% $38.58 $29.02 $1.80 5.3% 189,340 68,482 (8,185) 249,637 3.1% 4.5 x
Comcast Corp. 1 CMCSA.Q Sector Outperform $36.99 $44.00 20.7% $38.57 $24.28 $0.65 1.8% 98,555 27,393 (1,136) 124,812 22% 0.7 xTime Warner Cable TWC.N Sector Outperform $96.22 $109.00 15.6% $100.50 $63.93 $2.24 2.3% 28,444 24,878 (2,124) 51,197 19% 0.7 xVerizon Comm. 2 VZ.N Sector Outperform $43.48 $50.00 19.7% $47.32 $36.80 $2.06 4.7% 124,222 43,693 (3,108) 164,807 13% 1.2 x
EV/EBITDA EV/Cash EBIT P/E FCF Yield 3 Target Multiples 4
2011 2012E 2013E 2011 2012E 2013E 2011 2012E 2013E 2011 2012E 2013E EV/EBITDA P/E PEG FCF YieldCanadian
BCE Inc. 5 7.1 x 7.0 x 7.0 x 12.7 x 12.9 x 12.6 x 14.7 x 13.9 x 15.5 x 2.1% 3.1% 5.8% 6.8 x 14.6 x n.m. 6.1%Bell Aliant 7.4 x 7.0 x 7.4 x 13.3 x 12.5 x 12.8 x 16.8 x 15.2 x 16.5 x 0.7% 6.2% 6.1% 7.0 x 15.2 x -1.9 x 6.3%Cogeco Cable * 6.1 x 5.0 x 4.7 x 15.2 x 13.7 x 12.0 x 12.8 x 10.9 x 9.6 x 4.5% 3.6% 4.5% 5.4 x 10.4 x 1.6 x 7.7%Manitoba Tel 6 5.4 x 5.6 x 5.6 x 12.9 x 14.5 x 13.9 x 11.6 x 12.0 x 12.8 x 5.7% 5.5% 4.3% 5.8 x 13.4 x -2.2 x 2.9%
Quebecor Inc. 6.2 x 6.0 x 5.5 x 18.8 x 13.9 x 12.3 x 12.1 x 11.9 x 10.6 x -0.5% 2.7% 4.1% 5.7 x 11.3 x 1.0 x 5.2%
Rogers Comm. 6.8 x 6.9 x 6.6 x 12.3 x 12.3 x 11.2 x 12.2 x 13.4 x 12.4 x 6.2% 5.8% 7.2% 7.0 x 12.7 x 1.5 x 7.1%
Shaw Comm. 7.8 x 8.0 x 7.7 x 14.3 x 14.2 x 13.4 x 14.6 x 13.9 x 14.7 x 5.0% 5.0% 4.7% 7.4 x 14.4 x -2.7 x 6.0%TELUS Corp. 7.1 x 7.2 x 7.0 x 14.4 x 14.9 x 13.5 x 15.3 x 16.3 x 16.4 x 4.0% 4.6% 6.0% 6.9 x 15.0 x -34 x 6.5%
Cap Wgt Avg 7.0 x 7.0 x 6.9 x 13.4 x 13.4 x 12.6 x 14.2 x 14.2 x 14.6 x 3.7% 4.5% 6.0% 6.8 x 14.0 x -7.3 x 6.3%
LatAm **
AMX 6.0 x 6.2 x 6.1 x 10.0 x 9.5 x 9.2 x 12.9 x 12.5 x 12.0 x 6.4% 8.1% 7.9% 6.1 x 12.6 x 3.2 x 7.5%NII Holdings, Inc. 3.9 x 4.2 x 3.4 x n.m. n.m. n.m. 15.7 x n.m. n.m. n.m. n.m. n.m. 3.8 x n.m. n.m. n.m.Televisa 7.5 x 8.6 x 7.9 x n.m. n.m. 13.3 x 20.8 x 25.8 x 21.7 x n.m. n.m. 3.7% 6.8 x 17.9 x 1.7 x 4.9%Vivo 4.5 x 4.4 x 4.2 x 8.7 x 7.7 x 8.2 x 10.3 x 13.0 x 11.7 x 8.4% 8.7% 7.9% 4.6 x 11.8 x 1.4 x 9.3%
Cap Wgt Avg 5.8 x 6.1 x 5.9 x 9.7 x 9.1 x 9.5 x 13.3 x 14.1 x 13.1 x 6.8% 8.3% 7.4% 5.9 x 12.9 x 2.7 x 7.6%
U.S.AT&T 5.9 x 6.0 x 5.9 x 11.6 x 11.2 x 12.1 x 13.7 x 14.5 x 14.0 x 6.1% 6.6% 5.9% 6.0 x 14.2 x 3.9 x 6.2%
Comcast Corp. 1 6.5 x 6.9 x 6.5 x 9.2 x 9.8 x 9.0 x 15.3 x 18.9 x 15.4 x 9.1% 6.5% 7.8% 7.0 x 15.2 x 0.7 x 7.4%Time Warner Cable 5.9 x 6.5 x 6.2 x 10.0 x 10.7 x 9.8 x 13.5 x 16.4 x 13.4 x 9.3% 6.0% 8.6% 6.4 x 13.1 x 0.6 x 9.0%Verizon Comm. 2 6.6 x 6.7 x 6.3 x 13.9 x 13.2 x 11.4 x 18.6 x 18.0 x 15.7 x 6.0% 4.0% 8.0% 6.4 x 16.2 x 1.1 x 7.3%
Cap Wgt Avg 6.2 x 6.4 x 6.2 x 11.6 x 11.4 x 11.1 x 15.4 x 16.6 x 14.8 x 6.9% 5.8% 7.1% 6.4 x 14.9 x 2.2 x 7.0%
^ Non-voting shares also trade.+ Includes minority interest, working capital deficit, and tax shields.* EV and estimates do not reflect acquisition of Atlantic Broadband.
** Also covered by Andres Coello1 EV and valuation metrics based on 51% proportionate share of NBCU.2 EV and valuation metrics based on 55% proportionate share of Verizon Wireless.3 BCE, BA, QBR, RCI, T, T.N, TWC, CMCSA, and VZ FCF yields are fully taxed. BCE, BA, RCI, and T FCF yields include voluntary pension contributions. AMX F11 figure excludes acquisition of Telmex.4 Using NTM estimates, one year forward5 2011 and 2012E are pro forma CTV.6 EBITDA includes wireless equipment subsidies
Normalized Adjusted Earnings used. BA EPS excludes ~$100M customer amortization expense p.a., pre-tax.
U.S. and International companies stated in US$
Source: Company reports; Scotiabank GBM estimates; Thomson Reuters.
CO
MP
AR
AT
IVE
VA
LU
AT
ION
TA
BL
ES
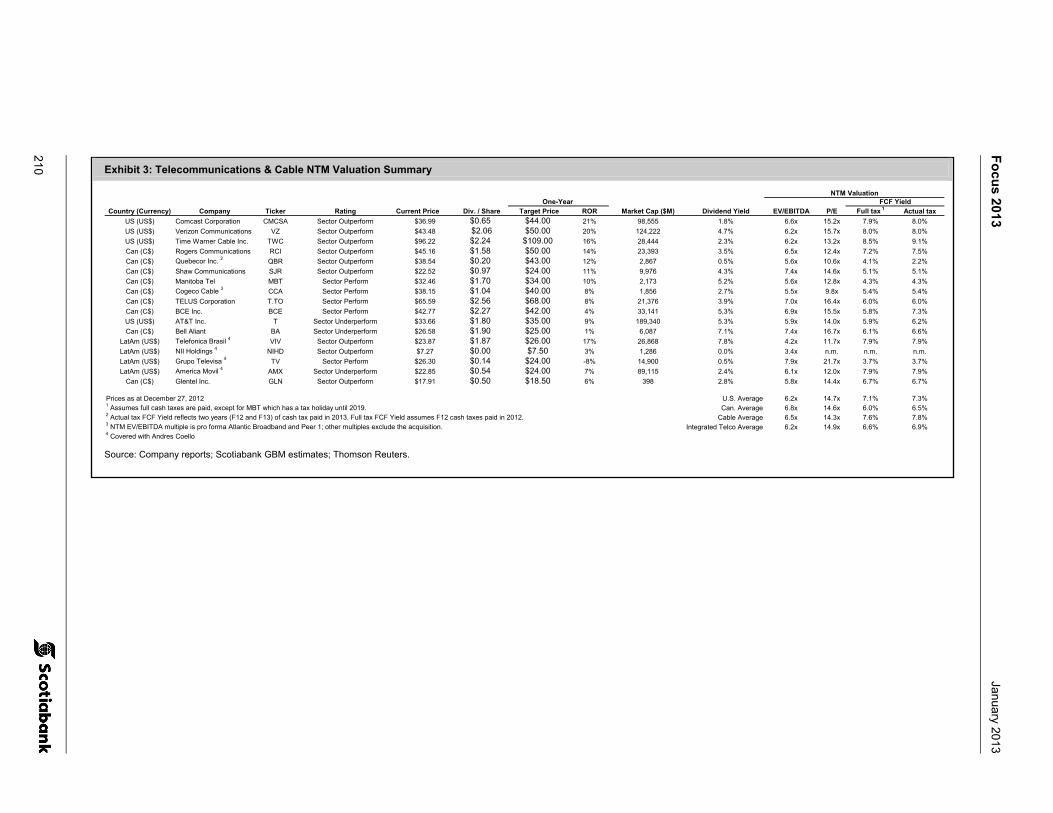
Fo
cus 2013
January 2013
210 Exhibit 3: Telecommunications & Cable NTM Valuation Summary
NTM ValuationOne-Year FCF Yield
Country (Currency) Company Ticker Rating Current Price Div. / Share Target Price ROR Market Cap ($M) Dividend Yield EV/EBITDA P/E Full tax 1 Actual tax
US (US$) Comcast Corporation CMCSA Sector Outperform $36.99 $0.65 $44.00 21% 98,555 1.8% 6.6x 15.2x 7.9% 8.0%
US (US$) Verizon Communications VZ Sector Outperform $43.48 $2.06 $50.00 20% 124,222 4.7% 6.2x 15.7x 8.0% 8.0%
US (US$) Time Warner Cable Inc. TWC Sector Outperform $96.22 $2.24 $109.00 16% 28,444 2.3% 6.2x 13.2x 8.5% 9.1%
Can (C$) Rogers Communications RCI Sector Outperform $45.16 $1.58 $50.00 14% 23,393 3.5% 6.5x 12.4x 7.2% 7.5%
Can (C$) Quebecor Inc. 2 QBR Sector Outperform $38.54 $0.20 $43.00 12% 2,867 0.5% 5.6x 10.6x 4.1% 2.2%
Can (C$) Shaw Communications SJR Sector Outperform $22.52 $0.97 $24.00 11% 9,976 4.3% 7.4x 14.6x 5.1% 5.1%
Can (C$) Manitoba Tel MBT Sector Perform $32.46 $1.70 $34.00 10% 2,173 5.2% 5.6x 12.8x 4.3% 4.3%
Can (C$) Cogeco Cable 3 CCA Sector Perform $38.15 $1.04 $40.00 8% 1,856 2.7% 5.5x 9.8x 5.4% 5.4%
Can (C$) TELUS Corporation T.TO Sector Perform $65.59 $2.56 $68.00 8% 21,376 3.9% 7.0x 16.4x 6.0% 6.0%
Can (C$) BCE Inc. BCE Sector Perform $42.77 $2.27 $42.00 4% 33,141 5.3% 6.9x 15.5x 5.8% 7.3%
US (US$) AT&T Inc. T Sector Underperform $33.66 $1.80 $35.00 9% 189,340 5.3% 5.9x 14.0x 5.9% 6.2%
Can (C$) Bell Aliant BA Sector Underperform $26.58 $1.90 $25.00 1% 6,087 7.1% 7.4x 16.7x 6.1% 6.6%
LatAm (US$) Telefonica Brasil 4 VIV Sector Outperform $23.87 $1.87 $26.00 17% 26,868 7.8% 4.2x 11.7x 7.9% 7.9%
LatAm (US$) NII Holdings 4 NIHD Sector Outperform $7.27 $0.00 $7.50 3% 1,286 0.0% 3.4x n.m. n.m. n.m.
LatAm (US$) Grupo Televisa 4 TV Sector Perform $26.30 $0.14 $24.00 -8% 14,900 0.5% 7.9x 21.7x 3.7% 3.7%
LatAm (US$) America Movil 4 AMX Sector Underperform $22.85 $0.54 $24.00 7% 89,115 2.4% 6.1x 12.0x 7.9% 7.9%
Can (C$) Glentel Inc. GLN Sector Outperform $17.91 $0.50 $18.50 6% 398 2.8% 5.8x 14.4x 6.7% 6.7%
Prices as at December 27, 2012 U.S. Average 6.2x 14.7x 7.1% 7.3%1 Assumes full cash taxes are paid, except for MBT which has a tax holiday until 2019. Can. Average 6.8x 14.6x 6.0% 6.5%2 Actual tax FCF Yield reflects two years (F12 and F13) of cash tax paid in 2013. Full tax FCF Yield assumes F12 cash taxes paid in 2012. Cable Average 6.5x 14.3x 7.6% 7.8%3 NTM EV/EBITDA multiple is pro forma Atlantic Broadband and Peer 1; other multiples exclude the acquisition. Integrated Telco Average 6.2x 14.9x 6.6% 6.9%4 Covered with Andres Coello
Source: Company reports; Scotiabank GBM estimates; Thomson Reuters.
Focus 2013 January 2013
Turan Quettawala, MBA, CFA (416) 863-7065 Milan Posarac (416) 863-7532 (Scotia Capital Inc. – Canada) (Scotia Capital Inc. – Canada) [email protected] [email protected]
211
Transportation & Aerospace
Macro Tailwind Desperately Needed
Growth for transportation stocks will depend on an improving economy. We believe that the next phase of share price performance for many transportation stocks will likely come from improved top-line prospects. However, top-line growth is predicated on an improved economic environment, which remains elusive. Our current forecasts are predicated on a continued mild recovery, with the likelihood that North America will fare better than Europe. A faster-than-expected comeback from China could result in improved performance for many stocks; however, the railroads (particularly Canadian Pacific Railway Limited [CP]) are likely best positioned to benefit from such an uptrend.
Canadian airlines have performed very well despite mixed macroeconomic conditions, but 2013 will bring more competitive challenges. We believe that global airline traffic will remain in the positive zone, with mid-single-digit growth buoyed by strength in emerging markets. For the most part, the Canadian environment has remained stable, with pricing and capacity discipline by both WestJet Airlines Ltd. (WJA) and Air Canada (AC). We expect a more intense competitive environment in 2013 as WJA builds out its regional and premium economy businesses and AC initiates its low-cost carrier (LCC). This could constrain revenue per available seat mile (RASM) growth, particularly at AC, as WJA should benefit from yield momentum as a result of the premium economy and regional launch.
A sustainable improvement in low-end business jet demand remains hostage to the economy. The weak macroeconomic environment has negatively affected demand for business jets, particularly ones at the lower end such as Learjets and Phenoms. Commercial RJ order flow has also been weak, with most U.S. airline orders pushed out to 2013. We believe that a sustainable recovery in share prices for aerospace stocks would only be possible with some clarity on the macroeconomic front.
L O O K F O R R E S T R U C T U R I N G T O D R I V E E A R N I N G S G R O W T H
Restructuring stories provide earnings growth. In our opinion, companies such as CP and TransForce Inc. (TFI), which are implementing significant cost-restructuring efforts, should be able to deliver significant earnings growth, even in tepid economic conditions. While a weak economy will obviously pressure earnings for all our companies, we believe that both CP and TFI should be able to navigate much better as the majority of their earnings growth is likely to come from restructuring and improved operations. For TFI, we are assuming organic growth of only 1% over the next two years, so it is almost entirely a margin-driven story. However, companies such as Canadian National Railway Company (CNR) and Mullen Group Ltd. (MTL) are likely to be more dependent on top-line momentum for earnings growth, and this could be difficult to achieve if the economy provides no tailwind.
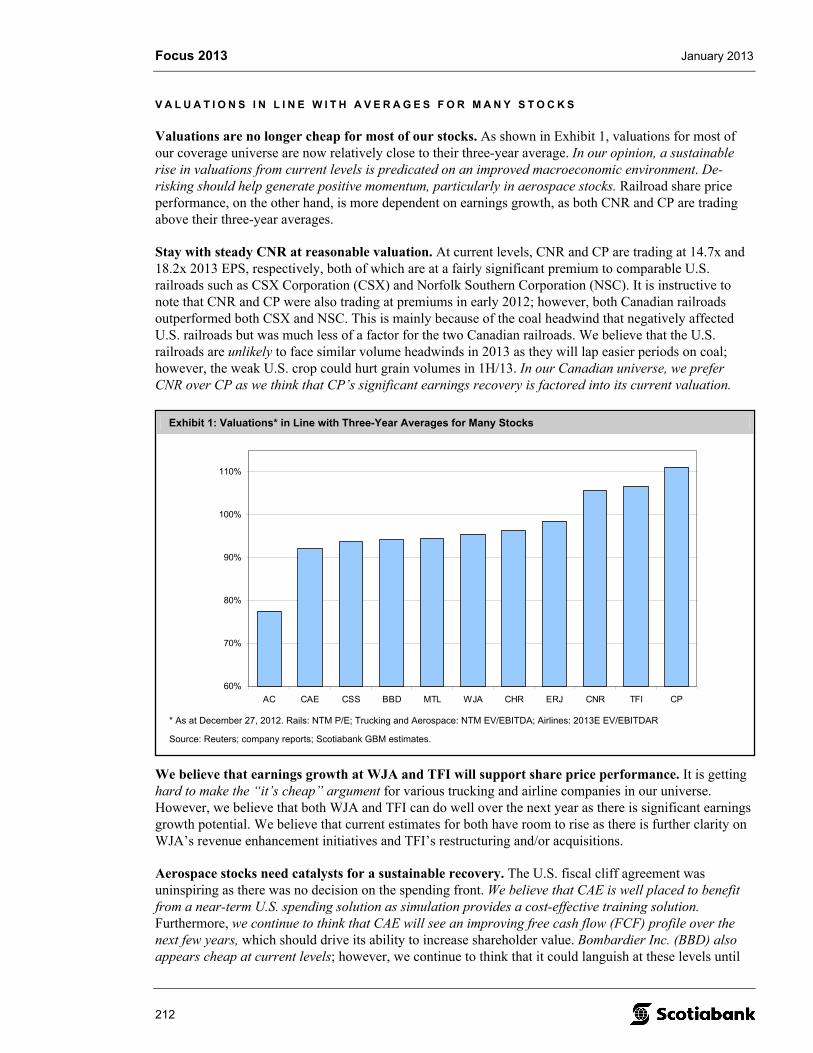
Focus 2013 January 2013
212
Exhibit 1: Valuations* in Line with Three-Year Averages for Many Stocks
60%
70%
80%
90%
100%
110%
AC CAE CSS BBD MTL WJA CHR ERJ CNR TFI CP
* As at December 27, 2012. Rails: NTM P/E; Trucking and Aerospace: NTM EV/EBITDA; Airlines: 2013E EV/EBITDAR
Source: Reuters; company reports; Scotiabank GBM estimates.
V A L U A T I O N S I N L I N E W I T H A V E R A G E S F O R M A N Y S T O C K S
Valuations are no longer cheap for most of our stocks. As shown in Exhibit 1, valuations for most of our coverage universe are now relatively close to their three-year average. In our opinion, a sustainable rise in valuations from current levels is predicated on an improved macroeconomic environment. De-risking should help generate positive momentum, particularly in aerospace stocks. Railroad share price performance, on the other hand, is more dependent on earnings growth, as both CNR and CP are trading above their three-year averages.
Stay with steady CNR at reasonable valuation. At current levels, CNR and CP are trading at 14.7x and 18.2x 2013 EPS, respectively, both of which are at a fairly significant premium to comparable U.S. railroads such as CSX Corporation (CSX) and Norfolk Southern Corporation (NSC). It is instructive to note that CNR and CP were also trading at premiums in early 2012; however, both Canadian railroads outperformed both CSX and NSC. This is mainly because of the coal headwind that negatively affected U.S. railroads but was much less of a factor for the two Canadian railroads. We believe that the U.S. railroads are unlikely to face similar volume headwinds in 2013 as they will lap easier periods on coal; however, the weak U.S. crop could hurt grain volumes in 1H/13. In our Canadian universe, we prefer CNR over CP as we think that CP’s significant earnings recovery is factored into its current valuation.
We believe that earnings growth at WJA and TFI will support share price performance. It is getting hard to make the “it’s cheap” argument for various trucking and airline companies in our universe. However, we believe that both WJA and TFI can do well over the next year as there is significant earnings growth potential. We believe that current estimates for both have room to rise as there is further clarity on WJA’s revenue enhancement initiatives and TFI’s restructuring and/or acquisitions.
Aerospace stocks need catalysts for a sustainable recovery. The U.S. fiscal cliff agreement was uninspiring as there was no decision on the spending front. We believe that CAE is well placed to benefit from a near-term U.S. spending solution as simulation provides a cost-effective training solution. Furthermore, we continue to think that CAE will see an improving free cash flow (FCF) profile over the next few years, which should drive its ability to increase shareholder value. Bombardier Inc. (BBD) also appears cheap at current levels; however, we continue to think that it could languish at these levels until
Focus 2013 January 2013
213
there is increased evidence of improved execution at Bombardier Transportation (BT) and de-risking of the CSeries. Both these events are important to provide more confidence on the balance sheet, which is stretched at this time. ERJ does not have the same balance-sheet constraints, but in our view it also needs an improvement in the macroeconomic and order environment to see a recovery.
O U T P E R F O R M E R S
WestJet Airlines Ltd. (Sector Outperform; One-Year Target $25.00)
Revenue initiatives such as premium economy and tiered fare structure could result in $150 milion-$200 million increase in revenues. WJA plans to launch these initiatives by the end of Q1/13, so there is good runway for the company to benefit from this during the next 12 months, which should help the company outperform significantly on RASM growth in 2013. We believe that there is significant upside potential to consensus estimates if these initiatives are reasonably successful.
Regional business positions WJA very well to pick up more market share from Air Canada. We believe that this business could produce revenues of $1 billion over time. With seven planes in 2H/13, the impact will likely be more in 2014; however, WJA continues to point out that it expects this venture to be accretive from the start.
Balance sheet is pristine and valuation is reasonable. WJA is currently in a net cash position (excluding operating leases) and is generally one of the least-leveraged airlines in the world. Its margins and return on invested capital (ROIC) are also enviable at 21.5% and 12.7%, respectively. Despite these positives, its valuation is reasonable at 4.3x EV/2013E EBITDAR, which is at a discount to such comparable companies as Southwest Airlines Co. (LUV) and JetBlue Airways Corp. (JBLU).
The economy remains the only major risk factor. A recession would be a negative for all airline stocks and would likely result in negative share price movement. We don’t see that happening in 2013 and, even in that scenario, WJA should outperform AC, based on its lower cost structure, growth initiatives, and balance sheet.
CAE Inc. (Sector Outperform; One-Year Target $13.25)
U.S. agreement could be a catalyst. CAE shares have been hurt by negative sentiment on the defence side as a result of fiscal worries in many parts of the world, including the threat of sequestration in the United States. We believe that clarity over U.S. defence policy should help lift the cloud from various defence stocks, including CAE. The New Year agreement did not contain any spending initiatives, so this headwind could remain through Q1/13 as the United States irons out spending cuts.
Worries about civil business are overdone. CAE’s civil business continues to perform well and we expect margin expansion over the next few years as synergies from the Oxford Aviation Academy acquisition bear fruit. Furthermore, we think that investor concerns about the competitive environment are overdone. The pilot shortage is real and we expect this to be a great long-term positive driver for CAE.
FCF yield should be solid at 7.3% in F2014E. We believe that CAE will reduce its focus on acquisitive growth over the next few years, which should allow significant FCF to surface. In our view, the likelihood of value creation from this avenue remains high.

Focus 2013 January 2013
214
U N D E R P E R F O R M E R
Air Canada (Sector Underperform; One-Year Target $1.50)
Market share remains vulnerable because of WJA’s initiatives. In our opinion, AC is likely to lose market share to WJA in two of its most profitable segments – business and regional. Apart from losing market share, AC’s yields would also likely be negatively affected as WJA reduces pricing to grab share.
LCC initiative is unlikely to be material in 2013. AC is only inducting four planes into the Rouge fleet in 2013, so this is not likely to be a significant driver of profitability. Furthermore, the viability of this segment remains to be proven as various mainlines have been unsuccessful with such a strategy.
Costs are coming down, but profitability remains stagnant. AC has improved its cost structure and removed $530 million from its costs over the last approximately four years. However, its EBITDAR hasn’t improved because of competitive pressures, and we fear that this is unlikely to change in the near future.
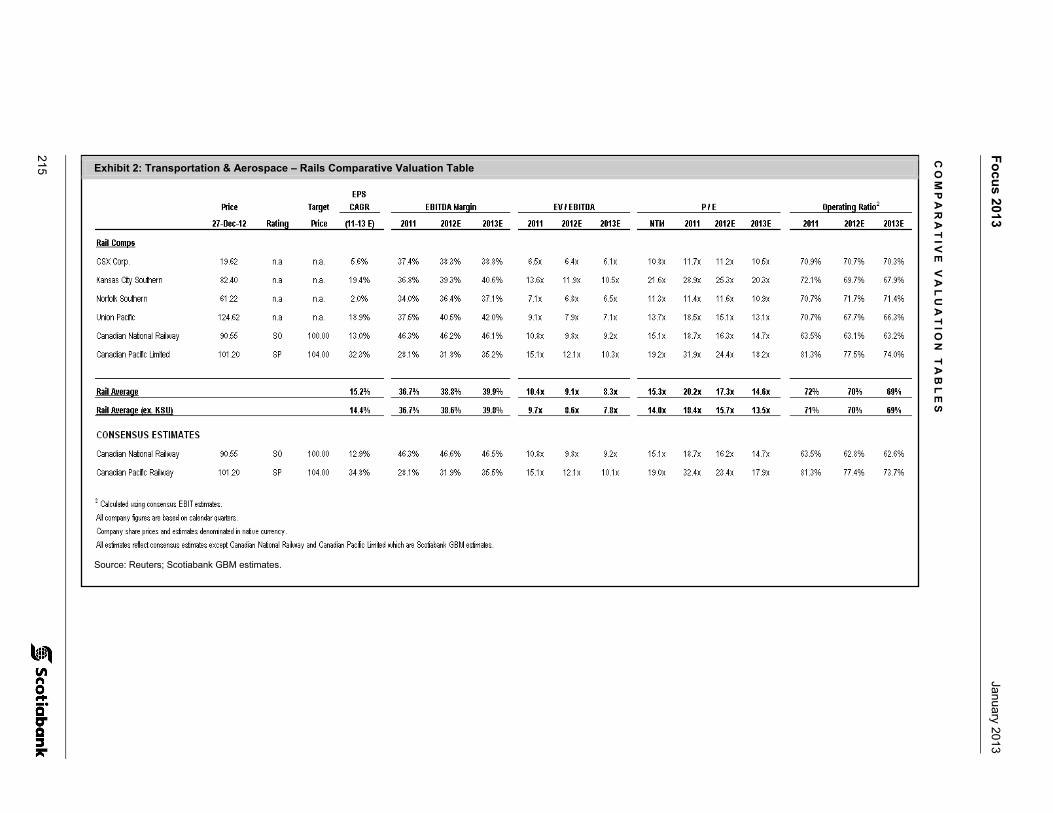
215
Fo
cus 2013
January 20
13
Exhibit 2: Transportation & Aerospace – Rails Comparative Valuation Table
Source: Reuters; Scotiabank GBM estimates.
CO
MP
AR
AT
IVE
VA
LU
AT
ION
TA
BL
ES
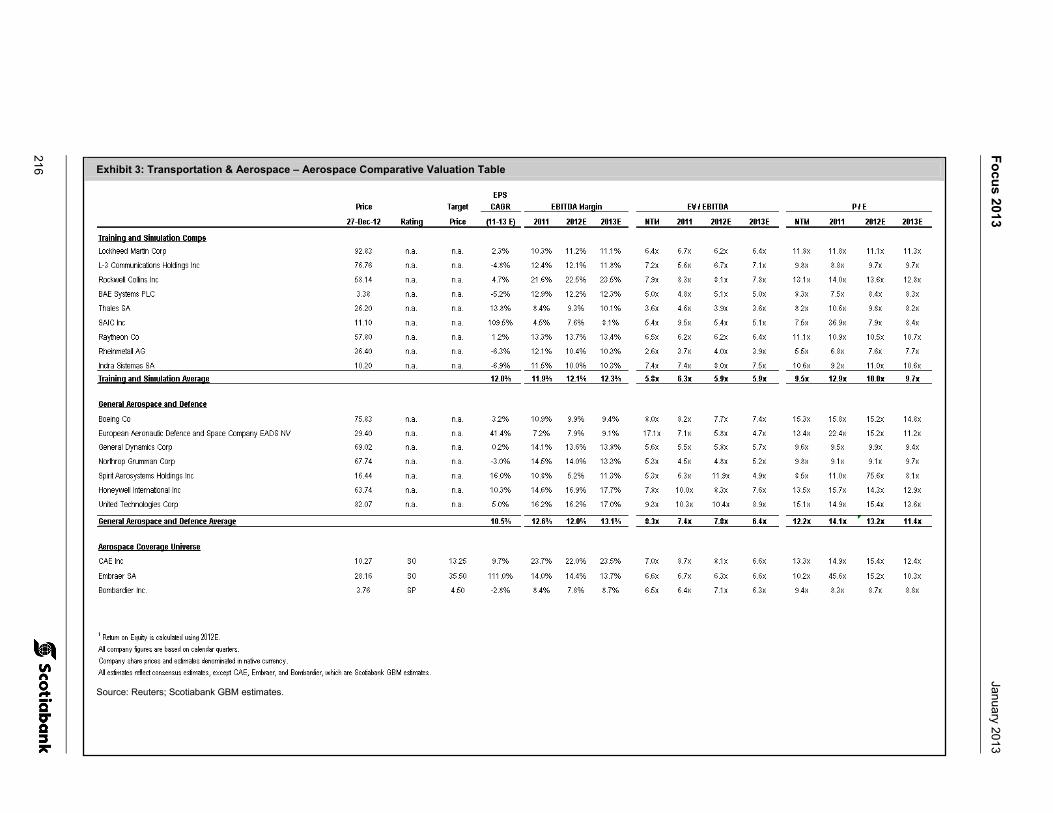
Fo
cus 2013
January 20
13
216 Exhibit 3: Transportation & Aerospace – Aerospace Comparative Valuation Table
Source: Reuters; Scotiabank GBM estimates.
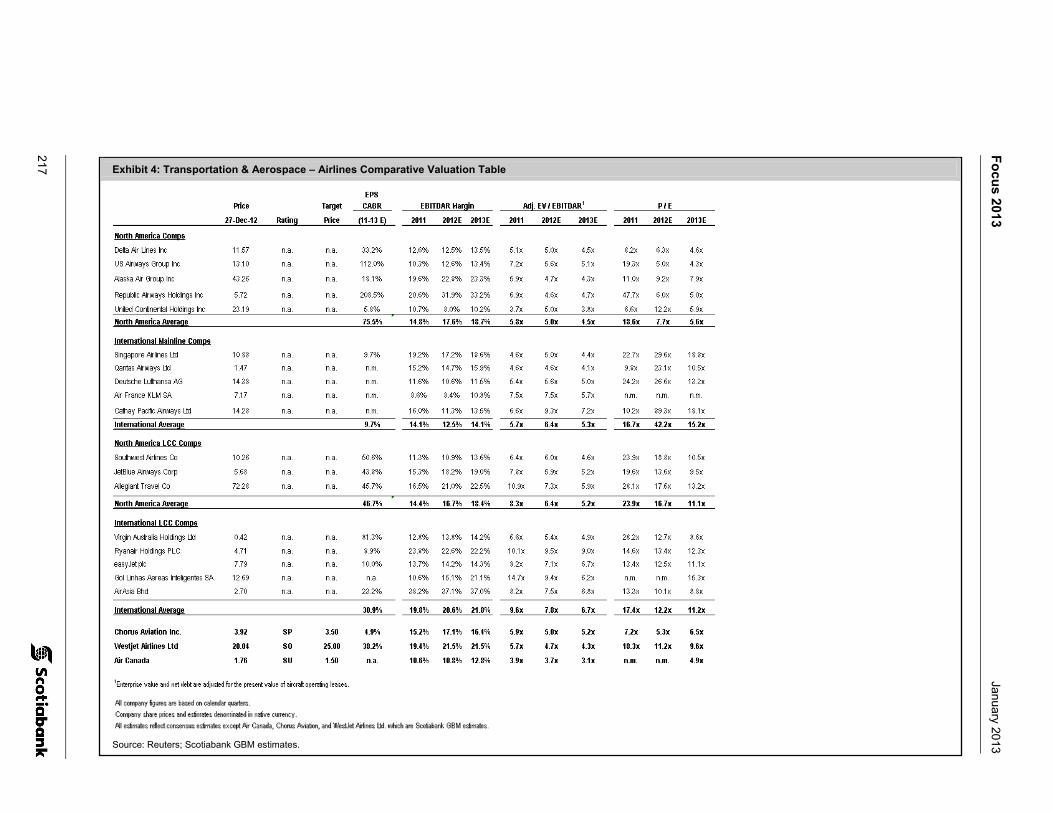
217
Fo
cus 2013
January 20
13
Exhibit 4: Transportation & Aerospace – Airlines Comparative Valuation Table
Source: Reuters; Scotiabank GBM estimates.
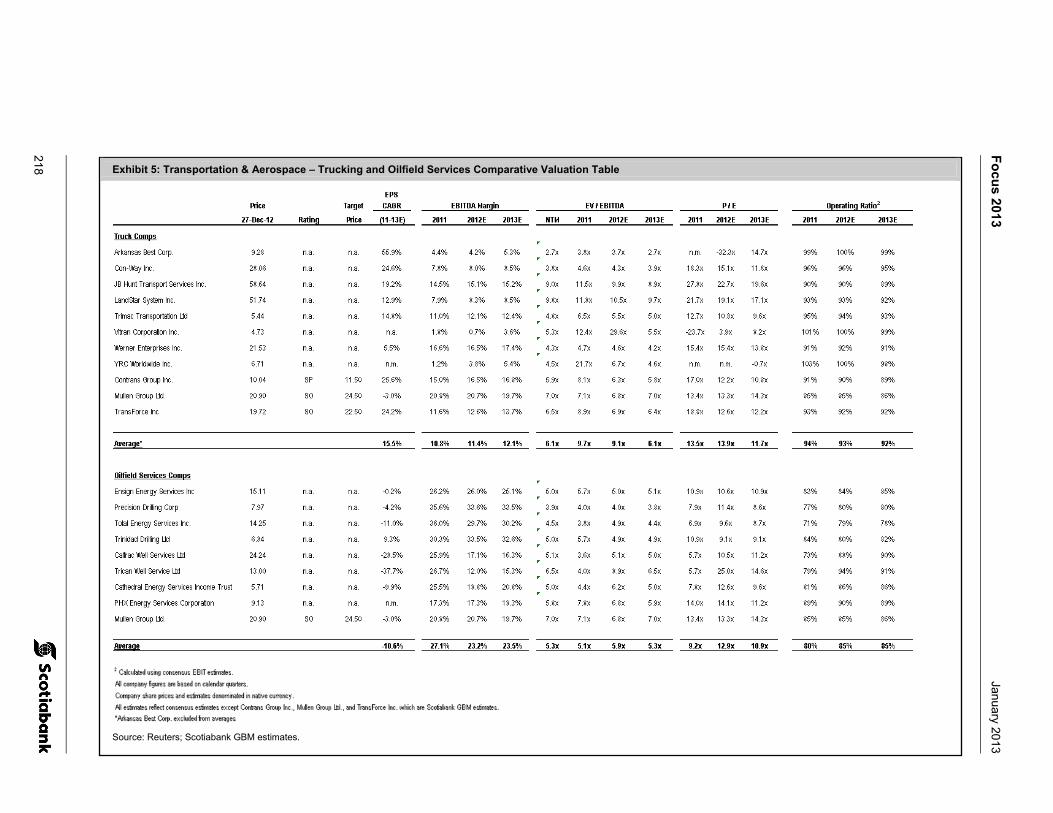
Fo
cus 2013
January 20
13
218 Exhibit 5: Transportation & Aerospace – Trucking and Oilfield Services Comparative Valuation Table
Source: Reuters; Scotiabank GBM estimates.

219
Notes
Focus 2013 January 2013
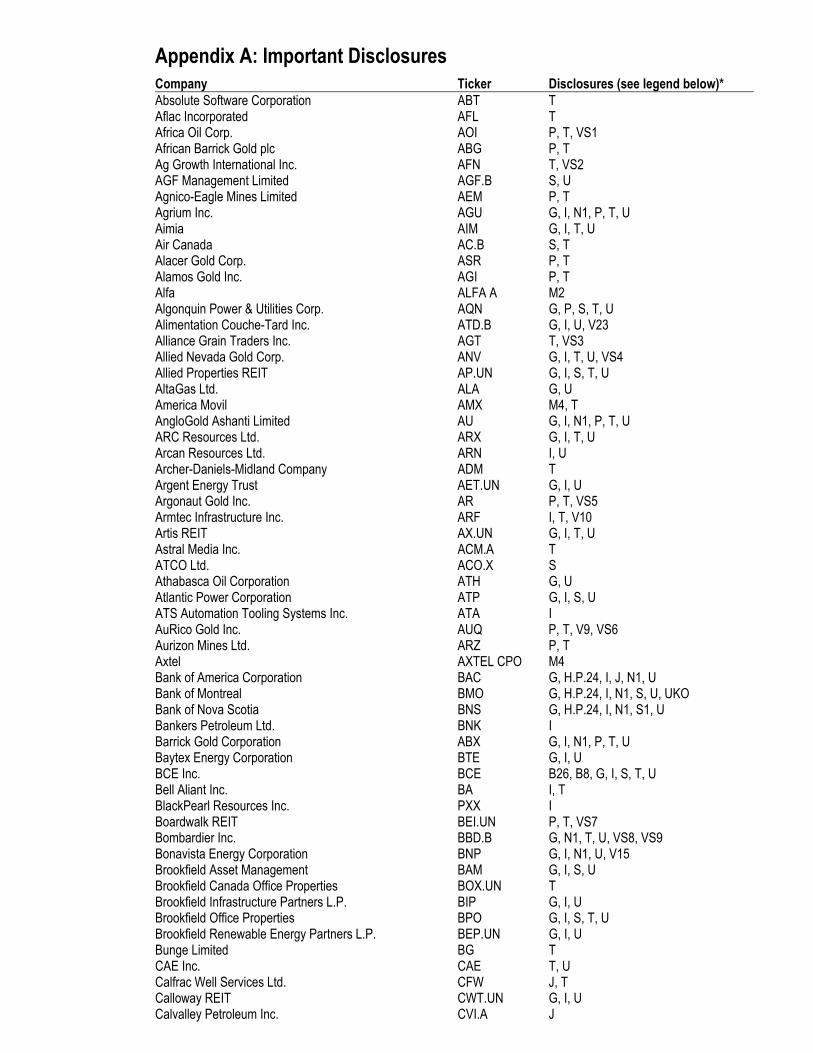
Appendix A: Important Disclosures Company Ticker Disclosures (see legend below)* Absolute Software Corporation ABT T Aflac Incorporated AFL T Africa Oil Corp. AOI P, T, VS1 African Barrick Gold plc ABG P, T Ag Growth International Inc. AFN T, VS2 AGF Management Limited AGF.B S, U Agnico-Eagle Mines Limited AEM P, T Agrium Inc. AGU G, I, N1, P, T, U Aimia AIM G, I, T, U Air Canada AC.B S, T Alacer Gold Corp. ASR P, T Alamos Gold Inc. AGI P, T Alfa ALFA A M2 Algonquin Power & Utilities Corp. AQN G, P, S, T, U Alimentation Couche-Tard Inc. ATD.B G, I, U, V23 Alliance Grain Traders Inc. AGT T, VS3 Allied Nevada Gold Corp. ANV G, I, T, U, VS4 Allied Properties REIT AP.UN G, I, S, T, U AltaGas Ltd. ALA G, U America Movil AMX M4, T AngloGold Ashanti Limited AU G, I, N1, P, T, U ARC Resources Ltd. ARX G, I, T, U Arcan Resources Ltd. ARN I, U Archer-Daniels-Midland Company ADM T Argent Energy Trust AET.UN G, I, U Argonaut Gold Inc. AR P, T, VS5 Armtec Infrastructure Inc. ARF I, T, V10 Artis REIT AX.UN G, I, T, U Astral Media Inc. ACM.A T ATCO Ltd. ACO.X S Athabasca Oil Corporation ATH G, U Atlantic Power Corporation ATP G, I, S, U ATS Automation Tooling Systems Inc. ATA I AuRico Gold Inc. AUQ P, T, V9, VS6 Aurizon Mines Ltd. ARZ P, T Axtel AXTEL CPO M4 Bank of America Corporation BAC G, H.P.24, I, J, N1, U Bank of Montreal BMO G, H.P.24, I, N1, S, U, UKO Bank of Nova Scotia BNS G, H.P.24, I, N1, S1, U Bankers Petroleum Ltd. BNK I Barrick Gold Corporation ABX G, I, N1, P, T, U Baytex Energy Corporation BTE G, I, U BCE Inc. BCE B26, B8, G, I, S, T, U Bell Aliant Inc. BA I, T BlackPearl Resources Inc. PXX I Boardwalk REIT BEI.UN P, T, VS7 Bombardier Inc. BBD.B G, N1, T, U, VS8, VS9 Bonavista Energy Corporation BNP G, I, N1, U, V15 Brookfield Asset Management BAM G, I, S, U Brookfield Canada Office Properties BOX.UN T Brookfield Infrastructure Partners L.P. BIP G, I, U Brookfield Office Properties BPO G, I, S, T, U Brookfield Renewable Energy Partners L.P. BEP.UN G, I, U Bunge Limited BG T CAE Inc. CAE T, U Calfrac Well Services Ltd. CFW J, T Calloway REIT CWT.UN G, I, U Calvalley Petroleum Inc. CVI.A J
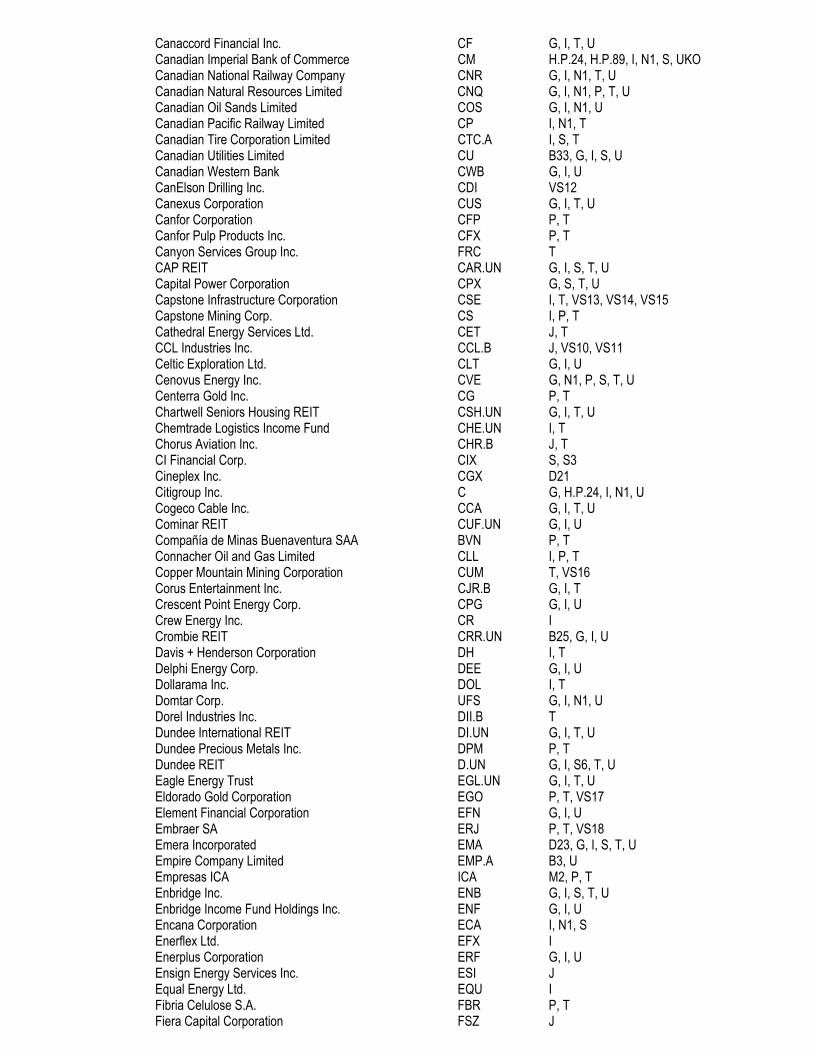
Canaccord Financial Inc. CF G, I, T, U Canadian Imperial Bank of Commerce CM H.P.24, H.P.89, I, N1, S, UKO Canadian National Railway Company CNR G, I, N1, T, U Canadian Natural Resources Limited CNQ G, I, N1, P, T, U Canadian Oil Sands Limited COS G, I, N1, U Canadian Pacific Railway Limited CP I, N1, T Canadian Tire Corporation Limited CTC.A I, S, T Canadian Utilities Limited CU B33, G, I, S, U Canadian Western Bank CWB G, I, U CanElson Drilling Inc. CDI VS12 Canexus Corporation CUS G, I, T, U Canfor Corporation CFP P, T Canfor Pulp Products Inc. CFX P, T Canyon Services Group Inc. FRC T CAP REIT CAR.UN G, I, S, T, U Capital Power Corporation CPX G, S, T, U Capstone Infrastructure Corporation CSE I, T, VS13, VS14, VS15 Capstone Mining Corp. CS I, P, T Cathedral Energy Services Ltd. CET J, T CCL Industries Inc. CCL.B J, VS10, VS11 Celtic Exploration Ltd. CLT G, I, U Cenovus Energy Inc. CVE G, N1, P, S, T, U Centerra Gold Inc. CG P, T Chartwell Seniors Housing REIT CSH.UN G, I, T, U Chemtrade Logistics Income Fund CHE.UN I, T Chorus Aviation Inc. CHR.B J, T CI Financial Corp. CIX S, S3 Cineplex Inc. CGX D21 Citigroup Inc. C G, H.P.24, I, N1, U Cogeco Cable Inc. CCA G, I, T, U Cominar REIT CUF.UN G, I, U Compañía de Minas Buenaventura SAA BVN P, T Connacher Oil and Gas Limited CLL I, P, T Copper Mountain Mining Corporation CUM T, VS16 Corus Entertainment Inc. CJR.B G, I, T Crescent Point Energy Corp. CPG G, I, U Crew Energy Inc. CR I Crombie REIT CRR.UN B25, G, I, U Davis + Henderson Corporation DH I, T Delphi Energy Corp. DEE G, I, U Dollarama Inc. DOL I, T Domtar Corp. UFS G, I, N1, U Dorel Industries Inc. DII.B T Dundee International REIT DI.UN G, I, T, U Dundee Precious Metals Inc. DPM P, T Dundee REIT D.UN G, I, S6, T, U Eagle Energy Trust EGL.UN G, I, T, U Eldorado Gold Corporation EGO P, T, VS17 Element Financial Corporation EFN G, I, U Embraer SA ERJ P, T, VS18 Emera Incorporated EMA D23, G, I, S, T, U Empire Company Limited EMP.A B3, U Empresas ICA ICA M2, P, T Enbridge Inc. ENB G, I, S, T, U Enbridge Income Fund Holdings Inc. ENF G, I, U Encana Corporation ECA I, N1, S Enerflex Ltd. EFX I Enerplus Corporation ERF G, I, U Ensign Energy Services Inc. ESI J Equal Energy Ltd. EQU I Fibria Celulose S.A. FBR P, T Fiera Capital Corporation FSZ J
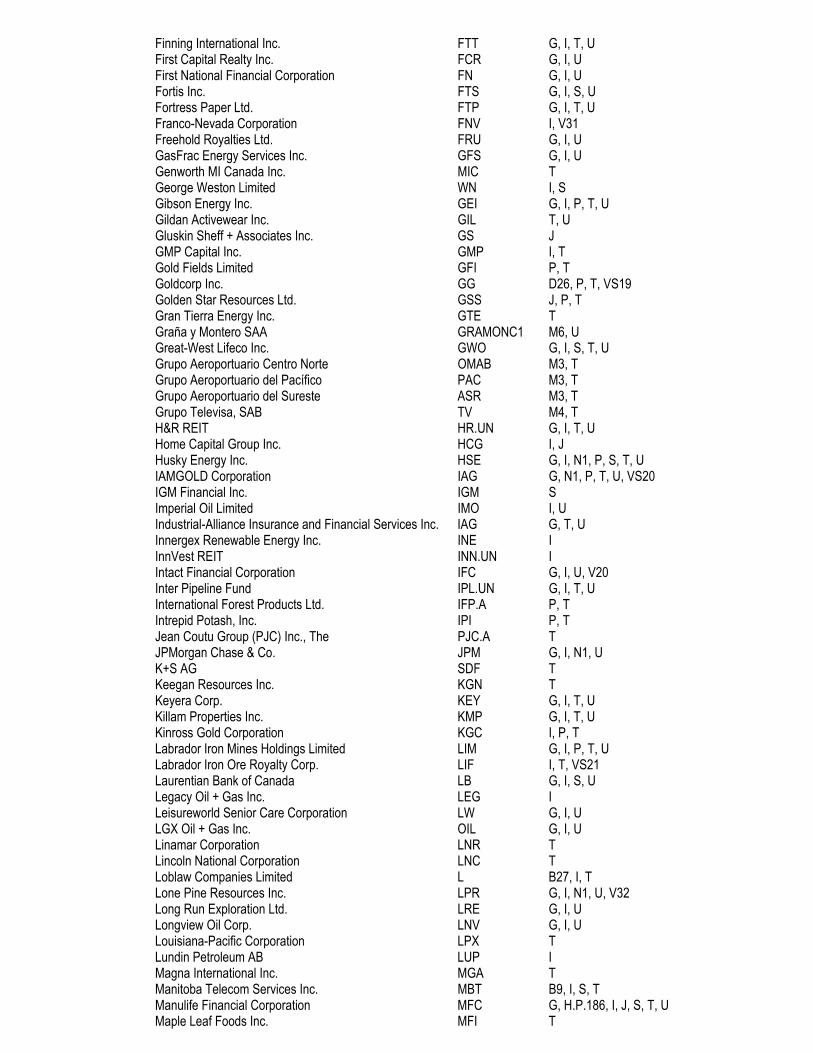
Finning International Inc. FTT G, I, T, U First Capital Realty Inc. FCR G, I, U First National Financial Corporation FN G, I, U Fortis Inc. FTS G, I, S, U Fortress Paper Ltd. FTP G, I, T, U Franco-Nevada Corporation FNV I, V31 Freehold Royalties Ltd. FRU G, I, U GasFrac Energy Services Inc. GFS G, I, U Genworth MI Canada Inc. MIC T George Weston Limited WN I, S Gibson Energy Inc. GEI G, I, P, T, U Gildan Activewear Inc. GIL T, U Gluskin Sheff + Associates Inc. GS J GMP Capital Inc. GMP I, T Gold Fields Limited GFI P, T Goldcorp Inc. GG D26, P, T, VS19 Golden Star Resources Ltd. GSS J, P, T Gran Tierra Energy Inc. GTE T Graña y Montero SAA GRAMONC1 M6, U Great-West Lifeco Inc. GWO G, I, S, T, U Grupo Aeroportuario Centro Norte OMAB M3, T Grupo Aeroportuario del Pacífico PAC M3, T Grupo Aeroportuario del Sureste ASR M3, T Grupo Televisa, SAB TV M4, T H&R REIT HR.UN G, I, T, U Home Capital Group Inc. HCG I, J Husky Energy Inc. HSE G, I, N1, P, S, T, U IAMGOLD Corporation IAG G, N1, P, T, U, VS20 IGM Financial Inc. IGM S Imperial Oil Limited IMO I, U Industrial-Alliance Insurance and Financial Services Inc. IAG G, T, U Innergex Renewable Energy Inc. INE I InnVest REIT INN.UN I Intact Financial Corporation IFC G, I, U, V20 Inter Pipeline Fund IPL.UN G, I, T, U International Forest Products Ltd. IFP.A P, T Intrepid Potash, Inc. IPI P, T Jean Coutu Group (PJC) Inc., The PJC.A T JPMorgan Chase & Co. JPM G, I, N1, U K+S AG SDF T Keegan Resources Inc. KGN T Keyera Corp. KEY G, I, T, U Killam Properties Inc. KMP G, I, T, U Kinross Gold Corporation KGC I, P, T Labrador Iron Mines Holdings Limited LIM G, I, P, T, U Labrador Iron Ore Royalty Corp. LIF I, T, VS21 Laurentian Bank of Canada LB G, I, S, U Legacy Oil + Gas Inc. LEG I Leisureworld Senior Care Corporation LW G, I, U LGX Oil + Gas Inc. OIL G, I, U Linamar Corporation LNR T Lincoln National Corporation LNC T Loblaw Companies Limited L B27, I, T Lone Pine Resources Inc. LPR G, I, N1, U, V32 Long Run Exploration Ltd. LRE G, I, U Longview Oil Corp. LNV G, I, U Louisiana-Pacific Corporation LPX T Lundin Petroleum AB LUP I Magna International Inc. MGA T Manitoba Telecom Services Inc. MBT B9, I, S, T Manulife Financial Corporation MFC G, H.P.186, I, J, S, T, U Maple Leaf Foods Inc. MFI T
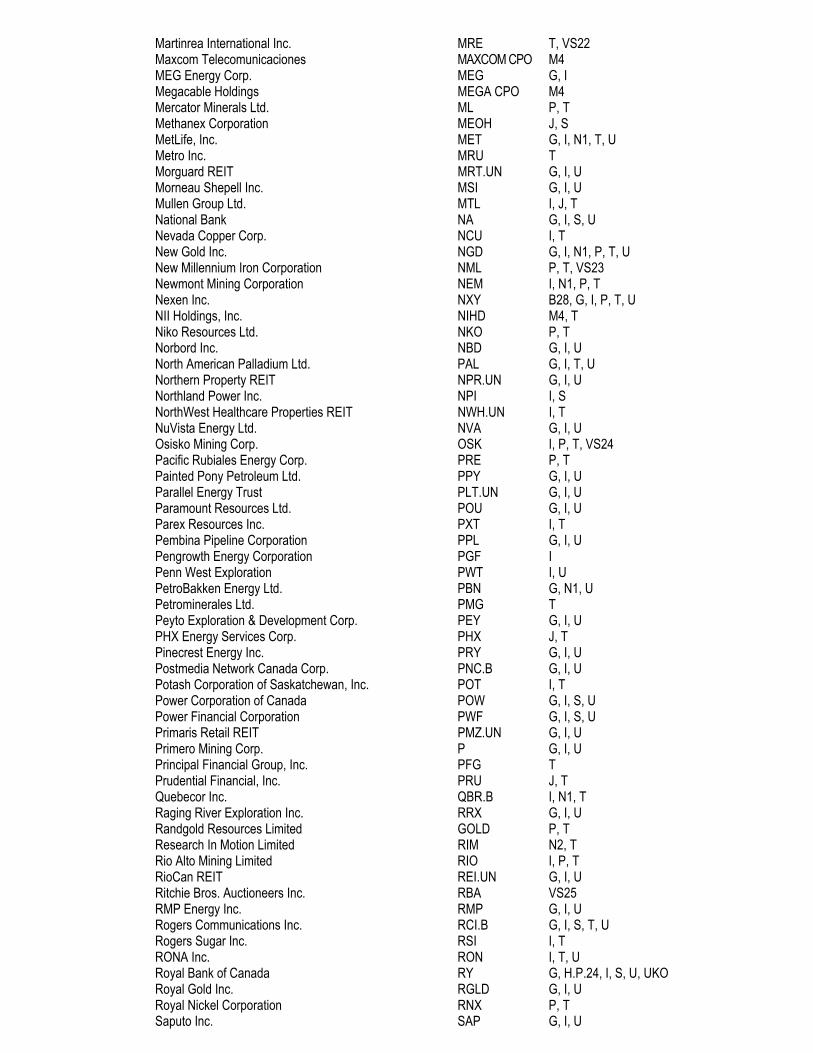
Martinrea International Inc. MRE T, VS22 Maxcom Telecomunicaciones MAXCOM CPO M4 MEG Energy Corp. MEG G, I Megacable Holdings MEGA CPO M4 Mercator Minerals Ltd. ML P, T Methanex Corporation MEOH J, S MetLife, Inc. MET G, I, N1, T, U Metro Inc. MRU T Morguard REIT MRT.UN G, I, U Morneau Shepell Inc. MSI G, I, U Mullen Group Ltd. MTL I, J, T National Bank NA G, I, S, U Nevada Copper Corp. NCU I, T New Gold Inc. NGD G, I, N1, P, T, U New Millennium Iron Corporation NML P, T, VS23 Newmont Mining Corporation NEM I, N1, P, T Nexen Inc. NXY B28, G, I, P, T, U NII Holdings, Inc. NIHD M4, T Niko Resources Ltd. NKO P, T Norbord Inc. NBD G, I, U North American Palladium Ltd. PAL G, I, T, U Northern Property REIT NPR.UN G, I, U Northland Power Inc. NPI I, S NorthWest Healthcare Properties REIT NWH.UN I, T NuVista Energy Ltd. NVA G, I, U Osisko Mining Corp. OSK I, P, T, VS24 Pacific Rubiales Energy Corp. PRE P, T Painted Pony Petroleum Ltd. PPY G, I, U Parallel Energy Trust PLT.UN G, I, U Paramount Resources Ltd. POU G, I, U Parex Resources Inc. PXT I, T Pembina Pipeline Corporation PPL G, I, U Pengrowth Energy Corporation PGF I Penn West Exploration PWT I, U PetroBakken Energy Ltd. PBN G, N1, U Petrominerales Ltd. PMG T Peyto Exploration & Development Corp. PEY G, I, U PHX Energy Services Corp. PHX J, T Pinecrest Energy Inc. PRY G, I, U Postmedia Network Canada Corp. PNC.B G, I, U Potash Corporation of Saskatchewan, Inc. POT I, T Power Corporation of Canada POW G, I, S, U Power Financial Corporation PWF G, I, S, U Primaris Retail REIT PMZ.UN G, I, U Primero Mining Corp. P G, I, U Principal Financial Group, Inc. PFG T Prudential Financial, Inc. PRU J, T Quebecor Inc. QBR.B I, N1, T Raging River Exploration Inc. RRX G, I, U Randgold Resources Limited GOLD P, T Research In Motion Limited RIM N2, T Rio Alto Mining Limited RIO I, P, T RioCan REIT REI.UN G, I, U Ritchie Bros. Auctioneers Inc. RBA VS25 RMP Energy Inc. RMP G, I, U Rogers Communications Inc. RCI.B G, I, S, T, U Rogers Sugar Inc. RSI I, T RONA Inc. RON I, T, U Royal Bank of Canada RY G, H.P.24, I, S, U, UKO Royal Gold Inc. RGLD G, I, U Royal Nickel Corporation RNX P, T Saputo Inc. SAP G, I, U
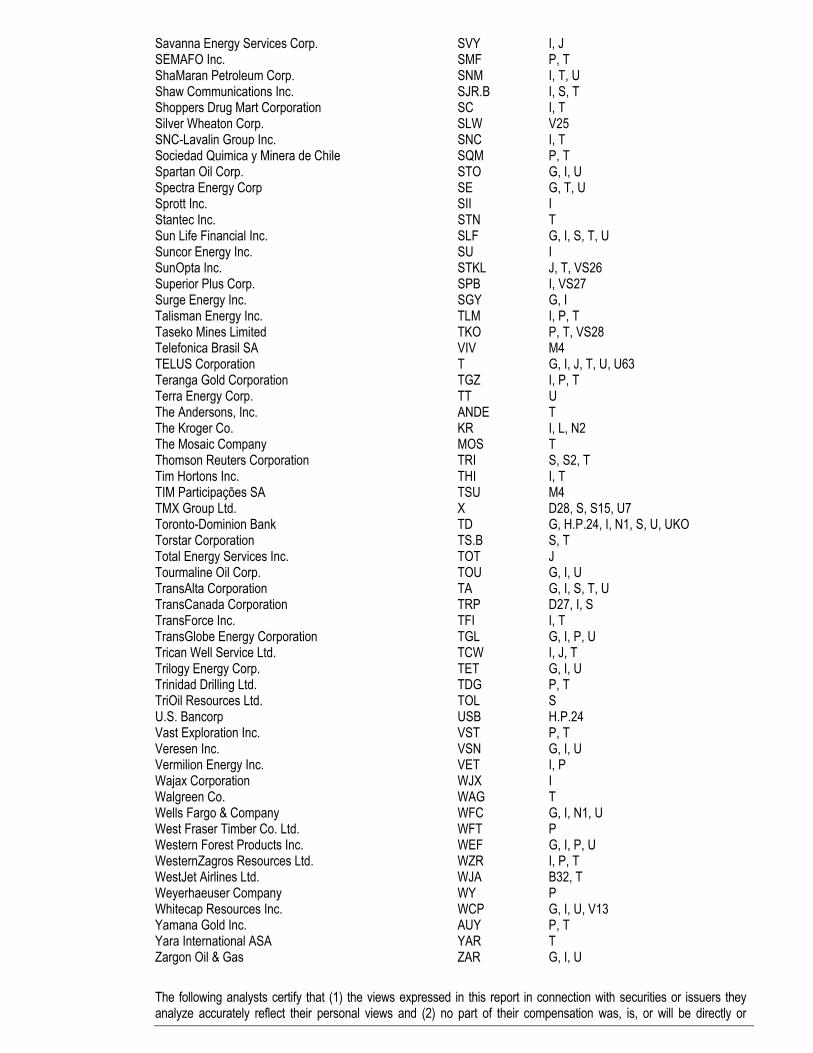
Savanna Energy Services Corp. SVY I, J SEMAFO Inc. SMF P, T ShaMaran Petroleum Corp. SNM I, T, U Shaw Communications Inc. SJR.B I, S, T Shoppers Drug Mart Corporation SC I, T Silver Wheaton Corp. SLW V25 SNC-Lavalin Group Inc. SNC I, T Sociedad Quimica y Minera de Chile SQM P, T Spartan Oil Corp. STO G, I, U Spectra Energy Corp SE G, T, U Sprott Inc. SII I Stantec Inc. STN T Sun Life Financial Inc. SLF G, I, S, T, U Suncor Energy Inc. SU I SunOpta Inc. STKL J, T, VS26 Superior Plus Corp. SPB I, VS27 Surge Energy Inc. SGY G, I Talisman Energy Inc. TLM I, P, T Taseko Mines Limited TKO P, T, VS28 Telefonica Brasil SA VIV M4 TELUS Corporation T G, I, J, T, U, U63 Teranga Gold Corporation TGZ I, P, T Terra Energy Corp. TT U The Andersons, Inc. ANDE T The Kroger Co. KR I, L, N2 The Mosaic Company MOS T Thomson Reuters Corporation TRI S, S2, T Tim Hortons Inc. THI I, T TIM Participações SA TSU M4 TMX Group Ltd. X D28, S, S15, U7 Toronto-Dominion Bank TD G, H.P.24, I, N1, S, U, UKO Torstar Corporation TS.B S, T Total Energy Services Inc. TOT J Tourmaline Oil Corp. TOU G, I, U TransAlta Corporation TA G, I, S, T, U TransCanada Corporation TRP D27, I, S TransForce Inc. TFI I, T TransGlobe Energy Corporation TGL G, I, P, U Trican Well Service Ltd. TCW I, J, T Trilogy Energy Corp. TET G, I, U Trinidad Drilling Ltd. TDG P, T TriOil Resources Ltd. TOL S U.S. Bancorp USB H.P.24 Vast Exploration Inc. VST P, T Veresen Inc. VSN G, I, U Vermilion Energy Inc. VET I, P Wajax Corporation WJX I Walgreen Co. WAG T Wells Fargo & Company WFC G, I, N1, U West Fraser Timber Co. Ltd. WFT P Western Forest Products Inc. WEF G, I, P, U WesternZagros Resources Ltd. WZR I, P, T WestJet Airlines Ltd. WJA B32, T Weyerhaeuser Company WY P Whitecap Resources Inc. WCP G, I, U, V13 Yamana Gold Inc. AUY P, T Yara International ASA YAR T Zargon Oil & Gas ZAR G, I, U The following analysts certify that (1) the views expressed in this report in connection with securities or issuers they analyze accurately reflect their personal views and (2) no part of their compensation was, is, or will be directly or

indirectly, related to the specific recommendations or views expressed by them in this report: Hugo Ste-Marie, Vincent Delisle, Phil Hardie, Patrick Bryden, Jeff Fan, Matthew Akman, Mark Neville, Paul Steep, William Lee, Joanne Smith, Gavin Wylie, Tanya Jakusconek, Christine Healy, Ben Isaacson, Anthony Zicha, Turan Quettawala, Leily Omoumi, Trevor Turnbull, Mark Turner, Marcos Durán y Casahonda, Patricia Baker, Mario Saric, Andres Coello, Ovais Habib, Mark Polak, Kevin Choquette, Jason Bouvier, Benoit Laprade, Vladislav Vlad, Pammi Bir, Neil Forster, Paul Figueroa Mantero, Rodrigo Echagaray, and Gus Papageorgiou This research report was prepared by employees of Scotia Capital Inc. and/or its affiliates who have the title of Analyst. All pricing of securities in reports is based on the closing price of the securities’ principal marketplace on the night before the publication date, unless otherwise explicitly stated. All Equity Research Analysts report to the Head of Equity Research. The Head of Equity Research reports to the Managing Director, Head of Institutional Equity Sales, Trading and Research, who is not and does not report to the Head of the Investment Banking Department. Scotiabank, Global Banking and Markets has policies that are reasonably designed to prevent or control the sharing of material non-public information across internal information barriers, such as between Investment Banking and Research. The compensation of the research analyst who prepared this report is based on several factors, including but not limited to, the overall profitability of Scotiabank, Global Banking and Markets and the revenues generated from its various departments, including investment banking. Furthermore, the research analyst's compensation is charged as an expense to various Scotiabank, Global Banking and Markets departments, including investment banking. Research Analysts may not receive compensation from the companies they cover. Non-U.S. analysts may not be associated persons of Scotia Capital (USA) Inc. and therefore may not be subject to NASD Rule 2711 restrictions on communications with subject company, public appearances and trading securities held by the analysts. This report includes articles prepared by Scotiabank Economics as a resource for the clients of Scotiabank. For Scotiabank, Global Banking and Markets Research analyst standards and disclosure policies, please visit http://www.gbm.scotiabank.com/disclosures Scotiabank, Global Banking and Markets Research, 40 King Street West, 33rd Floor, Toronto, Ontario, M5H 1H1. * Legend B25 Paul D. Sobey is a director of Crombie REIT and is a director of The Bank of Nova Scotia. B26 Thomas C. O'Neill is a director of BCE Inc. and is a director of The Bank of Nova Scotia. B27 Thomas C. O'Neill is a director of Loblaw Companies Limited and is a director of The Bank of Nova
Scotia. B28 Thomas C. O'Neill is a director of Nexen Inc. and is a director of The Bank of Nova Scotia. B3 Paul D. Sobey is an officer of Empire Company Limited and is a director of The Bank of Nova Scotia. B32 Ronald Brenneman is a director of WestJet Airlines Ltd. and is a director of The Bank of Nova Scotia. B33 David A. Dodge is a director of Canadian Utilities Limited and is a director of The Bank of Nova Scotia. B8 Ronald Brenneman is a director of BCE Inc and is a director of The Bank of Nova Scotia. B9 N. Ashleigh Everett is a director of Manitoba Telecom Services Inc. and is a director of The Bank of
Nova Scotia. D21 Sarabjit Marwah, Vice-Chairman and Chief Operating Officer of The Bank of Nova Scotia, is on the
Board of Trustees of Cineplex Inc. D23 Sylvia Chrominska, Group Head of Global Human Resources and Communications for The Bank of
Nova Scotia, is on the Board of Directors of Emera Inc. D26 Tanya Jakusconek is a Director of Equity Research for Scotiabank, Global Banking and Markets and is
a member of the board of directors for Tahoe Resources Inc. Goldcorp Inc. is a significant shareholder of Tahoe Resources Inc.
D27 Rick Waugh, Chief Executive Officer for The Bank of Nova Scotia, is a member of the Board of Directors of TransCanada Corporation.
D28 Jeffrey Heath, Executive Vice President & Group Treasurer of The Bank of Nova Scotia, is a member of the Board of Directors of TMX Group Limited.
G Scotia Capital (USA) Inc. or its affiliates has managed or co-managed a public offering in the past 12 months.
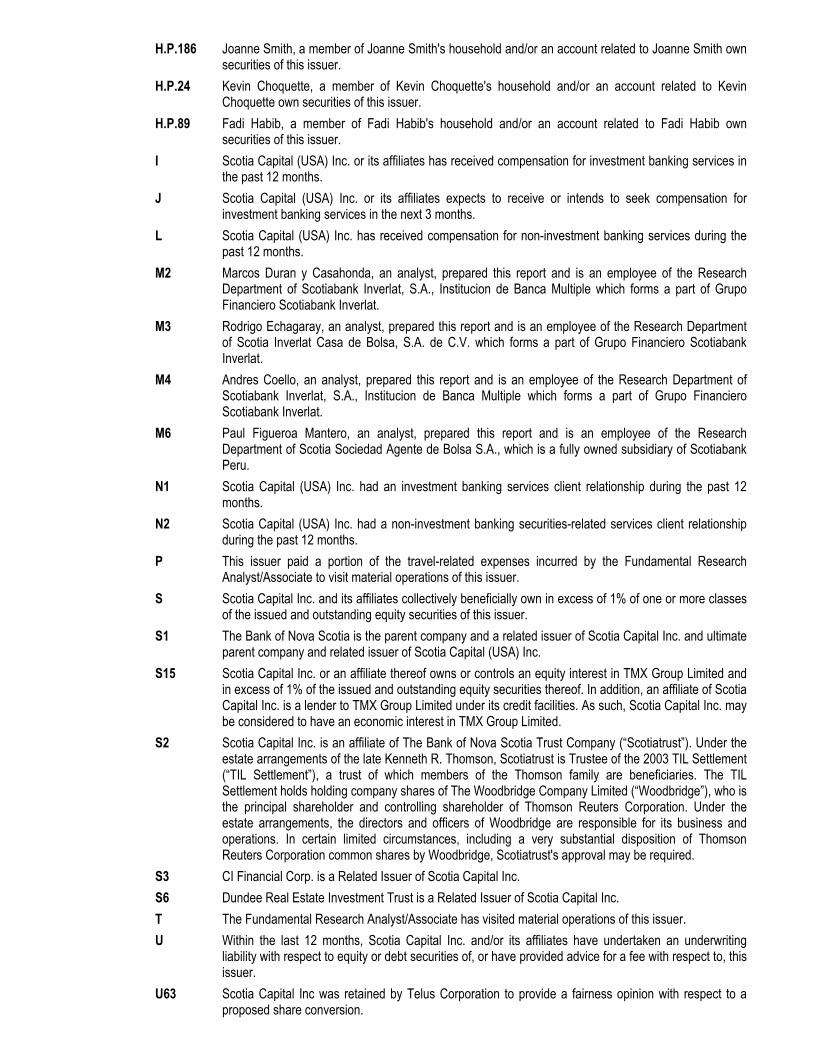
H.P.186 Joanne Smith, a member of Joanne Smith's household and/or an account related to Joanne Smith own securities of this issuer.
H.P.24 Kevin Choquette, a member of Kevin Choquette's household and/or an account related to Kevin Choquette own securities of this issuer.
H.P.89 Fadi Habib, a member of Fadi Habib's household and/or an account related to Fadi Habib own securities of this issuer.
I Scotia Capital (USA) Inc. or its affiliates has received compensation for investment banking services in the past 12 months.
J Scotia Capital (USA) Inc. or its affiliates expects to receive or intends to seek compensation for investment banking services in the next 3 months.
L Scotia Capital (USA) Inc. has received compensation for non-investment banking services during the past 12 months.
M2 Marcos Duran y Casahonda, an analyst, prepared this report and is an employee of the Research Department of Scotiabank Inverlat, S.A., Institucion de Banca Multiple which forms a part of Grupo Financiero Scotiabank Inverlat.
M3 Rodrigo Echagaray, an analyst, prepared this report and is an employee of the Research Department of Scotia Inverlat Casa de Bolsa, S.A. de C.V. which forms a part of Grupo Financiero Scotiabank Inverlat.
M4 Andres Coello, an analyst, prepared this report and is an employee of the Research Department of Scotiabank Inverlat, S.A., Institucion de Banca Multiple which forms a part of Grupo Financiero Scotiabank Inverlat.
M6 Paul Figueroa Mantero, an analyst, prepared this report and is an employee of the Research Department of Scotia Sociedad Agente de Bolsa S.A., which is a fully owned subsidiary of Scotiabank Peru.
N1 Scotia Capital (USA) Inc. had an investment banking services client relationship during the past 12 months.
N2 Scotia Capital (USA) Inc. had a non-investment banking securities-related services client relationship during the past 12 months.
P This issuer paid a portion of the travel-related expenses incurred by the Fundamental Research Analyst/Associate to visit material operations of this issuer.
S Scotia Capital Inc. and its affiliates collectively beneficially own in excess of 1% of one or more classes of the issued and outstanding equity securities of this issuer.
S1 The Bank of Nova Scotia is the parent company and a related issuer of Scotia Capital Inc. and ultimate parent company and related issuer of Scotia Capital (USA) Inc.
S15 Scotia Capital Inc. or an affiliate thereof owns or controls an equity interest in TMX Group Limited and in excess of 1% of the issued and outstanding equity securities thereof. In addition, an affiliate of Scotia Capital Inc. is a lender to TMX Group Limited under its credit facilities. As such, Scotia Capital Inc. may be considered to have an economic interest in TMX Group Limited.
S2 Scotia Capital Inc. is an affiliate of The Bank of Nova Scotia Trust Company (“Scotiatrust”). Under the estate arrangements of the late Kenneth R. Thomson, Scotiatrust is Trustee of the 2003 TIL Settlement (“TIL Settlement”), a trust of which members of the Thomson family are beneficiaries. The TIL Settlement holds holding company shares of The Woodbridge Company Limited (“Woodbridge”), who is the principal shareholder and controlling shareholder of Thomson Reuters Corporation. Under the estate arrangements, the directors and officers of Woodbridge are responsible for its business and operations. In certain limited circumstances, including a very substantial disposition of Thomson Reuters Corporation common shares by Woodbridge, Scotiatrust's approval may be required.
S3 CI Financial Corp. is a Related Issuer of Scotia Capital Inc. S6 Dundee Real Estate Investment Trust is a Related Issuer of Scotia Capital Inc. T The Fundamental Research Analyst/Associate has visited material operations of this issuer. U Within the last 12 months, Scotia Capital Inc. and/or its affiliates have undertaken an underwriting
liability with respect to equity or debt securities of, or have provided advice for a fee with respect to, this issuer.
U63 Scotia Capital Inc was retained by Telus Corporation to provide a fairness opinion with respect to a proposed share conversion.

U7 Scotia Capital Inc. has a direct and indirect ownership interest in excess of 9% in Alpha ATS. SCI's Co-Head of Institutional Equity Sales and Trading serves on the Board of Directors of Alpha Inc. and Alpha ATS.
UKO This issuer owns 5% or more of the total issued share capital of The Bank of Nova Scotia. V10 Two putative class action lawsuits have been filed, the first in June 2011 with the Ontario Superior
Court of Justice at Windsor, Ontario, Canada, and the second in July 2011 with the Ontario Superior Court of Justice at London, Ontario, Canada, against Armtec Infrastructure Inc. ('Armtec') and others by purported purchasers of Armtec common shares pursuant to an April 2011 public offering. The lawsuits are still pending. Certain underwriters, including Scotia Capital Inc., are among those named as defendants in the lawsuits.
V13 Scotia Capital Inc. participated in a bought deal with Whitecap Resources Inc. The proceeds from the bought deal were related to a proposed acquisition by Whitecap Resources Inc. of Midway Energy Ltd.
V15 Scotia Waterous has been retained by Bonavista Energy Corporation as financial advisor on the sale of certain oil and gas assets in Alberta and British Columbia. Scotia Waterous is a wholly-owned subsidiary of The Bank of Nova Scotia.
V20 Scotia Capital Inc. participated in a bought deal with Intact Financial Corporation. The proceeds from the bought deal were related to a proposed acquisition by Intact Financial Corporation of JEVCO Insurance Company, which is related to The Westaim Corporation.
V23 Alimentation Couche-Tard Inc engaged Scotiabank as a financial advisor in the acquisition of Statoil Fuel & Retail ASA.
V25 Scotiabank acted as a financial advisor for HudBay Minerals Inc. in a precious metals stream transaction with Silver Wheaton Corp.
V31 Scotia Waterous acted as an advisor to Franco-Nevada Corporation on the acquisition of certain non-material assets. Scotia Waterous is a wholly-owned subsidiary of The Bank of Nova Scotia.
V32 Lone Pine Resources Inc. retained Scotia Waterous as financial advisor on the sale of certain assets. Scotia Waterous is a wholly owned subsidiary of The Bank of Nova Scotia.
V9 AuRico Gold Inc. changed its corporate name from Gammon Gold Inc. (Gammon) to AuRico Gold Inc. in June 2011. A class action lawsuit was commenced in February 2008 in Ontario, Canada, against Gammon and others by a purchaser of Gammon common shares pursuant to an April 2007 public offering. The lawsuit is still pending. Members of the underwriting syndicate, which includes Scotia Capital Inc., are among those named as defendants in the lawsuit.
VS1 Our Research Analyst visited Block 10BB in Kenya, an exploration well, on October 2-4, 2012. Partial payment was received from the issuer for the travel-related expenses incurred by the Research Analyst to visit this site.
VS10 Our Research Analyst visited CCL Label, a manufacturing facility, on October 30, 2012. No payment was received from the issuer for the travel-related expenses incurred by the Research Analyst to visit this site.
VS11 Our Research Associate visited CCL Label, a manufacturing facility, on October 30, 2012. No payment was received from the issuer for the travel-related expenses incurred by the Research Associate to visit this site.
VS12 Our Research Associate visited the Nisku Facility, a rig construction facility, on August 28, 2012. Full payment was received from the issuer for the travel-related expenses incurred by the Research Associate to visit this site.
VS13 Our Research Associate visited Cardinal Power, an operating power plant, on November 29, 2012. No payment was received from the issuer for the travel-related expenses incurred by the Research Associate to visit this site.
VS14 Our Research Associate visited Cardinal Power, an operating power plant, on November 29, 2012. No payment was received from the issuer for the travel-related expenses incurred by the Research Associate to visit this site.
VS15 Our Research Analyst visited Cardinal Power, an operating power plant, on November 29, 2012. No payment was received from the issuer for the travel-related expenses incurred by the Research Analyst to visit this site.
VS16 Our Research Analyst visited the Copper Mountain project, a 75%-owned operating mine, on November 30, 2012. No payment was received from the issuer for the travel-related expenses incurred by the Research Analyst to visit this site.

VS17 Our Research Analyst visited Efemcukuru, Kisladag, Perama Hill, Olympias, Skouries, Piavitsa, and Stratoni, operating mines and projects under development, on October 1-5, 2012. Partial payment was received from the issuer for the travel-related expenses incurred by the Research Analyst to visit this site.
VS18 Our Research Analyst visited the Melbourne Business Facility, a business jet plant and customer facility, on October 2, 2012. Partial payment was received from the issuer for the travel-related expenses incurred by the Research Analyst to visit this site.
VS19 Our Research Associate visited the Red Lake mine, an operating mine, on September 5, 2012. Full payment was received from the issuer for the travel-related expenses incurred by the Research Associate to visit this site.
VS2 Our Research Analyst visited the Edwards and Twister facilities, two manufacturing plants, on October 29, 2012. No payment was received from the issuer for the travel-related expenses incurred by the Research Analyst to visit this site.
VS20 Our Research Analyst visited Cote Gold, a development project, on October 22, 2012. Full payment was received from the issuer for the travel-related expenses incurred by the Research Analyst to visit this site.
VS21 Our Research Analyst visited the Carol Lake operations, a mine processing plant and rail operations, on September 14, 2012. Full payment was received from the issuer for the travel-related expenses incurred by the Research Analyst to visit this site.
VS22 Our Research Analyst visited Shelbyville, Kentucky facility, an auto parts plant, on December 7, 2012. Partial payment was received from the issuer for the travel-related expenses incurred by the Research Analyst to visit this site.
VS23 Our Research Analyst visited the Schefferville projects, development & exploration projects, on July 23, 2012. Full payment was received from the issuer for the travel-related expenses incurred by the Research Analyst to visit this site.
VS24 Our Research Analyst visited Canadian Malartic, an operating gold mine, on November 30, 2012. Full payment was received from the issuer for the travel-related expenses incurred by the Research Analyst to visit this site.
VS25 Our Research Analyst visited the Montreal Auction Site on December 5, 2012. No payment was received from the issuer for the travel-related expenses incurred by the Research Analyst to visit this site.
VS26 Our Research Analyst visited the Hope, Oat Fiber, SunOpta Aseptic, Ingredients, and Dahlgren Sunflower facilities, which are handling and processing facilities, on September 25, 2012. No payment was received from the issuer for the travel-related expenses incurred by the Research Analyst to visit this site.
VS27 Our Research Analyst visited Port Edwards chemical plant, and Twin Oaks and Marcus Hall terminals, chemical plant and heating oil terminals, on September 10-12. Partial payment was received from the issuer for the travel-related expenses incurred by the Research Analyst to visit this site.
VS28 Our Research Analyst visited the Gibraltar mine, a 75%-owned operating mine, on November 29, 2012. No payment was received from the issuer for the travel-related expenses incurred by the Research Analyst to visit this site.
VS3 Our Research Analyst visited the Arbel rice, pasta, bulgur, and pulse processing facilities in Turkey, on November 27 and 28, 2012. No payment was received from the issuer for the travel-related expenses incurred by the Research Analyst to visit this site.
VS4 Our Research Analyst visited the Hycroft mine, an operating gold and silver mine, on November 13, 2012. No payment was received from the issuer for the travel-related expenses incurred by the Research Analyst to visit this site.
VS5 Our Research Analyst visited La Colorada and El Castillo, both operating mines, on Oct. 21-Oct. 25. Partial payment was received from the issuer for the travel-related expenses incurred by the Research Analyst to visit this site.
VS6 Our Research Associate visited Young-Davidson mine, an operating mine, on December 10, 2012. Full payment was received from the issuer for the travel-related expenses incurred by the Research Associate to visit this site.
VS7 Our Research Analyst visited the Calgary apartment portfolio, income-producing apartment buildings, on July 10, 2012. Partial payment was received from the issuer for the travel-related expenses incurred by the Research Analyst to visit this site.

VS8 Our Research Analyst visited BT's Derby facility, a manufacturing plant and servicing centre for trains, on July 11, 2012. No payment was received from the issuer for the travel-related expenses incurred by the Research Analyst to visit this site.
VS9 Our Research Analyst visited Bombardier Sifang Transportation and Bombardier CPC Propulsion System Co., both JVs with Bombardier Inc., on October 15-19, 2012. Partial payment was received from the issuer for the travel-related expenses incurred by the Research Analyst to visit this site.

General Disclosures This report has been prepared by analysts who are employed by the Research Department of Scotiabank, Global Banking and Markets. Scotiabank, together with “Global Banking and Markets,” is a marketing name for the global corporate and investment banking and capital markets businesses of The Bank of Nova Scotia and certain of its affiliates in the countries where they operate, including Scotia Capital Inc. All other trademarks are acknowledged as belonging to their respective owners and the display of such trademarks is for informational use only. Scotiabank, Global Banking and Markets Research produces research reports under a single marketing identity referred to as “Globally-branded research” under U.S. rules. This research is produced on a single global research platform with one set of rules which meet the most stringent standards set by regulators in the various jurisdictions in which the research reports are produced. In addition, the analysts who produce the research reports, regardless of location, are subject to one set of policies designed to meet the most stringent rules established by regulators in the various jurisdictions where the research reports are produced. This report is provided to you for informational purposes only. This report is not, and is not to be construed as, an offer to sell or solicitation of an offer to buy any securities and/or commodity futures contracts. The securities mentioned in this report may neither be suitable for all investors nor eligible for sale in some jurisdictions where the report is distributed. The information and opinions contained herein have been compiled or arrived at from sources believed reliable, however, Scotiabank, Global Banking and Markets makes no representation or warranty, express or implied, as to their accuracy or completeness. Scotiabank, Global Banking and Markets has policies designed to make best efforts to ensure that the information contained in this report is current as of the date of this report, unless otherwise specified. Any prices that are stated in this report are for informational purposes only. Scotiabank, Global Banking and Markets makes no representation that any transaction may be or could have been effected at those prices. Any opinions expressed herein are those of the author(s) and are subject to change without notice and may differ or be contrary from the opinions expressed by other departments of Scotiabank, Global Banking and Markets or any of its affiliates. Neither Scotiabank, Global Banking and Markets nor its affiliates accepts any liability whatsoever for any direct or consequential loss arising from any use of this report or its contents. Equity research reports published by Scotiabank, Global Banking and Markets are available electronically via: Bloomberg, Thomson Financial/First Call - Research Direct, Reuters, Capital IQ, and FactSet. Institutional clients with questions regarding distribution of equity research should contact us at 1-800-208-7666. This report and all the information, opinions, and conclusions contained in it are protected by copyright. This report may not be reproduced in whole or in part, or referred to in any manner whatsoever, nor may the information, opinions, and conclusions contained in it be referred to without the prior express consent of Scotiabank, Global Banking and Markets.
Additional Disclosures Canada: This report is distributed by Scotia Capital Inc., a subsidiary of The Bank of Nova Scotia. DWM Securities Inc. is a subsidiary of The Bank of Nova Scotia and an affiliate of Scotia Capital Inc. Scotia Capital Inc. and DWM Securities Inc. are members of the Canadian Investor Protection Fund and the Investment Industry Regulatory Organization of Canada. DWM Securities Inc. does not provide investment banking services. Chile: This report is distributed by Scotia Corredora de Bolsa Chile S.A., a subsidiary of The Bank of Nova Scotia. Hong Kong: This report is distributed by The Bank of Nova Scotia Hong Kong Branch, which is authorized by the Securities and Future Commission to conduct Type 1, Type 4 and Type 6 regulated activities and regulated by the Hong Kong Monetary Authority. Mexico: This report is distributed by Scotia Inverlat Casa de Bolsa S.A. de C.V., a subsidiary of the Bank of Nova Scotia. Peru: This report is distributed by Scotia Sociedad Agente de Bolsa S.A., a subsidiary of The Bank of Nova Scotia. Singapore: This report is distributed by The Bank of Nova Scotia Asia Limited, a subsidiary of The Bank of Nova Scotia. The Bank of Nova Scotia Asia Limited is authorised and regulated by the Monetary Authority of Singapore, and exempted under Section 99(1)(a),and (b), (c) and (d) of the Securities and Futures Act to conduct regulated activities. United Kingdom and the rest of Europe: Except as otherwise specified herein, this report is distributed by Scotiabank Europe PLC, a subsidiary of the Bank of Nova Scotia. Scotiabank Europe PLC is authorized and regulated by the Financial Services Authority (FSA). Scotiabank Europe PLC complies with all the FSA requirements concerning research and the associated disclosures and these are indicated on the research where applicable. United States: This report is distributed by Scotia Capital (USA) Inc., a subsidiary of Scotia Capital Inc., and a registered U.S. broker-dealer. All transactions by a U.S. investor of securities mentioned in this report must be effected through Scotia Capital (USA) Inc. Non-U.S. investors wishing to effect a transaction in the securities discussed in this report should contact a Scotiabank, Global Banking and Markets entity in their local jurisdiction unless governing law permits otherwise.
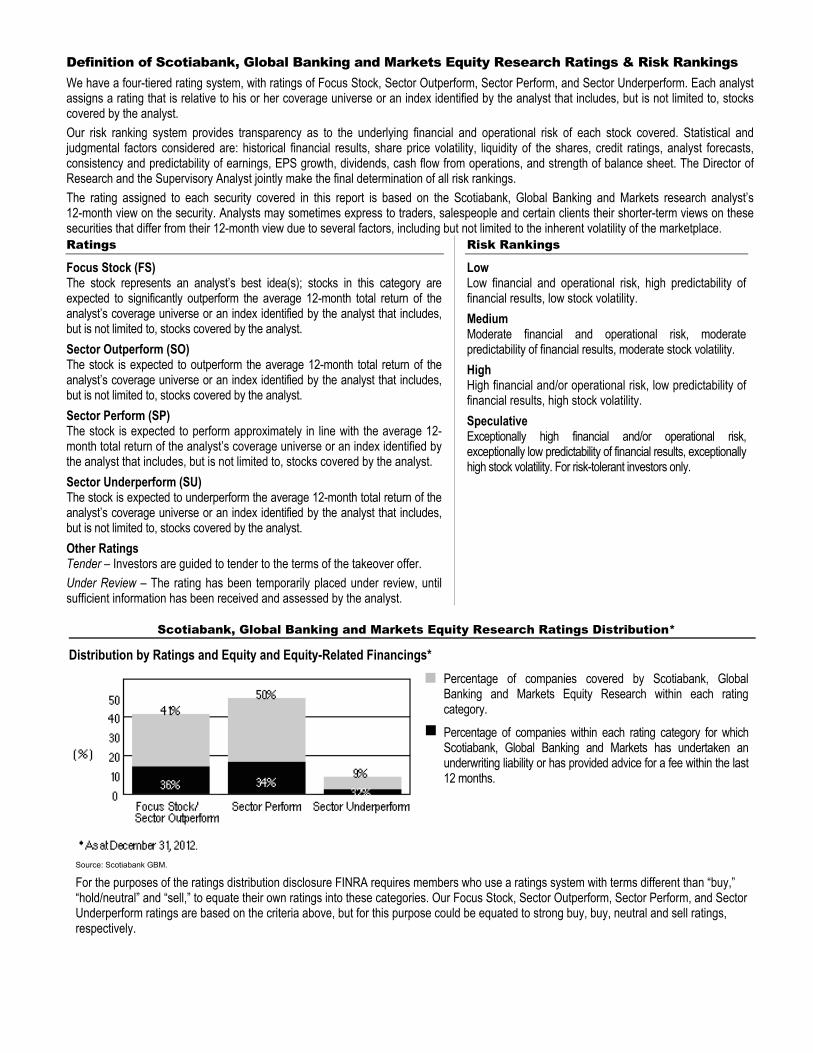
Definition of Scotiabank, Global Banking and Markets Equity Research Ratings & Risk Rankings We have a four-tiered rating system, with ratings of Focus Stock, Sector Outperform, Sector Perform, and Sector Underperform. Each analyst assigns a rating that is relative to his or her coverage universe or an index identified by the analyst that includes, but is not limited to, stockscovered by the analyst. Our risk ranking system provides transparency as to the underlying financial and operational risk of each stock covered. Statistical andjudgmental factors considered are: historical financial results, share price volatility, liquidity of the shares, credit ratings, analyst forecasts,consistency and predictability of earnings, EPS growth, dividends, cash flow from operations, and strength of balance sheet. The Director ofResearch and the Supervisory Analyst jointly make the final determination of all risk rankings. The rating assigned to each security covered in this report is based on the Scotiabank, Global Banking and Markets research analyst’s 12-month view on the security. Analysts may sometimes express to traders, salespeople and certain clients their shorter-term views on these securities that differ from their 12-month view due to several factors, including but not limited to the inherent volatility of the marketplace. Ratings
Focus Stock (FS) The stock represents an analyst’s best idea(s); stocks in this category are expected to significantly outperform the average 12-month total return of the analyst’s coverage universe or an index identified by the analyst that includes, but is not limited to, stocks covered by the analyst. Sector Outperform (SO) The stock is expected to outperform the average 12-month total return of the analyst’s coverage universe or an index identified by the analyst that includes, but is not limited to, stocks covered by the analyst. Sector Perform (SP) The stock is expected to perform approximately in line with the average 12-month total return of the analyst’s coverage universe or an index identified by the analyst that includes, but is not limited to, stocks covered by the analyst. Sector Underperform (SU) The stock is expected to underperform the average 12-month total return of the analyst’s coverage universe or an index identified by the analyst that includes, but is not limited to, stocks covered by the analyst. Other Ratings Tender – Investors are guided to tender to the terms of the takeover offer. Under Review – The rating has been temporarily placed under review, until sufficient information has been received and assessed by the analyst.
Risk Rankings
Low Low financial and operational risk, high predictability of financial results, low stock volatility. Medium Moderate financial and operational risk, moderate predictability of financial results, moderate stock volatility. High High financial and/or operational risk, low predictability of financial results, high stock volatility. Speculative Exceptionally high financial and/or operational risk, exceptionally low predictability of financial results, exceptionally high stock volatility. For risk-tolerant investors only.
Scotiabank, Global Banking and Markets Equity Research Ratings Distribution*
Distribution by Ratings and Equity and Equity-Related Financings* Percentage of companies covered by Scotiabank, Global Banking and Markets Equity Research within each rating category.
Percentage of companies within each rating category for which Scotiabank, Global Banking and Markets has undertaken an underwriting liability or has provided advice for a fee within the last 12 months.
Source: Scotiabank GBM.
For the purposes of the ratings distribution disclosure FINRA requires members who use a ratings system with terms different than “buy,” “hold/neutral” and “sell,” to equate their own ratings into these categories. Our Focus Stock, Sector Outperform, Sector Perform, and Sector Underperform ratings are based on the criteria above, but for this purpose could be equated to strong buy, buy, neutral and sell ratings, respectively.

Scotiabank, Global Banking and Markets Equity Research Team HEAD OF EQUITY RESEARCH John Henderson, P.Eng. ............................. (416) 945-7393 [email protected] HEAD OF BUSINESS MANAGEMENT Erika Osmond ............................................. (416) 945-4529 [email protected] CONSUMER DISCRETIONARY Cable Jeff Fan, CA, CFA ....................................... (416) 863-7780 [email protected] Media Paul Steep................................................... (416) 945-4310 [email protected] CONSUMER STAPLES Retailing Patricia Baker, Ph.D. ................................... (514) 287-4535 [email protected] ENERGY Oil & Gas – Integrated and E&P Mark Polak, CFA ......................................... (403) 213-7349 [email protected] Oil & Gas – International E&P Gavin Wylie ................................................. (403) 213-7333 [email protected] Oil & Gas – E&P Jason Bouvier, CFA .................................... (403) 213-7345 [email protected] Patrick Bryden, CFA.................................... (403) 213-7750 [email protected] William Lee, P.Eng. ..................................... (403) 213-7331 [email protected] Energy & Equipment Services Vladislav C. Vlad, MBA, P.Eng. .................. (403) 213-7759 [email protected] ENERGY INFRASTRUCTURE Matthew Akman, MBA................................. (416) 863-7798 [email protected] FINANCIALS Banks, Americas Kevin Choquette, CFA, CMA....................... (416) 863-2874 [email protected] Diversified Financials Phil Hardie, CFA, P.Eng. ............................. (416) 863-7430 [email protected] Insurance Joanne Smith, CFA ..................................... (212) 225-5071 [email protected] Phil Hardie, CFA, P.Eng. ............................. (416) 863-7430 [email protected] INDUSTRIALS Diversified Industrials Mark Neville, CFA ....................................... (514) 350-7756 [email protected] Industrial Products Neil Forster, CFA......................................... (416) 863-2899 [email protected]
Transportation & Aerospace Turan Quettawala, CFA............................... (416) 863-7065 [email protected] INFORMATION TECHNOLOGY Hardware & Equipment Gus Papageorgiou, CFA (416) 863-7552 [email protected] Software & Services Paul Steep……………………………………. (416) 945-4310 [email protected] LATIN AMERICA Banks, Americas Kevin Choquette, CFA, CMA....................... (416) 863-2874 [email protected] Claudia Benavente A....................................56 (2) 692-6568 [email protected] (Scotia Corredores de Bolsa Chile) Construction Marcos Durán y Casahonda, CFA..... 011-52-55-9179-5209 [email protected] (Scotiabank Inverlat) Paul Figueroa Mantero M.Sc......... 51-(1)-211-6040 x16474 [email protected] (Scotia Sociedad Agente de Bolsa S.A.) LatAm Telecom & Media Andres Coello........................................... 52-55-5123-2852 [email protected] (Scotiabank Inverlat) LatAm Consumer Products / Airports Rodrigo Echagaray...................................... (416) 945-4405 [email protected] (Scotia Inverlat Casa de Bolsa) MATERIALS Agriculture Christine Healy, CA..................................... (416) 863-7902 [email protected] Global Fertilizers Ben Isaacson, CFA ..................................... (416) 945-5310 [email protected] Gold & Precious Minerals Tanya Jakusconek, M.Sc ............................ (416) 945-4083 [email protected] Trevor Turnbull, M.Sc.................................. (416) 863-7427 [email protected] Leily Omoumi ............................................. (416) 945-4527 [email protected] Ovais Habib................................................. (416) 863-7141 [email protected] Metals & Mining Mark Turner, P.Eng. .................................... (416) 863-7484 [email protected] Paper & Forest Products Benoit Laprade, CA, CFA............................ (514) 287-3627 [email protected] PORTFOLIO STRATEGY Vincent Delisle, CFA ................................... (514) 287-3628 [email protected] Hugo Ste-Marie, CFA .................................. (514) 287-4992 [email protected]
REAL ESTATE & REITs Mario Saric, CA, CFA .................................. (416) 863-7824 [email protected] Pammi Bir, CA, CFA.................................... (416) 863-7218 [email protected] SPECIAL SITUATIONS Anthony Zicha ............................................. (514) 350-7748 [email protected] TELECOMMUNICATION SERVICES Jeff Fan, CA, CFA ....................................... (416) 863-7780 [email protected] ECONOMICS Warren Jestin .............................................. (416) 866-6136 Aron Gampel ............................................... (416) 866-6259 Pablo Bréard ............................................... (416) 862-3876 Derek Holt ................................................... (416) 863-7707 Patricia Mohr ............................................... (416) 866-4210 Mary Webb.................................................. (416) 866-4202 PORTFOLIO ADVISORY GROUP (SCOTIAMCLEOD) Managing Director: Stewart Hunt ............................................... (416) 863-2855 Trading Elliott Fishman............................................. (416) 863-7860 Tara Quinn .................................................. (416) 863-7149 Dave Stephens............................................ (416) 862-3115 Portfolio Manager: Stephen Uzielli ............................................ (416) 863-7939 Equity Advisory Paul Danesi................................................. (416) 863-7735 Geoff Ho, CFA............................................. (416) 865-6354 Institutional Equity Sales & Trading Toronto........................................................ (416) 863-2885 1-888-251-4484 Montreal ...................................................... (514) 287-4513 Vancouver ................................................... (604) 661-7411 1-888-926-2288 New York................................................ (212) 225-6605/04 1-800-262-4060 Boston......................................................... (617) 330-1477 Mexico City, MX ................................ 011-52-55-9179-5181 (Scotia Inverlat Casa de Bolsa) London, U.K. ................................... 011-44-207-826-5919 Singapore.................................................... (65) 6305-8350 (65) 6305-8347
Focus 2013 January 2013
Na Liu, MBA, CFA (647) 298-1411 Published by CNC Asset Management Ltd. [email protected] Exclusively distributed by Scotia Capital Inc. For important disclosures, please see China Outlook Disclosure.
i
Appendix 1 – China Outlook
Published by CNC Asset Management Ltd., exclusively distributed by Scotia Capital Inc.
A Year of Recovery
A S A B A S E C A S E , W E E X P E C T T H E C H I N E S E E C O N O M Y T O C O N T I N U E I T S M I L D
R E C O V E R Y I N 2 0 1 3 A N D T H E C O M M O D I T I E S M A R K E T S T O R E M A I N R A N G E - B O U N D .
H O W E V E R , T H E R E A R E T H R E E P O T E N T I A L G A M E C H A N G E R S .
In January 2012, in our Focus 2012 report entitled “Timing the Turnaround in 2012,” we wrote: “Even though the plane of the Chinese economy is still flying in a stormy zone, we believe it will eventually finish its bumpy ride in 2012. Therefore, the key task for investors [in 2012] is to time this turnaround.”
Now, at the start of 2013, most economists seem to agree that the growth of the Chinese economy troughed in the summer months of 2012 and that a nascent recovery has begun since the last quarter of 2012.
The Stress Test of 2012
During the “dark” summer months of 2012, the Chinese economy went through a stress test. The economy faced severe external and internal headwinds. Externally, European orders for Chinese goods suffered a double-digit year-over-year (YOY) decline (down 16.2% YOY in July), and China’s vast export sectors were struggling. Internally, the cyclical downturn was in full swing, and it was exacerbated by a seasonal summer lull. Moreover, despite the speculation about a hard landing for the Chinese economy at that time, the authorities in China decided to allow the economic down-cycle to run its course and to fulfill its “creative destruction” process. As we now know, after July the central bank took a stimulus pause by refusing to further cut interest rates and reserve ratios, despite all the calls from almost all economists and China observers.
In retrospect, the resilience of the Chinese economy demonstrated in the summer months of 2012 was remarkable. In our view, the economy was fundamentally supported by two underlying forces, which were unbroken even during the sharp economic downturn.
First, the economy was supported by rising labour compensation. According to the latest data from the National Bureau of Statistics, nominal income grew 13% in urban areas and 15.4% in rural areas in the first three quarters of 2012. The strong labour compensation was compromising corporate margins, but it was also supporting the consumer-related sectors and the service industry. From strong car sales to the heavy traffic during the Gold Week holidays, from the labour shortage in the service sectors to the rising wages on construction sites, 10 years from now, investors looking back might regard 2012 as a key transitional year for the Chinese economy: amid an economic downturn, the widely expected structural shift of the Chinese economy from being export- and investment-driven to consumption- and service-driven was taking place.
Focus 2013 January 2013
ii
Second, the economy was supported by the ongoing process of urbanization, which shored up the economy on three fronts: a strong pick-up in home sales, a good list of desirable infrastructure projects that could be launched when necessary, and, as a result, a certain level of construction activity that still helped China consume over 710 million tonnes of crude steel last year.
Our Current Recommendation
Both statistical and anecdotal evidence suggest to us that a recovery of the Chinese economy had started in the last quarter of 2012. To us, it is very encouraging that this recovery was achieved in the absence of outright stimulus news.
The stage of the current cyclicality has been our rationale for our current “overweight” call on the global raw materials and energy sectors from a China perspective, a call we steadfastly maintained over the “dark” summer months of 2012. As we know, the old-school investment philosophy calls for bottom-fishing the “deep cyclicals” in the late stage of an economic down-cycle (summer months of 2012) and for keeping the overweight exposure in the early stage of an economic recovery (Q4/12 and hopefully in most part of 2013), before inflation comes back.
For the time being, we will stick to this old-school doctrine and maintain our overweight call. That said, we do recognize that from a macro perspective, this economic recovery is likely to be mild; and from a commodity perspective, key commodities markets are likely to be range-bound.
Base Case for 2013 – A Mild Recovery and Range-Bound Markets
From a macro perspective, investors should not expect the same type of strong, V-shaped recoveries seen in past economic cycles in China for two reasons. First, this recovery is not aided by a massive stimulus package like the one we witnessed three years ago; and second, this recovery is taking place for an economy in transition.
As we highlighted earlier in this report, this recovery is partially led by the consumption part of the economy and the service sectors. Light industry is also slowly coming back, but heavy industry is still lagging. The divergence of different sectors’ growth strength could be clearly seen in the growth of
electricity usage by different sectors (Exhibit 1). From a broader perspective, the economy is still in its transition from being investment- and export-driven to consumption- and service industry-driven. This transition, if successful, should make the economic recovery more healthy and sustainable, but it should also make it much milder and less commodity-intensive in nature.
From a commodities perspective, we believe key commodity prices are likely to be range-bound.
Since early fall 2012, we have been making the case that floor prices for some key commodities such as thermal coal and iron ore might have been found, given the large-scale production cut in the late summer months by those small, high-cost producers in China facing sharply lower commodity prices. China is at the high end of the global production cost curve for a wide range of commodities, and the theoretical supports for key commodity prices at the Chinese cost curve have proven to be effective in this economic downturn. For instance, iron ore prices below $100/tonne proved unsustainable for very long.
Exhibit 1: China’s Power Consumption by Sector in 2012
Jan-Nov (bln kWh) YOY Percentage Change
Total Power Use 4,502.80 5.1
Light Industry 554.6 4.8Heavy Industry 2709.6 3.2
Service Industry 518.3 11.2Residential 571.4 10.6
Source: National Energy Administration.
Focus 2013 January 2013
iii
On the other hand, during this economic downturn, Chinese imports of key commodities have been surprisingly robust. During the first 11 months of 2012, China’s net imports of copper, primary aluminum, zinc, iron ore, all coal, coking coal, and crude oil have increased 28.3%, 294.8%, 77.8%, 8.2%, 33.1%, 24.4%, and 6.7% YOY, respectively. Those are all surprisingly strong numbers – in fact, China has been almost the lone active buyer for many commodities in 2012. The problem is, however, that those strong imports do not reconcile with the lukewarm 7%-8% GDP and 8%-10% industrial production (IP) YOY growth last year.
We believe the excess imports have found two different homes in China. For commodities like copper, the strong imports resulted in high inventory. For instance, the bonded warehouse inventory for refined copper is currently at record high levels (over 1 million tonnes). On the other hand, for commodities like iron ore, coking coal, and thermal coal, the strong imports acted as a partial replacement for the losses in local high-cost production. Therefore, there are two types of slackness in the Chinese commodities market: high inventory or high levels of idled capacity. They explain why we do not expect key commodity prices to rally hard from current levels. If iron ore prices go to $150/tonne, for instance, idled high-cost capacity will likely re-open in China.
In short, we think that for this mild economic recovery, commodity prices will be range-bound: supported by the Chinese cost curve, but capped by either high inventory or high spare capacity in the country.
Game Changer One – Accelerated Reforms
Even though we do have a base case for the Chinese economy and its commodities markets, we recognize that for an economy in transition, there are many moving parts, out of which there might be a few potential game changers.
First, new leadership always brings hope. And the recently completed leadership change at the party level is not a minor event. The Xi-Li regime is expected to govern China for the next 10 years and may profoundly change China and the world, for better or for worse. Therefore, the message sent during the first two month after the power transfer should be scrutinized. We are pleased to have heard two words repeatedly: reform and urbanization.
During his first month after the 18th Party Congress, Xi Jinping, the new Party General Secretary and widely expected to become China’s President next March, visited Shenzhen, the frontier of China’s reforms. The first tour by a newly elected Chinese leader is always highly symbolic. For Hu Jintao, China’s current President, his first tour 10 years ago was to Xi Baipo, where Chairman Mao once lived. The tribute to Mao messaged Hu’s leftist tendency. Xi’s choice of Shenzhen as his first destination outside Beijing is encouraging, in our view, as Shenzhen is widely seen as the ultimate symbol of China’s economic reforms and openness to the outside world. Also, 20 years ago, Deng Xiaoping, the “chief architect” of modern China, toured Shenzhen to give a major push for reform and steered the country back onto a road of rapid development. In Shenzhen, after paying his tribute to a statue of Deng, Xi was reported to have said that China’s reform must now enter new explorative fronts.
At the same time, Li Keqiang, the No. 2-ranked member of the politburo, widely expected to be China’s Premier, reportedly said that “reform is the biggest source of dividends for the Chinese economy.” He made the comment when addressing the concern that China’s rapid growth era might now have ended because the “demographic dividends” had been all paid out over the past 20 years – the once seemingly unlimited labour supply from the rural region has now run dry and the overall population is aging. In
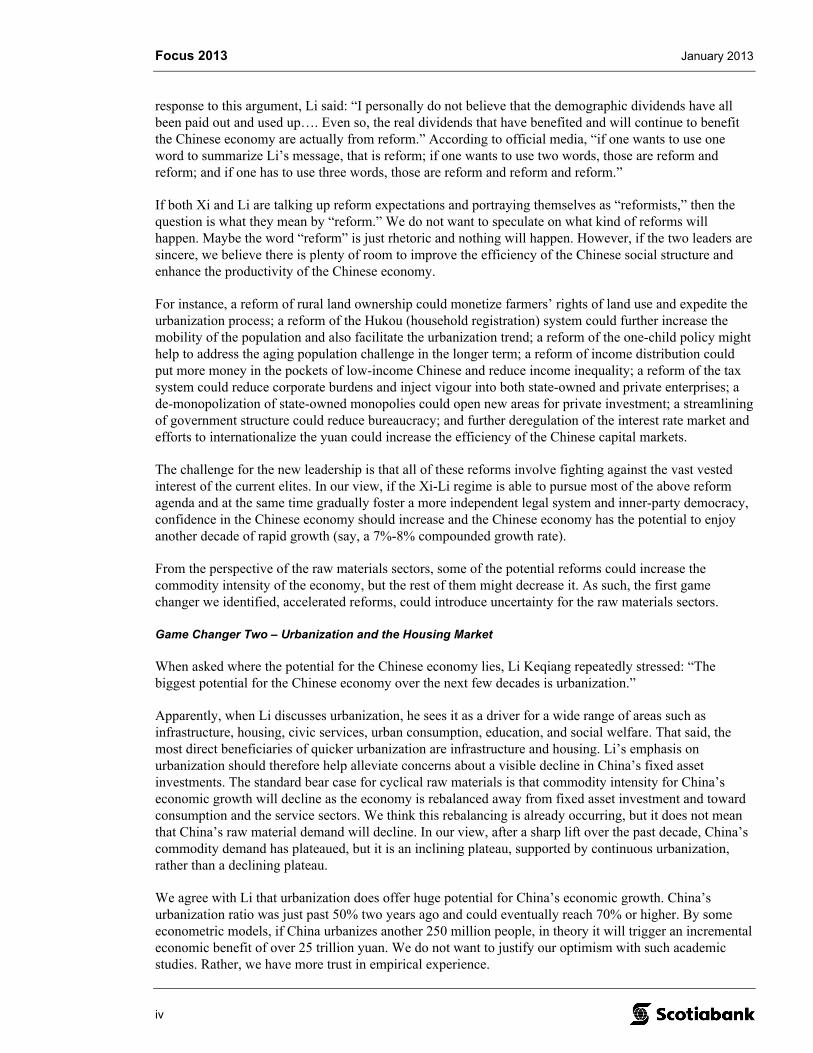
Focus 2013 January 2013
iv
response to this argument, Li said: “I personally do not believe that the demographic dividends have all been paid out and used up…. Even so, the real dividends that have benefited and will continue to benefit the Chinese economy are actually from reform.” According to official media, “if one wants to use one word to summarize Li’s message, that is reform; if one wants to use two words, those are reform and reform; and if one has to use three words, those are reform and reform and reform.”
If both Xi and Li are talking up reform expectations and portraying themselves as “reformists,” then the question is what they mean by “reform.” We do not want to speculate on what kind of reforms will happen. Maybe the word “reform” is just rhetoric and nothing will happen. However, if the two leaders are sincere, we believe there is plenty of room to improve the efficiency of the Chinese social structure and enhance the productivity of the Chinese economy.
For instance, a reform of rural land ownership could monetize farmers’ rights of land use and expedite the urbanization process; a reform of the Hukou (household registration) system could further increase the mobility of the population and also facilitate the urbanization trend; a reform of the one-child policy might help to address the aging population challenge in the longer term; a reform of income distribution could put more money in the pockets of low-income Chinese and reduce income inequality; a reform of the tax system could reduce corporate burdens and inject vigour into both state-owned and private enterprises; a de-monopolization of state-owned monopolies could open new areas for private investment; a streamlining of government structure could reduce bureaucracy; and further deregulation of the interest rate market and efforts to internationalize the yuan could increase the efficiency of the Chinese capital markets.
The challenge for the new leadership is that all of these reforms involve fighting against the vast vested interest of the current elites. In our view, if the Xi-Li regime is able to pursue most of the above reform agenda and at the same time gradually foster a more independent legal system and inner-party democracy, confidence in the Chinese economy should increase and the Chinese economy has the potential to enjoy another decade of rapid growth (say, a 7%-8% compounded growth rate).
From the perspective of the raw materials sectors, some of the potential reforms could increase the commodity intensity of the economy, but the rest of them might decrease it. As such, the first game changer we identified, accelerated reforms, could introduce uncertainty for the raw materials sectors.
Game Changer Two – Urbanization and the Housing Market
When asked where the potential for the Chinese economy lies, Li Keqiang repeatedly stressed: “The biggest potential for the Chinese economy over the next few decades is urbanization.”
Apparently, when Li discusses urbanization, he sees it as a driver for a wide range of areas such as infrastructure, housing, civic services, urban consumption, education, and social welfare. That said, the most direct beneficiaries of quicker urbanization are infrastructure and housing. Li’s emphasis on urbanization should therefore help alleviate concerns about a visible decline in China’s fixed asset investments. The standard bear case for cyclical raw materials is that commodity intensity for China’s economic growth will decline as the economy is rebalanced away from fixed asset investment and toward consumption and the service sectors. We think this rebalancing is already occurring, but it does not mean that China’s raw material demand will decline. In our view, after a sharp lift over the past decade, China’s commodity demand has plateaued, but it is an inclining plateau, supported by continuous urbanization, rather than a declining plateau.
We agree with Li that urbanization does offer huge potential for China’s economic growth. China’s urbanization ratio was just past 50% two years ago and could eventually reach 70% or higher. By some econometric models, if China urbanizes another 250 million people, in theory it will trigger an incremental economic benefit of over 25 trillion yuan. We do not want to justify our optimism with such academic studies. Rather, we have more trust in empirical experience.
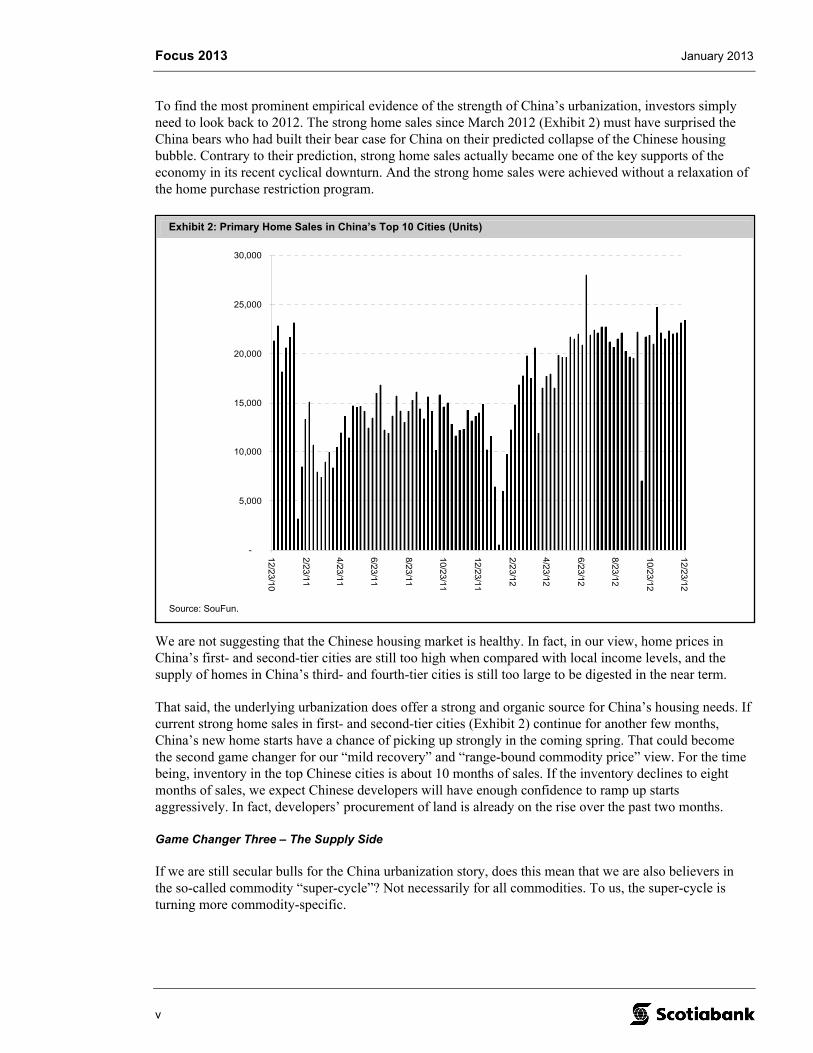
Focus 2013 January 2013
v
To find the most prominent empirical evidence of the strength of China’s urbanization, investors simply need to look back to 2012. The strong home sales since March 2012 (Exhibit 2) must have surprised the China bears who had built their bear case for China on their predicted collapse of the Chinese housing bubble. Contrary to their prediction, strong home sales actually became one of the key supports of the economy in its recent cyclical downturn. And the strong home sales were achieved without a relaxation of the home purchase restriction program.
We are not suggesting that the Chinese housing market is healthy. In fact, in our view, home prices in China’s first- and second-tier cities are still too high when compared with local income levels, and the supply of homes in China’s third- and fourth-tier cities is still too large to be digested in the near term.
That said, the underlying urbanization does offer a strong and organic source for China’s housing needs. If current strong home sales in first- and second-tier cities (Exhibit 2) continue for another few months, China’s new home starts have a chance of picking up strongly in the coming spring. That could become the second game changer for our “mild recovery” and “range-bound commodity price” view. For the time being, inventory in the top Chinese cities is about 10 months of sales. If the inventory declines to eight months of sales, we expect Chinese developers will have enough confidence to ramp up starts aggressively. In fact, developers’ procurement of land is already on the rise over the past two months.
Game Changer Three – The Supply Side
If we are still secular bulls for the China urbanization story, does this mean that we are also believers in the so-called commodity “super-cycle”? Not necessarily for all commodities. To us, the super-cycle is turning more commodity-specific.
Exhibit 2: Primary Home Sales in China’s Top 10 Cities (Units)
-
5,000
10,000
15,000
20,000
25,000
30,000
12/2
3/1
0
2/2
3/1
1
4/2
3/1
1
6/2
3/1
1
8/2
3/1
1
10/2
3/1
1
12/2
3/1
1
2/2
3/1
2
4/2
3/1
2
6/2
3/1
2
8/2
3/1
2
10/2
3/1
2
12/2
3/1
2
Source: SouFun.
Focus 2013 January 2013
vi
Ten years ago, when the commodity super-cycle started, incremental Chinese demand was the dominant factor, as supply for almost all commodities was lagging and the rest of the world economy was in growth mode. Today, the impact of Chinese demand has been dwarfed by the twin forces of the surge in supply for certain commodities and the lack of economic growth in the rest of the world.
Take coal as an example. In the first 11 months of 2012, China’s net coal imports grew a massive 33.1% to 197 million tonnes. But the huge Chinese imports did not alleviate the glut in the global market last year. The strong Chinese imports could not offset the combined forces of reduced demand in Europe, natural gas substitution in the United States, and strong supply growth in countries such as Indonesia and Mongolia.
In the longer term, we can easily argue that the secular demand trend for coal is not over. As of the end of 2011, China’s total installed electricity capacity was about 1,050 GW. This is still slightly lower than that of the United States – in the context that the Chinese population is 4.3 times that of the United States. If China’s installed capacity still has room to grow, China’s thermal coal demand (and imports) should also grow, as China currently has no alternative but to rely on coal as its main electricity source.
That said, will the coal price resume its super-cycle after last year’s slump when Chinese demand growth continues to realize its potential? We are not sure, as we don’t know how strong the supply-side response will be to meet the demand growth. The massive supply-side response to Chinese seaborne coal demand over the past 10 years has indeed surprised us. Ten years ago, China was a net exporter of coal of 80 million tonnes; last year, China’s net imports topped 210 million tonnes. A massive swing of almost 300 million tonnes did not seem to burden the global market too much.
In fact, over the past few years, investors have “lost” one commodity after another, not because of the lack of Chinese demand growth, but because of the quicker-than-expected supply-side response. China’s aluminum demand has been growing at double-digit rates for years, but the same thing cannot be said for the aluminum price, due to the quick supply-side response from bauxite to alumina. Similar scenarios have played out for zinc, nickel, molybdenum, natural gas, and certain fertilizers.
As we mentioned earlier in the report, on the demand side, after a sharp lift over the past decade, China’s commodity demand has plateaued, but it is an inclining plateau, supported by continuous urbanization, rather than a declining plateau. However, still-growing Chinese demand does not necessarily translate into ever-higher commodity prices. The super-cycle for commodity prices is turning more commodity-specific, and the supply side is a key differentiating factor. Therefore, we suggest investors pay close attention to the supply side for key commodities, and we regard supply side surprise as the third potential game changer for our range-bound commodity call.
Conclusion
For the time being, we take “mild recovery” and “range-bound commodity prices” as our base case. If the new leadership aggressively pursues more structural reforms in the Chinese socio-economic structure, confidence in the sustainability of China’s long-term economic growth should increase; and, if China’s urbanization process continues and even speeds up, China’s infrastructure and housing construction might surprise on the higher side. Those are our hopes and they are the extra reasons that we maintain our overweight call for the global raw materials sectors from a China perspective.

Focus 2013 January 2013
vii
IMPORTANT NOTICE AND DISCLAIMER
This publication has been prepared by an entity that is independent of and unaffiliated with The Bank of Nova Scotia and its subsidiaries and affiliates (individually or collectively, the “Scotiabank Group”). Unauthorized reproduction, distribution, transmission or publication without the prior written consent of Scotia Capital Inc. is strictly prohibited.
This publication is intended for general information purposes only and should not be construed as an offer to sell, a solicitation for or an offer to buy, any products or services referenced herein. The information, opinions, estimates, and projections contained herein are subject to change without notice. The Scotiabank Group has not independently verified and does not make any representation or warranty, express or implied, in respect thereof, takes no responsibility for any errors and omissions which may be contained herein or accept any liability whatsoever for any loss arising from any use of or reliance on the information, opinions, estimates, projections and other materials contained herein whether relied upon by the recipient or user or any other third party (including, without limitation, any customer of the recipient or user).
Securities laws and regulations and the policies of the Scotiabank Group that are applicable to Research Analysts may not be applicable to this publication and its author. The opinions and views expressed in this publication may differ from those of the Scotiabank Group and any or all of its divisions and departments, including Research Departments. Information may be available to the Scotiabank Group that is not reflected herein and it may engage in transactions in a manner inconsistent with the views discussed herein. The Scotiabank Group may have positions, or be in the process of acquiring or disposing of positions, referred to in this publication. The Scotiabank Group and any of its officers, directors and employees, may from time to time act as managers, co-managers or underwriters of a public offering or act as principals or agents, deal in, own or act as market-makers or advisors, brokers or commercial and/or investment bankers in relation to the securities, contracts or financial instruments discussed herein. Neither the Scotiabank Group nor any of its officers, directors, partners, or employees accepts any liability for any direct or consequential loss arising from this publication or its contents. Any securities, contracts or financial instruments discussed herein may be unsuitable for some investors. Investors should independently evaluate any issuer, security, contract or financial instrument that may be discussed in this publication and consult with an investment professional prior to making an investment decision.
To U.K. Residents: In the U.K. this document is distributed by Scotia Capital (Europe) Limited, which is authorised and regulated by the Financial Services Authority (“FSA”). The contents hereof are not intended for the use of and should not be issued or passed on to retail clients as defined by the FSA and has not been prepared in accordance with legal requirements designed to promote the independence of investment research and is not subject to any prohibition on dealing ahead of the dissemination of investment research.
For U.S. Investors: Any transactions by U.S. Institutional Investors in connection with a security referenced herein must be executed with a U.S. broker-dealer, including Scotia Capital (USA) Inc., an affiliate of Scotia Capital Inc.
™Trademark of The Bank of Nova Scotia. Used under license, where applicable. Scotiabank, together with “Global Banking and Markets,” is a marketing name for the global corporate and investment banking and capital markets businesses of The Bank of Nova Scotia and some of its subsidiaries, including Scotia Capital Inc., Scotia Capital (USA) Inc., Scotiabanc Inc., Citadel Hill Advisors LLC, The Bank of Nova Scotia Trust Company of New York, Scotiabank Europe plc, Scotia Capital (Europe) Limited, Scotiabank (Ireland) Limited, Scotiabank Inverlat, S.A., Institucion de Banca, Multiple, Grupo Financiero Scotiabank Inverlat, Scotia Inverlat Casa de Bolsa, S.A. de C.V., and Scotia Inverlat Derivados, S.A. de C.V. – all members of the Scotiabank Group and authorized users of the mark. The Bank of Nova Scotia is incorporated in Canada with limited liability. Scotia Capital Inc. is a member of CIPF. Scotia Capital (USA) Inc. is a registered broker-dealer with the SEC and is a member of FINRA and SIPC. The Bank of Nova Scotia, Scotiabank Europe plc, Scotia Capital (Europe) Limited and Scotia Capital Inc. are each authorized and regulated by the Financial Services Authority (FSA) in the U.K. Scotiabank Inverlat, S.A., Scotia Inverlat Casa de Bolsa, S.A. de C.V., and Scotia Derivados, S.A. de C.V., are each authorized and regulated by the Mexican financial authorities.
Focus 2013 January 2013
viii
CHINA OUTLOOK DISCLOSURE
This report only discusses geographic markets and industry or commodity sectors, and it does not assess individual issuers. Therefore, it is not an equity research report. Consequently this report is not governed by rules applicable to the publication and distribution of research reports, including relevant restrictions or disclosures required to be included in research reports.
Information, opinions, estimates, projections, statements and other materials contained herein are provided as of the date hereof, intended for information purposes only, and are subject to change without notice. In addition, the opinions and statements contained herein are based on information taken from sources believed to be reliable, but no representation or warranty, express or implied, is made as to their accuracy, completeness, or timeliness. CNC takes no responsibility for any errors and omissions which may be contained herein, and accepts no liability whatsoever for any loss arising from any use of or reliance on such information.
No part of this report constitutes a recommendation that any particular investment or investment strategy is suitable for any specific person. This report is not intended as investment advice tailored to the particular circumstances, investment objectives, and risk tolerances of any entity or individual. CNC does not continuously follow any investment vehicles or any issuers even if mentioned in this report. Accordingly, readers of this report must regard the report as providing stand-alone analysis as of the date of publication and should not expect continuing analysis or additional reports on any topics of the report. This report should not be construed as investment advice/recommendation or as a solicitation for or an offer to buy or sell any securities or other financial instruments.
If this report discusses any industry or commodity sectors, it should be noted that the views on industry or commodity sectors do not always align with CNC’s views on individual equities related to the industry or commodity sectors. For example, this report might express positive views on a particular commodity, but CNC, its directors, officers, employees, clients, or its managed accounts/funds may be bearish on a single issuer whose value generally rises and falls with the value of the commodity. CNC, its directors, officers, employees, clients, or its managed accounts/funds may decide to sell positions in that issuer, either because of concerns about any company-specific issues (such as management, debt level, geographic risk, and etc) of the issuer or because CNC, its directors, officers, employees, clients, or its managed accounts/funds may have determined that the issuer’s stock price is inflated even relative to CNC’s positive view of the value of the underlying commodity.
To make it clear, CNC, as a principal or advisor, and CNC’s directors, officers, employees, clients, or its managed accounts/funds may hold or may later acquire or sell securities of issuers tied to the industry or commodity sectors this report is commenting on. Although this report may be bullish (or bearish) on a particular industry or commodity sector in general, CNC, its directors, officers, employees, clients, or its managed accounts/funds may still determine that a particular issuer’s securities are overpriced (or underpriced) and may determine to sell (or buy) securities of that issuer. The readers of this report should understand that CNC, its directors, officers, employees, clients, or managed accounts/funds may be buying or selling securities that might appear contrary to the views expressed in this report.
All rights reserved. Unauthorized reproduction, distribution, transmission or publication of this report without the prior express written consent of CNC is strictly prohibited. If you believe that this report was sent to you in error, please forward a message to that effect as soon as practicable to [email protected].

TM Trademark of The Bank of Nova Scotia. Used under license, where applicable. Scotiabank, together with “Global Banking and Markets”, is a marketing name for the global corporate and investment banking and capital markets businesses of The Bank of Nova Scotia and certain of its affi liates in the countries where they operate, including Scotia Capital Inc. Scotia Capital Inc. is a Member of the Canadian Investor Protection Fund.
www.gbm.scotiabank.com


