Embed Size (px)
Citation preview
See discussions, stats, and author profiles for this publication at: https://www.researchgate.net/publication/341609755
Flexural and shear characteristics of bio-based sandwich beams made of
hollow and foam-filled paper honeycomb cores and flax fiber composite skins
Article in Thin-Walled Structures · August 2020
DOI: 10.1016/j.tws.2020.106834
CITATIONS
0READS
62
2 authors, including:
Some of the authors of this publication are also working on these related projects:
Design of Slender Concrete Columns Reinforced/Strengthened with FRP Composites View project
Connections of Concrete-Filled FRP Tubes to Concrete Members View project
Pedram Sadeghian
Dalhousie University
82 PUBLICATIONS 413 CITATIONS
SEE PROFILE
All content following this page was uploaded by Pedram Sadeghian on 24 May 2020.
The user has requested enhancement of the downloaded file.
Page 1 of 42
Flexural and Shear Characteristics of Bio-Based Sandwich Beams
Made of Hollow and Foam-Filled Paper Honeycomb Cores and
Flax Fiber Composite Skins
Yuchen Fu and Pedram Sadeghian1
Department of Civil and Resource Engineering, Dalhousie University, 1360 Barrington
Street, Halifax, NS, B3H 4R2, Canada
ABSTRACT
In this paper, bio-based sandwich panels made of fiber-reinforced polymer (FRP) skins and
two types of paper honeycomb core (namely, hollow and foam-filled) with three different
thicknesses (namely, 6 mm, 12 mm, and 25 mm) were studied. Flax FRP composites made of
a unidirectional plant-based flax fabric and bio-based epoxy resin (30% bio content) were used
for the skins. The panels were cut into a total of 36 sandwich beam specimens with the width
of 50 mm and tested under four-point bending with two span configurations to characterize the
flexural and shear stiffness of the panels. The specimens with foam-filled paper honeycomb
cores showed a higher load capacity than those with hollow honeycomb, however their
stiffnesses were not fundamentally different. Major non-linearity was observed in the load-
deflection and load-strain behavior of the specimens. An analytical model was successfully
developed based on the non-linearity of the skins in tension/compression and the core in shear
to predict the non-linear behavior of the specimens. A parametric study was performed on
1 Corresponding Author: Assistant Professor and Canada Research Chair in Sustainable Infrastructure,
Page 2 of 42
different geometrical parameters and it was shown that contribution and bending and shear
changes and it can be engineered to achieve desirable strength and stiffness. Overall, the bio-
based sandwich panels can be used for interior walls, doors, and furniture in building
application with much less impact on the environment in comparison with their synthetic
counterparts.
DOI: https://doi.org/10.1016/j.tws.2020.106834
Keyword: Bio-based, Sandwich; Composite; Flax fiber, FRP; Paper honeycomb; Foam.
1. INTRODUCTION
Sandwich composites are efficient systems with high performance at low cost and low weight.
The skins of a sandwich beam resist the tensile and compressive stresses under flexure, while
lightweight and low-density core provides shear stress resistance and maintains a distance
between skins resulting in a higher moment of inertia. Moreover, the core prevents heat flux
infiltration, so it provides insulation for the system. Honeycomb structures have been
extensively studied for the core of sandwich composites [1][2][3][4][5][6]. On the other hand,
sandwich composites with fiber-reinforced polymer (FRP) skins made of synthetic fibers (such
as carbon, glass, basalt, and etc.) have been practices for a long time [7][8][9]. Recently, it has
been shown that plant-based fibers (such as flax, hemp, jute, and etc.) can be more efficient for
cases that skin strength is not critical [10][11][12]. Plant-based fibers are considered as
prospective substitutes to synthetic fibers due to the relatively large quantity, low cost of raw
material, low density, high specific properties, and positive environmental profile [13][14][15].
Using bio-based polymer with flax fibers makes flax FRPs even more environmentally friendly
Page 3 of 42
than FRPs made of synthetic polymers [16][17][18].
In addition to skin materials, many different light-weight, low-density, and low-strength
core materials have been developed to be used in the form of foams [19][20], honeycombs
[21][22], and woven fabrics [23][24]. Hollow honeycomb cores have been widely applied to
sandwich composites due to their light-weight, high performance to cost ratio, excellent
stiffness, and good bonding surface [25][26][27]. Sandwich composites with honeycomb cores
have substantial empty space within the core cells, which can be filled with foams. Foam-filled
honeycomb cores can provide the combined advantages of traditional foam cores and hollow
honeycomb cores resulting in higher shear strength and stiffness plus cell stability [28][29][30].
Recently, multiple studies have been conducted on the impact behavior of sandwich composites
made of foam-filled metallic honeycomb cores [31][32][33].
Paper honeycomb cores are products with honeycomb structure and cell walls made of
paper-based materials. Due to its lightweight, high strength, and favorable cushioning
properties, paper honeycomb products have been widely used in packaging industry and others
such as aviation, furniture, and building industries [34][35][36]. Besides, paper is an
environmentally friendly material with very high recyclability potential. Numerous studies
have been conducted on sandwich composites made of bio-based components. A variety of bio-
based core materials including corrugated cardboard [37][38][39][40], hollow paper
honeycomb [34][36][41], and cork[26][42][43][44] have been studies in the past. Also, natural
fibers and bio-based polymers [45][46][47][48] have been incorporated into skins of sandwich
structures. However, the effects of filling foam on the behavior and failure of sandwich panels
Page 4 of 42
made of a paper honeycomb core and flax FRP composite skins considering the non-linearity
of both the skins and core have not been studied.
In this study, flax FRP skins and paper honeycomb (hollow and foam-filled) were
combined to manufacture sandwich beam specimens. High performance unidirectional flax
fabric is a general material used in automotive, sporting goods and decorative application.
Therefore, the flax is environmentally friendly and has fewer health and safety concerns than
traditional materials. Paper honeycomb, as mentioned earlier, is a recyclable and reusable
material. The whole sandwich beam specimens can be considered as a green construction
material. This paper evaluates the flexural and shear characteristics of a novel composition of
paper honeycomb cores and flax FRP skins to achieve a more environmentally friendly design
than conventional systems for sandwich structures.
2. EXPRIMENTAL PROGRAM
This section presents the details of test matrix, material properties, specimen fabrication, and
test setup and instrumentation.
2.1. Test Matrix
A total of 36 flax FRP and paper honeycomb core sandwich beams with the width of 50 mm
were manufactured and tested under four-point bending. All specimens were fabricated using
one-layer flax FRP skin on each sides of the core. The variables of the test were thickness and
type of the cores. Three core thicknesses of 6 mm, 12 mm and 25 mm as well as two core types
of hollow and foam-filled were used. Two beams spans were considered for each configuration
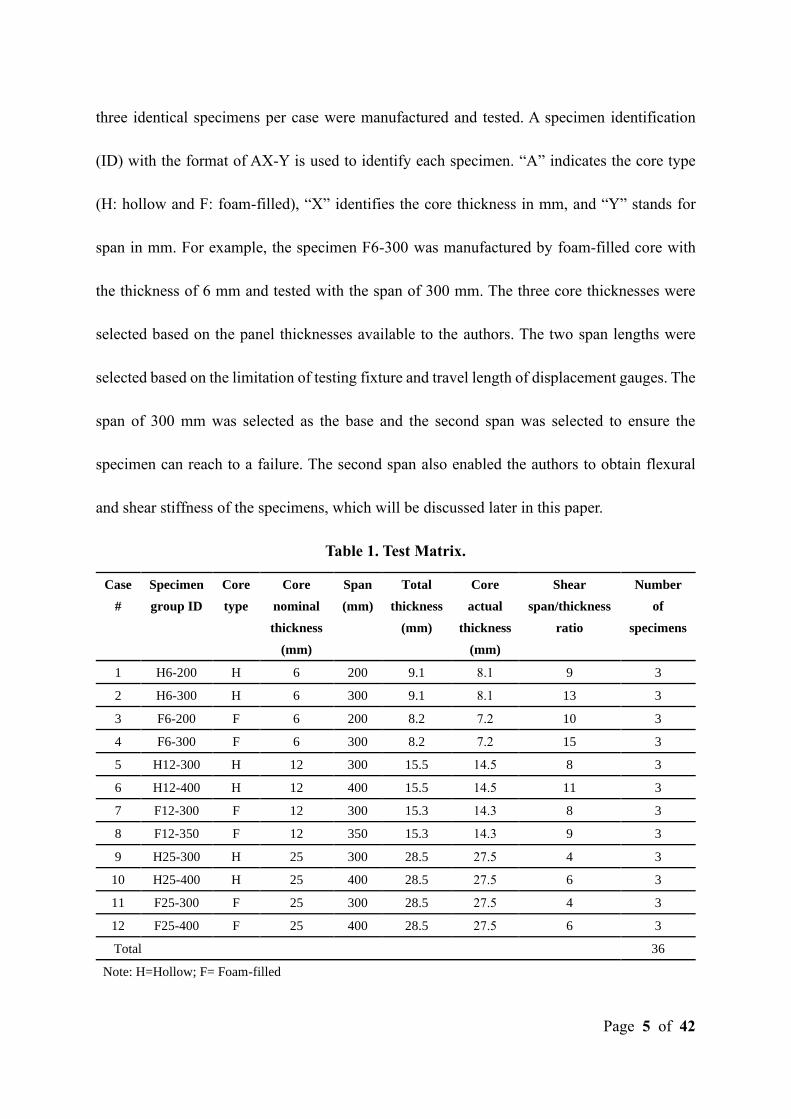
of core type and thickness. As shown in Table 1, a total of 12 cases were considered. Note that
Page 5 of 42
three identical specimens per case were manufactured and tested. A specimen identification
(ID) with the format of AX-Y is used to identify each specimen. “A” indicates the core type
(H: hollow and F: foam-filled), “X” identifies the core thickness in mm, and “Y” stands for
span in mm. For example, the specimen F6-300 was manufactured by foam-filled core with
the thickness of 6 mm and tested with the span of 300 mm. The three core thicknesses were
selected based on the panel thicknesses available to the authors. The two span lengths were
selected based on the limitation of testing fixture and travel length of displacement gauges. The
span of 300 mm was selected as the base and the second span was selected to ensure the
specimen can reach to a failure. The second span also enabled the authors to obtain flexural
and shear stiffness of the specimens, which will be discussed later in this paper.
Table 1. Test Matrix.
Case
#
Specimen
group ID
Core
type
Core
nominal
thickness
(mm)
Span
(mm)
Total
thickness
(mm)
Core
actual
thickness
(mm)
Shear
span/thickness
ratio
Number
of
specimens
1 H6-200 H 6 200 9.1 8.1 9 3
2 H6-300 H 6 300 9.1 8.1 13 3
3 F6-200 F 6 200 8.2 7.2 10 3
4 F6-300 F 6 300 8.2 7.2 15 3
5 H12-300 H 12 300 15.5 14.5 8 3
6 H12-400 H 12 400 15.5 14.5 11 3
7 F12-300 F 12 300 15.3 14.3 8 3
8 F12-350 F 12 350 15.3 14.3 9 3
9 H25-300 H 25 300 28.5 27.5 4 3
10 H25-400 H 25 400 28.5 27.5 6 3
11 F25-300 F 25 300 28.5 27.5 4 3
12 F25-400 F 25 400 28.5 27.5 6 3
Total 36
Note: H=Hollow; F= Foam-filled
Page 6 of 42
2.2. Material Properties
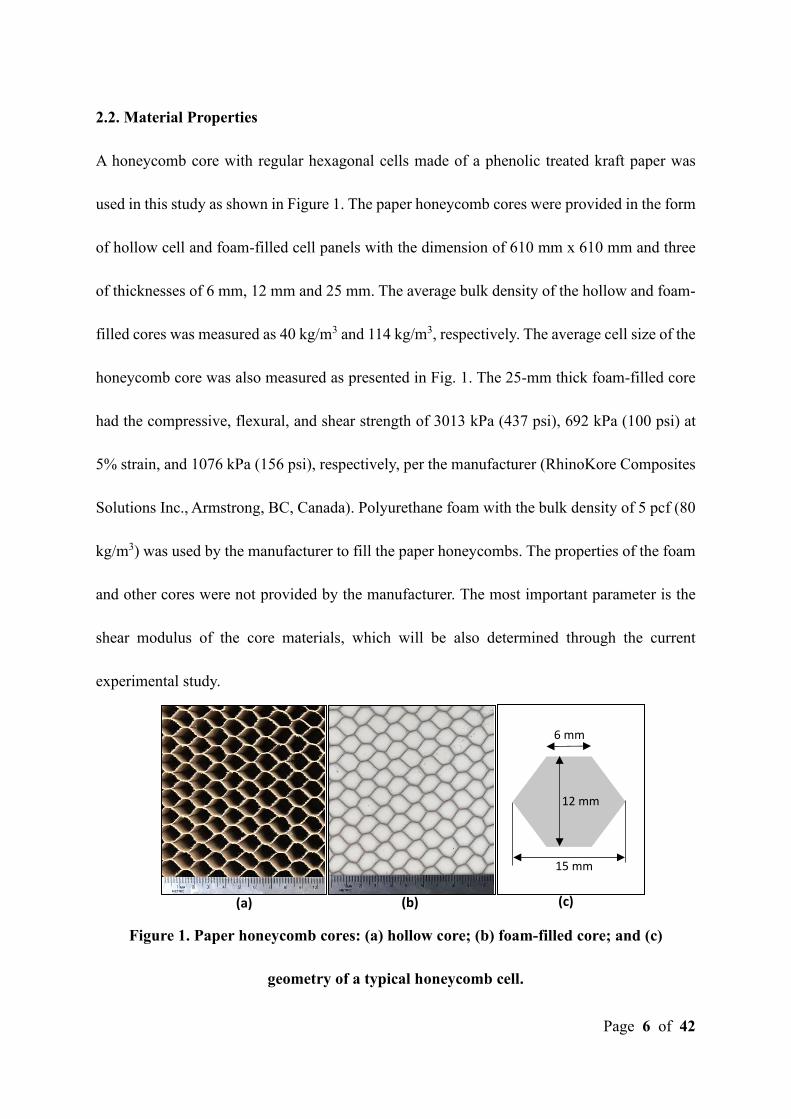
A honeycomb core with regular hexagonal cells made of a phenolic treated kraft paper was
used in this study as shown in Figure 1. The paper honeycomb cores were provided in the form
of hollow cell and foam-filled cell panels with the dimension of 610 mm x 610 mm and three
of thicknesses of 6 mm, 12 mm and 25 mm. The average bulk density of the hollow and foam-
filled cores was measured as 40 kg/m3 and 114 kg/m3, respectively. The average cell size of the
honeycomb core was also measured as presented in Fig. 1. The 25-mm thick foam-filled core
had the compressive, flexural, and shear strength of 3013 kPa (437 psi), 692 kPa (100 psi) at
5% strain, and 1076 kPa (156 psi), respectively, per the manufacturer (RhinoKore Composites
Solutions Inc., Armstrong, BC, Canada). Polyurethane foam with the bulk density of 5 pcf (80
kg/m3) was used by the manufacturer to fill the paper honeycombs. The properties of the foam
and other cores were not provided by the manufacturer. The most important parameter is the
shear modulus of the core materials, which will be also determined through the current
experimental study.
Figure 1. Paper honeycomb cores: (a) hollow core; (b) foam-filled core; and (c)
geometry of a typical honeycomb cell.
(a) (b) (c)
6 mm
15 mm
12 mm
Page 7 of 42
For flax FRP skins, a unidirectional flax fabric was used with a reported weight of 275 g/m2
and density of 1.28 g/cm3 reported by manufacturer (Composites Evolution, Chesterfield, UK).
A bio-based epoxy resin (30% bio content) with a fast setting hardener was used to make the
flax FRP skins. Epoxy and hardener are mixed at the ratio of 100 to 43 by weight, and it had a
reported fully cure time of 7 days. The mechanical properties were determined as tensile
strength, modulus and elongation of 53.23 MPa, 2.65 GPa, and 6% reported by the
manufacturer (Entropy Resins, Hayward, USA). The flax FRP with a ply thickness of 0.5 mm
was previously reported [49] to have a non-linear behavior in tension. The tensile strength,
initial modulus, and ultimate strain were reported to be 198 MPa, 17.09 GPa, 0.0153 mm/mm,
respectively.
2.3. Specimen Fabrication
Initially, sandwich panels with the size of the honeycomb core (i.e., 610 mm x 610 mm) were
manufactured and then were cut into difference specific beam size. Significant steps are shown
in Figure 2. First, two pieces of square wooden board with the same size of the honeycomb
core sheet were prepared, and they were sanded by sandpaper and cleaned to have flat surfaces.
One of square wooden boards was places on a flat table and covered by a wax paper. Flax fabric
was also cut to cover the surface of the honeycomb core sheet. Then, the epoxy and hardener
were mixed per manufacturer’s guideline, and a layer of resin was spread on the wax paper
using brush and scraper. Then, the flax fabric was placed on the resin coated surface. Additional
resin was applied on the flax fabric to saturate it. A scraper was used to spread the resin and
remove any excess resin. Then, the honeycomb core was placed on saturated flax fabric. The
Page 8 of 42
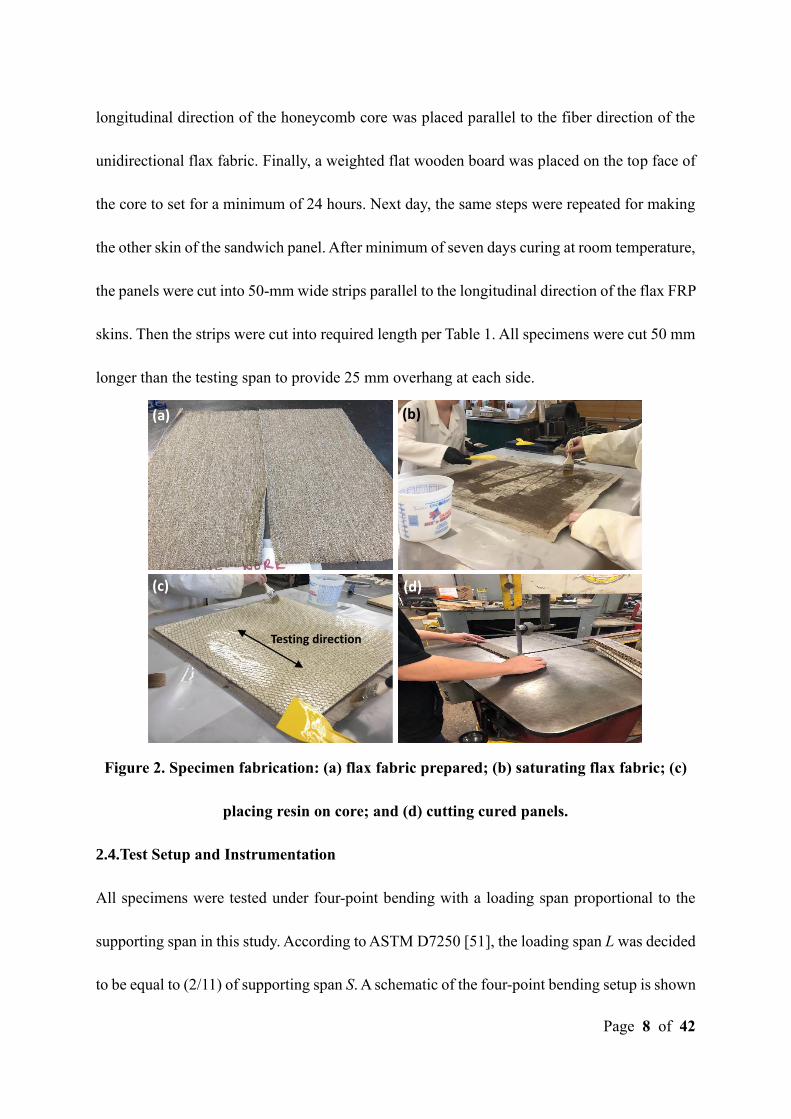
longitudinal direction of the honeycomb core was placed parallel to the fiber direction of the
unidirectional flax fabric. Finally, a weighted flat wooden board was placed on the top face of
the core to set for a minimum of 24 hours. Next day, the same steps were repeated for making
the other skin of the sandwich panel. After minimum of seven days curing at room temperature,
the panels were cut into 50-mm wide strips parallel to the longitudinal direction of the flax FRP
skins. Then the strips were cut into required length per Table 1. All specimens were cut 50 mm
longer than the testing span to provide 25 mm overhang at each side.
Figure 2. Specimen fabrication: (a) flax fabric prepared; (b) saturating flax fabric; (c)
placing resin on core; and (d) cutting cured panels.
2.4.Test Setup and Instrumentation
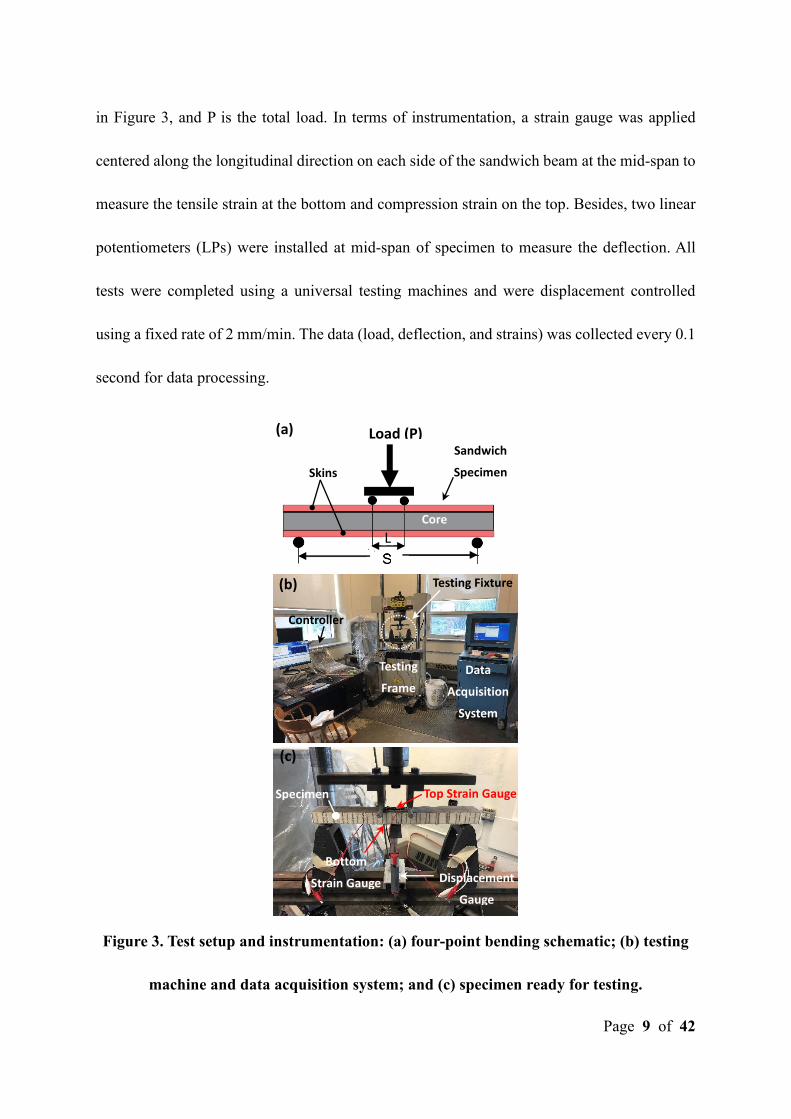
All specimens were tested under four-point bending with a loading span proportional to the
supporting span in this study. According to ASTM D7250 [51], the loading span L was decided
to be equal to (2/11) of supporting span S. A schematic of the four-point bending setup is shown
(a) (b)
(c) (d)
Testing direction
Page 9 of 42
in Figure 3, and P is the total load. In terms of instrumentation, a strain gauge was applied
centered along the longitudinal direction on each side of the sandwich beam at the mid-span to
measure the tensile strain at the bottom and compression strain on the top. Besides, two linear
potentiometers (LPs) were installed at mid-span of specimen to measure the deflection. All
tests were completed using a universal testing machines and were displacement controlled
using a fixed rate of 2 mm/min. The data (load, deflection, and strains) was collected every 0.1
second for data processing.
Figure 3. Test setup and instrumentation: (a) four-point bending schematic; (b) testing
machine and data acquisition system; and (c) specimen ready for testing.
(a)
(b)
(c)
Data
Acquisition
System
Testing
Frame
Sandwich
Specimen
Core
Skins
Testing Fixture
Controller
Top Strain Gauge
Bottom
Strain Gauge Displacement
Gauge
Specimen
L
Load (P)
Page 10 of 42
3. EXPERIMENTAL RESULTS AND DISCUSSIONS
This section presents the details of the failure modes, the load-deflection and load-strain,
behaviors, and the stiffness calculations based on the moment-curvature and ASTM methods.
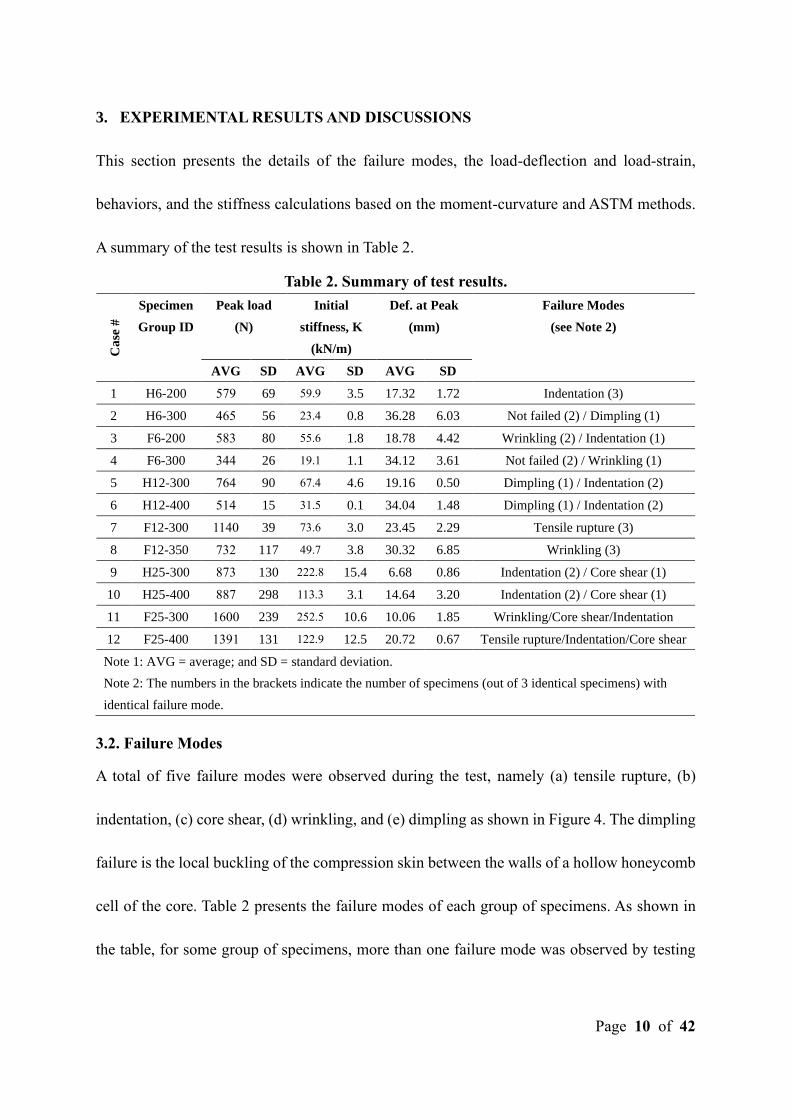
A summary of the test results is shown in Table 2.
Table 2. Summary of test results.
Ca
se #
Specimen
Group ID
Peak load
(N)
Initial
stiffness, K
(kN/m)
Def. at Peak
(mm)
Failure Modes
(see Note 2)
AVG SD AVG SD AVG SD
1 H6-200 579 69 59.9 3.5 17.32 1.72 Indentation (3)
2 H6-300 465 56 23.4 0.8 36.28 6.03 Not failed (2) / Dimpling (1)
3 F6-200 583 80 55.6 1.8 18.78 4.42 Wrinkling (2) / Indentation (1)
4 F6-300 344 26 19.1 1.1 34.12 3.61 Not failed (2) / Wrinkling (1)
5 H12-300 764 90 67.4 4.6 19.16 0.50 Dimpling (1) / Indentation (2)
6 H12-400 514 15 31.5 0.1 34.04 1.48 Dimpling (1) / Indentation (2)
7 F12-300 1140 39 73.6 3.0 23.45 2.29 Tensile rupture (3)
8 F12-350 732 117 49.7 3.8 30.32 6.85 Wrinkling (3)
9 H25-300 873 130 222.8 15.4 6.68 0.86 Indentation (2) / Core shear (1)
10 H25-400 887 298 113.3 3.1 14.64 3.20 Indentation (2) / Core shear (1)
11 F25-300 1600 239 252.5 10.6 10.06 1.85 Wrinkling/Core shear/Indentation
12 F25-400 1391 131 122.9 12.5 20.72 0.67 Tensile rupture/Indentation/Core shear
Note 1: AVG = average; and SD = standard deviation.
Note 2: The numbers in the brackets indicate the number of specimens (out of 3 identical specimens) with
identical failure mode.
3.2. Failure Modes
A total of five failure modes were observed during the test, namely (a) tensile rupture, (b)
indentation, (c) core shear, (d) wrinkling, and (e) dimpling as shown in Figure 4. The dimpling
failure is the local buckling of the compression skin between the walls of a hollow honeycomb
cell of the core. Table 2 presents the failure modes of each group of specimens. As shown in
the table, for some group of specimens, more than one failure mode was observed by testing
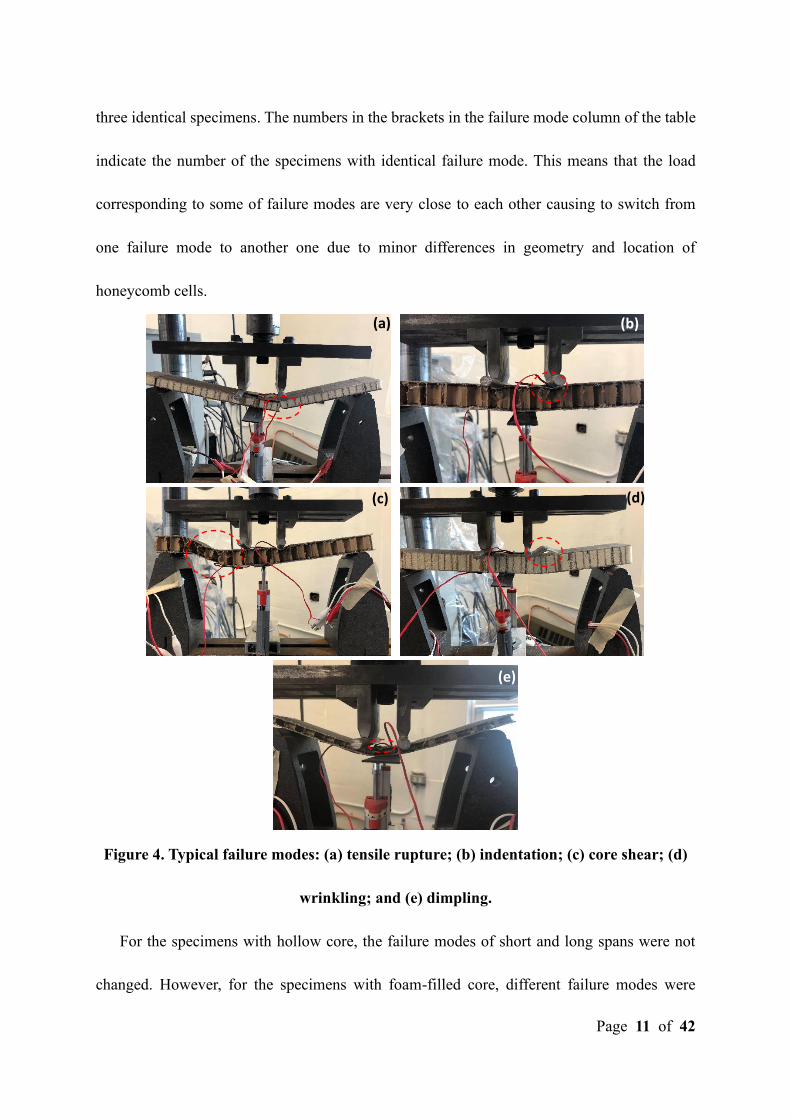
Page 11 of 42
three identical specimens. The numbers in the brackets in the failure mode column of the table
indicate the number of the specimens with identical failure mode. This means that the load
corresponding to some of failure modes are very close to each other causing to switch from
one failure mode to another one due to minor differences in geometry and location of
honeycomb cells.
Figure 4. Typical failure modes: (a) tensile rupture; (b) indentation; (c) core shear; (d)
wrinkling; and (e) dimpling.
For the specimens with hollow core, the failure modes of short and long spans were not
changed. However, for the specimens with foam-filled core, different failure modes were
(a) (b)
(c) (d)
(e)
Page 12 of 42
obtained in different span. Moreover, the filling foam significantly changed the failure mode
of the specimens with 12- and 25-mm thick honeycomb core. This can be explained with the
lateral support provided by the filling foam for the core cells and compressive skin. The
specimens with 12-mm thick core filled with foam showed consistent failure mode in
comparison with their counterparts.
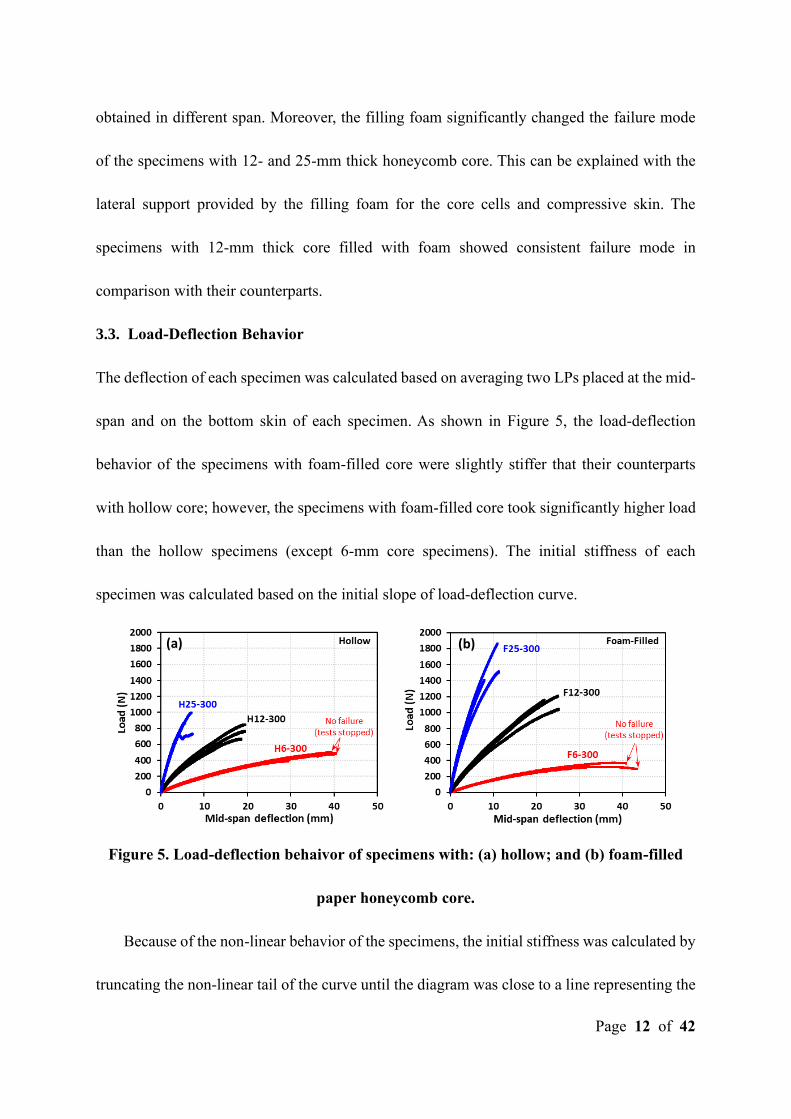
3.3. Load-Deflection Behavior
The deflection of each specimen was calculated based on averaging two LPs placed at the mid-
span and on the bottom skin of each specimen. As shown in Figure 5, the load-deflection
behavior of the specimens with foam-filled core were slightly stiffer that their counterparts
with hollow core; however, the specimens with foam-filled core took significantly higher load
than the hollow specimens (except 6-mm core specimens). The initial stiffness of each
specimen was calculated based on the initial slope of load-deflection curve.
Figure 5. Load-deflection behaivor of specimens with: (a) hollow; and (b) foam-filled
paper honeycomb core.
Because of the non-linear behavior of the specimens, the initial stiffness was calculated by
truncating the non-linear tail of the curve until the diagram was close to a line representing the
(a) (b)
Page 13 of 42
initial stiffness of the specimen. The test results of initial stiffness were shown in the Table 2
and will be used in the analytical section to calculate flexural and shear stiffness. Each value
presented in the table is the average of three identical specimens. The standard deviation of
each parameter is also provided in the table. Overall, higher values of stiffness were obtained
when the core became thicker. For 300 mm spans, the initial stiffness of the specimens with
25- and 12-mm thick foam-filled core were 13 and 9% higher than that of their counterparts
with hollow core, respectively. For 200- and 300-mm spans, the initial stiffness of the
specimens with 6-mm thick foam-filled core were averagely 13% less that of their counterparts
with hollow core. This can be explained based on the fact that the 6-mm thick foam-filled core
was slightly (about 1 mm) thinner that of its hollow counterpart as presented in Table 1.
The average peak load of each group of specimens along with corresponding standard
deviation are also presented in Table 2. For 300 mm spans, the peak load of the specimens with
25- and 12-mm thick foam-filled core were 83 and 49% higher than that of their counterparts
with hollow core, respectively. This indicates that the filling foam prevented failures triggered
with the lack of stability of hollow cell walls. For 200- and 300-mm spans, the peak load of the
specimens with 6-mm thick foam-filled core were averagely 13% less that of their counterparts
with hollow core, which can be explained as same as the initial stiffness. Overall, the foam-
filling increased the load capacity of the hollow core specimens significantly. The non-linearity
of the load-deflection behavior of the test specimens is significant, which will be discussed
later in the analytical section.
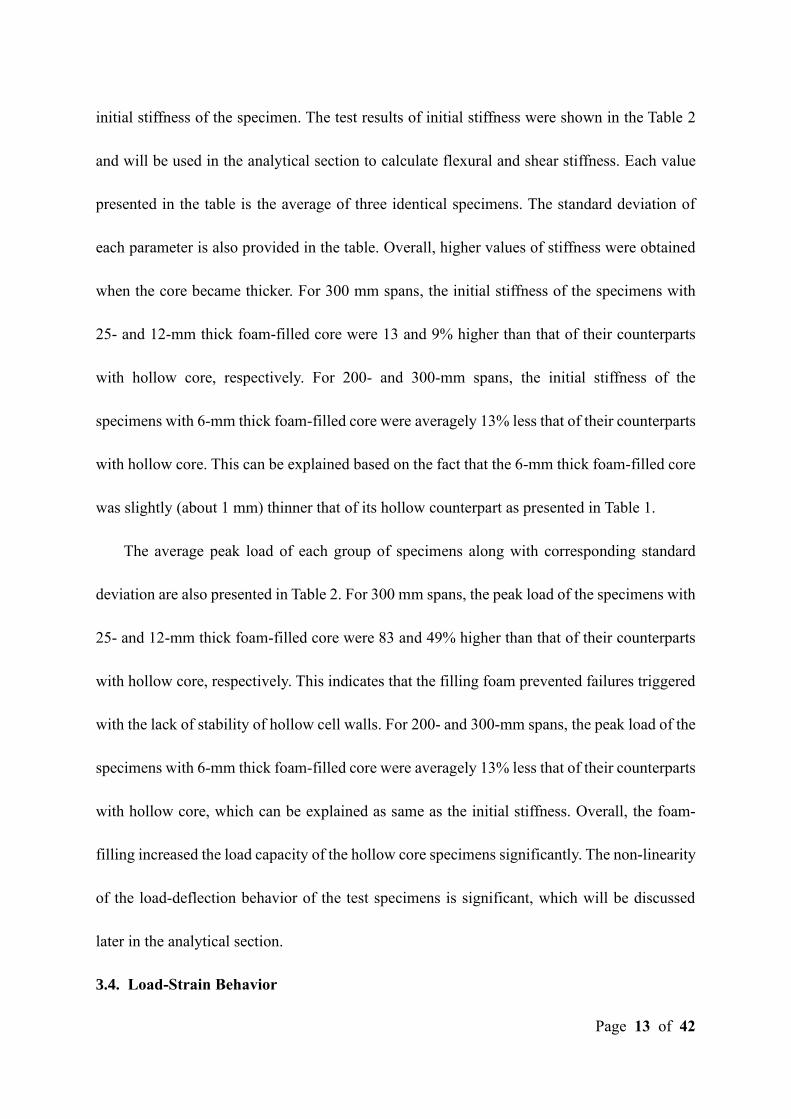
3.4. Load-Strain Behavior
Page 14 of 42
Two strain gauges were applied longitudinally on the center of each side of each specimen at
mid-span, and strain values were recorded at every load step. The load-strain curves of the test
specimens with 300 mm span are shown in Figure 6. As shown in the figure, when the load
was increasing, the top strain was decreasing caused by compression resulting in negative
number, and the bottom strain was going up caused by tension resulting in positive value. As
seen, at the same value of strain, a higher load was obtained for the specimens with thicker
core indication a higher stiffens as expected. Also, the ultimate strain of the hollow core
specimens was higher for the specimens with thinner core. However, the ultimate strain of the
foam-filled core specimens did not change significantly by changing the core thickness. This
indicates that the specimens with thicker foam-filled core were able to utilize the capacity of
the skins more than the specimens with hollow cores.
Figure 6. Load-strain behavior of specimens with: (a) hollow; and (b) foam-filled paper
honeycomb core.
Figure 6 also shows a non-linear load-strain behavior indicating the source of non-linearity
is not only the core and the flax FRP skins of the sandwich specimens also contributed in the
non-linear behavior. This needs to be further verified in the analytical section. The maximum
(a) (b)
Page 15 of 42
tensile strain of the specimens is typically less than the rupture strain of the skin in tension (i.e.,
0.0153 mm/mm), which shows majority of the specimens did not reach to the tensile rupture
of the skin. As shown in Figure 6, the curves related to the specimen group F12-300 show a
clear intersection with the skin rupture strain on 0.0153 mm/mm, which is compatible with its
failure mode (i.e. tensile rupture) observed during the tests. The maximum tensile strain of the
specimens with 6- and 12-mm thick hollow core were close to, but mainly less than the skin
rupture strain on 0.0153 mm/mm, however they were mainly failed by indentation or dimpling.
This might be related to localized high strains due to indentation or dimpling of the skins at the
mid-span of those specimens. A finite element modeling of those specimens is recommended
to provide a better understanding of the localized strain distribution of the unsupported skin
between cell walls of the hollow honeycombs.
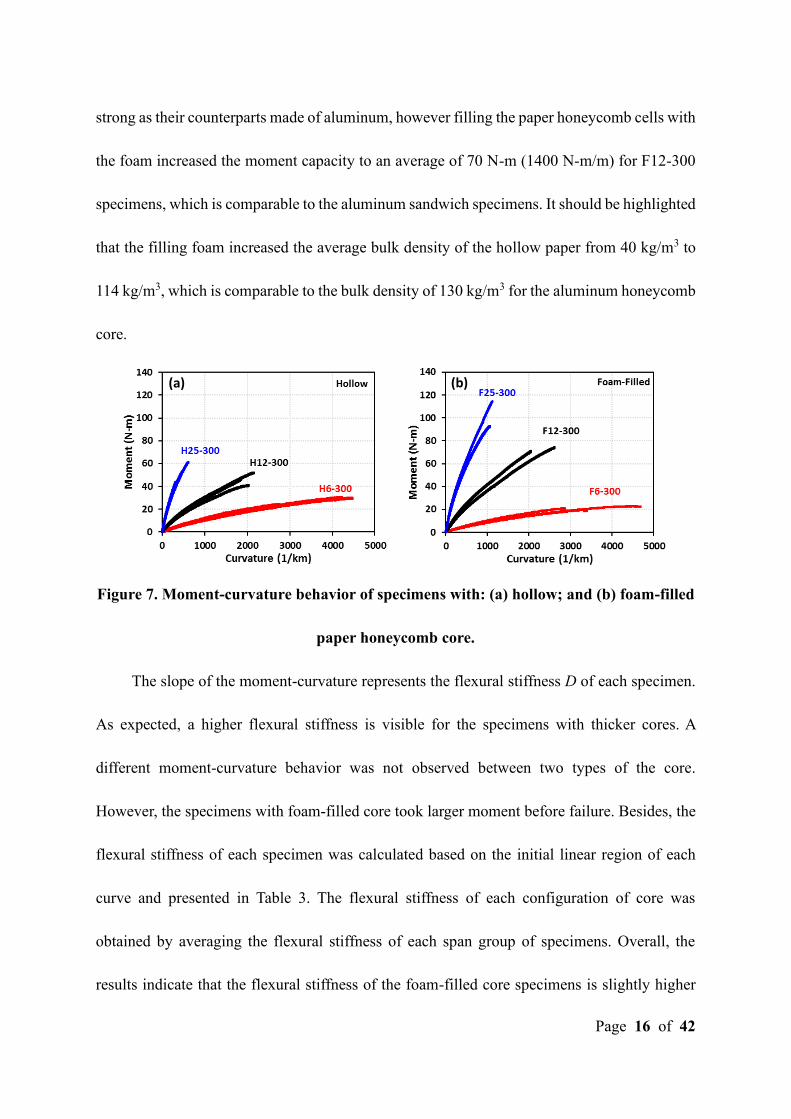
3.5. Flexural Stiffness Based on Moment-Curvature Behavior
The moment was calculated for mid-span of the specimens and the curvature was calculated
based on the values of strain from two strain gauges applied on the center of each sides of the
specimens. The values of moment and curvature were calculated for each load level. The
moment-curvature curves of the specimens with 300 mm span are shown in Figure 7. The
average moment capacity of 47 N-m (940 N-m/m) obtained from H12-300 specimens (total
thickness of 14.5 mm and width of 45 mm) was significantly less than the moment capacity of
64 N-m (1430 N-m/m) of a group of specimens made of aluminum honeycomb core and facings
(total thickness of 11 mm and core bulk density of 130 kg/m3) tested recently by Palomba et al.
[50]. This indicates that the hollow paper honeycombs considered in this study were not as
Page 16 of 42
strong as their counterparts made of aluminum, however filling the paper honeycomb cells with
the foam increased the moment capacity to an average of 70 N-m (1400 N-m/m) for F12-300
specimens, which is comparable to the aluminum sandwich specimens. It should be highlighted
that the filling foam increased the average bulk density of the hollow paper from 40 kg/m3 to
114 kg/m3, which is comparable to the bulk density of 130 kg/m3 for the aluminum honeycomb
core.
Figure 7. Moment-curvature behavior of specimens with: (a) hollow; and (b) foam-filled
paper honeycomb core.
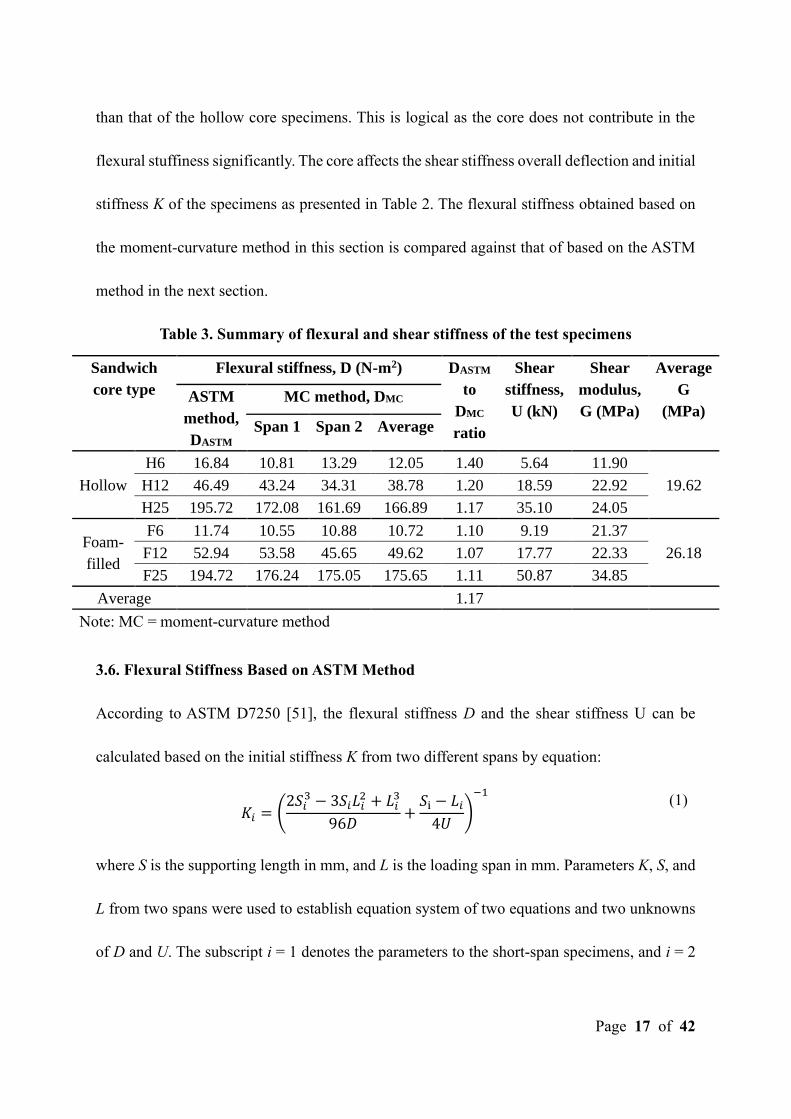
The slope of the moment-curvature represents the flexural stiffness D of each specimen.
As expected, a higher flexural stiffness is visible for the specimens with thicker cores. A
different moment-curvature behavior was not observed between two types of the core.
However, the specimens with foam-filled core took larger moment before failure. Besides, the
flexural stiffness of each specimen was calculated based on the initial linear region of each
curve and presented in Table 3. The flexural stiffness of each configuration of core was
obtained by averaging the flexural stiffness of each span group of specimens. Overall, the
results indicate that the flexural stiffness of the foam-filled core specimens is slightly higher
(a) (b)
Page 17 of 42
than that of the hollow core specimens. This is logical as the core does not contribute in the
flexural stuffiness significantly. The core affects the shear stiffness overall deflection and initial
stiffness K of the specimens as presented in Table 2. The flexural stiffness obtained based on
the moment-curvature method in this section is compared against that of based on the ASTM
method in the next section.
Table 3. Summary of flexural and shear stiffness of the test specimens
Sandwich
core type
Flexural stiffness, D (N-m2) DASTM
to
DMC
ratio
Shear
stiffness,
U (kN)
Shear
modulus,
G (MPa)
Average
G
(MPa) ASTM
method,
DASTM
MC method, DMC
Span 1 Span 2 Average
Hollow
H6 16.84 10.81 13.29 12.05 1.40 5.64 11.90
19.62 H12 46.49 43.24 34.31 38.78 1.20 18.59 22.92
H25 195.72 172.08 161.69 166.89 1.17 35.10 24.05
Foam-
filled
F6 11.74 10.55 10.88 10.72 1.10 9.19 21.37
26.18 F12 52.94 53.58 45.65 49.62 1.07 17.77 22.33
F25 194.72 176.24 175.05 175.65 1.11 50.87 34.85
Average 1.17
Note: MC = moment-curvature method
3.6. Flexural Stiffness Based on ASTM Method
According to ASTM D7250 [51], the flexural stiffness D and the shear stiffness U can be
calculated based on the initial stiffness K from two different spans by equation:
𝐾𝑖 = (2𝑆𝑖
3 − 3𝑆𝑖𝐿𝑖2 + 𝐿𝑖
3
96𝐷+𝑆i − 𝐿𝑖4𝑈
)
−1
(1)
where S is the supporting length in mm, and L is the loading span in mm. Parameters K, S, and
L from two spans were used to establish equation system of two equations and two unknowns
of D and U. The subscript i = 1 denotes the parameters to the short-span specimens, and i = 2
Page 18 of 42
to the long-span specimens. The initial stiffness K of each specimens was taken from Table 2
and then D and U were calculated for each sandwich configuration by solving the equation
system of two unknowns and two equations presented in Equation 1. The results are presented
in Table 3 and labeled as ASTM method. The flexural stiffness values obtained from the
moment-curvature method for each span are also presented in Table 3. The ratio of the flexural
based on the ASTM method to the average of moment-curvature (MC) method is also presented
in Table 3. Overall, the ASTM method gives the flexural stiffness of the sandwich specimens
17% higher than that of based on the MC method.
3.7. Shear Modulus
Based on the ASTM method, the shear stiffness U of each sandwich type was also calculated
and presented in Table 3. Based on that, the shear modulus G of each core type can be obtained
as follows:
𝐺 =𝑈(ℎ − 2𝑡)
𝑏(ℎ − 𝑡)2 (2)
where h is the height of the specimen, t is the thickness of the skin, and b is the width of the
specimen. The average dimensions of each specimen group were used, and the shear modulus
G of each core type was calculated and presented in Table 3. The average shear modulus of the
hollow and foam-filled honeycomb cores used in this study are obtained 19.6 and 26.2 MPa,
respectively. The shear modulus 19.6 MPa for the hollow paper honeycomb core is compatible
with the range of 18 MPa to 22 MPa reported by Chen and Yan [36] based on a finite element
modeling of hollow paper honeycomb core with the cell size of 12.7 mm and the core height
to face thickness ratio (i.e. shelling ratio) of 4 and more. The shelling ratio of the specimens
Page 19 of 42
tested in the current study ranges from 14 to 55. It should be noted that the actual thickness of
the cores used in this study are different than the nominal values used to name the specimens
(see Table 1). The shear modulus results are implemented in the next section to predict the
shear deformation of the sandwich specimens.
4. ANALYTICAL STUDY
In this section, an analytical study is presented to predict the non-linear behavior of the
sandwich specimens. Also, the initial stiffness and peak load of the test specimens are predicted
based on classic equations obtained from the literature.
4.1. Non-Linear Behavior
In the experimental section, it was shown that both the load-deflection and load-strain behavior
of the sandwich beams were non-linear. It was concluded the source of the non-linearity is both
the flax FRP skins and the paper honeycomb core. In this section, a non-linear analytical model
is presented to predict the load-deflection behavior of the sandwich specimens tested in the
experimental program. The analytical model utilizes the non-linearity of both skin and core
materials to calculate the flexural and shear deformations.
4.1.1. Assumptions
In this study, parabolic stress-strain curves for both flax FRPs (in tension and compression)
and paper honeycomb core (in shear) are implemented. The parabolic stress-strain curves were
previously proposed [37][52] and verified against independent test data. Also, the stress-strain
curve of the skins is assumed to be the same in tension and compression. Moreover, it is
assumed that the axial strain to vary linearly over the cross-section of the beam according to
Page 20 of 42
the Euler-Bernoulli beam theory. This assumption will be further discussed at the end of this
section. Based on a cross-sectional analysis and the assumption of linear and symmetric strain
profile with respect to the centroidal axis, the following iterative procedure is implemented to
obtain the non-linear load-strain and load-deflection behavior of the test specimens.
4.1.2. Iterative analysis
Based on the non-linearity of the skin and core, an iterative analysis is used to calculate the
normal stress σ of the skin under the bending moment M and the shear stress τ of the core under
the shear force V at any given load step j as follows:
𝜎𝑗 =𝑀𝑗
𝑑𝑏𝑡 (3)
𝜏𝑗 =𝑉𝑗𝑐
𝑏𝑑2 (4)
where d is center-to-center distance of the skins, t is the skin thickness, c is the core thickness,
and b is the width of the specimen. Then, the skin normal strain ε and the core shear strain γ is
calculated based on the non-linear stress-strain curves of the skin and the core as follows:
𝜀𝑗 =1
𝜎𝑢2(𝜀𝑢 −
𝜎𝑢𝐸𝑜) σ𝑗
2 +1
𝐸𝑜𝜎𝑗 (5)
𝛾𝑗 =1
𝜏𝑢2(𝛾𝑢 −
𝜏𝑢𝐺𝑜) τ𝑗
2 +1
𝐺𝑜𝜏𝑗 (6)
where σu is the rupture stress of the skin, εu is the rupture strain of the skin, Eo is the initial
elastic modulus of the skin, τu is the shear strength of the core, γu is the ultimate shear strain of
the core, and Go is the initial modulus of the core. Then, the secant elastic modulus of the skin
Esec and the secant shear modulus the core Gsec are obtained by dividing the normal and shear
stress to their corresponding strains at any given load step. Subsequently, the secant flexural
stiffness Dsec and the secant shear stiffness Usec are calculated at any given load step as follows:
Page 21 of 42
𝐷𝑠𝑒𝑐𝑗 = 𝐸𝑠𝑒𝑐𝑗 (𝑏𝑡3
6+𝑏𝑡𝑑2
2) (7)
𝑈𝑠𝑒𝑐𝑗 = 𝐺𝑠𝑒𝑐𝑗𝑏𝑑2
𝑐 (8)
where b is the width of specimen, t is the thickness of skin, d is the distance of center lines of
skins, and c is thickness of core. Ultimately, the bending and shear deflection of the sandwich
beam are obtained based on the secant moduli at the corresponding load step. The procedure is
continued until the sandwich beam reaches to its peak load. The total deflection Δj at the load
step j under the load Pj is obtained as follows:
𝛥𝑗 =𝑃𝑗(2𝑆
3 − 3𝑆𝐿2 + 𝐿3)
96𝐷𝑠𝑒𝑐𝑗+𝑃𝑗(𝑆 − 𝐿)
4𝑈𝑠𝑒𝑐𝑗 (9)
where S is the support span length, L is the load span length.
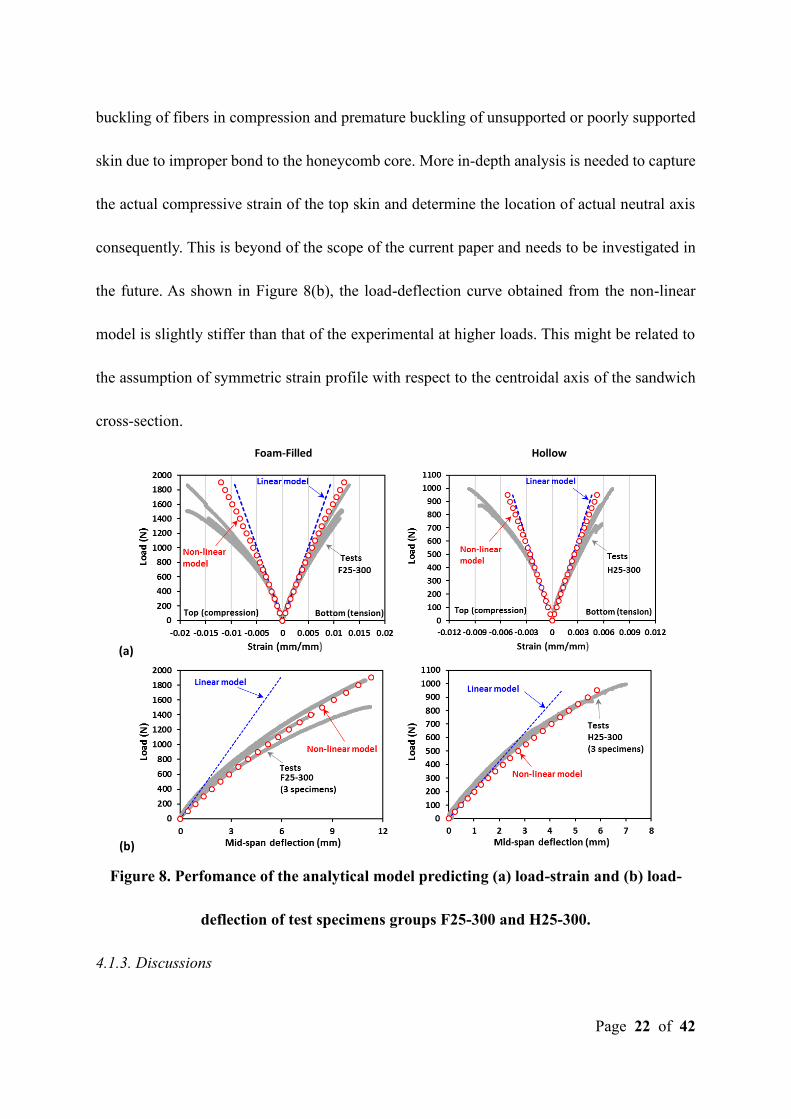
4.1.3. Model verification
Figure 8 compares the performance of the analytical model predicting load-strain and load-
deflection behaviors of the test specimen group F25-300 and H25-300. Also, a linear model
based on initial elastic modulus of flax FRPs are presented in the figure. The initial slope of
the load-deflection curve is also used to predict the stiffness of the test specimens, which is
discussed at the end of this section. As shown in Figure 8(a), the predicted strain of the top skin
(in compression) deviated from experimental strain at higher loads. This means that the top
skin of the specimen experienced more strain than that of the model. Lower modulus of FRP
skin in compression than that of in tension and/or a slight indentation of top skin due to loading
rollers might be the source(s) of the deviation. The damage behavior of composite materials in
compression is more complicated than that of in tension. There is a possibility of micro
Page 22 of 42
buckling of fibers in compression and premature buckling of unsupported or poorly supported
skin due to improper bond to the honeycomb core. More in-depth analysis is needed to capture
the actual compressive strain of the top skin and determine the location of actual neutral axis
consequently. This is beyond of the scope of the current paper and needs to be investigated in
the future. As shown in Figure 8(b), the load-deflection curve obtained from the non-linear
model is slightly stiffer than that of the experimental at higher loads. This might be related to
the assumption of symmetric strain profile with respect to the centroidal axis of the sandwich
cross-section.
Foam-Filled Hollow
(a)
(b)
Figure 8. Perfomance of the analytical model predicting (a) load-strain and (b) load-
deflection of test specimens groups F25-300 and H25-300.
4.1.3. Discussions
Page 23 of 42
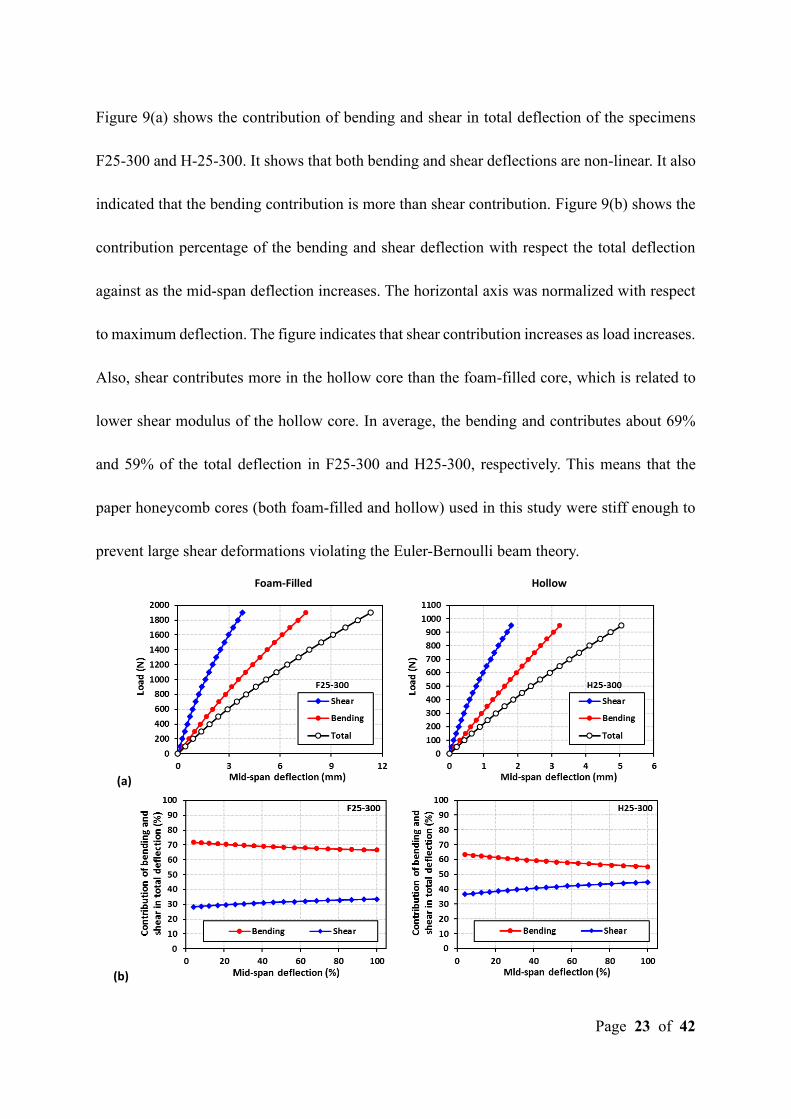
Figure 9(a) shows the contribution of bending and shear in total deflection of the specimens
F25-300 and H-25-300. It shows that both bending and shear deflections are non-linear. It also
indicated that the bending contribution is more than shear contribution. Figure 9(b) shows the
contribution percentage of the bending and shear deflection with respect the total deflection
against as the mid-span deflection increases. The horizontal axis was normalized with respect
to maximum deflection. The figure indicates that shear contribution increases as load increases.
Also, shear contributes more in the hollow core than the foam-filled core, which is related to
lower shear modulus of the hollow core. In average, the bending and contributes about 69%
and 59% of the total deflection in F25-300 and H25-300, respectively. This means that the
paper honeycomb cores (both foam-filled and hollow) used in this study were stiff enough to
prevent large shear deformations violating the Euler-Bernoulli beam theory.
Foam-Filled Hollow
(a)
(b)
Page 24 of 42
Figure 9. Contribution of bending and shear in total deflection of test specimens
groups F25-300 and H25-300: (a) load vs. deflection and (b) persentage of contribution
vs. percentage of maximum deflection.
It should be noted that sandwich composites with a soft core and stiff skins behave
differently and they must be analyzed with a high-order sandwich composite theory
[53][54][55] rather than the classical theories. The second author’s group previously developed
an analytical model [23] based on the non-proportional deformation of a soft core and stiff
skins to determine the level of partial composite action due to a non-proportional strain
distribution in the core and the skins. The model was applied to the sandwich beam specimens
tested in this study and it was shown that if the shear modulus of the paper honeycomb was
0.96 MPa (instead of 19.6 MPa for the hollow core and 26.2 MPa for the foam-filled core), the
degree of the partial composite action for the F25-300 and H25-300 specimens would be 95%.
In order to achieve the same level of the partial composite action (i.e. 95%), the shear modulus
of the 12 mm and 6 mm thick cores must be 1.31 MPa and 1.76 MPa, respectively. As the shear
modulus of the cores used in this study were well above theses limits, the authors are confident
that the use of the Euler-Bernoulli beam theory is justified.
In the experimental study, only load, displacement, and normal strains were measured and
reported. Normal stress in the skins and shear stress and strain in the core can be obtained based
on the nonlinear analytical model at any given load. For example, at the average experimental
peak load of 1600 kN for the F25-300 specimens, the normal stress and strain of the tensile
skin at the mid-span are calculated 137 MPa and 0.010 mm/mm, respectively. The
Page 25 of 42
corresponding shear stress and strain at shear span are calculated 0.55 MPa and 0.024 mm/mm.
The calculation can be done for other specimens and implemented in a parametric study for a
broad range of geometrical and materials parameters.
4.2. Peak Load
In order to calculate the peak load of each specimen identifying the peak point of the load-
strain and load-deflection curves obtained from the non-linear analytical model, three major
failure modes are considered for the foam-filled specimens, namely: core shear, tensile rupture,
and wrinkling failures. For the hollow core specimens, in addition to the wrinkling failure of
the compressive skin, the dimpling or local buckling of the compressive skin surrounded with
the hollow hexagonal core cell is also considered. The peak load of each specimen
corresponding to each failure mode was calculated by the following equations obtained from
the literature [56][57]:
𝑃𝐶𝑆 =2𝜏𝑐𝑏𝑐
√(𝑎𝐸𝑐2𝑡𝐸𝑓
)2 + 1
(10)
𝑃𝑇𝑅 = 𝜎𝑓𝑢2𝑏𝑡𝑑
𝑎 (11)
𝑃𝑊𝑅 = 0.56𝐸𝑓1/3𝐸𝑐
2/3 2𝑏𝑡𝑑
𝑎 (12)
𝑃𝐷𝑀 =2𝐸𝑓
1 − 𝜈𝑓2 (𝑡
𝑠)2 2𝑏𝑡𝑑
𝑎
(13)
where PCS is the core shear (CS) failure load, PTR is the skin tension rupture (TR) failure load,
PWR is the skin wrinkling (WR) failure load, and PDM is the skin dimpling (DM) failure load.
In addition, b is the width of sandwich specimen, c is the core thickness, t is the skin thickness,
Page 26 of 42
d is the distance between the skins’ centers, a is shear span, and s is the size of the core cell in
the direction of the skin’s compressive stress. Also, Ef is the initial elastic modulus of skin, Ec
is the initial elastic modulus of core, σfu is the tensile strength of skin, τc is the shear strength
of core, and νf is the initial Poisson’s ratio of skin. The minimum value of the loads calculated
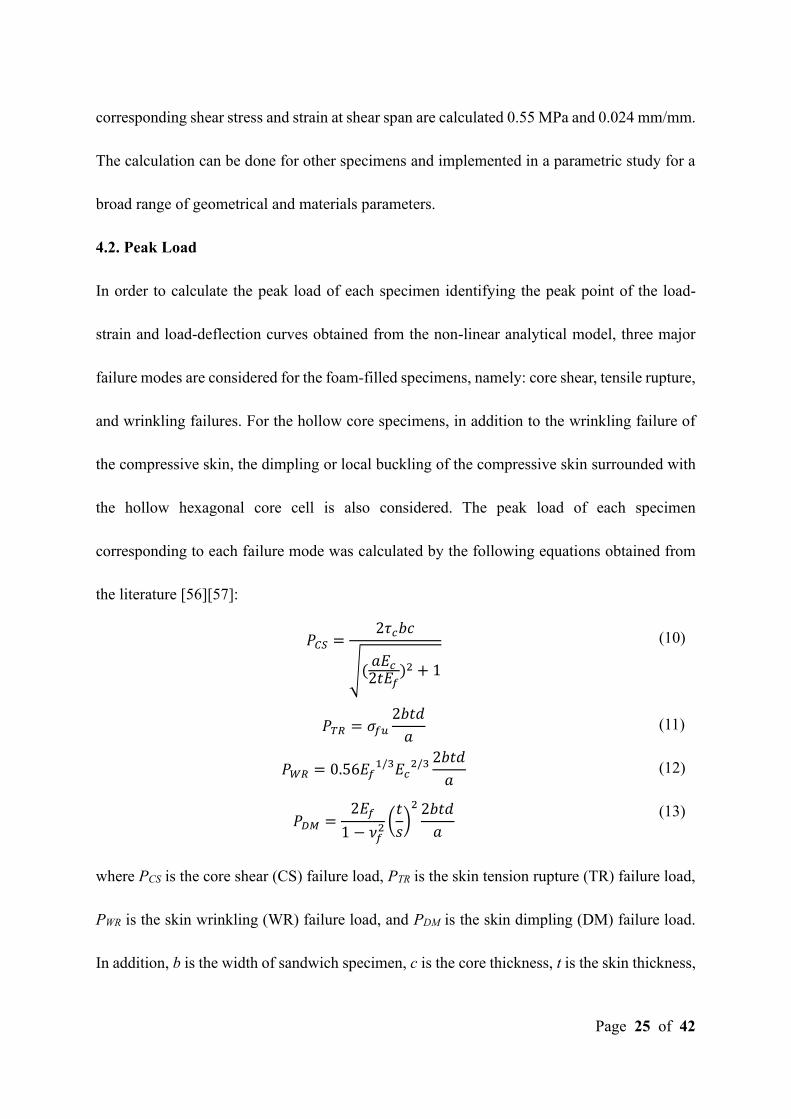
from the equations is taken as the peak load. The theoretical peak load and actual peak load
obtained from the experimental program are compared in Figure 10.
Figure 10. Comparison of peak load of model and test.
The error bars show one standard deviation above and below the average experimental
value based on three identical specimens. The theoretical peak load of each group was obtained
based on the average dimensions of three identical specimens. For specimens with the same
type of core, higher peak loads were obtained along with the thicker core applied, and the
model and test results were concordant with each other. For the comparison between the
specimens with the same thickness of the cores, the model calculation results show that the
peak loads of the foam-filled core specimens were higher than that of the hollow core
specimens. The test to model ratio of each group was also calculated with an average value of
Page 27 of 42
0.84 indicating the model over-predicted the peak load of the test specimens. It should be
highlighted that the peak load equations were obtained from the literature and this study does
not propose new equations. The overprediction of the peak load might be related to the
complicated behavior of the honeycomb cells interaction with the filling foam and non-linear
flax FRP skins. As the peak load equations were initially developed for conventional skin
materials such as metallic and synthetic composite materials, the equations might need to be
modified after an advanced simulation of the system in the future.
4.3. Initial Stiffness
The initial flexural stiffness K was also calculated based on Equation (1) considering both
bending and shear deformations. The theoretical initial flexural stiffness D was calculated by
Equation (7), and the theoretical initial shear stiffness U was calculated by Equation (9). The
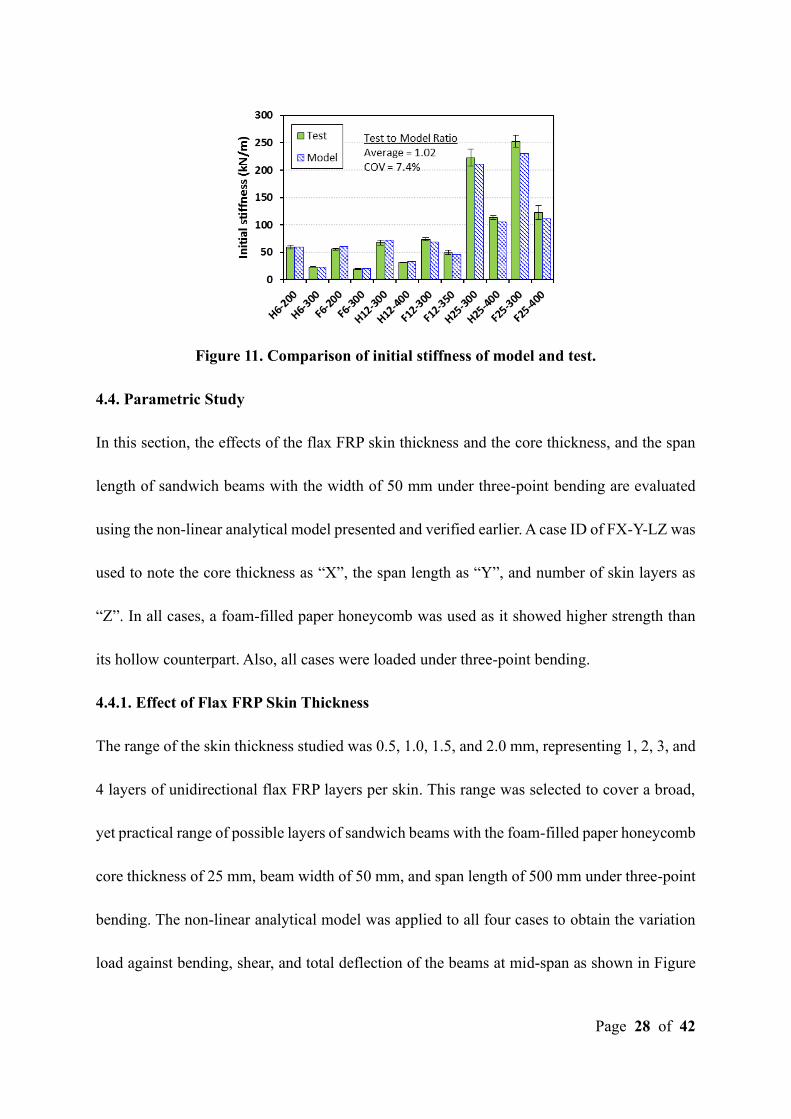
theoretical flexural stiffness K are compared with experimental values in Figure 11. As shown,
the specimens gained higher initial stiffness when thicker core was applied. For comparison
between the specimens with the same thickness of core, the difference between their initial
stiffness were not obviously observed. Besides, it can be observed that the model calculation
usually underestimated the initial stiffness of specimens slightly. The test to model ratio of each
group was also calculated with an average value of 1.02 indicating the model slightly under-
predicted the initial stiffness of the test specimens. The slight underprediction of stiffness by
the model might be related to the shear modulus of the core materials. It is recommended to
implement an advanced simulation for the paper honeycomb cores to have a better
understanding of their shear behavior.
Page 28 of 42
Figure 11. Comparison of initial stiffness of model and test.
4.4. Parametric Study
In this section, the effects of the flax FRP skin thickness and the core thickness, and the span
length of sandwich beams with the width of 50 mm under three-point bending are evaluated
using the non-linear analytical model presented and verified earlier. A case ID of FX-Y-LZ was
used to note the core thickness as “X”, the span length as “Y”, and number of skin layers as
“Z”. In all cases, a foam-filled paper honeycomb was used as it showed higher strength than
its hollow counterpart. Also, all cases were loaded under three-point bending.
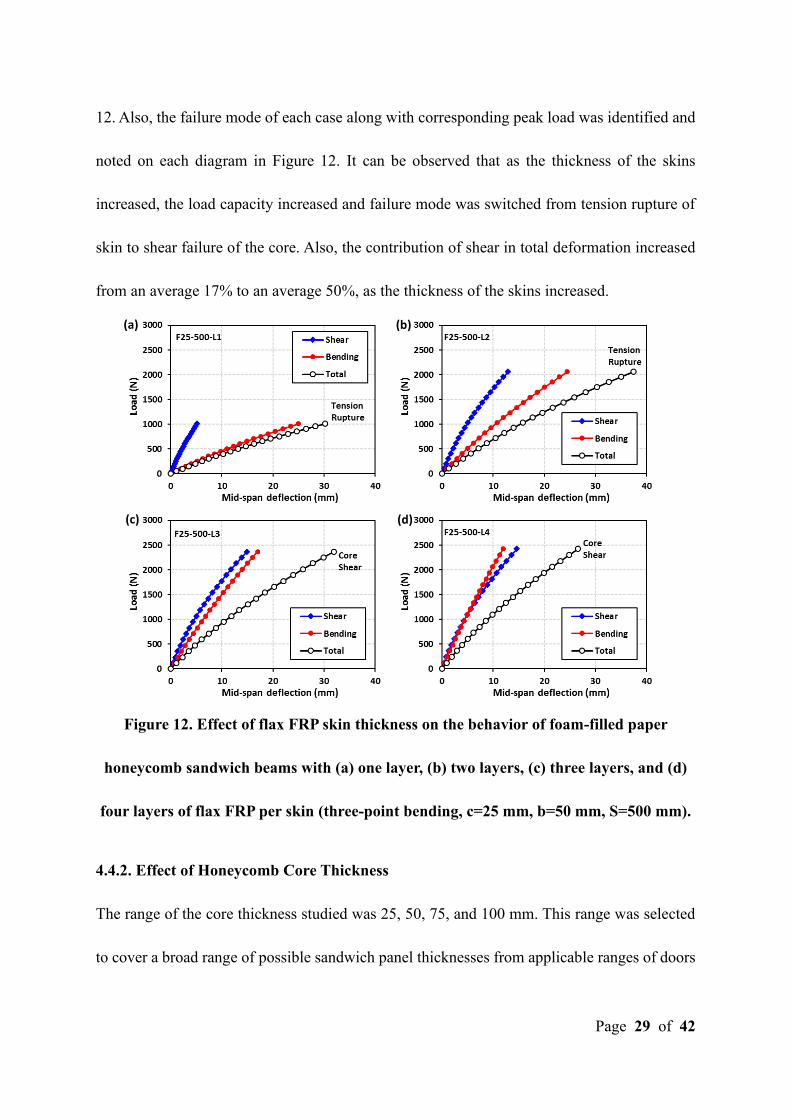
4.4.1. Effect of Flax FRP Skin Thickness
The range of the skin thickness studied was 0.5, 1.0, 1.5, and 2.0 mm, representing 1, 2, 3, and
4 layers of unidirectional flax FRP layers per skin. This range was selected to cover a broad,
yet practical range of possible layers of sandwich beams with the foam-filled paper honeycomb
core thickness of 25 mm, beam width of 50 mm, and span length of 500 mm under three-point
bending. The non-linear analytical model was applied to all four cases to obtain the variation
load against bending, shear, and total deflection of the beams at mid-span as shown in Figure
Page 29 of 42
12. Also, the failure mode of each case along with corresponding peak load was identified and
noted on each diagram in Figure 12. It can be observed that as the thickness of the skins
increased, the load capacity increased and failure mode was switched from tension rupture of
skin to shear failure of the core. Also, the contribution of shear in total deformation increased
from an average 17% to an average 50%, as the thickness of the skins increased.
Figure 12. Effect of flax FRP skin thickness on the behavior of foam-filled paper
honeycomb sandwich beams with (a) one layer, (b) two layers, (c) three layers, and (d)
four layers of flax FRP per skin (three-point bending, c=25 mm, b=50 mm, S=500 mm).
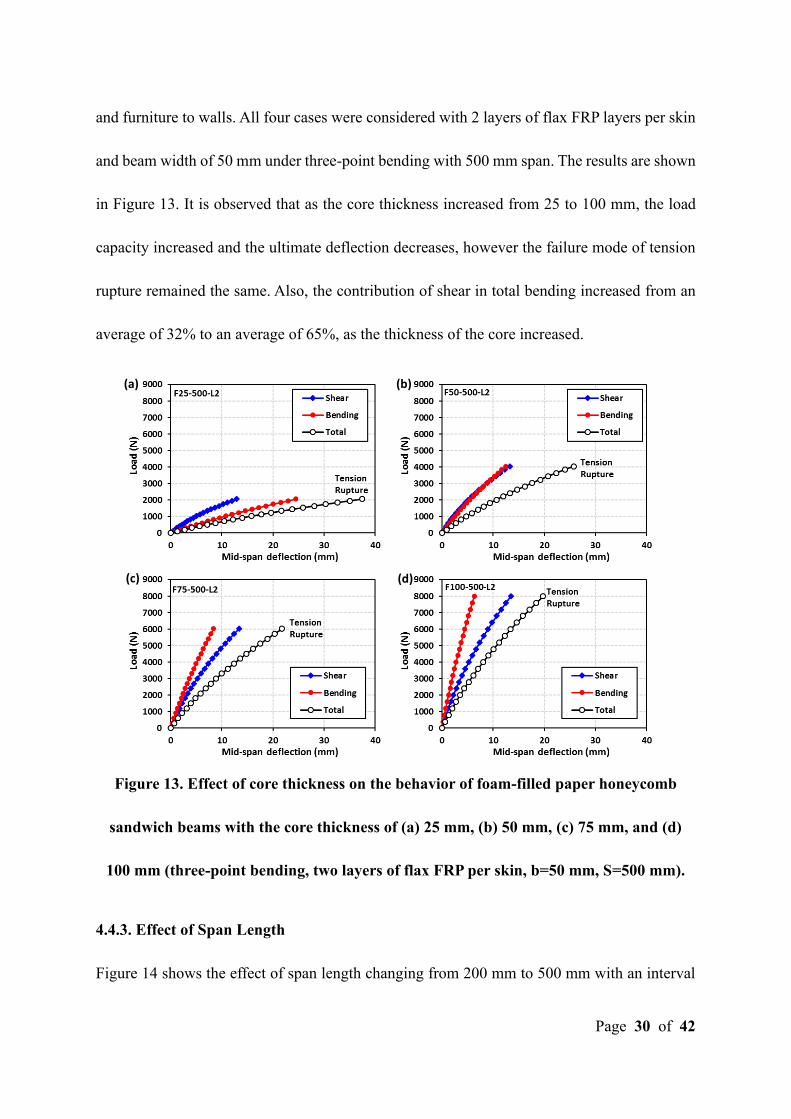
4.4.2. Effect of Honeycomb Core Thickness
The range of the core thickness studied was 25, 50, 75, and 100 mm. This range was selected
to cover a broad range of possible sandwich panel thicknesses from applicable ranges of doors
(a) (b)
(c) (d)
Page 30 of 42
and furniture to walls. All four cases were considered with 2 layers of flax FRP layers per skin
and beam width of 50 mm under three-point bending with 500 mm span. The results are shown
in Figure 13. It is observed that as the core thickness increased from 25 to 100 mm, the load
capacity increased and the ultimate deflection decreases, however the failure mode of tension
rupture remained the same. Also, the contribution of shear in total bending increased from an
average of 32% to an average of 65%, as the thickness of the core increased.
Figure 13. Effect of core thickness on the behavior of foam-filled paper honeycomb
sandwich beams with the core thickness of (a) 25 mm, (b) 50 mm, (c) 75 mm, and (d)
100 mm (three-point bending, two layers of flax FRP per skin, b=50 mm, S=500 mm).
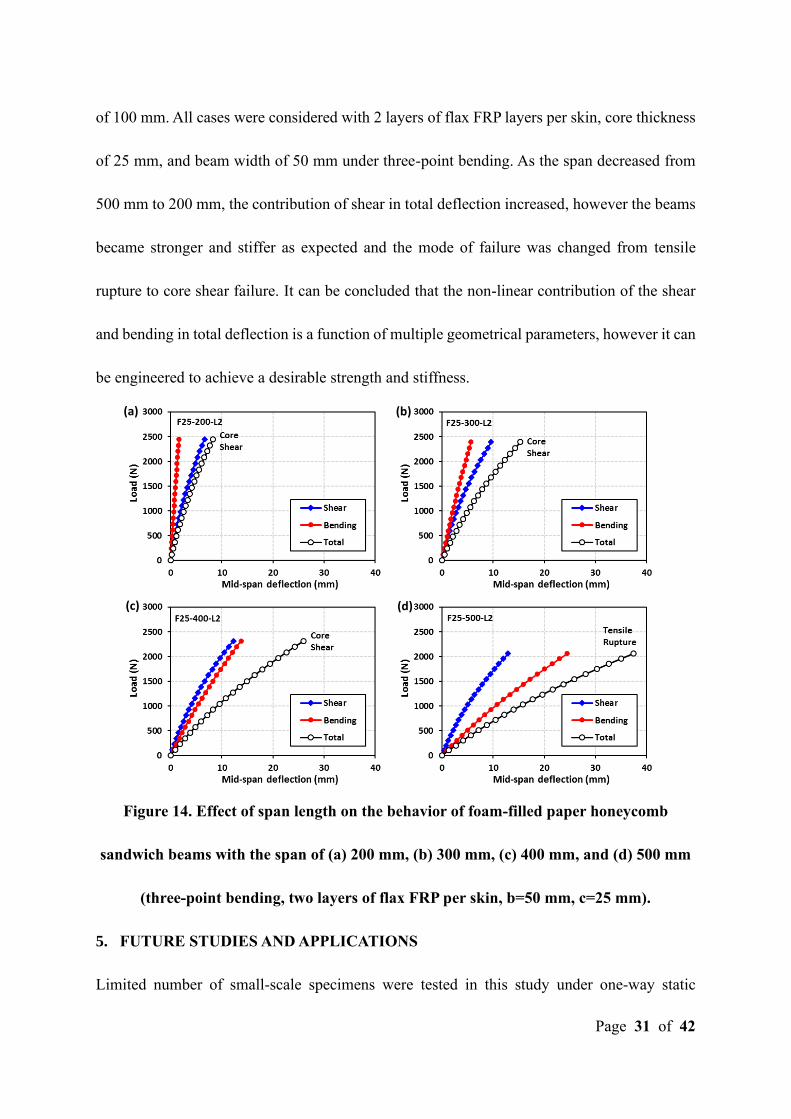
4.4.3. Effect of Span Length
Figure 14 shows the effect of span length changing from 200 mm to 500 mm with an interval
(a) (b)
(c) (d)
Page 31 of 42
of 100 mm. All cases were considered with 2 layers of flax FRP layers per skin, core thickness
of 25 mm, and beam width of 50 mm under three-point bending. As the span decreased from
500 mm to 200 mm, the contribution of shear in total deflection increased, however the beams
became stronger and stiffer as expected and the mode of failure was changed from tensile
rupture to core shear failure. It can be concluded that the non-linear contribution of the shear
and bending in total deflection is a function of multiple geometrical parameters, however it can
be engineered to achieve a desirable strength and stiffness.
Figure 14. Effect of span length on the behavior of foam-filled paper honeycomb
sandwich beams with the span of (a) 200 mm, (b) 300 mm, (c) 400 mm, and (d) 500 mm
(three-point bending, two layers of flax FRP per skin, b=50 mm, c=25 mm).
5. FUTURE STUDIES AND APPLICATIONS
Limited number of small-scale specimens were tested in this study under one-way static
(a) (b)
(c) (d)
Page 32 of 42
loading. Future studies may include testing more specimens to have a better confidence in
terms of mode of failure. Also, large-scale panels made of bidirectional flax fabrics for the
skins to be tested under two-way bending considering the effect of the bending and shear in a
three-dimensional space. Moreover, the behavior of the bio-based sandwich panels needs to be
studies under long-term loading to consider the creep effect of the bio-based components.
Considering the effect of impact and cyclic loadings is also recommended to understand the
dynamic and fatigue behavior of the system. Using bio-based foams to fill the cells of the paper
honeycomb core is also encouraged to increase the bio content of the sandwich panels.
Implementing advanced simulations is also recommended to have more in-depth understanding
of the non-linearity of the bio-based skins interaction with paper honeycomb cores.
In terms of applications, the simplicity of the manufacturing process of paper honeycombs
and can support mass production of the sandwich system for a variety of building and
construction applications. The sustainability of products made of natural fibers can encourage
more building applications to receive higher LEED (Leadership in Energy and Environmental
Design) rating for green buildings. The bio-based sandwich panels studied in this research have
many potentials to be used as walls, floors, and roofs in buildings, however more in-depth
research is needed to understand the long-term performance of the materials. Until the
availability of enough evidence verifying required long-term performance, the bio-based
panels might be considered for less sensitive applications for non-structural and semi-structural
components such as interior walls, doors, furniture, etc. in buildings considering required fire
safety requirements.
Page 33 of 42
6. CONCLUSIONS
The focus of this study was on the experimental behavior of sandwich composites made of bio-
based components (i.e. flax FRP skins and paper honeycomb cores). The failure modes, load-
deflection behavior, load-strain behavior, and moment-curvature behavior of the sandwich
beam specimens were studied to evaluate the mechanical behavior of the sandwich composites.
The flexural and shear stiffness of the specimens were obtained based on the moment-curvature
and an ASTM method. The effect of the non-linearity of the skins and core on the behavior of
the sandwich specimens was also evaluated. A non-linear analytical model was developed to
predict the load-strain and load-deflection behavior of the test specimens. After verification, a
parametric study was conducted to evaluate the effects of different geometrical parameters on
the behavior of the bio-based sandwich composites. The following conclusion can be found:
• Majority of the specimens with hollow honeycomb cores were prematurely failed due to
the local buckling of the compression skin. However, foam-filled core specimens were able
to sustain higher loads achieving material failures such as skin tension rupture and core
shear failure. By using the foam-filled cores instead of the hollow cores, the load capacity
of the specimens with 12- and 25-mm thick core and span of 300 mm increased 49% and
83%, however it did not change the load capacity of 6-m thick cores. The foam filling did
not affect the bending stiffness of the specimens with identical core thickness.
• Filling the paper honeycomb cells with the foam increased the bulk density of the cores
from 40 kg/m3 to 114 kg/m3. In return, it increased the shear modulus of the cores from an
average of 19.6 MPa to 26.2 MPa. Moreover, it significantly changed the failure mode and
Page 34 of 42
load capacity of majority of the specimens based on the lateral support provided by the
filling foam for the core cells and compressive skin.
• The load-deflection and load strain diagrams of the test specimens showed a non-linear
behavior due to the non-linearity of flax FRP skins in tension and compression plus the
nonlinearity of the paper honeycomb cores under shear.
• An analytical non-linear model based on the non-linearity of both the skins and the core
was developed to predict the load-strain and load-deflection behavior of the test specimens.
The model predicted the non-linear behavior of the test specimens with a relatively good
agreement. The model needs to be refined to mimic the behavior of the compressive skin
more accurately.
• A parametric study was performed on different geometrical parameters of the sandwich
beams. It was shown that the thickness of both the core and skins can be engineered to
achieve desirable strength and stiffness.
• Future studies may include large-scale sandwich panels made of bidirectional flax fabrics
to be tested under two-way bending under short- and long-term loadings to evaluate the
impact, dynamic, fatigue, and durability of the bio-based sandwich panels.
7. ACKNOWLEDGEMENTS
The authors of this paper would like to acknowledge the efforts of the technicians at Dalhousie
University’s Civil and Resource Engineering Department, Jesse Keane and Jordan Maerz, who
helped immensely with the setup, instrumentation and testing process. In addition, the authors
would like to acknowledge PhD student, Dillon Betts, who helped with fabrication and data
Page 35 of 42
processing.
8. REFERENCE
[1] Hazizan, M. A., & Cantwell, W. J. (2003). The low velocity impact response of an
aluminium honeycomb sandwich structure. Composites Part B: Engineering, 34(8), 679-
687.
[2] Foo, C. C., Chai, G. B., & Seah, L. K. (2006). Quasi-static and low-velocity impact failure
of aluminium honeycomb sandwich panels. Proceedings of the Institution of Mechanical
Engineers, Part L: Journal of Materials: Design and Applications, 220(2), 53-66.
[3] Crupi, V., Kara, E., Epasto, G., Guglielmino, E., & Aykul, H. (2018). Theoretical and
experimental analysis for the impact response of glass fibre reinforced aluminium
honeycomb sandwiches. Journal of Sandwich Structures & Materials, 20(1), 42-69.
[4] He, W., Yao, L., Meng, X., Sun, G., Xie, D., & Liu, J. (2019). Effect of structural
parameters on low-velocity impact behavior of aluminum honeycomb sandwich structures
with CFRP face sheets. Thin-Walled Structures, 137, 411-432.
[5] Sun, G., Zhang, J., Li, S., Fang, J., Wang, E., & Li, Q. (2019). Dynamic response of
sandwich panel with hierarchical honeycomb cores subject to blast loading. Thin-Walled
Structures, 142, 499-515.
[6] Zinno, A., Prota, A., Di Maio, E., and Bakis, C. E. (2011). Experimental characterization
of phenolic-impregnated honeycomb sandwich structures for transportation vehicles.
Composite structures, 93(11), 2910-2924.
[7] Bakis, C.E., Bank, L.C., Brown, V., Cosenza, E., Davalos, J.F., Lesko, J.J., Machida, A.,
Page 36 of 42
Rizkalla, S.H. and Triantafillou, T.C. (2002). Fiber-reinforced polymer composites for
construction—State-of-the-art review. Journal of composites for construction, 6(2), 73-87.
[8] Manalo, A., Aravinthan, T., Fam, A., and Bemokrane, B. (2017). State-of-the-art review
on FRP sandwich systems for lightweight civil infrastructure. Journal of Composites for
Construction, 21(1), 04016068.
[9] Shan, C., and Yi, Y. (2017). An experimental and numerical study on the behavior of a
continuous orthotropic bridge deck with sandwich construction. Thin-Walled Structures,
111, 138-144.
[10] Dweib, M. A., Hu, B., O’donnell, A., Shenton, H. W., and Wool, R. P. (2004). All natural
composite sandwich beams for structural applications. Composite structures, 63(2), 147-
157.
[11] Betts, D., Sadeghian, P. (2018). Experimental Behavior and Design-Oriented Analysis of
Sandwich Beams with Bio-based Composite Facings and Foam Cores. Journal of
Composites for construction, 22(4), 04018020.
[12] CoDyre, L., Mak, K., and Fam, A. (2018). Flexural and axial behaviour of sandwich panels
with bio-based flax fibre-reinforced polymer skins and various foam core densities.
Journal of Sandwich Structures and Materials, 20(5), 595-616.
[13] Wroblewski, L., Hristozov, D., and Sadeghian, P. (2016). Durability of bond between
concrete beams and FRP composites made of flax and glass fibers. Construction and
Building Materials, 126, 800-811.
[14] Shah, D. U., Schubel, P. J., and Clifford, M. J. (2013). Can flax replace E-glass in structural
Page 37 of 42
composites? A small wind turbine blade case study. Composites Part B: Engineering, 52,
172-181.
[15] Baiardo, M., Zini, E., and Scandola, M. (2004). Flax fibre–polyester composites.
Composites Part A: Applied Science and Manufacturing, 35(6), 703-710.
[16] Mohanty, A.K., Misra, M., and Drzal, L.T. (2002). Sustainable bio-composites from
renewable resources: opportunities and challenges in the green materials world. Journal
of Polymers and the Environment, 10(1-2), 19-26.
[17] Liu, Z., Erhan, S.Z., Akin, D.E., and Barton, F.E. (2006). “Green” composites from
renewable resources: preparation of epoxidized soybean oil and flax fiber composites.
Journal of agricultural and food chemistry, 54(6), 2134-2137.
[18] Fam, A., Eldridge, A., and Misra, M. (2014). Mechanical characteristics of glass fibre
reinforced polymer made of furfuryl alcohol bio-resin. Materials and structures, 47(7),
1195-1204.
[19] Belingardi, G., Cavatorta, M.P., and Duella, R. (2003). Material characterization of a
composite–foam sandwich for the front structure of a high speed train. Composite
structures, 61(1-2), 13-25.
[20] Fam, A., and Sharaf, T. (2010). Flexural performance of sandwich panels comprising
polyurethane core and GFRP skins and ribs of various configurations. Composite
Structures, 92(12), 2927-2935.
[21] Dharmasena, K. P., Wadley, H. N., Xue, Z., & Hutchinson, J. W. (2008). Mechanical
response of metallic honeycomb sandwich panel structures to high-intensity dynamic
Page 38 of 42
loading. International Journal of Impact Engineering, 35(9), 1063-1074.
[22] Aktay, L., Johnson, A. F., and Kröplin, B. H. (2008). Numerical modelling of honeycomb
core crush behaviour. Engineering Fracture Mechanics, 75(9), 2616-2630.
[23] McCracken, A., and Sadeghian, P. (2018). Partial-composite behavior of sandwich beams
composed of fiberglass facesheets and woven fabric core. Thin-Walled Structures, 131,
805-815.
[24] Ude, A. U., Ariffin, A. K., and Azhari, C. H. (2013). Impact damage characteristics in
reinforced woven natural silk/epoxy composite face-sheet and sandwich foam, coremat
and honeycomb materials. International Journal of Impact Engineering, 58, 31-38.
[25] Feraboli, P., and Masini, A. (2004). Development of carbon/epoxy structural components
for a high performance vehicle. Composites Part B: Engineering, 35(4), 323-330.
[26] Sadeghian, P., Hristozov, D, and Wroblewski, L. (2016). Experimental and analytical
behavior of sandwich composite beams: Comparison of natural and synthetic materials.
Journal of Sandwich Structures and Materials. Journal of Sandwich Structure and
Materials, 20(3), 287 – 307.
[27] Dong, Dahai, Qingguo, and Shaoqing. (2014). An approach on identification of equivalent
properties of honeycomb core using experimental modal data. Finite Elements in Analysis
and Design, 90(C), 84-92
[28] Vaidya, U., Kamath, M., Mahfuz, H., and Jeelani, S. (1998). Low Velocity Impact
Response of Resin Infusion Molded Foam Filled Honeycomb Sandwich Composites.
Journal of Reinforced Plastics and Composites, 17(9), 819-849.
Page 39 of 42
[29] Burlayenko, V. N., and Sadowski, T. (2009). Analysis of structural performance of
sandwich plates with foam-filled aluminum hexagonal honeycomb core. Computational
Materials Science, 45(3), 658-662.
[30] Mozafari, H., Khatami, S., Molatefi, H., Crupi, V., Epasto, G., and Guglielmino, E. (2016).
Finite element analysis of foam-filled honeycomb structures under impact loading and
crashworthiness design. International journal of crashworthiness, 21(2), 148-160.
[31] Zhang, P., Cheng, Y., Liu, J., Li, Y., Zhang, C., Hou, H., & Wang, C. (2016). Experimental
study on the dynamic response of foam-filled corrugated core sandwich panels subjected
to air blast loading. Composites Part B: Engineering, 105, 67-81.
[32] Zhang, Y., Liu, Q., He, Z., Zong, Z., & Fang, J. (2019). Dynamic impact response of
aluminum honeycombs filled with Expanded Polypropylene foam. Composites Part B:
Engineering, 156, 17-27.
[33] Jayaram, R. S., Nagarajan, V. A., & Vinod Kumar, K. P. (2019). Compression and low
velocity impact response of sandwich panels with polyester pin-reinforced foam filled
honeycomb core. Journal of Sandwich Structures & Materials, 21(6), 2014-2030.
[34] Wang, D. (2009). Impact behavior and energy absorption of paper honeycomb sandwich
panels. International Journal of Impact Engineering, 36(1), 110-114.
[35] Dongmei, W. (2009). Cushioning properties of multi-layer corrugated sandwich structures.
Journal of Sandwich Structures and Materials, 11(1), 57-66.
[36] Chen, Z., and Yan, N. (2012). Investigation of elastic moduli of Kraft paper honeycomb
core sandwich panels. Composites Part B: Engineering, 43(5), 2107-2114.
Page 40 of 42
[37] Sypeck, D. J. (2005). Cellular truss core sandwich structures. Applied Composite
Materials, 12(3-4), 229-246.
[38] Aboura, Z., Talbi, N., Allaoui, S., and Benzeggagh, M. L. (2004). Elastic behavior of
corrugated cardboard: experiments and modeling. Composite structures, 63(1), 53-62.
[39] McCracken, A., and Sadeghian, P. (2018). Corrugated cardboard core sandwich beams
with bio-based flax fiber composite skins. Journal of Building Engineering, 20, 114-122.
[40] Betts, D., Sadeghian, P., & Fam, A. (2020). Structural Behavior of Sandwich Beams with
Flax Fiber–Reinforced Polymer Faces and Cardboard Cores under Monotonic and Impact
Loads. Journal of Architectural Engineering, 26(2), 04020013.
[41] Wang, D. M., Wang, Z. W., and Liao, Q. H. (2009). Energy absorption diagrams of paper
honeycomb sandwich structures. Packaging Technology and Science: An International
Journal, 22(2), 63-67.
[42] Castro, O., Silva, J. M., Devezas, T., Silva, A., & Gil, L. (2010). Cork agglomerates as an
ideal core material in lightweight structures. Materials & Design, 31(1), 425-432.
[43] Lakreb, N., Bezzazi, B., and Pereira, H. (2015). Mechanical behavior of multilayered
sandwich panels of wood veneer and a core of cork agglomerates. Materials and Design
(1980-2015), 65, 627-636.
[44] Walsh, J., Kim, H. I., and Suhr, J. (2017). Low velocity impact resistance and energy
absorption of environmentally friendly expanded cork core-carbon fiber sandwich
composites. Composites Part A: Applied Science and Manufacturing, 101, 290-296.
[45] Dweib, M. A., Hu, B., O’donnell, A., Shenton, H. W., and Wool, R. P. (2004). All natural
Page 41 of 42
composite sandwich beams for structural applications. Composite structures, 63(2), 147-
157.
[46] Stocchi, A., Colabella, L., Cisilino, A., and Álvarez, V. (2014). Manufacturing and testing
of a sandwich panel honeycomb core reinforced with natural-fiber fabrics. Materials and
Design, 55, 394-403.
[47] Du, Y., Yan, N., and Kortschot, M. T. (2013). An experimental study of creep behavior of
lightweight natural fiber-reinforced polymer composite/honeycomb core sandwich panels.
Composite Structures, 106, 160-166.
[48] Mak, K., Fam, A., and MacDougall, C. (2015). Flexural behavior of sandwich panels with
bio-FRP skins made of flax fibers and epoxidized pine-oil resin. Journal of Composites
for Construction, 19(6), 04015005.
[49] Betts D, Sadeghian P, Fam A. Tensile Properties of Flax FRP Composites. In 6th Asia-
Pacific Conference on FRP in Structures (APFIS 2017) 2017 Jul 19. 6th Asia-Pacific
Conference on FRP in Structures, Singapore.
[50] Palomba, G., Crupi, V., & Epasto, G. (2019). Collapse modes of aluminium honeycomb
sandwich structures under fatigue bending loading. Thin-Walled Structures, 145, 106363.
[51] ASTM D7250. Standard practice for determining sandwich beam flexural and shear
stiffness. West Conshohocken, PA, USA.
[52] Betts, D., Sadeghian, P. and Fam, A. (2019). “Experiments and analysis of the impact
behavior of sandwich panels constructed with flax fibre-reinforced polymer faces and
foam cores.” Journal of Sandwich Structures and Materials, SAGE, DOI:
Page 42 of 42
https://doi.org/10.1177/1099636220925073.
[53] Frostig, Y., Baruch, M., Vilnay, O., and Sheinman, I. (1992). High-order theory for
sandwich-beam behavior with transversely flexible core. Journal of Engineering
Mechanics, 118(5), 1026-1043.
[54] Salami, S. J., Sadighi, M., and Shakeri, M. (2015). Improved high order analysis of
sandwich beams by considering a bilinear elasto-plastic behavior of core: an analytical
and experimental investigation. International Journal of Mechanical Sciences, 93, 270-
289.
[55] Sokolinsky, V. S., Shen, H., Vaikhanski, L., & Nutt, S. R. (2003). Experimental and
analytical study of nonlinear bending response of sandwich beams. Composite Structures,
60(2), 219-229.
[56] Triantafillou, T.C. and Gibson, L.J. (1987). Failure mode maps for foam-core sandwich
beams. U.S. Army Construction Engineering Research Lab.
[57] Ley, R.P., Lin, W. and Mbanefo, U. (1999). Facesheet Wrinkling in Sandwich Structures.
Northrop Grumman Corporation, El Segundo, California, USA.
View publication statsView publication stats


![No free lunch with the sandwich [sandwich estimator]](https://img.dokumen.tips/doc/110x75/6348f90b7442d262850f4be4/no-free-lunch-with-the-sandwich-sandwich-estimator.jpg)


