Embed Size (px)
Citation preview

b
on. Therentithout
Physics Letters B 625 (2005) 19–25
www.elsevier.com/locate/physlet
First storage of ultracold neutrons using foils coatedwith diamond-like carbon
F. Atchisona, T. Brysa, M. Dauma, P. Fierlingera,b, P. Geltenbortc, R. Hennecka,S. Heulea,b, M. Kasprzaka,d, K. Kirch a, A. Pichlmaiera,∗, C. Plonkac, U. Straumannb,
C. Wermelingera,e
a PSI, Paul Scherrer Institut, CH-5232 Villigen PSI, Switzerlandb Physik-Institut, Universität Zürich, Switzerlandc ILL, Institut Laue-Langevin, Grenoble, France
d SMI, Stefan-Meyer-Institut, Vienna, Austriae ETHZ, Eidgenössische Technische Hochschule Zürich, Switzerland
Received 7 July 2005; received in revised form 17 August 2005; accepted 17 August 2005
Available online 29 August 2005
Editor: D.F. Geesaman
Abstract
For the first time, ultracold neutrons have been stored in a volume formed of foils coated with diamond-like carbcoefficients for loss,η, and depolarization,β, per wall collision were determined simultaneously. The results for diffesamples,η ∼ 10−4 and β ∼ 10−5–10−6, are among the best values measured for high Fermi potential materials welaborate surface pre-treatment. Thin foil storage material will be widely applicable, e.g., in neutronβ-decay studies. 2005 Elsevier B.V. All rights reserved.
PACS: 28.20.-v; 29.25.Dz
Keywords: Ultra-cold neutrons; Diamond-like carbon; Ultracold neutron storage; Anomalous ultracold neutron losses
n,tra-can
310
re
Vu-eu-befum
At PSI, the Paul Scherrer Institute in VilligeSwitzerland, we are building a new and intense ulcold neutron (UCN) source; a detailed description
* Corresponding author. Tel.: +41 56 310 3596; fax: +41 563294.
E-mail address: [email protected](A. Pichlmaier).
0370-2693/$ – see front matter 2005 Elsevier B.V. All rights reserveddoi:10.1016/j.physletb.2005.08.066
be found in Ref.[1]. In this new source, neutrons aproduced by spallation in a lead target[2,3] with theexisting 1.2 MW proton beam from the PSI 590 Mecyclotron. After thermalization in heavy water, netrons are cooled further in a superthermal solid dterium converter at 5–8 K. The UCN produced willstored in a volume of 2–3 m3 coated with a material ohigh Fermi potential, which determines the maxim
.

20 F. Atchison et al. / Physics Letters B 625 (2005) 19–25
h auntof
sier.ble
ed
als ased
ed.eirsing
eV
-ion
ngsc-
of
ingur-spo-
c-
e,
gythe
s
.e.,ighctr
ob-deedigi-.g.,
vebili-a-
iesons:g atm-cedon-he
energy of neutrons that can be totally reflected. Witstorage volume formed of thin coated foils, the amoof active material is reduced, making the handlingthis rather bulky source component somewhat eaSpecial interest in thin foils comes also from possiapplications in neutron decay experiments.
The material with the highest Fermi potential usfor UCN is 58Ni, Vf = 346 neV [4]. Other materi-als with highVf are beryllium and BeO (∼ 260 neV).While 58Ni is predominantly used to obtain maximUCN transmission in neutron guides, its usefulnesa coating material for UCN storage volumes is limitby its thermal absorption cross section of 4.6 barn[5].For UCN storage, beryllium and BeO have been usThese materials, however, are highly toxic and thapplication suffers from the lack of coating facilitiefor large storage vessels. A novel and very promisalternative is diamond-like carbon (DLC)[6,7]. TheFermi potentials of diamond and graphite are 305 nand 195 neV, respectively. DLC with 60% sp3 (dia-mond) bonds would haveVf ≈ 260 neV. Recent experimental comparisons of the neutron transmissthrough beryllium and DLC coated foils[8] as wellas neutron reflectivity measurements of DLC coati[9] showed only very small differences in the refletion properties of beryllium and DLC.
The Fermi potential is complex,Vf = V − iW ,whereV andW depend on the nuclear propertiesthe surface atoms[4,10]:
(1)V = 2πh2
mNb, W = h
2Nσv.
Here m denotes the neutron mass,N the scatteringcentre density,b the bound coherent nuclear scatterlength,σ the loss cross section per atom of the sface material andv the neutron velocity. For neutronreflecting at a material surface the real part of thetential,V , sets the critical velocity,vc = √
2V/m, fortotal reflection and the imaginary part,W , determinesthe reflection loss[10]. The loss rate, 1/τµ, originat-ing from wall interactions for UCN of one specifikinetic energy,Ek, i.e., without the influence of external fields, is given by
(2)1
τµ
= µ(θ,Ek)ν(Ek),
whereµ(θ,Ek) is the wall-loss probability per bouncθ is the angle of incidence andν(Ek) the frequency of
wall collisions, which depends on the kinetic enerof the neutrons and the geometrical buckling ofstorage volume.
ForW � V , which is valid for almost all materialuseful for UCN storage, the reflection coefficient,R,can be calculated from
|R|2 = 1− µ(θ,Ek)
(3)= 1− 2η
(Ek cos2 θ
V − Ek cos2 θ
)1/2
, Ek � V,
where[10]
η = W
V= σmv
4πhb.
Sinceσ is proportional to 1/v, the parameterη is inde-pendent of neutron energy.
Experimentally one measures an average ofµ(θ,
Ek) over angle,µ(Ek), which is given by[10]:
µ(Ek) = 2
1∫0
µ(θ,Ek)cosθ d(cosθ)
= 2η
[V
Eksin−1
(Ek
V
)1/2
−(
V
Ek− 1
)1/2],
(4)Ek � V.
For materials suitable for UCN storage bottles, imaterials with low absorption cross section and hFermi potential such as beryllium and DLC, direevaluation of Eq.(4) yields loss probabilities pebounce of less than 3× 10⁻⁷ at temperatures of 80 Kor below. However, measured values of the loss prability are found to be about two orders of magnituhigher[11]. This long standing discrepancy is term‘anomalous losses’ and the evidence is that it ornates from impurities and surface contamination (ehydrogen)[12].
In order to test materials for UCN storage, we haset up a novel apparatus to measure the probaties per wall collision for UCN loss and depolariztion simultaneously[13]. Of particular significance isthat, for the first time, these two material propertare measured for exactly the same sample conditimoving a sample to another apparatus or measurina different time may lead to significantly altered saple surface conditions. The probabilities are dedufrom measurements of the loss rate for neutrons cfined in a specially designed UCN storage bottle. T

F. Atchison et al. / Physics Letters B 625 (2005) 19–25 21
forromuide;ac-net
ac-old-ieldnsorold
.
ichumingCNisre-
gy
Theity,
avi-
redH-
ag-T,orcm
w-om
ale-thehed
n,me,heyntstedtor,
d inlost
eldthee
forwctor
or-nt,Af-offnd
ntsme
is
Fig. 1. Experimental apparatus for the investigation of materialsthe storage of ultracold neutrons. 1: Ni coated neutron guide fthe turbine; 2: beam line shutter; 3: stainless steel neutron g4: neutron switch; 5: detector; 6: vacuum pumping port; 7: vuum separation foil; 8: vertical neutron guide; 9: sample; 10: magyoke; 11: magnet coils with poles (horizontal); 12: insulation vuum; 13: vacuum pumping port; 14: sensor feedthroughs; 15: hing field coils; 16: vacuum separation membrane; 17: thermal sh(copper); 18: vacuum pump; 19: clean sample vacuum; 20: sefeedthrough; 21: flexible thermal copper connections; 22: 10 K cstage; 23: 70 K stage; 24: vibration decoupling; 25: cryo-cooler
arrangement of the apparatus is shown inFig. 1 anddescribed in detail in Ref.[13].
The main component is the storage bottle, whconsists of a vertical tube mounted inside a vacuchamber, with its inner surface the material betested, open at the top and bottom and with the Uconfined at the bottom by a magnetic field. With thdesign, the sample surface is the only materialflector for stored UCN. Neutrons with kinetic enerEk � EB = 1.91µNB = (60 neV/T)B, with µN thenuclear magneton, can be reflected by the field.length of the tube is set so that, because of grav
UCN up to this energy cannot reach the top (the grtational potential of UCN is 102 neV/m). The vacuumchamber and tube are mounted in a vertical shaft bothrough the centre of the yoke and pole pieces of antype dipole magnet with an air gap of 3 cm. The mnetic field at the bottom of the UCN bottle is 1.52allowing storage of UCN of energy up to 91 neV fone neutron spin orientation. Tubes of length 108and with cross sectional areas in the range from∼ 30to ∼ 50 cm2 were used.
The measurements are carried out in the folloing way: ultracold neutrons enter the apparatus frthe right through a shutter (2,Fig. 1) and a feedingguide (3,Fig. 1). With the UCN switch (4,Fig. 1) inthe filling position, UCN are reflected into the verticneutron guide (8,Fig. 1) and reach the sample volum(9,Fig. 1). After about 15 s of filling, equilibrium neutron density in the sample volume is reached andmagnetic field is turned on to confine the UCN. Tshutter (2,Fig. 1) is closed to improve the backgrounsuppression.
At the time when the magnetic field is switched othere are three sorts of neutrons in the storage volu(i) those with magnetic moment antiparallel to tmagnetic fieldB with Ek � EB , which are reflected bthe magnetic shutter, (ii) those with magnetic momeparallel to the magnetic field, which are accelerathrough the magnetic shutter and fall into the detecand (iii) those with energiesEk > EB , which penetratethe magnetic field barrier and thus cannot be storethe apparatus. The non-confineable neutrons areover a period of about 100 s after the magnetic fiis switched on. The time to remove neutrons withwrong spin orientation or too ‘high’ energy from thstorage volume is termed ‘spectral cleaning’.
After spectral cleaning, the neutrons are storeda holding time,ti , which ranges from 20 up to a fehundred seconds. Neutrons which reach the deteduring this period,Nsp, come from wall interactions inwhich the spin of the neutron has flipped. (This is croborated by obtaining the same spin flip coefficieβ, using a complimentary technique: see below.)ter the holding time, the magnetic field is switchedand the remaining neutrons fall into the detector aare counted asNi . From the measured neutron couat different holding times we obtain the storage ticonstantτst, see below. The data taking procedureillustrated inFig. 2.
22 F. Atchison et al. / Physics Letters B 625 (2005) 19–25
an-g
m-
sgys-gin-in
/orgli-
out
ntoil,befoil
tion.alsolu-rtz
wases
relike
te
tione-
r-y
ergycy
ee-
lts
ty,eri-
ctsrob-
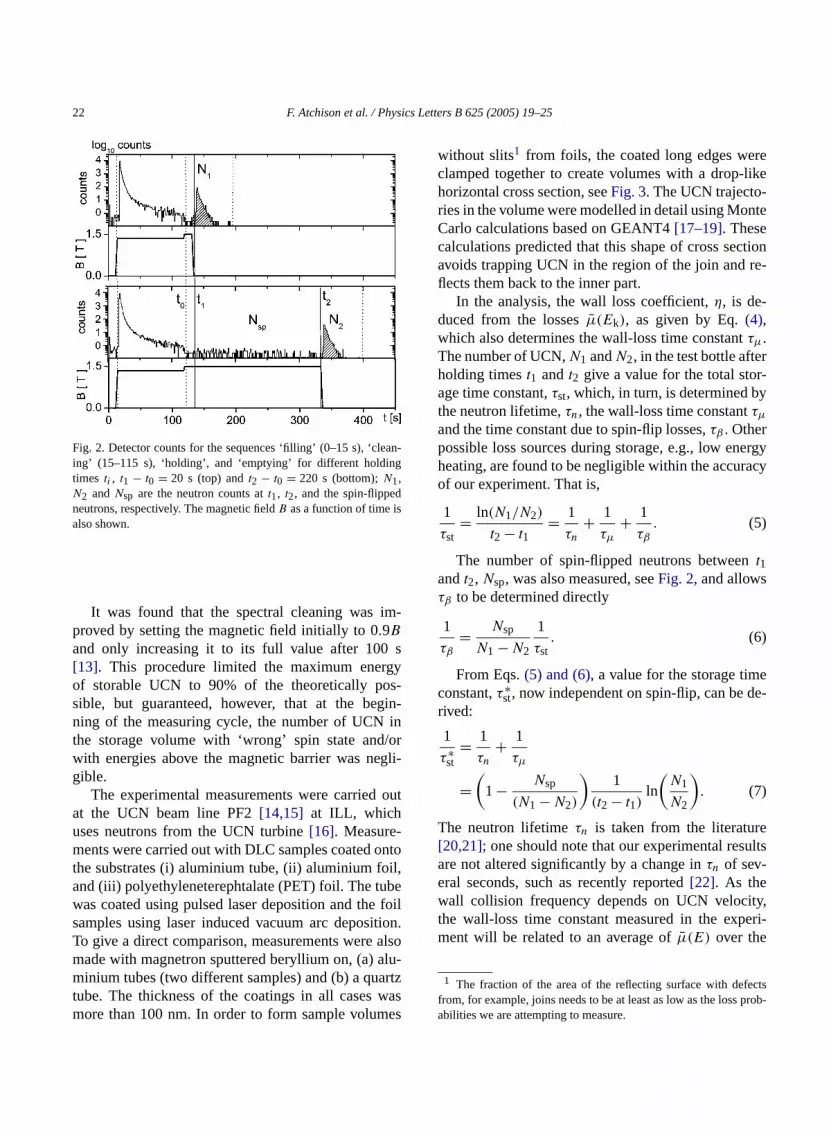
Fig. 2. Detector counts for the sequences ‘filling’ (0–15 s), ‘cleing’ (15–115 s), ‘holding’, and ‘emptying’ for different holdintimes ti , t1 − t0 = 20 s (top) andt2 − t0 = 220 s (bottom);N1,N2 andNsp are the neutron counts att1, t2, and the spin-flippedneutrons, respectively. The magnetic fieldB as a function of time isalso shown.
It was found that the spectral cleaning was iproved by setting the magnetic field initially to 0.9B
and only increasing it to its full value after 100[13]. This procedure limited the maximum enerof storable UCN to 90% of the theoretically posible, but guaranteed, however, that at the bening of the measuring cycle, the number of UCNthe storage volume with ‘wrong’ spin state andwith energies above the magnetic barrier was negible.
The experimental measurements were carriedat the UCN beam line PF2[14,15] at ILL, whichuses neutrons from the UCN turbine[16]. Measure-ments were carried out with DLC samples coated othe substrates (i) aluminium tube, (ii) aluminium foand (iii) polyethyleneterephtalate (PET) foil. The tuwas coated using pulsed laser deposition and thesamples using laser induced vacuum arc deposiTo give a direct comparison, measurements weremade with magnetron sputtered beryllium on, (a) aminium tubes (two different samples) and (b) a quatube. The thickness of the coatings in all casesmore than 100 nm. In order to form sample volum
without slits1 from foils, the coated long edges weclamped together to create volumes with a drop-horizontal cross section, seeFig. 3. The UCN trajecto-ries in the volume were modelled in detail using MonCarlo calculations based on GEANT4[17–19]. Thesecalculations predicted that this shape of cross secavoids trapping UCN in the region of the join and rflects them back to the inner part.
In the analysis, the wall loss coefficient,η, is de-duced from the lossesµ(Ek), as given by Eq.(4),which also determines the wall-loss time constantτµ.The number of UCN,N1 andN2, in the test bottle afteholding timest1 andt2 give a value for the total storage time constant,τst, which, in turn, is determined bthe neutron lifetime,τn, the wall-loss time constantτµ
and the time constant due to spin-flip losses,τβ . Otherpossible loss sources during storage, e.g., low enheating, are found to be negligible within the accuraof our experiment. That is,
(5)1
τst= ln(N1/N2)
t2 − t1= 1
τn
+ 1
τµ
+ 1
τβ
.
The number of spin-flipped neutrons betweent1andt2, Nsp, was also measured, seeFig. 2, and allowsτβ to be determined directly
(6)1
τβ
= Nsp
N1 − N2
1
τst.
From Eqs.(5) and (6), a value for the storage timconstant,τ ∗
st, now independent on spin-flip, can be drived:
1
τ ∗st
= 1
τn
+ 1
τµ
(7)=(
1− Nsp
(N1 − N2)
)1
(t2 − t1)ln
(N1
N2
).
The neutron lifetimeτn is taken from the literature[20,21]; one should note that our experimental resuare not altered significantly by a change inτn of sev-eral seconds, such as recently reported[22]. As thewall collision frequency depends on UCN velocithe wall-loss time constant measured in the expment will be related to an average ofµ(E) over the
1 The fraction of the area of the reflecting surface with defefrom, for example, joins needs to be at least as low as the loss pabilities we are attempting to measure.

F. Atchison et al. / Physics Letters B 625 (2005) 19–25 23
umlcu-
ron
er-
eri-
ysee
phof
er
oillev-see
.5re
al-f
l for
mDLCionsK).
etic
7.5ersde-o
ns
ta-for an.ally
lts
Fig. 3. Schematic view of the foil sample volume in the vacuchamber. The lines correspond to UCN tracks in the sample calated by means of the Monte Carlo code GEANT4[18] extended forUCN [17]. The diameter of the vacuum chamber was 70 mm.
UCN spectrum and height in the bottle. For a neutof energy,E = Ek + Epot, whereEpot is the potentialenergy due to gravity and the magnetic field, the avage wall-loss time constant,τµ, for a vertical region ofheightH (cf. Eq.(2)) is given by
(8)1
τµ
(E) =H∫
0
µ(h,E)dν
dh(h,E)dh.
The wall-loss time constant measured in the expment is obtained by integrating Eq.(8) over the UCNenergy spectrum:
1
τµ
= 1
τ ∗st
− 1
τn
(9)=∫ E
0
∫ H
0 g(E′)µ(h,E′) dνdh
(h,E′) dhdE′∫ E
0 g(E′) dE′ .
The UCN energy distributiong(E) was measured bvarying the magnetic field as mentioned above (also Ref.[13]).
Values of η have been extracted using a graof τ ∗
st = F(η) calculated by numerical integrationEq. (9). The function is shown inFig. 4. The inte-grals in Eq.(9) were replaced by a double sum ov
Fig. 4. Calibration curves for the storage time constantτ∗st as a func-
tion of the loss coefficientη as free parameter, here for the PET fcoated with DLC. The numbers 1–5 correspond to the energyels from the magnetic field values, 37.5 neV (1) to 81.8 neV (5),text.
height and energy with bin widths of 1 cm and 2neV, respectively. The wall collision distributions weobtained by Monte Carlo simulations[17,19,23] inwhich the detailed magnetic field distribution, the vues ofµ(h,E) from Eq.(4) using a suitable range oη values as free parameter and a Fermi potentiaDLC of 260 neV[8,9]2 were taken into account.
Results were taken for holding times ranging fro20 to several hundred seconds, various samples (and Be on various substrates) and sample condit(at room temperature and, in some cases, at 70Also, the energy dependence ofµ(Ek) was measuredby making measurements at five different magnfield settings corresponding to maximum energiesE
of 81.8 neV, 75.3 neV, 67.1 neV, 56.2 neV and 3neV. Changing the magnetic field also slightly altthe shape of the energy distribution. This effect,scribed in detail in Refs.[19,23], has been taken intaccount in the analysis. The values ofτst, τ ∗
st andη ob-tained for the nine sample plus condition combinatiomeasured are listed inTable 1.
The uncertainties in our results come from the stistical error of the measurements and an estimatesystematic contribution from the spectral distributioThe neutron counts per measurement were typic200� N1 � 400 and 100� N2 � 200, depending on
2 A change ofVf of up to 20 neV does not change the resusignificantly.

24 F. Atchison et al. / Physics Letters B 625 (2005) 19–25
Theses
mes.185 mm
Table 1Measured loss coefficientsη and spin flip coefficientsβ . The values are averaged over the measurements with five different energy bins.single measurements agree with each other very well, confirming the energy independence ofη, see also[19,23]. We used Be coated Al tubefrom two different producers. The horizontal cross sections of the samples were 38.5 cm2 for the Al tubes, 33.2 cm2 for the quartz tube, 27 cm2
for the PET foil and 23 cm2 for the Al foil volume. The averaged wall collision frequencies (at maximum magnetic field) in the foil voluwere 49 Hz (aluminium), 47 Hz (PET), 30 Hz for the Al-tubes and 34 Hz for quartz tube. The thicknesses of the substrate foils were 0(PET) and 0.1 mm (Al)
Coating Substrate T
[K]τst[s]
τ∗st
[s]η
[10−4]β(I)[10−6]
β(II)[10−6]
DLC Al foil 70 221 ± 14 225± 14 1.7± 0.1 2.2± 1.5 0.7± 0.3DLC Al foil 300 119± 2 121± 2 3.5± 0.1 1.3± 1.1 0.7± 0.2DLC PET foil 70 348± 59 428± 59 0.7± 0.1 15.8± 1.0 15.2± 1.2DLC PET foil 300 211± 15 232± 15 1.6± 0.1 15.2± 1.2 14.1± 1.6DLC Al tube 300 157± 6 161± 6 5.8± 0.3 8.5± 4.2 10.9± 0.3Be quartz 300 133± 4 140± 4 5.0± 0.1 12.4± 3.8 9.5± 0.6Be Al tube 300 200± 11 207± 11 4.2± 0.3 11.3± 13.2 12.3± 0.4Be Al tube 380 176± 11 181± 11 5.0± 0.4 11.1± 6.7 9.2± 2.3Be Al tube 300 138± 5 141± 5 6.8± 0.3 9.0± 0.7 7.8± 0.4
ea-
-
hatonter-dif-es
redndi-once,re,rK,s at
pin-
le
-ure-ld
-d inticinsr-
rrierrgyall
reher
ugh
ithbed
in-
Cd.ch-ed
sample, sample geometry and temperature. A msured background rate,Nbg = (4.8 ± 0.3) mHz, hasbeen taken into account.
Our values ofη at 300 K for beryllium range from4.2 × 10−4 to 6.8 × 10⁻⁴ in agreement with the literature values (1.1 × 10⁻⁴ to 4.3 × 10⁻⁴ [4]). Atroom temperature the values for DLC are somewlower than those for beryllium but show a variatiof about a factor of 3 depending on substrate maial and coating method. The actual cause of theferences is currently not known, but probably arisfrom surface contamination[12,24]. Due to the limitedtime for data taking, all the samples were measuas delivered, i.e., without any elaborate surface cotioning. It is well known, however, that the lossesberyllium are decreased considerably by, for instanbaking at 620 K in a helium or deuterium atmospheη(10 K) = 3 × 10⁻⁵ [11]. The loss coefficients foDLC reduce by about a factor of 2 on cooling to 70as is expected from the reduced number of phononlower wall temperatures[4,25]. To our knowledge, novalues for the loss coefficientη for DLC coatings havebeen reported so far.
The depolarization coefficients per wall bounce,β,have been extracted from the measured rate of sflipping:
(10)dNsp
dt= N(t)νβ,
whereN(t) is the number of neutrons in the sampvolume at timet andβ is given by
(11)β =E∫
0
Nsp(E′)g(E′)
τst(E′)ν(E′)(N1(E′) − N2(E′))dE′.
In this caseν(E) is the wall collision frequency averaged over the surface of the sample wall. Measments were carried out with different magnetic fielevels in order to investigate whetherβ is energy-dependent: no dependence was found.
The depolarization coefficient,β, was also measured using a second and complementary methowhich the sample volume is filled with the magnefield switched on. In this case, only neutrons with spanti-parallel to the magnetic field or with kinetic enegies higher than 90 neV can pass the magnetic baand enter the storage volume. Neutrons with enelower than the magnetic field barrier that make a wcollision with a spin flip within the sample volume areflected by the magnetic field and trapped. The higenergy neutrons are either lost from the top or throthe magnetic field. This method gave values forβ gen-erally more accurate and in excellent agreement wthose from the first method. The method is descriin detail in Refs.[19,23]. The spin flip probabilitiesper wall bounce and their one-σ uncertainties for thedifferent samples obtained with both methods, arecluded inTable 1.
The significant difference between the two DLon aluminium (foil vs. tube) results is not understooThe two samples were produced using different teniques, vacuum arc deposition for the foil and puls

F. Atchison et al. / Physics Letters B 625 (2005) 19–25 25
er-bleofopy,of
e
rage;
fu-the-rstmat-
N.nns,
e.ex-
ce,ilsonwge-
thisd to
SI.at
irra-
atortnkrte-,
dl-lly,ulzürer-
2,
39
rd. 5,
ys.
29
5)
6;
eu-
, in
A
06
sity
, in
laser deposition for the tube. This can lead to diffent surface conditions, which might be responsifor the two different results. Further investigationsthe surfaces with secondary ion mass spectroscetc., might contribute to an improved understandingthese effects.
In conclusion, we have determined for the first timthe wall loss coefficient,η, for UCN on diamond-likecarbon. The results demonstrate that DLC has stoproperties for UCN very similar to those for berylliumDLC is therefore a promising candidate for use inture UCN sources and experiments. Furthermore,wall loss coefficient,η, and the depolarization coefficient, β, were measured simultaneously for the fitime and determined for DLC and beryllium. Frothe results we conclude that DLC is also a good coing material for experiments involving polarized UCWe find thatη is about a factor of 2 lower at 70 K thaat room temperature, in agreement with expectatiobut that theβ values do not vary with temperaturWithin the experimental accuracy, we confirm thepected energy independence ofη. Theβ values werealso found to be energy-independent.
Besides their application in the new UCN sourstorage volumes formed from thin material focoated with DLC may be useful in various neutrdecay experiments. Thin foil UCN bottles may allodetection of the decay electrons outside the storavolume and hence a large detector solid angle;would lead to better background suppression anreduction of systematic uncertainties.
Acknowledgements
The experiment was designed and built at PWe thank the members of the various workshopsPSI, especially M. Müller and U. Bugmann, for theoutstanding work in fabrication of the many appatus components. The data acquisition took placeILL, Grenoble. We acknowledge the great suppof Th. Brenner and the ILL reactor crew. We thaYu. Pokotilovskiy and V. Ignatovich from JINR fofruitful discussions and interest. We are very graful to I. Altarev, TU Munich, M. Lasakov, PNPI
M. Makela and R.B. Vogelaar from Virginia Tech, anA.R. Young from NCSU, who performed the berylium and DLC coatings for the tube samples. Finawe acknowledge the kind cooperation of H. Schand B. Schultrich from the Fraunhofer-Institut fWerkstoff- und Strahlentechnik, IWS, Dresden, Gmany, in producing the DLC coatings on foils.
References
[1] http://ucn.web.psi.ch/.[2] M. Wohlmuther, G. Heidenreich, PSI report TM 85-05-0
2005.[3] F. Atchison, et al., Nucl. Instrum. Methods Phys. Res. A 5
(2005) 646.[4] V.K. Ignatovich, The Physics of Ultracold Neutrons, Oxfo
Series of Neutron Scattering in Condensed Matter, volClarendon Press, Oxford, 1990.
[5] V.F. Sears, Neutron News 3 (3) (1992) 29.[6] M.G.D. van der Grinten, et al., Nucl. Instrum. Methods Ph
Res. A 423 (1999) 421.[7] Y. Kawabata, et al., Nucl. Instrum. Methods Phys. Res. A 5
(2004) 84.[8] B. Blau, et al., PSI Scientific Report 2004/Volume I (200
137;B. Blau, et al., in preparation.
[9] T. Brys, et al., PSI Scientific Report 2004/Volume I (2005) 14T. Brys, et al., in preparation.
[10] R. Golub, D.J. Richardson, S.K. Lamoreaux, Ultra-Cold Ntrons, Adam Hilger, Bristol, 1991.
[11] V.P. Alfimenkov, et al., JETP Lett. 55 (1992) 84.[12] E. Korobkina, et al., Phys. Rev. B 70 (2004) 35409.[13] T. Brys, et al., Nucl. Instrum. Methods Phys. Res. A (2005)
press.[14] ILL Yellow Book, www.ill.fr/YellowBook/PF2/.[15] W. Drexel, Neutron News 1 (1990) 23.[16] A. Steyerl, et al., Phys. Lett. A 116 (1986) 347.[17] F. Atchison, et al., Nucl. Instrum. Methods Phys. Res.
(2005), in press.[18] S. Agostinelli, et al., Nucl. Instrum. Methods Phys. Res. A 5
(2003) 250.[19] P. Fierlinger, PhD Thesis, Physics Department, Univer
Zürich, Switzerland, 2005.[20] Particle Data Group, Phys. Lett. B 592 (2004) 862.[21] S. Arzumanov, et al., Phys. Lett. B 483 (2000) 15.[22] A. Serebrov, et al., Phys. Lett. B 605 (2005) 72.[23] T. Brys, et al., in preparation.[24] T. Brys, et al., Nucl. Instrum. Methods Phys. Res. A (2005)
press.[25] Yu.Yu. Kosvintsev, et al., JINR Preprint P3-80-91, 1980.


