Embed Size (px)
Citation preview
Ecological Monographs, 85(1), 2015, pp. 49–72� 2015 by the Ecological Society of America
Fire evolution in the radioactive forests of Ukraine and Belarus:future risks for the population and the environment
N. EVANGELIOU,1,13 Y. BALKANSKI,1 A. COZIC,1 W. M. HAO,2 F. MOUILLOT,3 K. THONICKE,4 R. PAUGAM,5 S. ZIBTSEV,6
T. A. MOUSSEAU,7 R. WANG,1,8 B. POULTER,1 A. PETKOV,2 C. YUE,1 P. CADULE,1 B. KOFFI,9 J. W. KAISER,5,10,11 AND
A. P. MøLLER12
1CEA-UVSQ-CNRS UMR 8212, Institut Pierre et Simon Laplace, Laboratoire des Sciences du Climat et de l’Environnement (LSCE),L’Orme des Merisiers, F-91191 Gif sur Yvette Cedex, France
2Missoula Fire Sciences Laboratory, Rocky Mountain Research Station Forest Service, Missoula, Montana 59808-9361 USA3CEFE UMR 5175, CNRS, Universite de Montpellier, Universite Paul-Valery Montpellier, EPHE-IRD, 1919 route de Mende,
34293 Montpellier Cedex 5, France4Potsdam Institute for Climate Impact Research (PIK), P.O. Box 60 12 03, 14412 Potsdam, Germany
5King’s College London, London, United Kingdom6National University of Life and Environmental Sciences of Ukraine, Kiev, Ukraine
7Department of Biological Sciences, University of South Carolina, Columbia, South Carolina 29208 USA8Laboratory for Earth Surface Processes, College of Urban and Environmental Sciences, Peking University, Beijing 100871 China
9European Commission, Joint Research Centre, Air and Climate Unit, Ispra, Italy10European Centre for Medium-range Weather Forecasts, Reading, United Kingdom
11Max-Planck-Institute fur Chemie, Mainz, Germany12Laboratoire d’Ecologie, Systematique et Evolution, CNRS UMR 8079, Universite Paris-Sud, Batiment 362, F-91405 Orsay Cedex,
France
Abstract. In this paper, we analyze the current and future status of forests in Ukraine andBelarus that were contaminated after the nuclear disaster in 1986. Using several models,together with remote-sensing data and observations, we studied how climate change in theseforests may affect fire regimes. We investigated the possibility of 137Cs displacement overEurope by studying previous fire events, and examined three fire scenarios that depended ondifferent emission altitudes of 137Cs, assuming that 10% of the forests were affected by fires.Field measurements and modeling simulations confirmed that numerous radioactivecontaminants are still present at these sites in extremely large quantities.
Forests in Eastern Europe are characterized by large, highly fire-prone patches that areconducive to the development of extreme crown fires. Since 1986, there has been a positivecorrelation between extreme fire events and drought in the two contaminated regions. Littercarbon storage in the area has doubled since 1986 due to increased tree mortality anddecreased decomposition rates; dead trees and accumulating litter in turn can provide fuel forwildfires that pose a high risk of redistributing radioactivity in future years. Intense fires in2002, 2008, and 2010 resulted in the displacement of 137Cs to the south; the cumulative amountof 137Cs re-deposited over Europe was equivalent to 8% of that deposited following the initialChernobyl disaster. However, a large amount of 137Cs still remains in these forests, whichcould be remobilized along with a large number of other dangerous, long-lived, refractoryradionuclides. We predict that an expanding flammable area associated with climate changewill lead to a high risk of radioactive contamination with characteristic fire peaks in the future.Current fire-fighting infrastructure in the region is inadequate due to understaffing and lack offunding. Our data yield the first cogent predictions for future fire incidents and providescientific insights that could inform and spur evidence-based policy decisions concerninghighly contaminated regions around the world, such as those of Chernobyl.
Key words: carbon stock; Cesium-137; Chernobyl; climate change; fire risk; litter; redistribution;wildfires.
INTRODUCTION
The April 1986 disaster at the Chernobyl Nuclear
Power Plant (ChNPP) in Ukraine (former Soviet Union)
resulted from a flawed Soviet reactor design and serious
mistakes made by the operators. The ChNPP complex,
consisting of four nuclear reactors, is located about 100
km north of Kiev, Ukraine, and about 20 km south of
the border with Belarus. Soviet officials began evacuat-
Manuscript received 26 June 2014; revised 29 August 2014;accepted 5 September 2014. Corresponding Editor: A. T.Classen.
13 Present address: NILU (Norsk institutt for luftforsk-ning), Instituttveien 18, 2007 Kjeller, Norway.E-mail: [email protected]
49
ing residents near the ChNPP 36 hours after the
explosion and by 1990, more than 350 000 people had
been displaced and resettled from the most severely
contaminated areas of Belarus, Russia, and Ukraine
(UNDP and UNICEF 2002). This left a 2600-km2 area,
now known as the Chernobyl Exclusion Zone (CEZ),
empty of humans. However, around 600 000 emergency
workers were drafted to clean up the contamination and
manage the remaining three reactors (the last of which
closed in December 2000) and large amounts of
contaminants still remain inside. North of the border
with Ukraine, Belarusian authorities created a similar
2200-km2 restricted zone.
Thousands of hectares of a largely rural area were
severely contaminated as a result of the accident. Forests
and fields were subjected to a dense cloud of radioactive
fallout that included 137Cs (half-life 30.2 years), 90Sr
(half-life 28.8 years), multiple isotopes of plutonium,
and other radionuclides (NEA 2002). Among the tasks
of the cleanup workers (known as ‘‘liquidators’’) were
felling, bulldozing, and burying all the trees in a 4 km
radius around the ChNPP. They also constructed a
series of dikes designed to prevent flooding into the
Pripyat River, and from there into the Dnieper River,
which flows through Kiev to the Black Sea. Most of the
contamination sank into benthic river and reservoir
sediments, where it is supposedly stable (IAEA 2006).
With no one to cut saplings and cultivate fields,
natural ecological succession has gradually transformed
the landscape. Forests that covered 53% of the area
before the disaster now cover more than 70% (IAEA
2001). Stands dominated by birches (Betula pendula) and
pines (Pinus sylvestris) have taken over pastures where
farmers formerly grew wheat and flax. Most pines
(which are more sensitive to radiation than birches;
Yoschenko et al. 2011) seem normal, although deformed
trees are common in contaminated areas and substantial
negative effects of radiation on tree growth have been
reported (e.g., Mousseau et al. 2013).
Radionuclides have migrated into the forest soil and,
for the most part, remain there. Studies have shown that
90% of 90Sr is located in the top 10 cm of the soil (IRL
2013), whereas Yablokov et al. (2009) reported that 80%of 137Cs remained in the top 5 cm in the area. As trees,
grasses, other plants, and fungi transpire (release water),
they draw water up from the roots. Water-soluble salts
of cesium and strontium are chemical analogues of
potassium and calcium, respectively, and are taken up in
place of these crucial nutrients. The leaves fall to the
ground in autumn, becoming part of the ‘‘litter’’ (the
abscised vegetation that covers the forest floor), thus
returning the radioactive salts to the top layer of the soil.
Without the presence of trees or other permanent
groundcover, contaminants would likely migrate out of
the soil by being dispersed in dust or carried by water.
People living just outside the exclusion zone, who
depend on forests for work, food, fuel, and other
resources, pay the cost for this environmental contam-
ination. Many continue to live in areas with 137Cs soil
concentrations greater than 37 kBq/m2. They also
continue to eat mushrooms, berries, and other local
forest foods, despite government restrictions and warn-
ings (NEA 2002). Mushrooms, which are highly prized
by local populations, absorb high concentrations of
radioactive cesium (Linkov et al. 2000). Although 137Cs
content in the majority of edible mushrooms decreased
by 20–30% between 2005 and 2010, fungal species whose
feeding networks (mycelia) reach deeper into the soil
showed substantial increases in the amount of 137Cs
during the same period as radionuclides migrated into
deeper soil layers (NRU 2011).
Chernobyl contamination is also affecting non-human
communities. Although it has been reported that the
absence of people has attracted a surprising amount of
wildlife, scientific surveys suggest that the populations of
many mammals and birds are not as diverse or abundant
as would have been expected in a region where there is
little pressure from human communities (Møller and
Mousseau 2013). Fewer mammals live and reproduce in
high-radiation areas than in less contaminated ones
(Møller and Mousseau 2013). Birds show reduced
longevity and male fertility, smaller brains, and
increased frequency of mutations that indicate signifi-
cant genetic damage (Møller et al. 2012). Likewise, some
bird populations in contaminated areas are only
sustained via immigration from adjacent uncontaminat-
ed regions (Møller et al. 2006).
Ukrainian law requires that the exclusion zone should
be managed as a barrier that fixes contamination
through natural processes; everything deposited in
1986 must stay within the guarded area. Prohibiting
residence and economic activities such as commercial
forestry helps keep contaminated materials inside the
zone. The effectiveness of such laws is often challenged,
however, since many trucks transporting large logs of
pine and other trees have been observed in CEZ during
the summer of 2013 (A. P. Møller, personal observa-
tions).
Proponents of extensive decontamination in Cher-
nobyl see many benefits beyond public safety including
(1) more productive timber plantations (thousands of
hectares were in need of thinning even before the
disaster); (2) jobs; and (3) a sustainable energy source
(if debris can be burned in biomass power plants). On
the other hand, uncontrolled burning of contaminated
wood may negate these putative benefits by spreading
contaminants far beyond their current locations. Trees
and other groundcover that are currently trapping
radionuclides may become more susceptible to fire.
The stands that now grow on approximately 1800 km2
are largely unmanaged. As trees mature and die and
more sunlight penetrates the canopy, brush and other
understory species are starting to grow. The Chernobyl
forests are thus developing ‘‘fuel ladders’’ of vegetation
that would enable a fire to climb into the tree canopy
and burgeon into a crown fire (Hao et al. 2009). A lack
N. EVANGELIOU ET AL.50 Ecological MonographsVol. 85, No. 1
of effective forest management, combined with a general
drying trend attributable to local climate change, could
lead to catastrophic fires more intense than those
already seen in Chernobyl.
When forests laden with radionucleotides burn, they
emit radioactive cesium, strontium, and plutonium in
respirable fine particles (Hao et al. 2009). Here, we use
the terms displacement or redistribution of 137Cs to
define the amount of 137Cs present in the vegetation,
soil, or litter, which would be emitted in the atmospheric
aerosol after a major fire. High-intensity crown fires in
Chernobyl would release large amounts of radionuclides
and transport these emissions hundreds to thousands of
kilometers to human population centers (Hao et al.
2009). Such contamination could trigger long-term,
economically damaging government restrictions on
contaminated milk, meat, and vegetables.
The Ukrainian government faces the challenge of
protecting its citizens, even as it strives to return
residents to the rural communities that would provide
them with clean water, food, firewood, and livelihoods.
Whether Ukraine opts for leaving forests to their slow
but natural recovery or attempts to decontaminate
them, local residents will inevitably be affected by
ongoing contamination. These effects may be exacer-
bated by the current political instability in Ukraine and
a reduction in the priority of forest management and
changes in fire fighting policy due to other governmental
activities. Therefore, the primary aim of present paper is
to alert the scientific community about how changes in
Chernobyl forests, accompanied by pronounced climatic
changes, could remobilize radioactivity. Another aim is
to provide scientific insights that could motivate and
inform evidenced-based policy decisions concerning
radioactively contaminated regions around the world.
In this paper, we explicitly investigate a number of
hypotheses to address the two aims listed in the previous
paragraph. We do so by focusing on two areas with the
highest deposition density after the Chernobyl accident,
namely (1) a region centered at the ChNPP between 298 E
to 318 E and 50.58 N to 528 N where deposition density
ranges from 40 tomore than 1480 kBq/m2 and (2) a highly
contaminated zone 50 km northeast of the NPP in Belarus
(30.58 E to 32.58 E and 528 N to 53.58 N). The
International Atomic Energy Agency (IAEA 2005, 2009)
defines any area with surface activity larger than 40 kBq/
m2 (for beta and gamma emitters) as contaminated. In a
first hypothesis, we test to what extent wildfires in
contaminated regions of Ukraine and Belarus result in
atmospheric transport and redeposition of radionuclides.
To this end, we analyze the wildfires of 2002, 2008, and
2010 in the contaminated regions of Ukraine and Belarus
and document the atmospheric transport and ‘‘new’’
deposition of 137Cs throughout Europe after its redistri-
bution by fires. Cesium-137 is among the most dangerous
radionuclides released after nuclear accidents, due to its
long half-life, the radiation type it emits during decay, and
its bioaccumulation by organisms (Woodhead 1973). The
second hypothesis posits that atmospheric transport of137Cs in smoke will depend on injection heights. The effect
of the injection height of 137Cs (present in smoke) on
atmospheric transport is determined by investigating three
fire scenarios that differ only by their injection heights.
The third hypothesis suggests that the frequency and
magnitude of fires will depend on the development of the
vegetation and climate change. To this end, we model the
occurrence of future fires (2010–2100) in the area,
incorporating several different models (e.g., for vegetation
and fire) and satellite data (e.g., MODIS) in order to
reduce uncertainty and to present realistic past, present
and future predictions of the hazards and risks from
radioactivity redistribution by wildfires. Based on our
findings, we recommend policy changes aimed at prevent-
ing further future contamination. To our knowledge, this
is the first paper in which the effects of climate change on
wildfires are studied in relation to radionuclide mobility.
DATABASES AND METHODOLOGY
Databases for climate model diagnosis
and inter-comparison
Temperature and precipitation fields in contaminated
areas of Chernobyl were taken from the Program for
Climate Model Diagnosis and Inter-comparison
(PCMDI) databases. PCMDI was established in 1989
at the Lawrence Livermore National Laboratory (USA)
and aims to develop tools for the diagnosis and inter-
comparison of general circulation models (GCMs) that
simulate global climate. The GCMs adopted here are
from the modeling groups of the Canadian Centre for
Climate Modeling and Analysis (CCCMA); the CSIRO
atmospheric research (CSIRO); the U.S. Department of
Commerce, NOAA, Geophysical Fluid Dynamics Labo-
ratory (GFDL); the NASA Goddard Institute for Space
Studies (GISS); the Institut Pierre et Simon Laplace
(IPSL); the Meteorological Institute of the University of
Bonn (MIUB); the Max Planck Institute for Meteorology
(MPI); the National Center for Atmospheric Research
(NCAR); and the Hadley Center for Climate Prediction
and Research, Met Office (UKMO).
Global Fire Emissions Database (GFED3) and
Standardized Precipitation–Evapotranspiration Index
(SPEI) database
Satellite data on fire activity and vegetation produc-
tivity were combined to estimate gridded burned area
and fire emissions. The GFED3 database (which
combines multiple satellite fire products for better
accuracy and longer time series [Giglio et al. 2010]),
was used to estimate burned area, because it constitutes
the current reference data set available for all over the
world (Mouillot et al. 2014; GFED3 database available
online).14 The database offers burned area for each 0.58
resolution pixel globally, on a monthly time step, and
the subsequent emissions due to biomass burning,
14 http://www.falw.vu/;gwerf/GFED/GFED3/emissions/
February 2015 51FIRE EVOLUTION IN RADIOACTIVE FORESTS
including carbon (CO, CO2), methane and non-methane
hydrocarbons, NOx, SO2, and particulate matter.
Emissions were based on a global estimation of fuel
biomass and moisture content simulated by the biogeo-
chemical model CASA (Potter et al. 1993), coupled with
a combustion module (Van der Werf et al. 2003), using
emissions factors from Akagi et al. (2011).
As fire-spread is the result of a combination between
fuel moisture, fuel amount, and landscape pattern (Cary
et al. 2006, Krawchuk and Moritz 2011), we investigated
the continental-scale fire regime as a response to
drought, tree cover, and forest patch presence. Drought
effects are apparent only after a long period with a
shortage of precipitation, making it very difficult to
objectively quantify the characteristics of drought
episodes in terms of their intensity, magnitude, duration,
and spatial extent. We selected SPEI as an integrative
drought index, which calculates normalized monthly
drought anomalies as the precipitation/potential evapo-
transpiration differences compared to the average
calculated over the whole time series. SPEI is expressed
according to the time frame and the month considered
for calculation and is available at a 0.58 resolution
globally for the period 1901 to the present (Vicente-
Serrano et al. 2012); for instance, we selected the SPEI03
for September corresponding to the integrated drought
index over the three months before September (sum-
mer). Statistical analysis for the temporal trend in the
SPEI03 was performed using the non-parametric Mann-
Kendall trend test using the Kendall R package and the
Tukey honestly significant difference (tukeyHSD func-
tion using R [R Development Core Team 2014]) for
comparing burned area distribution among SPEI03
drought classes.
Continental-scale fuel biomass and landscape struc-
ture were investigated from tree cover. Kempeneers et al.
(2011) provided data of different remote-sensing prod-
ucts to produce an accurate tree cover map at 1-km
resolution for Europe, including Ukraine and Belarus
(Appendix: Fig. A1) as a surrogate for the Corine Land
cover, from which Eastern Europe is not included.
Landscape indices of largest patch index (LPI) and
mean patch area (MPA) were calculated (Fragstats;
MacGarigal and Marks 1994) for each 0.58 cell over
Europe based on forest patch analysis derived from the
tree cover map reclassified into forest/non forest at a
50% tree cover threshold.
Moderate Resolution Imaging Spectroradiometer
(MODIS) area burned data
To document the multiple fires that occurred in the
two areas of interest, we used the MODIS direct
broadcast (DB) algorithm developed by Urbanski et
al. (2009), which combines active fire detection and burn
scar detections in single satellite scenes to map burned
areas with a nominal spatial and temporal resolution of
500 m and 1 day, respectively. The MODIS-DB
algorithm provides rapid mapping of burned areas and
enables production of a regional emission inventory
within 1 hour of the final (Aqua satellite), local MODIS
overpass. Although the algorithm was designed to
process DB data in near-real time, archived data were
used (Urbanski et al. 2011) to monitor the spatial and
temporal distribution of fires, smoke, vegetation, and
flooding in the two contaminated areas. The dates and
the spatial distribution of fires were determined from
MODIS active fires for the years 2002, 2008, and 2010.
For the three fire scenarios that assumed that 10% of the
contaminated area is burned (2010 scenario 6, 2010
scenario 7, and 2010 scenario 8), we kept the same
temporal pattern with the fires of 2010 in the area.
MODIS area burned (250 000 m2 per pixel) was
combined with 137Cs deposition densities (kBq/m2) and
the respective emission factors to estimate 137Cs
emission per pixel.
Biomass burning estimates using PKU-FUEL
Inventories of firewood and straw consumption in the
domestic sector, as well as agricultural solid waste
burning in the fields, were derived from PKU-FUEL
(Peking University Fuel Inventory) for the year 2007 at
0.18 3 0.18 resolution (Wang et al. 2013); the product
covers 36 European countries for the year 2007. The
same inventories for 1986 (0.183 0.18) data were derived
by scaling the gridded data with the ratio of national
consumptions between 1986 and 2007. Specifically, the
national consumption of firewood and agricultural solid
waste burning were collected from FAO (2013), and the
data on domestic straw consumption from IEA (2013).
The projections show the temporal change of firewood
and straw consumption in the area, as well as changes in
agricultural burning since the date of the accident.
Assumptions on the redistribution of 137Cs
Only four references were found in the relevant
literature and taken into consideration in order to define
the amount of 137Cs emitted after fires (hereafter,
emission factor). Yoschenko et al. (2006) used three
natural experimental sites in the CEZ. They measured
background radiation, soil, natural litter, and vegetation
and then estimated the budget, concluding that the
redistribution of 137Cs after fires was at least 4%. Amiro
et al. (1996) carried out experimental burning of straw,
pine, and Norway maple (Acer platanoides) recording
several physicochemical characteristics such as temper-
ature and moisture of the fuel. They concluded that the
redistribution of 137Cs is a highly variable process
depending on the fire temperature and the type of
vegetation in the fuel and may range from 20% to 100%.
Horrill et al. (1995) performed experimental burns of
heather (Calluna vulgaris) in an area of Scotland that
was intensely affected by the Chernobyl accident, since
heather has been found to accumulate higher levels of
radiocesium than many other upland plants (Bunzl and
Kracke 1984). They found that 10–40% of 137Cs would
be lost after a heather fire, strongly depending on the
N. EVANGELIOU ET AL.52 Ecological MonographsVol. 85, No. 1
temperature (12% after cool burning and 39% after hot
burning). Piga (2010) performed similar fire experiments
in an artificial experimental site at the Institut de
Radioprotection et de Surete Nucleaire, France, using
contaminated wood as fuel. He recorded 137Cs levels
before and after burning, as well as the emitted amount
in the ambient aerosol, concluding that the redistribu-
tion was approximately 10%. These studies indicate that
the redistribution of 137Cs strongly depends on the
temperature of the fire and the type of vegetation used as
fuel. Most of the aforementioned studies were based on
experiments in which controlled conditions were main-
tained, whereas our study aimed to analyze uncontrolled
wildfires. Given that the prevailing temperatures in a
wildfire are higher than the controlled experiments, we
expected the redistribution of 137Cs to be close to that
estimated by Horrill et al. (1995) for hot burning,
corresponding to approximately 40%.
We also addressed the fate of 137Cs deposited in the
soil and the amount redistributed after fires. Analyses of
data collected after Chernobyl, and recently after
Fukushima (e.g., Hashimoto et al. 2012) have shown
that 137Cs is accumulated in the topsoil layer (Filipovic-
Vincekovic et al. 1991, Avery 1996) and remains there
for many years with a migration velocity of approxi-
mately 0.09 cm/yr (Lujanieneo et al. 2002). Once
deposited, 137Cs is affected by many site-specific factors
including soil type, rainfall, drainage, terrain, vegeta-
tion, and local activities and conditions. Studying four
different contaminated sites in Chernobyl in 1991,
Poiarkov (1995) showed that 84–86% of 137Cs predom-
inated in the litter and the first 2 cm of the soil, whereas
the remainder migrated into deeper layers of the soil.
The fraction of 137Cs in topsoil was much higher in
Fukushima (97%) one year after the accident (Tanaka et
al. 2012). The cesium cation (the predominant species of
Cs in aqueous solution) interacts strongly with many
soils due to its low tendency to hydrate and higher
polarizability than smaller ions like Kþ (Avery 1996). Its
binding in soils is largely contingent on the content of
inorganic minerals relative to organic matter. The
organic fraction of soils has a larger cation exchange
capacity than inorganic soil particles. Organic matter
can bind Csþ, acting as a transfer parameter for Cs (De
Brouwer et al. 1994, Shand et al. 1994, Lujanieneo et al.
2002). Since 137Cs has a relatively low boiling point of
6698C, it is partially volatilized in smoke even when
bound in soil. Paliouris et al. (1995) showed that more
than 20% of 137Cs is redistributed by large fires in North
American boreal forests. Due to the lack of such studies
in highly contaminated areas, and for simplicity’s sake,
we assumed that this ratio was the same as that for the
redistribution of 137Cs following burning (40%).
The transport model
The coupled model LMDZORINCA was used in the
simulations (Szopa et al. 2012) consisting of the aerosol
module INCA (INteractions between Chemistry and
Aerosols), the general circulation model (GCM),
LMDz, (Laboratoire de Meteorologie Dynamique),
and the global vegetation model ORCHIDEE (ORga-
nizing Carbon and Hydrology In Dynamic Ecosystems
Environment). The model accounts for emission, trans-
port, photochemical transformations, and dry and wet
scavenging of chemical species and aerosols (Evangeliou
et al. 2013). The horizontal resolution of the model in
the regular grid is 1.278 in latitude and 2.508 in
longitude, whereas the vertical grid is divided into 19
levels from the surface up to about 3.8 hPa. However,
the GCM also offers the opportunity to stretch the grid
over specific regions using the same number of grid-
boxes. In the present study, the fire incidents were
simulated using the zoom version for Europe, achieving
a horizontal resolution of 0.518 3 0.458 for 19 vertical
levels. The model can be run in a nudged mode using the
ERA40 reanalysis data, with 6-h wind fields, by the
European Centre for Medium-Range Weather Forecasts
(ECMWF 2002) with a relaxation time of 10 days for
the regular grid; in the zoom version, the model was
relaxed to 4.8 days in the center of the zoom and to 10
days outside (Hourdin and Issartel 2000).
Wildfires in the years 2002, 2008, and 2010 were
simulated, and three extreme fire scenarios were also
studied assuming that 10% of the contaminated forests
were burned following different injection regimes
described in detail in Estimates of the altitude of the
emissions near Chernobyl and Belarusian forests using the
Plume Rise Model (PRM) (2010 scenario 6, 2010
scenario 7, and 2010 scenario 8). Each simulation lasted
from March to the end of the year. According to
relevant measurements of 137Cs activity concentrations
after the recent accident of Fukushima, the detection of137Cs in the ambient aerosol ended 2–3 months after the
initial emissions (Masson et al. 2011, Long et al. 2012,
McMullin et al. 2012, Paatero et al. 2012); therefore, one
year was sufficient to obtain an overall view of the
deposition of 137Cs after wildfires.
Estimates of the altitude of the emissions near Chernobyl
and Belarusian forests using the Plume Rise Model
(PRM)
Current deposition densities were needed in order to
estimate the redistribution of 137Cs after fires. Therefore,
we used the Radioactivity Environmental Monitoring
(REM) database (De Cort et al. 1998), combined with
measurement data adapted from Kashparov et al.
(2003), assuming an effective half-life of 137Cs of 10
years. Bergan (2000), in the first complete study about
ecological loss of 137Cs, reported that ‘‘the calculated
effective half-lives of radiocesium in the surface soil
layer vary across the sites from 10 to 30 years, which is
equal to the physical half-life of 137Cs’’. Effective half-
life of 137Cs combines its physical decay and also its
ecological half-life (which includes all environmental
removing processes, such as vertical migration, runoff to
large reservoirs, soil erosion, etc); hence, the data were
February 2015 53FIRE EVOLUTION IN RADIOACTIVE FORESTS
corrected for 1 March 2002, 2008, and 2010. The data
were validated using measurement-based maps reported
in the NRU (2011).
Once aloft, air currents can transport fire emissions,
affecting their longevity, chemical conversion, and fate.
Models and observations (e.g., Chin et al. 2002, Bertschi
et al. 2004) have shown that aerosol residence times in
the atmosphere and downwind effects on surface air
quality depend on the heights at which emissions are
injected. In a study of 1998 boreal fires, Leung et al.
(2007) concluded that at least half of the carbon is
injected above the boundary layer (3–5 km) as a result of
convection. Studies of crown fires have shown that many
fires generate sufficient energy to loft smoke plumes
above the boundary layer (Cofer et al. 1996, Lavoue et
al. 2000) up to stratospheric altitudes by supercell
convection (Fromm and Servranckx 2003, Fromm et
al. 2008). The goal here was to generate realistic
parameterizations for the injection heights of forest fire
scenarios to be used in our global atmospheric model.
Chemical transport models (CTMs) are used to
quantify these processes. Unlike all other emissions
(except for those from aircraft and volcanoes), fires may
inject their smoke plumes into the troposphere, and
occasionally even into the lower stratosphere, by virtue
of the intense radiative energy and convection produced
by the burning fuel. The dynamics of the plume
responsible for the updraft and its final emission profile
take place at scales than range below CTM resolution
and therefore cannot be modeled; thus, parameteriza-
tion is usually needed to predict fire injection height at a
large scale. Several plume models have already been
implemented in CTMs, each of them focusing on
different aspects of plume dynamics. The PRM of
Freitas et al. (2007, 2010) emphasizes the role of moist
convection and ambient wind shear. Rio et al. (2010)
developed a model that, together with modeling water
transport within the plume, can interact with ambient
stratification. Sofiev et al. (2012) derived an empirical
model from dimensional analysis and optimization,
using as input the fire radiative power (FRP), to model
the convection induced by the fire, and the Brunt-
Vasisala frequency above the boundary layer to model
the effect of atmospheric stability. To our knowledge,
these parameterizations have not been properly validat-
ed. However, Val Martin et al. (2013) used the Multi-
angle Imaging SpectroRadiometer (MISR) injection
height data set to run a fire-by-fire comparison, and
concluded that the performance of the PRM was not
reliable. Such validations on a fire-by-fire basis are
problematic in that the main source of available data,
the MISR injection height data set, might be biased by
the fact that fire observations occur in most cases early
in the morning when fire intensity and plumes are not
yet mature.
Recently, a new approach based on the original
version of PRM has been developed to introduce
additional physical constraints (Paugam et al. 2010).
In the new PRM2 model, an equation for mass
conservation was added, the fire-induced convection
was derived from FRP measurements, and the entrain-
ment and detrainment scheme was improved to adapt to
more atmospheric scenarios. Six parameters were
introduced and optimized to fit well-characterized fire
events. The selection of these particular fires was made
through the MISR data set, and fires were detected when
effects of the diurnal cycle (high-latitude fires had more
Terra overpasses, and so had MISR observations made
later in the day), or the time lag between fire radiation
and plume development (use of multiple overpass form
Terra and Aqua are used to only consider mature fire)
could be considered negligible. For each fire a detrain-
ment profile was computed, allowing estimation of the
ratio of burned mass emitted in the boundary layer and
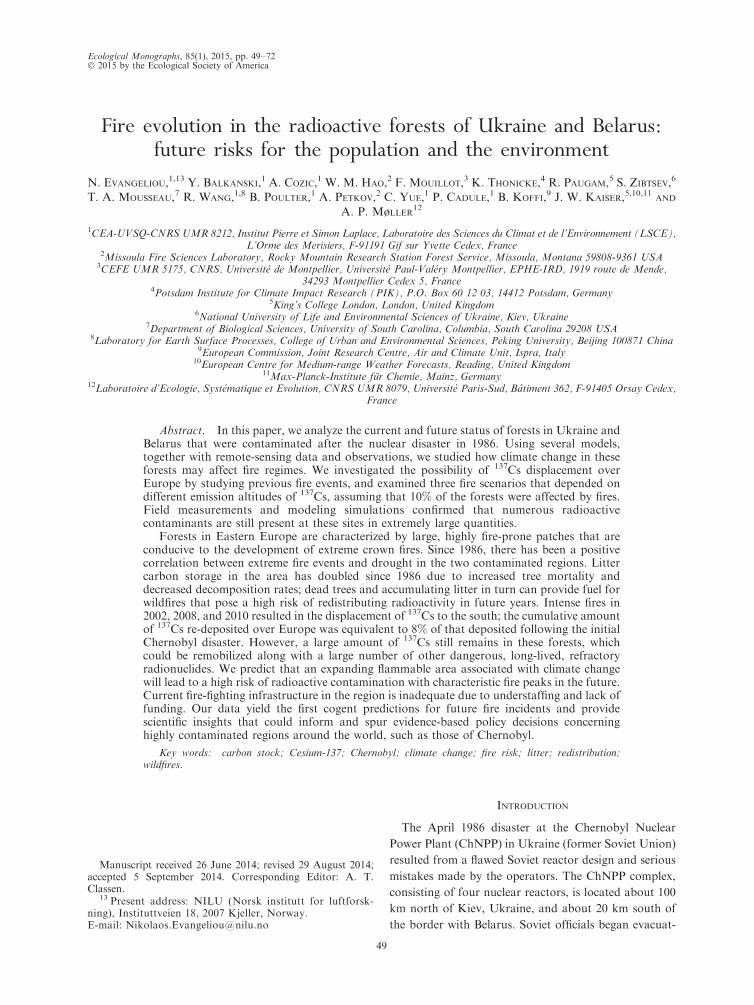
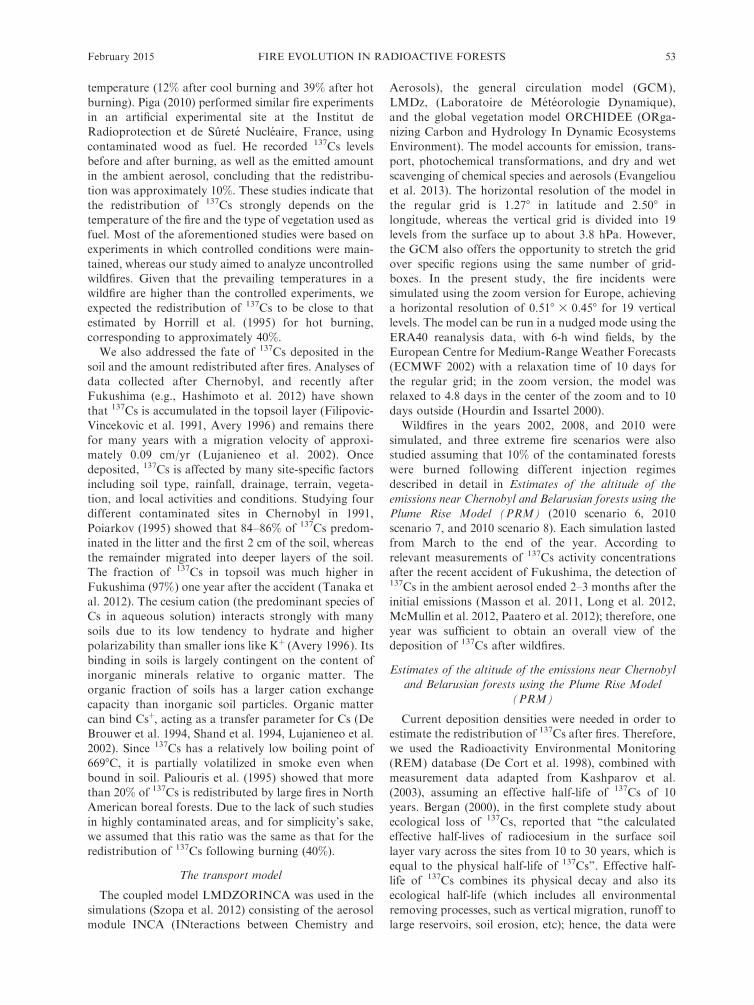
above it at the scale of every single fire. Fig. 1 shows
results of the PRM2 model applied to fires detected by
MODIS (for both Terra and Aqua sensors) in the
Ukrainian and Belarusian forests for the years 2003,
2008, and 2010. It shows the average and maximum
injection height above the boundary layer, the maximum
injection height above the ground, the number of fires,
and the total fire radiative energy (FRE) in the selected
area. Fig. 1 emphasizes the variability of injection height
(with injection up to 7 km) and mean injection heights
above the boundary layer (top panels) and the depen-
dence on the atmosphere, as the maxima above the
boundary layer do not necessarily match with the
maximum height above the ground or the fire activity.
For all these reasons, we assumed 137Cs would follow
the same dynamics with fire emissions from the PRM2
and therefore, a mean vertical mass profile was
computed and applied to the 137Cs emission from fires.
Due to the lack of data in 2002, we used the vertical
distribution of the plume for 2003 (a more conventional
distribution), in which the maximum injection height
reached 2.9 km. For 2008 fires, in which larger injection
heights were obtained by the PRM2 model (FRE was
extremely high, reflecting the high fire intensity), the
upper limit of the injection was set to 6 km. For the large
fires of 2010, a maximum emission altitude of 4.3 km
was chosen on the basis of the results presented in Fig. 1.
Val Martin et al. (2010) and Kahn et al. (2008) showed
that fires in boreal forests of North America and Alaska
resulted in smoke injections above the boundary layer.
In addition, Sofiev et al. (2013) published global maps of
emission heights and the resulting vertical profiles for
wildfires that occurred between 2000 and 2012. They
concluded that regions with moderately high injection
heights include forests in Amazonia, equatorial and
southern Africa, and central Eurasia, where 90% of the
mass is emitted within the lowest 3 km of the
atmosphere (the boundary layer in these forests can be
seen in Appendix: Fig. A2). These regions are notable
for quite strong fires and deep boundary layers (van der
Werf et al. 2010), and include the Ukrainian and
Belarusian forests. The profiles used here were compa-
N. EVANGELIOU ET AL.54 Ecological MonographsVol. 85, No. 1
rable to those presented by Sofiev et al. (2013), wherein
;90% of 137Cs is emitted within 3 km height. Finally,three extreme scenarios were also studied (10% of the
contaminated area burns), accounting for a maximuminjection at 2.9 km (2010 scenario 6), 4.3 km (2010
scenario 7), and up to 6 km (2010 scenario 8) using thesame profiles of the fire years 2002, 2010, and 2008,
respectively. The spatial deposition density of 137Cs (Bq/m2) in these forests is multiplied with the burned area
(m2) from MODIS and the emission factor (40%), inorder to estimate 137Cs emissions after fires.
LPJmL-SPITFIRE coupled model for litter carbonstorage
A process-based fire regime model, SPread and
InTensity of FIRE (SPITFIRE; Thonicke et al. 2001),coupled with ecosystem dynamics in the LPJmL (Lund,
Potsdam, and Jena) Dynamic Global Vegetation Model(Sitch et al. 2003, Gerten et al. 2004, Bondeau et al.
2007) was used to explore relationships between littercarbon stock and fire tendency from 1986 to 2010. The
aim was to study past, present, and future effects of fireson the terrestrial carbon cycle and the associated
emissions of trace atmospheric constituents. The samecoupled configuration was used to estimate future
burned areas and litter carbon storage in Europe andspecifically in contaminated regions of Ukraine and
Belarus up to 2100 under the REMO-A1B climatechange scenario. Comparison with observed active fire
counts have shown that the model reproduces fire
occurrence and can mimic broad geographic patterns
during the peak fire season. Modeled fire season
duration is generally overestimated by about one month,
but shows a realistic pattern of differences among
biomes. Comparisons with remotely sensed burned area
products have indicated that the model reproduces
broad geographic patterns of annual fractional burned
area over most regions, including the boreal forest
(Thonicke et al. 2010).
RESULTS
Climate change in Chernobyl and Belarus
Empirical observations over the past century have
shown that temperatures at the surface have risen
globally, with important regional variations. Global
average warming has been increasing since 1900, with a
trend between 0.078 6 0.028C per decade to 0.138 6
0.038C per decade (Scafetta and West 2006). Observa-
tions of global precipitation have shown that variability
exists in the amount, intensity, frequency, and type of
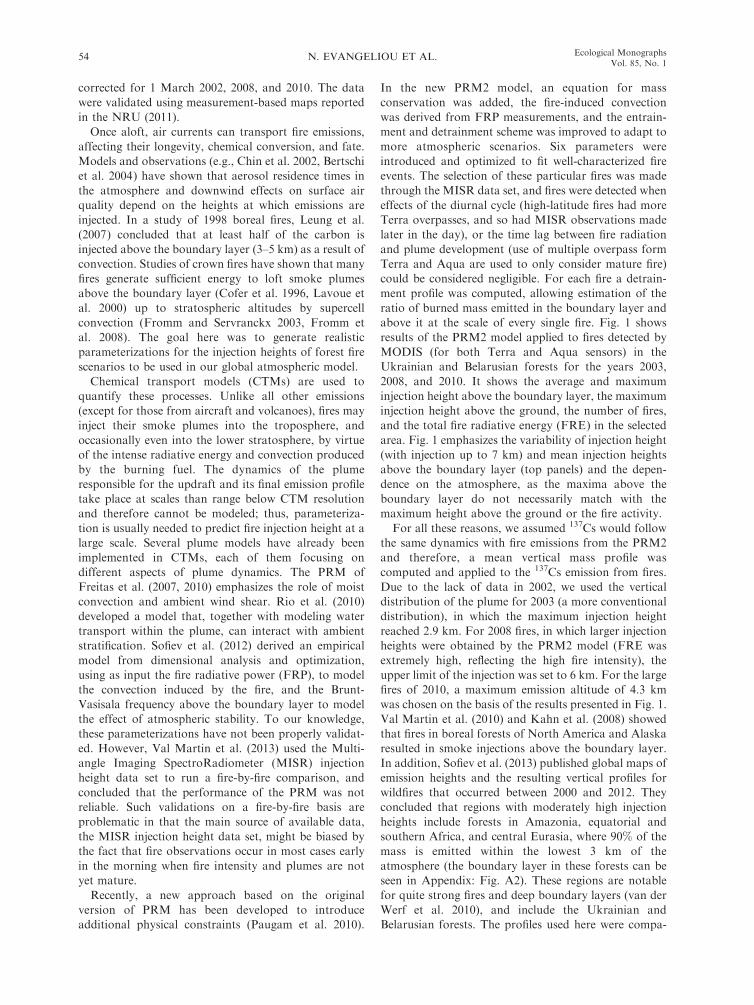
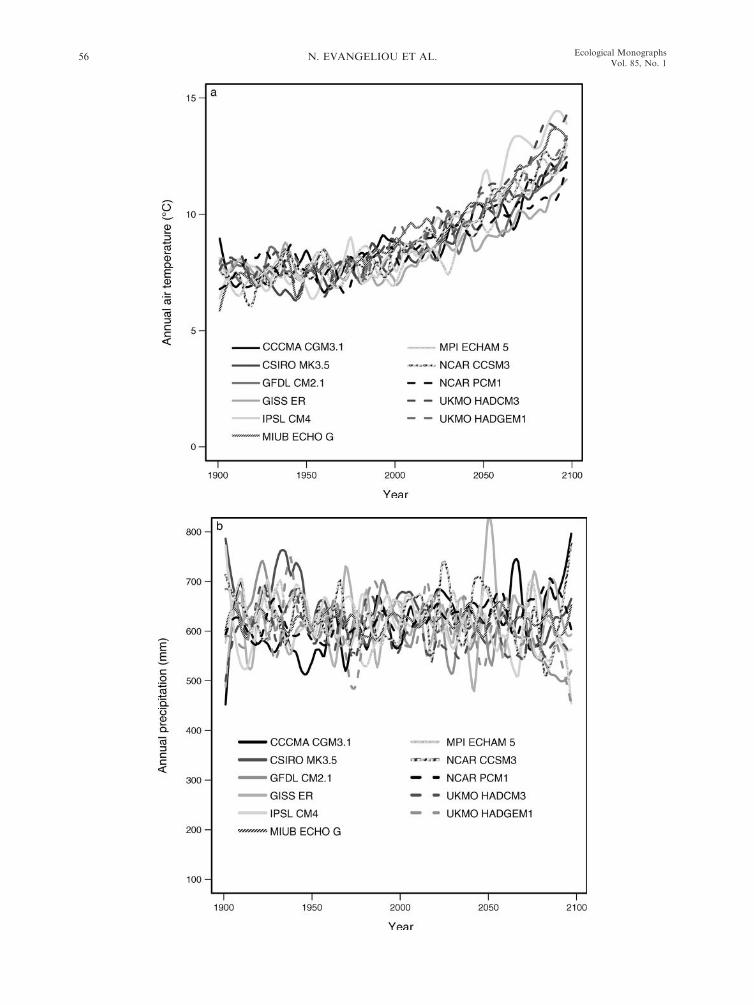
precipitation. Temperatures in Ukraine and Belarus
have become increasingly warmer in spring and summer
since 1950, and precipitation has decreased (or remained
stable) considerably during the same period (Fig. 2). The
most pronounced increase occurred during July–August
2010, when temperatures exceeded 408C accompanied by
many weeks without precipitation. With the projected
increase in CO2 and other greenhouse gases, most
coupled models predict an increase in the occurrence
FIG. 1. Mean and maximum injection height above the boundary layer (InjHBL; km), maximum injection height above theground (max InjH; km), number of fires, and total fire radiative energy (FRE) in the selected area for the fires in 2002, 2008, and2010.
February 2015 55FIRE EVOLUTION IN RADIOACTIVE FORESTS
N. EVANGELIOU ET AL.56 Ecological MonographsVol. 85, No. 1
of exceedingly warm and dry summers in the future (Fig.
2).
Recent fire history as seen from GFED3 burned area
database
Annual average and maximum values of burned area
(BA), total carbon (TC), and total particulate matter
(TPM) for Europe derived from the GFED3 database
are presented for the 1997–2009 period in Appendix:
Fig. A3. The most fire-prone areas were the grasslands
of Eastern Europe and the Mediterranean forests with
an average of 5000 ha/cell unit (0.58) corresponding to
2% of the cell. Annual maximum burned area reached
50 000 ha (20% of the grid cell) during extreme fire years.
TC and TPM emitted during fire events depended on the
fuel amount available for burning; for example, except
for acting as a spreading agent, grassland steppes
remained a very large atmospheric emitter during fires
in the same range with forest ecosystems of high fuel
amounts (Appendix: Fig. A2). Located at the interface
between grassland steppes and the temperate/boreal
biomes, Ukraine is affected by both recurrent grassland
fires and less-frequent but more intensively emitting
forest fires.
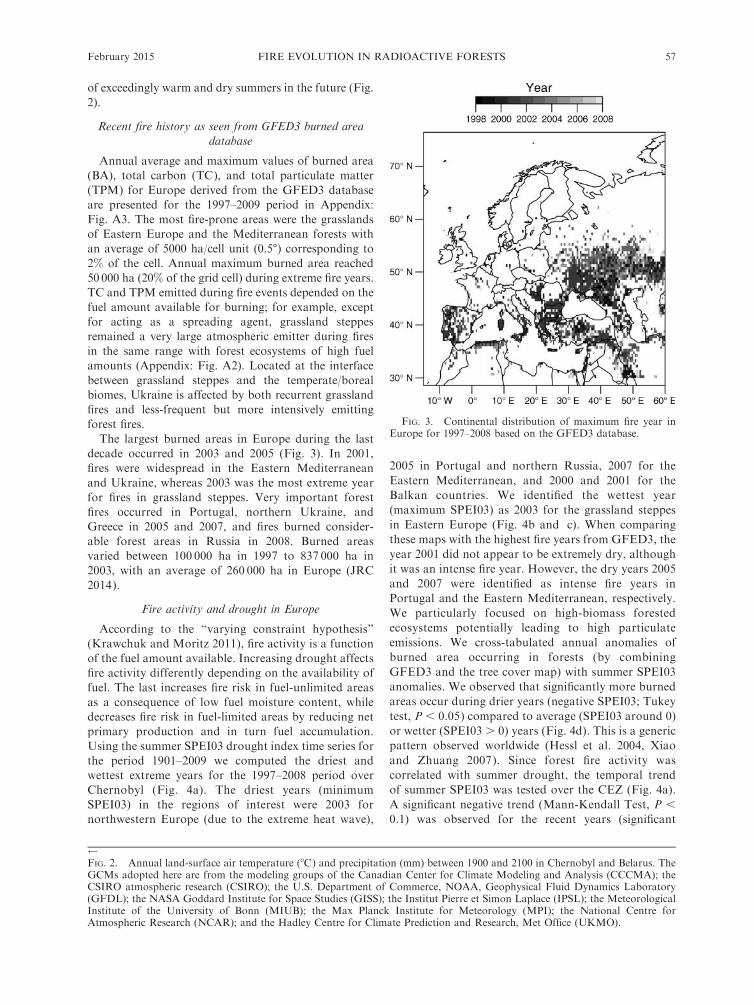
The largest burned areas in Europe during the last
decade occurred in 2003 and 2005 (Fig. 3). In 2001,
fires were widespread in the Eastern Mediterranean
and Ukraine, whereas 2003 was the most extreme year
for fires in grassland steppes. Very important forest
fires occurred in Portugal, northern Ukraine, and
Greece in 2005 and 2007, and fires burned consider-
able forest areas in Russia in 2008. Burned areas
varied between 100 000 ha in 1997 to 837 000 ha in
2003, with an average of 260 000 ha in Europe (JRC
2014).
Fire activity and drought in Europe
According to the ‘‘varying constraint hypothesis’’
(Krawchuk and Moritz 2011), fire activity is a function
of the fuel amount available. Increasing drought affects
fire activity differently depending on the availability of
fuel. The last increases fire risk in fuel-unlimited areas
as a consequence of low fuel moisture content, while
decreases fire risk in fuel-limited areas by reducing net
primary production and in turn fuel accumulation.
Using the summer SPEI03 drought index time series for
the period 1901–2009 we computed the driest and
wettest extreme years for the 1997–2008 period over
Chernobyl (Fig. 4a). The driest years (minimum
SPEI03) in the regions of interest were 2003 for
northwestern Europe (due to the extreme heat wave),
2005 in Portugal and northern Russia, 2007 for the
Eastern Mediterranean, and 2000 and 2001 for the
Balkan countries. We identified the wettest year
(maximum SPEI03) as 2003 for the grassland steppes
in Eastern Europe (Fig. 4b and c). When comparing
these maps with the highest fire years from GFED3, the
year 2001 did not appear to be extremely dry, although
it was an intense fire year. However, the dry years 2005
and 2007 were identified as intense fire years in
Portugal and the Eastern Mediterranean, respectively.
We particularly focused on high-biomass forested
ecosystems potentially leading to high particulate
emissions. We cross-tabulated annual anomalies of
burned area occurring in forests (by combining
GFED3 and the tree cover map) with summer SPEI03
anomalies. We observed that significantly more burned
areas occur during drier years (negative SPEI03; Tukey
test, P , 0.05) compared to average (SPEI03 around 0)
or wetter (SPEI03 . 0) years (Fig. 4d). This is a generic
pattern observed worldwide (Hessl et al. 2004, Xiao
and Zhuang 2007). Since forest fire activity was
correlated with summer drought, the temporal trend
of summer SPEI03 was tested over the CEZ (Fig. 4a).
A significant negative trend (Mann-Kendall Test, P ,
0.1) was observed for the recent years (significant
FIG. 3. Continental distribution of maximum fire year inEurope for 1997–2008 based on the GFED3 database.
FIG. 2. Annual land-surface air temperature (8C) and precipitation (mm) between 1900 and 2100 in Chernobyl and Belarus. TheGCMs adopted here are from the modeling groups of the Canadian Center for Climate Modeling and Analysis (CCCMA); theCSIRO atmospheric research (CSIRO); the U.S. Department of Commerce, NOAA, Geophysical Fluid Dynamics Laboratory(GFDL); the NASA Goddard Institute for Space Studies (GISS); the Institut Pierre et Simon Laplace (IPSL); the MeteorologicalInstitute of the University of Bonn (MIUB); the Max Planck Institute for Meteorology (MPI); the National Centre forAtmospheric Research (NCAR); and the Hadley Centre for Climate Prediction and Research, Met Office (UKMO).
February 2015 57FIRE EVOLUTION IN RADIOACTIVE FORESTS
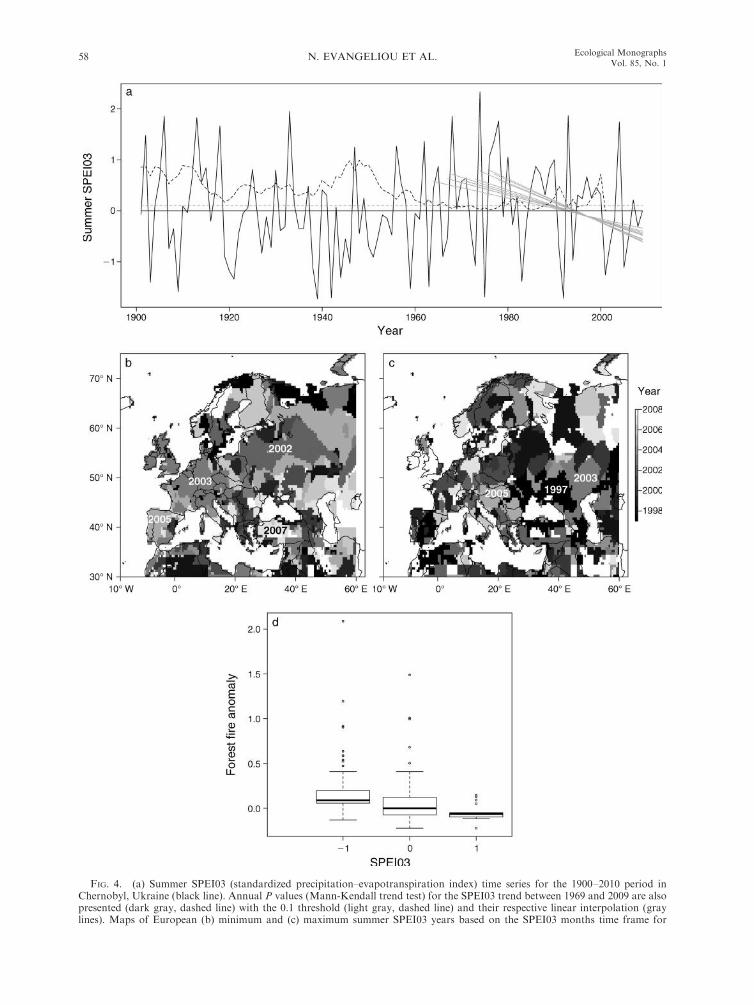
FIG. 4. (a) Summer SPEI03 (standardized precipitation–evapotranspiration index) time series for the 1900–2010 period inChernobyl, Ukraine (black line). Annual P values (Mann-Kendall trend test) for the SPEI03 trend between 1969 and 2009 are alsopresented (dark gray, dashed line) with the 0.1 threshold (light gray, dashed line) and their respective linear interpolation (graylines). Maps of European (b) minimum and (c) maximum summer SPEI03 years based on the SPEI03 months time frame for
N. EVANGELIOU ET AL.58 Ecological MonographsVol. 85, No. 1
trends until 2009, Fig. 4a), indicating that the summer
periods became drier over time and suggesting anincreasing trend in forest fire risk.
Fire activity and land cover
Accurate quantification of carbon and particulates
emitted during fire events is significantly enhanced whenland-cover types affected by fires are characterized. The
presence of continuous and homogeneous patches is a
key variable that allows fires to spread over large areasduring extreme events (Cary et al. 2006). We explored
the relationship between fire occurrence and land cover
in Europe by using the tree cover map for Europe(Appendix: Fig. A1).
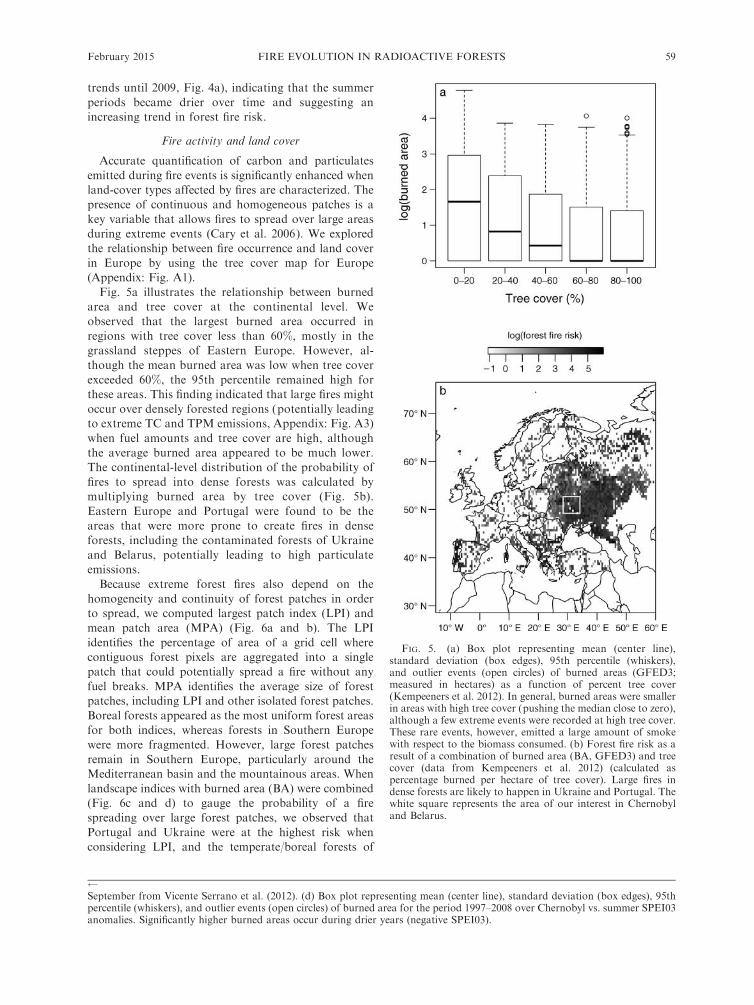
Fig. 5a illustrates the relationship between burnedarea and tree cover at the continental level. We
observed that the largest burned area occurred in
regions with tree cover less than 60%, mostly in thegrassland steppes of Eastern Europe. However, al-
though the mean burned area was low when tree cover
exceeded 60%, the 95th percentile remained high forthese areas. This finding indicated that large fires might
occur over densely forested regions (potentially leadingto extreme TC and TPM emissions, Appendix: Fig. A3)
when fuel amounts and tree cover are high, although
the average burned area appeared to be much lower.The continental-level distribution of the probability of
fires to spread into dense forests was calculated bymultiplying burned area by tree cover (Fig. 5b).
Eastern Europe and Portugal were found to be the
areas that were more prone to create fires in denseforests, including the contaminated forests of Ukraine
and Belarus, potentially leading to high particulateemissions.
Because extreme forest fires also depend on the
homogeneity and continuity of forest patches in orderto spread, we computed largest patch index (LPI) and
mean patch area (MPA) (Fig. 6a and b). The LPI
identifies the percentage of area of a grid cell wherecontiguous forest pixels are aggregated into a single
patch that could potentially spread a fire without any
fuel breaks. MPA identifies the average size of forestpatches, including LPI and other isolated forest patches.
Boreal forests appeared as the most uniform forest areasfor both indices, whereas forests in Southern Europe
were more fragmented. However, large forest patches
remain in Southern Europe, particularly around theMediterranean basin and the mountainous areas. When
landscape indices with burned area (BA) were combined(Fig. 6c and d) to gauge the probability of a fire
spreading over large forest patches, we observed that
Portugal and Ukraine were at the highest risk whenconsidering LPI, and the temperate/boreal forests of
FIG. 5. (a) Box plot representing mean (center line),standard deviation (box edges), 95th percentile (whiskers),and outlier events (open circles) of burned areas (GFED3;measured in hectares) as a function of percent tree cover(Kempeeners et al. 2012). In general, burned areas were smallerin areas with high tree cover (pushing the median close to zero),although a few extreme events were recorded at high tree cover.These rare events, however, emitted a large amount of smokewith respect to the biomass consumed. (b) Forest fire risk as aresult of a combination of burned area (BA, GFED3) and treecover (data from Kempeeners et al. 2012) (calculated aspercentage burned per hectare of tree cover). Large fires indense forests are likely to happen in Ukraine and Portugal. Thewhite square represents the area of our interest in Chernobyland Belarus.
September from Vicente Serrano et al. (2012). (d) Box plot representing mean (center line), standard deviation (box edges), 95thpercentile (whiskers), and outlier events (open circles) of burned area for the period 1997–2008 over Chernobyl vs. summer SPEI03anomalies. Significantly higher burned areas occur during drier years (negative SPEI03).
February 2015 59FIRE EVOLUTION IN RADIOACTIVE FORESTS
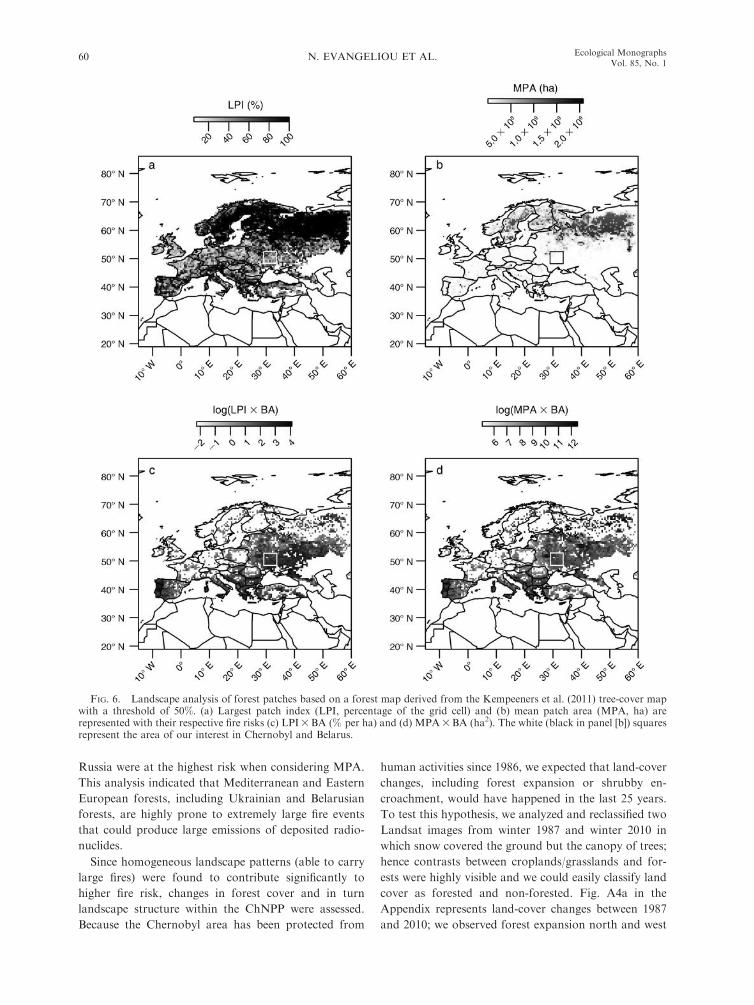
Russia were at the highest risk when considering MPA.
This analysis indicated that Mediterranean and Eastern
European forests, including Ukrainian and Belarusian
forests, are highly prone to extremely large fire events
that could produce large emissions of deposited radio-
nuclides.
Since homogeneous landscape patterns (able to carry
large fires) were found to contribute significantly to
higher fire risk, changes in forest cover and in turn
landscape structure within the ChNPP were assessed.
Because the Chernobyl area has been protected from
human activities since 1986, we expected that land-cover
changes, including forest expansion or shrubby en-
croachment, would have happened in the last 25 years.
To test this hypothesis, we analyzed and reclassified two
Landsat images from winter 1987 and winter 2010 in
which snow covered the ground but the canopy of trees;
hence contrasts between croplands/grasslands and for-
ests were highly visible and we could easily classify land
cover as forested and non-forested. Fig. A4a in the
Appendix represents land-cover changes between 1987
and 2010; we observed forest expansion north and west
FIG. 6. Landscape analysis of forest patches based on a forest map derived from the Kempeeners et al. (2011) tree-cover mapwith a threshold of 50%. (a) Largest patch index (LPI, percentage of the grid cell) and (b) mean patch area (MPA, ha) arerepresented with their respective fire risks (c) LPI3BA (% per ha) and (d) MPA3BA (ha2). The white (black in panel [b]) squaresrepresent the area of our interest in Chernobyl and Belarus.
N. EVANGELIOU ET AL.60 Ecological MonographsVol. 85, No. 1
of the ChNPP (þ25%), characterized by a concomitant
10% increase in forest cover. This observation confirmed
our hypothesis that forests were becoming less frag-
mented and thus potentially more capable of spreading
large wildfires. Our local analysis was consistent with the
recent analysis of global land-cover change by Hansen et
al. (2013; Appendix: Fig. A4b), in which forest increase
was the dominant pattern in the ChNPP exclusion zone
during 2000–2012.
Biomass burning and litter carbon storage
Fig. A5 in the Appendix depicts biomass burning
estimated by the PKU-FUEL model of Peking Univer-
sity for the years 1986 and 2007 in Europe. The year
1986 was chosen as a reference period just after the
accident to show the large variability of the biomass
consumption between the period of the accident and the
present. Dancause et al. (2010) noted that a majority of
people living in contaminated areas in Ukraine habitu-
ally burn stalks of potatoes during August–October,
increasing the surface concentration of 137Cs by almost a
factor of 10. Moreover, most households outside cities
are heated with firewood (77% of respondents in Rivne
Oblast), and cooking is often done on wood-burning
stoves (52%). Hence, the consumption of firewood has
increased by a factor of 16 (0.02–0.33 kg�m�2�yr�1) in
contaminated regions two decades after the Chernobyl
disaster. Consumption of straw has also increased from
0.01 to 0.06 kg�m�2�yr�1, especially in Belarus. Farmers
also light fires in their fields to burn weeds, potato stems,
and other plant material; such fires can lead to
uncontrolled forest fires. However, the MODIS active
fires product showed no increase in agricultural fires up
to 2007 because so few people live inside the contam-
inated areas of Ukraine and Belarus. Most fires in these
areas were attributable to natural causes such as
lightning.
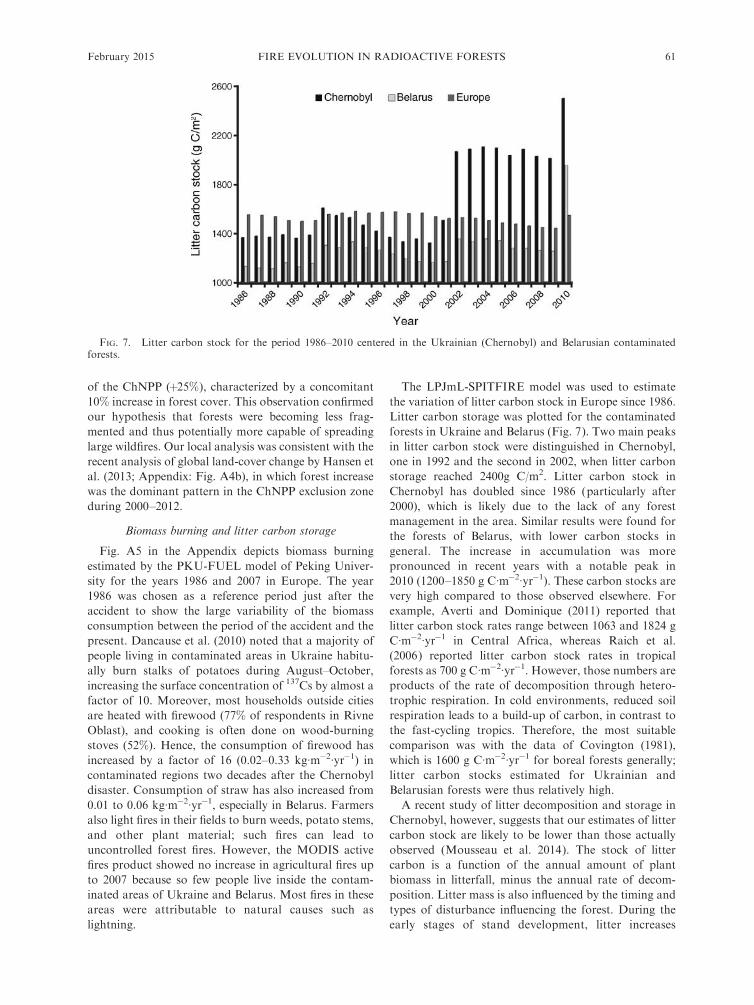
The LPJmL-SPITFIRE model was used to estimate
the variation of litter carbon stock in Europe since 1986.
Litter carbon storage was plotted for the contaminated
forests in Ukraine and Belarus (Fig. 7). Two main peaks
in litter carbon stock were distinguished in Chernobyl,
one in 1992 and the second in 2002, when litter carbon
storage reached 2400g C/m2. Litter carbon stock in
Chernobyl has doubled since 1986 (particularly after
2000), which is likely due to the lack of any forest
management in the area. Similar results were found for
the forests of Belarus, with lower carbon stocks in
general. The increase in accumulation was more
pronounced in recent years with a notable peak in
2010 (1200–1850 g C�m�2�yr�1). These carbon stocks are
very high compared to those observed elsewhere. For
example, Averti and Dominique (2011) reported that
litter carbon stock rates range between 1063 and 1824 g
C�m�2�yr�1 in Central Africa, whereas Raich et al.
(2006) reported litter carbon stock rates in tropical
forests as 700 g C�m�2�yr�1. However, those numbers are
products of the rate of decomposition through hetero-
trophic respiration. In cold environments, reduced soil
respiration leads to a build-up of carbon, in contrast to
the fast-cycling tropics. Therefore, the most suitable
comparison was with the data of Covington (1981),
which is 1600 g C�m�2�yr�1 for boreal forests generally;litter carbon stocks estimated for Ukrainian and
Belarusian forests were thus relatively high.
A recent study of litter decomposition and storage in
Chernobyl, however, suggests that our estimates of litter
carbon stock are likely to be lower than those actually
observed (Mousseau et al. 2014). The stock of litter
carbon is a function of the annual amount of plant
biomass in litterfall, minus the annual rate of decom-
position. Litter mass is also influenced by the timing and
types of disturbance influencing the forest. During the
early stages of stand development, litter increases
FIG. 7. Litter carbon stock for the period 1986–2010 centered in the Ukrainian (Chernobyl) and Belarusian contaminatedforests.
February 2015 61FIRE EVOLUTION IN RADIOACTIVE FORESTS
rapidly. Management such as timber harvesting, slash
burning, and site preparation dramatically alter litter
properties (Fisher and Binkley 2000), but few studies
clearly document the effects of management on litter
carbon storage (Smith and Heath 2002).
Transport and deposition of 137Cs after fires
Fires in Ukraine and Belarus were simulated for the
years 2002, 2008, and 2010 using the LMDZORINCA
model. MODIS satellite imagery recorded 185 fires in
2002, 50 in 2008, and 54 in 2010 that burned 473, 125,
and 137 ha, respectively. The same 54 fire incidents in
2010 were used to simulate the three scenarios of fires
occurring in 10% of the contaminated forests (2010
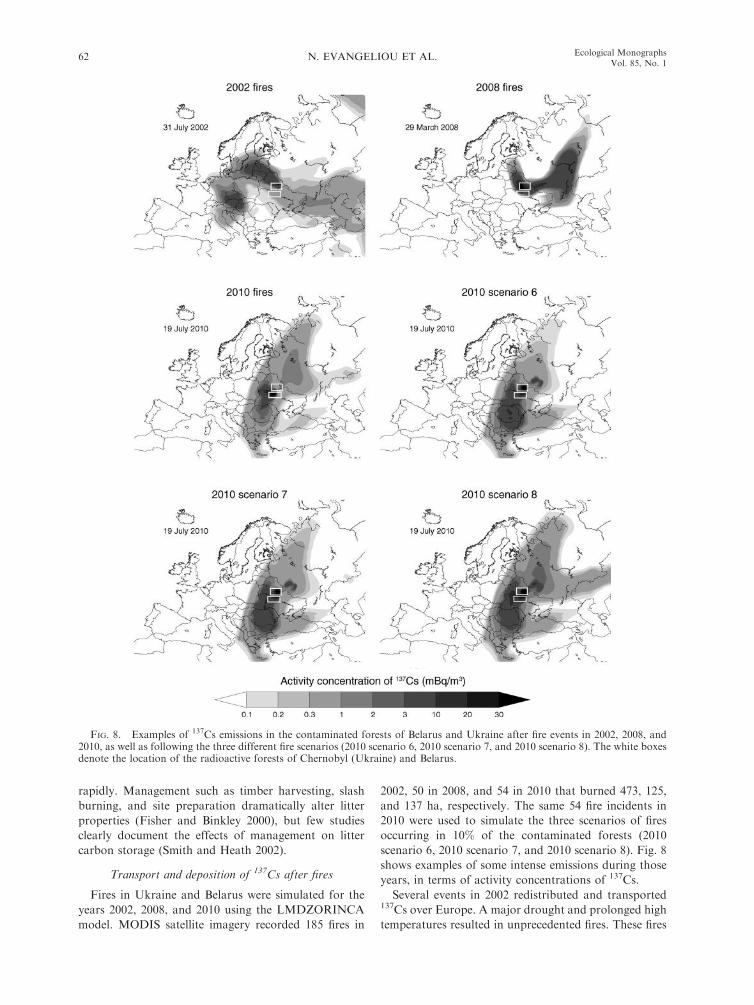
scenario 6, 2010 scenario 7, and 2010 scenario 8). Fig. 8
shows examples of some intense emissions during those
years, in terms of activity concentrations of 137Cs.
Several events in 2002 redistributed and transported137Cs over Europe. A major drought and prolonged high
temperatures resulted in unprecedented fires. These fires
FIG. 8. Examples of 137Cs emissions in the contaminated forests of Belarus and Ukraine after fire events in 2002, 2008, and2010, as well as following the three different fire scenarios (2010 scenario 6, 2010 scenario 7, and 2010 scenario 8). The white boxesdenote the location of the radioactive forests of Chernobyl (Ukraine) and Belarus.
N. EVANGELIOU ET AL.62 Ecological MonographsVol. 85, No. 1
occurred under extreme fire danger conditions and were
impossible for the authorities to extinguish. These fires
were so serious that peat bogs also burned, followed by
forests, causing massive smoke emissions that persisted
for a period of nearly 2 months, sometimes reducing
visibility to below 60 m. These fires resulted in significant
exposures of smoke to major population centers such as
Kiev and Moscow. The highest release occurred at the
end of July, with 137Cs fallout reaching Sweden,
Finland, and Central Europe (Fig. 8).
Fires in 2008 were of lower intensity and frequency.
However, some took place inside highly contaminated
regions, injecting a significant plume into the atmo-
sphere. In March 2008, 137Cs covered Belarus and a
large part of Russia (Fig. 8), and another event in
August distributed 137Cs more locally (data not shown).
Wildfires in 2010 affected several countries of
Southern Europe, including the Balkan countries,
Turkey, and southern Italy (Fig. 8). The same raging
forest fires affected ;3900 ha locally in the fallout zone
from the 1986 disaster. Despite the observed transport,
it is noteworthy that the atmospheric activity concen-
trations of 137Cs remained low (1–5 mBq/m3).
The highest exposure to the radioactive cloud from
the 2002, 2008, and 2010 fires occurred over Central
Europe (Fig. 8), with an annual average air activity
concentration of 137Cs ranging from 17 to 120 mBq/m3,
whereas the maximum displacement of 137Cs was
estimated to be only four orders of magnitude lower
than the initial total deposition in 1986 (85 PBq; De
Cort et al. 1998). In the three scenarios (2010 scenario 6,
2010 scenario 7, and 2010 scenario 8), 10% of the
contaminated forests in Chernobyl and Belarus were
burned (using the temporal pattern of 2010 wildfires, as
recorded from MODIS and accounting for a maximum
injection height of 2.9, 4.3, and 6.0 km, respectively). As
the altitude of the release increased, the plume spread
and therefore covered a larger surface area (Fig. 8).
Nevertheless, the transport was not significantly differ-
ent whether 137Cs was released at 2.9 or 6.0 km, likely
because we accounted for a small emission factor of137Cs after fires (40%) and/or because the highest
releases occurred during summer when surface winds
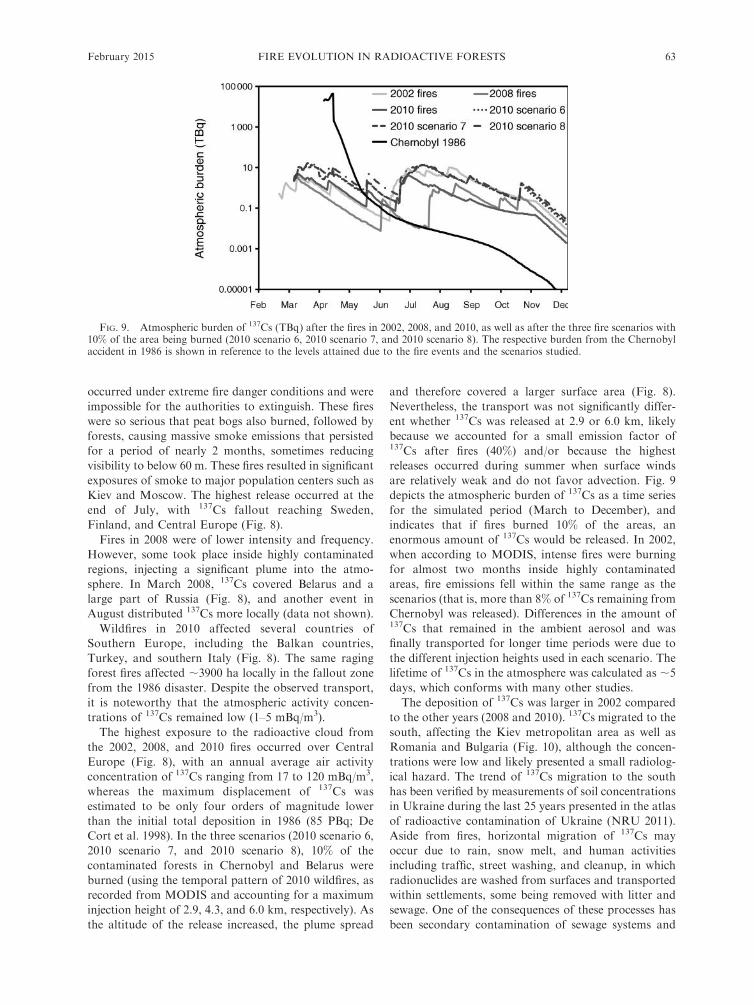
are relatively weak and do not favor advection. Fig. 9
depicts the atmospheric burden of 137Cs as a time series
for the simulated period (March to December), and
indicates that if fires burned 10% of the areas, an
enormous amount of 137Cs would be released. In 2002,
when according to MODIS, intense fires were burning
for almost two months inside highly contaminated
areas, fire emissions fell within the same range as the
scenarios (that is, more than 8% of 137Cs remaining from
Chernobyl was released). Differences in the amount of137Cs that remained in the ambient aerosol and was
finally transported for longer time periods were due to
the different injection heights used in each scenario. The
lifetime of 137Cs in the atmosphere was calculated as ;5
days, which conforms with many other studies.
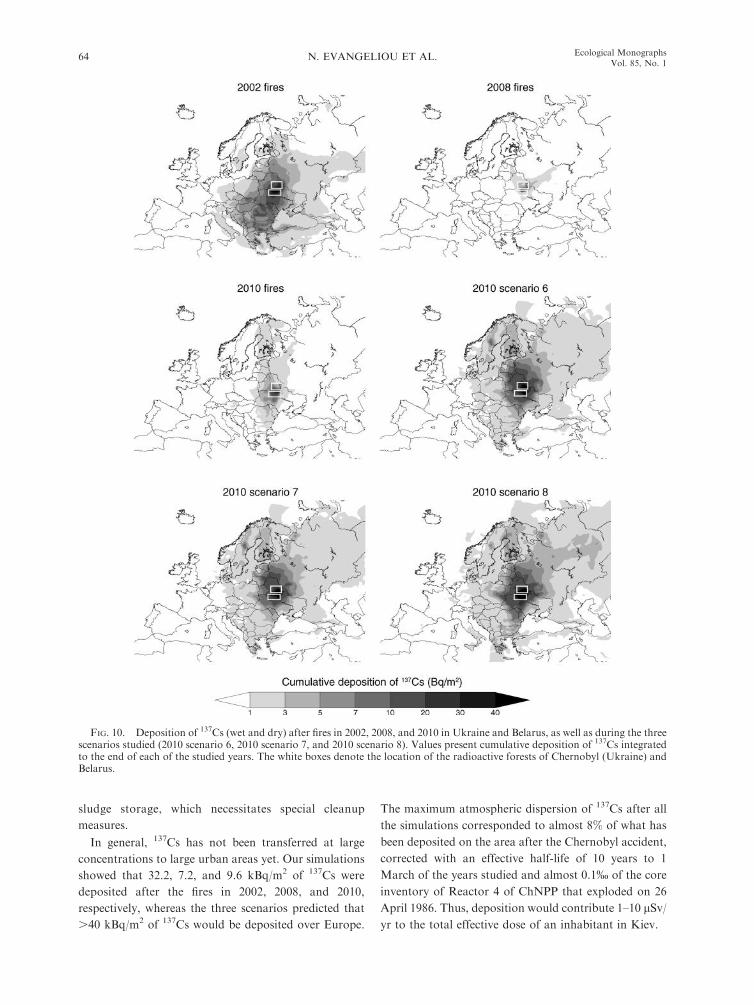
The deposition of 137Cs was larger in 2002 compared
to the other years (2008 and 2010). 137Cs migrated to the
south, affecting the Kiev metropolitan area as well as
Romania and Bulgaria (Fig. 10), although the concen-
trations were low and likely presented a small radiolog-
ical hazard. The trend of 137Cs migration to the south
has been verified by measurements of soil concentrations
in Ukraine during the last 25 years presented in the atlas
of radioactive contamination of Ukraine (NRU 2011).
Aside from fires, horizontal migration of 137Cs may
occur due to rain, snow melt, and human activities
including traffic, street washing, and cleanup, in which
radionuclides are washed from surfaces and transported
within settlements, some being removed with litter and
sewage. One of the consequences of these processes has
been secondary contamination of sewage systems and
FIG. 9. Atmospheric burden of 137Cs (TBq) after the fires in 2002, 2008, and 2010, as well as after the three fire scenarios with10% of the area being burned (2010 scenario 6, 2010 scenario 7, and 2010 scenario 8). The respective burden from the Chernobylaccident in 1986 is shown in reference to the levels attained due to the fire events and the scenarios studied.
February 2015 63FIRE EVOLUTION IN RADIOACTIVE FORESTS
sludge storage, which necessitates special cleanup
measures.
In general, 137Cs has not been transferred at large
concentrations to large urban areas yet. Our simulations
showed that 32.2, 7.2, and 9.6 kBq/m2 of 137Cs were
deposited after the fires in 2002, 2008, and 2010,
respectively, whereas the three scenarios predicted that
.40 kBq/m2 of 137Cs would be deposited over Europe.
The maximum atmospheric dispersion of 137Cs after all
the simulations corresponded to almost 8% of what has
been deposited on the area after the Chernobyl accident,
corrected with an effective half-life of 10 years to 1
March of the years studied and almost 0.1% of the core
inventory of Reactor 4 of ChNPP that exploded on 26
April 1986. Thus, deposition would contribute 1–10 lSv/
yr to the total effective dose of an inhabitant in Kiev.
FIG. 10. Deposition of 137Cs (wet and dry) after fires in 2002, 2008, and 2010 in Ukraine and Belarus, as well as during the threescenarios studied (2010 scenario 6, 2010 scenario 7, and 2010 scenario 8). Values present cumulative deposition of 137Cs integratedto the end of each of the studied years. The white boxes denote the location of the radioactive forests of Chernobyl (Ukraine) andBelarus.
N. EVANGELIOU ET AL.64 Ecological MonographsVol. 85, No. 1
DISCUSSION
Several models, together with remote-sensing data
and direct observations, are employed here for the first
time to provide the first realistic analyses of past and
present trends and risks of forest fires in the radioac-
tively contaminated forests of Ukraine and Belarus. We
also issue future predictions of fire incidents. The results
show that temperatures in the contaminated forests are
expected to increase in the future, whereas precipitation
will remain the same or decrease slightly. These changes
have important policy implications for the risk of fire
and for fire management.
Roles of vegetation in promoting the risk of fire
Worldwide, somewhere between 75 and 820 million
hectares of land burn each year, depending on the year.
Wildfires (not including fires intentionally set to clear
land) consume some 3–8% of total terrestrial net
primary productivity annually, releasing on average
1.7–4.1 Gt of carbon into the atmosphere (van der
Werf et al. 2010). There is a growing realization that
climate change may be associated with increasing forest
fire size, frequency, and severity (in terms of the
number of trees killed) across boreal and sub-boreal
regions (Westerling et al. 2006, Williams et al. 2013),
despite widespread management practices aimed at
reducing flammable materials in forests. Climate
models predict that higher temperatures and longer
droughts will increase wildfire frequency, particularly
in semiarid regions. Fig. 2 shows that temperature will
continue to increase in coming years in Chernobyl and
Belarus, and the average annual air temperature will
have reached 148C by 2100. Higher rainfall in some
areas could reduce fire frequency, though it could also
foster more vegetation, thus providing more fuel for
fires. Lightning (an important ignition source) is
thought to increase with a warmer climate, and more
intense rainstorms could exacerbate post-fire runoff
and landslides.
Warming trends also may already be contributing
to increasing stress on boreal forests such as those
that predominate in the Chernobyl region. Warming
can increase tree stress by increasing water deficit and
thus drought stress on trees (McDowell et al. 2008)
and/or enhancing the growth and reproduction of
insects and pathogens that attack trees (Raffa et al.
2008). Indeed, a major insect outbreak occurred in
Chernobyl in summer 2011, leaving a large swath of
forest with completely defoliated trees. Recent epi-
sodes of forest dieback (Breshears et al. 2005,
Williams et al. 2013) and rising tree mortality rates
in otherwise undisturbed forests (van Mantgem and
Stephenson 2007) may also be due to stress from
warming climate. Trees subject to chronic water and/
or temperature stress are more sensitive to subsequent
fire damage (van Mantgem et al. 2003), implying that
recent warming trends may lead to a de facto increase
in fire severity, apart from changes that may increase
fire intensity.
Vegetation type distribution, interannual variation in
amount of fuel and fuel moisture content, and
landscape patterns affect fuel continuity and the
capacity of a fire to crown and spread. We explored
these constraints and their trends throughout Europe
and at local scales in Chernobyl and Belarus. The
relationship between extreme fire years and increasing
frequencies of summer drought will potentially result in
larger burned areas. Grassland fields appear to be the
most fire-prone areas in Europe. When burned area is
combined with tree cover, the Mediterranean and
Eastern Europe (including the contaminated forests in
Ukraine and Belarus) emerge as the major regions with
forests threatened by fires. Extreme fire events are likely
to occur over large, contiguous forest patches; since
these regions exhibit both high fire occurrence and
large forest patches, we conclude that extreme fire
events will likely occur there. These forests extend up to
the interface between large boreal forests (which show
low fire activity due to limited drought) and up to
fragmented, fire-prone areas of Southern Europe
(which show lower risks of large fires). Local-scale
analysis illustrated the significant forest cover gains
around the ChNPP since 1986, suggesting an increasing
continuity in forest patches and, in turn, higher fire
risk.
Accumulation and loss of carbon litter stocks
In boreal forests generally, the rate of decomposition
is slower and leads to the accumulation of a thick litter
layer, also known as a mor (Schlesinger 1997). Another
source of variability of litter storage is caused by tree
mortality. Widespread forest dieback due to increasing
drought or heat stress as well as post-fire mortality can
lead to short-term carbon inputs to the litter pool that
exceed annual inputs from leaf and root turnover. This
is exactly what the LPJmL-SPITFIRE predicts for the
Chernobyl and Belarusian forests shown in Fig. A6 of
the Appendix. Litter carbon stock in the contaminated
forests has increased since 1986, with a major peak in
2010 due to the lack of forest management. Thereafter,
carbon litter stocks in Belarus and Ukraine decrease to
half by 2030 (compared to 2010), interrupted by a rapid
peak in 2035, whereas average litter carbon in Europe
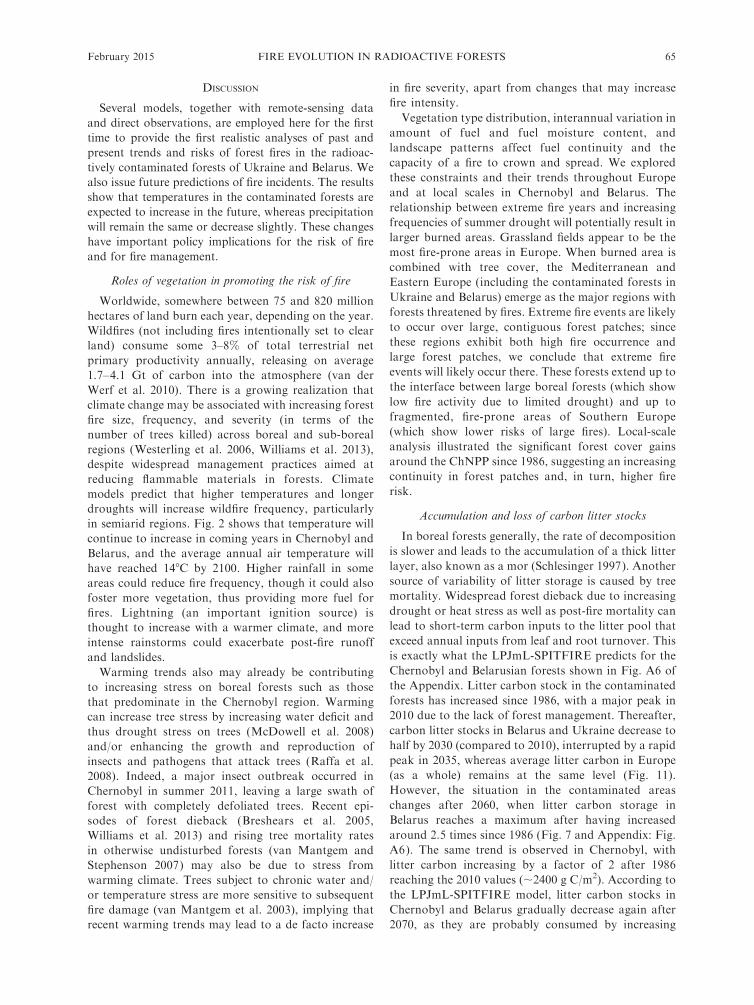
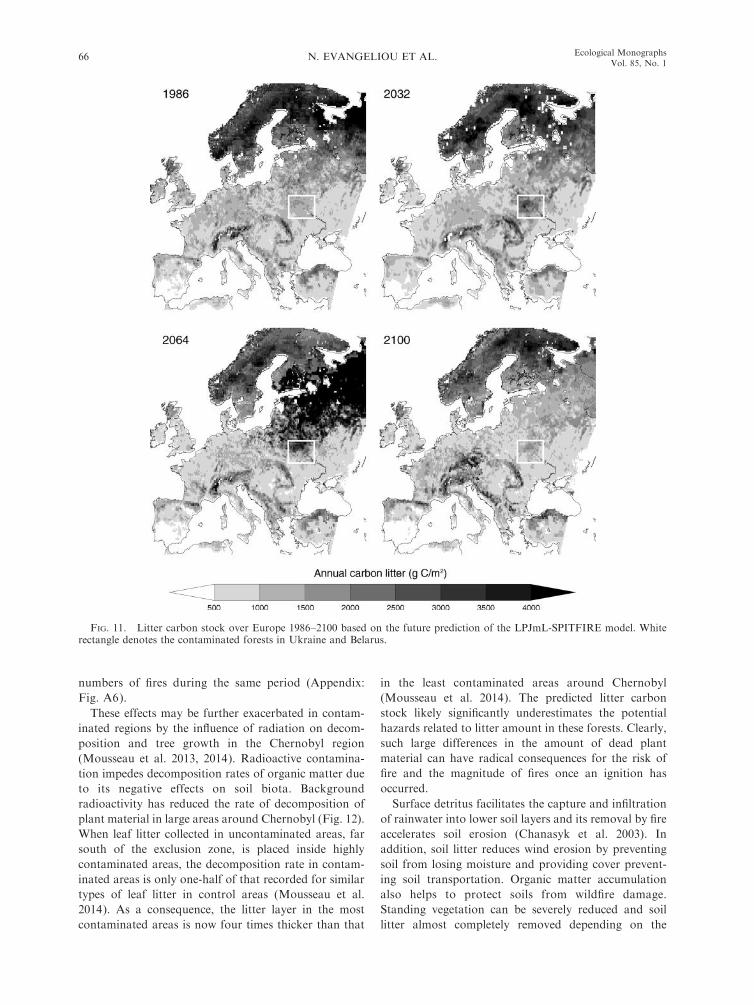
(as a whole) remains at the same level (Fig. 11).
However, the situation in the contaminated areas
changes after 2060, when litter carbon storage in
Belarus reaches a maximum after having increased
around 2.5 times since 1986 (Fig. 7 and Appendix: Fig.
A6). The same trend is observed in Chernobyl, with
litter carbon increasing by a factor of 2 after 1986
reaching the 2010 values (;2400 g C/m2). According to
the LPJmL-SPITFIRE model, litter carbon stocks in
Chernobyl and Belarus gradually decrease again after
2070, as they are probably consumed by increasing
February 2015 65FIRE EVOLUTION IN RADIOACTIVE FORESTS
numbers of fires during the same period (Appendix:
Fig. A6).
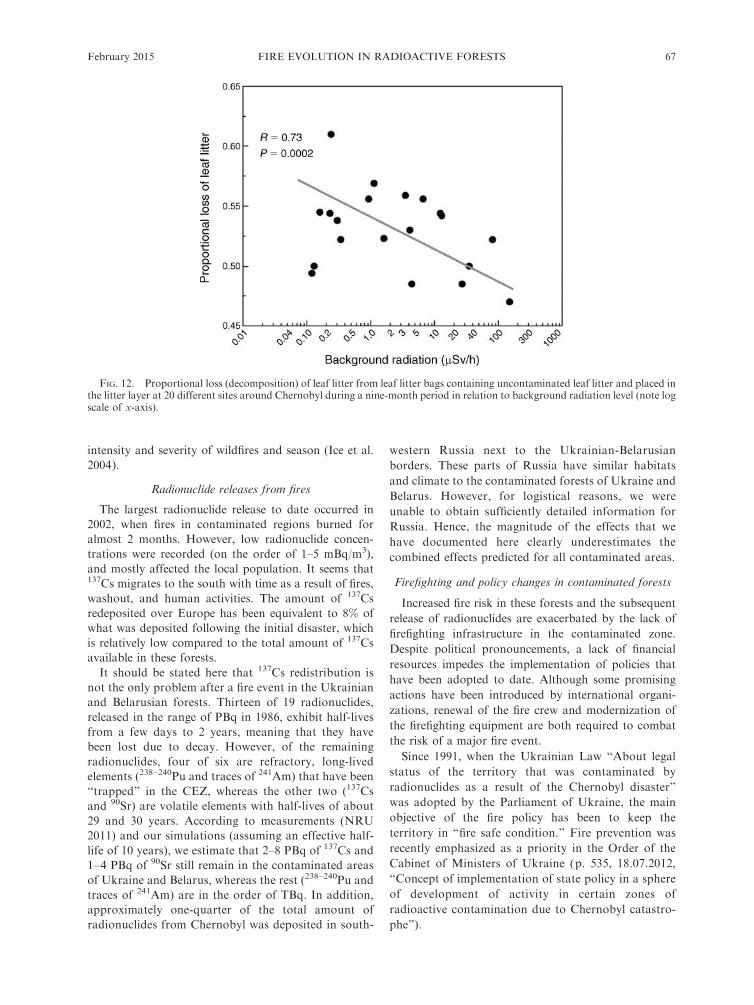
These effects may be further exacerbated in contam-
inated regions by the influence of radiation on decom-
position and tree growth in the Chernobyl region
(Mousseau et al. 2013, 2014). Radioactive contamina-
tion impedes decomposition rates of organic matter due
to its negative effects on soil biota. Background
radioactivity has reduced the rate of decomposition of
plant material in large areas around Chernobyl (Fig. 12).
When leaf litter collected in uncontaminated areas, far
south of the exclusion zone, is placed inside highly
contaminated areas, the decomposition rate in contam-
inated areas is only one-half of that recorded for similar
types of leaf litter in control areas (Mousseau et al.
2014). As a consequence, the litter layer in the most
contaminated areas is now four times thicker than that
in the least contaminated areas around Chernobyl
(Mousseau et al. 2014). The predicted litter carbon
stock likely significantly underestimates the potential
hazards related to litter amount in these forests. Clearly,
such large differences in the amount of dead plant
material can have radical consequences for the risk of
fire and the magnitude of fires once an ignition has
occurred.
Surface detritus facilitates the capture and infiltration
of rainwater into lower soil layers and its removal by fire
accelerates soil erosion (Chanasyk et al. 2003). In
addition, soil litter reduces wind erosion by preventing
soil from losing moisture and providing cover prevent-
ing soil transportation. Organic matter accumulation
also helps to protect soils from wildfire damage.
Standing vegetation can be severely reduced and soil
litter almost completely removed depending on the
FIG. 11. Litter carbon stock over Europe 1986–2100 based on the future prediction of the LPJmL-SPITFIRE model. Whiterectangle denotes the contaminated forests in Ukraine and Belarus.
N. EVANGELIOU ET AL.66 Ecological MonographsVol. 85, No. 1
intensity and severity of wildfires and season (Ice et al.
2004).
Radionuclide releases from fires
The largest radionuclide release to date occurred in
2002, when fires in contaminated regions burned for
almost 2 months. However, low radionuclide concen-
trations were recorded (on the order of 1–5 mBq/m3),
and mostly affected the local population. It seems that137Cs migrates to the south with time as a result of fires,
washout, and human activities. The amount of 137Cs
redeposited over Europe has been equivalent to 8% of
what was deposited following the initial disaster, which
is relatively low compared to the total amount of 137Cs
available in these forests.
It should be stated here that 137Cs redistribution is
not the only problem after a fire event in the Ukrainian
and Belarusian forests. Thirteen of 19 radionuclides,
released in the range of PBq in 1986, exhibit half-lives
from a few days to 2 years, meaning that they have
been lost due to decay. However, of the remaining
radionuclides, four of six are refractory, long-lived
elements (238–240Pu and traces of 241Am) that have been
‘‘trapped’’ in the CEZ, whereas the other two (137Cs
and 90Sr) are volatile elements with half-lives of about
29 and 30 years. According to measurements (NRU
2011) and our simulations (assuming an effective half-
life of 10 years), we estimate that 2–8 PBq of 137Cs and
1–4 PBq of 90Sr still remain in the contaminated areas
of Ukraine and Belarus, whereas the rest (238–240Pu and
traces of 241Am) are in the order of TBq. In addition,
approximately one-quarter of the total amount of
radionuclides from Chernobyl was deposited in south-
western Russia next to the Ukrainian-Belarusian
borders. These parts of Russia have similar habitats
and climate to the contaminated forests of Ukraine and
Belarus. However, for logistical reasons, we were
unable to obtain sufficiently detailed information for
Russia. Hence, the magnitude of the effects that we
have documented here clearly underestimates the
combined effects predicted for all contaminated areas.
Firefighting and policy changes in contaminated forests
Increased fire risk in these forests and the subsequent
release of radionuclides are exacerbated by the lack of
firefighting infrastructure in the contaminated zone.
Despite political pronouncements, a lack of financial
resources impedes the implementation of policies that
have been adopted to date. Although some promising
actions have been introduced by international organi-
zations, renewal of the fire crew and modernization of
the firefighting equipment are both required to combat
the risk of a major fire event.
Since 1991, when the Ukrainian Law ‘‘About legal
status of the territory that was contaminated by
radionuclides as a result of the Chernobyl disaster’’
was adopted by the Parliament of Ukraine, the main
objective of the fire policy has been to keep the
territory in ‘‘fire safe condition.’’ Fire prevention was
recently emphasized as a priority in the Order of the
Cabinet of Ministers of Ukraine (p. 535, 18.07.2012,
‘‘Concept of implementation of state policy in a sphere
of development of activity in certain zones of
radioactive contamination due to Chernobyl catastro-
phe’’).
FIG. 12. Proportional loss (decomposition) of leaf litter from leaf litter bags containing uncontaminated leaf litter and placed inthe litter layer at 20 different sites around Chernobyl during a nine-month period in relation to background radiation level (note logscale of x-axis).
February 2015 67FIRE EVOLUTION IN RADIOACTIVE FORESTS
With an emphasis on prevention, firefighting capac-
ities have not been given enough attention in the area.
During 1986–1992, professional firefighters at the
Chernobyl Fire Station were responsible for forest
firefighting; however, in practice, this staff was mainly
trained for suppressing infrastructural fires, not wild-
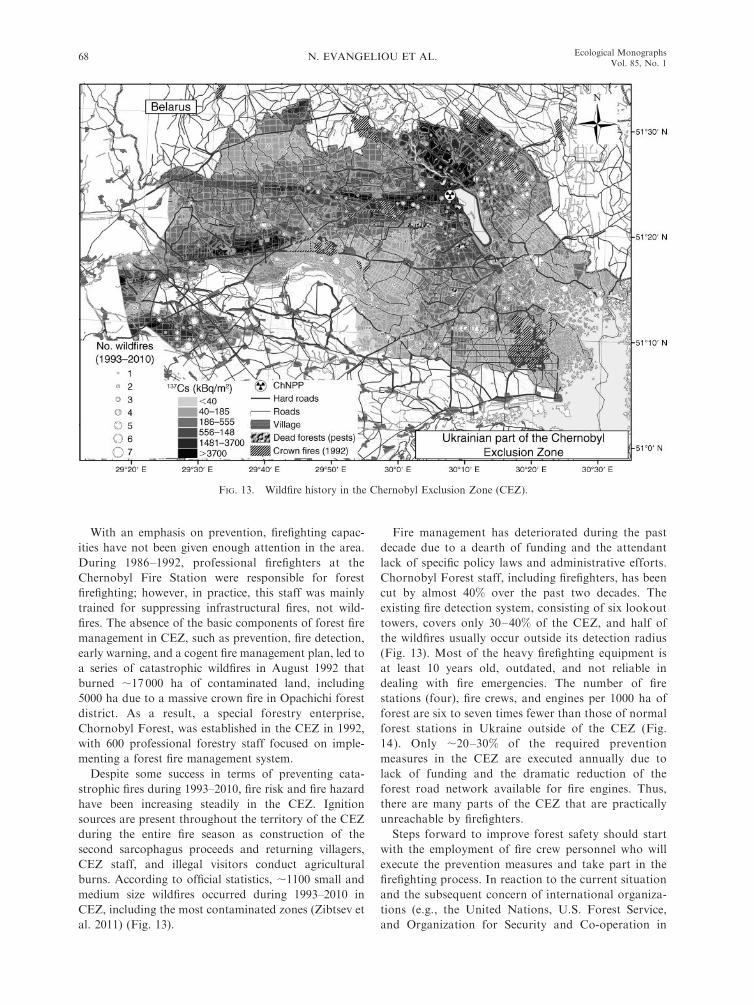
fires. The absence of the basic components of forest fire
management in CEZ, such as prevention, fire detection,
early warning, and a cogent fire management plan, led to
a series of catastrophic wildfires in August 1992 that
burned ;17 000 ha of contaminated land, including
5000 ha due to a massive crown fire in Opachichi forest
district. As a result, a special forestry enterprise,
Chornobyl Forest, was established in the CEZ in 1992,
with 600 professional forestry staff focused on imple-
menting a forest fire management system.
Despite some success in terms of preventing cata-
strophic fires during 1993–2010, fire risk and fire hazard
have been increasing steadily in the CEZ. Ignition
sources are present throughout the territory of the CEZ
during the entire fire season as construction of the
second sarcophagus proceeds and returning villagers,
CEZ staff, and illegal visitors conduct agricultural
burns. According to official statistics, ;1100 small and
medium size wildfires occurred during 1993–2010 in
CEZ, including the most contaminated zones (Zibtsev et
al. 2011) (Fig. 13).
Fire management has deteriorated during the past
decade due to a dearth of funding and the attendant
lack of specific policy laws and administrative efforts.
Chornobyl Forest staff, including firefighters, has been
cut by almost 40% over the past two decades. The
existing fire detection system, consisting of six lookout
towers, covers only 30–40% of the CEZ, and half of
the wildfires usually occur outside its detection radius
(Fig. 13). Most of the heavy firefighting equipment is
at least 10 years old, outdated, and not reliable in
dealing with fire emergencies. The number of fire
stations (four), fire crews, and engines per 1000 ha of
forest are six to seven times fewer than those of normal
forest stations in Ukraine outside of the CEZ (Fig.
14). Only ;20–30% of the required prevention
measures in the CEZ are executed annually due to
lack of funding and the dramatic reduction of the
forest road network available for fire engines. Thus,
there are many parts of the CEZ that are practically
unreachable by firefighters.
Steps forward to improve forest safety should start
with the employment of fire crew personnel who will
execute the prevention measures and take part in the
firefighting process. In reaction to the current situation
and the subsequent concern of international organiza-
tions (e.g., the United Nations, U.S. Forest Service,
and Organization for Security and Co-operation in
FIG. 13. Wildfire history in the Chernobyl Exclusion Zone (CEZ).
N. EVANGELIOU ET AL.68 Ecological MonographsVol. 85, No. 1
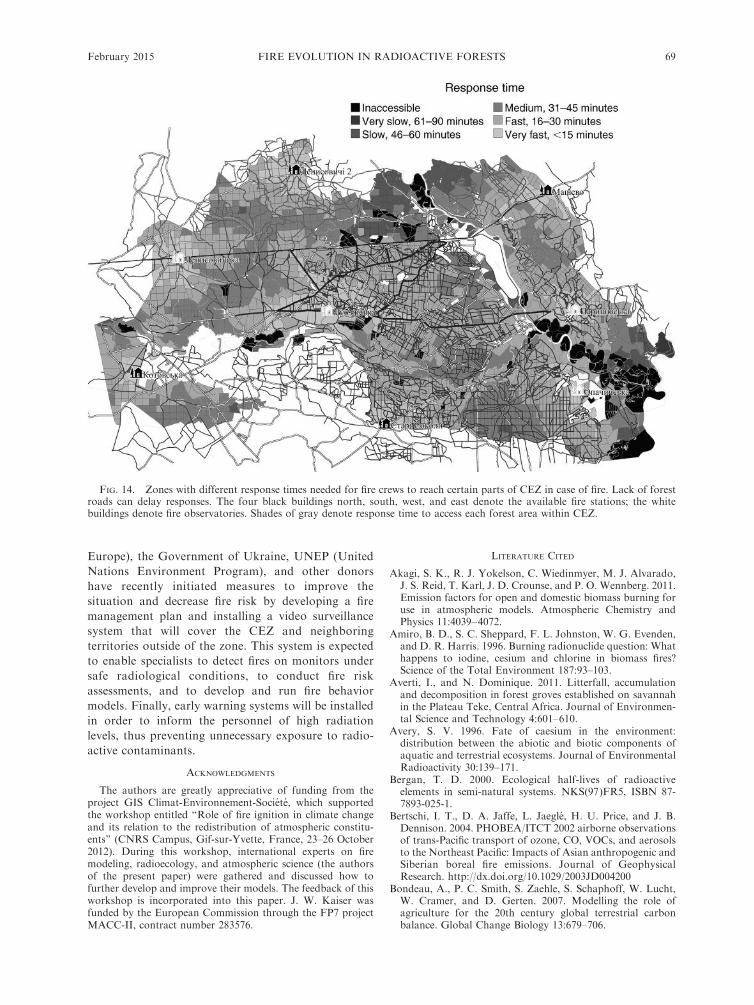
Europe), the Government of Ukraine, UNEP (United
Nations Environment Program), and other donors
have recently initiated measures to improve the
situation and decrease fire risk by developing a fire
management plan and installing a video surveillance
system that will cover the CEZ and neighboring
territories outside of the zone. This system is expected
to enable specialists to detect fires on monitors under
safe radiological conditions, to conduct fire risk
assessments, and to develop and run fire behavior
models. Finally, early warning systems will be installed
in order to inform the personnel of high radiation
levels, thus preventing unnecessary exposure to radio-
active contaminants.
ACKNOWLEDGMENTS
The authors are greatly appreciative of funding from theproject GIS Climat-Environnement-Societe, which supportedthe workshop entitled ‘‘Role of fire ignition in climate changeand its relation to the redistribution of atmospheric constitu-ents’’ (CNRS Campus, Gif-sur-Yvette, France, 23–26 October2012). During this workshop, international experts on firemodeling, radioecology, and atmospheric science (the authorsof the present paper) were gathered and discussed how tofurther develop and improve their models. The feedback of thisworkshop is incorporated into this paper. J. W. Kaiser wasfunded by the European Commission through the FP7 projectMACC-II, contract number 283576.
LITERATURE CITED
Akagi, S. K., R. J. Yokelson, C. Wiedinmyer, M. J. Alvarado,J. S. Reid, T. Karl, J. D. Crounse, and P. O. Wennberg. 2011.Emission factors for open and domestic biomass burning foruse in atmospheric models. Atmospheric Chemistry andPhysics 11:4039–4072.
Amiro, B. D., S. C. Sheppard, F. L. Johnston, W. G. Evenden,and D. R. Harris. 1996. Burning radionuclide question: Whathappens to iodine, cesium and chlorine in biomass fires?Science of the Total Environment 187:93–103.
Averti, I., and N. Dominique. 2011. Litterfall, accumulationand decomposition in forest groves established on savannahin the Plateau Teke, Central Africa. Journal of Environmen-tal Science and Technology 4:601–610.
Avery, S. V. 1996. Fate of caesium in the environment:distribution between the abiotic and biotic components ofaquatic and terrestrial ecosystems. Journal of EnvironmentalRadioactivity 30:139–171.
Bergan, T. D. 2000. Ecological half-lives of radioactiveelements in semi-natural systems. NKS(97)FR5, ISBN 87-7893-025-1.
Bertschi, I. T., D. A. Jaffe, L. Jaegle, H. U. Price, and J. B.Dennison. 2004. PHOBEA/ITCT 2002 airborne observationsof trans-Pacific transport of ozone, CO, VOCs, and aerosolsto the Northeast Pacific: Impacts of Asian anthropogenic andSiberian boreal fire emissions. Journal of GeophysicalResearch. http://dx.doi.org/10.1029/2003JD004200
Bondeau, A., P. C. Smith, S. Zaehle, S. Schaphoff, W. Lucht,W. Cramer, and D. Gerten. 2007. Modelling the role ofagriculture for the 20th century global terrestrial carbonbalance. Global Change Biology 13:679–706.
FIG. 14. Zones with different response times needed for fire crews to reach certain parts of CEZ in case of fire. Lack of forestroads can delay responses. The four black buildings north, south, west, and east denote the available fire stations; the whitebuildings denote fire observatories. Shades of gray denote response time to access each forest area within CEZ.
February 2015 69FIRE EVOLUTION IN RADIOACTIVE FORESTS
Breshears, D. D., et al. 2005. Regional vegetation die-off inresponse to global-change-type drought. Proceedings of theNational Academy of Sciences USA 102:15144–15148.
Bunzl, K., and W. Kracke. 1984. The distribution of lead-210,polonium-210, stable lead and fallout caesium-137 in soil,plants and moorland sheep of a heath. Science of the TotalEnvironment 39:143–160.
Cary, G. J., R. E. Kean, R. H. Gardner, S. Lavorel, M.Flannigan, I. D. Davies, C. Li, J. M. Lenihan, T. S. Rupp,and F. Mouillot. 2006. Comparison of the sensitivity oflandscape fire succession models to variations in terrain, fuelpattern, climate and weather. Landscape Ecology 21:121–137.
Chanasyk, D. S., I. R. Whitson, E. Mapfumo, J. M. Burke, andE. E. Prepas. 2003. The impacts of forest harvest and wildfireon soils and hydrology in temperate forests: a baseline todevelop hypotheses for the boreal plain. Journal of Environ-mental Engineering and Science 2:S51–S62.
Chin, M., P. Ginoux, S. Kinne, O. Torres, B. Holben, B. N.Duncan, R. V. Martin, J. A. Logan, A. Higurashi, and T.Nakajima. 2002. Tropospheric aerosol optical thickness fromthe GOCART model and comparisons with satellite andsunphotometer measurements. Journal of AtmosphericScience 59:461–483.
Cofer, W. R., E. L. Winstead, B. J. Stocks, L. W. Overbay,J. G. Goldammer, D. R. Cahoon, and J. S. Levine. 1996.Emissions from boreal forest fires: Are the atmosphericimpacts underestimated? Pages 834–839 in J. S. Levine,editor. Biomass burning and global change. MIT Press,Cambridge, Massachusetts, USA.
Covington, W. W. 1981. Changes in forest floor organic-matterand nutrient content following clear cutting in NorthernHardwoods. Ecology 62:41–48.
Dancause, K. N., L. Yevtushok, S. Lapchenko, I. Shumlyan-sky, G. Shevchenko, W. Wertelecki, and R. M. Garruto.2010. Chronic radiation exposure in the Rivne-Polissia regionof Ukraine: Implications for birth defects. American Journalof Human Biology 22:667–674.
De Brouwer, S., Y. Thiry, and C. Myttenaere. 1994. Availabil-ity and fixation of radiocaesium in a forest brown acid soil.Science of the Total Environment 143:183–191.
De Cort, M., et al. 1998. Atlas of caesium deposition on Europeafter the Chernobyl accident. Office for Official Publicationsof the European Communities, EUR 16733, Luxembourg.
European Centre for Medium-range Weather Forecasts(ECMWF). 2002. ERA-40, forty-year European re-analysisof the global atmosphere. http://www.ecmwf.int/products/data/archive/descriptions/e4
Evangeliou, N., Y. Balkanski, A. Cozic, and A. P. Møller. 2013.Simulations of the transport and deposition of 137Cs overEurope after the Chernobyl NPP accident: Influence ofvarying emission-altitude and model horizontal and verticalresolution. Atmospheric Chemistry and Physics 13:7183–7198.
Filipovic-Vincekovic, N., D. Barisic, N. Masic, and S. Lulic.1991. Distribution of fallout radionuclides through soilsurface layer. Journal of Radioanalytical and NuclearChemistry Archives 148:53–62.
Fisher, R. F., and D. Binkley. 2000. Ecology and managementof forest soils. Third edition. Wiley, New York, New York,USA.
Food and Agriculture Organization of the United Nations(FAO). 2013. Statistics at FAO. http://faostat.fao.org/site/291/default.aspx
Freitas, S. R., K. M. Longo, R. Chatfield, D. Latham, M. A. F.Silva Dias, M. O. Andreae, E. Prins, J. C. Santos, R. Gielow,and J. A. Carvalho, Jr. 2007. Including the sub-grid scaleplume rise of vegetation fires in low resolution atmospherictransport models. Atmospheric Chemistry and Physics7:3385–3398.
Freitas, S. R., K. M. Longo, J. Trentmann, and D. Latham.2010. Technical Note: Sensitivity of 1-D smoke plume rise
models to the inclusion of environmental wind drag.Atmospheric Chemistry and Physics 10:585–594.
Fromm, M. D., and R. Servranckx. 2003. Transport of firesmoke above the tropopause by supercell convection.Geophysical Research Letters 30:1542.
Fromm, M., O. Torres, D. Diner, D. Lindsey, B. Vant Hull, R.Servranckx, E. P. Shettle, and Z. Li. 2008. Stratosphericimpact of the Chisholm pyrocumulonimbus eruption: 1. Earth-viewing satellite perspective. Journal of Geophysical Research113:D08202. http://dx.doi.org/10.1029/2007JD009153
Gerten, D., S. Schaphoff, U. Haberlandt, W. Lucht, and S.Sitch. 2004. Terrestrial vegetation and water balance—hydrological evaluation of a dynamic global vegetationmodel. Journal of Hydrology 286:249–270.
Giglio, L., J. T. Randerson, G. R. van der Werf, P. S.Kasibhatla, G. J. Collatz, D. C. Morton, and R. S. DeFries.2010. Assessing variability and long-term trends in burnedarea by merging multiple satellite fire products. Biogeoscien-ces 7:1171–1186.
Hansen, M. C., et al. 2013. High resolution global maps of 21stcentury forest cover change. Science 342:850–853.
Hao, W. M., O. O. Bondarenko, S. Zibtsev, and D. Hutton.2009. Vegetation fires, smoke emissions, and dispersion ofradionuclides in the Chernobyl Exclusion Zone. Pages 265–275 in A. Bytnerowicz, M. J. Arbaugh, A. R. Riebau, and C.Andersen, editors. Developments in environmental science.Volume 8. Elsevier, Amsterdam, The Netherlands.
Hashimoto, S., S. Ugawa, K. Nanko, and K. Shichi. 2012. Thetotal amounts of radioactively contaminated materials inforests in Fukushima. Japanese Scientific Reports. http://dx.doi.org/10.1038/srep00416
Hessl, A. E., D. McKenzie, and R. Schellhaas. 2004. Droughtand Pacific decadal oscillation linked to fire occurrence in theinland Pacific Northwest. Ecological Applications 14:425–442.
Horrill, A. D., V. H. Kennedy, I. S. Paterson, and G. M.McGowan. 1995. The effect of heather burning on thetransfer of radiocaesium to smoke and the solubility ofradiocaesium associated with different types of heather ash.Journal of Environmental Radioactivity 29:1–10.
Hourdin, F., and J. P. Issartel. 2000. Sub-surface nuclear testsmonitoring through the CTBT xenon network. GeophysicalResearch Letters 27:2245–2248.
Ice, G. G., D. G. Neary, and P. W. Adams. 2004. Effects ofwildfire on soils and watershed processes. Journal of Forestry102:16–20.
International Atomic Energy Agency (IAEA). 2001. Presentand future environmental impact of the Chernobyl accident.IAEA, Vienna, Austria.
International Atomic Energy Agency (IAEA). 2005. Regula-tions for the safe transport of radioactive material. IAEA,Vienna, Austria.
International Atomic Energy Agency (IAEA). 2006. Cherno-byl’s legacy: health, environmental and socio-economicimpacts and recommendations to the governments of Belarus,the Russian Federation and Ukraine. The Chernobyl forum:2003–2005. Second revised version. IAEA, Vienna, Austria.http://www.iaea.org/Publications/Booklets/Chernobyl/chernobyl.pdf
International Atomic Energy Agency (IAEA). 2009. Regula-tions for the safe transport of radioactive material. IAEA,Vienna, Austria.
International Energy Agency (IEA). 2013. World energystatistics and balances. http://www.oecd-ilibrary.org/statistics
International Radioecology Laboratory (IRL). 2013. Radio-ecology research of the Red Forest Proving Ground, Kyiv,Ukraine. International Radioecology Laboratory, ChernobylCenter for Nuclear Safety, Radioactive Waste and Radio-ecology. http://www.chornobyl.net/en/index.php?newsid¼1174890890
N. EVANGELIOU ET AL.70 Ecological MonographsVol. 85, No. 1
Joint Research Centre (JRC). 2014. EFFIS—European ForestFire Information System. http://forest.jrc.ec.europa.eu/effis/applications/fire-history/
Kahn, R. A., Y. Chen, D. L. Nelson, F.-Y. Leung, Q. Li, D. J.Diner, and J. A. Logan. 2008. Wildfire smoke injectionheights—two perspectives from space. Geophysical ResearchLetters 35:L04809.
Kashparov, V. A., S. M. Lundin, S. I. Zvarich, V. I.Yoschenko, S. E. Levtchuk, Y. V. Khomutinin, I. N.Maloshtan, and V. P. Protsak. 2003. Territory contaminationwith the radionuclides representing the fuel component ofChernobyl fallout. Science of the Total Environment317:105–119.
Kempeneers, P., F. Sedano, L. Seebach, P. Strobl, and J. San-Miguel-Ayanz. 2011. Data fusion of different spatialresolution remote sensing images applied to forest typemapping. IEEE Transactions on Geoscience and RemoteSensing 49:4977–4986.
Krawchuk, M. A., and M. A. Moritz. 2011. Constraints onglobal fire activity vary across a resource gradient. Ecology92:121–132.
Kristiansen, N. I., A. Stohl, and G. Wotawa. 2012. Atmo-spheric removal times of the aerosol-bound radionuclides137Cs and 131I measured after the Fukushima Dai-ichi nuclearaccident—a constraint for air quality and climate models.Atmospheric Chemistry and Physics 12:10759–10769.
Lavoue, D., C. Liousse, H. Cachier, B. J. Stocks, and J. G.Goldammer. 2000. Modeling of carbonaceous particlesemitted by boreal and temperate wildfires at northernlatitudes. Journal of Geophysical Research 105:26871–26890.
Leung, F.-Y., J. A. Logan, R. Park, E. Hyer, E. Kasischke, D.Streets, and L. Yurganov. 2007. Impacts of enhancedbiomass burning in the boreal forests in 1998 on troposphericchemistry and the sensitivity of model results to the injectionheight of emissions. Journal of Geophysical Research112:D10313.
Linkov, I., S. Yoshida, and M. Steiner. 2000. Fungi contam-inated by radionuclides: critical review of approaches tomodeling. In Proceedings of the 10th International Congressof the International Radiation Protection Association(IRPA-10), Hiroshima, Japan, 14–19 May 2000, P-4b-255.http://www.irpa.net/irpa10/cdrom/00967.pdf
Long, N. Q., Y. Truong, P. D. Hien, N. T. Binh, L. N. Sieu,T. V. Giap, and N. T. Phan. 2012. Atmospheric radionuclidesfrom the Fukushima Dai-ichi nuclear reactor accidentobserved in Vietnam. Journal of Environmental Radioactiv-ity 111:53–58.
Lujanieneo, G., A. Plukis, E. Kimtys, V. Remeikis, D.Jankunaiteo, and B. I. Ogorodnikov. 2002. Study of 137Cs,90Sr, 239,240Pu, 238Pu and 241Am behavior in the Chernobylsoil. Journal of Radioanalytical and Nuclear Chemistry251:59–68.
MacGarigal, K., and B. Marks. 1994. Fragstats: spatial patternanalysis program for quantifying landscape structure. Ver-sion 3. Oregon State University, Corvallis, Oregon, USA.
Masson, O., et al. 2011. Tracking of airborne radionuclidesfrom the damaged Fukushima Dai-Ichi nuclear reactors byEuropean networks. Environmental Science and Technology45:7670–7677.
McDowell, N., et al. 2008. Mechanisms of plant survival andmortality during drought: why do some plants survive whileothers succumb to drought? New Phytologist 178:719–739.
McMullin, S., G. K. Giovanetti, M. P. Green, R. Henning, R.Holmes, K. Vorren, and J. F. Wilkerson. 2012. Measurementof airborne fission products in Chapel Hill, NC, USA fromthe Fukushima Dai-ichi reactor accident. Journal of Envi-ronmental Radioactivity 112:165–170.
Møller, A. P., A. Bonisoli-Alquati, G. Rudolfsen, and T. A.Mousseau. 2012. Elevated mortality among birds in Cher-nobyl as judged from skewed age and sex ratios. PLoS ONE7:e35223.
Møller, A. P., K. A. Hobson, T. A. Mousseau, and A. M.Peklo. 2006. Chernobyl as a population sink for BarnSwallows: tracking dispersal using stable isotope profiles.Ecological Applications 16:1696–1705.
Møller, A. P., and T. A. Mousseau. 2013. Assessing effects ofradiation on abundance of mammals and predator–preyinteractions in Chernobyl using tracks in the snow. Ecolog-ical Indicators 26:112–116.
Mouillot, F., M. G. Schultz, C. Yue, P. Cadule, K. Tansey, P.Ciais, and E. Chuvieco. 2014. Ten years of global burnedarea products from spaceborne remote sensing—a review:analysis of user needs and recommendations for futuredevelopments. International Journal of Applied EarthObservation and Geoinformation 26:64–79.
Mousseau, T. A., G. Milinevsky, J. Kenney-Hunt, and A. P.Møller. 2014. Highly reduced mass loss rates and increasedlitter layer in radioactively contaminated areas. Oecologia175:429–437.
Mousseau, T. A., S. M. Welch, I. Chizhevsky, O. Bondarenko,G. Milinevsky, D. J. Tedeschi, A. Bonisoli-Alquati, and A. P.Møller. 2013. Tree rings reveal extent of exposure to ionizingradiation in Scots pine Pinus sylvestris. Trees 27:1443–1453.
National Report of Ukraine (NRU). 2011. Reports Proceed-ings, conclusions and recommendations. In Twenty-five yearsafter Chernobyl accident. Safety for the future. Proceedingsof the International Conference, April 20–22, KIM Kyiv,Ukraine. Government of Ukraine, Kiev, Ukraine.
Nuclear Energy Agency (NEA). 2002. Chernobyl: assessment ofradiological and health impacts. 2002 Update of Chernobyl:ten years on. Organisation for Economic Co-Operation andDevelopment, Paris, France. https://www.oecd-nea.org/rp/reports/2003/nea3508-chernobyl.pdf
Paatero, J., J. Vira, M. Siitari-Kauppi, J. Hatakka, K. Holmen,and Y. Viisanen. 2012. Airborne fission products in the highArctic after the Fukushima nuclear accident. Journal ofEnvironmental Radioactivity 114:41–47.
Paliouris, G., H. W. Taylor, R. W. Wein, J. Svoboda, and B.Mierzynski. 1995. Fire as an agent in redistributing fallout137Cs in the Canadian boreal forest. Science of the TotalEnvironment 160/161:153–166.
Paugam, R., M. Wooster, G. Papadakis, and M. Schultz. 2010.Estimation of the injection height of biomass burningemission. In Proceedings of the ESA-iLEAPS-EGU jointconference, Frascati, Italy.
Piga, D. 2010. Residence time of Cs-137 in the atmosphere.Dissertation. Universite du Sud Toulon, Var, France.
Poiarkov, V. A. 1995. Post-Chernobyl radiomonitoring of theforest ecosystem. Journal of Radioanalytical and NuclearChemistry Archives 194:259–267.
Potter, C. S., J. T. Randerson, C. B. Field, P. A. Matson, P. M.Vitousek, H. A. Mooney, and S. A. Klooster. 1993.Terrestrial ecosystem production: a process model based onglobal satellite and surface data. Global BiogeochemicalCycles 7:811–841.
Raffa, K. F., B. H. Aukema, B. J. Bentz, A. L. Carroll, J. A.Hicke, M. G. Turner, and W. F. Romme. 2008. Cross-scaledrivers of natural disturbances prone to anthropogenicamplification: the dynamics of bark beetle eruptions.BioScience 58:501–517.
R Development Core Team. 2014. R 3.1.0. R Project forStatistical Computing, Vienna, Austria. www.r-project.org
Raich, J. W., A. E. Russell, K. Kitayama, W. J. Parton, andP. M. Vitousek. 2006. Temperature influences carbonaccumulation in moist tropical forests. Ecology 87:76–87.
Rio, C., F. Hourdin, and A. Chedin. 2010. Numericalsimulation of tropospheric injection of biomass burningproducts by pyro-thermal plumes. Atmospheric Chemistryand Physics 10:3463–3478.
Scafetta, N., and B. J. West. 2006. Phenomenological solarcontribution to the 1900–2000 global surface warming.Geophysical Research Letters 33:L05708.
February 2015 71FIRE EVOLUTION IN RADIOACTIVE FORESTS
Schlesinger, W. H. 1997. Biogeochemistry: an analysis of globalchange. Second edition. Academic Press, San Diego,California, USA.
Shand, C. A., M. V. Cheshire, S. Smith, M. Vidal, and G.Rauret. 1994. Distribution of radiocaesium in organic soils.Journal of Environmental Radioactivity 23:285–302.
Sitch, S., et al. 2003. Evaluation of ecosystem dynamics, plantgeography and terrestrial carbon cycling in the LPJ DynamicGlobal Vegetation Model. Global Change Biology 9:161–185.
Smith, J. E., and L. S. Heath. 2002. A model of forest floorcarbon mass for United States forest types. Research PaperNE-722. USDA Forest Service, Newtown Square, Pennsyl-vania, USA.
Sofiev, M., T. Ermakova, and R. Vankevich. 2012. Evaluationof the smoke injection height from wild-land fires usingremote sensing data. Atmospheric Chemistry and Physics12:1995–2006.
Sofiev, M., R. Vankevich, T. Ermakova, and J. Hakkarainen.2013. Global mapping of maximum emission heights andresulting vertical profiles of wildfire emissions. AtmosphericChemistry and Physics 13:7039–7052.
Szopa, S., et al. 2012. Aerosol and Ozone changes as forcing forclimate evolution between 1850 and 2100. Climate Dynamics40:2223–2250.
Tanaka, K., Y. Takahashi, A. Sakaguchi, M. Umeo, S.Hayakawa, H. Tanida, T. Saito, and Y. Kanai. 2012. Verticalprofiles of Iodine-131 and Cesium-137 in soils in FukushimaPrefecture related to the Fukushima Daiichi nuclear powerstation accident. Geochemistry Journal 46:73–76.
Thonicke, K., A. Spessa, I. C. Prentice, S. P. Harrison, L.Dong, and C. Carmona-Moreno. 2010. The influence ofvegetation, fire spread and fire behaviour on biomass burningand trace gas emissions: results from a process-based model.Biogeosciences 7:1991–2011.
Thonicke, K., S. Venevsky, S. Sitch, and W. Cramer. 2001. Therole of fire disturbance for global vegetation dynamics:coupling fire into a dynamic global vegetation model. GlobalEcology and Biogeography 10:661–678.
United Nations Development Programme (UNDP) and UnitedNations Children’s Fund (UNICEF). 2002. The humanconsequences of the Chernobyl nuclear accident. UNDP andUNICEF, New York, New York, USA. http://www.unicef.org/newsline/chernobylreport.pdf
Urbanski, S. P., W. M. Hao, and B. Nordgren. 2011. Thewildland fire emission inventory: western United Statesemission estimates and an evaluation of uncertainty. Atmo-spheric Chemistry and Physics 11:12973–13000.
Urbanski, S. P., J. M. Salmon, B. L. Nordgren, and W. M.Hao. 2009. A MODIS direct broadcast algorithm formapping wildfire burned area in the western United States.Remote Sensing of Environment 113:2511–2526.
Val Martin, M., C. L. Heald, B. Ford, A. J. Prenni, and C.Wiedinmyer. 2013. A decadal satellite analysis of the originsand impacts of smoke in Colorado. Atmospheric Chemistryand Physics 13:7429–7439.
Val Martin, M., J. A. Logan, R. Kahn, F.-Y. Leung, D.Nelson, and D. Diner. 2010. Smoke injection heights fromfires in North America: Analysis of five years of satellite
observations. Atmospheric Chemistry and Physics 10:1491–1510.
van der Werf, G. R., J. T. Randerson, and G. J. Collatz. 2003.Carbon emissions from fires in the tropical and subtropicalecosystems. Global Change Biology 9:547–562.
van der Werf, G. R., J. T. Randerson, L. Giglio, G. J. Collatz,M. Mu, P. S. Kasibhatla, D. C. Morton, R. S. DeFries, Y.Jin, and van T. T. Leeuwen. 2010. Global fire emissions andthe contribution of deforestation, savanna, forest, agricul-tural, and peat fires (1997–2009). Atmospheric Chemistryand Physics 10:11707–11735.
van Mantgem, P. J., and N. L. Stephenson. 2007. Apparentclimatically-induced increase of mortality rates in a temper-ate forest. Ecological Letters 10:909–916.
van Mantgem, P. J., N. L. Stephenson, L. S. Mutch, V. G.Johnson, A. M. Esperanza, and D. J. Parsons. 2003. Growthrate predicts mortality of Abies concolor in both burned andunburned stands. Canadian Journal of Forest Research33:1029–1038.
Vicente-Serrano, S. M., S. Beguerıa, J. Lorenzo-Lacruz, J. J.Camarero, J. I. Lopez-Moreno, C. Azorin-Molina, J.Revuelto, E. Moran-Tejeda, and A. Sanchez-Lorenzo.2012. Performance of drought indices for ecological, agricul-tural, and hydrological applications. Earth Interactions 16:1–27.
Wang, R., et al. 2013. High-resolution mapping of combustionprocesses and implications for CO2 emissions. AtmosphericChemistry and Physics 13:5189–5203.
Westerling, A. L., H. G. Hidalgo, D. R. Cayan, and T. W.Swetnam. 2006. Warming and earlier spring increase westernU.S. forest wildfire activity. Science 313:940–943.
Williams, A. P., et al. 2013. Temperature as a potent driver ofregional forest drought stress and tree mortality. NatureClimate Change 3:292–297.
Woodhead, D. S. 1973. Levels of radioactivity in the marineenvironment and the dose commitment to the marineorganisms. IAEA, Vienna, Austria.
Xiao, J., and Q. Zhuang. 2007. Drought effects on large fireactivity in Canadian and Alaskan forests. EnvironmentalResearch Letters 2:044003.
Yablokov, A. V., V. B. Nesterenko, and A. V. Nesterenko.2009. Chernobyl: consequences of the catastrophe for peopleand nature. New York Academy of Sciences, New York,New York, USA.
Yoschenko, V. I., V. A. Kashparov, M. D. Melnychuk, S. E.Levchuk, Y. O. Bondar, M. Lazarev, M. I. Yoschenko, E. B.Farfan, and G. T. Jannik. 2011. Chronic irradiation of Scotspine trees (Pinus sylvestris) in the Chernobyl Exclusion Zone:dosimetry and radiobiological effects. Health Physics101:393–408.
Yoschenko, V. I., et al. 2006. Resuspension and redistributionof radionuclides during grassland and forest fires in theChernobyl exclusion zone: part I. Fire experiments. Journalof Environmental Radioactivity 86:143–163.
Zibtsev, S. V., C. D. Oliver, J. G. Goldammer, A. M. Hohl, andO. A. Borsuk. 2011. Wildfires management and riskassessment in the Chernobyl Nuclear Power Plant ExclusionZone. In: Twenty-five years after Chernobyl accident.Proceedings of the 5th International Wildland Fire Confer-ence, Sun City, South Africa, 9–13 May 2011.
SUPPLEMENTAL MATERIAL
Ecological Archives
The Appendix is available online: http://dx.doi.org/10.1890/14-1227.1.sm
Data Availability
Data associated with this paper have been deposited in Dryad: http://dx.doi.org/10.5061/dryad.33mn2
N. EVANGELIOU ET AL.72 Ecological MonographsVol. 85, No. 1


