Embed Size (px)
Citation preview


Financial Management www.IndigoLearn.com 1
1. TABLE OF CONTENTS
FINANCIAL MANAGEMENT – SCOPE AND OBJECTIVES ..................................................................................................... 2
TYPES OF FINANCE .......................................................................................................................................................... 15
RATIO ANALYSIS .............................................................................................................................................................. 44
COST OF CAPITAL ............................................................................................................................................................ 77
FINANCING DECISIONS - CAPITAL STRUCTURE ANALYSIS ............................................................................................... 99
FINANCING DECISIONS - LEVERAGES ............................................................................................................................ 120
Time value of money ..................................................................................................................................................... 137
INVESTMENT DECISIONS ............................................................................................................................................... 140
risk analysis in capital budgeting ................................................................................................................................... 178
DIVIDEND DECISIONS .................................................................................................................................................... 190
WORKING CAPITAL MANAGEMENT .............................................................................................................................. 210

Financial Management www.IndigoLearn.com 2
FINANCIAL MANAGEMENT – SCOPE AND OBJECTIVES
Meaning of financial management
Financial Management deals with procurement of funds and effective utilisation of funds in business. Financial management is that managerial activity which is concerned with the planning and controlling of the firm’s financial resources. It is an integrated decision-making process concerned with acquiring, financing and managing assets to accomplish the overall goal of a business organisation. It can also be stated as the process of planning decisions in order to maximise the shareholder’s wealth. Financial managers have a major role in cash management, acquisition of funds and in all aspects of raising and allocating capital. As far as business organisations are concerned, the objective of financial management is to maximise the value of business. “Financial management comprises the forecasting, planning, organising, directing, co-ordinating and controlling of all activities relating to acquisition and application of the financial resources of an undertaking in keeping with its financial objective.”
Two main aspects of the finance function
PROCUREMENT OF FUNDS: 1. Funds can be obtained from various sources like equity, preference
capital, debentures, term loans etc 2. Funds procured from various sources have different characteristics
in terms of risk, cost and control. 3. Funds can be procured from banks and financial institutions subject
to certain restrictions. 4. Funds can be obtained by retention of profits also, called retained earnings. 5. The cost of funds should be minimum. Hence, a proper balancing of risk and control
factors becomes essential.
Two main aspects of the Finance Function
Procurement of Funds
Effective Utilisation of Funds
Procurement of funds involves the following :
Identification of sources of finance
Determination of finance mix.
Division of profits between dividends and retention of
profits i.e. internal fund generation.
Raising of funds

Financial Management www.IndigoLearn.com 3
EFFECTIVE UTILISATION OF FUNDS:
Main characteristic features of sources of funds
The major considerations in procurement of funds are (a) Risk, (b) Cost and (c) Control. They differ with the type of fund.
Type of fund
Risk Cost Control
Own Funds (Equity)
Low Risk – No question of repayment of capital except when the company is under liquidation. No obligation to pay dividend. Hence, best from viewpoint of risk.
Most expensive –
Dividend expectations of shareholders are higher than interest rates. Also, dividends are not tax-deductible.
Companies are required to pay dividend distribution tax.
Dilution of control – If the capital base is expanded due to the involvement of new shareholders / public, then, the issue of shares is said to dilute the control.
Preference shares
Riskier than equity, but less risky than debentures or loans. Dividend is paid only out of profits, in priority over the equity. No security is provided to preference shareholders. However, there is an obligation to redeem the preference shares on maturity.
Costlier than debentures, but less expensive than equity. Dividend is not tax deductible. Companies are required to pay dividend distribution tax.
No dilution of control.
(EXCEPTION – in case of cumulative preference shares, if dividend is not paid for two consecutive years.)
1
• Funds are procured at a cost. Hence it is crucial to employ them properly
and profitably. Funds should not be kept idle. Idle funds have
opportunity cost.
2• The Finance Manager is responsible not only for procurement of funds but
also for its effective utilisation.
3•He analyses the financial implications of each decision – to invest in fixed assets, the
need for adequate working capital, etc.
4• He identifies the areas where funds remain idle and why they are not used
properly.

Financial Management www.IndigoLearn.com 4
Type of fund
Risk Cost Control
Loan Funds High risk – capital should be repaid as per agreement; Interest should be paid irrespective of profits being made.
Comparatively less expensive – rate of interest is lower than rate of preference dividend. Also, interest being a tax-deductible expense, it makes effective cost much lower.
No dilution of control.
(EXCEPTION - When loan is taken from financial institutions, they may appoint nominee directors. Banks and financial institutions may impose restrictive provisions on raising loans from other sources, end use of funds, etc.)
Evolution of financial management
Scope of financial management
The scope of financial management extends to all spheres of life, in all types of organisations and in all departments within the organisation.
3 Stages
Traditional Phase
During this phase, financial management was considered necessary only during occasional events such as takeovers, mergers, expansion, liquidation, etc.
Also, when taking financial decisions in the organisation, the needs of outsiders (like investment bankers, people who lend money to the business and other such people) to the business was kept in mind.
routine financial problems were ignored.
Transitional Phase
During this phase, the day-to-day problemsthat financial managers faced were given importance.
The general problems related to funds analysis, planning and control were given more attention in this phase.
Modern Phase
Modern phase is still going on. The scope of financial management has greatly increased now.
It is important to carry out financial analysis for a company. This analysis helps in decision making.
During this phase, many theories have been developed regarding efficient markets, capital budgeting, option pricing, valuation models and also in several other important fields in financial management.

Financial Management www.IndigoLearn.com 5
Financial management in all types of organisation
Financial management in all types of organisation
Financial management in all the departments of organisation
• Profit making or non-profit making: A non-profit organisation needs to cut down its cost and use its funds at their optimum capacity.
• New or old company: new companies need financial management for their growth and development in this competitive world. Old companies need financial management for their survival and further growth.
• Small or big company: financial management is essential for a small as well as big company, though to a different extent.
• Doctors
• Lawyers
• Engineers
• Politicians
• Teachers
• Actors
• Sportsperson
• Accountant
All departments need funds to be managed well and hence need financial management, e.g.,
• Production department
• Marketing department
• Personnel department
• Research department
• Administrative department
Overview of Financial Management
Trade Off
Objectives of financial management
The two objectives of Financial Management are:
Financial
Management
Maximization of Shareholder’s wealth
Financial Decisions
Financing
Decisions
Investment
Decisions
Dividend
Decisions
Return Risk

Financial Management www.IndigoLearn.com 6
PROFIT MAXIMISATION: The finance manager has to make his decisions to maximise the profits of the concern. Profit Maximisation, as an objective has the following advantages and limitations.
Advantages Disadvantages / Limitations
Must for survival of business, else, Capital is lost.
The term “Profit” is vague and ambiguous. It conveys different meaning to different people. Profit may be in short term or long term; it may be total profit or rate of profit; It may be profit before tax or profit after tax.
Essential for growth and development of business.
Higher the profits, higher the risks involved. If profit maximisation is the only goal, then the risk factor is altogether ignored. The finance manager will accept highly risky proposal, just by noticing they give high profits.
Societal impact and reputation.
Ignores time pattern of return. The term profit considers costs and returns in the absolute terms without considering the timing of return (time value of money).
Proposal A may give a higher amount of profits as compared to proposal B, but if the returns begin to flow say 10 years later, then ideally, proposal B may be preferred, as its returns flow is more early and quick, though the overall value of profit is low.
Profit is regarded as the yardstick for judging the economic efficiency of a firm.
Ignores social and moral obligations of business. It fails to consider the obligations to various interests of workers, consumers, society as well as ethical trade practices. Profit maximisation at the cost of social and moral obligations is a short-sighted policy. For example: Child Labour, Pollution, Corruption, Adulteration
Profit-making firms only can pursue social obligations
Profits calculations can be influenced by accounting policy.
Hence, Profit Maximisation is viewed as a limited objective, i.e. essential but not enough.
WEALTH MAXIMISATION: The objective of a firm should be to maximise its value or wealth. The wealth maximisation objective of a firm considers all future cash flows, dividends, earning per share, risk of a decision etc. Wealth maximisation, as an objective, means that the company is using its resources in a good manner. If the company follows the goal of wealth maximisation, it means that the company will promote only those policies that will lead to an efficient allocation of resources.
Objectives
Profit Maximisation(short term) Wealth Maximisation (long term).

Financial Management www.IndigoLearn.com 7
Wealth or Value of a firm is represented by the market price of its shares. The market price of a share reflects the shareholders expected return, considering the long-term prospects of the firm, reflects the differences in timings of the returns, considers risk and recognizes the importance of distribution of returns. If the share value is to stay high, the company has to reduce its costs and use the resources properly.
ADVANTAGES & DISADVANTAGES OF WEALTH MAXIMISATION OBJECTIVE
Advantages Disadvantages
i. It is unambiguous since it clearly explains what wealth refers to.
ii. Emphasizes on long term. It considers all future benefits flowing from the firm to the shareholders.
iii. Recognises risk or uncertainty
iv. Recognises the timing of returns by using discounting techniques.
v. Considers shareholders’ return.
i. Offers no clear relationship between financial decisions and share price.
ii. Can lead to management anxiety and frustration.
Hence, Wealth maximization is a better objective for a business since it represents both return and risk.
Decisions taken by Finance Manager to achieve wealth Maximization
Investment Decisions Financing decisions Dividend decisions
These decisions determine how the resources available are committed to projects, which can range from acquiring a piece of plant to the acquisition of another company.
The investment of funds in a project has to be made after careful assessment of the various projects through capital budgeting.
A part of long-term funds is also to be kept for financing the working capital requirements.
These decisions relate to acquiring the optimum finance to meet financial objectives and seeing that fixed assets and working capital are effectively managed.
The financial manager needs to possess a good knowledge of the sources of available funds and their respective costs and needs to ensure that the company has a sound capital structure, i.e. a proper balance between equity capital and debt.
Financing decisions also call for a good knowledge of evaluation of risk, e.g.
These decisions relate to the determination as to how much and how frequently cash can be paid out of the profits of an organisation as income for its owners / shareholders.
The dividend decisions thus has two elements – the amount to be paid out and the amount to be retained to support the growth of the organisation, the latter being also a financing decision; the level and regular growth of
Decisio
n
Investment
Decisions
Financing
decisions
Dividend
decisions

Financial Management www.IndigoLearn.com 8
excessive debt carries high risk for an organisation’s equity because of the priority rights of the lenders.
dividends represent a significant factor in determining a profit-making company’s market value.
Functions of a finance manager
All decisions involving management of funds come under the purview of the Finance Manager. This includes:
1. Fund Requirement Estimation:
▪ The requirements of funds must be carefully estimated.
▪ The purpose of funds (investment in fixed assets or working capital) and timing of funds i.e. when required, should be determined.
▪ This involves the use of techniques like budgetary control and long-range planning.
▪ This calls for forecasting all physical activities of the organisation and translating them into monetary terms.
2. Capital Structure / Financial Decisions:
▪ Funds can be procured from various sources for short term and long-term purposes.
▪ Decisions regarding capital structure (called financing decisions) should be taken to provide proper balance between (a) long-term and short-term funds (b) loan funds and own funds.
▪ Long-term funds are required to (a) finance fixed assets and long-term investments and (b) provide for permanent needs of working capital. Short Term Funds are required for Working Capital purposes.
▪ A proper mix of various sources must be worked out by the Finance Manager.
3. Investment decisions:
▪ Funds procured should be invested / utilised effectively.
▪ Long Term Funds should be invested (a) in Fixed Assets / Projects after Capital Budgeting and (b) in Permanent Working Capital after estimating the requirements carefully.
▪ Asset management policies should be laid down, for Fixed Assets and Current Assets.
4. Dividend decisions:
▪ The Finance Manager assists the top management in deciding as to (a) what amount of dividend should be paid to shareholders and (b) what amount should be retained in the business itself.

Financial Management www.IndigoLearn.com 9
▪ Dividend Decisions depend upon numerous factors like (a) trend of earnings, (b) trend of share market prices, (c) requirement of funds for future growth, (d) cash flow situation, (e) tax position of shareholders.
5. Cash Management Decisions:
▪ The Finance Manager has to ensure that all sections / branches / factories / departments and units of the organisation are supplied with adequate funds (cash), to facilitate smooth flow of business operations.
▪ He should also ensure that there is no excessive cash (idle funds) in any division at any point of time.
▪ For this purpose, cash management and cash disbursement policies should be laid down.
6. Performance Evaluation:
▪ The Finance Manager must evaluate financial performance of various units of the organisation.
▪ There are various tools of financial analysis viz. Budgetary Control, Ratio Analysis, Cash Flow and Fund Flow Analysis, Common Size Statement analysis, Intra-Firm Comparison etc.
▪ Financial Analysis helps management to assess how effectively the funds have been utilised and to identify methods of improvement.
7. Financial negotiations:
▪ The Finance Manager is required to interact and carry out negotiations with financial institutions, banks and public depositors. Negotiations especially with outside financiers require specialised skills.
8. Market Impact Analysis: ▪ The Finance Manager must keep in touch with stock exchange quotations and behaviour of
share prices. ▪ It involves analysis of major trends in the stock market and judging their impact of the
share price of the Company. ▪ Value Maximisation Objective is achieved through this analysis and action.
Role of chief financial officer (CFO):
Chief Financial Officer
Financial analysis
and planning
Investment
decisions
Financing and
capital structure decisions
Risk management
Management of financial resource
s

Financial Management www.IndigoLearn.com 10
The chief financial officer of an organisation plays an important role in the company’s goals, policies, and financial success. His responsibilities include:
a. Financial analysis and planning: Determining the proper amount of funds to employ in the firm, i.e. designating the size of the firm and its rate of growth.
b. Investment decisions: The efficient allocation of funds to specific assets.
c. Financing and capital structure decisions: Raising funds on favourable terms as possible, i.e. determining the composition of liabilities.
d. Management of financial resources (such as working capital).
e. Risk management: Protecting assets.
Typical organisation chart depicting the finance function
Broadly, the finance function can be specially classified into: a. Treasury functions; and b. Control functions.
A typical organisation chart of finance function in a big organization may be like –
ORGANISATION CHART OF FINANCE FUNCTION
BOARD OF DIRECTORS
PRESIDENT / CHIEF EXECUTIVE OFFICER (CEO)/ MANAGING DIRECTOR (MD) Vice-PresidentVice-President / CFO/Finance DirectorVice-President (manufacturing) (Finance) (Marketing) Treasurer (to raise and manage company’s funds) Controller (to ensure correct application of funds)
Capital Credit Cash Banking Portfolio Budgeting Management Management Relations Management Corporate General Accounting Taxation Internal Budgeting Data & Cost Accounting Audit Processing
Role of finance manager in today’s dynamic environment
Freedom in pricing of securities.

Financial Management www.IndigoLearn.com 11
Important role in taking vital decisions of allocation of capital, e.g., Mergers and acquisitions
Emergence of financial services. E.g., Mutual funds, housing loans, consumer finance, etc.
Capital Market regulations, e.g., SEBI, Companies Act. The finance manager has to constantly update himself with the latest provisions of law.
Innovative tools of raising finance, e.g., Deep Discount bond, Zero coupon Bonds.
Promotion of shareholders interest due to increased competition.
Use of Information technology. A finance manager needs to know how to integrate finance and costing with operations through software packages including ERP.
E-Commerce.
Globalisation – competition at international level
Raising of Funds from international sources e.g., ADR, GDR. Access to international markets, both debt and equity, has enabled Indian companies to lower the cost of capital. For example, Tata Motors raised debt as less than 1% from the international capital markets recently by issuing convertible bonds.
Foreign direct Investment (FDI) and Foreign Institutional Investors (FII)
Foreign Collaboration and Joint Ventures.
Investment outside the country.
Tools of financial management
Some widely known methods / tools of financial management are:
Type of Decision Tool / Method adopted
Financing Decision – To maximise wealth of shareholders
Optimum capital structure
Proper debt-equity mix
Financial Leverage / Trading on Equity
EPS analysis
Investment Decision – To maximise return on investment made
Capital Budgeting techniques–
Payback,
Average Rate of Return,
Net Present Value,
Internal Rate of Return,
Profitability Index etc.
Performance Evaluation Decision Budgetary Control,
Ratio Analysis,
Projected Financial Statements
Cash Flow and Fund Flow Analysis etc.
Working Capital Management – to maintain liquidity
ABC Analysis
Economic Order Quantities (EOQ)
Cash management models

Financial Management www.IndigoLearn.com 12
Relationship between finance function and other functions
Finance is defined as the life and blood of an organisation. It is the common thread that binds all organisational functions. Each function in an organisation has financial implications. The relationship between finance and other functions can be described as follows :
Function Investment Aspect Decision-Making Aspect
Finance and Production
This includes decisions on investment in
inventories,
Purchase of new asset
stock levels,
purchase policies etc.
Expansion
Decisions such as Make or Buy Components, Retain or Replace Machinery etc. are taken after analysing financial implications thereof.
Finance and Marketing
This includes decisions on
Investment in finished goods inventories.
Advertising
Sales promotion
Credit period
Marketing decisions and strategies such as Credit Granting, Change in Sale Prices to sell additional quantities, acceptance of additional order etc. are taken after analysing their financial impact.
Finance and Personnel
This includes decisions on
capital costs associated with personnel policies
substantial training expenditure,
Recruitment
Promotion Voluntary Retirement Scheme (VRS)
Investments in HRD are bound to increase in future. Restructuring of pay package, drafting of voluntary retirement schemes, etc. are some major decisions in Human Resource Management.
Finance and Research and Development
Lots of funds are required for research and development purposes. Companies must come out with new product, new models to face the tough competition.
Large sum of money needs to commit.
S. N. Financial Accounting Financial management
1 Tasks handled
An accountant’s job is mainly concerned with maintaining financial records, ensuring proper classification of transactions under assets, liabilities, income and expense groups, preparing Financial statements, etc.
Finance manager handles the task of procurement and optimum allocation of funds, keeping in mind risk, cost and control aspects.
2 Hierarchy level
Accounting is performed at medium and lower level in the organisational hierarchy.
Financial management is performed at top level in the organisation.
3 Time period covered

Financial Management www.IndigoLearn.com 13
S. N. Financial Accounting Financial management
It deals with past events, i.e., the transactions which have already occurred.
It is future oriented. It deals with estimated transactions.
4 Accrual Vs Cash-flow method
Accounts are maintained on accrual basis.
Finance manager uses cash basis since he decides about availability of funds not only for present but also for future.
5 Function
It is more related to measurement of funds.
It is more related management of funds.
Financial management and an understanding of taxation policy and provisions
The Finance Manager, as an advisor to management, is required to take various decisions on procurement and utilisation of funds. Tax considerations influence these areas and hence the Finance Manager needs to have a reasonable understanding of direct and indirect tax provisions.
• Financing Decisions – Cost of Capital: Debt is cheaper than Equity since interest payable on loan is a charge on profit and will reduce the tax payable by the Company. The use of cheaper cost debt funds has a leverage effect and increase the EPS of the Company.
• Investment Decisions – Capital Budgeting: For project evaluation, the Cash Flows after taxes (CFAT) are relevant for discounting purposes. Cash outflows may also be reduced due to various deductions and allowances. The incidence of tax on income and on capital gains affect cash flows and investment decisions.
• Dividend Decisions – Retention v Payment: Tax is one of the major considerations in taking decisions on the amount and rate of dividend. Whether the Company should retain all its earnings of distribute all earnings as dividend, also depends on tax incidence on the Company and its shareholders.

Financial Management www.IndigoLearn.com 14
SELF – PRACTICE TEST TRUE & FALSE
State whether each of the following statements is True (T) or False (F).
1 In the traditional approach, the scope of financial management was restricted to procurement of funds.
2 In financial management, the objective of financial manager is profit maximization.
3 Financial management refers to financial decision making.
4 Over last few decades, the scope of financial management has broadened.
5 Financial management and financial accounting are essentially same.
6 The basic objective of financial manager is the maximization of wealth of shareholders.
7 Risk and return are two basic dimensions of any financial decision.
8 Financial management interacts with other departments of the firm and determines the future growth of the firm.
9 Profit maximization and wealth maximization are essentially the same thing.
10 Investment financing and dividend decisions works collectively to determine the growth of the firm.
11 The Investment, financing and dividend decisions are not related to value of the firm.
12 Profit maximisation is the sole objective of financial management.
13 The goal of wealth maximisation takes into consideration risk related to uncertainty of returns, timing of expected returns and amount of returns expected.

Financial Management www.IndigoLearn.com 15
TYPES OF FINANCE
Introduction:
Every business enterprise requires funds for the purpose of – 1. Implementation of a new project 2. Expansion of existing project 3. Diversification to a New Project 4. Modernisation Scheme 5. Working Capital
There are several sources of funds available in the market and effective appraisal mechanism is required to be instituted to achieve its object of maximisation of profit, with minimum possible risk.
Selection of sources of finance will depend upon: 1. Risk involved 2. Tenure 3. Cost of funds
Requirement of funds:
Business enterprises need funds to meet their different types of requirement
Long Term needs Medium Term Financial needs
Short Term Financial needs
Purpose-
• Investment in fixed Assets.
• Permanent or core working capital
Time Span: 5 to 10 year
Purpose:
• Extensive publicity and advertisement campaign.
• To meet the cost, the benefit of which is expected over 1 to 5 years.
Time Span: 1 to 5 years
Purpose-
• To financial fluctuating working capital requirement.
• To execute export orders.
• Bridge finance, pending formalities of term loan sanctions
Need for Funds
Long Term
needs
Medium
Terms
Short Terms
Financial
needs

Financial Management www.IndigoLearn.com 16
Time Span: Not exceeding a period of one year
Source of finance:
Primarily source of finance can be divided into two parts: 1. Owners Capital or shareholders’ funds 2. Borrowed Capital
The following chart will give Birds Eye view of various sources of finance.
Sr. No.
Type of Funds
Owners Funds Borrowed Funds
1.
Long Term
1. Equity Share Capital
2. Preference Share Capital
3. Retained earnings (Plough back of profits)
4. Capital Subsidy / incentives
1. Debentures/Bonds
2. Term Loans from institution
- Rupee Loan
- Foreign Currency Loan
3. Term loans from Banks
4. Venture Capital Financing
5. Interest free sales tax loan
6. Asset/Debt securitisation
7. Euro Equity issues
8. New debt Instruments
2. Medium Term
Preference Share Capital
1. Debentures / Bonds
2. Public Deposits
3. Loans from financial institutions
4. Loan from commercial banks
5. Lease Financing
6. Hire Purchase / Instalment Financing Scheme
7. Euro Debt issue
8. New debt Instruments
3. Short Term
1. Credit from trade and expense creditors
i. Trade credits
ii. Advances from customers
iii. Short term provisions
2. Bank Advances
3. Factoring
4. Commercial Papers
5. Public deposits
6. Inter Corporate deposits
7. Short term Unsecured Debentures
8. Bridge Finance

Financial Management www.IndigoLearn.com 17
Sr. No.
Type of Funds
Owners Funds Borrowed Funds
9. Certificate of Deposit
Understanding the sources of finance
EQUITY SHARE CAPITAL Salient Features 1. Private Limited company raises funds promoters, their relatives and friends. 2. Public Limited company raises funds from promoters as well as from public. 3. Permanent source of funds. 4. Equity shareholders being owners of company undertake the risks of business. 5. Right to elect Board of Directors and have the control over the management of
company. 6. Redeemed only in case of liquidation, hence least risk involved.
Exceptions: i. Buy-back of shares ii. Redemption of excess capital
7. Shareholders are entitled for dividend which depends upon:
i. Profitability position
ii. Liquidity position
iii. Financial needs of company
There is no mandatory Payment of dividend to equity shareholders.
8. Dividend being an appropriation of profit is not deductible, while computing taxable profits of business. On the contrary under Income Tax Act, domestic companies are required to pay tax on dividend under section 115 O @ 10% (plus Surcharge) on the amount of dividend paid / distributed. Such dividend is tax free in the hands of equity shareholders.
Returns from the sale of shares in the form of capital gains are subject to capital gain tax
9. Costliest but less risky capital, in the capital employed of the company.
10. Equity capital provides security to lenders of fund.
11. The company can make further issue of share capital by making a right issue
12. The company can issue bonus shares by way of capitalisation of reserves.
Merits of Equity shares Demerits of Equity shares
• Permanent source of funds
• Equity capital provides security to lenders of fund.
• Redeemed only in case of liquidation, hence least risk involved.
• There is no mandatory payment of dividend to equity shareholders.
• The company can use the funds flexibly.
• Costliest source of finance.
• Dividend being an appropriation of profit is not deductible.
• further issue of share capital dilutes the ownership.
• further issue of shares may reduce the EPS.

Financial Management www.IndigoLearn.com 18
Merits of Equity shares Demerits of Equity shares
• No need to create any charge against the assets of the company.
PREFERENCE SHARE CAPITAL: Salient Features
1. Preference share is a hybrid security because it has features of both ordinary shares and bonds.
2. The holders of such shares enjoy priority both as regards to fixed dividend and redemption in case of winding up.
3. Different types of preference share viz.
(a) Cumulative and Non-cumulative preference shares. In cumulative preference shares unpaid dividend gets accumulated. All arrears of dividend must be paid before any dividend can be paid to equity shareholders. The non-cumulative preference shares carry a right to fixed dividend out of profits for that year only. In case of non-availability of profits, the holders of non-cumulative preference shares are not entitled to arrears of dividend.
(b) Participating and Non – participating preference shares. Participating preference shares carry a right to participate in surplus profits along with equity Shareholders after dividend at a certain rate has been paid to equity shareholders, in addition to entitlement of fixed dividend. Again, in case of wind up, if there remains surplus after paying both the preference and equity shareholders, then the holders get additional share in the surplus assets. The right to participate is given in the Memorandum or Articles or by virtue of terms of issue.
(c) Convertible and non-convertible: convertible preference shares can be converted into equity shares during a specified time period, at a specified price and in a specified ratio.
(d) Cumulative Convertible Preference shares (CCPs) may also be offered under which the shares would carry a cumulative dividend and specifies a limit for a period of say three years after which the shares are converted into equity shares.
4. A public company may issue Redeemable Preference Shares to be redeemed after a fixed period. The Companies Act prohibits to issue irredeemable preference shares or shares redeemable after expiry of twenty years of issue. For redemption of preference shares. A company has to comply legal requirements of Sec. 55 of the Companies Act, 2013.
5. A Medium- or Long-Term Source of funds.
6. Preference shares enable the company to avoid dilution of equity capital.
7. There are no voting rights offered to preference shareholders.
8. Preference dividend, being an appropriation of profits is not tax deductible. On the contrary, under the provisions of the income Tax Act, domestic company is liable to pay tax on dividend under Sec. 115 O @10% (plus surcharge.)

Financial Management www.IndigoLearn.com 19
9. Though company creates financial leverage, as there is a fixed dividend, cost of preference share capital is far greater than cost of debentures / borrowed funds.
10. If Debt-equity ratio is high or cost of equity financing is relatively high, the case for using preference shares will be strengthened.
11. For normal preference shares, the maximum permissible rate of dividend is 14%
Merits of Preference shares Demerits of Preference shares
• Preference capital provides security to lenders of fund as they form part of net worth.
• They carry a fixed rate of dividend which gives advantage of financial leverage.
• There are no voting rights offered to preference shareholders.
• Preference shares enable the company to avoid dilution of control.
• Long Term Source of funds.
• Payment of dividend is only out of profits.
• The company can use the funds flexibly.
• No need to create any charge against the assets of the company.
• Costlier than debentures or loans.
• Dividend being an appropriation of profit is not deductible.
• The holders of such shares get priority both as regards to fixed dividend and redemption in case of winding up as compared to the equity shareholders.
• If preference dividend is not paid on time, it might affect the market image of the firm and give voting rights to those shareholders.
• As redemption is obligatory, it involves a huge amount of cash outflows on redemption.
RETAINED EARNINGS / PLOUGH BACK OF PROFITS: 1. A company may plough back profits earned. Accumulated retained profits are
reserves and is a part of equity or net worth. 2. They belong to equity shareholders. Increase in net worth strengthen the
shareholders equity base and service as ‘promoters’ contribution’, if represented by liquid funds. It increases debt borrowing capacity of a company.
3. By virtue of legal provisions, company must plough back reasonable amount of profits every year to meet long term requirement.
4. Such funds entail no risk. 5. Further there is no dilution of control of the present management group. 6. A company by complying legal requirements can pay dividend out of accumulated
profits or retained earnings. 7. it is one of the most preferred sources of finance.
DEBENTURES OR BONDS: ‘It is acknowledgment of debt, given under the seal of the company and containing a contract for the repayment of principal sum at a specified date and for the payment of interest at fixed rate until the repayment of principal sum and it may or may not give the charge on the assets of the company as security’. Salient Features 1. Debenture holders are the creditors of the company and hence no voting rights are
enjoyed by them.
2. Debentures are redeemable according to the terms of their issue.

Financial Management www.IndigoLearn.com 20
3. Interest on debentures must be paid irrespective of profitability of the company. It is a charge against profits.
4. In case of liquidation, debenture holders being creditors have prior claim over the shareholders.
5. Raising funds by way of debentures has advantage of financial leverage or trading on equity.
6. Interest on debentures is tax deductible. Thus, there is a tax shield and a source of finance becomes cheaper.
7. Debentures are usually secured on the assets of the company and therefore carry lesser risk and assured return to the investors.
8. As it is obligatory to pay interest at regular intervals and repayment of principal sum on scheduled dates. Any failure in obligations may paralyse the company’s operations.
9. Financing through debentures is associated with financial risk to the company. This increases the cost of equity capital.
10. Higher risks bring, higher capitalisation rates on equity earnings. Thus, even though gearing is favourable and raises EPS, the higher capitalisation rate attributable to gearing may drive down the market price of equity shares.
11. There is a flexibility in Debentures funds. Surplus funds with the company may be utilised for buying own debentures from the market and making cancellation thereof even before maturity date.
12. A company may issue convertible debentures (CDs) in which option may or may not be given to debenture holders to convert them into equity or preference shares at stated issue price, after a certain period. CDs may be fully or partly convertible.
13. In a period of rising prices, debentures issue is advantageous. The fixed monetary outgo decreases in real terms as the price level increases.
14. Public issue of debentures and private placement to mutual funds now require that the issue be rated by credit rating agency like CRISIL (Credit Rating and Information services of India Ltd.). Credit rating is given after evaluating factors like track record of the company, profitability, debt-service coverage, creditworthiness and perceived risk of lending.
15. For all debentures having a maturity period beyond 18 months, a Debenture Redemption Reserve (DRR) is created by transferring at least 50% of the redemption amount to this reserve out of the profits of the profits of the company before the redemption date.
16. Debentures are classified into –
From Security point of view – Secured Debentures, Unsecured Debentures. From Registration point of view – Registered Debentures, Bearer Debentures From Priority point of view - First Debentures, Second Debentures etc. From Enlisting point of view - Listed Debentures, Unlisted Debentures From Conversion point of view – Convertible Debentures, Non-convertible Debentures From Redemption point of view – Redeemable Debentures, Irredeemable Debentures
Merits of debenture as a source Demerits of debenture as a source
• Raising funds by way of debentures has advantage of financial leverage
• Interest on debentures is tax deductible.
• Interest on debentures must be paid irrespective of profitability
• Debenture holders being creditors have prior claim over

Financial Management www.IndigoLearn.com 21
Merits of debenture as a source Demerits of debenture as a source
• No voting rights are enjoyed by debenture holders, no dilution of control.
• Fixed amount of interest also provides a protection against unanticipated inflation.
the shareholders at the time of liquidation.
• Debentures are usually secured on the assets of the company
• Financing through debentures is associated with financial risk to the company.
• Debenture trust deed may impose restrictions on the company and reduce its flexibility.
TERM LOAN FROM FINANCIAL INSTITUTIONS:
The following financial institutions cater major part of financial needs of the Industrial Sector in India. i) Industrial Development Bank of India (IDBI) ii) Industrial Finance Corporation of India (IFCI) iii) State Finance Corporation of India (SFCI) iv) State Industrial Development Corporations (SIDCs) v) Industrial Reconstruction Bank of India (IRBI) vi) Small Industries Development Bank of India. (SIDBI) vii) Life Insurance Corporation of India. (LIC) viii) Unit Trust of India (UTI) ix) General Insurance Corporation (GIC) and its subsidiaries. x) Shipping Credit and Investment Company of India Ltd. (SCICI) Before term loan is sanctioned, a company must satisfy the financial institution regarding technical, commercial, economic, financial and managerial liability of the project. Such loans are available at different rates under different schemes. A lending institution stipulates number of conditions regarding the managerial and other financial policies of the company. The important covenant of the loan agreement includes –
Amount of loan, Rate of Interest, Additional levy Interest, Commitment Charges, Reimbursement of Costs etc., Last date of Withdrawal, Repayment schedule, Conversion Right, Security for the loans, Appointment of Nominee Directors, Restriction on payment of Dividends, Permission to carry out Expansion on Diversification, Inspection of Books and Property, Commitment to investment of funds, Consent for Change in Scheme, Appointment of Managing Director, Changes in Memorandum and Articles of Association with prior approval affecting institutional interest, Raising Unsecured Loans, Raising of Financial Resources, Submission of Physical and Financial Progress Reports, Review of project cost, Withhold Disbursement in certain cases, Information about Change in important Contacts, Maintenance of Property, Merger Compromise with institutional consent, Material Happenings to be informed, Creation of Subsidiary with prior permission, Promoters Contribution towards the project, Lock – in – period for promoters funds, etc., Salient Features
1. Term loans are secured borrowing and is a long-term source of finance for new projects.

Financial Management www.IndigoLearn.com 22
2. Rate of interest depends upon credit rating of the borrower, perceived risk of lending and cost of funds to the lender.
3. Term loan is generally repayable over a period of 5-10 years in quarterly / half yearly instalments.
4. For large scale projects, All India financial institutions provide finance usually under consortium arrangement.
5. Interest on term loan is tax deductible. 6. Foreign currency loan carries a risk of exchange rate fluctuations. 7. Administrative cost of serving the loan is minimal as compared to cost related to
Debenture / Bond option. 8. Financial institutions keep a clause reserving the right to convert the loan into
equity shares of borrower company, subject to certain conditions. 9. Financial institution has a right to appoint nominee Director on the Board of the
borrower company, who will not be liable to retire by rotation or removal.
TERM LOAN FROM BANKS: The primary role of the commercial bank is to cater to short term requirement of late, however banks have started term financing of industries, though the formal term loan lending is so far, small and confined to major banks only.
Salient Features: 1. Term loans are secured borrowing is medium/ long term source of finance for
additions to fixed assets. 2. Rate of interest depends upon credit rating of the borrower, perceived risk of
lending and cost of funds to the lender. 3. Term loan is generally repayable over a period of 4-7 years in quarterly / half
yearly instalments. 4. Interest on term loan is tax deductible. 5. Administrative cost of serving the loan is minimal as compared to cost related to
Debenture / Bond option.
VENTURE CAPITAL FINANCING: When technically competent entrepreneurs, who lack experience and funds required as promoter’s contribution is financed under venture capital financing. Venture capital financing refers to financing new highly risky venture promoted by qualified entrepreneurs with a potential of success.
Venture Capital industry is a recent introduction. It is a national priority especially in the areas of tele-communication, Non-conventional energy, Quality upgrading, Biotechnology, information Technology, Induction of new technologies etc. The Government of India issued guidelines for venture capital companies in 1988 and offered number of tax concessions. In 1999 the existing guidelines are relaxed to increase the attractiveness of the venture schemes and induce high net worth investors to commit their funds to “Sunrise”, sectors, particularly the information Technology Sector. Initially the contribution to the funds available for the venture was only from all India financial institutions, state development corporations, commercial banks and companies in private sector. In the last couple of years, many offshore funds have been started in the country and maximum contribution is form foreign institutional investors.

Financial Management www.IndigoLearn.com 23
Some methods of venture capital financing are as follows:
1. Equity Financing: As venture capital undertaking generally requires funds for a longer period but may not be able to provide returns to the investors during initial stages, the venture finance is normally the form of equity capital. The equity contribution of venture capital funds does not exceed 49% of the total equity capital, so that control remains with the entrepreneur.
2. Conditional Loan:
A conditional loan is repayable in the form of royalty after the venture enterprise can generate sales. No interest is payable on such loans A royalty charge may range between 2 to 15 percent, actual rate depends on factors like gestation period, cash flow pattern, risk and other related factors. Some capital financers give a choice to enterprise of paying high rate of interest (say above 20%) instead of royalty on sales once it becomes commercially sound.
3. Income Note:
It is a hybrid security which combines the features of both conventional loan and conditional loan. The entrepreneur has to pay both interest on loan and royalty on sales but at substantially low rates.
4. Participating Debentures:
Such security carries charges in three phases: Start phase : No interest Next phase : Low rate of interest up to a level of operation. Subsequent phase : High rate of Interest
Factors that a venture capitalist should consider before financing any risky project:
Level of expertise of company’s management – the success of any new project is highly dependent on the quality of management team.
Level of expertise in production – the entrepreneur should have necessary technical ability to be able to develop the new product and service.
Nature of new product / service – the venture capitalist should consider whether the development of new product / service is technically feasible.
Market - the venture capitalist should seek assurance that there is actually a market for the new product.
Risk borne by the entrepreneur - the venture capitalist should see that the risk borne by the entrepreneur is high. This will ensure that the entrepreneur will have sufficient level of commitment to project.
Method of Venture Capital Fund
Equity
Financing
Conditional
Loan
Income
Loan
Participating
Debentures
Method of Venture
Capital Fund

Financial Management www.IndigoLearn.com 24
CAPITAL SUBSIDY / INCENTIVES: In order to encourage the dispersal of industries in the less developed areas, Government has been giving a package of incentives to New/ Expansion units set up in the developing region. The Package scheme of incentives introduced in 1964 were amended from time to time e.g. Government of Maharashtra has introduced a new scheme viz. Package Scheme of Incentives 2001 for accelerating the process of dispersal of industries to the less developed regions and promoting high-tech industries in developed areas of the state coupled with the object of generating mass employment opportunities.
The following categories of industrial and other units will be considered for incentives: 1. Industries listed in the first schedule of Industrial (Developed and Regulation) Act, 1951. 2. Small Scale Industries, coir, silk, Handicraft and Khadi Industries. 3. Information Technology. 4. Hotels. 5. Poultry and Agro Industries. 6. Bio – Technology. 7. Non–Conventional energy.
The quantum of incentive varies with reference to developed areas. No incentives are allowed to units located in developed area, but maximum benefits are extended to units located in backward areas.
The Incentives may be in the form of: 1. Special Capital incentives as a grant computed based on certain percent of fixed capital
investment, with a ceiling. 2. Interest Subsidy 3. Refund of Octroi / Entry Tax. 4. Exemption of Electricity Duty. 5. Exemption of Sales Tax or Deferment of Sales Tax.
The capital incentives form a part of long-term finance. However, one must not be dependent on the availability of incentives for economic viability of the project. The incentives are sanctioned and released to the units only after they have complied initial effective steps and final effective steps respectively. The release of incentives by the concerned State Government generally take one to three years. The promoters therefore find it convenient to avail bridge finance against the sanctioned capital incentives. However, bridge finance is normally made available to the extent of 85% of the sanctioned incentives.
INTEREST FREE SALES TAX LOAN State Government as a package of incentives sanction interest free sales tax loan either by way of deferment of sales tax liability of a new unit or disbursing sales tax loan based on sales tax paid by existing unit in the past. The loan is repayable after 10/12/14 Years. Thus, it serves as a long-term loan without any interest.
Asset / Debt Securitization:
MEANING
The term Securitisation refers to both switching away from bank intermediation to direct financing via capital market and/or money market, and the transformation of illiquid assets like automobile loans, mortgage loans, trade receivables into marketable securities.

Financial Management www.IndigoLearn.com 25
“Securitisation is a process of transformation of illiquid assets into security, which may be traded later in the open market”. It is a method of recycling of funds. It is especially beneficial to financial intermediaries to support lending volumes. Assets generating steady cash flow are packaged together and against this asset pool, market securities can be issued.
Securitization Process:
1. The Originating Function: A borrower seeks a loan from finance company, housing company or lease from leasing company. The creditworthiness of the borrower is evaluated, and contract is entered in a normal manner with repayment schedule.
2. The pooling Function: The originated assets viz. trade receivable, lease rentals, housing loans, automobiles etc. according to maturity pattern and interest rate risk are clubbed together to create a pool. This pool is transferred, in favour of Special Purpose Vehicle (SPV), which acts as a trustee for the investor. Once the assets are transferred, they are held in the SPV’s portfolio.
3. The Securitisation Function: It is the SPV’s job now to structure and issue the securities based on asset pool. The securities carry a coupon and on expected maturity which can be asset based or mortgage based. They are generally sold to investors through merchant banker. The investors interested in this type of securities are generally institutional investors like mutual fund, insurance companies etc. The originator usually keeps spread available between yield from secured assets and interest paid to investors.
Thus, trustees act as receiving and paying agent. Thus, good quality loans will be eligible for securitisation. The repayment pattern of assets will be deciding factor to structure the instrument.
Bank / Financial
Institution / Company
Balance Sheet
Liabilities Assets
Trade receivables
Automobile loans
Housing loans
Investors
Pool of Assets Trust Instruments
Credit Rating Third Party support Insurance cover Underwriting

Financial Management www.IndigoLearn.com 26
Instruments in securitization:
Major instruments issued under the securitization are the pass through and the pay through securities. Salient features of these securities are given below:
Pass through securities / certificates (PTC)
• Instrument, as its name indicates, passes all the cash flows generated from the portfolio are passed on to the investors without any intervention.
• In other sense, cash flows from the original portfolio are passed on to their investors, whenever they arse.
• It results in the huge pre-payment risk to the investors. It essentially means that if the prepayment takes place on a 10-year pass through instrument, its life may shrink to even one day.
Pay through securities
• Pay through securities differ from the pass through as the investors are given cash flows at the pre-determined time irrespective of the cash flows from the original portfolio in the deal.
• In other words, we can say that the Pre-payment risk in the instrument is absorbed by the SPV. What happens practically in the deal is that the SPV maintains the pre-paid cash flows at its end and pay to the final investors at the pre-determined time only.
These instruments appeal to the wide range of investors because of the different maturities, risk and return profiles. Status and Role of Special Purpose Vehicle or Special Purpose Entity (SPV or SPE): It would be evident from the above discussion that the SPV plays a very crucial role in the whole deal. It is the transforming device. It essentially is the means to convert one form of asset into another form. Salient features of the SPV may be mentioned as follows:
• It is a vehicle to transform assets into securities
• It is a transformation device, specially created to hold the assets in trust for the investors.
• As per the securitization bill recently cleared by the government, SPV may take the form or trust or company (securitization company).
• In case of securitization trusts, structure of SPV would be exactly like the Mutual Funds.
As mentioned above, real financial engineering takes place at the SPV’s end and in the whole securitization process, it plays a very crucial role.
Types of Securitization:
Securitization with recourse
“With recourse” is a legal term and relates to the credit risk retention by the originator. It essentially means that the assets are sold to the investors through SPV with the clause that if any party in the portfolio of assets defaults, it would be protected by the originator i.e. the originator would make the default good.
Securitization without Recourse
1. In case of securitization without recourse, whole risk in the asset portfolio is transferred to the investors through the SPV i.e. originator is in no way concerned with the assets once that is sold

Financial Management www.IndigoLearn.com 27
to the SPV. This is the true form of securitisation.
2. In this case, simply the asset would get converted into cash for the originator with no future obligation. So, this transaction is performing two functions, one the financing and another the credit risk transfer to the investors from the originator.
3. The issuer is under an obligation to pay to the investors only if the
cash flows are received by him from the collateral.
4. The risk run by the investor can be further reduced by obtaining insurance cover, often provided by a pool insurance policy.
What can be securitized?
Practically speaking, any future cash flow can be securitized in the market. So, we may say that the prominent assets for the securitization are as follows:
• Physical Assets
• Financial Assets
• Operational Assets
• Any other receivable
To be put to the perspective, there is no limit to the imagination and creativity and from that angle there is huge room for the innovation in the market. Real path breaking deals are taking place in the market. To apprise you, in 1997 Mr. David Bowie, a rock singer securitized the royalty from his albums and collected cool $ 58 Million from the market. These bonds are called the Bowie bonds. Recently, in France and Belgium some retailers have securitized their inventories of the champagne through bonds titled “Champagne Bonds”.
Benefits to the originator:
1. The additional source of capital can be tapped through securitisation reliving trade receivables, deposit collection process.
2. Without disturbing the liabilities side of the Balance Sheet, the funds can be raised and enhance activity of lending, which increases the profitability.
3. Reduce the existing debtors and its related risks. 4. Conversion of illiquid asset into liquid portfolio. 5. The assets are shifted off the Balance – Sheet, thus giving the originator recourse to
off Balance – Sheet funding. 6. It facilitates better Balance Sheet management, as assets are transferred off – Balance
Sheet facilitating satisfaction of Capital Adequacy Norm. 7. Enhancement of credit rating. 8. Improvement of income to asset ratio.
Benefits to the investor:
1. He gets security which is backed by adequate collateral and has credit enhancement. 2. Securities are rated by credit rating agencies. It becomes easier for an investor to
compare the risk – return profile of asset backed securities with other investible instruments and make an informed choice.

Financial Management www.IndigoLearn.com 28
3. It opens up new investment avenue.
Factors required for Success of securitization process
◼ High quality assets with low default rate is essential
◼ Standardised loan documentation
◼ Stable interest rate structure.
◼ Well-developed Capital market.
◼ Investors awareness
◼ Strong Regulation
DIFFERENCE BETWEEN FACTORING VS. SECURITISATION
S.no. Particulars Factoring Securitisation
1 Range of investors
In factoring, only one party is involved.
Issue of securitisation are sold to a wide range of investors.
2 Issue expenses
No issue expenses are involved in Factoring.
Issue expenses are involved.
3. Recourse Factoring may be with or without recourse.
Securitisation is generally without recourse.
4 Receipt of payment
In “advance factoring”, Factor gives an advance, say 90%, at the time of transaction and provides the balance at the time of settlement.
In securitisation cash is generally received as soon as the issue is placed.
5 Additional services
Factors provides financial services and other services like follow-up with debtors, sales ledger maintenance, collection, credit investigation, etc.
Securitisation does not carry any such services with it.
6 Time period Short-term receivables are factored.
Long-term receivables and short-term receivables can be securitised.
7 Credit rating Credit rating is not compulsory.
Credit rating is compulsory.
8. Nature of receivables
Only existing receivables can be factored.
Future and existing receivables can be securitised.
PUBLIC DEPOSITS: a. Public deposits are tapped as a source of short term or medium-term finance. This had
become important source of finance during the period of credit squeeze by RBI. b. A company can accept public deposits, subject to stipulations, up to a maximum of 35%
of its paid-up capital and reserves from the public and shareholders. c. These are unsecured deposits and may be accepted for a period ranging six months to
three years. d. As the deposits are available for a period of not more than three years, they are used for

Financial Management www.IndigoLearn.com 29
financing working capital requirements. e. The public deposits are renewable on maturity.
CREDIT FROM TRADE AND EXPENSE CREDITORS: This represent credit granted by supplies of goods or expense creditors as a term of contract. Usually trade creditors grant a credit varying between 15 to 90 days. It generates automatically in the course of business and is common to all business operations. It may be in the form of “Open Account” or “Bills Payable”. It is without any explicit cost, keep on rotating, is a source of finance for the gross working capital. Expense creditor period may vary according to the terms and conditions of contract e.g. salaries and wages are payable monthly, but a bonus is payable annually or royalty may be payable on quarterly basis. This type of credit has also no explicit cost and keeps on rotating on a going concern.
A manufacturer or contractor engaged in producing or constructing costly goods involving length of time usually demand advance from customers at time of accepting order for execution. Similarly, monopolistic organisations may demand advance from customers before the order is accepted. This source of finance has no explicit cost of Capital.
BANK ADVANCES: Bank advances are in the form of:
1. Overdraft: Under this facility, customer can withdraw in excess of his balance in current account up to a fixed limit. Though overdraft is repayable on demand, it generally continues for long period by annual renewals. Interest on this facility is charged based on daily products and usually the rate of interest is higher than other short-term finance. The security for overdraft account may be by way of shares; debentures, Government securities, Fixed Deposits etc.
Bank also allows clean overdraft to customers, who are financially sound and reputed for their integrity. In case of clean overdraft, banks usually rely upon personal security of the borrower. A clean overdraft is generally granted for a short period only.
2. Cash Credit: Under cash credit, a limit is sanctioned by bank and the borrower can withdraw required funds at any time, within that limit. The withdrawable amount may be fixed based on drawing power, which is calculated at a certain prefixed percentage of inventory / receivables. The interest is charged on daily product basis. Cash credit is usually secured against hypothecation of inventory and security of book debts. Though this is short term finance used for working capital purpose, the facility continues for a longer period on its annual renewals.
The borrower some time provide the security of goods by way of pledge. In this case, the borrower delivers the goods from pledged godown only on depositing the borrowed
Bank Advances
Overdraft Cash
Credit Bill
Discounting
Letter of
Credit
Pre-Shipment Packing Credit
Finance
Post – Shipment
Packing Credit
Finance
Bank Advances

Financial Management www.IndigoLearn.com 30
amount with the bank. Similarly, on pledge of additional goods, the borrower can withdraw additional funds.
3. Bill Discounting: Bank also provide short term capital by discounting the bill of exchange drawn on customers. Out of working capital total limit, Bill Discounting limit also may be fixed by bank. The discount depends upon the amount of the bill, the maturity period and the prevailing rate of interest.
One of the shortcomings of the bill, discounting system is that the bank which discount the bill must establish and verify creditworthiness of the buyer, which at times may be difficult, complicated and time-consuming process.
4. Letter of Credit:
A letter of credit (LC) is a guarantee provided by the buyer's banker to the seller in case of failure or default of the buyer. Letter of credit issued by bank thus serves the purpose as security to the seller. The LC provides a non-fund-based financing as the funds are not involved in the issue of LC. It is a contingent liability of the bank and shall arise only if buyer fails to pay. However, whenever LC is issued, the amount is adjusted against the fund-based cash credit limit of the buyer. It is an indirect form of financing.
5. Pre - Shipment Packing Credit Finance: Packing credit is an advance extended by banks to an exporter for the purpose of buying, manufacturing or processing, packing and shipping the goods to overseas buyers. An exporter having in hand firm order placed with him by a foreign buyer or irrecoverable letter of credit opened in his favour, can approach bank for availing packing credit. An advance so taken is required to be liquidated within 180 days from the date of its commencement by negotiation of export bills or receipt of export proceeds in an approved manner. Packing credit in the case of customers of long standing, may also be allowed against firm contracts entered by them with overseas buyers.
Types of Packing Credit i. Clean Packing Credit:
It is a dean type of export advance each proposal is weighed according to requirement of trade and credit worthiness of the exporter. Export credit Guarantee Corporation [ECGC] cover is obtained by the bank.
ii. Packing credit against hypothecation of goods: Export finance is made available on certain terms and conditions, where the exporter has pledge able interest and goods are hypothecated to the bank as security with stipulated margin. In this case borrower is required to submit periodical stock statement to bank.
iii. Packing credit against pledge of goods: Export finance is made available on certain terms and conditions, where the exportable finished goods are pledged to the bank with approved clearing agents who will ship, he goods from time to time as required by the exporter. The possession of the goods so pledged lies with the bank and kept under lock and key.
6. Post - Shipment Packing Credit Finance:
Bank provides finance to exporters by purchasing export bills drawn payable at sight or by discounting usance export bills covered by confirmed sales and backed by documents of the title of the goods such as bill of lading, air / ship consignment notes. It is necessary that exporter should obtain a shipment or contract risk policy of ECGC. Finance is also provided by banks to exporters by way of advance against bill forwarded through them for collection, considering creditworthiness of the party, nature of goods

Financial Management www.IndigoLearn.com 31
exported, usance etc.
COMMERCIAL PAPERS: o Commercial Paper (CP) is an unsecured promissory note issued as a debt instrument,
that enables highly - rated corporate borrowers to raise funds for a short period. o The maturity period may vary between 7 days to 365 days. The amount raised by CP is
also large. o The firm or the dealers in CP sell these to the short-term lenders, who use it as interest
earning investments of temporary surplus operating funds. The maturity term of CP is fixed.
o The CPs are issued with face value, but the issue price is less than face value. The
difference is discount on the issue price work as a return to the lender at the time of maturity. Discount on CP depends upon the amount involved, maturity period and prime lending rate of commercial banks.
o The main advantage of CP is that the cost involved is lower than the prime lending
rates. In addition to this cost the borrower has to bear another cost in the form of stamp duty and placement fees payable to the dealer of CP who arrange the sale.
o CP comes under the purview of RBI which has issued guidelines in 1990 on the basis of
recommendations of the Vaghul Committee.
Guidelines for issue of CP in India:
1. CP should be in the form of Usance Promissory Note negotiable by endorsement and
delivery. It is issued at a discount to the face value as may be decided by issuing company.
2. Amount to be raised by CP is not restricted by the company's cash credit component of the maximum Permissible Bank Finance. CPs can be issued up to 100% of the fund based working capital limit enjoyed with the bankers.
3. CP is issued in the denomination of Rs. 5,00,000, but the minimum lot or investment is Rs. 25,00,000 per investor.
4. CPs should be issued for a minimum period of 7 days and maximum of 12 months. No grace period is allowed for repayment.
5. CPs can be issued by a company whose a. Tangible net worth is not less than Rs. 5 crores. b. Fund based working capital limit is not less than Rs. 4 crores. c. Shares are listed on the stock exchange. d. Specified credit rating is obtained from CRISIL or ICRA or CARE e. The current ratio is 1.33: 1.00
6. All expenses (such as dealers fees, rating agency fee, other relevant cost) should be borne by issuing company.
7. CPs can be issued to any person, bank, company. The issue of CP to NRls can only be on non- repatriable basis and is not transferable.

Financial Management www.IndigoLearn.com 32
Benefits of Commercial Paper:
Inter Corporate Deposits (ICD):
• Sometimes the companies borrow funds for a short-term period, say up to six months, from other companies which have surplus liquidity for the time being.
• The ICD are generally unsecured and are arranged by a financer.
• The ICD are very common and popular in practice as these are not subject to legal hassles. Convenience is the basic virtue of this method of financing.
• The rate of interest on ICD varies depending upon the amount involved and time period. The entire working of ICD market is based upon the personal connection of the lenders, borrowers and financers.
Bridge Finance:
• Bridge finance refers, normally to loans taken by a business usually from commercial banks for a short period, pending disbursement of sanctioned term loan by financial institutions.
• Normally it requires a time for the financial institution to finalise procedures of creation of security, tie - up participation with other institutions etc. even though appraisal of the project is made.
• Once the loans are sanctioned in principle, in order to avoid delay in project implementation, bridge finance arrangement is made.
• Repayment: Such temporary finance is repaid out of the disbursement of the principal term loan.
• Security: It is secured by hypothecation of movable assets, personal guarantees and demand loans.
• Generally, the rate of interests on bridge finance is higher than as compared to that on term loans.
a. To the Issuer:
i. Low interest expenses
ii. Access to short-term
funding
iii. Flexibility and Liquidity
iv. Investor recognition
v. Ease and Low cost of
establishment
b. To the Investor:
i. Higher yield
ii. Portfolio diversification
iii. Flexibility to match cash flow
requirements
iv. Liquidity
v. issued by reputed corporates, hence, less
risky.
vi. the instruments are credit rated.
Date of
sanction
10.10.11
Date of
Disbursement
20.12.11

Financial Management www.IndigoLearn.com 33
• Maturity period is equal to or less than one year (s per RBI Guidelines).
• It can also be called as “interim Loan”.
Certificate of Deposit (CD):
• CDs are time deposits of specific maturity similar in nature to commonly available fixed deposits (FDs) of the banks.
• The major difference between the two being that CDs are easily transferable from one party to another, whereas FDs are not transferable.
• The CDs are unsecured negotiable promissory notes issued by commercial banks and Development Financial Institution (DFIs).
• While the commercial bank CDs are issued on discount to face value basis, the CDs issued by DFIs can be coupon bearing.
• The discount rates of CDs are market determined.
• The maturity period ranges from 91 days for the CDs issued by banks to 1-3 years for those issued by DFIs.
• CDs are freely transferable after 45 days after the date of issue.
• The CDs can be issued for a minimum amount of Rs.1 lakh to a single investor. There is no limit on total quantum of funds raised through CDs.
Lease Financing:
Lease is a type of Financing, to use an asset, by way of possession but not ownership. It is a
contract between the owner of the asset (Lessor) and the user (Lessee), for a specified period.
The lessor pays Lease Rentals to the Lessor, at the specified time (intervals) for using the
asset. It is also preferred source of finance as it can be arranged faster than a loan from a
financial institution.
TYPES OF LEASES: i) Operating Lease ii) Finance Lease
Operating Lease:
An operating Lease is generally made for a smaller period and smaller rentals. In other words,
the term of this type of lease is much lesser than the economic life of the asset and hence
the lessor is not said to earn to the extent of recovery of capital outlay. The risk incident of
the asset belongs to the actual owner and hence he will alone be eligible to claim for
depreciation of the asset. Also, the cost of maintenance and repair is borne by the lessor and
such lease can be cancelled at the option of the lessor
Finance Lease:
A finance lease is longer in term and it can contribute for the recovery of capital outlay, for
the lessor. Thus, it is a contract to finance the use of the equipment for the major part of its
economic life. The lessee is said to use the asset, but the title remains with the lessor. It is
thus a capital lease and is called a loan in disguise.

Financial Management www.IndigoLearn.com 34
The risk incident is transferred to the lessee and he takes care of the maintenance & repairs.
Even the reward of claiming depreciation on the asset is taken by the lessee. The lease is
non-cancellable by either of the parties, unless with a prior notice as mentioned in the lease
deed.
Other types of leases:
1) Sale and Lease Back:
Under this model, the owner of the asset sells the asset to the buyer and makes a lease contract with the buyer, for the asset and takes the position of a lessee, making the buyer – lessor. Thus, the asset is not physically exchanged and is left with the original owner only (i.e., seller or lessee). Thereby, the seller gets the sales proceeds and pays the lease rentals and versa for the buyer.
2) Levered Lease: Under this model, the owner buys the asset, by borrowing most of the purchase cost (say 80%) from a lender, and then gives it on lease to the lessee. The asset is given as security to the lender. Finally, the lender is paid off his dues from the lessee directly and the surplus over & above the due is received by the lessor in the form of lease rental. Here, lessor can claim the depreciation.
3) Sales aided Lease:
Under this model, the lessor buys the asset from the manufacturer and enters into a tie up with him to market the product (asset). Lessor does the same with his leasing operations and receives both, commission from the manufacturer and lease rentals from the lessee.
4) Open ended & Close ended Lease:
In the case of open-ended lease, the lessee is given the option to purchase the asset at the end of lease period, whereas, in the case of close ended lease the assets get transferred to the lessor only. In the latter case, the risk of obsolescence, residual value etc., remain with the lessor
New Debt Instruments:
In the changing scenario, it has become imperative for the corporate sector to device new debt instruments for raising funds from the market.
1. Deep Discount Bonds (DDB)
• These bonds are issued at discount and redeemed at face value.
• They are issued for a very long period, say 20-25 years.
• No interest is paid during the life of the bond.
• The difference between the sale price / maturity proceeds and cost of acquisition will be treated as capital gain, which is subject to indexation of cost and concessional rate of income tax.
• IDBI for the first time issued DDB at a deep discount price of Rs. 2,700 for which an investor got a bond with a face value of Rs, 1 lakh with a maturity period of 25 years. It allows investor to lock-in the yield to maturity or withdrawing from the scheme on a specified period (After 5,10,15 or 20 years). The effective rate of interest to maturity works out to 15.54% p.a.
• The investor can also sell the bonds on stock exchange.

Financial Management www.IndigoLearn.com 35
• One of the demerits of DDB is that thy may face difficulty in arranging such huge amount of funds at the time of repayment.
Face Value = Issue Price (1 + r) n
Where, r = rate of interest per annum compounded annually, n = maturity years
2. Zero Interest Bonds (ZIB) / Zero Coupon Bonds (ZCB):
• ZIB refers to those bonds which are sold at discount from their eventual maturity value and have zero interest rate.
• These bonds are sold to the investor for discount. The difference between the face value of the certificate and acquisition cost is capital gain to the investors, which is subject to indexation of cost and concessional rate of income tax.
• The investors are not entitled to any interest and are entitled only repayment of principal sum on the maturity period. It operates in the same manner as Deep Discount Bond, but the lock in period is comparatively lesser.
• The investor prefers ZIB because of lower investment cost. ZIB may be fully or partly convertible bonds.
• Companies also find ZIB quite attractive because there is no immediate interest Commitment.
• On maturity the bonds can be converted into equity shares or non - convertible debentures depending upon the desired capital structure of a company.
Face Value = Issue Price (1 + r) n
Where, r = rate of interest per annum compounded annually, n = maturity years
3. Security Premium Notes (SPN): (May 2008)(2 marks)
The SPN is a tradable instrument with detachable warrant against which the holder gets right to apply for equity shares after a fixed period of time. The SPN have feature of medium to long term notes
Example: Infotech Limited Issue SPN the face value of Rs. 1,000. No interest will accrue on the instrument during first three years after allotment. Subsequently in year 4 to 7 SPN will be repaid in 4 equal instalments of Rs. 250 each, along with additional premium of Rs. 250 each over 4 to 7 years. With each SPN, a warrant will be attached, which will give the holder the right to apply and get 20 equity shares of Rs. 10 each at the end of 4 years at a premium of Rs. 20 per share.
4. Option Bonds:
These are cumulative and non - cumulative bonds, where interest is payable on maturity or periodically. Redemption premium is also offered to attract investors.
5. Double option Bonds : These bonds are issued in the form of two certificates: one for the principal amount and the other for the interest amount. Both these certificates can be traded in the stock
Option Bonds
Cumulative
Interest is payable on maturity
Non - Cumulative bonds
Interest is payable periodically.

Financial Management www.IndigoLearn.com 36
market together or separately.
IDBI issued Double option Bonds. The Face value of each Bond is Rs. 5,000. The bond carry interest at 15% p.a. compounded half yearly from the date of allotment. The bond has maturity period of 10 years. Each bond has two parts in the form of two separate certificates. One for, principal of Rs. 5,000 and the other for interest (including redemption premium) of Rs. 16,500. Both these certificates are listed on the stock exchange. The investor has the option of selling either one or both parts anytime he wishes.
6. Inflation Adjusted Bonds (IAB)
IAB are bonds which promise to repay both the principal and the interest adjusted with inflation. For example, if the normal coupon rate is 10% and inflation is 4%, the investor will earn 14% and hence value of money received will not decline due to inflation.
7. Floating Rate Bonds / adjustable interest bonds / variable rate bonds:
The interest rate paid to the floating rate bond holders changes periodically depending upon the market rate of interest payable on gilt-edged securities. These bonds are also called adjustable interest bonds or variable rate bonds. If the issuing company expects that interest rate will decline in future, it will issue floating rate bonds. The interest rate may be linked to certain benchmark rates like LIBOR, MIBOR, Treasury Bill rate, Prime Lending rate, etc.
8. Zero interest fully convertible debentures
▪ These are fully convertible debentures, which do not carry any interest.
▪ The debentures are compulsorily and automatically converted after a specified period and its holders are entitled to new equity shares of the company at the predetermined price.
▪ The Company is benefited since no interest is to be paid on it. The investor is benefited if the market price of the Company’s shares is very high since he tends to get equity shares of the company at an agreed lower rate.
9. Seed Capital Assistance:
This is a scheme for providing financial assistance to deserving entrepreneurs who are professionally or technically qualified and possess the relevant skills and experience, but don’t have adequate funds.
This scheme promotes small and medium industries.
a. Applicability: The Seed Capital Assistance Scheme is designed by the IDBI for professionally or technically qualified entrepreneurs and / or persons possessing relevant experience, skills and entrepreneurial traits. All the projects eligible for financial assistance from IDBI directly or indirectly through refinance are eligible under the scheme.
b. Amount of Finance: The project cost should not exceed Rs. 2 crores. The maximum assistance under the scheme will be (a) 50% of the required promoter’s contribution or (b) Rs. 15 lacs, whichever is lower.
c. Interest and Charges: The assistance is initially interest free but carries a service charge of 1% to 2% per annum for the first five years and at increasing rate thereafter. When the financial position and profitability is favourable, IDBI may charge interest at a suitable rate even during the currency of the loan.
d. Repayment: The repayment schedule is fixed depending upon the repaying capacity of the unit with an initial moratorium of up to five years.
e. Other Agencies: For projects with a project cost exceeding Rs. 2 crores, seed capital may be obtained from the Risk Capital and Technology Corporation Ltd.

Financial Management www.IndigoLearn.com 37
(RCTC), now known as IFCI venture Capital Funds Ltd (IVCF). For small projects costing up to Rs. 5 lakhs, assistance under the National Equity Fund of the SIDBI may be availed.
Major sources of Foreign Currency Funds
The major sources of foreign currency funds are:
a. Commercial banks: Commercial Banks extend foreign currency loans for international operations, just like rupee loans (domestic loans). The banks also provide facilities for overdraft.
b. Developed banks: Development banks offer long- and medium-term loans including foreign currency loans. These are national level agencies and offer several concessions to foreign companies to invest within their country and to finance exports from their countries, e.g. EXIM Bank.
c. International agencies: International agencies like the International Finance Corporation (IFC), The International Bank for Reconstruction & Development (IBRD), The Asian Development Bank (ADB), The International Monetary Fund (IMF), etc. provide indirect assistance for obtaining foreign currency.
d. International Capital Markets: Savings of individual investors can be effectively tapped by issue of shares or debentures in the world market and not just in the local market. International Capital Markets in Tokyo, London, Luxembourg, New York cater to the needs of Multi-National Corporations raise substantial sums from investors spread across the globe, not just in one country.
Sources of International Financing
EURO ISSUES After decades of regulated economic policies, the Government of India started major economic reforms in 1991 aimed at integration of Indian economy with Global economies.
In 1992 Government of India permitted Indian Companies with consistent track record of good performance (for a minimum period of 3 years), to raise funds by issuance of equity / debt capital in International market through Global Depository Receipt (GDR), Foreign Currency Convertible Bonds (FCCB). Euro issues are outside the ambit of SEBI guidelines and regulations.
Benefits to the issuer:
1. International market being very large, and liquid has capacity to absorb larger issue.
2. Broaden the base of shareholders and quality of investors. 3. It offers better comparative share value. 4. Cost of raising funds from international market is generally lower than the
cost of domestic issues. 5. It implies acceptance of sophisticated western investors, which in turn will
enhance the image of the company and product internationally. 6. Availability of foreign exchange fulfils the requirement of funds for overseas
acquisitions and other capital expenditures.

Financial Management www.IndigoLearn.com 38
Financial instruments dealt with in the international market:
1. Foreign Bonds: Debt instruments denominated in a currency which is foreign to the borrower and is sold in the country of that currency e.g. A British firm places US Dollar Bond in USA.
2. Euro Bonds: Debt instrument denominated in a currency outside the country of that currency e. g. A sterling Pound Bond issued in Germany. A Yen bond floated in Germany; a yen bond issued in France.
3. Fully Hedged Bonds: In foreign bond, the risk of currency fluctuation exists fully hedged bonds eliminates the risk by selling in forward market the entire stream of principal and interest payment.
4. Floating Rate Notes: In these notes interest rates are adjusted to reflect the prevailing exchange rates.
5. Euro Commercial Papers: ECPs are short-term money market instruments. They are for maturities for less than a year. They are usually designated in US dollars. The principal distinguishing feature is that CPs are not underwritten by a bank and the issuer, therefore, is one with very high credentials. The paper is usually issued in higher denominations of the order of $1,00,000 and the market is dominated by large professional investors. Although these can be issued in interest-bearing form, they are usually issued at a discount to face-value and quoted in the secondary market on a yield basis.
6. Euro Convertible Bonds: It is a Euro-Bond, a debt instrument which gives the
bondholders an option to convert them into a pre-determined number of equity shares of the company. Usually the price of the equity shares at the time of conversion will have a premium element. These bonds carry a fixed rate of interest. These bonds may include a Call Option (where the issuer company has the option of calling / buying the bonds for redemption prior to the maturity date) or a Put Option (which gives the holder the option to put / sell his bonds to the issuer company at a pre-determined date and price).
7. Euro Bonds with Equity Warrants: These bonds carry a coupon rate determined by
market rates. The warrants are detachable. Pure bonds are traded at a discount. Fixed Income Funds Management may like to invest for the purposes of regular income.
8. Euro Convertible Zero Bonds: These bonds are structured as a convertible bond. No
Benefits to the investor:
1. Euro issues are made by companies with proven track record. 2. Listed and traded in international stock market. 3. It is generally denominated in US Dollars and hence minimize foreign
exchange risk. 4. Dividend, interest and capital gains generally carry concessional tax rates. 5. Market for most of the scripts is liquid and hence facilitates faster entry and
exit. 6. Investors are required to comply simplified formalities. 7. Diversification of funds. 8. Higher returns.

Financial Management www.IndigoLearn.com 39
interest is payable on the bonds. But conversion of bonds takes place on maturity at a pre-determined price. usually there is a five years maturity period and they are treated as a deferred equity issue.
9. External Commercial Borrowings. (ECB)
• External Commercial Borrowings (ECB) refer to Commercial Loans, which may be in the form of Bank Loans, Buyers Credit, Suppliers Credit, Securitised Instruments (e.g. Floating Rate Notes or Fixed Rate Bonds), availed from Non-Resident Lenders, with minimum average maturity of 3 years.
• Borrowers can raise ECBs through Internationally recognized sources like –(a) International Bank, (b) International Capital Markets, (c) Multilateral Financial Institutions e.g. ADB (d) Export Credit Agencies, (e) Suppliers of Equipment, (f) Foreign Equity Holders.
• ECBs can be accessed through- (a) Automatic Route (for Companies registered under the Companies Act, and NGOs engaged in micro-finance activities), or Approval Route (i.e. after obtaining RBI/Government Approval).
Method used to hedge against foreign exchange rate risk
1. Foreign Currency Option: A Foreign Currency Option is the right to buy or sell but not the obligation, a specified foreign currency at a specified price at some specified date in future. It provides hedge against foreign exchange fluctuation risk.
2. Foreign Currency Futures: Foreign Currency Futures are rights as well as obligations to buy or sell a specified currency at a specified price at some specified date in future. It provides hedge against foreign exchange fluctuation risk.
International Financial Instruments and Indian Companies
In India, two principal forms of international offering are made by companies tapping the international capital market
1. Foreign Currency Convertible Bonds (FCCB). 2. Depository Receipts (DR). - American Depository Receipts and Global Depository
Receipts.
Foreign Currency Convertible Bonds (FCCB):
• The FCCB is a bond issued in accordance with the relevant scheme and subscribed by a non - resident in a foreign currency and convertible into equity shares of issuing company, either in whole or part, based on equity related warrants attached to the debt instrument.
• FCCBs are unsecured, carry fixed rate of interest and option to convert into fixed number of equity shares of the issuer company.
• Interests rates are very low as compared to domestic market.
• FCCBs are denominated in freely convertible foreign currency.
• FCCBs are popular with issuers, as domestic market can be restricted with comparatively shorter maturities with high rate of interest. On the other hand, low coupon, Security option and arbitrage opportunities available with the investors is also an attractive feature.
• The major drawback is that issuing company cannot plan its capital structure, as it is not assured of conversion of FCCBs. Moreover, projection of cash out flow on maturities

Financial Management www.IndigoLearn.com 40
also cannot be made.
• FCCBs are also subject to foreign exchange risk.
• FCCBs result in creation of external debt, that requires foreign exchange outflow from the country, if conversion option is not exercised by the investors.
ADVANTAGES OF FCCB
• Interests rates are very low as compared to domestic market.
• FCCBs carry a lesser restrictive covenant as compared to a debenture or loan.
• The convertible bond gives the investor the flexibility to convert the bond into equity at a price or redeem the bond at the end of a specified period, normally three years if the price of the share has not met his expectations.
• Companies prefer bonds as it leads to delayed dilution of equity and allows company to avoid any current dilution in earnings per share that a further issuance of equity would cause.
• FCCBs are easily marketable as investors enjoys option of conversion into equity if resulting to capital appreciation. Further investor is assured of a minimum fixed interest earnings.
DISADVANTAGES OF FCCB
• Exchange risk is more in FCCBs as interest on bonds would be payable in foreign currency. Thus, companies with low debt equity ratios, large forex earnings potential only opt for FCCBs.
• FCCBs mean creation of more debt and a forex outgo in terms of interest which is in foreign exchange.
• In the case of convertible bonds, the interest rate is low, say around 3-4% but there is exchange risk on the interest payment as well as re-payment if the bonds are not converted into equity shares. The only major advantage would be that where the company has a high rate of growth in earnings and the conversion takes place subsequently, the price at which shares can be issued can be higher than the current market price.
DEPOSITORY RECEIPTS: (DR)
• DR is an instrument in the form of depository receipt or certificate created by the overseas Depository Bank outside India and issued to the non - resident investors against the issue of equity shares.
• A depository receipt is a negotiable instrument evidencing a fixed number of equity shares of the issuing company generally denominated in US Dollars.
Depository Receipts
American Depository
Receipts
Indian Depository
Receipts
Global Depository
Receipts

Financial Management www.IndigoLearn.com 41
• DRs are commonly used by those companies which sell their securities in international market and expand their shareholdings abroad.
• These securities are listed and traded in International Stock Exchanges.
• These are either American Depository Receipts (ADR) or Global Depository Receipts (GDR). ADRs are issued in case the funds are raised through retail market in United States. In case of GDRs, the invitation to participate in the issue cannot be extended to retail US investors.
• While DRs denominated in freely convertible foreign exchange, are issued by the depository in the international market, the underlying shares denominated in Indian Rupees are issued in the domestic market by the issuing company are customised with local bank called “Custodian”.
• An investor has an option to convert GDR into a fixed number of equity shares of issuer company after cooling period of 45 days. He can do so by advising the depository. The depositor, in turn, will instruct the custodian about cancellation of GDR and release the corresponding shares in favour of the non- resident investor, for being sold directly on behalf of the non - resident or being transferred in the books of account of the issuing company in the name of non - resident. Until such conversion, GDRs. are traded on Overseas Stock Exchange entitled for dividend but carry no voting rights. On conversion of GDRs into equity shares, the said shares carry voting rights and yield rupee dividend and are tradable on Indian Stock Exchange like any other equity issue.
The following agencies are involved in Euro Issue: 1. Lead Manager 2. Overseas Depository Bank 3. Domestic Custodian Bank
American Depository Receipts (ADR)
Depository Receipts issued by a company in the United States of America is known as American Depository Receipt (ADR). Such receipts have to be issued in accordance with the provisions stipulated by the Securities and Exchange Commission (SEC) of USA. Such provisions cover many matters such as minimum requirements with respect to size, reporting requirements such as adherence to US GAAP, etc. and are stringent. Only very large companies in India can perhaps qualify for such parameters. An ADR is generally created by the deposit of the securities of a non-US company with a custodian bank in the issuers’ country. The custodian bank ties up with the US Depository for the issue of the ADRs. ADRs are denominated in dollars and are traded in the same way as other securities in the USA.
TYPES OF ADRS:
a. Unsponsored ADRs - These are issued without any formal agreement between the issuing company and the depository, although the issuing company must consent to the creation of the ADR facility. With unsponsored ADRs, certain costs, including these associated with disbursement of dividends, are borne by the investor. For the issuing company, they are inexpensive method of accessing the US capital markets. They are exempt from most of the reporting requirements of Securities and Exchange Commission (SEC).
b. Sponsored ADRs - These are created by a single depository which is appointed by the issuing company under rules provided in the deposit agreement. There are 2 types sponsored ADRs.

Financial Management www.IndigoLearn.com 42
i. Restricted ADRs - These are restricted with respect to the type of buyer, which is allowed, and are privately placed.
ii. Unrestricted ADRs - These-are unrestricted with respect to buyer and are publicly placed and traded. There are 3 classes of unrestricted ADRs, each increasingly demanding in terms of reporting requirement to the SEC, but also increasingly attractive in terms of degree of visibility provided.
Advantages to the issuer of ADRs Disadvantages to the issuer of ADRs
• Access to large capital
• Access to foreign exchange
• No change in the shareholding / voting pattern.
• High cost of issue and compliance
• Disclosure requirements are more stringent
Global Depository Receipts (GDR)
GDR is a dollar denominated instrument tradable on Stock exchange in Europe or the US or both. It represents a non-US companies publicly traded local currency (Indian rupee) equity shares. The modalities of issue of GDR can be put as follows:
a. The GDR represents a certain number of equity shares. For instance, in case of Reliance Industries Ltd, one GDR represents two equity shares.
b. The GDR is quoted and traded in dollar terms, but the equity shares are denominated in rupees.
c. The shares are issued by the issuing company to intermediary called "depository". The equity shares are registered in the name of depository and he is the person who subsequently issues the GDR to the investors.
d. The physical possession of the equity shares is with another intermediary called the "custodian", who is an agent of the depository.
e. GDR has a distinct identity though it represents the issuing company's shares. In fact, GDR doesn't appear in the books of the issuing company.
f. An investor has an option to convert GDR into a fixed number of equity shares of issuer company after cooling period of 45 days. He can do so by advising the depository. The depositor, in turn, will instruct the custodian about cancellation of GDR and release the corresponding shares in favour of the non-resident investor, for being sold directly on behalf of the non-resident or being transferred in the books of account of the issuing company in the name of non-resident.
Once the underlying shares are issued, the same cannot be re-customised. Until such conversion, GDRs are traded on Overseas Stock Exchange entitled for dividend but carry no voting rights. On conversion of GDRs into equity shares, the said shares carry voting rights and yield rupee dividend and are tradable on Indian Stock Exchange like any other equity issue.
ADVANTAGE OF GDRS: a. The issuer has the benefit of collecting the issue proceeds in foreign currency which
may be utilised for meeting the foreign exchange component of the project cost, repayment of foreign currency / loan, etc.
b. It has been perceived that a GDR issue has been able to fetch higher prices from international investors than those that a domestic public issue would have been able to extract from Indian investors.
c. GDR does not entitle the holder to any voting rights, so there is no fear of loss of management & control.
d. The GDR holder can convert the GDR and become an equity shareholder instead.

Financial Management www.IndigoLearn.com 43
e. GDR does not involve any foreign exchange risk to the issuing company, as the shares represented by GDR are expressed in rupees.
DIFFERENCES BETWEEN GDR & ADR
GDR ADR
Quoted on stock exchange other than USA Quoted in USA only
Disclosure requirements are less stringent Disclosure requirements are more stringent
Only Institutional Investors can participate in the offer
US Retail investors in addition to US Institutional Investors can participate in the offer.
Limited institutional investors, so stock may not value at fair value.
Wider interest of the investors and better valuation of stocks on account of participation of retail investors
Low cost of compliance as compared to the ADR
High cost of compliance as compared to the GDR
Traded in more than one currency Traded in US $ only
GDR's Vs EURO - BONDS
1. GDR is an equity instrument whereas Euro-bonds are debt instrument. 2. GDR puts all the risks on the foreign investor, while Euro-bonds tend to add to the
country's external debt
Indian depository receipts.
As per the definition given in the Companies (Issue of Indian Depository Receipts) Rules, 2004, IDR is an instrument in the form of a Depository Receipt created by the Indian depository in India against the underlying equity shares of the issuing company. In an IDR, foreign companies would issue shares, to an Indian Depository (say National Security Depository Limited – NSDL), which would in turn issue depository receipts to investors in India. The actual shares underlying the IDRs would be held by an Overseas Custodian, which shall authorize the Indian Depository to issue the IDRs. The IDRs would have following features:
Overseas Custodian: It is a foreign bank having branches in India and requires approval from Finance Ministry for acting as custodian and Indian depository has to be registered with SEBI.
Approvals for issue of IDRs: IDR issue will require approval from SEBI and application can be made for this purpose 90 days before the issue opening date.
Listing: These IDRs would be listed on stock exchanges in India and would be freely transferable.
Eligibility conditions for overseas companies to issue IDRs:
Capital: The overseas company intending to issue IDRs should have paid up capital and free reserve of at least $ 100 million.
Sales turnover: It should have an average turnover of $ 500 million during the last three years.
Profits/dividend: Such company should also have earned profits in the last 5 years and should have declared dividend of at least 10% each year during this period.

Financial Management www.IndigoLearn.com 44
Debt equity ratio: The pre-issue debt equity ratio of such company should not be more than 2:1.
Extent of issue: The issue during a particular year should not exceed 15% of the paid-up capital plus free reserves.
Redemption: IDRs would not be redeemable into underlying equity shares before one year from date of issue.
Denomination: IDRs would be denominated in Indian rupees, irrespective of the denomination of underlying shares.
Benefits: In addition to other avenues, IDR is an additional investment opportunity for Indian investors for overseas investment.
RATIO ANALYSIS

Financial Management www.IndigoLearn.com 45
INTRODUCTION
‘Financial Statements Analysis’ refers to draw meaningful interpretation of financial statements for parties demanding financial information. In this analysis user-oriented approach is adopted instead of following the traditional proprietary approach.
Traditionally and popularly the term ‘Financial Statement’ means Balance - Sheet and Profit & Loss Account. The term financial statements are usually defined as, “statements that contains financial information”. It does not merely consist of Annual Report, although for external users the major portion for the financial information comes from the annual report.
Traditionally, the financial statements are prepared for the proprietors and the accounting aids for stewardship function. In recent years the concept of stewardship accounting has been changed for user-oriented approach has emerged to fit the purpose of recipients of financial information.
Various parties interested in financial statement analysis
MANAGEMENT: Management is concerned with analysing the overall strengths and weaknesses of the company. Based on analysis, they can plan for future. Management is interested in evolving analytical tools that will measure costs, operational efficiency, liquidity and profitability with the objective of taking appropriate decisions.
INVESTORS Investors are primarily interested in earning capacity, liquidity and financial risk of the company. They calculate profitability ratios, liquidity ratios and capital structure ratios. These ratios determine whether investors can earn regular and growing returns. TRADE CREDITORS They are primarily concerned with short-term liquidity position of the company since their claim fall due only in short term. They generally calculate liquidity ratios like current ratio, quick ratio, etc. LONG-TERM LENDERS LIKE BANKS, FINANCIAL INSTITUTIONS, ETC. They want to analyse the ability of the company to serve and redeem the debt within a specified period. They want to know the long-term profitability and cash flow position of the company. They calculate capital structure leverage ratios and profitability ratios. CUSTOMERS They want to assess the business viability of the company before entering into long-term contract with the company. The relationship over the time may be a study of comparable firms at a particular time or it may be study of particular firm over a period of time or it may cover both.
Prominent Users
Owners or
investor or
shareholders
Creditors /
debenture
holders
Financial
institutions /
bankers
Trade unions /
employees
Finance
executives
Economics /
security
analysts
Government /
regulating
agencies
Management

Financial Management www.IndigoLearn.com 46
Types of financial statement analysis
Internal analysis External analysis Horizontal analysis Vertical analysis
This analysis is done by company’s own management.
This analysis can be done by any outside parties like creditors, banks, etc.
This analysis involves comparison of financial data of different years. Example: comparison between gross profit ratio for last two financial years.
This involves study of relationship between different items of financial statements for one particular year. Example: calculating gross profit to sales ratio for the year.
Financial ratio analysis
• A ratio is a statistical yardstick that provides a measure of relationship between two financial figures.
• Financial ratios measures relationship expressed in mathematical terms between figures which are connected with each other in significant manner.
• It is a process of determining, interpreting and presenting numerical relationships of items and group of items in the financial statements.
• “Ratio analysis is a process of analysis of the ratios in such a manner, so that the management can take actions on off standard performances.”
STEPS INVOLVED IN THE PROCESS OF RATIO ANALYSIS:
Ratios are presented in the following forms :
Ratios are expressed as rates which refer to ratios over a period of time (fixed assets turnover ratio, Inventory
turnover ratio etc.)
Merely a quotient (Current Ratio, Proprietors Funds : Total assets Ratio etc.)
Ratios are presented by per cent. (Gross Profit
Ratio, ROI, etc.)

Financial Management www.IndigoLearn.com 47
Financial Ratios for Evaluating Performance:
a. Liquidity Position:
• With the help of ratio analysis one can draw conclusions regarding liquidity position of a firm.
• The liquidity position of a firm would be satisfactory if it is able to meet its current obligations when they become due.
• A firm can be said to have the ability to meet its short-term liabilities if it has sufficient liquid funds to pay the interest on its short maturing debt usually within a year as well the principal. This ability is reflected in the liquidity ratios of a firm.
• Liquidity ratios are current ratio, liquid ratio and cash to current liability ratio.
• The liquidity ratios are particularly useful in credit analysis by banks and other suppliers of short-term loans.
b. Long-term Solvency:
• Ratio analysis is equally useful for assessing the long-term financial viability of a firm.
• This aspect of the financial position of a borrower is of concern to the long-term creditors, security analysts and the present and potential owners of a business.
• The long-term solvency is measured by the leverage /capital structure and profitability ratios which focus on earning power and operating efficiency.
• Ratio analysis reveals the strengths and weaknesses of a firm in this respect.
• The leverage ratios, for instance, will indicate whether a firm has a reasonable proportion of various sources of finance or whether heavily loaded with debt in which case its solvency is exposed to serious strain.
• Similarly, the various profitability ratios would reveal whether the firm is able to offer adequate return to its owners consistent with the risk involved.
c. Operating Efficiency:
• Ratio analysis throws light on the degree of efficiency in the management and utilization of its assets.
• The various activity ratios (such as turnover ratios) measure this kind of operational efficiency.
• These ratios are employed to evaluate the efficiency with which the firm manages and utilizes its assets.
1. Establising the pupose of financial analysis
2. Working of Ratios
3. Interpretation of Ratios
4. Remedial actions on variance with the objective of improvement in efficiency.

Financial Management www.IndigoLearn.com 48
• These ratios usually indicate the frequency of sales with respect to its assets. These assets may be capital assets or working capital or average inventory.
• In fact, the solvency of a firm is, in the ultimate analysis, dependent upon the sales revenues generated by use of its assets – total as well as its components.
d. Overall Profitability:
• Unlike the outside parties which are interested in one aspect of the financial position of a firm, the management is constantly concerned about the overall profitability of the enterprise.
• That is, they are concerned about the ability of the firm to meet its short-term as well as long-term obligations to its creditors, to ensure a reasonable return to its owners and secure optimum utilisation of the assets of the firm.
• This is possible if an integrated view is taken and all the ratios are considered together.
e. Inter-firm Comparison:
• Ratio analysis not only throws light on the financial position of a firm but also serves as a steppingstone to remedial measures.
• This is made possible due to inter-firm comparison / comparison with industry averages.
• A single figure of ratio is meaningless unless it is related to some standard or norm.
• One of the popular techniques is to compare the ratios of a firm with the industry average.
• It should be reasonably expected that the performance of a firm should be in broad conformity with that of the industry to which it belongs.
• An inter-firm comparison would demonstrate the relative position vis-à-vis its competitors.
• If the results are at variance either with the industry average or with those of the competitors, the firm can seek to identify the probable reasons and, in the light, take remedial measures.
• Ratios not only perform post-mortem of operations, but also serve as barometer for future.
f. Financial Ratios for Budgeting:
• In this field ratios can provide a great deal of assistance, budget is only an estimate of future activity based on past experience, in the making of which the relationship between different spheres of activities are invaluable.
• Ratios are very helpful in forecasting and planning the business activities for a future. It helps in budgeting.
• It is usually possible to estimate budgeted figures using financial ratios.
• Ratios also can be made use of for measuring actual performance with budgeted estimates.
• They indicate directions in which adjustments should be made either in the budget or in performance to bring them closer to each other.
Classification of ratios:

Financial Management www.IndigoLearn.com 49
Ratios may be classified on the following basis leading to somewhat overlapping categories:
Classification according to the statement from which ratios are
derived –
Classification according to Importance
Functional Classification
• Balance – Sheet Ratios – both the items of ratio are taken from balance sheet, e.g., debt-equity ratio
• Revenue Statement Ratios- both the items of ratio are derived from Profit and Loss Account, e.g., gross profit ratio.
• Inter-Statement or combined Ratios – where the items are taken from different sources, e.g., return on capital employed.
• Primary Ratios (more important)
• Secondary Ratios (less important)
• Cash position ratios
• Liquidity ratios
• Working Capital ratios
• Capital Structure ratios
• Profitability ratios
• Debt Service coverage ratios
• Turnover ratios
ANALYSIS:
CASH POSITION RATIOS
Cash and Marketable securities constitute the most important reservoir, which a firm needs for meeting its daily operating expenses and other obligations.
Sr. No.
Ratio Formula Significance
1 Absolute Cash Ratio
Cash + Marketable Securities
Current Liabilities
It is the strictest measure of liquidity.
Indication of ready cash available to meet current liabilities
Higher ratio indicates better liquidity position.
A very high ratio is not desirable, since excess cash earns nothing.
2 Cash to total Assets Ratio
Cash + Marketable securities
Total Assets
Indication of composition of cash availability in total investment.
Higher ratio indicates better liquidity position.
A very high ratio is not desirable, since excess cash earns nothing.
3
Interval Measures
Cash + Marketable Securities
Average Daily Cash operating expenses
Indication of time length that can be covered by the available cash to meet operating expenses.
Higher ratio indicates better liquidity position.
A very high ratio is not desirable, since excess cash earns nothing.
Note: Marketable Securities means the securities, which can be converted into cash at short notice. Quoted Investments are not necessarily marketable securities.

Financial Management www.IndigoLearn.com 50
LIQUIDITY RATIOS
Liquidity or Short-term solvency means ability of the business to pay its short-term liabilities. Inability to pay-off short term liabilities affects its creditability as well as its credit rating. Continuous default on the part of the business leads to bankruptcy. Eventually bankruptcy leads to sickness and liquidation. Cash position ratios may be supplemented for liquidity appraisal.
Sr. No.
Ratio Formula Significance
1 Current Ratio
(The ratio is also called as ‘Working Capital’ or ‘Solvency Ratio’.)
Current Assets
Current Liabilities
Indication of availability of Current Assets to pay off Current liabilities.
Higher the ratio, better the coverage.
But a high ratio may be due to slow-moving inventory, inefficient debt collections, idle cash etc. so, this ratio may be cautiously analysed.
2: 1 ratio is treated as standard ratio.
Current ratio less than one means negative working capital or an aggressive financing policy which may be risky.
Ratio differs from industry to industry as well as with its policy
2 Liquid Ratio or Quick Ratio
(also known as Acid Test Ratio)
Quick Assets
Quick Liabilities
Or
Quick Assets
Current Liabilities
Indication of availability of quick assets to honour its immediate claims
A fairly strict measure of liquidity as compared to current assets.
It excludes those assets which have either slow or no cash realisation, e.g., stock and prepaid expenses.
Higher the ratio, better the coverage
1: 1 ratio is treated as standard ratio
Ratio differs from industry to industry as well as with policy
Current Assets = Inventories + Trade receivables + Cash and Bank Balances + Marketable Securities + Advances to Material Suppliers + Prepaid Expenses + Advance Income tax (in excess of provision) Current Liabilities = Trade Creditors + Creditors for Services + Short term loans + Bank overdraft / Cash credit + outstanding Expenses + Provision for taxation (net of advance tax) + Proposed dividend + Unclaimed dividend Quick Assets = Current Assets – Inventories Note: Often prepaid expenses are not considered as Quick assets.

Financial Management www.IndigoLearn.com 51
Quick Liabilities = Current Liabilities – Bank overdraft – cash credit from Bank. Note: quick liabilities do not include cash credit and bank overdraft since they are generally available for a continuous term.
WORKING CAPITAL / CASH FLOW RATIOS:
Cash generation ability of business is necessary to be judged. Since accounting profit and fund generation differs, cash from operations seems to be true measure to judge the performance.
Cash from operations is based on cash concept, i.e. net operational cash receipts.
Sr. No.
Ratio Formula Significance
1 Cash generated from operation to sales ratio
Cash generated from operations
Sales
Indication for cash generated for every Re. 1 Sale.
Higher the ratio, better the performance.
2 Cash generated from operation to Total Assets Ratio
Cash generated from operations
Total Assets (average)
Indication of cash generated for every Re. 1 investment.
Higher the ratio, better the performance.
CAPITAL STRUCTURE RATIOS / LONG-TERM SOLVENCY RATIOS / LEVERAGE RATIOS:
Capital structure ratios provide an insight into financial techniques used by business and focus on the long-term solvency position.
Sr. No.
Ratio Formula Significance
1 Owners’ Equity to Total Equity ratio
Owner Equity
Total Equity
Indication of proportion of owners’ funds to total funds invested in the business.
Higher the proportion of owner’s fund, lower is the degree of risk
2 Debt Equity Ratio
Long Term Debt
Shareholders’ Equity
The ratio is useful for deciding upon the capital structure
Lenders judge the standard borrowing capacity by normally considering the ratio as 2: 1.
Lending institutions nowadays set their own norms considering the capital intensity and other factors.
Indicator of financial leverage.
Owners’ Equity / Shareholders’ Equity = Share Capital (Equity + Preference) + Reserves and Surplus / (loss)

Financial Management www.IndigoLearn.com 52
3
Capital Gearing Ratio
Long Term Debt + Debentures + Preference Share Capital
Equity Share Capital + Reserves and Surplus – losses
and fictitious assets
The ratio is useful to show the proportion of fixed interest (dividend) bearing capital to funds belonging to equity shareholders
Higher the ratio, higher the risk.
The ratio is complementary to financial leverage
4
Fixed Assets to long term fund ratio
Fixed Assets
Long Term Funds
Fixed assets and core working capital are to be covered by long term funds.
There is no uniform standard ratio due to change in composition of fixed assets and current assets.
The ratio should be less than one.
If it is more than one, it means short term funds have been used to finance fixed assets. It means a very risky aggressive approach has been followed.
5
6.
Proprietary Ratio
Net working Capital ratio
Proprietary funds
Total Assets
Net working capital
Capital employed
The ratio indicates proprietors’ stake in total assets. It shows the limit up to which the shareholders own the business.
Higher the ratio, lower the risk, but profits won’t be maximised.
The ratio is like Owners Equity to Total Equity (Capital Structure Ratio)
Debt Equity Ratio and Current ratio affects the proprietary ratio.
This ratio shows the level of current assets being financed by long-term funds.
Proprietary Funds = Equity Share Capital + Preference Share Capital + Reserves and Surplus – losses and fictitious assets
Important Notes
- Preference share capital is included in Equity: when the ratio is being calculated to ascertain financial risk, e.g., Debt-equity ratio. - Preference share capital is included in debt: when the ratio is being calculated to show the effect of use of fixed charge funds on earnings available to shareholders, e.g., Fixed charges coverage ratio, Capital Gearing Ratio, etc. - All secured and unsecured loans are treated as Long –Term liability unless otherwise mentioned. - Any long-term debt maturing in current year is included in “Current Liabilities”.

Financial Management www.IndigoLearn.com 53
- Net fixed assets refer to “fixed assets less depreciation”. In all the ratios, we should use Net Fixed assets only. - From the point of view of debt providers, there should be low debt-equity ratio and high proprietary ratio. - Proprietary ratio + total debts to total assets ratio = 1
- 1 − 𝐹𝑖𝑥𝑒𝑑 𝐴𝑠𝑠𝑒𝑡𝑠
𝑐𝑎𝑝𝑖𝑡𝑎𝑙 𝑒𝑚𝑝𝑙𝑜𝑦𝑒𝑑 =
𝑤𝑜𝑟𝑘𝑖𝑛𝑔 𝑐𝑎𝑝𝑖𝑡𝑎𝑙
𝑐𝑎𝑝𝑖𝑡𝑎𝑙 𝑒𝑚𝑝𝑙𝑜𝑦𝑒𝑑 (assuming no non-trade investment by firm.)
PROFITABILITY RATIOS:
Return on Investment (ROI) is the basic profitability ratio. It is an indicator of overall efficiency. Higher ratio indicates better efficiency in utilisation of long-term funds.
𝑅𝑂𝐼 =𝑅𝑒𝑡𝑢𝑟𝑛𝑠 𝑜𝑟 𝐸𝑎𝑟𝑛𝑖𝑛𝑔𝑠
𝐼𝑛𝑣𝑒𝑠𝑡𝑚𝑒𝑛𝑡𝑋 100
Return on Capital Employed (ROCE) is computed as
𝑅𝑂𝐶𝐸 =𝐸𝐵𝐼𝑇
𝐶𝑎𝑝𝑖𝑡𝑎𝑙 𝐸𝑚𝑝𝑙𝑜𝑦𝑒𝑑 𝑋 100
Capital Employed: Equity Share Capital Preference Share Capital Reserves and Surplus Debentures and other long-term loans Less: 1. Miscellaneous expenditure and losses …. 2. Non-Trade Investments …...
Rs.
….. ….. ….. …..
…..
Capital Employed ….. ===
Notes:
Intangible assets having no physical existence like goodwill, patents and trademarks should be included in the capital employed. But no fictitious assets should be indicated within Capital Employed. It is more appropriate to work out the ratio based on ‘Average Capital Employed’ during the year. ROI may be calculated on the basis of shareholders capital employed.
Long-term Fund Approach (Equity shareholders’ funds + preference shares + Long term Debts)
Shareholders’ funds approach (Equity shareholders’ funds + preference shares)
Equity Shareholders’ funds approach

Financial Management www.IndigoLearn.com 54
𝑁𝑒𝑡 𝑂𝑝𝑒𝑟𝑎𝑡𝑖𝑛𝑔 𝑃𝑟𝑜𝑓𝑖𝑡
𝐶𝑎𝑝𝑖𝑡𝑎𝑙 𝐸𝑚𝑝𝑙𝑜𝑦𝑒𝑑
OR
1 𝐸𝐵𝐼𝑇
𝐿𝑜𝑛𝑔 𝑇𝑒𝑟𝑚 𝐶𝑎𝑝𝑖𝑡𝑎𝑙 𝐸𝑚𝑝𝑙𝑜𝑦𝑒𝑑
2 𝐸𝐵𝐼𝑇 (1 − 𝑡𝑎𝑥 𝑟𝑎𝑡𝑒)
𝐿𝑜𝑛𝑔 𝑇𝑒𝑟𝑚 𝐶𝑎𝑝𝑖𝑡𝑎𝑙 𝐸𝑚𝑝𝑙𝑜𝑦𝑒𝑑
Notes: (1) The first formula shows before tax return and second formula shows, after-tax return.
(2) First formula is used to
compare ROCE with cost of
debt to decide whether use
of debt will be justified or
not.
=𝐸𝑎𝑟𝑛𝑖𝑛𝑔𝑠 𝑎𝑣𝑎𝑖𝑙𝑎𝑏𝑙𝑒 𝑡𝑜 𝑆ℎ𝑎𝑟𝑒ℎ𝑜𝑙𝑑𝑒𝑟𝑠
𝑆ℎ𝑎𝑟𝑒ℎ𝑜𝑙𝑑𝑒𝑟𝑠′ 𝐶𝑎𝑝𝑖𝑡𝑎𝑙 𝐸𝑚𝑝𝑙𝑜𝑦𝑒𝑑
=𝑃𝐴𝑇
𝑆ℎ𝑎𝑟𝑒ℎ𝑜𝑙𝑑𝑒𝑟𝑠′𝑓𝑢𝑛𝑑
=𝐸𝑎𝑟𝑛𝑖𝑛𝑔𝑠 𝑎𝑣𝑎𝑖𝑙𝑎𝑏𝑙𝑒 𝑡𝑜 𝐸𝑞𝑢𝑖𝑡𝑦 𝑆ℎ𝑎𝑟𝑒 ℎ𝑜𝑙𝑑𝑒𝑟𝑠
𝐸𝑞𝑢𝑖𝑡𝑦 𝑆ℎ𝑎𝑟𝑒ℎ𝑜𝑙𝑑𝑒𝑟𝑠 𝐶𝑎𝑝𝑖𝑡𝑎𝑙 𝐸𝑚𝑝𝑙𝑜𝑦𝑒𝑑
=𝑃𝐴𝑇−𝑃𝑟𝑒𝑓.𝐷𝑖𝑣𝑖𝑑𝑒𝑛𝑑
𝑆ℎ𝑎𝑟𝑒ℎ𝑜𝑙𝑑𝑒𝑟𝑠′𝑓𝑢𝑛𝑑
ROI = Net Profit to Sales Ratio x Capital Turnover Ratio
Net Profit Sales = x x 100
Sales Capital Employed
Du Pont control chart
Return on investment (ROI) represents the earning power of the company. ROI depends on two ratios:
(a) Net Profit Ratio and (b) Capital Turnover Ratio.
A change in any of these ratios will change the firms earning power. These two ratios are affected by many factors. A change in any of these factors will change these ratios also. The various factors affecting the ROI can be put through a chart given below. This chart is known as the Du Pont Control Chart since it was first used by Du Pont Company of the USA.
The chart show that return on capital employed is affected by several factors. Any change in these factors will affect the return on capital employed. For example, if the cost of goods sold increases, without any corresponding increase in the selling price of the goods, the net profit would decrease and consequently ROI would also decrease. Similarly, if there is, increase in working capital, the total capital employed would increase and, therefore, in the absence of any increase in the net profit, ROI would decrease.
The chart helps the management in concentrating attention on different forces affecting profit. An increase in profit can be achieved either by more effective use of capital which will result in a higher turnover ratio or better sales efforts which will result in a higher net profit ratio. The same rate of return can be obtained either by a low net profit ratio but a higher turnover ratio or a low turnover ratio but a high net profit ratio.

Financial Management www.IndigoLearn.com 55
Return ROI = x 100 Capital Employed Profitability Ratio Capital Turnover Ratio Return x 100 Sales Sales Capital Employed
Material Consumed x 100Fixed Expenses x 100 Fixed Assets Working Capital Sales Sales Turnover Ratio Turnover Ratio
Wages x 100 Variable Expenses x 100 Sales Sales Sales Sales Fixed Assets Working Capital
Mfg. Exps x 100 Turnover of Individual Turnover Inventory Debtors’ Creditors Fixed Assets Ratio Turnover Turnover Sales Ratio Ratio
Admn. Exps x 100 Sales Selling & Dist. Exp x 100 Sales
Return on Equity (ROE):
Return on Equity measures the profitability of equity funds invested in the firm. This ratio reveals how profitability of the owners’ funds have been utilised by the firm. This ratio is computed as:
ROE = worthNet
tax after Profit
In case preference dividend is paid; ROE = Profit After Tax – Preference Dividend
Net Worth
Return on equity is one of the most important indicators of a firm’s profitability and potential growth. Companies that boast a high return on equity with little or no debt are able to grow without large capital expenditures, allowing the owners of the business to withdraw cash and reinvest it elsewhere. Many investors fail to realize, however, that two companies can have the same return on equity, yet one can be a much better business.
For that reason, a finance executive at E.I. Du Pont de Nemours and Co., of Wilmington, Delaware, created the DuPont system of financial analysis in 1919. That system is used around the world today and serves as the basis of components that make up return on equity.
Composition of Return on Equity using the DuPont Model

Financial Management www.IndigoLearn.com 56
There are three components in the calculation of return on equity using the traditional DuPont model- the net profit margin, asset turnover, and the equity multiplier. By examining each input individually, the sources of a company’s return on equity can be discovered and compared to its competitors.
(a) Net Profit Margin: The net profit margin is simply the after-tax profit a company generates
for each rupee of revenue. Net profit margins vary across industries, making it important to compare a potential investment against its competitors. Although the general rule-of-thumb is that a higher net profit margin is preferable, it is not uncommon for management to purposely lower the net profit margin in a bid to attract higher sales.
Net profit margin = Net Income Revenue
Net profit margin is a safety cushion; the lower the margin, the less room for error. A business with 1% margins has no room for flawed execution. Small miscalculations on management’s part could lead to tremendous losses with little or no warning.
(b) Asset Turnover: The asset turnover ratio is a measure of how effectively a company converts its assets into sales. It is calculated as follows:
Asset Turnover = Revenue Assets
The asset turnover ratio tends to be inversely related to the net profit margin; i.e. the higher the net profit margin, the lower the asset turnover. The result is that the investor can compare companies using different models (low-profit, high-volume vs. high-profit, low-volume) and determine which one is the more attractive business.
(c) Equity Multiplier: It is possible for a company with terrible sales and margins to take on excessive debt and artificially increased its return on equity. The equity multiplier, a measure of financial leverage, allows the investor to see what portion of the return on equity is the result of debt. The equity multiplier is calculated as follows:
Calculation of Return on Equity
To calculate the return on equity using the DuPont model, simply multiply the three components (net profit margin, asset turnover, and equity multiplier).
Return on Equity = (Net Profit Margin) (Asset Turnover) (Equity Multiplier)
Return on Shareholders
Fund = PAT NW
Financial Leverage
(Income)
= PAT EBIT
Return on Net
Assets
(RONA) = EBIT NA
Profit Margin =
EBIT Sales
Assets Turnover
= Sales NA
Financial Leverage (Balance
Sheet) = NA NW

Financial Management www.IndigoLearn.com 57
Du Pont Chart
Illustration XYZ Company’s details are as under: Revenue: Rs. 29,261; Net Income: Rs. 4,212; Assets: Rs. 27,987; Shareholders’ Equity: Rs. 13,572. Calculate return on equity.
Solution:
Net Profit Margin = Net Income (Rs. 4,212) Revenue (Rs. 29,261) = 0.1439, or 14.39%
Asset Turnover = Revenue (Rs. 29,261) Assets (Rs. 27,987) = 1.0455
Equity Multiplier = Assets (Rs. 27,987) Shareholders’ Equity (Rs. 13,572) = 2.0621
Finally, we multiply the three components together to calculate the return on equity: Return on Equity = (0.1439) x (1.0455) x (2.0621) = 0.3102, or 31.02% Analysis: A 31.02% return on equity is good in any industry. Yet, if you were to leave out the equity multiplier to see how much company would earn if it were completely debt-free, you will see that the ROE drops to 15.04%. In other words, for fiscal year 2004, 15.04% of the return on equity was due to profit margins and sales, while 15.96% was due to returns earned on the debt at work in the business. If you found a company at a comparable valuation with the same return on equity yet a higher percentage arose from internally generated sales, it would be more attractive.
Return on Assets (ROA):
The profitability ratio is measured in terms of relationship between net profits and assets employed to earn that profit. This ratio measures the profitability of the firm in terms of assets employed in the firm. The ROA may be measured as follows:
ROA = assets total Average
taxes after profit Net or
= assets tangible Average
taxes after profit Net or
= assets fixed Average
taxes after profit Net
Other profitability ratios
Sr. No.
Ratio Formula Significance
1 Gross Profit Ratio
Gross Profit x 100
Sales
Indication of gross margin available on Rs. 100 Sales
Higher ratio shows efficient operations.
A high ratio may be due to low cost or high sales price.
A low ratio may be due to high cost or low sales price.
Change in price levels or efficiency affects the ratio.

Financial Management www.IndigoLearn.com 58
Sr. No.
Ratio Formula Significance
2 P/V Ratio (Sales – Variable Cost) x 100
Sales
Or
Contribution x 100
Sales
Higher P/V Ratio lowers Break Even Point
Fixed cost remaining the same, higher P/V ratio leads to increase in ROI with increase in Sales.
3 Net Profit Ratio or Operating Profit Ratio
Net Operating Profit x 100
Sales
Indication of net margin of profit available on Rs. 100 Sales.
Higher the ratio, higher is efficiency.
Indicator of overall operational efficiency.
It shows return available to shareholders.
Sales (Gross or net) should be interpreted consistently
4 Individual Expenses or Group of Exps. To Sales Ratio
Individual Expenses /
Group of Expenses x 100
Sales
Useful for reconciling deviation in net profit
Useful for forecasting and budgeting
5 Operating Ratio
Operating Cost x 100
Sales
Lower the ratio, higher is efficiency.
Operating cost = COGS + other operating expenses.
Certain expenses are uncontrollable, so, one must concentrate on reducing the controllable expenses.
Complementary to Net Profit or Operating Profit Ratio.
A rise or fall in operating ratio affects the operating profit.
It gives a useful insight about the reasons for a change in profit from year to year or from one firm to another.
Operating Ratio = 100 – operating Profit Ratio
6 Earnings Per Share (EPS)
Earnings available to Equity Shareholder / No. of Equity Shares
If shares are not of same paid up value–
EPS = Earnings available
to Equity Shareholder No. of Equivalent Shares
Higher the better. A steady growth in EPS over the years shows steady profitability.
A rise in EPS growth rate represents a rise in profitability.
It is one of the best measures to make investment decisions.
It helps in comparison of two firms.
EPS is the measure to relate the return to equity shareholders. Dividend per share (DPS) is also measured side by side. But

Financial Management www.IndigoLearn.com 59
Sr. No.
Ratio Formula Significance
Earnings available to Equity Shareholder = PAT – Prefernece dividend – tax on preference dividend
dividend decision is outcome of many other considerations.
Stock exchange prices fluctuates based on EPS.
Market value of share = EPS x price-earnings ratio.
It is used in Mergers and acquisitions decisions to calculate share exchange ratio.
A high ratio indicates a high market standing and vice-versa.
7
Price Earnings Ratio
Average or closing Equity Share
Market price
EPS
This ratio calculates the price which the investors are paying per rupee of earnings.
This ratio indicates investors’ assessment of firm’s performance based on which market price is determined.
Indicates growth prospects of the firm.
Used for calculating market price of the share
Market value of share = EPS x price-earnings ratio.
Indication of payback period to the investor.
One may calculate Earning price ratio
= EPS / Average Equity Share Price.
Debt service coverage:
Financial institutions are interested in Debt Service Coverage to judge firm’s ability to pay off current interest and instalments.
Sr. No.
Ratio Formula Significance
1 Debt Service Coverage Ratio or Debt Service Ratio
Earnings available for debt service
Interest on Term Loans + Term loan Instalments
Higher the ratio, more security to the lender. It shows cash available for the interest as well as for principal repayment.
Ratio of 1.6 is treated by financial institutions as satisfactory ratio
Financial Institutions lend money even with lower Debt Service ratio in case of core / Infrastructural Projects.
2 Interest Coverage Ratio* or times
Earnings before interest on Term Loan and taxation.
Interest on Term Loans
The ratio indicates adequacy of profit to cover interest

Financial Management www.IndigoLearn.com 60
Sr. No.
Ratio Formula Significance
interest earned ratio
Higher the ratio, more security to the lender.
It should be at least greater than 1.
A too high ratio would indicate under-utilisation of debt capacity.
This ratio does not cover principal repayment obligations.
Earnings available for debt service = Net Profit after taxation + Non-Cash operating expenses like depreciation and other amortisations + Non-operating adjustments + Interest on long term loans Earnings before interest on term loan but after taxation * The ratio is also worked out as = Interest on term loans
Turnover / activity / performance / efficiency / asset utilization ratios:
Higher return on investment depends on higher capital turnover apart from the profit margin per rupee of sales. These ratios indicate how efficiently the resources have been utilised during a period.
Sr. No.
Ratio Formula Significance
1 Capital Turnover Ratio
Sales
Average Capital Employed
𝒂𝒗𝒆𝒓𝒂𝒈𝒆
=𝑜𝑝𝑒𝑛𝑖𝑛𝑔 + 𝑐𝑙𝑜𝑠𝑖𝑛𝑔
2
Overall indicator of utilisation of resources
If only closing figures are given, we can use that in the denominator
Higher the ratio, greater is the efficiency and higher the profits.
A low ratio indicates underestimation of capital.
1.1 Fixed Assets Turnover Ratio
Sales
Fixed Assets
Indicator of utilisation of fixed assets.
Higher the ratio, greater is the efficiency.
Operating efficiency is achieved when the ratio rises due to rise in sales and not when the ratio rises due to low value of fixed assets.
In case of significant change, take ‘Average Fixed Assets’ available for use.
1.2 Working Capital Turnover Ratio
Sales
Working Employed
Higher the ratio, greater is the efficiency.
It shows the efficiency with which working capital has been used in generating sales.
In case of significant change, take ‘Average Working Capital’ employed.
1.2.1 Inventory Turnover Ratio
Cost of Goods Sold
Average Inventory
It shows how fast the finished goods have been sold.
Stock holding ratio can be calculated as :

Financial Management www.IndigoLearn.com 61
Sr. No.
Ratio Formula Significance
Average Inventory
Average daily or monthly cost of sales
Average Inventory =
Operating Inventory + Closing Inventory
2
If COGS is not available, one can use sales also.
A high ratio indicates efficient inventory management.
A too low ratio indicates overstocking or obsolete, non-moving inventory.
Raw Material Inventory Turnover Ratio
Raw Material Consumed
Average Raw Material Stock
A high ratio indicates efficient inventory management.
A too low ratio indicates overstocking or obsolete, non-moving inventory.
1.2.2 Debtors Turnover Ratio
Net Credit Sales
Average Accounts receivable
(note: if average can’t be calculated, we can use closing receivables)
It shows the velocity of conversion of debtors into cash.
A too high ratio may indicate very restrictive credit terms.
A very low ratio may indicate very lenient credit terms.
Accounts Receivable = Sundry Debtors +
Bills Receivable
Bills discounted / endorsed not appearing in the Balance Sheet requires adjustment
Seasonal variations in sales affects ratio. In that case, scrutinise debtors with age wise analysis.
Debtors collection period
Average Accounts Receivable
Average daily/monthly credit sales
Compare with credit period granted
1.2.3 Creditors Turnover Ratio
Creditors Payment period
Net Credit Purchases
Average Accounts Payable
(note: if average can’t be calculated, we can use closing payables)
Average Accounts Payable
It shows the velocity for payment for credit purchases.
If payments are delayed beyond the credit period, it will lose goodwill.
If payments are done too early, it will lose interest.
Accounts Payable = Trade Creditors + Bills Payable
The ratio is worked out with the revenue purchases

Financial Management www.IndigoLearn.com 62
Sr. No.
Ratio Formula Significance
Average daily/monthly credit purchases
Other ratios:
Apart from financial ratios, some other ratios may also be computed to supplement the ratios covered earlier.
Sr. No.
Ratio Formula Significance
1 Appropriation Ratios
Interest x 100
EBIT
Tax x 100
EBIT
Indication of Disposal or appropriation of Income. These ratios are usually calculated with reference to EBIT
2 Dividend Pay-Out Ratio
DPS x 100
EPS
Indication of distribution of profit as per cent of Earning
3
Preference
Dividend
Coverage Ratio
Profit after tax
Preference dividend
Indication of adequacy of profit to cover dividend on Preference Shares.
Higher the better.
4 Dividend Yield DPS MPS
Indicates return earned by
equity investors taking dividend as base for analysing return.
It is useful for the investors in making investment decision.
5
Capitalisation Rate
or earning yield
EPS
MPS
Indicates return earned by equity investors taking earning as base for analysing return.
Reciprocal of price-earning ratio

Financial Management www.IndigoLearn.com 63
6
Market value / book value per share
orSharesEquity of Number / worthNet
Price Share Average
or SharesEquity of Number / worthNet
Price Share Closing
This ratio indicates market
response of the shareholders’ investment.
Undoubtedly, higher the ratios
better is the shareholders’ position in terms of return and capital gains.
MODIFIED PROFIT AND LOSS ACCOUNT FOR RATIO ANALYSIS
Sales (net of sales return)
Less: Cost of Goods Sold (opening stock + purchases + direct expenses – closing stock)
Gross profits
Less: Operating expenses Administration expenses, Selling and distribution expenses Depreciation
Operating Profits
Add: Non- operating Income Profit on sale of Fixed Assets Interest/ Dividend on non-trade Investment Rent Income
Less: Non- Operating Expenses Loss on sale of Fixed Assets Preliminary Expenses written off
Earnings before Interest and Tax
Less: Interest
Earnings before Tax
Less: Tax
Earnings After Tax
Less: Preference Dividend
Earnings available to Equity shareholders
Less: Dividend to equity shareholders
Retained Earnings

Financial Management www.IndigoLearn.com 64
MODIFIED BALANCE SHEET FOR RATIO ANALYSIS
S.N. Rs
A LIABILITIES
1 Shareholders’ funds
(a) Share capital
(I) Equity share capital
(II) Preference share capital
Total share capital
(b) Reserves and surplus
less: accumulated losses
less: miscellaneous expenditure to the extent not written off or adjusted
TOTAL SHAREHOLDERS FUNDS
2 LOAN FUNDS (LONG-TERM DEBTS)
(a) Secured
(b) Unsecured
(C) Deferred payment liabilities (like Deferred sales tax)
3 CURRENT LIABILITIES
Creditors for goods and services Bills payable Outstanding expenses and provisions Quick Liabilities Quick Liabilities Provision for taxation (net of advance tax) Proposed dividend and unclaimed dividend Short term borrowings Bank Overdraft/Cash Credit
TOTAL
B Assets
1 FIXED ASSETS (INCLUDING INTANGIBLE ASSETS)
2 INVESTMENTS
3 CURRENT ASSETS
stock prepaid expenses debtors bills receivable loans and advances Quick assets cash and bank marketable securities
TOTAL
SOME BASIC EQUATIONS
Cost of goods sold (COGS) = opening stock + purchases + direct expenses – closing stock
Cost of goods sold = sales – gross profit
Sales = gross profit / gross profit ratio

Financial Management www.IndigoLearn.com 65
Gross profit = sales x gross profit ratio
COGS ratio + Gross profit ratio = 100
Gross profit ratio – operating expenses ratio = operating profit ratio
Operating expenses ratio + operating profit ratio = 100
Net profit = net profit ratio x sales
Working capital (net current assets) = current assets – current liabilities
Total operating costs = cost of goods sold + other operating expenses
Raw material consumed = opening stock of raw material + purchases – closing stock of raw material
Cost of production = opening stock of WIP + Raw material consumed + Direct wages + production expenses – closing stock of WIP
Average daily cash expenditure = (COGS + Cash operating expenses) / 365 days
Total of liabilities side = Net worth + long term debt + current liabilities
Total of assets side = Fixed assets + Investments + Current assets
Net-worth = total assets – total debts
Net-worth = fixed assets + working capital – long-term debt
Capital employed = net worth + long-term debt – non-trade investments
Capital employed = fixed assets + net working capital – non-trade investments
Common size statements (CSS):
1. Common Size Statements are prepared by converting the absolute rupee amounts of Financial Statements into percentages, in the following manner :
a. For Profit & Loss A/c. : Sales = 100% and all items of expenditure are shown as a percentage of sales.
b. For Balance Sheet : Total of B/s = 100%, Each asset and liability item are shown as a % of this total.
2. Common Size Statements for Profit and Loss Account indicate the expenditure patterns of the Company. In case of the Balance Sheet, it shows the pattern of asset holding and the extent of liabilities.
3. Commons Size Statements are also prepared over several years in order to analyse the trend / pattern / movement of various items over the years. It also helps in inter-firm comparison.
Illustrative Common Size Statement (amount in Rs. Lakhs)
Common Size Profit and Loss Account Common Size Balance Sheet
Particulars Amt % Particulars Amount %
Sales
Less : Materials
Labour
1000
400
250
100%
40%
25%
Fixed Assets
Investments
Current Assets
Less : Current Liabilities
100
20
120
(40)
50%
10%
60%
(20%) Gross Profit
Less : Fixed Costs
350
50
35%
5%
Total Funds employed 200 100%
EBIT
Less : Interest
300
100
30%
10%
Represented by :
Owner’s Funds
Borrowed Funds
50
150
25%
75% EBT
Less : Tax
200
80
20%
8%
Total Funds obtained 200 100%

Financial Management www.IndigoLearn.com 66
EAT
Less : Dividends
120
60
12%
6%
Retained
Earnings
60 6%
Limitations of financial ratio analysis:
Ratios are useful tools for financial analysis. However, the following are the limitations –
1. Window Dressing: Ratios depict the picture of performance at a point of time. Sometimes, a business can make year-end adjustments in order to result in favourable ratios (e.g. Current Ratio, Operating Profit Ratio, Debt-Equity Ratio, etc.)
2. Impact of Inflation: Financial Statements are affected by inflation. Ratios may not depict the correct picture. For example, Fixed Assets are accounted at historical cost while profits are measured in current rupee terms. In inflationary situations, the Return on Assets or Return on Capital Employed may be very high due to less investment in fixed assets. Ratios may not indicate the true position in such situations.
3. Product Line diversification: Detailed ratios for different divisions, products and market segments, etc. may not be available to the users in order to make an informed judgement. For example, loss in one product may be set off by substantial profits in another product line. But the overall NP ratio may be favourable.
4. Impact of Seasonal Factors : When the operations do not follow a uniform pattern during the financial period, ratios may not indicate the correct situation. For example, if the peak supply season of a business is between February to June, it will hold substantial stocks on the Balance Sheet date. This will lead to a very favourable current ratio on that date. But the position for the rest of the year may be entirely different.
5. Differences in Accounting Policies : Different firms follow different accounting policies, e.g. rate and methods of depreciation. Straight-jacket comparison of ratios may lead to misleading results.
6. Lack of Standards : Even though some norms can be set for ratios, there is no uniformity as to what an “ideal” ratio is. Generally, it is said that Current Ratio should be 2:1. But if a firm supplies mainly to Government Departments where debt collection period is high, a Current Ratio of 4 : 1 or 5 : 1, may also be considered normal.
7. High or Low : A number by itself cannot be “high” or “low”. Hence, a ratio by itself cannot become “good” or “bad”. The line of difference between “good ratio” and “bad ratio” is very thin.
8. Interdependence : Financial Ratios cannot be considered in isolation. A single ratio may not tell the real reason affecting profitability or liquidity. Decision taken based on one ratio may be incorrect when a set of ratios are analysed.

Financial Management www.IndigoLearn.com 67
ILLUSTRATIONS Illustration-1 In a meeting held at Solan towards the end of 2016, the Directors of M/s HPCL Ltd. have taken a decision to diversify. At present HPCL Ltd. sells all finished goods from its own warehouse. The company issued debentures on 01.01.2017 and purchased fixed assets on the same day. The purchase prices have remained stable during the concerned period. Following information is provided to you:
Income Statement
Particulars 2016 (Amt in Rs) 2017 (Amt in Rs)
Cash Sales Credit Sales Less: COGS
Gross profit
30,000 2,70,000
3,00,000
2,36,000
32,000 3,42,000
3,74,000
2,98,000
64,000 76,000
Less: Op. Exp
Warehousing 13,000 14,000
Transport 6,000 10,000
Administrative 19,000 19,000
Selling 11,000
14,000
Non-Op. Exp - 49,000 2,000 59,000
Net Profit 15,000 17,000
Balance Sheet
Assets & Liabilities 2016 2017
Fixed Assets (Net Block) - 30,000 - 40,000
Receivables 50,000 82,000
Cash at Bank 10,000 7,000
Stock 60,000 94,000
Total Current Assets (CA) 1,20,000 1,83,000
Payables 50,000 76,000
Total Current Liabilities (CL)
50,000
76,000
Working Capital (CA - CL) 70,000 1,07,000
Total Assets 1,00,000 1,47,000
Represented by:
Share Capital 75,000 75,000
Reserve and Surplus 25,000 42,000
Debentures - 30,000
1,00,000 1,47,000
You are required to calculate the following ratios for the years 2016-2017. (i) Gross Profit Ratio (ii) Operating Expenses to Sales Ratio.

Financial Management www.IndigoLearn.com 68
(iii) Operating Profit Ratio (iv) Capital Turnover Ratio (v) Stock Turnover Ratio (vi) Net Profit to Net Worth Ratio, and (vii) Receivables Collection Period. Ratio relating to capital employed should be based on the capital at the end of the year. Give the reasons for change in the ratios for 2 years. Assume opening stock of Rs. 40,000 for the year 2017. Ignore Taxation. Illustration 2 Following is the abridged Balance Sheet of Alpha Ltd.
Liabilities Rs Assets Rs Rs
Share Capital 1,00,000 Land and Buildings 80,000
Profit and Loss A/c 17,000 Plant and Machineries
50,000
Current Liabilities 40,000 Less: Depreciation 15,000 35,000
1,15,000
Stock 21,000
Receivables 20,000
Bank 1,000 42,000
Total 1,57,000 Total 1,57,000
With the help of the additional information furnished below, you are required to prepare Trading and Profit & Loss Account and a Balance Sheet as at 31st March 2017: (i) The company went in for re-organization of capital structure, with share capital remaining the same as follows:
Share capital 50%
Other Shareholders’ funds 15%
5% Debentures 10%
Payables 25%
Debentures were issued on 1st April, interest being paid annually on 31st March 2017. (ii) Land and Buildings remained unchanged. Additional plant and machinery have been bought and a further Rs 5,000 depreciation written off. (The total fixed assets then constituted 60% of total fixed and current assets). (iii) Working capital ratio was 8: 5 (iv) Quick assets ratio was 1: 1 (v) The receivables (four-fifth of the quick assets) to sales ratio revealed a credit period of 2 months. There were no cash sales. (vi) Return on net worth was 10%. (viii) Gross profit was at the rate of 15% of selling price. (ix) Stock turnover was eight times for the year. Ignore Taxation
Illustration 3 X Co. has made plans for the next year. It is estimated that the company will employ total assets of Rs 8,00,000; 50 per cent of the assets being financed by borrowed capital at an interest cost of 8 per cent per year. The direct costs for the year are estimated at Rs 4,80,000 and all other operating expenses are estimated at Rs 80,000. The goods will be sold to customers at 150 per cent of the direct costs. Tax rate is assumed to be 50 per cent. You are required to calculate: (I) net profit margin;

Financial Management www.IndigoLearn.com 69
(ii) return on assets; (iii) return on assets; (iv) asset turnover and (v) return on owner's equity
Illustration – 4 Ganpati Limited has furnished the following ratios and information relating to the year ended 31st March 2017.
Sales Rs.60,00,000
Return on Net Worth 25%
Rate of Income Tax 50%
Share Capital to Reserves 7:3
Current Ratio 2
Net Profit to sales 6.25 %
Inventory turnover (based on cost of goods sold)
12
Interest on debentures Rs.60,000
Receivables Rs.2,00,000
Payables Rs.2,00,000
You are required to : a. Calculate the operating expenses for the year ended 31st March 2017. b. Prepare a balance sheet as on 31st March in the following format:
Liabilities Amount Assets Amount
Share Capital Reserve and Surplus 15% Debentures Payables
Fixed Assets Current Assets Stock Receivables Cash
Illustration - 5 (Balance Sheet completion)
Using the following information, complete this balance sheet:
Long-term debt to net worth 0.5:1
Total asset turnover 2.5 x
Average collection period* 18 Days
Stock turnover 9 x
Gross profit margin 10%
Acid Test Ratio 1 to 1
* Assume a 360-day year and all sales on credit
Assets Amount (In Rs)
Liabilities Amount (In Rs)
Cash Accounts receivable Stock Plant and equipment
Notes and payables Long-term debt Common stock Retained earnings
1,00,000 1,00,000 1,00,000
Total Assets Total liabilities and equity
Illustration – 6 (Sona Ltd.)
a. The assets of SONA Ltd consist of fixed assets and current assets, while its current liabilities comprise bank credit in the ratio of 2 : 1.

Financial Management www.IndigoLearn.com 70
b. You are required to prepare the Balance Sheet of the company as on 31st March 2017 with the help of following information:
Share Capital 5,75,000 Working Capital (CA-CL) 1,50,000 Gross Margin 25% Inventory Turnover 5 times Average Collection Period 1.5 Months Current Ratio 1.5 : 1 Quick Ratio 0.8 : 1 R&S to Bank & Cash 4 times
Illustration - 7 (Summarized Balance Sheet)
From the following information, prepare a summarized Balance Sheet as at 31st March 2017
Working Capital Rs.2,40,000 Bank overdraft Rs.40,000 Fixed Assets to Proprietary ratio 0.75 Reserves and Surplus Rs.1,60,000 Current ratio 2.5 Liquid ratio 1.5
Illustration – 8 (MNOP)
With the help of the following information complete the Balance Sheet of MNOP Ltd.:
Equity share capital Rs. 1,00,000 The relevant ratios of the company are as follows :
Current debt to total debt 0.4 Total debt to owner’s equity 0.6 Fixed assets to owner’s equity 0.6 Total assets turnover 2 Times Inventory turnover 8 Times
Illustration – 9(Balance Sheet completion)
Complete the Balance Sheet from the data given below:
Gross Profit Rs. 54,000
Shareholders’ Funds Rs.6,00,000
Gross Profit Margin 20%
Credit Sales to Total Sales 80%
Total Assets Turnover 0.3 times
Inventory Turnover 4 times
Avg. Collection Periods (a 360 days year)
20 days
Current Ratio 1.8
Long-term Debt to Equity 40%

Financial Management www.IndigoLearn.com 71
Illustration 10 (Beta Ltd)
The following information relates to Beta Ltd. for the year ended 31st March 2017:
Net Working Capital Rs. 12,00,000
Fixed Assets to Proprietor’s Fund Ratio
0.75 times
Working Capital Turnover Ratio 5 times
Return on Equity (ROE) 15%
There is no Debt Capital. You are required to calculate: (i) Proprietor’s Fund (ii) Fixed Assets (iii) Net Profit Ratio.
Illustration 11 (MN Ltd)
MN Limited gives you the following information for the year ending 31st March, 2017:
Current Ratio 2.5: 1
Debt-Equity Ratio 1:1.5
Return on Total Assets 15%
Total Assets Turnover Ratio 2
Gross Profit Ratio 20%
Stock Turnover Ratio 7
Current Market Price per Equity Share
Rs. 16
Net Working Capital Rs. 4,50,000
Fixed Assets Rs. 10,00,000
60,000 Equity Shares of Rs. 10 each
20,000, 9% Preference Shares of Rs. 10 each
Opening Stock Rs. 3,80,000
You are required to calculate: (i) Quick Ratio (ii) Fixed Assets Turnover Ratio (iii) Proprietary Ratio (iv) Earnings Per Share (v) Price-Earning Ratio.
Illustration 12 (M Ltd) The following accounting information and financial ratios of M Limited relate to the year ended 31st March, 2017:
Inventory Turnover Ratio 6 Times
Creditors Turnover Ratio 10 Times
Debtors Turnover Ratio 8 Times
Current Ratio 2:4
Gross Profit Ratio 25%
• Total sales Rs 30,00,000;

Financial Management www.IndigoLearn.com 72
• cash sales 25% of credit sales; • cash purchases Rs 2,30,000; • working capital Rs 2,80,000; • closing inventory is Rs 80,000 more than opening inventory
You are required to calculate:
i.Average Inventory ii.Purchases
iii.Average Debtors iv.Average Creditors v.Average Payment Period
vi.Average Collection Period vii.Current Assets
viii.Current Liabilities Illustration [Q1 (c) May 2018 Q paper (New Syllabus)] The accountant of Moon Ltd. has reported the following data:
Inventory Turnover Ratio 6 Times
Creditors Turnover Ratio
(Credit purchases to be considered)
10 Times
Debtors Turnover Ratio
(Credit sales to be considered)
8 Times
Current Ratio 2:4
Gross Profit Ratio 25%
Total Sales Rs 30,00,000
Cash Sales 25% of Credit Sales
Cash Purchases Rs 2,30,000
Working Capital Rs 2,80,000
Closing Inventory – Opening Inventory Rs 80,000
Illustration 1(C) Nov 2018 Question Paper
The following is the information of XML Ltd. related to the year 31.3.2018:
Gross Profit of Sales 20% of sales
Net Profit 10% of sales
Inventory Holding Period 3 Months
Receivable Collection Period 3 Months
Non-Current Assets to Sales 1:4
Non-Current Assets to Current Assets 1:2
Current Ratio 2:1
Non-Current Liabilities to Current Liabilities 1:1
Share Capital to Reserves and Surplus 4:1
Non-Current Assets as on 31st March, 2017 Rs 5000000
Assume that:
No change in current Assets during 2017-18. No depreciation charged on Non-Current Assets during the year 2017-18. Tax Ignored
You are required to calculate Cost of goods sold, Net Profit, Inventory, Receivables and cash for the year ended 31st March, 2018
Illustration [Q1 RTP Nov 20 New Syllabus]

Financial Management www.IndigoLearn.com 73
Following information has been provided from the books of M/s Laxmi & Co. for the year ending on
31st March, 2020:
Net Working Capital Rs. 4,80,000
Bank overdraft Rs. 80,000
Fixed Assets to Proprietary ratio
0.75
Reserves and Surplus Rs. 3,20,000
Current ratio 2.5
Liquid ratio (Quick Ratio)
1.5
You are required to prepare a summarised Balance Sheet as at 31st March, 2020
Illustration [Q1a May 2019 Question Paper] Following figures and ratios are related to a company Q Ltd. :
i. Sales for the year (all credit) Rs. 30,00,000
ii. Gross Profit ratio 25 per cent
iii. Fixed assets turnover (based on cost of goods sold)
1.5
iv. Stock turnover (based on cost of goods sold)
6
v. Liquid ratio 1 : 1
vi. Current ratio 1.5 : 1
vii. Receivables (Debtors) collection period
2 months
viii. Reserves and surplus to share capital
0.6 : 1
ix. Capital gearing ratio 0.5
x. Fixed assets to net worth 1.2 : 1
You are required to calculate:
i.Closing stock, ii.1Fixed Assets, iii.Current Assets, iv.Debtors and Net worth.
Illustration (RTP, May 2018)
Following figures are available in the books Tirupati Ltd.
Fixed assets turnover ratio 8 times
Capital turnover ratio 2 times
Inventory Turnover 8 times
Receivable turnover 4 times
Payable turnover 6 times
G P Ratio 25%
Gross profit during the year ₹ 8,00,000
There is no long-term loan or overdraft.
Reserve and surplus ₹ 2,00,000
Ending inventory of the year ₹ 20,000 above the beginning inventory
CALCULATE various assets and liabilities and PREPARE a Balance sheet of Tirupati Ltd

Financial Management www.IndigoLearn.com 74
Illustration [Q1 Nov 2018 RTP New Syllabus]
Assuming the current ratio of a Company is 2 STATE in each of the following cases whether the ratio will improve or decline or will have no change:
Current liability Current assets Current ratio
(i) Payment of current liability
(ii) Purchase of fixed assets by cash
(iii) Cash collected from Customers
(iv) Bills receivable dishonoured
(v) Issue of new shares
Illustration [Q1a Nov 2019 New Syllabus]
Following information has been gathered from the books of Tram Ltd. the equity shares of which is trading in the stock market at ₹ 14
Particulars Amount (₹)
Equity Share Capital (face value ₹ 10) 10,00,000
10% Preference Shares 2,00,000
Reserves 8,00,000
10% Debentures 6,00,000
Profit before Interest and Tax for the year 4,00,000
Interest 60,000
Profit after Tax for the year 2,40,000
Calculate the following: (i) Return on Capital Employed (ii) Earnings per share (iii) PE ratio
Illustration [Q3(b) May 2019 (Old Syllabus) - Part 1*]
Using the information given below, complete the Balance Sheet of PQR Private Limited:
(i) Current ratio 1.6 :1
(ii) Cash and Bank balance 15% of total current assets
(iii) Debtors turnover ratio 12 times
(iv) Stock turnover (cost of goods sold) ratio
16 times
(v) Creditors turnover (cost of goods sold) ratio
10 times
(vi) Gross Profit ratio 20%
(vii) Capital Gearing ratio 0.6
(viii) Depreciation rate 15% on W.D.V.

Financial Management www.IndigoLearn.com 75
(ix) Net Fixed Assets 20% of total assets
(Assume all purchase and sales are on credit)
Balance Sheet of PQR Private Limited as at 31.03.2019
Liabilities (Rs.) Assets (Rs. )
Share Capital 25,00,000 Fixed Assets
Reserve & surplus Opening WDV
12% Long term debt Less: Depreciation
Current Liabilities
Creditors Current Assets
Provisions & outstanding expense
68,50,000
Stock
Debtors
Cash and bank balance
Total ? Total ?
Illustration (Newly Added) From the following ratios and information given below, PREPARE Trading Account, Profit and Loss Account and Balance Sheet of Aebece Company
Fixed Assets ₹ 40,00,000
Closing Stock ₹ 4,00,000
Stock Turnover Ratio
10
Gross Profit Ratio 25 Percent
Net Profit Ratio 20 Percent
Net Profit to Capital
1/5
Capital to total Liabilities
1/2
Fixed assets to capital
5/4
Fixed assets/ Total current assets
5/7
Illustration (Newly Added) Gig Ltd. has furnished the following information relating to the year ended 31st March, 2020 and 31st March, 2021:
31st March 2020
31st March 2021
Share Capital 40,00,000 40,00,000
Reserves and Surplus 20,00,000 25,00,000
Long Term loan 30,00,000 30,00,000
➢ Net profit ratio: 8% ➢ Gross profit ratio: 20% ➢ The long-term loan has been used to finance 40% of the fixed assets. ➢ Stock turnover with respect to the cost of goods sold is 4. ➢ Debtors represent 90 days sales.

Financial Management www.IndigoLearn.com 76
➢ The company holds cash equivalent to 1½ months cost of goods sold. Ignore taxation and assume 360 days in a year. You are required to PREPARE Balance Sheet as on 31st March, 2021 in the following format:
Liabilities ₹ Assets ₹
Share Capital Fixed Assets
Reserves and Surplus
Sundry Debtors
Long Term Loan
Closing Stock
Sundry Creditors
Cash in hand
Illustration (Newly Added) Following information relates to Temer Ltd.: Debtors Velocity 3 months Creditors Velocity 2 months Stock Turnover Ratio 1.5 Gross Profit Ratio 25% Bills Receivables ₹ 25,000 Bills Payables ₹ 10,000 Gross Profit ₹ 4,00,000 Fixed Assets turnover Ratio 4
Closing stock of the period is ₹ 10,000 above the opening stock. DETERMINE:
(i) Sales and cost of goods sold (ii) Sundry Debtors (iii) Sundry Creditors (iv) Closing Stock (v) Fixed Assets

Financial Management www.IndigoLearn.com 77
COST OF CAPITAL
Introduction
The financing decision relates to the composition of relative proportion of various sources of finance. The financial management weighs the merits and demerits of different sources of finance while taking the financing decision. A business can be financed from either the shareholders’ funds or borrowings from outside agencies. The shareholders’ funds include equity share capital, preference share capital and the accumulated profits whereas borrowings from outsiders include borrowed funds like debentures and loans from financial institutions.
The borrowed funds have to be paid back with interest and some amount of risk is involved if the principal and interest is not paid. Equity has no fixed commitment regarding payment of dividends or principal amount and therefore, no risk is involved. It is the decision of the business to decide the ratio of borrowed funds and owned funds. However, most of the companies use a combination of both the shareholders’ funds and borrowed funds.
Whether the companies choose shareholders’ funds or borrowed funds, each type of fund carries a cost. Borrowed funds involve interest payment whereas equities, as such do not have any fixed obligation but, they involve a cost.
The cost of equity is the minimum return the shareholders would have received if they had invested elsewhere. Both types of funds incur cost, and this is the cost of capital to the company.
This means, cost of capital is the minimum return expected by the company on the whole.
FINANCING DECISION PROCESS
Capital Budgeting
Decision
Need to Raise Funds
Capital Structure Decision
Replaceme
nt
Modernizati
on
Expansion
Diversificat
ion
Internal
funds
Debt
External
equity
Existing Capital
Structure
Desired Debt
Equity Mix
Payout
Policy
Effect of Return Effect of Risk

Financial Management www.IndigoLearn.com 78
Meaning of capital structure
Meaning: Capital Structure refers to the mix of sources from where the long-term funds required in a business may be raised. In other words, it refers to the proportion of debt, preference capital and equity capital.
Definition of cost of capital
Cost of capital may be defined as the cut off rate for determining estimated future cash proceeds of a project and eventually deciding whether the project is worth undertaking or not. It is also the minimum rate of return that a firm must earn on its investment which will maintain the market value of share at its current level.
It can be stated as the opportunity cost of an investment, i.e. the rate of return that a company would otherwise be able to earn at the same risk level as the investment that has been selected.
It can also be said as the required return necessary to take up a capital budgeting project – such as building a new factory – worthwhile. Cost of capital includes the cost of debt and the cost of equity.
Importance of cost of capital:
the cost of capital is very important in financial management and plays a crucial role in the following areas: i) Capital budgeting decisions: The cost of capital is used for discounting cash flows under Net Present Value method for investment proposals. So, it is very useful in capital budgeting decisions. ii) Capital structure decisions: An optimal capital is that structure at which the value of the firm is maximum, and cost of capital is the lowest. So, cost of capital is crucial in designing optimal capital structure. iii) Evaluation of financial Performance: Cost of capital is used to evaluate the financial performance of top management. The profitability is compared to cost of capital of funds and if profit is greater than the cost of capital the performance may be said to be satisfactory. iv) Other financial decisions: Cost of capital is also useful in making such other financial decisions as dividend policy, capitalization of profits, making the rights issue etc.
Computation of cost of capital:
Computation of cost capital of a firm involves the following steps: i) Computation of cost of specific sources of a capital (debt, preference capital, equity and retained earnings) and ii) Computation of weighted average cost of capital.
Effect on
Cost of Capital
Value of the
Firm
Optimum
Capital
Structure

Financial Management www.IndigoLearn.com 79
Cost of debt capital (Kd)
Debt may be an irredeemable (perpetual) or a redeemable debt. It may be issued at par, at premium or discount. Interest is the cost incurred for having borrowed the debt value (net proceeds i.e., after adjusting for any incidental cost incurred for raising the fund). Interest can be deducted for computation of tax. So, the post-tax cost is computed as follows EXPLICIT COST OF DEBT CAPITAL - denoted as Kd
COST OF IRREDEEMABLE DEBT COST OF REDEEMABLE DEBT
Interest x [1 - Tax Rate] Interest x [1 - Tax Rate] + [RV - Net
Proceeds]/n
Net Proceeds of Issue [RV + Net Proceeds] / 2
Where RV = Redeemable value of debt and n = Life of the redeemable Debt.
Notes: 1. If redemption value is not given, assume redemption is at par. 2. If net proceeds are not given, then assume current market price as issue price, because if the company raises the funds today, it can raise an amount equal to current market price. 3. If current market price is also not given, then assume face value as net proceeds.
Cost of Preference capital (Kp)
In case of preference shares, dividends payable at a fixed rate, is the cost. However, the dividends are not allowed to be deducted for computation of tax. So, no adjustment for tax is required. Just like debentures, preference shares may be perpetual or redeemable. Further, they may be issued at par, premium or discount. Cost of Preference Share Capital (PSC) can be computed as under: (denoted as Kp) COST OF IRREDEEMABLE PSC COST OF REDEEMABLE PSC
Preference Dividend Preference Dividend + [RV - Net Proceeds)/n
Net Proceeds of Issue [RV + Net Proceeds] / 2
Where RV = Redeemable value of preference shares and n = Life of the redeemable preference shares.
Notes: 1. If redemption value is not given, assume redemption is at par. 2. If net proceeds are not given, then assume current market price as redemption price, because if the company raises the funds today, it can raise an amount equal to current market price. 3. If current market price is also not given, then assume face value as net proceeds.
Cost of equity share capital (Ke)
Cost of equity capital (denoted by Ke) represents the expectations of equity shareholders from a company. ‘Based on investors' behaviour and expectations, the cost of equity capital can be determined by any of the following approaches.

Financial Management www.IndigoLearn.com 80
a. Dividend Price Approach:
This model assumes that: 1. Dividends influence the share price & the cost incurred for raising equity is the dividend payable. 2. Price of the share today is the present value of expected future dividend. 3. Dividends are paid at a constant rate to perpetuity. Thus, here, cost of equity capital is computed by dividing the current dividend by average market price per share. This dividend price ratio expresses the cost of equity capital in relation to what yield the company should pay to attract investors.
Ke = 0P
D
Where, Ke = Cost of equity; D = Annual dividend & P0 = Current Market value of equity (ex-dividend) Demerits:
• However, this method cannot be used to calculate cost of equity of units suffering losses.
• It ignores the importance of retained earnings on the market price of equity shares. Suitability: This method is suitable only when the company has stable earnings and stable dividend policy over a period. b. Dividend Growth Approach: Earnings and dividends do not remain constant and the price of
equity shares is also directly influenced by the growth rate in dividends. Where earnings, dividends and equity share price all grow at the same rate, the cost of equity capital may be computed as follows:
Ke = (D1/P0) + G Where, D1 = Expected dividend per share [D1 = Do(1+g)] P0 = Current Market price per share G = Annual Growth rate of earnings of dividend.
c. Earning / Price Approach:
• The advocates of this approach co-relate the earnings of the company with the market price of its share.
Cost of equity share capital
Dividend Price Approach
Constant
Dividend
Dividend Growth Approach
Earning Price Approach
Constant
Earning
Earnings Growth
Approach
Realized Yield Approach
Capital Asset Pricing Model
Approach
If last year’s dividend is
given, convert it into
expected dividend.

Financial Management www.IndigoLearn.com 81
• Accordingly, the cost of ordinary share capital would be based upon the expected rate of earnings of a company.
• The argument is that each investor expects a certain amount of earnings, whether distributed or not from the company in whose shares he invests.
d. Earnings Growth Approach: This approach is an improvement over the earlier methods. But
even this method assumes that dividend will increase at the same rate as earnings, and the equity share price is the regular of this growth as deemed by the investor. However, in actual practice, rate of dividend is recommended by the Board of Directors and shareholders cannot change it. Thus, rate of growth of dividend subsequently depends on director’s attitude. The dividend method should, therefore, be modified by substituting earnings for dividends. So, cost of equity will be given by:
Ke = P
E + G
Where, E = Current Earnings per share P = Market share price G = Annual growth rate of earnings. The calculation of ‘G’ (the growth rate) is an important factor in calculating cost of equity capital. The past trend in earnings and dividends may be used as an approximation to predict the future growth rate if the growth rate of dividend is fairly stable in the past.
e. Realized Yield Approach: According to this approach, the average rate of return realized in the past few years is historically regarded as ‘expected return’ in the future. The yield of equity for the year is:
Yt = ( )
1-t
1-ttt
P
P - P D +
Where, Yt = Yield for the year t Dt = Dividend for share for end of the year t Pt = Price per share at the end of the year t Pt-1 = Price per share at the beginning of year t. Though, this approach provides a single mechanism of calculating cost of equity, it has unrealistic assumptions. If the earnings do not remain stable, this method is not practical.
f. Capital Asset Pricing Model Approach (CAPM): This model describes the linear relationship between risk and return for securities. The security is exposed to diversifiable risk and non-diversifiable risk. The diversifiable risk can be eliminated through a portfolio consisting of large number of well diversified securities. The non-diversifiable risk is assessed in terms of
beta coefficient (b or ) through fitting regression equation between return of a security and the return on a market portfolio.

Financial Management www.IndigoLearn.com 82
Thus, the cost of equity capital can be calculated under this approach as: Ke = Rf + b (Rm – Rf) Where, Ke = Cost of equity capital Rf = Rate of return on security b = Beta coefficient Rm = Rate of return on market portfolio Therefore, required rate of return = risk free rate + security risk premium The idea behind CAPM is that investors need to be compensated in two ways – time value of money and risk.
The CAPM says that the expected return of a security or a portfolio equals the rate on a risk-free security plus a risk premium. If this expected return does not meet or beat the required return, then the investment should not be undertaken.
The capital asset pricing approach is useful in calculating cost of equity, even when the firm is suffering losses.
Cost of retained earnings (Kr)
FROM COMPANY’S POINT OF VIEW
▪ Cost of Retained Earnings or Reserves are generally taken as the same as Cost of Equity. This is because, if earnings are paid out as dividends without being retained, and simultaneously a rights issue is made, the investors would be subscribing to the issue based on some expected return. This is taken as the indicator of the Cost of Reserves or Retained Earnings.
There are two approaches to measure this opportunity cost. One approach is by using discounted cash flow (DCF) or Dividend Growth method and the second approach is by using capital asset pricing model.
a. By DCF: Ks = 0
1
P
D + G
Where, D1 = Dividend P0 = Current market price G = Growth rate
b. By CAPM: Ks = Rf + b (Rm – Rf) Where, Ks = Cost of equity capital Rf = Rate of return on Risk – free security b = Beta coefficient Rm = Rate of return on market portfolio
FROM INVESTORS’ POINT OF VIEW
Income-tax adjustment is made as the shareholders are to pay some income tax out of dividends, and adjustment for brokerage cost is also made as the shareholders should incur some brokerage cost while investing in a share. Therefore, after these adjustments, cost of retained earnings is calculated as:

Financial Management www.IndigoLearn.com 83
Kr = Ke (1 - t) (1 - b) Where, Kr = cost of retained earnings, Ke = Cost of equity, t = rate of tax, b = brokerage cost.
Cost of depreciation
Depreciation provisions may be considered similar to retained earnings – they have an opportunity cost and represent an increased stake in the firm by its shareholders. However, a distribution of depreciation provisions would produce a capital reduction, probably requiring outstanding debts to be repaid due to the depletion of the capital base, the security against which the debt was obtained. This indicates a proportional combination between the cost of debt repaid and the cost of retained earnings to calculate the cost of capital in the form of depreciation provisions.
Cost of FRESH equity or EXTERNAL EQUITY
Dividend is growing Dividend is constant (No growth in dividend)
Ke = f) - (1 P
D
0
1 + g
Where, f = floatation cost, g = growth rate, & P0 = current market price.
Ke = f) - (1 P
D
0
Weighted average cost of capital (WACC)
▪ WACC denotes the Weighted Average Cost of Capital. It is defined as the Overall Cost of Capital computed by reference to the proportion of each component of capital as weights. It is denoted by Ko.
▪ After computing the cost of individual sources of finance, the weighted average cost of capital is calculated by putting weights in the proportion of the various sources of funds to the total funds.
▪ Hence WACC = Sum of [Cost of Individual Components X Proportion of each Capital] ▪ The following format may be adopted for computation of WACC:
Source Value Weights Individual Cost in % Weighted Costs
Debt W1 Kd Kd X W 1
Preference Capital W2 Kp Kp X W 2
Retained Earnings W3 Ke Ke X W 3
Equity Capital W4 Ke Ke X W 4
Total Ko = WACC = Total of
above
The proportion or percentage of each component of capital may be determined by reference to either book values or market values of capital.

Financial Management www.IndigoLearn.com 84
Advantages of market values as weights
a. Market values are not affected by accounting policies. b. Market values represent the opportunity cost. c. It represents the present economic value of various sources of finance. d. It is consistent with the definition of cost of capital i.e. the cost of capital is the minimum
rate of return needed to maintain the market value of the firm. e. Market value is the true reflection of the firm’s capital structure.
Disadvantages of market values as weight
a. Market values are not available in case of unlisted companies. b. It is not reliable when shares are not actively traded (no purchase or sale of share) c. Market prices fluctuate frequently and are affected by speculations. (Manipulation of share
prices)
Advantages of using book values as weight
a. The data is easily available from the Balance sheet data. b. Firms set their capital structure in terms of Book weights. c. Calculations are simple d. Less fluctuations in Book Value. e. Useful when market price is not available. (in case of an unlisted company) or when the shares
are not actively traded.
Disadvantages of Book values as weights
a. Affected by accounting policies. b. Does not truly represent the opportunity cost of capital. c. Does not represent the present economic values of various sources of finance.
Importance of WACC
• The weighted average method is preferred because the proportions of various sources of funds in the capital structure are different. To be representative, therefore, cost of capital should consider the relative proportions of different sources of finance.
• Securities analysts employ WACC all the time when valuing and selecting investments. In discounted cash flow analysis, WACC is used as the discount rate applied to future cash flows for deriving a business’s net present value.
• WACC can be used as a hurdle rate, to assess the performance based on return on investment/capital.
• It also plays a key role in economic value added (EVA) calculations.
• Investors use WACC as a tool to decide whether or not to invest.
• The WACC represents the minimum rate of return at which a company produces value for its investors.
• Therefore, WACC serves as a useful reality check for investors.
MARGINAL COST OF CAPITAL (Weighted Marginal Cost of Capital)

Financial Management www.IndigoLearn.com 85
1. Marginal Cost of Capital is the cost of additional capital for raising funds. 2. It is derived when the average cost of capital is computed with marginal weights. The
weights represent the proportion of funds the firm intends to employ. 3. When funds are raised 1) in the same proportion as at present and 2) if the component costs
remain unchanged, there will be no difference between overall cost of capital and marginal cost of capital
4. As the level of Capital Employed increases, the component costs may start increasing. In such a case both the WACC and marginal cost of capital will increase. But marginal cost of capital will rise at a faster rate.
The WMCC for any firm depends upon several factors and therefore the calculation of WMCC is a typical exercise. The following variables may affect the marginal cost of capital of a specific source and thereby may affect the WMCC as follows:
a) The investors may perceive an increase in business risk of the firm. b) The financial risk of the firm may also change as a result of change in composition of the
capital structure. c) The increase in business and financial risk may increase the marginal cost of capital and
thus some of the proposals may become unviable. Calculation of MWACC: It is done in the same way as Ko
ISSUES IN WACC
The determination of cost of capital has a number of problems in the dynamic world of today. Conditions which are present now may not remain static in future. Therefore, however cost of capital is determined now, it is dependent on certain conditions or situations which are subject to change.
Firstly, the firms’ internal structure and character change. For instance, as the firm grows and matures, its business risk may decline resulting in new structure and cost of capital.
Secondly, capital market conditions may change, making either debt or equity more favorable than the other.
Thirdly, supply and demand for funds may vary from time to time leading to change in cost of different components of capital.
Fourthly, the company may experience subtle change in capital structure because of retained earnings unless its growth rate is sufficient to call for employment of debt on a continuous basis.
Because of these reasons the firm should periodically re-examine its cost of capital before determining annual capital budget.
EBIT – EPS Analysis
With the help of EBIT – EPS chart, EPS - the term, which directly signifies the wealth of the shareholders can be computed. Hence, for a given set of alternatives EPS under each plan is computed to know which the best plan of all is (the one exhibiting the highest EPS for a given level of EBIT). The analysis is said to be complete upon identification of 2 Important Levels of EBITs (Points)
Financial BREAK-EVEN Point
▪ It is that level of EBIT at which EPS turns to be zero.

Financial Management www.IndigoLearn.com 86
▪ It thus denotes the level of Earnings (EBIT) available, at which the firm can just sufficiently meet the Financial Costs (Interest and Preference Dividend).
▪ Financial Breakeven Point = Rate)Tax - (1
PD I +
Where, I = Interest and PD = Preference Dividend.
Indifference Point
▪ Alternative modes of financing have different impact on EPS. A firm is said to be indifferent between TWO modes of financing, if the EPS under both options is the same. This level of EBIT that results in equal EPS is called EPS Equivalency Point or Indifference Point.
▪ The level of EBIT at which EPS remains the same for two options of debt - equity mix, is called Indifference Point.
▪ Indifference Point between 2 options is computed by solving the following equation for EBIT.
Alternative 1: Alternative 2:
[EBIT– Int1 – Int2] X [1 - Tax Rate] – Pd1 [EBIT – Int1] X [1 - Tax Rate] – Pd1 – Pd2
Number of Equity Shares1 Number of Equity Shares2
▪ Indifference Point between a Debt & a Non-Debt Option is computed by solving the following
equation for EBIT.
Alternative 1: With Debt Alternative 2: Without Debt
[EBIT- Interest] X [1 - Tax Rate] EBIT X [1 - Tax Rate]
Number of Equity Shares – 1 Number of Equity Shares – 2
When both the alternatives in the above chart is equal at a certain level of EBIT (to be computed by solving the equation), the company is said to be indifferent between the two alternatives.
Graphical Depiction of Indifference Point and Financial BEP EPS (Rs.)
(With Fin. cost) Plan II
2.0 Plan I (Without Fin. cost)
1.5
1.0
.5
0 2 3 5 6 9 10 12 EBIT (Rs. Lacs)
2.0 3.5 6.2 Interpretation of Graph:
• The horizontal intercepts (i.e., 2L & 3.5L) indicate the Financial Break-Even levels of EBIT for each plan (i.e., the Levels of EBITs at which their respective EPS is ‘0’).
• The point at which the lines of both plans intersect is called Indifference Point (6.2L). This can be identified at its horizontal intercept. The vertical intercept gives the value of EPS at that point (Rs. 1.5).
• Below the indifference point, one plan will have higher EPS over the other. Above that point,

Financial Management www.IndigoLearn.com 87
automatically the other plan will have higher EPS over the former. This is interpreted as under: Interpretation of the Indifference Point:
Situation Option to be chosen Reason
EBIT below Indifference Point
Option with Low or No debt (Interest Burden)
When rate of earnings and operating profits (EBIT) are low, more interest and debt burden is not advisable.
EBIT equal to Indifference point
Any alternative can be chosen.
Same EPS due to indifference point.
EBIT above Indifference Point
Option with higher debt (Interest Burden)
When EBIT is high, financial leverage works favorably and EPS is maximized.
Thus, the Option with more Debt component exhibits higher EPS, when EBIT > IDP EBIT & The Option with low or No Debt in its structure exhibits higher EPS, when EBIT < IDP EBIT. This method of taking advantage of choosing a Debt Option in case of having a higher EBIT is called Trading on Equity. (An alternative definition for Trading on Equity is provided in “Other Considerations for Capital Structure Planning”) The same logic is applicable in the presence of Preference Shares also as its nature is similar to that of Debt, i.e., the Option WITH Preference Share component exhibits higher EPS, when EBIT > IDP EBIT & The Option WITHOUT Preference Share component exhibits higher EPS, when EBIT < IDP EBIT.
Concept of Dominance
Upon observation it can be understood that, between Debt & Preference options, there will not be any Indifference Point. Mathematically it is due to the number of shares in the denominator being same. But conceptually, the reason is, both the plans have Financial costs, which are fixed in nature, and are different in values. Thus, if one plan has a Fixed Cost less than the other, there cannot be a level of Earnings (EBIT) at which they can arrive at the same EPS. Hence, the Plan having a lower Financial (Fixed) cost, is said to dominate the other, resulting in NO IDP. Note: In case the Fixed Costs of both Plans are same, at ANY level of EBIT, either of the plans end up at the same EPS.

Financial Management www.IndigoLearn.com 88
ILLUSTRATIONS
Illustration-1 (Cost of debentures)
Five years ago, Sona Limited issued 12 percent irredeemable debentures at Rs.103, a Rs.3
premium to their par value of Rs.100. The current market price of these debentures is Rs.94. If
the company pays corporate tax at a rate of 35 percent, what is its current cost of debenture
capital?
Illustration-2 (Cost of debentures)
A company issued 10,000, 10% debentures of Rs.100 each at a premium of 10% on 1.4.2017 to be
matured on 1.4. 2022.The debentures will be redeemed on maturity. Compute the cost of
debentures assuming 35% tax rate.
Illustration-3 (Cost of debentures)
A company issued 10,000, 10% debentures of Rs. 100 each on 1.4.2017 to be matured on 1.4.2022.
The company wants to know the current cost of its existing debt and the market price of the
debentures is Rs. 80. Compute the cost of existing debentures assuming 35% tax rate.
Illustration-4 (Cost of debentures)
A company issued 10,000, 10% debentures of Rs 100 each on 1/4/2013 to be matured on 1/4/2018.
The company wants to know the current cost of its existing debt and the market price of the
debentures is Rs 80. Compute the cost of existing debentures assuming 35% tax rate.
Illustration-5 (Value of a Bond)
RBML is proposing to sell a 5-year bond of Rs 5,000 at 8 % rate of interest per annum. The bond
amount will be amortized equally over its life. What is the bond’s present value for an investor if
he expects a minimum rate of return of 6 per cent?
Illustration-6 (Cost of debentures)
A Company issued 10,000 15% Convertible debentures of Rs 100 each with a maturity period of 5
years. At maturity the debenture holders will have the option to convert the debentures into
equity shares of the company in the ratio of 1:10 (10 shares for each debenture). The current
market price of the equity shares is Rs 12 each and historically the growth rate of the shares is 5%
per annum. Compute the cost of debentures assuming 35% tax rate.

Financial Management www.IndigoLearn.com 89
Illustration-7 (Cost of debentures)
A Company issued 10,00,000 12% Debentures of Rs 100 each. The debentures are redeemable after
expiry of fixed period of 7 years. The Company is in 35% tax bracket. Required:
i. Calculate cost of debt after tax if debentures are issued at
a. Par;
b. 10% discount and
c. 10% premium
ii. If brokerage is paid at 2%, what will be the cost of debentures if issue is at par.
Illustration-8 (Cost of preference shares)
XYZ Ltd. issues 2,000 10% preference shares of Rs 100 each at Rs 95 each. The company proposes
to redeem the preference shares at the end of 10th year from the date of issue. Calculate the
cost of preference share?
Illustration-9 (Cost of preference shares)
XYZ & Co. issues 2,000 10% Preference Shares of Rs 100 each at Rs 95 each. Calculate the cost of
preference shares?
Illustration-10 (Cost of preference shares)
If R Energy is issuing preferred stock at Rs100 per share, with a stated dividend of Rs 12, and a
floatation cost of 3% then, what is the cost of preference share?
Illustration-11 (Cost of preference shares)
A Company issued 40,000 12% Redeemable Preference Shares of Rs 100 each at a premium of Rs
5 each redeemable after 10 years at a premium of Rs 10 each. The floatation cost of each share
is Rs 2. You are required to calculate cost of Preference Share Capital ignoring dividend tax.
Illustration-12 (Cost of preference shares)
A company has paid dividend of Rs. 1 per share (of face value of Rs.10 each) last year and it is expected to grow @ 10% next year. Calculate the cost of equity if the market price of share is Rs.55. Illustration-13 (Estimation of growth rate-Avg method)

Financial Management www.IndigoLearn.com 90
The current dividend (Do) is Rs.16.10 and the dividend 5 years ago was rs.10. What is the growth rate? Illustration-14 (Cost of equity)
Mr. Mehra had purchased a share of Alpha Limited for Rs. 1,000. He received dividend for a period of 5 years at the rate of 10 %. At the end of the fifth year, he sold the share of Alpha Limited for Rs.1,128. You are required to compute the cost of equity as per Realised Yield Approach. Illustration-15 (Cost of capital)
Calculate the cost of equity capital of H Ltd., whose risk-free rate of return equals 10%. The firm’s beta equals 1.75 and the return on the market portfolio equals to 15%.
Illustration-16 (Cost of retained Earnings)
ABC Company provides the following details: D0 = Rs. 4.19 P0 = Rs. 50 g = 5% Calculate the cost of retained earnings based on Dividend-Growth model?
Illustration-17 (Cost of retained Earnings)
ABC Company provides the following details: Rf = 7% ß = 1.20 Rm - Rf = 6% Calculate the cost of retained earnings based on CAPM method.
Illustration-18 (Cost of retained Earnings)
Y Ltd retains Rs. 7,50,000 out of its retained earnings. The expected rate of return to the
shareholders, if they had invested the funds elsewhere is 10%. The brokerage is 3% and the
shareholders come in 30% tax bracket. Calculate the cost of Retained Earnings
Illustration-19 (Weighted average cost of capital)
Gama Limited has an issue of Rs 5,00,000 Rs 1 ordinary shares whose current ex-dividend market
price is Rs 1.50 per share. The Company has just paid a dividend of 27 paise per share, and
dividends are expected to continue at this level for some time. If the company has no debt capital,
what is the weighted average cost of capital?
Illustration-20 (Weighted average cost of capital)

Financial Management www.IndigoLearn.com 91
The capital structure of a company consists of · Equity shares of Rs. 50 lakhs; · 10% Preference shares of Rs. 10 lakhs and · 12% Debentures of Rs. 30 lakhs. The cost of equity capital for the company is 14.7 percent and income-tax rate for this company
is 30%.
You are required to calculate the Weighted Average Cost of Capital (WACC).
Illustration-21 (Weighted average cost of capital)
JKL Ltd. Has the following book-value capital structure as on March 31, 2017.
Rs.
Equity share capital (2,00,000 shares) 11.5% Preference shares 10% Debentures
40,00,000 10,00,000 30,00,000
80,00,000
The equity share of the company sells for Rs. 20. It is expected that the company will pay next
year a dividend of Rs. 2 per equity share, which is expected to grow at 5% p.a. forever. Assume a
35% corporate tax rate.
Required:
i. Compute weighted average cost of capital (WACC) of the company based on the
existing capital structure.
ii. Compute the new WACC, if the company raises an additional Rs. 20 lakhs debt by
issuing 12% Debentures. This would result in increasing the expected equity dividend
to Rs. 2.40 and leave the growth rate unchanged, but the price of equity share will
fall to Rs. 16 per share
Illustration-22 (Weighted average cost of capital)
Calculate the WACC using the following data by using book value & market value weights.
The capital structure of the company is as under:
Rs.
Debentures (Rs. 100 per debenture) Preference shares (Rs. 100 per share) Equity shares (Rs. 10 per share)
5,00,000 5,00,000
10,00,000 20,00,000
The market prices of these securities are:
→ Debenture Rs. 105 per debenture
→ Preference Rs. 110 per preference share
→ Equity Rs. 24 each
Additional information:

Financial Management www.IndigoLearn.com 92
a. Rs. 100 per Debenture redeemable at par, 10% coupon rate, 4% floatation costs, 10-year
maturity.
b. Rs. 100 per Preference share redeemable at par, 5% coupon rate, 2% floatation cost and 10-
year maturity.
c. Equity shares has Rs. 4 floatation cost and market price Rs. 24 per share.
The next year expected dividend is Rs. 1 with annual growth of 5%. The firm has practice of paying
all earnings in the form of dividend. Corporate tax rate is 50%
Illustration-23 (Overall cost of capital)
Determine the cost of capital of Best Luck Limited using the book value (BV) and market value
(MV) weights from the following information:
Sources Book Value (Rs.) Market Value (Rs.)
Equity shares 1,20,00,000
2,00,00,000
Retained earnings 30,00,000
—
Preference shares
36,00,000
33,75,000
Debentures
9,00,000
10,40,000
Additional information:
a. Equity: Equity shares are quoted at Rs.130 per share and a new issue priced at Rs. 125 per
share will be fully subscribed. Flotation costs will be Rs. 5 per share.
b. Dividend: During the previous 5 years, dividends have steadily increased from Rs.10.60 to
Rs.14.19 per share. Dividend at the end of the current year is expected to be Rs.15 per share.
c. Preference shares: 15% Preference shares with face value of Rs.100 would realise Rs.105 per
share.
d. Debentures: The Company proposes to issue 11-year 15% debentures but the yield on
debentures of similar maturity and risk class is 16%; Flotation cost is 2%.
e. Tax: Corporate tax rate is 35%. Ignore dividend tax.
Illustration-24 (Overall cost of capital)
The following details are provided by the GPS Limited:
Equity Share Capital 65,00,000
12% Preference Share Capital 12,00,000
15% Redeemable Debentures 20,00,000
10% Convertible Debentures 8,00,000
The cost of equity capital for the company is 16.30% and Inc tax rate for the company is 30%.
You are required to calculate the Weighted Average Cost of Capital (WACC) of the company.

Financial Management www.IndigoLearn.com 93
Illustration-25 (Marginal cost of capital)
XYZ Ltd. has the following book value capital structure:
(Rs. In Crores)
Equity Capital (in shares of Rs.10 each, fully paid up- at par) Rs. 15
11% Preference Capital (in shares of Rs.100 each, fully paid up- at par) Rs. 1
Retained Earnings Rs. 20
13.5% Debentures (of Rs.100 each) Rs. 10
15% Term Loans Rs. 12.5
• The next expected dividend on equity shares per share is Rs.3.60 ; the dividend per share
is expected to grow at the rate of 7%.
• The market price per share is Rs.40.
• Preference stock, redeemable after ten years, is currently selling at Rs.75 per share.
• Debentures, redeemable after six years, are selling at Rs.80 per debenture.
The Income tax rate for the company is 40%.
Required:
a. Calculate the WACC using:
i. Book value proportions; and
ii. Market value proportions.
b. Define the Marginal WACC schedule for the company, if it raises Rs.10 crores next
year, given the following information:
i. The amount will be raised by equity and debt in equal proportions;
ii. The company expects to retain Rs.1.5 crores earnings next year;
iii. The additional issue of equity shares will result in the net price per share being fixed
at Rs.32;
iv. The debt capital raised by way of term loans will cost 15% for the first Rs.2.5 crores
and 16% for the next Rs.2.5 crores.
Illustration-26 (Marginal Cost of Capital)
ABC Ltd. has the following capital structure which is considered to be optimum as on 31st March
2017
Rs
14% Debentures 30,000
11% Preference Shares 10,000
Equity Shares (10,000 shares) 1,60,000
2,00,000
The company share has a market price of Rs 23.60. Next year dividend per share is 50% of year
2017 EPS.

Financial Management www.IndigoLearn.com 94
The following is the trend of EPS for the preceding 10 years which is expected to continue in
future.
Year EPS (Rs) Year EPS (Rs)
2008 1.00 2013 1.61
2009 1.10 2014 1.77
2010 1.21 2015 1.95
2011 1.33 2016 2.15
2012 1.46 2017 2.36
The company issued new debentures carrying 16% rate of interest and the current market price
of debenture is Rs 96.
Preference share Rs 9.20 (with annual dividend of Rs 1.1 per share) were also issued. The company
is in 50% tax bracket
a. Calculate after tax:
i. Cost of new debt
ii. Cost of new preference shares
iii. New equity share (consuming new equity from retained earnings
b. Calculate marginal cost of capital when no new shares are issued.
c. How much can be spent for capital investment before new ordinary shares must be sold?
Assuming that retained earnings for next year’s investment are 50% of 2017.
d. What will the marginal cost of capital when the funds exceed the amount calculated in (c),
assuming new equity is issued at Rs 20 per share?
Illustration-27 (Ko-Market Values)
ABC Limited has the following book value capital structure: Rs in Million
Equity Share Capital (150 million shares, Rs.10 par)
Reserves and Surplus
10.5% Preference Share Capital (1 million shares, Rs.100 par)
9.5% Debentures (1.5 million debentures, Rs. 1,000 par)
8.5% Term Loans from Financial Institutions
1,500
2,250
100
1,500
500
- The debentures of ABC Limited are redeemable after three years and are quoting at Rs. 981.05 per debenture.
- The applicable income tax rate for the company is 35%. - The current market price per equity share is Rs.60. - The prevailing default risk free interest rate on 10-year GOI Treasury Bonds is 5.5%. - The average market risk premium is 8%. - The beta of the company is 1.1875.
The preferred stock of the company is redeemable after 5 years is currently selling at Rs. 98.15 per preference share.

Financial Management www.IndigoLearn.com 95
Required: i. Calculate weighted average cost of capital of the company using market value weights. ii. Define the marginal cost of capital schedule for the firm if it raises Rs.750 million for a
new project.
→ The firm plans to have a target debt to value ratio of 20%.
→ The beta of new project is 1.4375.
→ The debt capital will be raised through term loans.
→ It will carry interest rate of 9.5% for the first 100 million and 10% for the next Rs. 50 million
Illustration 28 (Additional Finance) Masco Limited wishes to raise additional finance of Rs 10 lakhs for meeting its investment plans. It has Rs 2,10,000 in the form of retained earnings available for investment purposes Further details are as following:
(1) Debt / Equity mix 30%/70%
(2) Cost of Debt
up to Rs 1,80,000 10% (before tax)
beyond Rs 1,80,000 16% (before tax)
(3) Earnings per share Rs 4
(4) Dividend pay out 50% of earnings
(5) Expected growth rate in dividend 10%
(6) Current market price per share Rs 44
(7) Tax rate 50%
You are required:
a. To determine the pattern for raising the additional finance.
b. To determine the post-tax average cost of additional debt.
c. To determine the cost of retained earnings and cost of equity, and
d. Compute the overall weighted average after tax cost of additional finance.
Illustration (Q2 RTP NOV 2020) Calculate the WACC using the following data by using: (a) Book value weights (b) Market value weights The capital structure of the company is as under:
Particulars (Rs.)
Debentures (Rs. 100 per debenture)
5,00,000
Preference shares (Rs. 100 per share)
5,00,000
Equity shares (Rs. 10 per share) 10,00,000
20,00,000
The market prices of these securities are:
• Debenture - Rs. 105 per debenture

Financial Management www.IndigoLearn.com 96
• Preference shares - Rs. 110 per preference share • Equity shares Rs. 24 each.
Additional information: i.Rs. 100 per debenture redeemable at par, 10% coupon rate, 4% floatation costs, 10-
year maturity. ii.Rs. 100 per preference share redeemable at par, 5% coupon rate, 2% floatation cost
and 10-year maturity. iii.Equity shares has Rs. 4 floatation cost and market price Rs. 24 per share.
The next year expected dividend is Rs. 1 with annual growth of 5%. The firm has practice of paying all earnings in the form of dividend.
Corporate tax rate is 30%. Use YTM method to calculate cost of debentures and preference shares. Illustration (Q1(b) MAY 2019)
Alpha Ltd. has furnished the following information:
Earnings Per Share (EPS) Rs. 4
Dividend pay-out ratio 25%
Market price per share Rs. 50
Rate of tax 30%
Growth rate of dividend 10%
The company wants to raise additional capital of Rs. 10 lakhs including debt of Rs. 4 lakhs. The cost of debt (before tax) is 10% up to Rs. 2 lakhs and 15% beyond that. Compute the after-tax cost of equity and debt and weighted average cost of capital. Illustration ( Q4 Nov 2019) A Company wants to raise additional finance of Rs.5 crore in the next year. The company expects to retain Rs. 1 crore earning next year. Further details are as follows:
i.The amount will be raised by equity and debt in the ratio of 3: 1. ii. The additional issue of equity shares will result in price per share being fixed
at Rs. 25. iii. The debt capital raised by way of term loan will cost 10% for the first Rs. 75 lakh and
12% for the next Rs. 50 lakhs to 1.25 Crores iv. The net expected dividend on equity shares is Rs. 2.00 per share. v. The dividend is expected to grow at the rate of 5%. vi. Income tax rate is 25%.
You are required:
a. To determine the amount of equity and debt for raising additional finance. b. To determine the post-tax average cost of additional debt. c. To determine the cost of retained earnings and cost of equity. d. To compute the overall weighted average cost of additional finance after tax.

Financial Management www.IndigoLearn.com 97
Illustration (RTP Q2 NOV 2018) M/s. Navya Corporation has a capital structure of 40% debt and 60% equity. The company is presently considering several alternative investment proposals costing less than ₹ 20 lakhs. The corporation always raises the required funds without disturbing its present debt equity ratio The cost of raising the debt and equity are as under:
Project cost Cost of debt 18015 Cost of debt (after tax)
Cost of equity
Upto ₹ 2 lakhs
10% 5% 12%
Above ₹ 2 lakhs & upto to ₹ 5 lakhs
11% 5.5% 13%
Above ₹ 5 lakhs & upto ₹ 10 lakhs
12% 6% 14%
Above ₹ 10 lakhs & upto ₹ 20 lakhs
13% 6.5% 14.5%
. Assuming the tax rate at 50%, CALCULATE: (i) Cost of capital of two projects X and Y whose fund requirements are ₹ 6.5 lakhs and ₹ 14 lakhs, respectively. (ii) If a project is expected to give after tax return of 10%, DETERMINE under what conditions it would be acceptable. Illustration (Q1(c) NOV 2019) Following figures and information were extracted from the company A Ltd.
Earnings of the company ₹ 10,00,000
Dividend paid ₹ 6,00,000
No. of shares outstanding
2,00,000
Price Earnings Ratio 10
Rate of return on investment
20%
You are required to calculate: (i) Current Market price of the share (ii) Capitalisation rate of its risk class
(iii) What should be the optimum pay-out ratio? (iv) What should be the market price per share at optimal pay-out ratio? (use Walter’s Model)

Financial Management www.IndigoLearn.com 98
Illustration Kalyanam Ltd. has an operating profit of ₹ 34,50,000 and has employed Debt which gives total Interest Charge of ₹ 7,50,000. The firm has an existing Cost of Equity and Cost of Debt as 16% and 8% respectively. The firm has a new proposal before it, which requires funds of ₹ 75 Lakhs and is expected to bring an additional profit of ₹ 14,25,000. To finance the proposal, the firm is expecting to issue an additional debt at 8% and will not be issuing any new equity shares in the market. Assume no tax culture. You are required to CALCULATE the Weighted Average Cost of Capital (WACC) of Kalyanam Ltd.:
(i) Before the new Proposal (ii) After the new Proposal

Financial Management www.IndigoLearn.com 99
FINANCING DECISIONS - CAPITAL STRUCTURE ANALYSIS
Optimum Capital Structure
One of the basic objectives of financial management is to maximize the value or wealth of the firm. Capital Structure is optimum when the firm has a combination of equity and debt so that the wealth of the firm is maximum. At this level, cost of capital is minimum and market price per share is maximum. In theory, one can speak of an optimum capital structure; but in practice, appropriate capital structure is a more realistic term than optimum capital structure.
Features of an Appropriate Capital Structure
The following are the major features of an appropriate capital structure: a. Profitability: It should minimize the cost of financing and maximize earning per equity
share. b. Flexibility: The capital structure should be such that company can raise funds whenever
needed. c. Conservation: The debt content should not exceed the maximum which the company can
bear. d. Solvency: The capital structure should be such that the firm does not run the risk of
becoming insolvent. e. Control: There should be minimum risk of loss or dilution of control of the company.
Major considerations in capital structure planning
The three major considerations in Capital Structure Planning are: (a) Risk, (b) Cost and (c) Control. They differ for various components of Capital i.e. Own Funds and Loan Funds. A comparative analysis is given as under:
Type of fund
Risk Cost Control
Equity Capital
Low Risk - no question of repayment of capital except when the company is under liquidation - Hence best from viewpoint of risk.
Most expensive - dividend expectations of shareholders are higher than interest rates. Also, dividends are not tax- deductible.
Dilution of control - Since the Capital base might be expanded and new shareholders / public are involved.
Preference
Slightly higher risk when Slightly cheaper cost than No dilution of control since
Capital compared to Equity Equity but higher than voting rights are
Value of firm is
maximized when cost
of capital is minimised
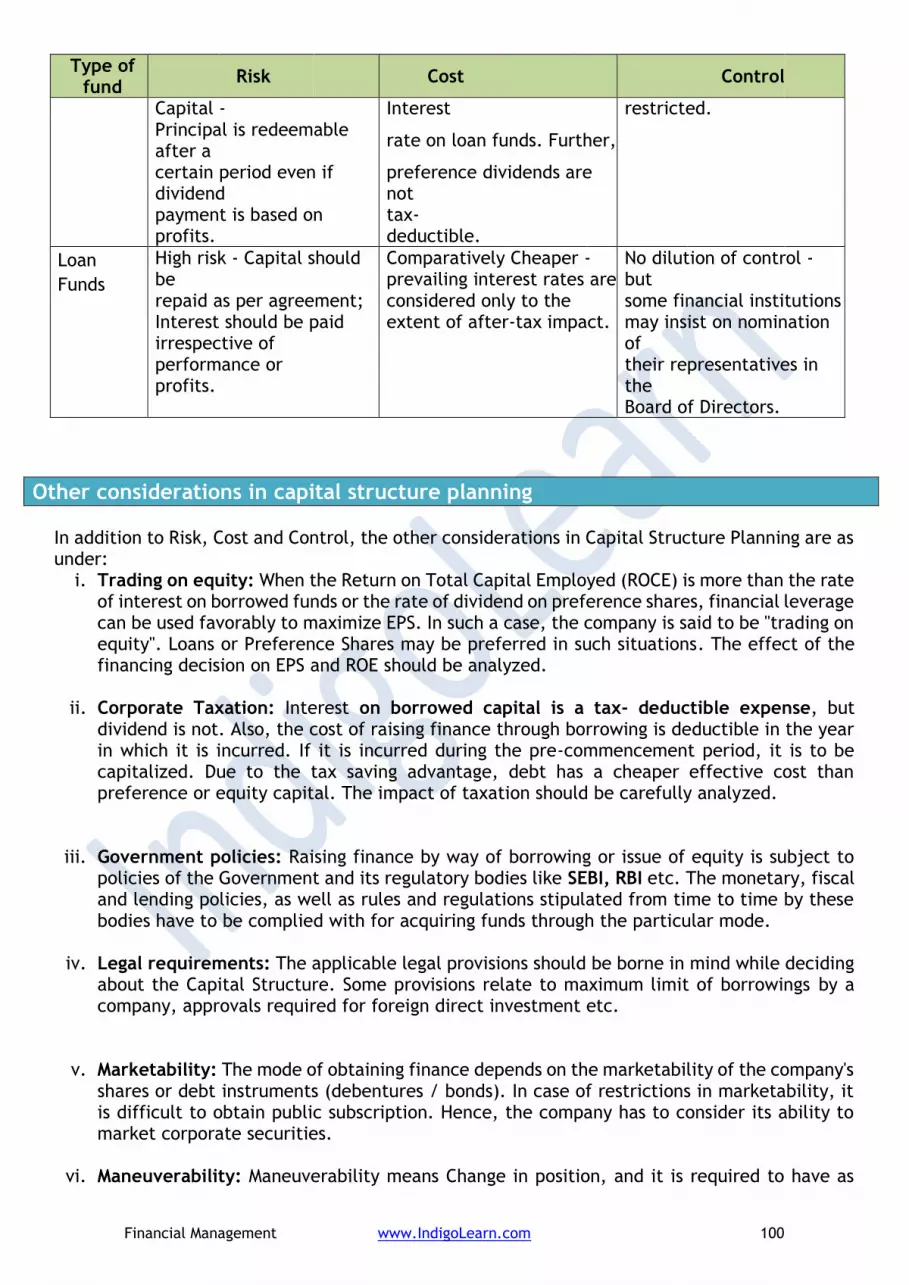
Financial Management www.IndigoLearn.com 100
Type of fund
Risk Cost Control
Capital - Interest restricted.
Principal is redeemable after a
rate on loan funds. Further,
certain period even if dividend
preference dividends are not
payment is based on profits.
tax-deductible.
Loan High risk - Capital should be repaid as per agreement; Interest should be paid irrespective of performance or profits.
Comparatively Cheaper - prevailing interest rates are considered only to the extent of after-tax impact.
No dilution of control - but some financial institutions may insist on nomination of their representatives in the Board of Directors.
Funds
Other considerations in capital structure planning
In addition to Risk, Cost and Control, the other considerations in Capital Structure Planning are as under:
i. Trading on equity: When the Return on Total Capital Employed (ROCE) is more than the rate of interest on borrowed funds or the rate of dividend on preference shares, financial leverage can be used favorably to maximize EPS. In such a case, the company is said to be "trading on equity". Loans or Preference Shares may be preferred in such situations. The effect of the financing decision on EPS and ROE should be analyzed.
ii. Corporate Taxation: Interest on borrowed capital is a tax- deductible expense, but
dividend is not. Also, the cost of raising finance through borrowing is deductible in the year in which it is incurred. If it is incurred during the pre-commencement period, it is to be capitalized. Due to the tax saving advantage, debt has a cheaper effective cost than preference or equity capital. The impact of taxation should be carefully analyzed.
iii. Government policies: Raising finance by way of borrowing or issue of equity is subject to policies of the Government and its regulatory bodies like SEBI, RBI etc. The monetary, fiscal and lending policies, as well as rules and regulations stipulated from time to time by these bodies have to be complied with for acquiring funds through the particular mode.
iv. Legal requirements: The applicable legal provisions should be borne in mind while deciding about the Capital Structure. Some provisions relate to maximum limit of borrowings by a company, approvals required for foreign direct investment etc.
v. Marketability: The mode of obtaining finance depends on the marketability of the company's shares or debt instruments (debentures / bonds). In case of restrictions in marketability, it is difficult to obtain public subscription. Hence, the company has to consider its ability to market corporate securities.
vi. Maneuverability: Maneuverability means Change in position, and it is required to have as

Financial Management www.IndigoLearn.com 101
many alternatives as possible at the time of expanding or contracting the requirement of funds. It enables use of proper type of funds available at a given time and also enhances the bargaining power when dealing with prospective suppliers of funds.
vii. Flexibility: It denotes the capacity of the business and its management to adjust to expected
and unexpected changes in the business environment. The Capital structure should provide maximum freedom to changes at all times.
viii. Timing: Proper timing of a security issue often brings substantial savings because of the
dynamic nature of the capital market. Hence the issue should be made at the right time to minimize effective cost of capital. The management should constantly study the trend in the capital market and time its issue carefully.
ix. Size of the Company: Small companies rely heavily on owner's funds, while large and widely
held companies are generally considered to be less risky by the investors. Such large companies can issue different types of debt instruments or securities.
x. Purpose of financing: Funds required for long term productive purposes like manufacturing,
setting up new plant etc. may be raised through long term sources. But if the funds are required for non- productive purposes, like welfare facilities to employees such as schools, hospitals etc., internal financing may have to be resorted to.
xi. Period of finance: Funds required for medium and long-term periods say 8 to 10 years may
be raised by way of borrowings. But if the funds are for permanent requirement, it will be appropriate to raise them by the issue of equity shares.
xii. Nature of investors: Enterprises which enjoy stable earnings and dividend with a proven
track record may go for borrowings or preference shares, since they are having adequate profits to pay interest/fixed charges. But companies, which do not have assured income, should preferably rely on internal resources to a large extent since it may be difficult to woo investors towards the issue.
xiii. Requirement of investors: Different types of securities are issued to different classes of
investors according to their requirement. Sometimes, the investor may be motivated by the options and advantages available with a security, e.g. double options, convertibility, security of principal and interest etc.
xiv. Provision for future growth: Future growth considerations and further requirements of
capital should also be considered.
xv. Nature of industry, xvi. Gestation period, xvii. Certainty with which profits will accrue after the undertaking goes into commercial
production,
xviii. Quantum of return on investment,
Components of Financial Risk
Financial risk is of three types:

Financial Management www.IndigoLearn.com 102
1. Risk of cash insolvency: As a firm raises more debt, its commitment towards debt service
increases. This is due to two reasons. Firstly, higher the debt, the greater the amount of interest payable, even in years of insufficient profits. Secondly, the principal must be repaid in committed instalments, even if sufficient cash is not available. Thus, the risk of cash insolvency increases.
2. Risk of variation in the EPS: Equity Shareholders are entitled to residual earnings only, i.e. earnings after meeting interest, tax and preference dividend. Hence, as interest increases, these will be lower probability that equity shareholders will enjoy a stable dividend. As a result of financial leverage, if debt content is high in the capital structure, the risk of variations in expected earnings available to equity shareholders will be higher.
3. Risk of rise in cost of capital:
Capital structure theories
Capital Structure Theories seek to explain the relationship between the following variables:
▪ Proportions of Components of capital (debt, equity etc.); ▪ Costs of each component of Capital; ▪ Impact of Leverage; ▪ Overall Cost of Capital (WACC); and ▪ Value of the Firm.
General assumptions in Capital Structure Theories
The following are the general assumptions in Capital Structure Theories. a. There are only two sources of funds viz., debt and equity. [No Preference Share Capital] b. The Total Assets of a firm and its Capital Employed are fixed. However, debt equity mix can
be changed: ▪ either by borrowing debt to repurchase (redeem) equity shares ▪ or by raising equity capital to retire (repay) debt. [No change in TOTAL OF Capital
Employed] c. All earnings are distributed to equity shareholders. [No retained earnings i.e. 100% dividend
pay-out ratio] d. The firm earns operating profits and it is not expected to grow. [No losses] e. Business risk is assumed to be constant and is not affected by the finance mix [No change in
fixed operating cost] f. There are no corporate or personal taxes. [No taxation] g. The investors have the same subjective probability distribution of expected earnings.
Capital structure theories
Theories which suggest that capital structure (i.e. debt equity mix) affects WACC
Net Income Approach (NI Approach)
Traditional Theory - In Phase -1
Theories which suggest that capital structure (i.e. debt equity mix) does not affect WACC, which is a constant.
Net Operating Income Approach (NOI Approach)
Modigliani and Miller Approach (MM Approach)

Financial Management www.IndigoLearn.com 103
[No difference in investors’ expectations] h. The capital structure can be altered without incurring transaction costs. [No Transaction
Cost]
In discussing the theories of capital structure, we will consider the following notations: S or E= Market value of the Equity [earnings available to equity shareholders / cost of equity] D = Market value of the Debt [interest / rate of interest or cost of debt] V = Market value of the Firm = E or S +D I = Total Interest Payments T = Tax Rate EBIT or NOI= Earnings before Interest & Tax or Net Operating Income [Sales – variable cost – operating fixed costs] EBT or NI = Earnings before Tax or Net Income or Earnings available to Equity Share Holders [EBIT – Interest] EAT = Earnings after Tax [EBT – Tax] Kd = Cost of Debt [interest / value of debt] Ke = Cost of Equity [EBT or EAT / value of equity] K0 = Overall cost of capital i.e., WACC [ EBIT / Value of Firm]
NET Income Approach - of David Durand
This theory states that there is a relationship between the Capital Structure and the value of the firm. Assumptions of the theory: Apart from the general assumptions, the following additional assumptions are made: 1. The Cost of Debt (Kd) is always less than Cost of Equity (Ke). (Kd < Ke) 2. Kd and Ke remain constant at all levels of debt-equity mix. Ke remaining constant means, the
increase in use of debt content does not change the risk perception of investors. 3. Ko decreases with the increase in debt in capital structure. Theory or Explanation: 1. As Debt is a cheaper source of finance than equity (due to investor's risk expectations)
use/increase of cheaper debt funds in total capital structure will reduce the Overall Cost of Capital.
2. Hence, as the degree of financial leverage increases, the WACC will decline with every increase in the debt content in total funds employed.
3. Since Value of Firm = EBIT / Ko, the value of firm will increase for every decline in WACC. Thus, where debt content is reduced, the reverse will happen, i.e. WACC will increase thereby reducing the value of the firm.
Optimum Capital Structure
• Thus, a firm can increase its value and lower the overall cost of capital by increasing the proportion of debt in the capital structure.
• Thus, the theory suggests total or maximum possible debt financing for minimizing the cost of capital.
The Value of the Firm will be Maximum at a point where WACC is minimum, & thus Optimum capital Structure Application: The application of theory in determining Ko involves the following steps:

Financial Management www.IndigoLearn.com 104
In this Theory, Kd & Ke being constant - will be Given & Ko should be Computed (for the Optimum Structure) Key: S – V – K
Step Procedure
1 Compute Market Value of Equity: S or E = EAESH or [EBIT – I]
/ (Ke)
2 Compute Market Value of Firm: V = S or E + D; where D = I /
Kd
3 Compute Overall Cost of Capital; Ko = EBIT / V
Graphical Representation
Debt-Equity Mix
Net Operating Income Approach
According to David Durand, under NOI approach, the total value of the firm will not be affected by the composition of capital structure. Assumptions: The following additional assumptions are made: 1. The Cost of Debt (Kd) is always less than Cost of Equity (Ke). (Kd < Ke) 2. Kd (Debt Capitalization Rate) remains constant at various levels of debt-equity mix. 3. Ke (Equity Capitalization Rate) increases as debt content increases due to higher
expectations of equity investors i.e., the increase in use of debt content changes/Increases the risk perception of investors. (This is the conceptual difference from NIA)
4. The market (investors in debt as well as equity) capitalizes the value of the firm, without giving importance to the debt-equity mix. Hence Overall Cost of Capital is constant.
Theory or Explanation: 1. Debt may be cheaper than equity. But the risk perception of equity investors increases with
the use of additional debt in the capital employed. This increase in financial risk causes the equity capitalization rate to increase.
2. Thus, the advantage of using low-cost debt is set off exactly by such increase in equity capitalization rate, so that the overall cost of capital remains constant for all degrees of debt-equity mix.
3. Hence, the market capitalizes the value of firm as a whole. Thus, the split between debt and equity is not important.
4. The market value of the firm is computed by capitalizing the net operating income at the overall cost of capital - which is constant & therefore the market value is not affected by,

Financial Management www.IndigoLearn.com 105
debt -equity mix change. 5. Optimum capital Structure
Since WACC is constant at all levels, every debt-equity mix is as good as any other mix. There is no optimum capital structure. Every capital structure is optimal one.
Application: The application of theory in determining Ke involves the following steps: In this Theory, Kd & Ko being constant - will be Given & Ke should be Computed (for finding the increased Ke) Key: V – S – K
Step Procedure
1 Compute Market Value of Firm; V = EBIT / Ko
2 Compute Market Value of Equity; S or E = V - D ; where D = I / Kd
3 Compute Cost of Equity; Ke = [EBIT – I] / S or E
Graphical Representation
Traditional Theory to Cost of Capital.
It takes a mid-way between the NI approach and the NOI approach. Assumptions: 1. The Cost of Debt (Kd) is always less than Cost of Equity (Ke). 2. Kd and Ke vary with change in debt-equity mix. As debt content increases, financial risk
increases, causing increase in the expectations of equity investors and rise in the cost of equity. Also, additional loans can be taken only at a higher rate of interest. So, Cost of Debt also rises beyond a certain level of debt content.
3. Increase in Cost of Equity is steeper and higher than increase in cost of debt. Theory or Explanation: 1. Debt is a cheaper source of finance than equity due investor's risk expectations. 2. Use of cheaper debt funds in total capital structure will reduce the Overall or Weighted Cost
of Capital since Debt percentage increases in the total capital structure i.e., as the degree of financial leverage increases, the WACC will decline with every increase in the debt content in total funds employed.(similar to NIA) – Phase 1
3. However, if financial leverage increases beyond an acceptable limit (called the optimal point), the cost of equity starts rising. This is because of the high financial risk associated with the firm. (similar to NOIA) – Phase 2
4. The increasing cost of equity and along with increasing cost of debt owing to increased financial risk makes the overall cost of capital to increase. New – Phase 3
5. The firm should strive to reach the optimal capital structure and maximize its total value through a judicious use of both debt and equity in the capital structure. At the optimal capital structure, the overall cost of capital will be minimum, and the value of the firm is maximum.

Financial Management www.IndigoLearn.com 106
6. Thus, as per the Traditional Theory, the firm should try to achieve the optimal Capital Structure by minimizing WACC and maximizing its value.
Application: Different Ko s for various Capital Structures is computed using the given Weights and costs (similar to that of Net Income Approach except that Ke and Kd differ for different degrees of debt-equity mix). The least WACC should be selected as the optimal Capital Structure.
Modigliani and Miller Approach
This Approach is a refinement of the Net Operating Income Approach. The basic theory is essentially the same, but some additional propositions are made. Assumptions: 1. Kd less than Ke: The Cost of Debt (Kd) is always less than Cost of Equity (Ke). 2. Constant Kd: The Debt Capitalization Rate remains constant at various levels of debt equity
mix. 3. Increasing Ke: Ke increases as debt content increases due to higher expectations of equity
investors. 4. Constant WACC: The market (investors in debt as well as equity) capitalizes the value of the
firm, without giving importance to the debt-equity mix. Hence Overall Cost of Capital is constant.
Additional assumptions are:
1. Perfect Capital Market: a. Investors are free to buy and sell securities. b. They are well informed about the risk and return on all type of securities. c. There are no transaction costs. d. The investors behave rationally. e. They can borrow without restrictions on the same terms as the firms do.
2. Risk Classification: Firms can be classified into ' homogenous risk class'. They belong to this class if their expected earnings have identical risk characteristics.
Theory or Explanation: 1. Debt may be cheaper than equity. But the risk perception of equity investors increases with
the use of additional debt in the capital employed. 2. Increase in financial risk causes the equity capitalization rate to increase. 3. Thus, the advantage of using low-cost debt is set off exactly by the increase in equity
capitalization rate. 4. Therefore, the overall cost of capital remains constant for all degrees of debt-equity mix. 5. The market capitalizes the value of firm as a whole. Thus, the split between debt and
equity is not important. 6. The market value of the firm is ascertained by capitalizing the net operating income at the

Financial Management www.IndigoLearn.com 107
overall cost of capital, which is constant. The market value is not affected by changes in debt-equity mix. .
7. Since WACC is constant at all levels, every debt-equity mix is as good as any other mix. There is no optimum capital structure. Every capital structure is an optimal one. The total cost of capital of a firm is independent of its methods and level of financing.
8. Since WACC is constant, WACC at 0% debt (i.e. 100% equity) should be the same as WACC at any other percentage of debt. Hence WACC = Ke when the firm is financed purely by equity. WACC of a firm equals the capitalization rate of pure equity stream of its class of risk.
Propositions: Modigliani and Miller make the following propositions for Levered & Unlevered Structures
1. The total market value of a firm and its cost of capital are independent of its capital structure.
The total market value of the firm is given by capitalizing the expected stream of operating earnings at a discount rate considered appropriate for its risk class.
VU = EBIT
KeU
& VL = EBIT−I
KeL
+ D; Here: KeU = K0U
= KOL= KO
2. The cost of equity (Ke) of Levered Structure KeL
is equal to capitalisation rate of pure equity
stream plus a premium for financial risk. The financial risk increases with more debt content in the capital structure. As a result, Ke increases in a manner to offset exactly the use of less expensive source of debt funds.
KeL = Ko + [
Equity
DebtX (Ko – Kd)]
3. The cut off rate for investment purposes is completely independent of the mode of financing,
since the value of the Firm depends on the Investment opportunities (but not on finance mix) and irrespective of any capital structure the Value of an opportunity remains the same & hence the Overall Cost also remains constant.
4. Financial Leverage has no impact on market values, which remain constant for all firms in the same risk class. If at all such firms have different market values, investors will buy and sell shares and set aside the leverage effect. Hence arbitrage will substitute personal leverage for corporate leverage.
Concept of Arbitrage under M & M Approach
Modigliani and Miller argue that there is no difference in the market values of different firms in the same risk class. They consider that financial leverage or use of debt in capital structure has no impact on Market Values. Their reasoning is as under: 1. Companies in an industry of the same risk class will ideally result in their earnings being
capitalized at same rates.
2. The Market values of such companies would ideally remain the same, but if the market values

Financial Management www.IndigoLearn.com 108
(as represented by Market Price per share i.e. MPS) of these companies are different, investors in the high MPS company will sell their holding and the shares of low MPS Company will be bought. This is because, in the capital market, the rational movement should be "buy at low prices and sell at high prices".
3. The buying and selling spree will lead to increase in demand of the low MPS company's shares causing its share price to increase. Similarly, due to sale of holdings, the price of high MPS company's share will fall.
4. This movement in share prices will continue till both companies' share prices settle at a constant.
5. Through the above procedure, investors will move from leveraged firm to unleveraged firm and vice-versa through the process of arbitrage. This will cease only when total market values of both firms are the same.
6. The arbitrage effect nullifies the effect of leverage that the companies may possess.
7. Hence, it is not possible for the companies in the same risk class, to affect their market values and therefore their overall capitalization rate by use of leverage.
8. Thus, for a company in a particular risk class, the total market value must be same irrespective of debt in company's capital structure.
Criticism of Modigliani and Miller theory
Modigliani and Miller Theory is criticized on the following grounds: 1. The assumption of perfect market is not practical. In the real world, various imperfections
exist, such as transaction costs for purchase and sale of securities, differential rates of interest etc.
2. The argument that arbitrage nullifies the effect of leverage is not valid. Investors do not behave in such a calculated and rational way in switching from leveraged to unleveraged firm or vice-versa.
3. Rates of interest are not the same for the individuals and firms. The firms generally have a
higher credit standing because of which they can borrow funds at a lower rate of interest as compared to individuals.
4. The theory presumes the availability of free and up to date information on all aspects of the
company's functioning. In practice, investors have little or no knowledge about the company's operations. Their dealing in shares are not based only upon the information on hand, but on other considerations also.
5. Existence of corporate taxes: The major limitation of M – M hypothesis is the existence of corporate taxes. Since the interest charges are tax deductible, a levered firm will have a lower cost of debt due to tax advantage when taxes exist.
M – M Hypothesis and Corporate Taxes
Modigliani and Miller later recognised the importance of the existence of corporate taxes. Accordingly, they agreed that for Levered Structure, the value of will increase or the cost of capital will decrease with the use of debt due to tax deductibility of interest charges. Thus, the optimum capital structure can be achieved by maximising debt component in the capital structure. According to this approach, value of a firm can be calculated as follows:

Financial Management www.IndigoLearn.com 109
Value of Unlevered firm (Vu) = 𝐸𝐵𝐼𝑇 (𝐼−𝑇)
𝐾𝑜
Where, EBIT = Earnings before interest and taxes Ko = Ke of ULF= Overall cost of capital of the Unlevered Firm t = Tax rate.
Value of levered firm (VL) = Value of Unlevered firm + Present value of tax shield on interest Value of levered firm (VL) = Value of Unlevered firm + (debt x tax rate)
Note: The interest tax shields increase the cashflows available to the investors of the levered firm, thus, increases the value of levered firm to the extent of present value of tax shield on interest.
Also, KeL = Ko + [
Equity
DebtX (1 – tax) (Ko – Kd)]
(Where Ko is post-tax) Assuming permanent use of debt funds, the PV of interest tax shield can be calculated using the formula of perpetuity.
Present value of tax shield on interest = 𝑡𝑎𝑥 𝑟𝑎𝑡𝑒 ×𝑖𝑛𝑡𝑒𝑟𝑒𝑠𝑡 𝑟𝑎𝑡𝑒 ×𝑑𝑒𝑏𝑡 𝑓𝑢𝑛𝑑𝑠
𝑖𝑛𝑡𝑒𝑟𝑒𝑠𝑡 𝑟𝑎𝑡𝑒
Over capitalization and Under capitalization
Over capitalization
• Over capitalization is a situation where a firm has more capital than it needs
• The chief sign of over-capitalisation is the fall in payment of dividend and interest leading to fall in value of the shares of the company.
Causes of Over-Capitalisation:
Over-capitalisation arises due to following reasons:
i. Raising more money through issue of shares or debentures than company can employ profitably.
ii. Borrowing huge amount at higher rate than rate at which company can earn. iii. Excessive payment for the acquisition of fictitious assets such as goodwill etc. iv. Improper provision for depreciation, replacement of assets and distribution of dividends
at a higher rate. v. Wrong estimation of earnings and capitalisation.
Consequences of Over-Capitalisation:
Over-capitalisation results in the following consequences: i. Considerable reduction in the rate of dividend and interest payments. ii. Reduction in the market price of shares. iii. Resorting to “window dressing”. iv. Some companies may opt for reorganization. However, sometimes the matter gets worse
and the company may go into liquidation.
Remedies for Over-Capitalisation:

Financial Management www.IndigoLearn.com 110
Following steps may be adopted to avoid the negative consequences of over-capitalisation: i. Company should go for thorough reorganization. ii. Buyback of shares. iii. Reduction in claims of debenture-holders and creditors. iv. Value of shares may also be reduced. This will result in sufficient funds for the company
to carry out replacement of assets.
Under capitalization
• Under capitalization is a state, when its actual capitalisation is lower than its proper capitalisation as warranted by its earning capacity.
• This situation normally happens with companies which have insufficient capital but large secret reserves in the form of considerable appreciation in the values of the fixed assets not brought into the books.
Consequences of Under-Capitalisation:
Under-capitalisation results in the following consequences: i. The dividend rate will be higher in comparison to similarly situated companies. ii. Market value of shares will be higher than value of shares of other similar companies
because their earning rate being considerably more than the prevailing rate on such securities.
iii. Real value of shares will be higher than their book value.
Effects of Under-Capitalisation:
Under-capitalisation has the following effects: i. It encourages acute competition. High profitability encourages new entrepreneurs to
come into same type of business. ii. High rate of dividend encourages the workers’ union to demand high wages. iii. Normally common people (consumers) start feeling that they are being exploited. iv. Management may resort to manipulation of share values. v. Invite more government control and regulation on the company and higher taxation also.
Remedies:
Following steps may be adopted to avoid the negative consequences of under capitalization: i. The shares of the company should be split up. This will reduce dividend per share, though
EPS shall remain unchanged. ii. Issue of Bonus Shares is the most appropriate measure as this will reduce both dividend
per share and the average rate of earning. iii. By revising upward the par value of shares in exchange of the existing shares held by
them.
Over capitalization vs. Under capitalization
• Both over capitalisation and under capitalisation are not good.
• However, over capitalisation is more dangerous to the company, shareholders and the society than under capitalisation.
• The situation of under capitalisation can be handled more easily than the situation of over-capitalisation.
• Moreover, under capitalisation is not an economic problem but a problem of adjusting capital structure.
• Thus, under capitalisation should be considered less dangerous but both situations are bad and every company should strive to have a proper capitalisation.

Financial Management www.IndigoLearn.com 111
ILLUSTRATIONS
Illustration-1 (Net Income Approach)
Rupa Ltd.'s EBIT is Rs 5,00,000. The company has 10%, 20 lakhs debentures. The equity
capitalization rate i.e. Ke is 16%.
You are required to calculate:
(i) Market value of equity and value of firm
(ii) Overall cost of capital
Illustration-2 (Net Income approach)
Indra Ltd. has EBIT of Rs 1,00,000. The company makes use of debt and equity capital. The firm
has 10% debentures of Rs 5,00,000 and the firm’s equity capitalization rate is 15%.
You are required to compute:
(i) Current value of the firm
(ii) Overall cost of capital.
Illustration-3 (NOI Approach)
Amita Ltd.’s operating income is Rs 5,00,000. The firm’s cost of debt is 10% and currently the
firm employs Rs 15,00,000 of debt. The overall cost of capital of the firm is 15%.
You are required to determine:
(i) Total value of the firm.
(ii) Cost of equity.
Illustration – 4 (NOI Approach)
Z Ltd.’s operating income (before interest and tax) is Rs. 9,00,000. The firm’s cost of debt is 10
per cent and currently firm employs Rs. 30,00,000 of debt. The overall cost of capital of firm is
12%.
Required:
Calculate cost of equity
Illustration – 5 (NOI Approach- 2 firms)
Alpha Limited and Beta Limited are identical except for capital structures. Alpha Ltd. has 50 per
cent debt and 50 per cent equity, whereas Beta Ltd. has 20 per cent debt and 80 per cent
equity. (All percentages are in market-value terms). The borrowing rate for both companies is 8
per cent in a no-tax world, and capital markets are assumed to be perfect.

Financial Management www.IndigoLearn.com 112
(a) (i) If you own 2 per cent of the shares of Alpha Ltd., what is your return if the company has
net operating income of Rs 3,60,000 and the overall capitalization rate of the company, K0 is 18
per cent?
(ii) What is the implied required rate of return on equity?
(b) Beta Ltd. has the same net operating income as Alpha Ltd.
(i) What is the implied required equity return of Beta Ltd.?
(ii) Why does it differ from that of Alpha Ltd.?
Illustration 6 (MM Approach- without tax)
One-third of the total market value of Sanghmani Limited consists of loan stock, which has a cost
of 10 per cent. Another company, Samsui Limited, is identical in every respect to Sanghmani
Limited, except that its capital structure is all-equity, and its cost of equity is 16 per cent.
According to Modigliani and Miller, if we ignored taxation and tax relief on debt capital, what
would be the cost of equity of Sanghmani Limited?
Illustration 7 (Arbitrage)
There are two company N Ltd. and M Ltd., having same earnings before interest and taxes i.e.
EBIT of Rs. 20,000. M Ltd. is a levered company having a debt of Rs.1,00,000 @ 7% rate of interest.
The cost of equity of N Ltd. is 10% and of M Ltd. is 11.50%. Find out how arbitrage process will be
carried on?
Illustration 8 (Arbitrage)
There are two companies U Ltd. and L Ltd., having same NOI of Rs. 20,000 except that L Ltd. is a levered company having a debt of Rs. 1,00,000 @ 7% and cost of equity of U Ltd. & L Ltd. are 10% and 18% respectively. Show how the arbitrage process will work.
Illustration 9 (MM Approach- with tax)
There are two firms P and Q which are identical except P does not use any debt in its capital
structure while Q has Rs. 8,00,000, 9% debentures in its capital structure. Both the firms have
earnings before interest and tax of Rs. 2,60,000 p.a. and the capitalization rate are 10%.
Assuming the corporate tax of 30%, calculate the value of these firms according to MM
Hypothesis.

Financial Management www.IndigoLearn.com 113
Illustration 10 (MM Approach- with tax)
RES Ltd. is an all equity financed company with a market value of Rs. 25,00,000 and cost of
equity Ke = 21%. The company wants to buyback equity shares worth Rs. 5,00,000 by issuing and
raising 15% perpetual debt of the same amount.
Rate of tax may be taken as 30%. After the capital restructuring and applying MM Model (with
taxes), you are required to calculate:
(i) Market value of RES Ltd.
(ii) Cost of Equity Ke
(iii) Weighted average cost of capital and comment on it.
Illustration 11 ( Capital structure decisions-existing and new)
Best of Luck Ltd., a profit making company, has a paid-up capital of Rs. 100 lakhs consisting of 10 lakhs ordinary shares of Rs. 10 each. Currently, it is earning an annual pre-tax profit of Rs. 60 lakhs. The company’s shares are listed and are quoted in the range of Rs. 50 to Rs. 80. The management wants to diversify production and has approved a project which will cost Rs. 50 lakhs and which is expected to yield a pre-tax income of Rs. 40 lakhs per annum. To raise this additional capital, the following options are under consideration of the management:
(a) To issue equity share capital for the entire additional amount. It is expected that the new shares (face value of Rs. 10) can be sold at a premium of Rs.15.
(b) To issue 16% non-convertible debentures of Rs.100 each for the entire amount. (c) To issue equity capital for Rs.25 lakhs (face value of Rs. 10) and 16% non-convertible
debentures for the balance amount. In this case, the company can issue shares at a premium of Rs. 40 each.
You are required to advise the management as to how the additional capital can be raised, keeping in mind that the management wants to maximise the earnings per share to maintain its goodwill. The company is paying income tax at 50%.
Illustration 12 ( Capital structure decisions-Debt 3 options)
Shahji Steels Limited requires Rs.25,00,000 for a new plant. This plant is expected to yield EBIT of Rs.5,00,000. While deciding about the financial plan, the company considers the objective of maximizing earnings per share. It has three alternatives to finance the project – By raising Debt of Rs.2,50,000 or Rs.10,00,000 or Rs.15,00,000 The balance, in each case, by issuing Equity Shares. The company’s share is currently selling at Rs. 150, but is expected to decline to Rs. 125 in case the funds are borrowed in excess of Rs. 10,00,000. The funds can be borrowed at 10 % upto Rs. 2,50,000, at 15 % over Rs. 2,50,000 and upto Rs. 10,00,000 and at 20 % over Rs. 10,00,000. The tax rate applicable to the company is 50 %. Which form of financing should the company choose?
Illustration 13 (EPS under different options)

Financial Management www.IndigoLearn.com 114
A Company earns a profit of Rs. 3,00,000 per annum after meeting its Interest liability of Rs.
1,20,000 on 12% debentures. The Tax rate is 50%. The number of Equity Shares of Rs. 10 each
are 80,000 and the retained earnings amount to Rs. 12,00, 000.The company proposes to take up
an expansion scheme for which a sum of Rs. 4,00,000 is required.
It is anticipated that after expansion, the company will be able to achieve the same return on
investment as at present. The funds required for expansion can be raised either through debt at
the rate of 12% or by issuing Equity Shares at par.
Required:
i) Compute the Earnings per Share (EPS), if:
a) The additional funds were raised as debt
b) The additional funds were raised by issue of equity shares
ii) Advise the company as to which source of finance is preferable.
Illustration 14 (Indifference point)
Ganesha Limited is setting up a project with a capital outlay of Rs. 60,00,000. It has two alternatives in financing the project cost. Alternative-I: 100% equity finance by issuing equity shares of Rs. 10 each Alternative-II: Debt-equity ratio 2:1 (issuing equity shares of Rs. 10 each) The rate of interest payable on the debts is 18% p.a. The corporate tax rate is 40%. Calculate the indifference point between the two alternative methods of financing. Illustration 15 (Indifference point)
Calculate the level of earnings before interest and tax (EBIT) at which the EPS indifference point
between the following financing alternatives will occur.
i. Equity share capital of Rs.6,00,000 and 12% debentures of Rs.4,00,000
Or
ii. Equity share capital of Rs.4,00,000, 14% preference share capital of Rs.2,00,000 and 12%
debentures of Rs.4,00,000.
Assume the corporate tax rate is 35% and par value of equity share is Rs.10 in each case.
Illustration 16 (Indifference point)
Alpha Limited requires funds amounting to Rs 80 lakhs for its new project. To raise the funds,
the company has following two alternatives:
(i) To issue Equity Shares of Rs 100 each (at par) amounting to Rs 60 lakhs and borrow the
balance amount at the interest of 12% p.a.; (or)
(ii) To issue Equity Shares of Rs 100 each (at par) and 12% Debentures in equal proportion,
The Income-tax rate is 30%.

Financial Management www.IndigoLearn.com 115
Find out the point of indifference between the available two modes of financing and state which
option will be beneficial in different situations.
Illustration 17 (EPS, indifference point, BEP)
Ganapati Limited is considering three financing plans. The key information is as follows:
(a) Total investment to be raised Rs 2,00,000
(b) Plans of Financing Proportion:
Plans Equity Debt Preference Shares
A 100% - -
B 50% 50% -
C 50% - 50%
(c) Cost of debt 8% Cost of preference shares 8%
(d) Tax rate 50%
(e) Equity shares of the face value of Rs 10 each will be issued at a premium of Rs 10 per share.
(f) Expected EBIT is Rs 80,000.
You are required to determine for each plan: -
(i) Earnings per share (EPS) (ii) The financial break-even point.
(iii) Indicate if any of the plans dominate and compute the EBIT range among the plans for
indifference.
Illustration 18 (Indifference point)
X Ltd. is considering the following two alternative financing plans:
Plan - I Plan – II
Rs. Rs.
Equity shares of Rs. 10 each 12% Debentures Preference Shares of Rs. 100 each
4,00,000 2,00,000
-
4,00,000
- 2,00,000
6,00,000 6,00,000
The Indifference point between the plans is Rs. 2,40,000. Corporate tax rate is 30%. Calculate
the rate of dividend on preference share.
Illustration 19 ( effect on EPS- 3 options)

Financial Management www.IndigoLearn.com 116
Suppose that a firm has an all equity capital structure consisting of 100,000 ordinary shares of Rs
10 per share. The firm wants to raise Rs 250,000 to finance its investments and is considering
three alternative methods of financing –
(i) to issue 25,000 ordinary shares at Rs10 each,
(ii) to borrow Rs 2,50,000 at 8 per cent rate of interest,
(iii) to issue 2,500 preference shares of Rs100 each at an 8 per cent rate of dividend.
If the firm’s earnings before interest and taxes after additional investment are Rs 3,12,500 and
the tax rate is 50 per cent. Show the effect on the earnings per share under the three financing
alternatives.
Illustration 20
Yoyo Limited presently has Rs 36,00,000 in debt outstanding bearing an interest rate of 10%. It
wishes to finance a Rs 40,00,000 expansion programme and is considering three alternatives:
➢ Additional debt at 12% interest;
➢ Preference stock with an 11% dividend; and
➢ The issue of common stock at Rs 16 per share. The company presently has 8,00,000 shares outstanding and is in a 40% tax bracket.
a) If earnings before interest and taxes are presently Rs 15,00,000, what would be earnings
per share for the three alternatives, assuming no immediate increase in profitability?
b) Develop an indifference chart for these alternatives. What are the approximate
indifference points? To check one of these points, what is the indifference point
mathematically between debt and common?
Which alternative do you prefer? How much would EBIT need to increase before the next
alternative would be best?
Question – 1(a) Nov 2018 Question Paper
Y Ltd. Requires Rs 5000000 for a new project. This project is expected to yield earnings before
interest and taxes of Rs 1000000. While deciding about the financial plan the company considers
the objective of maximizing earnings per share. It has two alternatives to finance the project
- By raising debt
• Rs 500000 or
• Rs 2000000 - By issuing equity shares
The company’s share is currently selling at Rs 300 but is expected to decline to Rs 250 in cas the
funds are borrowed in excess of Rs 20 lakhs. The funds can be borrowed at the rate of 12% upto
Rs 500000 and 10% over Rs 500000. The Tax rate applicable to the company is 25%.
Question – 5 Nov 2018 Question Paper
The following data relates to two companies belonging to same risk class:

Financial Management www.IndigoLearn.com 117
Particulars A Ltd. B Ltd.
Expected Net Operating Income ‘18,00,000 ’18,00,000
12% Debt ’54,00,000 _
Equity Capitalization Rate _ 18%
Required:
a) Determine the total market value, Equity capitalization rate and weighted average cost of capital for each company assuming No taxes as per M.M. approach.
b) Determine the total Market value, Equity Capitalization rate and weighted average cost of capital for each company assuming 40% taxes as per M.M. approach.
Illustration ( Q3 RTP Nov 2020)
Xylo Ltd. is considering two alternative financing plans as follows:
Particulars Plan – A (Rs.)
Plan – B (Rs.)
Equity shares of Rs. 10 each
8,00,000 8,00,000
Preference Shares of Rs. 100 each
- 4,00,000
12% Debentures 4,00,000 -
12,00,000 12,00,000
The indifference point between the plans is Rs.4,80,000. Corporate tax rate is 30%. Calculate the rate of dividend on preference share Illustration ( Q2 May 2019) RM Steels Limited requires Rs. 10,00,000 for construction of a new plant. It is considering three financial plans:
i. The company may issue 1,00,000 ordinary shares at Rs. 10 per share. ii. The company may issue 50,000 ordinary shares at Rs. 10 per share and
5000 debentures of Rs. 100 denominations bearing an 8 per cent rate of interest; and
iii. The company may issue 50,000 ordinary shares at Rs. 10 per share and 5,000 preference shares at Rs. 100 per share bearing an 8 per cent rate of dividend.
If RM Steels Limited's earnings before interest and taxes are Rs. 20,000; Rs. 40,000; Rs. 80,000;Rs. 1,20,000 and Rs. 2,00,000. (a)You are required to compute the earnings per share under each of the three financial plans?
(b)Which alternative would you recommend for RM steels and why? Tax rate is 50%

Financial Management www.IndigoLearn.com 118
Illustration ( Q 1(a) May 2018) Stopgo Ltd, an all equity financed company, is considering the repurchase of Rs. 200 lakhs equity and to replace it with 15% debentures of the same amount.
• Current market Value of the company is Rs. 1140 lakhs and it's cost of capital is 20%. • It's Earnings before Interest and Taxes (EBIT) are expected to remain constant in future. • It's entire earnings are distributed as dividend. • Applicable tax rate is 30 per cent.
You are required to calculate the impact on the following on account of the change in the capital structure as per Modigliani and Miller (MM) Hypothesis: (i) The market value of the company (ii) It's cost of capital, and (iii) It’s cost of equity Illustration ( Q 1(d) May 2018) Sun Ltd. is considering two financing plans. Details of which are as under: (i) Fund's requirement – Rs. 100 Lakhs (ii) Financial Plan
Plan Equity Debt
I 100% - Rs. 100 Lakhs Equity
II 25% 75% Rs. 25 lakhs Equity and Rs. 75 Lakhs Debt
(iii) Cost of debt – 12% p.a. (iv) Tax Rate – 30% (v) Equity Share Rs. 10 each, issued at a premium of Rs. 15 per share (vi) Expected Earnings before Interest and Taxes (EBIT) Rs. 40 Lakhs You are required to compute: (i) EPS in each of the plan (ii) The Financial Break-Even Point (iii) Indifference point between Plan I and plan II Illustration ( Q 3 May 2018 RTP) Company P and Q are identical in all respects including risk factors except for debt/equity,

Financial Management www.IndigoLearn.com 119
• company P having issued 10% debentures of ₹ 18 lakhs while company Q is unlevered. • Both the companies earn 20% before interest and taxes on their total assets of ₹ 30 lakhs. • Assuming a tax rate of 50% and capitalization rate of 15% from an all-equity company
CALCULATE the value of companies P and Q using (i) Net Income Approach and (ii) Net Operating Income Approach.
Illustration ( Q 3 May 2019 RTP)
Akash Limited provides you the following information:
(₹)
Profit (EBIT) 2,80,000
Less: Interest on Debenture @ 10% (40,000)
EBT 2,40,000
Less Income Tax @ 50% (1,20,000)
1,20,000
No. of Equity Shares (₹ 10 each) 30,000
Earnings per share (EPS) 4
Price /EPS (PE) Ratio 10
• The company has reserves and surplus of ₹ 7,00,000 and required ₹ 4,00,000 further for modernisation. • Return on Capital Employed (ROCE) is constant. • Debt (Debt/ Debt + Equity) Ratio higher than 40% will bring the P/E Ratio down to 8 and increase the interest rate on additional debts to 12%.
You are required to ascertain the probable price of the share (i) If the additional capital are raised as debt; and (ii) If the amount is raised by issuing equity shares at ruling market prices.

Financial Management www.IndigoLearn.com 120
FINANCING DECISIONS - LEVERAGES
Meaning of leverage
➢ The concept of leverage has its origin in science. It means influence of one force over another. ➢ In the context of financial management, the term ‘leverage’ means sensitiveness of one
financial variable to change in another. ➢ Use of one financial variable to create an impact on another financial variable ➢ For example:
o Increase in sales leads to increase in EBIT. o Increase in EBIT leads to increase in EPS.
➢ The term leverage in general, refers to advantage gained for any purpose. ➢ Study of leverage is essential to define the risk undertaken by the shareholders. ➢ In financial analysis, Leverage is used by business firms to quantify the risk-return relationship
of different alternative capital structures. ➢ Earnings available to shareholders fluctuate on account of two risks.
▪ Variability of EBIT - Operating Risk: arises due to variability of sales and variability of expenses.
▪ Variability of EPS or ROE - Financial Risk: arises due to the impact of interest charges.
FIXED COSTS
Meaning and significance of Operating Leverage.
(a) Definition: Operating leverage is defined as the "firm's ability to use fixed operating costs to magnify effects of changes in sales on its earnings before interest and taxes."
(b) Explanation: A change in sales will lead to a change in Profit i.e. Earnings before Interest and Taxes (EBIT). The effect of change in sales on EBIT is measured by operating leverage. Since fixed costs remain the same irrespective of level of output, percentage increase in EBIT will be higher than increase in Sales.
Fixed Costs
Operating Fixed Cost
e.g. Salary, insurance, rent, etc.
Financial Fixed Cost
e.g., interest, preference dividend.
Types of
Leverage
Operating
Leverage
Financial
Leverage
Combined
Leverage

Financial Management www.IndigoLearn.com 121
(c) Measurement: The degree of Operating Leverage (DOL) is measured by: (expressed in times)
% Change in EBIT Contribution or % Change in Sales EBIT
(d) Significance:
▪ Effect on EBIT: DOL measures the impact of change in sales on operating income. Suppose DOL of a firm is 1.67 times, it implies that 1 % change in sales will lead to 1.67% change in EBIT. Hence, if sales increase by 20%, EBIT increases by 20% X 1.67 = 33%. Also, if sales decrease by say 40%, EBIT falls by 67%.
▪ Impact of Fixed Costs: DOL depends on fixed costs. If fixed costs are higher, DOL is higher and vice-versa.
▪ Effect of High DOL: If DOL is high, it implies that fixed costs are high. Hence the Breakeven point (no profit- no loss situation) would be reached at a higher level of sales. Due to the high Break-Even Point, the Margin of Safety and profits would be low. This means that the operating risks are higher. Hence, a low DOL is preferred.
▪ A high DOL means that profits (EBIT) may be wiped off, even for a marginal reduction in sales. Hence, it is preferred to operate sufficiently above break-even point to avoid the danger of fluctuations in sales and profits.
(e) Operating Breakeven Point = unit per onContributi
Cost Fixed or
RatioPV
Cost Fixed
Important Points – 1) In the Absence of Fixed Cost, C = EBIT & DOL = 1 => there is NO Leverage Impact
2) When Sales = BE Sales => C = FC => at Break – even point, DOL is undefined, since EBIT is 0.
3) When Sales > BE Sales => C > FC => DOL is Positive AND can be favorable 4) When Sales < BE Sales => C < FC => DOL is NOT considered negative since DOL is a
Ratio [But in such case the Leverage is NOT at all Favorable as it is in Fraction < 1]
5) Each level of sales has different operating leverage & DOL decreases as sales increases, because risk reduces
Meaning and significance of Financial Leverage.
(a) Meaning: Financial Leverage is defined as the ability of a firm to use fixed financial charges (interest) to magnify the effects of changes in E.B.I.T. / Operating profits, on the firm's Earning Per Share (EPS).
(b) Explanation: Financial Leverage occurs when a Company has debt content in its capital structure and fixed financial charges e.g. interest on debentures. These fixed financial charges do not vary with the EBIT. They are fixed and are to be paid irrespective of level of EBIT. Hence an increase in EBIT will lead to a higher percentage increase in Earnings per Share (EPS). This is measured by the Financial Leverage.
(c) Measurement: The degree of Financial Leverage (DFL) is measured by: (expressed in times}

Financial Management www.IndigoLearn.com 122
EBIT in Change%
EPSin Change % or
EBT
EBIT or
ratetax - I
Div Pref. -Int -EBIT
EBIT
(d) Significance:
➢ Effect on EPS: DFL measures the impact of change in EBIT (Operating Income) on EPS (earnings per share). E.g.: DFL of a firm is 4 times, it implies that 1 % change in EBIT will lead to 4% change in EPS. Hence, if EBIT increases by 10%, EPS increases by 10% X 4 = 40%. Also, if EBIT decreases by say 5%, EPS fall by 20%
➢ Indicator of Financial Risk (e) Impact of fixed financial charges: DFL depends on the magnitude of interest and fixed
financial charges. If these costs are higher, DFL is higher and vice-versa Effect of High DFL: If DFL is high, it implies that fixed interest charges are high. This means that the financial risks are higher. The DFL is favorable or advantageous to the firm, when it earns more on its total investment that what it pays towards debt capital. In other words, DFL is advantageous only if Return on Capital Employed (ROCE) is greater than Rate of Interest on Debt. Financial BEP – It is that level of EBIT at which EPS is zero.
Financial Breakeven point = I + ratetax - 1
PD
Where, I = Interest, PD = Pref. Dividend
Important Points – 1) If Financial Cost is Absent, EBIT = EBT & DFL = 1 => there is NO Leverage Impact
2) When EBIT = BE EBIT => EBIT = I + Pd/(1-t) => at Financial BEP, DFL is undefined, since Denominator is 0.
3) When EBIT > BE EBIT => EBIT > EBIT – I – Pd/(1-t) => DFL is Positive AND can be favorable 4) When EBIT < BE EBIT => EBIT < EBIT – I – Pd/(1-t) DFL is NOT considered negative since
DFL is a Ratio [But in such case the Leverage is NOT at all Favorable as it is in Fraction < 1]
5) Each level of EBIT has different Financial leverage & DFL decreases as EBIT increases, because risk reduces
When is a firm said to be financially favorably leveraged?
To determine whether the degree of Financial Leverage is favorable or not, the Return on Capital Employed (ROCE) should be compared with Rate of Interest on Debt. 1. When ROCE greater than Interest rate:
DFL is favorable or advantageous to the firm, when it earns more on its total investment than what is pays towards debt capital. In other words, DFL is advantageous only if Return on Capital Employed (ROCE) is greater than Rate of Interest on Debt. This is because shareholders gain in a situation where the company earns a high rate of return and pays a lower rate of return to the supplier of long-term debt funds. Financial Leverage in such cases is therefore also called 'Trading on Equity'. The difference, between the return (EBIT) and the cost of debt funds would enhance the earnings of shareholders. Further, in case of debt funds the interest cost is also tax deductible. Hence. gain from DFL arises due to: ▪ Excess of return on investment over effective cost (cost after considering taxation effect)

Financial Management www.IndigoLearn.com 123
of debt funds. ▪ Reduction in the number of shares issued due to the use of debt funds.
2. When ROCE is less than Interest rate:
Where the rate of return on investment falls below the rate of interest, the shareholders suffer, because their earnings fall more sharply than the fall in the return on investment. This is because fixed interest costs have to be met, irrespective of the level of EBIT. In such cases, a high DFL is disadvantageous. In fact, the use of debt funds involving fixed commitment of interest payment and principal repayment, is not justified.
3. Conclusion: DFL should be high when Return on Capital Employed (ROCE) is greater than Interest Rate on Debt. If ROCE is less than Interest Rate on Debt, DFL should be maintained low.
Meaning and Significance of Combined Leverage
(a)Meaning: Combined Leverage is used to measure the total risk of a firm i.e. Operating Risk and Financial Risk.
(b) Explanation: Effect of Fixed Operating Costs (i.e. Operating Risks) is measured by Operating Leverage (DOL). Effect of Fixed Interest Charges (i.e. Financial Risks) is measured by Financial Leverage (DFL). The combined effect of these is measured by Combined Leverage (DCL).
(c) Measurement: The degree of Combined Leverage (DCL) is measured as DOL X DFL.
Therefore, DCL = EBT
onContributi or
ratetax - I
Div Pref. -Int -EBIT
onContributi
(d) Significance: DOL measures impact of change in Sales on EBIT. DFL measures the impact of
change in EBIT on EPS. DCL measures the combined impact, i.e. effect of change in Sales on EPS. If DCL is 2 times, it implies that a 10% increase in Sales will lead to 20% increase in EPS.
(e) Overall breakeven point = onContributi
Cost Fixed Total=
Ratio PV
t- 1
DP I FC ++
Ideal combination for Combined Leverage
Combined Leverage is analyzed by reference to the combination of DOL and DFL, as under.
DOL DFL Effect Reason and Significance
High High Very RISKY High DOL => High Operating Risk => High Fixed Cost & BEP
High DFL => Small fall in EBIT to greater fall EBT
High Low CAREFUL, medium
risk High DOL's impact is sought to be set off with Low
Financial Risk.
Hence Equity Shareholders interest is safeguarded.

Financial Management www.IndigoLearn.com 124
DOL DFL Effect Reason and Significance
Low Low CAUTIOUS &
CONSERVATIVE,
low risk and low
return
Low DOL => Low Operating Risks => Low Fixed Costs & BEP
But Equity Shareholders' gains are not maximized since DFL is low.
Low High PREFERABLE Low DOL => Low Operating Risks => Low Fixed Costs & BEP
Due to high DFL, small rise in EBIT leads to greater rise in EBT
and EPS. Hence Equity Shareholders' gains are maximized.
DIFFERENCES BETWEEN BUSINESS RISK AND FINANCIAL RISK
# Business risk Financial risk
1 Meaning
It refers to variability of EBIT and the fear of inability of the firm to generate sales sufficiently for meeting its fixed operating costs.
It refers to variability of EPS due to financial leverage, and the fear of inability of the firm to earn sufficiently for meeting its fixed financing costs.
2 Operating or Financing costs
It deals with fixed operating costs e.g., salaries, rent, depreciation, etc.
It deals with the fixed financial charges to be paid irrespective of the profits, e.g., Interest and Preference dividend.
3 Avoidable / unavoidable
Business risk is generally unavoidable since most of the fixed costs are unavoidable and firm can’t do without them. Such costs can be controlled to a certain extent but can’t be avoided fully.
This risk can be avoided if firm does not use fixed charge source of finance (i.e., Debt & Pref. Cap).
Should increase in activity levels (Sales) be supported by increase in Capital Employed
1. Increase in Sales leads to increase in EBIT, EBT and ROI. Hence, a firm may be tempted to try to raise its Capital Turnover Ratio (Sales divided by Capital Employed) without restraint.
2. However, as Capital Turnover Ratio increases, Working Capital Ratio deteriorates. 3. As sales increases, both Current Assets and Current Liabilities also increase but not in
proportion to the current ratio, with the same amount of funds employed. Hence Current Ratio registers a fall and affects the liquidity position of the firm adversely.
4. Hence, a rise in capital turnover must be supported by an adequate capital base and increase in the amount of funds employed, more particularly in Working Capital.
Discuss the impact of Financial Leverage on Shareholders Wealth by using Return-on-Assets (ROA) and Return-on-Equity (ROE) analytic framework. 1. ROA or ROCE = PBIT less Tax Sales X
Sales Capital Employed

Financial Management www.IndigoLearn.com 125
2. ROE = Earnings Available for Equity holders
Equity Funds Employed
3. ROE can also be computed as ROA + Equity
Debt(ROA – Kd) where Kd = Cost of Debt
4. When ROA is high, the ROE is also higher and financial leverage is favorable. However, when the after-tax cost of debt is higher than ROA or ROCE, financial leverage works in the reverse manner and consequently ROE will be affected.
5. Hence, equity shareholders stand to gain with use of debt-funds, only if ROA is higher than the after-tax cost of debt.

Financial Management www.IndigoLearn.com 126
ILLUSTRATIONS
Illustration 1 (Operating leverage)
A Company produces and sells 10,000 shirts. The selling price per shirt is Rs.500. Variable cost is
Rs. 200 per shirt and fixed operating cost is Rs. 25,00,000.
(a) Calculate operating leverage.
(b) If sales are up by 10%, then what is the impact on EBIT?
Illustration 2 (Operating leverage)
Calculate the operating leverage for each of the firms A, B, C and D from the following price and
cost data.
Firms (Amounts in Rs.)
A B C D
Sale price per unit
Variable cost per unit
Fixed operating cost
20
6
80,000
32
16
40,000
50
20
2,00,000
70
50
NIL
What conclusions can you draw with respect to levels of fixed cost and the degree of operating
leverage result? Explain.
Assume number of units sold is 5,000.
Illustration 3 (Financial leverage)
A firm has Sales of Rs. 40 lakhs; Variable cost of Rs. 25 lakhs; Fixed cost of Rs. 6 lakhs; 10% debt
of Rs. 30 lakhs; and Equity Capital of Rs. 45 lakhs.
Required:
Calculate operating and financial leverage.
Illustration 4 (OL. FL, CL)
A firm’s details are as under:
Sales (@ 100 per unit) Rs.24,00,000
Variable Cost 50%
Fixed Cost Rs.10,00,000
It has borrowed Rs. 10,00,000 @ 10% p.a. and its equity share capital are Rs.10,00,000 (Rs. 100
each).
Calculate:
(a) Operating Leverage
(b) Financial Leverage
(c) Combined Leverage
www.IndigoLearn.com
9640 11111 0

Financial Management www.IndigoLearn.com 127
(d) Return on Investment
(e) If the sales increases by Rs. 6,00,000, what will the new EBIT?
Illustration 5 (EPS vs sales)
Betatronics Ltd has the following balance sheet and income statement information:
Balance Sheet as on March 31st
Liabilities Rs Assets Rs
Equity capital (Rs. 10 per share) Net fixed assets 10,00,000
10% Debt 6,00,000 Current assets 9,00,000
Retained earnings 3,50,000
Current liabilities 1,50,000
Total Liabilities 19,00,000 Total Assets 19,00,000
Income Statement for the year ending March 31st:
Particulars Rs
Sales 3,40,000
Operating expenses (including 60,000 depreciation) 1,20,000
EBIT 2,20,000
Less: Interest 60,000
Earnings before tax (EBT) 1,60,000
Less: Taxes 56,000
Net Earnings (EAT) 1,04,000
(a) Determine the degree of operating, financial and combined leverages at the current sales
level, if all operating expenses, other than depreciation, are variable costs.
(b) If total assets remain at the same level, but sales
(i) increase by 20 percent and
(ii) decrease by 20 percent,
what will be the earnings per share at the new sales level?
Illustration 6 (EPS,OL,FL,CL)
A Company had the following Balance Sheet as on 31st March 2014:
Liabilities (Rs in Crores)
Assets (Rs in crores)
Equity Share Capital (50 lakh shares of Rs 10 each)
5 Fixed Assets (Net) 12.5
Reserves and Surplus 1 Current Assets 7.5
15% Debentures 10
Current Liabilities 4
20 20
The additional information is given as under:
Fixed cost per annum (excluding interest) 4 crores

Financial Management www.IndigoLearn.com 128
Variable operating cost ratio 65%
Total assets turnover ratio 2.5
Income Tax rate 30%
Calculate the following and comment:
i. Earnings per share
ii. Operating Leverage
iii. Financial Leverage
iv. Combined Leverage
Illustration 7 (OL,FL,CL)
The following information related to XL Company Ltd. for the year ended 31st March 2013 are
available to you:
Equity share capital of Rs.10 each Rs.25 lakh
11% Bonds of Rs.1000 each Rs.18.5 lakh
Sales Rs.42 lakh
Fixed cost (Excluding Interest) Rs.3.48 lakh
Financial leverage 1.39
Profit-Volume Ratio 25.55%
Income Tax Rate Applicable 35%
You are required to calculate: (i) Operating Leverage; (ii) Combined Leverage; and (iii) Earning
per Share.
Illustration 7 (OL,FL,CL)
Calculate the operating leverage, financial leverage and combined leverage from the following
data under Situation I and II and Financial Plan A and B”:
Installed Capacity 4,000 units
Actual Production and Sales 75% of the Capacity
Selling Price Rs 30 per unit
Variable Cost Rs 15 per unit
Fixed Cost:
Under Situation – I Rs 15,000
Under Situation – II Rs 20,000
Capital Structure:
Plan A Plan B
(Rs) (Rs)
Equity 10,000 15,000
Debt (Rate of Interest at 20%) 10,000 5,000
20,000 20,000

Financial Management www.IndigoLearn.com 129
Illustration 8 ( Degree of operating leverage)
X Ltd has estimated that for a new product its break-even point is 20,000 units if the item is sold
for Rs. 14 per unit and variable cost is Rs. 9 per unit. Calculate the degree of operating leverage
for sales volume is 25,000 units and 30,000 units.
Illustration 9 (OL,FL,CL)
Z Limited is considering the installation of a new project costing Rs. 80,00,000. Expected Annual
Sales from the project is Rs. 90,00,000. Variable costs are 60% of sales.
Expected annual fixed cost other than interest is Rs. 10,00,000. Corporate tax rate is 30%.
Company wants to arrange the funds through issuing 4,00,000 equity shares of Rs. 10 each and
12% debentures of Rs. 40,00,000.
You are required to:
a. Calculate the operating, financial and combined leverages and Earnings per Share (EPS).
b. Determine the likely level of EBIT, if EPS is (i) Rs. 4, (ii) Rs. 2, (iii) Rs. 0
Illustration 10 (Change in EPS)
Consider the following information for Strong Ltd.
Rs. in lakh
EBIT PBT Fixed Cost
1,120 320 700
Calculate % change in earnings per share, if sales increase by 5%.
Illustration 11 ( Earnings calculation)
A company operates at a production level of 1,000 units. The contribution is `60 per unit,
operating leverage is 6, combined leverage is 24. If tax rate is 30%, what would be its earnings
after tax?
Illustration 12 (Income statement)
From the following financial data of Company, A and Company B:
Prepare their Income Statements.
Company A Company B
Rs. Rs.
Variable Cost Fixed Cost Interest Expenses Financial Leverage
56,000 20,000 12,000 5:1
60% of sales -
9,000 -

Financial Management www.IndigoLearn.com 130
Operating Leverage Income Tax Rate Sales
- 30%
-
4:1 30%
1,05,000
Illustration 13 (FL,EPS)
The following details of RST Limited for the year ended 31st March 2006 are given below:
Operating leverage Combined leverage Fixed Cost (Excluding interest) Sales 12% Debentures of Rs. 100 each Equity Share Capital of Rs. 10 each Income tax rate
1.4 2.8 Rs.2.04 lakhs Rs. 30.00 lakhs Rs. 21.25 lakhs Rs. 17.00 lakhs 30 percent
Required:
i. Calculate Financial leverage
ii. Calculate P/V ratio and Earning per Share (EPS)
iii. If the company belongs to an industry, whose assets turnover is 1.5, does it have a high or
low assets leverage?
At what level of sales, the Earning before Tax (EBT) of the company will be equal to Zero?
Illustration 14 (FL, Cover for dividend, PE, net fund flow)
The capital structure of JCPL Ltd. is as follows:
Particulars Rs.
Equity Share Capital of Rs. 10 each 8% Preference Share Capital of Rs. 10 each 10% Debentures of Rs. 100 each
8,00,000 6,25,000 4,00,000
18,25,000
Additional Information:
• Profit after tax (Tax Rate 30%) is Rs. 1,82,000
• Operating Expenses (including depreciation Rs. 90,000) being 1.5 times of EBIT
• Equity Share dividend paid 15%
• Market Price per Equity Share Rs.20
Required to calculate:
a. Operating and Financial Leverage
b. Cover for the preference and equity share of dividends
c. The earning yield and price earnings ratio
d. The net fund flow

Financial Management www.IndigoLearn.com 131
Illustration (Q2 Nov 2018)
Following is the Balance Sheet of Soni Ltd. as on 31st March, 2018 :
Liabilities Amount in Rs.
Shareholder’s Funds : Equity Share Capital (Rs.10 each) Reserves and Surplus
25,00,000 5,00,000
Non-Current Liabilities (12% Debentures)
50,00,000
Current Liabilities 20,00,000
Total 1,00,00,000
Assets Amount in Rs.
Non-current Assets 60,00,000
Current Assets 40,00,000
Total 1,00,00,000
Additional Information: (i) Variable Cost is 60% of Sales. (ii) Fixed Cost p.a. excluding interest ` 20,00,000. (iii) Total Asset Turnover Ratio is 5 times. (iv) Income Tax Rate 25% You are required to: (1) Prepare Income Statement (2) Calculate the following and comment: (a) Operating Leverage (b) Financial Leverage (c) Combined Leverage
Illustration (Q4 RTP Nov 2020)
The capital structure of PS Ltd. for the year ended 31st March, 2020 consisted as follows:
Particulars Amount in Rs.
Equity share capital (face value Rs. 100 each)
10,00,000
10% debentures (Rs. 100 each) 10,00,000
During the year 2019-20, sales decreased to 1,00,000 units as compared to 1,20,000 units in the previous year. However, the selling price stood at Rs. 12 per unit and variable cost at Rs. 8 per unit for both the years. The fixed expenses were at Rs. 2,00,000 p.a. and the income tax rate is 30%. You are required to calculate the following: (a) The degree of financial leverage at 1,20,000 units and 1,00,000 units. (b) The degree of operating leverage at 1,20,000 units and 1,00,000 units. (c) The percentage change in EPS.

Financial Management www.IndigoLearn.com 132
Illustration (Q2 Nov 2019)
The Balance Sheet of Gitashree Ltd. is given below:
Liabilities (Rs. ) (Rs. )
Shareholders’ fund
Equity share capital of Rs. 10 each
1,80,000
Retained earnings 60,000 2,40,000
Non-current liabilities 10% debt 2,40,000
Current liabilities 1,20,000
6,00,000
Assets
Fixed Assets 4,50,000
Current Assets 1,50,000
6,00,000
The company's total asset turnover ratio is 4. Its fixed operating cost is Rs. 2,00,000 and its variable operating cost ratio is 60%. The income tax rate is 30%. Calculate: (i) (a) Degree of Operating leverage. (b) Degree of Financial leverage. (c) Degree of Combined leverage. (ii) Find out EBIT if EPS is (a) Rs. 1 (b) Rs. 2 and (c) Rs. 0.
Illustration (Q1(b) May 2018)
The following data have been extracted from the books of LM Ltd:
Sales Rs. 100 lakhs
Interest Payable per annum
Rs. 10 lakhs
Operating leverage 1. 2
Combined leverage 2.16
You are required to calculate: (i) The financial leverage, (ii) Fixed cost and (iii P/V ratio

Financial Management www.IndigoLearn.com 133
Illustration (Q4 RTP May 2018-New)
Question 4: (Leverage)
Calculate the operating leverage, financial leverage and combined leverage from the following data under Situation I and II and Financial Plan A and B:
Installed Capacity 4,000 units
Actual Production and Sales 75% of the Capacity
Selling Price ₹ 30 per unit
Variable Cost ₹ 15 per unit
Fixed Cost:
Under Situation I ₹ 15,000
Under Situation II ₹ 20,000
Capital Structure:
Financial Plan
A (₹) B (₹) Equity 10,000 15,000
Debt (Rate of Interest at 20%) 10,000 5,000
20,000 20,000
Illustration (Q4 RTP Nov 2018-New)
A firm has sales of ₹ 75,00,000 variable cost is 56% and fixed cost is ₹ 6,00,000. It has a debt of ₹ 45,00,000 at 9% and equity of ₹ 55,00,000. You are required to INTERPRET: (i) The firm’s ROI? (ii) Does it have favourable financial leverage?
(iii) If the firm belongs to an industry whose capital turnover is 3, does it have a high or low capital turnover? (iv) The operating, financial and combined leverages of the firm? (v) If the sales is increased by 10% by what percentage EBIT will increase? (vi) At what level of sales the EBT of the firm will be equal to zero?
(vii) If EBIT increases by 20%, by what percentage EBT will increase?
Illustration (Q4 May 2019)
The capital structure of the Shiva Ltd. consists of;
Equity share capital of Rs. 20,00,000 (Share of Rs.100 per value)
Rs. 20,00,000 of 10% Debentures
Sales increased by 20% from 2,00,000 units to 2,40,000 units
Selling price Rs. 10 per unit
Variable costs Rs. 6 per unit
Fixed expenses Rs. 4,00,000
The income tax rate is assumed to be 50%.
a. You are required to calculate the following: I. The percentage increase in earnings per share; II. Financial leverage at 2,00,000 units and 2,40,000 units.

Financial Management www.IndigoLearn.com 134
III. Operating leverage at 2,00,000 units and 2,40,000 units. b. Comment on the behaviour of operating and Financial leverages in relation to increase in production from 2,00,000 units to 2,40,000 units.
Illustration (Q4 RTP Nov 2019-New)
The following summarises the percentage changes in operating income, percentage changes in revenues, and betas for four listed firms.
Firm Change in revenue
Change in operating income
Beta
A Ltd.
35% 22% 1.00
B Ltd.
24% 35% 1.65
C Ltd.
29% 26% 1.15
D Ltd.
32% 30% 1.20
Required: (i) Calculate the degree of operating leverage for each of these firms. Comment
also. (ii) Use the operating leverage to explain why these firms have different beta.
Illustration (May 2018 Old)
Following are the selected financial information of A Ltd. and B Ltd. for the year ended March 31, 2018:
A Ltd B Ltd
Variable cost ratio 60% 50%
Interest ₹ 20,000 ₹ 1,00,000
Operating Leverage 5 2
Financial Leverage 3 2
Tax Rate 30% 30%
You are required to find out
(i) EBIT (ii) Sales (iii) Fixed Cost (iv) Identify the company which is better placed with reasons based on leverages.
Illustration
The following particulars relating to Navya Ltd. for the year ended 31st March 2021 is given:
Output 1,00,000 units at normal capacity
Selling price per unit ₹ 40

Financial Management www.IndigoLearn.com 135
Variable cost per unit ₹ 20
Fixed cost ₹ 10,00,000
The capital structure of the company as on 31st March, 2021 is as follows:
Particulars ₹
Equity share capital 10,00,000
Reserves and Surplus 5,00,000
7% Debentures 10,00,000
Current Liabilities 5,00,000
Total 30,00,000
Navya Ltd. has decided to undertake an expansion project to use the market potential, that will involve ₹ 10 lakhs. The
company expects an increase in output by 50%. Fixed cost will be increased by ₹ 5,00,000 and variable cost per unit
will be decreased by 10%. The additional output can be sold at the existing selling price without any adverse impact
on the market.
The following alternative schemes for financing the proposed expansion programme are planned:
(i) Entirely by equity shares of ₹ 10 each at par. (ii) ₹ 5 lakh by issue of equity shares of ₹ 10 each and the balance by issue of 6% debentures of ₹ 00
each at par. (iii) Entirely by 6% debentures of ₹ 100 each at par.
FIND out which of the above-mentioned alternatives would you recommend for Navya Ltd. with reference to the risk
and return involved, assuming a corporate tax of 40%.
Illustration
The following information is related to Yizi Company Ltd. for the year ended 31st March, 2021:
Equity share capital (of ₹ 10 each) ₹ 50 lakhs
12% Bonds of ₹1,000 each ₹ 37 lakhs
Sales ₹ 84 lakhs
Fixed cost (excluding interest) ₹ 6.96 Lakhs
Financial leverage 1.49
Profit-volume Ratio 27.55%
Income tax applicable 40%

Financial Management www.IndigoLearn.com 136
You are required to calculate
(i) Operating Leverage
(ii) Combined Leverage
(iii) Earnings per share
Show calculations up to two decimal points.
Illustration
Following are the selected financial year information of A Ltd. And B Ltd. For the year ended 31st March 2021
A Ltd. B. Ltd
Variable Cost Ratio 60% 50%
Interest ₹ 20,000 ₹ 1,00,000
Operating Leverage 5 2
Financial Leverage 3 2
Tax Rate 30% 30%
You are required to FIND out:
(i) EBIT
(ii) Sales
(iii) Fixed Cost
(iv) Identify the company which is better placed with reasons based on leverages.
Illustration
You are given the following information of 5 firms of the same industry
Name of the firm
Change in revenue Change in operating income
Change in Earning per share
M 28% 26% 32%
N 27% 34% 26%
P 25% 38% 23%
Q 23% 43% 27%
R 25% 40% 28%
You are required to calculate for all firms
1. Degree of operating leverage
2. Degree of combined leverage

Financial Management www.IndigoLearn.com 137
TIME VALUE OF MONEY
The time value of money is a basic financial concept Time Value of money => Value of money over a period of time
It is based on the principle that
Present value of money is worth > same sum of money to be received in the future. As money that you have right now can be invested and earn a return, thus creating a larger amount of money in the future.
FUTURE VALUE (FV) OF SINGLE CASH FLOW
Where: FV = the future value of money PV = the present value r = rate of compounding per period n = the number of compounding periods of interest per year In other terms, FV = PV x FVIF FVIF = Future Value Interest Factor
Note: FV is directly proportional to number of compoundings
PRESENT VALUE (PV) OF SINGLE CASH FLOW
Where: PV = the present value

Financial Management www.IndigoLearn.com 138
FV = the future value of money r = rate of discounting per period n = the number of discountings periods of interest per year In other terms, PV = FV x PVIF Where: PVIF = Present Value Interest Factor
EFFECTIVE ANNUAL INTEREST RATE (EAIR)
FUTURE VALUE OF SERIES OF CASH FLOWS
Series of Cash flows can be (I) Irregular – Cash flows across all periods are not of same amounts (ii) Regular - Cash flows across all periods are of same amounts, they are called Annuity Cash Flows
Where: FV = the future value of cash flows CF = cash flows (Annuity) r = rate of compounding per period n = the number of compounding periods of interest per year Alternately FV = CF x FVAF Where FVAF – Future Value Annuity Factor
PRESENT VALUE OF SERIES OF CASH FLOWS

Financial Management www.IndigoLearn.com 139
Where: PV = the present value of cash flows CF = cash flows (Annuity) r = rate of compounding per period n = the number of compounding periods of interest per year Alternately PV = CF x PVAF Where PVAF – Present Value Annuity Factor
ILLUSTRATIONS Illustration 1 [FV single cash flow] Rs. 2,000 is invested at annual rate of interest of 10%. What is the amount after two years if compounding is done (a) Annually (b) Semi-annually (c) Monthly Illustration 2 [PV Single Cash Flow] Rs. 20,000 is future value and annual rate of interest of 16%. What is the present value if compounding is done for two years: (a) Annually (b) Half-yearly (c) Quarterly Illustration 3 [FV of Annuity Part 1] Annual Investments planned - Rs.1 lakhs for 5 years Rate of interest – 12% p.a. What is the Future value? Illustration 4 [FV of Annuity – Part 2] Given, Future Expenses to be funded after 10 yrs – Rs. 10 lakhs Rate of interest – 12% No. Of years – 10 yrs What is the amount to be invested today? Illustration 5 [PV of series of Cash Flows – Part 2] Cash Flows – Rs.1,00,000 Tenure – 5 yrs Rate of interest – 14% Compounding – Annually What is the present value?

Financial Management www.IndigoLearn.com 140
INVESTMENT DECISIONS
MEANING AND SIGNIFICANCE OF CAPITAL BUDGETING
• Capital budgeting refers to the long-term planning of expenditure whose returns stretch themselves over future period.
• It is the process of deciding whether or not to commit resources to a project whose benefits would be spread over several time periods.
• It considers proposed capital outlay and its financing. Thus, it includes both raising of long-term funds as well as their utilisation.
• The exercise involved in capital budgeting is to co-relate the benefits to costs in some reasonable manner which would be consistent with the profit maximising objectives of the business.
• It is a managerial decision, as it involves high estimation and predictions, which requires high order of intellectual ability.
• It includes searching for new and more profitable investment proposals, investigation, engineering and marketing considerations to predict the consequences of accepting the investment and making economic analysis to determine the profit potential of each investment proposal.
IMPORTANCE OF CAPITAL BUDGETING DECISIONS
Capital Budgeting decisions should be taken after careful analysis and review. The importance of Capital Budgeting can be understood from the following points:
a. Investment Cost: Initial Investment is substantial. Hence commitment of resources should be made properly.
b. Time: The effect of decision is known only in the near future and not immediately.
c. Irreversibility: Decisions are irreversible, and commitment should be made on proper evaluation. For example, plant and machinery purchased for a textile mill project cannot be used for any other purpose, say, refining of crude oil.
d. Complexity: Decisions are based on forecasting of future events and inflows. Quantification of future events involves application of statistical and probabilistic techniques. Careful judgement and application of mind is necessary.
e. Risk and Uncertainty involved in appraisal: Evaluation of capital expenditure proposal involves projections of the future. Future is always uncertain. Nobody can say with certainty about the quantum and frequency of the future cash flows. There are too many unknown and uncertain factors which influence cash flow and therefore, it is important to recognise that each cash inflow or outflow, as only a probable figure. Risk and return have a direct relationship. Higher the risk of the project, higher would be the return normally & vice versa. It is, therefore, necessary that capital budgeting exercise should attempt to optimise both the return and risk factors.
BASIC FINANCIAL FACTORS USED IN PROJECT EVALUATION
The following basic financial factors are used in project evaluation techniques:

Financial Management www.IndigoLearn.com 141
a. Initial Investment: This equals the cash outflow at the initial stage, net of salvage value of old machinery if any. Initial Investment = Cost of New Asset purchased Less Sale Value of old assets if any.
It considers the following factors:
• Cost of purchase of land, building, plant etc.
• Increase in level of working capital
• Salvage value from old assets (in case of replacement) or write off of assets not fully depreciated
• Cost of installation and other incidental costs
• Opportunity cost of using existing resources
• Tax impact on sale of old assets (in case of replacement)
• Sunk costs should NOT be considered (e.g. Research cost).
b. Cash Flow After Taxes (CFAT) : This equals the cash inflows generated by the projects at various points of time. Generally, CFAT = PAT (Profit After Tax) + Depreciation and other amortizations.
The following principles should be kept in mind while estimating cash flows –
• Decisions are based on cash flows and NOT accounting income.
• Cash flows are based on opportunity costs. Example – loss of lease rental if own building is used.
• Cash flows are analysed on after-tax basis.
• Include all incidental costs and benefits resulting from the adoption of the proposed projects.
• The estimates may also be on an incremental basis i.e. with and without projects (in case of replacement).
• Indirect costs and benefits can be considered to the extent appropriate to the decision-making unit. Example – Diet Coke affecting the sale of normal Coke.
• Ignore existing allocated overheads. Example - Allocated Head office expenses.
• Consider incremental overhead, if any. Example – increase in supervisor’s salary.
COMPONENTS RELEVANT AND IRRELEVANT CASHFLOWS
S.no. Term Relevancy
1 Future cashflow Yes
2 Common cashflows No
3 Past cashflow (Historical cost of machine already purchased) No
4 Sunk cost e.g. Research expenses No
5 Apportioned overheads No
6. Specific extra overheads Yes
7. Opportunity cost Yes
8. Side effects (sale of RIN supreme may affect Rin Shakti) Yes
9 Working capital additional requirement Yes
HOW TO CALCULATE CFAT?

Financial Management www.IndigoLearn.com 142
Particulars Rs
Sales XXX
Less: Expenses (XXX)
CFBDT XXX
Less: Depreciation (XXX)
PBT XXX
Tax @ 30% XXX
PAT XXX
Add back: Depreciation XXX
CFAT XXX
c. Project Life :
1. The time period during which the project generates positive Cash Flow After Taxes is called Project Life. 2. Project life may be finite or infinite.
d. Terminal Inflows :
1. Amount expected to be realised at the end of project life. 2. If nothing is mentioned in the problem, assume working capital will be recovered in full. 3. Salvage value of fixed assets should be adjusted for tax in the following manner:
However, if block of assets continues even after the sale of fixed assets, ignore tax on sale of fixed assets.
e. Time Value of Money : The value of money differs at different points of time. So the present value of further cash flows will be computed by discounting the same at the appropriate discount rate.
f. Discount Rate :
1. It represents the cut-off rate for capital investment evaluation.
Net /Total Sale value of fixed
asset
Sale value > Book value
Tax on gain
= profit x tax rate
Net Inflow =
Sale value - tax on gain
Sale value = Book value
No gain / loss
Inflow = Sale value
Sale value < Book value
Tax saving on loss
= loss x tax rate
Total Inflow = Sale value + tax
saving on loss

Financial Management www.IndigoLearn.com 143
2. A project which does not earn at least the cut-off rate should not be accepted. 3. Generally, the rate used for discounting is the Weighted Average Cost of Capital of
the enterprise. 4. Discount rate should reflect opportunity cost of fund. 5. Riskiness of the Project – higher the risk, higher the discount rate. 6. Inflation – higher the inflation, higher the discount rate.
g. PV Factor and Annuity Factor Tables : For the purpose of discounting future cash flows, the PV factor (Present Value Factor) and Annuity Factor tables are used. The utility of tables is as under :
➢ In case of uniform Cash Flows during the project life : Annuity Factor at the end of the project life.
➢ In case of differential Cash Flows during the project life : PV Factors for each year.
NOTE ON TAX SHIELD OR TAX SHELTER ON LOSS
• When a company incurs a loss on a project, it goes to reduce the taxable profits of the company either in that year or of any subsequent year during which loss is set-off. It is called tax shield on loss
• Tax shield = loss adjusted x tax rate.
NOTE ON DEPRECIATION
i. Depreciation is NOT an item of cashflow; hence it is not considered in cashflow analysis. ii. However, Depreciation is relevant in capital budgeting on account of depreciation tax
shield. Tax shield on depreciation is an item of cash inflow and hence must be recognized. iii. If in the question, tax is not applicable, depreciation is irrelevant. iv. Depreciation should be computed as per Tax Laws and not as per books of accounts. v. If tax rate both as per books of accounts and as per tax laws are given, use tax rate as
per tax laws. vi. Depreciation is charged by the owner of the asset for tax purpose
vii. Depreciation Tax shield = Depreciation x tax rate.
NOTE ON CASH VERSUS ACCRUAL BASIS • First, Compute tax expense on accrual basis.
• Then, Compute CFAT on cash basis.
ESTIMATION OF FUTURE CASH FLOW:
It is very essential to have data regarding the cash flows from the project to use any technique of financial evaluation. This implies that costs of operation and returns from the project for a considerable period in future should be estimated. However, future is uncertain, and estimation of cash flows can, at best, be a probability.
Steps in developing relevant information for cash flow analysis –
a. Estimation of costs – It requires data regarding cost of new equipment, cost of removal and disposal of old equipment less scrap value, cost of preparing the site and mounting the new equipment, cost of ancillary services, etc. The basis of estimation of these costs would

Financial Management www.IndigoLearn.com 144
be capital expenditure budget and payment pattern associated with capital equipment purchases.
b. Estimation of additional working capital requirement – Every capital project involves additional working capital to finance the increase in level of activity. The increase in the working capital requirement arises due to the need for maintaining higher sundry debtors, stock-in-hand, prepaid expenses, etc.
c. Estimation of production and sales – The cash flows are highly dependent upon the estimate of sales and production levels. On the basis of the additional production units that can be sold and the price at which they can be sold, the gross revenue from a project can be worked out.
d. Estimation of cash expenses – It involves estimation of wage and salaries, manufacturing expenses, general administration and selling expenses, etc.
e. Working out cash inflows – Cash inflow would be revenue minus cash expenses and liability for taxation.
Note – If the discounting rate (if DCF technique is used) is itself based on the cost of capital, there should not be any deduction for interest on long term funds and dividends to equity or preference shareholders while working out the cash inflows.
Methods of ranking investment proposals:
There are several methods / techniques for evaluation and ranking of the capital investment proposals. In all these methods, the main emphasis is the return which will be derived on the capital investment in the project.
Capital budgeting techniques
Traditional or Non –
Time adjusted
Modern or Time-adjusted
Discounted Cash Flows
Payback Period
Discounted Payback
Period
Net Present Value
Profitability Index
Internal Rate of
Return
Modified Internal Rate
of Return
Discounted
Equivalent
Annualized
Reciprocal Payback
Period
Accounting Rate of
Return

Financial Management www.IndigoLearn.com 145
Payback period
Payback period refers to the Period within which, the project will be able to Payback (recover/generate) the initial investment. Initial investment In case of Even annual CFAT, Payback period = Annual Cash inflow Annual cash flows = Estimated cash inflow resulting from the proposed investment (i.e. CFAT)
PROCEDURE FOR CALCULATION OF PAY BACK PERIOD – FOR UNEVEN CASH FLOWS
Step Procedure
1 Determine the total outflow of the project. (Initial Investment)
2 Determine the cash inflow after taxes (CFAT) for each year.
3 Determine the cumulative CFAT at the end of every year.
4 Determine the year in which cumulative CFAT exceeds Initial Investment, say ‘n’
5 Payback period = ‘n-1’year + Amount Recoverable in ‘n’ to meet Initial Investment CF in year n
ACCEPT OR REJECT CRITERION:
The payback period can also be used in case of independent projects. The projects are then arranged in ascending order according to the length of their pay back periods. It may be said that pay-back period is measure of liquidity of investments rather than their profitability. It should more appropriately be treated as a constraint to be satisfied rather than as a profitability measure to be maximised.
S.No. Particulars Decision
A Payback period < cut-off period predetermined by management
Accept
B Payback period > cut-off period predetermined by management
Reject
C Payback period = cut-off period predetermined by management
Indifferent
MERITS / ADVANTAGES:
1. This method is simple to understand and easy to operate.
2. When funds are limited, projects having shorter payback periods should be selected, since they can be rotated a greater number of times.
3. This method is suitable in the case of industries where the risk of technological obsolescence is very high and hence only those projects which have a shorter payback period should be financed.
4. This method focuses on projects which generates cash inflows in earlier years, thereby eliminating projects bringing cash inflows in later years. As time period of cash flows increases, risk and uncertainty also increase. Thus, payback period is useful during risk and uncertainty.

Financial Management www.IndigoLearn.com 146
5. This method promotes liquidity by stressing on projects with earlier cash inflows. This is a very useful evaluation tool in case of liquidity or cash crunch and high cost of capital.
6. The payback period can be compared to a break-even point, the point at which the costs are fully recovered but profits are yet to commence.
7. It clarifies the concept of profit or surplus. Surplus arises only if the initial investment is fully recovered. Hence, there is no profit on any project unless the payback period is over
.
DEMERITS / LIMITATIONS :
1. It stresses on capital recovery rather than profitability.
2. It does not consider the post-payback cash flows, i.e. returns from the project after its payback period. Hence, it is not a good measure to evaluate where the comparison is between two projects, one involving a long gestation period and the other yield quick results but only for a short period.
3. This method becomes an inadequate measure of evaluating two projects where the cash inflows are uneven. There may be projects with heavy initial inflows and very less inflows in later years. Other projects with moderately higher but uniform CFAT may be rejected because of longer payback.
4. This method ignores the time value of money. Cash flows occurring at all points of time are treated equally. This goes against the basic principle of financial analysis which stipulates compounding or discounting of cash flows when they arise at different points of time.
Discounted payback period
When the payback period is computed after discounting the cash flows by a predetermined rate, it is called as the ‘Discounted payback period’. It is computed as under:
Step Procedure
1 Determine the total outflow of the project. (Initial Investment)
2 Determine the cash inflow after taxes (CFAT) for each year.
3 Determine the PV factor for each year and compute Discounted CFAT (DCFAT) for each year.
4 Determine the cumulative DCFAT at the end of every year.
5 Determine the year (say ‘n’) in which cumulative DCFAT exceeds Initial Investment.
6 Discounted Payback period
= ‘n-1’year + Discounted CF Recoverable in ‘n’ to meet Initial Investment Discounted CF in year n
Accept if Discounted Payback Period less than maximum / benchmark period; else reject the project. The following vertical format may be adopted for presentation of the answer:
Year CFAT PV Factor DCF = CFAT X PV factor
Cumulative DCF
1
2
3

Financial Management www.IndigoLearn.com 147
DISCOUNTED PAYBACK PERIOD: MERITS / DEMERITS
• All merits and demerits are similar to Payback period method.
• However, this method considers time value of money.
Payback reciprocal:
➢ It indicates the percentage of Capital Recovery p.a. ➢ It is a reciprocal of payback period. ➢ It is calculated as follows:
Annual Cash Inflow PB Reciprocal = Initial Investment
Payback Reciprocal method does not indicate any cut off period for the purpose of investment decision.
Accounting or average rate of return (arr)
According to this method, the capital investment proposals are judged on the basis of their relative profitability. For this purpose, capital employed and expected net income are determined according to commonly accepted accounting principles and practices over the entire economic life of the project and then the average yield is calculated. Such a rate is termed as Accounting Rate of Return. It may be calculated, according to, either of the following formulae –
Average annual net earnings i. x 100 Original investment Average Annual net earnings ii. x 100 Average Investment
The term “Average annual net earnings” is the average of the earnings (after depreciation and tax) over the whole of the economic life. One may calculate “Average annual net earnings” before tax. Such rate is known as pre-tax accounting rate of return.
The amount of “Average Annual Net Earnings” is calculated as follows: Total Annual Net Earnings – Initial Cost Economic Life of the Project
The amount of “Average Investment” is calculated as follows: Original investment – Scrap value + Additional Net Working Capital + Scrap Value 2

Financial Management www.IndigoLearn.com 148
ACCEPT / REJECT CRITERION:
Any project expected to give a return below minimum desired rate of return will be straightway rejected. In case of several projects, where a choice has to be made, the different projects may be ranked in the descending order on the basis of their rate of return.
MERITS:
1. The method is superior to pay-back period as it considers savings over the entire economic life, even though estimates of distant future may be subject to wide margin of errors.
2. The projects differing widely in character can be compared properly.
3. The method embodies the concept of ‘Net earnings’ after allowing for depreciation as it is of vital importance in the appraisal of a proposal.
DEMERITS:
1. The method suffers from the fundamental weakness as that of pay-back method i.e. it ignores the fact that receipts occur at different time intervals i.e. it ignores time value of money. If earnings from different investments accrue at the same time, this method can be safely used.
2. The method has different variants, each of which emerge different rate of return for one proposal. This situation arises due to diverse concept of investments as well as earnings.
3. Some analysts are of the opinion that as the, method takes into account earnings after depreciation, it is gross error because it is only the cash flows, that are relevant for the decision-making purpose.
DISCOUNTED CASH FLOW (DCF) METHODS:
An investment is an essential outlay of funds in anticipation of future returns. The presence of time as a factor in investment is fundamental rather than incidental to the purpose of evaluation of investments. Time is always crucial for the investor, so that a sum received today is worth more than the same sum to be received tomorrow. Thus, in evaluating investment projects, it is important to consider the timings of return on investments.
ASSUMPTIONS OF DISCOUNTING TABLE: 111111
1. Opportunity for investment is available at any time for any amount.
2. Interest will accrue at the same rate.
3. Interest will be received at the end of the year.
4. Interest will be reinvested at the same opportunity rate.
NET PRESENT VALUE METHOD: The net present value is the difference between present value of benefits and present value of costs.
NPV = PV of cash inflows – PV of cash outflows = PVCI - PVCO
PROCEDURE FOR COMPUTATION OF NPV:
• Step 1: Compute initial cash flow. • Capital expenditure. • Working capital
• Step 2: Compute in-between cash flows after-tax. • Step 3: Compute terminal inflow

Financial Management www.IndigoLearn.com 149
Amount expected to be realised at the end of Project’s Life. It will include net salvage value of capital assets and recovery of working capital.
• Step 4: calculate NPV.
Cash Outflows: Generally, Cash Outflows consist of (a) Initial investment which occurs at Time “0” and (b) Special Payments and outflows e.g. Working Capital outflow which arises in the year of commercial production, Tax paid on Capital Gain made by sale of old asset, if any.
Cash Inflows: Cash Inflows = CFAT = PAT + Depreciation. Also, specific cash inflows like salvage value of new assets and recovery of working capital at the end of the project, tax implication due to sale of old asset, should be carefully considered. The general assumption is that all cash inflows occur at the end of each year.
Discounting cash inflows and outflows: Each item of cash inflow and outflow is discounted to ascertain its present value. For this purpose, the discounting rate is generally taken as the Cost of Capital since the project must earn at least what is paid out on the funds blocked in the project. The Present Value tables are used to calculate the present value of various cash flows.
Note: The NPV method will give valid results only if money can be immediately reinvested at a rate of return equal to the firm’s cost of capital.
Relationship between NPV and Discount Rate
NPV
Discount Rate
ACCEPT OR REJECT CRITERION:
S.No. Particulars Decision
A NPV > Zero Accept
B NPV < Zero Reject
C NPV = Zero Indifferent
MERITS:
1. It considers the time value of money.
2. Unlike payback period, all cash flows are considered.
3. NPV constitutes addition to the wealth of shareholders and thus focuses on the basic objective of financial management.
4. Since all cash flows are converted into present value (current rupees), different projects can be compared on NPV basis.
5. NPV of two or more projects can be added.
6. Risk can be incorporated in capital budgeting decision by adjusting the discount rate.

Financial Management www.IndigoLearn.com 150
DEMERITS:
1. It involves complex calculations.
2. It involves forecasting cash flows and application of discount rate. Thus, accuracy of NPV depends on accurate estimation of these two factors which may be quite difficult in practice.
3. NPV and ranking of project may differ at different discount rates, causing inconsistency in decision making.
4. It ignores the difference in initial outflows or size of different proposals & Pattern of cash flows, while evaluating mutually exclusive projects.
5. NPV method may not be useful if the lives of two projects are different.
PROFITABILITY INDEX / DESIRABILITY FACTOR: (ALSO CALLED BENEFIT – COST RATIO) If the present value method is used, the present value of the earnings of one project cannot be compared directly with the present value of earnings of another, unless the investments are of the same size. In order to compare proposals of different size, the flows to investment must be related. This is done by dividing the present value of earnings by the amount of investment, to give a ratio i.e. called the profitability index / ratio or desirability factor.
Profitability Index = OutflowCashDiscounted
InflowCashDiscounted = OutflowCashofPV
InflowCashofPV
Higher the index number, the better the project. This is called benefit cost ratio.
ACCEPT / REJECT CRITERION –
S.No. Particulars Decision
A PI > 1 Accept
B PI < 1 Reject
C PI = 1 Neutral
CLASSIFICATION OF PROPOSALS
CAPITAL RATIONING
Independent proposals:
These are the proposals, which do not compete with one another. In case of such proposals the firm may straightway accept or reject on the basis of a minimum return on investment required.
Contingent or dependent proposals:
These are the proposals; whose acceptance depends on the acceptance of one or more other proposal. When a contingent investment proposal is made, it should also contain the proposal on which it is dependent in order to have better perspective of the situation.
Mutually Exclusive Proposals:
These are proposals which compete with each other. In a way, the acceptance of one precludes the acceptance of other or others. Thus, in case of two or more mutually exclusive proposals, only one of the proposals can be accepted.

Financial Management www.IndigoLearn.com 151
A firm normally fixes up maximum amount that can be invested in capital projects during a given period of time. The firm then attempts to select a combination of investment proposals, that will within the specific limits provide maximum profitability and put them in descending order according to their rate of return. Such a situation is called ‘Capital Rationing’. The situation may arise due to –
- Financing capital expenditure only by way of retained earnings. - Allocation of specified departmental limits. - Restricted availability of own funds and thereby restrictions on borrowings.
Classification of Investment Proposals - For Capital Rationing purpose:
Nature of Project
Divisible Indivisible
Meaning Partial Investment is possible and proportionate NPV can be generated.
Investment should be made in full. Partial or Proportionate investment is not possible.
Steps involved in Decision Making
Compute PI of various projects and rank them. Projects are selected in the order of Profitability Index Ranking, up to capital available.
Determine the combination of projects to utilise amount available. Compute NPV of each combination. Select the combination with maximum NPV.
NPV & PI – CO RELATION :
• Both NPV and PI techniques recognise Time value of money.
• The discount rate used in NPV and PI methods are the same. Hence, for one given project, NPV and PI method give the same result, i.e. Accept or Reject.
• If we have to select one project out of two mutually exclusive projects when there is no capital rationing, the NPV method should be preferred. This is because the NPV indicates the economic contribution or surplus of the project in absolute terms. The higher the NPV, the better it is.
• In capital rationing situations, PI is a better evaluation technique, when projects are divisible.
IMPORTANT POINTS 1. FOR A SINGLE PROJECT, TO SELECT OR REJECT, NPV METHOD AND PI METHOD WILL PROVIDE
CONSISTENT ANSWERS.
Situation Decision
NPV > Zero PI > 1 Accept
NPV < Zero PI < 1 Reject
NPV = Zero PI = 1 Neutral
2. FOR TWO PROJECTS, NPV METHOD AND PI METHOD MAY GIVE INCONSISTENT ANSWERS.
Project A Project B
NPV 100 90
PI 1.11 1.3
Note:
If there is no capital constraint, Project A will be better as NPV is more. But if there is a capital rationing problem, then project B may be chosen first as this has better PI. However, before finalising, investor should analyse the options chosen and ascertain that his NPV of investment as a whole is maximum in that selection made.

Financial Management www.IndigoLearn.com 152
Advantages of PI: 1. This method considers the time value of money. 2. It is a better project evaluation technique than NPV and helps in ranking projects where
NPV is positive. 3. It focuses on maximum return per rupee of investment and hence is useful in case of
investment in divisible projects, when funds are not fully available. 4. All cashflows are considered, including the weightage of Initial Outlay
Disadvantages of PI:
1. It fails as a guide in resolving capital rationing when projects are indivisible. i.e., once a single large project with high NPV is selected, possibility of accepting several small projects which together may have higher NPV than the single project is excluded.
2. Situations may arise where a project with a lower profitability index selected may generate cash flows in such a way that another project can be taken up one or two years later, the total NPV in such case being more than the one with a project with highest Profitability Index.
3. PI of two or more projects cannot be added.
INTERNAL RATE OF RETURN (IRR):
• IRR is that RATE of return earned, at which the sum of discounted cash inflows equals the Investment made (or the sum of discounted cash outflows)
• It is that rate of discount at which NPV = 0
• This rate is also called time – adjusted rate of return, DCF rate of return, yield rate, marginal efficiency of capital
• IRR is the rate at which returns are earned (cash inflows), upon making the investment in that project.
• IRR calculations are based upon the investment rate assumptions i.e. IRR method assume reinvestment at IRR
ACCEPT / REJECT CRITERION:
S.No. Particulars Decision
A IRR > Cut-off-rate Accept
B IRR < Cut-off-rate Reject
C IRR = Cut-off-rate Neutral
ADVANTAGES:
a. Time value of money is considered.
b. All cash inflows of the project, arising at different points of time are considered.
c. Decisions are immediately taken by comparing IRR with the cost of capital.
d. It helps in achieving the basic objective of maximisation of shareholders wealth (since CFATs are taken).
DISADVANTAGES
a. It is tedious to compute in case of multiple cash outflows.
b. It does not have the property of additivity, i.e., IRR of two or more projects can NOT be added.
c. It may conflict with NPV in case inflow / outflow patterns are different in alternative proposals.

Financial Management www.IndigoLearn.com 153
d. The presumption that all the future cash inflows of a proposal are reinvested at a rate equal to the IRR may not be practically valid.
e. Multiple IRR’s may result, leading to difficulty in interpretation.
f. If cash flows have multiple cash outflows, IRR may be indeterminate, I.E., NO IRR
NOTE: The reciprocal of payback is a close approximation of the internal rate of return, if the life of the project is at least twice the payback period and project generate equal amount of the annual cash inflows Example: A project with an initial investment of Rs. 50 lakhs and life of 10 years generates CFAT of Rs. 10 lakhs per annum. Its payback reciprocal will be Rs. 10 lakhs / Rs. 50 lakhs = 20%.
NPV V/S IRR : Higher the NPV, higher will be the IRR. However, NPV and IRR may give conflicting results in certain cases particularly when:
➢ Cash Outflows arise at different points of time, rather than as Initial Investment only – Timing of OUT flows
➢ There is a huge difference between initial CFAT and later years CFAT – Pattern of cash IN flows
➢ Initial investment Disparity – Different project sizes &
➢ Unequal Economic lives of the Projects – Difference in lives
A project with heavier initial CFAT that compared to later years will have higher IRR and vice-versa. The NPV method considers the timing differences at the appropriate discount rate.
Defects in IRR &Superiority of NPV:
1. The presumption in IRR is that intermediate cash inflows will be reinvested at that rate (IRR); whereas in the case of NPV method, intermediate cash inflows are presumed to be reinvested at the cut-off rate. The latter presumption viz. Reinvestment at the Cut-ff Rate, is more realistic than reinvestment at IRR.
2. There may be projects with negative IRR / Multiple IRRs etc if cash outflow arises at different points of time. This leads difficulty in interpretation. NPV does not pose such interpretation problems.
3. IRR is greatly affected by volatility in cashflow pattern.
Hence, in case of conflicting decisions based on NPV and IRR, the NPV method must prevail.
PROFITABILITY INDEX V/S IRR : Where the projects have equal lives but are of different sizes and have different cash flow patterns, an interesting controversy arises in the financial analysis relating to conflict in project ranking between the IRR and PI method.
Project ‘A’
Rs.
Project ‘B’
Rs.
Cost
Cash inflow 1 year
2 year
3 year
11,872
10,000
2,000
1,000
10,067
1,000
1,000
2,000

Financial Management www.IndigoLearn.com 154
4 year
IRR
Profitability Index
1,000
12%
1.053
10,000
10%
1.064
The profitability index is found better than the IRR for comparing two projects with different lives or with different patterns of cash flows as it is easier to calculate and since there is no trial and error element in computation.
IRR Method is more acceptable as the index is an abstract number that does not explain rate of return whereas IRR is like interest or earning rate quite familiar to the businessman.
EQUIVALENT ANNUALIZED NET BENEFIT / COST [EQUIVALENT ANNUAL CRITERION]
Equivalent Annualized Benefit Method is used to deal with Projects with different lives, as follows:
Project A Project B
NPV
PV Annuity factor
Equivalent Annualised Benefit (NPV / PVAF)
NPV Annualised net benefit = PV Annuity factor over the project life
If revenue (CFAT) information is not given, we select project on the basis of Equivalent Annualised COST Decision rule:
1. In benefit maximisation problem, select the option with higher EAB. 2. In cost minimisation problem, select the option with Lowest EAC.
Guiding principles under EAB / EAC
1. Assets can be repeated infinite times. If assets can’t be repeated more than once, decision should be based on NPV.
2. Cost and cash-flows will remain the same.
Social cost benefit analysis
,An increasing awareness in our society in recent times is that, business managers are made increasingly responsible for consequential social and environmental impact. Changing environment and social parameters have compelled them to revalue their social as well as economic obligations towards the needs of the society, since society provides the requisite working infrastructure and facilities. Hence, the organisation has to present the accounting system which will reflect the social and economic benefits created by it as well as the costs incurred, to appraise its contribution towards solving the problems of society.
‘Social Costs’ are sacrifices of the society for which the business firm is responsible. Ex: air pollution, water pollution, soil erosion, deforestation, production of dangerous products,

Financial Management www.IndigoLearn.com 155
explosives, etc. ‘Social benefits’ are the compensation made to the society in the form of increase in per capita income, employment opportunities, etc. Need for Social Cost Benefit Analysis (SCBA) – a. Market prices which are used to measure costs and benefits in project analysis do not
represent social value due to imperfections in market. b. Monetary cost and benefit analysis fail to consider the external effects of projects. c. Taxes and subsidies are monetary costs and gains, but these are only transfer payments
from social point of view and therefore irrelevant. d. It is essential for measuring the redistribution effects of benefits of a project as benefits
going to poorer section are more important than going to economically better off sections. Indicators of social desirability of a project – a. Employment potential – A project with high employment potential is considered highly
desirable. b. Value addition per unit of capital employed – A project with high value addition per unit
of capital employed is given priority. c. Foreign exchange earnings – A project with potential to earn foreign exchange to the
country or an import substitution project which saves the country’s foreign exchange reserves is highly desirable.
d. Social cost-benefit analysis – A project with net benefits to the society over the costs to the society is preferred.
ILLUSTRATIONS
llustration-1 (Relevant cash flows)
ABC Limited is evaluating the purchase of a new project with
• a depreciable base of Rs 1,00,000;
• expected economic life of 4 years and
• change in earnings before taxes and depreciation of o Rs 45,000 in year 1,
o Rs 30,000 in year 2,
o Rs 25,000 in year 3, and
o Rs 35,000 in year 4.
Assume straight-line depreciation and a 20% tax rate. You are required to compute the relevant
cash flows.
Illustration-2 (Payback period)
Suppose a project costs Rs. 20,00,000 and yields annually a profit of Rs. 3,00,000 after
depreciation @ 12½% (straight line method) but before tax @50%,
Compute the Payback Period.
Illustration-3 (Payback period-uneven cash flows)
Suppose XYZ Ltd. is analyzing a project requiring an initial cash outlay
of 2,00,000 and expected to generate cash inflows as follows:

Financial Management www.IndigoLearn.com 156
Year Annual cash Inflows
1 80,000
2 60,000
3 60,000
4 20,000
i. Find out Payback period.
ii. Suppose in above case, if the initial outlay had been Rs.2,05,000 ,what would be payback
period?
Illustration-4 (ARR)
Suppose Times Ltd. is going to invest in a project a sum of 3,00,000 having a life span of 3 years.
Salvage value of machine is 90,000. The profit before depreciation for each year is 1,50,000.
Compute Average ARR based on:
1. Annual basis,
2. Initial Investment,
3. Average Investment.
Illustration-5 (ARR)
A project requiring an investment of Rs.10,00,000 and it yields profit after tax and
depreciation which is as follows:
Years Profit after tax and
depreciation
1 50,000
2 75,000
3 1,25,000
4 1,30,000
5 80,000
Total 4,60,000
Suppose further that at the end of the 5th year, the plant and machinery of the project can be
sold for Rs. 80,000.
Determine Average Rate of Return.
Illustration-6 (NPV)
Compute the Net present value for a project with a net investment of Rs.1,00,000 and net cash
flows year one is Rs. 55,000; for year two is Rs. 80,000 and for year three is Rs.15,000. Further,
the company’s cost of capital is 10%.
Illustration-7 (NPV Different projects)

Financial Management www.IndigoLearn.com 157
ABC Ltd is a small company that is currently analyzing capital expenditure proposals for the
purchase of equipment; the company uses the net present value technique to evaluate
projects. The capital budget is limited to Rs.500,000 which ABC Ltd believes is the maximum
capital it can raise.
The initial investment and projected net cash flows for each project are shown below. The cost
of capital of ABC Ltd is 12%.
You are required to compute the NPV of the different projects.
Project
A
Project
B
Project
C
Project
D
Initial Investment 200,000 190,000 250,000 210,000
Project Cash
Inflows
Year 1 50,000 40,000 75,000 75,000
2 50,000 50,000 75,000 75,000
3 50,000 70,000 60,000 60,000
4 50,000 75,000 80,000 40,000
5 50,000 75,000 100,000 20,000
Illustration – 8 (Project evaluation using NPV)
Cello Limited is considering buying a new machine which would have a useful economic life of five
years, a cost of Rs. 1,25,000 and a scrap value of Rs. 30,000, with 80% of the cost being payable
at the start of the project and 20% at the end of the first year.
The machine would produce 50,000 units per annum of a new project with an estimated selling
price of Rs. 3 per unit. Direct costs would be Rs. 1.75 per unit and annual fixed costs, including
depreciation calculated on a straight- line basis, would be Rs. 40,000 per annum.
In the first year and the second year, special sales promotion expenditure, not included in the
above costs, would be incurred, amounting to Rs. 10,000 and Rs. 15,000 respectively.
Evaluate the project using the NPV method of investment appraisal, assuming the company’s Cost
of capital to be 10%.
Illustration – 9 (Profitability Index)
Suppose we have three projects involving discounted cash outflow of Rs.5,50,000, Rs.75,000 and
Rs.1,00,20,000 respectively. Suppose further that the sum of discounted cash inflows for these
projects are Rs.6,50,000, Rs.95,000 and Rs.1,00,30,000 respectively.
Calculate the desirability factors for the three projects.
Illustration – 10 (NPV & PI)

Financial Management www.IndigoLearn.com 158
A hospital is considering purchasing a diagnostic machine costing Rs.80,000. The projected life of
the machine is 8 years and has an expected salvage value of Rs.6,000 at the end of 8years.
The annual operating cost of the machine is Rs. 7,500. It is expected to generate revenues of Rs.
40,000 per year for eight years. Presently, the hospital is outsourcing the diagnostic work and is
earning commission income of Rs. 12,000 per annum; net of taxes.
Required:
Whether it would be profitable for the hospital to purchase the machine? (Tax @30%)
Give your recommendation under:
i. Net Present Value method
ii. Profitability Index method.
PV factors at 10% are given below:
Year
1
Year
2
Year 3 Year 4 Year 5 Year 6 Year 7 Year 8
0.909 0.826 0.751 0.683 0.621 0.564 0.513 0.467
Illustration – 11 (Mutually exclusive projects)
Elite Cooker Company is evaluating three investment situations:
1. produce a new line of aluminium skillets,
2. expand its existing cooker line to include several new sizes, and
3. develop a new, higher-quality line of cookers.
If only the project in question is undertaken, the expected present values and the amounts of
investment required are:
Project Investment
Required (Rs)
Present value of Future
Cash-Flows (Rs)
1 2,00,000 2,90,000
2 1,15,000 1,85,000
3 2,70,000 4,00,000
➢ If projects 1 & 2 are jointly undertaken, there will be no economies; the
investments required, and present values will simply be the sum of the parts.
➢ With projects 1 & 3 the economies are possible in investment because one of the machines
acquired can be used in both production processes. The total investment for the projects
1 & 3 combined would be Rs.4,40,000.
➢ If projects 2 & 3 are undertaken, there are economies to be achieved in marketing and
producing the products but not in investment. The expected present value of future cash
flows for the combination of projects 2 & 3 would be Rs. 6,20,000.
➢ If all three projects are undertaken simultaneously, the economies noted will still hold
good. However, a Rs.1,25,000 extension on the plant will be necessary, as space is
not sufficient for all the three projects.
Which project or projects should be chosen?

Financial Management www.IndigoLearn.com 159
Illustration 12 (Mutually exclusive projects)
Shiva Limited is planning its capital investment program for next year. It has five projects all of
which give a positive NPV at the company cut-off rate of 15 percent, the investment outflows and
present values being as follows
(Rs in ‘000)
Project Investment NPV @15%
A -50 15.4
B -40 18.7
C -25 10.1
D -30 11.2
E -35 19.3
The company is limited to a capital spending of Rs.1,20,000.
You are required to optimize the returns from a package of projects within the capital spending
limit.
a. If the projects are independent of each other and are divisible (i.e., part-project is possible)
b. What would be your answer if the projects are indivisible
c. Had the projects been Mutually Exclusive, which project would you select?
Illustration 13 (PBP,ARR,PI)
A Ltd. is considering the purchase of a machine which will perform some operations which are at
present performed by workers. Machines X and Y are alternative models.
The following details are available:
(Rs.)
Machine (X) Machine (Y)
Cost of Machine 1,50,000 2,40,000
Estimated life of machine 5 years 6 years
Estimated cost of maintenance p.a. 7,000 11,000
Estimated cost of indirect material p.a. 6,000 8,000
Estimated savings in scrap p.a. 10,000 15,000
Estimated cost of supervision p.a. 12,000 16,000
Estimated savings in wages p.a. 90,000 1,20,000
Depreciation will be charged on straight line basis. The tax rate is 30%.
Assuming cost of capital being 10%, evaluate the alternatives according to:
i. Pay Back period,
ii. Average rate of return method and
iii. Present value index method
(The present value of Rs. 1.00 @ 10% p.a. for 5 years is 3.79 and for 6 years is 4.354)
Illustration 14 (DPBP,NPV,PI)

Financial Management www.IndigoLearn.com 160
PQR Company Ltd. is considering selecting a machine out of two mutually exclusive machines.
The company’s cost of capital is 12 per cent and corporate tax rate is 30 per cent. Other
information relating to both machines is as follows:
Particulars Machine I Machine II
Cost of Machine Rs. 15,00,000 Rs. 20,00,000
Expected life 5 Yrs. 5 Yrs.
Annual Income (before tax and Depreciation) Rs 6,25,000 Rs. 8,75,000
Depreciation is to be charged on straight line basis: You are required to calculate:
i. Discounted Pay Back Period
ii. Net Present Value
iii. Profitability Index
Year 1 2 3 4 5
PV factor @ 12% 0.893 0.797 0.712 0.636 0.567
Illustration 15 (Replacement)
Lockwood Limited wants to replace its old machine with a new automatic machine. Two models
A and B are available at the same cost of Rs. 5 lakhs each. Salvage value of the old machine is Rs.
1 lakh. The utilities of the existing machine can be used if the company purchases A. Additional
cost of utilities to be purchased in that case are Rs. 1 lakh. If the company purchases B, then all
the existing utilities will have to be replaced with new utilities costing Rs. 2 lakhs. The salvage
value of the old utilities will be Rs. 0.20 lakhs. The earnings after taxation are expected to be:
Year
(cash in-flows of)
A Rs. B Rs. P.V.F @
15%
1 1,00,000 2,00,000 0.87
2 1,50,000 2,10,000 0.76
3 1,80,000 1,80,000 0.66
4 2,00,000 1,70,000 0.57
5 1,70,000 40,000 0.50
Salvage Value at the
end of Year 5
50,000 60,000
The targeted return on capital is 15%.
You are required to
i. Compute, for the two machines separately, net present value, discounted payback period
and desirability factor
ii. Advice which of the machines is to be selected
Illustration 16 (PBP vs DPBP)
Consider the following mutually exclusive projects:

Financial Management www.IndigoLearn.com 161
Cash flows (Rs.)
Projects C0 C1 C2 C3 C4
A
B
C
D
−10,000
−10,000
−3,500
−3,000
6,000
2,500
1,500
0
2,000
2,500
2,500
0
2,000
5,000
500
3,000
12,000
7,500
5,000
6,000
Required:
i. Calculate the payback period for each project.
ii. If the standard payback period is 2 years, which project will you select? Will your answer
differ, if standard payback period is 3 years?
iii. If the cost of capital is 10%, compute the discounted payback period for each project.
Which projects will you recommend, if standard discounted payback period is (i) 2 years;
(ii) 3 years?
iv. Compute NPV of each project. Which project will you recommend on the NPV criterion?
The cost of capital is 10%. What will be the appropriate choice criteria in this case?
The PV factors at 10% are:
Year 1 2 3 4
PV factor at 10% 0.9091 0.8264 0.7513 0.6830
Illustration 17 (Repair vs Replacement)
A company wants to invest in machinery that would cost Rs.50,000 at beginning of year 1.
It is estimated that the net cash inflows from operations will be Rs. 18,000 per annum for 3 years,
if the company opts to service a part of the machine at the end of year 1 at Rs. 10,000. In such a
case, the scrap value at the end of year 3 will be Rs. 12,500.
However, if the company decides not to service the part, then it will have to be replaced at the
end of year 2 at Rs. 15,400. But in this case, the machine will work for the 4th year also and get
operational cash inflow of Rs.18,000 for the 4th year. It will have to be scrapped at the end of
year 4 at Rs. 9,000.
Assuming cost of capital at 10% and ignoring taxes, will you recommend the purchase of this
machine based on the net present value of its cash flows?
If the supplier gives a discount of Rs.5,000 for purchase, what would be your decision?
(The present value factors at the end of years 0, 1, 2, 3, 4, 5 and 6 are 1, 0.9091, 0.8264, 0.7513,
0.6830, 0.6209 and 0.5644 respectively).

Financial Management www.IndigoLearn.com 162
Illustration 18 (Project evaluation)
X Ltd an existing profit-making company, is planning to introduce a new product with a projected
life of 8 years. Initial equipment cost will be Rs.120 lakhs and additional equipment costing Rs.10
lakhs will be needed at the beginning of third year.
At the end of the 8 years, the original equipment will have resale value equivalent to the cost of
removal, but the additional equipment would be sold for Rs. 1 lakh. Working capital of Rs.15 lakhs
will be needed.
The 100% capacity of the plant is of 4,00,000 units per annum, but the production and sales-
volume expected are as under:
Year Capacity in
percentage
1 20
2 30
3-5 75
6-8 50
• A sale price of Rs. 100 per unit with a profit volume ratio of 60% is likely to be obtained.
• Fixed operating cash cost are likely to be Rs.16 lakhs per annum.
• In addition to this the advertisement expenditure will have to be incurred as under:
Year 1 2 3-5 6-8
Expenditure in Rs. lakhs each year 30 15 10 4
• The company is subjected to 50% tax, straight–line method of depreciation (permissible for
tax purpose also) and taking 12% as appropriate after-tax cost of capital, should the project
be accepted?
Illustration 19 (IRR)
Calculate the internal rate of return of an investment of Rs.1,36,000 which yields the following
cash inflows:
Year Cash Inflows
Rs.
1 30,000
2 40,000
3 60,000
4 30,000
5 20,000
Illustration 20 (IRR)
A company proposes to install machine involving a capital cost of Rs. 3,60,000. The life of the
machine is 5 years and its salvage value at the end of the life is nil. The machine will produce

Financial Management www.IndigoLearn.com 163
the net operating income after depreciation of Rs. 68,000 per annum. The company's tax rate is
45%. If the Net Present Value Annuity factors for 5 years are as under:
Discounting rate (%) : 14 15 16 17 18
Cumulative factor : 3.43 3.35 3.27 3.20 3.13
Calculate the Internal Rate of Return of the proposal.
Illustration 21 (NPV,IRR,PBP)
Hind lever Company is considering a new product line to supplement its range line. It is
anticipated that the new product line will involve cash investments of Rs. 7,00,000 at time 0 and
Rs. 10,00,000 in year 1.
After-tax cash inflows of Rs. 2,50,000 are expected in year 2, Rs. 3,00,000 in year 3, Rs. 3,50,000
in year 4 and Rs. 4,00,000 each year thereafter through year 10. Although the product line might
be viable after year 10, the company prefers to be conservative and end all calculations at that
time. If the required rate of return is 15 per cent,
a. What is the NPV of the project? Is it acceptable?
b. What would be the case if the required rate of return were 10%?
c. What is its internal rate of return?
d. What is the project’s payback period?
Illustration 22 (ARR,NPV,IRR)
C Ltd. is considering investing in a project. The expected original investment in the project will
be Rs. 2,00,000, the life of project will be 5 year with no salvage value. The expected net cash
inflows after depreciation but before tax during the life of the project will be:
Year 1 2 3 4 5
Rs. 85,000 1,00,000 80,000 80,000 40,000
The project will be depreciated at the rate of 20% on original cost. The company is subjected to
30% tax rate.
Required:
i. Calculate Payback Period and Average Rate of Return (ARR)
ii. Calculate Net Present Value and Net Present Value Index, if cost of capital is 10%.
iii. Calculate Internal Rate of Return (IRR).
PVF Table
Year 10% 37% 38% 40%
1
2
3
.909
.826
.751
.730
.533
.389
.725
.525
.381
.714
.510
.364

Financial Management www.IndigoLearn.com 164
4
5
.683
.621
.284
.207
.276
.200
.260
.186
Illustration-23 9 (Comprehensive)
A Company is considering a proposal of installing a drying equipment. The equipment would
involve a Cash outlay of Rs. 6,00,000 and net Working Capital of Rs. 80,000. The expected life of
the project is 5 years without any salvage value. Assume that the company is allowed to charge
depreciation on straight-line basis for Income-tax purpose. The estimated before-tax cash inflows
are given below:
Before-tax Cash inflows (Rs. in ‘000)
Year 1 2 3 4 5
240 275 210 180 160
The applicable Income-tax rate to the Company is 35%. If the Company’s opportunity Cost of
Capital is 12%, calculate the equipment’s
i. Discounted Payback Period,
ii. Payback Period,
iii. Net Present Value and
iv. Internal Rate of Return.
The PV factors at 12%, 14% and 15% are:
Year 1 2 3 4 5
PV factor at 12%
PV factor at 14%
PV factor at 15%
0.8929
0.8772
0.8696
0.7972
0.7695
0.7561
0.7118
0.6750
0.6575
0.6355
0.5921
0.5718
0.5674
0.5194
0.4972
Illustration-24 (NPV vs IRR)
Suppose there are two Project A and Project B are under consideration. The cash flows associated
with these projects are as follows:
Year Project A Project B
0 (1,00,000) (3,00,000)
1 50,000 1,40,000
2 60,000 1,90,000
3 40,000 1,00,000
Assuming Cost of Capital equal to 10% which project should be accepted as per NPV Method and
IRR Method.
Illustration-25 (NPV vs IRR)

Financial Management www.IndigoLearn.com 165
Suppose ABC Ltd. is considering two Project X and Project Y for investment. The cash flows
associated with these projects are as follows:
Year Project X Project Y
0 (2,50,000) (3,00,000)
1 2,00,000 50,000
2 1,00,000 1,00,000
3 50,000 3,00,000
Assuming Cost of Capital be 10%, which project should be accepted as per NPV Method and IRR
Method.
Illustration-26 (NPV vs IRR)
Suppose MVA Ltd. is considering two Project A and Project B for investment. The cash flows
associated with these projects are as follows:
Year Project A
(In Rs.)
Project B
(In Rs.)
0 (5,00,000) (5,00,000)
1 7,50,000 2,00,000
2
2,00,000
3
7,00,000
Assuming Cost of Capital equal to 12%, which project should be accepted as per NPV Method and
IRR Method?
Illustration-27 (Rankings)
The cash flows of project C and D are reproduced below:
Cash Flow
Project C0 C1 C2 C3 NPV at 10% IRR
C
D
-Rs. 10,000
-Rs. 10,000
+ 2,000
+ 10,000
+
4,000
+
3,000
+ 12,000
+ 3,000
+ Rs. 4,139
+ Rs. 3,823
26.5%
37.6%
i. Why is there a conflict of rankings?
ii. Why should you recommend project C in spite of lower internal rate of return?
Illustration-28 (MIRR)
An investment of Rs.1,36,000 yields the following cash inflows (profits before depreciation but
after tax). Determine MIRR considering 8% cost of capital.

Financial Management www.IndigoLearn.com 166
Year Cash Inflows (in Rs)
1 30,000
2 40,000
3 60,000
4 30,000
5 20,000
Total 1,80,000
Illustration – 29 (Replacement chain)
R plc is considering modernizing its production facilities and it has two proposals under
consideration. The expected cash flows associated with these projects and their NPV as per
discounting rate of 12% and IRR is as follows:
Year
Cash Flow (in Rs.)
Project A Project B
0 (40,00,000) (20,00,000)
1 8,00,000 7,00,000
2 14,00,000 13,00,000
3 13,00,000 12,00,000
4 12,00,000
5 11,00,000
6 10,00,000
NPV@12% 6,49,094 5,15,488
IRR 17.47% 25.20%
Which project should R plc accept?
Illustration-30 (Mutually exclusive projects)
The cash flows of two mutually exclusive Projects are as under:
Project T0 T1 T2 T3 T4 T5 T6
P (40,000) 13,000 8,000 14,000 12,000 11,000 15,000
J (20,000) 7,000 13,000 12,000 - - -
Required:
i. Estimate the net present value (NPV) of the Project ‘P’ and ‘J’ using 15% as the hurdle
rate.
ii. Estimate the internal rate of return (IRR) of the Project ‘P’ and ‘J’.
iii. Why there is a conflict in the project choice by using NPV and IRR criterion?
iv. Which criteria you will use in such a situation? Estimate the value at that criterion. Make a
project choice.
The present value interest factor values at different rates of discount are as under:
Rate of
Discount
t0 t1 t2 t3 t4 t5 t6

Financial Management www.IndigoLearn.com 167
0.15
0.18
0.20
0.24
0.26
1.00
1.00
1.00
1.00
1.00
0.8696
0.8475
0.8333
0.8065
0.7937
0.7561
0.7182
0.6944
0.6504
0.6299
0.6575
0.6086
0.5787
0.5245
0.4999
0.5718
0.5158
0.4823
0.4230
0.3968
0.4972
0.4371
0.4019
0.3411
0.3149
0.4323
0.3704
0.3349
0.2751
0.2499
Illustration-31 (Equivalent Annualized Cost)
APZ Limited is considering selecting a machine between two machines 'A' and 'B'. The
two machines have identical capacity, do exactly the same job, but designed differently. Machine
'A' costs Rs.8,00,000, having useful life of three years. It costs Rs.1,30,000 per year to run. Machine
'B' is an economy model costing Rs.6,00,000, having useful life of two years. It costs Rs.2,50,000
per year to run.
The cash flows of machine 'A' and 'B' are real cash flows. The costs are forecasted in rupees of
constant purchasing power. Ignore taxes.
The opportunity cost of capital is 10%.
Year t1 t2 t3
PVIF10%, t 0.9091 0.8264 0.7513
PVAF10%,
2 =
1.7355
PVAF10%, 3=
2.4868
Which machine would you recommend the company to buy?
Illustration – 32 (Comprehensive)
Alpha Company is considering the following investment projects:
Projects Cash Flows (in Rs)
C0 C1 C2 C3
A -10,000 +10,000
B -10,000 +7,500 +7,500
C -10,000 +2,000 +4,000 +12,000
D -10,000 +10,000 +3,000 +3,000
a. Rank the projects according to each of the following methods: (i) Payback, (ii) ARR, (iii)
IRR and (iv) NPV, assuming discount rates of 10 and 30 per cent.
b. Assuming the projects are independent, which one should be accepted? If the projects
are mutually exclusive, which project is the best?

Financial Management www.IndigoLearn.com 168
Illustration-33 (Comprehensive)
The expected cash flows of three projects are given below. The cost of capital is 10 per cent.
a. Calculate the payback period, net present value, internal rate of return and accounting rate of
return of each project.
b. Show the rankings of the projects by each of the four methods.
Period Project
A (Rs)
Project
B (Rs)
Project
C (Rs)
0 (5,000) (5,000) (5,000)
1 900 700 2,000
2 900 800 2,000
3 900 900 2,000
4 900 1,000 1,000
5 900 1,100
6 900 1,200
7 900 1,300
8 900 1,400
9 900 1,500
10 900 1,600
Illustration – 34 (Missing Values)
Given below are the data on a capital project ‘M’:
Annual cost of
savings
Rs.
60,000
Useful Life 4 years
Internal rate of
return
15%
Profitability index 1.064
Salvage value 0
You are required to calculate for this project M:
i. Cost of project
ii. Payback period
iii. Cost of capital
iv. Net present value.
Given the following table of discount factors:
Year 15% 14% 13% 12%
1 0.869 0.877 0.885 0.893
2 0.756 0.769 0.783 0.797
3 0.658 0.675 0.693 0.712
4 0.572 0.592 0.613 0.636
Total 2.855 2.913 2.974 3.038
Illustration-35 (Replacement decision)

Financial Management www.IndigoLearn.com 169
WX Ltd. has a machine which has been in operation for 3 years. Its remaining estimated useful
life is 8 years with no salvage value in the end. Its current market value is Rs. 2,00,000. The
company is considering a proposal to purchase a new model of machine to replace the existing
machine.
The relevant information is as follows:
Existing Machine New Machine
Cost of machine
Estimated life
Salvage value
Annual output
Selling price per unit
Annual operating hours
Material cost per unit
Labour cost per hour
Indirect cash cost per annum
Rs. 3,30,000
11 years
Nil
30,000 units
Rs.15
3,000
Rs. 4
Rs.40
Rs.50,000
Rs.10,00,000
8 years
Rs. 40,000
75,000 units
Rs.15
3,000
Rs. 4
Rs. 70
Rs. 65,000
➢ The company follows the straight-line method of depreciation.
➢ The corporate tax rate is 30 per cent and WX Ltd. does not make any investment, if it yields
less than 12 per cent.
➢ Present value of annuity of Re. 1 at 12% rate of discount for 8 years is 4.968. Present value
of Re. 1 at 12% rate of discount, received at the end of 8th year is 0.404.
➢ Ignore capital gain tax.
Advise WX Ltd. whether the existing machine should be replaced or not.
Illustration-36 (Replacement decision)
ABC Company Ltd. has been producing a chemical product by using machine Z for the last two
years. Now the management of the company is thinking to replace this machine either by X or by
Y machine. The following details are furnished to you.
Z X Y
Book value (Rs.) 1,00,000 - -
Resale Value now (Rs.) 1,10,000 - -
Purchase Price (Rs.) - 1,80,000 2,00,000
Annual fixed costs (including
depreciation) (Rs.)
92,000 1,08,000 1,32,000
Variable running cost
(including labour) per unit (Rs.)
3 1.50 2.50
Production per hour (unit) 8 8 12
Further Details

Financial Management www.IndigoLearn.com 170
Selling price per unit
Cost of materials per unit
Annual operating hours
Rs. 20
Rs. 10
2,000
• Working life of each of the three machines (as from now) is 5 years
• Salvage value of machines Z is Rs. 10,000, X is Rs. 15,000 and Y is Rs.18,000
• The company charges depreciation using straight line method.
• It is anticipated that an additional cost of Rs. 8,000 per annum would be incurred on special
advertising to sell the extra output of machine Y.
• Assume tax rate of 50% and cost of capital 10%.
The Present value of Re.1 to be received at the end of the year at 10% is as under:
Year 1 1 2 3 4 5
Present
value
.909 .826 .751 .683 .621
Required
Using NPV method, you are required to analyse the feasibility of the proposal and make
recommendations.
Illustration-(Q5 RTP-Nov 2020)
Initial stock of materials required before commencement of the processing operations
is Rs. 60 lakh at the start of year 1. The stock levels of materials to be maintained at the end of
year 1, 2 and 3 will be Rs. 165 lakh and the stocks at the end of year 4 will be nil. The storage of
materials will utilize space which would otherwise have been rented out for Rs. 30 lakh per
annum. Labour costs include wages of 40 workers, whose transfer to this process will reduce idle
time payments of Rs. 45 lakh in the year - 1 and Rs. 30 lakh in the year - 2. Factory overheads
include apportionment of general factory overheads except to the extent of insurance charges
of Rs. 90 lakh per annum payable on this venture. The company’s tax rate is 30%.
Present value factors for four years are as under:
Year 1 2 3 4
PV factors @14% 0.877 0.769 0.674 0.592
Advise the management on the desirability of installing the machine for processing the waste. All calculations should form part of the answer.
Illustration-(Q 1(c) May-2019)
Kanoria Enterprises wishes to evaluate two mutually exclusive projects X and Y. The particulars are as under :

Financial Management www.IndigoLearn.com 171
Project X (`)
Project Y (`)
Initial Investment 1,20,000 1,20,000
Estimated cash inflows (per annum for 8 years)
Pessimistic 26,000 12,000
Most Likely 28,000 28,000
Optimistic 36,000 52,000
• The cut off rate is 14%. • The discount factor at 14% are :
Year 1 2 3 4 5 6 7 8 9
Discount factor
0.877 0.769 0.675 0.592 0.519 0.456 0.400 0.351 0.308
Advise management about the acceptability of projects X and Y.
Illustration-(Q4-May 2019)
AT Limited is considering three projects A, B and C. The cash flows associated with the projects are given below:
Project C0 C1 C2 C3 C4
A (10,000) 2,000 2,000 6,000 0
B (2,000) 0 2,000 4,000 6,000
C (10,000) 2,000 2,000 6,000 10,000
You are required to : a. Calculate the payback period of each of the three projects. b. If the cut-off period is two years, then which projects should be accepted? c. Projects with positive NPVs if the opportunity cost of capital is 10 percent. d. "Payback gives too much weight to cash flows that occur after the cut-off date". True or false? e. "If a firm used a single cut-off period for all projects, it is likely to accept too many short-lived projects." True or false?
P.V. Factor @ 10 %
Year 0 1 2 3 4 5
P.V. 1.000 0.909 0.826 0.751 0.683 0.621
Illustration-(Q4-May 2018)
A company is evaluating a project that requires
• initial investment of Rs. 60 lakhs in fixed assets and
• Rs. 12 lakhs towards additional working capital
• The project is expected to increase annual real cash inflow before taxes by Rs. 24,00,000 during its life.
• The fixed assets would have zero residual value at the end of life of 5 years.

Financial Management www.IndigoLearn.com 172
• The company follows straight line method of depreciation which is expected for tax purposes also.
• Inflation is expected to be 6% per year.
• For evaluating similar projects, the company uses discounting rate of 12% in real terms.
• Company's tax rate is 30%.
Advise whether the company should accept the project, by calculating NPV in real terms.
PVIF (12%, 5 years)
PVIF (6%, 5 years)
Year 1 0.893 Year 1 0.943
Year 2 0.797 Year 2 0.890
Year 3 0.712 Year 3 0.840
Year 4 0.636 Year 4 0.792
Year 5 0.567 Year 5 0.747
Illustration-(Q 5 RTP May-2018)
company has to make a choice between two projects namely A and B. • The initial capital outlay of two Projects are ₹ 1,35,000 and ₹ 2,40,000 respectively for A and B. • There will be no scrap value at the end of the life of both the projects. • The opportunity Cost of Capital of the company is 16%. • The annual incomes are as under:
Year Project A (₹) Project B (₹) Discounting factor @ 16%
1 - 60,000 0.862
2 30,000 84,000 0.743
3 1,32,000 96,000 0.641
4 84,000 1,02,000 0.552
5 84,000 90,000 0.476
Calculate for each project: i. Discounted payback period ii. Profitability index iii. Net present value
Decide which of these projects should be accepted?
Illustration-(Q 5 RTP Nov-2018)
• Shiv Limited is thinking of replacing its existing machine by a new machine which would cost ₹ 60 lakhs. • The company’s current production is 80,000 units, and is expected to increase to 1,00,000 units, if the new machine is bought, • The selling price of the product would remain unchanged at ₹ 200 per unit. • The following is the cost of producing one unit of product using both the existing and new machine :

Financial Management www.IndigoLearn.com 173
Unit cost (₹)
Existing Machine (80,000 units)
New Machine (1,00,000 units)
Difference
Materials 75.0 63.75 (11.25)
Wages & Salaries 51.25 37.50 (13.75)
Supervision 20.0 25.0 5.0
Repairs and Maintenance
11.25 7.50 (3.75)
Power and Fuel 15.50 14.25 (1.25)
Depreciation 0.25 5.0 4.75
Allocated Corporate Overheads
10.0 12.50 2.50
183.25 165.50 (17.75)
• The existing machine has an accounting book value of ₹ 1,00,000, and it has been fully depreciated for tax purpose. • It is estimated that machine will be useful for 5 years. • The supplier of the new machine has offered to accept the old machine for ₹ 2,50,000. • However, the market price of old machine today is ₹ 1,50,000 and it is expected to be ₹ 35,000 after 5 years. • The new machine has a life of 5 years and a salvage value of ₹ 2,50,000 at the end of its economic life. • Assume corporate Income tax rate at 40%, and depreciation is charged on straight line basis for Income-tax purposes. • Further assume that book profit is treated as ordinary income for tax purpose. • The opportunity cost of capital of the Company is 15%
Required: (i) ESTIMATE net present value of the replacement decision. (ii) CALCULATE the internal rate of return of the replacement decision. (iii Should Company go ahead with the replacement decision? ANALYSE.
Year (t) 1 2 3 4 5
PVIF0.15,t 0.8696 0.7561 0.6575 0.5718 0.4972
PVIF0.20,t 0.8333 0.6944 0.5787 0.4823 0.4019
PVIF0.25,t 0.80 0.64 0.512 0.4096 0.3277
PVIF0.30,t 0.7692 0.5917 0.4552 0.3501 0.2693
PVIF0.35,t 0.7407 0.5487 0.4064 0.3011 0.2230
Illustration-(Q 1(b) Nov 2019)
• Door Ltd. is considering an investment of ₹ 4,00,000. • This investment is expected to generate substantial cash inflows over the next five years. • Unfortunately, the annual cash flows from this investment is uncertain, and the following profitability distribution has been established.
Annual Cash
Flow (₹)
Probability

Financial Management www.IndigoLearn.com 174
50,000 0.3
1,00,000 0.3
1,50,000 0.4
• At the end of its 5 years life, the investment is expected to have a residual value of ₹ 40,000. • The cost of capital is 5%
(i) Calculate NPV under the three different scenarios. (ii) Calculate Expected Net Present Value. (iii) Advise Door Ltd. on whether the investment is to be undertaken
Year 1 2 3 4 5
DF @ 5%
0.952 0.907 0.864 0.823 0.784
Illustration-(Q 1(d) Nov 2019) A company has ₹ 1,00,000 available for investment and has identified the following four investments in which to invest.
Project Investment (₹)
NPV (₹)
C 40,000 20,000
D 1,00,000 35,000
E 50,000 24,000
F 60,000 18,000
You are required to optimize the returns from a package of projects within the capital spending limit if- (i) The projects are independent of each other and are divisible. (ii The projects are not divisible
Illustration-(Q 5 RTP May-2019) BT Pathology Lab Ltd. is using an X-ray machines which reached at the end of their useful lives.
• Following new X-ray machines are of two different brands with same features are available for the purchase
Brand Cost of Machine (Rs. )
Life of Machine
Maintenance Cost (Rs. )
Rate of Depreciation
Year 1-5
Year 6-10
Year 11-15
XYZ 6,00,000
15
years
20,000
28,000
39,000
4%
ABC 4,50,000
10
years
31,000
53,000
-- 6%
Residual Value of both of above machines shall be dropped by 1/3 of Purchase price in the first year and thereafter shall be depreciated at the rate mentioned above.
• Alternatively, the machine of Brand ABC can also be taken on rent to be returned back to the owner after use on the following terms and conditions:

Financial Management www.IndigoLearn.com 175
• Annual Rent shall be paid in the beginning of each year and for first year it shall be Rs. 1,02,000.
• Annual Rent for the subsequent 4 years shall be Rs. 1,02,500. • Annual Rent for the final 5 years shall be Rs. 1,09,950. • The Rent Agreement can be terminated by BT Labs by making a payment of Rs. 1,00,000 as
penalty. This penalty would be reduced by Rs. 10,000 each year of the period of rental agreement.
You are required to: (a) ADVISE which brand of X-ray machine should be acquired assuming that the use of machine
shall be continued for a period of 20 years. (b) STATE which of the option is most economical if machine is likely to be used for a period of
5 years? The cost of capital of BT Labs is 12% Illustration-(Q 2(b) May-2019) Aar Cee Manufacturing Co. is considering a proposal to replace one of its existing machine by the CNC machine.
• In this connection, the following information is available: • The existing machine was bought 3 years ago for Rs. 15,40,000. • It was depreciated on straight line basis and has a remaining useful life of 7 years. • It's annual maintenance cost is expected to increase by Rs. 40,000 from the sixth year of its installation. • It's present realisable value is Rs. 6,50,000. • The purchase price of CNC machine is Rs. 27,00,000 and installation expenses of Rs. 95,000 will be incurred. • Subsidy equal to 15% of the purchase price will be received at the end of first year of its installation. It is subject to same rate of depreciation. • It's realisable value after 7 years is Rs. 5,70,000. • With the CNC machine, annual cash operating costs are expected to decrease by Rs. 2,16,000. • In addition, CNC machine would increase productivity on account of which net cash revenue would increase by Rs. 2,76,000 per annum. • The tax rate applicable to firm is 30% and cost of capital is 11%.
Required: • Advise the firm whether to replace the existing machine with CNC machine on the basis of net present value. • The present value factor at 11% are as follows :
Year 1 2 3 4 5 6 7
PV @ 11%
0.901 0.812 0.731 0.659 0.593 0.535 0.482
Illustration – HMR Ltd. is considering replacing a manually operated old machine with a fully automatic new machine. The old machine had been fully depreciated for tax purpose but has a book value of ₹ 2,40,000 on 31st March 2021. The machine has begun causing problems with breakdowns and it cannot fetch more than ₹ 30,000 if sold in the market at present. It will have no realizable value after 10 years. The company has been offered ₹ 1,00,000 for the old machine as a trade in on the new machine which has a price (before allowance for trade in) of ₹ 4,50,000. The expected life of new machine is 10 years with salvage value of ₹ 35,000 Further, the company follows straight line depreciation method but for tax purpose, written down value method depreciation @ 7.5% is allowed taking that this is the only machine in the block of assets. Given below are the expected sales and costs from both old and new machine:

Financial Management www.IndigoLearn.com 176
Old Machine (₹)
New Machine (₹)
Sales 8,10,000 8,10,000
Material cost 1,80,000 1,26,250
Labour cost 1,35,000 1,10,000
Variable overhead 56,250 47,500
Fixed overhead 90,000 97,500
Depreciation 24,000 41,500
PBT 3,24,750 3,87,250
Tax @ 30% 97,425 1,16,175
PAT 2,27,325 2,71,075
From the above information, ANALYSE whether the old machine should be replaced or not if required rate of return is 10%? Ignore capital gain tax. PV factors at 10%
Year 1 2 3 4 5 6 7 8 9 10
PVF 0.909 0.826 0.751 0.683 0.621 0.564 0.513 0.467 0.424 0.386
Illustration An existing company has a machine which has been in operation for two years, its estimated remaining useful life is 4
years with no residual value in the end. Its current market value is ₹ 3 lakhs. The management is considering a proposal to purchase an improved model of a machine gives increase output. The details are as under:
Particulars Existing Machine New Machine
Purchase Price ₹ 6,00,000 ₹ 10,00,000
Estimated life 6 Years 4 years
Residual value 0 0
Annual operating days 300 300
Operating hours per day 6 6
Selling price per unit ₹ 10 ₹ 10
Material cost per unit ₹ 2 ₹ 2
Output per hour in unit 20 40
Labour cost per unit ₹ 20 ₹ 30
Fixed OH per annum excluding depreciation ₹ 1,00,000 ₹ 60,000
Working capital ₹ 1,00,000 ₹ 2,00,000
Income tax rate 30% 30%
Assuming that - cost of capital is 10% and the company uses written down value of depreciation @ 20% and it has
several machines in 20% block. Advice the management on the Replacement of Machine as per the NPV method. The discounting factors table given below:
Discounting factors Year 1 Year 2 Year 3 Year 4
10% 0.909 0.826 0.751 0.683
Illustration A & Co. is contemplating whether to replace an existing machine or to spend money on overhauling
it. A & Co. currently pays no taxes. The replacement machine costs ₹ 90,000 now and requires
maintenance of ₹ 10,000 at the end of every year for eight years. At the end of eight years it would have

Financial Management www.IndigoLearn.com 177
a salvage value of ₹ 20,000 and would be sold. The existing machine requires increasing amounts of
maintenance each year and its salvage value falls each year as follows:
Year Maintenance (₹)
Salvage (₹)
Present 0 40,000
1 10,000 25,000
2 20,000 15,000
3 30,000 10,000
4 40,000 0
The opportunity cost of capital for A & Co. is 15%.
REQUIRED:
When should the company replace the machine?
(Note: Present value of an annuity of Re. 1 per period for 8 years at interest rate of 15% : 4.4873; present value of Re. 1 to be received after 8 years at interest rate of 15% : 0.3269).
Illustration
A chemical company is presently paying an outside firm ₹ 1 per gallon to dispose off the waste resulting
from its manufacturing operations. At normal operating capacity, the waste is about 50,000 gallons
per year.
After spending ₹ 60,000 on research, the company discovered that the waste could be sold for ₹10 per gallon if it was processed further. Additional processing would, however, require an investment of ₹ 6,00,000 in new equipment, which would have an estimated life of 10 years with no salvage value. Depreciation would be calculated by straight line method.
Except for the costs incurred in advertising ₹ 20,000 per year, no change in the present selling and administrative expenses is expected, if the new product is sold. The details of additional processing costs are as follows:
Variable : ₹ 5 per gallon of waste put into process.
Fixed : (Excluding Depreciation) ₹ 30,000 per year.
There will be no losses in processing, and it is assumed that the total waste processed in a given year will be sold in the same year. Estimates indicate that 50,000 gallons of the product could be sold each year.
The management when confronted with the choice of disposing off the waste or processing it further and selling it, seeks your ADVICE. Which alternative would you recommend? Assume that the firm's cost of capital is 15% and it pays on an average 50% Tax on its income.
You should consider Present value of Annuity of ₹1 per year @ 15% p.a. for 10 years as 5.019.

Financial Management www.IndigoLearn.com 178
RISK ANALYSIS IN CAPITAL BUDGETING

Financial Management www.IndigoLearn.com 179
Monte Carlo Simulation Analysis
Scenario Analysis
Other Techniques
Sensitivity Anaysis
Conventional Techniques
Coefficient of Variation
TECHNIQUES OF
RISK ANALYSIS
IN CAPITAL
BUDGETING
Variance / Standard Deviation
Statistical Techniques
Certainty equivalents
Risk adjusted discount rate
Probability
Decision Tree Analysis

Financial Management www.IndigoLearn.com 180
A. Statistical Techniques
1. Probability • A measure of of the chances that an event will occur • If certain to occur, probability is 1. If certain that will not occur, probability is 0. • Once probability is assigned to each cash flow:

Financial Management www.IndigoLearn.com 183
Illustration 1
Bes Guess High Guess Low Guess
Cash Flows 3 Lacs 2 Lacs 1.2 Lacs
Probability 0.3 0.6 0.2
Compute the expected Net Cash Flow.
Illustration 2 ( Multiple years ENPV,SD)
Possible Net cash flows of projects A &B and their probabilities are given below. Discount rate is
10% and Initial investment is Rs.10,000 for both the projects
a) Calculate Expected NPV for each project and determine which project is preferrable? b) Compute SD for both projects c) Compute co efficient of variation and determine which project is preferrable
Project A Project B
Event CF Rs. Probability CF Rs. Probability
A 8,000 0.10 4,000 0.10
B 10,000 0.20 20,000 0.15
C 12,000 0.40 16,000 0.50
D 14,000 0.20 12,000 0.15
E 16,000 0.10 8,000 0.10
Illustration 3 ( Multiple years ENPV,SD)
Probabilities for net cash flows for three years, of a project are as follows.
Year1 Year2 Year3
Cash flow Probability Cash flow Probability Cash flow Probability
2,000 0.1 2,000 0.2 2,000 0.3
4,000 0.2 4,000 0.3 4,000 0.4
6,000 0.3 6,000 0.4 6,000 0.2
8,000 0.4 8,000 0.1 8,000 0.1
Calculate expected net cash flow, present value of expected net cash flow using 10% discount rate. Initial investment is Rs. 10,000. Illustration 4 ( ENPV,SD & PI) Shivam Ltd. is considering two mutually exclusive projects A and B. [41948] Project A costs Rs.36,000 and project B Rs.30,000. You have been given below the net present value probability distribution for each project
Project A Project B
NPV estimates (Rs.)
Probability NPV estimates (Rs.)
Probability
15,000 0.2 15,000 0.1
12,000 0.3 12,000 0.4
6,000 0.3 6,000 0.4
3,000 0.2 3,000 0.1

Financial Management www.IndigoLearn.com 184
i.Compute the expected net present values of projects A and B. ii.Compute the risk attached to each project i.e. standard deviation of each probability
distribution. iii.Compute the profitability index of each project. iv.Which project do you recommend? State with reasons.
Illustration 5 (RADR) An enterprise is investing Rs. 100 lakhs in a project. The risk-free rate of return is 7%. Risk premium expected by the Management is 7%. The life of the project is 5 years. Following are the cash flows that are estimated over the life of the project
Year Cash flows (Rs.in lakhs)
1 25
2 60
3 75
4 80
5 65
Calculate Net Present Value of the project based on Risk free rate and also on the basis of Risks adjusted discount rate. Illustration 6 (CE) If Investment Proposal is Rs.45,00,000 and risk-free rate is 5%, calculate Net present value under certainty equivalent technique.
Year Expected cash flow (In Rs.) Certainty Equivalent coefficient
1 10,00,000 0.90
2 15,00,000 0.85
3 20,00,000 0.82
4 25,00,000 0.78
Illustration 7 (RADR vs CE) The Textile Manufacturing Company Ltd, is considering one of two mutually exclusive proposals, Projects M and N, which require cash outlays of Rs.8,50,000 and Rs.8,25,000 respectively. The certainty-equivalent (C.E) approach is used in incorporating risk in capital budgeting decisions. The current yield on government bonds is 6% and this is used as the risk-free rate. The expected net cash flows and their certainty equivalents are as follows:
Project M Project N
Year-end Cash flow (Rs) C.E. Cash flow (Rs) C.E.
1 4,50,000 0.8 4,50,000 0.9
2 5,00,000 0.7 4,50,000 0.8
3 5,00,000 0.5 5,00,000 0.7
Present value factors of Re. 1 discounted at 6% at the end of year 1, 2 and 3 are 0.943, 0.890 and 0.840 respectively. Required:
i.Which project should be accepted? ii.If risk adjusted discount rate method is used, which project would be appraised with a
higher rate and why?

Financial Management www.IndigoLearn.com 185
Illustration 8 (RADR) Determine the risk adjusted net present value of the following projects:
X Y Z
Nat cash outlays (Rs) 2,10,000 1,20,000 1,00,000
Project life 5 Years 5 Years 5 Years
Annual Cash Inflow (Rs) 70,000 42,000 30,000
Coefficient of variation 1.2 0.8 0.4
The Company selects the risk-adjusted rate of discount on the basis of the coefficient of variation:
Coefficient of variation
Risk-Adjusted rate of return
P.V. Factor 1 to 5 years at risk adjusted rate of discount
0.0 10% 3.791
0.4 12% 3.605
0.8 14% 3.433
1.2 16% 3.274
1.6 18% 3.127
2.0 22% 2.864
More than 2.0 25% 2.689
Illustration 9 (sensitivity analysis) From the following details relating to a project, analyse the sensitivity of the project to changes in initial project cost, annual cash inflow and cost of capital:
Initial Project Cost (Rs) 1,20,000
Annual Cash Inflows (Rs) 45,000
Project Life (Years) 4
Cost of Capital 10%
To which of the three factors, the project is most sensitive if the variable is adversely affected by 10%? (Use annuity factors: for 10% 3.169 and 11% 3.103). Illustration 10 (NPV) X Ltd is considering its New Product with the following details
Sr.No. Particulars Figures
1 Initial capital cost Rs.400Cr
2 Annual unit sales Rs.5Cr
3 Selling price per unit Rs.100
4 Variable cost per unit Rs.50
5 Fixed cost per unit Rs.50Cr
6 Discount Rate 6%
7 Tenure 3 years
i.Calculate the NPV of the project. ii.Find the impact on the project’s NPV of a 2.5 per cent adverse variance in each
variable. Which variable is having maximum effect?

Financial Management www.IndigoLearn.com 186
Illustration 11 (NPV & Sensitivity) Initial investment outlay for capital investment project of Priyanka ltd consists of Rs.100,00,000 for plant and machinery & Rs.40,00,000 for working Capital other details are summarized as follows:
Sales 1,00,000 units of output p.a (Year-1 to Year-5)
Selling Price Rs.120 per unit of Output
Variable Cost Rs.60 per unit of Output
Fixed Overheads (Excl. Depreciation)
Rs.15,00,000 p.a (Year-1 to Year-5)
Rate of Depreciation on P&M 20% on SLM
Salvage value on P&M Nil
Tax rate 40%
Time Horizon 5Years
Post tax cut off rate 12%
You are required to
i.Calculate NPV & indicate financial viability of the Project ii.Determine the sensitivity of the projects NPV under each of the following conditions
a. Decrease in S.P by 5% b. Increase in V.C by 10%
Illustration 12 ( Scenario & Statistical analysis) XYZ Ltd. is considering a project “A” with an initial outlay of Rs 14,00,000 and the possible three cash inflow attached with the project as follow: (Amt in Rs.000)
Particular Year-1 Year-2 Year-3
Worst Case 450 400 700
Most Likely 550 450 800
Best Case 650 500 900
Assuming the cost of capital as 9%, determine NPV in each scenario. If XYZ Ltd is certain about the most likely result but uncertain about the third year’s cash flow, what will be the NPV expecting worst scenario in the third year. If XYZ Ltd is certain about the most likely result but uncertain about the third year’s cash flow, what will be the NPV expecting worst scenario in the third year. Illustration 13 (Scenario & Statistical analysis) Surya Manufacturers is planning to start a new manufacturing process. Following are the estimated net cash flows and probabilities of the new manufacturing process:
Year Net Cash Flows (Rs)
Worst Case P=0.2
Most likely Case P = 0.6
Best Case P=0.2
0 (-) 2,00,000 (-)2,00,000 (-)2,00,000
1 40,000 60,000 80,000
2 40,000 60,000 80,000
3 40,000 60,000 80,000

Financial Management www.IndigoLearn.com 187
4 40,000 60,000 80,000
5 40,000 60,000 80,000
5 (Salvage) 0 40,000 60,000
Surya Manufacturers cost of capital for an average risk project is 10%
i.Find the projects NPV considering all the probabilities together ii.Find the best case and worst case and most likely case NPVs separately. iii.Compute Expected NPV of three scenarios also standard deviation & Coefficient of
variation. Question – 7 RTP Nov 2020 A&R Ltd. is considering one of two mutually exclusive proposals, Projects- X and Y, which require cash outlays of Rs. 42,50,000 and Rs. 41,25,000 respectively. The certainty-equivalent (C.E) approach is used in incorporating risk in capital budgeting decisions. The current yield on government bonds is 5.5% and this is used as the risk-free rate. The expected net cash flows and their certainty equivalents are as follows:
Project X Project Y
Year-end Cash Flow (Rs.)
C.E. Cash Flow (Rs.)
C.E.
1 16,50,000 0.8 16,50,000 0.9
2 15,00,000 0.7 16,50,000 0.8
3 15,00,000 0.5 15,00,000 0.7
4 20,00,000 0.4 10,00,000 0.8
5 21,00,000 0.6 8,00,000 0.9
The Present value (PV) factor @ 5.5% is as follows:
Year 0 1 2 3 4 5
PV factor
1 0.947 0.898 0.851 0.807 0.765
Determine the project that should be accepted?
Q.8 May 2018 RTP
From the following details relating to a project, analyse the sensitivity of the project to changes in initial project cost, annual cash inflow and cost of capital:
Initial Project Cost (₹) 1,20,000
Annual Cash Inflow (₹) 45,000
Project Life (Years) 4
Cost of Capital 10
Required: Examine which of the three factors, the project is most sensitive? (Use annuity factors: for 10% 3.169 and 11% 3.103.

Financial Management www.IndigoLearn.com 188
Question – 1(d) Nov 2018 Question Paper From the following details relating to a project analyse the sensitivity of the project to changes in the Initial Project Cost, Annual Cash Inflow and Cost of Capital: Initial Project Cost Rs. 2,00,00,000 Annual Cash Inflow Rs. 60,00,000 Project Life 5 years Cost of Capital 10% To which of the 3 factors, the project is most sensitive if the variable is adversely affected by 10%? Cumulative Present Value Factor for 5 years for 10% is 3.791 and for 11% is 3.696 Illustration SG Ltd. is considering a project “Z” with an initial outlay of ₹ 7,50,000 and life of 5 years. The estimates
of project are as follows:
Lower Estimates Base Upper Estimates
Sales (Units) 4,500 5,000 5,500
(₹) (₹) (₹)
Selling Price p.u. 175 200 225
Variable cost p.u. 100 125 150
Fixed Cost 50,000 75,000 1,00,000
Depreciation included in Fixed cost is ₹ 35,000 and corporate tax is 25%.
Assuming the cost of capital as 15%, DETERMINE NPV in three scenarios i.e worst, base and best case scenario.
PV factor for 5 years at 15% are as follows:
Years 1 2 3 4 5
P.V. factor 0.870 0.756 0.658 0.572 0.497
Illustration:
New Projects Ltd. is evaluating 3 projects, P-I, P-II, P-III. Following information
is available in respect of these projects:
P-I P-II P-III
Cost ₹ 15,00,000 ₹ 11,00,000 ₹ 19,00,000
Inflows-Year 1 6,00,000 6,00,000 4,00,000
Year 2 6,00,000 4,00,000 6,00,000
Year 3 6,00,000 5,00,000 8,00,000
Year 4 6,00,000 2,00,000 12,00,000

Financial Management www.IndigoLearn.com 189
Risk Index 1.80 1.00 0.60
Minimum required rate of return of the firm is 15% and applicable tax rate is 40%. The risk free interest rate is 10%.
REQUIRED:
1. Find out the risk-adjusted discount rate (RADR) for these projects.
2. Which project is the best?

Financial Management www.IndigoLearn.com 190
DIVIDEND DECISIONS
OBJECTIVES
INTRODUCTION
Financial Management: Financial Management essentially refers to managing money to ensure adequate profitability and
optimum cash flows, and involves three inter-related crucial decisions:
a. Investment Decisions:
The management of an enterprise decides allocates resources to various investment opportunities under this decision. For example, how much money can be allocated to buy machinery, or how much money can be invested in acquisition of a new company, or how much money should be used to start a new line of business / expand existing business? Investment decisions may be long-term or short-term and help determine commitment of available resources.
b. Financing Decisions:
These involve four key questions as listed below:
i. How much money must be raised? (Quantum)
ii. What should be the source of funds? (Equity, loans, debentures etc.)
iii. What is the cost of raising funds? (Expected return by shareholders and creditors)
iv. What are the terms of raising funds? (i.e. repayment terms, timeline etc.)
c. Dividend Decisions:
This involves deciding the following:
Understanding the meaning and significance of dividend decisions
Understanding the theories of Dividend
Understanding the approaches to Dividend
Understanding the forms and determinants of dividend

Financial Management www.IndigoLearn.com 191
i. Whether dividends are to be paid?
ii. How much of dividend is to be paid? How much of the current year’s profits are to be retained?
(Quantum)
iii. When should the dividend be paid? (Annual or interim)
iv. Dividend should be paid in what form? (Cash or stock)
Meaning of Dividend:
Dividend is the part of profit which is distributed to the shareholders of the company.
Particulars Reference Amount (in Rs.)
Profit before tax A 500
Less: Taxes to be paid (at 30%) B=A*tax rate 150
Profit after tax C=A-B 350
Dividend to be distributed D 250
Retained Earnings E=C-D 100
Further, dividend can be paid out of accumulated profits- i.e. profits which were retained earnings in
previous years.
Dividend can be paid annually, half-yearly or quarterly based on the management’s discretion. When
dividend is distributed half-yearly or quarterly or at any other point in time other than being declared
at the Annual General Meeting (AGM) – it is known as interim dividend.
Significance of dividend:
The afore mentioned dividend decisions are made by the Board keeping in the mind the following key
objectives:
a. Wealth Maximization:
Owing to volatility of the stock market, shareholders tend to assign more value to dividends in the
near future than future dividends and capital gains. Dividend payouts also influence the market
price of a share. More dividend payouts increase the market price and vice-versa.
On the other hand, use of retained earnings in investments increases the future earnings per share.
And, increased dividends decrease future earnings per share as less funds are available for
investments.
Thus, the Board take dividend decisions which divide net earnings into retained earnings and
dividend payouts optimally, so as to maximize wealth for the shareholders.
b. Long Term Financing:
Retained Earnings
Future earnings per share
Incre
ase
Incre
ase
Dividends Market price per share
Incre
ase
Decre
ase

Financial Management www.IndigoLearn.com 192
Every enterprise has multiple sources of funds - for example, loans, equity, accumulated
profits etc. However, obtaining loans and raising equity by fresh issue of share capital involves
floatation costs. Hence, many enterprises prefer to use accumulated profits or retained
earnings as the same doesn’t involve any additional cost.
As dividend payouts from retained earnings would reduce the funding available with the
enterprise, thereby reducing its capacity to make further investments, the Board of Directors
must consider the following before finalizing the dividend to be declared.
i. Whether investment opportunities are available
ii. Whether the return on investment (RoI) on such investments is higher than the cost of
capital (Ke)
In essence, the Board must find a balance between current income for shareholders (dividends) and growth of the company through retained earnings.
Impact of dividends:
Dividends and Retained Earnings have a significant impact on the future profitability of an enterprise.
The same is illustrated below through an example. The below mentioned two companies have the same
earnings, growth rate etc. and have different dividend policies.
A Ltd. has a no dividend policy whereas B Ltd. distributes 50 percent of its earnings as dividend every
year.
Particulars A Ltd (Amount in Rs.) B Ltd (Amount in Rs.)
Previous Year
Earnings 10,00,000 10,00,000
Dividend Nil 500,000
Retained Earnings 10,00,000 500,000
Current Year
Opening Capital 50,00,000 50,00,000
Retained Earnings 10,00,000 5,00,000
Total Capital Employed 60,00,000 55,00,000
Earnings at 20 percent of capital employed
10,00,000 11,00,000
Key Dates:
Let us understand the events associated with dividend declaration with the example illustrated below:

Financial Management www.IndigoLearn.com 193
Dividend
Rate: Dividends are typically expressed as a percentage of the face value of shares. This percentage is
called Dividend Rate.
Example:
Dividend Yield: Dividend per share expressed as a percentage of market price per share.
Example:
Market Price per share 100 Dividend per share 2 Dividend Rate 2%
Dividend Payout: Dividend per share expressed as a percentage of earnings per share
Example: Earnings per share
20 Dividend per share 2 Dividend Rate 10%
Growth rate is a function of retained earnings and return on equity
b = retention (%) r = return on equity (%) g = growth rate of dividend
Cost of equity (Ke): Cost of equity includes dividends distributed and applicable dividend distribution
tax (DDT).
Face Value per share 10 Dividend per share 2 Dividend Rate 20%
BASIC CONCEPTS
•Date on which dividend is declared20 SepDeclaration Date
•Date upto which shares bought shall be eligible to receive dividend
25 SepLast cum-dividend date
•Date from which shares bought are not eligible to receive the dividend declared
26 SepEx dividend date
•Date on which the Register of Members is closed to identify the members eligible to receive dividend
28 Sep Record Date
•Date on which dividend is paid out5 Oct Payment Date

Financial Management www.IndigoLearn.com 194
THEORIES OF DIVIDEND
WALTER’S MODEL:
Assumptions:
1. All equity: The firm is an all equity firm e with no debt
2. Fixed Investment Policy: All investment should be financed through retained earnings
3. Perfect Capital Markets: The firm functions in a market where all the investors are rational, and
information is freely available to all.
4. No taxes: or no tax discrimination between dividend income and capital gain. This assumption is
necessary as the tax rates or provisions to tax income shall be different in different countries.
5. No Transaction Cost: The costs may differ from country to country and market to market.
6. Perpetual Life: The Firm has perpetual life
7. Constant r & Ke: Rate of return and market capitalization rate are assumed to be constant
throughout the life of the firm.
Formula:
P0 = Current Market price per share
D = Dividend per share
E= Earnings per share
Ke = Cost of Equity
r = Rate of return
Hypothesis:
James E Walter propounded the theory that in the long run, the market price of shares reflects the
present value of expected dividends and capital gains.
Theories of dividend
Irrelevance Theory
Dividend is irrelevant in
determining MPS)
M M Approach
Relevance Theory
(Dividend is relevant in
determining MPS)
Walter’s Model
Gordon’s Model

Financial Management www.IndigoLearn.com 195
Accordingly, the formula is an addition of present value of dividends and retained earnings.
In the aforesaid formula, retained earnings is represented by (E-D) i.e. earnings per share minus
dividend per share, growing at the internal rate of return (r).
Walter explained that if the rate of return is higher than the market capitalization rate, the value of
shares would be high even if dividends are low. However, if the rate of return is lower than the market
capitalization rate, the value of the share will be low. He argued that if the rate of return is equal to
the market capitalization rate, dividend at any rate would be considered optimum.
Thus, he concluded the following:
Firm Condition of r and Ke
Correlation between Dividend and MPS
Optimum Dividend Payout Ratio
Growth r > Ke Negative 0%
Constant / Normal
R = Ke No correlation Any% (Every payout ratio is optimum)
Declining R < Ke Positive 100%
Limitations:
a. Other Factors: The hypothesis does not consider all factors affecting dividend policy and share
prices. Further, the formula ignores factors such as taxation, various legal and contractual
obligations etc.
b. No debt: It assumes that the Firm shall not borrow money and merely be dependent upon retained
earnings and fresh equity issue.
c. Constant Ke: It assumes that Ke will remain constant throughout the life of the Firm which means
that the risk associated with the business of the Firm shall be the same. However, in reality, risks
change over time.
d. Constant r: Further, it assumes that the rate of return on all investment shall remain the same.
Advantages:
a. The formula is simple to understand and easy to compute.
b. It considers market capitalization rate, internal rate of return, and dividend payout ratio as factors
to determine market value of a share.
GORDON’S MODEL (DIVIDEND DISCOUNT MODEL)
Assumptions:
Present value of retained earnings Present value of dividends
+

Financial Management www.IndigoLearn.com 196
1. All equity: The firm is an all equity firm e with no debt
2. Fixed Investment Policy: All investment should be financed through retained earnings
3. No taxes: or no tax discrimination between dividend income and capital gain. This assumption is
necessary as the tax rates or provisions to tax income shall be different in different countries.
4. Perpetual Life: The Firm has perpetual life
5. Constant r & Ke: Internal rate of return and market capitalization rate are assumed to be constant
throughout the life of the firm.
6. Constant dividend payout ratio: Constant retention ratio is assumed and accordingly, growth rate
is also constant since rate of return is also assumed to be constant. (g = b x r)
7. Ke > g: Ke is assumed to be greater than growth.
Formula:
P0 = Current Market price per share
D1 = Dividend per share next year
g = Growth rate of dividends
Ke = Cost of Equity
Hypothesis:
Myron Gordon propounded the theory that the market price of share is the present value of expected
dividends.
Since it assumed that the growth rate of dividends remains constant throughout the life of the Firm,
the formula depicts that the market price is ascertained as the present value of a growing perpetuity.
The formula shows that when the rate of return is higher than the discount rate, the price per share
increases as the dividend ratio decreases and if the return is less than the discount rate, the price per
share decreases.
Accordingly, the price per share shall remain unchanged where the rate of return and discount rate are
equal.
Consequently, the conclusion of Walter’s and Gordon’s model remains the same as tabulated below:
Firm Condition of r and Ke
Correlation between Dividend and MPS
Optimum Dividend Payout Ratio
Growth r > Ke Negative 0%
Constant / Normal
R = Ke No correlation Any% (Every payout ratio is optimum)
Declining R < Ke Positive 100%
Limitations:
a. Other Factors: The hypothesis does not consider all factors affecting dividend policy and share
prices. Further, the formula ignores factors such as taxation, various legal and contractual
obligations etc.

Financial Management www.IndigoLearn.com 197
b. No debt: It assumes that the Firm shall not borrow money and merely be dependent upon retained
earnings and fresh equity issue.
c. Constant Ke: It assumes that Ke will remain constant throughout the life of the Firm which means
that the risk associated with the business of the Firm shall be the same. However, in reality, risks
change over time.
d. Constant r: Further, it assumes that the rate of return on all investment shall remain the same.
e. Ke > g assumption: In case the growth rate is higher than the Ke, the price of the share shall be
negative as per the formula given. In reality, the price of a share cannot be negative since growth
rate is higher than Ke.
Advantages:
a. The formula is simple to understand and easy to compute.
b. It considers the market value of a share to be a reflection of present value of future cash flows.
GRAHAM AND DODD MODEL (TRADITIONAL MODEL)
Formula:
P = Market price per share
D = Dividend per share
E = Earnings per share
m = Multiplier
Hypothesis:
Graham & Dodd propounded the theory that investors place considerably more weight on dividends
than on retained earnings, since dividends in the near future provide more certainty.
Please note that that formula given attaches weight to dividends which is equal to 4 times the weight
attached to retained earnings.
Limitations:
The weights attached to dividends in comparison to retained earnings is based on the subjective
judgment of Graham and Dodd.
Advantages:
The formula is simple to understand and easy to compute.
LINTERS MODEL
Assumptions:
1. Long term dividend payout ratio: Firms maintain a fixed dividend payout over a long term.

Financial Management www.IndigoLearn.com 198
2. Management Concern: Managers are more concerned with changes in dividends than the absolute
number of dividends. They are reluctant to effect dividend changes if the same have to be reversed.
3. Dividend Changes in long run: Dividend changes follow changes in long run sustainable earnings.
This is also due to the fact that managers decide dividend changes only if they foresee that the
same is maintainable in future years to manage investor expectations.
Formula:
D1 = Dividend per share next year
D0 = Dividend per share in current year
EPS = Earnings per share
AF = Adjustment Factor
Hypothesis:
John Linter based his model on a series of interviews he conducted with corporate managers in mid
1950s. As per his theory, current year dividend is dependent upon current year’s earnings and last
year’s dividend.
Limitations:
a. The adjustment factor is an arbitrary number.
b. The formula does not ascertain market price of the share.
Advantages:
The formula is simple to understand and easy to compute.
MODIGLIANI AND MILLER (M.M) HYPOTHESIS
This theory proposed by Franco Modigliani and Merton Miller in 1961 was an approach in the support of
irrelevance of dividends in determining market value of a share.
Assumptions of the M.M Hypothesis:
1. Perfect Capital Markets: The firm functions in a market where all the investors are rational, and
information is freely available to all.
2. No taxes: or no tax discrimination between dividend income and capital gain. This assumption is
necessary as the tax rates or provisions to tax income may be different in different countries.
3. Fixed Investment Policy: It is necessary to assume that all investment should be financed
through equity only as implication after using debt as a source of finance may be difficult to
understand.
4. No Transaction Cost: The costs may differ from country to country and market to market.
5. Risk of Uncertainty: It does not exist as investors are able to forecast future prices and dividend
with certainty and one discount rate is appropriate for all securities and time periods.

Financial Management www.IndigoLearn.com 199
Formula:
Vf = Value of firm at the beginning of the period
nP0 = number of shares in the beginning of the period X Current Market price per share
n = number of shares in the beginning of the period
n= number of shares issued
P1 = Market price at end of the period
I = Amount required for investment
E = Total earnings during the period
Ke = Cost of Equity
Hypothesis:
The model considers that the market value of equity shares of a firm depends only on its earning power
and is not influenced by any manner in which its earnings are split between dividends and its retained
earnings. It propounds that the market value of equity shares is not influenced by dividend size.
Consider this illustration to examine the hypothesis under this model:
Facts: A Ltd has outstanding 10,000 shares available at a market price of Rs. 100. The market
capitalization rate is 10%. A Ltd. expects to have a net income of Rs. 100,000 at the end of the year
and proposes to invest Rs. 200,000. The management intends to declare dividend of Rs. 5 per share at
the end of the current year.
Scenario 1: A Ltd does not pay any dividend
Step 1: Market price of the share at the end of the period
= 100 = P1 + 0 / 1 + 0.10
= P1 = 110
Step 2: Computing funds required for proposed investment
Particulars Reference Amount (in Rs)
Earnings A 100,000
Less: Dividend distributed B Nil
Funds available for investment C = A-B 100,000
Total Proposed Investment D 200,000
Balance funds required E = D-C 100,000
Step 3: Number of shares to be issued for balance funds required:

Financial Management www.IndigoLearn.com 200
n= Funds required / Price at end
n= 100,000 / 110
Step 4: Calculation of Value of Firm:
nP0 = (10,000 + 1,00,000/110)110 – 200,000 + 100,000
(1 + 0.1)
= 10,00,000
Scenario 2: A Ltd pays the proposed dividend
Step 1: Market price of the share at the end of the period
= 100 = P1 + 5 / 1 + 0.10
= P1 = 105
Step 2: Computing funds required for proposed investment
Particulars Reference Amount (in Rs)
Earnings A 100,000
Less: Dividend distributed B (50,000)
Funds available for investment C = A-B 50,000
Total Proposed Investment D 200,000
Balance funds required E = D-C 150,000
Step 3: Number of shares to be issued for balance funds required:
n= Funds required / Price at end
n= 150,000 / 105
Step 4: Calculation of Value of Firm:
nP0 = (10,000 + 1,50,000/1050)105 – 200,000 + 100,000

Financial Management www.IndigoLearn.com 201
(1 + 0.1)
= 10,00,000
Thus, it can be seen that the value of the firm remains the same irrespective of whether dividends are
paid or not.
Limitations:
1. Validity of various assumptions is questionable.
2. It may not be valid under uncertainty.
Advantages:
1. This model is logically consistent.
2. It provides a satisfactory structure of the dividend policy with the concept of Arbitrage process.
CONSTANT DIVIDEND APPROACH:
Under this approach, a constant dividend per share is paid each year irrespective of the earnings. For
example, Rs. 5 per share shall be the fixed dividend paid by the Firm every year.
Dividends are increased by the management only if they are certain that the increased dividend per
share can be maintained by the Firm for future years. This is done to manage investor expectations.
Advantages:
a. Stable dividend: The Firm shall have a clean track record of stable dividends since the inception
and gives a good impression for investors. This provides a regular, stable level of income for its
investors.
b. No Uncertainty: The investors do not face any uncertainty in respect of the quantum of dividend
they expect.
c. Positive Sign: An increase in the dividend in any year send a positive signal to the investors as the
Firm does not generally reduce the amount of dividends being paid.
APPROACHES TO DIVIDENDS
Approaches to Dividend
Constant Dividend Constant Payout Constant Dividend Plus

Financial Management www.IndigoLearn.com 202
CONSTANT PAYOUT APPROACH:
Under this approach, the Firm follows a fixed payout ratio. This means that the ratio of dividends per
share to the earnings per share remains constant.
Advantages:
a. Dividends linked to earnings: Dividends are linked to earnings under this approach. More profit
would mean more dividend for the investors.
b. No Liquidity pressure: The Firm shall pay dividends only from its profits and accordingly, the Firm
will not face any liquidity pressure. This is a great advantage in comparison to the constant dividend
approach.
CONSTANT DIVIDEND PLUS APPROACH:
Under this approach, a low fixed dividend is always payable and an additional amount of dividend which
varies from year to year is paid. This approach is a mix of the aforesaid approaches as the fixed low
dividend is constant and the additional dividend would be paid based on the earnings of the Firm.
Advantages:
a. Dividends linked to earnings: Additional Dividends being paid are linked to earnings under this
approach. More profit would mean more dividend for the investors.
b. Stable dividend: The Firm shall have a clean track record of paying a minimum amount of dividend
every year and gives a good impression for investors. This provides a low quantum, regular, stable
level of income for its investors.
a. Cash Dividend: This is the most common of dividend. Firms pay dividends to their investors in cash
through warrant / demand drafts / cheque / pay order / electronic clearing service etc.
b. Stock Dividend (Bonus Shares): This is the allotment of shares by the enterprise for no
consideration received from the investors. The reserves of the enterprise and reduced and
converted to equity shares by issue of equity shares to the investors. The enterprise is benefitted
as cash is not paid and investors benefit as bonus shares received are taxed only on sale. Receipt
of bonus shares does not attract tax as per the extant income tax law in India.
Example: A 1:3 bonus means that for every 3 shares held; one share shall be allotted free of cost. The balance sheet shall be affected as tabulated below:
Before Bonus Issue Post Bonus Issue
Particulars Amount (in Rs) Particulars Amount (in Rs)
Equity Share capital (600,000 shares of Rs. 10 each)
60 Equity Share capital (800,000 shares of Rs. 10 each)
80
Reserves & Surplus 140 Reserves & Surplus 120
Total 200 Total 200
FORMS OF DIVIDENDS

Financial Management www.IndigoLearn.com 203
Share capital increases by 200,000 shares of Rs. 10 each since 1 share is issued for every 3 shares held. Let’s assume the market price of the share before bonus issue was Rs. 45. This would imply a market capitalization of Rs. 45 X 600,000 shares = Rs, 270,00,000. Post the bonus issue, the market capitalization shall remain the same. However, the number of shares has now increased to 800,000. Accordingly, the market price of the share shall be Rs. 270,00,000 / 800,000 = 33.75 per share. Formula:
P0 = Current Market price per share
S = No. of shares outstanding before bonus issue
N = Number of bonus shares issued.
Stock split means splitting one share into many. It essentially implies a reduction in the face value
of shares. For example, one share of Rs. 500 shall be split into 5 shares of Rs. 100 each.
This is a tool often used by companies whose stock value per share increases beyond a point where it becomes less tradable. For example, if the stock price reaches Rs. 5,000 per share, the company may opt to split the stock to reduce the market price to Rs, 500 per share. Advantages: a. Increases affordability: Stock split increases the affordability of a share to small / medium
investors.
b. Increases Potential Investment: Increase in number of shares increases the potential of
investment as a greater number of investors can now invest.
Limitations: a. Additional Cost: The exercise of splitting a stock shall involve cost to the company.
b. Increase in speculators: Lower prices of shares attracts small investors and speculators which
are generally not preferred by a company.
Example: Taking the same facts of the case as given in the bonus example above, a stock split ratio could be 4:3, which means that 4 shares for every 3 shares held. Consequently, the par value will be reduced to Rs. 7.5 since this is a 75% split (Computed as ¾). Accordingly, the number of shares will be increased to 800,000 shares [(4*600,000)/3] of Rs, 7.5 each. The market price of the share after the stock split shall also amount to Rs. 33.75 since the market capitalization of Rs. 270,00,000 shall remain unchanged for the 800,000 shares. The balance sheet shall be appear as given below:
Before Stock Split Post Stock Split
Particulars Amount (in Rs) Particulars Amount (in Rs)
STOCK SPLIT

Financial Management www.IndigoLearn.com 204
Equity Share capital (600,000 shares of Rs. 10 each)
60 Equity Share capital (800,000 shares of Rs. 7.5 each)
60
Reserves & Surplus 140 Reserves & Surplus 140
Total 200 Total 200
Formula:
P0 = Current Market price per share S = No. of shares outstanding before stock split N = Increase in shares on account of stock split
Dividend Decisions of a firm are based on the following key factors:
a. Availability of Funds: If a firm requires funds in the short-medium term, the firm shall prefer a
low payout ratio to utilize the retained earnings available as the same does not involve floatation
costs.
b. Cost of Capital: In case the firm has access to debt (which is relatively a cheaper source of
finance), the firm would prefer to distribute more dividend. However, in case the firm does not
have access to external financing, it would be preferable to use retained earnings.
c. Capital Structure: Firms should have an optimum debt-equity ratio. Accordingly, the firm would
consider the existing debt-equity ratio prior to declaration of dividend.
d. Stock Price: Higher dividends typically increase the market price of shares. Accordingly, the
management would consider the impact on stock price on account of dividends declared.
e. Investment Opportunities available: In case the firm has many viable investment opportunities,
the firm would prefer to pay less dividends and invest retained earnings in projects.
f. Internal rate of return: If the internal rate of return (r) is more than the cost of retained
earnings, it would be preferable to pay retain more.
g. Industry Trends: Firm would strive to meet the industry standards as few industries receive
investments from investors who are expecting a regular, stable source of income. Some investors
invest in a few industries where the risk appetite is more, and hence even if dividends declared
are not regular / stable, the same would be acceptable.
h. Investor’s expectations: Some investors invest for growth and some invest to earn regular
income. The Firm must bear in minds the expectations of the investors before making dividend
decisions.
i. Legal Constraints: Section 123 of the Companies Act, 2013 and related rules must be followed
by the firm while declaring dividend.
j. Taxation: The Firm must be aware of the tax implications on dividend declaration and must
comply with the same.
DETERMINANTS OF DIVIDEND

Financial Management www.IndigoLearn.com 205
ILLUSTRATIONS
Illustration 1 ( Walter’s Model)
XYZ ltd. which earns Rs.10 per share is capitalized at 10% and has a return on investment of 12%
Dividend is Rs. 8 per share.
Determine the optimum dividend pay-out ratio and the price of the share at the pay-out as per
Walter’s model.
Illustration 2 ( Walter’s Model)
The following information pertains to M/s XY Ltd.
Earnings of the company Rs. 5,00,000
Dividend Pay-out Ratio 60%
No. of shares outstanding Rs. 1,00,000
Equity capitalization rate 12%
Rate of return on investment
15%
1. What would be the market value per share as per Walter’s model?
2. What is the optimum dividend pay-out ratio according to Walter’s model and the market
value of Company’s share at that pay-out ratio?
Illustration 3 ( Walter’s Model)
The following figures are collected from the annual report of XYZ Ltd.:
Particulars
Net Profit 30 lakhs
Outstanding 12% preference shares 100 lakhs
No. of equity shares 3 lakhs
Return on Investment 20%
Cost of capital i.e. (ke) 16%
What should be the approximate dividend pay-out ratio to keep the share price at Rs. 42 by using
Walter model?
Illustration 4 (optimal dividend policy)
The following information is supplied to you:
Particulars Value in Rs
Total Earnings 2,00,000
No. of equity shares (of Rs. 100 each)
20,000
Dividend paid 1,50,000
Price/ Earnings ratio 12.5
r (rate of return) 10%

Financial Management www.IndigoLearn.com 206
Applying Walter’s Model
1. Ascertain whether the company is following an optimal dividend policy.
2. Find out what should be the P/E ratio at which the dividend policy will have no effect on
the value of the share,
3. Will your decision change, if the P/E ratio is 8 instead of 12.5?
Illustration 5 (Walter’s model)
• The earnings per share of a company are Rs. 8,
• The rate of capitalization applicable to the company is 10%.
• The company has before it an option of adopting a payout ratio of 25% or 50% or 75%.
Using Walter’s formula of dividend payout, Compute the market value of the company’s share
if the productivity of retained earnings is (i) 15% (ii) 10% and (iii) 5%. Explain fully what
inferences can be drawn from the above exercise?
Illustration 6
X ltd. is a no growth company, pays a dividend of Rs.5 per share. If the cost of capital is 10%, what
should be the current market price of the share?
Illustration 7
XYZ is company having share capital of Rs.10 Lakhs of Rs.10 each. It distributed current dividend
of 20% per annum. Annual growth rate in dividend expected is 2%. The expected rate of return on
its equity capital is 15%.
Illustration 8 (Walter & Gordan)
With the help of following figures calculate the market price of a share of a company by using:
(i) Walter’s formula
(ii) Dividend growth model (Gordon’s formula)
Earnings per share (EPS) Rs.10
Dividends per share (DPS) Rs.6
Cost of Capital 20%
Internal rate of return on investment
25%
Retention ratio 60%
Illustration 9 ( Constant growth rate approach)
There are three different firms: Growth Firm, Normal Firm, Declining Firm -
Factors Growth Firm r > Ke
Normal Firm r = Ke
Declining Firm r < Ke

Financial Management www.IndigoLearn.com 207
r (rate of return on retained earnings)
15% 10% 8%
Ke (Cost of Capital) E (Earning Per Share)
10% Rs.10
10% Rs.10
10% Rs.10
b (Retained Earnings)
0.6 0.6 0.6
1- b 0.4 0.4 0.4
i. Compute the market price of these three Firms under Gordon’s model
ii. Also compute the market price per share if the Retention ratio is 0.4, Explain the inference.
Illustration 10 ( Variable growth model)
A firm had been paid dividend at Rs.2 per share last year. The estimated growth of the dividends
from the company is estimated to be 5% p.a. Determine the estimated market price of the equity
share if the estimated growth rate of dividends
(i) rises to 8%, and
(ii) falls to 3%.
Also find out the present market price of the share, given that the required rate of return of the
equity investors is 15.5%.
Illustration 11 ( Graham & Dodd)
The following information regarding the equity shares of M ltd. is given:
Market price Rs.58.33
Dividend per share Rs.5
Multiplier 7
According to the Graham & Dodd approach to the dividend policy, compute the EPS.
Illustration 12 ( Traditional model)
The dividend pay-out ratio of H ltd. is 40%. If the company follows traditional approach to dividend
policy with a multiplier of 9, what will be the P/E ratio?
Illustration 13 (MM)
RST Ltd. has a capital of Rs.10,00,000 in equity shares of Rs.100 each. The shares are currently
quoted at par. The company proposes to declare a dividend of Rs.10 per share at the end of the

Financial Management www.IndigoLearn.com 208
current financial year. The capitalization rate for the risk class of which the company belongs is
12%. What will be the market price of the share at the end of the year, if?
i. a dividend is not declared?
ii. a dividend is declared?
iii. assuming that the company pays the dividend and has net profits of Rs.5,00,000 and makes
new investments of Rs.10,00,000 during the period, how many new shares must be issued?
Use the MM model.
Illustration 14 (MM)
AB Engineering ltd. belongs to a risk class for which the capitalization rate is 10%. It currently has
outstanding 10,000 shares selling at Rs.100 each. The firm is contemplating the declaration of a
dividend of Rs.5 per share at the end of the current financial year.
It expects to have a net income of Rs.1,00,000 and has a proposal for making new investments of
Rs. 2,00,000.
Using MM Hypothesis, prove that value of the firm remains constant irrespective of Dividend
Policy.
Illustration 15 (MM)
M Ltd. belongs to a risk class for which the capitalization rate is 10%. It has 25,000 outstanding
shares and the current market price is Rs.100. It expects a net profit of Rs.2,50,000 for the year
and the Board is considering dividend of Rs.5 per share. M Ltd. requires to raise Rs.5,00,000 for
an approved investment expenditure.
Show, how the MM approach affects the value of M Ltd. if dividends are paid or not paid.
Illustration 16 (Walter & Gordan)
With the help of following figures calculate the market price of a share of a company by using:
i. Walter’s formula
ii. Dividend growth model (Gordon’s formula)
Earnings per share Rs.10
Dividend per share Rs.6
Cost of capital 20%
Internal rate of return 25%
\
Illustration (1(b) Nov 2018)
Following information relating to Jee Ltd. is given:

Financial Management www.IndigoLearn.com 209
Particulars
Profit after tax Rs. 10,00,000
Dividend pay-out ratio 50%
Number of Equity Shares 50,000
Cost of Equity 10%
Rate of return on Investment 12%
i. What would be the market value per share as per Walter’s Model? ii. What is the optimum dividend pay-out ratio according to Walter’s Model and Market value
of equity share at that pay-out ratio?
Illustration (1(d) May 2019)
The following information is supplied to you
Total Earning Rs. 40 Lakhs
No. of Equity Shares (of Rs. 100 each) 4,00,000
Dividend Per Share Rs. 4
Cost of Capital 16%
Internal rate of return on investment 20%
Retention ratio 60%
Calculate the market price of a share of a company by using : i. WaIter’s Formula ii. Gordon's Formula
Illustration (Q9 May 2018 RTP)
The following information relates to Navya Ltd:
Earnings of the company ₹ 20,00,000
Dividend pay-out ratio 60%
No. of Shares outstanding ₹ 4,00,000
Rate of return on investment 15%
Equity capitalization rate 12%
Required: i.Determine what would be the market value per share as per Walter’s model. ii. Compute optimum dividend pay-out ratio according to Walter’s model and the market
value of company’s share at that pay-out ratio

Financial Management www.IndigoLearn.com 210
WORKING CAPITAL MANAGEMENT
Meaning of Working Capital
Working Capital is the Capital required for smooth and uninterrupted functioning of the business.
Working Capital = Current Assets (-) Current Liabilities.
Current Assets are those, which can be converted into cash within a short duration, i.e. generally less than one year. They are constantly being transformed into other forms, e.g., finished goods are transformed into debtors, debtors are converted into cash, etc.
Current Assets are - Inventories, Debtors, Cash and Bank Balances, Prepaid Expenses, Loans and Advances, Marketable Investments.
Current Liabilities are those which fall due for payment or settlement within a short duration, i.e. generally less than one year.
Current Liabilities are - Creditors, Outstanding Expenses, Tax Provision, Proposed and Unclaimed Dividend, Short Term Loans, Bank Overdraft, Cash Credit.
Various ways in which Working Capital can be classified
Working Capital can be classified based on (a) Concept or (b) Time Factor. (a) Based on Concept - Gross and Net Working Capital:
▪ Gross Working Capital = Current Assets only. ▪ Net Working Capital = Current Assets Less Current Liabilities. In general, whenever we use
the term working capital, we mean net working capital only.
(b) Based on Time Factor - Permanent and Temporary Working Capital.
▪ Permanent Working Capital: It is the minimum level of investment required in the business at any point of time and hence at all points of time. It is also called Fixed or Hard-Core Working Capital.
▪ It remains constant for a period of time. ▪ It is required even during slack season. ▪ Permanent working capital can change
1. with the growth of the firm
Classification of Working
Capital
based on Concept
Gross Working Capital
Net Working Capital
based on
Time
Permanent Working Capital
Temporary Working Capital

Financial Management www.IndigoLearn.com 211
2. change in firm’s policy regarding current assets. 3. Change in technology where a new machine can reduce the conversion time
of raw material into finished goods.
• Financing of permanent working capital: Permanent working capital is financed out of long-term funds.
▪ Temporary Working Capital (TWC): It represents working capital requirements over and above permanent working capital and
▪ It is dependent on factors like peak season, trade cycle, boom, recession, demand changes etc.
▪ It is also called as Fluctuating or Variable Working Capital. ▪ Its requirement may complete decline during slack time. ▪ Financing of temporary working capital: It is financed from short-term sources.
There are two views as to the amount of Permanent Working Capital. (Refer Diagram) ▪ The first view is that the amount of Permanent Working Capital remains the same over all
periods of time.
▪ The more logical second view is that the Permanent Working Capital increases in amount (rupee value) based on the activity levels of the firm. For example, Working Capital of Rs. 10 lakhs maybe sufficient for a turnover level of Rs. 50 lakhs. But when the turnover increases to Rs. 100 Crores after a certain time period, the amount of Working Capital should rise proportionately.
Time Time
Importance of Adequate Working Capital
The need for adequate investment in Working Capital can be understood from the following points: 1. Working Capital is required to use fixed assets profitably. For example, a machine cannot be
used productively without raw materials. 2. Funds are required for day-to-day operations and transactions. These are provided by Cash
and Cash Equivalents, forming part of Current Assets. 3. Adequate Working Capital determines the short-term solvency of the firm. Inadequate
working capital means that the firm will be unable to meet its immediate payment commitments. This represents under-capitalization
4. Increase in activity levels and sales should be backed up by suitable investment in working capital.
5. The aspects of liquidity and profitability should be suitably analyzed by the Finance Manager. Too much emphasis on profitability may affect liquidity.
Shortcomings of excessive working capital Shortcomings of inadequate working capital

Financial Management www.IndigoLearn.com 212
• In case of too much debtors, risk of bad debt increases.
• Excess inventory increases the risk of waste and theft and increases the carrying cost.
• Excess funds blocked in working capital results in low rate of return on capital employed.
• It decreases profitability.
• Production may stop due to shortage of raw material.
• Fixed assets are not efficiently utilized.
• Firm may be unable to deliver on time due to insufficient finished goods, resulting in losing customers.
• Firm may not be able to pay its short-term obligations, thus, losing goodwill.
Hence, working capital levels are said to be adequate when: ▪ Current Assets are greater than Current Liabilities. ▪ Current Ratio = Current Assets / Current Liabilities is about 2: 1. This may differ from industry
to industry. ▪ Quick Ratio = Quick Assets / Quick Liabilities is at least 1: 1. This may also differ from industry
to industry.
Aspects OF Working Capital management
Working Capital management entails the control and monitoring of all components of working capital i.e. cash, marketable securities, debtors (receivables) and stocks (inventories) and creditors (payables). The finance manager has to determine the levels and composition of current assets. He has to ensure a right mix of different current assets and that current liabilities are paid in time.
There are many aspects of working capital management which makes it an important function of financial management.
Time: Working capital management requires much of the finance manager’s time.
Investment: Working capital represents a significant portion of the total investment in assets.
Credibility: Working capital management has great significance for all firms and it is very critical for small firms.
Growth: The need for working capital is directly related to the firm’s growth.
Aspects of
working capital
Time
Investment
Credibility
Growth

Financial Management www.IndigoLearn.com 213
It is advisable that the finance manager should take precautionary measures for effective and efficient management of working capital. He has to pay particular attention to the levels of current assets and their financing. To decide the levels and financing of current assets, the risk return trade off must be considered.
a. Current Assets to Fixed Assets Ratio: The finance manager is required to determine the optimum level of current assets so that the shareholders’ value is maximized. A firm need fixed and current assets to support a particular level of output. However, to support the same level of output, the firm can have different levels of current assets
The level of the current assets can be measured by creating a relationship between current assets and fixed assets. Dividing current assets by fixed assets gives current assets / fixed assets ratio.
- Assuming a constant level of fixed assets, a higher current assets / fixed assets ratio indicates a conservative current assets policy.
- A lower current assets / fixed assets ratio means an aggressive current assets policy assuming all factors to be constant.
- A conservative policy implies greater liquidity and lower risk whereas an aggressive policy indicates higher profitability with higher risk and poor liquidity. Moderate current assets policy will fall in the middle of conservative and aggressive policies. The current assets policy of most of the firms may fall between these two extreme policies.
b. Liquidity versus Profitability: Risk return trade off – A firm may follow a conservative, aggressive or moderate policy as discussed above. However, these policies involve risk, return tradeoff. A conservative policy means lower return and risk. While an aggressive policy produces higher return and risk.
The two important aims of the working capital management are profitability and solvency. A liquid firm has less risk of insolvency that is, it will hardly experience a cash shortage or a stock out situation. However, there is a cost associated with maintaining a sound liquidity position. However, to have higher profitability the firm may have to sacrifice solvency and maintain a relatively low level of current assets. This will improve firm’s profitability as fewer funds will be tied up in idle current assets, but its solvency would be threatened and exposed to greater risk of cash shortage and stock outs.
The following illustration explains the risk-return tradeoff of various working capital management policies, viz., conservative, aggressive and moderate etc.
The approaches to financing working capital requirements are:
Name of Matching Conservative Aggressive Approach Approach Approach Approach
Long Term Funds Used in
Fixed Assets and Permanent Working Capital
Fixed Assets, Permanent Working Capital and part of Temporary Working Capital
Fixed Assets and part of Permanent Working Capital
Short Term Funds
Temporary Working Capital
Balance of Temporary Working
Balance of Permanent Working
Used in Capital
Capital and entire Temporary
Working Capital
Impact on Comparatively well - High Liquidity Low Liquidity
Liquidity Balanced

Financial Management www.IndigoLearn.com 214
Impact on Comparatively well- Low profitability and return on
High return on assets but risky
Balanced assets
Illustration
A firm has the following data for the year ending 31st March 2011: Rs. Sales (1,00,000@ Rs. 20/-) 20,00,000 Earnings before Interest and Taxes 2,00,000 Fixed Assets 5,00,000 The three possible current assets holdings of the firm are Rs. 5,00,000/-, Rs. 4,00,000/- and Rs. 3,00,000/-. It is assumed that fixed assets level is constant, and profits do not vary with current assets levels. The effect of the three alternative current assets policies is as follows:
Effect of alternative Working Capital Policies
(Amount in Rs.) Working Capital Policy Conservative Moderate Aggressive
Sales 20,00,000 20,00,000 20,00,000 Earnings before Interest and Taxes (EBIT) 2,00,000 2,00,000 2,00,000 Current Assets 5,00,000 4,00,000 3,00,000 Fixed Assets 5,00,000 5,00,000 5,00,000 Total Assets 10,00,000 9,00,000 8,00,000 Return on Total Assets (EBIT / Total Assets) 20% 22.22% 25% Current Assets / Fixed Assets 1.00 0.80 0.60
The aforesaid calculations show that the conservative policy provides greater liquidity (solvency) to the firm, but lower return on total assets. On the other hand, the aggressive policy gives higher return, but low liquidity and thus is very risky. The moderate policy generates return higher than Conservative policy but lower aggressive policy. This is less risky than Aggressive policy but more risky than conservative policy. In determining the optimum level of current assets, the firm should balance the profitability - Solvency tangle by minimizing total costs, Cost of liquidity and cost of illiquidity.
Estimating Working Capital needs
Operating cycle is one of the most reliable method of Computation of Working Capital. However, other methods like ratio of sales and ratio of fixed investment may also be used to determine the Working Capital requirements. These methods are briefly explained as follows:
i. Current assets holding period: To estimate working capital needs based on the average holding period of current assets and relating them to costs based on the company’s experience in the previous year. This method is essentially based on the Operating Cycle Concept.
ii. Ratio of sales: To estimate working capital needs as a ratio of sales on the assumption that current assets change with changes in sales.
iii. Ratio of fixed investments: To estimate Working Capital requirements as a percentage of fixed investments.
A number of factors will, however, be impacting the choice of method of estimating Working Capital. Factors such as seasonal fluctuations, accurate sales forecast, investment cost and

Financial Management www.IndigoLearn.com 215
variability in sales price would generally be considered. The production cycle and credit and collection policies of the firm will have an impact on Working Capital requirements. Therefore, they should be given due weightage in projecting Working Capital requirements.
Importance of the Working Capital Cycle / operating cycle / cash cycle
Meaning: Working Capital Cycle or Cash Cycle or Operating Cycle is the time duration for conversion of cash into cash equivalents like Raw Materials, Work-in-Progress, Finished Goods, sundry Debtors and thereafter back into cash. Representation of the Segments: The operating cycle has the following phases or segments: Operating Cycle ▪ Conversion of Cash into Raw Materials - Lead Time ▪ Conversion of Raw Materials into WIP and then WIP into Finished
Goods - Production / Process Cycle ▪ Conversion of Finished Goods into Debtors through Sales ▪ Stockholding Period ▪ Conversion of Receivables into Cash - Average Collection Period. Computation: Operating Cycle is computed in terms of number of days (or sometimes in months), It is computed as under:
Gross Operating Cycle = Raw Material Storage Period + WIP Conversion Period + Finished Goods Holding Period + Debtors
Collection Period Net Operating Cycle = [Raw Material Storage Period + WIP Conversion Period + Finished Goods Holding Period + Debtors
Collection Period] – Creditors Payment Period
The various components of working capital cycle are computed as under (Based on time taken for Avg. Stock held);
Component Formula Formula based on
Turnover Related Formula
Raw Materials Storage Period
Average Stock of Raw Materials 365 RM turnover ratio =
Average Cost of RM per day Raw Materials Turnover
Ratio
𝑇𝑜𝑡𝑎𝑙 𝑐𝑜𝑠𝑡 𝑜𝑓 𝑅𝑀 𝑐𝑜𝑛𝑠𝑢𝑚𝑝𝑡𝑖𝑜𝑛 𝑝. 𝑎
𝐴𝑣𝑔 𝑠𝑡𝑜𝑐𝑘 𝑜𝑓 𝑅𝑀
WIP Conversion Period
Average Stock of WIP 365 WIP Turnover =
Average Cost of production per
day WIP Turnover Ratio
𝑇𝑜𝑡𝑎𝑙 𝑐𝑜𝑠𝑡 𝑜𝑓 𝑝𝑟𝑜𝑑𝑢𝑐𝑡𝑖𝑜𝑛 𝑝. 𝑎
𝐴𝑣𝑔 𝑠𝑡𝑜𝑐𝑘 𝑜𝑓 𝑊𝐼𝑃
Finished Goods Holding Period
Average Stock of Finished Goods
365 FG turnover =
Average Cost of Goods sold per
day FG Turnover Ratio
𝑇𝑜𝑡𝑎𝑙 𝑐𝑜𝑠𝑡 𝑜𝑓 𝑔𝑜𝑜𝑑𝑠 𝑠𝑜𝑙𝑑 𝑝. 𝑎
𝐴𝑣𝑔 𝑠𝑡𝑜𝑐𝑘 𝑜𝑓 𝐹𝐺
Debtors Collection
Average Accounts Receivables 365 Debtors turnover =

Financial Management www.IndigoLearn.com 216
Note: The average figure in Turnover ratios is calculated by Average of opening and closing Balance. If opening balance is not available, then only closing balance can be taken as Avg. (assuming op.bal = cl.bal)
SIGNIFICANCE OF WORKING CAPITAL CYCLE:
1. Control the time lag in processes: proper monitoring of working capital cycle points out the excess time taken by various processes which ultimately affects the working capital needs.
2. Surplus Generation: It represents the activity cycle of the business, i.e. purchase, manufacture, sales and collection thereof. Hence the operating cycle stands for the process that creates surplus or profit for the business.
3. Funds Rotation: Operating cycle indicates the total time required for rotation of funds the faster the funds rotate, the better it is for the Company.
4. Going Concern: Cash cycle lends meaning to the going concern concept. If the cycle stops in between, the going concern assumption may, be violated.
Hence, Working Capital Cycle should be on par with the industry average. A long cycle indicates overstocking of inventories or delayed collection of receivables and is considered unsatisfactory. Using the Operating Cycle, the Working Capital Turnover can also be computed as 365/Working Capital Cycle. A high turnover ratio indicates a better position.
Approaches to estimation of Working Capital Requirements
Working Capital Requirements can be forecast in two Methods: ▪ By reference to the Operating Cycle (based on time)
Net working capital = 𝑡𝑜𝑡𝑎𝑙 𝑦𝑒𝑎𝑟𝑙𝑦 𝑜𝑝𝑒𝑟𝑎𝑡𝑖𝑛𝑔 𝑒𝑥𝑝𝑒𝑛𝑠𝑒𝑠 × 𝑜𝑝𝑒𝑟𝑎𝑡𝑖𝑛𝑔 𝑐𝑦𝑐𝑙𝑒 𝑝𝑒𝑟𝑖𝑜𝑑
12 𝑚𝑜𝑛𝑡ℎ𝑠 𝑜𝑟 365 𝑑𝑎𝑦𝑠
▪ By estimation of each component of Current assets and Current liabilities (based on value)
The second method is more popularly used in practice. The two approaches to estimation of working capital requirements based on value are: (1) Total Approach – Total amount of current assets and current liabilities are considered. It
means, even non-cash expenses like depreciation and profit margins are included in the valuation of current assets.
(2) Cash Cost Approach - This approach is based on the fact that actual amount of funds blocked in current assets are less than their total value in the books. Only Cash expenses (excluding
Period 𝑇𝑜𝑡𝑎𝑙 𝑐𝑟𝑒𝑑𝑖𝑡 𝑠𝑎𝑙𝑒𝑠 𝑝. 𝑎
𝐴𝑣𝑔 𝐷𝑒𝑏𝑡𝑜𝑟𝑠
Average Credit Sales per day Debtors Turnover Ratio
Creditors Payment Period
Average Accounts Payable 365 Creditors turnover
=
Average Credit Purchases per
day Creditors Turnover Ratio
𝑇𝑜𝑡𝑎𝑙 𝑐𝑟𝑒𝑑𝑖𝑡 𝑝𝑢𝑟𝑐ℎ𝑎𝑠𝑒𝑠 𝑝. 𝑎
𝐴𝑣𝑔 𝑐𝑟𝑒𝑑𝑖𝑡𝑜𝑟𝑠

Financial Management www.IndigoLearn.com 217
depreciation) are included. Profit margins and depreciation are excluded from receivables and inventory.
Estimation of current assets
The estimates of various components of working capital may be made as follows
(Based on value blocked for the holding periods):
S. No
Total approach Cash cost approach
1 Raw materials inventory (RM): The funds to be invested in raw materials inventory may be estimated on the basis of production budget, the estimated cost per unit and average holding period of raw material inventory by using the following formula:
days 360 / weeks52 / months 12
unitper units)(in
material raw ofcost Estimated x production Estimated
x
Note: 360 days in a year are generally assumed to facilitate calculation.
Same
2 Work-in-progress inventory: The funds to be invested in work-in-progress can be estimated by the following formula:
days 360 / weeks52 / months 12
unitper cost units)(in
progress-in- workEstimated x production Estimated
x
In the same formula, Depreciation is excluded from production overhead
3 Finished Goods (FG): The funds to be invested in finished goods inventory can be estimated with the help of following formula:
days 360 / weeks52 / months 12
units)(in
unit)(Per production ofCost x production Estimated
x
In the same formula, Depreciation is excluded from cost of production.
4 Debtors: Funds to be invested in trade debtors may be estimated with the help of following formula:
days 360 / weeks52 / months 12
units)(in
unit)(Per price selling x salescredit Estimated
x
In the same formula, profit margin and Depreciation are excluded from selling price.
5 Minimum desired Cash and bank balances to be maintained by the firm Same
Average RM
holding period
(months /
weeks / days)
Average holding period
of W.I.P. (months/
weeks/days)
FG holding
period (months
/ weeks / days)
Average debtor’s
collection period
(months / weeks /
days)

Financial Management www.IndigoLearn.com 218
has to be added in the current assets for the computation of working capital.
Estimation of current liabilities
Current liabilities generally affect computation of working capital. Hence, the amount of working capital is lowered to the extent of current liabilities (other than bank credit) arising in the normal course of business. The important current liabilities like trade creditors, wages and overheads can be estimated as follows:
(Based on value payable for the delayed periods)
i. Trade creditors:
days 360 / weeks52 / months 12
unitper units)(in
cost material Raw x PURCHASEyearly Estimated
x
ii. Direct Wages:
days 360 / weeks52 / months 12
unitper units)(in
Cost labour Direct x production Estimated
x
iii. Overheads (other than depreciation and amortization):
days 360 / weeks52 / months 12
unitper units)(in
cost Overhead x productionyearly Estimated
x
Note 1: Op. Bal + Purchases – Cl. Bal = RM Consumed p.a., hence If the company is NOT said to be a new company & if the opening & closing balances of Raw Materials are not given, assume those balances are same & then RM Purchased p.a = RM consumed p.a But if the company is said to be a NEW company => opening balance = 0 & hence
RM Purchased p.a = RM consumed p.a + closing stock of RM
Note 2: Estimation of current liabilities remain the same under total and cash cost approach Note 3: In the absence of information, assume all purchases and sales are on credit basis. Note 4: In the case of selling overheads, the yearly SALES volume is considered but NOT yearly PRODUCTION.
Credit period granted by
suppliers (months / weeks /
days)
Average time lag in payment of
wages (months / weeks / days)
Average time lag in
payment of overheads
(months / weeks / days)

Financial Management www.IndigoLearn.com 219
CONSIDERABLE COMPONENTS P.A. FOR VALUATION OF VARIOUS ITEMS:
Component Total Approach Cash Cost Approach.
Raw Materials Raw Material Consumption
Cost net of discounts
Raw Material Consumption Cost net of discounts
Work in Progress
Raw Materials + 50% of [Direct
Raw Materials + 50% of [Direct
Labour + Direct Expenses + Labour + Direct Expenses + Production
Overheads
Production Overheads]
Excluding Depreciation]
Note on WIP: WIP consists of raw material. We take full cost of raw material which is being worked upon since production starts with full units of raw material. Other components of WIP like labour and overheads are assumed to accrue evenly, and we assume them to be 50% complete. This method of estimation may change depending upon the information given in the question.
Finished Goods Cost of Production Cost of Production Less Depreciation
Sundry Debtors Selling Price or Total Cost
Selling Price Less Profit Margin Less Depreciation
or Total Cash Cost
Sundry Creditors
Purchase Price of Raw Material
net of discounts
Purchase Price of Raw Material net of discounts
Factors determining HIGH / LOW working capital requirements
A number of factors determine whether the amount of Working Capital held by a firm is high or low. Some illustrative factors are listed below:
Factor High Working Capital Low or Moderate Working
Capital
1. Production Policies High Production during peak season e.g.
Uniform Production over the year
diaries, calendars etc.
2. Production Process Labour Intensive Process Capital Intensive Process
3. Length of manufacturing
Long manufacturing process or Short and quick manufacturing process.
Process Production cycle more batch runs etc.
4. Nature of Business Manufacturing concerns Trading Concerns
5. Credit Policy Liberal Credit Policy and low efforts for debtor’s follow-up
Strict Credit and efficient credit collection Mechanism
6. Market Standing Newly established concern – Credit Sales are made but purchases are settled in cash.
Reputed and established companies - better and advantageous credit terms with debtors and suppliers.
7. Inventory Policy High Storage period or Just in Time Inventory Policy and

Financial Management www.IndigoLearn.com 220
Factor High Working Capital Low or Moderate Working
Capital
Stockholding
Period moderate stockholding period
8. Market conditions Fierce Competition or Buyer's market
Seller's market - quick disposal of stocks
and immediate collection of receivables
9. Inflationary conditions
In case of highly inflationary conditions.
For moderate and mild inflationary
conditions.
10. Business Cycle During peak or boom conditions During moderately active conditions
Costs of maintaining receivables
The cost of maintaining receivables comprises the following: (1) Interest on Investment: Additional funds are blocked in receivables. This involves cost in the
form of interest (in case of loan funds) or opportunity cost of capital (in case of own funds). (2) Administrative Costs: Costs of record keeping, investigation of credit worthiness etc. (3) Delinquency Costs: Costs of reminders, phone calls, follow-up letters etc. (4) Collection Costs: Cost of contacting customers, collecting cheques in person, outstation
collection charges, etc. (5) Defaulting Costs: Bad debts, legal charges in respect of suits pending against debtors etc. (6) Credit worthiness analysis costs – whether customer should be granted credit or not (7) Cash Discount Note: These costs are compared with benefits, i.e. Additional Contribution, in the evaluation of credit period or credit policy.
Importance of proper management of Sundry Debtors
High Investment: If large amounts are tied up in sundry debtors, working capital requirements and consequently interest charges will be high. Also, bad debts and cost of collection of debts would be high.
Low Investment: If the investment in sundry debtors is low, the sales may be restricted, since the competitors may offer more liberal credit terms.
Hence, management of sundry debtors is an important issue and requires proper policies and efficient execution of such policies.
Aspects of management of debtors
The three basic aspects of management of sundry debtors are: (A) Credit Policy - decisions on credit period to be allowed (B) Discount Policy - decisions on discount to be allowed (C) Factoring – Trade - off between Factoring cost & Control over Receivables
A. CREDIT POLICY

Financial Management www.IndigoLearn.com 221
Credit Policy: This involves decisions relating on the following aspects of credit: (1) Length of the credit period; (2) Discount Policy; (3) Other special items. Role: The credit policy determines the investment in sundry debtors, average collection period and bad debt losses. Hence, credit policy of a firm should enable it to achieve the following objectives: (1) Increasing sales and market share (2) Increasing profits due to higher sale and higher margins on credit sales. (3) Meeting competition. Credit Period Meaning: Credit Period denotes the period allowed for payment by customers, in the normal course of business. Factors: Credit period depends on a number of factors, for example: (1) Nature of product i.e. if demand is inelastic or if product is perishable, credit period may be
small. (2) Quantum of Sales - Credit may not be allowed if small quantities are purchased. (3) Customs and Practices - normal trade practices and those followed by competitors (4) Funds available with the Company (5) Credit Risk i.e. possibility of bad debts Expression: The credit period is generally stated in terms of net days. For example, if the credit terms are "net 45", it means that customers will repay credit obligations not later than 45 days.
B. DISCOUNT POLICY
Meaning: In the context of Debtors Management, Discount Policy involves decisions relating to: ▪ Percentage of Cash Discount to be offered as incentive for early settlement of invoice ▪ Period within which cash discount can be availed.
Role: Discounts are given to speed up the collection of debts. Hence, it improves the liquidity of the seller. It also ensures prompt collection and reduces risk of bad debts.
Expression: Normally, credit terms are expressed in this order: (a) the rate of cash discount, (b) the cash discount period and (c) the net credit period. For example, credit terms of "2/10 net 60" means that a cash discount of 2% will be granted if customer pays within 10 days; if he does not avail the offer, he must pay within 60 days, being the credit period.
Factors to be analyzed before credit is granted to a customer
A firm selling on credit terms cannot extend credit to all customers. Credit granting decision is taken on a case – to – case basis, based on the following illustrative factors: (a) Nature of Product: Generally perishable items are sold on "cash and carry" basis, while durable
/ non-perishable items may be sold on credit. (b) Nature of customer: A Valued customer, who has long and favorable past dealings with the
firm may be given credit immediately than, a new customer. However, credit may also be offered for attracting new customers.
(c) Quantity purchased: Firms may decide to grant credit only beyond a certain lot size. For example, sale up to 5 kg per invoice is made on cash basis only, while orders beyond 5 kg may

Financial Management www.IndigoLearn.com 222
be supplied on credit. (d) Value of Sales: Sometimes, the invoice value (instead of quantity) may be the determinant in
a credit decision. For example, credit may be granted for amounts exceeding Rs. 15,000 (e) Credit worthiness of the customer: The creditworthiness of the customer is the most crucial
factor in deciding whether credit should be granted or not. This is based on past experience (for existing customers) and credit analysis (for existing and new customers).
(f) Risk of Bad Debts: The extent of risk of bad debts that a firm can bear should be determined. For example, if there is a 1 % chance of bad debts, the firm may take the risk of credit supply, but when the chance of bad debts is 55%, credit should not be granted.
Credit granting is a two-phase decision-making process: Phase I - Whether Credit should be granted at all? - Decision to be based on Credit Rating. Phase II - Up to what limits and how long credit be granted? - Decision to be based on Cost
Benefit Analysis.
Various sources of Credit Rating information
Credit rating of a customer involves finding answers to two broad questions: (1) Can he say? i.e. ability or financial strength. (2) Will he pay? i.e. attitude in meeting payment obligations. A firm has to ascertain the credit rating of prospective customers, to ascertain how much and how long can credit be extended. Credit can be granted only to a customer who is reliably sound. This decision would involve analysis of the financial status of the party, his reputation and previous record of meeting commitments. The following are the important sources of credit information: (1) Trade references: The prospective customer may be required to give two/three trade
references. Thus, the customers may give a list of personal acquaintances or some other existing credit-worthy customers. The credit manager can send a short questionnaire, seeking relevant information, to the referees.
(2) Bank references: Sometimes, the customer is asked to request the banker to provide the required information. In India, bankers do not generally give detailed and unqualified credit reference.
(3) Credit bureau reports: Associations for specific industries may maintain a credit bureau report which provides useful and authentic credit information for their members.
(4) Past experience: The past experience of dealings with an existing customer is a valuable source of essential data. The transactions should be carefully scrutinized and interpreted for finding out the credit risk involved.
(5) Published financial statements: Published financial statements of a customer, (in case of limited companies) can be examined to determine the Creditworthiness.
(6) Salesman's interview and reports: Creditworthiness can be evaluated by the reports provided by consulting salesmen or sales representatives. Such reports provide first-hand information to the Company for proper determination of the credit limit.
Decision tree analysis of credit granting
Meaning: Decision Tree Analysis is one of the techniques of Cost - Benefit Analysis, as to whether credit can be granted or not. Probability: Under this technique, future uncertain events (like payment by customer, non-payment by customer) are assigned probabilities, based on the chances estimated by the firm. For example, if the chances of recovering the dues are 9 out of 10, the probability of recovery is 0.9 or 90% and that of default is 0.1 or 10%.

Financial Management www.IndigoLearn.com 223
Expectations: The net expected earnings of each event is determined on the basis of probabilities: ▪ Expected Profit in case of payment = [Sales Less Costs] X Probability of Payment ▪ Expected Loss in case of default = Costs X Probability of Default This is because, when a customer pays, the seller makes profit but when he fails to pay the amount the cost of the product is also lost. Decision: Decisions are based on the expected profits / losses. If there is net expected profit, credit may be granted. However, in case of net expected loss, credit should not be granted.
Collection Policy
Role of collection Policy: Average Collection Period and Bad Debt losses are reduced by efficient and timely collection of debtors. Hence, a proper collection policy should be laid down. Aspects of Collection Policy: The following aspects should be covered in Collection Policy and procedures. ▪ Timing of the collection process - when to start reminding etc. ▪ Dispatch of reminder letters to Customers. ▪ Personal follow-up by Company's representatives and telephonic calls. ▪ Appointment of agents for collection or follow-up. ▪ Dealing with default accounts, legal action to be initiated, notice to defaulting customer etc. Cost Benefit Analysis: There are certain routine costs associated with collection from customers e.g. contacting customers, collecting cheques in person, collection agency fees etc. If a firm spends more on collection of debts, it is likely to have smaller bad debts. Hence the amount of collection costs to be incurred should be determined by Cost-Benefit Analysis i.e. level of expenditure on one hand and decrease in bad debt losses and investment in debtors on the other.
Measures for monitoring receivables
Monitoring of receivables involves the following measures: (1) Average Age of Receivables: Debtors Turnover Ratio and Average Collection Period are worked
out at periodic intervals. These are compared with the industry norms or the standards set by firm. In case of high collection period, intense collection efforts are initiated.
(2) Ageing Schedule: The pattern of outstanding dues / receivables is determined by preparing
Grant credit

Financial Management www.IndigoLearn.com 224
the Ageing Schedule. If the receivables denote old outstanding dues for longer periods, suitable action should be taken to collect them immediately.
(3) Collection Programme: The procedures for collection e.g. reminding letters, direct follow-up etc. should be initiated based on the company's policies and procedures.
Notes on Ageing Schedule.
Meaning: In 'Ageing Schedule', the receivables are classified according to their age, i.e. period for which they have been outstanding. e.g. less than' 30 days, 30-45 days, 45-60 days, above 60 days etc. Role: Preparation of ageing schedule helps management in the following ways: (a) Analysis of quality of individual accounts (b) Intra-firm and Inter-firm comparison, i.e. comparing liquidity of present receivables with the
past periods and also comparing current liquidity of receivables of one firm with that of other firms
(c) Trend Analysis of debtors (d) Supplement to average collection period of receivables / sales analysis. (e) Recognition of recent increase and slump in sales. An illustrative Ageing Schedule is given below:
Period due No. of parties
No. of bills
Amount due
% of Total Remarks
< 15 days 65 70 34,180 3.42% Less than normal credit
period
16 - 30 days 12 80 46,840 4.68% Less than normal credit
period
31 - 45 days 86 241 3,83,690 38.37% Normal Credit Period debts
46 - 60 days 91 196 3,59,960 36.00% Regular reminders sent
61 - 90 days 43 52 97,100 9.71% Special reminders sent
91 - 180 days
12 22 41,350 4.13% Rs. 18, 150 doubtful -
party may be insolvent.
181-365 days
6 9 8,000 0.80% Legal notice sent - reply
due
> 1 year 3 3 17,860 1.79% Suit filed - decision awaited
> 2 years 2 2 11,020 1.1 0% Suit filed - decision awaited
Total 320 675 10,00,000 100.00
%
The above schedule shows that about 75% of the company's receivables are about 31-60 days due. It can be compared with corresponding schedules for previous years so as to analyse trend of Collection Management.
Collection Program
The following are the illustrative steps in a collection program. (a) Monitoring the state of receivables. (b) Intimation of due dates to customers. (c) Telegraphic and telephonic advice to customers on the due date. (d) Threat of legal action on overdue accounts.

Financial Management www.IndigoLearn.com 225
(e) Legal action on overdue accounts.
Alternatives for external financing of Receivables
The following are some alternatives for external financing of Accounts Receivables / Debtors. (a) Bills Discounting. (b) Loans against Book Debts. (c) Loans against supply of bills to Government Departments. (d) Factoring, Forfaiting etc. (e) Debt Securitization. (f) Advances from Customers. (g) Inter Corporate Deposits (h) Commercial Papers (i) Public Deposits
Innovations in Receivable management
Following are the major determinants for significant innovations in accounts receivable management and process efficiency. 1. Re-engineering Receivable Process: In some of the organizations real cost reductions and
performance improvements have been achieved by re-engineering in accounts receivable process. Re-engineering is a fundamental re-think and re-design of business processes by incorporating modern business approaches. The nature of accounts receivables is such that decisions made elsewhere in the organization are likely to affect the level of resources that are expended on the management of accounts receivables.
The following aspects provide an opportunity to improve the management of accounts receivables. a. Centralization: Centralization of high nature transactions of accounts receivables and
payable is one of the practices for better efficiency. This focuses attention on specialized groups for speedy recovery.
b. Alternative Payment Strategies: Alternative payment strategies in addition to traditional practices result into efficiencies in the management of accounts receivables. It is observed that payment of accounts outstanding is likely to be quicker where a number of payment alternatives are made available to customers. Besides this, providing convenient payment methods is a marketing tool that is of benefit in attracting and retaining customers. The following alternative modes of payment may also be used along with traditional methods like Cheque Book, online payments etc., for making timely payment, added customer service, reducing remittance processing costs and improved cash flows and better debtor turnover.
i. Direct debit: i.e. authorization for the transfer of funds from the purchaser’s bank account.
ii. Integrated Voice Response: This system uses human operators and a computer-based system to allow customers to make payment over phone, generally by credit card. This system has proved to be beneficial in the organisations processing a large number of payments regularly.
iii. Collection by a third party: The payment can be collected by an authorized external firm. The payments can be made by cash, cheque, credit card or Electronic fund transfer. Banks may also be acting as collecting agents of their customers and directly depositing the collections in customer’s bank accounts.
iv. Lock Box Processing: Under this system customers are instructed to send cheques to designated post box. The bank collects cheques from the boxes directly.

Financial Management www.IndigoLearn.com 226
v. Payments via Internet.
2. Evaluation of Risk: Risk evaluation is a major component in the establishment of an effective control mechanism. Once risks have been properly assessed controls can be introduced to either contain the risk to an acceptable level or to eliminate them entirely. This also provides an opportunity for removing inefficient practices.
3. Use of Latest Technology: Technological developments now-a-days provides an opportunity for improvement in accounts receivables process. The major innovations available are the integration of systems used in the management of accounts receivables, the automation and the use of e-commerce.
a. E-commerce: It refers to the use of computer and electronic telecommunication technologies, particularly on an inter-Organisational level, to support trading in goods and services. It uses technologies such as Electronic Data Inter-change (EDI), Electronic Mail, Electronic Funds Transfer (EFT) and Electronic Catalogue System to allow the buyer and seller to transact business by exchange of information between computer application system. b. Accounts Receivable System: Now-a-days all the big companies develop and maintain automated receivable management systems. Manual systems of recording the transactions and managing receivables, is not only cumbersome but ultimately costly also. These integrated systems automatically update all the accounting records affected by a transaction. For example, if a transaction of credit sale is to be recorded, the system increases the amount the customer owes to the firm, reduces the inventory for the item purchased, and records the sale. This system of a company allows the application and tracking of receivables and collections, using the automated receivables system allows the company to store important information for an unlimited number of customers and transactions, and accommodate efficient processing of customer payments and adjustments.
4. Receivable Collection Practices: The aim of debtor’s collection should be to reduce, monitor and control the accounts receivable at the same time maintain customer goodwill. The fundamental rule of sound receivable management should be to reduce the time lag between the sale and collection. Any delays that lengthen this span causes receivables to unnecessary build up and increase the risk of bad debts. The following are major receivable collection procedures and practices: i. Issue of Invoice
ii. Open account or open-end credit
iii. Credit terms or time limits
iv. Periodic statements
v. Use of payment incentives and penalties
vi. Record keeping and Continuous Audit
vii. Export Factoring
5. Business Process Outsourcing: This refers to a strategic business tool whereby an outside agency takes over the entire responsibility for managing a business process.
FACTORING
• A factor is a financial institution which offers services relating to management and financing of debts arising from credit sales
• It is not just a single service, rather a portfolio of complementary financial services available to clients i.e., sellers.
SERVICES MADE AVAILABLE TO CLIENTS BY A FACTOR 1. Credit investigation

Financial Management www.IndigoLearn.com 227
2. Sales ledger management, 3. Invoicing 4. Purchase of receivable 5. Advance 6. Bad debt risks 7. Collection and monitoring of debts.
MECHANICS OF FACTORING
2) Places Order
3) Delivery of Goods & Invoice with notice to pay Factor 5) Pre-payment Up to 80% 8) Balance Amount 6) Follow up 7) Payment 4) Copy of
1) Extension Invoice of Factoring documentation
Mechanics of Factoring The following is the procedure in factoring service –
• Seller (Client) negotiates with the factor for establishing factors relationship.
• Request by seller for credit check on the buyer (customer) whose name and address are furnished to the factor.
• Factor checks the credit credentials and approves the buyer, a credit limit and the period up to which credit can be given.
• Seller sells goods to the buyer.
• Seller sends invoice to the factor. The invoice is accounted for in the buyers’ accounts in the factor’s sales ledger.
• Factor sends notice of assignment / copy of invoice to the buyer.
• Factor advises the amount to which seller is entitled after retaining margin, say, of 20%, the residual amount being paid later.
• On the expiry of the agreed credit period, buyer makes the payment of invoice to the factor. At this point the factor pays to seller margin money retained as per point above. If, however, the buyer defaults to pay the factor, it would still make the final payment to the seller in the case of without recourse factoring.
Key features –
1. The factor selects the accounts of the client that would be handled by it and establishes, along with the client, the credit limits applicable to the selected accounts.
2. The factor assumes responsibility for collecting the debt of accounts handled by it. For each account, the factor pays to the client at the end of the credit period or when the account is collected, whichever comes earlier.
CLIENT
(SELLER)
CUSTOMER OF THE
CLIENT
FACTOR

Financial Management www.IndigoLearn.com 228
3. The factor advances money to the client against not yet collected and not yet due debts. The credit is usually extended up to 70% to 80% of the face value of the debts and carries interest rates which may be equal to or marginally higher than the lending rate of commercial banks.
4. Factoring may be on recourse basis (this means that the credit risk is borne by the client) or on a non-recourse basis (this means that the credit risk is borne by the factor). Presently factoring in India is done on recourse basis.
5. Besides the interest on advances against debt, the factor charges a commission which may be 1 to 2 per cent of the face value of the debt factored.
6. Generally, client notifies to the customer the existing factoring arrangement between the seller and factor and advises customer to pay directly to the factor. This is known as disclosed factoring. Whereas in undisclosed factoring, such notification is not made, and the client makes over payment to the factor on receipt from debtors, if advance has been availed of against such debts.
7.
ADVANTAGES OF FACTORING
1. Convertibility: Conversion of Account Receivable in cash without botheration of repayment.
2. Definite pattern of cash flow: Ensuring definite pattern of cash flow from credit sales.
3. Continuous factoring may eliminate the need of Credit and Collection Department.
4. Reduction in collection and administration cost: Relieving the borrowing firm of substantial credit and collection costs.
5. Management can focus on its core activity.
6. Reduction in bad debts.
7. Factor provides advisory services.
8.
LIMITATIONS OF FACTORING
1. Cost of factoring tends to be higher than the cost of other forms of short-term borrowing.
2. Factoring of debt may be perceived as a sign of financial weakness.
3. Business secrecy may be diluted.
TYPES / FORMS OF FACTORING:
a. Recourse Factoring – Under recourse factoring, the factor purchases the receivables on the condition that any loss arising out of irrevocable receivables will be borne by the client.
Types / Forms of Factoring
Recourse Factoring
Non-recourse or Full
factoring
Maturity Factoring
Advance Factoring
Notified Factoring
Non-notified
(Undisclosed)
Factoring
International
Factoring

Financial Management www.IndigoLearn.com 229
In other words, the factor has recourse to the client if the receivable purchased turnout to be irrecoverable.
b. Non-recourse or Full factoring – As the name implies, the factor has no recourse to the client if the receivables are not recovered, i.e. the client gets total credit protection. In this type of factoring, all the components of service, viz. Short-term finance, administration of sales ledger and credit protection are available to the client.
c. Maturity Factoring – Under this type of factoring arrangement, the factor does not make any advance or pre-payment. The factor pays the client either on a guaranteed payment date or on the date of collection from the customer.
d. Advance Factoring – In this, the factor makes prepayment of around 80% of the invoice value to the client. The balance is paid on collection / guaranteed payment date.
e. Notified Factoring – In case of notified or Disclosed Factoring ‘factoring, the customer is intimated about the assignment of debt to the factor and also directed to make payments to the factor instead of the firm.
f. Non-notified (Undisclosed) Factoring – This facility is one under which the supplier / factor arrangement is not disclosed to the customer unless there is a break of the agreement on the part of the supplier or, exceptionally, where the factor considers himself to be at risk.
g. International Factoring – This deal with exports. The factoring service may include completing legal and procedural formalities pertaining to export. It is also called export cross-border factoring. The parties in this factoring are exporter (client), importer (customer), export factor and import factor.
h.
DIFFERENCE BETWEEN FACTORING VS. BILLS DISCOUNTING
S.no.
Particulars Bills Discounting Factoring
1 Parties Buyer of Goods – Drawee
Seller of goods – Drawer
Financier – Payee
Buyer of Goods – Debtors
Seller of goods – Client
Financier – Factor
2 Nature It is a method of borrowing from commercial bank
It is a method of management of receivables.
3. Pattern of financing
The entire amount of the bill of exchange is discounted and provided at the time of transaction itself.
Factor gives an advance, say 90%, at the time of transaction and provides the balance at the time of settlement.
4 Additional services
The bank provides advance / finance against bills of exchange / invoice.
Factors provides financial services and other services like follow-up with debtors, sales ledger maintenance, collection, credit investigation, etc.
5 Risk of bad debts
Risk of bad debts is retained by the seller of the goods. If the customer defaults in making payment to the bank, the selling firm will have to indemnify the bank by paying the amount.
In non-recourse factoring, the risk of bad debts is passed on to the factor.

Financial Management www.IndigoLearn.com 230
Treasury Management
Treasury Management refers to efficient management of liquidity and financial risk in business. The responsibilities of Treasury Management include: (a) Management of Cash, while obtaining the optimum return from surplus funds; (b) Management of foreign exchange rate risks, in accordance with the Company policy; (c) Providing long-term and short-term funds as required by the business, at the minimum cost; (d) Maintaining good relationship and liaison with financiers, lenders, bankers and investors
(shareholders); and (e) Advising on various issues of corporate finance like capital structure, buy-back, mergers,
acquisitions, disinvestments etc.
Functions of the Treasury Department
The responsibilities of the Treasury Department are discharged through its functions. These are as under: (b) Cash Management: This involves aspects such as:
▪ Planning or forecasting future cash requirements through Cash Budgets. ▪ Efficient collection of receivables and payment of liabilities through float management. ▪ Monitoring of funds position at various divisions / branches and identifying surplus or idle
funds to transfer them to other divisions. ▪ Investment planning or parking of surplus funds in marketable securities to optimize return ▪ Centralization of collections and release of funds to various divisions.
(c) Currency Management: This involves aspects such as:
▪ Managing the foreign currency risk exposure through hedging or forward or futures. ▪ Timely settling or setting off of intra-group indebtedness when there are divisions in various
countries. ▪ Matching transactions of receipts and payments in the same currency to save transaction
costs. ▪ Decision on currency to be used while invoicing export sales.
(d) Fund Management: This involves aspects such as:
▪ Planning of long-term, medium-term and short-term cash needs. ▪ Participation in decisions concerning capital structure, dividend payout etc. ▪ Obtaining the fund requirements from various sources like bank loans, public issues etc.
(e) Banking Liaison: This involves aspects such as:
▪ Maintaining cordial and good relationships with bankers, lending institutions and financiers ▪ Coordinating, liaising and negotiating with the lenders during obtaining finance.
(f) Corporate Finance: This involves aspects like:
▪ Advising on various issues such as buy-back, mergers, acquisitions and divestments. ▪ Investor relationships. ▪ Capital Market Intelligence - obtaining information on market trend, timing of public issue
6 Statute Negotiable Instruments Act is applicable
There is no specific Act
7 Grace time Grace time is 3 days Grace time is not given.
8. Income to financier
Bank earns discounting charges. Factor earns interest on advance and commission for other services rendered.

Financial Management www.IndigoLearn.com 231
etc.
Important areas of Cash Management
The Finance Manager should consider the following important areas of Cash Management. (a) To ensure that sufficient cash is available at each division or section for routine operations. (b) To ensure liquidity in all divisions of the organisation. (c) To identify surplus funds in certain divisions and transfer them to other divisions requiring
them. (d) To invest surplus or idle funds in marketable securities in order to optimize return on funds.
Basic needs or considerations for holding cash
According to Lord Keynes, the basic considerations in determining the amount of cash or liquidity are: (a) Transaction or Operation Needs: Cash may be held sufficiently in order to meet day-to-day
expenses, repayments, commitments etc. In case the forecast receipts or inflows do not arise as planned, the reserve cash balance will be available for meeting payment commitments.
(b) Speculative or Investment Needs: Cash may be held in order to take advantage of profitable opportunities that may crop up. e.g. purchase of materials in bulk in case of temporary fall in price. Otherwise, such opportunities may be lost for want of ready cash.
(c) Precautionary or Safety Needs: Cash may be held in order to provide safety against unexpected events and payments. Sufficient cash holding gives a sense of security or safety to the firm.
Cash Budgets
Cash Budgets are a tool for forecasting short-term cash requirements of an enterprise. They provide a blueprint of the cash inflows and outflows that are expected to occur in the immediate future period. They assist the management in determining the surplus or shortage of funds and to take suitable action. Cash Budgets are generally prepared in the following format, for short periods, say month by month:
Particulars Amount
a. Opening Balance of Cash
b. Cash Inflows or Receipts:
▪ Cash Sales
▪ Receipts from Debtors
▪ Other Revenue Receipts
▪ Capital Receipts (to be specified) Sale of fixed assets / investments Issue of shares / debentures / bonds / loan taken
c. Cash Outflows or Payments:
▪ Payment to Creditors for Goods
▪ Expenses and To Creditors for Services
▪ Other, payments, which occur periodically like debenture
interest, advance
tax, dividend, sales tax etc.
▪ Capital Expenditures / purchase of fixed assets

Financial Management www.IndigoLearn.com 232
Purchase of investments
▪ Repayment of Loans / redemption of shares / debentures
d. Surplus or Shortage = b - c = Inflows less Outflows
e. Closing Balance of Cash = a + d = Opening Balance + Surplus
Distinguish between Cash Flow Statements and Cash Budgets.
Particulars Cash Flow Statements Cash Budgets
Meaning It is a statement which shows the
manner It is a statement, which shows the
plans for
in which funds (cash) has been
utilized in receipt and utilization of cash for a
certain Operational, Investing and Financing future period of time.
Activities.
Time Period It can be prepared either for a past
financial It is essentially a future-oriented
statement.
period or projected into the future. There is no Cash Budget for a past
period.
Nature of flows
It is a long-term cash forecasting tool e.g.
It is essentially a short-term forecasting tool
a year, 5 years, 10 years etc. and is and is prepared on a monthly basis.
prepared on an annual basis.
Purposes ▪ Analysis of cash movements for a The purpose is primarily to serve
internal
past period management for forecasting future
cash
▪ Compliance with statutory
requirements requirements, identifying cash
surplus and
where AS - 3 is applicable shortage in future, short-term
investment
▪ Cash forecasting purpose, when decisions etc.
prepared for future periods
Format When statutory disclosure is
required, There is no specified mandatory
format for
Cash Flow Statements should
conform Cash Budgets as it is purely an
internal
to AS-3. document used for budgeting
purposes.
Various types of floats in the context of Cash Management
The term "float” denotes a delay or lag between two events. In the context of cash management,

Financial Management www.IndigoLearn.com 233
Credit of Cheque by Bank
the term float is usually used for the following delays Dispatch of Finished Goods to Customer
Billing Float
Preparation of Bill or Invoice
Mailing Float Receipt of invoice by customer
Credit Period
Payment of amount due under the invoice
Mailing Float
Receipt of Cheque (by the Seller)
Cheque Processing Float
Deposit of Cheque into Bank Banking Processing Float
To convert receivables into cash quickly, all the floats have to be reduced to the minimum. While credit period is considered as a policy decision, all other floats can be reduced by judicious managerial action.
Measures for reducing various floats in management of Cash
Some measures to reduce floats in Cash Management are:
Type of Float Technique
Billing Float Immediate preparation of bill, on the date of dispatch of goods
Mailing Float - in sending invoice to customer
Use of faster modes of mailing, including e-mail
Sending the invoice by fax first, followed by normal mail.
Mailing Float - receipt of cheque from customer
Cheque Processing Float Concentration Banking and Lock Box System Banking Processing Float
Concentration Banking
Procedure: This method of collection from customers operates as under: (b) Identify locations or places where major customers are placed, i.e. a Company with Head
Office at Chennai and customers based in Delhi, Kolkata and Mumbai. (c) Open a Local Bank Account in each of these locations i.e. Delhi, Kolkata and Mumbai. (d) Open a local collection center for receiving cheques from these customers at the respective

Financial Management www.IndigoLearn.com 234
places. A Branch Office or even an Agent can perform the role of a Collection Centre. (e) Collect remittances from customers locally, either in person or through post. (f) Deposit the cheques received in the local bank account for clearing. (g) Transfer the funds to Head Office Bank Account, upon realization of cheques. Advantages: (a) Reduction in Mailing Float: Since remittances from customers are collected locally either in
person or by local post / courier, mailing float is reduced substantially. (b) Reduction in Banking Processing Float: Cheques are cleared locally, and the funds are made
available faster. There need not be any waiting time for clearance of outstation cheques. (c) Centralized Cash Management: As surplus funds are transferred to Head Office Concentration
Bank Account, idle funds in various locations are avoided. Centralized Cash Management ensures optimum use of funds available to the company and enables payment planning.
Role of lock Box System in reducing float
Procedure: This method of collection from customers operates as under: (b) Identify locations or places where major customers are placed, i.e. a Company with Head
Office at Chennai and customers based in Delhi, Kolkata and Mumbai. (c) Open a Local Bank Account in each of these locations i.e. Delhi, Kolkata and Mumbai. (d) Instruct customers to mail their payments to the Local Bank. [The invoice may carry
instructions like "Mail your payment to Corporation Bank A/c No. 157483 P.O. Box No. 7083, Andheri Branch, Mumbai]
(e) Authorize the Bank to pick up remittances from the post box. (f) Authorize the Bank to realize the cheques through local, collection / clearing. (g) Transfer the funds to Head Office Bank Account, upon realization of cheques. Advantages: (a) Reduction in Mailing Float: Since remittances from customers are collected locally either in
person or by local post / courier, mailing float is reduced substantially (b) Reduction in Cheque Processing Float: The Bank would prepare a list of remittances received
and forward it to the Company as a Credit Advice. This saves cheque processing float at the Company's office, prior to collection.
(c) Reduction in Banking Processing Float: Since cheques are cleared locally, the funds are made available faster. There is no delay in collection of outstation cheques.
(d) Centralized Cash Management: Since surplus funds are transferred to Head Office Bank Account, idle funds in various locations are avoided. Centralized Cash Management ensures optimum use of funds available to the company and enables payment planning.
Notes on Cash Management Models
(a) There are several mathematical models, which help to determine the optimum cash balance to be carried by a firm, at any given point of time.
(b) The major objective of these models is to ensure that cash does not remain idle with the firm and at the same time it is not confronted with cash shortage.
(c) The models can be broadly divided into two categories. ▪ Inventory Type Models - Cash flows are expected to arise uniformly, day-by-day, during the year. ▪ Stochastic Models - Cash flows are expected to be uneven and different on various dates. ▪
WiIIiam J. Baumol's EOQ model for optimum cash balance.
The Baumol model on Optimum Cash Balance is similar to Wilson's model on raw material EOQ.

Financial Management www.IndigoLearn.com 235
Assumptions: The Optimum Cash Balance model is based on the following assumptions: (a) Uniform Cash Flows: Cash payments arise uniformly during a year. For example, if the total
annual cash outflow is Rs. 36,00,000 and there are 300 working days, the average payment per day = Rs. 36,00,000 / 300 days = Rs. 12,000 per day.
(b) Fixed Transaction Costs: Surplus cash can be invested in short-term marketable securities. However, for every purchase of securities (i.e. investments) and for every sale (i.e. disposal of investments), fixed transaction costs are incurred e.g. brokerage, registration costs, clerical expenses etc. Hence, these costs rise along with the number of transactions (i.e. purchase and sale of securities).
(c) Fixed Holding Costs.: Surplus cash, if held by the firm, entails loss of interest at a fixed rate. This constitutes the carrying costs of cash, i.e. the interest foregone on marketable securities.
(d) Free marketability: Short-term instruments can be freely traded. The firm can invest them at any time and sell off / dispose investments at any time.
Theory: According to this model, optimum investment size is that level of investment where the total of carrying costs and transactions costs per annum are the minimum. At that point, these two costs are equal and constitute half of the total costs.
Formula: Optimum Investment Size = I
2AT
Where A = Annual Cash Requirements T = Costs per Transaction I = Interest rate, i.e. Carrying Cost per rupee of
Cash Limitation of Baumol Model
The limitation of the Baumol’s model is that it does not allow the cash flows to fluctuate. Firms in practice do not use their cash balance uniformly nor they are able to predict daily cash inflows and outflows. The Miller-Orr (MO) model overcomes this shortcoming and allows for daily cash flow variation.
Miller-Orr Cash Management Model
Stochastic Cash Flow Assumption: Under this model, cash payments are presumed at different amounts on different days, i.e. stochastic. In practice, the payment flow is not uniform. For example, wage and salary payment arises in the first week, telephone bills fall due for payment once in a month etc. With this assumption, this model is designed to determine the time and size of transfers between an investment account and cash account. Theory: This model operates as under: (a) Cash outflows are not uniform during the year. (b) Upper and lower limits can be fixed for cash balances, as outflows do not exceed a certain
limit on any day. These limits are determined based on fixed transaction costs, interest foregone on marketable securities and the degree of likely fluctuations in cash balances.
(c) When cash balance reaches the upper limit, surplus cash is invested in marketable securities, to bring down the cash balance to the average limit or return point.
(d) When cash balance touches the lower limit, investments (marketable securities) are disposed of so that cash balances goes up to the average limit or return point.
(e) During the period when cash balance stays between high and low limits, there are no transactions between cash and marketable securities.

Financial Management www.IndigoLearn.com 236
Recent development in cash management
Now-a-days, electronic delivery and payment system are becoming increasingly important because of increased competition and the demand for more efficient and convenient capabilities. A considerable number of transactions and amounts of funds can be moved electronically from one place to another almost instantaneously. Therefore, we can easily observe the rapid transition from the most basic and traditional principles to now complex strategies dominated by the technology and globalization, but the basic goal is same i.e. the efficient utilization of cash in a way which is consistent with the overall strategic objectives of a business unit.
a. Electronic Fund Transfer: With the developments which took place in the information technology, the present banking system is switching over to the computerization of banks branches to offer efficient banking services and cash management services to their customers. The network will be linked to the different branches, banks. This will help the customers in the following ways:
• Instant updating of accounts
• The quick transfer of funds.
• Instant information about foreign exchange rates.
b. Zero Balance Account: For efficient cash management some firms employ an extensive policy of substituting marketable securities for cash by the use of zero balance accounts. Every day the firm totals the cheques presented for payment against the account. The firm transfers the balance amount of cash in the account if any, for buying marketable securities. In case of shortage of cash, the firm sells the marketable securities.
c. Money Market Operations: One of the tasks of ‘treasury function’ of larger companies is the investment of surplus funds in the money market. The chief characteristic of money market banking is one of size. Banks obtain funds by competing in the money market for the deposits by the companies, public authorities, High Net worth Investors (HNI), and other banks, Deposits are made for specific periods ranging from overnight to one year, a highly competitive rates which reflect supply and demand on a daily, even hourly basis are quoted.
d. Petty Cash Imprest System: For better control on cash, generally the companies use petty cash imprest system wherein the day-to-day petty expenses are estimated considering past experience and future needs and generally a week’s requirement of cash will be kept separate for making petty expenses.
e. Management of Temporary Cash Surplus
Temporary cash surpluses can be profitably invested in the following:
Short-term deposits in Banks and financial institutions.
Short-term debt market instruments.
Long-term debt instruments.
Shares of Blue-chip listed companies

Financial Management www.IndigoLearn.com 237
f. Electronic Cash Management System: Most of the cash management systems now-a-days are electronically based, since ‘speed’ is the essence of any cash management system. Various elements in the process of cash management are linked through a satellite. Various places that are interlinked may be the place where the instrument is collected, the place where cash is to be transferred in company’s account, the place where the payment is to be transferred etc.
Certain networked cash management system may also provide a very limited access to third parties like parties having very regular dealings of receipts and payments with the company etc. A finance company accepting deposits from public through sub-brokers may give a limited access to sub-brokers to verify the collections made through him for determination of his commission among other things.
Benefits: Good cash management is a conscious process of knowing:
When, where and how a company’s cash needs will arise.
Knowing what the best sources of meeting at a short notice additional cash requirement are.
Maintaining good and cordial relations with bankers and other creditors.
g. Virtual Banking: Customers are increasingly moving away from the confines of traditional
branch banking and are seeking the convenience of remote electronic banking services. And even within the broad spectrum of electronic banking the virtual banking has gained prominence.
Broadly virtual banking denotes the provision of banking and related services through extensive use of information technology without direct recourse to the bank by the customer. The origin of virtual banking in the developed countries can be traced back to the seventies with the installation of Automated Teller Machines (ATMs). Subsequently, driven by the competitive market environment as well as various technological and customer pressures, other types of virtual banking services have grown in prominence throughout the world.
The Reserve Bank of India has been taking a number of initiatives, which will facilitate the active involvement of commercial banks in the sophisticated cash management system. One of the pre-requisites to ensure faster and reliable mobility of funds in a country is to have an efficient payment system.
Introduction of computerized settlement of clearing transactions, use of Magnetic Ink Character Recognition (MICR) technology, provision of inter-city clearing facilities and high value clearing facilities, Electronic Clearing Services Scheme (ECSS), Electronic Funds Transfer (EFT) scheme, Delivery vs. Payment (DVP) for Government securities transactions, setting up of Indian Financial Network (INFINET) are some of the significant developments. Introduction of Centralized Funds Management System (CFMS), Securities Services System (SSS), Real Time Gross Settlement System (RTFS) and Structured Financial Messaging System (SFMS) are the other top priority items on the agenda to transform the existing system into a state-of-the-art payment infrastructure in India.
THE ADVANTAGES OF VIRTUAL BANKING SERVICES: Lower cost of handling a transaction
The increased speed of response to customer requirements
The lower cost of operating branch network along with reduced staff costs leads to cost efficiency.
Virtual banking allows the possibility of improved and a range of services being made available to the customer rapidly, accurately and at his convenience.
Principles involved in selection of marketable securities

Financial Management www.IndigoLearn.com 238
Marketable Securities: Surplus cash can be invested in short-term instruments in order to earn interest. Such instruments are called marketable securities. They are next in place to cash equivalents. Examples: Government Treasury Bills, Short-term Deposits with Banks (Certificate of Deposits and Money at Call and Short Notice), Inter-Corporate Deposits (ICD's), Commercial Papers (CP's) etc. The selection of securities for short term investment purposes, is guided by three factors: (a) Safety: The investment should be safe, i.e. guaranteed income and return of principal, when
disposed of. Since short-term funds are to be parked in marketable securities, minimum risk is the criterion of selection, for ensuring liquidity
(b) Maturity: Matching maturity of investments with forecasted cash needs is essential. Prices of long-term securities fluctuate more with changes in interest rates and are therefore, riskier.
(c) Marketability: It refers to the convenience, speed and cost at which a security can be converted into cash. If the security can be sold quickly without loss of time and price it is said to be highly liquid or marketable.
Forfaiting
Meaning of Forfaiting
• ‘Forfait’ is a French term which means “relinquish a right”.
• Forfaiting is an arrangement of bill discounting in which a financial institution or bank buys the trade bills (invoices) or trade receivables from exporters of goods or services, where the exporter relinquish his right to receive payment from importer.
• Financial Institutions or banks provides immediate finance to exporter ‘without recourse’ basis in which risk and rewards related with the bills/ receivables transferred to the financial institutions/ banks.
Functions of Forfaiting
The functionality can be understood in the following manner: i. Exporter sells goods or services to an overseas buyer. ii. The overseas buyers i.e. the importer on the basis trade bills and import documents
draws a letter of credit (or other negotiable instruments) through its bank (known as importer’s bank).
iii. The exporter on receiving the letter of credit (or other negotiable instruments) approaches to its bank (known as exporter’s bank).
iv. The exporter’s bank buys the letter of credit (or other negotiable instruments) ‘without recourse basis and provides the exporter the payment for the bill.
Features of Forfaiting
The Salient features of forfaiting are: i. It motivates exporters to explore new geographies as payment is assured. ii. An overseas buyer (importer) can import goods and services on deferred payment terms. iii. The exporter enjoys reduced transaction costs and complexities of international trade
transactions. iv. The exporter gets to compete in the international market and can continue to put his
working capital to good use to scale up operations. v. While importers avail of forfaiting facility from international financial institutions in order
to finance their imports at competitive rates.
ILLUSTRATIONS ON WORKING CAPITAL MANAGEMENT

Financial Management www.IndigoLearn.com 239
Illustration 1 A firm has the following data for the year ending 31st March 2017:
Particulars Amt (in Rs)
Sales (1,00,000 @ Rs. 20) 20,00,000
Earnings before Interest and Taxes 2,00,000
Fixed Assets 5,00,000
The three possible current assets holdings of the firm are Rs. 5,00,000, Rs. 4,00,000 and Rs. 3,00,000. It is assumed that fixed assets level is constant, and profits do not vary with current assets levels. Show the effect of the three alternative current assets policies. Illustration 2 A company is considering its working capital investment and financial policies for the next year. Estimated fixed assets and current liabilities for the next year are Rs. 2.60 crores and Rs. 2.34 crores respectively. Estimated Sales and EBIT depend on current assets investment, particularly inventories and book-debts. The financial controller of the company is examining the following alternative Working Capital Policies:
(Rs. Crores)
Working Capital Policy
Investment in C. A Estimated Sales EBIT
Conservative 4.5 12.30 1.23
Moderate 3.90 11.50 1.15
Aggressive 2.60 10.00 1.00
After evaluating the working capital policy, the Financial Controller has advised the adoption of the moderate working capital policy. The company is now examining the use of long-term and short-term borrowings for financing its assets. The company will use Rs. 2.50 crores of the equity funds. The corporate tax rate is 35%. The company is considering the following debt alternatives.
Financing Policy Short-term Debt Long-term Debt
Conservative Moderate Aggressive Interest rate – Average
0.54 1.00 1.50 12%
1.12 0.66 0.16 16%
You are required to calculate the following: i.Working Capital Investment for each policy:
a. Net Working Capital position b. Rate of Return c. Current ratio
ii.Financing for each policy: a. Net Working Capital position. b. Rate of Return on Shareholders’ equity. c. Current ratio
Illustration 3 [Net operating cycle period – Illustration1] From the following information of XYZ Ltd., you are required to calculate:
a. Net operating cycle period. b. Number of operating cycles in a year
S.No. Particulars Amt in Rs
(i) Raw material inventory consumed during the year
6,00,000
(ii) Average stock of raw material 50,000
(iii) Work-in-progress inventory 5,00,000
(iv) Average work-in-progress inventory 30,000

Financial Management www.IndigoLearn.com 240
(v) Finished goods inventory 8,00,000
(vi) Average finished goods stock held 40,000
(vii) Average collection period from debtors 45 days
(viii) Average credit period availed 30 days
(ix) No. of days in a year 360 days
Illustration 4 [Net operating cycle period – Illustration2] The Trading and Profit and Loss Account of Beta Ltd. for the year ended 31st March 2011 is given below:
Particulars Amount (Rs.)
Particulars
Amount (Rs.)
To Opening Stock: Raw Materials Work- in- progress Finished Goods To Purchases (credit) To Wages To Production Expenses To Gross Profit c/d To Administration Expenses To Selling Expenses To Net Profit
1,80,000
60,000 2,60,000
5,00,000 11,00,000
3,00,000 2,00,000
5,00,000
26,00,000
1,75,000
75,000 2,50,000 5,00,000
By Sales (Credit) By Closing Stock: Raw Materials Work-in-progress Finished Goods By Gross Profit b/d
2,00,000 1,00,000 3,00,000
20,00,000
6,00,000
26,00,000
5,00,000
5,00,000
The opening and closing balances of debtors were Rs. 1,50,000 and Rs. 2,00,000 respectively whereas opening and closing creditors were Rs. 2,00,000 and Rs. 2,40,000 respectively. You are required to ascertain the working capital requirement by operating cycle method. (Assume No. of days as 360)
Illustration 5 [Computation of Cash Cost] The following information is provided by the DPS Limited for the year ending 31st March 2013.
Raw material storage period 55 days
Work-in-progress conversion period 18 days
Finished Goods storage period 22 days
Debt collection period 45 days
Creditors’ payment period 60 days
Annual Operating cost (Including depreciation of Rs. 2,10,000)
Rs. 21,00,000
[1 year = 360 days]
You are required to calculate:
i.Operating Cycle period. ii.Number of Operating Cycle in a year. iii.Amount of working capital required for the company on a cash cost basis.
The company is a market leader in its product, there is virtually no competitor in the market. Based on a market research it is planning to discontinue sales on credit and deliver products

Financial Management www.IndigoLearn.com 241
based on pre-payments. Thereby, it can reduce its working capital requirement substantially. What would be the reduction in working capital requirement due to such decision? Illustration 6 [Illustration X] On 1st January, the Managing Director of Naureen Ltd. wishes to know the amount of working capital that will be required during the year. From the following information prepare the working capital requirements forecast.
• Production during the previous year was 60,000 units. It is planned that this level of activity would be maintained during the present year. • The expected ratios of the cost to selling prices are Raw materials 60%, Direct wages 10% and Overheads 20%. • Raw materials are expected to remain in store for an average of 2 months before issue to production. • Each unit is expected to be in process for one month, the raw materials being fed into the pipeline immediately and the labour and overhead costs accruing evenly during the month. • Finished goods will stay in the warehouse awaiting dispatch to customers for approximately 3 months. • Credit allowed by creditors is 2 months from the date of delivery of raw material. • Credit allowed to debtors is 3 months from the date of dispatch. • Selling price is Rs.5 per unit. • There is a regular production and sales cycle. • Wages and overheads are paid on the 1st of each month for the previous month. • The company normally keeps cash in hand to the extent of Rs.20,000.
Illustration 7 [Illustration Y] A proforma cost sheet of a Company provides the following particulars:
Amt per Unit (Rs.)
Raw materials cost Direct labour cost Overheads cost Total cost Profit Selling Price
100 37.50
75 212.50 37.50
250
The Company keeps raw material in stock, on an average for one month; work-in-progress, on an average for one week; and finished goods in stock, on an average for two weeks. The credit allowed by suppliers is three weeks and company allow four weeks credit to its debtors. The lag in payment of wages is one week and lag in payment of overhead expenses is two weeks. The Company sells one-fifth of the output against cash and maintains cash-in-hand and at bank put together at Rs.37,500. Required: Prepare a statement showing estimate of Working Capital needed to finance an activity level of 1,30,000 units of production. Assume that production is carried on evenly throughout the year, and wages and overheads accrue similarly. Work-in-progress stock is 80% complete in all respects. Consider a safety margin of 15% as provision.
Illustration (Double Shift) Samreen Enterprises has been operating its manufacturing facilities till 31.3.2017 on a single shift working with the following cost structure:
Particulars Per unit (Rs.)
Fixed (Rs.)
Variable (Rs.)
Cost of Materials 6.00

Financial Management www.IndigoLearn.com 242
Wages ( out of which 40% fixed) 5.00 2.00 3.00
Overheads (out of which 80% fixed) 5.00 4.00 1.00
Profit 2.00
Selling Price 18.00
Sales during 2016-17 – Rs. 4,32,000.
As at 31.3.2017 the company held:
Particulars Amount (Rs.)
Stock of raw materials (at cost) 36,000
Work-in-progress (valued at prime cost) 22,000
Finished goods (valued at total cost) 72,000
Sundry debtors 1,08,000
• In view of increased market demand, it is proposed to double production by working an extra shift. • It is expected that a 10% discount will be available from suppliers of raw materials in view of increased volume of business. • Selling price will remain the same. • The credit period allowed to customers will remain unaltered. Credit availed of from suppliers will continue to remain at the present level i.e., 2 months. • Lag in payment of wages and expenses will continue to remain half a month.
You are required to PREPARE the additional working capital requirements, if the policy to increase output is implemented.
Illustration [Q5 May 2018 Question Paper (New Syllabus)*] Day Ltd., a newly formed company has applied to the Private Bank for the first time for financing it's Working Capital Requirements. The following information are available about the projections for the current year: Estimated Level of Activity
Completed Units of Production 31200 plus unit of work in progress 12000
Raw Material Cost Rs. 40 per unit
Direct Wages Cost Rs. 15 per unit
Overhead Rs. 40 per unit (inclusive of Depreciation Rs. 10 per unit)
Selling Price Rs. 130 per unit
Raw Material in Stock Average 30 days consumption
Work in Progress Stock Material 100% and Conversion Cost 50%
Finished Goods Stock 24000 Units
Credit Allowed by the supplier
30 days
Credit Allowed to Purchasers
60 days
Direct Wages (Lag in payment)
15 days
Expected Cash Balance Rs. 2,00,000
Assume that production is carried on evenly throughout the year (360 days) and wages and overheads accrue similarly. All sales are on the credit basis. You are required to calculate the Net Working Capital Requirement on Cash Cost Basis.

Financial Management www.IndigoLearn.com 243
Illustration [Q5 May 2019 - New Syllabus*] Bita Limited manufactures used in the steel industry. The following information regarding the company is given for your consideration:
i.Expected level of production 9000 units per annum. ii.Raw materials are expected to remain in store for an average of two months before
issue to production. iii.Work-in-progress (50 percent complete as to conversion cost) will approximate to ½
month’s production. iv.Finished goods remain in warehouse on an average for one month. v.Credit allowed by suppliers is one month.· vi.Two month's credit is normally allowed to debtors. vii.A minimum cash balance of Rs. 67,500 is expected to be maintained. viii.Cash sales are 75 percent less than the credit sales. ix.Safety margin of 20 percent to cover unforeseen contingencies. x.The production pattern is assumed to be even during the year. xi.The cost structure for Bita Limited's product is as follows:
Raw Materials Rs. 80 per unit
Direct Labour Rs. 20 per unit
Overheads (including depreciation Rs. 20)
Rs. 80 per unit
Total Cost Rs. 180 per unit
Profit Rs. 20 per unit
Selling Price Rs. 200 per unit
You are required to estimate the working capital requirement of Bita limited
Illustration [Q8 NOV 2019 RTP - New Syllabus*]
Following are cost information of KG Ltd., which has commenced a new project for an annual production of 24,000 units which is the full capacity:
Materials 80.00
Direct labour and variable expenses 40.00
Fixed manufacturing expenses 12.00
Depreciation 20.00
Fixed administration expenses 8.00
160.00
The selling price per unit is expected to be Rs.192 and the selling expenses Rs.10 per unit, 80% of which is variable. In the first two years of operations, production and sales are expected to be as follows:
Year Production (No. of units) Sales (No. of units)
1 12,000 10,000
2 18,000 17,000
To assess the working capital requirements, the following additional information is available:
(a) Stock of materials 2 months’ average consumption

Financial Management www.IndigoLearn.com 244
(b) Work-in-process Nil
(c) Debtors 2 month’s average sales.
(d) Cash balance Rs. 1,00,000
(e) Creditors for supply of materials
1 month’s average purchase during the year.
(f) Creditors for expenses
1 month’s average of all expenses during the year.
PREPARE, for the two years: (i) A projected statement of Profit/Loss (Ignoring taxation); and (ii) A projected statement of working capital requirements
ILLUSTRATIONS ON TREASURY AND CASH MANAGEMENT
Illustration 1 [Cash budget Illustration A] Prepare monthly cash budget for six months beginning from April 2017 on the basis of the following information: -
1. Estimated monthly sales are as follows:
Month Rs Month Rs
January 1,00,000 June 80,000
Februar 1,20,000 July 1,00,000
March 1,40,000 August 80,000
April 80,000 September 60,000
May 60,000 October 1,00,000
2. Wages and salaries are estimated to be payable as follows: -
Month Rs Month Rs
April 9,000 July 10,000
May 8,000 August 9,000
June 10,000 September 9,000
3. Of the sales, 80% is on credit and 20% for cash. 75% of the credit sales are collected within one month and the balance in two months. There are no bad debt losses. 4. Purchases amount to 80% of sales and are made on credit and paid for in the month preceding the sales. 5. The firm has 10% debentures of Rs.1,20,000. Interest on these has to be paid quarterly in January, April and so on. 6. The firm is to make an advance payment of tax of Rs.5,000 in July,2017. 7. The firm had a cash balance of Rs.20,000 on April 1, 2017, which is the minimum desired level of cash balance. Any cash surplus/deficit above/below this level is made up by temporary investments/liquidation of temporary investments or temporary borrowings at the end of each month (interest on these to be ignored).
Illustration 2 [Cash Budget Illustration B] From the following information relating to a departmental store, you are required to prepare for the three months ending 31st March,2017: - (a) Month-wise cash budget on receipts and payments basis; and (b) Statement of Sources and uses of funds for the three months period. It is anticipated that the working capital at 1st January 2017 will be as follows: -
Particulars Amount (Rs ‘000)
Cash in hand and at bank 545
Short term investments 300
Debtors 2,570

Financial Management www.IndigoLearn.com 245
Stock 1,300
Trade Creditors 2,110
Other Creditors 200
Dividend Payable 485
Tax due 320
Plant 800
Budgeted Profit Statement (Rs in ‘000)
January February March
Sales Cost of Sales
2,100 (1,635)
1,800 (1,405)
1,700 (1,330)
Gross Profit Administrative, Selling & Distribution Expenses
465 (315)
395 (270)
370 (255)
Net Profit Before Tax 150 125 115
Budgeted balances at the end of each months
(Rs in ‘000)
31st Jan 28th Feb 31st Mar
Short term investments 700 - 200
Debtors 2,600 2,500 2,350
Stock 1,200 1,100 1,000
Trade Creditors 2,000 1,950 1,900
Other Creditors 200 200 200
Dividend payable 485 - -
Tax due 320 320 320
Plant (Depreciation ignored) 800 1,600 1,550
Depreciation amount to Rs.60,000 is included in the budgeted expenditure for each month. Illustration 3 [Zeta Ltd] The following information relates to Zeta Limited, a publishing company: The selling price of a book is Rs.15, Sales are made on credit through a book club & invoiced on the last day of the month. Variable costs of production per book:
• Materials (Rs.5), • Labour (Rs.4), & • Overhead (Rs.2)
The sales manager has forecasted the following volumes:
Month Nov Dec Jan Feb Mar Apr May June July Aug
Books 1,000 1,000 1,000 1,250 1,500 2,000 1,900 2,200 2,200 2,300
Customers are expected to pay as follows:
One month after the sale 40%
Two months after the sale 60% i.The company produces the books two months before they are sold and the creditors for materials are paid two months after production.
ii.Variable overheads are paid in the month following production and are expected to increase by 25% in April.
iii.75% of wages are paid in the month of production and 25% in the following month. A wage increase, of 12.5% will take place on 1st March.
iv.The company is going through a restructuring and will sell one of its freehold properties in May for Rs.25,000, but it is also planning to buy a new printing press in May for Rs.10,000.

Financial Management www.IndigoLearn.com 246
Depreciation is currently Rs.1,000 per month and will rise to Rs.1,500 after the purchase of the new machine.
v.The company’s corporation tax (of Rs.10,000) is due for payment in March. vi.The company presently has a cash balance at bank on 31 December 2013, of Rs.1,500.
You are required to prepare a cash budget for the six months from January to June Illustration 4 [Long Term Cash Budget] You are given below the Profit & Loss Accounts for two years for a company:
Year 1 Year 2 Year 1 Year 2
Rs. Rs. Rs. Rs.
To Opening stock
80,00,000 1,00,00,000 By Sales 8,00,00,000 10,00,00,000
To Raw materials
3,00,00,000 4,00,00,000 By Closing stock
1,00,00,000 1,50,00,000
To Stores 1,00,00,000 1,20,00,000 By Misc. Income
10,00,000 10,00,000
To Manufacturing Expenses
1,00,00,000 1,60,00,000
To Other Expenses
1,00,00,000 1,00,00,000
To Depreciation
1,00,00,000 1,00,00,000
To Net Profit 1,30,00,000 1,80,00,000
9,10,00,000 11,60,00,000 9,10,00,000 11,60,00,000
i.Sales are expected to be Rs.12,00,00,000 in year 3.
ii.As a result, other expenses will increase by Rs. 50,00,000 besides other charges. iii.Only raw materials are in stock. Assume sales and purchases are in cash terms and the closing
stock is expected to go up by the same amount as between year 1 and 2. iv.You may assume that no dividend is being paid. The Company can use 75% of the cash
generated to service a loan.
How much cash from operations will be available in year 3 for the purpose? Ignore income tax. Illustration 5 [Cash Budget & Proforma] Consider the balance sheet of Maya Limited at December 31 (in thousands). The company has received a large order and anticipates the need to go to its bank to increase its borrowings. As a result, it has to forecast its cash requirements for January, February and March. Typically, the company collects 20 per cent of its sales in the month of sale, 70 per cent in the subsequent month, and 10 per cent in the second month after the sale. All sales are credit sales. Balance sheet of Maya Limited as on December 31st (in thousands)
Particulars Value in Rs Particulars Value in Rs
Cash Accounts receivable Inventories Current asset
50 530 545
1,125
Accounts payable Bank loan Accruals Current liabilities
360 400 212 972
Net fixed assets
1,836 Long-term debt Common stock Retained earnings
450 100
1,439
Total assets
2,961
Total liabilities and equity
2,961

Financial Management www.IndigoLearn.com 247
• Purchases of raw materials are made in the month prior to the sale and amount to 60% of sales in the subsequent month. • Payments for these purchases occur in the month after the purchase. • Labour costs, including overtime, are expected to be Rs.1,50,000 in January, Rs.2,00,000 in February, and Rs.1,60,000 in March. • Selling, administrative, taxes, and other cash expenses are expected to be Rs.1,00,000 per month for January through March.
Actual sales in November and December and projected sales for January through April are as follows (in thousands):
November 500 January 600 March 650
December 600 February 1,000 April 750
Based on this information: a. Prepare a cash budget for the months of January, February, and March. b. Determine the amount of additional bank borrowings necessary to maintain a cash balance of Rs.50,000 at all times. c. Prepare a pro forma balance sheet for March 31.
Illustration 6 [Prachi Ltd] Prachi Ltd is a manufacturing company producing and selling a range of cleaning products to wholesale customers. It has three suppliers and two customers. Prachi Ltd relies on its cleared funds forecast to manage its cash. You are an accounting technician for the company and have been asked to prepare a cleared funds forecast for the period Monday 7 January to Friday 11 January 2017 inclusive. You have been provided with the following information:
i.Receipts from customers
Customer name Credit terms Payment method
7 Jan 2017 sales
7 Dec 2016 sales
W Ltd 1 calendar month
BACS Rs. 150,000 Rs. 130,000
X Ltd None Cheque Rs. 180,000 Rs. 160,000
1. Receipt of money by BACS (Bankers’ Automated Clearing Services) is instantaneous. 2. X Ltd’s cheque will be paid into Prachi Ltd’s bank account on the same day as the sale is made and will clear on the third day following this (excluding day of payment).
i.Payments to suppliers
Supplier Name
Credit terms Payment method
7 Jan 2017 purchases
7 Dec 2016 purchases
7 Nov 2016 purchases
A Ltd 1 calendar month
Standing order
Rs. 65,000 Rs. 55,000 Rs. 45,000
B Ltd 2 calendars months
Cheque Rs. 85,000 Rs. 80,000 Rs. 75,000
C Ltd None Cheque Rs. 95,000 Rs. 90,000 Rs. 85,000
1. Prachi Ltd has set up a standing order for Rs. 45,000 a month to pay for supplies from A Ltd. This will leave Prachi’s bank account on 7 January. Every few months, an adjustment is made to reflect the actual cost of supplies purchased (you need to make this adjustment).

Financial Management www.IndigoLearn.com 248
2. Prachi Ltd will send out, by post, cheques to B Ltd and C Ltd on 7 January. The amounts will leave its bank account on the second day following this (excluding the day of posting).
ii.Wages and salaries
December 2016 January 2017
Weekly wages Rs. 12,000 Rs. 13,000
Monthly salaries Rs. 56,000 Rs. 59,000
1. Factory workers are paid cash wages (weekly). They will be paid one week’s wages, on 11 January, for the last week’s work done in December (i.e. they work a week in hand). 2. All the office workers are paid salaries (monthly) by BACS. Salaries for December will be paid on 7 January.
iii.Other miscellaneous payments 1. Every Monday morning, the petty cashier withdraws Rs. 200 from the company bank account for the petty cash. The money leaves Prachi’s bank account straight away. 2. The room cleaner is paid Rs. 30 from petty cash every Wednesday morning. 3. Office stationery will be ordered by telephone on Tuesday 8 January to the value of Rs. 300. This is paid for by company debit card. Such payments are generally seen to leave the company account on the next working day. 4. Five new software will be ordered over the Internet on 10 January at a total cost of Rs. 6,500. A cheque will be sent out on the same day. The amount will leave Prachi Ltd’s bank account on the second day following this (excluding the day of posting).
iv.Other information the balance on Prachi’s bank account will be Rs. 200,000 on 7
January 2017. This represents both the book balance and the cleared funds. Required: Prepare a cleared funds forecast for the period Monday 7 January to Friday 7 January 2017 inclusive using the information provided. Show clearly the uncleared funds float each day. I Illustration 7 [Sai Trading Company] The following information is available in respect of Sai trading company:
1. On an average, debtors are collected after 45 days; inventories have an average holding period of 75 days and creditor’s payment period on an average is 30 days. 2. The firm spends a total of Rs. 120 lakhs annually at a constant rate. 3. It can earn 10 per cent on investments.
From the above information, you are required to calculate:
a. The cash cycle and cash turnover, b. Minimum amounts of cash to be maintained to meet payments as they become due c. Savings by reducing the average inventory holding period by 30 days.
illustration 7 [Cash Management Tools (Optimum bal /EOQ Model)] A firm maintains a separate account for cash disbursement. Total disbursement are Rs. 1,05,000 per month or Rs. 12,60,000 per year. Administrative and transaction cost of transferring cash to disbursement account is Rs. 20 per transfer. Marketable securities yield is 8% per annum. Determine the optimum cash balance according to William J. Baumol model.

Financial Management www.IndigoLearn.com 249
Illustration [Q3 Nov 2019 Question paper (New Syllabus)* Slide Ltd. is preparing a cash flow forecast for the three months period from January to the end of March. The following sales volumes have been forecasted:
Months December January February March April
Sales (units)
1,800 1,875 1,950 2,100 2,250
• Selling price per unit is Rs. 600. • Sales are all on one-month credit. • Production of goods for sale takes place one month before sales. • Each unit produced requires two units of raw materials costing Rs. 150 per unit. • No raw material inventory is held. • Raw materials purchases are on one-month credit. • Variable overheads and wages equal to Rs. 100 per unit are incurred during production and paid in the month of production. • The opening cash balance on 1st January is expected to be Rs. 35,000. • A long term loan of Rs. 2,00,000 is expected to be received in the month of March. • A machine costing Rs. 3,00,000 will be purchased in March.
a. Prepare a cash budget for the months of January, February and March and calculate the cash balance at the end of each month in the three months period. b. Calculate the forecast current ratio at the end of the three months period
ILLUSTRATIONS ON MANAGEMENT OF INVENTORY
Illustration 1 [Illustration A, B , C] A Company’s requirement for 10 days is 6,300 units. The ordering cost per order is Rs 10 and the carrying cost per order is Rs 0.26. You are required to calculate the Economic Ordering Quantity. Illustration 2 [Illustration A, B , C] Pureair Company is a distributor of air filters to retail stores. It buys its filters from several manufacturers. Filters are ordered in lot sizes of 1,000 and each order costs Rs 40 to place. Demand from retail stores is 20,000 filters per month, and carrying costs is Rs 0.10 a filter per month.
a. What is the optimal order quantity with respect to so many lot sizes? b. What would be the optimal order quantity if the carrying cost were Rs 0.50 a filter per month? c. What would be the optimal order quantity if order costs were Rs 10?
Illustration 3 [Illustration A, B , C] The demand for a certain product is random. It has been estimated that the monthly demand of the product has a normal distribution with a mean of 390 units. The unit price of product is Rs. 25. Ordering cost is Rs. 40 per order and inventory carrying cost is estimated to be 35 percent per year. Required: Calculate Economic Order Quantity (EOQ). Illustration 4 [Marvel]

Financial Management www.IndigoLearn.com 250
Marvel Limited uses a large quantity of salt in its production process. Annual consumption is 60,000 tonnes over a 50-week working year. It costs Rs. 100 to initiate and process an order and delivery follow two weeks later. Storage costs for the salt are estimated at 10 paise per tonne per annum. The current practice is to order twice a year when the stock falls to 10,000 tonnes. Recommend an appropriate ordering policy for Marvel Limited and contrast it with the cost of the current policy.
ILLUSTRATIONS (ACCOUNT RECEIVABLE)
Illustration 1 [XYZ Ltd] XYZ Corporation is considering relaxing its present credit policy and is in the process of evaluating two proposed policies. Currently, the firm has annual credit sales of Rs. 50 lakhs and accounts receivable turnover ratio of 4 times a year. The current level of loss due to bad debts is Rs.1,50,000. The firm is required to give a return of 25% on the investment in new accounts receivables. The company’s variable costs are 70% of the selling price. Given the following information, which is the better option?
(Amount in Rs.)
Present policy
Policy Option I
Policy Option II
Annual credit sales 50,00,000 60,00,000 67,50,000
Accounts receivable turnover ratio 4 times 3 times 2.4 times
Bad debt losses 1,50,000 3,00,000 4,50,000
Illustration 2 [Trader] A trader whose current sales are in the region of Rs. 6 lakhs per annum and an average collection period of 30 days wants to pursue a more liberal policy to improve sales. A study made by a management consultant reveals the following information.
Credit Policy Increase in collection period
Increase in sales Present default anticipated
A 10 days Rs. 30,000 1.5%
B 20 days Rs. 48,000 2%
C 30 days Rs. 75,000 3%
D 45 days Rs. 90,000 4%
The selling price per unit is Rs. 3. Average cost per unit is Rs. 2.25 and variable costs per unit are Rs. 2. The current bad debt loss is 1%. Required return on additional investment is 20%. Assume a 360 days year. Which of the above policies would you recommend for adoption? Illustration 3 [Mosaic] Mosaic Limited has current sales of Rs.15 lakhs per year. Cost of sales is 75 per cent of sales and bad debts are one per cent of sales. Cost of sales comprises 80 per cent variable costs and 20 per cent fixed costs, while the company’s required rate of return is 12 per cent. Mosaic Limited currently allows customers 30 days’ credit but is considering increasing this to 60 days’ credit in order to increase sales. It has been estimated that this change in policy will increase sales by 15 per cent, while bad debts will increase from one per cent to four per cent. It is not expected that the policy change will result in an increase in fixed costs and creditors and stock will be unchanged. Should Mosaic Limited introduce the proposed policy? (Assume 360 days year) Illustration 4 [PQR Ltd]

Financial Management www.IndigoLearn.com 251
PQR Ltd. having an annual sale of Rs. 30 Lakhs is reconsidering its present Collection Policy. At present, the average collection period is 50 days and bad debt losses are 5% of sales. The company is incurring expenditure of Rs. 30,000 on account of collection of receivables. Cost of funds is 10%. The alternative policies are as under
Alternative I Alternative II
Avg. Collection Period 40 days 30 Days
Bad debt losses 4% of Sales 3% of sales
Collection Expenses Rs. 60,000 Rs. 95,000
Evaluate the alternatives on the basis of the incremental approach and state which alternative is more beneficial Illustration 5 [Bad Debts & ROI] As a part of the strategy to increase sales and profits, the sales manager of a company proposes to sell goods to a group of new customers with 10% risk of non-payment. This group would require one and a half months credit and is likely to increase sales by Rs. 1,00,000 p.a. Production and Selling expenses amount to 80% of sales and the income-tax rate is 50%. The company’s minimum required rate of return (after tax) is 25%. Should the sales manager’s proposal be accepted? Also find the degree of risk of non-payment that the company should be willing to assume if the required rate of return (after tax) were (i) 30%, (ii) 40% and (iii) 60%. Illustration 6 [Slow Players] Slow Payers are regular customers of Goods Dealers Ltd., Calcutta and have approached the sellers for extension of a credit facility for enabling them to purchase goods from Goods Dealers Ltd. On an analysis of past performance and on the basis of information supplied, the following pattern of payment schedule emerges in regard to Slow Payers:
Pattern of Payment Schedule
At the end of 30 days At the end of 60 days At the end of 90 days At the end of 100 days Non-recovery
15% of the bill 34% of the bill. 30% of the bill. 20% of the bill. 1% of the bill.
Slow Payers want to enter into a firm commitment for purchase of goods of Rs. 15 lakhs in 2013, deliveries to be made in equal quantities on the first day of each quarter in the calendar year. The price per unit of commodity is Rs. 150 on which a profit of Rs. 5 per unit is expected to be made. It is anticipated by Goods Dealers Ltd., that taking up of this contract would mean an extra recurring expenditure of Rs. 5,000 per annum. If the opportunity cost of funds in the hands of Goods Dealers is 24% per annum, would you as the finance manager of the seller recommend the grant of credit to Slow Payers? Workings should form part of your answer. Assume year of 360 days. Illustration 7 [Saavan Ltd] Saavan Ltd. currently has sales of Rs. 30 Lakhs, with an average collection period of 2 months. At present, no discounts are offered to the customers. The management of the company is thinking to allow a discount of 2% on cash sales which will result as under;
i.The average collection period will reduce to 1 month. ii.50% of customers would take advantage of 2% discount.
The company would normally require 25% return on investment. Advise the management, whether to extend discount on cash sales. Illustration 8 [Factoring]

Financial Management www.IndigoLearn.com 252
A Factoring firm has credit sales of Rs. 360 lakhs and its average collection period is 30 days. The financial controller estimates, bad debt losses are around 2% of credit sales. The firm spends Rs. 1,40,000 annually on debtor’s administration. This cost comprises of telephonic and fax bills along with salaries of staff members. These are the avoidable costs. A Factoring firm has offered to buy the firm’s receivables. The factor will charge 1% commission and will pay an advance against receivables on an interest @15% p.a. after withholding 10% as reserve. What should the firm do? Assume 360 days in a year Illustration 9 [Dolce Company] The Dolce Company purchases raw materials on terms of 2/10, net 30. A review of the company’s records by the owner, Mr. Gupta, revealed that payments are usually made 15 days after purchases are received. When asked why the firm did not take advantage of its discounts, the accountant, Mr. Ram, replied that it cost only 2 per cent for these funds, whereas a bank loan would cost the company 12 per cent.
1. What mistake is Ram making? 2. What is the real cost of not taking advantage of the discount? 3. If the firm could not borrow from the bank and was forced to resort to the use of trade credit funds, what suggestion might be made to Ram that would reduce the annual interest cost?
Illustration [Q4: Nov 2018 - New Syllabus*]
MN Ltd. has
Current turnover of Rs. 30,00,000 p.a.
Cost of Sales is 80% of turn over
Bad debts are 2% of turnover
Cost of sales include 70% variable cost and 30% fixed cost
Company required rate of return is 15%
• MN Ltd. currently allows 15 days credit to its customers, but it is considering increasing this to 45 days credit in order to increase turnover. • It has been estimated that this change in policy will increase turnover by 20%, while Bad Debts will increase by 1%. • It is not expected that the policy change will result in an increase in fixed cost and creditors and stock will be unchanged.
Should MN Ltd. introduce the proposed policy? (assume 360 days
Illustration [Q6: May 2020 RTP - New Syllabus*] TM Limited, a manufacturer of Colour TV sets is considering the liberalization of existing credit terms to three of their large customers A, B and C. The credit period and likely quantity of TV sets that will be sold to the customers in addition to the other sales are as follows:
Quantity sold (No. of TV Sets)
Credit Period (Days)
A B C
0 10,000 10,000 -
30 10,000 15,000 -
60 10,000 20,000 10,000
90 10,000 25,000 15,000
The selling price per TV set is Rs. 15,000. The expected contribution is 50% of the selling price. The cost of carrying receivable averages 20% per annum.

Financial Management www.IndigoLearn.com 253
You are required compute the credit period to be allowed to each customer. (Assume 360 days in a year for calculation purposes).
ILLUSTRATIONS (ACCOUNT PAYABLE)
Illustration 1 Suppose ABC Ltd. has been offered credit terms from its major supplier of 2/10, net 45. Hence the company has the choice of paying Rs.98 per Rs.100 or to invest Rs.98 for an additional 35 days and eventually pay the supplier Rs.100 per Rs.100. The decision as to whether the discount should be accepted depends on the opportunity cost of investing Rs.98 for 35 days. What should the company do? Illustration [Q6 May 2018 RTP (New Syllabus)*]
• A Ltd. is in the manufacturing business and it acquires raw material from X Ltd. on a regular basis. • As per the terms of agreement the payment must be made within 40 days of purchase. • However, A Ltd. has a choice of paying ₹ 98.50 per ₹ 100 it owes to X Ltd. on or before 10th day of purchase.
Required: Examine whether A Ltd. should accept the offer of discount assuming average billing of A Ltd. with X Ltd. is ₹ 10,00,000 and an alternative investment yield a return of 15% and company pays the invoice.
ILLUSTRATION ON FINANCING OF WORKING CAPITAL
Illustration 1 [MBPF Introduction] From the following data, calculate the maximum permissible bank finance under the three methods suggested by the Tandon Committee: -
Current Assets Rs. in Lakhs Current Liabilities Rs. In Lakhs
Raw Material 180 Creditors 120
Work-in-Progress 60 Other current Liabilities
40
Finished Goods 100 Bank borrowings 250
Receivables 150
Other Current Assets 20
Total 510 Total 410
The total Core Current Assets (CCA) are Rs. 200 Lakhs. Illustration 2 [Working Capital & MBPF] A company has applied to the Commercial Bank for financing its working capital requirements. The following information is available about the projections for the current year:
Elements of cost: Per unit (Rs.)
Raw Material Direct Labour Overhead
40 15 30
Total Cost Profit
85 15
Sales 100
Other information:

Financial Management www.IndigoLearn.com 254
1. Raw material in stock: average 4 weeks consumption, 2. Work – in progress (completion stage, 50 per cent), on an average half a month. 3. Finished goods in stock: on an average, one month. 4. Credit allowed by suppliers is one month. 5. Credit allowed to debtors is two months. 6. Average time lag in payment of wages is 1½ weeks and 4 weeks in overhead expenses. 7. Cash in hand and at bank is desired to be maintained at Rs. 50,000.
All Sales are on credit basis only. Required:
i.Prepare statement showing estimate of working capital needed to finance an activity level of 96,000 units of production. Assume that production is carried on evenly throughout the year, and wages and overhead accrue similarly. For the calculation purpose 4 weeks may be taken as equivalent to a month and 52 weeks in a year.
ii.Compute the Maximum Permissible Bank Finance (MPBF) to the company as per the lending norms of Tandon Committee, under all the 3 methods (assuming the core current assets of the company are 25% of the current assets)
Illustration 3 [Balance Sheet and WC] The following figures and ratios are related to a company:
(i) Sales for the year (all credit) Rs. 30,00,000
(ii) Gross Profit ratio 25%
(iii) Fixed assets turnover (based on cost of goods sold) 1.5
(iv) Stock turnover (based on cost of goods sold) 6
(v) Liquid ratio 1:1
(vi) Current ratio 1.5:1
(vii) Debtors collection period 2 months
(viii) Reserves and surplus to Share capital 0.6:1
(xi) Capital gearing ratio 0.5
(x) Fixed assets to net worth 1.20:1
You are required to prepare: a) Balance Sheet of the company on the basis of above details. b) The statement showing working capital requirement, if the company wants to make a provision for contingencies @ 10% of net working capital including such provision Illustration 4 [XYZ Ltd (Cash Cost Basis)] The following annual figures relate to XYZ Co.,
Particulars Amount (Rs.)
Sales (at two months’ credit) 36,00,000
Materials consumed (suppliers extend two months’ credit) 9,00,000
Wages paid (1-month lag in payment) 7,20,000
Cash manufacturing expenses (expenses are paid one month in arrear)
9,60,000
Administrative expenses (1-month lag in payment) 2,40,000
Sales promotion expenses (paid quarterly in advance) 1,20,000
The company sells its products on gross profit of 25%. Depreciation is considered as a part of the cost of production. It keeps one month’s stock each of raw materials and finished goods, and a cash balance of Rs.1,00,000. Assuming a 20% safety margin, work out the working capital requirements of the company on cash cost basis. Ignore work-in-progress.

Financial Management www.IndigoLearn.com 255
Illustration 5 [PQ Ltd] PQ Ltd. a company newly commencing business in 2017 has the following projected Profit and Loss Account. Prepare an estimate of working capital using the information provided.
(Rs.) (Rs)
Sales 2,10,000
Cost of goods sold 1,53,000
Gross Profit 57,000
Administrative Expenses 14,000
Selling Expenses 13,000 27,000
Net Profit 30,000
The cost of goods sold has been arrived at as under:
Materials used 84,000
Wages and manufacturing Expenses 62,500
Depreciation 23,500
1,70,000
Less: Stock of Finished goods (10% of goods produced not yet sold)
(17,000)
COGS 1,53,000
The figure given above relate only to finished goods and not to work-in-progress. Goods equal to 15% of the year’s production (in terms of physical units) will be in process on the average requiring full materials but only 40% of the other expenses. The company believes in keeping materials equal to two months consumption in stock.
i.Suppliers of materials will extend 1.5 months credit. ii.Sales will be 20% for cash and the rest at two months credit. iii.The company wishes to keep Rs. 8,000 in cash. iv.10% has to be added to the estimated figure for unforeseen contingencies.
Prepare an estimate of working capital Note: All workings should form part of the answer.
Illustration 5 [PQ Ltd Part 6]
Changes in the assumptions: 1. All expenses will be paid one month in advance 2. Provision for tax is Rs.10,000 3. 70% of income tax is paid in advance on quarterly basis
Illustration 6 [Aneja Ltd] Aneja Limited, a newly formed company, has applied to the commercial bank for the first time for financing its working capital requirements. The following information is available about the projections for the current year: Estimated level of activity: 1,04,000 completed units of production + 4,000 units of work-in-progress. Based on the above activity, estimated cost per unit is:
Raw Material Rs. 80 per unit
Direct wages Rs. 30 per unit
Overheads (Exclusive of depreciation) Rs. 60 per unit
Total cost Rs. 170 per unit
Selling price Rs. 200 per unit
Raw materials in stock: Average 4 weeks consumption, work-in-progress (assume 50% completion stage in respect of conversion cost) (materials issued at the start of the processing). Finished goods in stock 8,000 units Credit allowed by suppliers Average 4 weeks Credit allowed to debtors/receivables Average 8 weeks

Financial Management www.IndigoLearn.com 256
Lag in payment of wages Average 1.5 weeks Cash at banks is expected to be Rs. 25,000 (for smooth operation) Assume that production is carried on evenly throughout the year (52 weeks) and wages and overheads accrue similarly. All sales are on credit basis only. You are required to calculate the net working capital required. Illustration 7 [MN Ltd] MN Ltd. is commencing a new project for manufacture of electric toys. The following cost information has been ascertained for annual production of 60,000 units at full capacity:
Particulars Amount in Rs.
Raw material 20
Direct Labour 15
Manufacturing Overheads: Variable 15 Fixed 10
25
Selling and Distribution overheads: Variable 3 Fixed 1
4
Total cost 64
Profit 16
Selling price 80
In the first year of operations expected production and sales are 40,000 units and 35,000 units respectively. To assess the need of working capital, the following additional information is available:
i.Stock of Raw materials…………………………………. 3 months consumption. ii.Credit allowable for debtors…………………………. 1.5 months. iii.Credit allowable by creditors………………………… 4 months. iv.Lag in payment of wages………………………………. 1 month. v.Lag in payment of overheads………………………….0.5 month. vi.Cash in hand and Bank is expected to be Rs. 60,000. vii.Provision for contingencies is required @ 10% of working capital requirement including that
provision.
You are required to prepare a projected statement of working capital requirement for the first year of operations. Debtors are taken at cost. Illustration [Q7 May 2018 RTP (New Syllabus)*] Following information is forecasted by the Puja Limited for the year ending 31st March, 2018
Balance as at 1st April, 2017 (₹)
Balance as at 31st March, 2018 (₹)
Raw material 45,000 65,356
Work-in-progress 35,000 51,300
Finished goods 60,181 70,175
Debtors 1,12,123 1,35,000
Creditors 50,079 70,469
Annual purchases of raw material (all credit)
4,00,000
Annual cost of production 7,50,000
Annual cost of goods sold 9,15,000
Annual operating cost 9,50,000
Annual sales (all credit) 11,00,000

Financial Management www.IndigoLearn.com 257
You may take one year as equal to 365 days. Calculate: (i) Net operating cycle period. (ii) Number of operating cycles in the year. (iii) Amount of working capital requirement using operating cycles.