Embed Size (px)
Citation preview
Equipment Leasing 913
■ The options available to the lessee at the end of the lease term are criti-cal in determining the nature of the lease for tax purposes and the clas-sification of the lease for financial accounting purposes.
■ Non-tax-oriented leases or conditional sale leases transfer all incidentsof ownership of the leased property to the lessee and usually give thelessee a fixed price bargain purchase option or renewal option notbased on fair market value at the time of exercise. For tax purposes, thetransaction is treated as a loan.
■ In a tax-oriented true leases, the lessor claims and retains the tax ben-efits of ownership and passes through to the lessee most of such taxbenefits in the form of reduced lease payments. The principal advan-tage to a lessee of using a true lease to finance an equipment acquisi-tion is the economic benefit that comes from the indirect realizationof tax benefits that might otherwise be lost because the lessee cannotuse the tax benefits.
■ True leases are categorized as single-investor leases (or direct leases)and leveraged leases. Single-investor leases are essentially two-partytransactions, with the lessor purchasing the leased equipment with itsown funds and being at risk for 100% of the funds used to purchasethe equipment. Conceptually, a leveraged lease of equipment is similarto a single-investor lease. However, it is more complex in size, docu-mentation, legal involvement, and, most importantly, the number ofparties (particularly lenders who provide the major portion of funds topurchase the equipment) involved and the unique advantages that eachparty gains.
■ Full payout leases are basically financing transactions. In contrast, anoperating lease is one for which the lease term is much shorter than theexpected life of the equipment.
■ The reasons cited for leasing rather than borrowing to purchase equip-ment are cost savings, conservation of working capital, preservation ofcredit capacity by avoiding capitalization, elimination of risk of obso-lescence and disposal of equipment, less restrictions on management,and flexibility and convenience. Not all of these claims are valid, par-ticularly cost savings since cost reduction depends on whether the leaseis tax-oriented.
■ For financial reporting purposes, a lease is classified as either an operat-ing lease or a capital lease. FAS 13 sets forth the conditions for classify-ing a lease. For a capital lease, the transaction is shown on the lessee’sbalance sheet as a liability and the leased property reported as an asset.For an operating lease, the lessee need only disclose certain informationregarding lease commitments in a footnote.
■ The value of the lease is found by discounting the direct cash flow fromleasing by the adjusted discount rate. A negative value for a lease indi-
27-Equipment Leasing Page 913 Wednesday, June 4, 2003 12:07 PM
914 SELECTED TOPICS IN FINANCIAL MANAGEMENT
cates that leasing will not be more economically beneficial than bor-rowing to purchase. A positive value means that leasing will be moreeconomically beneficial. However, leasing will be attractive only if theNPV of the asset assuming normal financing is positive and the value ofthe lease is positive, or if the sum of the NPV of the asset assuming nor-mal financing and the value of the lease is positive.
QUESTIONS
1. Why in a tax-oriented true lease can the lessee benefit from a lowerleasing cost?
2. How does a single-investor lease differ from a leveraged lease?3. Explain how a lessor expects to recover its investment in a full payout
lease.4. How does an operating lease differ from a full payout lease?5. How is an operating lease treated for tax purposes?6. How can a corporation that cannot currently use tax benefits associ-
ated with equipment ownership because it lacks currently taxableincome or net operating loss carryforward benefits from leasing?
7. Why, if it were not for the different tax treatment for owning and leasingequipment, would the costs be identical in an efficient capital market?
8. Explain why the cost of a true lease depends on the size of the transac-tion and whether the lease is tax-oriented or non-tax-oriented.
9. A frequently cited advantage for leasing is that it conserves workingcapital. The validity of this advantage for financially sound firms dur-ing normal economic conditions is questionable. Explain why.
10. Why do chief financial officers generally prefer that lease agreements bestructured as an operating lease for financial accounting purposes?
11. Critically evaluate the claim that by leasing, a corporation can avoidthe risk of obsolescence of equipment and the risk of disposal of theequipment.
12. Who are corporate lessors?13. Explain the role of lease brokers and financial advisers in a lease trans-
action.14. a. What is a master lease?
b. What is a sale-and-leaseback transaction?15. a. For financial reporting purposes, what determines if a lease is treated
as an operating lease or capital lease?b. If a lease for equipment that has a 15-year expected economic life
has a lease term of two years, how will the lease be treated forfinancial reporting purposes?
27-Equipment Leasing Page 914 Wednesday, June 4, 2003 12:07 PM
Equipment Leasing 915
c. If a lease for equipment allows the lessee to buy the equipment atthe end of the lease term for $1, how will the lease be treated forfinancial reporting purposes?
16. For tax reporting purposes, explain why a purchase option based onfair market value rather than a nominal purchase option is a strongindication of intent to create a lease rather than a conditional sale lease.
17. Explain why when structuring a tax-oriented lease transaction, corpo-rations requiring the use of equipment will seek to have the leasetreated as an operating lease for financial reporting purposes but as atrue lease for tax purposes.
18. What is a synthetic lease?19. The Mishthosi Company is considering the acquisition of a machine
that costs $50,000 if bought today. The company can buy or leasethe machine. If it buys the machine, the machine would be depreci-ated as a 3-year MACRS asset and is expected to have a salvagevalue of $1,000 at the end of the 5-year useful life. If leased, thelease payments are $12,000 each year for four years, payable at thebeginning of each year. The marginal tax rate of Mishthosi is 30%and its cost of capital is 10%. Assume that the lease is a net lease,that any tax benefits are realized in the year of the expense, and thatthere is no investment tax credit.
MACRS rates of depreciation on a 3-year asset are:
a. Calculate the depreciation for each year in the case of the pur-chase of this machine.
b. Calculate the direct cash flows from leasing initially and for eachof the five years.
c. Calculate the adjusted discount rate.d. Calculate the value of the lease.
20. The Mietet Company is considering the acquisition of a machine thatcosts $1 million if bought today. The company can buy or lease themachine. If it buys the machine, the machine would be depreciatedas a 3-year MACRS asset and is expected to have a salvage value of$10,000 at the end of the 5-year useful life. If leased, the lease pay-ments are $250,000 each year for four years, payable at the begin-ning of each year. Mietet’s marginal tax rate is 35% and the cost ofcapital is 12%. Use the MACRS rates as provided in Problem 1.
Year Rate
1 33.33%2 44.45%3 14.81%4 7.41%
27-Equipment Leasing Page 915 Wednesday, June 4, 2003 12:07 PM
916 SELECTED TOPICS IN FINANCIAL MANAGEMENT
Assume that the lease is a net lease, that any tax benefits are realizedin the year of the expense, and that there is no investment tax credit.a. Calculate the depreciation for each year in the case of the purchase
of this machine.b. Calculate the direct cash flows from leasing initially and for each of
the five years.c. Calculate the adjusted discount rate.d. Calculate the value of the lease.
21. The Rendilegping Company is considering the acquisition of amachine that costs $100,000 if bought today. The company can buyor lease the machine. If it buys the machine, the machine would bedepreciated as a 3-year MACRS asset and is expected to have a sal-vage value of $5,000 at the end of the 5-year useful life. If leased,the lease payments are $24,000 each year for four years, payable atthe beginning of each year. The marginal tax rate of the Rendileg-ping Company is 30% and the cost of capital is 15%. Use theMACRS rates as provided in Question 19 and assume that the leaseis a net lease, that any tax benefits are realized in the year of theexpense, and that there is no investment tax credit.a. Calculate the depreciation for each year in the case of the pur-
chase of this machine.b. Calculate the direct cash flows from leasing initially and for each
of the five years.c. Calculate the adjusted discount rate.d. Calculate the value of the lease.e. Calculate the amortization of the equivalent loan.
22. The Arrende Corporation is considering the acquisition of a machinethat costs $73,000 if bought today. The company can buy or lease themachine. If it buys the machine, the machine would be depreciatedusing the straight-line method, depreciating the full asset cost over fiveyears, and is expected to have a salvage value of $2,000 at the end ofthe 5-year useful life. If leased, the lease payments are $17,500 eachyear for four years, payable at the beginning of each year. Arrende’smarginal tax rate is 38% and the appropriate cost of capital is 10%.Assume that the lease is a net lease, that any tax benefits are realized inthe year of the expense, and that there is no investment tax credit.a. Calculate the depreciation for each year in the case of the pur-
chase of this machine.b. Calculate the direct cash flows from leasing initially and for each
of the five years.c. Calculate the adjusted discount rate.d. Calculate the value of the lease.e. Calculate the amortization of the equivalent loan.
27-Equipment Leasing Page 916 Wednesday, June 4, 2003 12:07 PM

CHAPTER 28
917
Project Financing
tructured financing is a debt obligation that is backed by the value ofan asset or credit support provided by a third party. In Chapter 26
we described one form of structured finance transaction—asset securiti-zation. The key in an asset securitization is to remove the assets (i.e.,loans and receivables) from the balance sheet of an entity. Recall thatthe special purpose vehicle (SPV) is the entity that acquires the asset andsells the securities to purchase the assets.1 Structured finance is also usedby corporations to fund major projects so that the lenders look to thecash flow from the project being financed rather than corporation orcorporations seeking funding. This financing technique is called projectfinancing (or project finance) and uses the SPV to accomplish its financ-ing objectives. Both project financing and asset securitization use SPVs,yet project financing involves cash flows from operating assets, whereasasset securitization involves cash flows from financial assets, such loansor as receivables.
Industries engaged in the production, processing, transportation oruse of energy have been particularly attracted to project financing tech-niques because of the needs of such companies for new capital sources.Enterprises located in countries privatizing state-owned companies havemade extensive use of project financing.
In this chapter we look at the basic features of project financing.Discussions associated with project financing tend to focus on largecomplex projects. This might lead one to the conclusion that the projectfinancing principles discussed in this chapter have little application tosmaller, more ordinary financings. This is not the case. The same princi-ples used to finance a major pipeline, copper mine, or a power plant canbe used to finance a cannery, a hotel, a ship, or a processing plant.
1 Another name for the SPV is the special purpose entity, or SPE.
S
28-Project financing Page 917 Wednesday, April 30, 2003 12:20 PM
918 SELECTED TOPICS IN FINANCIAL MANAGEMENT
The use of project financing, and the use of an SPV to accomplish it,have been under attack by the press and some legislative leaders. Thisattack is the result of the bankruptcy of Enron in 2002. Enron usedproject financing in a manner that made little economic sense and purelyas a means for avoiding disclosing information to shareholders andcreditors. At the end of this chapter, we discuss the impact of Enron’sbankruptcy on the use of project financing by corporations.
WHAT IS PROJECT FINANCING?
Although the term “project financing” has been used to describe alltypes of financing of projects, both with and without recourse, the termhas evolved in recent years to have a more precise definition:
A financing of a particular economic unit in which alender is satisfied to look initially to the cash flows andearnings of that economic unit as the source of funds fromwhich a loan will be repaid and to the assets of the eco-nomic unit as collateral for the loan.2
A key word in the definition is “initially.” While a lender may bewilling to look initially to the cash flows of a project as the source offunds for repayment of the loan, the lender must also feel comfortablethat the loan will in fact be paid on a worst case basis. This may involveundertakings or direct or indirect guarantees by third parties who aremotivated in some way to provide such guarantees.
Project financing has great appeal when it does not have a substan-tial impact on the balance sheet or the creditworthiness of the sponsor-ing entity. Boards of directors are receptive to proceeding with projectswhich can be very highly leveraged or financed entirely or substantiallyon their own merits.
The moving party in a project is its promoter or sponsor. A projectmay have one or several sponsors. The motivation of construction com-panies acting as sponsors is to profit in some way from the constructionor operation of the project. The motivation of operating companies forsponsoring a project may be simply to make a profit from selling theproduct produced by the project. In many instances the motivation forthe project is to provide processing or distribution of a basic product ofthe sponsor or to ensure a source of supply vital to the sponsor’s business.
2 Peter K. Nevitt and Frank J. Fabozzi, Project Financing: Seventh Edition (London:Euromoney, 2001), p. 1.
28-Project financing Page 918 Wednesday, April 30, 2003 12:20 PM
Project Financing 919
The ultimate goal in project financing is to arrange a borrowing fora project which will benefit the sponsor and at the same time be com-pletely non-recourse to the sponsor, in no way affecting its credit stand-ing or balance sheet. One way this can be accomplished is by using thecredit of a third party to support the transaction. Such a third party thenbecomes a sponsor. However, projects are rarely financed independentlyon their own merits without credit support from sponsors who are inter-ested as third parties and who will benefit in some way from the project.
There is considerable room for disagreement between lenders andborrowers as to what constitutes a feasible project financing. Borrowersprefer their projects to be financed independently off-balance sheet withappropriate disclosures in financial reports indicating the exposure ofthe borrower to a project financing. Lenders, on the other hand, are notin the venture capital business. They are not equity risk takers. Lenderswant to feel secure that they are going to be repaid either by the project,the sponsor, or an interested third party. Therein lies the challenge ofmost project financings.
The key to a successful project financing is structuring the financingof a project with as little recourse as possible to the sponsor while at thesame time providing sufficient credit support through guarantees orundertakings of a sponsor or third party, so that lenders will be satisfiedwith the credit risk.
There is a popular misconception that project financing means off-balance sheet financing to the point that the project is completely self-supporting without guarantees or undertakings by financially responsibleparties. This leads to misunderstandings by prospective borrowers whoare under the impression that certain kinds of projects may be financedas stand-alone, self-supporting project financings and, therefore, proceedon the assumption that similar projects in which they are interested canbe financed without recourse to the sponsor, be off-balance sheet to thesponsor, and be without any additional credit support from a financiallyresponsible third party.
It would be a happy circumstance if it were possible simply to arrangea 100% loan for a project (non-recourse to sponsors) which looked asthough it would surely be successful on the basis of optimistic financialprojections. Unfortunately, this is not the case. There is no magic aboutproject financing. Such a financing can be accomplished by financial engi-neering which combines the undertakings and various kinds of guaranteesby parties interested in a project being built in such a way that none of theparties alone has to assume the full credit responsibility for the project, yetwhen all the undertakings are combined and reviewed together, the equiv-alent of a satisfactory credit risk for lenders has resulted.
28-Project financing Page 919 Wednesday, April 30, 2003 12:20 PM
920 SELECTED TOPICS IN FINANCIAL MANAGEMENT
REASONS FOR JOINTLY OWNED OR SPONSORED PROJECTS
There has been an increasing trend towards jointly owned or controlledprojects. Although most corporations prefer sole ownership and controlof a major project, particularly projects involving vital supplies and dis-tribution channels, there are factors that encourage the formation ofjointly owned or controlled projects that consist of partners withmutual goals, talents, and resources. These factors include:3
■ The undertaking is beyond a single corporation’s financial and/or man-agerial resources.
■ The partners have complementary skills.
■ Economics of a large project lower the cost of the product or servicesubstantially over the possible cost of a smaller project if the partnersproceeded individually.
■ The risks of the projects are shared.
■ One or more of the partners can use the tax benefits (i.e., depreciationand any tax credit).
■ Greater debt leverage can be obtained.
The joint sponsors will select the legal form of the SPV (corpora-tion, partner, limited partnership, limited liability company, contractualjoint venture, or trust) that will be satisfy their tax and legal objectives.
CREDIT EXPOSURES IN A PROJECT FINANCING
To place a project financing into perspective, it is helpful to review thedifferent credit exposures that occur at different times in the course of atypical project financing.
Risk PhasesProject financing risks can be divided into three time frames in whichthe elements of credit exposure assume different characteristics:
■ engineering and construction phase
■ start-up phase
■ operations according to planned specifications
3 Nevitt and Fabozzi, Project Financing, Seventh Edition, p. 265.
28-Project financing Page 920 Wednesday, April 30, 2003 12:20 PM
Project Financing 921
Different guarantees and undertakings of different partners may be usedin each time frame to provide the credit support necessary for structur-ing a project financing.
Engineering and Construction PhaseProjects generally begin with a long period of planning and engineering.Equipment is ordered, construction contracts are negotiated, and actualconstruction begins. After commencement of construction, the amountat risk begins to increase sharply as funds are advanced to purchasematerial, labor, and equipment. Interest charges on loans to finance con-struction also begin to accumulate.
Start-Up PhaseProject lenders do not regard a project as completed on conclusion ofthe construction of the facility. They are concerned that the plant orfacility will work at the costs and to the specifications which wereplanned when arranging the financing. Failure to produce the productor service in the amounts and at the costs originally planned means thatthe projections and the feasibility study are incorrect and that there maybe insufficient cash to service debt and pay expenses.
Project lenders regard a project as acceptable only after the plant orfacility has been in operation for a sufficient period of time to ensurethat the plant will in fact produce the product or service at the price, inthe amounts, and to the standards assumed in the financial plan whichformed the basis for the financing. This start-up risk period may runfrom a few months to several years.
Operations According to SpecificationOnce the parties are satisfied that the plant is running to specification,the final operating phase begins. During this phase, the project begins tofunction as a regular operating company. If correct financial planningwas done, revenues from the sale of the product produced or serviceperformed should be sufficient to service debt—interest and principal—pay operating costs, and provide a return to sponsors and investors.
Different Lenders for Different Risk PeriodsSome projects are financed from beginning to end with a single lender orsingle group of lenders. However, most large projects employ differentlenders or groups of lenders during different risk phases. This is becauseof the different risks involved as the project facility progresses through
28-Project financing Page 921 Wednesday, April 30, 2003 12:20 PM
922 SELECTED TOPICS IN FINANCIAL MANAGEMENT
construction to operation, and the different ability of lenders to copewith and accept such risks.
Some lenders like to lend for longer terms and some prefer short-termlending. Some lenders specialize in construction lending and are equippedto monitor engineering and construction of a project, some are not. Somelenders will accept and rely on guarantees of different sponsors during theconstruction, start-up or operation phases, and some will not. Some lend-ers will accept the credit risk of a turn-key operating project, but are notinterested in the high-risk lending during construction and start-up.
Interest rates will also vary during the different risk phases ofproject financing and with different credit support from sponsors duringthose time periods.
Short-term construction lenders are very concerned about the avail-ability of long-term “take out” financing by other lenders upon comple-tion of the construction or start-up phase. Construction lenders live infear of providing their own unplanned take out financing. Consequently,from the standpoint of the construction lender, take out financingshould be in place at the outset of construction financing.
KEY ELEMENTS OF A SUCCESSFUL PROJECT FINANCING
There are several elements that both sponsors and lenders to a projectfinancing should review in order to increase the likelihood that a projectfinancing will be successful. The key ones are listed below:4
■ A satisfactory feasibility study and financial plan should be preparedwith realistic assumptions regarding future inflation rates and interestrates.
■ The cost of product or raw materials to be used by the project is assured.
■ A supply of energy at reasonable cost has been assured.
■ A market exists for the product, commodity, or service to be produced.
■ Transportation is available at a reasonable cost to move the product tothe market.
■ Adequate communications are available.
■ Building materials are available at the costs contemplated.
■ The contractor is experienced and reliable.
■ The operator is experienced and reliable.
■ Management personnel are experienced and reliable.
■ Untested technology is not involved.
4 Nevitt and Fabozzi, Project Financing, Seventh Edition, p. 7.
28-Project financing Page 922 Wednesday, April 30, 2003 12:20 PM
Project Financing 923
■ The contractual agreement among joint venture partners, if any, is sat-isfactory.
■ The key sponsors have made an adequate equity contribution.
■ Satisfactory appraisals of resources and assets have been obtained.
■ Adequate insurance coverage is contemplated.
■ The risk of cost overruns have been addressed.
■ The risk of delay has been considered.
■ The project will have an adequate return for the equity investor.
■ Environmental risks are manageable.
When the project involves a sovereign entity, the following criticalelements are important to consider to ensure the success of a project:
■ A stable and friendly political environment exists; licences and permitsare available; contracts can be enforced; legal remedies exist.
■ There is no risk of expropriation.
■ Country risk is satisfactory.
■ Sovereign risk is satisfactory.
■ Currency and foreign exchange risks have been addressed.
■ Protection from criminal activities such as kidnaping and extortion.
■ Existence of a commercial legal system protecting property and con-tractual rights.
CAUSES FOR PROJECT FAILURES
The best way to appreciate the concerns of lenders to a project is to reviewand consider some of the common causes for project failures, whichinclude the following:5
■ Delay in completion, with consequential increase in the interestexpense on construction financing and delay in the contemplated reve-nue flow
■ Capital cost overrun
■ Technical failure
■ Financial failure of the contractor
■ Uninsured casualty losses
■ Increased price or shortages of raw material
■ Technical obsolescence of the plant or equipment
■ Loss of competitive position in the marketplace
5 Nevitt and Fabozzi, Project Financing, Seventh Edition, p. 2.
28-Project financing Page 923 Wednesday, April 30, 2003 12:20 PM
924 SELECTED TOPICS IN FINANCIAL MANAGEMENT
■ Poor management
■ Overly optimistic appraisals of the value of pledged security, such as oiland gas reserves
In addition, for projects in a foreign country, the following arecauses for project failures:
■ Government interference
■ Expropriation
■ Financial insolvency of the host government
For a project financing to be successfully achieved, these risks mustbe properly considered, monitored, and avoided throughout the life ofthe project.
CREDIT IMPACT OBJECTIVE
While the sponsor or sponsors of a project financing ideally would pre-fer that the project financing be a non-recourse borrowing which doesnot in any way affect its credit standing or balance sheet, many projectfinancings are aimed at achieving some other particular credit impactobjective, such as any one or several of the following:6
■ To avoid being shown on the face of the balance sheet
■ To avoid being shown as debt on the face of the balance sheet so as notto impact financial ratios
■ To avoid being shown in a particular footnote to the balance sheet
■ To avoid being within the scope of restrictive covenants in an indentureor loan agreement which precludes direct debt financing or leases forthe project
■ To avoid being considered as a cash obligation which would diluteinterest coverage ratios, and affect the sponsor’s credit standing withthe rating services
■ To limit direct liability to a certain period of time such as during con-struction and/or the start-up period, so as to avoid a liability for theremaining life of the project
■ To keep the project off-balance sheet during construction and/or untilthe project generates revenues
6 Nevitt and Fabozzi, Project Financing, Seventh Edition, p. 4.
28-Project financing Page 924 Wednesday, April 30, 2003 12:20 PM
Project Financing 925
Any one or a combination of these objectives maybe sufficient reasonfor a borrower to seek the structure of a project financing.
Liability for project debt for a limited time period may be accept-able in situations in which liability for such debt is unacceptable for thelife of the project. Where a sponsor cannot initially arrange long-termnon-recourse debt for its project that will not impact its balance sheet,the project may still be feasible if the sponsor is willing to assume thecredit risk during the construction and start-up phase, and providedlenders are willing to shift the credit risk to the project after the projectfacility is completed and operating. Under such an arrangement, most ofthe objectives of an off-balance sheet project financing and limitedcredit impact can be achieved after the initial risk period of constructionand start-up. In some instances, the lenders may be satisfied to rely onrevenue produced by unconditional take-or-pay contracts from users ofthe product or services to be provided by the project to repay debt.7 Inother instances, the condition of the market for the product or servicemay be such that sufficient revenues are assured after completion ofconstruction and start-up so as to convince lenders to rely on such reve-nues for repayment of their debts.
ACCOUNTING CONSIDERATIONS
Project financing is sometimes called off-balance sheet financing. How-ever, while the project debt may not be on the sponsor’s balance sheet,the project debt will appear on the face of the project balance sheet. Inany event, the purpose of a project financing is to segregate the creditrisk of the project in order that the credit risk of lending to either thesponsor or the project can be clearly and fairly appraised on theirrespective merits. The purpose is not to hide or conceal a liability of thesponsor from creditors, rating agencies, or stockholders.
Significant undertakings of sponsors and investors in projects subjectto the Financial Accounting Standards Board must usually be shown infootnotes to their financial statements if not in the statements themselves.
7 A take-or-pay contract is a long-term contract to make periodic payments over thelife of the contract in certain minimum amounts as payments for a service or a prod-uct. The payments are in an amount sufficient to service the debt needed to financethe project which provides the services or the product and to pay operating expensesof the project. The obligation to make minimum payments is unconditional and mustbe paid whether or not the service or product is actually furnished or delivered. Incontrast, a take-and-pay contract is a contact in which payment is contingent upondelivery and the obligation to pay is not unconditional.
28-Project financing Page 925 Wednesday, April 30, 2003 12:20 PM
926 SELECTED TOPICS IN FINANCIAL MANAGEMENT
Because project financings are concerned with balance sheet accountingtreatment, familiarity with accounting terms used to describe or rational-ize balance sheet reporting is important. Terms such as contingent liabil-ity, indirect liability, deferred liability, deferred expense, fixed charges,equity accounting, and materiality are used to rationalize the appropriatepositioning of entries in a sponsor’s financial statements and footnotes.Accounting rules for reporting these types of liabilities are under contin-ual review, as the accounting profession grapples with the problem ofproper and fair disclosure and presentation of objective information tostockholders, lenders, rating agencies, guarantors, government agencies,and other concerned parties.8
MEETING INTERNAL RETURN OBJECTIVES
As explained in Chapter 13, corporations set target rates of return fornew capital investments. If a proposed capital expenditure will not gen-erate a return greater than a company’s target rate, it is not regarded asa satisfactory use of capital resources. This is particularly true when acompany can make alternative capital expenditures which will producea return on capital in excess of the target rate.
Project financing can sometimes be used to improve the return onthe capital invested in a project by leveraging the investment to a greaterextent than would be possible in a straight commercial financing of theproject. This can be accomplished by locating other parties interested ingetting the project built, and shifting some of the debt coverage to suchparties through direct or indirect guarantees. An example would be anoil company with a promising coal property which it did not wish todevelop because of better alternative uses of its capital. By bringing in acompany which required the coal, such as a public utility, an indirectguarantee might be available in the form of a long-term take-or-paycontract which would support long-term debt to finance the construc-tion of the coal mine. This, in turn, would permit the oil company’sinvestment to be highly leveraged and consequently to produce a muchhigher rate of return.
8 On June 28, 2002, the Financial Accounting Standards Board (FASB) issued an ex-posure draft of a proposed interpretation of Accounting Research Bulletin No. 51,“Consolidation of Certain Special-Purpose Entities.” This exposure draft, which issubject to public comment, is an attempt to clarify the issue of whether to consolidatespecial purpose entities within the sponsor company’s financial statements.
28-Project financing Page 926 Wednesday, April 30, 2003 12:20 PM
Project Financing 927
OTHER BENEFITS OF A PROJECT FINANCING
There are often other side benefits resulting from segregating a financingas a project financing which may have a bearing on the motives of thecompany seeking such a structure. These benefits include:9
■ Credit sources may be available to the project that would not be avail-able to the sponsor.
■ Guarantees may be available to the project that would not be availableto the sponsor.
■ A project financing may enjoy better credit terms and interest costs insituations in which a sponsor’s credit is weak.
■ Higher leverage of debt to equity may be achieved. ■ Legal requirements applicable to certain investing institutions may be
met by the project but not by the sponsor. ■ Regulatory problems affecting the sponsor may be avoided. ■ For regulatory purposes, costs may be clearly segregated as a result of a
project financing. ■ Construction financing costs may not be reflected in the sponsor’s
financial statements until such time as the project begins producingrevenue.
In some instances, any one of the reasons stated above may be the pri-mary motivation for structuring a new operation as a project financing.
TAX CONSIDERATIONS
Tax benefits from any applicable tax credits, depreciation deductions,interest deductions, depletion deductions, research and development taxdeductions, dividends-received credits, foreign tax credits, capital gains,and non-capital start-up expenses are very significant considerations inthe investment, debt service, and cash flow of most project financings.Care must be used in structuring a project financing to make sure thatthese tax benefits are used. Where a project financing is housed in a newentity that does not have taxes to shelter, it is important to structure theproject financing so that any tax benefits can be transferred to parties ina position currently able to use such tax benefits.
For U.S. federal income tax purposes, 80% control is required fortax consolidation, except in the case of certain foreign subsidiaries, inwhich 50% control may require consolidation.
9 Nevitt and Fabozzi, Project Financing, Seventh Edition, p. 6.
28-Project financing Page 927 Wednesday, April 30, 2003 12:20 PM
928 SELECTED TOPICS IN FINANCIAL MANAGEMENT
DISINCENTIVES TO PROJECT FINANCING
Project financings are complex. The documentation tends to be compli-cated, and the cost of borrowing funds may be higher than conventionalfinancing. If the undertakings of a number of parties are necessary tostructure the project financing, or if a joint venture is involved, the nego-tiation of the original financing agreements and operating agreements willrequire patience, forbearing, and understanding. Decision making in part-nerships and joint ventures is never easy, since the friendliest of partnersmay have diverse interests, problems, and objectives. However, therewards and advantages of a project financing will often justify the specialproblems that may arise in structuring and operating the project.
ENRON’S EFFECT ON PROJECT FINANCING
Because of Enron’s use of project financing, concerns have been expressedover the use of this method of financing. Unfortunately, attacks on projectfinancing that were reported in the press and concerns expressed by mem-bers of Congress simply failed to recognize that what Enron did had verylittle to do with traditional project financing. Enron used partnerships asits legal entity in project financing and these partnerships had little of thecharacteristics of a project financing described in this chapter. Instead,according to Barry Gold, a managing director at Salomon Smith Barney,the project financings used by Enron were an “attempt to unduly benefitfrom accounting, tax, and disclosure requirements and definitions.”10
In a project financing, there is transparency about the economics ofthe project. The project lenders are well informed of the risks and arefurnished the financial projections and economic analysis along with theassumptions. In general, there is more information provided in a projectfinancing than there is in a typical corporate bond prospectus. All par-ties to a project financing can perform due diligence and raise questionswith the sponsor. In contrast, in the project financings of Enron, thefirm’s shareholders and creditor did not have enough information toundertake due diligence.
While project financing as discussed in this chapter had nothing to dowith the use of off-balance sheet SPVs utilized by Enron, there have beensome changes in the market. As a result of the Enron bankruptcy, majorcorporate users of project financing are providing even more disclosure
10 Henry A. Davis, “How Enron Has Affected Project Finance,” The Journal ofStructured and Project Finance (Spring 2002), p. 19.
28-Project financing Page 928 Wednesday, April 30, 2003 12:20 PM
Project Financing 929
about projects.11 What management will want to be sure of is that anyproject financings that are treated as off-balance sheet are truly non-recourse to the sponsor. If there is potential recourse to the sponsor thatmay be significant in nature, management should report the project financ-ing on the balance sheet. That is, the debt of the project should be treatedas a liability and the value of the project should be treated as an asset.
In concluding his analysis of the use of project finance after Enron,Henry Davis, managing editor of The Journal of Structured and ProjectFinance, writes:
... project finance is alive and well. We just need to reminda few people of its basic fundamentals. Neither projectfinance nor sensible innovations in structured finance withsound, well-explained business reasons have been shakenby Enron. The principal lessons learned from the Enrondebacle have to do with transparency and disclosure.When some of your businesses or your financing structuresbecome hard to explain, you may begin to questionwhether they make sense in the first place.12
SUMMARY
■ In a project financing or project finance, lenders initially look to thecash flow from the project being financed rather than the corporationor corporations seeking funding. The moving party in a project is itspromoter or sponsor.
■ The ultimate goal in project financing is to arrange a borrowing for aproject which will benefit the sponsor and, at the same time, be com-pletely non-recourse to the sponsor, in no way affecting its creditstanding or balance sheet. This can be accomplished by using thecredit of a third party to support the transaction. However, projectsare typically not financed independently on their own merits withoutcredit support from sponsors who are interested third parties whowill benefit in some way from the project.
■ Although most corporations prefer sole ownership and control of amajor project, there are several factors that encourage the formation ofjointly owned or controlled projects. Joint sponsors will select the legalform of the SPV that will satisfy their tax and legal objectives.
11 Davis, “How Enron Has Affected Project Finance.”12 Davis, “How Enron Has Affected Project Finance,” p. 25.
28-Project financing Page 929 Wednesday, April 30, 2003 12:20 PM

930 SELECTED TOPICS IN FINANCIAL MANAGEMENT
■ There are three time frames that are associated with the risk of aproject financing: (1) engineering and construction phase, (2) start-upphase, and (3) operations according to planned specifications. Differ-ent guarantees and undertakings of different partners may be used ineach time frame to provide the credit support necessary for structur-ing a project financing. Most large projects employ different lendersor groups of lenders because of the different risks involved as theproject facility progresses through construction to operation, and thedifferent ability of lenders to cope with and accept such risks.
■ For a project financing to be successfully achieved, the risks associatedwith a project must be understood and monitored throughout the lifeof the project.
QUESTIONS
1. What types of industries have been engaged in project financing?2. Why do lenders in a project financing look very closely at the
project’s expected cash flows?3. Comment on the following statement: “The sole purpose of a project
financing is to provide the sponsors with off-balance sheet financing.”4. What are the advantages of a jointly sponsored project financing?5. The key to a project financing is to finance a project with as little
recourse to the sponsor as possible. Explain why.6. Comment on the following statement: “Project financing means off-
balance sheet financing to the point that the project is completelyself-supporting without guarantees or undertakings by financiallyresponsible parties.”
7. What types of risk are associated with the following phases of aproject financing:a. engineering and construction phase?b. start-up phase?c. operations according to planned specifications?
8. For most large projects there are different lenders or groups of lend-ers during different risk phases. Explain why.
9. What is the concern of short-term construction lenders to a projectfinancing?
10. Identify some important factors that a company considering aproject financing in another country should consider.
11. Identify some of the common causes for project failures.12. What are some of the ways that a project financing can be used to
improve the return on the capital invested in a project?
28-Project financing Page 930 Wednesday, April 30, 2003 12:20 PM

Project Financing 931
13. Identify some of the motives for a project financing.14. Comment on the following statement: “Enron Corporation used
project financing and got itself into a lot of trouble. Enron is a per-fect example of why project financing and special purpose vehiclesshould not be used by reputable firms.”
28-Project financing Page 931 Wednesday, April 30, 2003 12:20 PM

28-Project financing Page 932 Wednesday, April 30, 2003 12:20 PM
CHAPTER 29
933
Strategy and Financial Planning
business that maximizes its owners’ wealth allocates its resourcesefficiently, resulting in an efficient allocation of resources for society
as a whole. Owners, employees, customers, and anyone else who has astake in the business enterprise are all better off when its managersmake decisions that maximize the value of the firm.
Just as there may be alternative routes to a destination, there may bealternative ways to maximize owners’ wealth. A strategy is a sense ofhow to reach an objective such as maximizing wealth. And just as someroutes may get you where you are going faster, some strategies may bebetter than others.
Suppose a firm has decided it has an advantage over its competitorsin marketing and distributing its products in the global market. Thefirm’s strategy may be to expand into European market, followed by anexpansion into the Asian market. Once the firm has its strategy, it needsa plan, in particular the strategic plan, which is the set of actions thefirm intends to use to follow its strategy.
The investment opportunities that enable the firm to follow its strat-egy comprise the firm’s investment strategy. The firm may pursue itsstrategy of expanding into European and Asian markets by either estab-lishing itself or acquiring businesses already in these markets. This iswhere capital budgeting analysis comes in: We evaluate the possibleinvestment opportunities to see which ones, if any, provide a returngreater than necessary for the investment’s risk. And let’s not forget theinvestment in working capital, the resources the firm needs to supportits day-to-day operations.
Suppose as a result of evaluating whether to establish or acquirebusinesses, our firm decides it is better—in terms of maximizing thevalue of the firm—to acquire selected European businesses. The next
A
29-Strategy_FinancialPlan Page 933 Wednesday, April 30, 2003 12:19 PM
934 SELECTED TOPICS IN FINANCIAL MANAGEMENT
step is to figure out how it is going to pay for these acquisitions. Thefinancial managers must make sure that the firm has sufficient funds tomeet its operating needs, as well as its investment needs. This is wherethe firm’s financing strategy enters the picture. Where should the fundsneeded come from? What is the precise timing of the needs for funds?To answer these questions, working capital management (in particular,short-term financing) and the capital structure decision (the mix of long-term sources of financing) enters the picture.
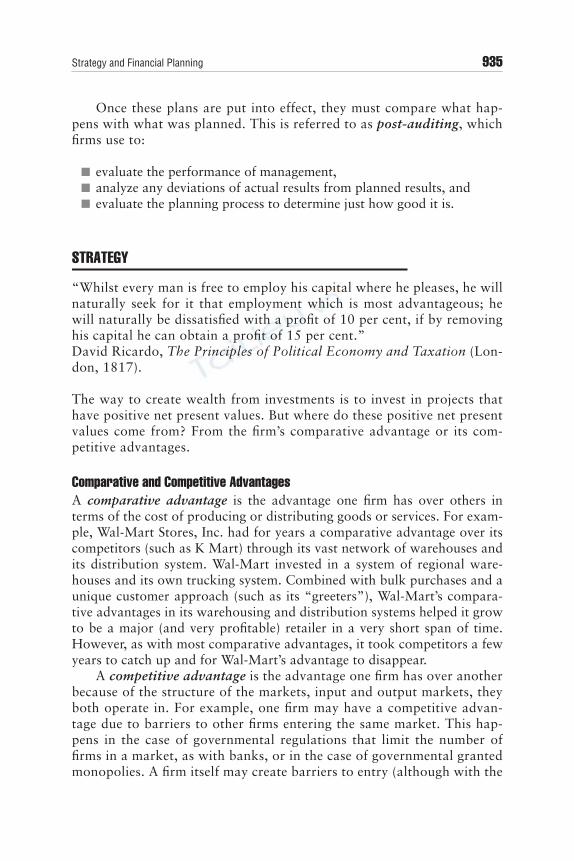
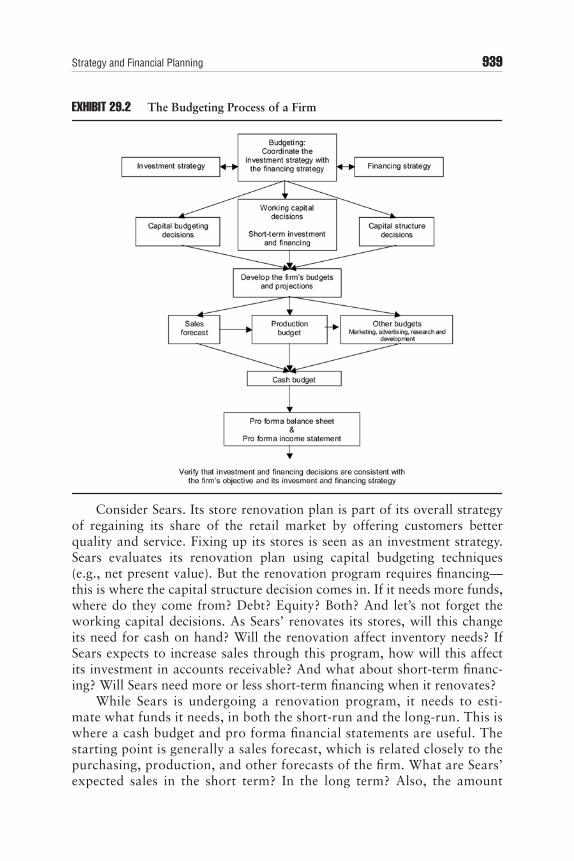
When managers look at the firm’s investment decisions and considerhow to finance them, they are budgeting. Budgeting is mapping out thesources and uses of funds for future periods. Budgeting requires botheconomic analysis (including forecasting) and accounting. Economicanalysis includes both marketing and production analysis to developforecasts of future sales and costs. Accounting techniques are used as ameasurement device: but instead of using accounting to summarize whathas happened (its common use), in budgeting firms use accounting torepresent what we expect to happen in the future. The process is sum-marized in Exhibit 29.1
EXHIBIT 29.1 The Firm’s Planning Process
Define the objective:Maximize owner wealth
Develop a strategy anda strategic plan:
Define comparativeand competitive advantages
Develop the investmentstrategy:
Identify andevaluate investment
opportunities
Develop budgets:Coordinate the
investment plan needswith the financing plan
Develop the financingstrategy:
Identify the needs forfinancing and the
means of financing
Evaluate performance:Post-auditing,
compare results with plans
29-Strategy_FinancialPlan Page 934 Wednesday, April 30, 2003 12:19 PM
Strategy and Financial Planning 935
Once these plans are put into effect, they must compare what hap-pens with what was planned. This is referred to as post-auditing, whichfirms use to:
■ evaluate the performance of management,
■ analyze any deviations of actual results from planned results, and
■ evaluate the planning process to determine just how good it is.
STRATEGY
“Whilst every man is free to employ his capital where he pleases, he willnaturally seek for it that employment which is most advantageous; hewill naturally be dissatisfied with a profit of 10 per cent, if by removinghis capital he can obtain a profit of 15 per cent.”David Ricardo, The Principles of Political Economy and Taxation (Lon-don, 1817).
The way to create wealth from investments is to invest in projects thathave positive net present values. But where do these positive net presentvalues come from? From the firm’s comparative advantage or its com-petitive advantages.
Comparative and Competitive AdvantagesA comparative advantage is the advantage one firm has over others interms of the cost of producing or distributing goods or services. For exam-ple, Wal-Mart Stores, Inc. had for years a comparative advantage over itscompetitors (such as K Mart) through its vast network of warehouses andits distribution system. Wal-Mart invested in a system of regional ware-houses and its own trucking system. Combined with bulk purchases and aunique customer approach (such as its “greeters”), Wal-Mart’s compara-tive advantages in its warehousing and distribution systems helped it growto be a major (and very profitable) retailer in a very short span of time.However, as with most comparative advantages, it took competitors a fewyears to catch up and for Wal-Mart’s advantage to disappear.
A competitive advantage is the advantage one firm has over anotherbecause of the structure of the markets, input and output markets, theyboth operate in. For example, one firm may have a competitive advan-tage due to barriers to other firms entering the same market. This hap-pens in the case of governmental regulations that limit the number offirms in a market, as with banks, or in the case of governmental grantedmonopolies. A firm itself may create barriers to entry (although with the
29-Strategy_FinancialPlan Page 935 Wednesday, April 30, 2003 12:19 PM

936 SELECTED TOPICS IN FINANCIAL MANAGEMENT
help of the government) that include patents and trademarks.NutraSweet Company, a unit of Monsanto Company, had the exclusivepatent on the artificial sweetener, aspartame, which it marketed underthe brand name, NutraSweet. However, this patent expired December14, 1992. The loss of the monopoly on the artificial sweetener reducedthe price of aspartame from $70 per pound to $20–35 per pound, sinceother firms could produce and sell aspartame products starting Decem-ber 15, 1992.1,2
NutraSweet had a competitive advantage as long as it had thepatent. But as soon this patent expired, this competitive advantage waslost and competitors were lining up to enter the market.
Only by having some type of advantage can a firm invest in some-thing and get more back in return. So first you have to figure out whereyour firm has a comparative or competitive advantage before you candetermine your firm’s strategy.
Strategy and Owners’ Wealth MaximizationOften firms conceptualize a strategy in terms of the consumers of thefirm’s goods and services. For example, you may have a strategy tobecome the world’s leading producer of microcomputer chips by pro-ducing the best quality chip or by producing chips at the lowest cost,developing a cost (and price) advantage over your competitors. So yourfocus is on product quality and cost. Is this strategy in conflict withmaximizing owners’ wealth? No.
To maximize owners’ wealth, we focus on the returns and risks offuture cash flows to the firm’s owners. And we look at a project’s netpresent value when we make decisions regarding whether or not toinvest in it. A strategy of gaining a competitive or comparative advan-tage is consistent with maximizing shareholder wealth. This is becauseprojects with positive net present value arise when the firm has a com-petitive or comparative advantage over other firms.
Suppose a new piece of equipment is expected to generate a returngreater than what is expected for the project’s risk (its cost of capital).But how can a firm create value simply by investing in a piece of equip-ment? How can it maintain a competitive advantage? If investing in thisequipment can create value, wouldn’t the firm’s competitors also wantthis equipment? Of course—if they could use it to create value, theywould surely be interested in it.
1 Lois Therrien, Patrick Oster, and Chuck Hawkins, “How Sweet It Isn’t At Nutra-Sweet,” Business Week (December 14, 1992), p. 42.2 Monsanto sold its sweetener division in 2000.
29-Strategy_FinancialPlan Page 936 Wednesday, April 30, 2003 12:19 PM
Strategy and Financial Planning 937
Now suppose that the firm’s competitors face no barriers to buying theequipment and exploiting its benefits. What will happen? The firm and itscompetitors will compete for the equipment, bidding up its price. Whendoes it all end? When the net present value of the equipment is zero.
Now suppose instead that the firm has a patent on the new piece ofequipment and can thus keep its competitors from exploiting the equip-ment’s benefits. Then there would be no competition for the equipmentand the firm would be able to exploit it to increase its owners’ wealth.
Consider an example where trying to gain a comparative advantagewent wrong. Schlitz Brewing Company attempted to reduce its costs togain an advantage over its competitors: It reduced its labor costs andshortened the brewing cycle. Reducing costs allow it to reduce its pricesbelow competitors’ prices. But product quality suffered—so much thatSchlitz lost market share, instead of gaining it.
Schlitz attempted to gain a comparative advantage, but was not trueto a larger strategy to satisfy its customers—who apparently wantedquality beer more than they wanted cheap beer. And the loss of marketshare was reflected in Schlitz’s declining stock price.3
Value can only be created when the firm has a competitive or compara-tive advantage. If a firm analyzes a project and determines that it has a posi-tive net present value, the first question should be: Where did it come from?
FINANCIAL PLANNING AND BUDGETING
“As certainly as financial planning centers about commitments and utili-zation of capital, the protective function of management is also germaneto the process. This function comprehends the integrity of capital, theprofitable survival of the business entity, and the safe-guarding of therights of the capital contributors,” Paul M. Van Arsdell, CorporationFinance (New York: The Ronald Press Company, 1968), p. 550.
A strategy is the direction a firm takes to meet its objective. A strategicplan is how a firm intends to go in that direction. In financial manage-ment, a strategic investment plan includes policies to seek out possibleinvestment opportunities: Do we spend more on research and develop-ment? Do we look globally? Do we attempt to increase market share?
A strategic plan also includes resource allocation. If a firm intendsto expand, where does it get the capital to do so? If a firm requires more
3 The case of Schlitz Brewing is detailed in George S. Day and Liam Fahey in “PuttingStrategy into Shareholder Value Analysis,” Harvard Business Review (March–April1990), pp. 156–162.
29-Strategy_FinancialPlan Page 937 Wednesday, April 30, 2003 12:19 PM
938 SELECTED TOPICS IN FINANCIAL MANAGEMENT
capital, the timing, amount, and type of capital (whether equity or debt)comprise elements of a firm’s financial strategic plan. These things mustbe planned to implement the strategy.
Financial planning allocates a firm’s resources to achieve its invest-ment objectives. Financial planning is important for several reasons.
First, financial planning helps managers assess the impact of a par-ticular strategy on their firm’s financial position, its cash flows, itsreported earnings, and its need for external financing.
Second, by formulating financial plans, the firm’s management is ina better position to react to any changes in market conditions, such asslower than expected sales, or unexpected problems, such as a reductionin the supply of raw materials. By constructing a financial plan, manag-ers become more familiar with the sensitivity of the firm’s cash flowsand its financing needs to changes in sales or some other factor.
Third, creating a financial plan helps managers understand the trade-offs inherent in its investment and financing plans. For example, by devel-oping a financial plan, the financial manager is better able to understandthe tradeoff that exists between having sufficient inventory to satisfy cus-tomer demands and the need to finance the investment in inventory.
Financial planning consists of the firm’s investment and financingplans. Once we know the firm’s investment plan, we need to figure outwhen funds are needed and where they will come from. We do this bydeveloping a budget,4 which is basically the firm’s investment and financ-ing plans expressed in dollar terms. A budget can represent details suchas what to do with cash in excess of needs on a daily basis, or it canreflect broad statements of a firm’s business strategy over the nextdecade. Exhibit 29.2 illustrates the budgeting process.
Budgeting for a short-term (less than a year) is usually referred to asoperational budgeting; budgeting for the long-term (typically three to fiveyears ahead) is referred to as long-run planning or long-term planning.But since long-term planning depends on what is done in the short-term,the operational budgeting and long-term planning are closely related.
The budgeting process involves putting together the financing andinvestment strategy into terms that allow the financial manager to deter-mine what investments can be made and how these investments should befinanced. In other words, budgeting pulls together decisions regarding capi-tal budgeting, capital structure, and working capital. Managers preparebudgets by preparing financial statements that represent these decisions.
4 The term “budget” originates from the French bouge, meaning a bag and its con-tents. We use the term budget to refer to the allocation of a firm’s resources (in dol-lars) over future periods. The bag is therefore the firm; its contents are the firm’sresources, its funds.
29-Strategy_FinancialPlan Page 938 Wednesday, April 30, 2003 12:19 PM
Strategy and Financial Planning 939
EXHIBIT 29.2 The Budgeting Process of a Firm
Consider Sears. Its store renovation plan is part of its overall strategyof regaining its share of the retail market by offering customers betterquality and service. Fixing up its stores is seen as an investment strategy.Sears evaluates its renovation plan using capital budgeting techniques(e.g., net present value). But the renovation program requires financing—this is where the capital structure decision comes in. If it needs more funds,where do they come from? Debt? Equity? Both? And let’s not forget theworking capital decisions. As Sears’ renovates its stores, will this changeits need for cash on hand? Will the renovation affect inventory needs? IfSears expects to increase sales through this program, how will this affectits investment in accounts receivable? And what about short-term financ-ing? Will Sears need more or less short-term financing when it renovates?
While Sears is undergoing a renovation program, it needs to esti-mate what funds it needs, in both the short-run and the long-run. This iswhere a cash budget and pro forma financial statements are useful. Thestarting point is generally a sales forecast, which is related closely to thepurchasing, production, and other forecasts of the firm. What are Sears’expected sales in the short term? In the long term? Also, the amount
29-Strategy_FinancialPlan Page 939 Wednesday, April 30, 2003 12:19 PM
940 SELECTED TOPICS IN FINANCIAL MANAGEMENT
that Sears expects to sell affects its purchases, sales personnel, andadvertising forecasts. Putting together forecasts requires cooperationamong Sears’ marketing, purchasing, and financial management.
Once Sears has its sales and related forecasts, the next step is a cashbudget, detailing the cash inflows and outflows each period. Once thecash budget is established, pro forma balance sheet and income state-ments can be constructed. Following this, Sears must verify that its bud-get is consistent with its objective and its strategies.
Budgeting generally begins four to six months prior to the end of thecurrent fiscal period. Most firms have a set of procedures that must be fol-lowed in compiling the budget. The budget process is usually managed byeither a Vice-President to Planning, the Director of the Budget, the Vice-President of Finance, the Chief Financial Officer, or the Corporate Con-troller. Each division or department provides its own budgets that are thenmerged into a firm’s centralized budget by the manager of the budget.
A budget looks forward and backward. It identifies resources the firmwill generate or need in the near- and long-term, and it serves as a measureof the current and past performance of departments, divisions, or individ-ual managers. But we have to be careful when we measure deviationsbetween budgeted and actual results. We must separately identify devia-tions that were controllable from deviations that were uncontrollable. Forexample, suppose we develop a budget expecting $10 million sales from anew product. If actual sales turn out to be $6 million, do we interpret thisresult as poor performance on the part of management? Maybe, maybenot. If the lower-than-expected sales are due to an unexpected downturnin the economy, probably not. But yes, if they are due to what turns out tobe obviously poor management forecasts of consumer demand.
Sales ForecastingSales forecasts are an important part of financial planning. Inaccurateforecasts can result in shortages of inventory, inadequate short-termfinancing arrangements, and so on.
If a firm’s sales forecast misses its mark, either understating or overstat-ing sales, there are many potential problems. Consider Coleco Industries,which missed its mark. This company introduced a toy product in 1983, itsCabbage Patch doll, which enjoyed runaway popularity. In fact, this dollwas so popular, that Coleco could not keep up with demand. It was in suchdemand and inventory so depleted that fights broke out in toy stores, someparents bribed store personnel to get scarce dolls just before Christmas, andfake dolls were being smuggled into the country.
Coleco missed its mark, significantly underestimating the demandfor these dolls. While having a popular toy may seem like a dream for a
29-Strategy_FinancialPlan Page 940 Wednesday, April 30, 2003 12:19 PM
Strategy and Financial Planning 941
toy manufacturer, this doll turned into a nightmare. With no CabbagePatch dolls on the toy shelves, other toy manufacturers introduced dollswith similar (but not identical) features, capturing some of Coleco’smarket. Also, many consumers—the parents—became irate at Coleco’screating the demand for the toy through advertising, but not having suf-ficient dolls to satisfy the demand.
Coleco Industries tried but failed to introduce a toy as successful asthe Cabbage Patch doll. It filed for bankruptcy in 1988, with most of itsassets (including its Cabbage Patch doll line) sold to Hasbro Inc., a rivaltoy company. Hasbro was then acquired by Mattel, Inc. Cabbage PatchDolls are experiencing a resurgence of interest, thanks to the increasedmarketing power of Mattel and a tie-in with the 1996 summer Olympics.
To predict cash flows we forecast sales which are uncertain becausethey are affected by future economic, industry, and market conditions.Nevertheless, we can usually assign meaningful degrees of uncertaintyto our forecasts. We forecast sales in one of the following ways:
■ regression analysis;
■ market surveys; and
■ opinions of management.
Forecasting with Regression Regression is a statistical method that enables us to “fit” a straight linethat on average represents the best possible graphical relationshipbetween sales and time. This best “fit” is called the regression line. Oneway regression can be used is to simply extrapolate future sales basedon the trend in past sales. In Exhibit 29.3, let’s look at the sales of Inter-national Business Machines’ sales over the period 1976 through 1999.During much of this period, sales increased each year, hence the salestrend is positive. If we were to connect each point representing sales andtime, the result would look almost like a straight line that slopesupward. But we can’t do much with an “almost” straight line. We needa straight line.
Let’s simplify the regression against time by noting the years 1976,1977, ..., 1999 as 1, 2, ..., 24. Regressing IBM’s sales against time weestimate a regression line described as:
IBM annual sales, in billions = $14.67 + $3.00
× time
↑ ↑Intercept of
line withvertical axis,
in billions
Slope ofthe line, inbillions of
dollars per year
29-Strategy_FinancialPlan Page 941 Wednesday, April 30, 2003 12:19 PM
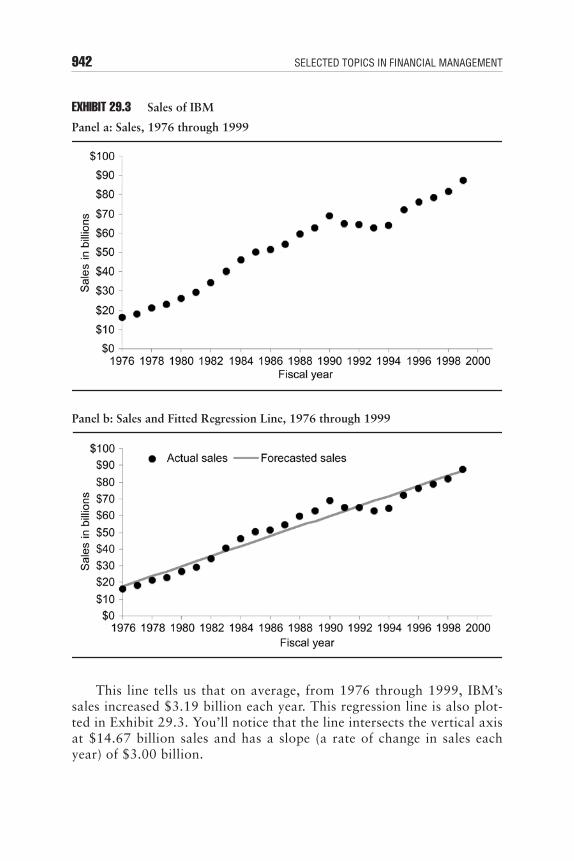
942 SELECTED TOPICS IN FINANCIAL MANAGEMENT
EXHIBIT 29.3 Sales of IBM
Panel a: Sales, 1976 through 1999
Panel b: Sales and Fitted Regression Line, 1976 through 1999
This line tells us that on average, from 1976 through 1999, IBM’ssales increased $3.19 billion each year. This regression line is also plot-ted in Exhibit 29.3. You’ll notice that the line intersects the vertical axisat $14.67 billion sales and has a slope (a rate of change in sales eachyear) of $3.00 billion.
29-Strategy_FinancialPlan Page 942 Wednesday, April 30, 2003 12:19 PM
Strategy and Financial Planning 943
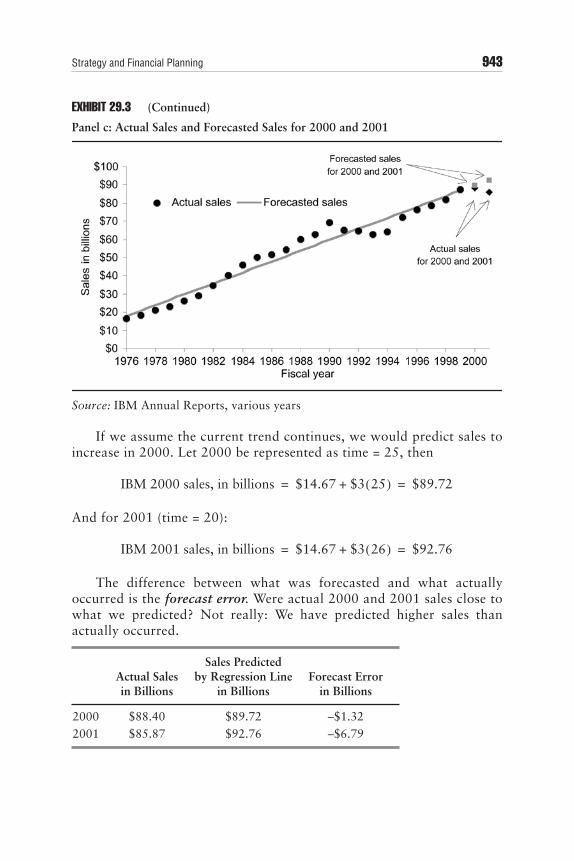
EXHIBIT 29.3 (Continued)
Panel c: Actual Sales and Forecasted Sales for 2000 and 2001
Source: IBM Annual Reports, various years
If we assume the current trend continues, we would predict sales toincrease in 2000. Let 2000 be represented as time = 25, then
And for 2001 (time = 20):
The difference between what was forecasted and what actuallyoccurred is the forecast error. Were actual 2000 and 2001 sales close towhat we predicted? Not really: We have predicted higher sales thanactually occurred.
Actual Salesin Billions
Sales Predictedby Regression Line
in BillionsForecast Error
in Billions
2000 $88.40 $89.72 –$1.322001 $85.87 $92.76 –$6.79
IBM 2000 sales, in billions $14.67 $3 25( )+ $89.72= =
IBM 2001 sales, in billions $14.67 $3 26( )+ $92.76= =
29-Strategy_FinancialPlan Page 943 Wednesday, April 30, 2003 12:19 PM
944 SELECTED TOPICS IN FINANCIAL MANAGEMENT
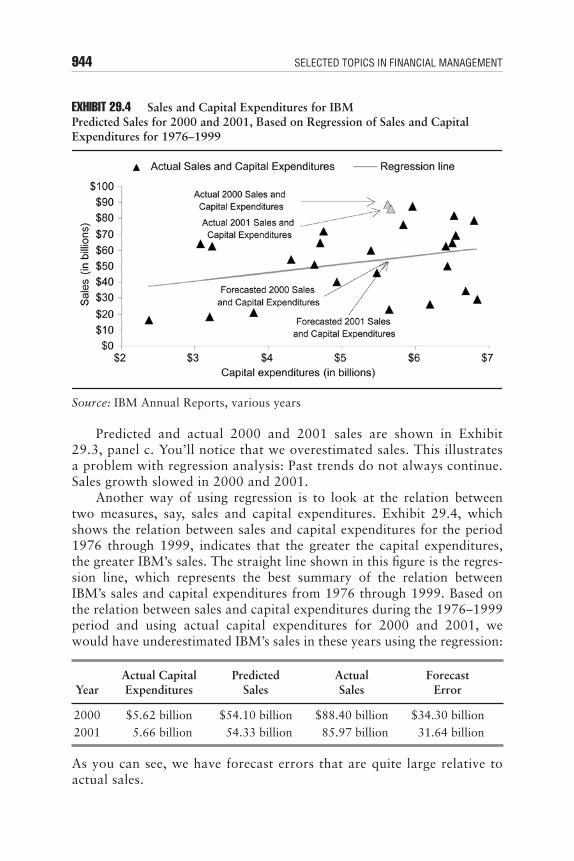
EXHIBIT 29.4 Sales and Capital Expenditures for IBMPredicted Sales for 2000 and 2001, Based on Regression of Sales and Capital Expenditures for 1976–1999
Source: IBM Annual Reports, various years
Predicted and actual 2000 and 2001 sales are shown in Exhibit29.3, panel c. You’ll notice that we overestimated sales. This illustratesa problem with regression analysis: Past trends do not always continue.Sales growth slowed in 2000 and 2001.
Another way of using regression is to look at the relation betweentwo measures, say, sales and capital expenditures. Exhibit 29.4, whichshows the relation between sales and capital expenditures for the period1976 through 1999, indicates that the greater the capital expenditures,the greater IBM’s sales. The straight line shown in this figure is the regres-sion line, which represents the best summary of the relation betweenIBM’s sales and capital expenditures from 1976 through 1999. Based onthe relation between sales and capital expenditures during the 1976–1999period and using actual capital expenditures for 2000 and 2001, wewould have underestimated IBM’s sales in these years using the regression:
As you can see, we have forecast errors that are quite large relative toactual sales.
YearActual CapitalExpenditures
PredictedSales
ActualSales
ForecastError
2000 $5.62 billion $54.10 billion $88.40 billion $34.30 billion2001 5.66 billion 54.33 billion 85.97 billion 31.64 billion
29-Strategy_FinancialPlan Page 944 Wednesday, April 30, 2003 12:19 PM
Strategy and Financial Planning 945
We also could look at the relation between IBM’s sales and a num-ber of factors, such as IBM’s capital expenditures, a measure of eco-nomic activity such as Gross Domestic Product (GDP), and IBM’scompetitor’s capital expenditures. Estimating the relation among thesefactors over a number of years, combined with forecasts of GDP andcompetitors’ expenditures, we could predict IBM’s sales for 1994. Themore factors we include, the more accurate should be our predictions.
While regression analysis gives us what may seem to be a precisemeasure of the relationship among variables, there are a number ofwarnings that the financial manager must heed in using it:
■ Using historical data to predict the future assumes that the past rela-tionships will continue into the future, which is not always true.
■ The period over which the regression is estimated may not be represen-tative of the future. For example, data from a recessionary period oftime will not tell much about a period that is predicted to be an eco-nomic boom.
■ The reliability of the estimate is important: If there is a high degree oferror in the estimate, the regression estimates may not be useful.
■ The time period over which the regression is estimated may be tooshort to provide a basis for projecting long-term trends.
■ The forecast of one variable may require forecasts of other variables.For example, you may be convinced that sales are affected by GDP anduse regression to analyze this relationship. But to use regression to fore-cast sales, you must first forecast GDP. In this case, your forecast ofsales is only as good as your forecast of GDP.
Market SurveysMarket surveys of customers can provide estimates of future revenues.In the case of IBM, we would need to focus on the computer industryand, specifically, on the personal computer, mini-computer, and main-frame computer markets. For each of these markets, we would have toassess IBM’s market share and also the expected sales for each market.We should expect to learn from these market surveys:
■ product development and introductions by IBM and its competitors;and
■ the general economic climate and the projected expenditures on com-puters.
A firm can use its own market survey department to survey its custom-ers. Or it can employ outside market survey specialists.
29-Strategy_FinancialPlan Page 945 Wednesday, April 30, 2003 12:19 PM
946 SELECTED TOPICS IN FINANCIAL MANAGEMENT
Management ForecastsIn addition to market surveys, the firm’s managers may be able to pro-vide forecasts of future sales. The experience of a firm’s managementand their familiarity with the firm’s products, customers, and competi-tors make them reliable forecasters of future sales.
The firm’s own managers should have the expertise to predict themarket for the goods and services and to evaluate the costs of producingand marketing them. But there are potential problems in using manage-ment forecasts. Consider the case of a manager who forecasts rosy out-comes for a new product. These forecasts may persuade the firm toallocate more resources—such as a larger capital budget and additionalpersonnel—to that manager. If these forecasts come true, the firm willbe glad these additional resources were allocated. But if these forecaststurned out to be too rosy, the firm has unnecessarily allocated theseresources.
Forecasting is an important element in planning for both the short-term and the long-term. But forecasts are made by people. Forecasterstend to be optimistic, which usually results in rosier than deserved fore-casts of future sales. In addition, people tend to focus on what workedin the past, so past successes carry more weight in the developing fore-casts than an analysis of the future.
One way to avoid this is to make managers responsible for theirforecasts, rewarding accurate forecasts and penalizing the ones forbeing way off the mark.
Seasonal ConsiderationsThe operating activities of a firm typically vary throughout the year,depending on seasonal demand and supply factors. Seasonality influ-ences a firm’s short-term investment and financing activities.
Let’s look at a few U.S. corporations’ quarterly revenues to get anidea of different seasonal patterns of activity:
■ Coca Cola, a beverage producer
■ Amazon.com, an online retailer
■ Walt Disney, a film and amusement firm
■ Nike, a shoe manufacturer
■ Delta Airlines, a national airline
The quarterly revenues for each of these firms is plotted in Exhibit 29.5from the first quarter 1999 through the fourth quarter 2002. The sea-sonal patterns are quite different:
29-Strategy_FinancialPlan Page 946 Wednesday, April 30, 2003 12:19 PM
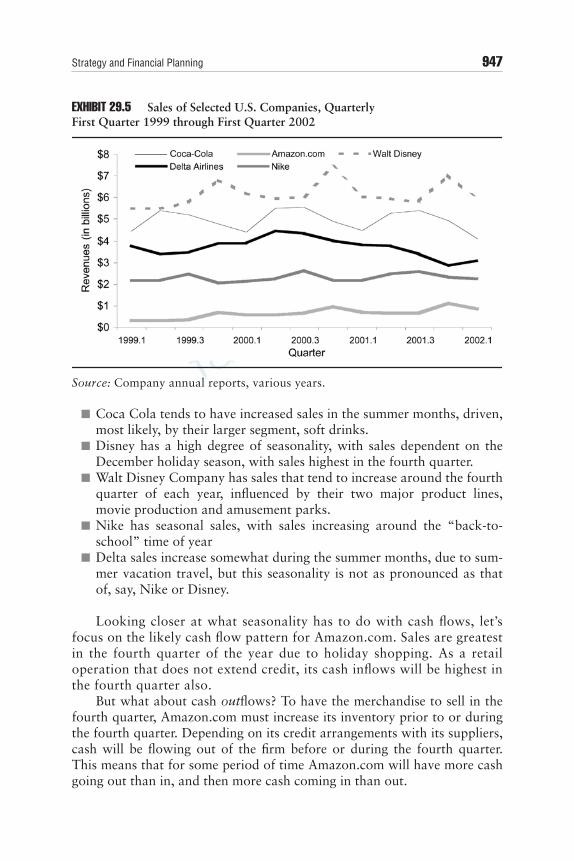
Strategy and Financial Planning 947
EXHIBIT 29.5 Sales of Selected U.S. Companies, QuarterlyFirst Quarter 1999 through First Quarter 2002
Source: Company annual reports, various years.
■ Coca Cola tends to have increased sales in the summer months, driven,most likely, by their larger segment, soft drinks.
■ Disney has a high degree of seasonality, with sales dependent on theDecember holiday season, with sales highest in the fourth quarter.
■ Walt Disney Company has sales that tend to increase around the fourthquarter of each year, influenced by their two major product lines,movie production and amusement parks.
■ Nike has seasonal sales, with sales increasing around the “back-to-school” time of year
■ Delta sales increase somewhat during the summer months, due to sum-mer vacation travel, but this seasonality is not as pronounced as thatof, say, Nike or Disney.
Looking closer at what seasonality has to do with cash flows, let’sfocus on the likely cash flow pattern for Amazon.com. Sales are greatestin the fourth quarter of the year due to holiday shopping. As a retailoperation that does not extend credit, its cash inflows will be highest inthe fourth quarter also.
But what about cash outflows? To have the merchandise to sell in thefourth quarter, Amazon.com must increase its inventory prior to or duringthe fourth quarter. Depending on its credit arrangements with its suppliers,cash will be flowing out of the firm before or during the fourth quarter.This means that for some period of time Amazon.com will have more cashgoing out than in, and then more cash coming in than out.
29-Strategy_FinancialPlan Page 947 Wednesday, April 30, 2003 12:19 PM
948 SELECTED TOPICS IN FINANCIAL MANAGEMENT
BudgetingIn budgeting, we bring together analyses of cash flows, projected incomestatements, projected balance sheets. The cash flow analyses are mostimportant, though you also need to generate the income statement andbalance sheet as well.
Most firms extend or receive credit, so cash flows and net income donot coincide. Typically, you must determine cash flows from accountinginformation on revenues and expenses. Combining sales projectionswith our estimates of collections of accounts receivable results in anestimate of cash receipts.
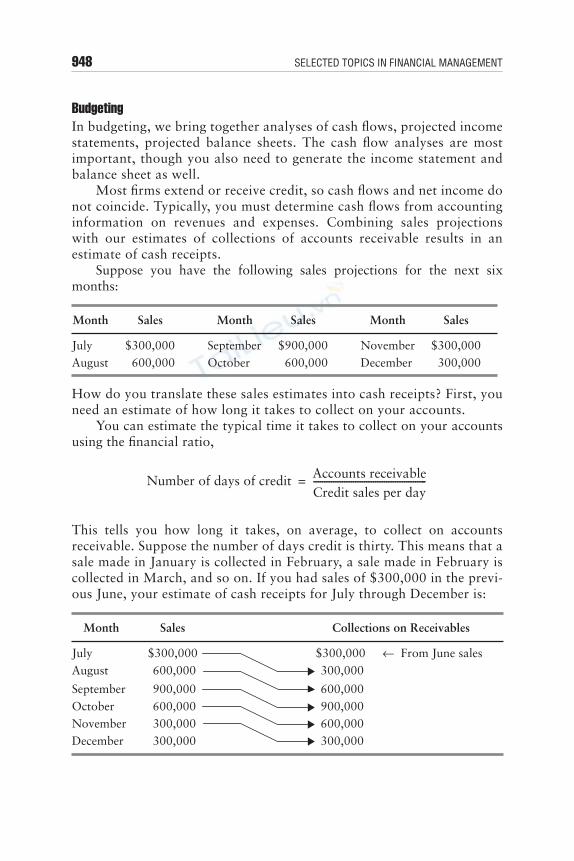
Suppose you have the following sales projections for the next sixmonths:
How do you translate these sales estimates into cash receipts? First, youneed an estimate of how long it takes to collect on your accounts.
You can estimate the typical time it takes to collect on your accountsusing the financial ratio,
This tells you how long it takes, on average, to collect on accountsreceivable. Suppose the number of days credit is thirty. This means that asale made in January is collected in February, a sale made in February iscollected in March, and so on. If you had sales of $300,000 in the previ-ous June, your estimate of cash receipts for July through December is:
Month Sales Month Sales Month Sales
July $300,000 September $900,000 November $300,000August 600,000 October 600,000 December 300,000
Month Sales Collections on Receivables
July $300,000 $300,000 ← From June salesAugust 600,000 300,000
September 900,000 600,000October 600,000 900,000November 300,000 600,000December 300,000 300,000
Number of days of credit Accounts receivableCredit sales per day---------------------------------------------------=
29-Strategy_FinancialPlan Page 948 Wednesday, April 30, 2003 12:19 PM
Strategy and Financial Planning 949
An alternative, and more precise method, is to look at the aging ofreceivables—how long each account has been outstanding—and use thisinformation to track collections. However, this requires a detailed esti-mate of the age of all accounts and their typical collection period.
Whether you use an overall average or an aging approach, you needto consider several factors in our cash collections estimate:
■ An estimate of bad debts—accounts that will not be collected at all; ■ An analysis of the trend in the number of days it takes customers to
pay on account; and ■ An estimate of the seasonal nature of collections of accounts; often cus-
tomers’ ability to pay is influenced by the operating cycle of their ownfirm.
As with revenues and cash receipts, there is a relation betweenexpenses and cash disbursements. Firms typically do not pay cash for allgoods and services; purchases are generally bought on account (creatingaccounts payable) and wages and salaries are paid periodically (weekly,bi-monthly, or monthly). Therefore, there’s a lagged relationship betweenexpenses and cash payments.
You can get an idea of the time it takes to pay for your purchases onaccount with the number of days of purchases:
And you can determine the time it takes to pay for wages and salaries bylooking at the firm’s personnel policies. Putting these two piecestogether, you can estimate how long it takes to pay for the goods andservices you acquire.
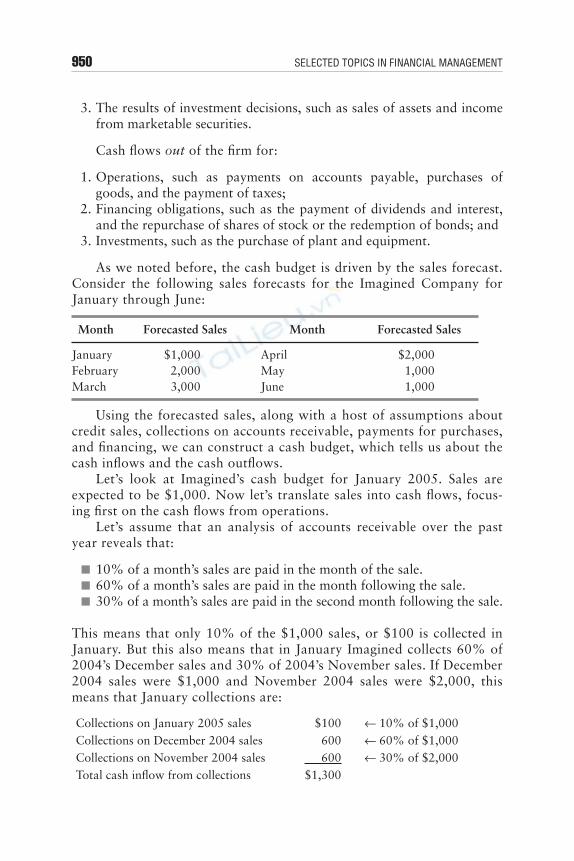
The Cash BudgetA cash budget is a detailed statement of the cash inflows and outflowsexpected in future periods. This budget helps you identify our financingand investment needs. You can also use a cash budget to compare youractual cash flows against planned cash flows so that you can evaluateboth your performance and your forecasting ability.
Cash flows in to the firm from:
1. Operations, such as receipts from sales and collections on accountsreceivable;
2. The results of financing decisions, such as borrowings, sales of sharesof common stock, and sales of preferred stock; and
Number of days of purchases Accounts payableAverage day’s purchases---------------------------------------------------------------=
29-Strategy_FinancialPlan Page 949 Wednesday, April 30, 2003 12:19 PM
950 SELECTED TOPICS IN FINANCIAL MANAGEMENT
3. The results of investment decisions, such as sales of assets and incomefrom marketable securities.
Cash flows out of the firm for:
1. Operations, such as payments on accounts payable, purchases ofgoods, and the payment of taxes;
2. Financing obligations, such as the payment of dividends and interest,and the repurchase of shares of stock or the redemption of bonds; and
3. Investments, such as the purchase of plant and equipment.
As we noted before, the cash budget is driven by the sales forecast.Consider the following sales forecasts for the Imagined Company forJanuary through June:
Using the forecasted sales, along with a host of assumptions aboutcredit sales, collections on accounts receivable, payments for purchases,and financing, we can construct a cash budget, which tells us about thecash inflows and the cash outflows.
Let’s look at Imagined’s cash budget for January 2005. Sales areexpected to be $1,000. Now let’s translate sales into cash flows, focus-ing first on the cash flows from operations.
Let’s assume that an analysis of accounts receivable over the pastyear reveals that:
■ 10% of a month’s sales are paid in the month of the sale. ■ 60% of a month’s sales are paid in the month following the sale. ■ 30% of a month’s sales are paid in the second month following the sale.
This means that only 10% of the $1,000 sales, or $100 is collected inJanuary. But this also means that in January Imagined collects 60% of2004’s December sales and 30% of 2004’s November sales. If December2004 sales were $1,000 and November 2004 sales were $2,000, thismeans that January collections are:
Month Forecasted Sales Month Forecasted Sales
January $1,000 April $2,000February 2,000 May 1,000March 3,000 June 1,000
Collections on January 2005 sales $100 ← 10% of $1,000Collections on December 2004 sales 600 ← 60% of $1,000Collections on November 2004 sales 600 ← 30% of $2,000Total cash inflow from collections $1,300
29-Strategy_FinancialPlan Page 950 Wednesday, April 30, 2003 12:19 PM
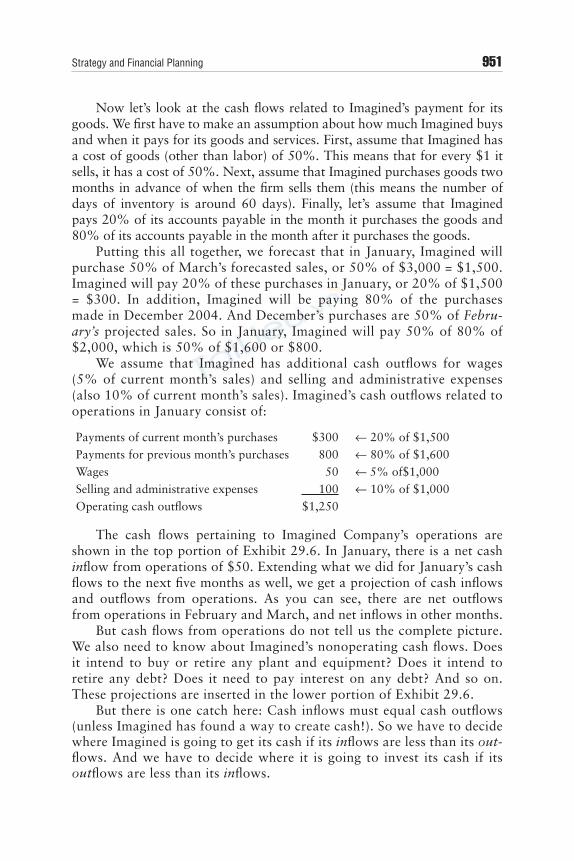
Strategy and Financial Planning 951
Now let’s look at the cash flows related to Imagined’s payment for itsgoods. We first have to make an assumption about how much Imagined buysand when it pays for its goods and services. First, assume that Imagined hasa cost of goods (other than labor) of 50%. This means that for every $1 itsells, it has a cost of 50%. Next, assume that Imagined purchases goods twomonths in advance of when the firm sells them (this means the number ofdays of inventory is around 60 days). Finally, let’s assume that Imaginedpays 20% of its accounts payable in the month it purchases the goods and80% of its accounts payable in the month after it purchases the goods.
Putting this all together, we forecast that in January, Imagined willpurchase 50% of March’s forecasted sales, or 50% of $3,000 = $1,500.Imagined will pay 20% of these purchases in January, or 20% of $1,500= $300. In addition, Imagined will be paying 80% of the purchasesmade in December 2004. And December’s purchases are 50% of Febru-ary’s projected sales. So in January, Imagined will pay 50% of 80% of$2,000, which is 50% of $1,600 or $800.
We assume that Imagined has additional cash outflows for wages(5% of current month’s sales) and selling and administrative expenses(also 10% of current month’s sales). Imagined’s cash outflows related tooperations in January consist of:
The cash flows pertaining to Imagined Company’s operations areshown in the top portion of Exhibit 29.6. In January, there is a net cashinflow from operations of $50. Extending what we did for January’s cashflows to the next five months as well, we get a projection of cash inflowsand outflows from operations. As you can see, there are net outflowsfrom operations in February and March, and net inflows in other months.
But cash flows from operations do not tell us the complete picture.We also need to know about Imagined’s nonoperating cash flows. Doesit intend to buy or retire any plant and equipment? Does it intend toretire any debt? Does it need to pay interest on any debt? And so on.These projections are inserted in the lower portion of Exhibit 29.6.
But there is one catch here: Cash inflows must equal cash outflows(unless Imagined has found a way to create cash!). So we have to decidewhere Imagined is going to get its cash if its inflows are less than its out-flows. And we have to decide where it is going to invest its cash if itsoutflows are less than its inflows.
Payments of current month’s purchases $300 ← 20% of $1,500Payments for previous month’s purchases 800 ← 80% of $1,600Wages 50 ← 5% of$1,000Selling and administrative expenses 100 ← 10% of $1,000Operating cash outflows $1,250
29-Strategy_FinancialPlan Page 951 Wednesday, April 30, 2003 12:19 PM
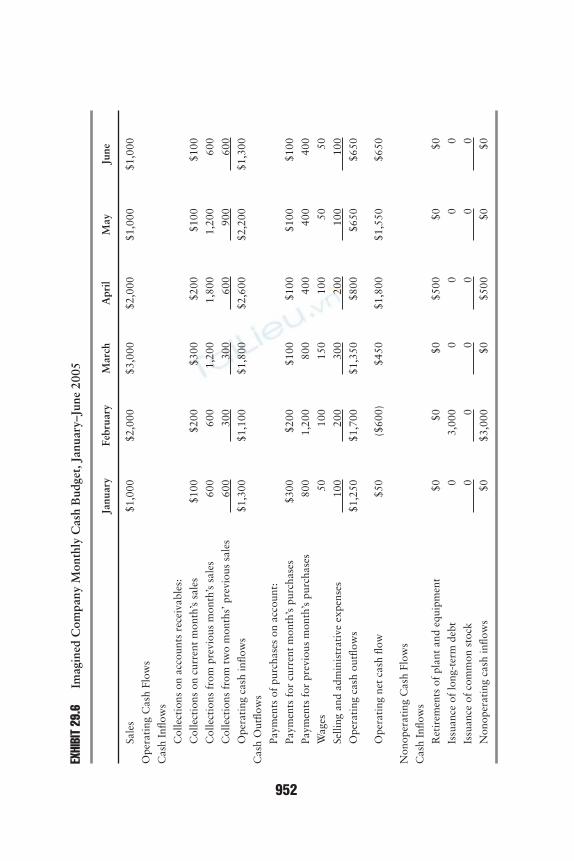
952
EXHI
BIT
29.6
Imag
ined
Com
pany
Mon
thly
Cas
h B
udge
t, J
anua
ry–J
une
2005
Janu
ary
Febr
uary
Mar
chA
pril
May
June
Sale
s$1
,000
$2,0
00$3
,000
$2
,000
$1
,000
$1
,000
Ope
rati
ng C
ash
Flow
s
Cas
h In
flow
s
Col
lect
ions
on
acco
unts
rec
eiva
bles
:
Col
lect
ions
on
curr
ent
mon
th’s
sal
es
$100
$2
00
$300
$2
00
$100
$1
00
Col
lect
ions
fro
m p
revi
ous
mon
th’s
sal
es
600
6
00 1
,200
1,8
00 1
,200
6
00
Col
lect
ions
fro
m t
wo
mon
ths’
pre
viou
s sa
les
6
00
300
3
00
600
9
00
600
Ope
rati
ng c
ash
inflo
ws
$1,3
00$1
,100
$1,8
00$2
,600
$2,2
00$1
,300
Cas
h O
utflo
ws
Paym
ents
of
purc
hase
s on
acc
ount
:
Paym
ents
for
cur
rent
mon
th’s
pur
chas
es
$300
$2
00
$100
$1
00
$100
$1
00
Paym
ents
for
pre
viou
s m
onth
’s p
urch
ases
8
00 1
,200
8
00
400
4
00
400
Wag
es
5
0
100
1
50
100
50
50
Selli
ng a
nd a
dmin
istr
ativ
e ex
pens
es
1
00
200
3
00
200
1
00
100
Ope
rati
ng c
ash
outfl
ows
$1,2
50$1
,700
$1,3
50
$800
$6
50
$650
Ope
rati
ng n
et c
ash
flow
$
50
($60
0)
$450
$1,8
00$1
,550
$6
50
Non
oper
atin
g C
ash
Flow
s
Cas
h In
flow
s
Ret
irem
ents
of
plan
t an
d eq
uipm
ent
$0
$0
$0
$5
00
$
0
$
0
Issu
ance
of
long
-ter
m d
ebt
0
3,0
00
0
0
0
0
Issu
ance
of
com
mon
sto
ck
0
0
0
0
0
0
Non
oper
atin
g ca
sh in
flow
s
$
0$3
,000
$0
$5
00
$
0
$
0
29-Strategy_FinancialPlan Page 952 Wednesday, April 30, 2003 12:19 PM
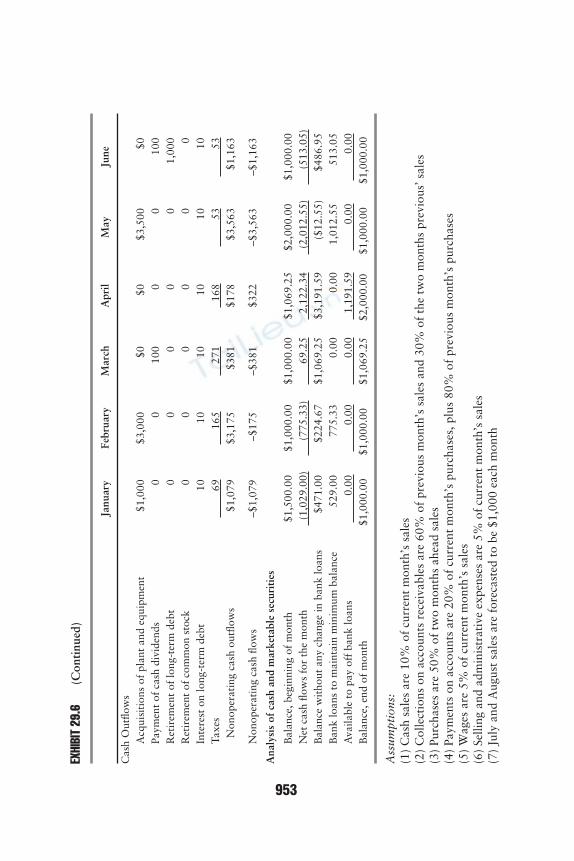
953
EXHI
BIT
29.6
(Con
tinu
ed)
Ass
umpt
ions
:(1
) C
ash
sale
s ar
e 10
% o
f cu
rren
t m
onth
’s s
ales
(2)
Col
lect
ions
on
acco
unts
rec
eiva
bles
are
60%
of
prev
ious
mon
th’s
sal
es a
nd 3
0% o
f th
e tw
o m
onth
s pr
evio
us’ s
ales
(3)
Purc
hase
s ar
e 50
% o
f tw
o m
onth
s ah
ead
sale
s(4
) Pa
ymen
ts o
n ac
coun
ts a
re 2
0% o
f cu
rren
t m
onth
’s p
urch
ases
, plu
s 80
% o
f pr
evio
us m
onth
’s p
urch
ases
(5)
Wag
es a
re 5
% o
f cu
rren
t m
onth
’s s
ales
(6)
Selli
ng a
nd a
dmin
istr
ativ
e ex
pens
es a
re 5
% o
f cu
rren
t m
onth
’s s
ales
(7)
July
and
Aug
ust
sale
s ar
e fo
reca
sted
to
be $
1,00
0 ea
ch m
onth
Janu
ary
Febr
uary
Mar
chA
pril
May
June
Cas
h O
utflo
ws
Acq
uisi
tion
s of
pla
nt a
nd e
quip
men
t $
1,00
0$3
,000
$0
$0
$3,
500
$0
Paym
ent
of c
ash
divi
dend
s
0
0
100
0
0
1
00R
etir
emen
t of
long
-ter
m d
ebt
0
0
0
0
0
1
,000
Ret
irem
ent
of c
omm
on s
tock
0
0
0
0
0
0
Inte
rest
on
long
-ter
m d
ebt
10
10
10
10
10
10
Taxe
s
69
165
2
71 1
68
53
53 N
onop
erat
ing
cash
out
flow
s $
1,07
9$3
,175
$38
1$1
78 $
3,56
3 $
1,16
3
Non
oper
atin
g ca
sh fl
ows
–$1,
079
–$1
75–$
381
$322
–$3,
563
–$1,
163
Ana
lysi
s of
cas
h an
d m
arke
tabl
e se
curi
ties
Bal
ance
, beg
inni
ng o
f m
onth
$1,5
00.0
0$1
,000
.00
$1,0
00.0
0$1
,069
.25
$2,0
00.0
0$1
,000
.00
Net
cas
h flo
ws
for
the
mon
th (
1,02
9.00
)
(77
5.33
)
6
9.25
2,1
22.3
4 (
2,01
2.55
)
(51
3.05
)B
alan
ce w
itho
ut a
ny c
hang
e in
ban
k lo
ans
$4
71.0
0
$224
.67
$1,0
69.2
5$3
,191
.59
(
$12.
55)
$4
86.9
5B
ank
loan
s to
mai
ntai
n m
inim
um b
alan
ce
529
.00
7
75.3
3
0.00
0.
00 1
,012
.55
5
13.0
5A
vaila
ble
to p
ay o
ff b
ank
loan
s
0.00
0.
00
0.00
1,1
91.5
9
0.00
0.
00B
alan
ce, e
nd o
f m
onth
$1,0
00.0
0$1
,000
.00
$1,0
69.2
5$2
,000
.00
$1,0
00.0
0$1
,000
.00
29-Strategy_FinancialPlan Page 953 Wednesday, April 30, 2003 12:19 PM
954 SELECTED TOPICS IN FINANCIAL MANAGEMENT
Let’s assume that Imagined will borrow from the bank when itneeds short-term financing and it will pay off its bank loans or invest inmarketable securities (if it has no outstanding bank loans) if it has morecash than needed. In our example, let’s group cash and marketable secu-rities and cash into one item, referred to as “cash.”
The bank loan-marketable securities decision is a residual decision:We make decisions about such things as when we pay out accounts, butwe use the bank loan or marketable securities investment as a “plug”figure to help balance our cash inflows and outflows. But this “plug” isvery important—it tells us what financing arrangement we need to havein place (such as a line of credit) or that we need to make decisionsregarding short-term investments (such as U.S. Treasury bills).
Comparing inflows with outflows from operations, we see that ifImagined requires a minimum cash balance of $1,000, it needs to usebank financing in January, February, May, and June. We also see that ifImagined does not need to maintain a cash balance above $2,000, it canpay off some of its bank loans in April.
We’ve forecasted cash inflows and outflows for several months intothe future. But these are forecasts and lots of things can happen betweennow and then. The actual cash flows can easily differ from the fore-casted cash flows. Furthermore, we’ve made a host of assumptions anddecisions along the way, some that we have control over, such as divi-dend payments, and some that we have no control over, such as howlong customers take to pay. Economic conditions, market conditions,and other factors will affect actual cash flows.
Two methods to help us look as the uncertainty of cash flows aresensitivity analysis and simulation analysis. Sensitivity analysis involveschanging one of the variables in our analysis, such as the number of unitssold, and looking at its affect on the cash flows. This gives us an idea ofwhat cash flows may be under certain circumstances. We can pose differ-ent scenarios: What if customers take 60 days to pay instead of 30?What if we sales are actually $1,000 in February instead of $2,000?
But sensitivity analysis can become unmanageable if we start chang-ing two or more things at a time. A manageable approach to doing thisis with computer simulation. Simulation analysis allows you to developa probability distribution of possible outcomes, given a probability dis-tribution for each variable that may change.
Suppose you can develop a probability distribution—that is, a list ofpossible outcomes and their related likelihood of occurring—for sales.(A probability distribution is the set of possible outcomes and theirlikelihood of occurrence.) And suppose you can develop a probabilitydistribution for costs of the raw materials that are needed in producingthe product. Using simulation, a probability distribution of cash flows
29-Strategy_FinancialPlan Page 954 Wednesday, April 30, 2003 12:19 PM

Strategy and Financial Planning 955
can be produced, providing information on the uncertainty of the firm’sfuture cash flows, as shown in Exhibit 29.7.
Once we produce the probability distribution of future cash flows,we have an idea of the possible cash flows and can plan accordingly. Thecash budget produced using the possible cash flows is a flexible budget.With this information, we can then determine the more appropriateshort-term financing and short-term investments to consider.
Pro Forma Financial StatementsA pro forma balance sheet is a projected balance sheet for a future period—a month, quarter, or year—that summarizes assets, liabilities, and equity.A pro forma income statement is the projected income statement for afuture period—a month, quarter, or year—that summarizes revenues andexpenses. Together both projections help you identify your firm’s invest-ment and financing needs.
The analysis of accounts and the percent-of-sales method are twoways of projecting financial statements.
Analysis of AccountsThe analysis of accounts method starts with the cash budget. Before put-ting together the pro forma income statement and balance sheet, we needto see how the various asset, liability, and equity accounts change frommonth to month, based on the information provided in the cash budget.The analysis of accounts is shown in Exhibit 29.8, where each account isanalyzed starting with the beginning balance and making any necessaryadjustments to arrive at the ending balance.
EXHIBIT 29.7 Simulation and Cash Flow Uncertainty
Probability distributionof future period’s sales
Computersimulation
Probability distribution offuture cash flows
Probability distributionof future period’s raw materials
29-Strategy_FinancialPlan Page 955 Wednesday, April 30, 2003 12:19 PM
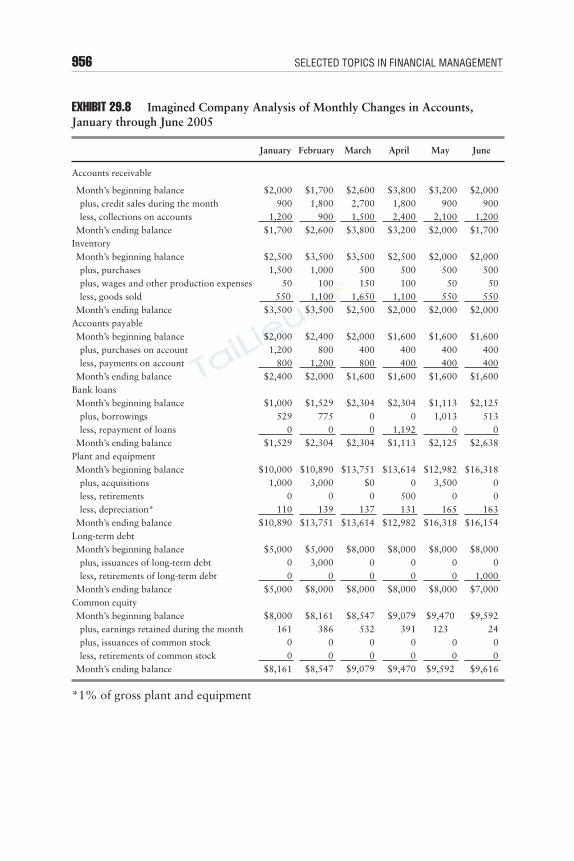
956 SELECTED TOPICS IN FINANCIAL MANAGEMENT
EXHIBIT 29.8 Imagined Company Analysis of Monthly Changes in Accounts, January through June 2005
*1% of gross plant and equipment
January February March April May June
Accounts receivable
Month’s beginning balance $2,000 $1,700 $2,600 $3,800 $3,200 $2,000plus, credit sales during the month 900 1,800 2,700 1,800 900 900less, collections on accounts 1,200 900 1,500 2,400 2,100 1,200
Month’s ending balance $1,700 $2,600 $3,800 $3,200 $2,000 $1,700InventoryMonth’s beginning balance $2,500 $3,500 $3,500 $2,500 $2,000 $2,000plus, purchases 1,500 1,000 500 500 500 500plus, wages and other production expenses 50 100 150 100 50 50less, goods sold 550 1,100 1,650 1,100 550 550
Month’s ending balance $3,500 $3,500 $2,500 $2,000 $2,000 $2,000Accounts payableMonth’s beginning balance $2,000 $2,400 $2,000 $1,600 $1,600 $1,600plus, purchases on account 1,200 800 400 400 400 400less, payments on account 800 1,200 800 400 400 400
Month’s ending balance $2,400 $2,000 $1,600 $1,600 $1,600 $1,600Bank loans Month’s beginning balance $1,000 $1,529 $2,304 $2,304 $1,113 $2,125plus, borrowings 529 775 0 0 1,013 513less, repayment of loans 0 0 0 1,192 0 0
Month’s ending balance $1,529 $2,304 $2,304 $1,113 $2,125 $2,638Plant and equipmentMonth’s beginning balance $10,000 $10,890 $13,751 $13,614 $12,982 $16,318plus, acquisitions 1,000 3,000 $0 0 3,500 0less, retirements 0 0 0 500 0 0less, depreciation* 110 139 137 131 165 163
Month’s ending balance $10,890 $13,751 $13,614 $12,982 $16,318 $16,154Long-term debtMonth’s beginning balance $5,000 $5,000 $8,000 $8,000 $8,000 $8,000 plus, issuances of long-term debt 0 3,000 0 0 0 0 less, retirements of long-term debt 0 0 0 0 0 1,000
Month’s ending balance $5,000 $8,000 $8,000 $8,000 $8,000 $7,000 Common equityMonth’s beginning balance $8,000 $8,161 $8,547 $9,079 $9,470 $9,592 plus, earnings retained during the month 161 386 532 391 123 24 plus, issuances of common stock 0 0 0 0 0 0 less, retirements of common stock 0 0 0 0 0 0
Month’s ending balance $8,161 $8,547 $9,079 $9,470 $9,592 $9,616
29-Strategy_FinancialPlan Page 956 Wednesday, April 30, 2003 12:19 PM
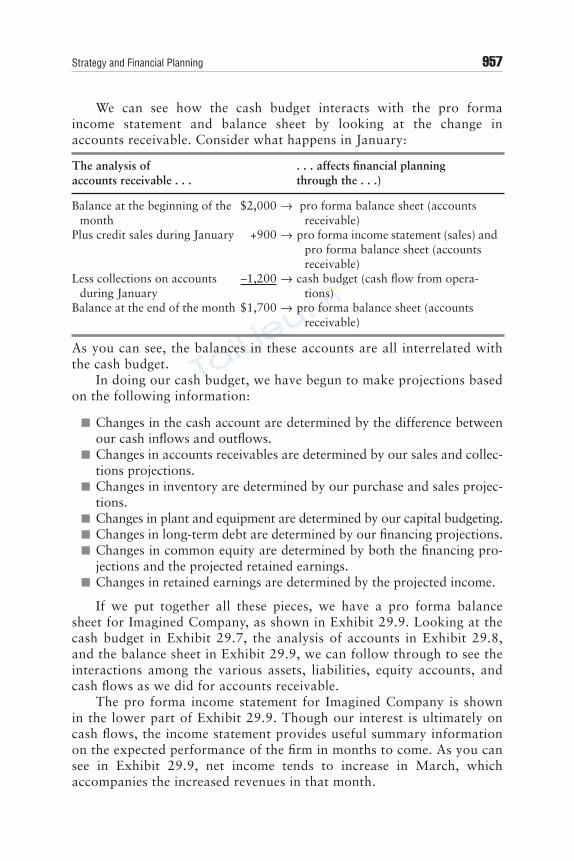
Strategy and Financial Planning 957
We can see how the cash budget interacts with the pro formaincome statement and balance sheet by looking at the change inaccounts receivable. Consider what happens in January:
As you can see, the balances in these accounts are all interrelated withthe cash budget.
In doing our cash budget, we have begun to make projections basedon the following information:
■ Changes in the cash account are determined by the difference betweenour cash inflows and outflows.
■ Changes in accounts receivables are determined by our sales and collec-tions projections.
■ Changes in inventory are determined by our purchase and sales projec-tions.
■ Changes in plant and equipment are determined by our capital budgeting. ■ Changes in long-term debt are determined by our financing projections. ■ Changes in common equity are determined by both the financing pro-
jections and the projected retained earnings. ■ Changes in retained earnings are determined by the projected income.
If we put together all these pieces, we have a pro forma balancesheet for Imagined Company, as shown in Exhibit 29.9. Looking at thecash budget in Exhibit 29.7, the analysis of accounts in Exhibit 29.8,and the balance sheet in Exhibit 29.9, we can follow through to see theinteractions among the various assets, liabilities, equity accounts, andcash flows as we did for accounts receivable.
The pro forma income statement for Imagined Company is shownin the lower part of Exhibit 29.9. Though our interest is ultimately oncash flows, the income statement provides useful summary informationon the expected performance of the firm in months to come. As you cansee in Exhibit 29.9, net income tends to increase in March, whichaccompanies the increased revenues in that month.
The analysis ofaccounts receivable . . .
. . . affects financial planningthrough the . . .)
Balance at the beginning of the month
$2,000 → pro forma balance sheet (accounts receivable)
Plus credit sales during January +900 → pro forma income statement (sales) and pro forma balance sheet (accounts receivable)
Less collections on accounts during January
–1,200 → cash budget (cash flow from opera-tions)
Balance at the end of the month $1,700 → pro forma balance sheet (accounts receivable)
29-Strategy_FinancialPlan Page 957 Wednesday, April 30, 2003 12:19 PM
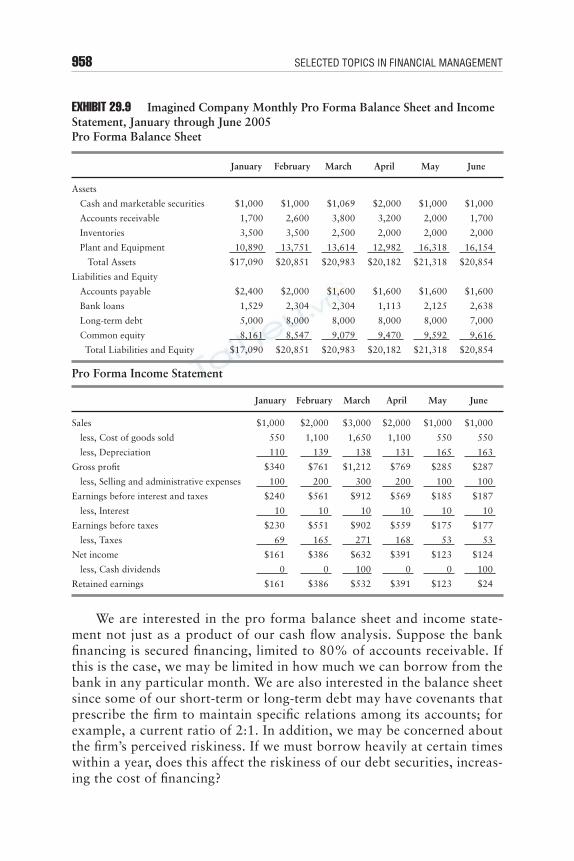
958 SELECTED TOPICS IN FINANCIAL MANAGEMENT
EXHIBIT 29.9 Imagined Company Monthly Pro Forma Balance Sheet and Income Statement, January through June 2005Pro Forma Balance Sheet
Pro Forma Income Statement
We are interested in the pro forma balance sheet and income state-ment not just as a product of our cash flow analysis. Suppose the bankfinancing is secured financing, limited to 80% of accounts receivable. Ifthis is the case, we may be limited in how much we can borrow from thebank in any particular month. We are also interested in the balance sheetsince some of our short-term or long-term debt may have covenants thatprescribe the firm to maintain specific relations among its accounts; forexample, a current ratio of 2:1. In addition, we may be concerned aboutthe firm’s perceived riskiness. If we must borrow heavily at certain timeswithin a year, does this affect the riskiness of our debt securities, increas-ing the cost of financing?
January February March April May June
Assets
Cash and marketable securities $1,000 $1,000 $1,069 $2,000 $1,000 $1,000
Accounts receivable 1,700 2,600 3,800 3,200 2,000 1,700
Inventories 3,500 3,500 2,500 2,000 2,000 2,000
Plant and Equipment 10,890 13,751 13,614 12,982 16,318 16,154
Total Assets $17,090 $20,851 $20,983 $20,182 $21,318 $20,854
Liabilities and Equity
Accounts payable $2,400 $2,000 $1,600 $1,600 $1,600 $1,600
Bank loans 1,529 2,304 2,304 1,113 2,125 2,638
Long-term debt 5,000 8,000 8,000 8,000 8,000 7,000
Common equity 8,161 8,547 9,079 9,470 9,592 9,616
Total Liabilities and Equity $17,090 $20,851 $20,983 $20,182 $21,318 $20,854
January February March April May June
Sales $1,000 $2,000 $3,000 $2,000 $1,000 $1,000
less, Cost of goods sold 550 1,100 1,650 1,100 550 550
less, Depreciation 110 139 138 131 165 163
Gross profit $340 $761 $1,212 $769 $285 $287
less, Selling and administrative expenses 100 200 300 200 100 100
Earnings before interest and taxes $240 $561 $912 $569 $185 $187
less, Interest 10 10 10 10 10 10
Earnings before taxes $230 $551 $902 $559 $175 $177
less, Taxes 69 165 271 168 53 53
Net income $161 $386 $632 $391 $123 $124
less, Cash dividends 0 0 100 0 0 100
Retained earnings $161 $386 $532 $391 $123 $24
29-Strategy_FinancialPlan Page 958 Wednesday, April 30, 2003 12:19 PM
Strategy and Financial Planning 959
These considerations point out the importance of reviewing the pro-jected balance sheet. In fact, these considerations may point out theneed for the financial manager to explicitly build constraints into thebudget to ensure that, say, a current ratio of 2 is maintained eachmonth. These constraints add complexity to an already complex systemof relationships, the detail of which is beyond the scope of this text.
Percent-of-Sales MethodThe percent-of-sales method uses historical relationships between salesand each of the other income statement accounts and between sales andeach of the balance sheet accounts. There are two steps to this method.
First, previous periods’ income statement and balance sheet accountsare restated in terms of a percentage of sales for the year. Let’s look atthe Imagined Corporation balance sheet and income statement for 2004shown in the left-most column of Exhibit 29.10. Because we are project-ing monthly sales, each item in both statements is restated as a percent ofDecember 2004 sales, as shown in the second column of this table.
Second, based on the forecasted sales for the future years and thepercentages each account represents, projections for January throughJune are calculated. For example, cost of goods sold are 55% of sales.Because January sales are predicted to be $1,000, cost of goods sold arepredicted to be 55% of $1,000, or $550. And as sales for February arepredicted to be $2,000, cost of goods sold for February are predicted tobe $1,100. Likewise for balance sheet accounts. Cash and marketablesecurities are 75% of monthly sales, so we expect $750 in this accountin January. Each of the balance sheet and income statement accounts isforecasted January through June, as shown in Exhibit 29.10.
This method of creating pro forma statements is simple. But it maymake inappropriate assumptions, such as that: (1) all costs vary withsales, even though most firms have fixed costs; or (2) assets and liabili-ties change along with sales, even though firms tend to make capitalinvestments that generate cash flows far into the future, not necessarilyin the year they are put in place.
And there is another drawback: The percent-of-sales methodfocuses on accounts in the financial statements, not cash flows. Becauseit doesn’t, it cannot help us identify when a firm needs cash and when ithas excess cash to invest.
But the percent-of-sales method is used frequently because of itssimplicity. And since we are dealing with forecasts, which are them-selves estimates (and not actual fact), the simpler approach is sometimesmore attractive.
29-Strategy_FinancialPlan Page 959 Wednesday, April 30, 2003 12:19 PM
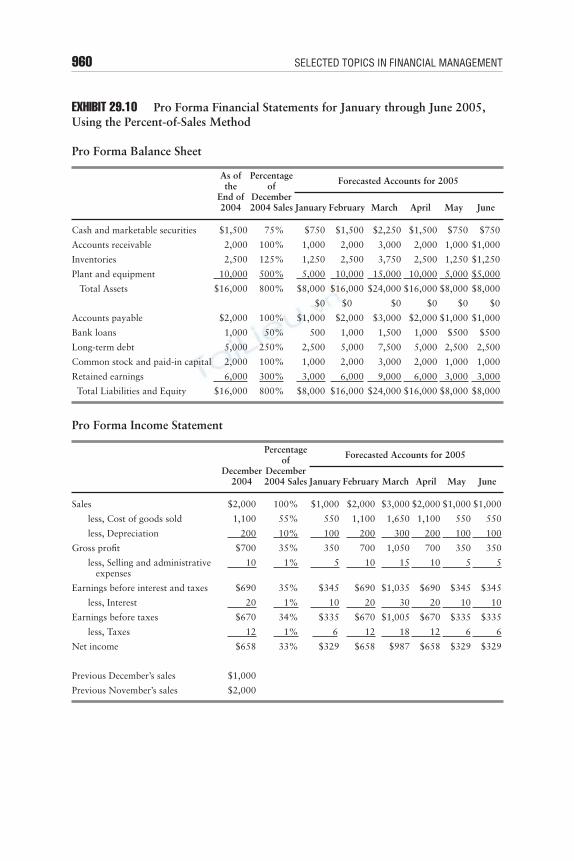
960 SELECTED TOPICS IN FINANCIAL MANAGEMENT
EXHIBIT 29.10 Pro Forma Financial Statements for January through June 2005, Using the Percent-of-Sales Method
Pro Forma Balance Sheet
Pro Forma Income Statement
As of the
End of2004
Percentageof
December2004 Sales
Forecasted Accounts for 2005
January February March April May June
Cash and marketable securities $1,500 75% $750 $1,500 $2,250 $1,500 $750 $750
Accounts receivable 2,000 100% 1,000 2,000 3,000 2,000 1,000 $1,000
Inventories 2,500 125% 1,250 2,500 3,750 2,500 1,250 $1,250
Plant and equipment 10,000 500% 5,000 10,000 15,000 10,000 5,000 $5,000
Total Assets $16,000 800% $8,000 $16,000 $24,000 $16,000 $8,000 $8,000
$0 $0 $0 $0 $0 $0
Accounts payable $2,000 100% $1,000 $2,000 $3,000 $2,000 $1,000 $1,000
Bank loans 1,000 50% 500 1,000 1,500 1,000 $500 $500
Long-term debt 5,000 250% 2,500 5,000 7,500 5,000 2,500 2,500
Common stock and paid-in capital 2,000 100% 1,000 2,000 3,000 2,000 1,000 1,000
Retained earnings 6,000 300% 3,000 6,000 9,000 6,000 3,000 3,000
Total Liabilities and Equity $16,000 800% $8,000 $16,000 $24,000 $16,000 $8,000 $8,000
December2004
Percentageof
December2004 Sales
Forecasted Accounts for 2005
January February March April May June
Sales $2,000 100% $1,000 $2,000 $3,000 $2,000 $1,000 $1,000
less, Cost of goods sold 1,100 55% 550 1,100 1,650 1,100 550 550
less, Depreciation 200 10% 100 200 300 200 100 100
Gross profit $700 35% 350 700 1,050 700 350 350
less, Selling and administrative expenses
10 1% 5 10 15 10 5 5
Earnings before interest and taxes $690 35% $345 $690 $1,035 $690 $345 $345
less, Interest 20 1% 10 20 30 20 10 10
Earnings before taxes $670 34% $335 $670 $1,005 $670 $335 $335
less, Taxes 12 1% 6 12 18 12 6 6
Net income $658 33% $329 $658 $987 $658 $329 $329
Previous December’s sales $1,000
Previous November’s sales $2,000
29-Strategy_FinancialPlan Page 960 Wednesday, April 30, 2003 12:19 PM
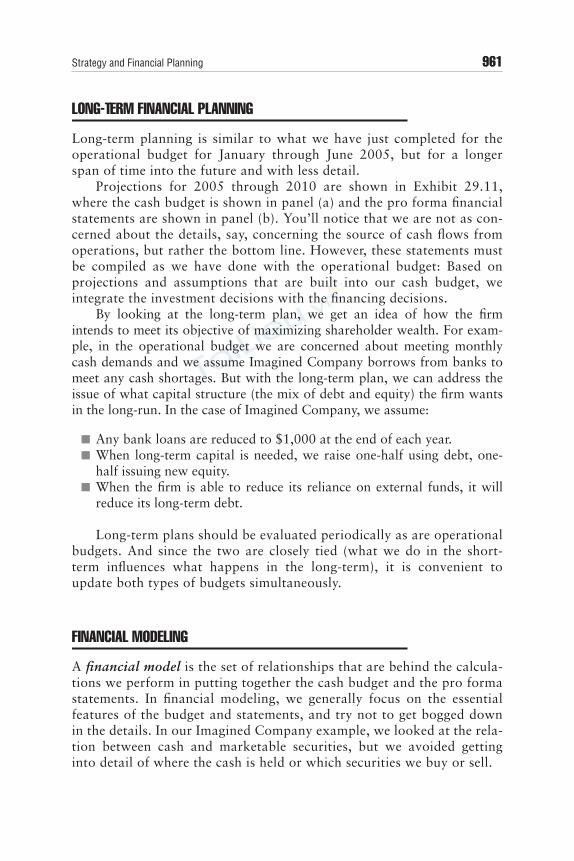
Strategy and Financial Planning 961
LONG-TERM FINANCIAL PLANNING
Long-term planning is similar to what we have just completed for theoperational budget for January through June 2005, but for a longerspan of time into the future and with less detail.
Projections for 2005 through 2010 are shown in Exhibit 29.11,where the cash budget is shown in panel (a) and the pro forma financialstatements are shown in panel (b). You’ll notice that we are not as con-cerned about the details, say, concerning the source of cash flows fromoperations, but rather the bottom line. However, these statements mustbe compiled as we have done with the operational budget: Based onprojections and assumptions that are built into our cash budget, weintegrate the investment decisions with the financing decisions.
By looking at the long-term plan, we get an idea of how the firmintends to meet its objective of maximizing shareholder wealth. For exam-ple, in the operational budget we are concerned about meeting monthlycash demands and we assume Imagined Company borrows from banks tomeet any cash shortages. But with the long-term plan, we can address theissue of what capital structure (the mix of debt and equity) the firm wantsin the long-run. In the case of Imagined Company, we assume:
■ Any bank loans are reduced to $1,000 at the end of each year. ■ When long-term capital is needed, we raise one-half using debt, one-
half issuing new equity. ■ When the firm is able to reduce its reliance on external funds, it will
reduce its long-term debt.
Long-term plans should be evaluated periodically as are operationalbudgets. And since the two are closely tied (what we do in the short-term influences what happens in the long-term), it is convenient toupdate both types of budgets simultaneously.
FINANCIAL MODELING
A financial model is the set of relationships that are behind the calcula-tions we perform in putting together the cash budget and the pro formastatements. In financial modeling, we generally focus on the essentialfeatures of the budget and statements, and try not to get bogged downin the details. In our Imagined Company example, we looked at the rela-tion between cash and marketable securities, but we avoided gettinginto detail of where the cash is held or which securities we buy or sell.
29-Strategy_FinancialPlan Page 961 Wednesday, April 30, 2003 12:19 PM
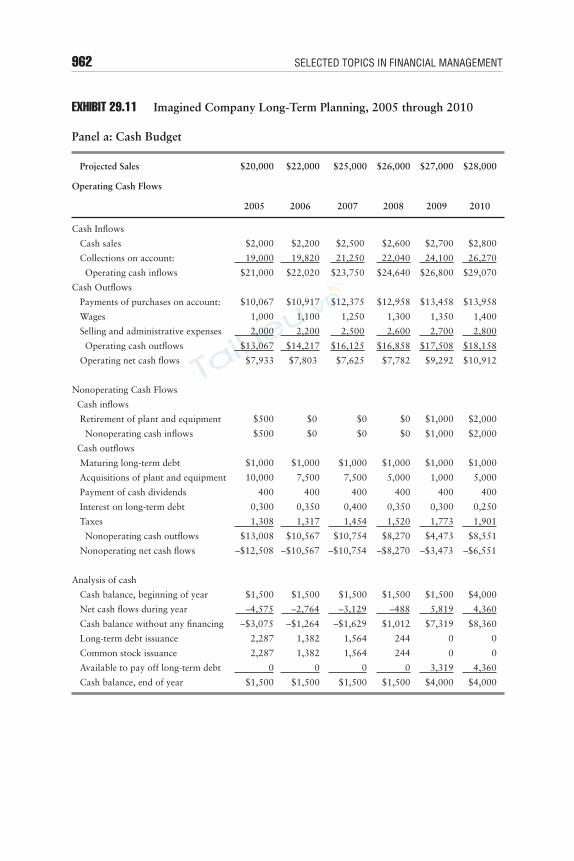
962 SELECTED TOPICS IN FINANCIAL MANAGEMENT
EXHIBIT 29.11 Imagined Company Long-Term Planning, 2005 through 2010
Panel a: Cash Budget
Projected Sales $20,000 $22,000 $25,000 $26,000 $27,000 $28,000
Operating Cash Flows
2005 2006 2007 2008 2009 2010
Cash Inflows
Cash sales $2,000 $2,200 $2,500 $2,600 $2,700 $2,800
Collections on account: 19,000 19,820 21,250 22,040 24,100 26,270
Operating cash inflows $21,000 $22,020 $23,750 $24,640 $26,800 $29,070
Cash Outflows
Payments of purchases on account: $10,067 $10,917 $12,375 $12,958 $13,458 $13,958
Wages 1,000 1,100 1,250 1,300 1,350 1,400
Selling and administrative expenses 2,000 2,200 2,500 2,600 2,700 2,800
Operating cash outflows $13,067 $14,217 $16,125 $16,858 $17,508 $18,158
Operating net cash flows $7,933 $7,803 $7,625 $7,782 $9,292 $10,912
Nonoperating Cash Flows
Cash inflows
Retirement of plant and equipment $500 $0 $0 $0 $1,000 $2,000
Nonoperating cash inflows $500 $0 $0 $0 $1,000 $2,000
Cash outflows
Maturing long-term debt $1,000 $1,000 $1,000 $1,000 $1,000 $1,000
Acquisitions of plant and equipment 10,000 7,500 7,500 5,000 1,000 5,000
Payment of cash dividends 400 400 400 400 400 400
Interest on long-term debt 0,300 0,350 0,400 0,350 0,300 0,250
Taxes 1,308 1,317 1,454 1,520 1,773 1,901
Nonoperating cash outflows $13,008 $10,567 $10,754 $8,270 $4,473 $8,551
Nonoperating net cash flows –$12,508 –$10,567 –$10,754 –$8,270 –$3,473 –$6,551
Analysis of cash
Cash balance, beginning of year $1,500 $1,500 $1,500 $1,500 $1,500 $4,000
Net cash flows during year –4,575 –2,764 –3,129 –488 5,819 4,360
Cash balance without any financing –$3,075 –$1,264 –$1,629 $1,012 $7,319 $8,360
Long-term debt issuance 2,287 1,382 1,564 244 0 0
Common stock issuance 2,287 1,382 1,564 244 0 0
Available to pay off long-term debt 0 0 0 0 3,319 4,360
Cash balance, end of year $1,500 $1,500 $1,500 $1,500 $4,000 $4,000
29-Strategy_FinancialPlan Page 962 Wednesday, April 30, 2003 12:19 PM
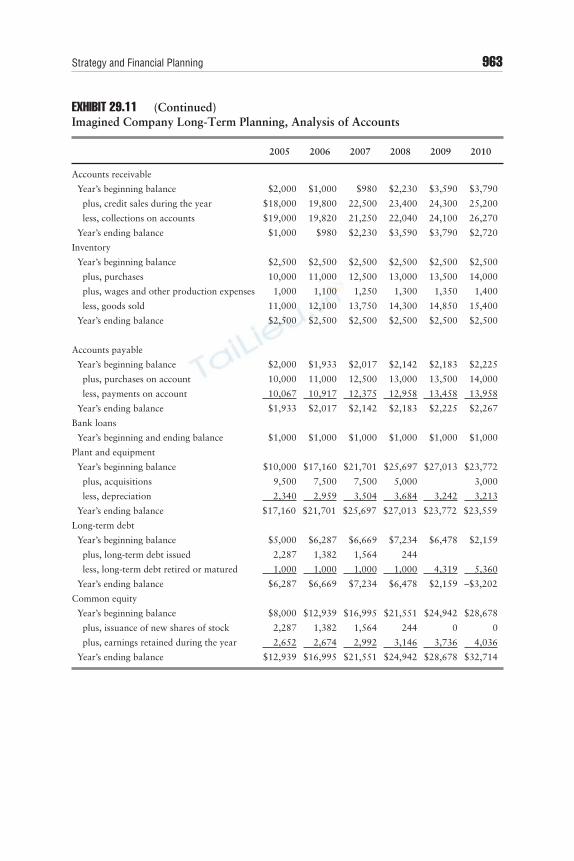
Strategy and Financial Planning 963
EXHIBIT 29.11 (Continued)Imagined Company Long-Term Planning, Analysis of Accounts
2005 2006 2007 2008 2009 2010
Accounts receivable
Year’s beginning balance $2,000 $1,000 $980 $2,230 $3,590 $3,790
plus, credit sales during the year $18,000 19,800 22,500 23,400 24,300 25,200
less, collections on accounts $19,000 19,820 21,250 22,040 24,100 26,270
Year’s ending balance $1,000 $980 $2,230 $3,590 $3,790 $2,720
Inventory
Year’s beginning balance $2,500 $2,500 $2,500 $2,500 $2,500 $2,500
plus, purchases 10,000 11,000 12,500 13,000 13,500 14,000
plus, wages and other production expenses 1,000 1,100 1,250 1,300 1,350 1,400
less, goods sold 11,000 12,100 13,750 14,300 14,850 15,400
Year’s ending balance $2,500 $2,500 $2,500 $2,500 $2,500 $2,500
Accounts payable
Year’s beginning balance $2,000 $1,933 $2,017 $2,142 $2,183 $2,225
plus, purchases on account 10,000 11,000 12,500 13,000 13,500 14,000
less, payments on account 10,067 10,917 12,375 12,958 13,458 13,958
Year’s ending balance $1,933 $2,017 $2,142 $2,183 $2,225 $2,267
Bank loans
Year’s beginning and ending balance $1,000 $1,000 $1,000 $1,000 $1,000 $1,000
Plant and equipment
Year’s beginning balance $10,000 $17,160 $21,701 $25,697 $27,013 $23,772
plus, acquisitions 9,500 7,500 7,500 5,000 3,000
less, depreciation 2,340 2,959 3,504 3,684 3,242 3,213
Year’s ending balance $17,160 $21,701 $25,697 $27,013 $23,772 $23,559
Long-term debt
Year’s beginning balance $5,000 $6,287 $6,669 $7,234 $6,478 $2,159
plus, long-term debt issued 2,287 1,382 1,564 244
less, long-term debt retired or matured 1,000 1,000 1,000 1,000 4,319 5,360
Year’s ending balance $6,287 $6,669 $7,234 $6,478 $2,159 –$3,202
Common equity
Year’s beginning balance $8,000 $12,939 $16,995 $21,551 $24,942 $28,678
plus, issuance of new shares of stock 2,287 1,382 1,564 244 0 0
plus, earnings retained during the year 2,652 2,674 2,992 3,146 3,736 4,036
Year’s ending balance $12,939 $16,995 $21,551 $24,942 $28,678 $32,714
29-Strategy_FinancialPlan Page 963 Wednesday, April 30, 2003 12:19 PM
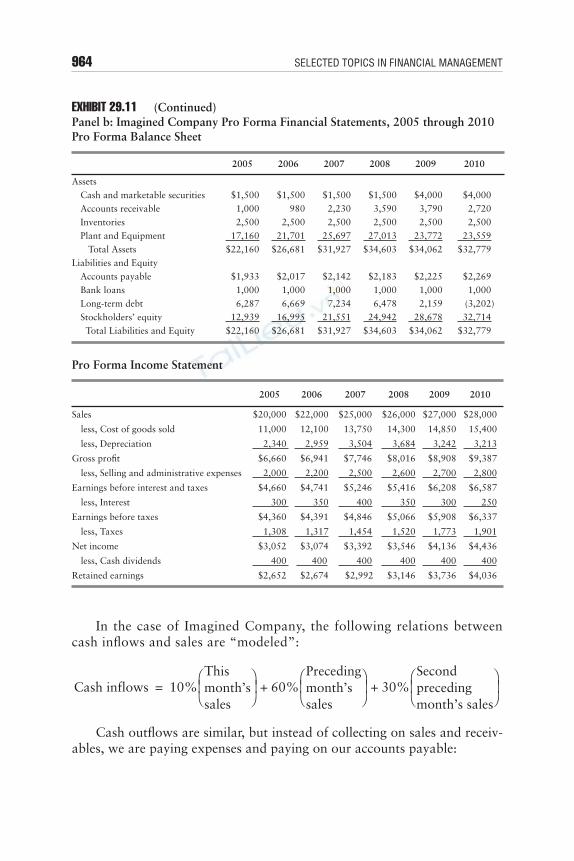
964 SELECTED TOPICS IN FINANCIAL MANAGEMENT
EXHIBIT 29.11 (Continued)Panel b: Imagined Company Pro Forma Financial Statements, 2005 through 2010Pro Forma Balance Sheet
Pro Forma Income Statement
In the case of Imagined Company, the following relations betweencash inflows and sales are “modeled”:
Cash outflows are similar, but instead of collecting on sales and receiv-ables, we are paying expenses and paying on our accounts payable:
2005 2006 2007 2008 2009 2010
AssetsCash and marketable securities $1,500 $1,500 $1,500 $1,500 $4,000 $4,000Accounts receivable 1,000 980 2,230 3,590 3,790 2,720Inventories 2,500 2,500 2,500 2,500 2,500 2,500Plant and Equipment 17,160 21,701 25,697 27,013 23,772 23,559 Total Assets $22,160 $26,681 $31,927 $34,603 $34,062 $32,779
Liabilities and EquityAccounts payable $1,933 $2,017 $2,142 $2,183 $2,225 $2,269Bank loans 1,000 1,000 1,000 1,000 1,000 1,000Long-term debt 6,287 6,669 7,234 6,478 2,159 (3,202)Stockholders’ equity 12,939 16,995 21,551 24,942 28,678 32,714 Total Liabilities and Equity $22,160 $26,681 $31,927 $34,603 $34,062 $32,779
2005 2006 2007 2008 2009 2010
Sales $20,000 $22,000 $25,000 $26,000 $27,000 $28,000
less, Cost of goods sold 11,000 12,100 13,750 14,300 14,850 15,400
less, Depreciation 2,340 2,959 3,504 3,684 3,242 3,213
Gross profit $6,660 $6,941 $7,746 $8,016 $8,908 $9,387
less, Selling and administrative expenses 2,000 2,200 2,500 2,600 2,700 2,800
Earnings before interest and taxes $4,660 $4,741 $5,246 $5,416 $6,208 $6,587
less, Interest 300 350 400 350 300 250
Earnings before taxes $4,360 $4,391 $4,846 $5,066 $5,908 $6,337
less, Taxes 1,308 1,317 1,454 1,520 1,773 1,901
Net income $3,052 $3,074 $3,392 $3,546 $4,136 $4,436
less, Cash dividends 400 400 400 400 400 400
Retained earnings $2,652 $2,674 $2,992 $3,146 $3,736 $4,036
Cash inflows 10%Thismonth’ssales
60%Precedingmonth’ssales
30%Secondprecedingmonth’s sales
+ +=
29-Strategy_FinancialPlan Page 964 Wednesday, April 30, 2003 12:19 PM
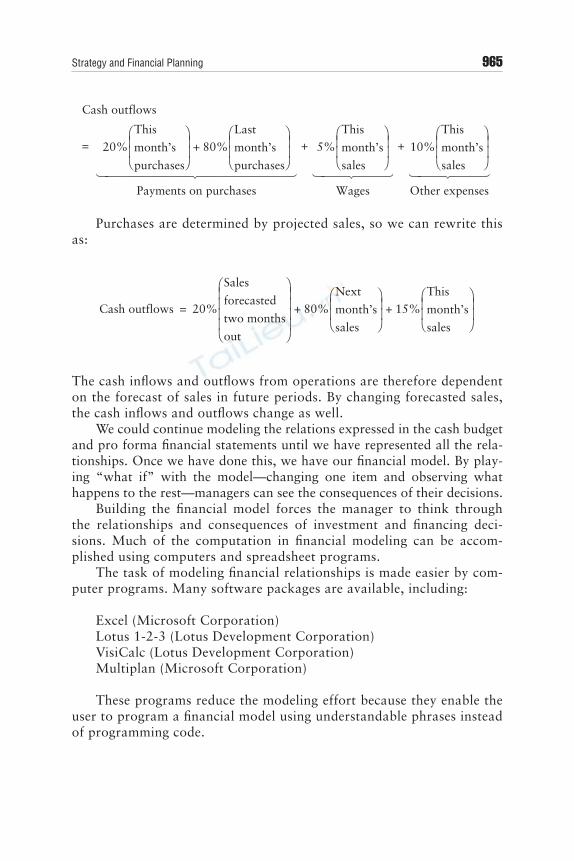
Strategy and Financial Planning 965
Purchases are determined by projected sales, so we can rewrite thisas:
The cash inflows and outflows from operations are therefore dependenton the forecast of sales in future periods. By changing forecasted sales,the cash inflows and outflows change as well.
We could continue modeling the relations expressed in the cash budgetand pro forma financial statements until we have represented all the rela-tionships. Once we have done this, we have our financial model. By play-ing “what if” with the model—changing one item and observing whathappens to the rest—managers can see the consequences of their decisions.
Building the financial model forces the manager to think throughthe relationships and consequences of investment and financing deci-sions. Much of the computation in financial modeling can be accom-plished using computers and spreadsheet programs.
The task of modeling financial relationships is made easier by com-puter programs. Many software packages are available, including:
Excel (Microsoft Corporation)Lotus 1-2-3 (Lotus Development Corporation)VisiCalc (Lotus Development Corporation)Multiplan (Microsoft Corporation)
These programs reduce the modeling effort because they enable theuser to program a financial model using understandable phrases insteadof programming code.
Cash outflows
20%
This
month’s
purchases
80%
Last
month’s
purchases
+
Payments on purchases
5%
This
month’s
sales
Wages
10%
This
month’s
sales
Other expenses
+ +=
Cash outflows 20%
Sales
forecasted
two months
out
80%
Next
month’s
sales
+ 15%
This
month’s
sales
+=
29-Strategy_FinancialPlan Page 965 Wednesday, April 30, 2003 12:19 PM

966 SELECTED TOPICS IN FINANCIAL MANAGEMENT
BUDGETING AND FINANCIAL PLANNING PRACTICES
Based on numerous surveys of budgeting practices in U.S. companies,we can make some general statements regarding budgeting and financialplanning practices:5
■ Most firms start with sales forecasts. ■ Most use historical data analysis to forecast sales and expenses, though
some use opinions of management and economic models. ■ Most firms have budget manuals, detailing budget procedures and
forms to be completed.
The survey indicates the following recent changes in firms’ financialplanning:
■ An increasing number of firms have established formal budget pro-grams.
■ There is a decreasing role of Board of Directors in approving budgets. ■ Strategy is becoming more centralized within the companies. ■ There is more frequent updating of long-run plans. ■ There is an increasing use of flexible budgets that separate controllable
and uncontrollable revenues and expenses.
Over time, the level of sophistication of capital budgeting in theUnited States has increased. This is due to two factors. First, there is anincreased awareness of the need to plan a firm’s finances to meet itsobjective of maximizing owners’ wealth. Second, technological advancesin computer software and hardware make financial planning less timeconsuming and less costly.
SUMMARY
■ The goal of financial management is to maximize shareholder wealth.Like any goal, it requires a strategy.
■ As part of its strategy, the firm needs to plan the sources and uses offunds. The investment strategy is the plan of what investment opportuni-ties are needed to meet the firm’s goals. The financing strategy is the planof where the firm is going to get the funds to make these investments.
5 See Srinivasan Umapathy’s book entitled Current Budgeting Practices in U.S. In-dustry (New York: Quorum Books, 1987) for a detailed survey of budgeting andplanning practices.
29-Strategy_FinancialPlan Page 966 Wednesday, April 30, 2003 12:19 PM
Strategy and Financial Planning 967
■ Financial planning is where decisions, actions, and goals are broughttogether with forecasts about the firm’s sales.
■ In financial planning we need to know what sales will be to determinewhat are cash flows will be. We can forecast sales using regression anal-ysis, market surveys, or management forecasts.
■ The cash budget is used to coordinate the investment decisions—whichoften require cash outlays—with the financing decisions—where thecash is coming from.
■ Pro forma financial statements can be generated using the percent ofsales method or analyzing accounts based on the cash budget. Whereasthe percent of sales method is simpler, the analysis of accounts gives thefinancial manager a better idea of the cash flows of the firm and theirrelation to the financial statements.
■ Long-term financial planning is less detailed than the operational bud-gets, but not less important. Long-term planning helps keep financialmanagers focused on the objective of the firm and the strategy toachieve it.
■ Financial modeling is a useful tool in looking at the array of relation-ships that exist in financial planning. It enables managers to examinethe consequences of their decisions.
■ Budgeting practices of U.S. companies have become more sophisti-cated, with more formalized procedures and more attention to long-term financial planning.
QUESTIONS
1. Suppose the financial manager of the Sooner Company had projectedsales in 2001 of $4 million and actual sales for that year were $3 mil-lion. What should you consider in evaluating this difference? Why?
2. How does the process of selecting projects on the basis of net presentvalues, as done in capital budgeting, relate to a firm’s strategy? Explain.
3. How does a firm’s capital structure decision relate to its strategy?Explain.
4. Consider a discount retail store chain. List the factors that influencefuture sales for the chain. Identify the factors over which the firm’smanagement exercises some control.
5. What are the advantages and disadvantages of using the percent-of-sales method in constructing pro forma financial statements?
6. Describe the methods a financial manager could use to assess theuncertainty of a firm’s future cash flows.
7. Explain how long-term financial planning is related to operationalbudgeting.
29-Strategy_FinancialPlan Page 967 Wednesday, April 30, 2003 12:19 PM
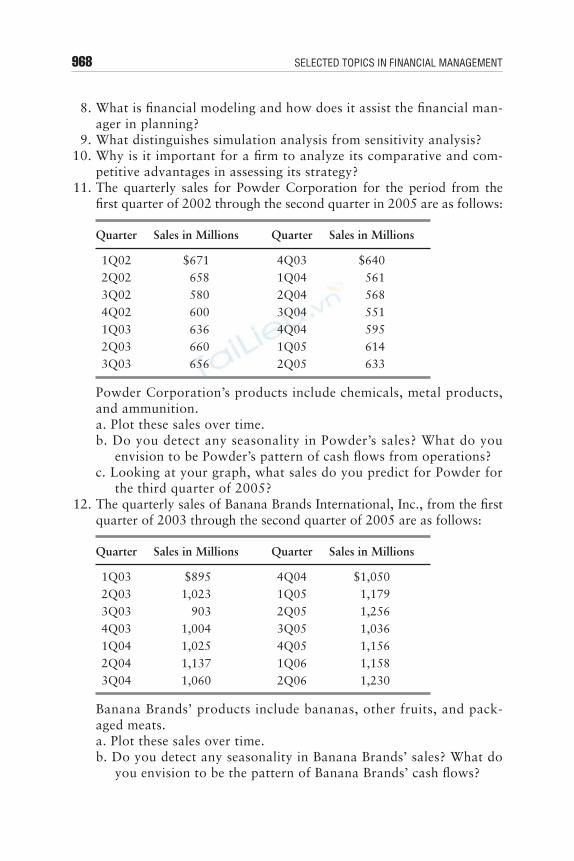
968 SELECTED TOPICS IN FINANCIAL MANAGEMENT
8. What is financial modeling and how does it assist the financial man-ager in planning?
9. What distinguishes simulation analysis from sensitivity analysis?10. Why is it important for a firm to analyze its comparative and com-
petitive advantages in assessing its strategy?11. The quarterly sales for Powder Corporation for the period from the
first quarter of 2002 through the second quarter in 2005 are as follows:
Powder Corporation’s products include chemicals, metal products,and ammunition.a. Plot these sales over time.b. Do you detect any seasonality in Powder’s sales? What do you
envision to be Powder’s pattern of cash flows from operations?c. Looking at your graph, what sales do you predict for Powder for
the third quarter of 2005?12. The quarterly sales of Banana Brands International, Inc., from the first
quarter of 2003 through the second quarter of 2005 are as follows:
Banana Brands’ products include bananas, other fruits, and pack-aged meats.a. Plot these sales over time.b. Do you detect any seasonality in Banana Brands’ sales? What do
you envision to be the pattern of Banana Brands’ cash flows?
Quarter Sales in Millions Quarter Sales in Millions
1Q02 $671 4Q03 $6402Q02 658 1Q04 5613Q02 580 2Q04 5684Q02 600 3Q04 5511Q03 636 4Q04 5952Q03 660 1Q05 6143Q03 656 2Q05 633
Quarter Sales in Millions Quarter Sales in Millions
1Q03 $895 4Q04 $1,0502Q03 1,023 1Q05 1,1793Q03 903 2Q05 1,2564Q03 1,004 3Q05 1,0361Q04 1,025 4Q05 1,1562Q04 1,137 1Q06 1,1583Q04 1,060 2Q06 1,230
29-Strategy_FinancialPlan Page 968 Wednesday, April 30, 2003 12:19 PM
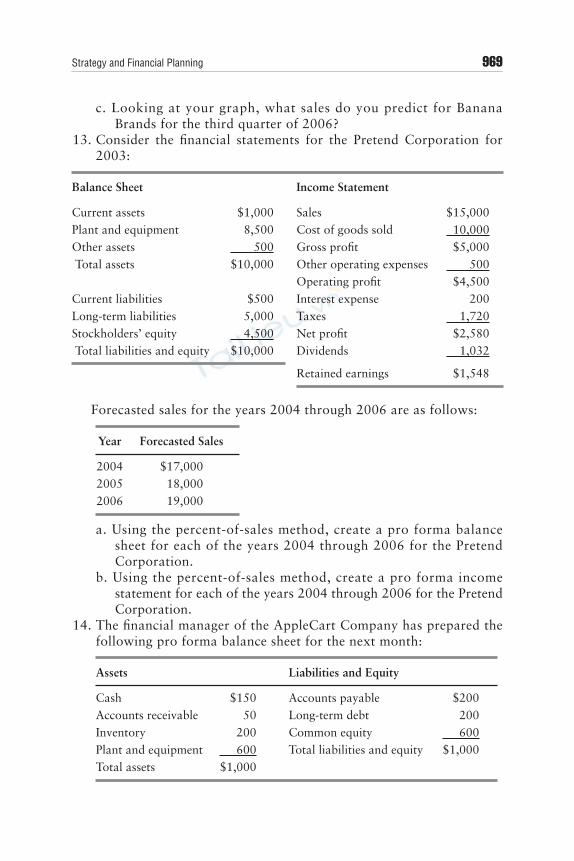
Strategy and Financial Planning 969
c. Looking at your graph, what sales do you predict for BananaBrands for the third quarter of 2006?
13. Consider the financial statements for the Pretend Corporation for2003:
Forecasted sales for the years 2004 through 2006 are as follows:
a. Using the percent-of-sales method, create a pro forma balancesheet for each of the years 2004 through 2006 for the PretendCorporation.
b. Using the percent-of-sales method, create a pro forma incomestatement for each of the years 2004 through 2006 for the PretendCorporation.
14. The financial manager of the AppleCart Company has prepared thefollowing pro forma balance sheet for the next month:
Balance Sheet Income Statement
Current assets $1,000 Sales $15,000Plant and equipment 8,500 Cost of goods sold 10,000Other assets 500 Gross profit $5,000 Total assets $10,000 Other operating expenses 500
Operating profit $4,500Current liabilities $500 Interest expense 200Long-term liabilities 5,000 Taxes 1,720Stockholders’ equity 4,500 Net profit $2,580 Total liabilities and equity $10,000 Dividends 1,032
Retained earnings $1,548
Year Forecasted Sales
2004 $17,0002005 18,0002006 19,000
Assets Liabilities and Equity
Cash $150 Accounts payable $200Accounts receivable 50 Long-term debt 200Inventory 200 Common equity 600Plant and equipment 600 Total liabilities and equity $1,000Total assets $1,000
29-Strategy_FinancialPlan Page 969 Wednesday, April 30, 2003 12:19 PM
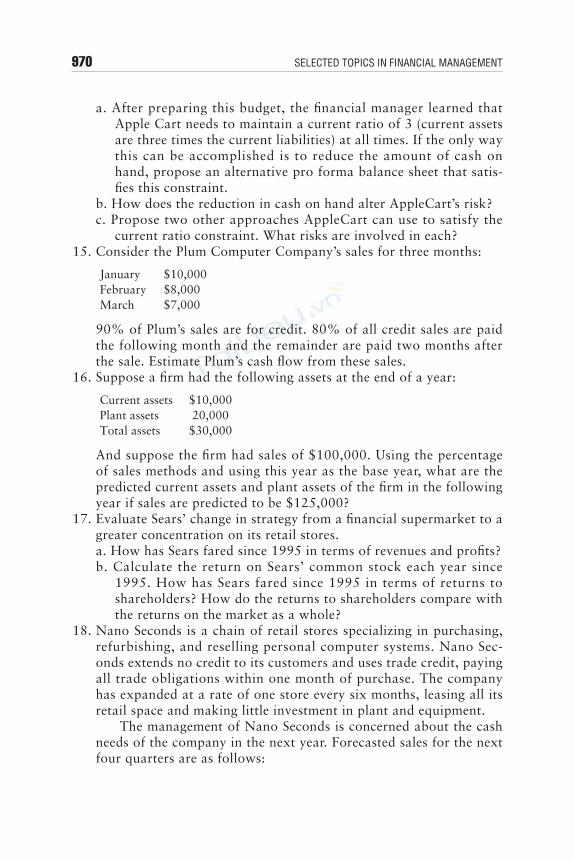
970 SELECTED TOPICS IN FINANCIAL MANAGEMENT
a. After preparing this budget, the financial manager learned thatApple Cart needs to maintain a current ratio of 3 (current assetsare three times the current liabilities) at all times. If the only waythis can be accomplished is to reduce the amount of cash onhand, propose an alternative pro forma balance sheet that satis-fies this constraint.
b. How does the reduction in cash on hand alter AppleCart’s risk?c. Propose two other approaches AppleCart can use to satisfy the
current ratio constraint. What risks are involved in each?15. Consider the Plum Computer Company’s sales for three months:
90% of Plum’s sales are for credit. 80% of all credit sales are paidthe following month and the remainder are paid two months afterthe sale. Estimate Plum’s cash flow from these sales.
16. Suppose a firm had the following assets at the end of a year:
And suppose the firm had sales of $100,000. Using the percentageof sales methods and using this year as the base year, what are thepredicted current assets and plant assets of the firm in the followingyear if sales are predicted to be $125,000?
17. Evaluate Sears’ change in strategy from a financial supermarket to agreater concentration on its retail stores.a. How has Sears fared since 1995 in terms of revenues and profits?b. Calculate the return on Sears’ common stock each year since
1995. How has Sears fared since 1995 in terms of returns toshareholders? How do the returns to shareholders compare withthe returns on the market as a whole?
18. Nano Seconds is a chain of retail stores specializing in purchasing,refurbishing, and reselling personal computer systems. Nano Sec-onds extends no credit to its customers and uses trade credit, payingall trade obligations within one month of purchase. The companyhas expanded at a rate of one store every six months, leasing all itsretail space and making little investment in plant and equipment.
The management of Nano Seconds is concerned about the cashneeds of the company in the next year. Forecasted sales for the nextfour quarters are as follows:
January $10,000February $8,000March $7,000
Current assets $10,000Plant assets 20,000Total assets $30,000
29-Strategy_FinancialPlan Page 970 Wednesday, April 30, 2003 12:19 PM
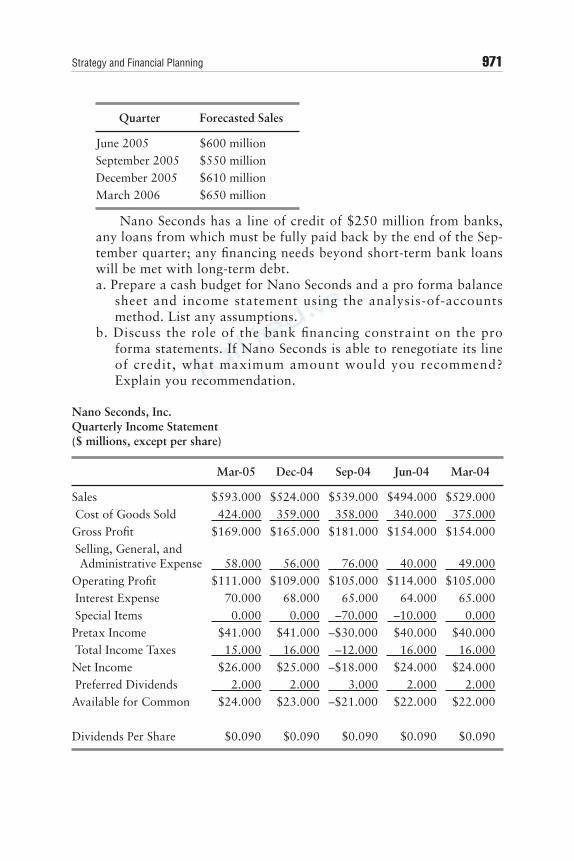
Strategy and Financial Planning 971
Nano Seconds has a line of credit of $250 million from banks,any loans from which must be fully paid back by the end of the Sep-tember quarter; any financing needs beyond short-term bank loanswill be met with long-term debt.a. Prepare a cash budget for Nano Seconds and a pro forma balance
sheet and income statement using the analysis-of-accountsmethod. List any assumptions.
b. Discuss the role of the bank financing constraint on the proforma statements. If Nano Seconds is able to renegotiate its lineof credit, what maximum amount would you recommend?Explain you recommendation.
Nano Seconds, Inc.Quarterly Income Statement($ millions, except per share)
Quarter Forecasted Sales
June 2005 $600 millionSeptember 2005 $550 millionDecember 2005 $610 millionMarch 2006 $650 million
Mar-05 Dec-04 Sep-04 Jun-04 Mar-04
Sales $593.000 $524.000 $539.000 $494.000 $529.000 Cost of Goods Sold 424.000 359.000 358.000 340.000 375.000Gross Profit $169.000 $165.000 $181.000 $154.000 $154.000 Selling, General, and
Administrative Expense 58.000 56.000 76.000 40.000 49.000Operating Profit $111.000 $109.000 $105.000 $114.000 $105.000 Interest Expense 70.000 68.000 65.000 64.000 65.000 Special Items 0.000 0.000 –70.000 –10.000 0.000Pretax Income $41.000 $41.000 –$30.000 $40.000 $40.000 Total Income Taxes 15.000 16.000 –12.000 16.000 16.000Net Income $26.000 $25.000 –$18.000 $24.000 $24.000 Preferred Dividends 2.000 2.000 3.000 2.000 2.000Available for Common $24.000 $23.000 –$21.000 $22.000 $22.000
Dividends Per Share $0.090 $0.090 $0.090 $0.090 $0.090
29-Strategy_FinancialPlan Page 971 Wednesday, April 30, 2003 12:19 PM
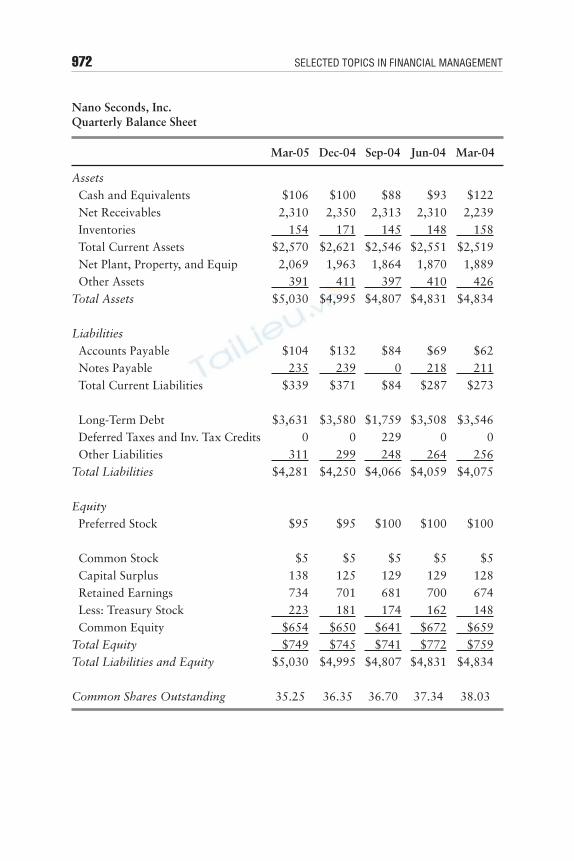
972 SELECTED TOPICS IN FINANCIAL MANAGEMENT
Nano Seconds, Inc.Quarterly Balance Sheet
Mar-05 Dec-04 Sep-04 Jun-04 Mar-04
Assets
Cash and Equivalents $106 $100 $88 $93 $122 Net Receivables 2,310 2,350 2,313 2,310 2,239 Inventories 154 171 145 148 158 Total Current Assets $2,570 $2,621 $2,546 $2,551 $2,519 Net Plant, Property, and Equip 2,069 1,963 1,864 1,870 1,889 Other Assets 391 411 397 410 426Total Assets $5,030 $4,995 $4,807 $4,831 $4,834
Liabilities
Accounts Payable $104 $132 $84 $69 $62 Notes Payable 235 239 0 218 211 Total Current Liabilities $339 $371 $84 $287 $273
Long-Term Debt $3,631 $3,580 $1,759 $3,508 $3,546Deferred Taxes and Inv. Tax Credits 0 0 229 0 0
Other Liabilities 311 299 248 264 256Total Liabilities $4,281 $4,250 $4,066 $4,059 $4,075
Equity
Preferred Stock $95 $95 $100 $100 $100
Common Stock $5 $5 $5 $5 $5 Capital Surplus 138 125 129 129 128 Retained Earnings 734 701 681 700 674 Less: Treasury Stock 223 181 174 162 148 Common Equity $654 $650 $641 $672 $659Total Equity $749 $745 $741 $772 $759Total Liabilities and Equity $5,030 $4,995 $4,807 $4,831 $4,834
Common Shares Outstanding 35.25 36.35 36.70 37.34 38.03
29-Strategy_FinancialPlan Page 972 Wednesday, April 30, 2003 12:19 PM
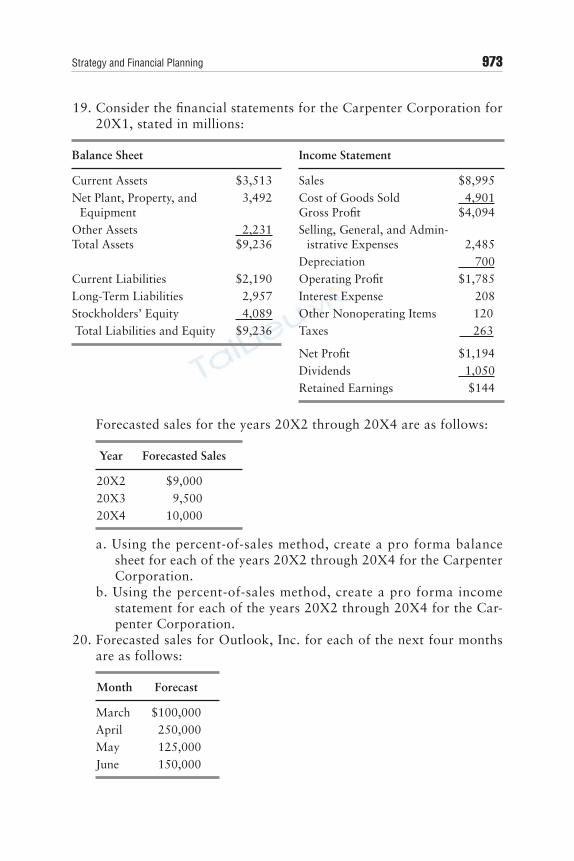
Strategy and Financial Planning 973
19. Consider the financial statements for the Carpenter Corporation for20X1, stated in millions:
Forecasted sales for the years 20X2 through 20X4 are as follows:
a. Using the percent-of-sales method, create a pro forma balancesheet for each of the years 20X2 through 20X4 for the CarpenterCorporation.
b. Using the percent-of-sales method, create a pro forma incomestatement for each of the years 20X2 through 20X4 for the Car-penter Corporation.
20. Forecasted sales for Outlook, Inc. for each of the next four monthsare as follows:
Balance Sheet Income Statement
Current Assets $3,513 Sales $8,995Net Plant, Property, and
Equipment 3,492 Cost of Goods Sold
Gross Profit 4,901$4,094
Other AssetsTotal Assets
2,231$9,236
Selling, General, and Admin-istrative Expenses 2,485
Depreciation 700Current Liabilities $2,190 Operating Profit $1,785Long-Term Liabilities 2,957 Interest Expense 208Stockholders’ Equity 4,089 Other Nonoperating Items 120 Total Liabilities and Equity $9,236 Taxes 263
Net Profit $1,194Dividends 1,050Retained Earnings $144
Year Forecasted Sales
20X2 $9,00020X3 9,50020X4 10,000
Month Forecast
March $100,000April 250,000May 125,000June 150,000
29-Strategy_FinancialPlan Page 973 Wednesday, April 30, 2003 12:19 PM

974 SELECTED TOPICS IN FINANCIAL MANAGEMENT
Actual sales in April were $150,000. Outlook generally collects20% of its sales in cash and collects 80% the following month. Out-look purchases amount to 70% of the current month’s sales, and itpays 50% of its purchases during the current month and 50% duringthe following month. Determine the net cash flows from operationsforecasted for each of the four months.
29-Strategy_FinancialPlan Page 974 Wednesday, April 30, 2003 12:19 PM
Appendix
Black-Scholes OptionPricing Model
n option is an asset that derives its value from some other asset;hence, as we saw in Chapter 4, an option is a derivative instrument.
An option may be a stand-alone security, or be embedded in financialinstruments such as a callable bond and a convertible bond, as well asoptions embedded in financial decisions such as real options in capitalbudgeting decisions, discussed in Chapter 14.
In Chapter 8 we explained the basic factors that affect the “value ofan option,” also referred to as the “option price.” The option price is areflection of the option’s intrinsic value and any additional amount overits intrinsic value, called the time premium. In this appendix we willexplain how the theoretical price of an option can be determined using awell-known financial model, the Black-Scholes option pricing model.1
This model is viewed by many in the financial community as one of thepath-breaking innovations in financial management and analysis. Wewill not provide the details with respect to how the model was derivedby its developers, Myron Scholes and Fischer Black. Rather, we will setforth the basics of the model.2
1 Fischer Black and Myron Scholes, “The Pricing of Options and Corporate Liabili-ties,” Journal of Political Economy (May-June 1973), pp. 637–654.2 Since the introduction of the Black-Scholes option pricing, there have been numer-ous modifications and extensions of the model. We will not review these in this ap-pendix.
A
Append-Black_Scholes Page 975 Wednesday, June 4, 2003 12:02 PM
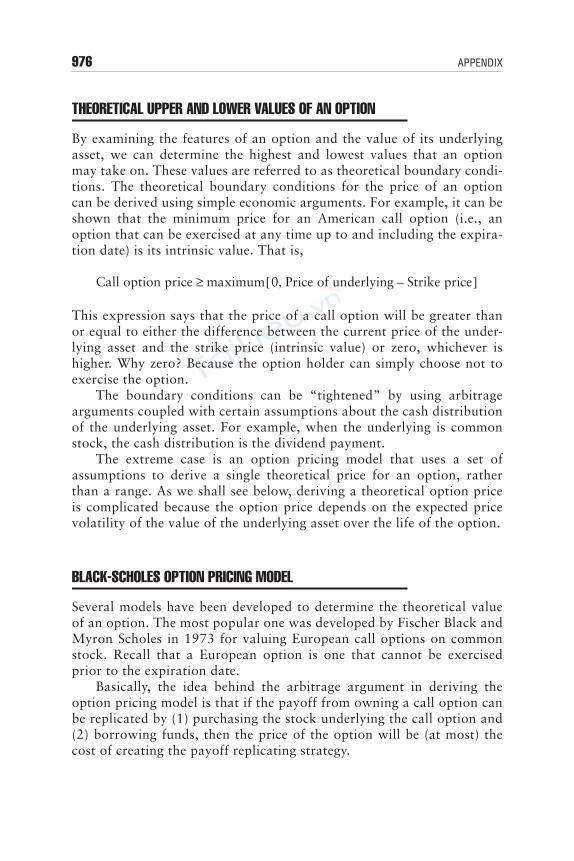
976 APPENDIX
THEORETICAL UPPER AND LOWER VALUES OF AN OPTION
By examining the features of an option and the value of its underlyingasset, we can determine the highest and lowest values that an optionmay take on. These values are referred to as theoretical boundary condi-tions. The theoretical boundary conditions for the price of an optioncan be derived using simple economic arguments. For example, it can beshown that the minimum price for an American call option (i.e., anoption that can be exercised at any time up to and including the expira-tion date) is its intrinsic value. That is,
This expression says that the price of a call option will be greater thanor equal to either the difference between the current price of the under-lying asset and the strike price (intrinsic value) or zero, whichever ishigher. Why zero? Because the option holder can simply choose not toexercise the option.
The boundary conditions can be “tightened” by using arbitragearguments coupled with certain assumptions about the cash distributionof the underlying asset. For example, when the underlying is commonstock, the cash distribution is the dividend payment.
The extreme case is an option pricing model that uses a set ofassumptions to derive a single theoretical price for an option, ratherthan a range. As we shall see below, deriving a theoretical option priceis complicated because the option price depends on the expected pricevolatility of the value of the underlying asset over the life of the option.
BLACK-SCHOLES OPTION PRICING MODEL
Several models have been developed to determine the theoretical valueof an option. The most popular one was developed by Fischer Black andMyron Scholes in 1973 for valuing European call options on commonstock. Recall that a European option is one that cannot be exercisedprior to the expiration date.
Basically, the idea behind the arbitrage argument in deriving theoption pricing model is that if the payoff from owning a call option canbe replicated by (1) purchasing the stock underlying the call option and(2) borrowing funds, then the price of the option will be (at most) thecost of creating the payoff replicating strategy.
Call option price maximum 0 Price of underlying Strike price–,[ ]≥
Append-Black_Scholes Page 976 Wednesday, June 4, 2003 12:02 PM
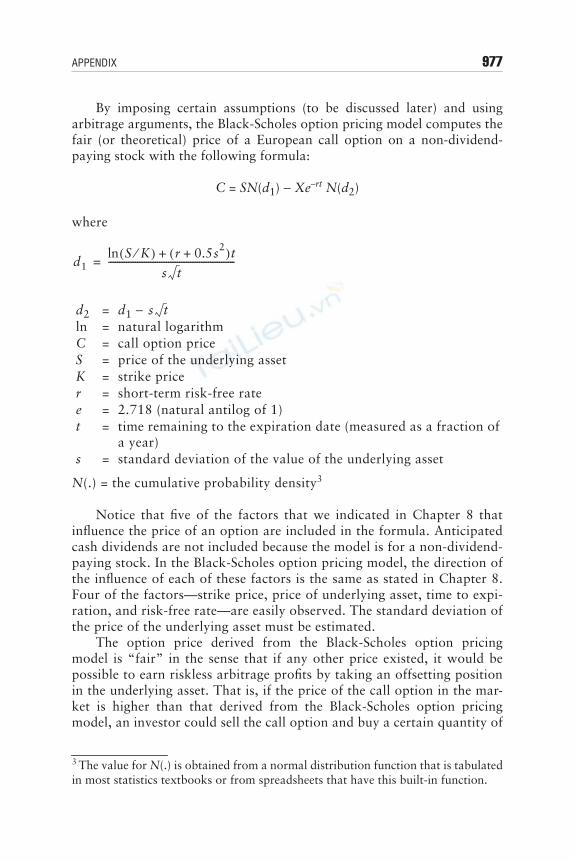
APPENDIX 977
By imposing certain assumptions (to be discussed later) and usingarbitrage arguments, the Black-Scholes option pricing model computes thefair (or theoretical) price of a European call option on a non-dividend-paying stock with the following formula:
C = SN(d1)
− Xe–rt N(d2)
where
N(.) = the cumulative probability density3
Notice that five of the factors that we indicated in Chapter 8 thatinfluence the price of an option are included in the formula. Anticipatedcash dividends are not included because the model is for a non-dividend-paying stock. In the Black-Scholes option pricing model, the direction ofthe influence of each of these factors is the same as stated in Chapter 8.Four of the factors—strike price, price of underlying asset, time to expi-ration, and risk-free rate—are easily observed. The standard deviation ofthe price of the underlying asset must be estimated.
The option price derived from the Black-Scholes option pricingmodel is “fair” in the sense that if any other price existed, it would bepossible to earn riskless arbitrage profits by taking an offsetting positionin the underlying asset. That is, if the price of the call option in the mar-ket is higher than that derived from the Black-Scholes option pricingmodel, an investor could sell the call option and buy a certain quantity of
d2 = d1
−ln = natural logarithmC = call option priceS = price of the underlying assetK = strike pricer = short-term risk-free ratee = 2.718 (natural antilog of 1)t = time remaining to the expiration date (measured as a fraction of
a year)s = standard deviation of the value of the underlying asset
3 The value for N(.) is obtained from a normal distribution function that is tabulatedin most statistics textbooks or from spreadsheets that have this built-in function.
d1ln S K⁄( ) r 0.5s2+( )t+
s t---------------------------------------------------------=
s t
Append-Black_Scholes Page 977 Wednesday, June 4, 2003 12:02 PM
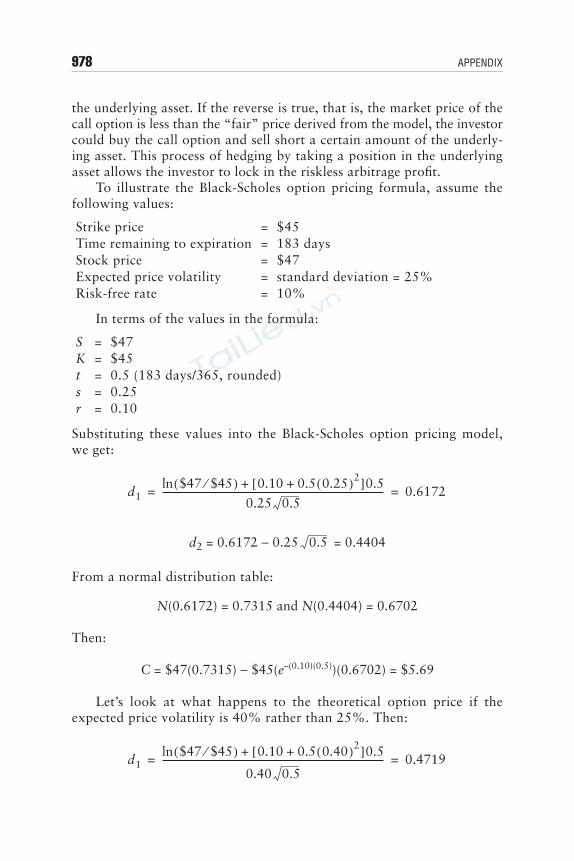
978 APPENDIX
the underlying asset. If the reverse is true, that is, the market price of thecall option is less than the “fair” price derived from the model, the investorcould buy the call option and sell short a certain amount of the underly-ing asset. This process of hedging by taking a position in the underlyingasset allows the investor to lock in the riskless arbitrage profit.
To illustrate the Black-Scholes option pricing formula, assume thefollowing values:
In terms of the values in the formula:
Substituting these values into the Black-Scholes option pricing model,we get:
d2 = 0.6172
− 0.25 = 0.4404
From a normal distribution table:
N(0.6172) = 0.7315 and N(0.4404) = 0.6702
Then:
C = $47(0.7315)
− $45(e–(0.10)(0.5))(0.6702) = $5.69
Let’s look at what happens to the theoretical option price if theexpected price volatility is 40% rather than 25%. Then:
Strike price = $45Time remaining to expiration = 183 daysStock price = $47Expected price volatility = standard deviation = 25%Risk-free rate = 10%
S = $47K = $45t = 0.5 (183 days/365, rounded)s = 0.25r = 0.10
d1ln $47 $45⁄( ) 0.10 0.5 0.25( )2+[ ]0.5+
0.25 0.5---------------------------------------------------------------------------------------------------- 0.6172= =
0.5
d1ln $47 $45⁄( ) 0.10 0.5 0.40( )2+[ ]0.5+
0.40 0.5---------------------------------------------------------------------------------------------------- 0.4719= =
Append-Black_Scholes Page 978 Wednesday, June 4, 2003 12:02 PM
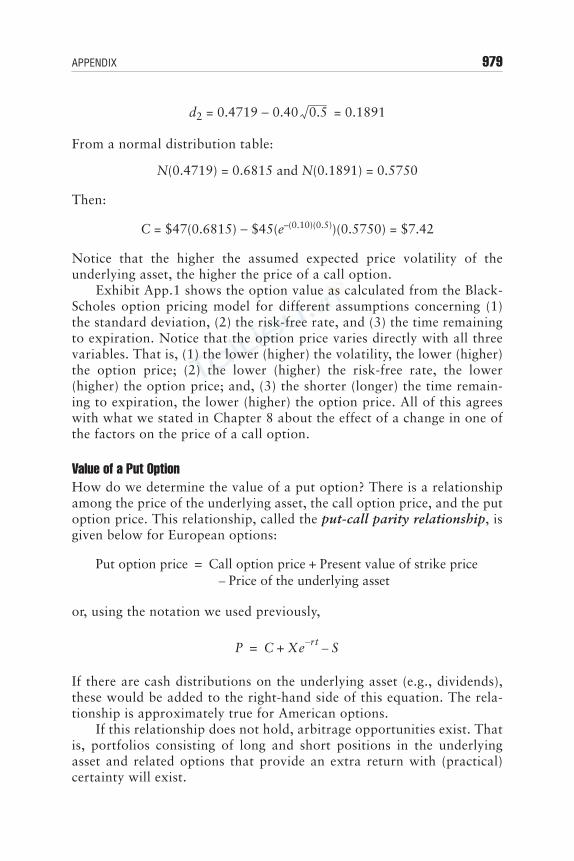
APPENDIX 979
d2 = 0.4719
− 0.40 = 0.1891
From a normal distribution table:
N(0.4719) = 0.6815 and N(0.1891) = 0.5750
Then:
C = $47(0.6815)
− $45(e–(0.10)(0.5))(0.5750) = $7.42
Notice that the higher the assumed expected price volatility of theunderlying asset, the higher the price of a call option.
Exhibit App.1 shows the option value as calculated from the Black-Scholes option pricing model for different assumptions concerning (1)the standard deviation, (2) the risk-free rate, and (3) the time remainingto expiration. Notice that the option price varies directly with all threevariables. That is, (1) the lower (higher) the volatility, the lower (higher)the option price; (2) the lower (higher) the risk-free rate, the lower(higher) the option price; and, (3) the shorter (longer) the time remain-ing to expiration, the lower (higher) the option price. All of this agreeswith what we stated in Chapter 8 about the effect of a change in one ofthe factors on the price of a call option.
Value of a Put OptionHow do we determine the value of a put option? There is a relationshipamong the price of the underlying asset, the call option price, and the putoption price. This relationship, called the put-call parity relationship, isgiven below for European options:
or, using the notation we used previously,
If there are cash distributions on the underlying asset (e.g., dividends),these would be added to the right-hand side of this equation. The rela-tionship is approximately true for American options.
If this relationship does not hold, arbitrage opportunities exist. Thatis, portfolios consisting of long and short positions in the underlyingasset and related options that provide an extra return with (practical)certainty will exist.
0.5
Put option price Call option price Present value of strike price+=Price of the underlying asset–
P C Xe rt– S–+=
Append-Black_Scholes Page 979 Wednesday, June 4, 2003 12:02 PM
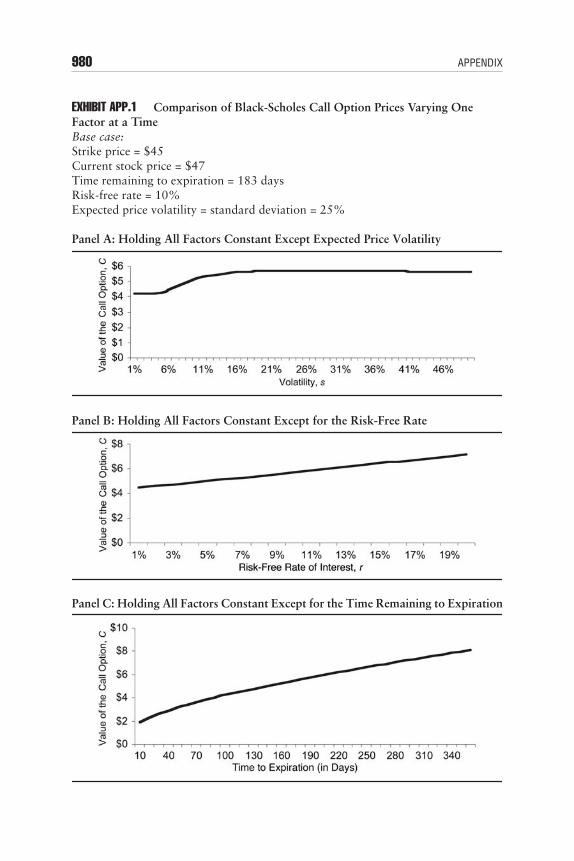
980 APPENDIX
EXHIBIT APP.1 Comparison of Black-Scholes Call Option Prices Varying One Factor at a TimeBase case:Strike price = $45Current stock price = $47Time remaining to expiration = 183 daysRisk-free rate = 10%Expected price volatility = standard deviation = 25%
Panel A: Holding All Factors Constant Except Expected Price Volatility
Panel B: Holding All Factors Constant Except for the Risk-Free Rate
Panel C: Holding All Factors Constant Except for the Time Remaining to Expiration
Append-Black_Scholes Page 980 Wednesday, June 4, 2003 12:02 PM
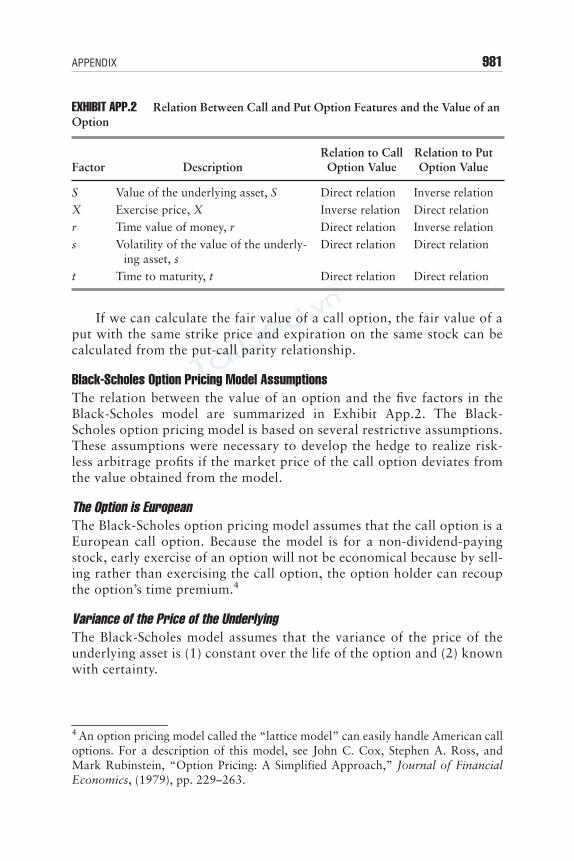
APPENDIX 981
EXHIBIT APP.2 Relation Between Call and Put Option Features and the Value of an Option
If we can calculate the fair value of a call option, the fair value of aput with the same strike price and expiration on the same stock can becalculated from the put-call parity relationship.
Black-Scholes Option Pricing Model AssumptionsThe relation between the value of an option and the five factors in theBlack-Scholes model are summarized in Exhibit App.2. The Black-Scholes option pricing model is based on several restrictive assumptions.These assumptions were necessary to develop the hedge to realize risk-less arbitrage profits if the market price of the call option deviates fromthe value obtained from the model.
The Option is European The Black-Scholes option pricing model assumes that the call option is aEuropean call option. Because the model is for a non-dividend-payingstock, early exercise of an option will not be economical because by sell-ing rather than exercising the call option, the option holder can recoupthe option’s time premium.4
Variance of the Price of the Underlying The Black-Scholes model assumes that the variance of the price of theunderlying asset is (1) constant over the life of the option and (2) knownwith certainty.
Factor DescriptionRelation to CallOption Value
Relation to PutOption Value
S Value of the underlying asset, S Direct relation Inverse relationX Exercise price, X Inverse relation Direct relationr Time value of money, r Direct relation Inverse relations Volatility of the value of the underly-
ing asset, sDirect relation Direct relation
t Time to maturity, t Direct relation Direct relation
4 An option pricing model called the “lattice model” can easily handle American calloptions. For a description of this model, see John C. Cox, Stephen A. Ross, andMark Rubinstein, “Option Pricing: A Simplified Approach,” Journal of FinancialEconomics, (1979), pp. 229–263.
Append-Black_Scholes Page 981 Wednesday, June 4, 2003 12:02 PM
982 APPENDIX
Stochastic Process Generating Stock Prices To derive an option pricing model, an assumption is needed about theway the price of the underlying asset may change over time. The Black-Scholes model is based on the assumption that the price of the underlyingasset is generated by one kind of stochastic (random) process called a“diffusion process.” In a diffusion process, the underlying asset’s pricecan take on any positive value, but when it moves from one price toanother, it must take on all values in between. That is, the stock price doesnot jump from one stock price to another, skipping over interim prices.
Risk-Free Rate In deriving the Black-Scholes option pricing model, two assumptions aremade about the risk-free rate. First, it is assumed that the interest ratesfor borrowing and lending are the same. Second, it is assumed that theinterest rate was constant and known over the life of the option.
DividendsThe original Black-Scholes option pricing model is for a non-dividend-paying stock. In the case of a dividend-paying stock, it may be advanta-geous for the holder of the call option to exercise the option early. Tounderstand why, suppose that a stock pays a dividend such that if thecall option is exercised, dividends would be received prior to theoption’s expiration date. If the dividends plus the accrued interestearned from investing the dividends from the time they are receiveduntil the expiration date are greater than the option’s time premium,then it would be optimal to exercise the option. In the case where divi-dends are not known with certainty, it will not be possible to develop amodel using arbitrage arguments.5
Taxes and Transaction Costs The Black-Scholes option pricing model ignores taxes and transactioncosts. The model can be modified to account for taxes, but the problemis that there is not just one tax rate. Transaction costs include both com-missions and the bid-ask spreads for the underlying asset and theoption, as well as other costs associated with trading options.
5 In the case of known dividends, a shortcut to adjust the Black-Scholes model is toreduce the stock price by the present value of the dividends. Fischer Black suggestedan approximation technique to value a call option for a dividend-paying stock. Amore accurate model for pricing call options in the case of known dividends has beendeveloped by several researchers.
Append-Black_Scholes Page 982 Wednesday, June 4, 2003 12:02 PM

983
Index
10K filings, 12710-K report, 87910Q filings, 127
Abarbanell, Jeffrey S., 792Abel-Noser database, 788Abnormal profit, 44Acceleration option, 504Accounting
accrual method, usage, 374considerations, 925–926earnings, 779income, 375irregularities, 21principles/assumptions, 125–127profit, 14–15
contrast. See Economic profitrules, 926
basis, 551standards, 848
Accounts method, analysis, 955–960Accounts payable, 132, 949
days, number, 694increase, 376management, 692–695payments, 950turnover, 693
Accounts receivable, 129, 651, 706–708management, 739–740monitoring, 659–661turnover ratio, 740, 741
Accrual accounting, 126Accrued expenses, 132Accumulated depreciation, 131Acid-test ratio, 734Acquisitions, 763Activity ratios, 739–742Actual EPS, 786–787Add back expenses, 745Additional paid-in capital, 134Add-on interest, 685–686Adjustable rate dividends, 573Adjustable-rate preferred stock (ARPS), 573Adjusted discount rate, 910Adjustment factor, 325ADR. See American depositary receiptADS. See American depositary shareAdvertising expenditures, 737After-tax basis, 745After-tax dollars, 320
After-tax interest rate, 911AG. See AktiengellschaftAgencies
explanation. See Dividendsrelationship, 560
Agencies, relationship, 17–23cost, 18–19definition, 17problems, 17–18
Agents, 560definition, 17
Aharony, Joseph, 555AIC. See All-in-costAktiengellschaft (AG), 833Allied Products Corporation, Annual Report (1991),
815All-inclusive income concept, 138All-in-cost (AIC). See also Debt; FundsAlternative leases, comparison, 910–911Alternative trading systems, 40–41Altman, Edward I., 610AMA. See American Management AssociationAmazon.com, 946, 948American depositary receipt (ADR), 843–844American depositary share (ADS), 844American Express, EPS (2001), 782American Management Association (AMA), 726American option, 89
definition, 473American Stock Exchange, 844Ammons, Janice L., 777Amortization. See Loan
definition, 131schedule, 491–493
Amortizing loan. See Fully amortizing loanAmortizing structure, 488Analysts
forecasting ability, 785–789forecasts, 783–792
beating, 776Ang, James, 559Annual percentage rate (APR), 152–154, 183–187
calculation, 682–683, 707, 709Annual yield, 228
yield-to-maturity, contrast, 240Annualized basis, 682Annualized interest rates, contrast. See Effective
interest ratesAnnuities. See Ordinary annuity
amount, multiplication, 172
Index Page 983 Wednesday, April 30, 2003 12:24 PM

984 Index
Annuities (Cont.)due, valuation, 179–180factor, 198. See also Future value; Present value
tables, usage, 174–177future value, 171usage, 168–174valuation. See Deferred annuitiesvalue, determination, 169
AOL Time Warner, 753APM. See Arbitrage Pricing ModelAppreciation. See Capital
right. See StocksAPR. See Annual percentage rateArbitrage Pricing Model (APM), 299–301Arithmetic average return, 151, 202–203ARPS. See Adjustable-rate preferred stockArthur Anderson, obstruction of justice, 21Asian currency option, 855Asset-backed securities, 32, 861, 867–868
evaluation, rating agencies (considerations), 871–873
transactions, 873Assets, 128–132. See also Current assets; Noncur-
rent assets; Other assetsacquisition, 364–366cost, 364, 391demand, 68disposition, 366–370
cash flow, 366gross amount, 898management, 740–741pricing, 292–301
interaction. See Financial decision makingmodel, 339
return, covariance, 287securitization, 706, 862types, 620valuation, marketplace role, 199–201valuation, principles, 195–201
questions, 208–210value, 245–247. See also Underlying asset
change, 201volatility, 245
At-risk investment, 901At-the-money option, 246Auction
preferred stock, 573process, 64, 500
Audit. See Post-completion auditAuthorized shares, 535Autoliv, Inc., 811Autoregressive models, 789Available-for-sale securities, 132Average annual return, 202, 238Average collection period, 659Average cost, 129Average credit sales per day, 731Average day COGS, 730Average day purchases on credit, 732Average rate currency option, 855Average return. See Arithmetic average return; Geo-
metric average returnAverage tax rate, 109
Backup servicer, 873Bad debts
expense, 737probability, 656risk, 654
Baker, H. Kent, 843Balance sheet, 127–128, 588, 749, 948. See also
Common size; Pro forma balance sheetaccount retained earnings, 320information, providing, 143shareholder equity, impact, 132
Ball, Ray, 777Balloon payment, 491Bank loan-marketable securities, 954Bankers, acceptances, 29, 703–705Banking. See Concentration; Global banking; Invest-
ment; Merchant bankingBanking Act of 1933, 61Bankruptcy, 267, 606. See also Chapter 11 bank-
ruptcy; Enron; Texacoamount, 618costs, 610–612risk, 564
Bankruptcy Reform Act of 1978, 610Bankruptcy remote entities, 867Banks. See Clearinghouse; Money center banks
activities, regulation. See Commercial banksCDs, 155financing, 695–697
forms, comparison, 697–699holding companies, 58, 893loan, 695. See also Syndicated bank loanselection, 641services. See Commercial bank services
Base interest rate, 69Basic earning power, 726
ratio, 723Basic EPS, 782Basic valuation equation, 150Basu, Sanjoy, 795Baumol Model, 632–637, 640Baumol, William J., 632Bautista, Alberto J., 903Bearer bonds, 495Before-tax basis, 662Bell Atlantic, dividends (growth rate), 163Benchmark, usage, 750–753Benke Jr., R.L., 837Berkshire Hathaway, stock purchase, 222Bermuda option, 89Berry, Michael A., 787Best efforts arrangement, 62Beta, 295–298, 325. See also Common stock
definition, 295measure, 296
Biased expectations theories, 77–78Bird in the hand theory, 557, 558Black, Fischer, 472, 561Black-Scholes option pricing formula, 476Black-Scholes option-pricing model, 474Blanket indenture, 496Bloomberg, 783Board of directors, 966. See also Classified board
of directorsclassification, 541
Index Page 984 Wednesday, April 30, 2003 12:24 PM

Index 985
Bond issuesdesigning, 512–521features/provisions, 496–508refunding, 524
Bond series, 496Bond-equivalent basis, 233, 237, 846Bond-equivalent yield, 233, 313Bondholder, role, 31Bonding costs, 18–19Bonds, 495–526. See also Income; Investment-
grade bonds; Noninvestment-grade bonds;Secured bonds
contrast. See Fixed-rate bondsconvertibility, 506–508denominations, 496–497designing, derivative instruments (usage), 516–520distinction. See Noteshigh quality, 70interest, 229markets, 43
convention, 233medium grade, 70offering, warrants usage, 520–521par value, 239prime, 70rating systems, 508–510retirement, 523–526returns, 234–240security, 501seniority, 502time path, 241upper medium grade, 70valuation
maturity, approaching, 240–241yields, change, 242–243
yield, 236Bonus, compensation, 19Book earnings, equipment leasing impact, 893Book value, 131, 336. See also Equity
market value, contrast, 743–744Borrowed funds, 905Borrowers, creditworthiness, 710Borrowing. See Longer-term borrowing
arrangement. See Financial institutionscompany dependence, 811effective cost, 681–682impact, 893maturity, length, 710
Borrow-to-buy decision, comparison. See LeasesBought deal, mechanics, 64Bouncing, 639Break-even point, 410Break-points, determination, 330Brealey, Richard, 907Broker/dealer functions, 54Brown, Lawrence D., 787Browning, E.S., 793Budgeting, 934, 948–955
approval/authorization, 359practices, 966relationship. See Financial planning
Budgetsdevelopment, 938manuals, usage, 966
term origination, 938types, 961
Buildings, setup charges, 382Bullet loan, 491Bullet payment, 491Bullet structure, 488Burmeister, Edwin, 300Business
enterpriseforms, 6–17prevalence, 11–12
entity, establishment, 833–834finance, 3financing flexibility, 138forms, 10–11risk, 258–262, 357, 558, 611
increase, 616
Calculators, usage, 174–177. See also Financialcalculators
Call options, 89. See also Long call position; Shortcall position
definition, 473purchase, 92–93writing/selling, 93
Call the issue, right, 503Callability. See Preferred stockCallable bonds, 243–245Callable preferred stock, 576Calls
exercising, 576feature, 226, 243. See also Preferred stockmechanism, 502–503premium, receiving, 270price, 226, 244, 576provision, 72risk, 258, 270
Campbell, John Y., 793Cancelable operating lease, 890Cap
agreements, 101–103interpretation, 102motivation, 103
Capacity, 658analysis, 510–511
Capital. See Additional paid-in capital; Workingcapital
appreciation, 225components, 603
changes. See Working capitalgains, 116–118, 366–367, 382
expectations, 368investment, 356leases, current portion, 132marginal cost, 345. See also Shareholders
estimation. See Du Pontproblems, 333–335
marginal efficiency, 308markets. See Real-world capital markets
securities, 29–33project, 356raising, average cost, 329rationing. See Internal rate of return; Modified
internal rate of return
Index Page 985 Wednesday, April 30, 2003 12:24 PM

986 Index
requirements, relief, 866schedule, marginal cost, 327–333source, cost determination (integrative example),
337–345stock, 135yield, 219–221, 224, 558
Capital Asset Pricing Model (CAPM), 293–299,324, 326
DVM, estimates reconciliation, 344–345limitations, 298–299usage, 341–344. See also Common stock
Capital budget, 946. See also Optimal capital bud-get
dollar limit, 401limitation, 426proposal, 359
Capital budgeting, 355, 358–363, 847–848, 912decision, risk incorporation, 469–477evaluation techniques, 400–436Hirshleifer Company, integrative example, 385–
389analysis, 387problem, 385–387
process, stages, 359–360questions, 392–398risk, relationship, 451
questions, 481–484Williams 5&10, integrative example, 380–385
analysis, 382–385problem, 380–382
Capital budgeting techniques, 399comparison, 436–441practice, 441–442questions, 444–450selection, 439–441
Capital componentcosts, determination, 310–326proportion, determination, 309–310
integrative example, 335–337Capital Corporation, expected values, 592Capital cost, 14, 307, 326–335, 805
adjustment, 470–471calculation, 470definition, 400determination, 333estimation, Du Pont (integrative example), 335–
346fluctuation, 318overrun, 923questions, 347–352return, 358
Capital expenditures, 361adjustment, 808coverage ratio, 812effect, 814
Capital leases, accounting, 897–899Capital market line (CML), 294Capital structure, 310, 848–849. See also Observed
capital structures; Optimal capital structureconclusions, 612–615financial distress, relationship, 606–612financial leverage, relationship, 587–591prescription, 619–620proportions, 330
questions, 621–624relationship. See Interest; Personal taxestaxes, relationship, 594–605types, 616–617usage, 328, 583
Capitalization. See Thin capitalizationavoidance, 889–890, 913rate, 596
CAPM. See Capital Asset Pricing ModelCaptive finance companies, 54, 862Captive finance subsidiaries, 664Captive leasing, 893Carrybacks. See Net operating loss carrybacksCarrying costs, 665Carryovers, 119–120Cash
account, change, 957balances, holding (reasons), 631–632budget, 949–955
statements, 965collections, estimation, 949components, 129costs, 632dividends, 547–549, 561equivalents, 129forecasting, 630holding
cost, 634opportunity cost, 635
investment, determination, 632–637needs, monitoring, 630–631outflow, 372, 947, 951payment, 563taxes, 810
Cash flow (CF). See Discretionary cash flow; End-of-period cash flow; Incremental cash flow;Investment; Net cash flows; Net free cashflow; Operating cash flow; Projects; Unevencash flows
adjustment, 478analysis, 797
questions, 817–819calculation, 182–183change. See Expensescharacteristics. See Options; Securitiesconsequences, 903differences. See Investmentdiscounted payback, consideration, 406–407estimation, 389–392financing activities, usage, 140–143generation, 959information, usage, 814–816interest coverage ratio, 746investing activities, usage, 140–143investments, 363–380IRR consideration, 427leasing, impact, 893measure, 812measurement, difficulties, 797–799MIRR consideration, 435NPV consideration, 412–413operating activities, usage, 139–140patterns. See Customerspayback consideration, 404
Index Page 986 Wednesday, April 30, 2003 12:24 PM

Index 987
Cash flow (Cont.)perpetual stream, valuation, 177–179PI consideration, 417–418present value, 399, 414questions, 392–398reduction, 266reinvestment, 425series, time value, 164–177simplifications, 379–380statements, 138–143, 799–804streams, 199
valuation, 177stress, 873techniques. See Discounted cash flow techniquestime line representation, 166usage. See Free cash flow; Investment returnsusefulness. See Financial analysisvaluation, time patterns (usage), 177–183value, determination, 434volatility, 475
Cash flow (CF) risk, 258–268coefficient of variation, 459–460range, 455–456relationship, 452–454standard deviation, 456–459statistical measures, 455–460
Cash flow (CF) riskinessdiscounted payback consideration, 409–410IRR consideration, 427MIRR consideration, 435–436NPV consideration, 413payback consideration, 404PI consideration, 418
Cash flow (CF) timing, 425discounted payback consideration, 407–408IRR consideration, 428MIRR consideration, 435NPV consideration, 413payback consideration, 404PI consideration, 418
Cash flow to capital expenditures ratio, 812Cash flow to debt ratio, 813, 814Cash inflows, 383
creation, 372present value. See Investmentreceiving, 425stream, 203
Cash management, 627, 630–644questions, 648–650techniques, 640–643
Category killers, 763Caterpillar Financial Asset Trust 1997-A, 877–879Caterpillar Financial Services Corporation, 877CDs. See Certificates of depositCertainty equivalents, 477–478
NPV, 478Certificates of deposit (CDs), 28–29, 52. See also
Banks; Eurodollars; Negotiable CDs; Yan-kee CDs
Certificates of indebtedness. See IndebtednessCFAR ratio. See Fitch IBCACFTC. See Commodity Futures Trading CommissionChapter 11 bankruptcy, 610Chattel mortgage, 708, 709
Check clearing process, 641–643Check processing, 641Circuit City Stores, annual report (1999), 897Circulating capital, 128, 627Citibank, 99Class B stock, 538Classified board of directors, 541Classified stocks, 534, 538–539Clearinghouse
bank, 642role, 85–86
Close corporation, definition, 9, 536Closed-end investment companies, 66Closely held corporation, definition, 9, 536CML. See Capital market lineCoca-Cola, 823, 946, 947
book value, 136Coefficient of variation. See VariationCoggin, T. Daniel, 791, 792COGS. See Cost of goods soldColeco Industries, 940–941Collar, 573Collateral, 29, 489, 511, 658, 705
credit quality, 871–872factors, 710par value, 875trust bond, 501
Collateralization. See OvercollateralizationCollection
costs, 663period. See Average collection period
Collection policies, 657–659benefits, 662change, analysis, 661–662considerations, 663–664costs, 662–663
Commercial banks. See Domestic commercial banks;Foreign commercial banks
activities, regulation, 60–61services, 59–60
Commercial paper, 28, 699–702notes, 699
Commitment fee, 688Committed line of credit, 696Commodity
futures, 84price, 101swaps, 100
Commodity Futures Trading Commission (CFTC),44
Common equity, 479, 534change, 957
Common shareholders, available earnings, 137Common shares outstanding, number, 780Common size
analysis, 747–748. See also Wal-Mart Storesbalance sheet, 747income statement, 748
Common stock, 135, 336, 533beta, 296characteristics, 534–545cost, 344definition, 30investment return, calculation, 221
Index Page 987 Wednesday, April 30, 2003 12:24 PM

988 Index
Common stock (Cont.)market value, 337outstanding, 134owners, 211present value, 214question, 566–570returns, 221–225share price volatility, 521shares, authorization, 539stated value, 134valuation, 213–225
Common stock, cost, 320–326, 339–345CAPM, usage, 324–326determination, 334dividend valuation model, usage, 321–324
Company-specific risk, 295Comparative advantage, 935–936Compensating balance, 631, 686–688Competition, degree. See MarketsCompetitive advantage, 935–936Competitive bidding underwriting, 64Competitors, terms, 657Complementary projects, 363Component percentage, 722
ratios, 742–744Compound average annual return, 152Compound factor, 150
tables, 157–161Compound interest, 149, 680Compounding. See Continuous compounding
factor, 162frequency, 152–154, 157periods, 150, 152
number, determination, 163–164usage, 156, 185
Comprehensive income, 138Comptroller of the Currency, 50
Office, 60Concentration
banking, 642risk, 872
Conditional sale leases, 884Connor, Gregory, 300Conroy, Robert, 792Consensus earnings forecast, 783–784Consensus EPS, 786–787Construction
financing costs, 927phase. See Project financing
Consumer price index (CPI), 756Contingent projects, 363Contingent voting rights, 577Continuous compounding, 154Contracting costs
definition, 57reduction, 56–57
Contracts. See Forward contracts; Underlying forthe contract
Controlled disbursements. See DisbursementsConventional factoring, 707Conversion. See Preferred stock
premium, 575price, 507. See also Effective conversion price;
Markets; Stated conversion price
ratio, 506, 575value, 507, 575
Convertibility, 496. See also Bonds; Preferred stockConvertible bond, 72, 249, 506Convertible preferred stock, 575. See also Manda-
tory convertible preferred stockCopyrights, definition, 131Corporate bond, 248Corporate democracy, 543–545Corporate entities, tax considerations, 833–837Corporate finance, 3Corporate financing, 60Corporate income tax rates, 834–835Corporate taxable income, 110–111Corporations, 8–10
taxes, 116Correlation
coefficientdefinition, 288usage, 289
definition, 288Correspondent bank, 642Cost of capital. See CapitalCost of goods sold (COGS), 136, 376, 671, 732,
959. See also Average day COGSCost of products sold, 136Costco Wholesale, 754Counterparty, 86
risk, 87Coupon bonds, 232, 238–240, 845. See also Straight
couponCoupon rate, 227, 229, 235, 338
explanation, 498increase, 272usage, 503yield, relationship, 230
Coupons, 227, 498payment, creation. See Equity linked coupon
paymentreset formula, 500swaps. See Currencyusage, 31yield, 235
Covariancedefinition, 284dividing, 289
Covenants, 496, 511–512, 696inclusion. See Long-term debt; Short-term debt
Coverage ratios, 722, 744–746. See also Capitalexpenditures; Cash flow; Fixed charge cov-erage ratio; Interest
CPI. See Consumer price indexCragg, J.G., 789Credit. See Letter of credit; Revolving credit
backup line, 710capacity, preservation, 889–890costs, 652–657days, number, 659–660, 731effective cost, 691enhancement, 867, 874–877. See also External
credit enhancement; Internal creditenhancement
form, 874, 876exposures. See Project financing
Index Page 988 Wednesday, April 30, 2003 12:24 PM

Index 989
Credit (Cont.)extension, 655
reasons, 652impact objective, 924–925implicit cost. See Trade creditletter. See Letter of creditline, 696period, 663purchases, 693quality. See Collateralratings, 508–512risk, 267sources, 927spread, 70support. See Third-party credit supportterms, 657
equitability, 657unions, 58
Credit policies, 657–659benefits, 662change, 661–662
analysis, 661–662considerations, 663–664costs, 662–663establishment, 661–662
Credit Suisse First Boston (CSFB), 519–520Creditors, role, 849Creditworthiness. See Borrowers; Issuers
evaluation, 658Cross-currency pooling, 849Crossing networks, 41Crossover discount rate, 415Crossover rate, solution, 415CSFB. See Credit Suisse First BostonCumulative dividends, noncumulative dividends
(contrast), 574Cumulative preferred stock, 574Cumulative voting, 540–541Currency
bonds. See Dual currency bondscoupon swaps, 854exchange risk, 923forward contracts, 850futures contracts, 850option. See Asian currency option; Average rate
currency option; Lookback currencyoption
contracts, 854–855risk, 258, 275, 830–831
hedging, 850–855swaps, 99–100, 851–854
agreement, 852market, 854
transferring, restrictions, 640Current assets, 128–130, 733–735Current capital, 627Current liabilities, 132–133, 733, 734. See also
Other current liabilitiesCurrent ratio, 733Custom leases, 895Customers
cash flow patterns, 657goodwill, 668
Cybercash, 53
Davis, Henry A., 928, 929Day, George S., 937Days sales outstanding (DSO), 659Dealer
credit, 651functions. See Broker/dealer functionsmarket, definition, 36options, 90
Debentures, 501definition, 31
Debt. See Refinancing debt; Secured debtall-in-cost, 315cost, 311–318, 338–339displacement, dollar-for-dollar basis, 907equity, contrast, 583–587income, 603issue, 328leverage, 927liability. See Project debtofferings, yields, 338raising, cost, 334ratings, 508–512ratio, 585, 757retirement, 502–506risk. See Bad debtsservicing, 921
Debt obligations. See Short-term debtdefinition, 500meeting, 138overview, 487–489
Debt securities, 271interest promise, 231ranking, 212valuation, 227. See also Long-term debt securities
Debtholder, role, 31Debtor, 488Debt-to-assets ratio, 585, 742, 746Debt-to-equity ratio, 743, 746, 761, 899Declaration date, 546Default risk, 258, 267–268, 646Defeasance, 504–505Deferred annuities, valuation, 180–183Deferred charges, 128Deferred interest, 500–501
bonds, 500Deferred taxes, 133–134
liabilities, 114Deficit, 824Degree of financial leverage (DFL), 263–264, 267Degree of operating leverage (DOL), 259–262, 267Degree of total leverage (DTL), 266–267Delivery date, 84–85Delivery plan. See Three-day delivery planDell, cash flow, 141Delta Airlines, 946, 947Denominations. See BondsDeposit institutions, 58–61Depository institutions, 54Depository Institutions Deregulation and Mone-
tary Control Act of 1980 (DIDMC), 59Deposits, present value calculation, 167Depreciation, 110, 131, 372–374, 808. See also
Accumulated depreciation; Straight-linedepreciation
Index Page 989 Wednesday, April 30, 2003 12:24 PM

990 Index
Depreciation (Cont.)calculation, 732comparison, 373impact, 829–830recapture, 117, 366–368, 387schedule, 904tax shield, 116, 372, 377
change, 388timing, 116
taxation purposes, 113–116Derivative instruments, 32–33, 83, 522
usage. See BondsDerivatives
introduction, 83questions, 104–106
Detachable warrant, 248, 520DFL. See Degree of financial leverageDIDMC. See Depository Institutions Deregulation
and Monetary Control Act of 1980Digicash, 53Dill, David A., 903Diluted EPS, 782Dilutive securities, 780–783Direct cash flow. See LeasingDirect investments, 54. See also Indirect invest-
mentsDirect method, usage, 800Direct paper, 701Direct quotation, 829Directors. See Independent directors; Inside direc-
tors; Outside directorsDisbursements, control, 642–645Discount. See Underwriter discount
interest, 683–685percentage, 653period, 694rate, 52, 205, 414, 429. See also Adjusted dis-
count rate; Crossover discount ratecalculation, 238, 242, 597
window, 52Discount factor tables, 157–161Discounted basis, usage, 28Discounted cash flow techniques, 439Discounted payback
consideration. See Cash flow; Cash flow riskiness;Cash flow timing
consistency. See Owner wealth maximizationdecision rule, 406evaluation technique, 406–410period, 400, 405–410
Discountingfactor, 162usage, 156
Discounts, costs, 652–654Discretionary cash flow, 802Dispersion, 455–456Distress cost, theory/practice reconciliation. See
InterestDistributed profits, tax credit, 835Distributions. See StocksDiversifiable risk, 258, 290. See also Nondiversifi-
able riskDiversification, 281–292, 828
definition, 56, 288
risk, interaction, 282–290usage. See Risk reduction
Diversified portfolio, 324Dividend payout (DPO), 548–549
ratio, 220Dividend reinvestment plan (DRP), 549Dividend valuation method (DVM), 321Dividend Valuation Model (DVM), 213–220
estimates, reconciliation. See Capital Asset Pric-ing Model
usage, 340–341Dividend valuation model, usage. See Common
stockDividend-paying company, 835Dividends, 533, 546–565. See also Adjustable rate
dividends; Cash; Cumulative dividends; Fixeddividends; Noncumulative dividends
agency explanation, 557, 560components, 603contrast. See Cumulative dividendsdeclaration. See Preferred stockgrowth, 323, 344
rate, 216, 334. See also Future dividendsincrease, 561irrelevance theory, 557–558payment
mechanics, 546–547question, 557–561
policy, 553–561present value, 217puzzle, 561rate, 225reset spread, 573shift. See Stockssignalling explanation, 557, 559–560tax preference explanation, 557–559yield, 219–221, 224, 323, 558
Dividends per share (DPS), 548growth, 553
Dividends received deduction, 559Dividends-received deduction, 111–113Dodd, David L., 794DOL. See Degree of operating leverageDollar
interest, 712limit. See Capital budgetprincipal, 712worth, 147
Dollar net interest spread, 869Dollar-for-dollar gain/loss, 91Domestic commercial banks, 862Domestic currency, 640
relative value, 275Domino effect, 664Doubtful accounts, allowance, 129Dowen, Richard J., 778DPO. See Dividend payoutDPS. See Dividends per shareDrafts, 703Dravid, Ajay, 552Dreman, David N., 787DRP. See Dividend reinvestment planDSO. See Days sales outstandingDTL. See Degree of total leverage
Index Page 990 Wednesday, April 30, 2003 12:24 PM

Index 991
Du Pontcapital cost, example. See Capital costcapital, marginal cost estimation, 345system, 725–729
Dual currency bonds, 497Dually listed stocks, 39Dugan, Michael T., 815Dun & Bradstreet, 658Dutch auction, 500, 562DVM. See Dividend valuation method; Dividend
Valuation Model
EAR. See Effective annual rateEarnings
acceleration. See Financial reporting purposesanalysis, 775
questions, 796forecasts. See Consensus earnings forecastmanagement, potential, 776–780measures, 775–776momentum, 785quality, 811reporting, 776surprises, 777
market reaction, 778torpedo, 785yield, 792–793
Earnings before interest and taxes depreciation andamortization (EBITDA), 798–799, 814
Earnings before interest and taxes (EBIT), 137, 723,748, 776
calculations, 726–728, 744–745determination, 808
Earnings per share (EPS), 590, 780–783. See alsoActual EPS; Basic EPS; Consensus EPS;Diluted EPS; Primary EPS
contrast. See Sharesforecasting, 789–791indifference point, 592usage, 220–221
Eastman, Kent, 799Easton, Peter D., 779EBIT. See Earnings before interest and taxesEBITDA. See Earnings before interest and taxes
depreciation and amortizationE-cash, 53ECNs. See Electronic communications networksE-commerce leases, 892Economic and Monetary Union (EMU), 832Economic conditions, 452Economic life, 382
classification, 360–361Economic Order Quantity (EOQ) Model, 632, 666–
670Economic profit
accounting profit, contrast, 14–15definition, 14
Economic value-added (EVA), 15Economic well-being, measurement, 13–14EDS, spinoff, 538Edwards, J.D., 837EEC. See European Economic CommunityEffective annual rate (EAR), 185–187, 206–207
calculation, 682–692
Effective conversion price, 507Effective cost, 687Effective interest cost, 692Effective interest rates, annualized interest rates
(contrast), 185–187Efficient frontier, 291Efficient markets, 44–46
definition, 44interaction. See Shares
EFTA. See European Free Trade AssociationEI. See Employee involvementEisner, Michael (bonus payment), 776Electronic cash, 53Electronic collection, 642Electronic communications networks (ECNs), 41Elton, Edwin, 785, 792Embedded option, 72, 503Employee involvement (EI), 670Employment taxes, 107EMS. See European Monetary SystemEMU. See Economic and Monetary UnionEnd-of-period cash flow, 165, 206, 426Engineering phase. See Project financingEnron
bankruptcy, 928effect. See Project financing
Environmental Protection Agency (EPA), 362EOQ. See Economic Order QuantityEPA. See Environmental Protection AgencyEPS. See Earnings per shareEquipment
disposal, 387, 890–891, 913leases, types, 884–887obligation, 501setup charges, 382technical obsolescence, 923trust debt, 501
Equipment leasing, 883flexibility/convenience, 891–893impact. See Book earnings; Cash flowmaintenance problems, elimination, 892–893management, restrictions, 891questions, 914–916regulatory ease, 892
Equity, 29–30, 128, 134–136. See also Commonequity; Owner equity; Shareholders; Stock-holders
beta, 466–468specification, 467
book value, 134–136contrast. See Debtcost, 323
calculation, 343income, 603marginal cost, 331markets, 38–43risk takers, 919statement. See Shareholdersswaps, 519total debt-to-market value, 754
Equity linked coupon payment, creation, 519–520Equivalent loan, 907. See also Leases
concept, 908–910EU. See European Union
Index Page 991 Wednesday, April 30, 2003 12:24 PM
992 Index
Eurobonds, 495issue, cost calculation, 845–846market, 844–846
Eurodollars, 52bonds, 845–846CDs, 29
Euroequity issues, 844Euromarket, 839European Central Bank, 832European Economic Community (EEC), 832European Free Trade Association (EFTA), 826, 828European Monetary System (EMS), 832European option, 89
definition, 473European Union (EU), 826, 832Euros, 832–835Euroyen bonds, 845EVA. See Economic value-addedEvaluation techniques. See Capital budgetingEvent risk, 875Exchanges, 35–36. See also Stock exchanges
rates, 828–830risk, 830–831system. See Managed floating exchange rate
systemExchange-traded options, OTC options (contrast),
90–91Excise taxes, 107Ex-dividend date, 547Executive compensation, 19–21Executory costs, 896Exercise price, 89, 245, 473, 521Exercise value, 101Exotic options, 855Expansion
financing ability, 138projects, 361–362
Expected cash flow, 276, 435, 456Expected future cash flow, 416Expected return, 275–277, 281–292, 341. See also
Portfoliodefinition, 5impact, 257questions, 302–306
Expected risk-free rate, 344Expected value, 456–458Expenditures, 258Expenses
cash flow, change, 376change, 371, 377
Expiration date, 89Export taxes, 107Export-import quotas, 671Expropriation, 924External credit enhancement, 874External market, 837, 839
Fabozzi, Frank J., 219, 300, 791, 883, 918, 920,922–924, 927
Face value, 496definition, 28, 212
Facility leases, 895Factor, definition, 707
Factor model. See Fundamental factor model;Macroeconomic factor model; Statisticalfactor model
Factor tables. See Compound factor; Discount fac-tor tables
usage. See AnnuitiesFactoring, 707–708. See Conventional factoring;
MaturityFahey, Liam, 937Fair market value. See Leased assetFama, Eugene F., 44, 76, 795Farm Equip Corporation, 99FAS. See Financial Accounting StandardsFASB. See Financial Accounting Standards BoardFDIC. See Federal Deposit Insurance CorporationFederal Deposit Insurance Corporation (FDIC),
59, 60Federal Home Loan Bank Board, 58Federal income tax requirements. See True lease
transactionsFederal Open Market Committee (FOMC), 50–51Federal Reserve Board, 60Federal Reserve System, 49–53
money supply, interaction, 51–53Fiduciary duty, 18Field warehouse loan, 708–709FIFO. See First in, first outFinance, mathematics, 147
questions, 188–192Financial Accounting Standards Board (FASB),
505, 513, 925exposure draft (2002), 926recommendations, 799requirement, 617Statement No. 13, 889, 896Statement No. 94, 617
Financial Accounting Standards (FAS) No. 13,896–897, 902, 913
implementation, interpretation (role), 899–900Financial advisers, 894Financial analysis, 5
cash flow, usefulness, 811–816integrative example. See Wal-Mart Storesintroduction, 3issues, 847questions, 24–26worth, 45
Financial asset, 861Financial calculators, usage, 161–162, 204–205Financial condition, statement, 127–128Financial decision making, asset pricing (interac-
tion), 301Financial derivatives, usage. See Interest ratesFinancial distress, 584
costs, 606probability, 612relationship. See Capital structure
Financial futures, 84Financial insolvency, 924Financial institutions, 3, 53–67
definition, 33money (cost), 49
questions, 80–82services, 54
Index Page 992 Wednesday, April 30, 2003 12:24 PM
Index 993
Financial institutions (Cont.)specialized collateralized borrowing arrangement,
711–713types, 66–67
Financial intermediaries, role, 54–58Financial leverage, 584, 723. See also Degree of
financial leverage; Wal-Mart Storesratios, 742–747relationship. See Capital structure; Market riskrisk, relationship, 591–594
Financial management, 3–5. See also Internationalfinancial management
interaction. See Owner wealth maximizationintroduction, 3objective, 12–13questions, 24–26
Financial markets, access (increase), 843Financial modeling, 961–966Financial planning, 933. See also Long-term financial
planningbudgeting, relationship, 937–961practices, 966questions, 967–971seasonal considerations, 946–948
Financial position, statement, 128Financial ratio analysis, 721
questions, 765–774usage, 748–754Wal-Mart (1996-2001), example, 750
Financial ratios. See Wal-Mart Storesusage, 948
Financial reporting purposes, earnings acceleration,866, 868–871
Financial results, example, 141Financial risk, 258, 262–265, 467, 743
cost, 335impact, 558interaction. See Operating risk
Financial Services Modernization (FSM) Act of1999, 60
Financial slack, 619–620Financial statements, 125. See also Pro forma finan-
cial statementsfiling. See Securities and Exchange Commissionnotes, 143–144questions, 144–145
Financing. See Bank financing; Corporate financ-ing; Institutional financing; Long-termtake-out financing; Project financing;Secured financing; Unsecured financing;Individual financing
activitiescash flow, 140usage. See Cash flow
agreement, 928behavior, 618–619costs, 801. See also Construction; Inventoriesflexibility. See Businessmanagement. See Short-term financingobtaining, speed, 892sources, 811strategy, 934subsidiaries, 862types. See Inventories
Financing, source, 138Firm commitment, 62First in, first out (FIFO), 129, 776Fitch IBCA, 509, 646, 701, 808, 871
CFAR ratio, 813–814research reports, 808
Fixed asset turnover ratio, 741Fixed charge coverage ratio, 745, 746Fixed costs, 261Fixed dividends, 573Fixed exchange rate system, 829Fixed-rate bonds, 515, 518
floating-rate bonds, contrast, 514–515Fixed-rate payments, 515, 854Floaters. See Inverse floatersFloating exchange rate system, 829Floating lien, 708, 709Floating rates, 488–490, 500Floating-rate bonds, 518
contrast. See Fixed-rate bondsFloats, definition, 641Floor, 489
agreements, 101–103, 102motivation, 103planning, 708
Flotation costs, 314, 327, 560consideration, 346inclusion, 320payment, 319
FOMC. See Federal Open Market CommitteeFord Motor Company, 670Forecasted sales, usage, 950Forecasting. See Cash; Sales
ability. See Analystsregression, usage, 941–945
Forecasts. See Analysts; Managementerror, 943extrapolative statistical models, 789–792
Foreign commercial banks, 862Foreign currency, 828–833, 840
relative value, 275risk, 848
Foreign exchange risk, 852, 923Foreign market, 837Foreign tax credit, 835Form 10-K, 536Form 10-Q, 536Forward contracts, 84–89. See also Currency; Long-
dated forward contractscontrast. See Futures contracts
Forward market, 831Forward rates, 73–76
hedgeable rate, 76Forward start interest rate swap, 523Foster, Benjamin P., 816Franks, Julian R., 905Free cash flow, 560, 805–806. See also Net free
cash flowcalculation, 807–808usage, 812
Free trade, advocacy, 826French, Kenneth R., 794Frequency distribution, 464–465Fridson, Martin S., 802, 813
Index Page 993 Wednesday, April 30, 2003 12:24 PM

994 Index
FSM. See Financial Services Modernization Act of1999
Full payout leases, operating leases (contrast), 887Fully amortizing loan, 491Fundamental factor model, 300–301Funding costs
global market integration, implications, 841reduction, potential, 866–867
Funding sources, diversification, 866, 867Funds
all-in-cost, 845opportunity costs, 521, 662
Future cash flows, 357. See also Expected futurecash flow; Investment
estimation, 474present value, 224risk, 416uncertainty, 400
Future dividendsgrowth rate, 220–221, 340present value, 322
Future value (FV)annuity factor, 170–173calculation, 430, 434determination, 148–155
multiple rates, 154–155present value, contrast, 185value, 157
Futuresmarkets, 44price, 84trading, mechanics, 84–87usage. See Risk
Futures contracts, 84–89, 850. See also Currencycontrast. See Optionsforward contracts, contrast, 87options, difference, 98risk/return characteristics, 88
FV. See Future value
GAAP. See Generally accepted accounting principlesGATT. See General Agreement on Tariffs and TradeGDP. See Gross domestic product; Gross domestic
productionGeneral Agreement on Tariffs and Trade (GATT),
826General commercial partnership, 833General Electric
book value, 136earnings, 779
General Motors Acceptance Corporation (GMAC),664, 701
General Motors, class E share (exchange), 538General obligation bonds, 32General partnerships, 7Generally accepted accounting principles (GAAP),
125, 847Geometric average return, 151, 202–203Gesellschaft mit beschrankter Haftung (GmbH), 833Gibson Greetings, losses, 83GIC. See Guaranteed investment contractGlass-Steagall Act, 60, 61GLB. See Gramm-Leach-Bliley Act of 1999Global banking, 60
Global capital market, 839Global economy, 824–827Global equity market, 841–844Global market
financing, 837–846funds (raising), motivation, 839–841integration, implication. See Funding costs
GMAC. See General Motors Acceptance CorporationGmbH. See Gesellschaft mit beschrankter HaftungGold, Barry, 928Good faith money, 87Goods, credit/demand, 656–657Goodwill, 110. See also Customers
definition, 131Gordon, Myron, 215Gosh, Chinmoy, 555Gosman, Martin L., 777Government interference, 924Graham, Benjamin, 794Gramm-Leach-Bliley (GLB) Act of 1999, 60Grinblatt, Mark, 552Gross domestic product (GDP), 945Gross domestic production (GDP), 756Gross plant/equipment, 131Gross profit, 136, 748
margin, 736, 738Gross spread, 62Growth rate. See also Bell Atlantic
definition, 150discussion, 162
Gruber, Martin, 785, 792Guaranteed investment contract (GIC), 152Guarantees. See Third-party guaranteesGuideline lease, 885Gulf States Utilities, cash problems, 574Gultekin, M., 785
Half-year convention, 114Hamada, Robert S., 466, 468Hara, Lloyd F., 642Harris, Robert, 792Harris, Trevor S., 779Hawkins, Chuck, 936Hedgeable rates, 76. See also Forward ratesHedging, 831. See also Currency; Interest rates;
Long-dated foreign currency exposureHidden costs, 652High grade, definition, 70High quality. See BondsHigh-risk lending, 922High-yield bonds, 510Hirshleifer Company
facilities, replacement, 385–389integrative example. See Capital budgeting
Historical cost, 126Historical data
analysis, usage, 966usage, 945
HMFC. See Hyundai Motor Finance CompanyHodges, Stewart D., 905Holding cost, 632Hurdle rate, 469Hurley, William J., 219Hyundai Motor Finance Company (HMFC), 664
Index Page 994 Wednesday, April 30, 2003 12:24 PM

Index 995
IAS. See International Accounting StandardsIbbotson, Roger, 300I/B/E/S information, 788IBM
Global Financing, 863manufacturer-lessor, 890product development/introductions, 945sales, 944–945
IDRs. See International depositary receiptsImage-based processing, 644IMF. See International Monetary FundImplicit costs, 652, 690Implicit interest, 316
dependence, 317Import taxes, 107Income. See Interest; Net income
bonds, 501concept. See All-inclusive income conceptdetermination. See Taxable incomestatement, 136–138. See also Common size; Pro
forma income statementbypassing, 132
taxes, 107, 800Incorporation, articles, 8Incremental cash flows, 363–364, 399Incremental OCF, calculation, 384–385Indebtedness, 30–32, 488
certificates, 495Indenture, 244. See also Blanket indenture
agreement, 495–496Independent directors, definition, 8Independent finance companies, 862Independent projects, 363Indifference point. See Earnings per shareIndirect investments, 54Indirect method, usage, 800Indirect quotation, 829Individual banking, 59Inflation, impact, 274–275Information processing cost
definition, 57reduction, 56–57
Initial margin, 86, 87Initial public offering (IPO), 539, 844Inside information, definition, 45Insider directors, definition, 8Institutional banking, 59–60Intangible assets, 131Intercompany transactions, 836–837Interest. See Add-on interest; Deferred interest;
Discount; Single payment interestcost. See Effective interest costcoverage ratio, 744–746deductibility, capital structure (relationship), 598–
600expected risk free rate, 341expense, 801, 835–836income, 800payments, 249, 267, 497–501tax deductibility, 405, 613tax shield, 600–602. See also Present value of
the interest tax shielddistress cost, theory/practice reconciliation, 616–
618
taxability, 72value, 242
Interest on accumulated interest, 149Interest on interest, 149Interest rates, 452, 489–490. See also After-tax
interest rate; Base interest rate; Nominalinterest rate; Periodic interest rate
calculation, 67, 183–187contrast. See Effective interest ratescosts (hedging), financial derivatives (usage),
521–523determinants, 68determination, 162–163reset formula, 488risk, 258, 271–273, 646structure, 68–78swaps, 99, 516. See also Forward start interest
rate swapterm structure, 71–79yields, interactions, 67–68
Interest-earning asset, usage, 91Interest-free loan, 653Interest-only loan, 491Interest-only strip, 868–870, 879Intermediate debt, 487
questions, 528–532Intermediate-term debt, 892Internal credit enhancement, 874Internal market, 837Internal rate of return (IRR), 202, 308, 400, 420–
429. See also Investment; Modified inter-nal rate of return; Multiple IRR
capital rationing, 426–427consideration. See Cash flow; Cash flow riski-
ness; Cash flow timingconsistency. See Owner wealth maximizationdecision rule, 423–427evaluation technique, 427–428explanation, 911method, 441, 469mutually exclusive projects, 424–426program, 911representation, 422testing, 423
Internal return objectives, meeting, 926Internal Revenue Code (IRC), 108, 119–120, 900
Section 163, 598Section 172, 604
Internal Revenue Service (IRS), 108, 114, 501, 900requirements, 891Revenue Ruling 55-540, 901Revenue Rulings, 902
Internally generated funds, 618International Accounting Standards (IAS), 847International depositary receipts (IDRs), 843–844International financial management, 823
questions, 857–860International market, 839International Monetary Fund (IMF), 826In-the-money option, 246Intrinsic value, 95. See also OptionsInventories, 129, 375, 708–710
associated costs, 665–666change, 957
Index Page 995 Wednesday, April 30, 2003 12:24 PM

996 Index
Inventories (Cont.)cost, 666days, number, 671–672, 730, 733financing
cost, 709–710types, 708–709
holdingcosts, 665reasons, 664–665
management, 849model. See Just-In-Time Inventory Modelreordering cost, 669shortage, 667turnover
calculation, 749ratio, 671, 739, 741
Inventories management, 651, 664–672, 739models, 666–671
consideration, 670–671monitoring, 671–672questions, 673–678
Inverse floaters, 500Investing activities, usage. See Cash flowInvestment. See Capital; Long-term investment;
Reinvestment; Short-term investmentactivities, 800bankers, definition, 61banking, 61–64cash flow, 201, 364–366, 387–389
change, 411differences, 415
cash inflow, present value, 410companies, 66. See also Closed-end investment
companies; Open-end investment companiescost, 203decisions, 195, 357–358definition, 131determination. See Cashfuture cash flow, 412IRR, 421needs, 934opportunities, 270, 357, 474payback period, 404present value, 164, 197–199problems, 356–358profiles, 414–415projects, classification, 360–363
dependence classification, 362–363screening/selection, 359strategy, 933value, 282yield, 421
Investment returns, 195, 201–207, 222even cash flows, usage, 203–204no intermediate cash flows, usage, 201–203questions, 208–210uneven cash flows, usage, 204–205
Investment tax credit (ITC), 118–119Investment-grade bonds, 70, 510. See also Nonin-
vestment-grade bondsIPO. See Initial public offeringIRC. See Internal Revenue CodeIRR. See Internal rate of returnIRS. See Internal Revenue Service
Issued shares, 535Issuers
costs, understanding, 78–79definition, 61perceived creditworthiness, 70
Issuesexpected liquidity, 72underwriting, traditional process. See New issues
ITC. See Investment tax credit
Japanese Ministry of Finance, 838J.C. Penney, 754, 763Jensen, Michael, 608, 805JIT. See Just-In-TimeJob Creation and Worker Assistance Act of 2002, 114Joint venture, definition, 11Jointly owned projects, reasons, 920Jones, Charles P., 777Jones, Frank J., 300Junk bonds, 510Just-In-Time (JIT) Inventory Model, 669–670
Keefe, Victoria, 840KG. See KommanditgesellschaftKGaA. See Kommanditgellschaft auf AktienKmart, 754, 763, 935Kommanditgellschaft auf Aktien (KGaA), 833Kommanditgesellschaft (KG), 833Kwatinetz, Michael, 899
Largay III, J.A., 815Last in, first out (LIFO), 129, 776Latané, Henry A., 777Law of one price, 831Lead time, 668Leased asset, fair market value, 897Leases. See Net leases; Non-tax-oriented leases;
Synthetic leases; Tax-oriented true leasesaccounting. See Capital leases; Operating leasesborrow-to-buy decision, comparison, 903–912brokers, 894classification, 896comparison. See Alternative leasescontract, 912contrast. See Full payout leases; Single-investor
leasesdefinition, 133equivalent loan, 908expenses, 737payments. See Minimum lease payments; Periodic
lease payments; Tailor-made lease paymentsreduction, 885
programs, 894–895qualifications, 901term, 900transactions. See True lease transactions
lessees, financial reporting, 895–900types. See Equipmentvaluation, 903–912
approach, 911–912model. See Net present value
Leasing. See Captive leasingcompanies. See Specialized leasing companiescosts, 888–889
Index Page 996 Wednesday, April 30, 2003 12:24 PM

Index 997
Leasing (Cont.)direct cash flow, 903–907
valuation, 907–908process, explanation, 883–884reasons, 888–893
Lenderdefinition, 30relationship. See Risk
Lessees, 883financial reporting. See Leases
Lessors, 883types, 893–894
Letter of credit, 697Level payment, 490Leverage. See Degree of financial leverage; Degree
of operating leverageeffect, 591–592
quantification, 592–594Leveraged leases, 886–887
contrast. See Single-investor leasesLiabilities, 128, 132–134. See also Current liabili-
ties; Deferred taxes; Long-term liabilitiesLIBOR. See London Interbank Offered RateLife insurance companies, 67LIFO. See Last in, first outLimited liability, 535
impact, 612role, 606–609
Limited liability company (LLC), 10, 833formation, 8
Limited partnerships, 7, 833. See also Master lim-ited partnership
Line of credit. See CreditLiquid assets, 729Liquidation value, 572. See also Preferred stockLiquidity, 729–736. See also Issues; Wal-Mart
Storesmeasures, 733–735ratios, 735–736, 815risk, 646theory, 77–78
Listed stocks, 38. See also Dually listed stocksLLC. See Limited liability companyLoan
amortization, 174amount, 698definition, 488origination fee, 688payments, determination, 908
Local taxes, 120–121Lockboxes
advances, 644–645networks, 644system, 641, 643–644. See also Nonbank lock-
box systemsLogue, Dennis E., 543London Interbank Offered Rate (LIBOR), 99, 102,
489–490LIBOR-based financing, 854one-year, 100quoted rates, 695six-month, 516–518usage, 500
London Stock Exchange, 842
Long call position, 92Long futures, 88Long position, 88Long put position, 93Long-dated foreign currency exposure, hedging, 850Long-dated forward contracts, 851Longer-term borrowing, 891Long-run planning, 938Long-term contract, 274Long-term debt, 336, 487, 617, 747, 926
change, 957covenants, inclusion, 958current portion, 132questions, 528–532reliance, 763
Long-term debt securities, valuation, 226–245Long-term financial planning, 961Long-term indebtedness, 132Long-term investment, 360Long-term liabilities, 133Long-term planning, 938Long-term prepaid expenses, 131–132Long-term take-out financing, 922Long-term trends, projection, 945Long-term U.S. Treasury bond, yield, 469Lookback currency option, 855Lublin, Joann S., 20
M1, components, 51M2, components, 51M3, components, 51Maastricht Treaty, 826, 832Macroeconomic factor model, 300MACRS. See Modified accelerated cost recovery
systemMail interception, 644Maintenance margin, 86Maintenance problems, elimination. See Equipment
leasingMalatesta, Paul H., 545Malkiel, Burton, 789Managed floating exchange rate system, 829Management
character, 510forecasts, 946performance, evaluation, 935personnel, 922
Manager motivation, 19–21Mandated projects, 361Mandatory convertible preferred stock, 576Margin. See Initial margin; Maintenance margin;
Quoted margin; Variation marginrequirements, 86–87
Marginal corporate tax rate, 615Marginal cost. See Capital; Equity; StocksMarginal efficiency. See CapitalMarginal tax rate, 109, 311, 601, 904
increase, 616Markel, F. Lynn, 389Market efficiency
semi-strong form, 45strong form, 45weak form, 45
Market risk, 295, 297, 324. See also Projects
Index Page 997 Wednesday, April 30, 2003 12:24 PM

998 Index
Market risk (Cont.)compensation, 470contrast. See Stand-alone riskestimation, 465–466financial leverage, relationship, 466–468premium, 295, 325
Market value, 13, 336. See also Common stock;Preferred stock; Shareholders
contrast. See Book valueproportions, usage, 337
Market value added (MVA), 15Marketability risk, 43Marketable securities, 129, 375, 627, 645–647
questions, 648–651risk, relationship, 645–646types, 646–647
Marketsactivity, statistical data, 839competition, degree, 360conditions, 452conversion price, 575equilibrium, 200financing. See Global marketindicators. See Stocksinteraction. See Securitiesline. See Capital market line; Security Market Lineportfolio, 294purchases. See Open market purchasesquestions, 47–48reaction. See Stockssecurities. See Capital market securities; Moneysegmentation theory, 78share, 763surveys, 945–946
Marking a position to market, 86Marking to market, 86Markowitz, Harry M., 292, 300Master leases, 892, 895Master limited partnership, 10Masulis, Ronald H., 552, 603Matching principle, 126Material adverse change, 702Mattel, Inc., 679–680
Annual Reports (1991 / 2001), 359Maturity. See Original maturity; Term to maturity;
Yield-to-maturityapproaching. See Bondsdate, 497
definition, 28factoring, 707intermediation, 55–56length. See Borrowingspread, 71value, 228, 242, 496
definition, 28McConville, Daniel J., 814McNichols, Maureen, 552Meckling, William H., 608Merchandise credit, 651Merchant banking, 61Mergers, 763Microsoft Corporation, EPS, 783Miller, Merton H., 557, 559, 594, 595, 603, 637
Model. See Modigliani & Miller Model
Miller-Orr Model, 632, 637–640limits, 637–639
Minimum lease payments, 897–899present value, 897
MIRR. See Modified internal rate of returnM&M. See Modigliani & Miller ModelMMDAs. See Money market deposit accountsModel Business Corporations Act, 9Modern Portfolio Theory (MPT), 290–301Modified accelerated cost recovery system (MACRS),
113–114, 372usage, 380, 385
Modified internal rate of return (MIRR), 207, 269,400, 429–436
capital rationing, 439consideration. See Cash flow; Cash flow riskiness;
Cash flow timingconsistency. See Owner wealth maximizationdecision rule, 434–435evaluation technique, 435–436mutually exclusive projects, 438–439
Modigliani & Miller (M&M) Model, 594–595Modigliani, Franco, 557, 594, 595Monetary policy, 49Money. See Good faith money
cost, 67–79. See also Financial institutionsfuture, 53supply
definition, 51interaction. See Federal Reserve System
time value, 219, 245, 400, 416, 469Money center banks, 38Money market deposit accounts (MMDAs), 52Money market instruments
definition, 500usage, 500
Money market securities, 699–705Money markets, 38
funds, 66mutual funds, 52securities, 28–29
Monitoring costs, 560Monsanto, sweetener division sale, 936Moody’s Investors Service, 508–509, 646, 701, 871Mortgage, 501Motorola, cash flow, 141Multifactor risk models, 299, 340Multinational companies, 827Multinational firms, 827–828Multiple IRR, 428–429Multiple rates. See Future valueMurphy, Mary G., 777Mutual funds, 66. See also Money marketsMutual savings banks, 58Mutually exclusive projects, 363, 419. See also
Internal rate of return; Modified internalrate of return
MVA. See Market value addedMyers, Stewart C., 471, 619, 903, 907
NAFTA. See North American Free Trade Agree-ment
National Association for Security Dealers Auto-mated Quotation (NASDAQ), 540
Index Page 998 Wednesday, April 30, 2003 12:24 PM

Index 999
National Conference of Commissioners of UniformState Laws, Model act, 9
National market, 837Nationally Recognized Statistical Rating Organi-
zations (NRSROs), 508, 571, 701–702NCFs. See Net cash flowsNegotiable CDs, 28–29Net accounts receivable, 129Net cash flows (NCFs), 379Net free cash flow (NFCF), 808–811Net income, 748, 958Net interest spread, 868Net leases, 884. See also Triple net leaseNet operating cycle, 630, 733Net operating loss, 604
carrybacks, 119–120Net plant assets, 131Net plant/equipment, 131Net present value (NPV), 400, 410–412, 904. See
also Certainty equivalents; Strategic NPVconsideration, 416. See also Cash flow; Cash
flow riskiness; Cash flow timingconsistency. See Owner wealth maximizationdecision rule, 412–416evaluation technique, 412–414lease valuation model, 912technique, 475, 912
Net profit margin, 727–728, 738Net working capital, 374, 729
change, 388Net working capital-to-sales ratio, 734, 735Nevitt, Peter K., 883, 918, 920, 922–924, 927New issues, underwriting (traditional process), 61–62New York Stock Exchange (NYSE), 540, 842, 844NFCF. See Net free cash flowNike, 946, 947Nominal interest rate, 183–184Nominal rate, 682Nonbank lockbox systems, 644Non-cash expenses, 808Noncumulative dividends, contrast. See Cumulative
dividendsNoncumulative preferred stock, 574Noncurrent assets, 128, 130–132Nondiversifiable risk, 258, 290Nondividend-paying stocks, 558Noninvestment-grade bonds, 70, 510Nonoperating cash flows, 951Nonparticipating preferred stock, contrast. See
Participating preferred stockNonresident corporations, 121Non-Rule 144A offerings, 66Non-tax-oriented leases, 884–885, 888, 913Nontaxpaying position, 905Non-traditional maturities, 497Non-U.S. exchange-listed companies, 847Non-U.S. taxation, 121–122No-par stock, 535Norsk Data, 842North American Free Trade Agreement (NAFTA),
826–828Notes, 495–526. See also Secured notes
bonds, distinction, 31holder, role, 31
Notional amount, 98–102Notional principal amount, 98NPV. See Net present valueNRSROs. See Nationally Recognized Statistical
Rating OrganizationsNutraSweet Company, 936NYSE. See New York Stock Exchange
Observed capital structures, 617–618Obsolescence, 360
risk, 890–891elimination, 913
Occupational Health and Safety Agency (OSHA),362
OCFs. See Operating cash flowsOEA, Inc., 811–813OECD. See Organization on Economic Cooperation
and DevelopmentOff-balance sheet, 924Off-balance sheet SPVs, 928Offene Handelgellschaft (oHG), 833Office of Thrift Supervision, 58Office rent, 737Offshore leases, 895Offshore market, 839oHG. See Offene HandelgellschaftOhlson, James A., 779Open market operations, 52Open market purchases, 562Open-end investment companies, 66Operating activities, 374
usage. See Cash flowOperating cash flows (OCFs), 260, 364, 370–374,
388–389calculation. See Incremental OCFchange, calculation, 377–379reduction, 266
Operating costs. See Wal-Mart StoresOperating cycle, 729–733, 735. See also Net oper-
ating cycleOperating earnings, 137, 723
taxes, deductions, 810Operating income, 137Operating leases, 897. See also Cancelable operat-
ing leaseaccounting, 897contrast. See Full payout leases
Operating leverage, 265, 611–612. See also Degreeof operating leverage
Operating loss carrybacks. See Net operating lossOperating profit, 137
margin, 726, 737–738Operating project. See Turn-key operating projectOperating risk, 258, 259, 357, 611
financial risk, interaction, 265–267Operational budgeting, 938Opportunity cost, 91, 362, 370. See also Cash;
FundsOptimal capital budget, 333Optimal capital structure, 614Options, 89–98, 576–577. See also At-the-money
option; In-the-money option; Real optionscash flow characteristics, 211–225challenges, 476–477
Index Page 999 Wednesday, April 30, 2003 12:24 PM

1000 Index
Options (Cont.)contracts. See Currencycontrast. See Exchange-traded optionsexercising, 246expiration, 472futures contracts, contrast, 91inclusion, 71intrinsic value, 96–97markets, 44premium, 89price, 89
components, 95–97purchase. See Call options; Put optionsreturn characteristics, 91–95risk characteristics, 91–95time premium, 97usage. See Riskvaluation, 211, 245–250
question, 251–256writer, 89writing/selling. See Call options; Put options
Ordering cost, 665–666Ordinary annuity, 170, 179
present value, determination, 181Organization on Economic Cooperation and Devel-
opment (OECD), 836Original maturity, definition, 28Originators, 863Orr, Daniel, 637. See also Miller-Orr ModelOSHA. See Occupational Health and Safety AgencyOster, Patrick, 936Other assets, 128Other current liabilities, 130Out-of-pocket costs, 619Out-of-the-money options, 782Outside directors, 543
definition, 8Outstanding shares, 536Overcollateralization, 875Over-depreciating, 117Overnight repo, 711Over-the-counter (OTC) contract, 99Over-the-counter (OTC) instrument, 87Over-the-counter (OTC) markets, 35–36, 40, 90, 855Over-the-counter (OTC) options, contrast. See
Exchange-traded optionsOver-the-road vehicles, tax-oriented TRAC lease,
884Owner equity, 583Owner wealth, increase, 413Owner wealth maximization, 357–358, 420, 661,
936–937discounted payback consistency, 410financial management, interaction, 16–17IRR consistency, 428MIRR consistency, 436NPV consistency, 413–414payback, consistency, 404PI consistency, 418–420
Palmon, Dan, 899Par value, 134, 496, 535. See also Bonds; Collat-
eral; Preferred stockdefinition, 28
trading, 318Participating preferred stock, nonparticipating
preferred stock (contrast), 574–575Partnerships, 7–8. See also General partnerships;
Limited partnerships; Master limited part-nership
Patents, definition, 131Payables, days (number), 732Payback
consideration. See Cash flow; Cash flow riski-ness; Cash flow timing
consistency. See Owner wealth maximizationduration. See Post-payback durationperiod, 400, 402–405. See also Discounted pay-
back; Investmentdecision rule, 403evaluation technique, 404
Paymentdate, 546delinquencies, 873mechanism
definition, 57providing, 57–58
structure, 873Payoff period, 402Payout ratio, 553P/E. See Price-earningsPecking order, 619Penny stocks, 40, 552Pension funds, 66Percent-of-sales method, 959–960Perfect market, 557, 595Performance shares, 19Periodic interest rate, 154Periodic lease payments, 903Periodic payments, 925Permanent working capital, 679Perpetual annuity, present value, 178Perpetual preferred stock, 318, 572Perpetual warrants, 520Perpetuity, definition, 177Personal taxes, capital structure (relationship), 602–
603Peterson, David, 552, 559Peterson, Pamela, 552, 559Pettit, Richardson, 555P&G. See Procter & GamblePhilbrick, D.R., 788Physical deterioration, 360PI. See Profitability indexPier 1 Imports, losses, 83Planning process, evaluation, 935Pohlman, Randolph A., 389Poison puts, 506Political hurdles, reduction, 828Political risk, 848Portfolio. See Diversified portfolio
assetstandard deviation, 287weight, 287
definition, 280diversification, 454expected return, 298risk, 258, 290–292
Index Page 1000 Wednesday, April 30, 2003 12:24 PM

Index 1001
Portfolio (Cont.)size, 290–292standard deviation, 287–288variance, 287
Position, liquidation, 85Positive net present value projects, 805Post-auditing, 935Post-completion audit, 360Post-payback duration, 403Post-retirement, 133PPP. See Purchasing power parityPrecautionary balance, 631Preemptive rights, 542
offering, 65Preferred dividend arrearages, 574Preferred equity, cost determination, 318Preferred habitat theory, 77–78Preferred stock, 336, 571. See also Auction; Con-
vertible preferred stock; Cumulative pre-ferred stock; Noncumulative preferredstock; Perpetual preferred stock; Remar-keted preferred stock
call features, 576–577callability, 576contrast. See Participating preferred stockconversion, 576–577convertibility, 575–576corporate use, 578–579cost, 318–320, 339cumulative feature, 212definition, 30dividends, 211, 776
declaration, 572–575features, 572–578liquidation value, 572market value, 337origination, 571packaging features, 578par value, 572questions, 580–582share, value, 225–226valuation, 225–226voting rights, 577
Premium. See Market risk; Riskreceiving. See Callsvalue, 228
Prepaid expenses, 130Prepayment risk, 258, 270Present value of the interest tax shield (PVITS),
601–602Present value (PV), 13, 148, 364, 436. See also
Cash flows; Future dividends; Investment;Minimum lease payments
annuityfactor, 170–173, 422table, usage, 421
calculation, 182. See also Depositscontrast. See Future valuedetermination, 155–162. See also Ordinary
annuityprojects. See Positive net present value projectsusage. See Perpetual annuityvalue, 157
Prevalence, 11–12
Price elasticity, 656Price-earnings (P/E) ratio, 218, 792–795Primary EPS, 782Primary markets, 33–35
definition, 35regulation, 62–647
Prime. See BondsPrime rate, 695Principal
amount, 226–227definition, 17, 28, 488payments, 249, 267repayment. See Scheduled principal repayment
Principals (owners), 560Private corporation, 536Private placement, 33. See also Securities
definition, 65Privately-held corporation, 536Pro forma balance sheet, 955Pro forma financial statements, 955, 965Pro forma income statement, 955Probability distribution, 279, 955
comparison, 459specification. See Taxation/taxes
Procter & Gamble (P&G)capital investment, 807–808cash flows, 800–802
relationship, 807depreciation/amortization, 807fiscal year, 800, 809income taxes, 810losses, 83
Productioncosts, 371
change, 737efficiency, achievement, 828
Professional corporation, 10Profit margin. See Gross profit; Net profit margin
ratios, 736Profitability. See Wal-Mart Stores
ratios, 736–739, 815Profitability index (PI), 400, 416–420
consideration. See Cash flow; Cash flow riskiness;Cash flow timing
consistency. See Owner wealth maximizationdecision rule, 417evaluation technique, 417–420method, 438
Profit/loss (P&L) statement, 136Progressive tax, 109Project debt, liability, 925Project financing, 917
benefits, 927construction phase, 921credit exposures, 920–922definition, 918–919disincentives, 928engineering phase, 920, 921Enron, effect, 928–929key elements, 922–923operations, 921questions, 930–931risk phases, 920–921start-up financing, 920, 921
Index Page 1001 Wednesday, April 30, 2003 12:24 PM

1002 Index
Projected benefit obligation, 133Projects. See Complementary projects; Contingent
projects; Expansion; Independent projects;Mandated projects; Replacement projects
cash flows, 389delay, risk, 923economics, 920failures, causes, 923–924finance, 917market risk
measurement, 465–469required return, 470
risk, 434, 442assessment, 478–480measurement, 455–469
stand-alone risk, measurement, 455–465tracking, 359
Promoters, 918Property taxes, 896Property-casualty insurers, 67Prospectus, analysis, 62–63Proxy
card, 540fight, 545statement, 540
Public corporation, 536definition, 9
Public warehouse loan, 709Publicly held corporation, definition, 9Publicly-held corporation, 536Publicly-traded corporations, 537Purchase option, absence, 897Purchases, days (number), 949Purchasing power parity (PPP), 831–832
variation, 832Purchasing power risk, 258, 274–275, 646Pure auction process, 36Pure expectations theory, 77Pure-play, usage, 468–469Put options, 89, 247
definition, 473purchase, 93–95writing/selling, 95
Put position. See Long put position; Short put positionPut provision, 72, 502, 505–506Putable bond, 249, 505PV. See Present value
Qualcomm, 777Quality spread, 70Quantum Corporation, Annual Report (1996), 358Quick ratio, 734Quoted margin, 488
Railroads, creditors, 571Range. See Cash flow risk
definition, 278Rating. See Credit; Debt
agencies, 508considerations. See Asset-backed securities
assigning, factors, 510–512systems. See Bonds
Ratios. See Activity ratios; Component percentageratios; Coverage ratios; Financial leverage;
Liquidity; Profitability; Return-on-invest-ment ratios
analysis, 812–814. See also Financial ratio anal-ysis
classification, 721–723selection/interpretation, 753–754
Real estate investment trust (REIT), 66Real options, 471–474
example, 474–476Real options valuation (ROV), 471–472Realized returns, 235–237Real-world capital markets, 841Receivables
assignment, 706averages, 660management, 651–664
questions, 673–678Record date, 546Red herring, 63Reference rate, 99, 488Refinancing debt, 615Refunding. See Bond issuesRegistered bonds, 495Regression
line, 941–943calculations, 343
usage. See ForecastingRegulated entities, 866Regulation D, 65Regulatory hurdles, reduction, 828Regulatory problems, 927Reinvestment
annual percentage, 432–433assumption, 205–207plans. See Dividend reinvestment planrate risk, 268–270, 646risk, 258, 268, 513
REIT. See Real estate investment trustRelevant risk, 293Remarketed preferred stock, 573Remote disbursement, 642Rendleman, Richard J., 777Repatriation, restrictions, 848Repayment schedule, 490–494Replacement projects, 361–362Repo. See RepurchasesRepurchases. See Stocks
agreement (repo), 705, 711–713rate, 711
date, 711price, 711
Required rate of return (RRR), 213, 221, 225, 453.See also Returns
explanation, 357, 405usage, 315
Required return. See Project market riskResearch and development (R&D), 474–477Reserve account, 875Reserve funds, 876–877Reserve requirement, 52Reset
date, 488period, 488spread. See Dividends
Index Page 1002 Wednesday, April 30, 2003 12:24 PM
Index 1003
Residual loss, 19Residual value, 885Resources
access, 828allocation, 937
Restricted stock grant, 19Retained earnings, 135–138, 320, 327Retained funds, 321Return on assets, 723–724, 727–728Return on equity, 724Return on investments, 431. See also Investment
returnsReturn-on-asset ratios, 723–724Return-on-investment ratios, 723–729Returns. See Bonds; Common stock; Realized
returns; Wal-Mart Storescharacteristics. See Futures contracts; Optionscovariance, 289definition, 151form, 201internal rate. See Internal rate of returnobjectives, meeting. See Internal return objec-
tivesrate. See Internal rate of return; Modified inter-
nal rate of return; Required rate of returnratio, 722required rate, 219–220risk, interaction, 275–279
outcomes, standard deviation (usage), 277–279
Revenue bonds, 32Revenue Rulings. See Internal Revenue ServiceRevenues, 258
change, 370–371, 377, 384generation, 136
Reverse stock split, 551Revolving credit, 696
agreement, 696Ricardo, David, 935Ricks, W.E., 788Rights
definition, 248offering, 542. See also Preemptive rights
Risk. See Cash flow risk; Interest rates; Purchasingpower risk; Reinvestment; Relevant risk
assessment. See Projectsaversion, 199, 280–281bearing, return/tolerance, 280–281characteristics. See Futures contracts; Optionsclassification, 361–362compensation, 301contrast. See Stand-alone riskcontrol instruments, 32explanation, 5, 257, 451–452hedging. See Currencyimpact, 257–275, 281–292incorporation. See Capital budgetinginteraction. See Diversification; Returnslevels, 478management
futures, usage, 88–89options, usage, 97–98
measurement. See Project market risk; Projectsmodels. See Multifactor risk models
neutrality, 281periods, lenders (relationship), 921–922phases. See Project financingpreference, 280premium, 69–72, 294, 596–598
explanation, 453representation, 325
questions, 302–306reduction, diversification (usage), 56relationship. See Capital budgeting; Cash flow;
Financial leverage; Marketable securitiestakers. See Equitytime value, 219
Risk-adjusted rate, 469–471Risk-free asset, 293Risk-free rate. See Expected risk-free rateRoll, Richard, 300Ross, Stephen A., 299ROV. See Real options valuationRRR. See Required rate of returnRule 144A offerings, 66. See also Non-Rule 144A
offeringsRule 415 registration, 63Ryngaert, Michael, 545
SA. See Societe annonymeSaatchi & Saatchi, 842Safety stock, 637, 668Salary, compensation, 19Sale-and-leaseback transactions, 895Sales
cost, 136forecasting, 940–946generation, 136growth, 944leases. See Conditional sale leasesprice, changes, 737risk, 258, 357, 611volume, changes, 737
Sales to inventory ratio, 739Salomon Smith Barney, 928Sampling distribution, 465Sam’s Clubs, 754Samson, William D., 815Santiago, Emmanuel S., 389SARL. See Societe a responsabilitie limiteeSavings and loan (S&L) associations, 58Savings deposit, 52Scale differences, 438–439Scenario analysis, 461Scheduled principal repayment, 491Schlitz Brewing Company, 937Scholes, Myron, 472, 559Scott Paper, 842SCPA. See Societe en commandite par actionsSCS. See Societe en nom collectifSears Roebuck and Company, 754, 763, 939–940Seasonal considerations. See Financial planning;
Strategy planningSEC. See Securities and Exchange CommissionSecondary markets, 33–35
definition, 34–35Secured bonds, 31Secured debt, 489
Index Page 1003 Wednesday, April 30, 2003 12:24 PM

1004 Index
Secured financing, 705–710Secured loan, 690Secured notes, 31Securities, 27–29. See also Asset-backed securities;
Dilutive securitiescash flow characteristics, 211–225creation. See Synthetic fixed-rate security; Syn-
thetic floating-rate securitymarkets, 33–46
definition, 28interaction, 27
private placement, 65–66questions, 47–48valuation, 211. See also Long-term debt securi-
tiesquestions, 251–256
Securities Act of 1933, 62, 65Securities and Exchange Commission (SEC), 10,
127, 495, 701financial statements, filing, 537petition, 544regulations, 62, 892Rule 14a-6/14a-7, 540
Securities Exchange Act of 1934, 65, 540Regulation 14A, 540Rule 14a-8, 544
Securitization, 32absence, 871
Security. See BondsSecurity Market Line (SML), description, 296Seller/servicer, quality, 871, 873Semiannual U.S. coupon payments, 852Senior bond classes, 865Seniority. See Bonds
level, 710Senior-subordinate structure, 865, 875–876Sensitivity analysis, 461–463, 954
usage, 460Serial debt issue, 496Servicers. See Backup servicerServices, credit/demand, 656–657Servicing, 863–864Settlement date, 84–85Setup charges. See Buildings; EquipmentSet-up expenditures, 364Seward, James K., 543Share price volatility. See Common stockShareholders, 533
available earnings. See Common shareholdersbase, increase, 843definition, 8, 29equity, 128
impact. See Balance sheetmarket value, 13statement, 143
rights plans, 545wealth maximization, 21, 961
capital, marginal cost, 333social responsibility, 22–23
Shares. See Outstanding shares; Performance sharesdefinition, 8number, 535–536. See also Treasury stock
authorization, 135issued/outstanding, 135
priceearnings per share (contrast), 14–15efficient markets, interaction, 16
repurchase. See Targeted share repurchasestated value, 134
Sharpe, William F., 292, 293Shiller, Robert J., 793Short call position, 93Short futures, 88Short position, 88Short put position, 95Short-term basis, 849Short-term construction lenders, 922Short-term debt
covenants, inclusion, 958obligation, 487
Short-term financing, 939actual costs, 710–711costs, 680–689management, 679
questions, 714–718Short-term investment, 360, 954Short-term loans, 132Short-term security, 701Sight draft, 703Signalling explanation. See DividendsSilver, Andrew A., 861Simple interest, 149, 680Simulation analysis, 464–465, 954Single payment interest, 683Single payment loan, 683, 695Single-investor leases, 913
leveraged leases, contrast, 886–887Sinking fund, 503–504, 577–578, 745
call price, 504, 577payments, 267provision, 502requirement, 503
Size effect, 299Small-ticket retail market, 888Smith, Kimberly J., 391SML. See Security Market LineSocial responsibility. See ShareholdersSociete a responsabilitie limitee (SARL), 834Societe annonyme (SA), 834Societe en commandite par actions (SCPA), 834Societe en nom collectif (SCS), 834Software packages, 965Sole proprietorships, 6S&P. See Standard & Poor’sSPE. See Special purpose entitySpecial purpose entity (SPE), 917
consolidation, 926Special purpose vehicle (SPV), 864, 867, 917. See
also Off-balance sheet SPVsSpecialist, definition, 36Specialized collateralized borrowing arrangement.
See Financial institutionsSpecialized leasing companies, 893Speculative balance, 631Speculative bonds, 510Sponsored projects, reasons, 920Sponsors, 918Spot rates. See U.S. Treasury
Index Page 1004 Wednesday, April 30, 2003 12:24 PM

Index 1005
Spreadsheet programs, usage, 313SPV. See Special purpose vehicleStaggered board of directors, 541Stand-alone risk
market risk, contrast, 453–454measurement. See Projects
Standard & Poor’s (S&P), 509, 646, 871500 Stock Index, 342, 519, 788Daily Stock Price Record, 339P/E, usage, 783
Standard deviation, 457. See also Cash flow riskcalculation, 279–280, 288definition, 278interaction. See Varianceinterpretation, 465usage. See Returns
Standard lease, provisions, 894–895Standby underwriting arrangement, 64Start-up period, 924Start-up phase. See Project financingState taxes, 120–121Stated conversion price, 506Stated rate, 682Stated value, 535, 572. See also Common stock; SharesStatement of Financial Accounting Standard (SFAS)
No. 4, 526No. 52, 847No. 76, 505No. 95, 799No. 109, 111No. 128, 782
Statistical data. See MarketsStatistical factor model, 300Statistical measures. See Cash flow riskStatistical models, extrapolation. See ForecastsStewart III, G. Bennett, 15Stickney, C.P., 815Stockbrokers, commission, 223Stockholders, 533
equity, 128Stock-out, allowance, 668Stocks. See Classified stocks; Dually listed stocks;
Listed stocks; Penny stocksappreciation right, 19classification, 538–539distributions, 550–553
market reaction, 552–553dividends, 550–551
shift, 551exchanges, 39grant. See Restricted stock grantmarket indicators, 41–43option, 19ownership, 535–538prices, 779purchasing right, 542–543repurchases, 561–565
methods, 561–563reasons, 563–565
return, sensitivity, 341schedule, marginal cost, 330split, 551–552. See also Reverse stock splitvaluation. See Common stock; Preferred stock
Stojanovic, Dusan, 702
Straight coupon, 227, 498bond, 228–234
Straight-line depreciation, 114Strategic NPV, 472Strategic plan, 933Strategy, 935–937
comparative/competitive advantages, 935–936Strategy planning, 933
questions, 967–971seasonal considerations, 946–948
Strike price, 89, 246, 473Structured finance transactions
borrowing, 861questions, 880–881
definition, 861–863example, 877–879illustration, 863–865usage, reasons, 865–871
Structured financing, 861Structured note, 516Subordinate bond classes, 865Subordinated bond, 502Subscription price, 64Succursale, 834Sunk cost, 365Supervoting shares, 539Swaps, 98–101. See also Commodity; Currency
swaps; Interest ratesinterpretation, 100–101rate, 523spread, 523
Swary, Itzhak, 555Syndicated bank loan, 30Synthetic fixed-rate security, creation, 516–518Synthetic floating-rate security, creation, 516–518Synthetic leases, 902Systematic risk, 295. See also Unsystematic risk
Tailor-made lease payments, 891Take-and-pay contract, 925Take-or-pay contract, 925Target Stores, 754, 763Targeted block repurchase, 563Targeted share repurchase, 563Tax credit. See Distributed profits
illustration, 904Tax expense, deferment, 810Tax Reform Act of 1986, 604, 834Taxable income, determination, 835–837Taxation/taxes, 107, 848. See also Deferred taxes;
Local taxes; Non-U.S. taxation; Progres-sive tax; State taxes
basis, 366bracket, 108capital structure, relationship. See Personal taxeschange, 371–374clientele, 559code, change, 391considerations, 927. See also Corporate entitiescredits, 118–119, 364deductibility. See Interesthavens, 122, 834law. See U.S. taxation lawpreference explanation. See Dividends
Index Page 1005 Wednesday, April 30, 2003 12:24 PM

1006 Index
Taxation/taxes (Cont.)purposes. See Depreciationquestions, 122–124rates. See Average tax rate; Corporate income
tax rates; Marginal tax rate; U.S. federaltaxation rates
probability distribution, specification, 463relationship. See Capital structureshield, 367. See also Depreciation; Interest;
Present value of the interest tax shield;Unused tax shields
Tax-oriented leases, 888. See also Non-tax-ori-ented leases
Tax-oriented TRAC lease. See Over-the-road vehiclesTax-oriented true leases, 885–887, 900, 913T-bills. See U.S. TreasuryTechnical obsolescence. See EquipmentTechnology. See Untested technology
access, 828Temporary working capital, 679Tender offer, 561–562Term loans, 489–494Term repo, 711Term structure. See Interest rates
shape, determinants, 76–78Term to maturity, 70–71, 496–497Terminal value, 436Texaco, bankruptcy, 610Therrien, Lois, 936Thin capitalization, 836Third-party credit support, 862Third-party guarantees, 862, 874–875Three-day delivery plan, 547Tiers, 702Time deposit, 52Time draft, 703Time patterns, usage. See Cash flowTime premium, 95. See also OptionsTime to maturity, 245Time value. See Cash flow; Money; RiskTime Warner, offering, 543Times interest-covered ratio, 744Timing, 780, 781Titman, Sheridan, 552Total asset turnover ratio, 740–741Total debt-to-assets ratio, 742Total quality control (TQC), 670Total risk, 453Toys ’R Us, 672TQC. See Total quality controlTrade credit, 651, 690–695, 763
cost, 690–692implicit cost, 655–656
Tradeoff theory, 617–618Tranches, 844, 864Transactions
balance, 631cost, 633
avoidance, 849demand, 68recording, 126
Transfer prices, 836–837Treasury stock, 135, 536
shares, number, 135
Treaty on European Union of 1992, 832Trigeogis, Lenos, 477Triple net lease, 884True lease transactions, federal income tax require-
ments, 900–902True return, 152Trust companies, 66Trust Indenture Act of 1939, 495Trust receipts loan, 708Trustee, definition, 66Turn-key operating project, 922Turnover rate, 761Turnover ratios, 722, 815. See also Accounts receiv-
able; Fixed asset turnover ratio; Inventories;Total asset turnover ratio
Umapathy, Srinivasan, 966Uncertainty, 257
amount, 196degree, 451–452
Uncommitted line of credit, 696Underlying asset, value, 472Underlying for the contract, 84Underwriter discount, 62Underwriting. See Competitive bidding underwriting
arrangement. See Standby underwriting arrange-ment
definition, 34process, variations, 64service, 54standards, 863traditional process. See New issues
Uneven cash flows, 168–170Unsecured financing, 689–705Unsecured loan, 690Unsystematic risk, 295Untested technology, 922Unused tax shields, 603–605U.S. coupon payments. See Semiannual U.S. cou-
pon paymentsU.S. federal taxation rates, 108–118U.S markets, 36–37U.S. taxation law, 108U.S. Treasury
bills (T-bills), 28, 710bond, purchase, 268debt issuer, 69securities. See Zero-coupon Treasury securitiesspot rates, 73
U.S.-dollar-denominated debt, 851Useful life, 360
Valuation allowance, 111Valuation equation. See Basic valuation equationValue Line information, 788Value Line Investment Survey, 343, 791, 798Van Arsdell, Paul M, 937Vardharaj, Raman, 300Variable costs, 261
margin, 652Variance
square root, 279standard deviation, interaction, 279–281
Variation, coefficient, 460, 592. See also Cash flow risk
Index Page 1006 Wednesday, April 30, 2003 12:24 PM

Index 1007
Variation margin, 86Vaughan, Mark D., 702VBernard, Victor, 792Vendor leases, 895Visibility, increase, 843Volatility. See Cash flow; Common stock
estimation, 475, 476Voting. See Cumulative voting; Preferred stock
rights, 534, 539–541. See also Contingent vot-ing rights
WACC. See Weighted average cost of capitalWalkling, Ralph A., 545Wal-Mart Stores, Inc., 130, 803
activity, 760–761Annual Report, 804book value, 136business, 754cash flow, 141common size analysis, 762–763companies, opening, 827economy, 755–756example (1996-2001). See Financial ratio analysisfinancial analysis, integrative example, 754–764financial leverage, 761–762financial ratios, 756–763industry, 754–755liquidity, 758–759operating costs, 759profitability, 759–760return, 757–758warehouses, investment, 935
Walt Disney Company, 130, 753, 946, 947Annual Report (2001), 121, 750cash flow, 141forecasts (1999), 784
Ward, Terry J., 816Warehouse loan. See Field warehouse loan; Public
warehouse loanWarner, Jerold B., 610Warrant, 248, 520, 542. See also Detachable war-
rant; Perpetual warrantslife, 521usage. See Bonds
Watts, Stephanie A., 777WCC. See Weighted cost of capitalWealth maximization. See ShareholdersWeighted average cost of capital (WACC), 326–
327, 479Weighted average number of shares outstanding,
781
Weighted cost of capital (WCC), 326–327What if scenario, 462Williams 5&10
expansion, 380–385integrative example. See Capital budgeting
Williams, John Burr, 215Woolridge, J. Randall, 555Working assets, 128Working capital, 356, 627, 679, 729. See also Net
working capital; Permanent working capi-tal; Temporary working capital
change, 374–377, 384, 808–809concept, 799conservation, 889, 913increase, 376management, 798, 849–850needs, 391
Worldcom, 777W.T. Grant, 815
Yahoo! Finance, 343, 754, 784Yankee CDs, 29Yield. See Annual yield; Bond-equivalent yield;
Capital; Dividends; Earningscalculation, 67change. See Bondsdefinition, 31interaction. See Interest ratesrelationship. See Coupon rate
Yield curve, 72spread, 71
Yield-to-call, 243–245Yield-to-maturity, 231–232, 243–245
calculation, 233–234, 237–238change, 241contrast. See Annual yielddefinition, 312
Zacks, analyst forecast, 784Zacks Investment Research, 788ZBA. See Zero-balance accountZero-balance account (ZBA), 645Zero-coupon bonds, 227, 234, 237–238, 498–499
return, 236structure, 513usage, 513–514
Zero-coupon debt, 31Zero-coupon notes, 227Zero-coupon securities, 73Zero-coupon Treasury securities, 75Zweignierderlassung, 833
Index Page 1007 Wednesday, April 30, 2003 12:24 PM


