Embed Size (px)
Citation preview

FINANCIAL FEASIBILITY OF A 2500 SOW WEANED PIG OPERATION
by
BRENT HEID
B.S., University of Missouri, 1981
A THESIS
Submitted in partial fulfillment of the requirements
for the degree
MASTER OF AGRIBUSINESS
Department of Agricultural Economics
College of Agriculture
KANSAS STATE UNIVERSITY
Manhattan, Kansas
2008
Approved by:
Major Professor Dr. Mike Tokach
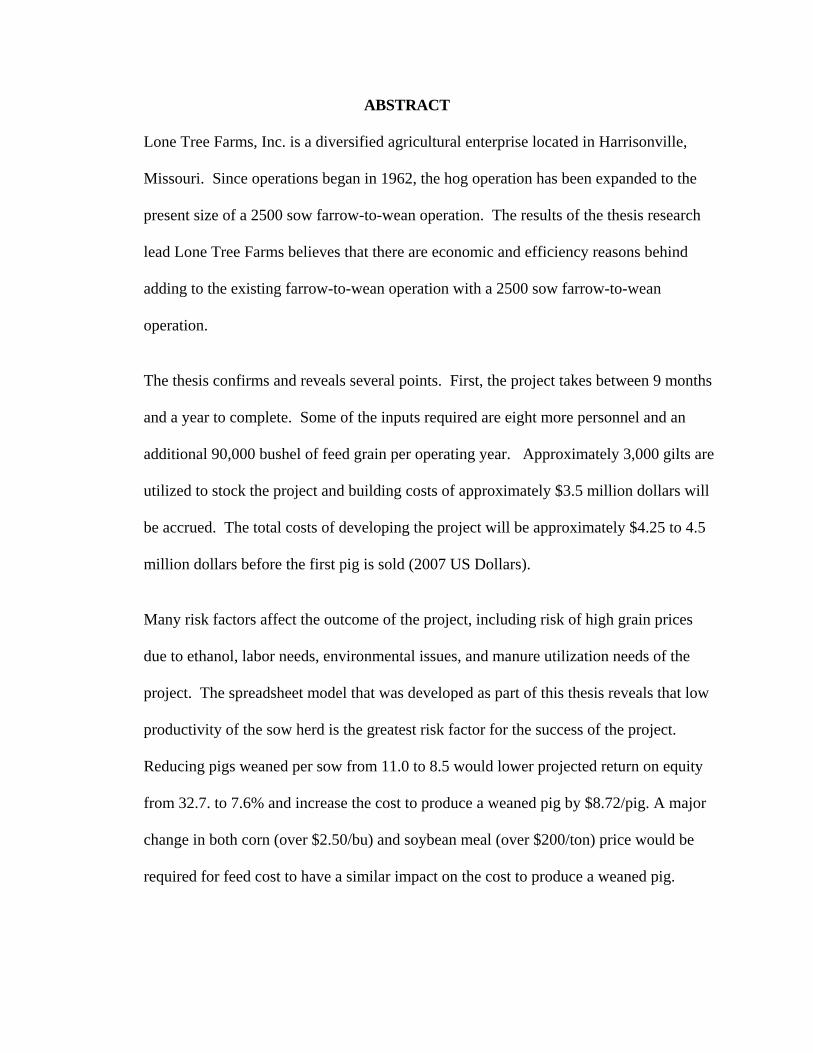
ABSTRACT
Lone Tree Farms, Inc. is a diversified agricultural enterprise located in Harrisonville,
Missouri. Since operations began in 1962, the hog operation has been expanded to the
present size of a 2500 sow farrow-to-wean operation. The results of the thesis research
lead Lone Tree Farms believes that there are economic and efficiency reasons behind
adding to the existing farrow-to-wean operation with a 2500 sow farrow-to-wean
operation.
The thesis confirms and reveals several points. First, the project takes between 9 months
and a year to complete. Some of the inputs required are eight more personnel and an
additional 90,000 bushel of feed grain per operating year. Approximately 3,000 gilts are
utilized to stock the project and building costs of approximately $3.5 million dollars will
be accrued. The total costs of developing the project will be approximately $4.25 to 4.5
million dollars before the first pig is sold (2007 US Dollars).
Many risk factors affect the outcome of the project, including risk of high grain prices
due to ethanol, labor needs, environmental issues, and manure utilization needs of the
project. The spreadsheet model that was developed as part of this thesis reveals that low
productivity of the sow herd is the greatest risk factor for the success of the project.
Reducing pigs weaned per sow from 11.0 to 8.5 would lower projected return on equity
from 32.7. to 7.6% and increase the cost to produce a weaned pig by $8.72/pig. A major
change in both corn (over $2.50/bu) and soybean meal (over $200/ton) price would be
required for feed cost to have a similar impact on the cost to produce a weaned pig.

The start-up and initial production year pose the greatest challenges and risks. After that,
production flows should reach more consistency and effectively lower the risk. The initial
start-up capitalization of approximately 30% reduces exposure and liquidity risks. The
timing of the project should be made when both input expenses and output prices (pig
price) are able to be managed. Combined with good management which maximizes
pigs/sow weaned, the project stands a very good chance of being considered successful.

iv
TABLE OF CONTENTS
List of Figures..........................................................................................................................v
List of Tables ..........................................................................................................................vi
Acknowledgments.................................................................................................................vii
Chapter I: Objectives .............................................................................................................1
1.1 The Resources ..............................................................................................................2
Chapter II: Risk Factors and Avoidance.............................................................................5
Chapter III: Additional Risk-Inputs ..................................................................................10
3.1 Feedstuffs and Hog Prices..........................................................................................10
3.2 Corn: Feed vs. Ethanol ...............................................................................................10
3.3 By-products ................................................................................................................12
Chapter IV: Energy, Ethanol, and the Price of Weaned Pigs.........................................13
4.1 The Law of Unintended Consequences .....................................................................13
4.2 Boon and Bane - Currency Exchange Rates..............................................................15
4.3 Meat Protein Demand.................................................................................................16
Chapter V: Locating the Proposed Operation-Building and Operations Concerns....19
5.1 Bio-security, the Premium Concern...........................................................................19
5.2 Building Location Considerations-Strategic Placement-Financial Reasoning.........21
5.3 Building Costs and Considerations............................................................................23
5.4 Labor Needs................................................................................................................26
5.5 Finance and Payback..................................................................................................29
5.6 Production Benchmarks .............................................................................................32
5.7 Inputs ..........................................................................................................................34
Chapter VI: Summary of Outputs .....................................................................................37
Chapter VII: Summary........................................................................................................43
References..............................................................................................................................45

v
LIST OF FIGURES
Figure 6.1 Breakeven vs. Pigs Weaned ..............................................................................41
Figure 6.2 Pigs per Sow per Year Affects on Income.......................................................42
vi
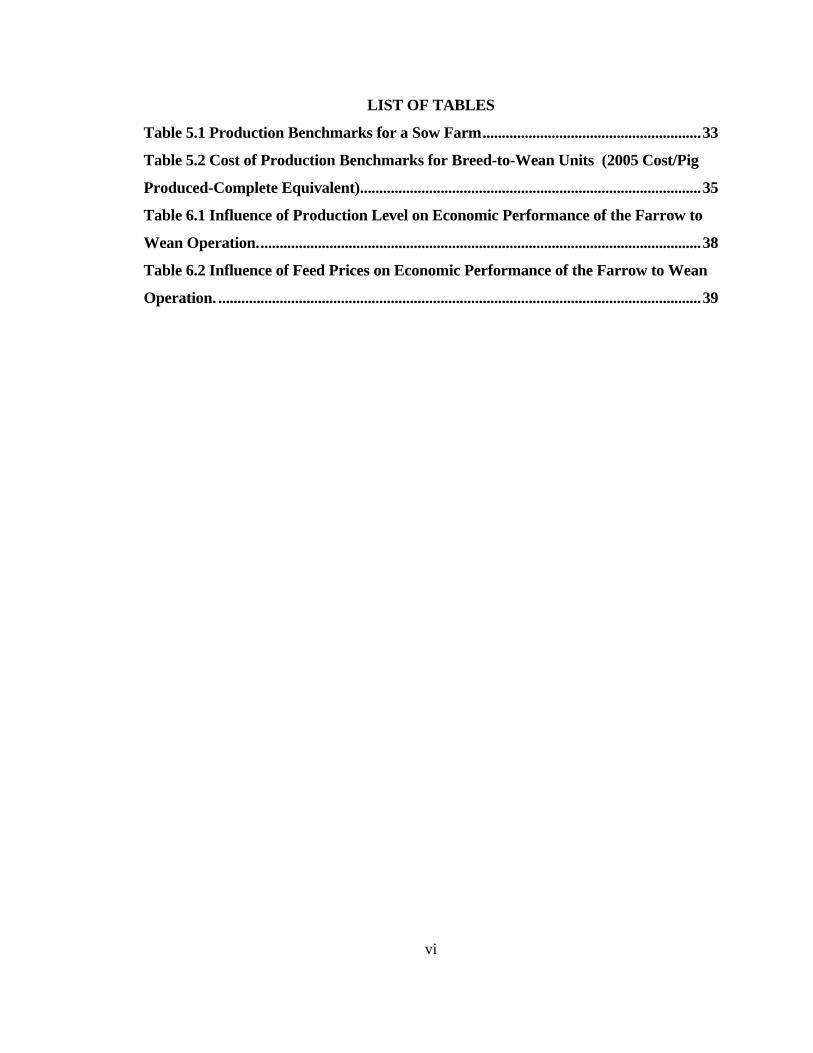
LIST OF TABLES
Table 5.1 Production Benchmarks for a Sow Farm.........................................................33
Table 5.2 Cost of Production Benchmarks for Breed-to-Wean Units (2005 Cost/Pig
Produced-Complete Equivalent).........................................................................................35
Table 6.1 Influence of Production Level on Economic Performance of the Farrow to
Wean Operation....................................................................................................................38
Table 6.2 Influence of Feed Prices on Economic Performance of the Farrow to Wean
Operation. ..............................................................................................................................39

vii
ACKNOWLEDGMENTS
The author wishes to thank all those who were actively involved in the formation of this
thesis. Those include faculty, thesis committee, proofreaders and MAB staff. Thank you.
To those family members not actively involved in the formation of the thesis but who
sacrificed time and treasure so that the author could be involved in the MAB program and
subsequent thesis, thank you, thank you. Especially, wife Peggy, sons Devin, Landon, and
Caleb, son Jared and daughter-in-law Rachel, and my father-in-law Ted Zellmer who has
been an encourager and supportive in everything that I have ever attempted. Blessings to
you all.

1
CHAPTER I: OBJECTIVES
The plan for this thesis is to develop a business plan which reveals the costs and strategies
and physical needs in developing a 2500 sow farrow-to-wean operation for Lone Tree
Farms, Inc, a diversified farm located in Cass County Missouri.
Lone Tree Farms, Inc, consists of different enterprises which offer a symbiotic relationship
to the proposed expansion project, namely a cattle enterprise which may utilize the
nutrients from manure produced on the proposed expansion and a cropping enterprise,
which not only utilizes manure for nutrients, but also supplies corn and soybean production
which makes on-farm milling possible. Lone Tree Farms also has in place a 2500 sow
farrowing operation so the proposed expansion would be a doubling of the herd. There
would be some efficiency captured from this doubling, such as spreading personnel
management over more animals and more efficient utilization of the feed mill.
The details and cash flows outlined in the proposal will be quite helpful to Lone Tree
Farms in the decision of; if, or when, to expand the sow operation.
Changing costs of production and, to a lesser but significant extent, building and
production systems make a current evaluation valuable. To develop a business plan with
these costs and different production scenarios explained by cash flows, with current
markets in mind will enable Lone Tree Farms, or any other potential producer to make an
informed decision about expansion or primary entry. The business plan will not be
comprehensive, but will strive to be an example that one may use to benchmark or
comparison in developing a project of one’s own. Following a resources section, the thesis
2
will contain prospective project issues that will need to be addressed. In order, the sections
will be:
1. Risks of production in operating a sow unit
2. Risks of inputs and outputs
3. Location and site selection factors
4. Building considerations and costs
5. Labor needs
6. Finance and payback expectations
7. Explanation of variables and benchmarks used in spreadsheets
8. Financial spreadsheets with various pricing scenarios
9. Explanation of results and summation.
Many of these items could lend themselves to a full thesis evaluation, but the purpose of
this thesis is to give an overall idea of the major inputs needed to develop an operation and
not reflect an exhaustive body of information on the swine industry. The thesis should be a
good working tool in the hands of the decision-maker and give a current cost picture of the
farrow-to-wean segment of the swine industry.
1.1 The Resources
The information required to inform and substantiate data offered to the reader on the thesis
topic(s) will be mainly agriculturally based. On the topic of site selection, ag-engineering
principles will need to be followed, along with thoughts about set-back and prevailing
winds. The various agriculture extension divisions of Land Grant Universities have much
information to offer and, along with a check with the regulations published by the

3
individual states Departments of Natural Resources should insure compliance. Building
type and effluent management are affected by these regulations as well. The ideas about
types of buildings will be suggestions influenced by current industry offerings and
standards. Attention will be paid to pig capacities and flow requirements, though, because
they will apply to nearly any structure chosen. In reference to costs and cash flow
expectations of buildings, an industry average will be offered on the type of building
suggested. Bids from various building companies will be gathered and reported (sans name
of company) so figures will be as current as possible. Information will also be given on a
per-sow basis, so a “bid” will be easily updated. Most companies heavily involved in
agricultural building construction can give a per-sow bid with good accuracy according to
their last construction experience.
Personnel needs will be suggested, but only in general with ideas about positions needed
(managers, team leaders, technicians, etc) and general salary expectations for these
positions. Current periodicals and agriculture employment companies will be good
resources for these approximations.
Financing and payback expectations will be evaluated with financial institution guidelines
in mind and some salient financial ratios will be calculated. The expected scenarios of
production will be examined by various cash flows, which will be adjusted to differing
scenarios and the results reported.
In conclusion, this thesis will attempt to be a working feasibility study with a general
overview of expectations presented. After presentation, the reader should be able to walk

4
away with some numbers that will enable a good decision on what resources and amount of
time will be needed to participate in the construction and operation of a start-up farrow-to-
wean operation.
5
CHAPTER II: RISK FACTORS AND AVOIDANCE
In the production sector of the swine industry, there are many inherent risks. Some of these
risks, such as costs of inputs (grain, feedstuffs, semen, and even liquid propane) can be
lessened by forward pricing. Other risk factors can be insured against. Insurance on
buildings, personnel, and livestock revenue coverage fall into this category. The risk of
rising interest rates may be dealt with by choosing a fixed rate product when financing.
The greatest risk factors of a farrow-to-wean operation, however, cannot be dealt with
traditional risk management techniques. Production losses due to disease, personnel
mistakes, extreme weather, or the potential loss of market (contract default) are, for most
operations of this type, the greatest risks that defy traditional control methods. As with
most risks such as these, avoidance is the most effective means of control. There are some
means to insulate an operation from the brunt of the risk that will help keep the operation in
business if a difficulty occurs. Avoidance and control of the three greatest risk factors
independent of typical market risk avoidance tools are discussed below.
Disease and its aftermath is the most prevalent risk for the farrow-to-wean operation.
PRRS (Porcine Reproductive and Respiratory Disease), Mycoplasma Pneumonia,
Influenza, and Circo-virus are diseases that can affect a sow herd and its production to the
point of extreme economic loss and possible business failure. PRRS, in particular, can be
devastating to an operation as it is estimated that PRRS costs U.S. pork producers as much
as $560 million each year (Miller, 2006).

6
Avoidance of diseases through proper bio-security (discussed in more detail in other parts
of this thesis) is the most effective and necessary method of risk avoidance. To protect the
business, a necessary level of liquidity should be maintained to continue cash flow in spite
of a disease outbreak. Each operation should design a plan for maintaining operations in a
worse case production interference scenario. Reserve funds may be set aside for this
purpose. These funds may be in notes, liquid assets, capacity within a line of credit, or in
collateral that may be utilized through borrowing, or a combination of these.
While PRRS and related diseases may cause this extreme need for emergency capital, other
production losses may cause the need for emergency capital at a lesser percent. Production
losses may occur through lesser diseases, reproductive failure, failure of personnel, or even
weather (i.e. heat) related losses. If a production drop does occur due to an extreme disease
outbreak, some ready cash should be available to assist with cash flow. An example would
be a PRRS outbreak. A 25% loss of production for three months due to PRRS would cost
approximately $130,000. This would cover the initial costs, but some lingering production
problems may continue to affect the operation for a time. The impact on an operation,
from Lone Tree Farm’s experience may be as much as ten percent of gross. Lone Tree has
found that cash or liquidity availability needs may be as much as $150,000 in its operation.
This is about one full month’s income. Proper management and oversight of an operation
can ameliorate many of these potential losses and at least minimize them.
Loss of market through a customer reneging on a contract is the third risk possibility.
Lessening of this risk is possible by selling to multiple customers and taking time to
research the financial strength of the entity to which the operation is marketing pigs.
7
Meeting the customer on a personal level and putting a face to the contract will also help
that person to follow through on the contract commitment. Good and ongoing
communication is also helpful to keep problems and miscommunications from occurring.
The potential of a financial loss due to contract default is really only present at a low in the
finishing hog market. When prices are high for finishing hogs, a buyer can be replaced if
one is lost through contract default. When lean hog prices are low, however, it is a difficult
time to negotiate a contract. It seems that either there is great demand for weaned pigs or
very little demand for weaned pigs so timing of negotiations is critical in achieving
acceptable results.
If a contract default does occur at a difficult time in the hog cycle, it may be ill-advised to
be reactionary and commit to long-term agreements that may last, and cost the operation
for years to come. Lone Tree Farm’s management has learned that patience and accepting
some short-term losses, if possible, may be the best option. History shows that the most
difficult pricing periods are relatively short-lived.
Other potential risks that may affect the development plans for a unit are negative public
perceptions of confinement operations and possible legislation of production techniques.
Actions that may help with these social risks may include education of the voting populace
on the viability of gestation stalls as good production practice, research to validate and
improve accepted production techniques, lobbying legislatures and informing them of facts
on the issues, and also building confinement buildings that may be converted to pen
gestation production if necessary.

8
The regulatory risk of odor and dust nuisance legislation and manure applications also fall
into this category. Wendy Powers of Iowa State University states; “Pork producers need
strategies that are readily available to implement because we may see more air regulations
come into place in the future.” Proper application techniques must be maintained and have
proper oversight. Moving away from lagoon manure storage to deep pits under buildings
will also help in the insulation of producers from nuisance issues. This method has less
odor nuisance risk to the operation than lagoon storage. Information on evaluating and
controlling odor may be found at
www.extension.iastate.edu/airquality/practices/homepage.html or in a multitude of
university publications from many land grant universities (Powers, 2006).
In the proposed operation for Lone Tree Farms, buildings will have deep pit storage to
eliminate that lagoon odor risk. The buildings will also have some crate gestation, but will
be built in such a way that they may be converted to full pen gestation if legislation
determines that crates will not be allowed.
Cash needs will be considered when planning payback of expansion and the time frame for
amortized payback will be structured to allow some liquidity within the operating line of
credit and cash inflows rather than push payback to the point that no cash is available for
emergency use. Excellent, experienced management will be hired and the area of labor
expense will not be compromised in order to lessen potential production losses.
Lastly, biosecurity will be taken into account on all decisions made, in order to lessen the
risk of importing a potentially devastating disease.
9
The areas of risk for non-input areas of production are difficult to ascertain and plan for.
Allan Lines, Ohio State economist relates, “Although there are sophisticated methods for
estimating risk, it is not so easy to establish the probabilities of receiving a specific price or
the likelihood of a disease outbreak”, he says. “The age-old, farmer-proven method of
underestimating receipts and over-estimating expenses-at least 5% for each-is referred to as
risk-based budgeting, and is a useable and useful mechanism for accounting risk” (Miller,
2004).
The areas of risk that do not have specific risk management tools to use have only the tools
of caution and preparation to assist in overcoming them. These areas mentioned, however,
should have equal attention paid to them as the risks that have risk management tools.

10
CHAPTER III: ADDITIONAL RISK-INPUTS
3.1 Feedstuffs and Hog Prices
In addition to the difficult to define risks of the proposed expansion in producing weaned
pigs such as disease and other production losses, and loss of markets, there are some risks
that are more definable and have specific risk management tools available to use.
The risk of rising feedstuffs prices, namely corn and soybean meal, are in the past, more
definable due to prices having both a historic and recognizable supply and demand curve.
These commodities, though, are in what seems to be a new era due to new uses of both
corn and soybeans in the energy market rather than the feed market exclusively. New
supply and demand curves are being determined and historical prices are of lesser value
when determining possible price/risk scenarios than they have been in the past.
Risk, for the proposed operation would be defined more specifically as high corn prices and
low hog prices. Both of which would negatively affect the profitability of the operation.
Cash flows for a new operation built in the midst of the shift of corn being used from the
food sector into the energy sector should take those additional risks into consideration and
must include these new frontiers of prices in order to be accurate.
3.2 Corn: Feed vs. Ethanol
The move from number 2 yellow corn from a livestock feed to an ethanol plant input has
been swift. According to Lester Brown of the Earth Policy Institute, there are estimated to
be 200 plants in the planning stage at the end of 2006, which could drive corn-for-ethanol
use in the 2008-09 marketing year to about 139 million tons (Brown, 2006).
11
This unprecedented move toward drawing a commodity into the ethanol industry could
cause major disruptions in the flow of grain to, and the profitability of many hog finishing
operations, to which feed costs are their highest cost input. Al Hubbard, director of the
National Economic Council (NEC) who is coordinating the White House energy policy,
recently predicted ongoing announcements that would show the current administrations
commitment to energy independence (Hubbard, 2007). This announcement by Hubbard
would seem to suggest that corn will for some time be continuing its front runner role in the
focus on alternative energy sources. The futures price for March, 2010 is nearly $6.00 at
the time of this paper (April, 2008), so Hubbard’s anticipations are being borne out.
The debate of the necessity to continue the current ethanol subsidy of 54 cents per gallon is
ongoing, but has extreme political stamina. There is hope, however, that the political clout
that ethanol production has garnered is somewhat tempered as prices for food have
increased in various parts of the world. Though there are only indirect ties between the use
of corn for ethanol and the rising prices of staple food grains such as rice and wheat,
political attention has tied the two more closely together and the results should diminish
support for ethanol from corn and it’s subsidies.
Another challenge that will help slow ethanol plant growth is availability of water for
production in drier areas such as Nebraska and the High Plains, and pressure from
environmental groups, such as the Minnesota River Summit. That group met in New Ulm
and voiced concern over the rivers hydrology being affected by the corn-based ethanol
industry. They also do not want to see corn planted on marginal and conservation lands
(Gunderson, 07). Seeing some pressure on the ethanol industry gives hope that ethanol
12
production and its corn usage will again come into a balance with the pricing and needs of
the livestock industry.
3.3 By-products
The hope initially cast to livestock producers from the ethanol industry was that
inexpensive by-products available from ethanol production would alleviate some of the
losses due to higher corn prices. However, the initial results of research into the efficacy of
including wet or dry distiller’s grains in hog rations have not borne this hope out. From
Webster City Iowa, nutritionist Gene Gourley, told the Senate Agriculture Committee
during testimony on the issue that there were a number of issues involving the introduction
of ethanol by-products in swine rations including “inconsistent quality, variability in
nutrient content, and the potential presence of mycotoxins”. The ability to utilize but a
very small percentage of these products in swine rations is another problem. The DDGS
product is far more useful in diets for beef and dairy cattle. It is apparent that distiller’s
products will not alleviate the increase in production cost for pork producers caused by
high corn prices (Gourley, 2006). More information on nutrient profiles of distiller’s
products is available form the University of Minnesota on its DDGS Web site at
www.ddgs.umn.edu.

13
CHAPTER IV: ENERGY, ETHANOL, AND THE PRICE OF WEANED PIGS
4.1 The Law of Unintended Consequences
The chronological beginning of the chain of consequence was nascent in low corn prices.
Since 1972 until 2006, the average price of corn for feed as stated in statistics from the
NASS was $2.36 per bushel. This average corn price, over the 30 plus years in its
formation, inspired corn growers to petition congress to install a subsidy on ethanol to
encourage development and investment in the ethanol industry. Congress complied and the
subsidy accomplished its purpose well. The addition of the demand for corn for the newly
expanded ethanol industry caused corn prices to double in the 2006-2007 growing year.
This rise in feed costs has hurt U.S. producer’s profits but has especially negatively
affected the Canadian producer, whose cost of imported grain from the U.S., more than
doubled. This problem was exacerbated when Canadian packers, who owned much of their
production, cancelled contracts with independent producers. These battered producers had
few options. They could export finished animals to the U.S. packers, which would net
them only a few dollars per head over trucking costs or begin selling their production as
weaned pigs, which, though sold at a loss on the open market, caused less red ink than
market animals. Obviously, few in Canada wished to buy the pigs, so they were sold to
U.S. finishers who filled their finishing floors with both Canadian and U.S. pigs.
Oversupply of these pigs contributed to the downward pressure on pig prices.
14
To recap, so far, because of the subsidies on corn based ethanol, we have:
1. ethanol plant construction
2. higher corn demand
3. higher corn prices
4. a damaged Canadian packing industry
5. oversupply of weaned pigs to the US
6. lower domestic pig prices
In the past, the price of oil has not been a significant factor in determining pig prices but
has become a salient factor in allowing the weaned pig price to be affected to an extreme
low. Because of the increasing demand worldwide, the limited capacity of refineries,
problems with transportation of both crude and refined products, and issues with
currencies, the price of crude oil has risen to record highs.
There are some possible direct implications of higher energy prices, but the sleeper effect is
the trailing connection of soybean oil, which for the most part, follows the trend of fossil
fuels. As the price of crude oil rises, in 2007-2008, the funds speculators have responded
by purchasing the soy complex on the futures. These purchases have the effect of
increasing the soy oil and soybean prices. The price of soybean meal follows and soybean
meal is typically the second highest use feed ingredient for finishing hogs. Weaned pig
buyers are affected on the expense side by this price increase.
15
The net effect is:
1. oil prices rise
2. price of soybeans rises
3. soy oil increases in demand and price
4. soybean meal follows suit as fund buyers purchase the entire complex
(soybeans, soy oil, and soybean meal)
5. feed costs are higher and buyers price this into price paid for pigs
4.2 Boon and Bane - Currency Exchange Rates
Another factor that is currently playing into the pricing structure of open market weaned
pigs has the distinction of being both a boon and a bane to the pricing. The low value of
U.S. currency as compared with other currencies, particularly the Euro, is priced into the
market. Import goods, such as Canadian weaned pigs, have effectively been lowered in
price received by Canadian producers and discounted to U.S. buyers.
“Adding to their (Canadian producers sic) woes, the relative exchange rate causes the price
of their imported goods (mostly feed grains) to rise +30%. Exacerbating the situation is the
monies received in US dollars from their fire sale of market hogs, feeder pigs and weaned
pigs south of the border is also depreciated by that same +30%” (DePietre, 2006).
The boon of the exchange rate pressure is that exports are cheaper on the international
market (pork exports) so the huge supply of pork from the burgeoning supply will have a
home. Imports will be more expensive, so U.S. goods should show increased domestic
demand.

16
Obviously, there is an opposite effect on goods imported to the U.S. as the U.S. dollar
weakens. Those goods take more dollars to obtain. If a country has domestic production
to take up the slack, all is well, but, as with the case of oil, it simply makes that product
draw more dollars out of the offended economy.
The weaned pig market is affected more and more by these relatively distant instigators.
Small changes in an overseas commodity can have implications, even in a market on a
local level (attempts to enhance market pricing through subsidies on ethanol imports being
one example). Import duties can bring huge and unintended consequences on the local
market. Timing of international trade action is crucial. An import duty on ethanol which
keeps domestic prices “artificially” high also continues to keep the domestic price of corn
at a higher level than may have been expected without an import duty. Couple this action
with the current case of a hyperactive corn/ethanol market teamed up with successive short
wheat crops in both hemispheres, the falling price of the dollar which makes our “over-
priced” ag commodities cheap internationally, and the extreme rise in oil prices and the
related fall-out, make for a perfect storm of short crops with high demand. This perfect
storm of factors, teamed together, make for a drastic environment for pricing of weaned
pigs on the open market which is exhibited in price volatility.
4.3 Meat Protein Demand
The length of time that it will take for the laws of economics to return corn to a level
acceptable to pork producers can be but a guess, but for the next few years (2008-2010) it
appears that the energy (ethanol) demand will accept high corn prices. There is a bright
spot on the output side of pork production, however, as the outlook for relatively high

17
prices for pork seems to be positive. Increased plant demand due to more packing plants
coming on line will help support prices. The continued strength of domestic demand and
exports demand for hogs should also be strong for most of that time frame. “Export
demand has been consistent and U.S. pork exports will set an annual record after 2006 that
continues for the 15th consecutive year”, indicates Steve Meyer of Paragon Economics,
“Shipments to Russia (+137%), Korea (+56%), Hong Kong (+154%) and Mexico (+23%)
have more than replaced the reduction of trade with Japan” (Meyer, 2007 pg 1). This shows
a strong and diversified export demand which should assist prices for hogs to remain solid
for some time.
“Exports have made it possible to grow the herd 0.8 percent a year for the last 20 years”,
says Glenn Grimes of the University of Missouri, “The last time we saw a decline in pork
production was in 2000.” In 2004, the U.S. slaughtered a record number of hogs. This year
(2005) will be the 6th year of growth and the 5th year of record production. Next year
(2006) is on target to set a 6th record, he notes. An amazing number that shows the growth
of exports is that U.S. net pork exports equaled 532 million pounds carcass equivalent in
2003. In 2005, it was 1.636 billion pounds (Grimes, 2006).
Other situations which are keeping the industry from expanding and therefore keeping
prices relatively strong are increased construction costs, circovirus (or other) disease
outbreaks, increased regulation and paperwork to build, and higher fuel costs. These
factors are keeping producers wary and tentative to expand.

18
With this environment of higher corn and soybean meal and strong demand with limited
expansion, the business plan for Lone Tree Farms will contain cash flows for the next few
years that will contain higher input prices and at least average expectations for price
received for pigs and cull sows.

19
CHAPTER V: LOCATING THE PROPOSED OPERATION-BUILDING AND
OPERATIONS CONCERNS
5.1 Bio-security, the Premium Concern
The location of a hog unit demands attention to several details, but assuming that local
ordinances and proper zoning driven set-backs from neighbors are observed, then only a
few outstanding issues remain. Bio-security concerns, manure storage and application
concerns, and environmental concerns remain at the forefront.
Bio-security must be addressed, along with location, as the ability to control disease is the
premier value in any confinement unit. Locations which avoid proximity to other
operations and up-wind locations are highly desired. Within a quarter of a mile, disease
transmission is easily possible by aerosol and insects or rodents. If an operation can be
located upwind of other units with a half-mile setback, then some semblance of bio-
security can take place. In some hog dense areas, the close proximity is typically
compromised to enable use of land currently owned and desire to apply manure (fertilizer)
on that production land. This practice should be considered carefully as the risk factors
may easily overshadow potential gains and efficiencies.
The basic ability to control transmission of disease by aerosol, insects, rodents, personnel
traffic and ancillary traffic (feed, semen, and general deliveries) must be afforded in an
operation of high investment. Setback from a road that carries “pig traffic” must be
considered also and buffer devices such as hedges of tree windbreaks may be effective to
utilize.

20
Disposal of deceased stock must also be considered as many disposal methods may
introduce disease pathogens to the farm. Rendering trucks and burial of dead pigs is fast
being replaced with composting and mechanical composting in order to keep disposal on-
site and more controllable.
It cannot be stated strongly enough the need to maintain a bio-secure area for pig
production. The next consideration for the location of a farrowing unit on the micro (on-
farm) level is the general lay of the land with proper slope for drainage yet availability of a
large level building site. If a lagoon that is gravity fed is in the site design, the buildings
will need to be placed at a higher elevation. Placement of buildings in relation to
prevailing winds is sometimes necessary for proper ventilation functions. This should be
taken into consideration, along with proper set-back from roads and yet offer access to
service vehicles.
Further consideration for the utilization of effluence (fertilizer) must be given. This high
value by-product of pig production must be afforded attention and proper application
techniques must be used, which is both proper in the eyes of regulatory agencies and proper
for full utilization of nutrient value. Utilization by the unit owner(s) or even the sale of the
effluence to neighbors is highly desired, especially as prices of commercial fertilizers have
risen.
In each instance listed above, Lone Tree Farms meets the desired specifications as the
nearest hog operation is five miles distant and down wind, set-back is adequate from
21
heavily traveled roads, and manure application opportunities are close at hand and adequate
in size for best management practices.
Typically, close proximity to delivery sites would also be a high value, but in the case of
pig production, location demanded by bio-security outweigh any efficiencies that may be
accrued by locating close to delivery sites and other more pig dense areas which carry a
higher disease risk. This point cannot be understated, and if proper bio-security methods
cannot be followed in the placement of facilities then the project should be relocated, in
spite of the efficiencies of utilizing pre-owned land and manure value on pre-owned land.
A related issue of using lagoons for the storage and elimination of some manure nutrients
should be considered carefully as the nuisance factor of employing this technology may put
an operation at risk for nuisance lawsuits and fractured neighbor relationships. The use of
lagoons is seemingly decreasing due to the inability to capture full value of high value
nutrients in a lagoon system and the aforementioned nuisance risk. A farrowing operation,
such as the one which Lone Tree Farms currently owns produces manageable quantities of
manure which may be stored in deep pits under buildings, which is becoming Lone Tree
Farm’s recognized method to save nutrient value and lessen environmental impact. The
value of the manure as a fertilizer is considered as an asset of the unit and appropriate usage
needs to be assessed for maximum value.
5.2 Building Location Considerations-Strategic Placement-Financial Reasoning
There are other location considerations that are of a long-term financial nature as opposed
to a logistical, bio-security nature. The risk of locating a confinement operation within an
existing farming operations physical plant exists. It is not unusual to locate confinement

22
buildings in close proximity to current operating hog buildings or grain-handling systems
or feed mills. While this method of location may be efficient in terms of production and
oversight, it may actually increase risk. If the situation occurs that a hog operation unit
must be sold due to difficult financial circumstances or changes in operational priority or
even inability of ownership to continue operations, the location entwined with other
operational entities may lower the resale value. A lender, reviewing the solvency of the
operation may discount the operations value because of its package appeal being burdened
with unwanted machine sheds, grain storage, or even the family home.
This may be avoided by, if possible, placing the operation on a saleable site which is
appropriately located away from other farming assets. A site with good bio-security,
access to water, good roads, and near to several acres of cropland for manure utilization
should be considered. The ability to divide off 20-40 acres with the building site and not
disturb other parts of the operation will have good resale value, which is what a lender may
be considering when setting current collateral values. Any considerations in planning a
confinement unit that will increase resale value should be evaluated and pursued. Some
minor inefficiency due to a locating the unit away from current facilities will be
outweighed by the financial leverage gained by insightful placing of the proposed unit.
Lastly, included in resale and collateral risk, is the state regulation that may exist that limits
resale of an existing unit. Some states currently have regulations limiting corporations
from ownership of agricultural real estate. This would limit sale of a confinement asset to
other individuals and lessen the potential purchasing pool and, therefore, potential value.
Opportunity to lease the operation may still exist, but having all options open, including

23
outright sale, brings the most value to the collateral base and retains maximum solvency
capacity.
5.3 Building Costs and Considerations
The cost of building confinement livestock facilities has increased along with the cost of
materials and labor. In addition, buildings offered today are typically more complex than
those in the past with more extensive environmental controls, more labor saving devices
such as cool cells, and higher cost, but longer-lived equipment installed.
This has resulted in a higher price tag that demands better management to obtain necessary
results for payback. The risk of a new operation is quite high in the first few start-up years.
To help offset some of these rising costs, there have been some design changes that do not
affect production, but are less expensive to construct. Kirk Brincks, of Hog Slat, Inc. tries
to reduce the overall cost of a building project by recommending that producers put more
hogs under one roof. This allows for fewer of the expensive computerized environmental
controllers, less cost for feed systems, less cost of ventilation, and even smaller factors such
as number of electrical service boxes and breaker panels needed per sow inventoried. In
farrowing, larger rooms (56 vs. 24 sow rooms) help lower costs without sacrificing results.
With these efficiencies in place, construction costs are still trending higher. To construct a
2500 sow production unit, a range of $1300 to $1550 per sow space should be planned for,
though sow unit costs are quite variable depending on what region of the country the unit is
built in. There is a range of $900 to $1550 per sow depending on where it is located and the
manure handling system that’s involved (Brinks, 2007 p.16).
24
There are further considerations when planning the construction of a sow facility. After the
bio-security situation and the desired pig flow needs are assessed, proper engineering of the
buildings is an important need. Always use an engineered building which has been “signed
off” on to avoid insurance issues. Make sure that the concrete and its reinforcement is
adequate for the project. Consistency is important and Lone Tree Farms has, in the past,
checked the “slump” (hardness factor) regularly during the building process. Make sure
that all materials used are quality and up to the abuse that a livestock building suffers.
Anything that touches manure or the fumes from a building must be made of proper
materials to withstand that environment. This includes plumbing, electrical components,
all exposed surfaces (including, and especially the ceiling), and even the doors must be
made for livestock passage and exposure.
Other costs that can easily be overlooked are the cost to cover walkways, the cost of office
and personnel space, water procurement and piping, electrical service provision, manure
handling equipment, feed milling and delivery equipment or costs, driveways, gravel and
rodent control around buildings, possible fencing needs for the unit (and a lagoon, if it is
designed into the unit), and production equipment purchase costs (i.e., pregnancy testers,
pig processing equipment, semen storage equipment). Plans to haul the pigs away from the
unit on weaning day must be made and the equipment to do so must be provided. A tractor
and hydraulic pig cart or a long loading ramp is recommended as backing up to the
farrowing house door with a trailer would be a bio-security risk. That same tractor will be
needed to mow the area and possibly blade snow from the driveways and graveled

25
employee parking lot. A complete scope of project should be offered by the builder that
outlines their responsibilities. Most include an office and some hallways in the bid.
Lone Tree has received bids of $1000 per sow and $1200 per sow from reputable builders
which does include the office and some hallways. Neither contains a bid for a farrowing
feed system, which some producers would desire. This range of figures would cover a basic
barn with complete mechanical ventilation (with cool cells) and deep pit manure storage for
the gestation and “pull plug” shallow pits in farrowing, which then drain into the deep pit
gestation unit. The gestation unit in this bid would be stalls, as opposed to pen gestation.
It takes some time and effort to review the scope of work documents from the builder, but
it is time well spent and will raise thoughts of other possible needs and expenses for the
proposed operation. Lone Tree Farms has many of the ancillary needs in place and
typically plans on spending about 2% of the project value in providing non-equipment set-
up monies for a project.
The building sizes that are necessary for the desired pig flow are 392 crates for farrowing
(56 crates per room in 7 rooms) and 2200 crates for gestation. Space will also be necessary
for gilt acclimation and cull sow storage. Some extra crates are needed to overlap sows on
weaning day. The newly weaned sows need to be held somewhere while the rooms are
washed before re-loading. Acclimation space of 250 gilts is needed and cull sow space for
at least 100 sows is preferable. It takes 80 sows to fill a semi and hauling may be bid into
the price of the cull sows, if the farm can provide a full semi load.
26
5.4 Labor Needs
Labor in the pork industry has been described by many producers as a pressing production
issue facing the industry. The availability of experienced labor for confinement units is
practically non-existent in some regions of the U.S. This lack of available, trained
personnel can result in possible production losses due to inexperienced people asked to
exhibit skills within weeks of hire that often take years to develop. A rapid turnover of
people is another detriment to consistent performance. People are much more mobile
within jobs than in the past and there is a more prevalent attitude that if they are not moving
up in a company quickly, that there is a need to move to another job to gain upward
mobility. This mentality sometimes enables people to obtain positions for which they are
not qualified. Personnel management at Lone Tree Farms is aware of this occurring and
recognizes that a person who was a manager with responsibility at another operation may
not be truly qualified. It is also wise to plan for employee turnover by developing good
training techniques and systems. Lone Tree Farms has utilized printed training material
and employee handbooks for many years and has found them to be very useful in the
training and expectation arena. Having personnel that are trained as trainers has also been
beneficial. Lone Tree Farms experience has been that much of the management staff is
longer term but the technician positions (discussed later) experience more turn-over.
Because of this, the systems and connections to find good replacement employees should
be in place and people must be cross-trained in several positions so they may be reassigned
to cover personnel shortages when needed.

27
With this environment of turnover in mind, the practice of employing willing, available,
foreign-born workers makes good sense. The swine industry is becoming more dependent
on foreign-born laborers each year. Thus, large production systems may need to be aware
of the paperwork required to employ foreign-born laborers.
The labor needs for the proposed operation are concentrated in the two main areas of
production for a farrow/wean operation, that is, breeding and farrowing. Breeding
technicians who are trained in artificial insemination and estrus detection are the most
important personnel to hire carefully. A trained person who has the ability to detect estrus
and understands the breeding technique is very valuable. Some of the four member
breeding crew may be inexperienced, but it is very helpful if two of the four have some
experience. The breeding technicians should be people who are patient with good animal
skills. These people should be selected with these skills in mind and their personality
should match the need. A fast-paced, hard driving, goal-oriented person may be a good
match in farrowing, but might become impatient in breeding. Personality or giftedness
assessments such as the Meyers-Briggs Assessment or the DISC Assessment have been
proven to be useful when assessing potential personnel at Lone Tree farms. A love for
animals also tends to make a good breeder so hiring people who purposefully surround
themselves with animals tends to be a good move. If they have animals; however, they
should not have pigs of their own due to bio-security concerns.
Farrowing will need four technicians as well. Lone Tree Farms’ experience has been that
there is more latitude in personality differences when hiring farrowing people as opposed to
breeding, but it is they important that farrowing personnel be detail-oriented. Farrowing

28
requires a large range of skills and while a breeder needs to do only two things well
(insemination and estrus detection), the farrowing person must be multi-faceted. Ability to
remember a complex system and keep many details in order requires a person who has a
varied skill set.
Typically, another person, the manager, would be needed, but in this proposal, that position
is not included as Lone Tree Farms has management in place with the existing operation to
cover that need.
The manager must possess a good knowledge of pigs and production as well as have
adequate people skills to manage the eight person crew that it will take to run the unit.
Experience is very valuable in this position and if the starting salary for a technician is
$25,000 plus benefits, the manager may be worth twice that, depending on region and
living costs in the area.
Even people at the upper end of the wage scale are becoming increasingly difficult to find.
Employee management consultant, Don Tyler, expects that issue to remain the same short
term and even intensify in the future. Tyler says that companies are pulling employees
away from the livestock sector and college graduates have more options than they’ve had
in the past. For example, this spring he spoke to a Purdue University agriculture economics
class where 18 of the 20 seniors had job offers paying $40,000 or more, plus benefits.
Tyler also works with operations that utilize immigrant labor. Those operations are tough
on themselves to make sure that they are doing everything right when it comes to
immigration. Operations that already experience high turnover, that don’t do their
29
homework on background checks, will continue to have trouble with immigrant labor
(Tyler, 2006, p.17).
With these thoughts in mind, it pays to treat valuable people as well as possible. Turnover
costs more in production losses and cost of personnel replacement costs than does paying a
good person a few thousand dollars more per year than the current accepted rate in an area.
Lone Tree Farms has found this principle to be true.
5.5 Finance and Payback
The financing of an investment of this magnitude is extremely important. Interest rates
immediately come to mind as a cost to control but other factors are important also. The
terms of payback are extremely important to the feasibility of the project as, if the payback
is too short, cash flow will be compromised with too high of payments. If payback is too
long, then total interest paid over the life of the loan balloons, money is consumed with
interest payments as opposed to principal, and there is a danger of the loan amortization
outrunning the effective life of the facility. At that point, the amount still owed on the
facility may far outstrip its value. Most facilities are, on paper, depreciated out at a ten year
time frame. They may last longer than ten years, but at that point, substantial remodeling
may need to occur.
Lee Fuchs, vice president of capital markets of FCS Financial of Missouri, notes that a
typical loan for a new facility is amortized over 10 years. Producers ask for 12 to 15 years
but rarely get it. The exception may be when a large land base secures the loan (Fuchs,
2006, p.18). It is healthy if lenders hold the line on loan periods, if a producer gets in a

30
bind for a few years because of a short amortization, then the producer and lender will
come together, discuss it and work out a solution (Fuchs, 2006).
The payback of a facility is important and financial formulas that reveal how an operation
is paying off. Six ratios most significant to this paper and his description of each are as
follows:
Profit Margin reveals the monies generated from the operation. Net income + interest
paid/gross income shows income made as a percentage of gross.
Return on Assets (ROA), shows the net income made as opposed to the asset base that it
took to make that income. A high percent is a good sign that an operation is utilizing its
assets to good advantage.
The asset turnover ratio (ATR) tells how much cash is being generated annually in
relation to a producer's investment. It is calculated by dividing gross farm income by the
average market value of total farm assets. The higher the percentage, the more efficient
and profitable the operation is.
The interest expense ratio (IER) is calculated by dividing interest paid by gross farm
income. The ideal standard is 15 percent or less. Operations with IERs of over 10 percent
are usually highly leveraged and interest is consuming too much of the income. This
would also be a prime indicator of a risky loan to an operation with cash flow issues.
The net/gross ratio is an indication of whether an operation is making any money. If that
ratio is too low, an operation is simply trading dollars without much real return.
31
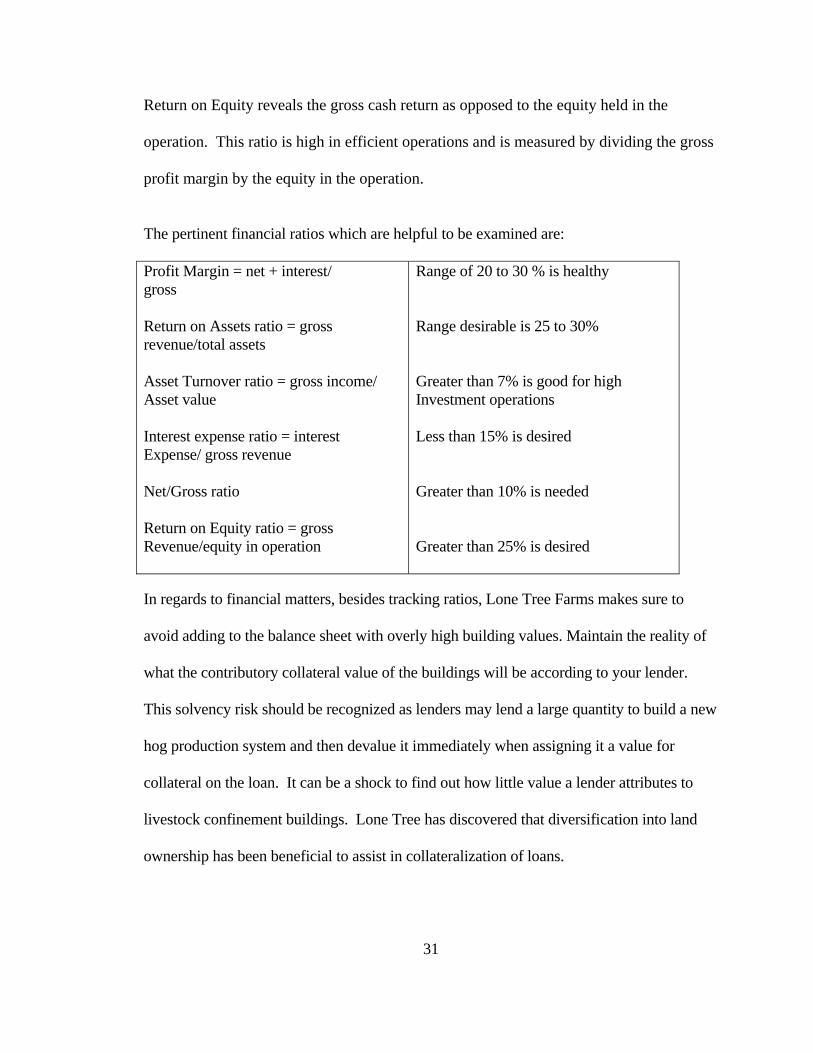
Return on Equity reveals the gross cash return as opposed to the equity held in the
operation. This ratio is high in efficient operations and is measured by dividing the gross
profit margin by the equity in the operation.
The pertinent financial ratios which are helpful to be examined are:
Profit Margin = net + interest/ gross Return on Assets ratio = gross revenue/total assets Asset Turnover ratio = gross income/ Asset value Interest expense ratio = interest Expense/ gross revenue Net/Gross ratio Return on Equity ratio = gross Revenue/equity in operation
Range of 20 to 30 % is healthy Range desirable is 25 to 30% Greater than 7% is good for high Investment operations Less than 15% is desired Greater than 10% is needed Greater than 25% is desired
In regards to financial matters, besides tracking ratios, Lone Tree Farms makes sure to
avoid adding to the balance sheet with overly high building values. Maintain the reality of
what the contributory collateral value of the buildings will be according to your lender.
This solvency risk should be recognized as lenders may lend a large quantity to build a new
hog production system and then devalue it immediately when assigning it a value for
collateral on the loan. It can be a shock to find out how little value a lender attributes to
livestock confinement buildings. Lone Tree has discovered that diversification into land
ownership has been beneficial to assist in collateralization of loans.

32
If the balance of proper financing terms is employed, an operation should, according to the
cash flows, be able to have payback percentages that are acceptable to the producer and
lender.
5.6 Production Benchmarks
With the introduction of a cash flow spreadsheet to the decision-making process, there are
some numbers that are used that bear explanation and introduction from the income side of
the cash flow. It is important to keep track of certain production benchmarks which
indicate profit potential and also help with diagnostics of production issues that need
attention. A good computer diagnostic program is essential to monitoring a sow farm and a
program and its data input time should be calculated into the needs of the operation.
As an example of the use of numbers in the operation, the numbers of pigs produced for the
first year is a 52,000 pigs and some calculation has gone into that number. These are
benchmark numbers that help to determine the numeric levels of production. The major
benchmarks that affect productivity on a sow farm include litters per mated female/year,
non-productive sow days, combined litter weight, conception rate, and farrowing rate.
These are all efficiency figures that must be paid attention to, and all will be somewhat
compromised in the gilt start-up herd, as opposed to the producing, mature sow herd. These
challenges to the start-up herd will be taken into account in pig production numbers. Pig
Champ, a large record keeping and data service for the swine industry; publish productivity
measures from their records which are good tools for comparison. The following table is
an example of some of the production benchmarks and some of the relevant levels of
production that may be expected in a sow farrowing operation.

33
Table 5.1 Production Benchmarks for a Sow Farm Productivity Measure Mean Upper 10% Lower 10% Pigs weaned/mated female/year 19.1 23.3 17 Non-productive sow days 74 47 103.5 Weaning age, days 18.2 21.1 15.2 Farrowing rate, % 75.6 84.8 64.1 Number born alive 10.3 11.1 9.5 Average sow parity 3.5 4.3 2.7 Preweaning mortality 13.4 8.7 17.7 Multiple matings 83.4 99.5 66.7 Sow mortality 7.8 3.2 13.1 Source: 2003 data from 199 U.S. farms, Pig Champ Datashare summary
The numbers represented in Table 5.1 represent the mean, low, and high numbers in each
category, not the numbers for whole farms in each category. Restated, the upper 10%
number represent the most efficient numbers in each category, but a farm with poor
production may actually have one really good benchmark number and therefore be
represented in the upper 10% category.
The numbers used in the proposal will be, from experience, not from the upper 10% on the
productivity scale, but, if good management is in place, neither will they be at the mean
level, except for non productive sow days, number born alive, weaning age, and multiple
matings, which will be at the mean level due to the nature of breeding so many new
breeding females. After the initial, start-up year, many numbers in the upper 10% of the
Pig Champ herds should be attainable (Pig Champ 2003 data).
The other number on the income side, along with the pigs produced per year is cull sows.
The number and price of the cull sow line on the cash flow will be small the first year in
production as most culls will be smaller, younger animals, with none culled for age. The
34
numbers will increase in the second year as the herd matures and less productive animals
will be culled to allow for incoming breeding females. At the point that a mature herd is in
production, the replacement rate for sows is often at 45 to 50% of the herd, depending upon
genetics. This would mean that as new breeding females are brought into the herd, the
same number of sows will leave, less death loss.
Number of gilts introduced in the construction year is obviously high, and that number
continues to be elevated in the first year of production as culling of less productive animals
and fragile first parity (first litter) animals occurs. Production deficit culling should be
fairly aggressive during this time frame to avoid a “bubble” that need to be culled because
of age (parity 7) will occur later on in the life of the sow as the initial group of females
ages. Overall, production will be enhanced for the longer term if this production culling
plan is carried out.
These production numbers all change as the sow herd matures from a gilt herd to a mature
herd in full production and by production year 2 and production year 3, the benchmark
numbers should regulate to a more consistent and maintainable level.
5.7 Inputs
Using benchmarks for inputs is not as common as using benchmarks for swine production
output, but historic price levels of inputs can be used and compared with the prices paid by
other producers with similar operations. A word of caution on benchmarks, the region of
the country where the operation exists will often determine if a benchmark can be reached.
For example, an operation in Oklahoma will have lower labor costs and higher feed costs
35
than Nebraska. Conversely, Nebraska will usually have higher labor costs and lower feed
costs. Regional differences may exist that should be taken into account.
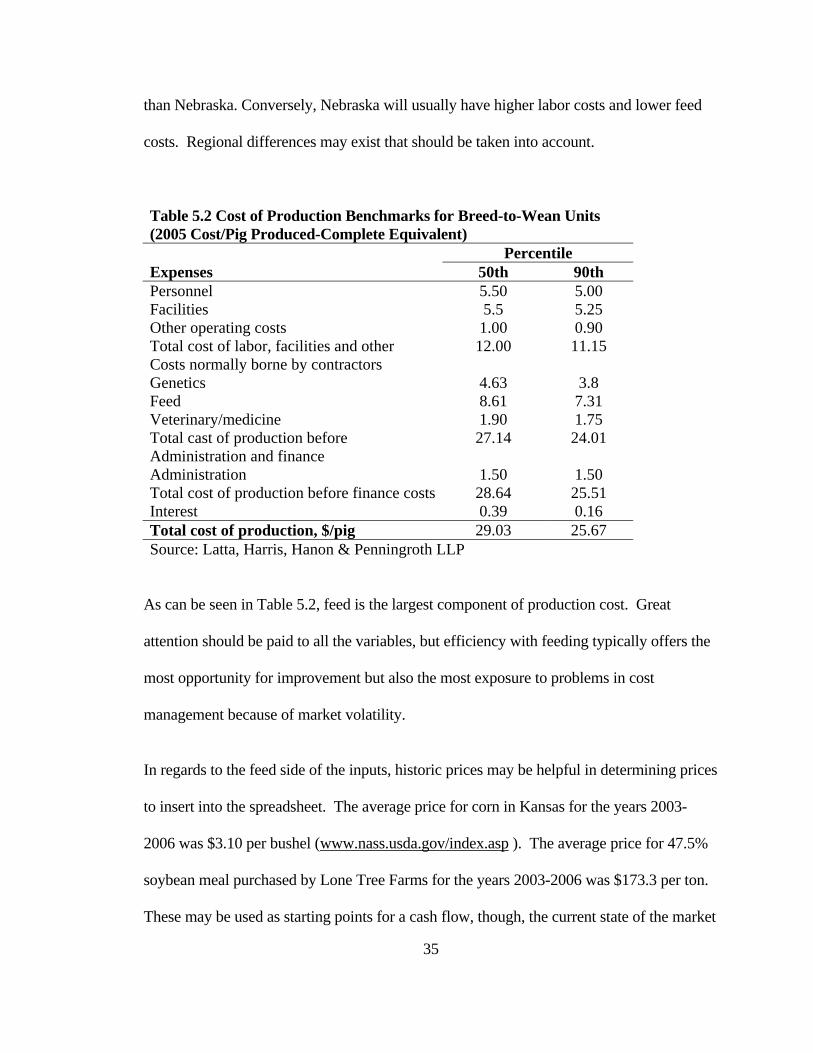
Table 5.2 Cost of Production Benchmarks for Breed-to-Wean Units (2005 Cost/Pig Produced-Complete Equivalent) Percentile Expenses 50th 90th Personnel 5.50 5.00 Facilities 5.5 5.25 Other operating costs 1.00 0.90 Total cost of labor, facilities and other 12.00 11.15 Costs normally borne by contractors Genetics 4.63 3.8 Feed 8.61 7.31 Veterinary/medicine 1.90 1.75 Total cast of production before 27.14 24.01 Administration and finance Administration 1.50 1.50 Total cost of production before finance costs 28.64 25.51 Interest 0.39 0.16 Total cost of production, $/pig 29.03 25.67 Source: Latta, Harris, Hanon & Penningroth LLP
As can be seen in Table 5.2, feed is the largest component of production cost. Great
attention should be paid to all the variables, but efficiency with feeding typically offers the
most opportunity for improvement but also the most exposure to problems in cost
management because of market volatility.
In regards to the feed side of the inputs, historic prices may be helpful in determining prices
to insert into the spreadsheet. The average price for corn in Kansas for the years 2003-
2006 was $3.10 per bushel (www.nass.usda.gov/index.asp ). The average price for 47.5%
soybean meal purchased by Lone Tree Farms for the years 2003-2006 was $173.3 per ton.
These may be used as starting points for a cash flow, though, the current state of the market
36
(2008) prices of at least $4/bushel of corn and $300/ton of soybean meal may be more
appropriate for longer-term planning.
Other inputs include; the price of labor which in this example is at a $30,000 package per
person for an 8 person crew. The price of semen is at $6.25 per dose with an average use
of 2.2 doses per mating. This will be less for the gilt start-up herd which will be a little less
than two doses per mating (gilts typically express estrus for a shorter amount of time, so
fewer doses would be required the first year). Semen can typically be contracted for a
period of time through a boar stud so prices may not vary. Another input benchmark that
changes is the number of new breeding females that are added to the herd. The number of
those females should be increased in May and June (assuming a 60 day acclimation) to
allow for breeding difficulties and lower conception rates in July and August. This will
allow pig flow to remain relatively constant which is extremely important in pleasing
buyers who desire a consistent pig flow.

37
CHAPTER VI: SUMMARY OF OUTPUTS
Financially, the project has good potential payback as long as acceptable input prices are
assured and acceptable output (pigs) is recognized. The Excel model used to run the
sensitivities to various changes and scenarios has been designed to adjust for all the major
variables in producing weaned pigs and operation a sow farm. A unique feature of the
spreadsheet is in the input page; each month is laid out individually and tied to a futures
market price. This allows the user to use the input page, which is tied to a month by month
cash flow, to construct a cash flow model as well as a sensitivity modeling tool. In
addition, there are, in the input page, some functional “mini” models that allow for changes
in feed rations, changes in production capabilities of sows, and different sow culling
scenarios, all along with the typical price and quantity changing cells to make the cash flow
spreadsheet accurate and flexible. The cash flow spreadsheet connected to the input page
contains a monthly cash flow, repeated over a period of four years. This enables the user to
obtain, as accurately as possible, a cash flow projection that is sensitive to monthly or
seasonal fluctuations in income and expenses. The spreadsheet also contains a running
payback of loans line which can be adjusted for payback on principal. Lastly, the cash flow
spreadsheet contains various financial ratios which adjust from the spreadsheet. This
allows the user to track important financial ratios and how changes in input or output
variables affect those ratios. Profit margin, return on assets, asset turnover ratio, interest
expense ratio, net/gross ratio, and return on equity are the ratios shown. In the Excel
spreadsheet accompanying the paper, the “options” page outlines some of these optional
outcomes when inputs and outputs fluctuate. Obviously, as the highest input variable, feed
(corn and soy) cost, when adjusted, causes great changes in the breakeven price for pigs as

38
well as in the pertinent financial ratios. The pig output, though, has an even greater effect
than moderate input price increases. The need to maximize pig production and efficient
through-put is essential. As noted in Table 6.1, moving pigs/sow produced from 8.5 to 11
pigs reduces the cost to produce a pig by over $8 per pig and reduces production breakeven
down to a level where profitability is more sustainable in the face of higher input prices.
All the key financial ratios improve substantially with the higher production output. Profit
margin increases from 11% to 37%. Return on assets increases by 23% because of the
efficiencies. The scenario shows that the return on equity rose from a 7.6% return to a
dramatic 32.7% return. This difference in return will be the difference between an
operation that is floundering toward demise and one that is profitable and a candidate for
expansion.
Table 6.1 Influence of Production Level on Economic Performance of the Farrow to Wean Operation. Pigs weaned per sow Item 8.5 11.0 Average market price, $/cwt carcass 75.00 75.00 Average pig price, $/pig 42.00 42.00 Cost of production, $/pig 38.77 30.05 Average corn price, $/bu 4.00 4.00 Average soybean meal price, $/ton 270 270 Profit margin, % 11.72 37.36 Return on assets, % 7.00 30.7 Asset turnover, % 65.56 87.72 Interest expense ratio, % .09 0.10 Net/gross ratio, % 10.80 37.36 Return on equity, % 7.60 32.77 Source: XLS thesis data

39
The impact of feed cost on the cost of production and the financial ratios is illustrated in
Table 6.2. Using current (April, 2008) prices for corn and soybean meal increases the cost
of producing a weaned pig by over 30% compared to using historical ingredient prices.
Comparing results from different input pricing scenarios yields information in different
financial ratios. The variables at the high input values are: corn, $5.50/bushel; soybean
meal, $370.00/ton; weaned pig market price, $42.00/pig. With these input prices, the cost
to produce the pig is $36.36. The lower input prices were: corn, $3.00/bu; soybean meal,
$175.00/ton; and weaned pig price, $42.00. With the lower input prices, the cost of
production was been reduced from $38.39 to $30.57/pig.
Table 6.2 Influence of Feed Prices on Economic Performance of the Farrow to Wean Operation. Feed prices Item Low High Average market price, $/cwt carcass 75.00 75.00 Average pig price, $/pig 42.00 42.00 Cost of production, $/pig 30.57 36.36 Average corn price, $/bu 3.00 5.5 Average soybean meal price, $/ton 175 370 Profit margin, % 32.78 21.13 Return on assets, % 25.45 15.40 Asset turnover, % 83.37 83.37 Interest expense ratio, % 2.00 3.00 net/gross ratio, % 30.53 18.48 Return on equity, % 27.33 17.61 Source: XLS thesis data

40
As can be seen in Table 6.2, input prices are important, but extreme differences in input
prices are needed to mirror the effect that changes in production have on profitability and
the cost to produce a weaned pig.
The ratios in Table 6.2 do show a dramatic increase in ROA as input costs decline. The
return on equity of an increased 10% is substantial. Profit margin also increases by 11%
and the Net/Gross ratio increases by 12%. The interest expense ratio shows the dramatic
increase in the amount of debt that can be serviced as the input cost falls and profit rises.
This dynamic is a good measure of timing for expansion using borrowed funds.
Lastly, the Excel workbook contains a loan calculator which is tied to the spreadsheet so
that changes in finance terms may be easily adjusted. This will allow the user to keep
accurate track of loan amortizations and allow them to impact the monthly spreadsheet.
After using the input page and the spreadsheet page of the Excel workbook, many scenarios
over several years were modeled. In all, most of the models showed the project has good
long-term profit potential, but ongoing attention to limiting risk through managing input
prices and effective management focused on maximizing production will be crucial. Once
a project is complete, most expenses enter into a fairly manageable range, but the
aforementioned variables will continue to determine the overall profitability of a highly
leveraged new expansion project. The lack of equity in the operation and its relatively high
debt load make it more susceptible to failure as opposed to an established operation.

41
Figure 6.1 Breakeven vs. Pigs Weaned
Sensitivities of different variables from the Excel worksheet are indicative of weaned pig
operations. Weaned pig operations are noteworthy in their business and financial structure
because nearly all costs are fixed costs. Other areas of producing pigs contain more
variable costs than does the weaned pig operation. Because of this nearly unique structure,
the weaned pig operations profitability is more influenced by pig production numbers than
input variables. In figure 6.1, the number of pigs weaned increasing shows a lessening of
breakeven cost on the pig. Figure 6.2 indicates the difference that pigs per sow per year
has on gross versus net income. An increase of pigs per litter increases the net income
greatly. This should energize the farrower to focus on production and work diligently to
eliminate obstacles standing in the way of maximizing pigs weaned per sow per year
(P/S/Y). Any obstacle, be it adequate and trained personnel, genetics, buildings, or
production systems, must not be compromised if it inhibits production. Each pig produced
as indicated by P/S/Y has great impact on the net of the operation.
252729313335373941
8 9 10 11 12Pigs weaned
Brea
keve
n $s

42
Figure 6.2 Pigs per Sow per Year Affects on Income
income per Pigs/Sow
0500000
10000001500000200000025000003000000
9 9.5 10 10.5 11 11.5
pigs weaned
inco
me
Net revenue Gross Revenue
Likewise, in Figure 6.2, the net income is affected by the largest input cost of the weaned
pig, namely feed for the sow. Net Income falls as feed costs rise, but the profitability of the
operation is not as affected by even extreme rises in input costs as it is by production
efficiency as noted above in Figure 6.1. This is, once again because of the nature of the
weaned pig operations business structure where most costs are fixed costs and increased
production provides greater return for each pig produced. As stated in section 6.1,
production of the maximum number of pigs per sow has an extreme impact on the
profitability of the proposed unit. Attention to inputs costs and values are important also,
but if attention that is given to reduction of input costs takes attention from maximizing
production, then most likely, it is misplaced. Both must be done, but there is an order of
importance.
43
CHAPTER VII: SUMMARY
In summary, the intent of this paper is to give the reader the ideas and considerations
needed when planning a sow unit. While not exhaustive, the major variables have been
examined. Buildings, labor, bio-security, inputs, risk variables, and expectations of output
have been examined and some realistic considerations have been offered.
The results of the spreadsheet can be extremely variable due to the extremes in prices of
inputs. The trend, however, is that an expansion of this sort, should yield acceptable
benefits over time. The first few years, however, are critical in the success of the
expansion. A good start is nearly essential and proper production practices and
management should not be overlooked at this time. The beginning financial ratios for year
1 are acceptable under most start-up scenarios and improve as production matures.
Another beginning variable to monitor during start-up is liquidity. For the example in the
spreadsheet, 70% of the funds are borrowed for the project. This 70% is a common amount
in that financiers like to see about 30% of a project’s capital supplied by the borrower to
stabilize the financing of the project.
Creative payback timing (delay) until sufficient working capital is built back up is the mode
of generating capital for short-term liquidity. The reality of an expansion would most
probably require bringing some working capital to the table for the project to be viable. In
this case, Lone Tree Farms has experienced that 10% might be sufficient (about $400,000).
This would help to overcome most start-up production inconsistencies and provide some
needed up-front liquidity.

44
The development of a 2500 sow farrow-to-wean operation is a complex undertaking. It
involves people, buildings, animals, highly variable inputs, marketing, and financial skill.
It is akin to the development of a small manufacturing plant, and yet this is undertaken
often by people who would disclaim the ability to begin a small manufacturing plant. The
ability of those people (mostly farmers) to accomplish such an undertaking highlights the
extreme value of experience, confidence and production knowledge base that they possess.
Those valuable assets are the beginning of the resources that are helpful to accomplish a
large project as mentioned, all other aspects of the project flow from those personal assets.
Farrowing out the initial gilt litters also challenge the system with initial start-up risk.
Inherent problems with gilts include some lighter, less marketable pigs, some increased
disease pressure such as ‘scours’ or ‘greasy pig syndrome’ and potential behavioral
problems including pig ‘savaging’ and operational training issues such as crate adaptation.
In all, the start-up and initial production year pose the greatest challenges and risks, but
after that time, production flows should reach more consistency and effectively lower the
risk. If the timing of the project can be made when both inputs and through-put are able to
be managed effectively, then the project stands a very good chance of being considered
successful.
45
REFERENCES
Berry, John Agricultural Marketing Agent at Penn State Cooperative Extension http://agmarketing.extension.psu.edu/Business/Sweet16.html, accessed June, 06 Brincks, Kirk “Building Costs Cause Growing Pains”, Pork, June 2006, p.16.
Brown, Lester “Brown says Corn Use for Ethanol Underestimated”, Pro Farmer, January 6, 2007, volume 35, edition 1. DePietre, Dennis “Farms.com”, e-newsletter November 2007. Feed Value of Distillers Grain, author unstated, www.ddgs.umn.edu, accessed February, 2007 Fuchs, Lee “Interest Rates Not Slowing Growth”, Pork, June 2006, p.18. Gourley, Gene “Pork Faces Challenges from Ethanol Demand”, July, 2007, NPPC-IPPA testimony, www.nppc.org Grimes, Glenn University of Missouri Economist, Hog Update, November 2006. Gunderson, Larry, “Ethanol Considered Among Top Challenges to Minnesota River”, Minnesota River Summit, West Central Tribune, January 12, 2007. Historic Corn Prices, USDA data, www.nass.usda.gov/index.asp, accessed June, 2007 Hubbard, Al “Democrats Have an Aggressive Plan for Renewables”, Pro Farmer, January 6, 2007, volume 35, no 1. Lines, Alan, “Facility Values”, National Hog Farmer, November 2004, p. 26. Meyer, Steve, Missouri Pork Check-off Report Magazine, Winter 2006, volume 25 no 4. Miller, Dale “Assessing PRRS Control”, Pork Magazine, August 2006, p.21. Pig Champ Datashare Summary, 2003 data (Table 5.1) Powers, Wendy “current information” page, November 2006, www.extension.iastate.edu/airquality/practices/homepage.html Tyler, Don “Labors Supply and Demand”, Pork, June, 2006, p.17. Woolverton, Dr. Mike, unpublished personal interview, November 2007.

46
Vansickle, Joe “Mortality Rates Inching Upward”, Table for Cost of Production Benchmark, Breed-to-Wean Units, Latta, Harris, Hanon & Penningroth LLP., National Hog Farmer, November 2006.


