Embed Size (px)
Citation preview
Finance and the Housing Market in the UK:
Who Wins?
Conall Boyle1*
University of Central England, Birmingham
Summary: Using data from a range of sources, this paper makes estimates of the money flows associated with
home-ownership in 2000. Of particular interest is the identification of 'winners' and 'losers' in the owner-occupied
sector. The big winners are of course Financial Institutions, the Government and those involved in transactions --
solicitors etc. Very little of the money going in to the system reaches the producers of housing (builders), landowners.
The most paltry sums reach those who inherit the accumulated wealth of housing, even fewer owner-occupiers make a
financial gain in their lifetime.
Keywords: Housing, equity, the economy, traders-down
Introduction: In this paper I try to answer two seemingly simple questions related to money and
the owner-occupied housing sector in the UK:—
— Where does the money go, and who makes money out of owner-occupation?
— How is this flow of money related to the overall money system and the economy?
It is surprising that in a field so rich in published data and of such wide interest to discover that the
answers to such relevant questions are not immediately available. I have had to piece together the
answers from a variety of sources, including previously published work and by using some heroic
assumptions. I reach a conclusion — that buying your own home in the UK is a pretty lousy
investment — which runs counter to conventional wisdom.
Throughout this paper I have used values for the Year 2000 which relate to the whole of the
United Kingdom. The sources for all the figures used and the methods of calculation are shown in
an Appendix. I would be grateful for any corrections, or to discuss my methodology. I have chosen
in the main to look at the sector in aggregate, lumping together a vast range of individual
1 Conall Boyle, (in 2002) Department of Construction and Surveying, University of Central England, now
Birmingham City University. Currently an independent researcher: Contact [email protected] This paper
was presented at an RICS Conference, Glasgow September 2002.
experiences. Nothing I say runs counter to the possibility that individuals might be losers in a
boom or winners during a slump.
[Note: I have ignored the imputed value of the rent 'paid' by the occupier to the owner, who is the
same person. One reason for this omission is that it is not an actual flow. 'Shadow rents' could be
calculated, values I believe have little meaning in the market so distorted by land-values.]
*The Appendix explains how the numbers have been derived, and what assumptions have been
made.
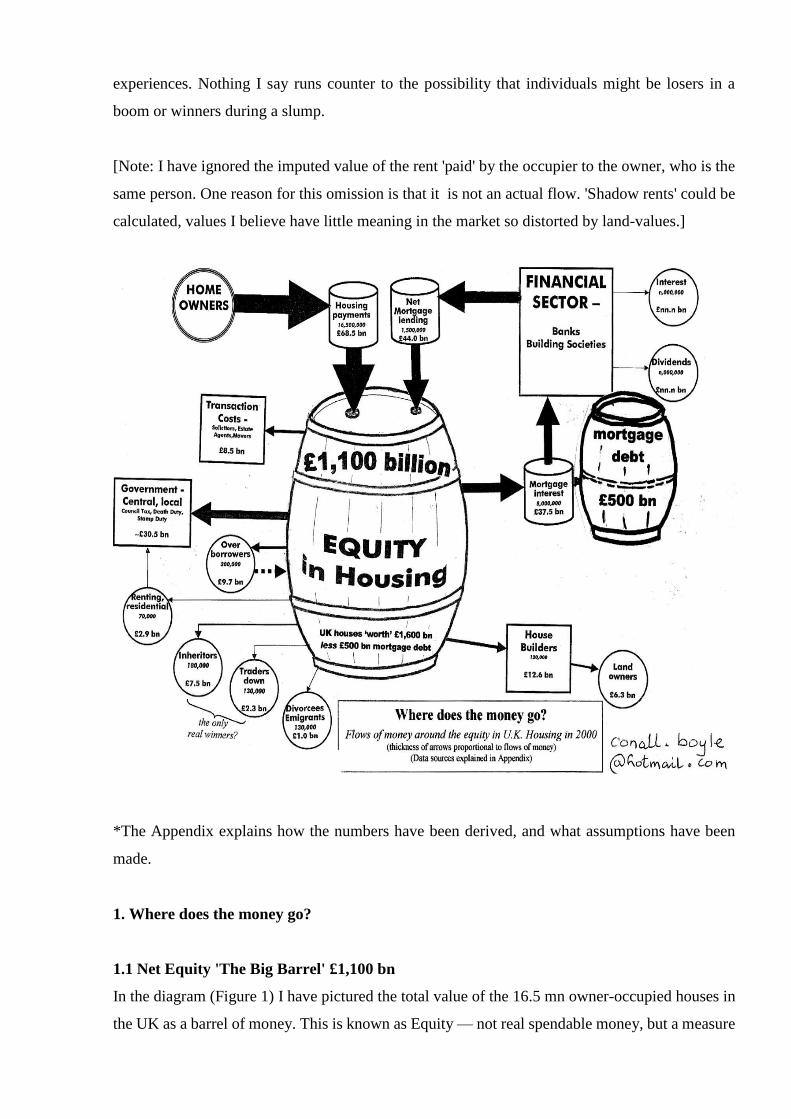
1. Where does the money go?
1.1 Net Equity 'The Big Barrel' £1,100 bn
In the diagram (Figure 1) I have pictured the total value of the 16.5 mn owner-occupied houses in
the UK as a barrel of money. This is known as Equity — not real spendable money, but a measure
at current market prices of the value of entire estate of privately owned dwellings in the UK. Net
Equity is the total value less the mortgage debt outstanding (£500 bn). To put these numbers into
context, the total GNP of the UK was about £1,000 bn in 2000.
Comment: The home-owners debt-to-equity ratio is 'prudent', with only 30% of equity owed as
debt. Of course individual owners may have debt/equity ratios of 90%, which may lead to the
'negative equity trap' should house prices fall. This happened during the early 1990's and affected
millions. But negative equity is only a problem when the borrower wants to sell, or is unable to
service his or her debt.
1.2 Mortgage Debt 'The small barrel' £500 bn
This debt is an asset of the financial sector. It is held by the traditional Building Societies but the
major proportion of the debt is held by the clearing Banks.
1.3 Mortgage Interest an outflow of £37.5
This is the first flow of money, which is paid out by home-owners who are borrowers. About half
of all owners are in debt, and repayment is subject to interest rates which vary with the market,
creating unpredictable liabilities for the home-buyer.
1.4 Net Mortgage Lending an inflow of £44.0 bn
In Figure 1 this is shown as a positive inflow to the Net Equity barrel. There are substantial flows
of capital (money) both to and from the financial sector:—
— Capital flows to the financial sector as repayment of mortgage debt, and
— Capital comes from the financial sector as new advances which are secured on the
collateral value of the housing equity, mainly related to house purchase.
It is usual for the total amount of mortgage debt to grow year-on-year. To sustain this requires
fresh supplies of credit from Finance sector.
1.5 'Over-borrowing' an outflow of £9.7 bn
Over-borrowing, or Mortgage Equity Withdrawal (MEW) as it is styled by the Bank of England, is
mortgage lending which is used for something other than house purchase. In the past borrowing for
house- purchase attracted tax relief (It still does in many countries) So MEW in the UK is just a
normal financial transaction. This kind of borrowing is portrayed as a major benefit of
home-owning, with owners feeling more confident as their house prices rise. But it is still
borrowing, and on no more favourable terms than any other commercial loans. All the moneys will
have to be repaid together with interest charges. Ability to repay is more important to the lenders
than the size of the collateral represented by the market price of the house.
1.6 Housing Payments .. an inflow of £68.5 bn
Apart from Net Mortgage Lending, this is the only other cash flow into the barrel. It covers all the
costs related to purchasing, owning and selling house property. The main destination for these
payments — mortgage interest - has been explained already. The next sections break down the
destination for the other outflows.
Comment: This huge amount of money takes a large chunk out of the household budget — about
16%. As the UK economy has progressed the proportions of the family budget spent on food and
clothing have fallen dramatically in the last 50 years. The proportion spent on housing has
remained stubbornly high.
1.7 The Housebuilders an outflow of £12.6 bn
The Housebuilders produce the new houses, and have been responsible for producing all the
houses which form the basis for the equity discussed here. Less than one-fifth of the total of
home-owners expenditure on house-purchase reaches the Housebuilders, and a large proportion of
that goes to the owners of land acquired for new building.
1.8 Transactions Costs an outflow of £8.5 bn
For every new-built house produced, there are about 10 old ones traded. Transaction costs only
affects the million or so traders. These costs are relatively low in the UK compared to Continental
Europe, and. attempts are being made through the introduction of a Seller's Pack to lessen these
costs further.
1.9 Government, Central and Local an outflow of £30.5 bn
Taxes on the ownership and transfer of property (plus another crypto-tax to be described in the
next section) are actual outflows of money. Not included are tax exemptions on incomes or capital
gains. My concern here is to trace actual as opposed to potential flows of money. However, two tax
breaks in particular give a major boost to house purchase compared to other types of investment:
— Capital Gains Tax on the potentially huge gains are free of tax for one's main residence
— Imputed Rent is the rent that would be paid by the occupier-tenant to the landlord-owner, but
which remains hypothetical because the owner and the occupier are the same person. No tax is
levied on this benefit.
We now come to four categories of home-owners, or ex-home-owners who are in receipt of
significant amounts of money. Apart from the 'Traders Down', these are the 'Last Time Sellers'
1.10 Last Time Sellers: into Renting or Residential care outflow of £2.9 bn
The category 'transfer to rented accommodation' is a quite large group - about 180,000 households
per year . Many of these will be elderly people going into sheltered accommodation. About 70,000
of these will be subject to a type of equity confiscation, the 'crypto-tax' referred to in the last
section: The proceeds of the sale of their house will be taken by the State to pay for their residential
care. (report in The Guardian 30 May 2001). Hamnett (1991) reported that in the 1980s social
policy analysts had readily identified that "home equity release would play an increasing role in
financing elderly care" (p9) The benefits to the home-owner of this form of 'equity confiscation'
are not immediately obvious, especially when those who have not saved will be paid for in full by
Social Security.
1.11. Last Time Sellers: Divorcees and Emigrants: outflow of £1.0 bn
These two groups don't make very much money, and their personal circumstances may in any case
create additional major expense.
1.12 Last Time Sellers: Inheritors: outflow £7.5 bn
The final category of last-time sellers results from the death of the home-owner, and is "the most
important route for equity withdrawal" according to Hamnett (p7). The beneficiaries of this are of
course not the home owners, but those who inherit the property after their death. Great hopes were
placed in this process for spreading wealth more widely in society, but the results have so far
disappointed. About 180,000 properties were inherited during 2000, with an average net value of
£42,000. The amount of inherited personal housing wealth is thus about £7.5 bn, which if spread
evenly could hugely aid the poorest in society. But inheritance as a social leveller has two major
drawbacks identified by Hamnett: it comes too late in life - typically an inheritor is about 50 years
old, and by keeping it in the family the recipients are generally housing-rich already. The upshot is
that the legacy is largely re-invested in financial instruments or in further property purchases. It is
a natural human impulse to want to leave something for your children's financial security, but the
home-owning route only helps a minority who either don't need it or who get it too late in life.
1.13 Traders Down: an outflow of £2.3 bn
There is one category of home-owner who is still alive to enjoy a real payoff from the
house-buying, house- mortgaging and house-selling game. Those who sell-up and move into a
cheaper property, a rented property or move in with someone else, stand to make real spendable
money without any obligation to repay. Holmans (1991) estimated that in 1985 there were about
80,000 households who made a seemingly modest £8,000 from the trade-down. Westway (1993)
speculated that this could reach 130,000 by the year 2000 with an average 'take' of £17,700,
yielding a total of £2.3 bn of free equity turned into cash. This would generally accrue to owners
who had typically been paying off a mortgage for 20 to 30 years.
____________________________________
This completes the answers to the first part, which traces the actual cash flows around home
ownership and the equity in housing. Later I will look at whether home-owning really offers such a
good return to the owner-investor, but now I want to put housing finance in the context of the
wider economy:
2.0 Housing Finance and the wider Economy
2.1 Payouts to depositors and Bank shareholders
Maintaining a financial clearing system is vital to the running of an economy, but it has to be paid
for. The biggest contributor to revenue are mortgage borrowers. The sector waxes fat on the
constant churning of mortgaging and re-mortgaging, collecting enormous sums by way of interest.
Much of this goes to maintaining the lavish network of offices and processing systems. The rest is
paid out as interest to savers, and as dividends for shareholders. All of this has to be paid for by the
homeowner: there is no other source of money flowing into the home-owning system. Hamnett
(1991) describes this (p38) as robbing Peter to pay Paul: That the bulk of existing owners capital
gains (presumably he means realised gains) are paid for by new buyers entering the market for the
first time or by existing owners trading up and taking a larger mortgage. A less charitable view
might be that this is a gigantic pyramid scam.
2.2 Driving the Economy by borrowing and spending
"In this economic recovery (Q1, 2002) homes have done much more than shelter people from the
wind and rain. They have helped shelter the whole world from deep recession" says the Economist
in a leading article on 30th
March, 2002. The confidence of home-owners borne of rising house
prices both in the UK but especially in the US enables them to borrow to spend. This keeps the
economy buoyant.
Equity withdrawal in the year 2000 amounted to £9.7 bn., which added about 1.5% to households
spending power (Bank of England figures). Mortgage Equity Withdrawers particularly vexes the
Bank of England monetary policy group. There is good reason to watch them: In the last housing
boom in 1988, the Bank failed to notice that consumers purchasing power had been expanded by
8% through this technique. Conversely, if house prices slump, or home owners lose confidence
this form of borrowing and spending, it can rapidly dry up. Without some alternative driver for the
economy, it could head into deep recession
2.3 Mortgaging and the Money System
As Michael Rowbotham (1998) explains: Governments used to issue most of the new money that
was needed to keep the economy moving. Since WW2 they have gradually abandoned their own
issue of money and left it to commercial banks to create new money. But Banks don't just give or
spend this money: they lend it and expect it to be repaid with interest. Today about 97% of all the
money in the economy has originated in this way. Only a paltry 3% has been issued by government
free of interest and repayment. The abandonment by sovereign governments of control over the
issue of our own money is a story that is glossed over by economists. But of course, as the Japanese
financial sector has discovered, offering loans on the collateral of property even at very low rates
of interest, won't get the money into the economy unless there are borrowers to take it up. No
borrowers, no loans: No loans no new money to keep the economy moving.
So where in the economy are the bankers going to find borrowers who are eager to take out
big loans, and eager to come back for more? This is where the mortgaged home-owner comes in.
Egged on by the prospect of easy capital gains, house-purchasers borrow to the hilt. Two-thirds of
the total money stock in the UK and a massive 80% in the US has derived from mortgages related
to house buying. The mortgage, 'the pledge of death' in Old French (Chambers dictionary, 1990), is
the principal pump and conduit for getting money into the economy. There could be other ways of
producing new money: Government could reclaim its seigniorage and issue the money directly (to
pay for the London Underground perhaps?). Banks could lend 'on personal recognisance' — purely
on their knowledge of the borrower. No, it's the housing market and the equity that it offers that is
the preferred vehicle for lazy bankers to deliver fresh credit into the economy.
___________________________________________________
3 HOME-OWNING: The balance sheet
3.1 An Englishman's home
But what of the house buyers who find themselves in this 'death-pledge'? Is it worthwhile? Do they
gain? As far back as 1979 Margaret Thatcher was in no doubt about the benefits of buying a house
with a mortgage: ".. .property owning democracy.. .give more of our people freedom and
mobility.. .prospect of handing on something to our children and grandchildren.". Ten years on,
Nigel Lawson echoed this, that Britain, through home-owning had become "..a nation of
inheritors" leading to a "..further diffusion of property in society". (quotes given in Hamnett, 1991)
In a market where house prices are constantly rising, this golden scenario seems to be self-evident.
Home-owners feel good as their property gains in value. The sound conventional advice is to
constantly trade up, increase your equity, take out the biggest mortgage you can. Rising house
prices will wipe out the pain, and you can look forward to becoming a quarter or a half- millionaire
in a few years time. It is such an attractive prospect, a one-way path to riches, that it is not
surprising that two-thirds of British households buy into home-owning with a mortgage.
The British obsession with home-owning, is memorably summed up by the phrase 'an
Englishman's home is his castle'. This reminds us that the satisfaction delivered by home-owning
is more than financial - the historical association of voting rights with property ownership conveys
a fundamental idea of liberty and stake-holding in the community. Such sentiments should not be
lightly cast aside. Having the freedom to do as one likes in one's own home compares especially
favourably with the rented sector, particularly renting from the local authority. Politicians like
Margaret Thatcher were quick to realise the vote-winning potential of the right-to-buy your
council house.
3.2 Cheaper than renting?
Conventional wisdom has it that buying your own home is cheaper than renting. Of course such
comparisons are not comparing like with like: In the UK there is a limited supply of main-stream
rented accommodation. Nevertheless, the Abbey National (mortgage Bank) confidently asserts
that 'house buyers are 30% better off than tenants' (April, 2002). The gap between renting and
buying has been narrowing in recent years, and would be completely wiped out for those who wish
to move frequently.
3.3 As an Investment :
Although owning a house as a place to live in is probably financially sound, this is not the main
motivation for buying. Investment, in the sense of building up a valuable asset is paramount.
Anecdotal evidence abounds that even a house of great architectural bravura will frequently be
difficult to sell, because buyers are worried about future resale. It is the views of the mortgage
valuer, not potential purchaser that determines the 'value' of a property, and houses however
spacious or attractive, if blighted by the valuers, it will not re-sell easily or at a good price. Buyers
place potential capital gain above all other features including the quality of the house as a place to
live.
But judged by this criterion, housing is a very poor investment. While capital values may
rise steadily, which fills the owners with the confidence to borrow and spend, the real payoffs are
meagre indeed. Only the traders-down pocket some real money which they can spend as they like:
The global amount extracted in this way was about £2.3 bn on a net equity value of the UK
owner-occupied housing stock of about £1,100 bn The much-hyped investment in housing yields
the investor-owners a miserly 0.2% overall. Even if we include the £7.5 bn extracted from housing
by the inheritors (mostly your relations) the yield is
(£2.3 + £7.5)/£1,100 *100 = 0.9%
The continuing enthusiasm of buyers to borrow to invest in housing seems difficult to explain.
______________________________________________
References:
Abbey National (April, 2002) Renting & Buying Guide Abbey National Bank, London (internet:
www.abbeynational.co.uk )
Bank of England (2001) Inflation Report (internet: www.bankofengland.co.uk)
Hamnett, Chris; Harmer, Michael and Williams, Peter (1991) Safe as houses: Housing
inheritance in Britain Paul Chapman, London
Holmans, A E (1991) Estimates of housing equity withdrawal by owner occupiers in the united
Kingdom; 1970 to 1990 Government Economic Service Working Ppaer No 116
Rowbotham, Michael (1998) The Grip of Death: A study of modern money, debt slavery and
destructive economics, Jon Carpenter Publishing, Oxfordshire £15.
Oswald, Andrew (2001) Buying: Why it's bad for you The Guardian Weekend , London Aug 4th
2001
The Economist Big scary monsters: Mortgage lending agencies in America July 19th
2001
Westway, Peter F (Nov, 1993) Mortgage equity withdrawal: Causes and Consequences
Discussion paper no. 59, National Institute of Economic and Social Research, London
_____________________________________
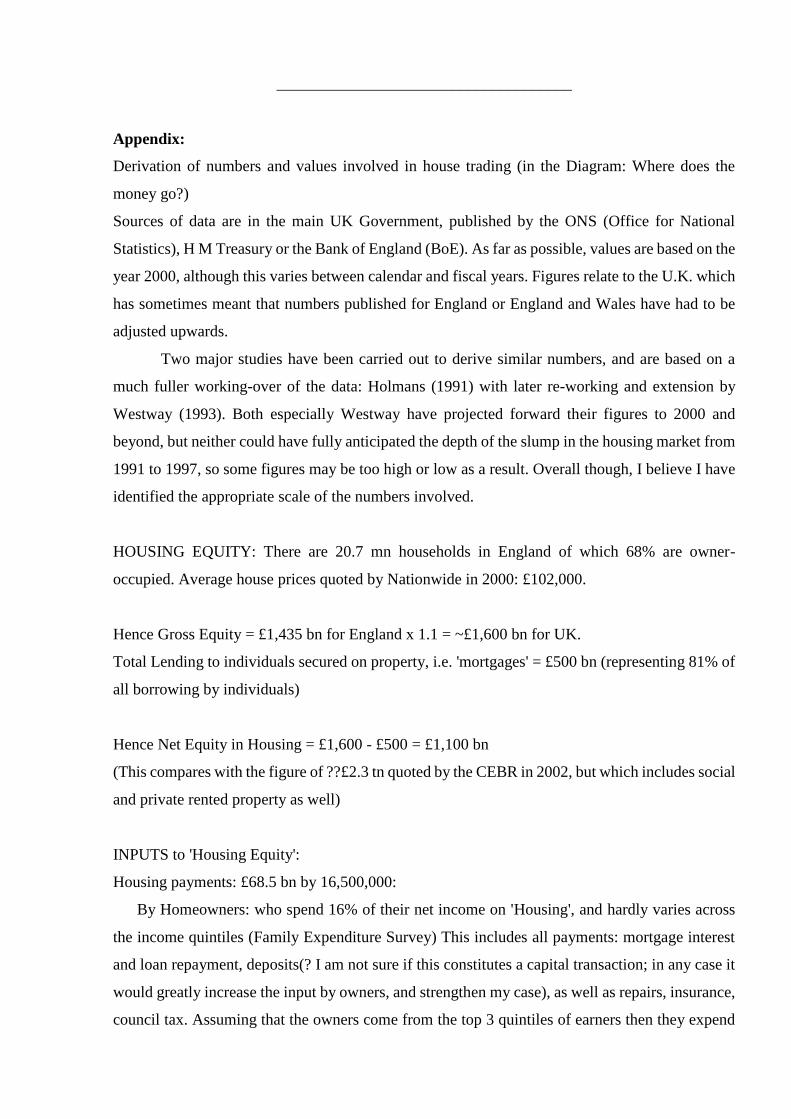
Appendix:
Derivation of numbers and values involved in house trading (in the Diagram: Where does the
money go?)
Sources of data are in the main UK Government, published by the ONS (Office for National
Statistics), H M Treasury or the Bank of England (BoE). As far as possible, values are based on the
year 2000, although this varies between calendar and fiscal years. Figures relate to the U.K. which
has sometimes meant that numbers published for England or England and Wales have had to be
adjusted upwards.
Two major studies have been carried out to derive similar numbers, and are based on a
much fuller working-over of the data: Holmans (1991) with later re-working and extension by
Westway (1993). Both especially Westway have projected forward their figures to 2000 and
beyond, but neither could have fully anticipated the depth of the slump in the housing market from
1991 to 1997, so some figures may be too high or low as a result. Overall though, I believe I have
identified the appropriate scale of the numbers involved.
HOUSING EQUITY: There are 20.7 mn households in England of which 68% are owner-
occupied. Average house prices quoted by Nationwide in 2000: £102,000.
Hence Gross Equity = £1,435 bn for England x 1.1 = ~£1,600 bn for UK.
Total Lending to individuals secured on property, i.e. 'mortgages' = £500 bn (representing 81% of
all borrowing by individuals)
Hence Net Equity in Housing = £1,600 - £500 = £1,100 bn
(This compares with the figure of ??£2.3 tn quoted by the CEBR in 2002, but which includes social
and private rented property as well)
INPUTS to 'Housing Equity':
Housing payments: £68.5 bn by 16,500,000:
By Homeowners: who spend 16% of their net income on 'Housing', and hardly varies across
the income quintiles (Family Expenditure Survey) This includes all payments: mortgage interest
and loan repayment, deposits(? I am not sure if this constitutes a capital transaction; in any case it
would greatly increase the input by owners, and strengthen my case), as well as repairs, insurance,
council tax. Assuming that the owners come from the top 3 quintiles of earners then they expend
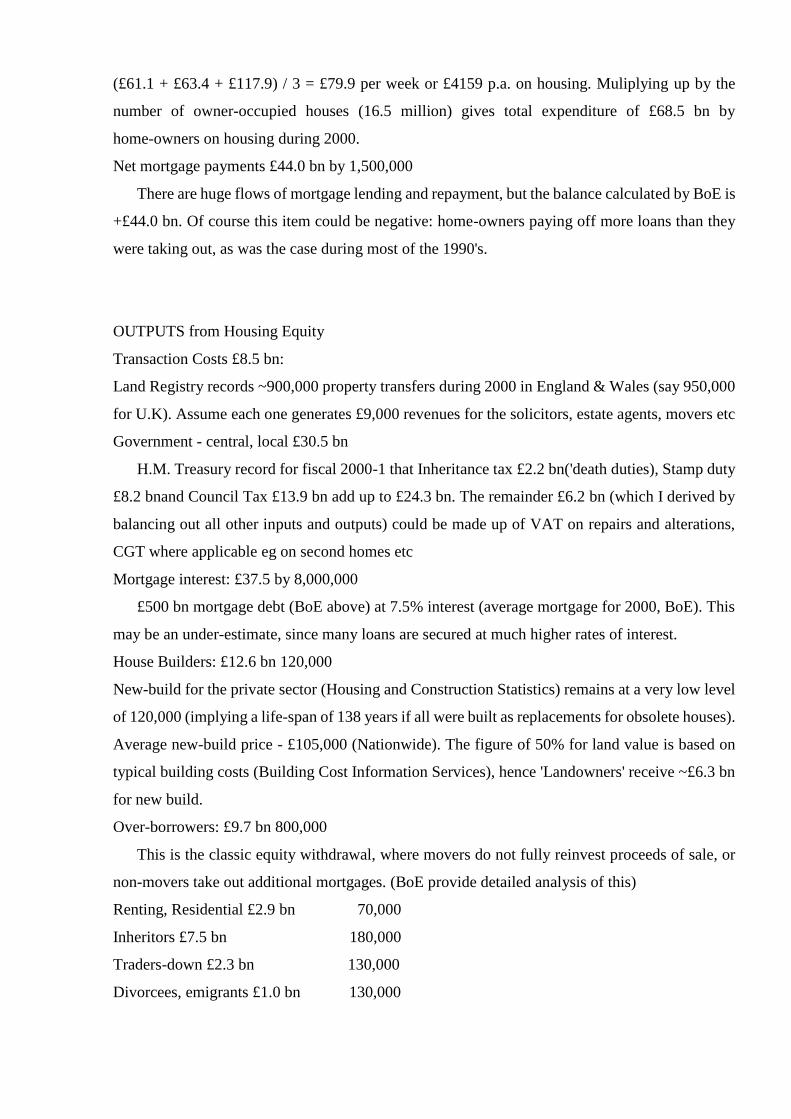
(£61.1 + £63.4 + £117.9) / 3 = £79.9 per week or £4159 p.a. on housing. Muliplying up by the
number of owner-occupied houses (16.5 million) gives total expenditure of £68.5 bn by
home-owners on housing during 2000.
Net mortgage payments £44.0 bn by 1,500,000
There are huge flows of mortgage lending and repayment, but the balance calculated by BoE is
+£44.0 bn. Of course this item could be negative: home-owners paying off more loans than they
were taking out, as was the case during most of the 1990's.
OUTPUTS from Housing Equity
Transaction Costs £8.5 bn:
Land Registry records ~900,000 property transfers during 2000 in England & Wales (say 950,000
for U.K). Assume each one generates £9,000 revenues for the solicitors, estate agents, movers etc
Government - central, local £30.5 bn
H.M. Treasury record for fiscal 2000-1 that Inheritance tax £2.2 bn('death duties), Stamp duty
£8.2 bnand Council Tax £13.9 bn add up to £24.3 bn. The remainder £6.2 bn (which I derived by
balancing out all other inputs and outputs) could be made up of VAT on repairs and alterations,
CGT where applicable eg on second homes etc
Mortgage interest: £37.5 by 8,000,000
£500 bn mortgage debt (BoE above) at 7.5% interest (average mortgage for 2000, BoE). This
may be an under-estimate, since many loans are secured at much higher rates of interest.
House Builders: £12.6 bn 120,000
New-build for the private sector (Housing and Construction Statistics) remains at a very low level
of 120,000 (implying a life-span of 138 years if all were built as replacements for obsolete houses).
Average new-build price - £105,000 (Nationwide). The figure of 50% for land value is based on
typical building costs (Building Cost Information Services), hence 'Landowners' receive ~£6.3 bn
for new build.
Over-borrowers: £9.7 bn 800,000
This is the classic equity withdrawal, where movers do not fully reinvest proceeds of sale, or
non-movers take out additional mortgages. (BoE provide detailed analysis of this)
Renting, Residential £2.9 bn 70,000
Inheritors £7.5 bn 180,000
Traders-down £2.3 bn 130,000
Divorcees, emigrants £1.0 bn 130,000
The main source for these four categories is the work of Holmans, extended by Westway. Some of
the values produced are suspect, especially when it involves extrapolating 1990 values forward to
2000, but are nevertheless of the right order:
Last-time movers include the deceased - about 180,000 households who leave £24,000 (Holmans).
This seems low, but is worth remembering the circumstances.
Move to residential includes those whose equity is confiscated to pay for residential care, hence
the (unspecified) connection back into Government.
Traders down which Holmans identified as numbering 58,000 in 1987 and would expand to
130,000 by 2000. Holmans attached the very modest value of £8,000 pay-off. I have increased this
to £17,700.


![[MS-WINSRA]: Windows Internet Naming Service (WINS](https://img.dokumen.tips/doc/110x75/631cdc546c6907d368017f1a/ms-winsra-windows-internet-naming-service-wins-.jpg)


