Embed Size (px)
Citation preview

Seediscussions,stats,andauthorprofilesforthispublicationat:https://www.researchgate.net/publication/257944272
Fibre-reinforcedConcreteforIndustrialConstruction-afracturemechanicsapproachtomaterialtestingandstructuralanalysis
THESISinDOKTORSAVHANDLINGARVIDCHALMERSTEKNISKAHOGSKOLA·DECEMBER2005
CITATIONS
19
READS
1,601
1AUTHOR:
IngemarLöfgren
ChalmersUniversityofTechnology
24PUBLICATIONS94CITATIONS
SEEPROFILE
Availablefrom:IngemarLöfgren
Retrievedon:02February2016

Fibre-reinforced Concrete forIndustrial Construction- a fracture mechanics approach to material testing and structural analysis
INGEMAR LÖFGREN
Department of Civil and Environmental Engineering Structural EngineeringCHALMERS UNIVERSITY OF TECHNOLOGY Göteborg, Sweden, 2005


THESIS FOR THE DEGREE OF DOCTOR OF PHILOSOPHY
Fibre-reinforced Concrete for Industrial Construction
- a fracture mechanics approach to material testingand structural analysis
INGEMAR LÖFGREN
Department of Civil and Environmental EngineeringStructural EngineeringCHALMERS UNIVERSITY OF TECHNOLOGY
Göteborg, Sweden, 2005

Fibre-reinforced Concrete for Industrial Construction- a fracture mechanics approach to material testing and structural analysisINGEMAR LÖFGRENGöteborg, 2005ISBN 91-7291-696-6
© INGEMAR LÖFGREN, 2005
Doktorsavhandlingar vid Chalmers tekniska högskolaNy serie nr. 2378ISSN 0346-718X
Archive no. 35
Department of Civil and Environmental EngineeringStructural EngineeringChalmers University of TechnologySE-412 96 GöteborgSwedenTelephone: + 46 (0)31-772 1000
Cover:A schematic picture illustrating the suggested and applied approach for material testingand structural analysis of FRC.
Printed by Chalmers ReproserviceGöteborg, Sweden, 2005

I
Fibre-reinforced Concrete for Industrial Construction- a fracture mechanics approach to material testing and structural analysisINGEMAR LÖFGRENDepartment of Civil and Environmental EngineeringStructural EngineeringChalmers University of Technology
ABSTRACT
More efficient and industrialised construction methods are both necessary for thecompetitiveness of in-situ concrete and essential if the construction industry is to moveforward. At present, the expenditure on labour (preparation and dismantling offormwork, reinforcing, and casting and finishing of concrete) almost equals the cost ofmaterial. Fibre-reinforced concrete (FRC) extends the versatility of concrete as aconstruction material, offers a potential to simplify the construction process and, whencombined with self-compacting concrete, signifies an important step towards industrialconstruction. However, a barrier to more widespread use of FRC has been the lack ofgeneral design guidelines which take into account the material properties characteristicof FRC, i.e. the stress-crack opening (σ-w) relationship.
The presented work has been focused on FRC, showing a strain-softening response, andthe interrelationship between material properties and structural behaviour. This has beenexamined by investigating and developing test methods and structural analysis models.A systematic approach for material testing and structural analysis, based on fracturemechanics, has been presented which covers: (1) material testing; (2) inverse analysis;(3) adjustment of the σ-w relationship for fibre efficiency; and (4) cross-sectional andstructural analysis. Furthermore, recommendations for using the wedge-splitting test(WST) method for FRC have been provided. The relative small scale of the WSTspecimens makes it ideal for use in laboratory studies, e.g. for development andoptimisation of new mixes.
By conducting experiments, the approach was demonstrated and it was shown that it ispossible to adjust the σ-w relationship for any difference in fibre efficiency between thematerial test specimen and the structural application considered. Full-scale experimentswere conducted on beams, made of self-compacting fibre-reinforced concrete, with asmall amount of conventional reinforcement. The results indicate that FRC can be usedin combination with low reinforcement ratios; the amount of conventionalreinforcement could be reduced to half that of conventional reinforced concrete (for thesame load-carrying resistance) but still lead to improved structural performance(reduced crack width and increased flexural stiffness). The results also suggest that theapproach used for the material testing provides the necessary properties to performanalyses based on non-linear fracture mechanics. Finally, when comparing the peakloads obtained in the experiments with the results from the analyses, the agreement wasgood, with a high correlation (>0.9). Hence, this demonstrates the strength of thefracture-mechanical approach for material testing and structural analysis.
Key words: concrete, in-situ cast, fibre-reinforced, self-compacting, non-linear fracturemechanics, stress-crack opening relationship, inverse analysis.

II
Fiberarmerad betong för ett industriellt platsgjutet byggande
- materialprovning och strukturanalys baserad på brottmekanikINGEMAR LÖFGRENInstitutionen för bygg- och miljöteknikKonstruktionsteknikChalmers tekniska högskola
SAMMANFATTNING
Ökade krav på produktivitet och kvalitet i byggbranschen har aktualiserat behovet av attutveckla ett resurssnålt byggande. Fiberarmerad betong i kombination medsjälvkompakterande betong innebär en möjlighet att förenkla byggandet och är ett stortsteg mot ett industriellt platsgjutet byggande. Ett hinder för denna utveckling äravsaknaden av generella dimensioneringsregler som beaktar de materialegenskaper somär karakteristiska för fiberarmerad betong, det vill säga sambandet mellan spänning-spricköppning (σ-w).
Arbetet i avhandling har fokuserats på fiberarmerad betong och sambandet mellanmaterialegenskaper och strukturrespons vilket har analyserats genom att undersöka ochutveckla metoder för materialprovning och modeller för strukturanalys, båda baseradepå brottmekanik. I avhandlingen presenteras en metodik som omfattar: (1)materialprovning; (2) parameteridentifikation (för att bestämma σ-w sambandet); (3)korrigering av σ-w sambandet avseende skillnad i fibereffektivitetsfaktor; samt (4)tvärsnitts- och strukturanalys. Genomförda experiment har påvisat att det är möjligt attta hänsyn till skillnader i fibereffektivitetsfaktor och att det därför går att korrigera σ-wsambandet, vilket även behövs om strukturresponsen skall beskrivas realistiskt. Iavhandlingen presenteras även förslag på hur ”kil-spräck” metoden (wedge-splitting testmethod) kan använda för fiberbetong. Kil-spräck metoden är väl lämpad förlaboratoriestudier, t ex vid utveckling och optimering av nya fiberbetonger, tack vare attrelativt små provkroppar används.
En slutsats av arbetet är att fiberarmerad betong i kombination med konventionellarmering medför att denna kan halveras (för samma bärförmåga), men trots detta erhållsen bättre prestanda (mindre sprickvidd och ökad böjstyvhet). Detta påvisades i utfördafullskaleförsök som genomfördes på balkar, gjutna med självkompakterandefiberarmerad betong, med en liten mängd konventionell armering.
Slutligen, genom de försök som har utförts (både materialprovning och fullskaleförsök)har den föreslagna metodiken demonstrerats och när resultaten från fullskaleförsökenjämfördes med beräknade var överensstämmelsen god, med en hög korrelation (>0.9).Detta belyser således styrkan i en brottmekanisk approach för materialprovning ochstrukturanalys.
Nyckelord: betong, platsgjuten, fiberarmerad, självkompakterande, ickelinjärbrottmekanik, samband spänning-spricköppning, parameter-identifikation.

III
LIST OF PUBLICATIONS
This thesis is based on the work contained in the following papers, referred to byRoman numerals in the text.
I. Löfgren, I. and Gylltoft, K.: In-situ cast concrete building: Important aspects ofindustrialised construction, Nordic Concrete Research, 1/2001, pp. 61-80.
II. Löfgren, I.: Lattice-girder elements – Investigation of structural behaviour andperformance enhancements, Nordic Concrete Research, 1/2003, pp. 85-104.
III. Löfgren, I., Stang, H., and Olesen, J.F.: The WST method, a fracture mechanicstest method for FRC. Paper submitted for publication in Materials and Structures(2005-04-03), 11 pp.
IV. Löfgren, I., Olesen, J.F., and Flansbjer, M.: The WST method for fracture testingof fibre-reinforced concrete. Paper accepted for publication in Nordic ConcreteResearch, 2/2005, 19 pp.
V. Löfgren, I., Stang, H., and Olesen, J.F.: Fracture properties of FRC determinedthrough inverse analysis of wedge splitting and three-point bending tests, Journalof Advanced Concrete Technology, Vol. 3, No. 3, pp. 425-436, October 2005,Japan Concrete Institute.
VI. Löfgren, I.: Fracture behaviour of reinforced FRC beams. Paper submitted forpublication in Structural Concrete, Journal of the fib, October 2005.

IV
OTHER PUBLICATIONS BY THE AUTHOR
During the course of this work, subsequent results and supplementary work have beenpresented on several occasions. Moreover, some of the work has been presented innational engineering magazines for a wider audience. This work has been presented inthe following publications:
LICENTIATE THESIS
Löfgren, I.: In-situ concrete building systems – Developments for industrialconstruction. Licentiate Thesis. Publication 02:2, Department of StructuralEngineering, Chalmers University of Technology, Feb. 2002, 138 pp.
CONFERENCE PAPERS
Esping, O. and Löfgren, I.: Investigation of early age deformation in self-compactingconcrete. Presented at the Knud Højgaard conference on Advanced Cement-BasedMaterials - Research and Teaching, at Technical University of Denmark, Lyngby, 12-15 June 2005.
Löfgren, I., Stang, H., and Olesen, J.F.: Wedge splitting test – a test to determinefracture properties of FRC. In Fibre-Reinforced Concretes - BEFIB 2004 –Proceedings of the Sixth RILEM symposium. Eds. M.di Prisco, R. Felicetti, and G.A.Plizzari, pp. 379-388, Varenna, Italy, 20-22 September 2004. PRO 39, RILEMPublications S.A.R.L, Bagneaux.
Löfgren, I.: The wedge splitting test – a test method for assessment of fractureparameters of FRC? In Fracture Mechanics of Concrete Structures, Vol. 2, eds. Li etal., pp. 1155-1162. Ia-FraMCos, 2004. Proceedings of the fifth internationalconference on fracture mechanics of concrete and concrete structures. In Vail,Colorado/USA, 12-16 April 2004.
Löfgren, I.: Analysis of Flexural Behaviour and Crack Propagation of Reinforced FRCMembers. In Proceedings of the Workshop Design Rules for Steel Fibre ReinforcedConcrete Structures, Nordic Miniseminar: Design Rules for Steel Fibre ReinforcedConcrete Structures, Oslo, Norway, October 6, 2003, pp. 25-34.
Löfgren, I. and Gylltoft, K.: Lattice Girder Elements – Structural Behaviour andPerformance Enhancements. In Proceedings XVIII Nordic Concrete ResearchSymposium, Helsingör, Denmark, 2002.
Löfgren, I., Gylltoft, K. and Kutti, T.: In-situ concrete building – Innovations inFormwork. Accepted contribution to the 1st International Conference on Innovation inArchitecture, Engineering and Construction (AEC) in Loughborough, 2001, 10 pp.
Löfgren, I.: Nya Stomsystem för platsgjutet byggande. Presented at: Workshop om nyaidéer för framtidens byggande av bärande konstruktioner, Göteborg 2001.

V
REPORTS
Esping, O. and Löfgren, I.: Cracking due to plastic and autogenous shrinkage –Investigation of early age deformation of self-compacting concrete – Experimentalstudy. Publication 05:11, Department of Civil and Environmental Engineering,Chalmers University of Technology, 95 pp.
Löfgren, I., Olesen, J.F., and Flansbjer, M.: Application of WST-method for fracturetesting of fibre-reinforced concrete. Report 04-13, Department of StructuralEngineering and Mechanics, Chalmers University of Technology, Göteborg 2004.
Löfgren, I.: Wedge splitting test method. Pilot Experiments. Report 03:1, Department ofStructural Engineering and Mechanics, Chalmers University of Technology, Göteborg2003.
Löfgren, I.: Provning av spännarmerade plattbärlag – Provningsuppdrag för ABFärdig Betong. Rapport Nr.02:16, Institutionen för Konstruktionsteknik –Betongbyggnad, Chalmers Tekniska Högskola, Göteborg 2002.
Löfgren, I.: Deformationsmätning vid pågjutning av plattbärlag – Provningsuppdragför AB Färdig Betong. Rapport Nr. 02:9, Institutionen för Konstruktionsteknik –Betongbyggnad, Chalmers Tekniska Högskola, Göteborg 2002.
Löfgren, I.: Lattice Girder Elements in Bending: Pilot Experiment. Chalmers Universityof Technology, Department of Structural Engineering – Concrete Structures, ReportNo. 01:7, Göteborg 2001.
OTHER PUBLICATIONS
Löfgren, I.: Fiberbetong – beräkningsmetod för bärande konstruktioner. Bygg & Teknik7/2004, pp. 32.
Löfgren, I. och Johansson, M.: Forskning och utveckling för framtida stombyggnads-teknik. Bygg & Teknik 2/2003, pp. 12.
Löfgren, I.: Industriellt platsgjutet byggande: Principer och metoder förindustrialisering. Bygg & Teknik, 2/2001, pp. 60-64.

Contents
ABSTRACT I
SAMMANFATTNING II
LIST OF PUBLICATIONS III
OTHER PUBLICATIONS BY THE AUTHOR IV
CONTENTS VI
PREFACE IX
NOTATIONS X
1 INTRODUCTION 1
1.1 Background 1
1.2 Aims, scope and limitations 3
1.3 Outline of the thesis 3
1.4 Original features 4
2 IN-SITU CAST CONCRETE CONSTRUCTION 5
2.1 Introductory remark 5
2.2 Concrete as a construction material 5
2.3 Industrial in-situ cast concrete construction 7
2.4 Cost of in-situ concrete construction 9
2.5 Developments of in-situ concrete construction 112.5.1 Formwork systems 132.5.2 Reinforcement technology 152.5.3 Concrete technology 16
2.6 Concluding remarks 18
3 FIBRE-REINFORCED CONCRETE 19
3.1 General 19
3.2 Fibre technology 193.2.1 Fibre geometries 213.2.2 Fibre materials and physical properties 22
3.3 Orientation and distribution of fibres 24
3.4 Mechanics of crack formation and propagation 283.4.1 Microstructure and microstructural development 293.4.2 Pre-cracking mechanisms (Stress transfer) 333.4.3 Post-cracking mechanisms (crack bridging) 37
3.5 Mechanical properties 483.5.1 Compressive properties 48

VII
3.5.2 Tensile properties 503.5.3 Shear properties 52
3.6 Concluding remarks 52
4 FRACTURE-MECHANICS-BASED MATERIAL TESTING OF FRC 53
4.1 Introduction 53
4.2 Approach for determining the σ-w relationship 544.2.1 Material testing 554.2.2 Inverse analysis 564.2.3 Adjustment of σ-w relationship for fibre efficiency 59
4.3 Investigation of fracture test methods 634.3.1 Uni-axial tension test 644.3.2 Three-point bending test on notched beams 674.3.3 Wedge-splitting test method 684.3.4 Comparison and evaluation of methods 75
4.4 Concluding remarks 79
5 FRACTURE-MECHANICS-BASED STRUCTURAL ANALYSIS 81
5.1 Introductory remarks 81
5.2 Design and analysis approaches 815.2.1 Finite element method 815.2.2 Analytical approaches 83
5.3 Non-linear hinge model 845.3.1 Members without conventional reinforcement 875.3.2 Members with conventional reinforcement 885.3.3 Influence of the σ-w relationship 915.3.4 Effect of normal force 955.3.5 Comparison of conventional RC- and FRC-members 96
5.4 Concluding remarks 98
6 STRUCTURAL APPLICATIONS 99
6.1 Fracture behaviour of reinforced FRC beams 996.1.1 Full-sale experiments 1006.1.2 Fibre quantity and distribution in specimens 1036.1.3 Materials testing 1046.1.4 Inverse analysis 1066.1.5 Adjustment of the σ-w relationship for fibre efficiency 1106.1.6 Analysis of experiments 1116.1.7 Concluding discussion 117
6.2 The lattice girder system - an application study 1186.2.1 Difficulties in design and analysis 1196.2.2 Laboratory tests 1206.2.3 Numerical analysis 1216.2.4 Structural behaviour 121

6.2.5 Improved performance 1246.2.6 Concluding discussion 125
7 CONCLUSIONS 127
7.1 General conclusions 127
7.2 Suggestions for future research 129
8 REFERENCES 131
PAPER I - PAPER VI
I. Löfgren, I. and Gylltoft, K.: In-situ cast concrete building: Important aspects ofindustrialised construction, Nordic Concrete Research, 1/2001, pp. 61-80.
II. Löfgren, I.: Lattice-girder elements – Investigation of structural behaviour andperformance enhancements, Nordic Concrete Research, 1/2003, pp. 85-104.
III. Löfgren, I., Stang, H., and Olesen, J.F.: The WST method, a fracture mechanicstest method for FRC. Paper submitted for publication in Materials and Structures(2005-04-03), 11 pp.
IV. Löfgren, I., Olesen, J.F., and Flansbjer, M.: The WST method for fracture testingof fibre-reinforced concrete. Paper accepted for publication in Nordic ConcreteResearch, 2/2005, 19 pp.
V. Löfgren, I., Stang, H., and Olesen, J.F.: Fracture properties of FRC determinedthrough inverse analysis of wedge splitting and three-point bending tests, Journalof Advanced Concrete Technology, Vol. 3, No. 3, pp. 425-436, October 2005,Japan Concrete Institute.
VI. Löfgren, I.: Fracture behaviour of reinforced FRC beams. Paper submitted forpublication in Structural Concrete, Journal of the fib, October 2005.

IX
Preface
The work presented in this thesis was initiated by AB Färdig Betong / Thomas ConcreteGroup together with Chalmers University of Technology as a response to the increaseddemand for improved construction methods for in-situ cast concrete structures. Thework was carried out from November 1999 until December 2005 at ChalmersUniversity of Technology, at the Department of Civil and Environmental Engineering,Division of Structural Engineering, Concrete Structures. Part of the work has been donein collaboration with the Technical University of Denmark, and a part has beenconducted as a NORDTEST project (No. 04032 1672-04, Part I).
First of all, I would like to thank my supervisor and examiner, Prof. Kent Gylltoft, forhaving given me the opportunity to work on this research project, for allowing andencouraging me to pursue my ideas, and for the valuable discussions we have hadthroughout the work. I would also like to extend my appreciation to Prof. BjörnEngström who has enthusiastically shared his broad and deep knowledge.
Penultimate, but not last, are thanks to all of my colleagues – present and former – at theDepartment who have all, in one way or another, assisted with the many theoretical andpractical problems encountered, as well as for their good humour making the work moreenjoyable. The staff in the laboratory is remembered with appreciation for its helpfuland technical assistance in the experiments. Moreover, I would like to extend mysincere gratitude to Prof. Henrik Stang and Prof. John Forbes Olesen at the TechnicalUniversity of Denmark (DTU) for a valuable and rewarding collaboration. Thelaboratory staff and the Ph.D. students at DTU are also appreciated for their hospitalityand for introducing me to the laboratory facilities and the testing machines.
Finally, but not least, I would like to express my sincere gratitude to the companies thatmade this project possible through a donation to Chalmers: Thomas Concrete Group andAB Färdig Betong. Special appreciation is due to Oskar Esping, my fellow Ph.D.student at Färdig Betong and Chalmers, for providing indispensable help regarding thedesign of self-compacting concrete, and who assisted in developing the self-compactingfibre-reinforced concrete used in the full-scale experiments. For their involvement in theproject, I would also like to thank Tomas Kutti, his colleagues at Färdig Betong –particularly the ever so enthusiastic production staff at the Ringö plant – and the staff atthe Central Laboratory of Thomas Concrete Group. Furthermore, Bekaert Sweden isappreciated for having supplied fibres to the experiments.
It is my hope that this thesis will be read and reviewed critically, and that anyviewpoints, comments and suggestions regarding its content will be directed to me.
Göteborg, November 2005
Ingemar Löfgren

Notations
Upper case letters
A Cross-sectional area
Af Cross-sectional area of fibre
E Modulus of elasticity
Ec Modulus of elasticity of concrete
Ef Modulus of elasticity of fibre
Em Modulus of elasticity of matrix
Fsp Splitting load in the wedge-splitting test
Fv Vertical load in the wedge-splitting test
GF Specific fracture energy
Gf Specific energy dissipated during fracture
I Second moment of inertia
Le Embedment length
Lf Fibre length
M Bending moment
Mcr Cracking moment
N Normal force
Nb Number of bridging fibres
Nf.exp Number of fibres per unit area in a fractured specimen
Vf Volume fraction of fibres
Vm Volume fraction of matrix
Rm Average centre-to centre inter-fibre distance
Q Point load
Lower case letters
a Length of crack
a1 Initial slope of the bi-linear σ-w relationship
a2 Second slope of the bi-linear σ-w relationship
b2 Intersection of the bi-linear σ-w relationship with the y-axis
b Width of beam section
df Diameter of fibre
d1 Distance from compressive edge to reinforcement
fc Compressive strength
ft Tensile strength
fct Tensile strength of concrete
fy Yield strength of reinforcement

XI
fu Tensile strength of reinforcement
h Height of beam section
lch Characteristic length
s Crack spacing or length of non-linear hinge region
rf Fibre radius
w Crack opening
wc Critical crack opening for which σ(w) = 0
w/c water cement ratio
w/b water binder ratio
(w/b)eff effective water binder ratio (calculated using k-factor acc. to EN 206-1)
w/f water filler ratio (volume-based)
y0 Depth of compressive zone
z Centroidal distance
Greek letters
α Wedge angle in the wedge-splitting test
Deflection
Strain
c Concrete strain
u Failure strain of reinforcement
Poisson’s ratio
ρ Reinforcement ratio
µ Coefficient of friction
κ Curvature
κm Average curvature of non-linear hinge element
θ Crack opening angle
ηb Fibre efficiency factor
λf Aspect ratio of fibre (length / diameter)
Stress
(w) Stress as a function of crack opening
w Stress as a function of crack opening
b Bridging stress
ab Aggregate bridging stress
fb Fibre bridging stress
τav Average bond strength
τi Interfacial shear stress
φ Fibre orientation angle

Abbreviations
ACI American Concrete InstituteCMOD Crack Mouth Opening DisplacementCoV Coefficient of VarianceCTOD Crack Tip Opening DisplacementC-S-H Calcium Silicate HydrateC3S Tri-calcium SilicateDTU Technical University of DenmarkEC 2 Eurocode 2FEA Finite Element AnalysisFEM Finite Element MethodFRC Fibre-Reinforced ConcreteFRP Fibre-Reinforced PolymersHSC High-Strength ConcreteHPFRCC High-Performance Fibre-Reinforced Cementitious CompositeLWAC LightWeight Aggregate ConcreteNSC Normal-Strength ConcretePVA Polyvinyl acetatePP PolypropyleneRC-65/60 Specification of Dramix® fibre (65/60 = aspect ratio / length)RILEM International Union of Laboratories and Experts in Construction
MaterialsSFRC Steel Fibre-Reinforced ConcreteSCC Self-Compacting ConcreteUTT Uni-axial Tension TestWST Wedge-Splitting TestITZ Interfacial Transition Zone3PBT Three-Point Bending Test
e.g. For example (Latin empli gratia)i.e. That is (Latin id est)vs. Versusσ-w Stress-crack opening

CHALMERS, Civil and Environmental Engineering 1
1 INTRODUCTION
1.1 Background
In the course of the 20th century, reinforced concrete has established itself as one of themajor building materials, and today concrete structures, including buildings, bridges,power plants, dams, etc., constitute a large part of the modern civil infrastructure.Nonetheless, more efficient and industrial construction of concrete structures withimproved performance can be viewed as a necessity for the future competitiveness ofconcrete, and is essential if the concrete construction industry is to move forward. Amotive for the need of such development can be found when analysing constructioncosts, which indicates that presently the expenditure on labour (e.g. preparation anddismantling of formwork, reinforcing, and casting and finishing of concrete) almostequals the cost of material. For a concrete building, roughly 40 percent of the total costof the superstructure can be referred to labour costs. On the other hand, there arematerial technologies available which have the potential to significantly reduce some ofthe more labour-intensive construction activities. Examples of such materials are self-compacting (SCC) and fibre-reinforced concrete (FRC). For instance, SCC is wellsuited for a mechanised and automated manufacturing process, and was initiallydeveloped in Japan as a response to the lack of construction workers and a need toimprove quality. Moreover, FRC has for a long time been perceived as a material withpotential and a material which extends the versatility of concrete as a constructionmaterial, by providing an effective method of overcoming its intrinsic brittleness, andby presenting an opportunity to reduce one of the more labour-intensive activitiesnecessary for concrete construction. For example, Krenchel (1974) pointed out earlythat “If, as in the case of the fibre-reinforced mortar, it one day proves possible toachieve an apparent elongation at rupture for ordinary concrete that is ten or moretimes the value normally achieved, it will be found that, for example, many of thestructures for which pre-stressed concrete is now used can be produced more simplyand economically in ordinary, reinforced concrete with a certain percentage of fibresadded as secondary reinforcement for crack distribution. Moreover, the risks ofcorrosion of the principal reinforcement will be so reduced that it should be possible touse considerably less concrete cover than is normal to-day. Particularly in the case ofreinforced concrete water tanks, sea-bed structures and similar, this should be of greateconomic importance.”
In some types of structures, such as slabs on grade, foundations, and walls, fibres canreplace ordinary reinforcement completely. In other structures, such as beams andsuspended slabs, fibres can be used in combination with ordinary or pre-stressedreinforcement. In both cases the potential benefits are due to economic factors as well asto rationalisation and improvement of the working environment at the construction site.From a structural viewpoint, on the other hand, the main reason for incorporating fibresis to improve the fracture characteristics and structural behaviour through the fibres’ability to bridge cracks; see Figure 1. This mechanism influences both the serviceabilityand ultimate limit states. The effects on the service load behaviour are controlled crackpropagation, which primarily reduces the crack spacing and crack width, and increasedflexural stiffness. The effect on the behaviour in the ultimate limit state is increased loadresistance and, for shear and punching failures, fibres also improve the ductility.

CHALMERS, Civil and Environmental Engineering2
w
- Increased shear resistance- Increased punching resistance- Increased dowel effect- Inhibiting growth of splitting cracks- Increased confinement of anchored bars
- Reduced crack spacing- Reduced crack widths- Increased moment resistance- Increased flexural stiffness- Increased ductility in compression- Improved behaviour at elevatedtemperature
NM
V
Figure 1. Effect of fibres on the structural behaviour.
But a widespread use of FRC, also for structural applications, has yet to appear. Abottleneck has been a lack of standardised test and design methods which take intoaccount the material properties characteristic of FRC, i.e. the tensile stress-crackopening (σ-w) relationship. Existing standardised test and design methods have notalways been consistent in the treatment. For example, the tensile behaviour has beencharacterised by dimensionless toughness indices or by flexural strength parameters,thus failing to distinguish clearly between what is relevant to the behaviour of thematerial as such and what concerns the structural behaviour of the test specimen. As aconsequence, the determined parameters (toughness indices or flexural strengthparameters) have been found to be size-dependent. From the viewpoint of structuralengineers, structures with FRC are still difficult to design, which to some extent mightbe explained by inexperience with FRC, but is mainly due to the lack of design codes.
A consistent framework for material testing and structural analysis is non-linear fracturemechanics. With non-linear fracture mechanics it is possible to accurately predict andsimulate the fracture process, and this is necessary for materials like fibre-reinforcedconcrete, which has a significantly different cracking behaviour compared to plainconcrete, and/or when design requirements for the service state are governing. However,fracture mechanics requires knowledge of fracture parameters – material parametersadditional to those traditionally used for design. For fibre-reinforced concrete, thefracture parameters can be described by the σ-w relationship, but to obtain thisfundamental relationship it is necessary to have appropriate test methods and, if indirecttest methods are used, it may also call for a procedure for interpreting the test results(i.e. inverse analyses or parameter estimation). A drawback, though, is that structuralengineers generally are not familiar with, or at ease using, the concept of non-linearfracture mechanics – even though it is almost thirty years since the fictitious crackmodel was proposed by Hillerborg and co-workers (see Hillerborg et al. 1976 andHillerborg 1980). Nowadays several simplified analytical approaches are available, andthe continuous development of finite element software introduces new possibilities forstructural engineers.

CHALMERS, Civil and Environmental Engineering 3
When examining some of the current research literature, it appears that FRC is gainingfurther acceptance as a construction material, as a number of countries andorganisations are developing new and improved design guidelines; see e.g. RILEM TC162-TDF, Kanstad (2003), Ahmad et al. (2004). The number of practical applications isalso growing, and some examples of noteworthy structural applications are tunnellinings (see e.g. Nanakorn and Horii 1996, and Kooiman 2003) and suspended flat slabswithout any conventional reinforcement (see e.g. Gossla and Pepin 2004). A summaryof different applications is provided by Li (2002). In addition, recently a number ofdissertations on the subject of FRC have been published; see e.g. Aarre (1992), Glavind(1992), Pedersen (1996), Li (1998), Dubey (1999), Groth (2000), Kooiman (2000),Barragán (2003), Dupont (2003), Pfyl (2003), Rosenbuch (2003), Ay (2004),Grünenwald (2004). Also a number of workshops and conferences have also been held;see e.g. Banthis and Mindess (1995), Banthia et al. (1998), Rossi and Chanvillard(2000), Silfwerbrand (2001), Kanstad (2003), di Prisco et al. (2004b&c), and Ahmad etal. (2004).
1.2 Aims, scope and limitations
The principal aim of this research project has been to improve the current knowledge ofthe mechanical and structural behaviour of fibre-reinforced concrete. One more specificaim has been to investigate and develop a consistent methodology for structural analysisof fibre-reinforced concrete, which includes material testing and inverse analysis. Along-term aim of the project is also that it may advance the use of fibre-reinforcedconcrete and thus lead to more efficient and industrial construction of in-situ castconcrete.
Regarding its scope, the work has briefly considered the construction process as awhole, but the main focus has been on the interrelationship between materials, theirproperties and how these may be determined, and the structural behaviour/performance.
The work has been limited to investigating steel-fibre reinforced concrete, whichexhibits a tensile softening behaviour, and the applications investigated have had afocus on commercial and residential construction. Furthermore, the loading conditionsinvestigated have been limited to bending in combination with normal force, and onlythe short-term response has been investigated (i.e. no creep and shrinkage).
The recipients of this work have been envisaged as structural engineers, materialsuppliers and materials testing institutes, as well as standardisation organisations andcode officials.
1.3 Outline of the thesis
This thesis consists of six papers and an introductory part. The introductory part gives amore comprehensive background to the subjects treated in the papers.
In Chapter 2 and Paper I, findings from a preparatory study are presented; this is relatedto construction aspects of in-situ cast concrete and industrial construction. Additional

CHALMERS, Civil and Environmental Engineering4
information is also provided on in-situ construction methods, the cost of construction,etc. and examples of recent developments.
Chapter 3 provides background information on the mechanics of fibre-reinforcedconcrete, and the mechanisms of crack formation and propagation are reviewed.Examples of different types of fibres are given, and the orientation and distribution offibres are discussed.
In Chapter 4 and Papers III to V, different test methods are presented and the resultswhen using them are compared. An approach for determining the stress-crack openingrelationship is presented, which consists of three steps: (1) material testing; (2) inverseanalysis; and (3) adjustment of the stress-crack opening relationship for fibre efficiency.
Chapter 5 deals with design and analysis methods for flexural members based onfracture mechanics. A comparison is made between an analytical approach (based onthe non-linear hinge concept) and finite element analyses based on non-linear fracturemechanics. Finally, examples using the approaches are presented and the flexuralbehaviour and crack propagation in FRC members (with and without conventionalreinforcement) are analysed and discussed, as well as compared with conventionalreinforced concrete members.
In Chapter 6 and Papers II and VI, two structural applications are investigated, usingboth experiments and analyses. In addition, the suggested approach is used and itsapplicability demonstrated.
The major conclusions are presented in Chapter 7 together with suggestions for futureresearch.
1.4 Original features
The work presented in this thesis is primarily a study of the mechanical behaviour offibre-reinforced concrete. It has been shown that by combining both experiments andnon-linear fracture mechanics, a powerful combination is obtained in gaining betterunderstanding of the mechanical behaviour. Throughout the work, inverse analyses havesystematically been used to determine the tensile fracture properties which have beenused in analyses to investigate the structural behaviour and predict the response.
Recommendations have been provided for: using the wedge-splitting test (WST) as afracture test method for fibre-reinforced concrete, and for performing inverse analyses.An approach has been suggested by which it is possible to consider and adjust for anydifferences in fibre efficiency (i.e. number of fibres) between a material test specimenand ideal conditions (e.g. random 3-D orientation) or a structural element. In addition,the author has further developed a previously proposed analytical approach (based onthe non-linear hinge concept) for analysis of flexural members and this has beencompared with detailed analyses, using the finite element method and non-linearfracture mechanics, as well as full-scale experiments.

CHALMERS, Civil and Environmental Engineering 5
2 In-situ cast concrete construction
2.1 Introductory remark
Several studies of the construction industry have pointed out shortcomings that urgentlyneed attention. Recent studies in the USA and UK suggest that up to 30 percent ofconstruction is rework, labour is used at only 40 to 60 percent of potential efficiency,accidents can account for 3-6 percent of total project costs, and at least 10 percent ofmaterials are wasted; see Table 1. In numerous studies from different countries, the costof poor quality, as measured on site, has turned out to be 10 to 20 percent of totalproject cost (Cnudde 1991). Furthermore, the increase of efficiency in the constructionindustry lags behind other manufacturing industries. Between 1965 and 1996 theincrease of productivity in Sweden was only 2.6 percent per year in the constructionindustry, compared to 3.9 percent per year for other industries (see SOU 2000:44).
Table 1. Compilation of data on construction waste, from Koskela (1992).
Waste Cost CountryQuality cost (non-conformance) 12% of total project costs USAExternal quality cost (during facility use) 4% of total project costs SwedenLack of constructability/buildability 6-10% of total project costs USAPoor material management 10-12% of labour costs USAExcess consumption of materials on site 10% on average SwedenWorking time used for non-value-adding activities on site roughly 2/3 of total time USALack of safety 6% of total project costs USA
2.2 Concrete as a construction material
In the course of the 20th century, reinforced concrete has established itself as one of themajor building materials and today concrete structures, including buildings, bridges,power plants, dams, etc., constitute a large part of the modern civil infrastructure. Theyearly annual consumption of cement was estimated in 2000 to be 1.66 billion tons(CEMBUREAU 2000); this corresponds to 7 billion m3 concrete or roughly 1 m3 perperson and year.
Concrete, as a material, belongs to a large group of brittle matrix materials, which alsoinclude ceramics. In ENV 206-1 (3.1.1) concrete is defined as material formed bymixing cement, coarse and fine aggregate, and water, and produced by the hardening ofthe cement paste (cement and water); besides these basic components, it may alsocontain admixtures and/or additions. The resulting composite material is strong incompression but relatively weak in tension, and therefore steel reinforcement is oftenincorporated to carry the tensile stresses. The mechanical properties of the hardenedconcrete and the rheological properties of the fresh concrete are relatively easy to varywithin certain limits. The density produced with regular aggregates is around2400 kg/m3; the compressive strength, which can be achieved without any specialconsiderations, ranges from 20 up to 100 MPa, and the modulus of elasticity typicallyranges from 25 to 45 GPa. Furthermore, using lightweight aggregates, with a density

CHALMERS, Civil and Environmental Engineering6
below 1500 kg/m3 it is possible to produce concrete with densities below 2000 kg/m3
having compressive strength up to 65 MPa and a modulus of elasticity of 25 GPa (seefib Bulletin 8 2000). In national and international standards, concretes generally areclassified according to their compressive strength. However, a distinction is often madebetween different types of concrete depending on the composition, state of hardening orspecial properties, of a concrete in particular (see Hilsdorf 1995) and this can be:
according to its density: light-weight, normal-weight, and heavy-weight;
according to its state of hardening: fresh, young, and hardened concrete;
according to the consistence of fresh concrete: earth moist, no-slump, plastic,self-compacting concrete, etc.;
according to its properties or areas of application: high-strength, frost-resistant,resistant against chemical attack, abrasion-resistant, architectural, massconcrete, etc.;
according to the location of its production: site-mixed, ready-mixed, precastconcrete, etc.;
according to its structure: normal, aerated, air-entrained, etc.;
according to the type of reinforcement: plain, reinforced, prestressed, fibre-reinforced, etc.; and
according to the method of placement, transportation, and compaction:pumpable, shotcrete, prepact, roller compacted, etc.
As a construction material, concrete has advantages and disadvantages; some of theseare listed in Table 2. The advantages of concrete are what make this material soubiquitous, for example: the cost of concrete is relatively low (cost per unit volume);concrete is moisture-resilient and can be made water-impermeable; concrete is non-combustible and can resist high temperatures; concrete is, due to its high density, sound-absorbing and capable of thermal storage; concrete structures can also be made durable,although this requires experienced designers, work executed with good quality, and aproper mix design. The disadvantages, on the other hand, are responsible for problemsin infrastructure deterioration, service load failures by excessive cracking anddeflections. Concrete is an intrinsically brittle material with low ductility and, what ismore, high-strength concrete is even more brittle. The tensile strain capacity is low, andthe tensile strength is only about 5% to 10% of its compressive strength. For mostpractical purposes in design, the tensile strength is ignored and reinforcement is addedto overcome the poor tensile behaviour. Concrete is not volume-stable over time; itshrinks, swells, and, when subjected to an external action, creeps. Concrete has a lowstrength-to-density ratio. Concrete requires a formwork to support it until it hashardened. Concrete, when newly cast, may be sensitive to early age drying and plasticshrinkage cracks may form; see Esping and Löfgren (2005). Desiccation of moisturerequires time, which sometimes may be important for the speed of construction.

CHALMERS, Civil and Environmental Engineering 7
Table 2. Advantages and disadvantages of concrete, from Mindess et al. (2003).
Advantages DisadvantagesAbility to be cast Low tensile strengthEconomical Low ductilityDurable Volume instabilityFire-resistant Low strength-to-weight ratioEnergy-efficientOn-site fabricationAesthetic properties
To make the most of the advantages and avoid, or reduce the effects of, thedisadvantages, a proper mix design should be made. A concrete mix composition has tosatisfy a number of different performance criteria, which cover both the fresh andhardened concrete as well as cost considerations; see e.g. de Larrard (1999), Neville(2000), and Mindess et al. (2003). Examples of characteristics that may be consideredcritical in different applications are listed in Table 3.
Table 3. Examples of some different performance criteria.
Fresh properties Hardened propertiesease of placement compressive and tensile strengthcompaction without segregation modulus of elasticityfilling ability creep and shrinkagefinishability permeabilityheat of hydration densityresistance against plastic shrinkage cracking toughness (ductility or brittleness)
durability
To design and choose the ‘right’ mix for the ‘right’ application requires soundengineering input and knowledge of materials science, the construction procedures, andstructural engineering. As concrete usually is made from locally available materials, it isalso essential that the material supplier, together with the structural engineer and thecontractor, collaborate in the specification of the concrete in order to produce/deliverhigh-quality and aesthetic concrete structures. The contractor’s ability to operateefficiently and competitively is also directly affected by the design concept and thematerial choices that are made and, in the end, this may have a large impact on the costsof construction. For this purpose, some types of concretes, e.g. self-compacting andfibre-reinforced concrete, can have a significant impact on the construction process as itis possible to increase the mechanisation and automation.
2.3 Industrial in-situ cast concrete construction
In Sweden and elsewhere, industrial construction is viewed as a necessary developmentto overcome some of the problems the current building process is beset by. Forexample, competition is often focused on lowest cost instead of quality, sustainabilityand customer-perceived value; the process is fragmented and the link between theclient/end-user and the producer is weak, and the same can be said about the link

CHALMERS, Civil and Environmental Engineering8
between designers and contractors. However, to compose a clear-cut definition ofindustrialised construction/building is perhaps not as straightforward as one mightimagine, since different forms and techniques exist. CIBI W24 (International Councilfor Research and Innovation in Building and Construction, work group) offers thefollowing general definition (see Sarja 1998):
“Industrialised Building is the term given to building technology where modernsystematised methods of design, production planning and control as well as mechanisedand automated manufacture are applied.”
Löfgren (2002) suggested that in-situ concrete construction can be viewed as industrialwhen the following criteria are fulfilled:
The entire process is planned, co-ordinated, and controlled – which includesthe design, production, transportation, erection, and on-site construction.
The design and production/construction process of the product is integrated,and all functional disciplines must be involved.
The production is systematised, mechanised, and automated as far as possible.
The design is systematised and is supported by tools for computer-integratedconstruction (CIC) – e.g. ICT (information and communication technology),CAD/CAM (computer-aided design and manufacturing), CAE/FE (computer-aided engineering and finite element software), etc.
The process and production are managed so that risks and disturbances areminimised, e.g. the effect of climate and weather.
For the production, the need for temporary works is minimised.
Measures are taken for continuous improvement of the entire process, whichincludes considering new technology, new/improved materials, etc.
Löfgren (2002) also proposed that in-situ concrete construction be viewed asindustrialised if some but not all of the criteria are fulfilled. Furthermore, in-situconcrete construction is viewed as mechanised if the on-site construction is, first andforemost, adapted for the use of equipment, machinery, and robotics in order tominimise the manual labour.
Girmscheid and Hofmann (2000) remark that industrialised construction often fails byprioritising the production while ignoring product and management processes. Koskela(2000) and Warszawski (1999) draw similar conclusions. In a study of industrial bridgeconstruction, conducted by Harryson (2002), three cornerstones were identified: (1)process development, (2) product development, and (3) productivity development.Harryson recognises the importance of the organisational/managerial domain as well asaspects stressing the technical domain, and concludes that in a successfulimplementation there cannot be an emphasis in just one of the domains, as suggested inFigure 2. Hence, for successfully implemented industrial in-situ construction, all stageof the process must be included and all parties must be involved (clients,designers/engineers, contractors, and suppliers) and work as a project team.
I See http://www.cibworld.nl.

CHALMERS, Civil and Environmental Engineering 9
Organisational / ManagerialDomain
Technical Domain
ProductivityDevelopment
ProductDevelopment
ProcessDevelopment
ICT
Figure 2. The three cornerstones of industrial construction, from Harryson (2002).
2.4 Cost of in-situ concrete construction
In-situ concrete construction is a complex process with many inputs and logisticalproblems, and the operations involved in traditional in-situ cast concrete constructioncan be seen in Figure 3. The total cost of concrete construction is influenced by severalfactors such as material choices/composition, labour costs and the working hours ofthose involved in executing the work, and cost for equipment used in executing thework. But the cost of capital (financing) for the investor as well as the contractor has tobe considered.
Formwork Scaffolding
SITE OPERATIONS
- Erection of falsework& scaffolding
- Erection of formwork
Reinforcement
Transportationto/on-site
SITE OPERATIONS
- Placement
- Fixation
Fabrication
Transportationon-site
Transportationto site
Distributionon-site
(eg pump)
SITE OPERATIONS
- Placement
- Compaction
- Screeding
- Floor finishing
SITE OPERATIONS
- Removal of falsework
- Formwork striking
- Erection of temporarysafety scaffolding
Transportationon-site
SITE OPERATIONS
- Surface repair
Constructiondesign input- reinforcement
Non value addingactivities
ReworkNon value addingactivity
Cleaning andrepair of formwork
curing
Constructiondesign input- concrete
Constructiondesign input- formwork
Transportationto/on-site
ConcreteBatching Plant
Figure 3. Schematic view of operations involved in traditional concreteconstruction, from Paper I.

CHALMERS, Civil and Environmental Engineering10
A comparative breakdown of the construction costs of a concrete building (office orresidential) reveals that the superstructure represents approximately 10 to 15 percent ofthe total cost. Construction data for 11 office and 16 residential buildings (built between1989 and 1993) were compiled by the Swedish Ready-Mix Association (BetongbankenII
2000). These data were analysed (see Löfgren and Gylltoft 2001, and Löfgren 2002) inorder to get an overview of the distribution of man-hours between the differentoperations and to find out where major improvements should be made. The analyseddata refer to the relative distribution of construction costs for the concretesuperstructure. These costs can generally be divided into: formwork, reinforcement,concrete, repair of surfaces, and remaining items (e.g. prefabricated elements). Table 4shows the relative expenditure for the concrete superstructure (material and labourcosts). As expected, reinforcement and, above all, formwork are the most labour-intensive activities, while concrete accounts for the main part of the material costs.
Table 4. Approximate proportional cost breakdown (material and labour costs) ofa concrete structure, from Paper I.
Cost of material Cost of labour TotalFormwork 14% 18% 32%Reinforcement 10% 8% 18%Concrete 30% 4% 34%Repair 1% 5% 6%Remaining 9% 1% 10%
Total 64% 36% 100%
The distribution of material and labour costs naturally differs between projects, andadditionally, the market situation affects the price of material and the cost of labour. Thedistribution of labour costs mainly depends on the methods and equipment used inconstruction, and is not so dependent on fluctuations of the market. Hence, theimportance of the tasks is better understood by studying the distribution of man-hours.As can be seen in Figure 4, almost 50% of the total work on a concrete structure can bereferred to the formwork; reinforcement operations require roughly 22 percent of thework; while concrete operations represent only 11 percent. On the other hand, if reworkto fix surfaces (repair 15 percent) is added, it gives concrete a share of 26 percent.Similar figures are quoted by Bennett (2002) who presents a typical cost breakdown ofconcrete construction cost as: pumping/placing 10-13%, concrete 14-16%,reinforcement 25-30%, and formwork 45-50%.
II See http://www.betongbanken.com.

CHALMERS, Civil and Environmental Engineering 11
Formwork,columns 2%
Reinforcement,walls 7%
Reinforcement,floor 13%
Reinforcement,columns 2%
Concrete,walls 4%
Concrete,floors 7%
Repair15%
Remaining /Prefab
3%
Formwork,floor 26%
Concrete,columns 0.3%
Formwork,walls 21%
Formwork49%
Reinforcement22%
Concrete11%
Figure 4. Approximate relative breakdown of man-hours for a concrete structure,from Paper I.
The conclusions that can be drawn ,based on this study, are that:
formwork represents the major portion of man-hours;
work with reinforcement is the second largest portion of the man-hours; and
rework, or repair of surfaces, is quite extensive.
This suggests that effective permanent formwork systems would enable more efficientconcrete construction and render arduous and costly labour activities unnecessary.Moreover, it may be possible to further rationalise and reduce the labour-intensive workwith reinforcement (placing and fixing) by introducing fibre-reinforced concrete, whichideally should be combined with a properly designed self-compacting concrete, thusachieving industrialised and mechanised construction. In addition, with self-compactingconcrete better surface finishing can be expected. The combination of thesedevelopments – permanent formwork systems and self-compacting fibre-reinforcedconcrete – could possibly lead to more industrialised construction.
2.5 Developments of in-situ concrete construction
The concrete industry (material suppliers and contractors) is constantly under pressureto improve productivity and reduce costs without lowering the standard of quality of itsproducts. This driving force for technical development has had effects on both concreteand reinforcement technology, and has resulted in new types of concrete andreinforcement as well as new building systems and methods. In a similar manner, thedevelopment of information technology (construction IT) has presented newpossibilities and methods of work for the planning, design, manufacturing, transport,

CHALMERS, Civil and Environmental Engineering12
construction, and operation and maintenance of buildings. In this section – based onPaper I and Löfgren (2002) – a limited number of techniques and research projects willbe discussed in order to illustrate some of the existing potential.
There is a great variety of methods for in-situ concrete construction, e.g. different typesof formwork systems, slip forming, and tilt-up as well as different structural systemslike reinforced concrete, prestressed concrete, and steel-concrete composite systems.The choice of construction method and its phasing depend on a number of factors, ande.g. Camellerie (1985) put forward the following factors: availability of funds; methodof financing; capability of the contractors; impact on labour market; fabrication time;critical prerequisite sequences; interface between concurrent phases; use of equipment;weather conditions; economics and use alternate to determine completion date; designtime. When planning the concreting process, the following aspects should also beconsidered: specified properties of the concrete, in both the hardened and fresh states;whether any special type should be used, e.g. self-compacting or high-strength; methodsof handling/transporting the concrete on site; compaction, curing, and finishingmethods; reinforcement densities and congestions; pour sizes and construction joints.
Studies of concrete construction have revealed that there are considerable improvementsto be made by developing and systematising the construction process and the design.When studying the operations in Figure 3, from a value management perspective, it isclear that erection and dismantling of scaffolding and the stripping, cleaning andrepairing of formwork are examples of non-value-adding activities. The operations arenecessary for traditional formwork, but they add no value for the end-client. In a casestudy of seven construction projects, conducted by Burwick (1998), the advantages anddrawbacks of participating formwork (precast concrete panels) were investigated. Allprojects demonstrated time savings of 10 to 35 percent and the system required fewerworkers (by 10 to 30 percent). Other advantages were better surface finish (less rework)and improved working conditions. The drawbacks of the system were that material costwas higher, requirements for co-ordination within the design were found to be higher,and dimensional tolerance was more severe. Reinforcement details were not thoroughlyplanned, and placing reinforcement in walls was difficult. Furthermore, a study of theconstruction process for in-situ concrete buildings was conducted in the EuropeanConcrete Building Project at BRE in Cardington; see Best Practice Guides (BRE 2000& 2001). The current process was mapped, the sources of waste were identified (non-value-adding activities, see Figure 3), and an improved process was developed andused; the resulting improvement can be seen in Table 5. These savings have beenconfirmed by findings in other projects, e.g. the study conducted at the ReadingProduction Engineering Group (see Gray 1995).
Table 5. Potential savings, according to BRE – European Concrete BuildingProject (Best Practice Guides, BRE 2000 & 2001).
Improvement area Reduction in totalcycle time [%]
Reduction in totalman-hours [%]
Supply chain management 10.5 15.0Buildability 3.0 3.5Resource allocation 6.5 10.5Operational methods 8.5 13.5Total 28.5 42.5

CHALMERS, Civil and Environmental Engineering 13
2.5.1 Formwork systems
The selection of formwork system/technique is crucial because it often decides thespeed of construction. In addition, the formwork cost is one of the larger parts of thetotal cost and often the most variable of these. Generally, a formwork system can bedefined as (see Hanna 1998):‘‘the total system of support for freshly placed concreteincluding the mould or sheathing which contacts the concrete as well as supportingmembers, hardware, and necessary bracing.’’ Examples of different formwork systemsare: conventional wood/plywood systems, proprietary formwork, table forms, tunnelforms, stay-in-place forms; see e.g. Johnston (1997), Hanna and Sanvido (1991), andBennett (2002). For the selection of the formwork type and its design, factors to betaken into consideration include, for example: concrete mix proportions, rate of placing,extent and type of compaction, method of placing, the shape of the structure, structuralforms, building span, repetitive nature, etc. Furthermore, according to Patrick (1998),the type and quantity of site labour (when constructing a slab) can be significantlyaffected by:
the nature of the work (e.g. skilled, etc.);
the total number of individual parts;
the weight of the individual parts;
the height of the floor lift, if formwork and scaffolding are required;
whether the formwork has to be stripped, cleaned or repaired, and manipulatedinto the next position;
the life (i.e. number of uses) of the formwork parts in the case of removablesystems;
whether repair to the soffit finish is required if the formwork is removed; and
the amount of reinforcement that must be placed in the slab.
Generally, a distinction can be made between two main categories of formworksystems: the temporary formwork systems, which are reusable, and the permanent, orstay-in-place, formwork systems. Temporary formwork can be made of timber planks,plywood sheets, metal panels, etc. Temporary formwork systems have had a substantialdevelopment, they have become easier to handle and assemble and also lighter thanks tothe use of aluminium (see Figure 5).
Figure 5. Example of temporary formwork systems from PERI. Pictures courtesy ofPERI.

CHALMERS, Civil and Environmental Engineering14
Patrick (1998) suggests that because a composite, permanent formwork can serve dualroles – acting first as the formwork before the concrete hardens, and then as an integralpart of the structure – economic advantages over the use of removable formworksystems should result. For a permanent formwork system to achieve an economicadvantage, it must be utilised efficiently during both the construction stage (asformwork) and the composite stage (in the completed structure). To achieve thisadvantage, an optimisation of structural shape, geometry, thickness of elements, etc. hasto be made. Permanent formwork systems include steel decking, precast elements, andcomposite elements; this is also referred to as composite or hybrid construction. Forfloor structures in commercial buildings, it is not uncommon to use profiled steeldecking or precast elements; see Figure 6. Permanent formwork usually reduces sitemanpower and the floor-cycle time, but may increase the material cost; other benefitsmay also arise from better thermal comfort, superior acoustic environment, flexibility tochanges, or easier integration of service installations. Savings may arise from needingless temporary works, achieving an earlier hand-over, less overall construction time,less material wastage, less vulnerability to weather conditions, etc.
(a) (b)Figure 6. Composite floors: (a) steel deck, steel beams, and in-situ concrete
(visualisation Wille Karlsson); and (b) precast elements (lattice girderelements), steel beams, and in-situ concrete. (Photo by Hans Olsson).
The lattice girder system, presented in Figure 7, consists of a precast panel with aminimum thickness of 40 mm, a lattice girder, and reinforcement. The elements are castin a factory, transported to the site, and lifted into place before in-situ casting. Thelattice girder element was introduced in Germany some 40 years ago and has spread tonumerous countries. In Sweden, production of the elements started in the beginning ofthe 1970s. Its most noticeable development concerns the manufacturing process. Todaysome manufacturers have automatic production plants with CAD/CAM-operatedequipment (see for example Müller 1991). The system has several advantages comparedto temporary formwork. Stripping and cleaning are unnecessary, the main slabreinforcement is cast into the slab in the factory, the elements require less propping thanordinary formwork, installations can be cast into the slab in the factory, surface finish isbetter, and working conditions are improved. This usually results in reduced sitemanpower and floor-cycle time. The disadvantages are an increase in material cost, inco-ordination of the design, in requirements of dimensional tolerance, in the difficultiesof connection details, and possibly in the size of the crane. Furthermore, propping is stillneeded. Löfgren (2003) – see Paper II – conducted experiments and analysed the latticegirder system in order to investigate development opportunities; these will be presentedand discussed in Chapter 6.

CHALMERS, Civil and Environmental Engineering 15
Panel reinforcement
(optional)
Steel trusses
Panel concrete
Site placed concretePolystyrene void formers
(a) (b)Figure 7. A lattice girder truss (a) and a lattice girder element (b).
2.5.2 Reinforcement technology
Today there are several different products, techniques, and materials available forreinforcing concrete. Usually, a distinction is made between conventional reinforcementand prestressing. The main advantage (see e.g. Warner et al. 1998 and Tygstad 2001) ofprestressed concrete, compared to conventional reinforced concrete, is that cracking canbe avoided in the service state, thus allowing thinner slabs or longer spans.
For conventional reinforcement, some investigations have been made to find the mosteconomical solutions. In a research project, the European Concrete Building Project, atBRE in Cardington (see Best Practice Guides, BRE 2000 & 2001), the constructionprocess was considered and it was concluded that, for conventional reinforcement,considerable time and cost savings could be achieved by utilising prefabricatedreinforcement units and welded wire meshes; see also Bennett (2002). Furthermore,different design approaches (elastic and yield line) significantly affected thereinforcement rationalisation. Generally, the use of prefabricated wire-mesh mats can bean economical solution for large slabs, but sometimes this option may be limited orbecome costly depending on the required amount of reinforcement. An option to wire-mesh mats is BAMTEC , which is a reinforcement carpet for slabs where variable barspacing, according to the design moment, can be used. With BAMTEC a productionlevel of 4.5 tons/man-hour has been achieved; see www.bamtec.com.
Other products for reinforcement of concrete have also been developed and among theseare fibre-reinforced polymers (FRP), which can be used as bars, strands, textiles, andfabrics. In textile concrete, the reinforcements are textiles, which are produced as planarknitted fabrics using fibres. The benefit is that the reinforcement can then be oriented inthe main stress direction and placed where it is needed (see Curbach et al. 1998). FRP-reinforcements can be made from carbon, glass, aramid, or any other high-performancefibres that can be embedded in polymeric matrices. Advantages of FRP-reinforcementsare their light weight, high tensile strength and ease of production, and that the materialis not susceptible to corrosion. Drawbacks with FRP are the low ductility, low shearstrength, high material costs, and susceptibility to stress-rupture effects.

CHALMERS, Civil and Environmental Engineering16
2.5.3 Concrete technology
The concrete industry has developed into a high-tech industry. Viewed from the earlybeginning, the progress has been enormous, notably in the improvement of concretestrength. However, it is not only strength that has been increased. Lately other materialproperties have been recognised as equally important – for example, permeability,ductility, and workability. Examples of this development can be seen in: Bache (1989),Li (1995), Walraven (1999), Brandt and Kucharska (1999), Guse and Müller (2000),Guerrini (2000), Flaga (2000), Aïtcin (2000), Zilch (2000), Flaga (2000), Brouwer(2001), Harryson (2002), Bentur (2002), Bennett (2002), Chong and Garboczi (2002).With this development, it is now possible to obtain certain predefined properties byadapting a certain mixture composition; to quote Walraven (1999), the era of “tailor-made concrete” has arrived. Examples of ‘new’ types of concretes (or cementitiouscomposites) are:
HSC – High-Strength Concrete;
LWAC – LightWeight Aggregate Concrete;
SCC – Self-Compacting Concrete;
FRC – Fibre-Reinforced Concrete or FRCC – Fibre-Reinforced CementComposite;
HPFRCC – High-Performance Fibre-Reinforced Cement Composite; and
ECCIII – Engineered Cementitious Composites.
All of the above-mentioned concretes (or cement composites) can be classified as high-performance materials. High-performance concrete is the generic classification ofconcretes with improved performance, in one or several attributes, compared toordinary/regular concrete.
High-strength concrete, as the term suggests, is characterised as concrete having ahigher compressive strength than normal concrete. The boundary between normal andhigh strength is not fixed and has increased with time; today, concrete having acompressive strength above 60 to 80 MPa can be considered as high-strength. Theutilisation of high-strength concrete progresses rapidly, and, for example, it was used inthe construction of the twin towers in Kuala Lumpur, Malaysia. The technology of high-strength concrete is by now well established and the benefits and disadvantages aremore or less well known; see e.g. Shah and Ahmad (1994) and CEB Bulletin 222.
Lightweight aggregate concrete is a concrete with closed structure, containinglightweight aggregates, and having an oven-dry density of not more than 2200 kg/m3
(fib Bulletin 8, 2000). Lightweight aggregate concrete has the advantage of reduceddead weight and improved thermal insulation ability. By reducing the dead load, longerspans can be achieved (resulting in fewer columns or unpropped permanent formwork)and savings can be made on the foundation. Lightweight concrete floor slabs were used,for example, in the Guggenheim museum in Bilbao, Spain (fib Bulletin 8, 2000); the
III ECC is an ultra-ductile mortar-based composite, reinforced with short random fibres; for moreinformation see the ECC technology network, http://www.engineeredcomposites.com/.

CHALMERS, Civil and Environmental Engineering 17
concrete had a density of 1700 kg/m3, and a compressive strength of 25 MPa, in order toreduce the weight of the structure. However, there is need for further development andresearch to be able to present an economical solution. As stated in fib Bulletin 8 (2000),“The challenges for the aggregate industry are thus to produce an aggregate with:
high strength;
low weight;
good production properties (low water absorption); and
reasonable price.”
Self-compacting concrete was first developed in 1988 as a response to problems withdurability of concrete structures in Japan; see Ozawa et al. (1992). The concrete wasnamed ‘high-performance concrete’ at the three stages:
(1) fresh, self-compactable (able to fill in every corner of the formwork);
(2) early age, avoidance from initial defects; and
(3) hardened, protection against external factors.
Self-compacting concrete is well suited for a mechanised and automated manufacturingprocess, and will offers new possibilities of mechanising the work tasks. In a researchproject investigating rational production systems by utilising self-compacting concrete,it was found that production was rationalised and that the advantages were numerous(Grauers, 1998), for example:
rationalised concrete production, faster construction and less casting time;
reduction in labour at the building site;
better working conditions and reduced health problems for the workers;
good homogeneity, improved quality and durability, and smoother surfaces;and
easier casting in difficult situations, e.g. complex forms or congestedreinforcement.
Fibre-reinforced concrete (FRC) is a concrete containing dispersed fibres. Incomparison to conventional reinforcement, the characteristics of fibre reinforcement arethat: (1) the fibres are generally distributed throughout a cross-section, whereasreinforcement bars are only placed where needed; (2) the fibres are relatively short andclosely spaced, whereas the reinforcement bars are continuous and not as closelyplaced; and (3) it is generally not possible to achieve the same area of reinforcementwith fibres as with reinforcing bars. This means that, unlike ordinary reinforcedconcrete with an appropriate minimum reinforcement, a softening response is observedafter cracking. In contrast to plain concrete, the toughness is significantly increased as aresult of fibres transmitting force across cracks. The advent of fibre reinforcement hasthus extended the versatility of concrete as a construction material by providing aneffective method of overcoming its intrinsic brittleness, and provides an opportunity toreduce one of the more labour-intensive activities necessary for concrete construction.The use of fibres in concrete is not a novel concept, but it is not until recently that thereseems to be any significant use in structural applications. Li (2002) estimates theamount of fibres used worldwide to be 300,000 tons per year; the growth rate in North

CHALMERS, Civil and Environmental Engineering18
America is expected to be 20% per year. Most of the current applications are non-structural; the fibres are used to control plastic and drying shrinkage in, for example,floors and pavements, and in most applications the fibre volume is less than 1%. Themain advantage of including fibres in the matrices is that it improves theductility/toughness and the post-peak stress–strain/crack relationship. The types offibres commonly used include steel, glass, carbon, polyvinyl alcohol (PVA),polypropylene (PP), and cellulose.
High-performance fibre-reinforced cement composite (HPFRCC) is, according toNaaman and Reinhardt (1996), characterised or defined as ‘high-performance’ if thestress–strain curve shows a quasi-strain hardening (or pseudo-strain hardening)behaviour (i.e. a post-cracking strength larger than the cracking strength, or elastic-plastic response). Examples of this type of material are: SIFCON (Slurry InfiltratedConcrete), SIMCON (Slurry Infiltrated Mat Concrete), CRC, and Ductal®. In SIFCONthe steel fibres are first placed in the mould, fibre volumes are typically 4 to 12%, andthe paste is then infiltrated. Most of these HPFRCC applications use a high fibrevolume, 4 to 20%. The negative aspect of the high fibre volume is that it is expensive.Recent scientific advances have made it possible to achieve strain-hardening materialswith less than 2%. Engineered cementitious composite (ECC) is a material developed atthe ACE-MRL at the University of Michigan (see Li 2002). The material properties foran ECC with 2% PE (polyethylene) fibres are: a tensile strength of 2.5 MPa, a tensilestrain capacity of 3 to 6%, a modulus of elasticity of 22 to 35 GPa, and a fracture energyof 27 kJ/m2.
2.6 Concluding remarks
Current concrete construction and design are meeting new challenges from otherconstruction materials and techniques (e.g. steel, precast concrete, and timber). An ‘on-site’ industrialisation of concrete construction could address this challenge and theproblems affecting the construction industry. It was shown that labour costs representroughly 40 percent of the construction cost, where formwork accounts for the majorportion of this cost (almost 50 percent) and reinforcement for the other large part.However, research confirms that there are substantial possibilities for improvement(reduction of man-hours and construction time as well as improved working conditions),see BRE 2000 & 2001, Grauers (1998), Burwick (1998), and Bennett (2002).Consequently, development of new formwork/building systems has the potential toreduce labour. In addition, new materials, well suited for a mechanised and automatedmanufacturing process, have been developed. Examples of such materials are self-compacting concrete (SCC) and fibre-reinforced concrete (FRC), and these could beutilised for industrialisation of in-situ cast concrete construction. On the other hand, itwill require material suppliers, structural engineers, and construction management ableto produce, design, plan, and control their use. It is also essential that test methods aswell as design codes and standards, covering these materials, are available.

CHALMERS, Civil and Environmental Engineering 19
3 Fibre-reinforced concrete
3.1 General
The use of fibres in concrete is not a novel concept; early patents on fibre-reinforcedconcrete date back to 1874 (A. Berard, USA) and fibres with shapes similar to thosecurrently used were patented already in 1927 (G. Martin, USA), 1939 (Zitkevic, Britain)and 1943 (G. Constantinesco, England) – for a more comprehensive historical reviewsee e.g. Naaman (1985) and Beddar (2004).
Generally, concrete containing a hydraulic cement, water, fine and coarse aggregate,and discontinuous discrete fibres is called fibre-reinforced concrete (FRC). Fibres ofvarious shapes and sizes produced from steel, synthetics, glass, and natural materialscan be used. However, for most structural and non-structural purposes, steel fibres arethe most used of all fibre materials, whereas synthetic fibres (e.g. polypropylene andnylon) are mainly used to control the early cracking (plastic shrinkage cracks) in slabs.Fibres are generally added during mixing, but may also be pre-placed into a mould andthe cementitious matrix subsequently infiltrated (e.g. SIFCON).
The constituents of a composite are generally arranged so that one or morediscontinuous phases are embedded in a continuous phase. The discontinuous phase istermed the reinforcement and the continuous phase is the matrix. In any compositematerial, fibres are added to improve the properties and behaviour of the material, andthese fibres can be either continuous or discontinuous (i.e. short), with a preferred (e.g.uni-directional or bi-directional) or random orientation. Moreover, the matrix can beclassified as either brittle or ductile; cement-based materials are typical brittle matrixmaterials. Depending on the characteristics of the matrix, the addition of discontinuousfibres will influence either the strength or the toughness. Normally, in a ductile matrix,short fibres are added to increase the strength, while for a brittle matrix the fibres areadded primarily to improve the toughness. The main factors controlling the performanceof a composite material are: (1) the physical properties of fibres and matrix; (2) thestrength and bond between fibres and matrix; and (3) the amount of fibres (volumefraction) and their distribution and orientation.
3.2 Fibre technology
There is a wide range of fibres (see Figure 8) that can be used to improve toughness andother properties of concrete and cementitious composites. Steel fibres have been usedfor a considerable time, but modern steel fibres have higher slenderness and morecomplex geometries, and are often made of high-strength steel. Further, synthetic fibresare becoming more attractive as they can provide effective reinforcement comparable tothat of steel fibres. Types of synthetic fibres that have been incorporated into cementmatrices include: polyethylene (PE), polypropylene (PP), acrylics (PAN), polyvinylacetate (PVA), polyamides (PA), aramid, polyester (PES), and carbon. Some examplesof different commercially available fibres can be seen in Figure 8. The both mechanicaland geometrical properties of fibres vary widely and as does the effect they have on the

CHALMERS, Civil and Environmental Engineering20
properties of concrete. Some types of fibre are mainly used to improve the toughnessand reduce crack widths, while others are there to reduce plastic shrinkage cracking orto avoid spalling of concrete during fire.
Figure 8. Examples of commercially available fibres.
Several important terms, definitions, parameters, and features serve to characterise thewide variety of existing fibres; relevant definitions include (see Chawla 2001 and ACI544, 1996):
aspect ratio, which is the ratio of length to diameter (or equivalent diameter fornon-circular fibres) of a fibre;
bundled fibres, which usually are strands consisting of several hundreds orthousands of filaments of microfibres;
chopped strand, which contains fibres chopped to various lengths;
collated, which refers to fibres bundled together either by cross-linking or bychemical means;
fibrillated, referring to continuous networks of fibre, in which the individualfibres have branching fibrils;
filament, which is a continuous fibre, i.e. one with an aspect ratio approachinginfinity;
monofilament, a large-diameter continuous fibre, generally with a diametergreater than 100 µm;
multifilament, a yarn consisting of many continuous filaments or strands.
These definitions and features are generally independent of fibre type, i.e., polymeric,metallic, glass, etc., and depend on the geometry rather than any materialcharacteristics. From a geometrical point of view, fibres used in cementitiouscomposites may be classified as: (1) macro-fibres, when their length is larger than themaximum aggregate size (at least by a factor of two for coarse aggregates) and if theircross-section diameter is much greater than that of the cement grains (which typically
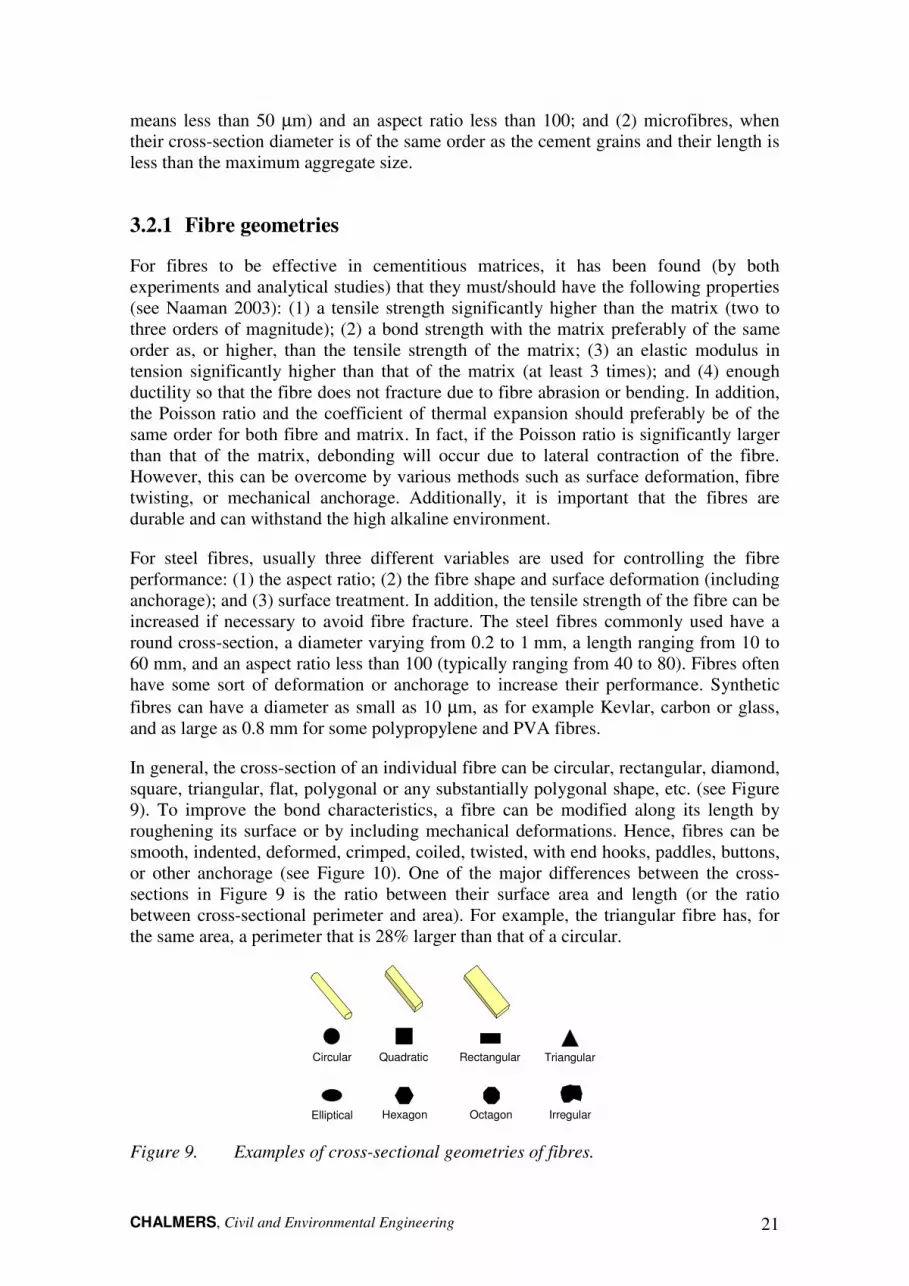
CHALMERS, Civil and Environmental Engineering 21
means less than 50 µm) and an aspect ratio less than 100; and (2) microfibres, whentheir cross-section diameter is of the same order as the cement grains and their length isless than the maximum aggregate size.
3.2.1 Fibre geometries
For fibres to be effective in cementitious matrices, it has been found (by bothexperiments and analytical studies) that they must/should have the following properties(see Naaman 2003): (1) a tensile strength significantly higher than the matrix (two tothree orders of magnitude); (2) a bond strength with the matrix preferably of the sameorder as, or higher, than the tensile strength of the matrix; (3) an elastic modulus intension significantly higher than that of the matrix (at least 3 times); and (4) enoughductility so that the fibre does not fracture due to fibre abrasion or bending. In addition,the Poisson ratio and the coefficient of thermal expansion should preferably be of thesame order for both fibre and matrix. In fact, if the Poisson ratio is significantly largerthan that of the matrix, debonding will occur due to lateral contraction of the fibre.However, this can be overcome by various methods such as surface deformation, fibretwisting, or mechanical anchorage. Additionally, it is important that the fibres aredurable and can withstand the high alkaline environment.
For steel fibres, usually three different variables are used for controlling the fibreperformance: (1) the aspect ratio; (2) the fibre shape and surface deformation (includinganchorage); and (3) surface treatment. In addition, the tensile strength of the fibre can beincreased if necessary to avoid fibre fracture. The steel fibres commonly used have around cross-section, a diameter varying from 0.2 to 1 mm, a length ranging from 10 to60 mm, and an aspect ratio less than 100 (typically ranging from 40 to 80). Fibres oftenhave some sort of deformation or anchorage to increase their performance. Syntheticfibres can have a diameter as small as 10 µm, as for example Kevlar, carbon or glass,and as large as 0.8 mm for some polypropylene and PVA fibres.
In general, the cross-section of an individual fibre can be circular, rectangular, diamond,square, triangular, flat, polygonal or any substantially polygonal shape, etc. (see Figure9). To improve the bond characteristics, a fibre can be modified along its length byroughening its surface or by including mechanical deformations. Hence, fibres can besmooth, indented, deformed, crimped, coiled, twisted, with end hooks, paddles, buttons,or other anchorage (see Figure 10). One of the major differences between the cross-sections in Figure 9 is the ratio between their surface area and length (or the ratiobetween cross-sectional perimeter and area). For example, the triangular fibre has, forthe same area, a perimeter that is 28% larger than that of a circular.
Circular Quadratic Rectangular Triangular
IrregularHexagon OctagonElliptical
Figure 9. Examples of cross-sectional geometries of fibres.

CHALMERS, Civil and Environmental Engineering22
Straight End-hooks
crimped(wave shaped)
Paddles End knobs Coned
Surfaceindented
ToothedBow shaped Irregular Twisted
Figure 10. Examples of some typical fibre geometries.
3.2.2 Fibre materials and physical properties
Metallic fibres are made of either carbon steel or stainless steel and their tensile strengthvaries from 200 to 2,600 MPa (see Table 6). In the draft European Standard prEN14889-1:2004 the following definition is provided for steel fibres: “Steel fibres arestraight or deformed pieces of cold-drawn steel wire, straight or deformed cut sheetfibres, melt extracted fibres, shaved cold drawn wire fibres and fibres milled from steelblocks which are suitable to be homogeneously mixed into concrete or mortar”. Steelfibres can also have coatings, for example of zinc for improved corrosion resistance, orbrass for improved bond characteristics. In prEN 14889-1:2004, steel fibres are dividedinto five general groups and defined in accordance with the basic material used for theproduction of the fibres according to:
�� Group I , cold-drawn wire.�� Group II, cut sheet.�� Group III, melt extracted.�� Group IV, shaved cold drawn wire.�� Group V, milled from blocks.
There is a large variety of synthetic fibres available commercially – polymer fibres suchas: polypropylene (PP), polyethylene (PE), polyamides, polyethylene terephthalate(PET), polyacrylonitrile (PAN), polytetrafluooroethylene (PTFE), aramid, etc., are well-established fibres. The properties of synthetic fibre vary considerably, in particular withrespect to the modulus of elasticity; see Table 6. In the draft European Standard prEN14889-2:2004 the following definition is provided for polymer fibres: “Polymer fibresare straight or deformed pieces of extruded orientated and cut material which aresuitable to be homogeneously mixed into concrete or mortar”. Polymer is defined as:“basic fibre material based on polyolefin (e.g. polypropylene or polyethylene),polyester, nylon, PVA, acrylic and aramids etc. and blends of them”. Moreover, inprEN 14889-2:2004 fibres are to be characterised in classes in accordance with theintended use, which are:

CHALMERS, Civil and Environmental Engineering 23
�� Class I; intended primarily to improve the short-term plastic properties ofmortar and/or concrete by controlling plastic shrinkage, settlement cracks, andreducing bleeding, but not adversely affecting the long-term properties.�� Class II; intended primarily to improve the durability of mortar and/or
concrete by improving abrasion and impact resistance and by reducingdamage caused by cycles of freezing and thawing.�� Class III; fibres which primarily increase the residual strength of mortar and/or
concrete.�� Class IV; fibres which are primarily used to improve the fire resistance of
mortar and/or concrete.
Naturally occurring fibres include organic fibres such as cellulose, silk, wool, cotton,jute, hemp, sisal and inorganic fibres such as asbestos, Wollastonite, and basalt. Forexample, Wollastonite is a natural mineral, calcium meta-silicate (β-CaO-CaSiO2), witha relatively high modulus (see Table 6 and Figure 8), and is generally available in theshape of acicular particles for commercial applications. Wollastonite microfibres havelateral dimensions of about 25–40 µm and lengths ranging from 0.4 to 0.6 mm.
More comprehensive information on different types of fibres, their properties and usecan be found in the following references: in general textbooks on fibre-reinforcedcomposites, e.g. Bentur and Mindess (1999) and Balagura and Shah (1992); intextbooks on fibres, e.g. Hongu and Phillips (1997) and Hearle (2001); in ACI 544(1996), a state-of-the-art report on fibre-reinforced concrete; in Zheng and Feldman(1995), a review article on synthetic fibre-reinforced concrete.

CHALMERS, Civil and Environmental Engineering24
Table 6. Physical properties of some fibres.
Type of Fibre
Diameter
[µm]
Specificgravity[g/cm3]
Tensilestrength[MPa]
Elasticmodulus
[GPa]
Ultimateelongation
[%]MetallicSteel 5-1 000 7.85 200-2 600 195-210 0.5-5GlassE glass 8-15 2.54 2 000-4 000 72 3.0-4.8AR glass 8-20 2.70 1 500-3 700 80 2.5-3.6SyntheticAcrylic (PAN) 5-17 1.18 200-1 000 14.6-19.6 7.5-50.0Aramid (e.g. Kevlar) 10-12 1.4-1.5 2 000-3 500 62-130 2.0-4.6Carbon (low modulus) 7-18 1.6-1.7 800-1 100 38-43 2.1-2-5Carbon (high modulus) 7-18 1.7-1.9 1 500-4 000 200-800 1.3-1.8Nylon (polyamide) 20-25 1.16 965 5.17 20.0Polyester (e.g. PET) 10-8 1.34-1.39 280-1 200 10-18 10-50Polyethylene (PE) 25-1 000 0.96 80-600 5.0 12-100Polyethylene (HPPE) - 0.97 4 100-3 000 80-150 2.9-4.1Polypropylene (PP) 10-200 0.90-0.91 310-760 3.5-4.9 6-15.0Polyvinyl acetate(PVA)
3-8 1.2-2.5 800-3 600 20-80 4-12
Natural - organicCellulose (wood) 15-125 1.50 300-2 000 10-50 20Coconut 100-400 1.12-1.15 120-200 19-25 10-25Bamboo 50-400 1.50 350-50 33-40 -Jute 100-200 1.02-1.04 250-350 25-32 1.5-1.9Natural - inorganicAsbestos 0.02-25 2.55 200-1 800 164 2-3Wollastonite 25-40 2.87-3.09 2 700-4 100 303-530 -
3.3 Orientation and distribution of fibres
The fibre orientation plays an important role for the mechanical performance of fibre-reinforced composites. The technology of dispersed reinforcement provides for directand random (free) orientation of fibres in the concrete body. Directed orientation, seeFigure 11 (a)-(e), is realised mainly by using continuous filaments, plaits, various typesof fabrics and non-fabric nets, or by special production techniques like pre-placing thefibres (e.g. SIFCON) or for example in the Hatcheck process. Body-random orientationis characterised by equi-probable and unlimited (free) distribution of short fibresthroughout the body of the concrete (in three-dimensional space); see Figure 11(f). Theangles of inclination of the fibres relative to the surface of the component range fromzero to 90°, as long as the dimensions of the component, in all directions, exceed thelength of fibres considerably. Plane-random orientation is characterised by equi-probable and unlimited (free) distribution of fibres in a two-dimensional space. Thiscase occurs mainly in thin-walled elements, e.g. flat sheets, plates, etc., when thethickness of an element is less than the length of the fibres used. As a result of this, theangle of inclination of fibres relative to the surface of the elements is comparativelylow. Constrained-random orientation is relevant when at least two geometric parametersof a structural unit, e.g. height and width, are restricted in dimensions and limit the free,random orientation of fibres in the body of the concrete. Such a situation can beobserved in the case of beams, plates, etc. The smaller the cross-section, the morerestricted the possibilities of free orientation of the fibres. However, it should also be

CHALMERS, Civil and Environmental Engineering 25
noted that for fibre-reinforced concrete there are a number of other factors influencingthe fibre orientation and distribution apart from purely geometrical considerations –such as the method of placement, the equipment used (e.g. pumping), and the propertiesof the fresh concrete (resistance against fibre segregation).
(c)
(f) (g) (h)
(a) (b) (d)
(e)
Figure 11. Schematic representation of different fibre composites: (a) unidirectionalcontinuous; (b) bi-directional continuous; (c) discontinuous with biased1-D fibre orientation; (d) discontinuous with biased 2-D fibre orientation;(e) discontinuous with plane-random orientation; (f) discontinuous withrandom fibre orientation; (g) particulate composite (particle suspension);and (h) fibre-reinforced and particulate composite (e.g. fibre-reinforcedconcrete).
To determine the mechanical behaviour of the different composites presented in Figure11 it is necessary to consider the orientation of the fibres. The fibre orientation and thenumbers crossing an arbitrary crack plane can be determined by theoreticalconsiderations. For this purpose it is common to define the fibre efficiency factor, ηb, asthe efficiency of bridging, in terms of the amount of fibres bridging a crack, withrespect to orientation effects; see e.g. Li and Stang (2001). In the case of a one-dimensional system (1-D) it is quite simple to determine the fibre efficiency, which isoptimal since all the fibres are oriented in the direction of the load. For this case thefibre efficiency equals one (ηb.1-D = 1), whereas the embedment length varies from halfthe fibre length to zero (0 < Le ≤ Lf/2); see Figure 12.
x
y
Lf
crack plane
Lez
Figure 12. Fibre orientation in 1-D, based on Li and Stang (2001).

CHALMERS, Civil and Environmental Engineering26
The situation changes, however, once the fibre orientation becomes plane-random (2-D)or random (3-D); see Figure 13(a) for the 2-D case and Figure 13(b) for the 3-D. Thenumber of fibres, Nb, bridging an arbitrary crack plane can be determined bytheoretically considering all possible fibre embedment lengths, Le, and angles, φ.According to Li and Stang (2001), if the centroidal distance z and the orientation angleφ are treated as random variables, Nb can be computed from the probability densityfunctions p(z) and p(φ):
bf
fb A
VN η⋅= where ( ) ( )
( )
=
=1
0
cos2
0
φ
φ
φ
φφη dzdzppfL
z
b
φ0 =-φ1
0
2-D
3-D
and φ1 = π/2 for both 2-D and 3-D.
The upper integration limit on z is imposed to eliminate those fibers which do not bridgethe crack. This is the case for fibres oriented at angle φ, and centroidal distancez > ( Lf / 2) cos φ. The expression for p(z) is always 2/Lf . The expression for p(φ) (Li etal. 1990), however, depends on whether the fibres are dispersed in 2-D or 3-D. Thesefunctions are tabulated in Table 7. As can be seen in Table 7, for the 2-D case the fibreefficiency is 0.64 (2/π) while for the 3-D case it is 0.5 (exactly half as many as for the 1-D case).
However, if restrictions are imposed on the inclination angle φ to φ∗, e.g. due toproduction techniques or by specimen boundaries, this can be incorporated bydetermining a new probability density function p´(φ) which considers the restrictedinclination angle φ∗, see Table 7.
x
y
Lf
φ
crack plane
Le
z
fr′
2φ
1φ
z
xy
(a) (b)Figure 13. Fibre orientation (from Li and Stang 2001): (a) in 2-D and (b) in 3-D.

CHALMERS, Civil and Environmental Engineering 27
Table 7. Bridging probability density functions and efficiency factors, from Li andStang (2001).
1-D 2-D 3-Dp(φ) – 1/π sin(φ)ηb 1 2/π 1/2
p (φ) – 1/(2φ*) sin(φ)/(1- cos(φ*))η b – 1/φ* 1/2(1- cos(φ*))
The fibre orientation in any structural member (beam, slab, etc.) or materials testspecimen is influenced by its boundaries. Analysis has shown that the effect ofconstrained orientation of fibres is manifested mainly in cases when the dimensions ofthe member are less than five times the length of the fibres; see e.g. Soroushian and Lee(1990) and Kooiman (2000). When the dimensions of the member are greater, the effectof constraint is considerably reduced and the orientation of the fibres approaches thoseof body-random. To consider this, an average fibre efficiency factor, ηb, cantheoretically be determined by taking into account the dimensions of the member, thelength of the fibre, and the wall effects in cases of 2-D fibre orientation. Suchtheoretical approaches have been suggested by Rao (1979), Soroushian and Lee (1990),Kooiman (2000), and Dupont & Vandewalle (2005). In Figure 14 it can be seen how theaverage fibre efficiency factor depends on the beam and fibre geometry. For a relativelyshort fibre Figure 14(a), the average fibre efficiency factor will approach the 2-D factoronly for very small members, while for a long fibre Figure 14(b) it can exceed the 2-Dfactor for small members. Moreover, it can be observed that even for quite largemembers the average fibre efficiency is higher than the 3-D factor of 0.5.
0.5
0.6
0.7
0.8
0 200 400 600 800
Height of section, h , [mm]
l f = 35 mm
75
b =
η b.2D = 0.64
Ave
rage
fibr
eef
fici
ency
fact
or[-
]
2000
125
250
500
0.5
0.6
0.7
0.8
0 200 400 600 800
Height of section, h , [mm]
l f = 65 mm
75
b =η b.2D = 0.64
Ave
rage
fibr
eef
fici
ency
fact
or[-
]
2000
125250
500
(a) (b)Figure 14. Average fibre efficiency factor, ηB, as a function of beam geometry
(height, h, and width, b): (a) for a fibre length of 35 mm; and (b) for afibre length of 65 mm.

CHALMERS, Civil and Environmental Engineering28
3.4 Mechanics of crack formation and propagation
Concrete usually exhibits a large number of microcracks, especially at the interfacebetween coarser aggregates and mortar, even before subjection to any load. Thesemicrocracks influence the mechanical behaviour of concrete, and their propagationduring loading contributes to the non-linear behaviour at low stress levels and causesvolume expansion near failure. Many of these microcracks are caused by segregation,shrinkage or thermal expansion of the mortar. Additionally, microcracks develop duringloading because of the difference in stiffness between aggregates and mortar, and sincethe aggregate-mortar interface usually constitutes the weakest link in the compositesystem. Furthermore, the presence of flaws and microcracks and the coalescence ofthese when loaded is the primary reason for the low tensile strength of concrete.Generally, cement-based materials have a relatively low tensile strength but moreimportantly a low tensile strain capacity, which leads to brittle behaviour and the factthat cracks are almost inevitable in any concrete structure.
It is now generally accepted that the primary effect of fibres is that they improve thepost-cracking behaviour and the toughness – i.e. the capacity of transferring stressesafter matrix cracking and the tensile strains at rupture – rather than the tensile strength;see e.g. Shah (1991), Mindess (1995) and Li and Maalej (1996b). In some of the earlywork on fibre-reinforced concrete, see Romualdi and Batson (1963), it was thought thatthe tensile strength could be increased due to an assumption that fibres delay thewidening of microcracks (initiated at flaws) – and that the closer the fibres were spaced,the more resistance to cracking. This concept was adapted from the model for fracturemechanics of materials with points of discontinuity developed by Griffith (1920). But asthe fibres that were used in the study were large compared to the flaw size and theamount of fibres that could be mixed without problems was rather limited (up to 3.0volume percent), this mechanism is not likely to have contributed to the strength of thematerial. Rather, as Romualdi and Batson (1963) and Romualdi and Mandel (1964)used indirect test methods (i.e. splitting test and flexural tests) to determine the tensilestrength, it is more likely that the interpreted increase in tensile strength was an effect ofthe increased toughness after matrix cracking resulting in a higher peak load (ofteninterpreted as the modulus of rupture). On the other hand, more recent investigations onthe mechanics of microfibres have shown that these actually can delay the widening ofmicrocracks (as postulated by Romualdi and Batson); see for example Betterman et al.(1995), Nelson et al. (2002), and Lawler et al. (2003).
Compared to other composite materials (e.g. fibre-reinforced polymers), fibre-reinforced cement-based composites are different. An obvious difference is that thereinforcing effect primarily occurs after the brittle matrix has cracked, either at themicroscopic level or with visible cracks through the composites. in addition, a fibre-reinforced concrete contains both aggregates and fibres and is thus a combination of aparticulate- and fibre-reinforced composite. However, probably the most importantdifference is the unique character of the cement-based matrix, whose structure involvesa wide range of particle sizes and void spaces, and this will briefly be discussed in thefollowing section.

CHALMERS, Civil and Environmental Engineering 29
3.4.1 Microstructure and microstructural development
Concrete is a heterogeneous, composite, material made from hydraulic cement,aggregates, and water; see Figure 15. In concrete, it is the hardened cement paste thatbinds the different components together. Cement paste, in itself, is a very brittle materialwith a tensile strength on the order of 2.0 to 9.0 MPa, a compressive strength of 20 to150 MPa, a modulus of elasticity of 10 to 20 GPa, and a fracture energy of 10 Nm/m2.Modern concretes also contain many different additives and admixtures (see Figure 15)to improve the workability, compressive strength, etc. The bulk volume of the concreteis occupied by aggregate (which roughly occupies 75% of the total volume) whose solidparticles may range in size from 0.1 µm to 30 mm; the diameter of fibres typicallyranges from 1 µm to 1 mm with lengths from about 1 mm up to 100 mm. Thenanometre and micrometer structure of hardened cement paste (e.g. porosity) is highlydependent on the water/cement ratio, the composition of the original grains, thetemperature of hydration, the presence of chemical admixtures at the time of hydration,the degree of hydration, etc. Furthermore, concrete is full of flaws, such as pores, airvoids, lenses of bleed water under coarse aggregates, and microcracks caused byshrinkage and thermal strains which have been restrained by coarse aggregates andboundary conditions. From a mechanical point of view, concrete is often viewed as athree-phase composite material consisting of the aggregate, the hardened cement paste(the matrix), and the interface between these two phases (the interfacial transition zone,ITZ). The major parameters influencing the properties of the hardened concrete are:
the properties of the hydrated cement paste (the matrix), e.g. porosity andmicrocracks;
the properties of the aggregates; and
the bond/interface between hydrated cement paste and aggregates.
CONCRETE-LIKE COMPOSITES or CEMENTITIOUS COMPOSITES
INCLUSIONSDISCONTINUOUS PHASECONTINUOUS PHASE-MATRIX
GRAINS(fillers)
BINDERS PORES AGGREGATES PORES REINFORCEMENTS
CementsPolymersBitumensGypsums
SandsFly AshSilica
Grounded limestone
Artificial
NaturalArtificial
NaturalArtificial
Lightweight
NaturalArtificial
Discontinuous fibres- micro fibres- macro fibres
Continuous fibresMats & fabrics
Water & Admixtures
Figure 15. Constituents for concrete-like composites, based on Brandt (1995).
The strength of cement-based materials is related to the development of themicrostructure, the hydration of the cement grains, and pozzolanic reactions. Hydrationis the process by which Portland cement becomes a firm, hardened mass after theaddition of water, and which is responsible for the microstructural development. Thecement hydration process is a complex sequence of overlapping chemical reactionsbetween clinker components, calcium sulphate, and water, leading to setting andhardening. Immediately after mixing cement and water, reactions start to occur and

CHALMERS, Civil and Environmental Engineering30
these generate an outburst of heat (Stages 0 and I in Figure 16). After these initial stagesan induction period, or dormant period, is entered (Stage II) during which not muchhydration takes place. Setting (Stage III) is defined as the onset of rigidity in freshconcrete whereas the period of fluidity, preceding setting, corresponds to the inductionperiod (Stage II); see Figure 16. The setting process is the consequence of a changefrom a concentrated suspension of flocculated particles to a viscoelastic skeletal solidcapable of supporting an applied stress. Setting is controlled primarily by the hydrationof Tri-calcium Silicate (C3S), and occurs when the induction period is terminated by arapid hydration of C3S leading to a fast temperature rise of the concrete (Stage III); seeNeville (2000), Gartner et al. (2002), Mindess et al. (2003). During the early stages (upto 24 hours) some 30 percent of the hydration occurs. After about 24 hours the rate ofheat evolution declines, although hydration may continue indefinitely as long as there iswater and space available for the cement grains that have not fully hydrated.
The products associated with the stages of cement hydration can be seen in Figure 17.The most important component is the Calcium Silicate Hydrate phase (C-S-H), whichmakes up 50 to 60 percent of the volume of solids in a fully hydrated cement paste andis responsible for the early mechanical strength. However, hydration is highlyinfluenced by a number of parameters such as: the water/cement ratio; the fineness ofthe cement and its composition (the main clinker components); addition ofsupplementary materials (such as fly ash and silica); admixtures (superplasticizer,accelerator, retarder, etc.); the temperature. The microstructure (and nanostructure) ofhardened cement paste will depend on the composition and size of the original cementgrains, the starting water/cement ratio, the temperature of hydration, and the presence ofchemical admixtures at the time of hydration. The overall view of the structure is one ofa wide range of particle sizes and void spaces. Throughout the hydrated paste there is acontinuous distribution of pore sizes, from air voids with a size of 50-200 µm tocapillaries of about 0.05-10 µm diameter and gel pores less than 0.5 nm in diameter.
Time of hydration
Degree ofhydration:
~2% ~15% ~30%
minutes hours days
0 I II III IV V
~4 h ~12 h ~24 h~10 m
Rat
eof
heat
evol
utio
n
Dissolution:ettringite formation
Initial set
Final set
Induction period:increase in Ca2+
concentration
Rapid formation ofC-S-H and CH
Formation ofmonosulfate
Diffusion-controlledreactions
Figure 16. Schematic representation of heat evolution during hydration of a cement,based on Gartner et al. (2002).

CHALMERS, Civil and Environmental Engineering 31
0 5 30 1 2 6 1 2 7 28 90
minutes hours days
PorosityC-S-H
short fibres
C-H
C4(AF)H13
Monosulphate
Ettringite
C-S-Hlong fibres
Time of hydration
VIII & IV0, I & II
0 25 50 75 100Degree of hydration [%]
0
25
50
75
100
Rel
ativ
evo
lum
e[%
]
capilaryporosity
C-S-H
calciumhydroxide
AFt and AFm
calciumsulfate
C4AF
C3A
C2S
C3S
Other
(a) (b)
Rel
ativ
eab
unda
nce
Figure 17. Relative volumes of the major compounds in the microstructure ofhydrating Portland cement pastes: (a) as a function of time (from Locheret al. 1976); and (b) as a function of the degree of hydration as estimatedby a computer model for a w/c-ratio of 0.5 (from Tennis and Jennings2000).
The addition of fibres does not change the hydration reactions, nor does it significantlyalter the development of the microstructure in the bulk matrix. However, the pull-outbehaviour and the bond of a fibre are significantly influenced by the microstructure atthe interface between the fibre and the matrix, which is referred to as the interfacialtransition zone (ITZ). Figure 18(a) shows a schematic description of the ITZ whileFigure 18(b) shows a scanning electron image of a fibre-reinforced concrete illustratingthe scale of the microstructure. Understanding this microstructure is important whendiscussing the mechanical properties of fibre-reinforced concrete, as it plays a key rolein controlling the overall performance of the material; see Bentur et al. (1995).According to Bentur et al. (1995), when considering interfacial effects, attention shouldbe given to two major characteristics: (1) the micromechanics of the physical andchemical processes taking place at the interface, and (2) the microstructure of thecomposite which develops at the interfacial zone. The formation of the ITZ is aconsequence of: (1) wall effects; (2) the conditions under which chemical processes takeplace near the surface of the inhomogeneity; and (3) bleeding as a result of theinefficient packing of the cement grains around the much bigger inclusion (the fibre). Awater-filled space tends to build up around the fibre (see Bentur et al. 1995), and withthe progress of hydration it becomes only partly filled with hydration products. It hasbeen estimated (see Mindess et al. 2003) that the interfacial transition zone (ITZ) in atypical concrete is 20-50 µm thick, and that the ITZ makes up 20-40% of the totalvolume of the cementitious matrix.

CHALMERS, Civil and Environmental Engineering32
Fibre
CH layer
Bulk matrix
Bulkmatrix
Fibre
FIBRE
Porous layer
Interfacialtransitionzone (ITZ)
Duplex film
Steel fibre
(a) (b)Figure 18. The interfacial transition zone (ITZ): (a) schematic description of the ITZ
around a fibre, based on Bentur (1991); and (b) picture showing theinterfacial transition zone (ITZ) close to a fibre and the microstructure ofconcrete. Credit T. Easley and Prof. K.T. Faber, NorthwesternUniversity.
To begin with, the density and packing of the ITZ is influenced by several parameters,e.g.: the size of the fibre in relation to the other constituents (see Figure 19); the size andpacking of the matrix material; the porosity of the matrix; and the surface roughness andchemistry of the fibre. The wall effect is related to the way that the cement particles arearranged geometrically near an inhomogeneity, compared to the way they are arrangedin the bulk paste. While the chemical effect is always there, the geometrical effect onpacking depends on the size of the inhomogeneity. It has been shown that improvedpacking, for example by the addition of microsilica (and other micro-fillers), improvesthe bond and increases the pull-out load for a fibre; see Bentur et al. (1995), Chan andLi (1997), Rasmussen (1997), and Banthia (1998). The beneficial effect of microsilicaarises primarily because: (1) it is able to pack more closely to the fibre; (2) microsilicais highly pozzolanic and reacts with the calcium hydroxide (CH) which results in a moredense and homogeneous microstructure (see Mindess et al. 2003); and (3) microsilicaimproves the coherency of the fresh paste and thereby reduces the degree of internalbleeding. A drawback with microsilica and other micro-fillers is that they increase thebrittleness and the shrinkage; see e.g. Neville (2000) and Mindess et al. (2003). On theother hand, it has also been suggested that the shrinkage results in a clamping pressurewhich improves the pull-out behaviour; see Stang (1996) and Cotterell and Mai (1996).
The mechanical properties of the fibre-matrix interface change with time as thehydration proceeds. The early-age bond strength development of different fibres (Nylon,PVA, and smooth, twisted, and hooked-end steel fibres) was investigated byWongtanakitcharoen and Naaman (2004). They found that during the first 8 hours aftermixing, the pull-out behaviour was more or less independent of the fibre material, whilehooked-end fibre had a different behaviour and fractured the matrix. Moreover, in theearly stage, the chemical bond (adhesion) seemed to be insignificant and friction themain mechanism, but from about 8 to 24 hours the bond strength developed very rapidlyand the pull-out characteristics of the different fibres changed. Rasmussen (1997)investigated the time development of bond, the interfacial properties for different fibretypes (steel, polypropylene, polyethylene, and carbon), and different micro-fillers(microsilica and clay). The results of Rasmussen (1997) indicated that the developmentof the ITZ was independent of the fibre (the investigated types) and that the strength

CHALMERS, Civil and Environmental Engineering 33
development of the composite was related to the constant development of the C-S-Hthrough hydration of cement. Furthermore, when the curing time was increased from 4to 7 days and from 7 to 14 days, the interfacial bond and the peak pull-out load werealmost doubled, but further curing resulted in a slight decrease of the peak load.
Steel fibre, df = 500 µm
Steel fibre, df = 100 µm
PVA fibre, df = 30 µm
Aramid fibre, df = 10 µm
Asbestos fibre, df = 0.5 µm
Silica, d50 = 0.15 µm
Cement, d50 = 15 µm
Filler, d50 = 50 µm
Fine aggregate, d50 = 1.0 mm
Figure 19. Schematic showing the relative sizes of different fibres (to the left) and theconcrete constituents (to the right).
3.4.2 Pre-cracking mechanisms (Stress transfer)
When a tensile load is applied to a fibre-reinforced composite, consisting of a low-modulus matrix reinforced with high-strength and high-modulus fibres, the matrix willtransfer some of the load to the fibre. Hence, before any macrocracks are initiated in thematrix, some of the load will be carried by the fibres and the rest by the matrix. As aconsequence, it should be possible to increase the strength of the material by addingfibres with a higher modulus than the matrix. However, experimental studies haveshown that, with the volumes and sizes of fibres that can conveniently be incorporatedinto conventional mortars or concretes, the fibre reinforcement did not offer asubstantial improvement in strength over corresponding mixtures without fibres; see e.g.Shah (1991), Mindess (1995) and Li and Maalej (1996b). The difficulty of increasingthe tensile strength is mainly due to the low tensile strain capacity of cementitiousmatrixes, but also due to the fact that a fibre addition may lead to increased porosity.That the tensile strength is difficult to increase can be shown by theoretical models, e.g.the rule-of-mixture.
The simplest model to predict the tensile strength of a composite material is the rule-of-mixture, in which it is assumed that a uniform strain exists throughout the compositeand that failure occurs when either of the materials reaches their failure strain. Thetensile failure strength of the composite, σt, and the axial elastic modulus, Ec, can thenbe predicted as:
( ) εσ ⋅⋅+⋅= mmfft EVEV and mmffc EVEVE ⋅+⋅=
where Vf and Vm are the fibre and matrix volume fractions, Ef and Em are thefibre and matrix elastic modulus, and ε is the failure stain of the material withthe lowest strain capacity.

CHALMERS, Civil and Environmental Engineering34
However, the rule-of-mixture is a simplification and idealisation, and such aspects asthe strength of interface between the fibre and the matrix or the case of a random 3D-orientation of fibres are not considered. On the other hand, these effects can be takeninto account by modifying the relationship and introducing factors that have to betheoretically derived or experimentally determined; see e.g. Bentur and Mindess (1995),Balaguru and Shah (1992), Maidl (1995). This results in the following approximaterelationship for the tensile failure strength of the composite:
ff
favlmmft V
d
LV τηησσ φ ⋅⋅+⋅=
where σmf is the matrix failure strength; ηφ is a fibre orientation efficiencyfactor; ηl is a fibre length influence coefficient; τav is the average bondstrength; and Lf/df is the fibre aspect ratio.
It should be noted that the fibre orientation efficiency factor is not the same beforematrix cracking as after the matrix has cracked. For determining the elastic properties(i.e. before matrix cracking) when the composite is subjected to deformation only in thedirection of the applied stress, efficiency factors are according to Cox (1952) forrandom 2-D η2-D = 1/3 and for random 3-D η3-D = 1/6. Krenchel (1964) considered thecase when deformations occurs in other directions as well and determined the followingefficiency factors: for random 2-D, η2-D = 3/8 and for random 3-D, η3-D = 1/5. Aftermatrix cracking, the factor depends upon the number of fibres per unit area; seeKrenchel (1964) and Cotterell and Mai (1995).
The stress transfer from the matrix to the fibre (see Figure 20) can be described by theshear-lag theory, originally introduced by Cox (1952). The shear-lag model can also beused to describe the load transferred from fibre to matrix, as the case when the matrixhas cracked.
Uniformstress
Deformationof matrix
Tensile stress in fibreShear stress at interface
Matrix
Fibre
x
Em , νm
Ef , rf , Lf
Figure 20. The stress build-up in a fibre and the interface for the shear-lag theory.
The shear lag model is perhaps one of the simplest models which takes into account thegeometry of the phases as well as their volume fraction, having originally beendeveloped for describing fibrous paper (Cox, 1952). The composite is viewed ascomprising of long, but not continuous, fibres within a matrix. It assumes that the loadis transferred from the matrix to the fibres by the generation of shear stresses at the fibrematrix interface, and given equilibrium conditions between the fibre stress, σf, and theinterfacial shear stress, τ i.

CHALMERS, Civil and Environmental Engineering 35
( ) ( )( )( )⋅
−−⋅=
2cosh
2cosh1
f
fff L
xLEx
ββ
εσ and ( ) ( )( )( )⋅
−⋅
⋅=
2sinh
2sinh
2 f
ff
fi L
xLE
rx
ββ
εβ
τ
with ( ) ( )fmfm
m
f rRE
E
r ln1
1
⋅⋅+=
νβ
where νm is the Poison’s ratio of the matrix, Rm is the average centre-to-centreinter-fibre distance, and rf is the radius of the fibre.
The value Rm/rf depends upon the fibre packing and the fibre volume content of thecomposite. The following equations can be derived for square and hexagonal packing(see Figure 21):
( ) ( )ffm VrR πln2
1ln = (for square packing)
( ) ( )ffm VrR 322
1ln π= (for hexagonal packing)
where Vf is the fibre volume content in the composite.
Rm Rm
Square packing Hexagonal packing
Figure 21. Fibre packing arrangements used to find Rm in shear lag models.
The shear lag model predicts an axial composite stiffness given by:
( )mm
f
fffc EV
n
nEVE +
⋅
⋅−=
λλtanh
1
where ( ) ( )ffm
m
VE
En
1ln1
2
⋅+⋅
=ν
and fff dL=λ is the aspect ratio of the fibre.
The shear lag model predicts that, as long as the fibre is stiffer than the matrix, the axialcomposite stiffness increases with: (1) the stiffness of the fibre; (2) the volume fractionof fibres; and, which is interesting, (3) increasing aspect ratio of the fibre (this effect is,however, rather small). Because the model neglects the transfer of stress across the fibreends, the model tends to underestimate the stiffness of very short fibre- and particle-containing composites, for which the transfer of normal stresses is as important as shear.The model also neglects the effect of an interfacial transition zone with slightly differentproperties that the matrix. However, the main advantage of the model is that it is thesimplest physical model which acknowledges the importance of fibre aspect ratio incontrolling stiffness, and thus serves the purpose of providing some initialunderstanding of important mechanisms and properties. A shear-lag analysis of an un-cracked matrix will provide information on how the parameters affect the tensile stressin the fibre and the shear stress in the interface. In Figure 22(a) it can be seen that, as themodulus of elasticity of the fibre increases, so does the tensile stress in the fibre.

CHALMERS, Civil and Environmental Engineering36
Furthermore, from Figure 22(b) it is apparent that a high modulus fibre leads to highshear stresses in the interface.
0
10
20
30
40
50
60
0 0.2 0.4 0.6 0.8 1Relative coordinate [x / (L f /2)] [-]
Ten
sile
stre
ssin
fibr
e,σ
f,[M
Pa]
E f = 400 GPa
E f = 200 GPa
E f = 100 GPa
E f = 50 GPa E f = 25 GPa
E m = 20 GPa
v m = 0.2
V f = 0.5 %
r m = 28 r f
r f = 0.23 mm
L f = 30 mm
0.0
0.5
1.0
1.5
2.0
2.5
3.0
3.5
0 0.2 0.4 0.6 0.8 1Relative coordinate [x / (L f /2)] [-]
Shea
rst
ress
inin
terf
ace,
τi,[
MPa
]
E f = 400 GPa
E f = 200 GPa
E f = 100 GPa
E f = 50 GPa
E f = 25 GPa
E m = 20 GPa
v m = 0.2
V f = 0.5 %
r m = 28 r f
r f = 0.23 mm
L f = 30 mm
(a) (b)Figure 22. Results from shear-lag analysis, influence of the modulus of elasticity of
the fibre: (a) stresses in fibre and (b) interface at cracking.
Figure 23(a) shows the influence of the modulus of elasticity of the matrix. It can beseen that for a typical steel fibre (with a modulus of elasticity Ef = 200 GPa) theinfluence of the modulus of elasticity of the matrix is not very large for the fibre stress.For a higher matrix modulus, the stress is introduced faster into the fibre and the shearstresses in the interface become larger; see Figure 23(b).
0
5
10
15
20
25
30
0 0.2 0.4 0.6 0.8 1Relative coordinate [x / (L f /2)] [-]
Ten
sile
stre
ssin
fibr
e,σ
f,[M
Pa] 40 GPa
E m = 10 GPa
v m = 0.2
E f = 200 GPa
V f = 0.5 %
r m = 28 r f
r f = 0.23 mm
L f = 30 mm
0.0
0.5
1.0
1.5
2.0
2.5
3.0
3.5
0 0.2 0.4 0.6 0.8 1Relative coordinate [x / (L f /2)] [-]
Shea
rst
ress
inin
terf
ace,
τi,[
MPa
]
E m = 40 GPa
E m = 10 GPa
v m = 0.2
E f = 200 GPa
V f = 0.5 %
r m = 28 r f
r f = 0.23 mm
L f = 30 mm
(a) (b)Figure 23. Results from shear-lag analysis, influence of the modulus of elasticity of
the matrix: (a) stresses in fibre and (b) interface at cracking.
The effect of the slenderness of the fibre (λf = Lf /df - fibre length divided by diameter)can be seen in Figure 24. For a high slenderness, the stress will be introduced over ashort distance, while for a fibre with a low slenderness it is introduced over a largerlength (transmission length). For a very low slenderness (a thick and short fibre) it is notpossible to transfer the same stress. In Figure 24(b) it is also possible to see that theslenderness has no effect on the magnitude of the maximum shear stress at the interface;it only affects the rate of stress transfer.

CHALMERS, Civil and Environmental Engineering 37
0
5
10
15
20
25
30
0 0.2 0.4 0.6 0.8 1Relative coordinate [x / (L f /2)] [-]
Ten
sile
stre
ssin
fibr
e,σ
f,[M
Pa]
λ f = L f / d f = 25
E m = 20 GPa
v m = 0.2
E f = 200 GPa
V f = 0.5 %
r m = 28 r f
L f = 30 mm
150
50
0.0
0.5
1.0
1.5
2.0
2.5
0 0.2 0.4 0.6 0.8 1Relative coordinate [x / (L f /2)] [-]
Shea
rst
ress
inin
terf
ace,
τi,[
MPa
]
λ f = L f /d f = 25
E m = 20 GPa
v m = 0.2
V f = 0.5 %
E f = 200 GPa
r m = 28 r f
L f = 30 mm
50
150
(a) (b)Figure 24. Results from shear-lag analysis, influence of the slenderness of the fibre
(the fibre diameter): (a) stresses in fibre and (b) interface at cracking.
3.4.3 Post-cracking mechanisms (crack bridging)
For most FRC, the major reinforcing effect of fibres comes about first after matrixcracking. Examination of fractured steel fibre-reinforced concrete specimens (see Figure25) shows that failure takes place primarily due to fibre pull-out and that, for fibres withdeformed ends (e.g. end-hooks), a considerable energy dissipation takes place as thefibre is straightened and plastically deformed; see Figure 25(c).
(a) (b) (c)Figure 25. Fractured specimens with fibres protruding: (a) uni-axial tension
specimen; (b) beam specimen; and (c) close-up of an end-hooked fibrethat has been straightened during pull-out.
Thus, unlike plain concrete, a FRC specimen does not break in such a brittle mannerafter initiation of the first crack. This has the effect of increasing the work of fracture,which is referred to as toughness or fracture energy and is represented by the area underthe stress-crack opening curve (see Figure 26). Also the tensile deformation capacity issignificantly improved as the critical crack opening – the crack opening when no stressis transferred – is increased from approximately 0.3 mm to half the fibre length (whichfor steel fibres usually means 10 to 30 mm); see Figure 26. In addition to the fibres, thematrix cracking contributes to the energy dissipation by aggregate bridging (see Figure26), which results in a bridging traction that decays towards zero for a crack opening of0.3 mm. Although, the fibre bridging is predominant when it comes to energydissipation and bridging traction.

CHALMERS, Civil and Environmental Engineering38
wc ≈ 0.3 w [mm]
σ (w) / fct
1
Concrete
Fibres
Total
φ
w
Le
σ
pull-out of randomlyorientated fibres
σ
Lf / 2≈ 0.05
Figure 26. Combined fibre and aggregate bridging for fibre-reinforced concreteloaded in uni-axial tension.
3.4.3.1 Aggregate bridging
The tensile fracture process of concrete is a complex phenomenon, whose physics hasnot yet been fully uncovered. In general, it is understood that, when subjected to atensile stress, concrete crack bridging is a result of coalescence of microcracks in thematrix, development of bond cracks between aggregates and matrix, and the frictionalpull-out of aggregates; see for example Petersson (1981), Brandt (1995), Shah et al.(1995), Karihaloo (1995), Cotterell and Mai (1995), Li and Maalej (1996a), van Mier(1997). In plain concrete the mechanisms involved in the fracture process include (seeFigure 27): (I) crack shielding, (II) crack deflection, (III) aggregate bridging, (IV) cracksurface roughness-induced closure, (V) crack tip blunted by void, and (VI) crackbranching. The different toughening mechanisms can be divided into crack frontal,crack tip, and crack wake mechanisms (see Cotterell and Mai 1995 and Li and Maalej1996a). Some of the toughening mechanisms have a long-range effect over a large crackextension distance (e.g. microcracking and aggregate and fibre bridging); but othershave only a short-range effect over a small crack extension distance (e.g. crackdeflection, bowing and pinning). For concrete, the major toughening mechanisms arethose of the crack wake (e.g. aggregate bridging). These mechanisms are supported byboth experimental and numerical observations, which have revealed overlapping cracks,aggregate interlock, and possibly aggregate fracture; see van Mier (1997) and van Mier(2004). As a result, it can be expected that the stress-crack opening relationship forconcrete should depend primarily on the characteristics of aggregates, includinggrading, stiffness and strength (or toughness), surface texture, shape and content, as wellas on the characteristics of the cement and any supplementary materials (e.g. pozzolanicmaterials, such as microsilica and fly ash, and fillers). Several researchers haveinvestigated the effects that aggregates play (e.g. type, size, shape, volume fraction, etc),the effect of additions etc., and techniques such as acoustic emission monitoring and X-ray observations; see for example van Mier (1991), van Mier (1997), Giaccio andZerbino (1997), Buyukozturk and Hearing (1998), Otsuka and Date (2000), Tasderi andKarihaloo (2001), Darwin et al. (2001), Wu et al. (2001). Furthermore,micromechanical modelling and simulations of fracture have provided additionalknowledge; see for example van Mier and van Vliet (1999), Mohamed and Hansen(1999), Tijssens et al. (2001).

CHALMERS, Civil and Environmental Engineering 39
Main crack Microcracks Main crackAggregate
Aggregatebridging
Main crack Void
Friction betweencrack faces
Secondarycrack tip
Main crack tip
(I) (II)
(III) (IV)
(V) (VI)
Crack tip blunting
Figure 27. Some toughening mechanisms in plain concrete, from Shah et al. (1995).
Based on the numerous studies mentioned, it is generally acknowledged that the uni-axial behaviour can be explained as presented in Figure 28. Pre-existing microcracksexists within the concrete, even before any stresses have been applied, as a result of theinternal restraint caused by the aggregate and shrinkage and thermal deformations.When a stress is applied, microcracks will start to grow, initially at the interfacebetween the cement paste and the aggregates (A), and eventually the microcrackspropagate into the mortar (B). Once the peak stress is reached (C), microcrackspropagate in an unstable manner and crack localisation occurs, with the result thatmacro-cracks propagate through the specimen, leading to the stress-drop (D). Crackbridging and crack branching is the principal mechanism responsible for the longsoftening tail (D-E) observed in experiments. But as the fracture process to a largeextent depends on the aggregates and their bond to the matrix, it is different for high-strength concrete and lightweight aggregate concrete. For these two types of concrete,the aggregates may become the weak link and aggregate rupture may occur, whichreduces the bridging effect and results in a more brittle fracture process.
σ
C
D
fct
Elongation, ∆l
bridging and branching
macro-crack growth
micro-crack growth
A
macro-crack
wB
traction freemicro-
cracking
E D
E
C B
w
A
Bridging stress
bridging andbranching
macro-crack growth
concrete fractureprocess zone
Figure 28. Schematic description of the fracture process in uni-axial tension and theresulting stress-crack opening relationship.

CHALMERS, Civil and Environmental Engineering40
3.4.3.2 Fibre bridging
The fracture process of fibre-reinforced composites is also a complex phenomenondependent on a number of parameters. It is generally accepted that when a crack ispresent in a matrix, and this approaches an isolated fibre, the following mechanismsmay be expected to take place and contribute to energy dissipation (see Figure 29):
matrix fracture and matrix spalling (or fragmentation);
fibre-matrix interface debonding;
post-debonding friction between fibre and matrix (fibre pull-out);
fibre fracture; and
fibre abrasion and plastic deformation (or yielding) of the fibre.
Matrixspalling
Matrixcracking
Plasticbending
Plasticdeformation
Crack frontdebonding
Slidingfriction
Fibre bridging
(a) (b) (c)
Fibre pull-out
Fibredebonding
Matrixcrack
Fibrefailure
Figure 29. (a) A schematic illustrating some of the toughening effects and crack frontdebonding, the Cook-Gordon effect (Cook and Gordon, 1964), anddebonding and sliding in the crack wake. (b) Matrix spalling and matrixcracking. (c) Plastic bending (deformation) of inclined fibre during pull-out – both at the crack and at the end-anchor.
The mechanical behaviour of a FRC is related not only to the amount and orientation ofthe fibres, but also largely to the pull-out versus load (or load-slip) behaviour of theindividual fibres. The pull-out behaviour of an fibre is, in its turn, dependent on anumber of factors such as: (1) the type of fibre and its mechanical and geometricalproperties; (2) the mechanical properties of the interface between the fibre and matrix;(3) the angle of inclination of the fibre with respect to the direction of loading; and (4)the mechanical properties of the matrix. The fibre pull-out problem has been extensivelyinvestigated experimentally, and a number of theoretical models for describing the fibrepull-out behaviour have been proposed. In addition, as the mechanics of fibre pull-out isof interest to a vast engineering field there is a large amount of literature covering thesubject. The current understanding of the behaviour of fibre-matrix interfacialmechanics is based on a number of studies, with fibres embedded in a cementitiousmatrix (using single or multiple fibres), and development of theoretical models. Some ofthe major studies in the filed include those of Bartos (1981), Gray (1984a, b), Bentur etal. (1985), Gopalaratnam and Shah (1987), Mandel et al. (1987), Namur and Naaman(1989), Wang et al. (1989), Bentur and Mindess (1990), Stang et al. (1990), Wang et al.(1990a, b), Alwan et al. (1991), Tjiptobroto and Hansen (1991), Balaguru and Shah(1992), Li (1992), Leung and Li (1991), Chanvillard and Aïtcin (1996), Kullaa (1996),Li and Stang (1997), Rasmussen (1997), Kim and Mai (1998), Alwan et al. (1999),Dubey (1999), Groth (2000), Robins et al. (2002), Grünewald (2004).

CHALMERS, Civil and Environmental Engineering 41
The transmission of forces between the fibre and the matrix is done through bond,which characterises the interface mechanics between the fibre and the surroundingmatrix. The fibre pull-out behaviour is generally considered to be the result of gradualdebonding of an interface surrounding the fibre, followed by frictional slip and pull-outof fibre. The components of bond can be classified as follows, see Alwan et al. (1999):(1) the physical and/or chemical adhesion between fibre and matrix; (2) the frictionalresistance; (3) the mechanical component (arising from a particular fibre geometry, e.g.deformed, crimped, or hooked-end); and (4) the fibre-to fibre interlock. Several fibrepull-out models exist, and the simplest models ignore the elastic stress transfer and thematrix deformation; see e.g. Hillerborg (1980) and Wang et al. (1989). In other models,it is assumed that the interfacial shear bond stresses are elastic to start with, butgradually debonding takes place at the interface and the stress transfer is shifted to africtional one; see for example Gopalaratnam and Shah (1987). To describe thedebonding criterion, basically two different approaches are used – see Figure 30(a): astrength-based criterion (or stress-based) and a fracture-based criterion. In the strength-based models, it is assumed that debonding initiates when the interfacial shear stressexceeds the shear strength. For the fracture-based models, on the other hand, thedebonding zone is treated as an interfacial crack and the conditions for its propagation(i.e. debonding) are considered, in terms of fracture parameters of the interface and anassumption that, to drive the debonded zone forward, adequate energy must be supplied;see Stang et al. (1990) and Li and Stang (1997). Once debonding has taken place, stresstransfer takes place due to frictional resistance. For the frictional bond, differentrelationships can be used to describe this, including (1) constant friction, (2) decayingfriction (or slip softening), and (3) slip hardening friction. The micromechanics andproperties of fibre-matrix interfaces have been reviewed and described in Bentur et al.(1995), Li and Stang (1997), Kim and Mai (1998).
Which model and relationship to use depend on the governing mechanisms. Forexample, in the case where the chemical bond (or adhesion) is negligible, the debondingenergy becomes unimportant and friction is the governing mechanism, and a simplefrictional pull-out model can be used. Furthermore, for some fibre-matrix systems thepull-out is associated with damage processes, either to the fibre surface or to the matrix(surface abrasion), which may lead to slip-softening or slip-hardening friction. Wheninterpreting experimental results it is important to realise that the choice of modelinfluences the interpreted properties. As concluded by Stang et al. (1990), in acomparative study of the strength-based and the fracture-based approaches, theparameter which in the strength-based approach is interpreted as the bond parametercan, according to the fracture-based approach, be decomposed into a friction-relatedpart and a bond-related part. Moreover, Bentur and Mindess (1990) stress theimportance of proper evaluation, which should not be based on the determination of alimited number of numerical parameters (e.g. maximum pull-out load, embedmentlength and fibre cross-sectional geometry), but rather it should include analysis of theentire curves obtained during such tests. The problems of correctly interpreting fibrepull-out tests can partly explain the huge differences in the quoted values of theinterfacial shear bond strength, which in the literature range from 0.5 up to 95 MPa,while the interfacial shear friction ranges from 0.5 to 20 MPa; see Bartos (1981), Benturand Mindess (1990), Balaguru and Shah (1992), Glavind (1992), Li and Stang (1997),Rasmussen (1997), Groth (2000), Grünenwald (2004). The high bond strength valueshave usually been evaluated from peak-load values.

CHALMERS, Civil and Environmental Engineering42
Slip
τ
P
τf
τaLinear elastic brittlefracture model (bondstress approach infinity)
τ
τf
τaCohesive strengthmodel
1/√r
τ
τf
τaSlip softeningfracture model
ττf
Simplified strengthbased model
breakdown zone
Bonded Debonded
τ (slip)
τ
slip
τ
slip
τ
slip
Constant friction
(a) (b)
Slip softening friction
Slip hardening friction
τ
slip
Constant frictionSlip softening friction
Slip hardening friction
Figure 30. (a) Different debonding models for fibre pull-out (based on Li and Stang,1997) and (b) different relationships for describing the frictional bond-slip relationship.
A typical pull-out curve for a straight fibre is shown in Figure 31. The ascending part(OA) is associated with elastic or adhesive bond. In the next portion of the curve (AB),debonding is initiated and progresses until full debonding occurs (B). Subsequently, thefibre is pulled out (B-F) and the only resistance offered is frictional bond; the pull-outload decreases with increasing slip as a result of decreasing embedded fibre length andbecause of slip-decaying friction. The dissipated energy is equal to the area beneath theload-displacement (slip) curve; see Figure 31(b). Thus, the pull-out energy (bothdebonding and friction) increases with increased fibre embedment length, unless theembedment length becomes too long and the fibre breaks. For a straight fibre, the slip atthe peak load is relatively small, generally less than 0.1 mm.
PPull-out curve
Pure friction curve
Debonding energy
Friction contribution
Debonding contribution
P δ
Le
Bonded
Debonded
Slip
P
δLe
Pull-out energy
BB
A
A
(a) (c)(b)
F
δ
Pcrit
Pmax
δcrit δ0
Figure 31. Fibre pull-out of a straight fibre (a) and the pull-out relationship betweenend-slip and load for a straight fibre (b). The complete curve is shown in(b) and (c) is a close-up of the curve during the debonding stage (basedon Hansen, in Bentur et al. 1995).

CHALMERS, Civil and Environmental Engineering 43
In Figure 32, a comparison is made between the pull-out curve for straight and hooked-end fibres. In Figure 32, the ascending part (OA) is associated with elastic or adhesivebond. In the next portion of the curve (AB), debonding is initiated and progresses untilfull debonding occurs (B). Afterwards, frictional decaying causes a decrease in pull-outload with increasing slip, as a result of decreasing embedded fibre length. For thestraight fibre, this part is represented by (BF). For a hooked-end fibre, the load can beincreased (BC) due to the mechanical anchorage until this starts to slip (CD) andbecomes progressively deformed during pull-out from the matrix (DE). When the end-anchor has been completely pulled out, and straightened in the process, a frictionaldecaying phase ends the process (EF), which corresponds to the case of a straight fibre.The amount of slip at the peak (C) and until the end-hook has been straightened (E)depends on the geometry of the fibre, but generally the peak occurs at a slip of about 0.5to 1.5 mm. In experiments it has been observed that, during the pull-out process,considerable cracking in the surrounding matrix may occur, which can extend to a zoneof a similar size as that of the deformed end (see Bentur et al., 1985). Furthermore, ifthe deformed part does not yield it may fracture. Analytical models for determining thepull-out response of fibres with mechanical anchorage have been developed by,amongst others, Alwan et al. (1999), van Gysel (1999), and Sujivorakul et al. (2000) forend-hooked fibres; and Chanvillard (1999) for crimped steel fibres.
P
P
Le
P
δLe
Hooked-end fibre
Straight fibre
Deformation ofend hook
δ
O
A
CB
DE
F
E
D
CB
Figure 32. Typical fibre pull-out relationship between end-slip and load for straightand end-hooked fibre.
When comparing the behaviour and efficiency of different fibres, the fibre pull-outrelationship depends on both mechanical and geometrical properties of the fibre, as wellas on its chemical affinity to the matrix (i.e. whether a chemical bond can develop). Thismeans that the pull-out behaviour of a hooked-end fibre is significantly differentcompared to a crimped/corrugated fibre. For the crimped/corrugated fibre, as observedby Chanvillard and Aïtcin (1996), the failure process starts by crushing of a smallconcrete cone on each side of the crack plane and the fibre is unfolded; during the pull-out, the fibre is straightened so that it loses it original shape (which leads to a significantreduction in the effective modulus of the fibre). Indented fibres (see Groth 2000) have,after the peak load, a wave-shaped pull-out curve where the wavelength coincides withthe distance between the indented marks. Furthermore, a new type of fibre developed atthe University of Michigan (see Naaman 2003) has a completely different pull-outresponse which is a slip-hardening behaviour. The fibre, which is named Torex, has apolygonal cross-section (primarily rectangular or triangular) and is twisted along its axis(similar to a screw). The polygonal shape increases the surface area of the fibre and thecohesive bond, while the twisting increases the frictional resistance. When pulled-put,one end of the fibre will be bonded to the matrix and twisting is prevented, while the

CHALMERS, Civil and Environmental Engineering44
other end rotates as the fibre is gradually pulled out. Naaman (2003) concludes thatTorex fibre has a significantly better performance (two to three times higher pull-outload); this can be utilised either to improve the performance of the fibre-reinforcedconcrete, or to reduce the required volume fraction of fibres.
The pull-out behaviour and maximum load also depend on the angle of inclination ofthe fibre. Here the matrix strength plays an important role, as a weak matrix is prone tospalling and local damage due to the additional concentrated stress (see Figure 33). Ingeneral, it has been found that flexible fibres (e.g. synthetic) tend to increase in pull-outload to a high angle, while stiff but ductile fibres (e.g. steel) increase up to about 45°inclination angle and then decrease. However, brittle fibres (e.g. carbon) tend to have adecreased pull-out load at all inclining angles. Naaman and Shah (1976) found that thepull-out load of inclined steel fibres was almost as high, and that the work required tocompletely pull out an inclined fibre was higher than that of a fibre parallel with theload; similar results were found by Bartos and Duris (1994). Brandt (1985) calculatedthe optimal orientation of steel fibres, and concluded that the optimal inclination angledepends on the interfacial properties of fibre and matrix; his model considered theenergy contribution of debonding, friction, plastic deformation, matrix spalling, andcomplementary friction between fibre and matrix due to local compression.Furthermore, Brandt found that the maximum pull-out energy was at an intermediateangle of about 35-50°. Li et al. (1990) investigated the pull-out behaviour of syntheticfibres and found that the pull-out load increased with the inclination angle. Leung andChi (1995) developed a theoretical, micromechanical model and identified that thereexists an optimum range of the yield strength of the fibre, which depends on the matrixproperties and the risk of spalling at high fibre load.
Fibre subjected tobending and shear
Crack faces
2δ
FS
R : F = Sx + Rx
Matrix spalling
w
(a) (b)
φ
Figure 33. (a) Bending and shearing of a fibre across a crack and the components ofa crack bridging force, based on Leung and Li (1992). (b) Inclinedbridging effect described by a pulley approach where the matrix ismodelled with spring elements.
So far only single fibre systems have been discussed, but a fibre-reinforced concreteconsists of several fibres which, in most cases, have random orientation. Bentur et al.(1985) and Bentur and Mindess (1990) pointed out, and observed in experiments, thatthe process of debonding and pull-out is quite different in an actual fibre-reinforcedspecimen, in which a crack is induced to propagate in the matrix across the fibre,compared to a simple pull-out test. It has also been observed that the pull-out behaviourand maximum load also depend on the spacing of the fibres (see Naaman and

CHALMERS, Civil and Environmental Engineering 45
Shah 1976). When investigating the pull-out process, Bentur et al. (1985) showed thathooked fibres damage the matrix at the hook and that the zone is on the same order asthe dimension of the hook. Hence, it is likely that for some types of fibres, e.g.deformed steel fibres, the pull-out behaviour will be affected by adjacent fibres, whichalso was found in an investigation by Naaman and Shah (1976). Naaman and Shahtested both aligned and inclined fibres and found that there was a decline in the pull-outresistance with increase in fibre density, and that the inclined fibres had the highestreduction. To what degree this affects the pull-out resistance is difficult to state, as itdepends on the extent of the damaged zone in the matrix, which is influenced by anumber of parameters such as the type of fibre (e.g. straight, hooked-end, or crimped),the dimensions of the fibre and its mechanical anchorage, and the properties of thematrix. Yet, it is likely that the best performance is achieved when the fibres areuniformly dispersed throughout the body.
3.4.3.3 Combined aggregate and fibre bridging
In a fibre-reinforced concrete, the resulting tensile bridging stress and energy dissipationare due to a number of mechanisms acting simultaneously; these have been explainedseparately. Compared to plain concrete, fibres act as an additional bridging mechanismand the critical crack opening (the stress-free) increases by a factor larger than 10, andso does the fracture energy. The tensile stress, fct, is scarcely influenced by the fibres,while the maximum fibre bridging stress depends on the parameters described for thesingle fibre pull-out and the additional effects caused by randomly oriented fibres.Hence, for a fibre-reinforced concrete there will be a combined effect of aggregate andfibre bridging (see Figure 34), where the aggregate bridging has a relatively shortworking range in comparison to the fibres. In Figure 34, three distinct zones can beidentified as:
a traction-free zone, which occurs for relatively large crack openings;
a bridging zone, where stress is transferred by fibre pull-out, and aggregatebridging; and
a zone of microcracking and microcrack growth.
σ
C
D
fct
Elongation, ∆l
bridging and branching
macro-crack growth
micro-crack growth
A
macro-crack
wB
tractionfree bridging and
branching
micro-cracking
E D
E
C B
w
macro-crack
growth
A
Bridging stress
FRC
ConcreteD
aggregatebridging
E
Figure 34. Schematic description of the effect of fibres on the fracture process in uni-axial tension.

CHALMERS, Civil and Environmental Engineering46
The stress-crack opening relationship, in Figure 34, thus depends on the fractureproperties of the concrete, and in most cases it will start with a steep descending part(C-D) for small crack openings (w < 0.1 mm). The contribution from fibre bridgingcomes gradually, and it is not until crack openings of at least 0.05 mm that it has anymajor influence. Depending on the characteristics of the fibre, the curve will level outand slowly decrease for increasing fibre slip (or crack opening) until it becomes zero(D-E); for some types of fibres the curve will enter an ascending part for which thestress increases (for deformed fibres, e.g. end-hooked) as the fibre is deformed duringthe fibre pull-out, but eventually the stress will start to decrease until it becomes zero.
Experiments have indicated that the size of the fibre compared to the aggregates and themicrocracks (load-induced and pre-existing) also has an influence on the fractureprocesses. For example, microfibres have experimentally been found to work on adifferent scale compared to large fibres. The basic concept is that, the smaller the fibres’diameter is, the more closely they will be spaced – which means that, depending on thefibre geometry, the number of fibres per added amount can vary quite considerably andincrease dramatically for short and slender fibres. In Figure 35 the number of fibres percm2 that cross a crack plane has been calculated for different fibre geometries (typicalsteel fibres) and volume fractions, and the effect of the fibre length and slenderness canbe seen. For short fibres with a high aspect ratio, Figure 35(b), the number of fibres ismuch higher than for conventional steel fibres. Moreover, for other types of fibres,which can be categorised as microfibres, the number of fibres can be as high as 1000per cm2, and even higher; see Table 8.
0
1
2
3
4
5
0.25 0.50 0.75 1.00 1.25 1.50
Volume fraction, V f, [%]
Num
ber
offi
bres
per
cm2
80/3565/3580/6065/60
0
20
40
60
80
100
0.25 0.50 0.75 1.00 1.25 1.50Volume fraction, V f, [%]
Num
ber
offi
bres
per
cm2
130/13100/1380/1365/13
(a) (b)Figure 35. Number of single fibres, Nf, crossing 1 cm2 of the matrix for different
aspect ratios and lengths (aspect ratio/length) for the case of random 3-Dorientation: (a) for steel macro-fibres; and (b) for steel microfibres.
Table 8. Approximate number of single fibres, Nf, crossing 1 cm2 of the matrix, forVf = 1% and random 3-D orientation.
PitchCarbon
PanCarbon
Asbestos Polypropylene PVA Steel MicroFibres
Ordinary SteelFibres
Diameter [µm] 14-18 6-10 0.02-25 18 12-41 50-150 250-1 050Length [mm] 3-12 3-6 1-5 10-25 4-12 3-15 25-60Nf [no. / cm2] 2 500 10 000 >50 000 2 000 900 30 2

CHALMERS, Civil and Environmental Engineering 47
To describe the influence of different fibres, Rossi et al. (1987) distinguish between twolevels (see Figure 36): the micro-level and the macro-level. The micro-level is initiatedafter the linear elastic stage is surpassed (A) and small cracks arise within the matrixfrom initial flaws. At increasing load (A-C), the length of the cracks increases and themicrocracks coalesce and finally localise (C). At a given fibre content, microfibres, dueto their high number, are more likely to cross these microcracks. In the macro-levelstage (C), a crack gradually opens in the direction of the principal tensile stress. Longfibres primarily improve the performance once a macro-crack appears, and theirgeometry and shape determine at what stage they are active. However, as themicrofibres are short, the range for which they are effective is limited and, inevitably,unstable crack growth will dominate the behaviour (C-D); see Rossi et al. (1987),Betterman et al. (1995), Nelson et al. (2002), Lawler et al. (2003), and Stang (1987).
For microfibres to be effective, they should have a relatively high aspect ratio andstiffness, so that they can restrain the microcracks as these propagate into the mortar andprevent and postpone the unstable crack growth; see Figure 36. Betterman et al. (1995)found that the peak-stress increased with increasing fibre volume as well as a decreasein fibre diameter. Lawler et al. (2003) observed that if microfibres were present,microcracks were prevented from widening but not from growing in length, buteventually cracks coalesced and transversed the full specimen width, producing amacro-crack where deformation localised. Furthermore, the strain capacity increasedwith the addition of microfibres, which is indicated in Figure 36. Nelson et al. (2002)found in their investigation that some microfibres are capable of effectively postponingthe development/growth of microcracks, and that polyvinylalcohol (PVA) andreinforced cellulose fibres were effective, whereas polypropylene fibres did not offerany improvement. It has been suggested that combining short and long fibres (hybridfibre concrete) improves the initial tensile strength as well as the performance in thepost-cracking regime; see e.g. Betterman et al. (1995), Markovic et al. (2004) and Medaet al. (2004).
σ
C
D
E
f*ct
Elongation, ∆l
bridging and branching
macro-crackgrowth
micro-crack growthdelayed by microfibres
A
fctC
fibre bridging
microfibres
macro-crack
w
Concrete
Micro fibre-reinforcedconcrete
Region wheremicrofibres act
B
postpones developmentand prevents widening ofmicro-crack
micro-crack
Figure 36. Schematic description of the effect of microfibres on the fracture processin uni-axial tension.

CHALMERS, Civil and Environmental Engineering48
3.5 Mechanical properties
In concrete design and quality control, compressive strength is the property generallyspecified and by which concrete is classified. The main reason for this is that, comparedto most other properties, testing of compressive strength is relatively easy. Furthermore,many properties of concrete, such as modulus of elasticity, tensile strength,permeability, etc., are believed to be dependent on the compressive strength and maytherefore be deduced from the strength data. Though, the compressive strength cannotbe utilised as a replacement for all properties, especially not for the increase oftoughness observed in fibre-reinforced concrete. This means that for fibre-reinforcedconcrete some sort of toughness property is required, and that other test methods have tobe utilised to characterise it. In addition, the type of properties required depends on theconstitutive models that are used to describe the material in numerical analyses.
The ranges of some mechanical properties of cement-based materials, such as cementpaste and concrete, are listed in Table 9. In the table, values of the following propertiesare listed: the compressive strength fc; the tensile strength ft; the modulus of elasticity E;the fracture energy GF; and the characteristic length lch. The characteristic length is anindication of the material’s brittleness and is defined as:
2t
Fcch
f
GEl
⋅=
Table 9. Range of mechanical properties of cement-based materials.
Materialfc
[MPa]ft
[MPa]E
[GPa]GF
[Nm/m2]lch
[mm]Cement paste 10 – 25 2.0 – 10.0 10 – 30 ≈ 10 5 – 15Mortar 1.0 – 10.0 10 – 30 10 – 50 100 – 200Normal-strength concrete 20 – 80 1.5 – 5.0 25 – 40 50 – 150 200 – 400High-strength concrete > 80 4.0 – 5.5 40 – 50 100 – 150 150 – 250Fibre-reinforced concrete 20 – 80 1.5 – 5.0 25 – 40 > 500 > 1 000
3.5.1 Compressive properties
The stress–strain relation of plain concrete exhibits nearly linear elastic response up toabout 30% of the compressive strength. This is followed by gradual softening up to theconcrete compressive strength; beyond the compressive strength, the concrete stress–strain relation exhibits strain softening until failure takes place by crushing.Experimental observations have suggested that the macroscopic behaviour undercompression is due to frictional sliding along pre-existing flaws, resulting in formationof tensile cracks at the tips of these flaws; see Vonk (1992) and van Mier (1997).Cracking starts as sliding on the aggregate-cement paste interface (the weak zone) andpropagates into the matrix as tensile cracks; these tensile cracks grow with increasingcompression and become parallel to the direction of the principal compressive stress.The final failure is due to interaction of the tensile cracks. The main explanation, asproposed by Neville (1997), of the largely curvilinear stress–strain relation of concretelies in the presence of interfaces between the aggregate and the hardened cement paste,in which microcracks develop even under modest loading. The behaviour of concretechanges and as the compressive strength increases and it becomes more brittle. For a

CHALMERS, Civil and Environmental Engineering 49
normal-strength concrete, the aggregate is significantly stronger and stiffer than thecement paste, while for a high-strength concrete the strength and stiffness are alike. As aresult, some cracks extend through the aggregates resulting in a smooth crack surface,compared to the more tortuous crack surface in normal-strength concrete. In high-strength concrete, the tensile strength of the aggregate, rather than the interface betweenpaste and aggregates, may become the weak link (see Darwin et al. 2001).
With fibres present in the matrix, the concrete become more ductile (see Figure 37), andthe main effect of fibres appears to be that they offer resistance against the longitudinalcrack growth. Though, the effect of fibres is highly dependent on the type of fibre used,the size and properties of the fibres, the volume fraction added, and the properties of thematrix. Glavind (1992), for example, found that the addition of fibres was particularlyadvantageous for improving the mechanical properties of high-strength concrete loadedin compression, as the inherent brittleness was significantly reduced. Generally it can beconcluded that conventional steel fibres at moderate dosages (<1%) do not affect thepre-peak properties, whereas the strain at crack localisation and the failure strainincrease. However, with microfibres (e.g. carbon and Wollastonite) and for high fibrevolumes (> 1%) it is possible to increase the compressive strength.
Plain concrete (NSC)
Plain concrete (HSC)
Strain [10-3]
0 1 2 3 4 5 6 7 8
Stre
ss[M
Pa]
0
20
40
60
80
100
120
FRC
FRC
Increaseof Vf
Figure 37. Schematic description of the behaviour of concrete and FRC incompression.
To take into account the beneficial effect of steel fibres, a number of empiricalexpressions have been proposed; see e.g. Ezeldin and Balaguru (1992), Taerwe and vanGysel (1996a,b). For structural design, elasto-plastic constitutive models with aparabolic transition have been proposed for the compressive behaviour of steel fibre-reinforced concrete, with ultimate strains of 3.0-3.5‰ (see e.g. Nanakorn and Horii,1996; ACI 544 (1994); Lok and Pei, 1998; and RILEM TC TDF-162, 2003a). RILEMTechnical Committee TDF-162 (2003a) suggests that the compressive strength of steelfibre-reinforced concrete should be determined by means of standard tests, i.e. assuggested in e.g. ENV 1992-1-1, on either concrete cylinders or cubes. Furthermore, theconcrete is classified according to the same strength classes as in ENV 1992-1-1, e.g.C30/37.

CHALMERS, Civil and Environmental Engineering50
3.5.2 Tensile properties
It is generally accepted that the most appropriate, and physically sound, classification ofthe tensile behaviour is based on the uni-axial response; see e.g. Hillerborg (1980),Stang (1992), van Mier (1997), Stang and Li (2004). The tensile behaviour of cement-based materials (like fibre-reinforced concrete) may be classified as either strain-softening (a quasi-brittle material) or pseudo strain-hardening; see Figure 38. For strain-softening materials, a localised single crack determines the post-peak behaviour andonce the matrix cracks the stress will start to decrease. The pseudo strain-hardeningmaterial is called high-performance fibre-reinforced cement composite (HPFRCC) – seeNaaman and Reinhardt (1996) – and is characterised or defined as ‘high-performance’ ifthe stress–strain curve shows a quasi-strain hardening (or pseudo-strain hardening)behaviour (i.e. a post-cracking strength larger than the cracking strength, or elastic-plastic response). Based on this classification, tensile properties for strain-softeningmaterials will be discussed.
wε
deformation
σt
σ
E
σ (ε)
σ = σ (ε)
σw
Strain softening:Plain concrete
Strain softening:Fibre-reinforced concrete
Strain hardening:High-performanceFibre-reinforcedConcrete
σ = σ (w)
wε
Multiplecracking
σ = σ (w)
Crack localization
Crack localization
Figure 38. Classification of tensile behaviour of cement-based materials.
Plain concrete is a strain-softening material, and results from a number of researchers –e.g. Petersson (1980), Cornelissen et al. (1986), and Hordijk (1991) – indicate that theexperimental data for the stress-crack opening curve lie in a relatively narrow bandwhen the stress is normalised with respect to the tensile strength (see Stang 1992 andCornelissen et al. 1986). This means that, despite the complexity of the variousmechanisms involved, experimental data can be fitted quite accurately with relativesimple expressions; see e.g. Cotterell and Mai (1995), Karihaloo (1995), Shah et al.(1995), and van Mier (1997). The tensile fracture behaviour can be characterised by thetensile stress versus crack opening curve, which can be used in a cohesive crack model,for example the so-called fictitious crack model originally suggested by Hillerborg andco-workers (see Hillerborg et al. 1976), or a crack band model (see Bažant and Oh1983).
In the fictitious crack model, the main parameters are the tensile strength, the modulusof elasticity, the fracture energy GF, and the shape of the σ-w curve; see Figure 39. Asthe shape of the σ-w curve does not vary too much for plain concrete, it is for most

CHALMERS, Civil and Environmental Engineering 51
practical engineering applications usually sufficient to determine the fracture energy,GF, and the tensile strength and to select an appropriate σ-w relationship. The fractureenergy can be determined experimentally in: uni-axial tension tests, which yield thecomplete σ-w curve; three-point bending tests, e.g. according to RILEM TC-50 FMC(1985); or other fracture test methods, such as the wedge-splitting test method (seeRILEM TC 89-FMT, 1991). If no experimental results exist, values of the fractureenergy have been recommended in CEB-FIP Model Code 1990 (see CEB-FIP 1993).When the fracture energy and tensile strength have been determined, the σ-wrelationship can be approximated as: linear (see Hillerborg et al. 1976); bi-linear (seee.g. Petersson 1981, Gylltoft 1983, and CEB-FIP 1993); multi- or polylinear (see e.g.Nanakorn and Horii 1996 and Kitsutaka 1997); polynomial or exponential (see e.g.Reinhardt 1984, Cornelissen et al. 1986, and Stang 1992). For most practicalapplications it has been found that the bi-linear relationship is a sufficientapproximation (see e.g. Cotterell and Mai 1995).
Ec
fct
σ (ε)
ε
1
wc
w
( )ctf
wσ
( ) dwwGcw
F =0
σ
(b)(a)
Figure 39. Description of the tensile behaviour in the fictitious crack model: (a) astress–strain curve and (b) a stress-crack opening curve (where GF is thefracture energy and wc is the critical crack opening).
Fibre-reinforced concretes, with low and moderate volume fractions of fibres, can alsobe regarded as a strain-softening material. As already pointed out, the tensile strengthand modulus of elasticity are not significantly affected. Although, the fibres have aconsiderable impact on the tensile fracture behaviour, and the fracture energy and shapeof the σ-w curves vary considerably depending on type and amount of fibres used, thequality of the concrete, etc.; see e.g. Li et al. (1993). Furthermore, as pointed out byHillerborg (1980), the complete fracture energy is of no interest since the stress-freecrack opening, wc, occurs at very large crack openings for most FRCs, while for mostconcretes (without fibres) it is seldom larger than 0.3 mm. Consequently, with thefictitious crack model as a framework, to completely characterise the mechanicalbehaviour of fibre-reinforced concrete in tension it is necessary to determine the σ-wrelationship. As the shape of the σ-w curve will be more or less complex (see Figure38), it may be necessary to simplify the relationship in a similar manner as for plainconcrete. Exactly how the σ-w relationship should be approximated depends, amongother things, on its shape, the constitutive model used, and the type of analysis (i.e.whether it is for determining the structural behaviour in service state or ultimate limitstate); see Hillerborg (1980), Stang and Olesen (2000), and RILEM TC 162-TDF(2002a).

CHALMERS, Civil and Environmental Engineering52
3.5.3 Shear properties
The principal action responsible for transferring shear stresses across a crack in plainconcrete is often explained as aggregate interlock and friction at the crack faces. Forfibre-reinforced concrete, at low and moderate fibre dosages the cracking strength is notaffected but, as soon as the matrix cracks, the fibres are activated and start to be pulledout, resulting in a significant toughening behaviour (see Barragán 2002). Allos (1989)reported that the shear transfer capacity could be significantly increased, as much as upto 60% of the compressive strength. Barragán (2002) found that the maximum shearstrength increased with the fibre volume fraction (for high-strength concrete theincrease was significant, close to 100% with 40 kg/m3 steel fibres). For reinforcedconcrete it is known that the amount of reinforcement crossing the shear planeinfluences the shear friction and the shear capacity due to dowel effects and a similareffect is observed for FRC. Barragán (2002) evaluated the dowel action of fibres byevaluating the residual shear stresses at different slip limits and found that this increasedwith the fibre volume fraction.
3.6 Concluding remarks
In this chapter, properties of different fibre materials have been introduced and a shortintroduction to the orientation of fibres in concrete has been provided. As themicrostructure of concrete, and its development with time, play a significant role incontrolling the performance of a fibre-reinforced concrete, this has briefly beenoutlined. Subsequently, the pre- and post-cracking mechanisms of both plain and fibre-reinforced concrete have been described. For plain concrete, it was shown that there area number of complex mechanisms involved in the fracture process, and that the majortoughening mechanism is the aggregate bridging but that increased toughness also canbe achieved by e.g. air voids. For fibre-reinforced concrete, with a low volume fractionof fibres (Vf < 1.0%), it was shown that the fibres have a negligible effect on thestrength (both in tension and compression) and that the primary effect of fibres is theirability to improve the post-cracking behaviour and the toughness – i.e. the capacity oftransferring stresses after matrix cracking and the tensile strains at rupture. Furthermore,the mechanics of fibre pull-out (of individual fibres) was discussed, examples ofschematic pull-out curves were given, and the importance for the mechanical behaviourof a fibre-reinforced concrete was also shown. For the fibre pull-out, it was shown thatthis depends on the characteristics of the fibre and the matrix, the mechanical propertiesof the interface between fibre and matrix, and the angle of inclination of the fibre withrespect to the direction of loading. In the end, mechanical properties were discussed andsome examples were provided.

CHALMERS, Civil and Environmental Engineering 53
4 Fracture-mechanics-based material testing of FRC
4.1 Introduction
During the past four decades, different methods have been proposed and used tocharacterise the tensile behaviour of fibre-reinforced concrete (FRC): e.g. by measuringthe flexural strength, as in the early work of Romualdi and Mandel (1964), or bydetermining the behaviour in terms of dimensionless toughness indices (as prescribed inASTM C 1018) to determine residual flexural strengths at prescribed deflections; seeand RILEM TC 162-TDF (2002b). In addition, the splitting test (also known as theBrazilian test) has been used to determine the splitting tensile strength. The main test-set-ups used are:
uni-axial tension test or direct tensile test;flexural test; andpanel test or plate test.
Other test methods exist, e.g. the wedge-splitting test (WST) method, the compacttension test, etc., but the most common test approach appears to be the flexural test onbeam/prism. Beam/prism specimens are loaded in either three-point or four-pointbending and can be equipped with a notch. Flexural beam tests are used in a number ofnational standards/guidelines: see e.g. the draft European Standard prEN14845-1; ACI544; ASTM C 1018; JCI-SF4 (Japan); UNI U73041440 (Italy), in di Prisco et al.(2004b). Panel/plate tests are typically used for shotcrete and can be either squarepanels, e.g. the EFNARC panel test (see EFNARC, 1996), or round panels (ASTM1550-02). Panel/plate tests are typical application-specific tests where the loadingcondition of the test method simulates a design situation in a real structure. Fordetermining tensile fracture properties of concrete and fibre-reinforced concrete, thethree-point bending test on a notched beam is probably the most widespread method;see RILEM TC-50 FMC (1985) for plain concrete and RILEM TC 162-TDF (2002b)for steel fibre-reinforced concrete. For a review of different test methods, see RILEMReport 5 (1991), ACI 544 (1996), Stang et al. (2000), Bentur and Mindess (1990),Gopalaratnam et al. (1991), Balaguru and Shah (1992), Gopalaratnam and Gettu (1995),Banthia and Trottier (1995), Barr et al. (1996), Mindess et al. (1996), Taylor et al.(1997), van Mier (1997), Marti et al. (1999), Chanvillard (2000), Kooiman (2000),Lambrechts (2004).
The fracture behaviour of fibre-reinforced concrete can be described by the stress-crackopening (σ-w) relationship, as was shown in the previous chapter, but to obtain this it isnecessary to have appropriate test methods that can be used to determine thisfundamental relationship. But determining the σ-w relationship is an intricate problem,especially in a flexural test for which it may also be necessary to have a procedure forinterpreting the test results, for example by conducting inverse analysis (see Paper V).Generally when characterising/classifying fibre-reinforced cementitious composites,Stang (1992 & 2004) and Stand and Li (2004) suggested that a distinction should bemade between materials that, when loaded under uni-axial stress, show tensionsoftening (strain localisation) and those with a strain-hardening behaviour; see Figure40. For this purpose, the uni-axial tension test (UTT) appears to be the most

CHALMERS, Civil and Environmental Engineering54
straightforward and physically sound method of classification, as the σ-w relationshipcan be directly determined from the test results. However, the UTT requiressophisticated testing equipment and is quite time-consuming to carry out, and it hasbeen shown that the test result is affected by machine specimen interaction and it isdifficult to accurately determine the tensile strength; see e.g. Aarre (1992), van Mier(1997), Rossi (1997), Stang and Bendixen (1998), Chanvillard (2000), Østergaard(2003), and Barragán (2003). As a substitute for the UTT, flexural tests are frequentlyused in standards. In a flexural test the response can be either deflection hardening ordeflection softening; see Figure 40. But to complicate matters, a material showing atension-softening behaviour when loaded under uni-axial stress can show eitherdeflection hardening or softening behaviour, as is seen in Figure 40. The response,deflection hardening or softening, depends on the fracture properties (the toughness) ofthe material as well as the dimensions of the specimen. For example, a thin beam mayshow a deflection hardening behaviour but, as the beam height is increased, theresponse eventually may change to deflection softening. It is also a well-known fact thatfor fibre-reinforced concrete the fibre distribution and orientation are influenced by thespecimen geometry, and it may also be affected during the casting procedure. Aconsequence of this is that care should be taken when specifying a test set-up and inparticular when interpreting the test result.
Tension softening
Strain hardening
Deflection softening
Deflection hardening
Str
ess
Str
ess
Strain / Deformation
Strain / Deformation
Deflection
Deflection
Load
Load
Localization
Localization
Multiplecracking
Multiplecracking
Single crackMatrix cracking
Singlecrack
FRC
Concrete
HPFRC
FRC
Concrete
FRC &HPFRC
Matrixcracking
Matrixcracking
Uni-axial response
Flexural response
Figure 40. Characterisation of the tensile and flexural behaviour.
4.2 Approach for determining the σσσσ-w relationship
To determine the σ-w relationship for FRC, an approach which overcomes some of theproblems mentioned in Section 4.1 has been developed and used in this study. Theapproach has three steps: (1) the material testing, e.g. the WST or the 3PBT; (2) inverseanalysis (using non-linear fracture mechanics) where the σ-w relationship is determined;and (3) adjustment of the σ-w relationship for any differences in fibre efficiency (the

CHALMERS, Civil and Environmental Engineering 55
number of fibres) between the material test specimen and random 3-D orientation or themember where the material is to be used. The same approach, but without the inverseanalysis step, may be utilised for the uni-axial tension test. The approach isschematically presented in Figure 41.
Figure 41. Approach for material testing to determine the σ-w relationship for fibre-reinforced concrete.
4.2.1 Material testing
The first step in the approach is the material test, which, for the framework used in thisthesis, should be based on fracture mechanics. The general requirements that can bespecified for the test method are that:
it must provide results which readily can be interpreted as constitutive materialparameters (the σ-w relationship);
it should, preferably, provide a relationship between load and crack opening (orCMOD) which can be used for inverse analysis;
the specimen should be designed such that a single, well-defined crack isformed, which generally means that the specimen has to be equipped with anotch of sufficient dimensions;
it should give representative values;
it should, if possible, not require too advanced testing equipment or demand ahigh machine stiffness;
it should be easy to handle and execute; and
the specimen size should be as small as possible but still be representative.
Examples of three test methods that can be used (the 3PBT, the WST, and the UTT) willbe given later in this chapter, and in the end they will be compared on the basis of theabove-listed requirements – see also Papers III to V.

CHALMERS, Civil and Environmental Engineering56
4.2.2 Inverse analysis
The second step in the approach is the determination of the σ-w relationship by inverseanalysis. Inverse analysis – also referred to as parameter or function estimation – isachieved by minimising the differences between calculated displacements and targetdisplacements (e.g. CMOD) obtained from test results (see Figure 42). In this manner,inverse analysis can be used to determine a σ-w relationship from test results ofmethods like the 3PBT and the WST.
experimental results
model prediction:yi = f (xi, α1,...,αn)
y
x
∆yi
xi
Error: ( ) ( )21,..., in yE ∆=αα
Figure 42. Principle of inverse analysis.
For regular concrete (i.e. without fibres), extensive research has been carried out todetermine the best approach for inverse analysis, and different strategies have beenproposed. Of the available approaches, some define the shape of the σ-w relationship asbi-linear according to Figure 43(a); see e.g. Roelfstra and Wittmann (1986), Planas etal. (1999), Østergaard (2003), Bolzon et al. (2002), and Que and Tin-Loi (2002).Alternatively, an exponential softening function according to Figure 43(b) is used; seee.g. Villmann et al. 2004. In others, a polylinear (or multilinear) σ-w relationship isused, see Figure 43(c), in conjunction with a stepwise analysis; see e.g. Kitsutaka(1997) and Nanakorn and Horii (1996b).
The inverse analysis approach has also been used for FRC; see e.g. Rokugo et al.(1989), Uchida et al. (1995), Kooiman (2000), Meda et al. (2001), and Sousa et al.(2002). A more comprehensive review of different approaches is provided in Paper V.However, there are some problems associated with conducting inverse analysis on FRC,such as: (1) the shape of the σ-w relationship is not as well defined as for regularconcrete, but varies depending on the mix constituents; (2) with increasing fibrevolumes, it becomes difficult to distinguish between the effect of the tensile strengthand the first slope of the σ-w relationship; (3) the inverse problem is often ill-posed, i.e.there exists no unique solution; (4) a large number of parameters may be required fordescribing the σ-w relationship; and (5) the response is influenced by the position of thefibres (see Figure 44), which may be reflected on the determined σ-w relationship as itis usually assumed that the properties are uniform over the section.

CHALMERS, Civil and Environmental Engineering 57
b2
w1 wc
a2
1
( )ctf
wσ
(a)
w
a1
wc
w
( )ctf
wσ
(b)
1
1
a1
1
( )ctf
wσ
ana2
w
w1 w2 wn wc
b2
(c)
11
1
Figure 43. Different σ-w relationships: (a) bi-linear; (b) exponential; and (c)polylinear (or multilinear).
Assuming uniform properties may well be justified for concrete without fibres, whilefor FRC it is quite likely that there will be variations due to non-uniform fibredistribution. These variations may not influence the tensile strength much, but a fibrebundle situated close to the notch (see Figure 44) may have a significant effect on thebehaviour and influence the determination of the σ-w relationship. In a uni-axial tensiontest, the position of a single fibre is not as important as for the 3PBT and the WST,where a flexural loading condition arises. In Figure 44 different positions of a fibre areshown; a fibre positioned directly at the notch (or at the beam surface if there is nonotch) will contribute significantly more to the bending resistance and it will also slowdown the crack propagation. In Figure 44(c) the situation which occurs in an un-notchedspecimen is shown; here fibres will have 2-D orientation at the bottom of the specimen,as they will be aligned with the edges, and a region with 2-D orientation will extend to adepth equal to half fibre length. Another problem which has been observed for beamswithout a notch, Figure 44(c), is that the orientation of the fibres at the bottom of thebeam may have a favourable effect on the flexural resistance; see e.g. Schumacher et al.(2003).
(a) (b)
df1 df1
Ff1
Ff1
(c)
df1
Ff1
Region with 2-Dfibre orientation
MMM
Notched beam:first fibre at thenotch tip
Notched beam:first fibre at a distancefrom notch tip
Un-notched beam:2-D fibre orientation atthe bottom of the beam
Figure 44. Different positions of a fibre: (a) notched specimen with a fibre just abovethe notch; (b) notched specimen with a fibre at a distance from the notch;and (c) the situation in an un-notched specimen.
In this study, inverse analyses were conducted on the averaged load–CMOD curves (theaverage of all tested specimens from one mix). The benefits of this are that effects ofany variations in fibre distribution and orientation between specimens are averaged outand a representative curve is provided, and that only one analysis is required fordetermination of the σ-w relationship. A drawback with this approach, which has been

CHALMERS, Civil and Environmental Engineering58
observed, is that when the load–CMOD curve is averaged the peak is somewhatflattened out or smoothed (see e.g. Villmann et al. 2004). A consequence is that theinitial part of the σ-w relationship is affected; this, on the other hand, affects plainconcrete or fibre-reinforced concrete with a low volume fraction of fibres, whichexhibits a more brittle behaviour.
When performing an inverse analysis on FRC the following general recommendationscan be provided:
(1) Preferably the tensile strength should be determined in an independent testor be based on previous experience. If a splitting test is conducted, it shouldnot be performed on the FRC but rather on a reference mix without fibres,but care should be taken so that this mix is representative (e.g. porosity) –see Olesen et al. (2003).
(2) It is important that the first descending slope of the σ-w relationship isestimated realistically – the slope should be sufficiently steep – and anadequate number of points should be used to describe the subsequent partsof the σ-w relationship.
(3) If possible, try in advance to get some information or understanding aboutthe behaviour of the fibres (the fibre pull-out) that are used and how theymay influence the shape of the σ-w relationship.
(4) The fitting interval should be chosen carefully. For example, when using abi-linear relationship it may not be possible to get a good fit over the entireexperimental curve (especially if the test is continued to a very large CMODor deflection). A choice should be made regarding which part of the σ-wrelationship is most important, i.e. small (< 0.5 mm) or large (> 1.0 mm)crack openings; see also Sousa and Gettu (2004).
If the tensile strength is to be predicted correctly, the initial slope is important; i.e. a lesssteep slope has to be compensated by a lower tensile strength in order to fit the test data.But it should be pointed out that the initial slope should be steep, and this can be basedon the following observations: (1) the initial part of the σ-w relationship is quite steepfor plain concrete (see Stang 1992 and Cornelissen et al. 1986); and (2) the contributionfrom fibre bridging comes gradually and it is not until crack openings of at least 0.05mm that it has any major influence (see Li et al. 1993). Moreover, uni-axial tension testson fibre-reinforced concrete have shown that the σ-w relationship starts with an initialsteep descending slope (see Figure 45 or e.g. Li et al. 1993 and Barragán 2002).
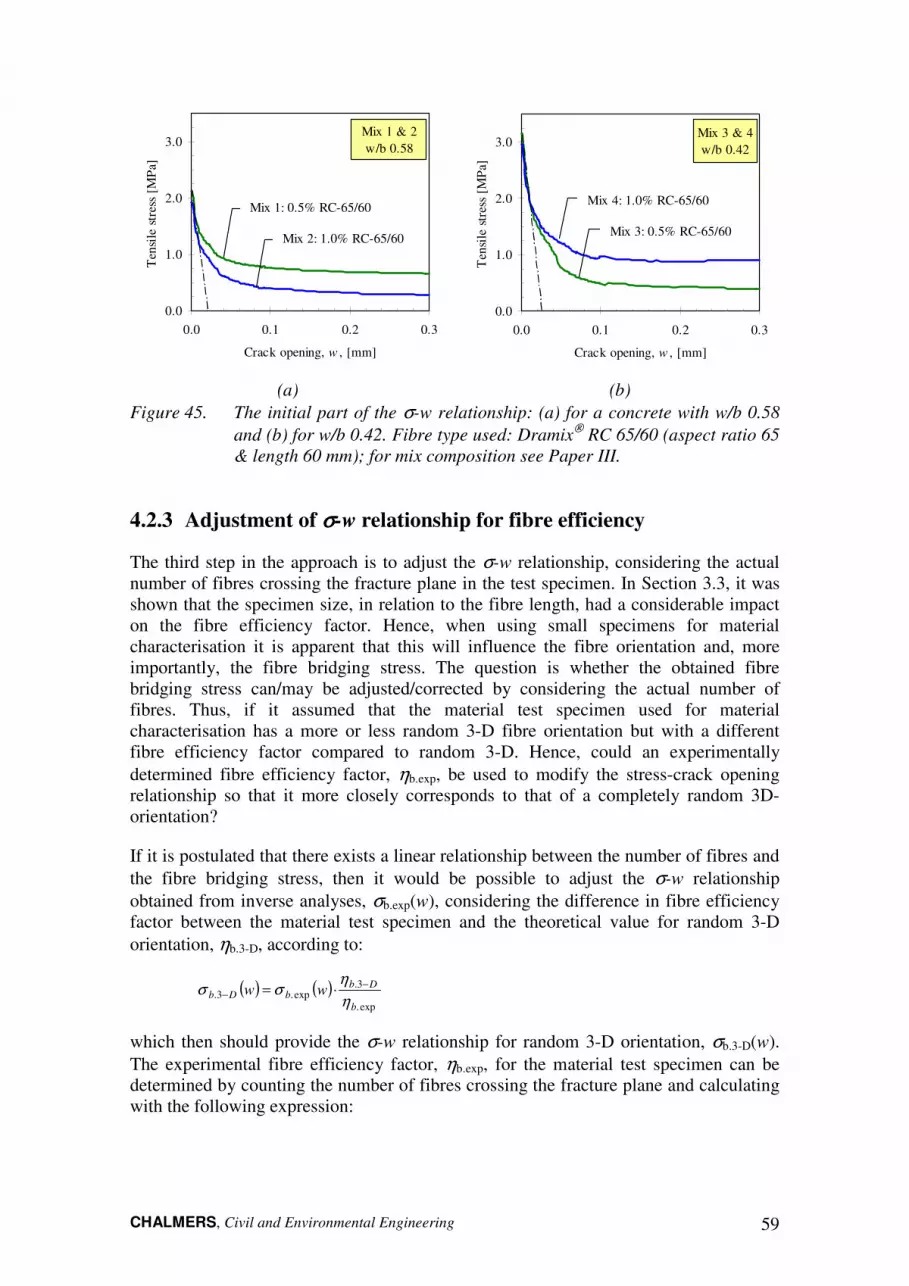
CHALMERS, Civil and Environmental Engineering 59
0.0
1.0
2.0
3.0
0.0 0.1 0.2 0.3
Crack opening, w , [mm]
Ten
sile
stre
ss[M
Pa]
Mix 1 & 2w/b 0.58
Mix 1: 0.5% RC-65/60
Mix 2: 1.0% RC-65/60
0.0
1.0
2.0
3.0
0.0 0.1 0.2 0.3
Crack opening, w , [mm]
Ten
sile
stre
ss[M
Pa]
Mix 3 & 4w/b 0.42
Mix 4: 1.0% RC-65/60
Mix 3: 0.5% RC-65/60
(a) (b)Figure 45. The initial part of the σ-w relationship: (a) for a concrete with w/b 0.58
and (b) for w/b 0.42. Fibre type used: Dramix® RC 65/60 (aspect ratio 65& length 60 mm); for mix composition see Paper III.
4.2.3 Adjustment of σσσσ-w relationship for fibre efficiency
The third step in the approach is to adjust the σ-w relationship, considering the actualnumber of fibres crossing the fracture plane in the test specimen. In Section 3.3, it wasshown that the specimen size, in relation to the fibre length, had a considerable impacton the fibre efficiency factor. Hence, when using small specimens for materialcharacterisation it is apparent that this will influence the fibre orientation and, moreimportantly, the fibre bridging stress. The question is whether the obtained fibrebridging stress can/may be adjusted/corrected by considering the actual number offibres. Thus, if it assumed that the material test specimen used for materialcharacterisation has a more or less random 3-D fibre orientation but with a differentfibre efficiency factor compared to random 3-D. Hence, could an experimentallydetermined fibre efficiency factor, ηb.exp, be used to modify the stress-crack openingrelationship so that it more closely corresponds to that of a completely random 3D-orientation?
If it is postulated that there exists a linear relationship between the number of fibres andthe fibre bridging stress, then it would be possible to adjust the σ-w relationshipobtained from inverse analyses, σb.exp(w), considering the difference in fibre efficiencyfactor between the material test specimen and the theoretical value for random 3-Dorientation, ηb.3-D, according to:
( ) ( )exp.
3.exp.3.
b
DbbDb ww
ηη
σσ −− ⋅=
which then should provide the σ-w relationship for random 3-D orientation, σb.3-D(w).The experimental fibre efficiency factor, ηb.exp, for the material test specimen can bedetermined by counting the number of fibres crossing the fracture plane and calculatingwith the following expression:

CHALMERS, Civil and Environmental Engineering60
ff
fb AV
N exp.exp. =η
where Nf.exp is the number of fibres per unit area, Vf is the fibre volumefraction, and Af is the cross-sectional area of a fibre.
But as pointed out in Chapter 3.4.3, it has been observed that neighbouring fibres mayinfluence each other by damaging the matrix. On the other hand, if the difference infibre efficiency is not too large, it may be an acceptable approximation to assume alinear relationship.
The proposed hypothesis can be supported by the following observations: (1) in mosttheoretical models for fibre-reinforced composites, it is assumed that the tensilebehaviour may be obtained by a simple summation of the individual components; and(2) experimental results, using different test methods (UTT, 3PBT, and WST), indicatean almost linear relationship between the number of fibres and the tensile stress atdifferent crack openings.
Regarding the first observation, examples of such theoretical models for fibre-reinforced composites can be found in e.g. Li et al. (1993), Kullaa (1994), Li and Stang(2001) and Voo & Foster (2003). In these models, it is assumed that the effects of eachindividual fibre (considering all possible embedment lengths and orientations) can besummed over the failure surface to yield the overall behaviour. It is also often assumed(but not necessarily) that the geometric centres of the fibres are uniformly distributed inspace and all fibres have an equal probability of being oriented in any direction. Forexample, in the model presented by Li and Stang (2001), see Figure 46, the total fibrebridging σfb(w) is a summation of the forces induced by each bridging fibre – everysingle fibre with random distribution and orientation – across the matrix crack per unitarea. The following expression gives the fibre bridging stress:
( ) ( ) ( )( )
( ) ( ) φφφδσφ
φ
φ
ddzzppgVLPA
Vw
fL
z
fef
ffb
=
=1
0
cos2
0
,...,;
where φ is the orientation angle of the fibre, φ0 and φ1 are the integration limits,z is the centroidal distance to the fibre, g(φ) is a function consideringinclination angle effects (e.g. snubbing), and probability density functions forthe fibre orientation are p(z) and p(φ).
The complete bridging relation σb(w) is determined by adding up the individualcontributions of the aggregate bridging σab(w), the fibre bridging σfb(w), and theprestressing effect σps(w). This gives the following expression:
( ) ( ) ( ) ( )wwww psfbabb σσσσ ++=

CHALMERS, Civil and Environmental Engineering 61
Fibre
Matrix Matrix
Le P
δ
P(Le, δ )⏐φ=0 P(Le, φ, δ )
w
σfb
P(φ)
z
p(z)
p(φ)
φ
φ
φ feP
P=
=0
( ) ( )( )
( ) ( ) φφδφσφ
φ
φ
ddzzppLPA
Vw
fL
z
ef
ffb ⋅=
=
1
0
cos2
0
,,
φ
matrixcrack plane
Figure 46. Micromechanical model for fibre bridging: modular construction of theσfb-w relationship, based on Li and Stang (2001).
Results from experiments presented in the literature also seem to confirm a linearrelationship between fibre content and the tensile stress at different crack openings. Thiscan be seen in for example Li et al. (1993), Barragán et al. (2003), Barragán (2003),Gettu and Barragán (2003), Barros and Antunes (2003), and Dupont (2003).
To investigate the hypothesis, a small experimental study was carried out using theWST method (which is described later in this chapter). For the experiments, a self-compacting concrete, with a w/b ratio of 0.55, was used and the volume fraction offibres was varied between 0 and 1.0%, using end-hooked fibres of the type Dramix®
RC-65/35 (fibre aspect ratio 65 and length 35 mm). For each mix, three WST specimens(dimensions 150×150×150 mm3) were tested after water curing. Figure 47(a) shows therelationship between the volume fraction and the number of fibres per cm2 while Figure47(b) shows the experimental fibre efficiency factor, ηb.exp. This factor was determinedby counting the number of fibres crossing the fracture plane. As can be seen in Figure47, in all the mixes the number of fibres exceeds the theoretical value for random 3-Dorientation, and for the mix with Vf = 1.0% it even exceeds the theoretical value forrandom 2-D orientation.
y = 2.5396x
R2
= 0.9651
y = 2.1045x
0.0
1.0
2.0
3.0
0.00 0.25 0.50 0.75 1.00 1.25
V f [%]
Theoretical
From WST-specimens
Num
ber
offi
bres
per
cm2
[no.
/cm
2 ]
0.58
0.53 0.54 0.55
0.59
0.66
0.3
0.4
0.5
0.6
0.7
0.25 0.38 0.50 0.63 0.75 1.00
V f [%]
η b.2D= 0.64
η b.3D= 0.5
Exp
erim
enta
lfib
reef
fici
ency
fact
or[-
]
(a) (b)Figure 47. (a) Relationship between the actual number of fibres per cm2 in the
specimens and the fibre volume fraction Vf. (b) The experimental fibreefficiency factor for the different mixes.

CHALMERS, Civil and Environmental Engineering62
The results from the wedge-splitting tests are presented in Figure 48, which shows thesplitting load versus CMOD curve (a) and the dissipated energy (b). As can be seen,when the volume fraction of fibres increases there is a significant increase in both thesplitting load and the dissipated energy, also presented in Figure 49(a). In Figure 49(b)the dissipated energy at different CMODs has been plotted against the actual number offibres and, as can be seen, there appears to be a fairly linear relationship between thedissipated energy and the number of fibres.
0
2 000
4 000
6 000
8 000
0.0 2.0 4.0 6.0
CMOD [mm]
1.0%
0.25%
0.375
0.75%
0.625
0.50%
0%
Spl
ittin
gL
oad
[N]
0
1 000
2 000
3 000
4 000
5 000
0.0 2.0 4.0 6.0
CMOD [mm]D
issi
pate
dE
nerg
y,G
f,[N
m/m
2 ]
0%
1.0%
0.75%
0.25%
(a) (b)Figure 48. Effect of fibre volume fraction (0% ≤ Vf ≤ 1.0%): (a) on the splitting
load–CMOD curve, and (b) on the dissipated energy.
0
1 000
2 000
3 000
4 000
5 000
0.00 0.25 0.50 0.75 1.00 1.25
V f [%]
Dis
sipa
ted
Ene
rgy,
Gf,
[Nm
/m2 ]
6.0mm
5.0mm
4.0mm
3.0mm
2.0mm
CMOD =
1.0mm
0
1 000
2 000
3 000
4 000
5 000
0.0 1.0 2.0 3.0
Number of fibres per cm2 [no./cm2]
Dis
sipa
ted
Ene
rgy,
Gf,
[Nm
/m2 ]
4.0mm; R2=0.99
2.0mm; R2=0.99
1.0mm; R2=1.00
CMOD = ; R2=
6.0mm; R2=0.98
(a) (b)Figure 49. (a) Effect of fibre volume fraction (0.25% ≤ Vf ≤ 1.0%) on the dissipated
energy at different CMODs. (b) Dissipated energy at different CMODsplotted against the actual number of fibres per cm2.
To investigate the effect on the σ-w relationship, inverse analyses were conducted and abi-linear σ-w relationship (see Figure 43) was determined through use of a Matlab®
program, developed at DTU by Østergaard (2003) – see Paper V. The results of theinverse analyses are presented in Figure 50 and Figure 51. Figure 50(a) shows therelation between the number of fibres and the b2 parameter in the bi-linear relationship(see Figure 43), which has a R2 value of 0.988. In Figure 50(b) the tensile stress atdifferent crack openings has been plotted against the number of fibres, which alsoindicates a linear relationship. Finally, Figure 51 shows the adjusted σ-w relationshipsand it can be seen that the agreement is fairly good for most of the investigated mixes,with the exception of the mix with Vf = 0.5%. Hence, the results of this investigationseem to confirm that it may be acceptable to assume a linear relationship between the

CHALMERS, Civil and Environmental Engineering 63
number of fibres and the σ-w relationship, particularly for small crack openings(< 1mm), and that the σ-w relationships can be adjusted accordingly. However, it shouldbe noted that the experiments were carried out using only three specimens, for whichthe coefficient of variance was between 5 and 20%, and only one type of concrete andfibre type was used.
y = 0.278x + 0.257
R2 = 0.988
0.0
0.2
0.4
0.6
0.8
1.0
0.0 0.5 1.0 1.5 2.0 2.5 3.0
Number of fibres per cm2 [no. / cm2]
b2
[-]
R2
= 0.998
R2
= 0.996
R2
= 0.9690.0
1.0
2.0
3.0
4.0
0.0 0.5 1.0 1.5 2.0 2.5 3.0
Number of fibres per cm2 [no. / cm2]T
ensi
lest
ress
[MP
a]
w = 2.0mm
w = 1.0mm
w = 0.5mm
(a) (b)Figure 50. Effect of the number of fibres on the σ-w relationship: (a) on the b2
parameter in the bi-linear stress-crack opening relationship and (b) onthe tensile stress at different crack openings.
0.0
1.0
2.0
3.0
4.0
0.0 0.5 1.0 1.5 2.0
Crack opening [mm]
Ten
sile
Str
ess
[MP
a]
w/b 0.55RC-65/35
0.625%
0.25% 0.375% 0.50%
0.75%
1.0%
Figure 51. Effect of fibre volume fraction (0% ≤ Vf ≤ 1.0%) on the σ-w relationship.
4.3 Investigation of fracture test methods
Recently RILEM technical committee 162-TDF, “Test and design methods for steelfibre-reinforced concrete”, published recommendations for two test methods for steelfibre-reinforced concrete (SFRC); see RILEM TC 162-TDF (2001) and (2002b). Theproposed test methods are a uni-axial tension test (UTT) and a three-point bending test(3PBT) on notched beams. In Papers III and V these test methods were investigated andcompared with an alternative test method called the wedge-splitting test (WST) method,for which two different specimen sizes have been investigated. Furthermore, in PaperIV the WST method was investigated in a Round Robin study. Inverse analyses havebeen used to obtain σ-w relationships for the 3PBT and the WST. For the comparison ofthe three test methods, five different concrete mixes were used in this investigation. Thevaried parameters were (see Table 10): the volume fraction of fibres, Vf; the water
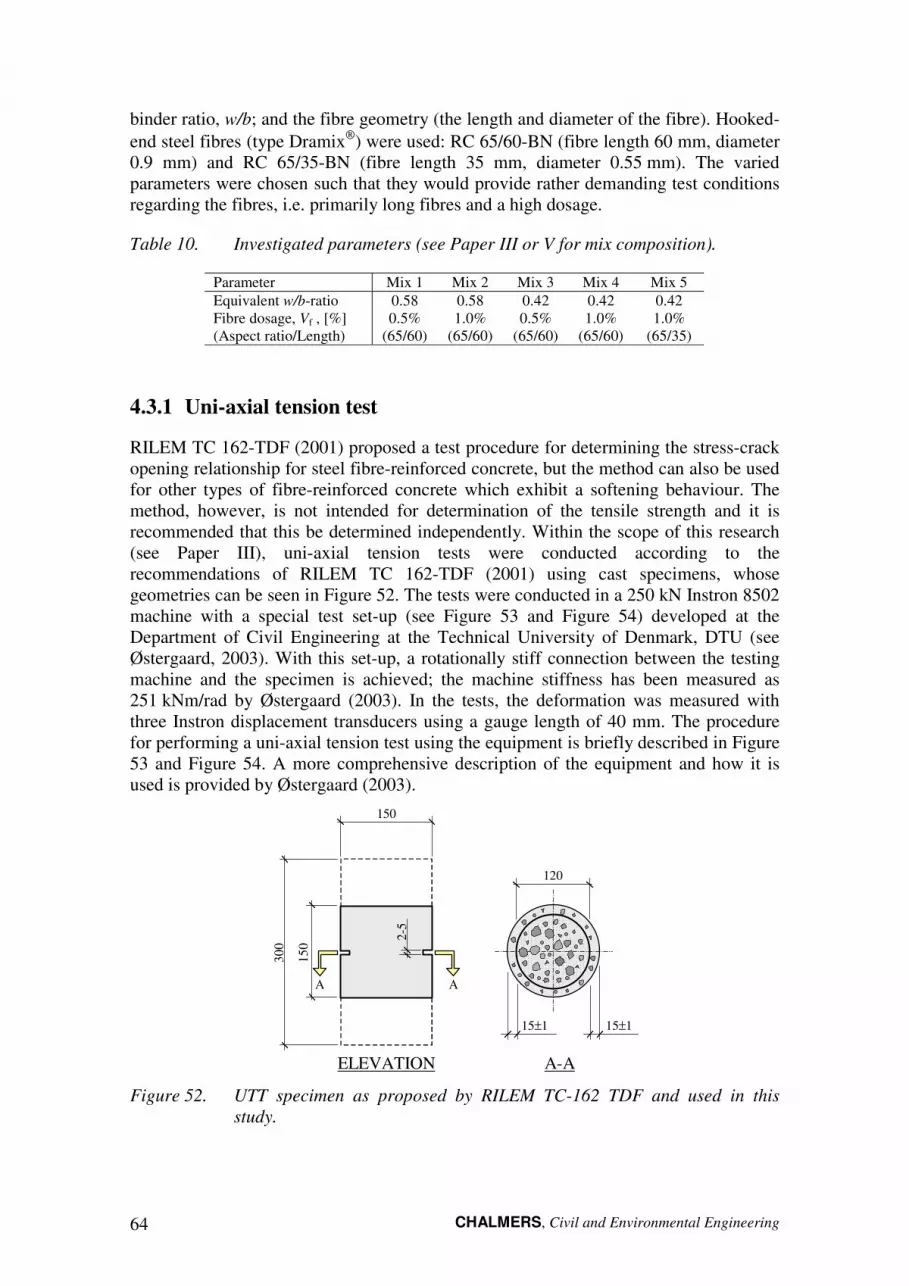
CHALMERS, Civil and Environmental Engineering64
binder ratio, w/b; and the fibre geometry (the length and diameter of the fibre). Hooked-end steel fibres (type Dramix®) were used: RC 65/60-BN (fibre length 60 mm, diameter0.9 mm) and RC 65/35-BN (fibre length 35 mm, diameter 0.55 mm). The variedparameters were chosen such that they would provide rather demanding test conditionsregarding the fibres, i.e. primarily long fibres and a high dosage.
Table 10. Investigated parameters (see Paper III or V for mix composition).
Parameter Mix 1 Mix 2 Mix 3 Mix 4 Mix 5Equivalent w/b-ratio 0.58 0.58 0.42 0.42 0.42Fibre dosage, Vf , [%](Aspect ratio/Length)
0.5%(65/60)
1.0%(65/60)
0.5%(65/60)
1.0%(65/60)
1.0%(65/35)
4.3.1 Uni-axial tension test
RILEM TC 162-TDF (2001) proposed a test procedure for determining the stress-crackopening relationship for steel fibre-reinforced concrete, but the method can also be usedfor other types of fibre-reinforced concrete which exhibit a softening behaviour. Themethod, however, is not intended for determination of the tensile strength and it isrecommended that this be determined independently. Within the scope of this research(see Paper III), uni-axial tension tests were conducted according to therecommendations of RILEM TC 162-TDF (2001) using cast specimens, whosegeometries can be seen in Figure 52. The tests were conducted in a 250 kN Instron 8502machine with a special test set-up (see Figure 53 and Figure 54) developed at theDepartment of Civil Engineering at the Technical University of Denmark, DTU (seeØstergaard, 2003). With this set-up, a rotationally stiff connection between the testingmachine and the specimen is achieved; the machine stiffness has been measured as251 kNm/rad by Østergaard (2003). In the tests, the deformation was measured withthree Instron displacement transducers using a gauge length of 40 mm. The procedurefor performing a uni-axial tension test using the equipment is briefly described in Figure53 and Figure 54. A more comprehensive description of the equipment and how it isused is provided by Østergaard (2003).
150
150
300
2-5
15±1
ELEVATION A-A
AA
120
15±1
Figure 52. UTT specimen as proposed by RILEM TC-162 TDF and used in thisstudy.

CHALMERS, Civil and Environmental Engineering 65
Figure 53. Equipment for the UTT: (a) steel wedges to ensure a connection with ahigh rotational stiffness; (b) end-plates, which are glued to the specimen;(c) end-plates that are connected to the other end-plate (b) with screws;(d) steel rod which is connected to the end-plate (c) and gripped by themachine; (e) turnbuckles, which can be connected to the steel wedges (a)and used to prestress the connection while the wedges are displaced; (f) ameasuring rig attached to the specimen, with positions for threedisplacement transducers.
(a) (b) (c)
Figure 54. Setting up a UTT experiment (DTU equipment): (a) one end-plate is gluedonto the specimen outside the test machine; (b) to ensure a highrotational stiffness, prestressing is achieved by four turnbuckles, whichare screwed into the wedges; (c) the turnbuckles are removed, the lastend-plate is glued with the specimen in the machine, and finally thedisplacement transducers are attached.

CHALMERS, Civil and Environmental Engineering66
Typical results from the uni-axial tension tests are presented in Figure 55 and Figure 56,which show both the stress–deformation response and the stress-crack openingrelationship. As can be seen, in the pre-peak region the response is linear up to a stresslevel of about 70% of the peak-stress where the curve deviates and a non-linearbehaviour can be observed. The results of these experiments suggest that the magnitudeof the deformation in this pre-peak non-linear zone is quite small, somewhere between 2and 5 µm. After the peak-stress a softening response is observed, but the fibre-reinforced concretes are capable of transferring stresses for large crack openings; seee.g. Mix 4 in Figure 56(b).
0.0
1.0
2.0
3.0
0 0.01 0.02 0.03
Deformation [mm]
Ten
sile
stre
ss[M
Pa]
Mix1: w/b 0.58Mix3: w/b 0.420.5% RC-65/60
Mix 1
Mix 3
0.0
1.0
2.0
3.0
0.0 0.5 1.0 1.5 2.0
Crack opening, w , [mm]
Ten
sile
stre
ss[M
Pa]
Mix 3
Mix 1
(a) (b)Figure 55. Typical results from the UTT experiments (see Paper III): (a) stress–
deformation response in the pre- and immediate post-peak behaviour(result from one specimen); (b) stress-crack opening relationship.
0
1
2
3
0.00 0.01 0.02 0.03
Deformation [mm]
Ten
sile
stre
ss[M
Pa]
Mix2: w/b 0.58& Mix4: w/b 0.42
1.0% RC-65/60Mix5: w/b 0.421.0% RC-65/35
Mix 2
Mix 5
Mix 4
0.0
1.0
2.0
3.0
0.0 0.5 1.0 1.5 2.0
Crack opening, w , [mm]
Ten
sile
stre
ss[M
Pa]
Mix 2
Mix 5
Mix 4
(a) (b)Figure 56. Typical results from the UTT experiments (see Paper III): (a) stress–
deformation response in the pre- and immediate post-peak behaviour(result from one specimen); (b) stress-crack opening relationship.

CHALMERS, Civil and Environmental Engineering 67
4.3.2 Three-point bending test on notched beams
A three-point bending test on notched beams was suggested by RILEM TC 162-TDF(2002b); the intended use is for evaluation of the tensile behaviour of steel-fibrereinforced concrete. The test method can be used for determination of:
the limit of proportionality (LOP);
equivalent flexural tensile strengths; and
residual flexural tensile strengths.
The result from the test method can be used together with the design method based on astress–strain approach which has been proposed by RILEM TC 162-TDF (2000).Material properties are determined from the test result and a stress–strain diagram canbe defined. The specimen geometry and the loading conditions can be seen in Figure 57.The suggested standard test specimen is not intended for concrete with steel fibreslonger than 60 mm and/or aggregates larger than 32 mm. The beams are cast in mouldsand after curing the beams are notched using wet sawing.
550
250 25
150
75
25 h=
150
b = 150
F
δ
h sp
=12
5
notch
25
A–A
A25025
A
75
Figure 57. Test set-up for the three-point bending test on notched beams accordingto RILEM TC 162-TDF.
Within the scope of this research, three-point bending tests were conducted according tothe recommendations of RILEM TC 162-TDF (2002b) having a geometry according toFigure 57. The specimens were tested in an Instron 6025 universal testing machine, seeFigure 58, with a capacity of 100 kN. The crack mouth opening displacement, CMOD,was measured at a distance of 8 mm from the bottom of the beam with an Instron clipgauge, having a 10 mm gauge length and a maximum travel of 5 mm. The net load-point deflection was measured by two LVDTs. The tests were performed under CMODcontrol. For each mix, five specimens were tested.

CHALMERS, Civil and Environmental Engineering68
Figure 58. Photo of the test set-up used in the experiments.
4.3.3 Wedge-splitting test method
The wedge splitting test (WST) method, originally proposed by Linsbauer and Tschegg(1986) and later developed by Brühwiler and Wittmann (1990), has also been used forfracture testing. The method is interesting since it does not require sophisticated testequipment; the test is stable and mechanical testing machines with a constant crossheaddisplacement can be used. Furthermore, a standard cube specimen is used, but the testcan also be performed on core-drilled samples. Researchers have used the WST methodextensively, and recently there has been increased interest in it. The method has provedto be successful for the determination of fracture properties of ordinary concrete, atearly age and later (see Østergaard, 2003, Abdalla and Karihaloo, 2003, and Karihalooet al. 2004), and for autoclaved aerated concrete (Trunk et al., 1999). In addition, themethod has been used for the study of fatigue crack growth in high-strength concrete(Kim and Kim, 1999), for determining fracture behaviour of polypropylene fibre-reinforced concrete (Elser et al., 1996), and for determination of stress-crack openingrelationships of interfaces between precast and in-situ concrete (see e.g. Lundgren et al.2005) and between steel and concrete (see e.g. Walter et al., 2005). For steel fibre-reinforced concrete, a small number of references can be found; Meda et al. (2001) usedthe WST method to determine a bi-linear stress-crack opening relationship throughinverse analysis. Nemegeer et al. (2003) used the WST method to investigate thecorrosion resistance of cracked fibre-reinforced concrete.
In Figure 59 the specimen geometry and loading procedure are clarified. The specimenis equipped with a groove (to be able to apply the splitting load) and a starter notch (toensure the crack propagation). Two steel platens with roller bearings are placed partlyon top of the specimen, partly into the groove, and through a wedging device thesplitting force, Fsp, is applied. During a test, the load in the vertical direction, Fv, and thecrack mouth opening displacement (CMOD) are monitored. The applied horizontalsplitting force, Fsp, is related to the vertical compressive load, Fv, through (see RILEMReport 5):
( )( )( )αµαµ
α cot1
tan1
tan2 ⋅+⋅−
⋅⋅
= vsp
FF

CHALMERS, Civil and Environmental Engineering 69
where α is the wedge angle (here α = 15°), and µ is the coefficient of friction for theroller bearing. The coefficient of friction normally varies between 0.1% and 0.5%. If thefriction is neglected in the splitting force, Fsp, is about 1.866×Fv, and the errorintroduced by this approximation is about 0.4% to 1.9%; see RILEM Report 5.
load cell
steel loadingdevice withroller bearings wedging
device
linear support
Clipgauge
cube specimenactuator
starter notch(cut-in)
groove (cast)
(a) (b)Figure 59. (a) Schematic view of the equipment and test set-up and (b) photo of test
set-up.
Standardised test procedures are available or general approaches have been proposed forsome types of cementitious composites: for plain concrete, see RILEM Report 5, dePlace Hansen et al. (1998), and Østergaard (2003); and for Autoclaved AeratedConcrete (AAC), see RILEM Recommendation AAC13.1. For steel fibre-reinforcedconcrete, on the other hand, only a small number of references can be found and, to theknowledge of the author, there exist no proper recommendations regarding testing steelfibre-reinforced concrete by the WST method, which specimen size that should be used,or how the test result should be interpreted. Moreover, in an experimental studyconducted by Löfgren (2004) it was found that there may be problems with horizontalcracks; see Figure 60.
(a) (b)Figure 60. Pictures showing cracks in WST specimens: (a) with only a vertical crack
and (b) with horizontal cracks.

CHALMERS, Civil and Environmental Engineering70
As part of the work presented in this thesis, recommendations were provided for usingthe WST for fibre-reinforced concrete, and these can be found in Papers III to V (seealso Löfgren 2004 and Löfgren et al. 2004). For the WST method, two differentspecimen sizes (see Figure 61) and different fibre lengths (from 30 to 60 mm) have beeninvestigated.
Figure 61. Dimensions of the investigated WST specimen sizes.
The results of the conducted studies indicate that the two investigated WST specimensizes are quite comparable for the investigated fibre lengths, i.e. regarding fibreefficiency factor, the scatter in the test results, and the determined σ-w relationships.Moreover, to evaluate the reproducibility of the WST method and to provide guidelines,a round robin study was conducted – financed by NORDTEST – in which threelaboratories participated; see Paper IV and Löfgren et al. (2004). The test results fromeach laboratory were analysed and a study of the variation was performed. From thestudy of the intra-lab variations, it is evident that the variations of the steel fibre-reinforced concrete properties are significant (coefficient of variance between 20 and40%). However, an investigation of the inter-lab variation, based on an analysis ofvariance (ANOVA), indicated no significant variation.
In Paper V it was pointed out that care should be taken when choosing a specimen size.A common recommendation is that the outer dimensions of the specimen shouldpreferably be at least three times the fibre length to reduce the wall effects (seeSoroushian and Lee, 1990, and Kooiman, 2000). Moreover, it is beneficial to have alarger fracture surface since this reduces the scatter, as was found in an investigation byLöfgren, 2004, and also by Kooiman, 2000. On this basis it is suggested that: (1) theouter dimension of the specimen should be at least 3 times the fibre length and/or 5times the maximum aggregate size; and (2) the length of the ligament should be at least1.5 times the fibre length and/or 5 times the maximum aggregate size. Furthermore,when testing fibre-reinforced concrete it is recommended to use a guide notch (seeFigure 62) as it prevents horizontal cracks from occurring for high fibre volumefractions; in addition, it corresponds well to the situation in a uni-axial tension test withnotches. A drawback with the guide notch, it can be argued, is that the crack is forced topropagate in a predefined path.

CHALMERS, Civil and Environmental Engineering 71
starternotch
≈ 0.2
5b
Front view Top view
guide notch
guide notch
≈ 0.5
b≈ 0
.25
b
b
Figure 62. Specimen with notches on the sides of the specimen to prevent horizontalcracks.
To investigate the problems with horizontal cracks, analyses have been carried out usingthe commercially available program package DIANA, version 8.1 (see Löfgren, 2004).In the analysis all elements outside the crack were assumed to have linear elastic andisotropic behaviour and the crack was modelled with a discrete crack, using so-callednon-linear interface elements. The interface elements can be considered as non-linearsprings describing the Mode I fracture properties. The stress distribution at peak load,for a specimen size of 150×150×150 mm3, is presented in Figure 63. As can be seen,there exists a region outside the assumed fracture plane with tensile stresses as high asthe tensile strength of 3.0 MPa. This is both perpendicular and parallel to the crack. Infact, the principal stresses, close to the crack plane, are parallel to the crack. Similarresults from FE analysis have been found by Leite et al. (2004), who analysed WSTexperiments, and Planas et al. (1992) and Olson (1994) who analysed notched beams.
1.0
-1.0-3.0
1.0
-0.14
-1.0
-0.140.14
-0.14
0.143.0
3.0 2.4
(b)(a)
Figure 63. Results from analysis of a 150 mm WST specimen, stresses at peak load:(a) stresses perpendicular to the crack, (b) stresses parallel to the crack.Analysis conducted for a fibre-reinforced concrete (w/c = 0.55, Vf =0.75%) with a tensile strength of roughly 3.0 MPa. From Löfgren (2004).

CHALMERS, Civil and Environmental Engineering72
Furthermore, experimental investigations of the effect of the guide notch wereconducted in a series of tests. An initial pilot study was undertaken, using specimens100×100×100 mm3, on a FRC with volume fraction of 1.0% and fibres with a length of35 mm. For this investigation three different cases were considered, using threespecimens for each (see Figure 64): (a) with a deep guide notch (depth approximately20 mm); (b) with a shallow guide notch (depth approximately 10 mm); and (c) without aguide notch. In Figure 65(a), a comparison is made between the splitting load–CMODcurves, and in Figure 65(b) the dissipated energy is compared. The results suggest that aguide notch may prevent the horizontal cracks from appearing (see Figure 64), but thedissipated energy increased by roughly 10 to 20% with a guide notch.
(a) (b) (c)Figure 64. Pictures showing cracks in WST specimens (specimen size 100×100×100
mm3): (a) with a deep guide notch; (b) with a shallow guide notch; and(c) with no guide notch.

CHALMERS, Civil and Environmental Engineering 73
0
10
20
30
0.0 1.0 2.0 3.0 4.0
CMOD [mm]
Without guide notch
With shallow guide notch
With deep guide notch
Spl
ittin
glo
ad,F
sp/w
idth
,[N
/mm
]
0
500
1 000
1 500
2 000
2 500
0.0 1.0 2.0 3.0 4.0
CMOD [mm]
1.0
1.1
1.2
1.3
Gf.g
uide
notc
h/G
f.no
notc
h
With shallow guide notch
With deep guide notch
Without guide
Dis
sipa
ted
Ene
rgy,
Gf,
[Nm
/m2 ]
Ratio of G f
(second y-axis)
(a) (b)Figure 65. Comparison of results for specimens with and without a guide notch: (a)
splitting load–CMOD curves (splitting load has been divided by the widthof the specimen), and (b) dissipated energy (on the first y-axis) and theratio of energies dissipated for specimens with and without a guide notch(second y-axis).
Another investigation was undertaken, presented in Paper III, where it was alsoconcluded that the guide notch successfully prevented horizontal cracking in thespecimens but that the energy dissipated during fracture increased (between 5 and 15%).In Paper III, it was suggested that this could be a result of an increased number of fibrescrossing the fracture plane. However, as the fibres were not counted in these specimensit could not be confirmed. An explanation for the increased number of fibres when aguide notch (or the starter notch for that case) is introduced is outlined in Figure 66(a &b).
Two situations are analysed, namely a specimen with and one without a notch. For thespecimen with a notch, a fibre situated close to the notch can have its centre of gravityoutside the fracture plane and, when the specimen has been fractured, the fibre willprotrude and be counted when the total number of fibres is assessed. Moreover, the fibrecontributes to the energy dissipation. For the specimen without a notch, where a depthcorresponding to that of the guide notch has been cut away, the fibre will be cut in twoand, when the specimen has been fractured, the fibre will not protrude and therefore willnot be counted when the total number of fibres is assessed. Moreover, the fibre will notcontribute to the energy dissipation. The additional number of fibres as a result of theguide notch depends on the length of the fibre and the depth of the notch; see e.g.Kooiman (2000) and Dupont and Vandewalle (2005). Consequently another study wasconducted – see Löfgren et al. 2004 and Paper V – in which it was again confirmed thatthe guide notch influenced the result and the dissipated energy increased; see Figure 67.However, in this study the fibres were counted and it was found that there was indeedan increase in the number of fibres; see Figure 68(a). Inverse analyses were conductedand bi-linear stress-crack opening relationships determined; when these had beenadjusted for the differences in the number of fibres, only minor differences were foundbetween them (mainly for crack openings larger than 1.0 mm) – see Figure 68(b).Hence, this suggests that a guide notch can be utilised as long as the effect of additionalfibres is taken into account and the stress-crack opening relationship is adjustedaccordingly.

CHALMERS, Civil and Environmental Engineering74
Fractureplane
Fibre with centreof gravity outsidefracture plane
No guide notch
Fractureplane
Fibre cut in twowhen sawing
(a)
Guide notch
(b)
Figure 66. (a) Specimen with guide notch. (b) Specimen without guide notch, butwhere a depth corresponding to that of the guide notch has been cutaway.
0
1 000
2 000
3 000
0.0 1.0 2.0 3.0 4.0
CMOD [mm]
Spec. with guide notch
Spl
ittin
glo
ad,
Fsp
,[N
]
Spec. without guide notch
0
200
400
600
800
0.0 1.0 2.0 3.0 4.0
CMOD [mm]
1.0
1.1
1.2
1.3
Spec. with guide notch
Dis
sipa
ted
ener
gy,G
f,[N
m/m
2 ]
Spec. without guide notch
Gf.
guid
eno
tch/
Gf.
nono
tch
Ratio of G f
(second y-axis)
(a) (b)Figure 67. Comparison of results for specimens with and without a guide notch: (a)
splitting load–CMOD curves and (b) dissipated energy. See Löfgren et al.(2004).
0.94
0.74
0.0
0.4
0.8
1.2
Without Guidenotch
With Guidenotch
No.
fibr
es/c
m2
Max
Average
Min
0.0
0.5
1.0
1.5
2.0
2.5
0.0 0.5 1.0 1.5 2.0 2.5
Crack opening [mm]
Ten
sile
Stre
ss[M
Pa]
w/c 0.55 & 0.51% RC-65/35WST 200
Spec. with a guide notch
Spec. without a guide notch
(a) (b)Figure 68. Comparison of results for specimens with and without a guide notch: (a)
number of fibres and (b) stress-crack opening relationship (adjusted fornumber of fibres). See Löfgren et al. (2004).

CHALMERS, Civil and Environmental Engineering 75
4.3.4 Comparison and evaluation of methods
In Paper III the presented test methods (the UTT, the 3PBT, and the WST) werecompared. It was found that the scatter in the test results was quite large and thecoefficient of variance could be as high as 40%; see Figure 69 and Figure 70 and PaperIII. Furthermore, the number of fibres crossing the fracture plane exceeded thetheoretical value for random 3-D orientation in all specimens except for the UTT, whichhad significantly fewer fibres; see Figure 71. A major factor contributing to the largescatter in the test results is believed to be related to variations in fibre distribution andorientation; in Figure 71(b) it can be seen that the coefficient of variance is between 10and 30%.
0%
10%
20%
30%
40%
50%
0.0 0.5 1.0 1.5 2.0 2.5
Crack opening, w, [mm]
Mix 3
Mix 5
Mix 2
Mix 4
Mix 1
CoV
for
the
Ten
sile
Stre
ss[%
]
0%
10%
20%
30%
40%
0.0 1.0 2.0 3.0 4.0 5.0
CMOD [mm]
Mix 1
Mix 3
Mix 5
Mix 4
Mix 2C
oVfo
rth
eL
oad
[%]
(a) (b)Figure 69. Comparison of the scatter in the test result, coefficient of variance (CoV):
(a) for the UTT; and (b) for the 3PBT. From Paper III.
0%
10%
20%
30%
40%
0.0 1.0 2.0 3.0 4.0 5.0
CMOD [mm]
Mix 3
Mix 4
Mix
Mix 5
Mix 2
CoV
for
the
Split
ting
Loa
d[%
]
0%
10%
20%
30%
40%
0.0 1.0 2.0 3.0 4.0 5.0
CMOD [mm]
Mix 2
Mix 3
Mix 1
Mix 4
Mix 5
CoV
for
the
Split
ting
Loa
d[%
]
(a) (b)Figure 70. Comparison of the scatter in the test result, coefficient of variance (CoV)
for the load: (a) 150×150 mm2 WST specimens and (b) 200×200 mm2
WST specimens. From Paper III.

CHALMERS, Civil and Environmental Engineering76
0.0
0.1
0.2
0.3
0.4
0.5
0.6
0.7
0.8
Mix 1 Mix 2 Mix 3 Mix 4 Mix 5
Fibr
eef
fici
ency
fact
or, η
b.ex
p,[
-]WST-S
WST-L
3PBT
UTT
η b.3D = 0.5
η b.2D = 0.64
0%
10%
20%
30%
40%
Mix 1 Mix 2 Mix 3 Mix 4 Mix 5
WST-S
WST-L
3PBT
UTT
CoV
for
num
ber
offi
bres
[%]
(a) (b)Figure 71. Comparison of the experimental fibre efficiency factor for the specimens.
(b) The coefficient of variance, CoV, for the number of fibres. FromPaper III.
When comparing the σ-w relationship obtained from the inverse analyses and the UTT– presented in Figure 72(a) to Figure 76(a) and in Paper III – it can be observed thatthere are differences between the test methods and the agreement is poor for the UTT.This poor agreement is partly due to the differences in the number of fibres, expressedas the experimentally determined fibre efficiency factor. However, if the differences inthat factor are taken into account and the σ-w relationship is adjusted accordingly it canbe noticed that the agreement is improved; see Figure 72(b) to Figure 76(b). Thisadjustment seems to give a better agreement for most mixes, except the 3PBT andMixes 2 and 4. With the modification, also the result from the UTT seems to give abetter agreement, although the number of fibres was probably too few and theirorientation may not have been representative to produce a stress crack-openingrelationship that could be adjusted. That the 3PBT does not always fit in and seems togive higher bridging stresses may be due to the problems of diffuse and multiplecracking in the specimens with a high fibre content (see Figure 77).
0.0
1.0
2.0
3.0
0.0 0.5 1.0 1.5 2.0 2.5
Crack opening [mm]
Ten
sile
Str
ess
[MP
a]
Mix 1 WST-S
Mix 1 WST-L
Mix 1 3PBT
Mix 1 UTT
Original curve
0.0
1.0
2.0
3.0
0.0 0.5 1.0 1.5 2.0 2.5
Crack opening [mm]
Ten
sile
Str
ess
[MP
a]
Mix 1 WST-S
Mix 1 WST-L
Mix 1 3PBT
Mix 1 UTT
Adjusted curve
(a) (b)Figure 72. Comparison of the σ-w relationship: (a) original curve and (b) curve
adjusted by considering the number of fibres in the specimens.

CHALMERS, Civil and Environmental Engineering 77
0.0
1.0
2.0
3.0
0.0 0.5 1.0 1.5 2.0 2.5Crack opening [mm]
Ten
sile
Str
ess
[MP
a]Mix 2 WST-SMix 2 WST-L
Mix 2 3PBTMix 2 UTT
Original curve
0.0
1.0
2.0
3.0
0.0 0.5 1.0 1.5 2.0 2.5
Crack opening [mm]
Ten
sile
Str
ess
[MP
a]
Mix 2 WST-S
Mix 2 WST-L
Mix 2 3PBT
Mix 2 UTT
Adjusted curve
(a) (b)Figure 73. Comparison of the σ-w relationship: (a) original curve and (b) curve
adjusted by considering the number of fibres in the specimens.
0.0
1.0
2.0
3.0
4.0
0.0 0.5 1.0 1.5 2.0 2.5
Crack opening [mm]
Ten
sile
Str
ess
[MP
a]
Mix 3 WST-S
Mix 3 WST-L
Mix 3 3PBT
Mix 3 UTT
Original curve
0.0
1.0
2.0
3.0
4.0
0.0 0.5 1.0 1.5 2.0 2.5
Crack opening [mm]
Ten
sile
Str
ess
[MP
a]
Mix 3 WST-S
Mix 3 WST-L
Mix 3 3PBT
Mix 3 UTT
Adjusted curve
(a) (b)Figure 74. Comparison of the σ-w relationship: (a) original curve and (b) curve
adjusted by considering the number of fibres in the specimens.
0.0
1.0
2.0
3.0
4.0
0.0 0.5 1.0 1.5 2.0 2.5
Crack opening [mm]
Ten
sile
Str
ess
[MP
a]
Mix 4 WST-SMix 4 WST-LMix 4 3PBTMix 4 UTT
Original curve
0.0
1.0
2.0
3.0
4.0
0.0 0.5 1.0 1.5 2.0 2.5
Crack opening [mm]
Ten
sile
Str
ess
[MP
a]
Mix 4 WST-S
Mix 4 WST-L
Mix 4 3PBT
Mix 4 UTT
Adjusted curve
(a) (b)Figure 75. Comparison of the σ-w relationship: (a) original curve and (b) curve
adjusted by considering the number of fibres in the specimens.

CHALMERS, Civil and Environmental Engineering78
0.0
1.0
2.0
3.0
4.0
0.0 0.5 1.0 1.5 2.0 2.5
Crack opening [mm]
Ten
sile
Str
ess
[MP
a]Mix 5 WST-SMix 5 WST-L
Mix 5 3PBTMix 5 UTT
Original curve
0.0
1.0
2.0
3.0
4.0
0.0 0.5 1.0 1.5 2.0 2.5
Crack opening [mm]
Ten
sile
Str
ess
[MP
a]
Mix 5 WST-S
Mix 5 WST-L
Mix 5 3PBT
Mix 5 UTT
Adjusted curve
(a) (b)Figure 76. Comparison of the σ-w relationship: (a) original curve and (b) curve
adjusted by considering the number of fibres in the specimens.
Figure 77. Examples of diffusive and multiple cracking in a notched beam specimen(w/b 0.42 and Vf = 1.0 %, type RC-65/35).
When comparing the different test methods, based on the criteria specified, thefollowing conclusions can be drawn:
The results from all test methods could be interpreted as constitutive materialparameters, although the 3PBT and the WST required inverse analyses.
The σ-w relationship obtained from the inverse analyses showed quite goodagreement after they had been adjusted by taking into account theexperimentally determined fibre efficiency factor.
A well-defined crack was formed in the UTT and the WST specimens whichhad a guide notch, but in the 3PBT specimens with a high volume fraction offibres this was not the case, suggesting that a deeper notch may be required forthe 3PBT when a deflection-hardening behaviour is expected.
Generally the scatter in the test result was high, but it was slightly lower for theWST.
For the UTT, it is clear that the UTT is sensitive to the casting and compactionprocedures, as the UTT specimens had only about half the expected number offibres in the fracture surface, which led to results that were not representative.
The WST was the simplest and fastest method to use.

CHALMERS, Civil and Environmental Engineering 79
4.4 Concluding remarks
A test method approach was suggested which is based on the following three steps: (1) afracture-mechanics-based test method; (2) inverse analysis for determining the σ-wrelationship; and (3) adjustment of the σ-w relationship to take into account anydifferences in fibre efficiency (the number of fibres) between the material test specimenand random 3-D orientation or the specimen where the material is to be used. Thisapproach was investigated in a parametric study, using the wedge-splitting test (WST)method for seven different volume fractions (0% ≤ Vf ≤ 1.0%), where the result seemsto confirm the approach and the assumptions made. The approach was also used in astudy where three different test methods were investigated for five different mixes; andit was possible to adjust for some of the variations in fibre content, which always will bepresent in material testing, and to obtain specimen-independent σ-w relationships.
A conclusion that can be drawn is that, when presenting test results for fibre-reinforcedconcrete, it is recommended always to count and explicitly state the number of fibrescrossing the fracture plane and, if possible, to make a note of any significant variationsin the distribution of the fibres (e.g. whether there is any segregation or bundles offibres).
When comparing the three different test methods (the UTT, 3PBT, and WST), it wasfound that there was a significant scatter in the test results for all methods, but that theWST method overall showed less scatter. When counting the fibres in the specimens, itbecame obvious that there were some variations in the number of fibres, but when thiswas considered the σ-w relationships, obtained by inverse analysis, showed reasonableagreement. Furthermore, recommendations for using the WST method were provided,which is an attractive alternative test method for FRC as the small specimen size makesit ideal for laboratory use, e.g. when developing and investigating new mixes or whenperforming parametric studies.

CHALMERS, Civil and Environmental Engineering80

CHALMERS, Civil and Environmental Engineering 81
5 Fracture-mechanics-based structural analysis
5.1 Introductory remarks
Gettu et al. (2000) suggest that a design approach, in order to be complete, shouldconsist of a methodology or strategy that includes: (1) a specification of the materialstesting, to obtaining the material parameters needed for the design, and a procedure forinterpreting the results; (2) the formulas or steps used for the design of structuralmembers; and (3) and indication of the limitations and reliability of the approach. Foranalysis it is suitable to distinguish between structural analysis and sectional analysis.The latter is performed to analyse a part of the structure – usually a critical section – andto determine the response of this section, e.g. the relationship between applied momentand curvature, strain or crack opening, etc., and the load resistance. The former isperformed to establish the global behaviour, e.g. the complete load–displacementrelationship for a beam, and to ensure that the structure or element behaves in asatisfactory manner. The aim of design, on the other hand, is to ensure that a givenstructural element is capable of sustaining the forces acting on it, forces which havebeen determined from a structural analysis.
5.2 Design and analysis approaches
For fibre-reinforced concrete there are a number of different design and analysisapproaches available, some of which can be found in the following references: Maidl(1995), Tan et al. (1995), Swedish Concrete Society (1995), Nanakorn and Horii(1996), Lok and Pei (1998), Lok and Xiao (1999), Lin (1999 and 2000), Gossla (2000),Gettu et al. (2000), Kooiman (2000), Silfwerbrand (2001), RILEM TC 162-TDF (2002aand 2003a&b), Barragán (2002), Hemmy (2002), Rosenbuch (2003), Dupont (2003),Pfyl (2003), Kanstad (2003), Ahmad et al. (2004). These design and analysisapproaches, which are readily available, are either analytical approaches, primarilydeveloped for performing cross-sectional analysis, or based on the finite elementmethod, for which a number of different methods and constitutive models are availableand can be used for both cross-sectional and structural analysis.
5.2.1 Finite element method
Examples where the finite element method has been used for analysing fibre-reinforcedconcrete can be found, for example, in the Brite-EuRam Project BRPR-CT98-0813(Test and Design Methods for Steel Fibre Reinforced Concrete); in this project differentFE programs and approaches were investigated (i.e. smeared and discrete cracking) –see Hemmy et al. (2002). Another investigation, using the smeared crack concept, wasconducted by Kanstad and Døssland (2003), see also Kanstad and Døssland (2004), whoused DIANA but with ‘embedded’ reinforcement (see TNO, 2002). Embeddedreinforcement means that the reinforcements are embedded in structural elements anddo not have degrees of freedom of their own. Other applications and developments of

CHALMERS, Civil and Environmental Engineering82
constitutive models for smeared cracking models can be found in e.g. Meda et al.(2001), Guttema (2004), Belletti et al. (2004). Other approaches, based on strongdiscontinuity, have been investigated and implemented by, among others, Simone(2003) and Svahn (2005).
For the finite element method, the applicability to model fibre-reinforced concretedepends on the capabilities of the FE program used, and it is outside the scope of thiswork to describe all the different approaches that can be used. However, a briefoverview of the concepts and the program (DIANA, see TNO, 2002) used in this studywill be provided. Generally a distinction is made between the discrete crack approachand the smeared crack concept. In the discrete crack approach, special interfaceelements are used to model a crack and the material behaviour is described by the σ-wrelationship; see Figure 78(a). A drawback with this approach is that the crack path hasto be predefined, which makes it useful only in situations where this occurs e.g. for theinverse analyses of a notched beam specimen or a WST specimen. The smeared crackapproach, on the other hand, requires no pre-defined cracks but it is assumed that thedeformation of one crack (the crack opening) can be smeared out over a characteristiclength lc; see Figure 78(b & c) as well as Roots (1988), Lundgren (1999) and Johansson(2000). When modelling plain concrete, this characteristic length is approximately thesize of one element, h; when modelling reinforced concrete, and when slip is allowedbetween the reinforcement and the concrete, it is also approximately the size of oneelement. But, this means that the tensile stress versus strain used will depend on the sizeof the element, and in some situation a different characteristic length may be required.One such situation occurs when modelling reinforced concrete and assuming completeinteraction between the steel and the concrete (e.g. using embedded reinforcement inDIANA; for this case, the deformation of one crack is smeared out over the mean crackdistance, s Figure 78(b & c). For fibre-reinforced concrete, the same assumptionsregarding the characteristic length can be used, but some extra considerations may berequired when modelling a combination of FRC and conventional reinforcement. In ananalysis, if the initial assumption is that the characteristic length is the size of oneelement but the obtained crack pattern is unrealistic – e.g. cracks will not localise intowell-defined and distinct cracks, and instead elements in a large part of the beam maybe cracked: see Figure 78(b) – the characteristic length may have to be adjusted. Theconsequence of an unrealistic crack pattern, with too many elements cracked, is that theductility and load resistance will be overestimated. If such a situation arises, thecharacteristic length has to be chosen as the size of several elements, but should neverbe more than the average expected crack spacing, and a new analysis has to beperformed with the new assumption. Situations where this problem may arise are, forexample, when the σ-w relationship has a relatively high stress level after cracking,when the σ-w relationship has no steep initial drop, or when a high amount ofconventional reinforcement is used in combination with FRC.

CHALMERS, Civil and Environmental Engineering 83
1
wc
w
( )ctf
wσ
(a)
1
εc = wc / lc
ε
( )ctf
wσ
(c)
εc = wc / (2 lc)
lc = h
(b)
s
lc = h ? lc = s
Figure 78. (a) Example showing a bi-linear σ-w relationship. (b) Localisation ofcracks and the choice of the characteristic length. (c) The transformationto a σ-ε relationship.
5.2.2 Analytical approaches
The analytical models – for cross-sectional analysis – that are available are based ondifferent assumptions regarding kinematic (e.g. whether the crack surfaces remain planeor not) and constitutive conditions (e.g. the stress-crack opening relationship in tensionand stress–strain relationship in compression); see RILEM TC 162-TDF (2002a and2003a). Depending on how the tensile response is represented, two approaches exist,namely the stress–strain (σ-ε) approach and the stress-crack opening (σ-w) approach;see Kooiman (2000) for a review of some approaches.
For the stress–strain approach, two possibilities exist: to use the uni-axial behaviour orto represent the post-peak material behaviour with equivalent, or residual, flexuraltensile strengths, which can be determined from a three-point bending test (see e.g.RILEM TC 162-TDF 2003a). In the σ-ε approach by RILEM TC 162-TDF (2003a) theequivalent, or residual, flexural strength is used, and a size effect factor has beenintroduced if the member depth is larger than the beam used for the materials testing.On the other hand, when studying the literature there is no clear evidence for a sizeeffect. Kooiman (2000) investigated the energy absorption for different beam sizes(ligament lengths 125, 250, and 375 mm) but found no evidence for any size effect.Furthermore, di Prisco et al. (2004a) investigated size effects in thin plates and foundthat there was a negligible size effect for the residual strength (i.e. post cracking) inbending and suggests that the large scatter may instead support the Weibull’s theory ofstatistical defects. Besides, it is not unlikely that the supposed size effect may partly beexplained by the fibre distribution and the fibre efficiency factor (see also Figure 14 andSection 4.2.3). For example, the result presented by Erdem (2003) suggests that anincreased beam width has a similar effect as the height, although not as pronounced forthe investigated dimensions.
Cross-sectional analysis can also be carried out using fracture mechanics, using a σ-wrelationship, and by describing the cracked section as a non-linear hinge, as proposed byUlfkjær et al. (1995) and later by Pedersen (1996), Cassanova and Rossi (1997), andOlesen (2001a). In addition, for determining the rotation capacity of reinforced concretebeams, other type of models (e.g. plastic hinge models, crack block models) exist; seee.g. CEB Bulletin 242, Rebentrost (2003), and Fantilli et al. (2005). An example of such

CHALMERS, Civil and Environmental Engineering84
a fracture-mechanics-based approach is the Japanese design provision for steel fibre-reinforced concrete (SFRC) tunnel linings (see Nanakorn and Horii 1996); in the designof a tunnel lining, one of the limit states is the failure of a section after initiation andpropagation of a crack.
Many of the proposed analytical models focus entirely on sections without conventionalreinforcement; often the shape of the σ-w relationship is ignored and, to simplifyanalysis, a plastic stress distribution is assumed. In addition, most of the suggestedmodels for reinforced FRC members are design models only aiming at predicting themoment resistance, and thus do not provide much information on the crack propagationstage; the possible negative/positive effects of a normal force acting on the cross sectionare also neglected in several models. For fibre-reinforced beams without conventionalreinforcement, Olesen (2001a) developed a non-linear hinge model, using a bi-linear σ-w relationship, covering the case with a normal force acting on the section. Olesen(2001b) further developed the non-linear hinge model to cover sections containingconventional reinforcement; in this model, the length of the hinge is set to the averagecrack spacing, which is a function of the load and changes during analysis, and de-bonding between reinforcement and concrete is also considered. The stress-crackopening relationship adopted is a drop-constant, and in compression the concretebehaves elastically. Barros and Figueiras (1999) proposed a layered approach for theanalysis of SFRC cross-sections under bending and axial forces. The model was basedon a stress–strain concept, with a bi-linear tension-softening relationship and a non-linear stress–strain relationship in compression. The fracture energy, GF, together withthe average crack spacing, was used to determine the tension-softening relationship andthe tension-stiffening phenomenon was considered with a cracked reinforced concretetie stiffening the reinforcement.
5.3 Non-linear hinge model
The approach used in this thesis for studying the flexural behaviour of beams is basedon non-linear fracture mechanics and the non-linear hinge model. Generally, for beams,slabs, and pipes without conventional reinforcement, cross-sectional analysis can becarried out by describing a cracked section with a non-linear hinge (see Figure 79), asproposed for example for Ulfkjær et al. (1995), Pedersen (1996), Casanova and Rossi(1997), and Olesen (2001a & b). These models are based on different assumptionsregarding kinematic and constitutive conditions. But generally the different kinematicassumptions for the stress-crack opening models can be described in the following way(see RILEM TC 162-TDF, 2002a):
The crack surfaces remain plane and the crack opening angle equals the overallangular deformation of the non-linear hinge.
The crack surfaces remain plane and the crack opening angle equals the overallcurvature of the non-linear hinge. Furthermore, the overall curvature of thenon-linear hinge, the curvature of the cracked part, and the curvature of theelastic part are linked due to the assumption of parabolic variation of thecurvature; see e.g. Casanova and Rossi (1997) and Chanvillard (2000).
The crack surfaces do not remain plane; the deformation is governed by thestress-crack opening relationship, the crack length and the overall angulardeformation of the non-linear hinge.

CHALMERS, Civil and Environmental Engineering 85
s
crack/notchM
M
Q
Non-linear hinge
L
h
δ
θ
w
ay0θ
Figure 79. Non-linear hinge, or ‘crack band’ concept for a beam withoutreinforcement.
The non-linear hinge approach, as described above, can also be used for beams with acombination of conventional reinforcement and fibres – see e.g. Olesen (2001a). Basedon the recommendations of RILEM TC 162-TDF (2002), a simplified model forsectional analysis, derived from the non-linear hinge concept, has been established. Thefollowing assumptions have been introduced:
the cross-section is subjected to a bending moment, M, and a normal force, N(no long-term effects are considered);
the length of the non-linear hinge is set to either half the beam height or, if thesections contain conventional reinforcement, the average crack spacing;
the crack surfaces remain plane and the crack opening angle equals the overallangular deformation of the non-linear hinge;
a non-linear stress–strain relationship in compression;
a fictitious crack (or cohesive crack) is assumed with a bi-, poly- or non-lineartension-softening relationship;
a bi-linear (or tri-linear) stress–strain relationship for the reinforcement;
the average strain in the reinforcement is related to the average elongation ofthe hinge (at the level of the reinforcement); and
tension stiffening and the distribution of stresses between the cracks are notconsidered.
The cross-sectional response can be determined through an iterative approach where therotation for the considered cross-section (see Figure 80) is increased and, in each step,the position of the neutral axis is determined by solving the equilibrium equation ofsectional forces, Equation (5.6); the corresponding bending moment, Equation (5.7), iscalculated for each step. The equations and integrals can be solved by using computersoftware such as MathCad® (used in this study), Matlab®, Mapel®, etc.
The average curvature, κm, of the non-linear hinge is given by:
smθκ = (5.1)
The crack mouth opening displacement, wCMOD, can be related to the crack openingangle, θ*, and the length of the crack, a:

CHALMERS, Civil and Environmental Engineering86
awCMOD ⋅= *θ (5.2)The average strain in the reinforcement is calculated as:
( )01 ydss −⋅= θε (5.3)
The compressive strain in the concrete is calculated as:
( )0yysc −⋅= θε (5.4)
When the crack surfaces remain plane, the overall angular deformation of the hinge, θ,is equal to the crack opening angle, θ*. The crack mouth opening displacement, wCMOD,can then be related to the depth of the neutral axis, y0, the overall angular deformation ofthe hinge, θ, the tensile strength, ft, the modulus of elasticity, E, the normal force, N, thecross-sectional area, A, and the length of the non-linear hinge, s, by:
( )⋅
−⋅−−⋅=EA
N
E
fsyhw t
CMOD 0θ (5.5)
Based on these assumptions and the stress distribution in Figure 80, the sectional forcescan be written as:
( ) ( ) ss
h
ah
f
ah
c Adyywdyyb
N ⋅++=−
−
σσεσ ,,0
(5.6)
−⋅⋅+−⋅+−⋅=−
−
22),(
2),( 1
0
hdAdy
hyywdy
hyy
b
Mss
h
ah
f
ah
c σσεσ (5.7)
N
w
M
s
M
N
σ c(ε
,y)
y
y 0
σs
d 1
σ c(w
,y)
a
h/2
h/2 a
εc (y)
εs
wCMOD
θ*θ / 2
non-linearsprings
ConcreteStress-strain
-110
-90
-70
-50
-30
-10
-5 -4 -3 -2 -1 0
Strain, εc, [10-3]
Stre
ss,σ
c,[M
Pa]
0
εs
σsfu
fy
εy εu
Ec
fct
σ (ε)
ε
1
wcw1
b2
a1
a2w
( )ctf
wσ
ConcreteStress-crack opening
ReinforcementStress-strain
ConcreteStress-strain
Figure 80. Non-linear hinge, or ‘crack band’ concept for a beam with reinforcementand examples of the material behaviour.

CHALMERS, Civil and Environmental Engineering 87
The results of a non-linear hinge analysis (moment vs. curvature or angulardeformation) can be used to determine the structural response (e.g. deflection) of beams,slabs, pipes, etc. This can be done by assuming that the deflection can be described bythree terms (see Stang and Olesen 2000) which can be superimposed, namely: (1) theelastic deflection of the beam without a crack or notch (if such exists); (2) the elasticdeflection due to the presence of the notch or a stress-free crack; and (3) the deflectiondue to the crack band. Alternatively, it is possible to determine the deflection byintegration of the curvature along the beam; see e.g. Hassanzadeh (2001).
5.3.1 Members without conventional reinforcement
Using the presented non-linear hinge model, analyses were carried out for beamsections without conventional reinforcement. The height of the beams was variedbetween 50 and 1600 mm (50, 100, 200, 400, 800, and 1600 mm) and, in the analyses,the following material properties were used:
For the plain concrete: modulus of elasticity, Ec = 30 GPa; tensile strength,ft = 3.0 MPa; compressive strength, fc = 30 MPa; and fracture energy,GF = 125 Nm/m2 (assuming an exponential σ-w relationship according toReinhardt et al. 1986).
For the fibre-reinforced concrete: modulus of elasticity, Ec = 30 GPa; tensilestrength, ft = 3.0 MPa; compressive strength, fc = 30 MPa; and a bi-linear σ-wrelationship with the following parameters a1 = 20 mm-1, a2 = 0.067 mm-1, andb2 = 0.5.
The results of the analyses can be seen in Figure 81, which shows the moment versusangular deformation, and in Figure 82 the relative crack length has been plotted againstthe moment. In Figure 81 the effect of the size of the beam and the influence of thefracture energy can be observed; for the small beam, the increase in the flexural strength(the normalised moment) is quite high, whereas for the high beam it is insignificant. Inthe figures it can also be seen that there is a significant difference in the behaviourbetween the plain and the fibre-reinforced concrete; the crack propagation (Figure 82)reveals that the fibre-reinforced concrete, as opposed to the plain, is capable of slowingdown the crack growth once this reaches the critical point.
0.0
0.5
1.0
1.5
2.0
0.000 0.002 0.004 0.006 0.008 0.010
Angular deformation, θ , [-]
FRC
h = 50
h = 1600
h = 50
h = 1600
Plain concrete
Nor
mal
ised
mom
ent(
M/M
cr)
[-]
Figure 81. Relationship between moment (normalised against cracking moment) andangular deformation for beams without reinforcement (h = 50, 100, 200,400, 800, and 1600 mm) – plain concrete and fibre-reinforced concrete.

CHALMERS, Civil and Environmental Engineering88
0.0
0.5
1.0
1.5
2.0
0.0 0.2 0.4 0.6 0.8 1.0
Normalised crack length, a/h , [-]
Plainconcrete
Nor
mal
ised
mom
ent(
M/M
cr)
[-]
h = 1600
h = 50
0.0
0.5
1.0
1.5
2.0
0.0 0.2 0.4 0.6 0.8 1.0
Normalised crack length, a/h , [-]
h = 50
h = 1600
Nor
mal
ised
mom
ent(
M/M
cr)
[-]
FRC
(a) (b)Figure 82. Relationship between moment (normalised against cracking moment) and
the normalised crack length for beams without reinforcement (h = 50,100, 200, 400, 800, and 1600 mm): (a) plain concrete and (b) fibre-reinforced concrete.
5.3.2 Members with conventional reinforcement
Analyses were also carried out for beam sections with conventional reinforcement (seeLöfgren, 2003). A slab with a thickness of 250 mm thick, 1 m wide, and with thereinforcement placed 225 mm from the top of the slab was analysed; see Figure 83. Forthe concrete: tensile strength ft = 2.5 MPa, compressive strength fc = 38 MPa, andmodulus of elasticity Ec = 30 GPa. For the reinforcement: yield stress fy = 500 MPa,tensile strength fu = 550 MPa (εu = 6%), and the elastic modulus Es = 200 GPa.Furthermore, the FRC was simulated by a bi-linear σ-w relationship in tensionaccording to Figure 83 with the following parameters: a1 = 10 mm-1, a2 = 0.033 mm-1,and b2 = 0.5. The fibre-reinforced concrete had a longitudinal geometric reinforcementratio of 0.1% while the plain concrete had 0.2%. The properties of the reinforcementwere: modulus of elasticity Es = 200 GPa, yield strength fy = 500 MPa, ultimate strengthfu = 550 MPa (at a failure strain of 5%).
Concrete:ft = 2.5 MPafc = 38 MPaEc = 30 GPa
1
wcw1
b2
a1
a2w
( )ctf
wσ
σ-w relationship for FRC.Parameters: a1, a2, and b2
b = 1000
d=
225
h=
250
Reinforcement: ρ = 0.1% or for RC 0.2%fy = 500 MPa (fu = 550 MPa)Es = 200 GPa
Figure 83. Geometry of investigated slab and assumed material properties.
To check the results and the assumption of the hinge length s, results from non-linearhinge analyses were compared with FE analyses based on non-linear fracture mechanics(see Figure 84). The FE analyses were performed with the program DIANA (see TNO,

CHALMERS, Civil and Environmental Engineering 89
2002). In the analyses, a smeared crack approach was used and the characteristic length(or the crack band width, h) was set to 12.5 and 25 mm for the FRC, which correspondrespectively to two and four elements as cracks tended to localise in more than oneelement row. With this assumption, the bi-linear stress-crack opening relationship wastransformed into a stress–strain relationship by dividing the crack opening with thecrack bandwidth. Furthermore, the interaction between the concrete and thereinforcement (the bond-slip) was modelled with interface elements, which were given abond-slip relationship according to the CEB-FIP MC90 (see CEB, 1993), assumingconfined concrete with good bond conditions.
Figure 84 shows the crack pattern obtained in one of the FE analyses with a spacing ofabout 120-130 mm. Moreover, in Figure 85 a comparison is made between the twomodels with different assumptions regarding the hinge length and crack bandwidth; ascan be seen, the non-linear hinge model seems to predict the overall behaviour fairlywell and the peak moment also corresponds. However, the FE-analyses show asomewhat stiffer behaviour during the cracking stage, and yielding of the reinforcementoccurs at a smaller rotation. This is expected as tension stiffening was ignored in thesimplified non-linear hinge model. For the plain concrete, see Figure 85(b), the effect ofthe tension stiffening is more pronounced and has a predominant influence during thecracking stage. Furthermore, the differences at the first crack development were due toconvergence problems in the FE analyses.
M
θ / 2
Figure 84. Detailed analysis of a beam segment for regional behaviour; the figureshows the longitudinal strain in the concrete, and the red or (dark)regions on the tensioned side indicate cracks.
0
10
20
30
40
50
60
70
0 0.004 0.008 0.012 0.016
Curvature [1/m]
Mom
ent,M
,[kN
m/m
]
FEM (h = 25 mm)
FEM (h = 12.5 mm)
s = 75 mm
s = 125 mm
s = 150 mm
0
10
20
30
40
50
60
70
0 0.004 0.008 0.012 0.016
Curvature [1/m]
Mom
ent,M
,[kN
m/m
]
FEM (h = 12.5 mm)
FEM (h = 6.25 mm)
s = 75 mms = 100 mm
s = 150 mm
s = 125 mm
(a) (b)Figure 85. Comparison between the non-linear hinge model and FE-analysis, with
different hinge lengths and crack band widths: (a) for fibre-reinforcedconcrete with 0.1% reinforcement, and (b) for normal reinforced concretewith 0.2% reinforcement. From Löfgren (2003).

CHALMERS, Civil and Environmental Engineering90
To further investigate the capabilities of the non-linear hinge model, another set ofanalyses was conducted for different values of the b2 parameter. The same geometry asin the example above was used, but for a concrete with the following properties: tensilestrength ft = 3.0 MPa, compressive strength fc = 40 MPa, and modulus of elasticityEc = 30 GPa. The reinforcement was assumed to have the following properties: a yieldstress fy = 500 MPa, a tensile strength fu = 550 MPa (εu = 6%), and the elastic modulusEs = 200 GPa. Furthermore, the FRC was simulated by a bi-linear σ-w relationship intension (according to Figure 83) with the following parameters: a1 = 20 mm-1,a2 = 0.05 mm-1, and b2 = 0.2 to 0.9. Figure 86 shows the results of the analyses; Figure86(a) shows the moment vs. curvature and (b) the moment versus crack opening.Generally, the non-linear hinge seems to predict the response fairly well. For themoment versus curvature, the hinge model shows better agreement for a high b2 valuethan for a low; the reason is that, for the case with a low b2, tension stiffening is thepredominant mechanism for the behaviour – compare also with reinforced concrete inFigure 85(b). The crack width seems to be predicted reasonably, but for large b2 valuesa larger crack width is predicted by using the non-linear hinge model.
0
20
40
60
80
100
0.000 0.005 0.010 0.015 0.020 0.025
Curvature [1/m]
Mom
ent[
kNm
/m]
0.9
b 2 =0.2
0.3
0.5
0.7
0
20
40
60
80
100
0.0 0.2 0.4 0.6 0.8 1.0
Crack opening, w , [mm]
Mom
ent[
kNm
/m]
0.9
b 2 =
0.2
0.30.5
0.7
(a) (b)Figure 86. Comparison of the non-linear hinge model (thin lines) and FE-analysis
(thick lines) for different b2 values: (a) moment vs. curvature and (b)moment vs. crack opening.
The conclusion that can be drawn from these investigations is that with the non-linearhinge it is possible to analyse the regional behaviour with quite realistic results whencompared to finite element analyses based on non-linear fracture mechanics. Moreover,the non-linear hinge model is a fast and simple tool that can be used for cross-sectionalanalyses, and the behaviour of simple structures can be determined (e.g. beams, slabs,and pipes) by integration of the curvature. However, input regarding the crack spacingis required, but as the result is not too sensitive (within reasonable deviations) to thechoice of hinge length this can be determined by using some of the available methods;see e.g. Ibrahim and Luxmoore (1979), Tan et al. (1995), RILEM TC 162-TDF, Pfyl(2003), and Dupont (2003). The finite element model, on the other hand, is a muchmore general approach than the analytical model, as it is possible to take into accountthe effects of bond-slip, cracking, multi-axial stress states, stress distribution betweencracks (tension stiffening), etc. Thus, the finite element method is better adapted formore complex structures and loading conditions, as it can provide comprehensiveresults regarding the structural behaviour (shear failure, crushing in the compressivezone, long-term deflections, etc.) and the crack spacing is provided as an output. On theother hand, for larger structures the analysis may become quite time-consuming.

CHALMERS, Civil and Environmental Engineering 91
5.3.3 Influence of the σσσσ-w relationship
As the response is influenced by the σ-w relationship and different relationships can beused, as can be seen in Figure 87, it is important to investigate how this influences theresult. The bi-linear relationship (c) usually provides an acceptable representation of thebehaviour, but in some cases it may be necessary to use a multi-linear relationship (d)for a realistic representation. On the other hand, for design it may be more useful to usea simpler representation, for example a simple drop-constant relationship according toFigure 87(b), which was suggested by Stang and Olesen (2000). Actually, the drop-constant relationship can be considered as a special case of the bi-linear relationship, forwhich the a1 parameter approaches infinity (a1 = ∞) and the a2 parameter approacheszero (a2 = 1 / ∞). However, the simplest possible representation would be a constantrelationship according to Figure 87(a); for this the tensile strength, ft, is simplyneglected and cracking is initiated for σ = b2×ft. For the constant and drop constantrelationships, the constant stress level can also be referred to as the residual stress andthe parameter b2 as the toughness class, sometimes denoted as γ – see Stang and Olesen(2000), Olesen and Stang (2000), and RILEM TC 162-TDF (2002).
For practical applications it has been found that the bi-linear relationship often is asufficient approximation; see e.g. Cotterell and Mai (1995), Olesen (2001a), andRILEM TC 162-TDF (2002). Typical parameters for plain concrete are: 15 mm-1≤ a1 ≤30 mm-1; 0.5 mm-1≤ a2 ≤ 2.5 mm-1; and 0.10 ≤ b2 ≤ 0.35. For fibre-reinforced concrete,the parameters of the bi-linear relationship can also be given phenomenologicalinterpretations. Hence, the parameters will be interpreted and values will be provided onthe basis of the steel fibre-reinforced concretes investigated in this study. To begin with,the a1 parameter may be slightly reduced, compared with plain concrete, but isessentially governed by the fracture properties of the plain concrete, particularly at highfibre volume fractions and with microfibres; typical values are on the order of 5 mm-1≤a1 ≤ 20 mm-1. Furthermore, the a2 parameter is principally related to the fibre length,and the critical crack opening can be on the order of Lf/10 ≤ wc < Lf/2, but poor fibrebond or fibre fracture may lead to a higher a2 value and a smaller critical crack opening;typical values are on the order of 0.025 mm-1≤ a2 ≤ 0.25 mm-1. Finally, the b2 parameteris primarily related to the fibre dosage, which could be seen in Section 4.2.3 and Figure50, and has values in the range of 0.25 < b2 < 1.0.
1
wcw1
b2
a1
a2w
( )ctf
wσ
(c)
1
b2
w
( )ctf
wσ
(b)
1
wcw1
b2
a1
a3
w
( )ctf
wσ
(d)
wc w2
a2
b3
1
b2
w
( )ctf
wσ
(a)
wc
b2 = γ b2 = γ
Figure 87. Definition of different σ-w relationships used in the cohesive crackmodel: (a) a simple constant relationship; (b) a drop constant; (c) a bi-linear and (d) a tri-linear.

CHALMERS, Civil and Environmental Engineering92
Using the bi-linear relationship, a parametric study was conducted using the samegeometry and material properties as shown in Figure 83. Figure 88 to Figure 90 showhow the parameters of the bi-linear stress-crack opening influence the moment-curvature relationship. As can be seen in Figure 88(a), a1 mainly has an influence on thepre-peak stage until a critical value for a1 is reached (corresponding to low values of a1),after which it also influences the maximum moment resistance of the cross-section, inFigure 88(b). It is also interesting to see the effect that the a1 parameter has on the crackpropagation; for a low value the crack will propagate, but with increasing momentresistance until it reaches a critical point where the moment suddenly decreases. Further,a2 mainly influences the shape of the moment-curvature relationship after the maximummoment of the cross-section is reached; see Figure 89(a). For low values, the momentdoes not decrease with increasing rotation, but as a2 is increased the maximum momentwill be decreased and, in addition, the moment decreases with increased rotation. Thissuggests that care should be taken for high values of the a2 parameter as it may have alarge impact on the moment redistribution in statically indeterminate systems. For thecrack propagation, which can be seen in Figure 89(b), the a2 parameter only influencesthe behaviour once the peak moment has been reached. The b2 parameter has a largeinfluence on the maximum moment and the pre-peak part; as b2 increases the momentresistance is increased, as can be seen in Figure 90(a). Moreover, for the crackpropagation, the b2 parameter influences the response first after the crack has reached acritical length (corresponding to the crack opening w1 in Figure 87(c)); see Figure 90(b).From the figures it can also be seen that the peak moment occurs at a crack length ofabout 0.8 of the section depth.
0
20
40
60
80
0 0.02 0.04 0.06
Curvature [1/m]
Mom
ent,
M,[
kNm
/m]
a 1 = 1
M cr
a 1 = 2.5
a 1 = 5
a 1 = 10
a 1 = 20
0.0
0.5
1.0
1.5
2.0
2.5
3.0
0.0 0.2 0.4 0.6 0.8 1.0
Normalised crack length (a / h ) [-]
M
ah
M
a 1 = 20
a 1 = 1
Nor
mal
ised
mom
ent(
M/M
cr)
[-]
(a) (b)Figure 88. Effect of a1 on the response (a1= 20, 10, 5, 2.5, and 1, with a2=0.025 and
b2=0.5): (a) the moment-curvature relationship; and (b) effect on thecrack propagation.

CHALMERS, Civil and Environmental Engineering 93
0
20
40
60
80
0 0.02 0.04 0.06
Curvature [1/m]
Mom
ent,M
,[kN
m/m
]
M cr
a 2 = 0.5
a 2 = 0.025
a 2 = 0.25
a 2 = 0.1
a 2 = 0.05
0.0
0.5
1.0
1.5
2.0
2.5
0.0 0.2 0.4 0.6 0.8 1.0
Normalised crack length (a / h ) [-]
Nor
mal
ised
mom
ent(
M/M
cr)
[-]
M
ah
M
a 2 = 0.5
a 2 = 0.025
(a) (b)Figure 89. Effect of a2 on the response (a2= 0.5, 0.25, 0.1, 0.05, and 0.025, with
a1=10 and b2=0.5): (a) the moment-curvature relationship; and (b) effecton the crack propagation.
0
20
40
60
80
0 0.02 0.04 0.06
Curvature [1/m]
Mom
ent,M
,[kN
m/m
]
M cr
b 2 = 0.25
b 2 = 0.4
b 2 = 0.5
b 2 = 0.6
b 2 = 0.75
0.0
0.5
1.0
1.5
2.0
2.5
3.0
0.0 0.2 0.4 0.6 0.8 1.0
Normalised crack length (a / h ) [-]
M
ah
M
b 2 = 0.25
b 2 = 0.75
Nor
mal
ised
mom
ent(
M/M
cr)
[-]
(a) (b)Figure 90. Effect of b2 on the response (b2= 0.25, 0.4, 0.5, 0.6, and 0.75, with a1=10
and a2=0.025): (a) the moment-curvature relationship; and (b) effect onthe crack propagation.
The simpler relationships presented in Figure 87 were also compared with the bi-linearin an analysis. The bi-linear σ-w relationship used in the analyses can be seen in Figure91 together with the drop constant and the constant relationship. The b2 parameter forthe latter was determined so that the consumed energy up to a crack opening of 2 mmshould be equal to that of the bi-linear relationship. The analyses were conducted byusing the same geometry and reinforcement ratio as in the example above (see Figure83) for a concrete with the following properties: tensile strength ft = 3.0 MPa,compressive strength fc = 40 MPa, and modulus of elasticity Ec = 30 GPa. For thereinforcement a yield stress fy = 500 MPa, a tensile strength fu = 550 MPa (εu = 6%), andan elastic modulus of Es = 200 GPa were assumed.

CHALMERS, Civil and Environmental Engineering94
0.0
1.0
2.0
3.0
0.0 0.5 1.0 1.5 2.0 2.5
Crack opening, w , [mm]
Ten
sile
stre
ss[M
Pa] a 1=20
a 2=0.05
b 2=0.5
b 2=0.4533(drop constant & constant)
Figure 91. Investigated σ-w relationships (bi-linear, drop constant, and constant).
The results of this analysis can be seen in Figure 92 and Figure 93. The simplerrelationships have only a small effect on the predicted load-carrying capacity, which ispartly due to the choice of the maximum crack opening, wc = 2mm. However, it has alarge effect on the cracking stage, where a larger curvature and crack opening arepredicted: this can be seen in Figure 92(b), presenting the moment versus crackopening, and in Figure 93(a), presenting the moment versus normalised crack length.Moreover, using the constant or drop constant relationship will lead to anunderestimation of the flexural stiffness, as can be seen in Figure 93(b).
0
20
40
60
80
0 0.01 0.02 0.03 0.04
Curvature [1/m]
a 1=20
a 2=0.05
b 2=0.5
b 2=0.4533 (drop const)Mom
ent[
kNm
/m]
b 2=0.4533 (constant)
0.0
0.5
1.0
1.5
2.0
2.5
0.0 0.2 0.4 0.6 0.8 1.0
Crack opening, w , [mm]
a 1=20
a 2=0.05
b 2=0.5
b 2=0.4533 (drop const)
Nor
mal
ised
mom
ent(
M/M
cr)
[-]
b 2=0.4533 (constant)
(a) (b)Figure 92. Influence of the σ-w relationship on: (a) moment-curvature relationship;
and (b) normalised moment vs. crack opening.

CHALMERS, Civil and Environmental Engineering 95
0.0
0.5
1.0
1.5
2.0
2.5
0.0 0.2 0.4 0.6 0.8 1.0
Normalised crack length (a / h ) [-]
a 1=20
a 2=0.05
b 2=0.5
b 2=0.4533 (drop const)
Nor
mal
ised
mom
ent(
M/M
cr)
[-]
b 2=0.4533 (constant)0.0
0.5
1.0
1.5
2.0
2.5
0.0 0.2 0.4 0.6 0.8 1.0
Normalised flexural stiffness (EI / EI cr) [-]
a 1=20
a 2=0.05
b 2=0.5
(drop const) b 2=0.4533
Nor
mal
ised
mom
ent(
M/M
cr)
[-]
(constant) b 2=0.4533
(a) (b)Figure 93. Influence of the σ-w relationship on: (a) normalised moment vs.
normalised crack length; and (b) normalised moment vs. normalisedflexural stiffness.
5.3.4 Effect of normal force
In many structural applications a design situation with only bending moment acting on amember is not realistic, as normal forces often act simultaneously with bendingmoment. A situation where this may arise is in suspended floor slabs in buildings withstabilising units, which may restrain any shrinkage or thermal dilatation from occurringand thus generating forces. A compressive force, on the other hand, has a positiveinfluence as it balances the bending moment and makes it possible to reduce the amountof reinforcement or fibres. A typical structural application where this situation arises isin concrete walls (e.g. basement walls with earth pressure). To instigate this, someanalyses were conducted, assuming the same geometry and reinforcement ratio as in theexample above (see Figure 83), for a concrete with the following properties: tensilestrength ft = 3.0 MPa, compressive strength fc = 40 MPa, and modulus of elasticity Ec =30 GPa. For the reinforcement a yield stress fy = 500 MPa, a tensile strength fu = 550MPa (εu = 6%), and an elastic modulus of Es = 200 GPa were assumed. Furthermore, theFRC was simulated by a bi-linear stress-crack opening relationship in tension(according to Figure 87) with the following parameters: a1 = 20 mm-1, a2 = 0.05 mm-1,and b2 = 0.5.
The normal forces were given the following values:
in tension N = 0.1 ft × h × b and N = 0.3 ft × h × b;
and in compression N = -0.1 ft × h × b and N = -0.3 ft × h × b.
The results from these analyses are presented in Figure 94 and Figure 95. As can beseen in Figure 94(a), a compressive force leads to increased moment resistance, whichincreases with the magnitude, while a tensile force leads to reduced moment resistance,and the reduction becomes larger as the magnitude increases. In Figure 94(b) the effecton the crack opening can be seen, and here the normal force has a similar influence. InFigure 95(a) it is interesting to see the effect that the normal force has on the crackpropagation, which for a tensile normal force grows rapidly once cracking has beeninitiated. This also has an effect on the flexural stiffness, as can be seen in Figure 95(b).

CHALMERS, Civil and Environmental Engineering96
0
20
40
60
80
100
0 0.01 0.02 0.03 0.04
Curvature [1/m]
Mom
ent[
kNm
/m]
N = 0.3
N = 0.1
N = -0.1
N = -0.3
0
20
40
60
80
100
0.0 0.2 0.4 0.6 0.8 1.0
Crack opening, w , [mm]
Mom
ent[
kNm
/m]
N = 0.3
N = 0.1
N = -0.1
N = -0.3
(a) (b)Figure 94. Effect of normal force on: (a) moment-curvature relationship; and (b)
moment vs. crack opening.
0
20
40
60
80
100
0.0 0.2 0.4 0.6 0.8 1.0
Normalised crack length, a / h , [-]
Mom
ent[
kNm
/m]
N = 0.3
N = 0.1
N = -0.1
N = -0.3
0
20
40
60
80
100
0.0 0.2 0.4 0.6 0.8 1.0
Normalised flexural stiffness, EI / EI cr, [-]
Mom
ent[
kNm
/m]
N = 0.3
N = 0.1
N = -0.1
N = -0.3
(a) (b)Figure 95. Effect of normal force on: (a) moment vs. normalised crack length; and
(b) moment vs. normalised flexural stiffness.
5.3.5 Comparison of conventional RC- and FRC-members
One of the incentives for fibre-reinforced concrete, which has been brought up, is thepossibility to reduce the amount of conventional reinforcement. In Figure 96 and Figure97 a comparison is made between a slab (having a geometry according to Figure 83)with conventional concrete and with fibre-reinforced concrete. In the analyses, theamount of reinforcement was chosen so that the slabs provided the same momentresistance, and two different cases were investigated: reinforcement with yield strengthof either 500 or 600 MPa. For the concrete, the following properties were used: tensilestrength ft = 2.5 MPa, compressive strength fc = 38 MPa, and modulus of elasticityEc = 30 GPa. The slab with conventional concrete was analysed by considering thefracture energy, GF. For the FRC, the following properties were used: a1 = 10 mm-1,a2 = 0.033 mm-1, and b2 = 0.5.
As can be seen in Figure 96, the main differences between the conventional slab and theFRC slab are the increased moment resistance and stiffness during the crackpropagation stage (the service state) as well as significantly smaller crack widths (seeFigure 96). It can be seen that after crack initiation, the crack propagates fast in the

CHALMERS, Civil and Environmental Engineering 97
conventional concrete (Figure 97(a)), to a height of 0.7 compared with 0.5 for the FRC.Moreover, the flexural stiffness is larger for the FRC member, which would lead to lessdeflection for a fibre-reinforced member; see Figure 97(b). Using reinforcement withhigher yield stress seems to be a good option for a FRC (as long as the fibre content issufficient) while for a plain concrete it leads to increased crack widths. In conclusion, itappears that with the fibre-reinforced concrete investigated in this example, withb2 = 0.5, it was possible to reduce the conventional reinforcement to half the amountneeded with a plain concrete. The properties of the FRC used in the analyses can becompared with the results in Chapter 4 where b2 = 0.5 roughly corresponded to 40kg/m3.
0
10
20
30
40
50
60
70
0 0.005 0.01 0.015 0.02 0.025
Curvature [1/m]
ρ =0.18%, fy=600
ρ =0.08%, f y=600
ρ =0.1%, f y=500
ρ =0.22%, fy=500
RC: G F=75
FRC: b 2 =0.5
Mom
ent[
kNm
/m]
0.0
0.5
1.0
1.5
2.0
2.5
0.0 0.2 0.4 0.6 0.8
Crack opening, w , [mm]
Nor
mal
ised
mom
ent(
M/M
cr)
[-]
ρ =0.1%, fy=500
FRC: b 2 =0.5
ρ =0.08%, fy=600
ρ =0.22%, fy=500
RC: G F=75
ρ =0.18%, fy=600
(a) (b)Figure 96. Comparison of reinforced FRC and plain concrete (RC): (a) moment vs.
curvature and (b) moment vs. crack opening.
0.0
0.5
1.0
1.5
2.0
2.5
0.0 0.2 0.4 0.6 0.8 1.0
Normalised crack length (a / h ) [-]
ρ =0.1%, fy=500FRC: b 2 =0.5
ρ =0.08%, fy=600
ρ =0.22%, fy=500
RC: G F=75
ρ =0.18%, fy=600
Nor
mal
ised
mom
ent(
M/M
cr)
[-]
0.0
0.5
1.0
1.5
2.0
2.5
0.0 0.2 0.4 0.6 0.8 1.0
Normalised flexural stifness (EI / EI cr) [-]
ρ =0.1%, f y=500
ρ =0.08%, f y=600
FRC: b 2 =0.5
ρ =0.22%, f y=500
RC: G F=75
ρ =0.18%, f y=600
Nor
mal
ised
mom
ent(
M/M
cr)
[-]
(a) (b)Figure 97. Comparison of reinforced FRC and plain concrete (RC): (a) moment vs.
normalised crack length and (b) moment vs. normalised crack length.

CHALMERS, Civil and Environmental Engineering98
5.4 Concluding remarks
A fracture-mechanics-based analysis model was presented, which is based on thefictitious crack model (see Hillerborg et al., 1976) and the non-linear hinge concept.With this simplified analytical model it is possible to analyse the flexural behaviour andto investigate how the shape of the σ-w relationship, the material properties of theconcrete, the yield strength of the reinforcement, the reinforcement ratio, and a normalforce influence flexural behaviour. A comparison was made between conventional RCmembers and FRC members; the main differences were found to be the increasedstiffness during the initial crack propagation and significantly reduced crack widths.Moreover, it was shown that with fibres it is possible to significantly reduce the amountof conventional reinforcement compared to a conventional concrete (to half the amountin the considered case) and, at the same time, improve the structural performance(reduced crack widths and increased flexural stiffness). When comparing the analyticalmodel with finite element analyses (based on non-linear fracture mechanics) it wasfound that the behaviour was predicted with fairly good agreement.
It was shown that the shape of the σ-w relationship not only influences the maximummoment, but also that the crack propagation stage is highly influenced. A consequenceis that, if a highly simplified/idealised σ-w relationship is used (e.g. a drop constant), itwill not be possible to accurately predict the service behaviour (crack widths andflexural stiffness) – but fortunately, the predicted load resistance is not as sensitive tothis choice. Furthermore, a parametric investigation using a bi-linear stress-crackopening relationship was conducted, and from this it can be concluded that:
The slope of the first part of the stress-crack opening relationship, a1, mainlyinfluences the crack propagation stage. This corresponds to the serviceabilitylimit state.
The slope of the second part of the stress-crack opening relationship, a2, mainlyinfluences the shape of the moment-curvature relationship after the peakmoment is reached. For higher values of a2 (corresponding to short fibres,fibres breaking, or fibres with a poor pull-out behaviour) the maximummoment is reached early and decreases with increased curvature. This is not apreferred behaviour for continuous members where moment redistributiontakes place.
The parameter b2 (related to the volume fraction and efficiency of the fibres)influences the moment level, i.e. a higher value leads to a higher momentresistance. However, for high values it leads to an almost elastic plasticbehaviour.

CHALMERS, Civil and Environmental Engineering 99
6 Structural applications
6.1 Fracture behaviour of reinforced FRC beams
Full-scale experiments were conducted on reinforced concrete members made of self-compacting fibre-reinforced concrete, having only a small amount of conventionalreinforcement. The post-cracking behaviour of the steel fibre-reinforced concrete wasdetermined through inverse analysis of results from wedge-splitting tests (WST). Usingthe results from these experiments, the capabilities of the fracture-mechanics-basedapproaches, presented in Chapters 4 and 5, for material testing and structural analysiscould be investigated. To briefly summarise and explain the approach, it can be said toconsist of the following steps:
Material testing, i.e. standard compressive strength test together with wedge-splitting tests (WST) to determine the tensile post-cracking behaviour of thesteel fibre-reinforced concrete.
Inverse analysis for interpreting the test results from the WST (i.e. splittingload vs. CMOD curves) as a σ-w relationship (outlined in Section 4.2.2).
Adjustment of the σ-w relationship by considering the differences in fibreefficiency factor between the WST specimens and the beams (outlined inSection 4.2.3).Cross-sectional analyses of the beams, using the non-linear hinge model, toobtain relationships between moment and curvature and between moment andcrack opening.
Structural analyses to predict the structural behaviour. For this purpose, thefinite element method can be used, but the response can also be predicted byusing the results from the cross-sectional analyses where the displacement isobtained by integrating the curvature.
The approach and the steps are schematically illustrated in Figure 98.

CHALMERS, Civil and Environmental Engineering100
Figure 98. Approach for structural design and analysis of fibre-reinforced concrete.
6.1.1 Full-sale experiments
The experimental programme consists of four series of slab strip elements, in totaltwelve, having identical rectangular cross-sections of 750 × 250 mm2 (width × height)and a span length of 3750 mm. A complete description of the test programme can befound in Paper VI and its main parameters are summarised in Table 11. Four differentfibre types were used and their properties are specified in Table 12. The concretes usedin this study were all self-compacting fibre-reinforced concretes with a slump flow of500 to 550 mm (550 to 600 mm without fibres). The mix design and its constituents,used in this study, represent commonly used materials and compositions of self-compacting concrete (SCC) in Sweden and the mix compositions can be found in PaperVI. The fibre dosage and type for each mix can also be seen in Table 11 and Table 12.When comparing the mixes, the main difference between Mixes 1 and 2 is the fibrevolume fraction, while the main difference between Mixes 2 and 3 is the type of fibre.

CHALMERS, Civil and Environmental Engineering 101
The fibres for Mixes 1 and 2 were standard fibres, but in Mix 3 the majority of thefibres were high-performance fibres (i.e. high aspect ratio and tensile strength).However, Mix 4 is slightly different in that one third of the fibres were steel microfibresand, to improve the bond of these fibres, the amount of silica fume was increased.Furthermore, to achieve a compressive and tensile strength comparable to the othermixes, entrained air was used. All the concrete was produced by a ready-mix producer(AB Färdig Betong) in batches of 4 m3 or 2 m3 using a central drum mixer with acapacity of 6 m3.
Table 11. Summary of test program
Specimen Concrete Steel fibres Reinforcement (welded wire mesh)Dosage (%) & Type
(see Table 12)φ – Spacing
[mm]Nom. yield
strengthρ
[%]S1:1 6-150/700 Mix 1 0.25 type 1 & 2 φ 6 - s 150 NPS 700 0.075S1:2 7-150/700 Mix 1 0.25 type 1 & 2 φ 7 - s 150 NPS 700 0.103S1:3 7-150/500 Mix 1 0.25 type 1 & 2 φ 7 - s 150 NPS 500 0.103S1:4 6-100/500 Mix 1 0.25 type 1 & 2 φ 6 - s 100 NPS 500 0.121S2:1 6-150/700 Mix 2 0.5 type 1 & 0.25 type 2 φ 6 - s 150 NPS 700 0.075S2:2 7-150/700 Mix 2 0.5 type 1 & 0.25 type 2 φ 7 - s 150 NPS 700 0.103S2:3 7-150/500 Mix 2 0.5 type 1 & 0.25 type 2 φ 7 - s 150 NPS 500 0.103S2:4 6-100/500 Mix 2 0.5 type 1 & 0.25 type 2 φ 6 - s 100 NPS 500 0.121S3:1 6-150/700 Mix 3 0.5 type 3 & 0.25 type 1 φ 6 - s 150 NPS 700 0.075S3:2 7-150/700 Mix 3 0.5 type 3 & 0.25 type 1 φ 7 - s 150 NPS 700 0.103S4:1 6-150/700 Mix 4 0.25 type 2, 3, & 4 φ 6 - s 150 NPS 700 0.075S4:2 7-150/700 Mix 4 0.25 type 2, 3, & 4 φ 7 - s 150 NPS 700 0.103
Table 12. Fibre specification.
Fibre type Supplier Brandname
Aspectratio
Length[mm]
Diameter[mm]
Configuration Strength[MPa]
1: RC 65/35 BN Bekaert Dramix® 64 35 0.55 Hooked ends 1 1002: RC 65/60 BN Bekaert Dramix® 67 60 0.90 Hooked ends 1 1003: RC 80/35 BP Bekaert Dramix® 78 35 0.45 Hooked ends 2 3004: OL 13/0.16 Bekaert 81 13 0.16 Straight
(Brass coated)2 000
The slab strips were simply supported (rollers at both ends) with a span of 3750 mm andsubjected to a four-point load, according to Figure 99, with a distance between the loadsof 1250 mm. The tests were conducted with deflection control (at a rate of approx. 0.2mm/min), and during the tests the following parameters were measured: load,deflections and support settlements, and at two points the width and height of a crack.The deflection was measured at mid-span and at four additional points between theloads; at all measuring points, two displacement transducers were used (see Figure 99).

CHALMERS, Civil and Environmental Engineering102
3750
4050
1250
CL
250 250250 250Displacementtransducer
b=750
h=25
0
d=22
5
SECTION A-AELEVATION
A
A
Wire mesh
125Displacementtransducer
1250 1250
Roller Roller
Figure 99. Schematic picture of test set-up, with indication of the points of deflectionmeasurements, and details of the slab strips (units: mm).
The load versus deflection and moment versus crack opening curves obtained from thetests can be seen in Paper VI. The initial response before cracking was almostindependent of the type of mix and type of reinforcement. After the formation of cracks,all the beams exhibited a non-linear load vs. deflection characteristic. The peak-load andpost-peak behaviour was determined by a single crack, which continued to grow whilethe other cracks closed. The final failure was caused by rupture of the reinforcement.The higher fibre dosage for Mixes 2 to 4 leads to a stiffer behaviour after cracking, toincreased peak load, and to a larger deflection at the peak load. Comparing the differentmixes, Mix 4 resulted in the highest increase in the peak load but, as the mix containedsome short fibres, it showed a less ductile behaviour than Mix 3. In the figurespresented in Paper VI, it can be observed that the crack width depends on the type andamount of reinforcement as well as on the efficiency of the fibres. Generally, at the peakload the measured crack width was between 0.4 and 0.8 mm, which coincided with thepeak of the ascending part of the σ-w relationship (see Figure 115). Furthermore, in thetests the primary flexural cracks had a spacing equal to the welded mesh spacing; seeFigure 100.
(a) (b)
(c) (d)Figure 100. Photos of crack patterns for some of the tested beams (reinforcement φ7-
s150 NPS 700): (a) Mix 1 – S1:1 7-150/700; (b) Mix 2 – S2:1 7-150/700;(c) Mix 3 – S3:1 7-150/700; and (d) Mix 4 – S4:1 7-150/700.

CHALMERS, Civil and Environmental Engineering 103
6.1.2 Fibre quantity and distribution in specimens
The fibre quantity and distribution were investigated for Mixes 1 and 2 by performingwash-out tests of the fresh concrete and by taking out cores from the slab specimens.
The wash-out tests were performed on the concrete used for measuring the air content,which means that one sample was made and that it had a volume of 8 litres. For Mix 1the measured fibre quantity was 35.3 kg/m3 (with C 65/35 18.6 kg/m3 and RC 65/6016.7 kg/m3) and for Mix 2 it was 50.3 kg/m3 (with C 65/35 33.4 kg/m3 and RC 65/6016.9 kg/m3). Hence, based on this spot test it seems that the fibre quantity was slightlylower than the nominal dosage, about 90% for Mix 1 and 85% for Mix 2. However,only one sample was taken for each mix and, as the variation is usually quite large, it isnot possible to state the quantity based on this.
After the slab specimens had been tested, cores were taken out in order to investigatethe distribution of fibres within the specimens. The cores were taken out at the end ofthe specimens (approximately 500 to 750 mm from the ends) and these were cut intothree pieces and their volume was determined; after that they were crushed and theweight of the fibres was determined. The result of the fibre distribution for Mixes 1 and2 can be seen in Figure 101. For Mix 1 the average fibre content was 45.2 kg/m3 (CoV8.4%) and for Mix 2 it was 61.8 kg/m3 (CoV 4.4%). It can be observed that for Mix 1the distribution is fairly even over the height; see Figure 101(a), but that one specimenhas a significantly higher fibre quantity (S1:4 6-100/500). It should be noted thatspecimen S1:4 6-100/500 was the first specimen to be cast and the concrete was notentirely homogeneous (containing more aggregates) and did not flow as well as it didfor the other specimens. For Mix 2 there appears to be a little segregation, especially forone of the cores (specimen S2:2 7-150/700); see Figure 101(b). Mix 2 had a slightlyhigher superplasticizer dosage and, as a result, had a higher flowability and a loweryield stress. Moreover, it can be seen that there appear to be more fibres than thenominal dosage (for Mix 1 it was 39.3 and for Mix 2 it was 58.9 kg/m3).
Hence, there seems to be some contradiction between the wash-out tests and the cores;the wash-out tests indicate a lower fibre quantity while the cores indicate a higher fibrequantity than the nominal dosage. However, a possible explanation for some of thisdifference for the cores could be that, in the mix design, the air content was assumed tobe much higher than was actually measured (5.5% as compared to 2.6-2.8%), whichmay explain a difference of about 1.2 kg for Mix 1 and 1.8 kg for Mix 2. It is alsopossible that the air content was further reduced when casting the slabs. However, thiscan only explain a part of the difference.

CHALMERS, Civil and Environmental Engineering104
0
83
167
250
30 40 50 60
Amount of fibres [kg/m3]
S1:1 6-150/700S1:2 7-150/700S1:2 7-150/700S1:3 7-150/500S1:4 6-100/500Average Mix 1
Dis
tanc
efr
ombo
ttom
ofsl
ab[m
m]
Mix 1
0
83
167
250
40 50 60 70 80
Amount of fibres [kg/m3]
S2:1 6-150/700S2:1 6-150/700S2:2 7-150/700S2:3 7-150/500S2:4 6-100/500Average Mix 2
Dis
tanc
efr
ombo
ttom
ofsl
ab[m
m] Mix 2
(a) (b)Figure 101. Distribution of fibres in the elements: (a) for Mix 1 and (b) for Mix 2.
6.1.3 Materials testing
The compressive strength of the fibre-reinforced concrete was determined by testing thecompressive strength, which was determined at 7 and 28 days on water-cured cubespecimens (150×150×150 mm3); it was also measured on cylinder specimens (φ =150 mm and h = 300 mm). The cylinder specimens were tested at the same time as thefull-scale tests were performed (at 50 to 55 days) and the cylinders were cured (underplastic cover) together with the slab strip elements. The modulus of elasticity wasdetermined from three cylinders for each mix; two strain gauges were attached and thestrain was measured at a stress level of 0.45×fcc. The results from the compressivestrength tests are listed in Table 13.
Table 13. Properties of the concrete.
MixDensity[kg/m3]
fc.cube 7d
[MPa]fc.cube 28d
[MPa]fc.cyl
[MPa]Eci
[GPa]Mix 1 2 330 39.2 52.4 55.4 32.7Mix 2 2 344 41.7 54.3 57.4 33.1Mix 3 2 384 42.5 54.9 54.3 31.7Mix 4 2 353 38.6 55.1 55.5 31.3
The tensile fracture behaviour of the fibre-reinforced concretes was determined byconducting wedge-splitting tests (WST), using six specimens (for each mix) having ageometry according to Figure 102. The results from these tests can be seen in Figure103, which shows the load versus CMOD and the dissipated energy versus CMOD, andin Figure 104, presenting the scatter in the test results. When examining the results, thefollowing observations can be made: (1) Mix 1 has, as expected, the lowest energydissipation and the largest scatter; (2) Mix 2 performs less well than the other mixeswith the same amount of fibres, having only a slightly higher energy dissipation thanMix 1 (but the peak splitting load is higher); and (3) there are only minor differencesbetween Mixes 3 and 4, but Mix 4 has less scatter. For Mix 2, fibre fracture isresponsible for the large decrease in the splitting load after the peak load, which alsoresulted in increased scatter for the load (for CMOD > 4 mm). The cause of thisbehaviour is that the bond between the fibre and the matrix was too good for these fibres

CHALMERS, Civil and Environmental Engineering 105
(the fibres used had a strength of 1100 MPa). In the other three mixes, fibres with ahigher strength were used for the majority of fibres.
Figure 102. Specimen geometry used in the experiments.
0
2 000
4 000
6 000
8 000
10 000
0 2 4 6 8 10
CMOD [mm]
Mix1
Mix2
Mix3
Mix4
Spli
ttin
gL
oad
[N]
0
2 000
4 000
6 000
8 000
0 2 4 6 8 10
CMOD [mm]
Mix1
Mix2
Mix3
Mix4D
issi
pate
dE
nerg
y[N
m/m
2]
(a) (b)Figure 103. Comparison of test results from the WST: (a) average splitting load vs.
CMOD curves and (b) the dissipated energy.
0%
5%
10%
15%
20%
25%
0 2 4 6 8 10
CMOD [mm]
Mix1 Mix2
Mix3
Mix4
CoV
forS
plit
ting
Loa
d[%
]
0%
5%
10%
15%
20%
25%
0 2 4 6 8 10
CMOD [mm]
Mix1
Mix2
Mix4
Mix3
CoV
forD
issi
pate
dE
nerg
y[%
]
(a) (b)Figure 104. Comparison of the scatter in the results from the WST: (a) the splitting
load and (b) the dissipated energy.

CHALMERS, Civil and Environmental Engineering106
6.1.4 Inverse analysis
Using the approaches presented in Paper V, inverse analyses were conducted by usingthe finite element program DIANA (see TNO 2002) with a poly-linear relationship, andthrough use of a Matlab® program where a bi-linear relationship can be determined. TheMatlab® program was developed at DTU by Østergaard (2003) and is based on thecracked hinge model by Olesen (2001); see Østergaard and Olesen (2004). In thesewedge-splitting tests, the response was determined to be a CMOD of 10 mm. Followingthe recommendations provided in Paper V, it is reasonable that the σ-w relationship canbe determined up to a crack opening of w = 2.5 mm.
The results from the inverse analysis using DIANA and a poly-linear relationship arepresented in Figure 105 to Figure 108, which show a comparison between theexperimentally obtained curves and the inverse analysis; in the figures, the ratiobetween the experiment and analysis is shown (on the second y-axis). Furthermore, boththe measured splitting load and the calculated energy dissipation are accounted for. Ascan be seen in these figures, the agreement between experiments and analyses is good –the deviation is less than 5% – and the dissipated energy can be fitted very accurately.
0
2 000
4 000
6 000
0 2 4 6 8 10
CMOD [mm]
Spl
ittin
gL
oad,
Fsp
,[N
]
0.95
1.00
1.05
Fsp
.Inv
/Fsp
.Exp
[-]
F sp.Inv / F sp.Exp
Mix 1 (FEA)
0
1 000
2 000
3 000
4 000
5 000
0 2 4 6 8 10
CMOD [mm]
0.95
1.00
1.05
Gf.
Inv
/Gf.
Exp
[-]
Mix 1 (FEA)
G f.Inv / G f.Exp
Dis
sipa
ted
eneg
y[N
m/m2 ]
(a) (b)Figure 105. Comparison of results from WST and inverse analysis for Mix 1: (a) the
splitting load and (b) the dissipated energy.
0
2 000
4 000
6 000
8 000
0 2 4 6 8 10
CMOD [mm]
Spl
ittin
gL
oad,
Fsp
,[N
]
0.95
1.00
1.05
Fsp
.Inv
/Fsp
.Exp
[-]
F sp.Inv / F sp.Exp
Mix 2 (FEA)
0
2 000
4 000
6 000
0 2 4 6 8 10
CMOD [mm]
0.95
1.00
1.05
Gf.
Inv
/Gf.
Exp
[-]
Mix 2 (FEA)
G f.Inv / G f.Exp
Dis
sipa
ted
eneg
y[N
m/m2 ]
(a) (b)Figure 106. Comparison of results from WST and inverse analysis for Mix 2: (a) the
splitting load and (b) the dissipated energy.

CHALMERS, Civil and Environmental Engineering 107
0
2 000
4 000
6 000
8 000
10 000
0 2 4 6 8 10
CMOD [mm]
Spl
ittin
gL
oad,
Fsp
,[N
]
0.95
1.00
1.05
Fsp
.Inv
/Fsp
.Exp
[-]
F sp.Inv / F sp.Exp
Mix 3 (FEA)
0
2 000
4 000
6 000
8 000
0 2 4 6 8 10
CMOD [mm]
0.95
1.00
1.05
Gf.
Inv
/Gf.
Exp
[-]
Mix 3 (FEA)
G f.Inv / G f.Exp
Dis
sipa
ted
eneg
y[N
m/m2 ]
(a) (b)Figure 107. Comparison of results from WST and inverse analysis for Mix 3: (a) the
splitting load and (b) the dissipated energy.
0
2 000
4 000
6 000
8 000
10 000
0 2 4 6 8 10
CMOD [mm]
Spl
ittin
gL
oad,
Fsp
,[N
]
0.95
1.00
1.05F
sp.I
nv/F
sp.E
xp[-
]
F sp.Inv / F sp.Exp
Mix 4 (FEA)
0
2 000
4 000
6 000
8 000
0 2 4 6 8 10
CMOD [mm]
0.95
1.00
1.05
GFf
.Inv
/Gf.
Exp
[-]
Mix 4 (FEA)
G f.Inv / G f.Exp
Dis
sipa
ted
eneg
y[N
m/m2
]
(a) (b)Figure 108. Comparison of results from WST and inverse analysis for Mix 4: (a) the
splitting load and (b) the dissipated energy.
The results from the inverse analysis using the Matlab® program and a bi-linearrelationship are presented in Figure 109 to Figure 112, which show a comparisonbetween the experimentally obtained curves and the inverse analysis; in these figurestoo, the ratio between the experiment and analysis is shown (on the second y-axis).Furthermore, both the measured splitting-load and the calculated energy dissipation areaccounted for. As can be seen in these figures, the agreement between experiments andanalyses is not as good as for the poly-linear relationship – the deviation is higher than5% – but the dissipated energy can be fitted with sufficient accuracy.

CHALMERS, Civil and Environmental Engineering108
0
2 000
4 000
6 000
0 2 4 6 8 10
CMOD [mm]
Spl
ittin
gL
oad,
Fsp
,[N
]
0.90
0.95
1.00
1.05
1.10
Fsp
.Inv
/Fsp
.Exp
[-]
F sp.Inv / F sp.Exp
Mix 1 (Bi-lin)
0
1 000
2 000
3 000
4 000
5 000
0 2 4 6 8 10
CMOD [mm]
0.95
1.00
1.05
Gf.
Inv
/Gf.
Exp
[-]
Mix 1 (Bi-lin)
G f.Inv / G f.ExpDis
sipa
ted
eneg
y[N
m/m2
]
(a) (b)Figure 109. Comparison of results from WST and inverse analysis for Mix 1: (a) the
splitting load and (b) the dissipated energy.
0
2 000
4 000
6 000
8 000
0 2 4 6 8 10
CMOD [mm]
Spl
ittin
gL
oad,
Fsp
,[N
]
0.90
0.95
1.00
1.05
1.10F
sp.I
nv/F
sp.E
xp[-
]
F sp.Inv / F sp.Exp
Mix 2 (Bi-lin)
0
2 000
4 000
6 000
0 2 4 6 8 10
CMOD [mm]
0.95
1.00
1.05
Gf.
Inv
/Gf.
Exp
[-]
Mix 2 (Bi-lin)
G f.Inv / G f.Exp
Dis
sipa
ted
eneg
y[N
m/m2 ]
(a) (b)Figure 110. Comparison of results from WST and inverse analysis for Mix 2: (a) the
splitting load and (b) the dissipated energy.
0
2 000
4 000
6 000
8 000
10 000
0 2 4 6 8 10
CMOD [mm]
Spl
ittin
gL
oad,
Fsp
,[N
]
0.90
0.95
1.00
1.05
1.10
Fsp
.Inv
/Fsp
.Exp
[-]
F sp.Inv / F sp.Exp
Mix 3 (Bi-lin)
0
2 000
4 000
6 000
8 000
0 2 4 6 8 10
CMOD [mm]
0.95
1.00
1.05G
f.In
v/G
f.E
xp[-
]Mix 3 (Bi-lin)
G f.Inv / G f.Exp
Dis
sipa
ted
eneg
y[N
m/m2 ]
(a) (b)Figure 111. Comparison of results from WST and inverse analysis for Mix 3: (a) the
splitting load and (b) the dissipated energy.

CHALMERS, Civil and Environmental Engineering 109
0
2 000
4 000
6 000
8 000
10 000
0 2 4 6 8 10
CMOD [mm]
Spl
ittin
gL
oad,
Fsp
,[N
]
0.90
0.95
1.00
1.05
1.10
Fsp
.Inv
/Fsp
.Exp
[-]
F sp.Inv / F sp.Exp
Mix 4 (Bi-lin)
0
2 000
4 000
6 000
8 000
0 2 4 6 8 10
CMOD [mm]
0.95
1.00
1.05
Gf.
Inv
/Gf.
Exp
[-]
Mix 4 (Bi-lin)
G f.Inv / G f.ExpDis
sipa
ted
eneg
y[N
m/m2
]
(a) (b)Figure 112. Comparison of results from WST and inverse analysis for Mix 4: (a) the
splitting load and (b) the dissipated energy.
The tensile strength and the stress-crack opening relationship were determined byconducting inverse analysis using the results from the wedge-splitting tests, and theresults are presented in Table 14 and Figure 113.
Table 14. Estimated tensile strength of the concrete.
Mix fct.FEA
[MPa]fct.Bi-lin
[MPa]Mix 1 3.3 3.2Mix 2 3.3 3.6Mix 3 3.3 3.8Mix 4 3.3 3.8
0.0
1.0
2.0
3.0
4.0
0.0 0.5 1.0 1.5 2.0 2.5
Crack opening [mm]
Ten
sile
stre
ss[M
Pa]
Mix3
Mix1Mix2
Mix4
0.0
1.0
2.0
3.0
4.0
0.0 0.5 1.0 1.5 2.0 2.5
Crack opening [mm]
Ten
sile
stre
ss[M
Pa]
Mix3
Mix1Mix2
Mix4
(a) (b)Figure 113. The σ-w relationships for WST specimens determined by inverse analysis:
(a) the multi-linear relationship and (b) the bi-linear relationship.

CHALMERS, Civil and Environmental Engineering110
6.1.5 Adjustment of the σσσσ-w relationship for fibre efficiency
As pointed out in Chapter 4, it is imperative that the σ-w relationship be adjusted forany differences in fibre efficiency between the material test specimen and the elementwhere the material is to be used. Hence, the approach suggested in Chapter 4 was used;all the fibres were counted in the fractured specimens and the experimental fibreefficiency factor, ηb.exp, was determined, which is presented in Figure 114 together witha figure showing the scatter. The fibre efficiency factor for the slab strip elements wasdetermined by considering the dimensions and the fibre geometry and nominal dosage;for this purpose an approach suggested by Dupont and Vandewalle (2005) was used.Following this approach, the factor was calculated to be ηb.slab = 0.52, and it can be seenin Figure 114 together with the WST specimens. Evidently the WST specimens in allmixes had a higher value, thus indicating more fibres being pulled out. For the slab stripelements, the dimensions (in relation to the length of the fibres) are such that the fibreorientation is close to, but slightly higher than, the random 3-D orientation.
0.60
0.52 0.52 0.52
0.59
0.63
0.550.52
0.45
0.50
0.55
0.60
0.65
Mix1 Mix2 Mix3 Mix4
Fibr
eef
fici
ency
fact
or, η
b.ex
p ,[-
]
η b.2D = 0.64
η b.3D = 0.5
WST
Slab strip
12.4%
6.6%
11.2%
4.3%
0%
5%
10%
15%
20%
Mix1 Mix2 Mix3 Mix4
CO
Vη
b.ex
p[%
]
(a) (b)Figure 114. (a) The average experimental fibre efficiency factor for the WST
specimens (at right) compared to the theoretical value for the slab strips(at left) and random 2D- and 3D-orientation. (b) The coefficient ofvariance for the fibre efficiency factor.
To account for the differences in fibre efficiency factor between the WST specimensand the slab strip elements, the stress-crack opening relationship obtained from theinverse analyses (see Figure 113) was reduced by the ratio between the two fibreefficiency factors, according to:
( ) ( )exp.
.exp..
b
slabbbslabb ww
ηη
σσ ⋅=
The adjusted σ-w relationship is presented in Figure 115. Comparing the differentmixes, it can be seen that Mix 1, with the low dosage, has the lowest stress level aftercracking. Furthermore, when comparing Mixes 2 to 4 (which had the same dosage) itcan be observed that Mix 2 does not perform as well as the other two mixes, and that at0.5 mm the stress descends more rapidly (due to fibre fracture). Comparing Mixes 3 and4, they have almost the same behaviour but Mix 4 is more effective for crack openingssmaller than 0.2 mm. The main difference between these mixes is the type of fibres thatwere used, but for Mix 4 a small modification of the mix composition was also made. InMixes 1 and 2, a standard fibre was used (having an aspect ratio of about 65 and a

CHALMERS, Civil and Environmental Engineering 111
tensile strength of 1100 MPa), while in Mix 3 a high-performance fibre (having anaspect ratio of about 80 and a tensile strength of 2300 MPa) was used in combinationwith a small amount (1/3 of the total amount) of the standard fibre. Moreover, in Mix 4steel microfibres were used in combination with two other fibre types, and the mixcomposition had been slightly adjusted by increasing the silica fume dosage and addingan air entertainer. See Table 12 for a full specification of the fibres, and Paper VI for themix composition.
0.0
1.0
2.0
3.0
4.0
0.0 0.5 1.0 1.5 2.0
Crack opening [mm]
Ten
sile
stre
ss[M
Pa]
Mix3
Mix1Mix2
Materials test spec. => StructureAdjusted for fibre efficiency
Mix4
0.0
1.0
2.0
3.0
4.0
0.0 0.1 0.2 0.3 0.4 0.5
Crack opening [mm]T
ensi
lest
ress
[MPa
]
Mix2
Mix1Mix3
Materials test spec. => StructureAdjusted for fibre efficiency
Mix4
(a) (b)Figure 115. σ-w relationships adjusted for fibre efficiency: (a) the complete
relationship and (b) for small crack openings.
6.1.6 Analysis of experiments
To achieve a deeper understanding of the structural and fracture behaviour, non-linearfracture mechanics was applied, using the finite element method. The general finiteelement program Diana was used in all analyses; see TNO (2002). The concrete wasmodelled with four-node quadrilateral isoparametric plane stress elements, with anelement size of 12.5 mm (20 elements over the height of the section). For thereinforcement, two different approaches were investigated (for some of the elements):with truss elements, where the interaction between the reinforcement and the concretewas modelled by using special interface elements describing the bond-slip relation; andwith the concept of ‘embedded’ reinforcement (see TNO, 2002). For the case where thebond-slip was considered, its relationship was chosen according to CEB-FIP MC90 (seeCEB 1993), and confined concrete with good bond conditions was assumed. In addition,the analytical approach presented in Chapter 5 was used.
In all FE analyses of the experiments, a constitutive model based on non-linear fracturemechanics, using a rotating crack model based on total strain, was used for the concrete;see TNO (2002). For the case where the bond-slip was considered, the deformation ofone crack was smeared over a length corresponding to the size of the localised area. Thesize of the localised area was: for Mix 1 two elements (25 mm); for Mix 2 four elements(50 mm); and for Mixes 3 and 4 six elements (75 mm). For the case with ‘embedded’reinforcement, the deformation of one crack was smeared over the crack spacingobtained in the experiments, i.e. the spacing of the reinforcement mesh. For the tensionsoftening, the multi-linear curves obtained from inverse analysis were used; see Figure

CHALMERS, Civil and Environmental Engineering112
116 and Figure 117. Furthermore, the values used for compressive strength and modulusof elasticity were according to the values determined on the cylinders (see Table 14).The hardening in compression was described by the expression of Thorenfeldt et al.(1987). The constitutive behaviour of the welded-mesh steel was modelled by the VonMises yield criterion with associated flow and isotropic hardening. The values used forthe different welded meshes are shown in Table 15.
For the non-linear hinge model, the bi-linear σ-w relationships (determined throughinverse analyses) were used as well as tri-linear relationships; these can be seen inFigure 116 and Figure 117.
Table 15. Properties of the welded mesh reinforcement.
φ – Spacing[mm]
fy,nom
[MPa]fy,act
[MPa]fu
[MPa]εu
[%]Es
[GPa]φ 6 - s 150 700 743 856 6.4 193φ 7 - s 150 700 737 853 7.0 194φ 7 - s 150 500 555 690 5.1 194φ 6 - s 100 500 497 623 6.3 193
0.0
1.0
2.0
3.0
4.0
0.0 0.5 1.0 1.5 2.0
Crack opening [mm]
Mix1: Bi-lin
Ten
sile
stre
ss[M
Pa]
Mix1: Tri-lin
0.0
1.0
2.0
3.0
4.0
0.0 0.5 1.0 1.5 2.0
Crack opening [mm]
Mix2: Bi-lin
Ten
sile
stre
ss[M
Pa] Mix2: Tri-lin
(a) (b)Figure 116. Stress-crack opening relationships used in analysis (bi- and tri-linear):
(a) for Mix 1 and (b) for Mix 2.
0.0
1.0
2.0
3.0
4.0
0.0 0.5 1.0 1.5 2.0
Crack opening [mm]
Mix3: Tri-lin
Ten
sile
stre
ss[M
Pa]
Mix3: Bi-lin
0.0
1.0
2.0
3.0
4.0
0.0 0.5 1.0 1.5 2.0
Crack opening [mm]
Mix4: Tri-lin
Ten
sile
stre
ss[M
Pa]
Mix4: Bi-lin
(a) (b)Figure 117. Stress-crack opening relationships used in analysis (bi- and tri-linear):
(a) for Mix 3 and (b) for Mix 4.

CHALMERS, Civil and Environmental Engineering 113
Table 16 summarises the peak loads obtained in the experiments and the correspondingresults from the different models. Moreover, Figure 118 shows plots where theexperimental results have been plotted against model results. It appears that the peakload can be predicted fairly accurately, and there is a good correlation betweenexperimental and model results. The best agreement is achieved for the finite elementmodel. The analytical model seems also to give a reasonable agreement; however, itseems that better agreement is obtained by using the bi-linear relationship, as with thetri-linear relationship the peak load is somewhat overestimated. On the other hand, thebi-linear relationship has a slightly poorer correlation and the variation is larger.However, it should be pointed out that the adjustment of the σ-w relationship was doneby assuming the nominal fibre volume fraction, and not the measured content in thecores that were taken out from the slabs, as this result was not complete until after allthe analyses had been performed. The consequence of increased fibre content (if that isthe case) would have led to a slightly higher predicted peak load if it had beenconsidered.
Table 16. Comparison of maximum load from experiments and the analyses (thefinite element analyses and the non-linear model, using tri- and bi-linearrelationships).
SpecimenQExp.
[kN]QFEA
[kN]QTri-lin
[kN]QBi-lin
[kN]QFEA / QExp. QTri-lin / QExp. QBi-lin / QExp.
S1:1 6-150/700 -35.3 -36.6 -39.8 -37.6 1.04 1.13 1.06S1:2 7-150/700 -43.9 -44.6 -45.8 -43.7 1.02 1.04 1.00S1:3 7-150/500 -38.9 -39.1 -41.7 -39.0 1.01 1.07 1.00S1:4 6-100/500 -42.3 -41.5 -43.0 -40.1 0.98 1.02 0.95S2:1 6-150/700 -43.0 -43.9 -49.6 -46.8 1.02 1.15 1.09S2:2 7-150/700 -52.8 -55.0 -56.0 -52.8 1.04 1.06 1.00S2:3 7-150/500 -51.5 -51.3 -50.6 -47.6 1.00 0.98 0.92S2:4 6-100/500 -47.8 -49.6 -52.6 -49.2 1.04 1.10 1.03S3:1 6-150/700 -49.2 -50.2 -55.5 -46.9 1.02 1.13 0.95S3:2 7-150/700 -55.1 -55.2 -61.7 -52.7 1.00 1.12 0.96S4:1 6-150/700 -51.9 -52.0 -56.3 -53.5 1.00 1.08 1.05S4:2 7-150/700 -58.3 -57.6 -62.5 -59.5 0.99 1.07 1.04
Average:CoV [%]:
Correlation:
1.011.93%0.99
1.084.61%0.95
1.005.09%0.94
R2 = 0.982
-80
-60
-40
-20
0
-80-60-40-200
FE analyses
QE
xp.[k
N]
Q Model [kN]
R2
= 0.905
-80
-60
-40
-20
0
-80-60-40-200
Tri-linear
QE
xp.[k
N]
Q Model [kN]
R2
= 0.882
-80
-60
-40
-20
0
-80-60-40-200
Bi-linear
QE
xp.[k
N]
Q Model [kN]
(a) (b) (c)Figure 118. Comparison of maximum load from experiments and models: (a) for the
FE analyses using a poly-linear relationship; (b) for a tri-linear σ-wrelationship; and (c) for a bi-linear σ -w relationship.

CHALMERS, Civil and Environmental Engineering114
In Figure 119 and Figure 120, a comparison is made between the load versus deflectioncurves obtained in the experiments and the FE analyses. In general, in most casescompared with the experimental results, the FE models predict a stiffer response and itwas difficult to follow the post-peak response, as multiple cracking and localisedcrushing made the numerical solution unstable in several of the analyses. Also the non-linear hinge model predicted a stiffer response than the experimental results, as can beseen in Figure 121(a). The difference in the predicted peak load between the twomodelling approaches used in the FE analyses was generally small; see Figure 121(b).However, the FE model considering the bond-slip worked better for the specimens withthe low fibre content (Mix 1), where cracks localise with a crack spacing similar to theones observed in the experiments, than for the specimens with the high fibre content(Mixes 2 to 4) where cracking occurs over a large region and, as a result, the materialbehaviour in the form of the tensile stress–strain relationship had to be adjusted. On theother hand, the FE model with the ‘embedded’ reinforcement predicted the overallstructural behaviour well for all mixes, but it was not capable of providing a realisticcrack pattern (not even for the mixes with the low fibre content); see Figure 121(b).
-60
-40
-20
0
0 10 20 30 40 50
Mid-span deflection [mm]
Loa
d[k
N]
S1:1 6-150/700Mix 1 & 2
S2:1 6-150/700-60
-40
-20
0
0 10 20 30 40 50
Mid-span deflection [mm]
Loa
d[k
N]
S3:1 6-150/700
Mix 3 & 4
S4:1 6-150/700
(a) (b)Figure 119. Comparison of load vs. deflection for the FE analyses (thin lines
represent analysis): (a) for Mixes 1 & 2 and (b) for Mixes 3 & 4.
-60
-40
-20
0
0 10 20 30 40 50
Mid-span deflection [mm]
Loa
d[k
N]
S2:2 7-150/700
Mix 1 & 2
S1:2 7-150/700
-60
-40
-20
0
0 10 20 30 40 50
Mid-span deflection [mm]
Loa
d[k
N]
S3:2 7-150/700
Mix 3 & 4
S4:2 7-150/700
(a) (b)Figure 120. Comparison of load vs. deflection for the FE analyses (thin lines
represent analysis): (a) for Mixes 1 & 2 and (b) for Mixes 3 & 4.

CHALMERS, Civil and Environmental Engineering 115
-50
-40
-30
-20
-10
0
0 10 20 30 40
Mid-span deflection [mm]
Loa
d[k
N]
FE bond-slip
FE embeddedreinforcement
Analytical
Experiment
S1:2 7-150/700(Mix1)
Experiment
FE ‘bond-slip’
FE ‘embedded’
(a) (b)Figure 121. Comparison of experiments and analyses for specimen S1:2 7-150/700:
(a) the load vs. deflection curve and (b) crack pattern (the red or darkregions indicate cracked areas).
The measured deflections in experiments have been used to determine the averagecurvature in the region with constant moment. The curvature was determined bypiecewise fitting of circular arcs using the five points at which the deflections weremeasured; see e.g. Ooi and Ramsey (2003). The curvatures, from experiments andanalyses, are presented in Figure 122 and Figure 123 and it can be seen that this seemsto correspond reasonably. The measured and the calculated crack opening can be seen inFigure 124 to Figure 126 and when comparing these it seems to be quite goodagreement for most of the tested beams. Furthermore, the difference using a bi-linear orthe tri-linear relationship is rather small. However, it can also be seen that the momentversus curvature relationship demonstrates a softening behaviour, and that in manycases there is no distinct yield plateau, characteristic of conventional reinforce concrete;a similar observation was made by Pfyl (2003). To avoid this type of behaviour, twopossibilities exist: (1) the σ-w relationship should exhibit a negligible stress decreasebetween two critical crack openings (for the bi-linear relationship this translates to a lowa2 value); and (2) a reinforcement with a different hardening behaviour, e.g. a higherratio between the yield strength and the tensile strength, could be used.

CHALMERS, Civil and Environmental Engineering116
0
15
30
45
60
75
90
0.00 0.01 0.02 0.03 0.04
Curvature [1/m]
φ 6-s150, 700Mix1 & 2
S2:1 6-150/700
S1:1 6-150/700Mom
ent[
kNm
]
0
15
30
45
60
75
90
0.00 0.01 0.02 0.03 0.04
Curvature [1/m]
φ 6-s150, 700Mix3 & 4
S3:1 6-150/700
S4:1 6-150/700
Mom
ent[
kNm
]
(a) (b)Figure 122. Comparison of moment vs. curvature using the bi-linear σ-w relationship
and the analytical model (thin lines represent analysis): (a) for Mixes 1 &2 and (b) for Mixes 3 & 4.
0
15
30
45
60
75
90
0.00 0.01 0.02 0.03 0.04
Curvature [1/m]
φ 7-s150, 700Mix1 & 2
S1:2 7-150/700
S2:2 7-150/700
Mom
ent[
kNm
]
0
15
30
45
60
75
90
0.00 0.01 0.02 0.03 0.04
Curvature [1/m]
φ 7-s150, 700Mix3 & 4
S3:2 6-150/700
S4:2 6-150/700
Mom
ent[
kNm
]
(a) (b)Figure 123. Comparison of moment vs. curvature using the bi-linear σ-w relationship
and the analytical model (thin lines represent analysis): (a) for Mixes 1 &2 and (b) for Mixes 3 & 4.
0
15
30
45
60
75
90
0.0 0.2 0.4 0.6 0.8 1.0
Crack opening [mm]
Mix2
S2:2 7-150/700
S2:1 6-150/700
Mom
ent[
kNm
]
0
15
30
45
60
75
90
0.0 0.2 0.4 0.6 0.8 1.0
Crack opening [mm]
Mix2
S2:2 7-150/700
S2:1 6-150/700Mom
ent[
kNm
]
(a) (b)Figure 124. Comparison of moment vs. crack opening for the analytical model (Mix
2): (a) bi-linear σ-w relationship and (b) tri-linear σ-w relationship.

CHALMERS, Civil and Environmental Engineering 117
0
15
30
45
60
75
90
0.0 0.2 0.4 0.6 0.8 1.0
Crack opening [mm]
Mix3
S3:2 7-150/700
S3:1 6-150/700
Mom
ent[
kNm
]
0
15
30
45
60
75
90
0.0 0.2 0.4 0.6 0.8 1.0
Crack opening [mm]
Mix3
S3:2 7-150/700
S3:1 6-150/700
Mom
ent[
kNm
]
(a) (b)Figure 125. Comparison of moment vs. crack opening for the analytical model (Mix
3): (a) bi-linear σ-w relationship and (b) tri-linear σ-w relationship.
0
15
30
45
60
75
90
0.0 0.2 0.4 0.6 0.8 1.0
Crack opening [mm]
Mix4
S4:1 6-150/700
S4:2 7-150/700
Mom
ent[
kNm
]
0
15
30
45
60
75
90
0.0 0.2 0.4 0.6 0.8 1.0
Crack opening [mm]
Mix4
S4:1 6-150/700
S4:2 7-150/700M
omen
t[kN
m]
(a) (b)Figure 126. Comparison of moment vs. crack opening for the analytical model (Mix
4): (a) bi-linear σ-w relationship and (b) tri-linear σ-w relationship.
6.1.7 Concluding discussion
An approach for material testing and structural analyses, based on non-linear fracturemechanics, has been used to investigate the fracture behaviour of lightly reinforced FRCbeams. In general, with the fracture-mechanics-based approach it is possible todetermine the σ-w relationship and use this to predict the structural behaviour ofreinforced FRC beams; this was done with good agreement and correlation betweenexperiments and analyses. For the finite element analyses, the multi-linear σ-wrelationship resulted in good agreement between experiments and analyses.
For the FE analyses where slip was allowed between concrete and reinforcement, thecharacteristic length, used to transform the σ-w relationship into a tensile stress vs.strain relationship, had to be set to a width of several elements for a realistic predictionof cracks and peak load. For the non-linear hinge model, two different σ-w relationshipswere investigated, namely a bi-linear and a tri-linear relationship; the tri-linear σ-wrelationship resulted in a higher correlation and a smaller variation, but the peak loadwas slightly overestimated. The bi-linear σ-w relationship, on the other hand, resulted in

CHALMERS, Civil and Environmental Engineering118
a slightly lower correlation and a higher variation, but generally led to better agreementfor the predicted peak load. However, it was pointed out that the adjustment of the σ-wrelationship was done by assuming the nominal fibre volume fraction, not the measuredcontent in the cores that was taken out from the slabs, and that this would have slightlyincreased the predicted peak load if it had been considered.
For the investigated reinforced FRC beams, the following conclusions can be made:
The self-compacting fibre-reinforced concrete generally performed well; nomajor fibre segregation was observed. However, some fibre fracture occurredfor the standard fibres, indicating too high a bond strength.
A low reinforcement ratio can be used, as long as the fibres provide enoughresistance and distribute the cracks.
The type of fibre and dosage had a significant effect on the structuralbehaviour, the peak load, and crack widths. Moreover, for the standard fibresthe bond was too good, resulting in fibre fracture.
High-strength reinforcement steel can be utilised without impairing theductility or crack widths.
The peak-load and post-peak behaviour was determined by a single crack.
The moment versus curvature relationship demonstrates a softening behaviourand in many cases there is no distinct yield plateau, characteristic ofconventional reinforced concrete; a similar observation was made by Pfyl(2003). However, to avoid this type of behaviour two possibilities exist: (1) theσ-w relationship should exhibit a negligible stress decrease between twocritical crack openings (for the bi-linear relationship this translates to a low a2
value); and (2) a reinforcement with a different hardening behaviour, e.g. ahigher ratio between the yield strength and the tensile strength, could be used.
6.2 The lattice girder system - an application study
The lattice girder system was presented in Chapter 2, and can be seen in Figure 7. Anatural stage in development is to improve a characteristic performance. In this case itwould primarily involve stiffness and load resistance during the construction stage. Itmay also include the weight of the element, to simplify transportation and handling ofthe elements. From the contractor’s point of view, there is a desire to increase thespacing of props. This would lead to less congestion and disturbance on site, andminimise the need for temporary works and the associated costs. From themanufacturers’ point of view, there is a desire to minimise transportation costs, byreducing the weight and the thickness of the elements. Reduced weight could also bebeneficial for the contractor since this could enable the use of a smaller crane or a betterlifting range. However, at present, engineers have the following design parameters towork with: the number of trusses, the truss height, the diameter of the top chord, theslab thickness, and prestressing (not considered in this study). But how the concretecontributes to the structural behaviour is less well known, and this may limit progress.For example, can the concrete be allowed to crack and, if so, how does this affect thestructural behaviour? How should it be considered in the analysis and, in this context,how should other types of concrete, such as fibre-reinforced concrete, be treated? Insum, there is a desire to optimise and refine the system, e.g. reduce the weight and

CHALMERS, Civil and Environmental Engineering 119
manage longer spans during construction. To achieve this, a better understanding of thestructural behaviour is needed, and this involves the link between material propertiesand performance attributes.
Materials have developed since the introduction of the system. However, they have notmade any significant impact on the system so far. With the current design practice, themain incentive for using a higher compressive strength in non-prestressed elements isthat it allows a shorter production cycle. From a structural viewpoint, one of the maindrawbacks with concrete is the brittleness problem; cracking of concrete usually takesplace at low stresses and is thus, in almost every case, inevitable in reinforced concreteelements. Besides being aesthetically displeasing, cracking also results in a gradualreduction of the structural stiffness. In view of this, is it possible to enhance structuralperformance by improving the mechanical behaviour of concrete, how can suchimprovement be realised, and how should it best be used? However, before going intodepth with those questions it could be useful to examine some of the difficulties indesigning and analysing a system like the lattice girder element. Also, the results fromexperiments and numerical analysis will be used to explain the structural behaviour ofthe system.
6.2.1 Difficulties in design and analysis
When carefully examining a product like the lattice girder element – which may seem arather simple product – and considering the entire life cycle from a structural viewpoint,it becomes obvious that design and analysis are not a straightforward matter. One has toconsider both time-dependent effects (such as creep and shrinkage) and time-dependentmaterial properties (strength and modulus of elasticity), which are affected byenvironmental conditions throughout the lifetime. This refers to an element with time-dependent boundary conditions (i.e. temporary supports during construction) and time-dependent sectional geometry (i.e. changing from a lattice girder element to amonolithic cross-section with composite action). Moreover, when or even before theyare loaded, the elements will exhibit, due to shrinkage and/or transportation, crackingwhich significantly changes the stiffness. As will be shown later, the tension-softeningresponse of the material has a significant influence on the behaviour.
The structural design of the elements must therefore be performed with regard to thewhole life cycle. The different stages to be considered are:
Stage ΙΙΙΙ (Non-composite Action) – prior to placement of concrete, which includes thetime:
(a) during transportation, handling and erection – e.g. cracking during lifting;(b) once the formwork is erected but prior to placement of the concrete – e.g.
deflections, excessive cracking and damage from construction loads,temporary stabilisation.
Stage ΙΙΙΙΙΙΙΙ (Non-composite Action) – during placement of concrete until the concretehardens – e.g. deflections and excessive cracking during casting.Stage ΙΙΙΙΙΙΙΙΙΙΙΙ (Composite Action) – during usage of the structure, which includes:
(a) normal usage (serviceability limit stage) – e.g. deflections, cracks, vibrations,acoustics, thermal comfort;
(b) at overloads (ultimate limit state) – e.g. strength, ductility, fire resistance.

CHALMERS, Civil and Environmental Engineering120
In addition, restraint stresses, introduced from the manufacturing, have to be considered.These stresses are mainly caused by shrinkage of the concrete and temperature restraintwhen the element starts to cool down. The focus of this study is the construction process(Stage I and Stage II). The design objectives for the construction stages can be dividedinto the serviceability and the ultimate limit states. In the ultimate limit state (ULS) themain requirement is that the overall system and each of its members should have thecapacity to sustain all design loads without collapsing. Adequate strength and safety areachieved if the following failures are avoided: failure of critical sections; loss ofequilibrium of the overall system or any part of it; loss of stability due to buckling of thelattice girder or any of its members (the top chord or the diagonals). In the serviceabilitylimit state (SLS) the following requirements should be fulfilled: deflections and localdeformations must not be unacceptably large; tensile cracks widths must be limited (orcracking may not be allowed); and local damage must be prevented.
6.2.2 Laboratory tests
A test series was carried out with twelve lattice girder elements, manufactured by ABFärdig Betong, in the laboratory at the Department of Structural Engineering, ChalmersUniversity of Technology. The main parameters varied were the height of the truss andthe diameter of the top bar. The choices of truss geometry was to be representative ofstandard trusses used in practice. All of the tested slabs had the same outer dimensions(length × width, 2600 × 1180 mm2); see Table 17 and Figure 127. For information aboutthe test set-up and measured material properties, see Paper II and Harnisch (2001) andVerdugo (2001).
Table 17. Table of test specimens.
Slab No. φ Topchord[mm]
φ Diagonal
[mm]
φ Bottomchords[mm]
Trussheight, h
[mm]
φ Longitudinalreinforcement
[mm]
Slabthickness, ts
[mm]
T10-6-5 H=120 10 6 5 120 9 φ10 – s 100 50T10-6-5 H=150 10 6 5 150 9 φ10 – s 100 50T10-6-5 H=200 10 6 5 200 9 φ10 – s 100 50T8-6-5 H=150 8 6 5 150 9 φ10 – s 100 50
T12-6-5 H=150 12 6 5 150 9 φ10 – s 100 50T10-6-5 H=150/8 10 6 5 150 9 φ8 – s 100 50
T10-6-5 H=150 / t =70 10 6 5 150 9 φ10 – s 100 70
Ø bottom
Ø diagonal
Ø top
Ø longitudinalreinforcement
t s
h
Figure 127. Description of the parameters varied in the test series.

CHALMERS, Civil and Environmental Engineering 121
6.2.3 Numerical analysis
Numerical analysis (e.g. finite element analysis) provides possibilities to analysecomplex problems. It may also supply additional information that is difficult to observein experiments, and it offers the possibility to change parameters that are difficult tocontrol in an experiment. A finite element model was set up in the program DIANA.The elements and material models to be used in the analysis should be able to representthe non-linear phenomena of buckling (geometric non-linearity), cracking (materialnon-linearity), and slip of the reinforcement. Description of the finite element model(element types, material models, etc.) can be found in Paper II. The model is shown inFigure 128.
Symmetry lines
Line load, Q/4
Support
1180/2
200
700
400
Figure 128. Finite element model representing a lattice girder element (due tosymmetry, only a quarter of the slab needs to be modelled).
6.2.4 Structural behaviour
What can be concluded is that the structural behaviour – in the ultimate limit state – isprimarily dependent on geometrical parameters (i.e. the geometry of the truss and theslenderness of the top chord as well as the thickness of the slab), as can be seen inFigure 129 and Figure 130. In Figure Figure 129(a), the influence of truss height can beseen. The truss height increases both the peak load and the stiffness. In Figure 129(b)the influence of truss top chord diameter can be seen. The influence of the stiffness isbarely notable before crack initiation, but it becomes notable after cracking. The effecton the peak load is notable; an increased bar diameter is less slender and thus is able toresist a larger compression stress before buckling.

CHALMERS, Civil and Environmental Engineering122
0
5
10
15
20
25
30
35
40
45
0 5 10 15 20 25
mid-span deflection [mm]
Q [kN]
T10-6-5 H=200
T10-6-5 H=150
T10-6-5 H=120
0
5
10
15
20
25
30
35
40
45
0 5 10 15 20 25mid-span deflection [mm]
Q [kN]
T12-6-5 H=150
T10-6-5 H=150
T8-6-5 H=150
Figure 129. Load versus mid-span deflection. (a) Influence of the truss height.(b) Influence of the top chord diameter.
In Figure 130(a) the influence of slab thickness can be seen. The slab thicknessincreases both the peak load and the stiffness. The initial stiffness is increased, but assoon as the crack load is reached the effect is reduced. The effect on the peak load ismainly an effect of the increased compression zone. In Figure 130(b) the influence ofslab reinforcement is seen; the reinforcement has been reduced from φ10-s100 to φ8-s100 (a reduction of 36%). The influence of the stiffness is not notable, either before orafter cracking. However, it was noted that it has some effect at large deflections.
0
5
10
15
20
25
30
35
40
45
0 5 10 15 20 25
Q [kN]
T10-6-5 H=150 / t=70
T10-6-5 H=150 / t=50
mid-span deflection [mm]
0
5
10
15
20
25
30
35
40
45
0 5 10 15 20 25
Q [kN]
T10-6-5 H=150 / φ10
T10-6-5 H=150 /φ8
mid-span deflection [mm]
Figure 130. Load versus mid-span deflection. (a) Influence of slab thickness.(b) Influence of slab reinforcement.
An interesting observation is that relatively small reinforcement strains and small crackwidths are introduced. This is due to the geometrical configuration with thereinforcement placed in the middle of the concrete slab. The crack widths are relativelysmall, typically < 0.2 mm, and are not visible until about 60 percent of the peak load.The measured strains are typically on the order of 500-1000×10-6 at peak load, and lessthan 300×10-6 at 60 percent of the peak load. This explains why the amount ofembedded reinforcement in the slab does not seem to have any considerable effect onthe stiffness; see Figure 130(b). As a result of the relatively small reinforcement strains,the ability of concrete to carry tensile stresses after cracking plays a significant role forthe tension-stiffening effect in the service stage. In conclusion, the tension softening andtension stiffening may play a vital role in the serviceability limit state. For larger crackwidths, closer to peak load, the concrete’s ability to transfer tensile stresses could also

CHALMERS, Civil and Environmental Engineering 123
influence the load-carrying resistance. However, this requires another type of concrete –for example a fibre-reinforced concrete, which also could influence the tension-stiffening effect in the serviceability limit stage.
As mentioned, the lattice girder element presents several difficulties for the numericalanalysis. Since cracking plays such a significant role in the degradation of the stiffness,this must be captured correctly throughout the entire loading process. Hence, a correctcrack pattern is needed (number of cracks and their spacing). Since no directmeasurement was made of the tensile strength of the concrete, a reasonable value had tobe assumed. Based on empirical correlations between tensile strength and thecompressive strength and splitting tensile strength, the concrete was assumed to have atensile strength, fct, of 2.6-3.0 MPa. However, it was realised that the crack-load alsowas affected by shrinkage; hence an analysis was conducted to investigate the effect ofshrinkage and the magnitude of the shrinkage-induced stresses. The result of theshrinkage analysis is shown in Figure 131. The shrinkage-induced stresses are on theorder of 0.4 MPa in the bottom of the slab and 1.0 MPa at the top of the slab. Hence, tocapture the cracking load, an effective tensile strength of 2.5 MPa was used in theanalysis instead of the earlier estimated value of 2.6-3.0 MPa.
Shrinkage Stresses in Concrete Slab - Longitudinal variation
0.0
0.20
0.40
0.60
0.80
1.00
1.20
0.0 0.2 0.4 0.6 0.8 1.0 1.2Length coordinate, x [m]
Stre
ss,σ
cs[M
Pa]
Top Surface
Bottom Surface
sym
met
rylin
e
Figure 131. Shrinkage-induced tensile stresses, from numerical analysis.
In the analysis, the peak load was represented accurately. However, the numericalmodel showed too stiff behaviour, mainly due to insufficient crack localisation. Thebuckling phenomenon was predicted in a satisfactory manner. The analysis becamenumerically unstable at crack initiation, and convergence problems occurred in someload steps. In Figure 132, a comparison is made between the numerical andexperimental load–deflection curves for slab T10-6-5 H=150. In the numerical analysis,two different load step sizes were chosen; for FEM-1 an automatic adaptation was used,and in FEM-2 explicitly specified step sizes were used. As can be seen, the differentstep sizes give slightly deviating results; the adaptive load steps give a stiffer responsebut, on the other hand, give a shorter computational time. The conclusion is that themodel is seemingly able to simulate the structural behaviour, even though the responseis a little too stiff, and can thus be used to investigate and simulate different materialbehaviour.

CHALMERS, Civil and Environmental Engineering124
0
5
10
15
20
25
30
0 2 4 6 8 10 12 14 16mid-span deflection [mm]
Q [kN]
T10-6-5 H=150 /8
T10-6-5 H=150 /10
FEM-1
FEM-2
Figure 132. Comparison of numerical (two different load step sizes) and experimentalresults (slab T10-6-5 H=150).
6.2.5 Improved performance
The results of the numerical analysis suggest that the increased toughness, which anaddition of fibres could provide, influences the structural behaviour, for both theserviceability (limiting deflections) and the ultimate limit states; see Figure 133. Thestiffness of the system, after cracking, is increased and it is thus able to carry a largerload at the same deflection; this is more pronounced for the high-strength concrete.Furthermore, the peak load is increased, even though the top chord buckles at the samestress, since the concrete is able to participate in the load-carrying capacity. The crackformation seems to differ between the normal-strength concrete and the high-strengthconcrete, with fewer cracks forming in the high-strength concrete. The increasedmodulus of elasticity of the high-strength concrete significantly increases the stiffnessof the system. However, when cracks are initiated this results in a rapid degradation ofthe stiffness, and the top chord now has to carry a larger compressive force in order tobalance the bending moment. Furthermore, as cracking is initiated for a rather high load,almost the same as the peak load, the behaviour becomes brittle. The increasedtoughness seems to be of particular importance for the high-strength concrete, where thecrack initiation leads to a rapid stiffness reduction.
0
5
10
15
20
0 4 8 12 16
mid-span deflection [mm]
Lo
ad
,q,
[kN
/m2 ]
C30
FRC30
C80
FRC80
0
5
10
15
20
0 4 8 12 16
mid-span deflection [mm]
Lo
ad
,q,
[kN
/m2]
C30
FRC30
FRC80
C80
(a) (b)Figure 133. Comparison of different materials – normal-strength concrete (C30),
high-strength concrete (C80), and two different FRC (FRC30 andFRC80). (a) T10-6-5, L=2 600 mm and (b) T12-6-5, L=2 600 mm.
CHALMERS, Civil and Environmental Engineering 125
6.2.6 Concluding discussion
The investigation of the lattice girder system has shown that with numerical tools it ispossible to virtually study the effects of different materials on the structural behaviour.The study was limited to simulating the effect, within certain geometricalconfigurations, on four types of concrete: normal-strength, high-strength, fibre-reinforced normal-strength, and fibre-reinforced high-strength. The structural behaviourof the lattice girder element is, above all, affected by the geometrical configuration ofthe lattice girder. However, tension stiffening as well as the tension softening of theconcrete has a substantial influence on the structural behaviour. Further:
The results of the numerical analyses show that it is possible to analyse latticegirder elements. It is essential, though, to use a model able to describe thetension softening of the concrete and to obtain a reasonable crack pattern.
A bigger top chord bar increases, as expected, the stiffness and the peak load.
An increased modulus of elasticity of the concrete increases the stiffness of theelements.
A tougher concrete, which the addition of fibres produces, may increase boththe peak load and the stiffness of the elements.
The increased toughness seems to be particularly important for the high-strength concrete, where the crack initiation leads to a rapid stiffness reduction.
One conclusion is that lattice girder elements could be an interesting application forfibre-reinforced concrete and, with the opportunities that exist today for designingmaterials, an appropriate mix proportion should be possible to develop. Based on a deepunderstanding of the structural behaviour, the link between structural behaviour andmaterial properties/behaviour can be utilised to optimise the structural performance.Moreover, when the mechanisms behind the structural behaviour have been identified,the design optimisation to achieve the desired performance of the product can berealised by optimising both the geometry and the materials.

CHALMERS, Civil and Environmental Engineering126

CHALMERS, Civil and Environmental Engineering 127
7 CONCLUSIONS
7.1 General conclusions
Fibre reinforcement extends the versatility of concrete as a construction material byovercoming the otherwise intrinsic brittleness and by improving the structural behaviour(crack propagation, flexural stiffness, etc.), but also by the potential it has to simplifythe construction process. When FRC is combined with self-compacting concrete, asignificant step towards industrial construction has been taken. However, a barrier tothis development has been a lack of general design guidelines for FRC, which take intoaccount the material properties characteristic of FRC materials, i.e. the σ-w relationship.
In this thesis, different test methods have been investigated and, through inverseanalyses, σ-w relationships have been determined for a number of fibre-reinforcedconcretes. Moreover, a systematic approach has been suggested for the material testing,aiming at determining the σ-w relationship. With this approach it is possible to adjustfor differences in fibre efficiency between the material test specimen and the structuralelement considered, or the case of random 3-D orientation. The approach has beendemonstrated by investigating a number of different mixes and determining thecorrelation between fibre efficiency (number of fibres) and σ-w relationship. Theapproach has also been demonstrated in an application study of structural memberswhere full-scale experiments were conducted. In addition, an existing model foranalysing the flexural behaviour of reinforced FRC members, based on the non-linearhinge, has been further developed and results using the approach have been comparedwith detailed finite element analyses and full-scale experiments. Based on these studies,a fracture-mechanics-based approach to material testing and structural analysis has beenpresented. To briefly summarise and explain the approach, it consists of the followingsteps:
Material testing, i.e. standard compressive strength test together with wedge-splitting tests (WST) to determine the tensile post-cracking behaviour of thesteel fibre-reinforced.
Inverse analysis for interpreting the test results from the WST (i.e. splittingload vs. CMOD curves) as a σ-w relationship (outlined in Section 4.2.2).
Adjustment of the σ-w relationship by considering the differences in fibreefficiency factor between the WST specimens and the beams (outlined inSection 4.2.3).
Cross-sectional analyses of the beams, using the non-linear hinge model, toobtain relationships between moment and curvature and between moment andcrack opening (outlined in Section 5.3).
Structural analyses to predict the structural behaviour, which can be based onthe finite element method or on using the results from the cross-sectionalanalyses where the displacement can be obtained by integrating the curvature.
The general conclusions that can be drawn, based on the presented work, are that fibrereinforcement improves the fracture behaviour of concrete, exemplified in Section 5.3.5and by the investigated structural applications. It was also demonstrated that the wedge-splitting test method can be used as a fracture test for steel fibre-reinforced concrete,

CHALMERS, Civil and Environmental Engineering128
which is useful since the specimens are much smaller than traditional beam specimens(e.g. 3PBT according to RILEM TC 162-TDF) and is thus better suited for laboratoryinvestigations and for development and optimisation of mixes. It was shown thatthrough inverse analysis it is possible to determine realistic σ-w relationships as long asthe initial part of the σ-w relationship and the tensile strength is estimated realistically.To determine a σ-w relationship which is realistic for a structural member, it is possible,and also recommended, to adjust for any difference in fibre efficiency between thematerial test specimen and a structural element; for this purpose it is necessary to countthe number of fibres in the fracture specimens. With the conducted full-scaleexperiments it was demonstrated that the σ-w relationship, obtained from materialtesting and inverse analysis, could be used to predict the flexural behaviour ofreinforced FRC members, using the analytical model as well as finite element analyses.For the finite element method, the structural behaviour could be predicted with goodagreement by using the multi-linear σ-w relationship. For the non-linear hinge model,the bi-linear σ-w relationship resulted in better agreement than a tri-linear σ-wrelationship.
The investigation of the fracture behaviour reinforced FRC beams showed that the typeof fibre and dosage had a significant effect on the structural behaviour, the peak load,and crack widths. Moreover, for the standard fibres the bond was to good and resultedin fibre fracture. The combination of welded mesh and steel fibres as reinforcementseems to be promising as it allows use of reinforcement with smaller diameters (φ ≤ 8mm) than those normally used, which is beneficial since welded mesh is available instandardised units for these dimensions. In addition, a low reinforcement ratio can beused, as long as the fibres provide enough resistance and distribute the cracks, and high-strength reinforcement steel can be utilised without impairing the ductility or crackwidths. In the experiments, it was observed that the peak-load and post-peak behaviourwas determined by a single crack, the moment versus curvature relationshipdemonstrated a softening behaviour, and there was no distinct yield plateau which ischaracteristic of conventional reinforced concrete.
The investigation of the lattice girder system showed that with numerical tools it ispossible to virtually study the effects of different materials on the structural behaviour.The structural behaviour of the lattice girder element is, above all, affected by thegeometrical configuration of the lattice girder. However, tension stiffening as well asthe tension softening of the concrete has a substantial influence on the structuralbehaviour. Further, it was concluded that the lattice girder elements could be oneinteresting application for fibre-reinforced concrete and, with the opportunities that existtoday for designing materials, an appropriate mix proportion should be possible todevelop. Based on a deep understanding of the structural behaviour, the link betweenstructural behaviour and material properties/behaviour can be utilised to optimise thestructural performance. Moreover, when the mechanisms behind the structuralbehaviour have been identified, the design optimisation to achieve the desiredperformance of the product can be realised by optimising both the geometry and thematerials.

CHALMERS, Civil and Environmental Engineering 129
7.2 Suggestions for future research
Although the research literature on fibre-reinforced concrete is extensive there is stillneed for further studies. A significant step forward would be the development of generaldesign guidelines based on the fracture-mechanics-based approach and development ofdesign software and tools that practising engineers can use. Further developments ofinverse analysis approaches are needed and, preferably, there should be a developmenttowards standardisation of these methods so that they can be used in conjunction withstandard test methods as a natural step to determine material properties – as for exampleproposed by JCI (Japan Concrete Institute); see Kitsutaka et al. (2001). The validity ofthe suggested approach for adjusting the σ-w relationship should be investigated further.The presented fracture-mechanics-based approach to material testing and structuralanalysis needs additional study, e.g. by investigating beams of different dimensions,different amounts of conventional reinforcement and fibre volume fractions, as well ascombinations of bending moment and normal forces. Time-dependent effects such asshrinkage, creep, relaxation, etc., which may influence the crack propagation and thestructural behaviour, should be addressed so that they can be incorporated into the non-linear hinge model. Situations involving multi-axial stress states and mixed-mode crackpropagation (shear, torsion, etc.) are also an area requiring attention.
While extensive research has been carried out in the field of fibre-reinforced concrete,few studies have been conducted where the material behaviour and the structuralperformance have been systematically linked, e.g. through accurate determination of theσ-w relationship and fracture-mechanics-based analyses. In addition, little effort hasbeen given to optimisation of the fibre-reinforced concrete so that it suits the applicationwhich was investigated; this should be systematically examined for potential structuralapplications, using a performance-based approach where the failure mode (e.g. stiffness,crack widths, bending failure, shear failure, etc.) governing the performance should bespecified for each type of application, together with how the material propertiesinfluence the performance and the possibilities and opportunities that exist.Furthermore, investigations of different types of reinforcement materials, with a moreoptimal performance for FRC, could lead to more effective and economical structures.
For analysing the structural behaviour of reinforced FRC members using the finiteelement method, other approaches such as X-FEM (extended finite element method)should be investigated. One of the appealing aspects of X-FEM is that the fictitiouscrack model (see Hillerborg et al. 1986) can be directly implemented and the σ-wrelationship can be used to describe the fracture process without having to transformthis into a stress vs. strain relationship or having to introduce predefined crack paths,which is necessary with the discrete crack approach; see Svahn (2005).

CHALMERS, Civil and Environmental Engineering130

CHALMERS, Civil and Environmental Engineering 131
8 ReferencesAarre, T. (1992): Tensile characteristics of FRC with special emphasis on its applicability in a continuous
pavement, Ph.D. thesis, Department of Structural Engineering, Technical University of Denmark,Serie R, No. 301, 1992, 167 pp.
Abdalla, H.M. and Karihaloo, B.L. (2003): Determination of size-independent specific fracture energy ofconcrete from three-point bend and wedge splitting tests, Magazine of Concrete Research, Vol. 55,No. 2, April 2003, pp. 133-141.
ACI Committee 544 (1988): Measurement of properties of fiber reinforced concrete. ACI MaterialsJournal 85 (1988), pp. 583-593.
ACI 544 (1994): Design Considerations for Steel Fiber Reinforced Concrete, ACI Committee 544 Report544.4R-88, American Concrete Institute, Detroit.
ACI 544 (1996): State-of-the-Art Report on Fibre Reinforced Concrete, ACI Committee 544, Report544.1R-96, American Concrete Institute, Detroit.
Ahmad, S., di Prisco, M., Meyer, C., Plizzari, G.A., and Shah, S. (Eds.) (2004): Fibre ReinforcedConcrete from Theory to Practice, International Workshop on Advances in Fiber ReinforcedConcrete, Bergamo, Italy, Sept. 24-25, 2004.
Aïtcin, P-C. (2000): Cements of yesterday and today – Concrete of tomorrow. Cement and ConcreteResearch, Vol. 30 (2000), pp. 1349-1359.
Allos, A.E. (1989): Shear transfer in fibre reinforced concrete. In Fibre Reinforced Cements andConcretes – Recent Developments, eds. R.N. Swamy and B. Barr, Elsevier Science Publishers, pp.146-156.
Alwan, J.M., Naaman, A.E, and Guerrero, P. (1999): Effect of mechanical clamping on the pull-outresponse of hooked steel fibers embedded in cementitious matrices, Concrete Science andEngineering, Vol. 1, March 1999, pp. 15-25.
Alwan, J.M., Naaman, A.E, and Hansen, W. (1991): Pull-Out Work of Steel Fibres From CementitiousComposites: Analytical Investigation. Cement & Concrete Composites, Vol. 13 (1991), pp. 247-255.
ASTM 1550-02 (2003): Standard Test Method for Flexural Toughness of Fiber Reinforced Concrete(Using Centrally Loaded Round Panel). American Society for Testing and Materials Standard,West Conshohoken.
ASTM C 1018: Standard Test Method for Flexural Toughness and First-Crack Strength of Fiber-Reinforced Concrete (Using Beam With Third-Point Loading). ASTM, West Conshohocken, Pa.,1997.
Aveston, J., and Kelly, A. (1973): Theory of Multiple Fracture of Fibrous Composites, Journal ofMaterials Science, Vol. 8, pp. 352-362.
Ay, L. (2004): Steel Fibrous Cement Based Composites. Ph.D. thesis, Dept. of Civil and ArchitecturalEngineering, Royal Institute of Technology, 2004, Stockholm, 234 pp.
Bache, H.H. (1989): Fracture mechanics in integrated design of new, ultra-strong materials and structures.In Fracture Mechanics of Concrete Structures – From theory to applications, ed. L. Elfgren,Chapman and Hall, London 1989, pp. 382-398.
Balaguru, P.N. and Shah, S.P. (1992): Fiber Reinforced Cement Composites. McGraw Hill, New York,530 pp.
Banthia, N. (1998): Fibre reinforced concrete: Present and the future. In Fibre reinforced concrete –Present and future, eds. Banthia, N., Bentur, A., and Mufti, A. The Canadian Society for CivilEngineering, Montreal, 1998, pp. 1-20.
Banthia, N. and Mindess, S. (eds.) (1995): Fiber Reinforced Concrete – Modern Developments. TheSecond University-Industry Workshop on Fibre Reinforced Concrete and Other Composites heldin Toronto, Canada, March 26-29, 1995.

CHALMERS, Civil and Environmental Engineering132
Banthia, N., and Trottier, J.-F. (1995): Test methods for flexural toughness characterization of fiberreinforced concrete: Some concerns and a proposition, ACI Materials Journal, Vol. 92, No. 1, pp.48-57.
Banthia, N., Bentur, A., and Mufti, A. (eds.) (1998): Fibre reinforced concrete – Present and future. TheCanadian Society for Civil Engineering, Montreal, 1998.
Barr B., Gettu R., Al-Oraimi S.K.A., and Bryars L.S. (1996): Toughness measurement – the need to thinkagain. Cem. & Concrete Composites 18 (1996), pp. 281-297.
Barragán, B.E. (2002): Failure and toughness of steel fiber reinforced concrete under tension and shear,Ph.D. Thesis, Universitat Politécnica de Catalunya, Barcelona, Spain.
Barragán, B.E, Gettu, R., Martín, M.A., and Zerbino, R.L. (2003): Uniaxial tension test for steel fibrereinforced concrete––a parametric study, Cement & Concrete Composites 25 (2003), pp. 767-777.
Barros, J.A.O. and Figueiras, J.A. (1999): Flexural Behavior of SFRC: Testing and Modeling. Journal ofMaterials in Civil Engineering, Vol. 11, No. 4, Nov. 1999, pp. 331-339.
Barros, J. and Antunes, J. (2003): Experimental characterization of the flexural behaviour of steel fibrereinforced concrete according to RILEM TC 162-TDF Recommendations. In Test and DesignMethods for Steel Fibre Reinforced Concrete – Background and Experiences, Proceedings of theRILEM TC 162-TDF Workshop, eds. Schnütgen and Vandevalle. pp. 77-89.
Barros, J., Pereira, E., Ribeiro, A., Chuna, V., and Antunes, J. (2004): Self-compacting steel fibrereinforced concrete for precasted sandwich panels – experiments and numerical research. In FibreReinforced Concrete from Theory to Practice, eds. S. Ahmad, M. di Prisco, C. Meyer, G.A.Plizzari, S. Shah, International Workshop on Advances in Fiber Reinforced Concrete, Bergamo,Italy, Sept. 24-25, 2004, pp. 135-148.
Barros, J.A.O., Chuna, V.M.C.F., Riberio, A.F., and Antunes, J.A.B. (2005): Post-cracking behaviour ofsteel fibre reinforced concrete. Materials and Structures, Vol. 38 No. 275, January-February 2005,pp. 47-56.
Bartos, P. (1981): Review paper: Bond in fibre reinforced cements and concretes. International Journal ofCement Composites, Vol. 3, No. 3 (1981), pp. 159-177.
Bartos, P.J.M. and Duris, M. (1994): Inclined tensile strength of steel fibres in a cement-based composite.Composites, Vol. 25, No. 10 (1994), pp. 945-952.
Bažant, Z. P. & Oh, B. H. (1983): Crack band theory for fracture of concrete, Materials and Structures,Vol. 16, pp. 155-177.
Beddar, M. (2004): Fibre-reinforced concrete – Past, present and future, Concrete, April 2004 (38) 4,ABI/INFORM Trade & Industry, pp. 47-49.
Belletti, B., Cerioni, R., Meda, A., and Plizzari, G.A. (2004): Experimental and numerical analyses ofFRC slabs on grade. In Fracture Mechanics of Concrete Structures, Vol 2, Li et al. (eds.),Proceedings of FRAMCOS-5, Vail, Colorado, U S A, April 2004, pp. 973-980.
Bennett, D. (2002): Innovation in concrete. Thomas Telford Publishing, London, 2002.
Bentur A. and Mindess S. (1990). Fibre Reinforced Cementitious Composites. Elsevier Science Publ. Ltd.England, UK., 1990.
Bentur, A. (1991): Microstructure, interfacial effects and micromechanics of cementitious composites, inAdvances in Cementitious Materials (ed. S. Mindess), The American Ceramic Society, USA, pp.523-547.
Bentur, A. (2002): Cementitious Materials – Nine Millennia and A New Century: Past, Present, andFuture. Journal of Materials in Civil Engineering, Vol. 14, No. 1, February 1, 2002, pp. 2-22.
Bentur, A., Mindess, S., and Diamond, S. (1985): Pull out processes in steel fiber reinforced cement.International Journal of Cement Composites & Lightweight Concrete, Vol. 7, No. 1, pp. 29-38.
Bentur, A., Wu, S.T, Banthia, N., Baggott, R., Hansen, W., Katz, A., Leung, C.K.Y., Li, V.C., Mobasher,B., Naaman, A.E., Robertson, R., Soroushian, P., Stang, H., and Taerwe, L.R. (1995): Fibre-matrixinterfaces. In High Performance Fibre Reinforced Cementitious Composites, eds. Naaman andReinhardt. Chapman and Hall, London, 1995, pp. 149-191.

CHALMERS, Civil and Environmental Engineering 133
Betongbanken (2000): Construction data compiled by the Swedish Ready-Mix Association – received on02-05-00 from Frank Johansson.
Betterman, L.R., Ouyang, C., Shah, S.P. (1995): Fiber-matrix interaction in microfiber-reinforced mortar,Advanced Cement Based Materials, 2, 1995, pp. 53-61
Bolzon G., Fedele R., and Maier G. (2002): Parameter identification of a cohesive crack model byKalman filter. Comput. Methods Appl. Mech. Eng. 191 (2002), pp. 2847-2871.
Brandt, A.M. (1985): On the optimal direction of short metal fibres in brittle matrix composites. Journalof Material Science, Vol. 20, pp. 3831-3841.
Brandt, A.M. (1995): Cement-Based Composites – Materials, Mechanical Properties and Performance,Spon, London, 1995.
Brandt, A.M. and Kucharska (1999): Developments in Cement-Based Composites. In Extending thePerformance of Concrete Structures, eds. R.K. Dhir and P.A.J. Tittle, Proceedings of theinternational seminar held at the University of Dundee, Scotland, UK, on Sept. 7 1999, ThomasTelford Publishing, pp. 17-32.
BRE (2000): Concreting for improved speed and efficiency, Best Practice Guides for In-situ ConcreteFrame Buildings, Building Research Establishment, (downloadable at www.rcc-info.org.uk).
BRE (2000): Improved rebar information and supply, Best Practice Guides for In-situ Concrete FrameBuildings, Building Research Establishment, (downloadable at www.rcc-info.org.uk).
BRE (2000): Improving concrete frame construction, Best Practice Guides for In-situ Concrete FrameBuildings, Building Research Establishment, (downloadable at www.rcc-info.org.uk).
BRE (2000): Rationalisation of flat slab reinforcement, Best Practice Guides for In-situ Concrete FrameBuildings, Building Research Establishment, (downloadable at www.rcc-info.org.uk).
BRE (2001): Early age strength assessment of concrete on site, Best Practice Guides for In-situ ConcreteFrame Buildings, Building Research Establishment, (downloadable at www.rcc-info.org.uk).
BRE (2001): Early striking and improved backpropping, Best Practice Guides for In-situ Concrete FrameBuildings, Building Research Establishment, (downloadable at www.rcc-info.org.uk).
BRE (2001): Flat slabs for efficient concrete construction, Best Practice Guides for In-sity ConcreteFrame Buildings, Building Research Establishment, (downloadable at www.rcc-info.org.uk).
BRE (2001): Prefabricated punching shear reinforcement for reinforced concrete flat slabs, Best PracticeGuides for In-situ Concrete Frame Buildings, Building Research Establishment, (downloadable atwww.rcc-info.org.uk).
Brühwiler, E. and Wittmann, F.H. (1990): The wedge splitting test, a new method of performing stablefracture mechanics test. Eng. Fracture Mech. 35(1/2/3), pp. 117-125.
Burwick, M. (1998): Betongbyggande med kvarsittande gjutformar – en jämförande studie.Examensarbete 334, Avd. för byggandets organisation och ekonomi, KTH. Stockholm, 1998. (InSwedish.)
Buyukozturk, O. and Hearing, B. (1998): Crack propagation in concrete composites influenced byinterface fracture parameters, Int. Journal of Solids and Structures, Vol. 35, Nos. 31-32, Elsevier,pp. 4055-4066.
Camellerie, J.F. (1985): Construction Methods and Equipment. Handbook of concrete engineering. Editedby Fintel. Van Nostrand Reinhold, New York, 1985, pp. 793-819.
Cassanova, P. and Rossi, P. (1997): Analysis and design of steel fiber reinforced concrete beams. ACIStructural J. 94(5) (1997), pp. 595-602.
CEB (1993): CEB-FIP Model Code 1990. Bulletin d'Information 213/214, Lausanne, Switzerland, 1993,437 pp.
CEB Bulletin 242 (1998): Ductillity of Reinforced Concrete Structures, Lausanne, Switzerland, 332 pp.
CEB Bulletin d’Information 222: Application of High Performance Concrete, Lausanne, 1994.
CEMBUREAU (2000): Annual Report 2000, Published by CEMBUREAU The European CementAssociation, Brussels.
CHALMERS, Civil and Environmental Engineering134
Chan, Y.W. and Li, V.C. (1997): Effects of Transition Zone Densification On Fiber/Cement Paste BondStrength Improvement, Advanced Cement Based Materials, 1997 (5), pp. 8-17.
Chanvillard, G. (1999): Modeling the pull-out of wire-drawn steel fibers. Cement and Concrete Research29(1999), pp. 1027–1037.
Chanvillard, G. (2000): Characterisation of fibre reinforced concrete mechanical properties: A review. InFibre-Reinforced Concretes (FRC), Proceedings of the Fifth International RILEM symposium,BEFIB 2000. Eds. P. Rossi and G. Chanvillard, PRO 15, RILEM Publications S.A.R.L, Bagneaux,pp. 29-50.
Chanvillard, G. and Aïtcin, P.C. (1996): Pull-Out Behavior of Corrugated Steel Fibers – Qualitative andStatistical Analysis. Advanced Cement Based Materials, 1996 (4), pp. 28-41.
Chawla, K.K. (2001): Fibrous Reinforcements for Composites: Overview, in Encyclopedia of Materials:Science and Technology, Elsevier Science Ltd., pp. 3160-3167.
Chong, K.P. and Garboczi, E.J. (2002): Smart and designer structural material systems, Prog. Struct.Engng Mater. 2002, No. 4, pp. 417-430.
Cnudde, M. (1991): Lack of quality in construction – economic losses. European Symposium onManagement, Quality and Economics in Housing and Other Building Sectors, Lisbon, September30 – October 4, 1991. Proceedings, pp. 508-515.
Constantinesco, G. (1943): Reinforced concrete, British Patent No. 2,677,955, Feb. 10, 1948.
Cook, J. & Gordon, J. E. (1964): A mechanism for the control of crack propagation in all brittle systems,Proc. Roy. Soc. 282A, pp. 508–520.
Cornelissen, H. A. W., Hordijk, D. A., and Reinhardt, H. W. (1986): Experimental determination of cracksoftening characteristics of normalweight and lightweight concrete. Heron 31, 2 (1986).
Cotterell, B. and Mai, Y.W. (1996): Fracture Mechanics of Cementitious Materials. Blackie Academic &Professional, Chapman & Hall, 294 pp.
Cox, H.L. (1952): The elasticity and strength of paper and other fibrous materials. British Journal ofApplied Physics, Vol. 3, March 1952, pp. 72-79.
Curbach et al. (1998): New building material – Textile Concrete. Betonwerk + Fertigteil-Technik, BFT6/1998, pp 45-56.
DAfStbUA SFB N 0146 (2005): DAfStb-Richtlinie Stahlfaserbeton (21. Entwurf), Ergänzung zu DIN1045, Teile 1 bis 4 (07/2001), Deutscher Ausschuss für Stahlbeton – DAfStb, Berlin. (In german)
Darwin, D., Barham, S., Kozul, R., and Luan, S. (2001): Fracture energy of high-strength concrete, ACIMaterials Journal, Vol. 98, No. 5, Sept-Oct 2001, pp. 410-417.
de Larrard, F. (1999): Concrete Mixture Proportioning – a Scientific Approach, E & FN Spon, London,1999, 421 pp.
de Place Hansen, E.J., Hansen, E.A., Hassanzadeh, M., and Stang, H. (1998): Determination of theFracture Energy of Concrete: A comparison of the Three-Point Bend Test on Notched Beam andthe Wedge-Splitting Test. NORDTEST Project No 1327-97. SP Swedish National Testing andResearch Institute, Building Technology, SP Report 1998:09, Borås, Sweden, p. 87.
di Prisco, M., Felicetti, R., Lamperti, M.G.L, and Menotti, G. (2004a): On size effect in tension of SFRCthin plates. In Fracture Mechanics of Concrete Structures, Vol. 2, Li et al. (eds.), Proceedings ofFRAMCOS-5, Vail, Colorado, USA, April 2004, pp. 1075-1082.
di Prisco, M., Toniolo, G., Plizzari, G.A., Cangiano, S., Failla, C. (2004b): Italian guidelines on SFRC. InFibre Reinforced Concrete from Theory to Practice, International Workshop on Advances in FiberReinforced Concrete, Bergamo, Italy, Sept. 24-25, 2004, pp. 39-72.
di Prisco, M., Felicetti, R., and Plizzari, G.A. (eds.) (2004c): Fibre-Reinforced Concretes – BEFIB 2004 –Proceedings of the Sixth RILEM symposium. Varenna, Italy, 20th-22nd September 2004. PRO 39,RILEM Publications S.A.R.L, Bagneaux.
Dubey, A. (1999): Fiber Reinforced Concrete: Characterization of flexural toughness & some studies onfibre-matrix bond-slip interaction. Ph.D. thesis, University of British Columbia, Department ofCivil Engineering, 1999.

CHALMERS, Civil and Environmental Engineering 135
Dupont D. (2003): Modelling and experimental validation of the constitutive law (σ-ε) and crackingbehaviour of fibre reinforced concrete. Ph.D. thesis, Katholieke Universiteit Leuven, 2003.
Dupont, D., and Vandewalle, L. (2005): Distribution of steel fibres in rectangular sections. Cement andConcrete Composites, 27, 2005, pp. 391-398.
Døssland, Å. (2003): Beams of ordinary and self-compacting concrete reinforced with steel fibres andordinary reinforcement tested in moment and shear. In Design Rules for Steel Fibre ReinforcedConcrete Structures (ed. T. Kanstad), Proc. Nordic miniseminar, Oslo, October 2003. TheNorwegian Concrete Association, Oslo, pp. 99-106.
EFNARC (1996): European Specification for Sprayed Concrete, European Federation of Producers andApplicators of Specialist Products for Structures – see www.efnarc.org.
Elser M., Tschegg E.K., Finger N., and Stanzl-Tschegg S.E. (1996): Fracture Behaviour ofPolypropylene-Fibre Reinforced Concrete: an experimental investigation. Comp. Science andTechnology 56 (1996), pp. 933-945.
EN 206-1 (2000): Concrete Part 1: Specification, performance, production and conformity, Ref. No. EN206-1: 2000 E, CEN European Committee for Standardization, Brussels.
Erdem, E. (2003): The flexural behaviour of SFRC beams and slabs: bending with σ-ε method. In Testand Design Methods for Steel Fibre Reinforced Concrete – Background and Experiences,Proceedings of the RILEM TC 162-TDF Workshop, eds. Schnütgen and Vandevalle, pp. 67-76.
Esping, O. and Löfgren, I. (2005): Cracking due to plastic and autogenous shrinkage – Investigation ofearly age deformation of self-compacting concrete – Experimental study. P-2005:11. Publication05:11, Department of Civil and Environmental Engineering, Chalmers University of Technology,95 pp.
Ezeldin, A.S. and Balaguru, P.N. (1992): Normal and high strength fiber reinforced concrete undercompression. Journal of Materials in Civil Engineering, 1992, 4(4), pp. 415-427.
Fantilli, A.P., Ferretti, D., and Rosati, G. (2005): Effect of Bar Diameter on the Behavior of LightlyReinforced Concrete Beams. Journal of Materials in Civil Engineering, Vol. 17, No. 1, February1, 2005, pp. 10-18.
fib Bulletin 8 (2000): Lightweight Aggregate Concrete, Recommended extension to Model Code 90.Lausanne, 2000.
Flaga, K. (2000): Advances in materials applied in civil engineering, Journal of Materials ProcessingTechnology, 106 (2000), pp. 173-183, Elsevier.
Gartner, E.M., Young, J.F., Damidot, D.A., and Jawed, I. (2002): Hydration of portland cement. Chapter3 in Structure and performance of cements (eds. Bensted and Barnes) Spoon Press, London, 2002.
Gettu, R. and Barragán, B.E. (2003): Direct tension test and interpretation. In Test and Design Methodsfor Steel Fibre Reinforced Concrete – Background and Experiences, Proceedings of the RILEMTC 162-TDF Workshop, eds. Schnütgen and Vandevalle, pp. 15-30.
Gettu, R., Schnütgen, B., Erdem, E., and Stang, H. (2000): Design Methods for Steel Fiber ReinforcedConcrete: A State-of-the-Art Report, Report of Sub-task 1.2 Test and Design Methods for SteelFiber Reinforced Concrete Brite-EuRam Project BRPR-CT98-0813 (DG12-BRPR), 55 p.
Giaccio, G. and Zerbino, R. (1997): Combined Effects of Coarse Aggregates and Strength Level,Advanced Cem Bas Mat, 7 (1998), Elsevier, pp. 41-48.
Girmscheid, G. & Hofmann, E. (2000): Industrielles Bauen – Fertigungstechnologie oderManagementkonzept? Bauingenieur, Band 75, September 2000, pp. 586-592. Springer Verlag. (Ingerman)
Glavind, M. (1992): Evaluation of the Compressive Behaviour of Fibre Reinforced High StrengthConcrete. PhD. thesis, Technical University of Denmark, Department of Structural Engineering,Serie R No. 302, 144 pp.
Gopalaratnam V.S. and Gettu R. (1995): On the characterization of flexural toughness in fiber reinforcedconcretes. Cem. & Concrete Composites 17 (1995), pp. 239-254.

CHALMERS, Civil and Environmental Engineering136
Gopalaratnam, V.G., Shah, S.P., Batson, G.B., Criswell, M.E., Ramakrishnan, V., and Wecharatana, M.(1991): Fracture Toughness of Fiber Reinforced Concrete. ACI Materials Journal, Vol. 88, No. 4,July-August 1991, pp. 339-353.
Gopalaratnam, V.S. and Shah, S.P. (1987): Tensile Failure of Steel Fiber-Reinforced Concrete, Journal ofEngineering Mech., ASCE, Vol. 113, No. 5, pp. 635-652.
Gossla, U. (2000): Tragverhalten und Sicherheit kombiniert bewehrter Stahlfaserbetonbauteile”(structural safety of combined steel fibre reinforced concrete members), Heft 501, DeutscherAusschuss für Stahlbeton, Beuth Verlag Berlin, Wien, Zürich, 2000. (In German)
Gossla, U. and Pepin, R. (2004): Decken aus selbstverdichtendem Stahlfaserbeton, BraunschweigerBauseminar 2004, 11. u. 12. November, pp. 147-154.
Grauers, M. (1998): Rational production and improved working environment through using selfcompacting concrete. Brite-EuRam project BRPR-CT96-0366, 1998.
Gray, C. (1995): In Situ Concrete Frames. The Reading Production Engineering Group. University ofReading, 1995.
Gray, R.J. (1984a): Analysis of Effect of Embedded Fibre Length on Fibre Debonding and Pull-Out froman Elastic Matrix; Part 1, Review of Theories, Journal of Materials Science, Vol. 19, No. 3, pp.861-870.
Gray, R.J. (1984b): Analysis of Effect of Embedded Fibre Length on Fibre Debonding and Pull-Out froman Elastic Matrix; Part 2, Application to Steel Fibre-Cementitious Matrix Composite System,Journal of Materials Science, Vol. 19, No. 5, pp. 1680-1691.
Gray, R.J., and Johnston, C.D., (1984): Effect of Matrix Composition of Fiber/Matrix Interfacial BondShear Strength in Fiber Reinforced Mortar, Cement and Concrete Research, Vol. 14, pp: 285-296.
Griffith, A.A. (1920): The Phenomena of Rupture and Flow in Solids, Philosophical transaction of theRoyal Society of London, Series A, Physical sciences and engineering, 221, pp. 163-198.
Groth, P. (2000): Fibre Reinforced Concrete – Fracture Mechanics Methods Applied on Self-CompactingConcrete and Energetically Modified Binders. Ph.D. thesis, Luleå University of Technology,Sweden.
Grünewald, S. (2004): Performance-based design of self-compacting fibre reinforced concrete. Ph.D.thesis, Department of Structural and Building Engineering, Delft University of Technology, 2004.
Guerrini, G.L. (2000): Applications of High-Performance Fibre-reinforced Cement-Based Composites,Applied Composite Materials, 7, Kluwer Academic Publisher, pp. 195-207.
Guse, U. and Müller, H.S (2000): Forschungsergebnisse und Ausblick ins neue Jahrtausend, Betonwerk +Fertigteil-Technik, BFT 1/2000, pp. 32-45. (In German)
Guttema, T.B. (2004): Constritutive modeling of reinforced steel fiber concrete composite material. InVol 2, ed Li et al., Proceedings of FRAMCOS-5, Vail, Colorado, U S A, April 2004, Li et. al.(eds), 2004, pp. 981-988.
Gylltoft, K. (1983): Fracture Mechanics Models for Fatigue in Concrete Structures. Doctoral Thesis.Division of Structural Engineering, Luleå University of Technology, Luleå, Sweden, 210 pp.
Hanna, A.S. (1998): Concrete Formwork Systems. Marcel Dekker Incorporated, New York, USA, 1998.
Harnisch, J. (2001): Comparative Studies on Lattice Girder Elements (Full-scale tests and a finiteelement simulation), Master’s Thesis 01:13, Dept. of Structural Engineering – Concrete Structures,Chalmers University of Technology, Göteborg, Sweden, 2001, 81 pp.
Harryson, P. (2002): Industrial bridge construction – merging developments of process, productivity andproducts with technical solutions. Publication 02:1, Dept. Of Structural Engineering – ConcreteStructures, Chalmers University of Technology, Göteborg, Sweden, 2002, 90 pp.
Hassanzadeh, M. (2001): Flexural Behaviour of Steel-Fibre-Reinforced High-Performance Concrete, Inthe Design of Steel Fibre Reinforced Concrete Structures, Proceedings of the Workshop,Stockholm, June 12, 2001, The Nordic Concrete Federation, pp. 113-122.
Hearle, J.W.S (ed.) (2001): High-performance Fibres. Woodhead Publishing Ltd, Cambridge, 2001.

CHALMERS, Civil and Environmental Engineering 137
Hemmy, O., Dupont, D., Vandewalle, L., and Stang, H. (2002): Recommendations for Finite ElementAnalysis of SFRC. Report of Sub-task 3.5 Test and Design Methods for Steel Fiber ReinforcedConcrete Brite-EuRam Project BRPR-CT98-0813 (DG12-BRPR).
Hillerborg, A. (1980): Analysis of Fracture by Means of the Fictitious Crack Model, Particularly for FibreReinforced Concrete. The Int. J. Cem. Comp. 2 (1980), pp. 177-184.
Hillerborg, A., Modéer, M., and Petersson, P. E. (1976): Analysis of crack formation and crack growth inconcrete by means of fracture mechanics and finite elements, Cement and Concrete Research, Vol.6, pp. 773-782.
Hilsdorf, H.K. (1995): Concrete, in Concrete Structures Euro-Design Handbook, ed. J. Eible, Ernst &Sohn, Berlin, 1995.
Hongu, T. and Phillips, G. O. (1997): New Fibers, Second ed., Woodhead Publishing Ltd, Cambridge,1997.
Hordijk, D. (1991): Local Approach to Fatigue of Concrete, Ph.D. thesis, Technical University of Delft.
Ibrahim, O.T. and Luxmoore, A.R. (1976): Control of crack width by inclusion of fibres in conventionallyreinforced concrete, Cement Composites, Vol. 1, No. 2, July 1976, pp. 77-89.
JCI-SF (1984): JCI Standards for Test Methods of Fiber Reinforced Concrete, Japan Concrete Institute.
Johansson, M. (2000): Structural Behaviour in Concrete Frame Corners of Civil Defence Shelters. Ph.Dthesis, Chalmers University of Technology, Publication 00:2, Göteborg, March 2000. 220 pp.
Johnston, D. W. (1997): Design and Construction of Concrete Formwork, in Concrete ConstructionEngineering Handbook, edited by E.G Nawy, CRC Press.
Kanstad, T. (ed.) (2003): Design Rules for Steel Fibre Reinforced Concrete Structures, Proc. Nordicminiseminar, Oslo, October 2003. The Nordic Concrete Federation, Oslo.
Kanstad, T. and Døssland, Å. (2003): Moment capacity of beams with different cross section height andsteel fibre content: Results from tests, simplified calculations and FE analysis. In Design Rules forSteel Fibre Reinforced Concrete Structures (ed. T. Kanstad), Proc. Nordic miniseminar, Oslo,October 2003. The Norwegian Concrete Association, Oslo, pp. 129-139.
Kanstad, T. and Døssland, Å. (2004): Testing and Modelling of Steel Fibre Reinforced Concrete BeamsDesigned for Moment Failure. In Fracture Mechanics of Concrete Structures, Vol 2, Li et al.(eds.), Proceedings of FRAMCOS-5, Vail, Colorado, U S A, April 2004, pp. 1171-1178.
Karihaloo, B. L. (1995): Fracture Mechanics & Structural Concrete, Concrete Design and ConstructionSeries, Longman Scientific & Technical, Essex, England.
Karihaloo, B.L, Xiao, Q.Z., and Abdalla, H.M. (2004): Strength size effect in quasi-brittle structures. InFracture Mechanics of Concrete Structures, Vol 1, eds. Li et al., pp. 163-171, Proceedings ofFRAMCOS-5, Vail, Colorado, USA, April 2004.
Kim J.-K. and Kim Y.-Y. (1999): Fatigue crack growth of high-strength concrete in wedge-splitting test.Cem. and Concrete Research 29 (1999), pp. 705–712.
Kim, J-K. and Mai, Y-W. (1998): Engineered interfaces in fiber reinforced composites. Elsevier, Oxford,1998.
Kitsutaka, Y. (1995): Fracture parameters of concrete based on poly-linear approximation analysis oftension softening diagrams. In Fracture Mechanics of Concrete Structures, ed. Wittman, F.H.,Aedificatio Publisher, Freiburg, Germany, pp. 199-208.
Kitsutaka, Y. (1997): Fracture parameters by polylinear tension-softening analysis. J. of Eng. Mechanics123(5), pp. 444-450.
Kitsutaka, Y., Uchida, Y., Mihashi, H., Kaneko, Y., Nakamura, S., and Kurihara, N. (2001): Draft on theJCI Standard Test Method for Determining Tension Softening Properties of Concrete. In FractureMechanics of Concrete Structures, eds. de Borst et al., Swets & Zeitlinger, Lisse, the Netherlands.
Kooiman, A.G. (2000): Modelling Steel Fibre Reinforced Concrete for Structural Design. Ph.D. Thesis,Department of Structural and Building Engineering, Delft University of Technology.

CHALMERS, Civil and Environmental Engineering138
Koskela, Lauri (1992): Application of the new Production Philosophy to Construction. Technical Report#72. Centre for Integrated Facility Engineering. Department of Civil Engineering. Stanford.
Koskela, Lauri (2000): An exploration towards a production theory and its application to construction.VTT Publications 408. Technical Research Centre of Finland, Espoo.
Krenchel, H. (1964): Fibre Reinforcement – Theoretical and practical investigations of the elasticity andstrength of fibre-reinforced materials. Ph.D. thesis, Laboratory of Structural Research, TechnicalUniversity of Denmark. Akademisk Forlag, Copenhagen.
Krenchel, H. (1974): Fiber Reinforced Brittle Matrix Materials, In Fiber Reinforced Concrete,Publication SP-44, American Concrete Institute, Detroit, pp. 45-68.
Krenchel, H. (1975): Fibre Spacing and Specific Fibre Surface. In Fibre-Reinforced Cement andConcrete, ed. Neville, The Construction Press, UK, pp. 69-79.
Kullaa, J: (1994): Constitutive modelling of fibre-reinforced concrete under uniaxial tensile loading,Composites, Vol. 25. No. 10, pp. 935-944.
Lambrechts, A.N. (2004): The variation of steel fibre characteristics – Study on toughness results 2002-2003. In Fibre Reinforced Concrete from Theory to Practice, eds. S. Ahmad, M. di Prisco, C.Meyer, G.A. Plizzari, S. Shah, International Workshop on Advances in Fiber Reinforced Concrete,Bergamo, Italy, Sept. 24-25, 2004, pp. 135-148.
Lawler, J.S., Wilhelm, T., Zampini, D., and Shah, S.P. (2003): Fracture processes of hybrid fiber-reinforced mortar. Materials and Structures, Vol. 36, April 2003, pp. 197-208.
Leite J.P. de B., Slowik V. and Mihashi H. (2004): Mesolevel models for simulation of fracture behaviourof fibre reinforced concrete. In Fibre-Reinforced Concrete, Proceedings of the Sixth InternationalRILEM Symposium, eds. di Prisco et al.
Leung, C.K.Y. and Chi, J. (1995): Crack-bridging force in random ductile fibre brittle matrix composites.Journal of Engineering Mechanics, Vol. 121, No. 2, December 1995, pp. 1315-1324.
Leung, C.K.Y. and Li, V.C. (1991): New strength-based model for debonding of continuous fibres in anelastic matrix. Journal of Material Science, 26 (1991), pp. 5996-6010.
Leung, C.K.Y. and Li, V.C. (1992): Effect of fibre inclination on crack bridging stress in brittle fiberreinforced matrix composites. Journal of Mech. Phys. Solids, Vol. 40, No. 6, pp. 1333-1362.
Li, F. (1998): Fracture Characterization of Fiber Reinforced Concrete in Direct Uniaxial Tension. Ph.D.thesis, the Hong Kong University of Science and Technology, 1998.
Li, V.C. (1989): Technological Implications of Concrete Fracture Research – An Overview of TensileFailure in Cementitious Materials and Structures, in Fracture Mechanics: Application to Concrete,Eds. V.C. Li and Z. Bazant, ACI SP-118, pp. 1-16.
Li, V. C. (1993): From Micromechanics to Structural Engineering – The design of cementitiouscomposites for civil engineering applications, Structural Eng. / Earthquake Eng., Vol. 10, No. 2,July 1993, pp. 37-48.
Li, V.C. (1995): New Construction Materials Proliferate in Japan, Civil Engineering, August 1995.
Li, V.C. (2002): Large volume, high-performance applications of fibers in civil engineering, Journal ofApplied Polymer Science, Vol. 83, John Wiley & Sons, pp. 660-686.
Li, V.C. and Maalej, M. (1996a): Toughening in Cement Based Composites. Part I: Cement, Mortar, andConcrete, Cement & Concrete Composites 18 (1996), pp. 223-237.
Li, V.C. and Maalej, M. (1996b): Toughening in Cement Based Composites. Part II: Fiber ReinforcedCementitious Composites, Cement & Concrete Composites 18 (1996), pp. 239-249.
Li, V.C. and Stang, H. (1997): Interface Property Characterization and Strengthening Mechanisms inFibre Reinforced Cement Based Composites. Journal of Advanced Cement Based Materials,1997(6), pp. 1-20.
Li, V.C. and Stang, H. (2001): Meso: Averaging, In Mechanics of Fibre Reinforced Cement BasedComposites, International Graduate Research School in Applied Mechanics, course material,Lyngby, Denmark 2001.

CHALMERS, Civil and Environmental Engineering 139
Li, V.C., Stang, H., and Krenchel, H. (1993): Micromechanics of crack bridging in fibre-reinforcedconcrete, Materials and Structures, 1993, 26, pp. 486-494.
Li, V.C., Wang, Y., and Backer, S. (1990): Effect of inclining angle, bundling and surface treatment onsynthetic fiber pull-out from cement matrix, Composites 21(2), pp.132–140.
Lin, Y-Z. (1999): Tragverhalten von Stahlfaserbeton, Deutscher Ausschuss für Stahlbeton, Heft 494,Berlin, 1999. (In German)
Lin, Y-Z. (2000): Method of dimensioning for stress caused by bending and perpendicular force,Betonwerk + Fertigteil-Technik, BFT 3/2000, pp. 64-70.
Linsbauer, H.N. and Tschegg, E.K. (1986): Fracture energy determination of concrete with cube shapedspecimens, Zement und Beton 31, pp. 38-40.
Locher, F.W., Richartz, W. and Sprung, S. (1976): Erstarren von Zement (in German), Zement Kalk Gips29(10), pp. 435-442.
Lok, T.-S. and Pei, J.-S. (1998): Flexural Behaviour of Steel Fiber Reinforced Concrete, Journal ofMaterials in Civil Engineering, Vol. 10 No. 2, May 1998, pp. 86-97.
Lok, T.-S. and Xiao, J.R. (1999): Flexural Strength Assessment of Steel Fiber Reinforced Concrete,Journal of Materials in Civil Engineering, Vol. 11 No. 3, August 1999, pp. 188-196.
Löfgen, I. (2002): In-situ concrete building systems – developments for industrial construction. Licentiatethesis, Publication No. 02:2, Dept. of Structural Engineering, Chalmers University of Technology,138 pp.
Löfgren, I. (2004): The wedge splitting test – a test method for assessment of fracture parameters of FRC?In Fracture Mechanics of Concrete Structures, Vol. 2, Li et al. (eds.), Proceedings of FRAMCOS-5, Vail, Colorado, USA, April 2004, pp. 1155-1162.
Löfgren, I. and Gylltoft, K. (2001): In-situ cast concrete building: Important aspects of industrialisedconstruction, Nordic Concrete Research, 1/2001, 2001, pp. 61-81.
Löfgren, I., Olesen J.F., and Flansbjer, M. (2004a): Application of WST-method for fracture testing offibre-reinforced concrete. Report 04:13, Department of Structural Engineering and Mechanics,Chalmers University of Technology, Göteborg 2004, 52 pp.
Löfgren, I., Stang, H. and Olesen, J.F. (2004b): Wedge splitting test – a test to determine fractureproperties of FRC. In Fibre-Reinforced Concretes - BEFIB 2004 –Proceedings of the Sixth RILEMsymposium. Eds. M.di Prisco, R. Felicetti, and G.A. Plizzari. Varenna, Italy, 20th-22nd September2004. PRO 39, RILEM Publications S.A.R.L, Bagneaux, pp. 379-388.
Lok, T.-S. and Pei, J.-S. (1998): Flexural Behaviour of Steel Fiber Reinforced Concrete, Journal ofMaterials in Civil Engineering, Vol. 10 No. 2, May 1998, pp. 86-97.
Lok, T.-S. and Xiao, J.R. (1999): Flexural Strength Assessment of Steel Fiber Reinforced Concrete,Journal of Materials in Civil Engineering, Vol. 11 No. 3, August 1999, pp. 188-196.
Low, N.M.P., Beaudoin, J.J. (1993): Flexural strength and microstructure of cement binders reinforcedwith wollastonite micro-fibers, Cement and Concrete Research, 23, 1993, pp. 905-916.
Lundgren, K, Helgesson, J, and Sylvén R. (2005): Joints in lattice girder structures. Chalmers Universityof Technology, Department of Civil and Environmental Engineering, Structural Engineering -Concrete Structures, Report 2005:9, Göteborg, 68 pp.
Lundgren, K. (1999): Three-Dimensional Modelling of Bond in Reinforced Concrete. Theoretical Model,Experiments and Applications. Ph.D. thesis Chalmers University of Technology, Publication 99:1,Göteborg, November 1999. 129 pp.
Maidl, B.R. (1995): Steel fibre reinforced concrete, Ernst & Sohn, Berlin 1995, p. 292.
Mandel, J.A., Wei, S., and Said, S., (1987): Studies of the Properties of The Fiber Matrix Interface inSteel Fiber Reinforced Mortar, ACI Material Journal, March-April, pp. 101-109.
Markovic, I., Walraven, J.C., and van Mier J.G.M. (2004): Tensile behaviour of high performance hybridfibre concrete. In Fracture Mechanics of Concrete Structures, Vol 2, eds Li et al., Proceedings ofFRAMCOS-5, Vail, Colorado, USA, April 2004, pp. 1113-1120.

CHALMERS, Civil and Environmental Engineering140
Marti, P., Pfyl, T., Sigrist, V., and Ulaga, T. (1999): Harmonized Test Procedures for Steel Fiber-Reinforced Concrete. ACI Materials Journal, Vol. 96, No. 6, Nov.-Dec. 1999, pp. 676-685.
Martin, G.C (1927): Method of forming pipes, US Patent No. 1,633,219, 17 Dec. 1926.
Meda A., Plizzari G.A. and Slowik V. (2001): Fracture of fiber reinforced concrete slabs on grade. InFracture Mechanics of Concrete Structures, FRAMCOS-4, ed. De Borst et al., Swets & Zeitlinger,Lisse, the Netherlands. pp.1013-1020.
Meda, A., Plizzari, G.A., and Sorelli, L. (2004): Uni-axial and bending test for the determination offracture properties of fiber reinforced concrete. In Fracture Mechanics of Concrete Structures,Vol. 2, eds. Li et al., Proceedings of FRAMCOS-5, Vail, Colorado, USA, April 2004, pp. 1163-1170.
Mindess, S. (1995): Fibre Reinforced Concrete: Challenges and Prospects. In Fiber Reinforced Concrete– Modern Developments, Banthia, N. and Mindess, S. (eds.). The second University-IndustryWorkshop on Fibre Reinforced Concrete and Other Composites held in Toronto, Canada, March26-29, 1995, pp. 1-11.
Mindess, S., Taerwe, L., Lin, Y-Z., Ansari, F., and Batson, G. (1996): Standard testing, In HighPerformance Fiber einforced Cement Composites 2. Eds A.E. Naaman and H.W. Reinhardt, E &FN Spon, London 1996, pp. 383-421.
Mindess, S., Young, J.F., and Darwin, D (2003): Concrete, 2nd ed. Prentice Hall, Upper Saddle RiverNew Jersey, 2002.
Mohamed, A.R. and Hansen, W. (1999): Micromechanical modeling of crack-aggregate interaction inconcrete materials, Cement & Concrete Composites, 21 (1999), Elsevier, pp. 349-359.
Müller, J. P. (1991): Element or Lattice Girder Floors – Conventionally Reinforced and Prestressed –with Costing Examples, Betonwerk + Fertigteil-Technik, BFT 4/1991, pp. 44-50.
Naaman, A.E. (1985): Fiber Reinforcement for Concrete, Concrete International, March 1985, pp. 21-25.
Naaman, A.E. (2003): Engineered Steel Fibers with Optimal Properties for Reinforcement of CementComposites, Journal of Advanced Concrete Technology, Vol. 1, No. 3, pp. 241-252.
Naaman, A.E. and Shah, S.P. (1976): Pull-Out Mechanism in Steel Fibre-Reinforced Concrete. Journal ofthe Structural Division, ASCE, 102(ST8), pp. 1537-1548.
Naaman, A.E., Wongtanakitcharoen, T., and Hauser, G. (2005): Influence of Different Fibres on PlasticShrinkage Cracking of Concrete. ACI Materials Journal, V. 102, No. 1, Jan-Feb 2005, pp. 49-58.
Namur, G.G. and Naaman, A.E., (1989): A Bond Stress Model for Fiber Reinforced Concrete Based onBond Stress Slip Relationship, ACI Material Journal, Vol. 86, No. 1, pp. 45-57.
Nanakorn, P. and Horii, H. (1996): A fracture-Mechanics-Based Design Method for SFRC TunnelLinings. Tunnelling and Underground Space Technology, Vol 11, No 1 (1996). pp. 39-43.
Nanakorn P. and Horii H. (1996b): Back analysis of tension-softening relationship of concrete. J.Materials, Conc. Struct., Pavements 32(544), pp. 265-275.
Nelson, P.K, Li, V.C, and Kamada, T. (2002): Fracture Toughness of Microfiber Reinforced CementComposites, Journal of Materials in Civil Engineering, September/October 2002, pp. 384–391.
Nemegeer D., Vanbrabant J. and Stang H. (2003): Brite Euram Program on Steel Fibre Concret Subtask:Durability: Corrosion Resistance of Cracked Fibre Reinforced Concrete. In Test and DesignMethods for Steel Fibre Reinforced Concrete – Background and Experiences, Proceedings of theRILEM TC 162-TDF Workshop, eds. Schnütgen and Vandevalle, pp. 47-66.
Neville, A. M. (1997): Aggregate Bond and Modulus of Elasticity of Concrete, ACI Materials Journal,January-February 1997, pp. 71-74.
Neville, A.M. (2000): Properties of Concrete, fourth edition. Pearson Educion Limited.
Olesen, J. F. (2001a): Fictitious crack propagation on fibre-reinforced concrete beams. ASCE, J. of Eng.Mech. 127(3) 2001, pp. 272-280.

CHALMERS, Civil and Environmental Engineering 141
Olesen, J.F. (2001b): Cracks in reinforced FRC beams subjected to bending and axial load. in FractureMechanics of Concrete Structures. eds. de Borst et al. FRAMCOS-4. A.A. Balkema Publishers(2001) pp. 1027-1033.
Olesen, J.F., Østergaard, L., and Stang, H. (2004): Nonlinear Fracture Mechanics and PlasticityModelling of the Split Cylinder Test, In Proceedings of the International Symposium “BrittleMatrix Composites 7”, ZTUREKRSI and Woodhead Publishing, Warsaw, pp. 467-476.
Olson P.C. (1994): Some comments on the bending strength of concrete beams. Mag. of ConcreteResearch, 1994:46, pp. 209-214.
Ooi, P.S.K. and Ramsey, T.L. (2003): Curvature and Bending Moments from Inclinometer Data,International Journal of Geomechanics, ASCE, Vol. 3, No. 1, September 1, 2003, pp. 64-74.
Otsuka, K. and Date H. (2000): Fracture process zone in concrete tension specimen, EngineeringFracture Mechanics, 65(2000), pp. 111-131.
Ozawa K., Maekawa K. and Okamura H (1992): Development of High Performance Concrete, Journal ofthe Faculty of Engineering, the University of Tokyo, Vol. XLI, No. 3 (1992), Tokyo, pp. 381-439.
Patrick M. (1998): The Application of Structural Steel Decking in Commercial and Residental Buildings.Malaysian Structural Steel Association, Convention 1998.
Pedersen, C. (1996): New production processes, materials and calculation techniques for fibre reinforcedconcrete pipes. PhD thesis Dep. of Structural Eng. and Materials, Technical University ofDenmark, Series R, no. 14, 1996.
Petersson, P.E. (1981): Crack growth and development of fracture zones in plain concrete and similarmaterials. PhD-thesis, Report TVBM-1006, Division of Building Materials, Lund Institute ofTechnology, 174 pp.
Pfyl, T. (2003):Tragverhalten von Stahlfaserbeton. Ph.D. dissertation, ETH, Zürich, 2003. (In German)
Planas J., Elices M., and Guinea G.V. (1992): Measurement of the fracture energy using three-point-bendtests: 2 Influence of bulk energy dissipation. Materials and Structures, 1992:25, pp. 305-312.
Planas J., Guinea G.V., and Elices M. (1999): Size effect and inverse analysis in concrete fracture,International Journal of Fracture 95(1999), pp. 367-378.
prEN 14889-1 DRAFT (2004): Fibres for concrete - Part 1: Steel fibres. Definition, specifications andconformity, Ref. No. prEN 14889-1:2004: E, CEN European Committee for Standardization,Brussels.
prEN 14889-2 DRAFT (2004): Fibres for concrete - Part 2: Polymer fibres - Definition, specificationand conformity, Ref. No. prEN 14889-2:2004: E, CEN European Committee for Standardization,Brussels.
Que, N.S. and Tin-Loi, F. (2002): Numerical evaluation of cohesive fracture parameters from a wedgesplitting test, Engineering Fracture Mechanics 69(2002), pp. 1269-1286.
Rao, C.V.S.K (1979): Effectiveness of random fibres in composites. Cement and Concrete Research, Vol.9, pp. 685-693.
Rasmussen, T.V. (1997): Time Dependent Interfacial Parameters in Cementitious Composite Materials.PhD-thesis, Department of Structural Engineering and Materials, Technical University ofDenmark, No 33, 1997.
Rebentrost, M. (2003): Deformation Capacity and Moment Redistribution of Partially PrestressedConcrete Beams, Ph.D. dissertation, Department of Civil and Environmental Engineering,Adelaide University, Australia.
Reinhardt H.W. and A. E. Naaman (eds) (1992): High Performance Fiber Reinforced Cement Composites1, E & FN Spon, London.
Reinhardt H.W. and A. E. Naaman (eds) (1996): High Performance Fiber Reinforced Cement Composites2, E & FN Spon, London.
Reinhardt, H.W. (1984): Fracture mechanics of an elastic softening material like concrete. Heron 29, 2.

CHALMERS, Civil and Environmental Engineering142
Reinhardt, H.W., Cornelissen, H.A.W., and Hordijk, D.A. (1986): Tensile tests and failure analysis ofconcrete, Journal of Structural Engineering, ASCE, 112(5), pp. 448-464.
RILEM Recommendation AAC13.1 (1994): Determination of the specific fracture energy and strainsoftening of AAC, RILEM Technical Recommendations for the testing and use of constructionmaterials, E & FN Spon, 1994, pp. 156–158.
RILEM Report 5 (1991): Fracture Mechanics Test Methods for Concrete. Edited by S.P. Shah and A.Carpinteri. Chapman and Hall, London, 1991.
RILEM TC 162- TDF (2000): Test and design methods for steel fibre reinforced concrete: σ-ε- DesignMethod, (Chairlady L. Vandewalle), Materials and Structures, Vol. 33 March 2000, pp. 75-81.
RILEM TC 162-TDF (2001): Test and design methods for steel fibre reinforced concrete.Recommendations for uni-axial tension test. Materials and Structures 34, Jan-Feb 2001, pp. 3-6.
RILEM TC 162- TDF (2002): Design of steel fibre reinforced concrete using the σ-w method - principlesand applications, (Chairlady L. Vandewalle), Materials and Structures, Vol. 35 June 2002, pp.262-278.
RILEM TC 162-TDF (2002a): Test and design methods for steel fibre reinforced concrete. Bending test –Final Recommendation. Materials and Structures 35, Nov 2002, pp. 579-582.
RILEM TC 162-TDF (2002b): Brite Euram Project nr: BE 97-4163, Test and Design Methods for SteelFibre Reinforced Concrete, ISBN 90-5682-358-2, June 2002.
RILEM TC 162- TDF (2003a): Test and design methods for steel fibre reinforced concrete: σ-ε- DesignMethod Final Recommendation, (Chairlady L. Vandewalle), Materials and Structures, Vol. 36October 2003, pp. 560-567.
RILEM TC 162-TDF (2003b): Test and design methods for steel fibre reinforced concrete: Backgroundand Experiences. Proceedings of the RILEM TC 162-TDF Workshop, eds. B. Schnütgen and L.Vandewalle. PRO 31, RILEM Publications S.A.R.L., Bagneaux, 2003.
RILEM TC 89-FMT (1991): Fracture Mechcanics Test Methods for Concrete, Report of TechnicalCommittee 89-FMT, Eds. S.P. Shah and A. Carpinteri, RILEM Report 5, Chapman and Hall,Cambridge, 1991.
Roelfstra P.E. and Wittmann F.H. (1986): Numerical method to link strain softening with failure ofconcrete. In Fracture Toughness and Fracture Energy of Concrete, Elsevier, pp. 163-175.
Rokugo, K., Iwasa, M., Seko, S., and Koyanagi, W. (1989): Tension-softening diagrams of steel fiberreinforced concrete, In: Fracture of Concrete and Rock, Recent Developments, Eds. Shah, S.P.,Swartz, S.E., and Barr, B., Elsevier, New York, pp. 513-522.
Romualdi, J.P. and Batson, G.B. (1963): Mechanics of crack arrest in concrete. Proceedings, AmericanSociety of Civil Engineers, Journal, Engineering Mechanics Division, Vol. 89, EM3, June 1963,pp. 147-68.
Romualdi, J.P. and Mandel, J.A. (1964): Tensile strength of concrete affected by uniformly distributedand closely spaced short lengths of wire reinforcement. ACI J. Proc. 61(6) 1964, pp. 657-671.
Rosenbuch, J. (2003): Zur Querkrafttragfähigkeit von Balken aus stahlfaseverstärktem Stahlbeton. PhDthesis, Fachbereich Bauingenieurwesen der Technischen Universität Corolo-Wilhelmina zuBraunschweig. (In German)
Rossi, P. (1997): High performance multimodal fiber reinforced cement composites (HPMFRCC): TheLCPC experience, ACI Materials Journal, V. 94, No. 6, pp. 478-483.
Rossi P., Acker, P., and Malier, P. (1987): Effect of steel fibres at two different stages: the material andthe structure, Materials and Structures, Vol. 20, pp. 436-439.
Rossi, P. and Chanvillard, G. (eds.) (2000): Fibre-Reinforced Concretes (FRC), Proceedings of the FifthInternational RILEM symposium, BEFIB 2000. PRO 15, RILEM Publications S.A.R.L, Bagneaux,pp. 29-50.
Rots, J.G. (1988): Computational modeling of concrete fracture. PhD thesis Delft University ofTechnology, Delft, The Netherlands.

CHALMERS, Civil and Environmental Engineering 143
Sarja, A. (1998): Open and Industrialised Building. CIB Publication 222, Report of Working CommissionW24. E & FN Spon. London, 1998, pp. 3-94 &159-184.
Schumacher, P., Den Ujil, J.A., Walraven, J.C. (2003): Fracture energy determined from three pointbending tests on self-compacting steel fiber reinforced concrete, Stevin-report 25.5-03-18,Department of Structural and Building Engineering, Delft University of Technology.
Shah, S. P. (1991): Do Fibers Increase the Tensile Strength of Cement-Based Matrixes? ACI MaterialJournal, V. 88, No. 6, Nov-Dec 1991, pp. 595-602.
Shah, S.P. and Ahmad, S.H. (eds.) (1994): High Performance Concretes and Applications. EdwardArnold.
Shah S.P, Ouyang C. and Swartz S.E. (1995): Fracture mechanics of concrete: Applications of fracturemechanics to concrete, rock, and other brittle materials. John Wiley and Sons, New York.
Silfwerbrand, J. (2001): The Design of Steel Fibre Reinforced Concrete Structures, Proc. Nordicminiseminar, Stockholm, June 12, 2001. The Nordic Concrete Federation, Oslo.
Simone, A. (2003): Continuous-Discontinuous Modelling of Failure, Ph.D. thesis, Faculty of CivilEngineering, Delft University of Technology, 2004, 198 pp.
Soroushian, P. and Lee, C-D. (1990): Distribution and Orientation of Fibers in Steel Fiber ReinforcedConcrete, ACI Material Journal, V. 87, No. 5, Sept-Oct 1990, pp. 433-439.
SOU 2000:44: Från byggsekt till byggsektorn. Byggkostnadsdelegationen, 2000. (In Swedish.)(http://www.regeringen.se/propositioner/sou/index.htm)
Sousa, J.L.A.O, Gettu, R., and Barragán, B.E. (2002): Obtaining the σ–w curve from the inverse analysisof the notched beam response. In Annex D of Barragán, B.E. (2002) ‘Failure and toughness ofsteel fiber reinforced concrete under tension and shear’, Ph.D. Thesis, Universitat Politécnica deCatalunya, Barcelona, Spain, 2002.
Sousa, J.L.A.O. and Gettu R. (2004): Inverse analysis of notched-beam test data for obtaining tensilestress-crack opening relation of fiber reinforced concrete. In BEFIB 2004 - Sixth RILEMsymposium on fibre reinforced concrete (FRC), Varenna, Italy, 20th-22nd September 2004. PRO39, RILEM Publications S.A.R.L, Bagneaux, pp. 809-818.
Stang, H. (1987): A double inclusion model for microcrack arrest in fibre reinforced brittle materials. J.Mech. Phys. Solids Vol. 35, No. 3, pp. 325-342.
Stang, H. (1992): Evaluation of properties of cementitious fiber composite materials, in H. W. Reinhardt& A. E. Naaman (eds), High Performance Fiber Reinforced Cement Composites, Vol. 1, E & FNSpon, London, pp. 388–406.
Stang, H. (1996): Significance of shrinkage-induced clamping pressure in fiber-matrix bonding incementitious composite materials, Advanced Cement Based Materials, 4, pp. 106–115.
Stang, H (2004): Toughness in testing and design, the FRC experience. In Fracture Mechanics ofConcrete Structures, Vol 1, eds. Li et al., Proceedings of FRAMCOS-5, Vail, Colorado, USA,April 2004, pp. 61-69.
Stang, H. and Bendixen S. (1998): A simple model for uniaxial testing of fiber reinforced concrete. InExperimental Mechanics, Advances in Design, Testing and Analysis. (Ed. I. M. Allison.) AA.Balkema. Rotterdam, Brookfield, pp. 887-892.
Stang, H., Gettu, R., and Barr, B. (2000): Test Methods for the Characterization of Steel Fiber ReinforcedConcrete - A State-of-the-Art Report. Report of Sub-task 1.1 Test and Design Methods for SteelFiber Reinforced Concrete Brite-EuRam Project BRPR-CT98-0813 (DG12-BRPR), 51 pp.
Stang, H. and Li, V.C. (2001): Mechanics of Fibre Reinforced Cement Based Composites, InternationalGraduate Research School in Applied Mechanics, course material, Lyngby, Denmark 2001.
Stang, H and Li, V.C. (2004): Classification of fibre reinforced cementitious materials for structuralapplications. In BEFIB 2004 – Sixth RILEM symposium on fibre reinforced concrete (FRC),Varenna, Italy, 20th-22nd September 2004. PRO 39, RILEM Publications S.A.R.L, Bagneaux,pp197-218.

CHALMERS, Civil and Environmental Engineering144
Stang, H. and Shah, S.P. (1990): Pull-out problem: Stress Versus Fracture Mechanical Approach. ASCE J.Eng. Mech., Vol 116, No 10, pp. 2136-2150.
Stang, H. and Olesen, J.F. (2000): A fracture mechanics based design approach to FRC, In Fibre-Reinforced Concretes (FRC), BEFIB’ 2000, eds. P. Rossi & G. Chanvillard, RILEM PublicationsS.A.R.L., Cachan Cedex, France. Proceedings of the Fifth International RILEM Symposium, pp.315–324.
Stang, H., and Olesen, J.F. (1998): On the interpretation of bending tests on FRC-materials. In FractureMechanics of Concrete Structures (eds. Mihashi and Rokugo), Proceedings FRAMCOS-3, Vol. 1,D-79104 Freiburg, Germany, 1998. Aedificatio Publishers, pp. 511-520.
Sujivorakul, C., Waas, A.M., and Naaman, A.E. (2000): Pull-out response of a smooth fiber with an endanchorage. Journal of Engineering Mechanics / September 2000, pp. 986-993.
Svahn, P.-O. (2005): Dynamic Behaviour of Reinforced Concrete Structures – Analyses with a StrongDiscontinuity Approach. Ph.D. thesis, Department of Civil and Environmental Engineering,Chalmers University of Technology.
Swedish Concrete Society (1997): Betongrapport nr. 4. Stålfiberbetong – rekommendationer förkonstruktion, utförande och provning, Utgåva 2, Svenska Betongföreningen, Stockholm, Nov.1997, 135 pp.
Taerwe, L. and Van Gysel, A. (1996a): Influence of steel fibres on design stress–strain curve forhighstrength concrete. Journal of Engineering Mechanics, 1996, 122, No. 8, pp. 695-704.
Taerwe, L. and van Gysel, A. (1996b): Effect of Steel Fibers on the Design Stress-Strain Curve for HighStrength Concrete Subjected to Axial Compression, Mechanics of Composite Materials, V. 32, No.2, pp. 122-129.
Tan, K.-H., Paramasivam, P., and Tan, K.-C. (1995): Cracking Characteristics of Reinforced Steel FiberConcrete Beams under Short- and Long-Term Loadings, Advanced Cement Based Materials, pp.127-137.
Tasderi and Karihaloo (2001): Effect of type and volume fraction of aggregate on the fracture propertiesof concrete, in Fracture Mechanics of Concrete Structures, de Borst et al. (eds), Swets &Zeitlinger, Lisse, 2001, pp. 123-129.
Taylor, M., Lyndon, F.D., and Barr, B.I.G. (1997): Toughness Measurements on Steel Fibre-reinforcedHigh Strength Concrete. Cement and Concrete Composites, Vol. 19 (1997), pp. 329-340.
Tennis, P.D. and Jennings, H.M. (2000): A Model for Two Types of Calcium Silicate Hydrate in theMicrostructure of Portland Cement Pastes, Cement and Concrete Research, June 2000, pp. 855-863.
Thorenfeld, T.E., Tomaszewicz, A., and Jensen, J.J. (1987): Mechanical Properties of High-StrengthConcrete and Application in Design. Utilization of High Strength Concrete, Symposium inStavanger, Norway, 1987. Tapir N-7034 Trondheim.
Tijssens, M.G.A., Sluys, L.J., and van der Giessen, E. (2001): Simulation of cementitious compositeswith explicit modeling of microstructural features, Engineering Fracture Mechanics, 68 (2001),Pergamon, pp. 1245-1263.
TNO (2002): DIANA Finite Element Analysis, User's Manual, release 8.1. TNO Building andConstruction Research, 2002.
Trunk, B., Schober, G., and Wittmann, F.H. (1999): Fracture mechanics parameters of autoclaved aeratedconcrete. Cement and Concrete Research 29 (1999), pp. 855-859.
Trygstad, S. (2001): Structural Behaviour of Post Tensioned Concrete Structures: Flat Slab. Slabs onGround. Ph.D. thesis, Norwegian University of Science and Technology, 279 pp.
Uchida, Y. and Barr, B.I.G (1998): Tension softening curves of concrete determined from different testspecimen geometries, In Fracture Mechanics of Concrete Structures, FRAMCOS-3, eds. Mihashi,H. and Rokugo, K., Aedificato Publisher, Freiburg, Germany, pp. 387-398.
Uchida, Y., Kurihara, N., Rokugo, K., and Koyanagi, W. (1995): Determination of tension softeningdiagrams of various kinds of concrete by means of numerical analysis. In Fracture Mechanics ofConcrete Structures, FRAMCOS-2, ed. F.H. Wittmann, pp. 17-30.

CHALMERS, Civil and Environmental Engineering 145
Ulfkjær, J.P., Krenk, S., and Brinckner, R. (1995): Analytical model for fictitious crack propagation inconcrete beams. ASCE, J. Eng. Mech., 121(1) (1995), pp. 7-15.
van Gysel, A. (1999): A pull-out model for hooked end steel fibres. In High Performance FiberReinforced Cement Composites – HPFRCC 3, RILEM Proceedings, PRO 6, RILEM PublicationsS.A.R.L., Cachan, France, pp. 351-359.
van Mier, J.G.M. (1991): Mode I fracture of concrete: Discontinuous crack growth and crack interfacegrain bridging, Cement and Concrete Research, 21 (1991), Pergamon, pp. 1-15.
van Mier, J.G.M. (1997): Fracture processes of concrete, CRC Press, Boca Raton, Florida.
van Mier, J.G.M. (2004): Reality Behind Fictitious Cracks? In Fracture Mechanics of ConcreteStructures, Vol 1, eds. Li et al., Proceedings of FRAMCOS-5, Vail, Colorado, USA, April 2004,pp. 11-30.
van Mier, J.G.M. and van Vliet, M.R.A. (1999): Experimentation, numerical simulation and the role ofengineering judgement in the fracture mechanics of concrete and concrete structures, Constructionand Building Materials, 13(1999), Elsevier, pp. 3-14.
Vecchio, F. J. and Collins, M. P. (1993): Compression Response of Cracked Reinforced Concrete. J. Str.Eng., ASCE 119, 12 (1993), pp. 3590-3610.
Verdugo, G. (2001): Full-scale Tests and Analytical Model for Lattice Girder Elements, Master’s Thesis01:11, Dept. of Structural Engineering – Concrete Structures, Chalmers University of Technology,Göteborg, Sweden, 2001, 53 pp.
Villmann, B., Villmann, T., and Slowik, V. (2004): Determination of softening curves by backwardanalyses of experiments and optimization using an evolutionary algorithm. In Fracture Mechanicsof Concrete Structures, FRAMCOS-5, eds. Li et al., Proceedings of FRAMCOS-5, Vail, Colorado,USA, April 2004, pp. 439-445.
Vonk, R. A. (1992): Softening of concrete loaded in compression. Ph.D. thesis, Technical University ofEindhoven.
Voo, J.Y.L. and Foster, S.J. (2003): Variable engagement model for fibre reinforced concrete in tension,UNICIV Report R-420, School of Civil and Environmental Engineering, University of New SouthWales, Australia, 2003.
Walraven J. (1999): The evolution of concrete. Structural Concrete – Journal of the fib, No. 1, March,Thomas Telford, pp. 3-11.
Walter, R., Østergaard, L., Olesen, J.F., and Stang, H. (2005): Wedge splitting test for a steel–concreteinterface. Journal of Engineering Fracture Mechanics, Vol. 72, Issue 17, pp. 2565–2583.
Wang, Y., Li, V.C., and Backer, S. (1989): Modelling of Fibre Pull-Out from a Cement Matrix.International Journal of Cement Composites & Lightweight Concrete, Vol. 10, No. 3, pp. 143-149.
Wang, Y., Li, C.V. and Backer, S. (1990a): Tensile Properties of Synthetic Fiber Reinforced Mortar,Cement and Concrete Composites, Vol. 12, pp. 29-40.
Wang, Y., Li, C.V. and Backer, S. (1990b): Experimental Determination of Tensile Behavior of FiberReinforced Concrete, ACI Materials Journals, Vol. 87, No. 5, Sept-Oct, pp. 461-468.
Warner, R.F., Rangan, B.V., Hall, A.S., and Faulkes, K.A. (1998): Concrete Structures, Longman,Melbourne, 1998.
Warszawski, A. (1999): Industrialized and Automated Building Systems – A managerial approach, E &FN Spon, London, 1999.
Wongtanakitcharoen, T. and Naaman, A.E. (2004): Early age bond strength development of fibres in FRCcomposites. In Fibre-Reinforced Concretes, Proceedings of the Sixth International RILEMSymposium, Varenna, Italy, 20-22 September 2004, pp. 431-442.
Wu, K-R, Chen, B., Yao, W., and Zhang, D. (2001): Effect of coarse aggregate type on mechanicalproperties of high-performance concrete, Cement and Concrete Research, 31 (2001), Pergamon,pp. 1421-1425.
Zheng, Z. and Feldman, D. (1995): Synthetic Fibre-Reinforced Concrete, Prog. Polym. Sci., Vol. 20, pp.185-210.

CHALMERS, Civil and Environmental Engineering146
Zilch, K. (2000): Innovationen und Entwicklungen im Massivbau, Bauingenieur, Band 75, August 2000,pp. 537-546. (In German)
Zitkevic, N. (1939): Improvements in reinforced concretes, British Patent No. 51,003, May 1939.
Zollo, R.F. (1997): Fiber-reinforced Concrete: an Overview after 30 Years of Development, Cement andConcrete Composites, Vol. 19, Issue 2, pp. 107-122.
Østergaard and Olesen (2004): Comparative study of fracture mechanical test methods for concrete. InFracture Mechanics of Concrete Structures, FRAMCOS-5, eds. Li et al., Proceedings ofFRAMCOS-5, Vail, Colorado, USA, April 2004, pp. 455-462.
Østergaard, L. (2003): Early-Age Fracture Mechanics and Cracking of Concrete – Experiments andModelling. Ph.D. thesis, Department of Civil Engineering, Technical University of Denmark.

PAPER I
In-situ cast concrete building: Important aspects of industrialised constructionLöfgren, I. and Gylltoft, K.
Nordic Concrete Research, 1/2001, 2001, pp. 61-80.


IN-SITU CAST CONCRETE BUILDING
IMPORTANT ASPECTS OF INDUSTRIALISED CONSTRUCTION
Ingemar LöfgrenM.Sc. in Civil EngineeringDepartment of Structural Engineering / Concrete StructuresChalmers University of TechnologySE-412 96 Göteborg, Sweden E-mail: [email protected].
Kent GylltoftProf. Dr. Department of Structural Engineering / Concrete StructuresChalmers University of TechnologySE-412 96 Göteborg, Sweden E-mail: [email protected].
ABSTRACT
In the ongoing research programme at Chalmers University of Technology, principles and methods for industrialised building with in-situ cast concrete are investigated. The goal is to increase the understanding of, and to develop methods and systems for, industrial building/construction. Improvement of in-situ concrete construction is necessary; partly in order to meet challenges from other materials. The article deals with questions of how the development should proceed and which research disciplines are needed as support. Opportunities for improvement are identified and a framework for the continuing work has been formulated.Key words: In-situ cast concrete, innovative building systems, improved concrete construction, cost-effective production.
Nordic Concrete Research, 1/2001 61

1. INTRODUCTION
The need for innovative approaches in design and construction is now recognised by mostsectors of the construction industry (as stated by the Centre for Innovative Construction Engineering). The construction industry has continuously developed during the years. However, there is need for a fundamental cultural and technical change – we are probably on the verge of a paradigm shift.
There is a need for more efficient and industrialised construction of concrete buildings; this is necessary for the competitiveness of in-situ concrete and essential if the construction industry is to move forward. At present, the expenditure on labour (preparation and dismantling of formwork, reinforcing, and casting and finishing of concrete) almost equals the cost of material(roughly 40 percent is labour). Consequently, the need to reduce the manpower involved is obvious. Development towards ‘on-site’ industrialisation of in-situ concrete construction presents challenges for all parties involved (i.e. clients, consultants, designers, contractors, and material suppliers). From the viewpoint of structural engineering there is an urgent need to address these problems, to look for innovative design solutions and develop new building/formwork systems. New and efficient permanent/participating formwork systems are likely to reduce arduous and costly labour activities and lead to a more industrialised construction. Apart from development of formwork systems, to reduce the time-consumingactivities, there are several other areas for improvement in the concrete industry: buildability; operational methods; logistics and supply chain management; resource allocation; informationtechnology/management, etc. Industrialised construction of in-situ concrete buildings should be seen as an attempt to move from largely craft-based production to a systematic production process where resources are utilised efficiently. Furthermore, it involves the application of modern systematised design, production planning and control as well as mechanised and automated manufacturing processes; see Sarja [1].
A typical building today consists of several standardised and industrially manufacturedcomponents (e.g. doors, windows) – components no one would consider manufacturing on site. Building materials, as well, are industrially manufactured in factories (such as reinforcement,prefabricated elements, and ready-mixed concrete, etc). Unfortunately, the industrial production often ends in the factories and the construction, on the building site, is still craft-based production (or manufacturing on site).
2. INDUSTRIALISED CONSTRUCTION
The term ‘industrial building’ has been used, and abused, ever since its introduction; occasionally it has been used with a negative meaning (for many people the term is inextricably linked to the 1950s and 1960s). To compose a straightforward and clear-cut definition of industrialised building is perhaps not as easy as one might imagine, since different forms and techniques exist. Nonetheless, CIB W24 (International Council for Research and Innovation in Building and Construction, work group 24 [2]) has made an effort and offers the following, quite general, definition:
Industrialised Building is the term given to building technology where modern systematised methods of design, production planning and control as well as mechanised and automated manufacture are applied.
Nordic Concrete Research, 1/200162

A comparison between industrial manufacturing and industrial building can further elucidate some aspects and principles which have to be applied in the building industry.
Table 1. Features of industrial manufacturing and the parallels in the building industry, from Girmscheid and Hofmann [3].
Features of industrial manufacturing Requirements on industrial building Centralised manufacturing Prefabrication of building components in
factoriesMass production / increased flexibility of production
Development of variable standard components
Manufacturing based on standard solutions and production of variants
Standardisation of building elements withflexibility in the design
Specialisation Concentration towards certain segments of themarket
Integration of planning, manufacturing and marketing
Interaction of planning, design, production,and production processes as well as marketing
Optimised processes and organisations Optimisation of planning and productionprocesses by considering automation and mechanisation
2.1 GENERAL VIEWS It is important to make clear that industrialised building does not automatically imply increased productivity, reduction of man-hours, or a better economy. However, it offers these possibilities if a totality concept is applied. Likewise, production indoors, in a factory, can also be craft-based (or manual) which implies that it is not the location that is decisive, but the conditions are important – the benefit in this case is that the workers have a roof over their heads. There is a broad spectrum of techniques available for industrialised building. It is impossible to mentionall because, firstly, the techniques are steadily under development and new ones being invented and, secondly, opinions differ on whether a technique is or is not ‘industrial’. In any case, techniques mentioned in connection with industrial building include the following:
standardisation (e.g. components, methods, processes or dimensional standardisation and modularisation);prefabrication (manufacturing of components beforehand, similar to off-site fabrication); on-site fabrication (manufacturing of components on site or in a field factory); pre-assembly (materials, prefabricated components and/or equipment are joined together for subsequent installation); modular buildings (units enclosing a usable space and forming a part of the building structure);the building system (a product system with an organised entity consisting of componentswith defined relationships, including design rules); mechanisation (the use of mechanical equipment instead of manual labour); and automation (utilisation of programmable machines – e.g. robots – performing tasks, or of computerised tools for planning, design and operation).
Most people probably associate industrialised concrete building with precast concrete. It was during the mass production era, in the 1950s, 1960s and 1970s, that the first steps towards moreindustrialised construction started. Prefabrication is not a novel concept; famous buildings in the ancient world – in Egypt, Greece, and Italy – were erected with prefabricated components madeof stone (Warszawski [4]). However, industrialised building does not necessarily equate with
Nordic Concrete Research, 1/2001 63

mass production – industrialisation can be achieved in one-off projects by adopting system-based solutions. A system-based solution should include a concept of structural elements - which may be project specific - having standard interfaces so that they can be assembled in a simple and standard manner. Furthermore, it should also include predefined manufacturing and construction process - with for instance Just in Time delivery of components.
Prefabrication is appealing because it reduces on-site activities and, thus, eliminates some of the construction peculiarities (e.g. work performed in suboptimal conditions1). The concept of prefabrication – as a production system – is good; however, it has various implications for the process. This will not be discussed thoroughly here; for such a discussion see Koskela [5] or Warszawski [4]. It is worth mentioning, though, that the total process2 tends to be morecomplex, requirements for co-operation and co-ordination within the design are higher, and the error correction cycle is longer (Koskela [5]). One of the implications is that there is a need, or requirement, to have a quality control system – for all activities during the whole process – in order to eliminate defects and mistakes (or mainly to reduce the variation; ‘zero defects’ is virtually impossible to achieve). De facto quality control is needed whatever production systemor method is used. However, for prefabricated systems and components this is of particular importance, since the requirements on dimensional tolerances are more severe. According to Warszawski [4], the main problem of prefabrication today is the lack of a system approach to its employment among the diverse parties involved.
2.2 INDUSTRIAL IN-SITU CAST CONCRETE BUILDING To compare in-situ cast and precast building (regarding economy, time, quality, etc.) is not easy – both have their advantages and disadvantages and are needed in order for development to move forward. Precast building, for instance, has the advantage of rapid erection and a fast on-site construction, and the elements are produced in factories, which secures good quality. But on the other hand, it requires a detailed design and connection details are complicated. In-situ cast building has the advantage of easy transportation (the wet concrete), it is flexible when it comesto geometric shapes, it is relatively easy to do late changes to the structure, and the structure becomes monolithic. The disadvantage is the it is produced in an ‘unprotected’ environment,additional time is required for the drying out process, and it requires more temporary works (like propping).
As mentioned earlier, precasting has some implications for the process and, in a similar manner,so does in-situ casting – and industrialisation results in further implications. In-situ cast construction is a quite complex process with many inputs and flows; e.g. material, components,and equipment have to be transported to and on the site, tasks have to be performed in certain sequences, etc.
One may ask whether industrial in-situ cast concrete building is a paradox, or whether it is sometimes used for marketing purposes as a ‘rhetorical’ trick. It could be argued that, at times, it is used incorrectly and a more ‘correct’ term would be mechanisation – the reason for using it might be that it is ‘trendy’. On the other hand, that it is a paradox (or a contradiction) is not true – there are no reasons why in-situ cast construction cannot be industrialised. As discussed earlier, the location is not decisive, but the systematised methods are. By improving site conditions, introducing new building systems, and adopting a system approach to its
1 E.g. climate, congestion, out-of-sequence work, multiple starts and stops, obstructions and interruptions, etc. 2 The process consists of the activities carried out during planing, design, manufacturing, transportation anderection/construction.
Nordic Concrete Research, 1/200164

employment, industrialisation is a feasible goal. However, it requires that all parties involved (clients, designers, contractors, and suppliers) strive towards the same goal – the goal of industrial in-situ cast construction.
In retrospect to the mistakes made with other forms of industrialised construction (which failed by not including and considering all steps of the process), a totality concept has to be applied. Actually, this necessitates new methods of work as well as a new philosophy for planning, design, and management. There is a tendency among engineers, whether natural or not, to makeeach beam and column as slender as possible – the smallest size that meets requirements on strength and serviceability – or to minimise the amount of reinforcement. This procedure will result in maximum economy of material but will certainly not result in minimum cost of the finished product – simplicity and repetition are usually the keys to success and the foundation of industrial production. Hence, the designer needs to understand the site activities, have a distinct picture of how the work will be conducted, and know which equipment is available. The designer also needs to comprehend which possibilities are offered and the limitations that are introduced when deciding on a solution. Camellerie [6] declares: “designers need to orient the design to the men and machines who build the structure and the materials, times, and environment in which it will be built.”
3. IMPROVEMENT OPPORTUNITIES
In the construction industry, it is generally agreed that there are opportunities for improvementand development of concrete construction – the opinions on how to improve, and the means to use, probably differ depending on whom you talk to. Development can generally be divided into two categories: process development and product development. Examples of process development are management, planning, logistics, etc., while product development includes materials, components and systems. For example, research in material science has led to the development of new types of concrete (e.g. self-compacting and high strength) and new types of composite and fibre reinforcement.
If we examine current methods of construction, the problems affecting the construction industry, and the sources causing waste and value loss in a project, the questions arise:
How should the development proceed in order to realise the full potential of concrete as a construction material, improve the efficiency of concrete construction, and develop concrete construction into an industrial process?How could research support this development and which disciplines need to participate – dealing with material, structure, construction, or management?
Today’s methods of construction and design of buildings may, in a broad sense, be said to have evolved through the survival of the ‘fittest and best’ of the methods which have been developed during the years of practice. An example of an innovative product, which has been used for a long time, is the hollow-core slab. However, the current systems have not been developed for the latest material technology or for a mechanised and automated manufacturing process. Furthermore, the advances the industry has made in technology and practice in recent years have largely been ignored in specifications; see Gray [7]. New technologies alter the basis for habitual methods of work, which must be scrutinised without biases, and new ideas and technology should be introduced where appropriate – it is time for a paradigm shift.
Nordic Concrete Research, 1/2001 65

3.1 NEW BUILDING PROCESS – A PREREQUISITE!The current building process is beset by many problems; each of the parties to the process has helped to develop it, but only from his own needs and views, and competition is mainly focusedon lowest cost instead of quality, sustainability and customer-perceived value. Thus, the building process is fragmented and the link between the client/end-user and the producer is weak, and the same can be said about the link between designers and contractors.
There is need for a fundamental cultural and technical change of the building process. Currently there is a global trend and it has been recognised that new methods of work are required in order for the industry to move forward, and that client decision-making and design management have to be changed. Best and Valence [8] point out that the cost of design represents only a fraction of the cost of a building over its life cycle – somewhere between 0.1 and 1 percent. It is generally accepted that the major part of the life cycle cost of a building can be referred to decisions made in the earliest stages of the design process; hence the importance of this stage. There is a movement to change the construction process and it has already started, it will fundamentally alter the construction process and, inevitably, increase efficiency and quality. This change is a prerequisite for industrialised construction and for the introduction of industrialised building systems.
The problems in the construction industry have led to governmental reports: e.g. in Sweden, the Swedish Delegation for Construction Cost, SOU 2000:44 [9]; in the United Kingdom, ‘Rethink Construction’, presented by Egan [10]; and the European Commission’s ‘The Competitivenessof the Construction Industry’ [11]. Brian Atkin asserts that the building industry has a ‘best’ method of working within reach (SOU 2000:44, Appendix 2 [9]). These reports point out deficiencies in the building industry and give recommendations for a changed project process. Some problems that must be addressed are:
the industry must replace competitive tendering with long-term relationships based on clear measurement of performance and sustained improvements in quality and efficiency;the industry must design projects for ease of construction making maximum use of standard components and processes; the industry should create an integrated project process around the four key elements of product development, project implementation, partnering the supply chain and production of components;the industry invests little in research and development and in capital. This lack of investment is damaging the industry’s ability to keep abreast of innovation in processes and technology; the need to focus on life-cycle design and encompass whole-life costs; clients need to formulate clearer project goals and specify priorities regarding quality, cost, and time; and clients need to understand the importance of the design stage and accept that it requires time.
These governmental reports have, in some countries, led to a response and the launching of action programs (e.g. in the UK: M4I - Movement for Innovation and the Construction Best Practice Programme; see http://www.rethinkingconstruction.org/).
Nordic Concrete Research, 1/200166

3.2 TECHNIQUE WITH POTENTIAL The concrete industry (material suppliers and contractors) is constantly under pressure to improve productivity and reduce costs without lowering the standard of quality of its products. This driving force for technical development has had effects on both concrete and reinforcementtechnology. The result is new types of concrete and reinforcement as well as new building systems and methods. In a similar manner, the development of information technology (construction IT) has presented new possibilities and methods of work for the planning, design, manufacturing, transport, construction, and operation and maintenance of buildings. In this section a limited number of techniques and research projects will be discussed in order to illustrate the existing potential.
Research reveals that there are considerable improvements to be made by developing and systematising the construction process and the design. A study of the construction process for in-situ concrete buildings was conducted at BRE in Cardington [12]. The current process was mapped, the sources of waste were identified, and an improved process was developed and used. The resulting improvement can be seen in Table 2. These savings have been confirmed by findings in other projects, e.g. the study conducted at the Reading Production Engineering Group; see Gray [7].
Table 2. Potential savings, according to BRE – European Concrete Building Project [12].
Improvement area Reduction in total cycle time [%]
Reduction in total man-hours [%]
Supply chain management 10.5 15.0Buildability 3.0 3.5Resource allocation 6.5 10.5Operational methods 8.5 13.5Total 28.5 42.5
In a case study of seven construction projects (Burwick [13]) the advantages and drawbacks of participating formwork (precast concrete panels) were investigated. All projects demonstratedtime savings of 10 to 35 percent and the system required fewer workers (by 10 to 30 percent). Other advantages were better surface finish (less rework) and improved working conditions. The drawbacks of the system were that material cost was higher, requirements for co-ordination within the design were found to be higher, and dimensional tolerance was more severe. Reinforcement details were not thoroughly planned, and placing reinforcement in walls was difficult.
In a research project investigating rational production systems by utilising self-compactingconcrete (SCC) it was found that SCC rationalised production and that the advantages were numerous (Grauers [14]):
rationalised concrete production, faster construction and less casting time;reduction in labour at the building site; better working conditions and reduced health problems for the workers; good homogeneity, improved quality and durability, and smoother surfaces; and easier casting in difficult situations, e.g. complex forms or congested reinforcement.
Today there are several different products, techniques, and materials available for reinforcementof concrete; they are a mix of ‘high-tech’ and ‘low-tech’. Sandberg and Hjort [15] remark: “atthe same time as there are advanced technical possibilities for prefabrication of reinforcement
Nordic Concrete Research, 1/2001 67

much of the work is conducted traditionally and manually (mostly on site) often leading to bad working conditions, poor quality, and a high total cost.” Nevertheless, the use of prefabricated reinforcement increases and it is a technique for the future – the possibilities to reduce site activities are considerable. An example of an innovative reinforcement system, developed lately, is BAMTEC , which is a reinforcement carpet for slabs (a production level of 4.5 tons/man-hour has been achieved; see http://www.bamtec.com). Another technique, used moreoften nowadays, is fibre reinforcement (fibres of steel, carbon, aramide, etc.) which is used for example in slabs, and it is also suitable for thin prefabricated elements as well.
3.3 RESEARCH AND DEVELOPMENT During the years, research and advances in engineering science have increased our knowledge. Hitherto, among other things, they have contributed to our comprehension of material properties as well as design rules, enabling us to build safe and slender structures. Likewise, the study of scientific management (pioneered by Taylor [16]) has helped us to understand the principles of, and to improve, manufacturing and production. However, as knowledge gradually accumulated,research separated into different disciplines (e.g. of material, structural, construction, and management) and researchers and practitioners specialised. Each of the specialists works with the ambition to do the ‘best’ at his/her part of the problem, but often without considering the whole problem in its proper context, a trend which leads to suboptimal solutions and increases the fragmentation of the industry.
Indeed, there is support for this view – in a study conducted by Josephson and Hammarlund[17], it was found that the main cause of the design defects was lack of knowledge (44 percent). Further, Lautanala [18] states that considerations of constructability are based only on the designers’ personal experience from construction. Consequently, since their knowledge is based on experience rather than scientific study, designers have problems in addressing constructability and, when they do so, it is with varying results. De facto, designers need feedback from, and a dialogue with, the contractors who are experienced in construction technology and meet the problems on a daily basis. Ballesty [19] states that designers often have to rely on anecdotal or ad hoc feedback rather than analytical assessment of actual performanceof facilities. Walraven [20] argues: “the structural designer and the material scientist are often seen as representatives of two totally independent groups of professionals. This is a wrong interpretation of actual needs, since design of today and tomorrow requires much more than realising structures with sufficient safety against overload.” Walraven [20] continues: “astructural engineer who is ignorant about the ‘ins and outs’ of the material concrete can never be a competent designer.” Furthermore, Camellerie’s [6] view is that “in our highly specialised society, we have developed a breed of engineers who can compute and draw, but have only hazy notions of how to build. Structures designed by such engineers are ‘successfully’ completed only after much anguish and modification in the field and at unnecessary cost in time and money.”There are currently several research projects (information and knowledge management) with the aim of developing methods and systems that will aid designers in the decision process.
Development of construction and building systems may have suffered from this separation. A systematic development of in-situ concrete construction, considering the whole construction process, is needed – development has to be done by unifying the knowledge in the disciplines. Other researchers share this view; Sarja [1] suggests that “the development of materials and structures will have to be done in close interaction with managerial, organisational and design development. Materials and structures must be designed and be suited for a mechanised and automated manufacturing process and they must be tailored for different requirements.”
Nordic Concrete Research, 1/200168

Research and development where problems are isolated from their context should be avoided, since suboptimal solutions are the outcome in most cases.
3.4 NEW TECHNOLOGY – A SOLUTION? In various studies of the building industry it has been concluded that there are high levels of production waste as well as low productivity (see Table 3). In a project there are several sources of waste and value loss (see Figure 1), and there is an abundance of remedies suggested and used for these problems. The basic solution, though, as suggested by Koskela [21], is to systematically and persistently decrease the share of non-value-adding activities in all processes, and to continue increasing the efficiency of value-adding activities. In the latest decade the construction industry has, among other things, tried to apply management philosophies in order to tackle some of the problems outlined above (e.g. lean construction, value management, total quality management, just-in-time production, process re-engineering). Other methodologies for improvement are, for example: industrialised system building (i.e. prefabrication and modularisation), computer-integrated construction, information technology, automation and robot technology.
under-performance
client decision-making
supply changemanagement
lack of innovation
conventionaltechnology
unfavourabledesign
(constructability)
site productionmanagement
material waste
reworklabour
productivity
designmanagement
poor quality
Figure 1. Some of the problems affecting the construction industry.
There is a widespread notion that by adopting state-of-the-art technology, problems will be rectified and an improvement achieved. However, history shows otherwise; Girmscheid and Hofmann [3] remark that industrialised construction often failed by prioritising the production while ignoring product and management processes. Koskela [5] and Warszawski [4] draw similar conclusions. To avoid such mistakes it is important (if not necessary) to study the building process and methods in use today, in order to realise the importance of a totality (holistic) concept – a concept including all steps of the process (i.e. planning, design, manufacturing, transport, erection/construction, and operation and maintenance). In Lean Production, e.g. Koskela [22], it is suggest that major investments in new technology are to be considered only after improving the present process; implementation of new technology is easier in controlled production processes. Or to quote Badger [23]: “It is relatively easy to create new technology, but the payback remains low until tools and processes are developed and people take ownership of the new knowledge.” It is often neglected, or not properly understood, that many problems are caused by basic structural deficits within organisations (i.e. the management, planning, and methods of work) and cannot be solved solely by means of new technology.
Nordic Concrete Research, 1/2001 69

4. CURRENT SITUATION
It has already been mentioned that there are problems affecting the building industry; see Figure 1. By examining these problems a better understanding and increased knowledge of the construction process can be achieved, knowledge which is an essential foundation when adopting new materials or developing new building systems to be used in construction. The first step is to analyse the current construction process with the aim of obtaining a general view of the activities and to identify:
possible causes of waste and deficiencies; management and organisational deficiencies; inefficiencies in design (bad constructability); inefficiencies in construction methods; and improvement opportunities.
One definition of waste is “all (construction) activities that produce cost, direct or indirect, but do not add value or progress to the product” (Serpell and Alarcón [24]). On a building site it includes labour, material, and equipment.
4.1 CONTEMPORARY MANAGEMENT OF DESIGN AND CONSTRUCTION Construction is characterised by a high proportion of non-value-adding activities and low productivity (compared to other manufacturing industries) – Koskela [5] even suggest that there are endemic problems associated with client decision-making, design management, supply chain management, and site production management. Koskela [5] points out some major features of the construction industry:
work is often done in suboptimal conditions – located on a site and affected by seasonal and climatic variations; construction can be conceived as prototype production; procurement through bidding; institutionalised roles and division of work – multidisciplinary;separation of design and construction; temporary organisations; and long service life.
There is growing dissatisfaction among clients and the authorities are deeply concerned; projects are seen as unpredictable in terms of delivery time and budget, and there are problemswith the standard of quality. The client’s time schedules, occasionally unrealistic, and lack of time for the design may cause some of the problems. Other causes could be poor planning and co-ordination or lack of information, knowledge, and motivation. The building industry also has a low and unreliable rate of profitability. As a result, it is sensitive to economic fluctuations and, consequently, invests too little in research and development.
Several studies of the construction industry have pointed out shortcomings that urgently need attention. Recent studies in the USA and UK suggest that up to 30 percent of construction is rework, labour is used at only 40 to 60 percent of potential efficiency, accidents can account for 3-6 percent of total project costs, and at least 10 percent of materials are wasted; see Table 3. In numerous studies from different countries, the cost of poor quality, as measured on site, has turned out to be 10 to 20 percent of total project cost (Cnudde [25]). Furthermore, the increase in efficiency in the construction industry lags behind other manufacturing industries. Between
Nordic Concrete Research, 1/200170

1965 and 1996 the increase in productivity in Sweden was only 2.6 percent per year in the construction industry, compared to 3.9 percent per year for other industries; see SOU 2000:44 [9].
Table 3. Compilation of Data on Construction Waste, from Koskela [21].
Waste Cost CountryQuality cost (non-conformance) 12% of total project costs USAExternal quality cost (during facility use) 4% of total project costs SwedenLack of constructability/buildability 6-10% of total project costs USAPoor material management 10-12% of labour costs USAExcess consumption of materials on site 10% on average SwedenWorking time used for non-value-adding activities on site App. 2/3 of total time USALack of safety 6% of total project costs USA
The conventional building process is generally sequential because it reflects the input of clients, architects, designers, contractors, and suppliers. Several researchers (Koskela [21] and Dupange [26]) have pointed out that sequential design leads to unsatisfactory performance: there are few or no iterations in the design process, constraints of subsequent phases are not taken into account in the design phase, and unnecessary constraints for subsequent phases are set in the design phase. Furthermore, there is little feedback for specialists and there is a lack ofleadership and responsibility for the total project. Consequently, the sequential procedure leads to:
suboptimal solutions; poor constructability and operability; large numbers of change orders (leading to rework in design and construction); and lack of innovation and improvement.
It is important to understand that engineering design is only one phase in a much larger process – but a very important one. Moreau and Back [27] state that the quality and accuracy of the design product can also influence the project schedule and cost (the number of field interferences, the amount of rework required, the optimisation of material resources, and the ease and efficiency of construction). Moreau and Back finally point out that, despite the significance of the design process to the delivery of the constructed facility, the design process is stilled riddled with inefficiencies.
In a case study, conducted by Koskela [5], it was found that waste (non-value-adding activities) primarily originated from prior phases of the project rather than from the phase of its occurrence. Waste was caused by problems of client decision-making; design management;supply chain management and site production management. Particularly client decision-makingand design management suffered from lack of planning, resulting in frequent change orders and extra costs. Regarding the site activities, waste originated from rework, waiting, and reduced productivity due to suboptimal conditions. As can be seen in Figure 2, there are seven resource flows (or conditions) that unite to generate the task result. Hence there are many sources of variability, and missing input leading to reduced productivity and the risk of disturbances increases with the number of resource flows. Koskela [5] gives an example:“let us assume that the probability of a deviation in any of the resource flows to a construction task over one week is 5 %.
Nordic Concrete Research, 1/2001 71

For seven resource flows the probability that there is no deviation in any input flow is thus:
Construction design
Components and materials
Workers
Equipment
Space
Connecting works
External conditions
Task
Prob{no deviation in any input flow} = (0.95)7 = 0.70
For ten resource flows the probability that there is no deviation in any input flow is thus: Prob{no deviation in any input flow} = (0.95)10 = 0.60”
Figure 2. Preconditions for a construction task, from Koskela [5].
At present, too much time and effort are spent on the construction site trying to make designs work in practice. A study conducted by Josephson and Hammarlund [17], on the cause and cost of defects in construction, showed that the cost of defects during production varies between 2.3 and 9.4 percent of the production cost. An analysis indicates that, on average, 32 percent of the defect cost originates in early phases, i.e. can be referred to the design phase. Approximately 45 percent of the defect cost originates on site, i.e. in relation to site management, workers and subcontractors. About 20 percent of the defect cost originates in materials or machines.However, when measured by cost, design-caused defects are the largest category; of these defects, those originating from missing co-ordination between disciplines are the largest category. When studying the root causes, it was found that about 80 percent of the defects originated from lack of knowledge and motivation.
4.2 CONSTRUCTION COSTS AND DISTRIBUTION OF LABOUR ACTIVITIES Building costs are a subject that has been studied thoroughly over the years. Several factors influence the total expenditure: material choices, labour costs and the working hours of those involved in executing the work, and cost for machinery used in executing the work. Furthermore, the cost of capital (financing) for the investor as well as the contractor has to be considered.
A comparative breakdown of the construction costs of a concrete building (office or residential) reveals that the superstructure represents approximately 10 to 15 percent of the total cost, a figure which has decreased during the years. The main difference today is that the costs forcladding, finish, and especially service installations have increased during the years. Owners and occupiers today have greater demands and different needs, and they expect higher standards. Best and Valence [8] emphasises the fact that the cost of construction is only a smallpart of the total cost of a building during its life cycle. The design cost is only a fraction, about 0.1 to 1 percent. This should be kept in mind when considering that roughly 80 percent of the cost is generated by only about 20 percent of the work items required for construction. Much of that 80 percent is related to design decisions made in the earliest stages of the design process. The costs for the concrete superstructure can generally be divided into formwork,reinforcement, concrete, repair of surfaces, and remaining (e.g. prefabricated elements). The operations involved in traditional in-situ cast concrete construction can be seen in Figure 3. Before the process of improvement can commence, it is necessary to understand the current practice, its process, and the operations (or tasks) involved. Construction data for 11 office- and 16 house-buildings (built between 1989 and 1993) have been compiled by the Swedish Ready-Mix Association [28]. These data have been analysed in order to get an overview of the
Nordic Concrete Research, 1/200172

distribution of man-hours between the different operations and to get a picture of where majorimprovements are to be made. The analysed data refer to the relative distribution of construction costs for the concrete superstructure. Table 4 shows the relative expenditure for the concrete superstructure (material and labour costs). As expected, reinforcement and, above all, formworkare the most labour-intensive activities, while concrete accounts for the main part of the materialcosts.
Table 4. Approximate proportional cost breakdown (material and labour costs) of a concrete structure [28].
Cost of material Cost of labour TotalFormwork 14% 18% 32%Reinforcement 10% 8% 18%Concrete 30% 4% 34%Repair 1% 5% 6%Remaining 9% 1% 10%Total 64% 36% 100%
Formwork Scaffolding
Transportationto/on-site
SITE OPERATIONS
- Erection of falsework &scaffolding
- Erection of formwork
Reinforcement
Transportationto/on-site
SITE OPERATIONS
- Placement
- Fixation
Fabrication
Transportationon-site
ConcreteBatching Plant
Transportationto site
Distributionon-site
(eg pump)
SITE OPERATIONS
- Placement
- Compaction
- Screeding
- Floor finishing
SITE OPERATIONS
- Removal of falsework
- Formwork striking
- Erection of temporarysafety scaffolding
Transportationon-site
SITE OPERATIONS
- Surface repair
Constructiondesign input- reinforcement
Non value addingactivities (waste)
Rework (waste)
- Cleaning andrepair offormwork
curing
Constructiondesign input- concrete
Constructiondesign input- formwork
Figure 3. Operations involved in traditional concrete construction (schematic).
The distribution of material and labour costs naturally differs between the projects, and additionally, the market situation affects the price of material and the cost of labour. However, the distribution of labour costs mainly depends on the methods and equipment used in construction, and is not so dependent on fluctuations of the market. Hence, the importance of the tasks is better understood by studying the distribution of man-hours. As can be seen in Figure 4, almost 50% of the total work on a concrete structure can be referred to the formwork;reinforcement operations require roughly 22 percent of the work; while concrete operations represent only 11 percent. On the other hand, if rework to fix surfaces (repair 15 percent) is added, it gives concrete a share of 26 percent.
Nordic Concrete Research, 1/2001 73

Formwork,columns 2%
Reinforcement,walls 7%
Reinforcement,floor 13%
Reinforcement,columns 2%
Concrete,walls 4%
Concrete,floors 7%
Repair15% !
Remaining /Prefab3%
Formwork,floor 26%
Concrete,columns 0.3%
Formwork,walls 21%
Formwork49%
Reinforcement22%
Concrete11%
Figure 4. Approximate relative breakdown of man-hours for a concrete structure, average values [28].
By studying the distribution of costs and man-hours we have gained the following knowledge, or rather the notions, mentioned earlier, have been confirmed:
formwork represents the major portion of man-hours; and rework, or repair of surfaces, is quite extensive.
Development of new permanent formwork systems would enable a more efficient concrete construction and render arduous and costly labour activities unnecessary. In view of the advent of self-compacting concrete and fibre reinforcement (techniques that will reduce the labour at the building site) this development seems even more desirable.
5. FURTHER WORK – FRAMEWORK FOR THE DEVELOPMENT
The main objective of this research project is to develop new systems and methods for an ‘on-site’ industrialisation of construction and to increase the understanding of industrial in-situ concrete construction. The aim is to reduce construction time and the man-hours required to construct. Furthermore, other important aspects that should be aimed for are a reduction of costs, raw material use and energy consumption (both during construction and as an operational building) as well as improved quality and increased customer value.
It can be concluded that there exist considerable opportunities for improvement in the construction industry; thus, these opportunities should be exploited. Some of the deficiencies that have been observed – and brought up in this article – cannot be improved by, or taken into account in, this project. It has also been mentioned that there is need for a cultural change and that client decision-making, design and production management have to be changed. Many of the problems concern fundamental deficits within organisations and methods of work, and thus cannot be solved solely by means of new technology – which is the main aims of this project. However, it is important to point out and call attention to these problems as well as bearing them in mind for the subsequent work. Let us hope that common sense will prevail and that there will be a cultural and technical change in the near future.
On the other hand, some of the deficiencies can be improved and – based on observations of the current process and practice coupled with the analysis of building costs – a framework for the
Nordic Concrete Research, 1/200174

development can be formulated. The framework will act as a general guideline for the development and it stipulates the cornerstones and the basic, underlying technologies; see Figure 5. The following cornerstones have been identified for this framework:
Material
Process
Systems
Material technology
Production theoryConstruction technology
Systems technology
Equipment technologyAutomation technology
Structural EngineeringDesign Theory
Design Methods
Information TechnologyInformation ManagementKnowledge Management
Process – production theory and construction technology (the repeated processes in construction).
Systems – systems and automation technology (modularisation and component interfaces).
Materials – materials technology (developmentand research).
Figure 5. Basic technologies and framework for development.
In addition to these items, economic and environmental aspects have to be considered. Economyis always a strong argument, and environmental aspects are relevant since there are regulations on materials to be used in buildings (i.e. emissions, energy consumption, recycling, etc).
While the framework and the basic technologies act as a general guideline, specific functional requirements must be formulated, and should be identified from the needs, demands, and wishes of the customers, i.e. not based on national codes and standards. However, the developed systems must of course fulfil the basic requirements in national codes and standards. As mentioned before, all the customers in the supply chain need to be considered (e.g. client, designer, manufacturer, supplier, contractor, and end-user). The functional requirements can be identified in a workshop where people are invited to give their opinions (i.e. representatives from all disciplines and all stages of the process). When the functional requirements have been identified the conceptual stage begins, this is an iterative decision making process where different layouts and feasible alternatives are identified. It is necessary to conduct this thoroughly and systematically; it should be done with the aid of a design system/method in order to handle the requirements and optimise the design. For example, structural requirements(such as strength, ductility and deflections) will be assessed by FE-analysis.
5.1 MATERIAL New materials, well suited for a mechanised and automated manufacturing process, have emerged from the material researchers. Materials have to be investigated regarding their versatility and their capability to improve; they must be suited for such a process. The concrete industry has developed into a high-tech industry in recent years; progress has been enormous,notably in the improvement of concrete strength. However, it is not only strength that has been increased. Lately other material properties have been recognised as equally important – for example, permeability, ductility, and workability. It is now possible to obtain certain predefinedproperties by adapting a certain mixture composition; to quote Walraven [29], the era of “tailor-made concrete” has arrived.
Nordic Concrete Research, 1/2001 75

Examples of recent material developments are self-compacting concrete (SCC), as mentioned in chapter 3.2, and fibre-reinforced concrete (FRC). Fibre-reinforced concrete has recently enjoyed a breakthrough in the construction industry, with the main application for slab on grade. Yet it is not a ‘miracle material’ and ordinary reinforcement will still be needed. The fibres are mainlyadded to control cracking in the service state and to increase the ductility, but not to increase the ultimate limit strength; for safety reasons, reinforcement is added to make sure of the structural stability and ductility in the ultimate limit state. One disadvantage of fibres is that it is difficultto control their distribution, resulting in a fairly high and uneconomical fibre-ratio. Nevertheless, used in appropriate elements, fibres can reduce the amount of reinforcement bars and thus the labour force required. Another development that shows promising results is standardisation and pre-assembly of reinforcement units; it has already become commonpractice to use prefabricated wire-mesh mats. However, there remains much more to be done in this area.
5.2 PROCESS It is often claimed that the construction industry is different from other manufacturing industries – every product is unique and in most cases only one prototype is built, the actual building. To some extent this is true, as building designs are unique; the process, however, is essentially repeated from project to project and, indeed, research suggests that up to 80 percent of inputs, design problems and materials in buildings are repeated (Egan [10]). This is important to keep in mind; these repeated ‘processes’ are one of the basic principles to develop new building systems from. The ‘one-off mentality’ is something that the industry must abandon if it is to move forward and improve. Projects must be designed for ease of construction, and the knowledge possessed by contractors and material suppliers must be utilised in order to reap the full value, and to be able to realise the potential, of concrete as a construction material.
5.3 SYSTEMS For the next discussion, a building system can be defined as follows: “a building systemincludes design rules and a product system whose parts have compatible interfaces, thus permitting the use of several alternative components and assemblies. The compatibility of the components and assemblies is assured by means of a dimensional and tolerance system as well as of connections and joints” (Sarja [1]). Furthermore, open systems have a framework of standards or rules for dimensional co-ordination and compatibility, allowing different systems to be assembled. The systems should be open to (Sarja [1]) free design for varying requirements,free competition between contractors and suppliers, future changes in use, and reuse and recycling. Consequently, design and construction of buildings face multiple requirements which all have to be considered. “The main goal of construction, in all societies, is a good quality of the built environment in terms of aesthetics, health, economy, and ecology throughout its life-span, fulfilling clients’ needs and all the requirements of a sustainable society and nature” (Sarja [1]).
CONSTRUCTION METHODS As shown in section 4.2, the cost of a concrete element (e.g. a slab or a beam) can be separated into the cost of labour (the cost of the employee and the time required to construct it) and cost of the material used. These are the two primary factors which affect the economics of a system. For example, permanent formwork usually reduces site manpower and the floor-cycle time but increases the material cost, as indicated by Burwick [13]. When analysing construction costs from actual projects it was established that formwork is the most labour-intensive activity. Consequently, development of new formwork/building systems has the potential to reduce
Nordic Concrete Research, 1/200176

labour. Concrete construction is a complex process, involving many inputs and flows, and certain operations are involved; see Figure 3. When studying these operations from a perspective of value management, it is clear that erection and dismantling of scaffolding and the stripping, cleaning and repairing of formwork are examples of non-value-adding activities. The operations are necessary for traditional formwork, but they add no value for the end-client. Permanent formwork, for instance, is an attempt to rationalise the construction, and two different types can be distinguished:
leave-in-place forms, which derive their economy from saving the cost of stripping and cleaning; and participating forms, which function as an integral part of the structure when in service; they achieve their economy by saving the cost of stripping and cleaning, by replacing some of the reinforcement, and by composite action adding to the load-carrying capacity.
STRUCTURAL SYSTEMS When designing structural systems (or choosing between different solutions) the total cost is reduced if the labour saving is greater than the increase in material cost. However, additional savings and benefits might also exist when comparing different systems; unfortunately, these are not always as easy to assess (in the form of a price tag). The benefits may for instance arise frombetter thermal comfort, superior acoustic environment, flexibility to changes, or easier integration of service installations. Savings may arise from needing less temporary works, achieving an earlier hand over, less overall construction time, less material wastage, less vulnerability to weather conditions, etc. Patrick [30] suggest that because a compositepermanent formwork can serve dual roles – firstly acting as the formwork before the concrete hardens and than as a integral part of the structure – economic advantages should result compared using removable formwork systems. For a permanent formwork system to achieve an economic advantage is it necessary that it is utilised efficiently during both the construction stage (as formwork) and the composite stage (in the completed structure). To achieve this advantage an optimisation of structural shape, geometry, thickness of elements, etc. is needed. For this optimisation there are different stages that have to be considered. Patrick [30] identified stages and as relevant to the design of the system, stage is added to complete the different stages that need to be considered.
(a) Stage – prior to placement of concrete, which includes the time:(i) during transportation, handling and erection – e.g. damage during lifting; and (ii) once the formwork is erected but prior to placement of the concrete – e.g. deflections
and damage from construction loads, temporary stabilisation. (b) Stage – during placement of concrete up until concrete hardens – e.g. deflections
during casting. (c) Stage – during usage of the structure, which includes:
(i) normal usage (serviceability limit stage) - e.g. deflections, cracks, vibrations, acoustics, thermal comfort;
(ii) at overloads (ultimate limit state) - e.g. strength, ductility.
These stages are equally important but result in different requirements and loading conditions. Stage I and II involve the safety requirements for the workers during construction. While stage III involve the safety for the end users. However, it is during stage I and II the initial economicboundary is set for the system, i.e. the material and labour costs are spent during these stages.
Industrialised construction requires that some aspects need a more thorough consideration, for example:
Nordic Concrete Research, 1/2001 77

open systems for compatibility of various components;optimal combination of materials and production methods – from the viewpoint of structural, construction, thermal, acoustic, etc.; optimal combination of in-situ cast and prefabricated components;focus on interfaces between various structural components (e.g. connection details and interface between in-situ concrete and prefabricated components); and a holistic view on a system level.
5.5 VISION OF THE FUTURE DESIGN The rapid progress in computer- and information technology has produced a powerful tool for the development of new design methods able of taking more factors into consideration at the same time, and thus giving an overview of the whole building from design to construction. It also gives the opportunity to view different types of design and to see the effects of various concepts, so called “conceptual design”. This gives the engineer the tool to think and work systematically in an engineering way and the possibility to simulate the structure during construction as well as during its life cycle. Furthermore, it also opens for optimisation of a structure/building concerning both economical aspects as well as human considerations and wishes, i. e. architectural aspects, comfort etc, and allowing for a more industrialised production.
6. CONCLUSIONS
Current concrete construction and design are meeting new challenges from other construction materials and techniques (e.g. steel, precast concrete, and timber). The ‘on-site’ industrialisation of concrete construction is intended to address this challenge and the problems affecting the construction industry. A prerequisite for the development of industrial building/formworksystems (and goal for the system) is that ‘they should be of fundamental importance for the competitiveness of concrete structures and of great value for the whole building sector’. New building/formwork systems for site-cast concrete structures are expected to have a strong impacton production efficiency and market shares. This development will reduce on-site labour, increase productivity, improve quality, result in efficient material usage, and shorten the timebetween project commencement and occupation of the building by paying tenants. It will, however, require improved materials as well as a design and construction management which is able to plan and control their use.
To answer the questions in chapter tree of this article (improvement opportunities), the following conclusions can be drawn:
development should obtain support from all research disciplines (material, structural, construction, and management) – designers, contractors, and suppliers must co-operate; how development should proceed depends on whom you are talking to. A shift of paradigms, resulting in a fundamental cultural and technical change of the building process, might be necessary. New building/formwork systems are also needed:
- industrial construction requires a totality concept which includes all steps of the process;
- all parties involved (clients, designers, contractors, and suppliers) should strive towards the same goal – the goal of industrial in-situ cast construction;
Nordic Concrete Research, 1/200178

development of construction and building systems may have suffered from the separation of research and subject fields, and the industry has become fragmented;labour costs represent roughly 40 percent of the construction cost, and formworkaccounts for the major portion of this cost (almost 50 percent); research confirms that there are substantial possibilities for improvement (reduction ofman-hours and construction time as well as improved working conditions) – BRE-Cardington [12], Grauers [14], and Burwick [13]; waste (non-value-adding activity) primarily originates in the early phases of projects (client decision-making, design, supply chain and production planning) – Koskela [5]; waste on the building site originates from rework, waiting, and reduced productivity due to suboptimal conditions – Koskela [5]; studies of the cause and cost of defects in construction showed that 80 percent of the defects originated from lack of knowledge and motivation; there was also found to be poor co-ordination between design disciplines – Josephson and Hammarlund [17]; it can be stated that today’s method of work does not live up to the definition of industrial building, the first deviation occur already at the design stage (where the first defects are ‘built in’).
7. REFERENCES
[1] Sarja, Asko: Open and Industrialised Building. CIB Publication 222, Report of Working Commission W24. E & FN Spon. London, 1998, pp. 3-94 &159-184.
[2] CIB W24: http://cic.vtt.fi/cib_W24/
[3] Girmscheid, G. & Hofmann, E.: Industrielles Bauen – Fertigungstechnologie oder Managementkonzept?Bauingenieur, Band 75, September 2000, pp. 586-592. Springer Verlag.
[4] Warszawski, A.: Industrialized and automated building systems – A managerial approach. E & FN Spon, London, 1999.
[5] Koskela, Lauri: An exploration towards a production theory and its application to construction. VTT Publications 408. Technical Research Centre of Finland, Espoo, 2000.
[6] Camellerie, J.F.: Construction Methods and Equipment. Handbook of concrete engineering. Edited by Fintel.Van Nostrand Reinhold, New York, 1985, pp. 793-819.
[7] Gray, C.: In Situ Concrete Frames. The Reading Production Engineering Group. The University of Reading,1995.
[8] Best and Valence: Getting it right at the start. In Building in value – Pre-design issues, edited by Best & Valence. Arnold, London, 1999, pp. 1-9.
[9] SOU 2000:44: Från byggsekt till byggsektorn. Byggkostnadsdelegationen, 2000. (In Swedish.) (http://www.regeringen.se/propositioner/sou/index.htm)
[10] Egan, Sir J.: Rethink Construction. The Construction Task Force. Department of the Environment, Transportand the Regions. London, 1998. (http://www.construction.detr.gov.uk/cis/rethink/index.htm)
[11] European Commission. The Competitiveness of the Construction Industry. Version 3.3. (http://europa.eu.int/comm/enterprise/construction/old/construc/constpol.htm)
[12] European Concrete Building Project: Improving concrete frame construction – Best Practice Guides. 2000. (http://www.bca.org.uk).
[13] Burwick, M.: Betongbyggande med kvarsittande gjutformar – en jämförande studie. Examensarbete 334, Avd. för byggandets organisation och ekonomi, KTH. Stockholm, 1998. (In Swedish.)
[14] Grauers, M.: Rational production and improved working environment through using self compacting concrete.Brite-EuRam project BRPR-CT96-0366, 1998. (http://scc.ce.luth.se/public/Summary).
Nordic Concrete Research, 1/2001 79

[15] Sandberg, J. & Hjort, B.: Rationell armering – ergonomi – ekonomi – miljö. Fundia Bygg AB, 1998. (In Swedish.)
[16] Taylor, F.W.: The Principles of Scientific Management. Harper & Brothers, New York, 1911.
[17] Josephson, P.-E. & Hammarlund, Y.: The causes and costs of defects in construction – A study of seven building projects. Automation in Construction 8, 1999, pp. 681-687. Elsevier.
[18] Lautanala, M.: A process approach to design for Construction. In Lean Construction, edited by Alcarón. A.A. Balkema, Rotterdam, 1997, pp. 237-248.
[19] Ballesty, S.: Facility quality and performance. In Building in value – Pre-design issues, edited by Best & Valence. Arnold, London, 1999, pp. 198-211.
[20] Walraven J: How can we Shorten the Bridge Between Design- and Material Engineers. Nordic Concrete Research, No. 23, 2000.
[21] Koskela, Lauri: Application of the new Production Philosophy to Construction. Technical Report #72. Centrefor Integrated Facility Engineering. Department of Civil Engineering. Stanford, 1992.
[22] Koskela, Lauri: Lean production in construction. In Lean Construction, edited by Alcarón. A.A. Balkema,Rotterdam, 1997, pp. 1-9.
[23] Badger, W.: Wisdom in Managing the Construction Process – Construction Forum. Practice Periodical on Structural Design and Construction, February 2000, pp. 92-95. ASCE.
[24] Serpell, A. & Alarcón, L. F.: Construction process improvement methodology for construction projects.International Journal of Project Management, Vol. 16, No. 4, 1998, pp. 215-221.
[25] Cnudde, M.: Lack of quality in construction – economic losses. European Symposium on Management,Quality and Economics in Housing and Other Building Sectors, Lisbon, September 30 – October 4, 1991. Proceedings, pp. 508-515.
[26] Dupagne, A. (ed.): Computer Integrated Building. Strategic Final Report. ESPRIT II: Exploratory Action No. 5604, 1991.
[27] Moreau, K.A. & Back, W.E.: Improving the design process with information management. Automation inConstruction, No. 10, 2000, pp. 127-140. Elsevier.
[28] Betongbanken. Construction data compiled by the Swedish Ready-Mix Association – received on 02-05-00 from Frank Johansson.
[29] Walraven J.: The evolution of concrete. Structural Concrete – Journal of the fib. No. 1 March, pp. 3-11. Thomas Telford, 1999.
[30] Patrick M.: The Application of Structural Steel Decking in Commercial and Residental Buildings. MalaysianStructural Steel Association, Convention 1998.
Nordic Concrete Research, 1/200180
PAPER II
Lattice-girder elements– Investigation of structural behaviour and performance enhancements
Löfgren, I. Nordic Concrete Research, 1/2003, pp. 85-104.


Lattice Girder Elements - Investigation of Structural Behaviour and Performance Enhancements
Ingemar LöfgrenM.Sc. in Civil EngineeringDepartment of Structural Engineering / Concrete StructuresChalmers University of TechnologySE-412 96 Göteborg, Sweden E-mail: [email protected].
ABSTRACT
In an ongoing research programme at Chalmers University of Technology, a study was made of the structural behaviour of lattice girder elements. The project was initiated by AB Färdig Betong and Thomas Concrete together with Chalmers as a response to the growing demand for improved construction methods for in-situ cast concrete structures. The study was based on experiments as well as numerical analyses. Its purpose was to gain knowledge of the structural behaviour and identify performance enhancements enabled by new materials. Through a deep understanding of the structural behaviour coupled with the possibilities to virtually investigate the effects of different material properties, new opportunities are available for an economicaland safe way of introducing and using new materials. In the numerical analyses, four different types of concrete were investigated: a normal-strength concrete (C30), a fibre-reinforced normal-strength concrete (FRC30), a high-strength concrete (C80), and a fibre-reinforced high-strength concrete (FRC80). The results show that the structural behaviour of the lattice girder elements can be simulated and that, by changing the behaviour and properties of the concrete, both the peak load and the stiffness of the elements can be increased. For high-strength concrete an increased toughness seems to be important.
Key words: In-situ cast concrete, lattice girder elements, structural behaviour, experiments,numerical analysis, fracture mechanics, fibre-reinforced concrete.
1. INTRODUCTION
In this paper, the structural behaviour of the lattice girder system is studied and, with this as a basis, performance enhancements of the system are discussed and analysed. The ideas and methods presented are based on experimental and numerical studies together with current knowledge and developments in materials science and structural engineering. An experimentalprogram was set up to investigate the behaviour in question. The lattice girder system has been used as a case study in order to explore the potential value of new materials in structural concrete systems. This approach could lead to a safe and economical way of introducing new materials like fibre-reinforced concrete. The reason for choosing the lattice girder system is that it is thought that new materials might enhance the performance of the elements. Moreover, in design practice in Sweden, there is a lack of a consistent mechanical model able to describe the
Nordic Concrete Research, 1/2003 85

structural behaviour of the elements and the phenomena of failure. This study has been limitedto reinforced elements, not considering prestressed elements, and it focuses chiefly on the construction stage and the structural behaviour. The experimental results, in combination with non-linear finite element analysis based on fracture mechanics, will be used in the future for verification of a proposed analytical model, but now mainly for investigating performanceenhancements of the system. The test results and the proposed analytical model can be found in Harnisch [1] and Verdugo [2].
The methods of construction vary depending on the cost of labour, the availability of workers, and the price and availability of construction materials and equipment. In Sweden, where the cost of labour is fairly high, the semi-precast element floor, or lattice girder system, is a popular system for construction of concrete floors. The lattice girder element (see Figure 1) is a permanent participating formwork system, which combines precast concrete panels and poured in-situ concrete topping.
Figure 1. Mounting of lattice girder elements on the construction site (photo, Hans Olsson SKANSKA, Mellerud).
The construction methods for in-situ cast concrete structures must become more efficient and industrialised; this is necessary for the competitiveness of in-situ concrete, and essential if the construction industry is to move forward. At present, the expenditure on labour (preparation and dismantling of formwork, reinforcing, and casting and finishing of concrete) almost equals the cost of material, being roughly 40 percent of all costs; see [3]. To improve the construction and utilise the concrete more efficiently, all parties must be involved (clients, designers, contractors, material suppliers, and researchers). From the viewpoint of structural engineering, there is an urgent need to address these problems, look for innovative design solutions and devote efforts and knowledge to, for example, the development of new structural building/formwork systems.Innovations and improved performance can often be attributed to the use of new or improvedmaterials. Engineered materials, with enhanced characteristics for a particular application, are increasingly viewed as a source of innovations and development.
Nordic Concrete Research, 1/200386

2. THE LATTICE GIRDER SYSTEM
The lattice girder element consists of a precast panel with a minimum thickness of 40 mm, a lattice girder (see Figure 2), and bottom reinforcement. The elements are cast in a factory, transported to the site, and lifted into place before in-situ casting. The lattice girder element was introduced in Germany some 40 years ago and has spread to numerous countries. In the early years there was considerable development of the system; beginning with simple beam elements,it evolved into slab and wall (shell) elements. Its most noticeable development concerns the manufacturing process. Today some manufacturers have automatic production plants with CAD/CAM operated equipment (see for example Müller [4]).
Panel reinforcement
(optional)
Steel trusses
Panel concrete
Site placed concretePolystyrene void formers
Figure 2. A lattice girder truss and a lattice girder element.
The system has several advantages: stripping and cleaning are unnecessary, the main slab reinforcement is cast into the slab in the factory, the elements require less propping (temporarysupport also called shoring) than ordinary formwork, installations can be cast into the slab in the factory, surface finish is better, and working conditions are improved. This usually results in reduced site manpower and floor-cycle time. The disadvantages are an increase in material cost, in co-ordination of the design, in requirements of dimensional tolerance, in the difficulties of connection details, and possibly in the size of the crane. Furthermore, propping is still needed.
From the contractor’s point of view, there is a desire to increase the spacing of props. This would lead to less congestion and disturbance on site, and minimise the need for temporaryworks and the associated costs; some reasons can be seen in Figure 3. From the manufacturers’point of view, there is a desire to minimise transportation costs, by reducing the weight and the thickness of the elements.
Figure 3. Simple arguments for why improvements are needed: photos recently taken at a construction site. (Source author)
Nordic Concrete Research, 1/2003 87

When designing the elements, the design parameters are the number of trusses, the truss height, the diameter of the top chord, the slab thickness, and prestressing forces. But how the concrete contributes to the structural behaviour is less well known, and this limits progress. For example,can the concrete be allowed to crack and, if so, how does this affect the structural behaviour?How should it be considered in the analysis and, in this context, how should other types of concrete be treated, such as fibre-reinforced concrete? In sum, there is a desire to optimise and refine the system, e.g. reduce the weight and manage longer spans during construction. To achieve this, a better understanding of the structural behaviour is needed.
Materials have developed since the introduction of the system. However, they have not madeany significant impact so far. Increased concrete compressive strength and curing condition at moderate temperatures can allow a shorter production cycle. The reason for the lack of materialsdevelopment could be inadequate understanding of how the material properties of the concrete contribute to the structural behaviour of the system, in particular the behaviour in tension which affects the performance. Besides, it is not until recent times that the building and construction industry has progressed sufficiently in developing and applying new materials (that is, to be able to design or engineer materials) as well as to design structures and components which better utilise these improved properties. This ongoing development was primarily initiated by an increase in the scientific understanding of the origin of material properties at micro-level and the mechanical properties at macro-level, coupled with the advent of numerical tools (like finite element analysis) able to predict the behaviour of structures. For a long time the compressivestrength of concrete was considered to be ‘the’ property and all other properties used in design were, and still are, assumed to be related to it by empirical relationships – increased compressive strength meant a stronger, better, and more durable material. Nowadays, with our greater understanding of this complex composite material, it is clear that there exist better methods to optimise concrete (e.g. Brandt and Marks [5]; Karihaloo and Lange-Kornbak [6]).These advances will provide the manufacturer with a more reliable material and more tools such as admixtures (shrinkage reducing), additions (silica, fly ash, grinded limestone), inclusions (fibres), advanced curing (e.g. steam curing), etc. Further, the type and volume fraction of aggregates may be used to affect the mechanical properties.
It is important to recognise the possibilities and opportunities that materials offer, as suggested in Figure 4, but also their limitations. To introduce and use these techniques in an economicaland safe way, it is necessary to have a deep understanding of the structural behaviour of the system and how this is linked to the mechanical properties and behaviour of the materials. Nor should one forget that the material properties must be reliable and possible to evaluate with material testing. Today there is a lack of guidelines, in standards and codes, for the use of new materials as well as standardised test methods for evaluating their performance, e.g. for fibre-reinforced concrete and FRP reinforcement.
MATERIAL
Properties
Performance
DESIGN
Possibilities
Opportunities
Figure 4. Inter-relationship between materials and design, adopted from James [7].
Nordic Concrete Research, 1/200388

3. DESIGN AND ANALYSIS
Design and analysis models should, as far as possible, be able to describe the structural behaviour and the phenomena of failure. They should be adequate but not over sophisticated. However, when carefully examining a product like the lattice girder element – which may seema rather simple product – and considering the entire life cycle from a structural viewpoint, it becomes obvious that design and analysis of it are not a straightforward matter. One has to consider both time-dependent effects (such as creep and shrinkage) and time-dependent materialproperties (gain in strength and modulus of elasticity), which are affected by environmentalconditions throughout the lifetime. This refers to an element with time-dependent boundary conditions (i.e. temporary supports during construction) and time-dependent sectional geometry(i.e. changing from a lattice girder element to a monolithic cross-section with composite action). Moreover, when or even before they are loaded, the elements may exhibit, due to shrinkage and/or transportation, cracking which significantly changes the stiffness. As will be shown later, the tension-softening response of the material has a significant influence on the behaviour.
The structural design of the elements must therefore be performed with regard to the whole life cycle. The different stages to be considered are:
Stage (Non-composite Action) – prior to placement of concrete, which includes the time:(a) during transportation, handling and erection – e.g. cracking during lifting;(b) once the formwork is erected but prior to placement of the concrete – e.g. deflections,
excessive cracking and damage from construction loads, temporary stabilisation. Stage (Non-composite Action) – during placement of concrete until the concrete hardens
– e.g. deflections and excessive cracking during casting. Stage (Composite Action) – during usage of the structure, which includes:
(a) normal usage (serviceability limit stage) – e.g. deflections, cracks, vibrations, acoustics, thermal comfort;
(b) at overloads (ultimate limit state) – e.g. strength, ductility, fire resistance.
The focus of this study is the construction process (Stage I and Stage II). The design objectives for the construction stages can be divided into the serviceability and the ultimate limit states. In the ultimate limit state (ULS) the main requirement is that the overall system and each of its members should have the capacity to sustain all design loads without collapsing. Adequate strength and safety are achieved if the following failures are avoided: failure of critical sections; loss of equilibrium of the overall system or any part of it; loss of stability due to buckling of the lattice girder or any of its members (the top chord or the diagonals). In the serviceability limitstate (SLS) the following requirements should be fulfilled: deflections and local deformationsmust not be unacceptably large; tensile cracks widths must be limited (or cracking may not be allowed); and local damage must be prevented. Moreover, if cracking is allowed, the crack width in the finished slab (Stage III) must be calculated considering that the element is cracked, and stresses present in the reinforcement before the additional load is applied must be added when calculating the final crack widths and deflections.
The current design practice in Sweden is based on empirical expressions (evaluated from full-scale testing performed 25 years ago) instead of a mechanical model; the only design parametersare the number of trusses, the truss geometry (top chord diameter and truss height), and the slab thickness. Hence, limitations to standard solutions are introduced, because non-standard solutions cannot be treated. Another disadvantage is that the flexural stiffness of the elements is not defined, and as a consequence stresses, strains, deflections, and crack widths cannot be
Nordic Concrete Research, 1/2003 89

calculated. Furthermore, an accurate stiffness is needed in order to calculate the shoring/propping loads in multi-storey buildings. Additionally, as mentioned, materials like fibre reinforcement are not treated in the existing design method – this is a major impediment to improving the system.
4. TEST PROGRAM
A test series was carried out with twelve lattice girder elements, manufactured by AB Färdig Betong, in the laboratory at the Department of Structural Engineering, Chalmers University of Technology. The main parameters varied were the height of the truss and the diameter of the top bar. The choices of truss geometry were to be representative of standard trusses used in practice. All of the tested slabs had the same outer dimensions (length width thickness, 2600 1180
50 mm) but had different truss geometries where the height, H, and the diameter of the top chord, top, were varied; see Figure 5 for description of parameters and Table 1 for test specimens refereed to in this paper. In Table 2 the concrete mixture proportions are presented.
Ø bottom
Ø diagonal
Ø top
Ø longitudinalreinforcement
t s
h
Figure 5. Description of the parameters varied in the test series.
Table 1. Table of test specimens.
Slab No. Top chord[mm]
Diagonal[mm]
Bottomchords[mm]
Trussheight, h
[mm]
Longitudinalreinforcement
[mm]
Slabthickness, ts
[mm]T10-6-5 H=120 10 6 5 120 9 10 – s 100 50T10-6-5 H=150 10 6 5 150 9 10 – s 100 50T10-6-5 H=200 10 6 5 200 9 10 – s 100 50T8-6-5 H=150 8 6 5 150 9 10 – s 100 50
T12-6-5 H=150 12 6 5 150 9 10 – s 100 50T10-6-5 H=150/8 10 6 5 150 9 8 – s 100 50
Table 2. The concrete mixture proportions for 1 m3 concrete.
Concrete mixture: C 25/35, w/c 0.59, semi-fluid consistence, Dmax 18 mm.Cement (II/A-LL 42,5) (Bygg.cem. Skövde)
Stone8 - 18 mm(crushed)
Sand0 – 8 mm
Water Plasticizer Air-entrainingadmixture
Totalweight
[kg] [kg] [kg] [litre] [litre] [litre] [kg]340 842 949 200 5 0 2330
A test set-up according to Figure 6 was used. Deflections at specific points, and strains in the top as well as the bottom chord, were measured.
Nordic Concrete Research, 1/200390

Displacementtransducers
Displacementtransducers
Displacementtransducers
Spreaderbeams
Woodenbeams
700 800 700
400 300 400 400 700
Loadcell
Hydraulicjack
Figure 6. Test set-up used in the experiments.
5. TEST RESULTS
We will now focus on the structural behaviour and discuss the mechanisms underlying it; only some of the results are presented here. For further information on the test series and the results, see Harnisch [1] and Verdugo [2].
5.1 Material Properties Material properties were obtained from standard material tests: compressive strength on cubes, fc.cube, and cylinders, fc.cyl; splitting tensile strength on cubes, fct.sp; and modulus of elasticity on cylinders, Ec0 (see Table 3). The fracture energy, GF, was tested in an earlier experiment (see Löfgren [8]) and, since the same concrete mix was used, it was assumed that the result from this test could be used in the numerical analysis (GF = 133 Nm/m2).
Table 3. Measured material properties of the concrete, at 28 and 42 days.
Materialproperty
Age [days] 28
Age [days] 42
fc,cube [MPa] 46.5 -fct.sp [MPa] 3.6 -fc,cyl [MPa] 33.5 35.3Ec0 [GPa] 25.1 25.6
The lattice girder truss is produced by welding cold-worked reinforcement (see Figure 2). The reinforcement in the truss was of the type Ps700, with a measured tensile strength, f0.2, of 720 MPa and measured modulus of elasticity, Es, of 210 GPa. The reinforcements used in the concrete slab were ribbed hot-rolled bars of Swedish type K500, with a measured yield strength, fy, of 586 MPa and measured modulus of elasticity, Es, of 211 GPa.
5.2 Structural Behaviour The main drawback with concrete is the brittleness problem; cracking of concrete usually takes place at low stresses and is thus, in almost every case, inevitable in reinforced concrete
Nordic Concrete Research, 1/2003 91

elements. Large crack widths are not aesthetically appealing and may also cause initiating ofreinforcement corrosion in severe environments. Furthermore, the structural behaviour is highly influenced by cracking and the cracking process, it results in a gradual reduction of the stiffness, as can be seen in Figure 7.
0
5
10
15
20
25
30
0 2 4 6 8 10 12 14 16mid-span deflection
[mm]
Q [kN]
Micro cracking
Macro crackingPrimary cracks forming
Buckling oftop-chord
A
B
C
ED
Upper limit(Elastic stiffness)
Lower limit(Stiffness of the truss)
Figure 7. Typical load–deflection curve, for slab T10-6-5 H=150.
Generally, the load-deflection behaviour is characterised by the following. The initial, almostlinear relationship between load, Q, and deflection applies until the onset of macro-cracking(A). The cracks continue to grow and form as the load, Q, increases; in the load–displacementcurve this is indicated in a region of decreasing stiffness (A-B). Primary cracks are primarilyinitiated where the diagonals intersect each other. A second near-linear range of behaviour occurs until the next set of primary cracks is formed (B-C). A third near-linear range ofbehaviour occurs when the crack pattern is well developed (C-D). The last stage (D-E) is reached when the top chord of the lattice girder is affected by second-order effects, which reduce the stiffness of the system; this takes place until buckling occurs and the peak load is reached (E).
What is interesting with the lattice girder system is that relatively small reinforcement strains and small crack widths are introduced due to the geometrical configuration: the reinforcement is placed in the middle of the concrete slab. The crack widths are relatively small, typically < 0.1 mm at peak load and < 0.2 mm at a deflection of L0/100, and are not visible until about 60 percent of the peak load. The measured strains are typically on the order of 500-1000×10-6 at peak load, and less than 300×10-6 at 60 percent of the peak load; see Figure 10. However, the geometry of the truss (height and diameter of the top chord) influences the strain distribution in the section. For the same top chord diameter, a higher truss results in smaller strains in the bottom chord. For the same truss height, a larger top chord diameter results in larger strains in the bottom chord. As a result of the relatively small reinforcement strains and crack widths, the ability of concrete to carry tensile stresses after cracking plays a significant role for the tension-stiffening effect in the service stage. This is important for limitation of deflections, which is one of the main design parameters. The load–deflection curves are presented in Figures 8 and 9. Figure 10 shows a typical load–strain curve for the embedded truss reinforcement. Figure 11(a) shows the obtained crack pattern and 11(b) shows a deformed truss.
Nordic Concrete Research, 1/200392

0
5
10
15
20
25
30
35
40
45
0 5 10 15 20 25mid-span deflection
[mm]
Q [kN]
T10-6-5 H=200
T10-6-5 H=150
T10-6-5 H=120
Figure 8. Load versus mid-span deflection, influence of the truss height.
05
10
15
2025
30
3540
45
0 5 10 15 20 25[mm]
Q [kN]
T12-6-5 H=150
T10-6-5 H=150/ 8
T10-6-5 H=150/ 10
T10-6-5 H=150
mid-span deflection
Figure 9. Load versus mid-span deflection, influence of the top chord diameter.
0
5
10
15
20
25
30
0 200 400 600 800 1000 1200 1400strain [10 -6]
Q [kN]
Figure 10. Typical load–strain curve for the embedded truss reinforcement, measured at mid-span, for slab T10-6-5 H=150.
Nordic Concrete Research, 1/2003 93

Figure 11. (a) Crack pattern after a deflection of 30 mm, for slab T10-6-5 H=150. Dotted lines towards the centre of the slab indicate were the load was applied and the continuous lines at the ends indicate the supports. (b) Photo showing the deformed truss.
6. NUMERICAL ANALYSIS
Numerical analysis (e.g. finite element analysis) provides possibilities to analyse complexproblems, but also to virtually study the effect of different material properties and geometricalconfigurations. A finite element model was set up in the program DIANA [9]. From the tests it was realised that the structural behaviour is governed by three main mechanisms: buckling of the lattice girder at peak load (see Figure 11 b), cracking (see Figure 11 a), and tension stiffening (see Figure 7 and 10). Hence, the elements and material models to be used in the analysis should be able to represent the non-linear phenomena of buckling (geometric non-linearity), cracking (material non-linearity), and slip of the reinforcement. When modelling,there is always a careful balance needed between the level of detailing and the complexity of the problem, the desired output and the ‘accuracy’ of the results and the pros and cons always have to be considered carefully when choosing models and elements for the FE model. For example,during the modelling and analysis process it was experienced that the inclusion of a bond-slip improved the localisation of primary cracks and the convergence.
6.1 Finite Element Model In the numerical analysis, the concrete slab was modelled with curved shell elements, which are good at describing bending, with eleven integration points in the thickness direction. Curved higher-order beam elements represented the lattice girder, while truss elements represented the other reinforcement. In order to capture the buckling load, the top chord was given an initial sinusoidal imperfection, with a maximum value of 0.1% of the top bar diameter. Both the reinforcement and the lattice girder were modelled with the von Mises plasticity condition. The model is shown in Figure 12.
Symmetry lines
Line load, Q/4
Support
1180/2
200
700
400
Figure 12. Finite element model representing a lattice girder element (due to symmetry, only a quarter of the slab needs to be modelled).
Nordic Concrete Research, 1/200394
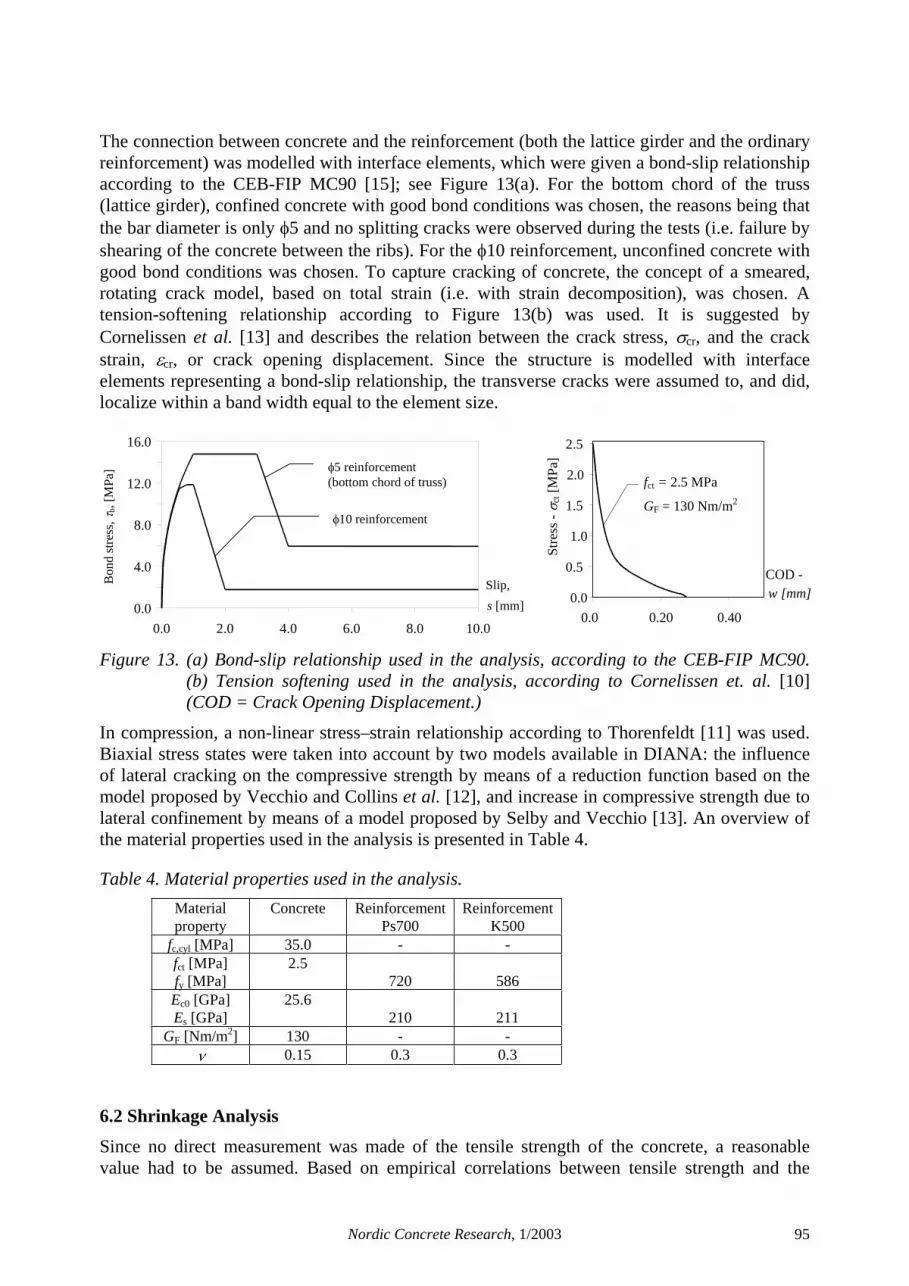
The connection between concrete and the reinforcement (both the lattice girder and the ordinary reinforcement) was modelled with interface elements, which were given a bond-slip relationship according to the CEB-FIP MC90 [15]; see Figure 13(a). For the bottom chord of the truss (lattice girder), confined concrete with good bond conditions was chosen, the reasons being that the bar diameter is only 5 and no splitting cracks were observed during the tests (i.e. failure by shearing of the concrete between the ribs). For the 10 reinforcement, unconfined concrete with good bond conditions was chosen. To capture cracking of concrete, the concept of a smeared,rotating crack model, based on total strain (i.e. with strain decomposition), was chosen. A tension-softening relationship according to Figure 13(b) was used. It is suggested by Cornelissen et al. [13] and describes the relation between the crack stress, cr, and the crack strain, cr, or crack opening displacement. Since the structure is modelled with interface elements representing a bond-slip relationship, the transverse cracks were assumed to, and did, localize within a band width equal to the element size.
0.0
4.0
8.0
12.0
16.0
0.0 2.0 4.0 6.0 8.0 10.0
Slip,s [mm]
Bon
d st
ress
,b,
[MPa
]
10 reinforcement
5 reinforcement(bottom chord of truss)
0.0
0.5
1.0
1.5
2.0
2.5
0.0 0.20 0.40
COD - w [mm]
fct = 2.5 MPa
GF = 130 Nm/m2
Stre
ss -
ct [M
Pa]
Figure 13. (a) Bond-slip relationship used in the analysis, according to the CEB-FIP MC90. (b) Tension softening used in the analysis, according to Cornelissen et. al. [10](COD = Crack Opening Displacement.)
In compression, a non-linear stress–strain relationship according to Thorenfeldt [11] was used. Biaxial stress states were taken into account by two models available in DIANA: the influence of lateral cracking on the compressive strength by means of a reduction function based on the model proposed by Vecchio and Collins et al. [12], and increase in compressive strength due to lateral confinement by means of a model proposed by Selby and Vecchio [13]. An overview of the material properties used in the analysis is presented in Table 4.
Table 4. Material properties used in the analysis.
Materialproperty
Concrete ReinforcementPs700
ReinforcementK500
fc,cyl [MPa] 35.0 - -fct [MPa]fy [MPa]
2.5720 586
Ec0 [GPa]Es [GPa]
25.6210 211
GF [Nm/m2] 130 - -0.15 0.3 0.3
6.2 Shrinkage Analysis Since no direct measurement was made of the tensile strength of the concrete, a reasonable value had to be assumed. Based on empirical correlations between tensile strength and the
Nordic Concrete Research, 1/2003 95

compressive strength and splitting tensile strength, the concrete was assumed to have a tensile strength, fct, of 2.6-3.0 MPa. However, concrete shrinkage, which took place from the time of manufacturing to the time of testing, introduces tensile stresses in the concrete, resulting in a lower cracking load. To evaluate the shrinkage-induced stresses, an analysis based on the sameFE-model was made, considering the time-dependent effects of shrinkage, creep, and materialproperties (modulus of elasticity). In DIANA, models are available for both creep and shrinkage; the models used in this analysis were based on the CEB-FIP MC90, creep being modelled by rheologic Maxwell/Kelvin chains, and shrinkage being modelled as age-dependent initial strain. The shrinkage strain was considered as uniform over the thickness of the slab; in reality the surfaces will dry out faster than the core, resulting in additional shrinkage effects. To consider the curing conditions, curage is the concrete age in days at the end of the curing period. The elastic and creep deformation for a young concrete will be much larger than for a concrete loaded at later stage; the model codes therefore give different superposable creep curves for loading at different young concrete ages. The creep and shrinkage models require additional data, and the following inputs were given; see Table 5.
Table 5. Model parameters used in the analysis.
Model parameter Creep / ShrinkageEc.28 [GPa]
modulus of elasticity at 28 days25.1
fc,cyl.28 [MPa]compressive strength at 28 days
33.5
H [mm]notational size of the member
48
RH [%]ambient relative humidity
60
TEMPR [ C]ambient temperature
20
CEMENTtype of cement
normal hardening
Curage [days] 2Aging [days] 2
The result of the shrinkage analysis is shown in Figure 14. The shrinkage-induced stresses are on the order of 0.4 MPa in the bottom of the slab and 1.0 MPa at the top of the slab. Hence, to capture the cracking load, an effective tensile strength of 2.5 MPa was used in the analysis instead of the earlier estimated value of 2.6-3.0 MPa.
Shrinkage Stresses in Concrete Slab - Longitudinal variation
0.0
0.20
0.40
0.60
0.80
1.00
1.20
0.0 0.2 0.4 0.6 0.8 1.0 1.2
Length coordinate, x [m]
Stre
ss,
cs [M
Pa]
Top Surface
Bottom Surface
sym
met
ry li
ne
Figure 14. Shrinkage-induced tensile stresses, from numerical analysis.
Nordic Concrete Research, 1/200396

6.3 Results From Numerical Analysis The first step was to compare the numerical results with the test results in order to investigate whether the model was able to simulate the structural behaviour in a reasonable way.
The lattice girder element presents several difficulties for the numerical analysis. Since cracking plays such a significant role in the degradation of the stiffness, this must be captured correctly throughout the entire loading process. Hence, a correct crack pattern is needed (number of cracks and their spacing). The peak load was represented accurately. However, the numericalmodel showed too stiff behaviour, mainly due to insufficient crack localisation. The buckling phenomenon was predicted in a satisfactory manner. The analysis becomes numerically unstable as soon as cracking starts, and has convergence problems in some load steps. In Figure 15, a comparison is made between the numerical and experimental load–deflection curves for slab T10-6-5 H=150. In the numerical analysis two different load step sizes were chosen; for FEM-1 an automatic adaptation was used, and in FEM-2 explicitly specified step sizes were used. As can be seen, the different step sizes give slightly deviating results; the adaptive load steps give a stiffer response but, on the other hand, give a shorter computational time. The conclusion is that the model is seemingly able to simulate the structural behaviour even though the response is a little too stiff.
0
5
10
15
20
25
30
0 2 4 6 8 10 12 14 16mid-span deflection
[mm]
Q [kN]
T10-6-5 H=150 /8T10-6-5 H=150 /10FEM-1FEM-2
Figure 15. Comparison of numerical (two different load step sizes) and experimental results (slab T10-6-5 H=150).
7. STRUCTURAL BEHAVIOUR AND PERFORMANCE ENHANCEMENT
In the building and construction industry, as in other industries, it is thought that innovation in engineering is often the result of the clever use of a new or improved material. For instance, Li [14] argues, “Advanced materials are increasingly recognized as an enabling technology for the building and construction industry”. However, in order to successfully introduce new materialsinto structural systems, it is, or should be, a necessity to have tools to ‘predict’ the structural behaviour – tools which are able to describe the phenomena of failure, and which consider relevant material properties and behaviour. One such tool is the finite element method, which should be based on non-linear fracture mechanics since concrete is a quasi-brittle material.Based on the structural behaviour, and observations from the experiments and numericalanalyses, important mechanisms are discussed in the following.
Nordic Concrete Research, 1/2003 97

7.1 Cracking and Tension Softening In analysis of concrete structures, it is often assumed that concrete does not carry any tensile stresses – these are simply neglected. This assumption might well be justified in the ultimatelimit state analysis, when the reinforcement starts to yield for large strains. However, in the service state, with reinforcement stresses below the yield stress (or well below as in the case of the lattice girder elements), it is well known that concrete does contribute considerably to the structural stiffness. Moreover, for structural elements with a small section depth, such as the lattice girder element, the stress distribution after cracking plays a significant role.
The behaviour of concrete in flexural tension is complex and often a flexural strength isintroduced, since it has been noted that concrete beams have a higher load-carrying capacity than theory based on strength of materials predicts. The flexural strength considers the effect of the stress distribution after cracking for a beam. For low beam heights, the ratio of flexural to axial tensile strength of concrete is larger than for high beams, where it theoretically approaches unity. The equations used in design codes (e.g. CEB-FIP MC90 [15]) to calculate the flexuralstrength have been deduced from a consideration of fracture mechanics. It should be noted that what are compared are the real load-carrying capacity (with the stress distribution after cracking initiation) and the calculated load-carrying capacity under the assumption of linear elastic properties of the concrete. The latter concept is illogical because it does not explain the phenomena or describe the actual stress distribution, but it may be justified if only the peak load is of interest and not the post-peak response; in comparison, for compressive stresses it is common practice to calculate with a non-linear stress distribution. Moreover, it is not reasonable to compare the flexural strength of ordinary concrete with that of a fibre-reinforced concrete since these have totally different stress distributions after cracking. In a perfectly elastic-brittle material (such as ceramics or mortar), there is no tension softening; consequently, as soon as the tensile strength is reached in the extreme fibre, the peak load is reached (see Figure 16).
fc.fl fct
( )
(w)ct
fct
cracking
Q
Qmax
Qbrittle
tension-softeningmaterial
brittle material f
Q
f
Figure 16. Strain and stress distribution at peak load, Qmax, after cracking and assumed linear stress distribution with the fictitious flexural strength, fc.fl, at the extreme tension fibre (for a plain concrete beam).
In numerical analysis, such as the finite element approach, there exist models able to describe the tension softening of quasi-brittle materials. One of the first studies to present a model, based on non-linear fracture mechanics, was by Hillerborg et al. [16] who introduced a fictitiouscrack.
7.2 Tension Stiffening Consider a tensile member with an embedded reinforcement bar. When the concrete starts to crack, it can still transfer some tensile stresses; the magnitude depends on the tension-softening
Nordic Concrete Research, 1/200398

behaviour (see Figure 17 and Figure 18). The concrete between the cracks carries tension, and hence stiffens the response of a reinforced concrete member subjected to tension. This stiffening effect after cracking is referred to as tension stiffening (see e.g. [17]). For tensile memberswithout fibres, the reinforcing bar must carry all of the tension at crack locations. If fibres are added, they help the steel bar to carry tension, which can significantly increase the tension stiffening. However, it may also, for limited crack widths, enable fibre-reinforced concrete members to carry loads greater than the yield load of the reinforcing bar. The factors affecting the tension stiffening are the crack formation and how the concrete is activated between the cracks; these are determined by the bond-slip relationship, the tensile strength and the stiffness of the concrete.
Relative elongation, /L
Axi
al fo
rce,
N
bare bar response
Ncr
Ny1
Ny2
N
N
L
Ns
Nc
Fibre reinforcedconcrete
Concrete
yield load
Figure 17. Tension-stiffening effect for a tensile member with an embedded reinforcement bar.
7.3 Mechanical Behaviour of Fibre-reinforced Concrete Materials science has provided structural engineers with a whole array of high-performancematerials. The question is where, when, and how these materials should be used. For example,high-strength concrete is often viewed as an enabling technology. However, there are someserious drawbacks with high-strength concrete: the fracture energy and tensile strength do not increase with the same magnitude as do the compressive strength. This results in a more brittle material, which then has a tendency to cause larger crack widths when cracking and, thus, requires more reinforcement (e.g. Li [18] and Al-Fayadh [19]). For systems such as the lattice girder elements, where the tensile behaviour plays a significant role, high-strength concrete must be used in combination with fibre reinforcement if it is to be a performance enhancement.The advantage of incorporating fibres into a cement matrix is that it increases the toughness and (in some cases) the tensile strength (see Figure 18). In addition, it improves the cracking and deformation characteristics of the composite. According to Mindess [20], the fibres appear to have two important roles in reinforced concrete:
1. Fibres may permit the post-cracking (or residual) strength of the fibre-reinforced concrete to be used in the design, since the fibre-reinforced matrix can continue to carry a considerable amount of load after cracking has occurred, over a wide range of deflections.
2. Fibres enhance the interaction and force transfere between the matrix and the reinforcingsteel, by inhibiting crack growth emanating (splitting cracks) from the bar deformationsand creating confinement.
Nordic Concrete Research, 1/2003 99

Thus, the key feature of fibre-reinforced concrete is the ability of the fibres to bridge across cracks. The effect fibres have on the tension-stiffening response of tensile members with embedded reinforcement (see Figure 17) has been investigated by, among others, Abrishami & Mitchell [21] and Noghabai [22].
w
deformation
E
t
w
Quasi-brittlePlain concrete
Quasi-brittleFibre-reinforcedConcrete
Strain hardening:High-performanceFibre-reinforcedConcrete
w(w)
w
Multiplecracking
w(w)
Cracklocalisation
Cracklocalisation
Brittle
Figure 18. Tension-softening behaviour: brittle material, plain concrete, fibre-reinforced concrete, and high-performance fibre-reinforced concrete (strain hardening).
7.4 Performance Enhancement – Hypothesis Based on Observations What can be concluded is that the structural behaviour – in the ultimate limit state – is primarilydependent on geometrical parameters (i.e. the geometry of the truss and the slenderness of the top chord as well as the thickness of the slab); however, the tension softening and tension stiffening play a vital role in the serviceability limit state. In the ultimate limit state, the concrete’s ability to transfer tensile stresses after cracking has an effect on the peak load (forfibre-reinforced concrete in particular). These observations together with research into the tension-softening behaviour and tension stiffening for concrete and fibre-reinforced concrete will serve as a base for a hypothesis. The following arguments can be formed:
1. The truss geometry and slab thickness are the parameters that have the most significant effect on the structural behaviour.
2. However, tension softening and tension stiffening play a significant role for the structural behaviour (i.e. for the same truss configuration) in the serviceability limitstate, and to some extent also in the ultimate limit state.
3. The crack formation and characteristics (crack spacing and widths) depend on the interaction between the concrete and the reinforcement (bond-slip relationship) together with the material behaviour of the concrete (tensile and compressive strength and the modulus of elasticity).
4. It is now well known that concrete can transfer stresses after crack localisation, through aggregate bridging, and that the softening behaviour primarily depends on the aggregates and can be quantified by the fracture energy, GF [Nm/m2 or J/m2] and by the shape of the tension-softening curve.
5. It is possible to design the behaviour of the concrete; e.g. by the addition of fibres, the softening behaviour can be changed, which does not change the tensile strength muchbut results in an increase of the fracture energy (see Figure 18).
Nordic Concrete Research, 1/2003100

6. For fibre-reinforced concrete, it is known that the type of fibre (material properties, length, diameter, surface characteristics, etc.) and the volume fraction, as well as the type of the matrices it is embedded in, have a significant impact on the softening behaviour.
If the above premises are valid, then the following hypothesis can be formed. Addition of fibres, given that a proper mix proportion is selected/developed, would be beneficial from a structural viewpoint; i.e. a stiffer response and fewer and smaller cracks would be the expected outcome of this performance enhancement.
For the mechanical behaviour of fibre-reinforced concrete (see tension softening in Figures 18 and 19) information may be found in the literature, e.g. Stang et al. [23], Lin [24], and Noghabai [16]. However, it is also possible to derive stress–strain/crack relationships from analytical models. For example, with the aid of micro-mechanical models (e.g. Stang and Li [25]), stress–strain/crack relationships can be derived by studying a single fibre pull-out, then averaged on a meso level, and finally used on a macro (structural) level. The obtained stress-strain/crack relationships are, of course, analytical and should be verified with experiments. Nonetheless, since the models contain parameters such as geometrical and mechanical properties of the fibre (length, diameter, volume fraction, strength, and modulus of elasticity), matrix mechanicalproperties (modulus of elasticity and fracture energy), and fibre-matrix interface mechanicalproperties (chemical bond, friction, modulus of elasticity, and fracture energy), they provide a tool for predicting the effect of fibres and also allow an optimisation of the mix proportions instead of the ‘old’ trial-and-error approach.
0.0
1.0
2.0
3.0
4.0
5.0
6.0
0.0 0.20 0.40 0.60 0.80 1.00
COD - w [mm]
Stre
ss -
ct [M
Pa] fct = 2.9 MPa
G F = 1000 Nm/m 2
fct = 5.6 MPaG F = 1000 Nm/m 2
fct = 2.9 MPaG F = 75 Nm/m 2
fct = 5.6 MPaG F = 135 Nm/m 2
FRC80:
FRC30:
C80:
C30:
Figure 19. Tension softening used in the analysis, for different types of concrete C30 and C80 based on material parameters according to CEB-FIP MC90 [15].
The final step in the present study was to investigate the possibilities that fibre reinforcementhas to offer, primarily by changing the tension-softening behaviour and the fracture energy. In this comparison, the slab was given a uniformly distributed load, simulating the loads on the construction site (before, during and after concrete casting). During construction, the floor panels must be able to support load from: self-weight of precast panels; dead load of the wet in-situ concrete (including localised mounding during placing); and live loads (due to stacked materials, workmen and equipment). Three different slabs were analysed: slab with a truss T10-6-5 H=150 and simply supported with a span length of 2.2; slab with a truss T10-6-5 H=150 and simply supported with a span length of 2.6 m; slab with a truss T12-6-5 H=150 and simply
Nordic Concrete Research, 1/2003 101

supported with a span length of 2.6 m was analysed. The results can be seen in Figures 20 (a) to 20 (c).
0.0
5.0
10.0
15.0
20.0
0.0 2.0 4.0 6.0 8.0 10.0mid-span deflection
[mm]
q [kN/m2]
C30FRC30C80FRC80
Figure 20. (a) Load deflection curve for slab with truss T10-6-5, and span L=2200. Influence of material characteristics, normal-strength concrete (C30), high-strength concrete (C80), and two different fibre-reinforced concretes (FRC30 and FRC80).
0.0
5.0
10.0
15.0
20.0
0.0 4.0 8.0 12.0 16.0mid-span deflection
[mm]
q [kN/m2]
C30FRC30C80FRC80
Figure 20. (b) Load deflection curve for slab with truss T10-6-5, and span L=2600.
0.0
5.0
10.0
15.0
20.0
0.0 4.0 8.0 12.0 16.0mid-span deflection
[mm]
q [kN/m2]
C30FRC30
FRC80C80
Figure 20. (c) Load deflection curve for slab with truss T12-6-5, and span L=2600.
Nordic Concrete Research, 1/2003102

The numerical analyses suggest that the toughness, which the addition of fibres produces, plays a significant role for the structural behaviour, both for the serviceability- (limiting deflections) and the ultimate limit state. The stiffness of the system, after cracking, is increased and it is thus able to carry a larger load at the same deflection; this is more pronounced for the high-strength concrete. Furthermore, the peak load is increased, even though the top chord buckles at the samestress, since the concrete is able to participate in the load-carrying capacity. The crack formationdiffered between the normal-strength concrete and the high-strength concrete, with fewer cracks forming for the high-strength concrete. The increased modulus of elasticity of the high-strength concrete significantly increases the stiffness of the system. However, when cracks are initiated this results in a rapid degradation of the stiffness, and the top chord now has to carry a larger compressive force in order to balance the bending moment. Furthermore, as cracking is initiated for a rather high load, almost the same as the peak load, the behaviour becomes brittle. The increased toughness seems to be of particular importance for the high-strength concrete where the crack initiation leads to a rapid stiffness reduction.
8. CONCLUSIONS
This investigation has shown that with numerical tools it is possible to virtually study the effects of different materials on the structural behaviour of the system. The study was limited to simulating the effect, within certain geometrical configurations, on four types of concrete: normal-strength, high-strength, fibre-reinforced normal-strength, and fibre-reinforced high-strength. The structural behaviour of the lattice girder element is, above all, affected by the geometrical configuration of the lattice girder. However, tension stiffening as well as the tension softening of the concrete has a substantial influence on the structural behaviour. Further:
1. The results of the numerical analyses show that it is possible to analyse lattice girder elements. It is essential, though, to use a model able to describe the tension softening of the concrete and to obtain a reasonable crack pattern.
2. A bigger top chord bar increases, as expected, the stiffness and the peak load. 3. An increased modulus of elasticity of the concrete increases the stiffness of the elements.4. A tougher concrete, which the addition of fibres produces, may increase both the peak
load and the stiffness of the elements.5. The increased toughness seems to be particularly important for the high-strength
concrete, where the crack initiation leads to a rapid stiffness reduction.
Lattice girder elements could be one interesting application for fibre-reinforced concrete and, with the opportunities that exist today for designing materials, an appropriate mix proportion should not be impossible to develop. Based on a deep understanding of the structural behaviour, the link between structural behaviour and material properties/behaviour can be used to optimisethe structural performance. Moreover, when the mechanisms behind the structural behaviour have been identified, the design optimisation to achieve the desired performance of the product can be realised by optimising both the geometry and the properties of the materials used. However, this study has so far been limited to the construction stage, and only the performancein this case has been investigated for a single-span element. A complete investigation of the entire life cycle is needed for a genuine optimisation of the system, as described in Chapter 3. Furthermore, improved engineered materials require additional studies and a closer collaboration with materials scientists.
Nordic Concrete Research, 1/2003 103

9. REFERENCES
[1] Harnisch, J.: Comparative Studies on Lattice Girder Elements (Full-scale tests and a finite element simulation),Master’s Thesis 01:13, Dept. of Structural Engineering – Concrete Structures, Chalmers University of Technology,Göteborg, Sweden, 2001, 81 pp. [2] Verdugo, G.: Full-scale Tests and Analytical Model for Lattice Girder Elements, Master’s Thesis 01:11, Dept.of Structural Engineering – Concrete Structures, Chalmers University of Technology, Göteborg, Sweden, 2001, 53 pp.[3] Löfgren, I. and Gylltoft, K.: In-situ cast concrete building: Important aspects of industrialised construction , Nordic Concrete Research, 1/2001, 2001, pp. 61-81. [4] Müller, J. P.: Element or Lattice Girder Floors – Conventionally Reinforced and Prestressed – with CostingExamples, Betonwerk + Fertigteil-Technik, BFT 4/1991, pp. 44-50. [5] Brandt, A. M. and Marks, M.: Optimization of the Material Structure and Composition of Cement BasedComposites, Cement and Concrete Composites, 18 (1996), Elsevier, pp. 271-279. [6] Karihaloo, B. L. and Lange-Kornbak, D.: Optimization techniques for the design of high-performance fibre-reinforced concrete, Struct Multidisc Optim 21 (2001), Springer-Verlag, pp. 32-39. [7] James, M. N.: Engineering Materialism and Structural Integrity, Journal of Engineering Design, Vol. 9, No. 4, CARFAX, pp. 329-342. [8] Löfgren, I.: Lattice Girder Elements in Four Point Bending – Pilot Experiment, Report No. 01:7, Dept. of Structural Engineering – Concrete Structures, Chalmers University of Technology, Göteborg, Sweden, 2001. [9] TNO Building and Construction Research: DIANA Finite Element Analysis, User’s Manual 7. Deen Haag, 1998.[10] Cornelissen, H. A. W., Hordijk, D. A., and Reinhardt, H. W.: Experimental determination of crack softeningcharacteristics of normalweight and lightweight concrete. Heron 31, 2 (1986). [11] Thorenfeldt, E., Tomaszewicz, A., and Jensen, J. J.: Mechanical properties of high-strength concrete and applications in design. In Proc. Symp. Utilization of High-Strength Concrete (Stavanger, Norway) (Trondheim,1987), Tapir.[12]Vecchio, F. J. and Collins, M. P.: Compression Response of Cracked Reinforced Concrete. J. Str. Eng., ASCE 119, 12 (1993), pp. 3590-3610. [13] Selby, R. G. and Vecchio, F. J.: Three-dimensional Constitutive Relations for Reinforced Concrete. Tech. Rep. 93-02, Dept. of Civil Eng., Univ. of Toronto, Toronto, Canada, 1993. [14] Li, V. C.: From Micromechanics to Structural Engineering – The design of cementitious composites for civilengineering applications, Structural Eng. / Earthquake Eng. Vol. 10, No. 2, July 1993, pp. 37-48. [15] CEB-FIP Model Code 1990: Bulletin d’information 213/214. Lausanne, Switzerland, May 1993, 437 pp. [16] Hillerborg, A., Modéer, M. and Petersson, P-E.: Analysis of crack formation and crack growth in concrete bymeans of fracture mechanics and finite elements, Cement and Concrete Research, Vol. 6 (1976), pp. 773-782. [17] CEB Bulletin d’Information 235: Serviceability Models – Behaviour And Modelling In Serviceability Limit States Including Repeated And Sustained Loads. Progress report, April 1997, Lausanne, Switzerland, 265 pp. [18] Li, V.C.: Technological Implications of Concrete Fracture Research – An Overview of Tensile Failure inCementitious Materials and Structures, in Fracture Mechanics : Application to Concrete, Eds. V.C. Li and Z. Bazant, ACI SP-118, pp. 1-16, 1989. [19] Al-Fayadh, S.: Cracking Behaviour of Reinforced Concrete Tensile Members, Master’s Thesis 97:3, Dept. of Structural Engineering – Division of Concrete Structures, Chalmers University of Technology, Göteborg, Sweden 1997.[20] Mindess, S.: Fiber Reinforced Concrete: Challenges and Prospects, in Fiber Reinforced Concrete, Eds. N. Banthia and S. Mindess, Second University-Industry Workshop on Fiber Reinforced Concrete and other Advanced Composites, Toronto, Canada, March 26-29, 1995. [21] Abrishami, H. H. and Mitchell, D.: Influence of steel fibers on tension stiffening, ACI Structural Journal, Vol. 94, No. 6, Nov-Dec 1997, pp. 769-776. [22] Noghabai, K.: Effect of tension softening on the performance of concrete structures – experimental, analyticaland computational studies, PhD thesis 1998:21, Luleå University of Technology, Luleå, Sweden, 1998, 147 pp. [23] Stang, H., Li, V. C. and Krenchel, H.: Design and structural application of stress–crack width relations in fibrereinforced concrete, Materials and Structures, 28, 1995, pp. 210-219. [24] Lin, Y-Z.: Tragverhalten von Stahlfaserbeton, Deutscher Ausschuss für Stahlbeton, Heft 494, Berlin, 1999. [25] Stang, H. and Li, V. C.: Mechanics of Fibre Reinforced Cement Based Composites, International GraduateResearch School in Applied Mechanics, course material, Lyngby, Denmark 2001.
Nordic Concrete Research, 1/2003104

PAPER III
The WST method, a fracture mechanics test method for FRC.Löfgren, I., Stang, H., and Olesen, J.F.
Paper submitted for publication in Materials and Structures, 03/05/2005, 11 p.


Materials and Structures
THE WST METHOD, A FRACTURE MECHANICS TEST METHOD FOR FRC
Löfgren, I.1, Stang, H.2 and Olesen, J.F.2(1) Department of Civil and Environmental Engineering, Chalmers University of Technology, Sweden(2) Department of Civil Engineering, Technical University of Denmark (DTU), Denmark
Submitted for publication: 3/4/2005
ABSTRACTThe applicability of the wedge-splitting test method (WST), for determining fracture properties of fibre-reinforced concrete, is
discussed. Experimental results, using the WST method, are compared with results from uniaxial tension tests (UTT) and three-pointbending tests (3PBT) for five different FRC compositions. Furthermore, for the WST method, two different specimen sizes have beeninvestigated. Results from this investigation demonstrate the applicability of the WST method and show that the scatter of the test results islower than for the 3PBT.
Through inverse analysis, stress-crack opening ( -w) relationships have been determined for each mix and test method. For the two WST specimen sizes, there is no apparent difference either in the number of fibres (per cm2) crossing the fracture plane or in the fractureproperties. The major factor contributing to the scatter in the test results is believed to be related to the variation in the number of fibres across the fracture plane. Furthermore, the inverse analyses indicate no systematic differences in the determined parameters between two WST specimens or between the WST and the 3PBT.
RÉSUMÉL’article concerne l’applicabilité de la méthode d’essai d’écartement par enfoncement d’un coin (WST) pour déterminer les propriétés
de fissures du béton renforcé de fibres. Les résultats expérimentaux utilisant la méthode WST sont comparés aux résultats des essais detraction uniaxiale (UTT) et des essais de flexion trois points (3PBT) pour cinq compositions différentes de béton renforcé de fibres (FRC).Par ailleurs, en ce qui concerne la méthode WST, deux différentes tailles d’éprouvettes ont été étudiées. Les résultats de cette étudeconfirme l’applicabilité de la méthode WST et montre que la dispersion des résultats de l’essai est inférieure à celle obtenue avec laméthode 3PBT.
A partir de l’analyse inverse, la courbe de comportement du matériau contrainte - ouverture de fissure ( -w) a été déterminée pourchaque composition et méthode d’essai. Pour les deux tailles d’éprouvette WST, aucune différence apparente n’est visible, ni dans lenombre de fibres (par cm2) traversant le plan de rupture, ni dans les propriétés de fissures. On estime que le principal facteur contribuantà la dispersion des résultats d’essai se rapporte à la variation du nombres de fibres à travers le plan de rupture. De plus, les analysesinverses n’indiquent aucunes différences systématiques dans les paramètres définis entre deux éprouvettes WST ou entre la méthode WSTet 3PBT.
1 INTRODUCTION
A fundamental aspect of the mechanical performance of fibre-reinforced concrete (FRC) is the tensile behaviour,which can be related to the debonding and frictionalinterface mechanisms that develop along the fibre-matrixinterface. A prerequisite for a widespread use of FRC is aconsistent characterisation of the mechanical performanceand quantification of the related material properties. Thetensile fracture toughness can be characterised by the tensile stress versus crack opening response (hereafterabbreviated as the -w relationship), which also isassociated with the so-called fictitious crack modeloriginally suggested by Hillerborg; see Hillerborg et al. [1]and Hillerborg [2]. With the -w relationship at hand, it ispossible to carry out design tasks based on non-linearfracture mechanics; see e.g. RILEM TC-162 TDF [3]. In
the fictitious crack model, the main parameters are the tensile strength, the modulus of elasticity, the fractureenergy, and the shape of the -w curve.
For regular concrete, the shape of the -w curve does notvary much – see Stang [4] and Cornelissen et al. [5] – and for most practical applications it is usually sufficient to determine the fracture energy, GF, and select an appropriate
-w relationship. For FRC, on the other hand, the shape ofthe -w curves varies considerably depending on type andamount of fibres used, quality of the concrete, etc. Furthermore, as pointed out by Hillerborg [2], the completefracture energy is of no interest since the stress-free crackopening, wc, occurs at very large crack openings for mostFRCs, while for most concretes (without fibres) it is seldomlarger than 0.3 mm. Consequently, to completelycharacterise the mechanical behaviour of fibre-reinforcedconcrete in tension, it is necessary to determine the -w

Löfgren, I. et al. / Materials and Structures. Submitted for publication: 3/4/20052
relationship. The -w relationship may be determined eitherdirectly, in a uniaxial tension test (UTT), or indirectly byperforming an inverse analysis on the results of e.g. a 3PBT. In an inverse analysis, the output from a test(typically a load–CMOD curve) is used as an input for the analysis, and the material parameters, which minimise thedifference between the analytical curve and the test results,are determined.
The purpose of this paper is to demonstrate that thewedge-splitting test (WST) method can be used todetermine fracture properties of steel fibre-reinforcedconcrete. Experimental results from three different test methods are compared, namely: the uniaxial tension test,the three-point bending test (3PBT) on notched beam, and the wedge-splitting test. Furthermore, for the wedge-splitting test, two different specimen sizes have beeninvestigated. Inverse analyses have been used to obtain -wrelationships for the 3PBT and the WST.
2 Fracture mechanics test methods for FRC
Recently, RILEM technical committee TC 162-TDF,“Test and design methods for steel fibre reinforcedconcrete”, published recommendations for two test methodsfor steel-fibre reinforced concrete (SFRC); see RILEM-Committee-TDF-162 [6] and [7]. The proposed testmethods are a uniaxial tension test (UTT) and a three-pointbending test (3PBT) on notched beam. The three-pointbending test on notched beams is probably the mostwidespread method for determining the fracture properties;see RILEM TC-50 FMC [8] for conventional concrete andRILEM TC 162-TDF [7] for steel fibre-reinforced concrete.The UTT requires sophisticated testing equipment and isquite time-consuming to carry out, and it has been shownthat the test result is affected by machine specimeninteraction; see e.g. Østergaard [9].
The wedge-splitting test (WST) method, originally proposed by Linsbauer and Tschegg [10] and laterdeveloped by Brühwiler and Wittmann [11], is an interesting method since it does not require sophisticatedtest equipment; the test is stable and a mechanical testing apparatus with a constant crosshead displacement can be used. Furthermore, a standard cube specimen is used, butthe test can also be performed on core-drilled samples. In Fig. 1, the specimen geometry and loading procedure areclarified. The specimen is equipped with a groove (to beable to apply the splitting load) and a starter notch. Twosteel platens with roller bearings are placed partly on top ofthe specimen, partly into the groove, and through a wedgingdevice the splitting force, Fsp, is applied. During a test, the load in the vertical direction, Fv, and the deformation, in the groove at the level of the roller bearings, are monitored; seealso Figs. 2 and 3. The deformation is referred to as thecrack mouth opening displacement (CMOD).
load cell
steel loadingdevice withroller bearings wedging
device
linear support
Clipgauge
cubespecimen
piston withconstant cross-head displacement
starter notch(cut-in)
groove (cast)
Fig. 1 – Schematic view of the WST-method.
Researchers have used the WST method extensively. The method has proved to be successful for thedetermination of fracture properties of ordinary concrete atearly age and later (see Østergaard [9]), and for autoclavedaerated concrete (see Trunk et al. [12]). In addition, the method has been used for the study of fatigue crack growthin high-strength concrete (see Kim and Kim [13]) andfracture behaviour of polypropylene fibre-reinforcedconcrete (see Elser et al. [14]). For steel fibre-reinforcedconcrete, a small number of references can be found. Medaet al. [15] used the WST method (with three specimensizes) to determine a bi-linear stress crack openingrelationship through inverse analysis. Nemegeer et al. [16]used the WST method to investigate the corrosionresistance of cracked fibre-reinforced concrete. However, inan experimental study conducted by Löfgren [17] it was found that there could be problems with horizontal cracks,which was also found by Leite at el. [18]. Still, to theauthors’ knowledge there exist no proper recommendationsregarding testing steel fibre-reinforced concrete by theWST method (specimen size, interpretation, etc).
3 Experimental program
3.1 Materials In total, five different concrete mixes were used in this
investigation. The varied parameters were (see Table 1) the volume fraction of fibres, Vf ; the water binder ratio, w/b;and the fibre geometry (the length and diameter of thefibre). Hooked-end steel fibres (type Dramix ) were used:RC 65/60-BN (fibre length 60 mm, diameter 0.9 mm) andRC 65/35-BN (fibre length 35 mm, diameter 0.55 mm). The specimens for each test series were made from one batch(220 litres), which was mixed in a planetary mixer. Theconcrete was compacted on a table vibrator for about twominutes at 50 Hz. After casting, the specimens were covered with plastic until the next day when they were de-moulded. The specimens were then stored in water, with a temperature of 21 2ºC, until the time of testing which inmost cases took place 28 days after casting.

Löfgren, I. et al. / Materials and Structures. Submitted for publication: 3/4/2005 3
Table 1 – Concrete mix compositions.Constituents Density
[kg/m3]Mix 1
[kg/m3]Mix 2
[kg/m3]Mix 3
[kg/m3]Mix 4
[kg/m3]Mix 5
[kg/m3]CEM II/A-LL 52.5 R 3100 260 260 360 360 360Fly ash 2250 - - 100 100 100Water 1000 150 150 172 172 172Equivalent w/b-ratio - 0.58 0.58 0.42 0.42 0.42SIKA ViscoCrete 34 1090 0.4 0.953 0.4 0.4 0.4Aggregates:00 – 04 mm 2535 822.6 794.1 745.4 745.4 744.304 – 08 mm 2642 345.8 333.8 313.3 312.9 312.908 – 16 mm 2637 700.7 676.5 635 634 634Fibres, Vf(Aspect ratio/Length)
7800 0.5%(65/60)
1.0%(65/60)
0.5%(65/60)
1.0%(65/60)
1.0%(65/35)
Measured air content 4.5% 7.0% 1.4% 1.4% 1.5%
3.2 Uniaxial tension test The uniaxial tension tests were conducted according to
the recommendations of RILEM TC-162 TDF, see [6], in a 250 kN Instron 8502 machine using a special test setupdeveloped at DTU; see Østergaard [9]. With the setup, arotationally stiff connection between the testing machineand the specimen is achieved; the machine stiffness has been measured as 251 kNm/rad by Østergaard [9]. For each mix, at least three specimens were tested.
3.3 Three-point bending test The three-point bending tests were conducted according
to the recommendations of RILEM TC-162 TDF, see [7], inan Instron 6025 universal testing machine with a capacityof 100 kN. The crack mouth opening displacement, CMOD,was measured at a distance of 8 mm from the bottom of the beam with an Instron clip gauge, having a 10 mm gaugelength and a maximum travel of 5 mm. The net load-pointdeflection was measured by two LVDT transducers. Thetests were performed under CMOD control. For each mix,five specimens were tested.
3.4 Wedge-splitting testFor the WST method, two different specimen sizes were
investigated: large specimens, in Fig. 2(a), and smallspecimens, in Fig. 2(b). The actual specimen sizes were chosen on the assumption that they would constitute a representative volume, but also in order to be practical forstandard testing procedures. To avoid any wall effects, thestarter notch was sawn; and to ensure a vertical crack propagation, a 25 mm deep guide-notch was cut on eachside of the specimens, in Fig. 2(c), to produce a specimenwith an effective thickness of 100 mm. The effect of theguide-notch was investigated in a separate test series, usingMix 5. Six large and six small specimens were cast; threelarge and small specimens were given guide-notches whilethe others were cut to a thickness of 100 mm; see Fig. 2(d).
For each mix, six specimens were tested. The tests wereperformed under CMOD control in an Instron 6025universal testing machine with a capacity of 100 kN. TheCMOD was measured with an Instron clip gauge, gaugelength 10 mm and maximum travel 5 mm. In the tests, a wedge angle of 15° was used and the roller bearings usedwere of the double-row-deep-groove type (manufactured bySKF, designation 4203 ATN9); see Fig. 3 for theexperimental setup.
guide notch
100
25
25
casting surface
(c) Top view
Specimens withguide notch
(a) Front view (b) Front view
100
casting surface
(d) Top view
Specimens withoutguide notch
Fig. 2 – Geometry of the wedge splitting test specimens(dimensions in mm).
Fig. 3 – Experimental setup for the WST.

Löfgren, I. et al. / Materials and Structures. Submitted for publication: 3/4/20054
4 Test results
4.1 Uniaxial tension test Figure 4 shows the average -w relationships from the
UTT experiments, and in Fig. 5 the scatter of the test resultsis presented in terms of the coefficient of variance (CoV)for the stress, , at different crack openings, w. In Fig. 4, itis evident that the results for some of the mixes give quitelow post-cracking stresses and the effect of increased fibrevolume cannot actually be seen; e.g. the stress for Mix 2(with 1% fibres) is lower than for Mix 1 (with 0.5% fibres).This is probably caused by a poor fibre orientation and a small number of fibres crossing the fracture plane. Thevariability of the test results, presented in Fig. 5, is quitelarge and the CoV varies between 10% and 50%.
0.0
0.5
1.0
1.5
2.0
2.5
3.0
3.5
0.0 0.2 0.4 0.6 0.8 1.0w [mm]
Stre
ss,
,[M
Pa]
Mix 5Mix 4
Mix 1Mix 3Mix 2
Fig. 4 – Average -w relationships from the UTT.
0%
10%
20%
30%
40%
50%
0.0 0.5 1.0 1.5 2.0 2.5
w [mm]
CO
V fo
r the
stre
ss,
,[%
]
Mix 3
Mix 5
Mix 2
Mix 4
Mix 1
Fig. 5 – CoV for the stress at different w, for the UTT.
4.2 Three-point bending test From the test results of the individual beams in a test
series, average load–CMOD curves have been constructed;Fig. 6 shows the average load–CMOD curves for the mixes,and Fig. 7 shows the CoV for the load. In Fig. 6 it can be seen that, as the fibre volume increases, both the peak loadand the post-peak load increase. Furthermore, the w/c ratio has a similar influence. The variability in the measured loadis quite large; the CoV is up to 38%, but as the fibre volumeis increased the CoV decreases.
0
5
10
15
20
25
30
0.0 1.0 2.0 3.0 4.0 5
CMOD [mm]
Load
[kN
]
Mix 1
Mix 2
Mix 3
Mix 5
Mix 4
.0
Fig. 6 – Average load-CMOD curves for the 3PBT.
0%
10%
20%
30%
40%
0.0 1.0 2.0 3.0 4.0 5.0
CMOD [mm]
CO
V fo
r the
load
[%]
Mix 1
Mix 3
Mix 5
Mix 4
Mix 2
Fig. 7 – CoV for the load at different CMODs for the 3PBT.
4.3 Wedge-splitting testThe test results from the WSTs are presented in Figs. 8-
11. Figure 8 shows the average splitting load–CMOD curvefor the small WST specimens, and Fig. 9 shows the CoV forthe splitting load. The corresponding results for the largeWST specimens can be seen in Figs. 10 and 11. Similar tothe 3PBT, in Figs. 8 and 10 it can be observed that thesplitting load, Fsp, increases with the amount of fibres. TheCoV for the measured splitting load is up to 26%.
0
1000
2000
3000
4000
5000
6000
0.0 1.0 2.0 3.0 4.0 5.0
CMOD [mm]
Split
ting
load
, Fsp
,[N
ewto
n]
Mix 1
Mix 2Mix 3
Mix 5
Mix 4
Fig. 8 – Average splitting load-CMOD curves for the small WST-specimens.

Löfgren, I. et al. / Materials and Structures. Submitted for publication: 3/4/2005 5
0%
10%
20%
30%
40%
0.0 1.0 2.0 3.0 4.0 5.0
CMOD [mm]
CO
V fo
r Fsp
[%]
Mix 3
Mix 4
Mix 1
Mix 5
Mix 2
Fig. 9 – CoV for the load at different CMODs for the small WST-specimens.
0
2000
4000
6000
8000
0.0 1.0 2.0 3.0 4.0 5
CMOD [mm]
Split
ting
load
, Fsp
,[N
ewto
n]
Mix 1
Mix 3
Mix 2
Mix 5
Mix 4
.0
Fig. 10 – Average splitting load-CMOD curves for the large WST-specimens.
0%
10%
20%
30%
40%
0.0 1.0 2.0 3.0 4.0 5.0
CMOD [mm]
CO
V fo
rFsp
[%]
Mix 2
Mix 3
Mix 1
Mix 4Mix 5
Fig. 11 – CoV for the load at different CMODs for the large WST-specimens.
4.4 Investigation of a guide-notch for the WST
Figure 12 shows the results from the experimentsregarding the guide-notch, and Fig. 13 shows the CoV forthe splitting load. Specimens denoted 150-S and 150-L are specimens with a guide-notch, while those denoted 100-Sand 100-L are specimens without a guide-notch.
0
2000
4000
6000
8000
0.0 1.0 2.0 3.0 4.0 5
CMOD [mm]
Split
ting
load
, Fsp
,[k
N]
100-L150-L
.0
100-S
150-S
Fig. 12 – Average splitting load-CMOD curves for small and largeWST-specimens, with (150-S respectively 150-L) and without(100-S respectively 100-L) guide-notches.
0%
10%
20%
30%
40%
0.0 1.0 2.0 3.0 4.0 5.0
CMOD [mm]
CO
V fo
r Fsp
[%]
150-S
150-L
100-S
100-L
Fig. 13 – CoV for the load at different CMODs for small and largeWST-specimens, with (150-S respectively 150-L) and without(100-S respectively 100-L) guide-notches.
5 Discussion
5.1 Fibre content and variation in fibre distribution
The number of fibres crossing a crack has a significantinfluence on the toughness and the -w relationship.Therefore, the fibres crossing the fracture surface have beencounted for all specimens and the fibre efficiency factor, b,has been calculated. The fibre efficiency factor, b, definesthe efficiency of bridging, in terms of the amount of fibresbridging a crack, with respect to orientation effects. Thetheoretical fibre efficiency factor, b, in a large volume is asfollows (see e.g. [19]): for the 1-D case, b.1D = 1; for the 2-D case, b.2D = 2/ ( b.2D 0.64); and for the 3-D case, b.3D
= 1/2. Figure 14 presents the fibre efficiency factor, b.exp,as obtained in the specimens, and Fig. 15 shows the coefficient of variance (CoV) for the fibre efficiency factor,
b.exp. The experimental fibre efficiency factor, b.exp, is calculated as:
ff
fb AV
N exp.exp. (1)
where Nf.exp is the number of fibres per unit area, Vf is the fibre volume fraction, and Af is the cross-sectional areaof a fibre.
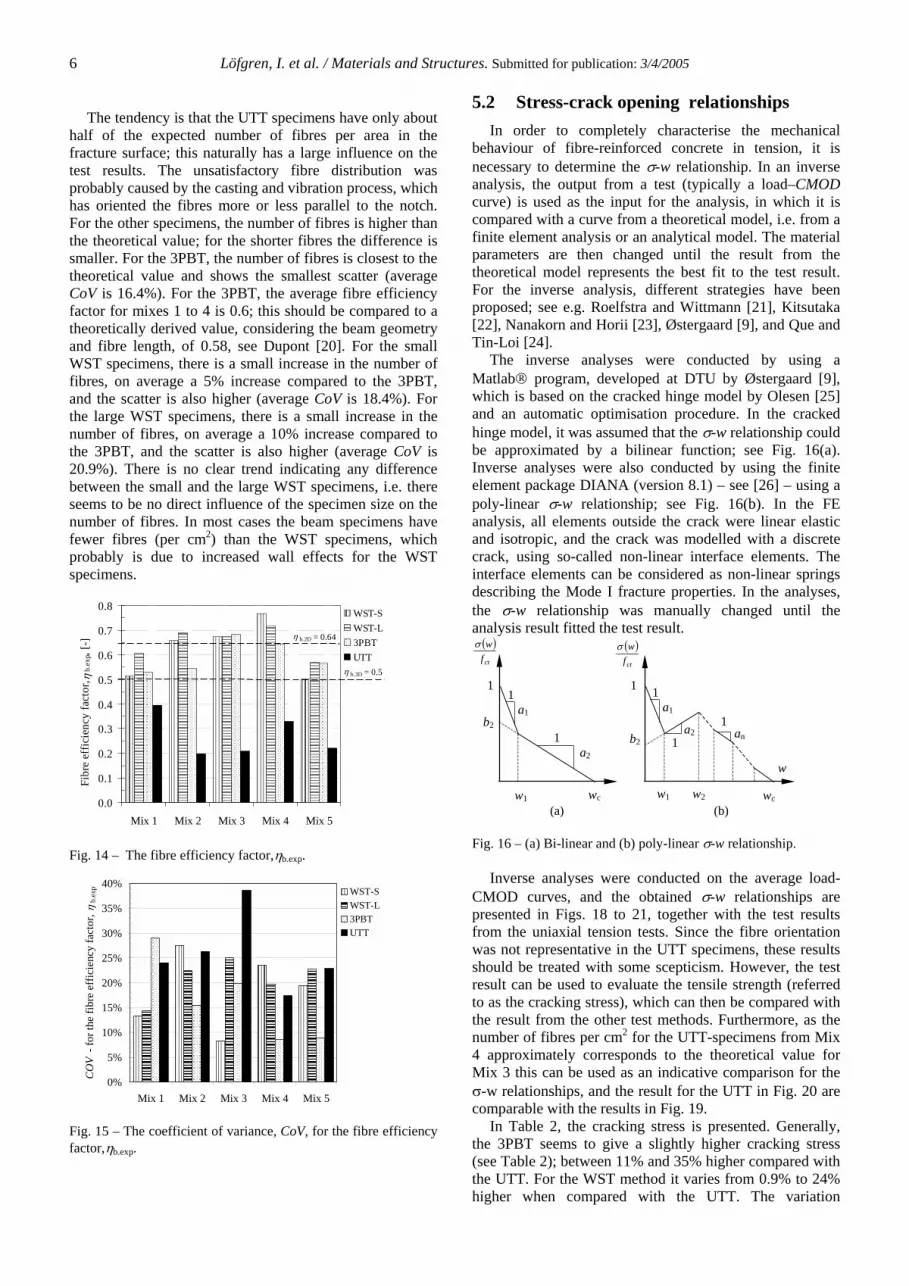
Löfgren, I. et al. / Materials and Structures. Submitted for publication: 3/4/20056
The tendency is that the UTT specimens have only abouthalf of the expected number of fibres per area in thefracture surface; this naturally has a large influence on the test results. The unsatisfactory fibre distribution wasprobably caused by the casting and vibration process, whichhas oriented the fibres more or less parallel to the notch.For the other specimens, the number of fibres is higher thanthe theoretical value; for the shorter fibres the difference is smaller. For the 3PBT, the number of fibres is closest to thetheoretical value and shows the smallest scatter (averageCoV is 16.4%). For the 3PBT, the average fibre efficiencyfactor for mixes 1 to 4 is 0.6; this should be compared to a theoretically derived value, considering the beam geometryand fibre length, of 0.58, see Dupont [20]. For the smallWST specimens, there is a small increase in the number offibres, on average a 5% increase compared to the 3PBT,and the scatter is also higher (average CoV is 18.4%). Forthe large WST specimens, there is a small increase in thenumber of fibres, on average a 10% increase compared tothe 3PBT, and the scatter is also higher (average CoV is20.9%). There is no clear trend indicating any differencebetween the small and the large WST specimens, i.e. thereseems to be no direct influence of the specimen size on thenumber of fibres. In most cases the beam specimens havefewer fibres (per cm2) than the WST specimens, whichprobably is due to increased wall effects for the WSTspecimens.
0.0
0.1
0.2
0.3
0.4
0.5
0.6
0.7
0.8
Mix 1 Mix 2 Mix 3 Mix 4 Mix 5
Fibr
e ef
ficie
ncy
fact
or,
b.ex
p, [-
]
WST-SWST-L3PBTUTT
b.3D = 0.5
b.2D = 0.64
Fig. 14 – The fibre efficiency factor, b.exp.
0%
5%
10%
15%
20%
25%
30%
35%
40%
Mix 1 Mix 2 Mix 3 Mix 4 Mix 5
CO
V -
for t
he fi
bre
effic
ienc
y fa
ctor
,b.
exp WST-S
WST-L3PBTUTT
Fig. 15 – The coefficient of variance, CoV, for the fibre efficiencyfactor, b.exp.
5.2 Stress-crack opening relationshipsIn order to completely characterise the mechanical
behaviour of fibre-reinforced concrete in tension, it isnecessary to determine the -w relationship. In an inverseanalysis, the output from a test (typically a load–CMODcurve) is used as the input for the analysis, in which it iscompared with a curve from a theoretical model, i.e. from afinite element analysis or an analytical model. The materialparameters are then changed until the result from thetheoretical model represents the best fit to the test result.For the inverse analysis, different strategies have beenproposed; see e.g. Roelfstra and Wittmann [21], Kitsutaka[22], Nanakorn and Horii [23], Østergaard [9], and Que andTin-Loi [24].
The inverse analyses were conducted by using a Matlab program, developed at DTU by Østergaard [9],which is based on the cracked hinge model by Olesen [25]and an automatic optimisation procedure. In the crackedhinge model, it was assumed that the -w relationship couldbe approximated by a bilinear function; see Fig. 16(a).Inverse analyses were also conducted by using the finiteelement package DIANA (version 8.1) – see [26] – using apoly-linear -w relationship; see Fig. 16(b). In the FEanalysis, all elements outside the crack were linear elasticand isotropic, and the crack was modelled with a discretecrack, using so-called non-linear interface elements. Theinterface elements can be considered as non-linear springsdescribing the Mode I fracture properties. In the analyses, the -w relationship was manually changed until theanalysis result fitted the test result.
w1
b2
w1 wc wcw2
a1
a2
1
1
1
ctfw
ctfw
1
b2an
1a2
1
(a) (b)
w
a1
1
Fig. 16 – (a) Bi-linear and (b) poly-linear -w relationship.
Inverse analyses were conducted on the average load-CMOD curves, and the obtained -w relationships arepresented in Figs. 18 to 21, together with the test resultsfrom the uniaxial tension tests. Since the fibre orientationwas not representative in the UTT specimens, these resultsshould be treated with some scepticism. However, the test result can be used to evaluate the tensile strength (referred to as the cracking stress), which can then be compared withthe result from the other test methods. Furthermore, as thenumber of fibres per cm2 for the UTT-specimens from Mix4 approximately corresponds to the theoretical value for Mix 3 this can be used as an indicative comparison for the
-w relationships, and the result for the UTT in Fig. 20 are comparable with the results in Fig. 19.
In Table 2, the cracking stress is presented. Generally,the 3PBT seems to give a slightly higher cracking stress(see Table 2); between 11% and 35% higher compared withthe UTT. For the WST method it varies from 0.9% to 24%higher when compared with the UTT. The variation

Löfgren, I. et al. / Materials and Structures. Submitted for publication: 3/4/2005 7
between the two WST specimen sizes is small, less than10%. For mixes 1 and 2, the agreement between the 3PBTand the WST is quite good (see Fig. 17 & 18). For the othermixes the discrepancy is larger. With the bi-linear -wrelationship it is difficult to match the test results; however,it seems that for larger crack openings the bi- and poly-linear -w relationship gives similar result. Some of thedifferences in the -w relationships are likely related to thevariation in fibre content, i.e. specimens with higher fibrecontent gives higher post-cracking stresses, see Fig. 14 andFigs. 17 to 21. The 3PBT seems to give relatively highpost-cracking stresses, especially considering that the 3PBT-specimens generally have a lower relative number offibres in a cross-section - see Fig. 14. This could be causedby diffused cracking (crack branching and two cracks insome cases) in some of the 3PBT specimens, which is notpossible to capture in the inverse analysis. For the WST-specimens, the guide-notch prevents this type of crackingand the crack is forced to propagate vertically with well-defined boundaries. From the -w relationships, the effectof an increased amount of fibres can be seen; compare Figs.17 and 18 (Mix 1 compared to Mix 2) respectively Figs. 19and 20 (Mix 3 compared to Mix 4). In these figures it canbe seen that the post-cracking stress (the residual stress)increases with increasing fibre content.
Table 2 – Cracking stress (in MPa) determined with thedifferent methods.Test method Mix 1 Mix 2 Mix 3 Mix 4 Mix 5UTT 2.24 1.99 3.25 3.05 2.853PBT 2.95 2.69 3.62 3.74 3.72WST-S 2.73 2.20 3.28 3.68 3.45WST-L 2.64 2.38 3.58 3.57 3.53
0.0
1.0
2.0
3.0
0.0 0.2 0.4 0.6 0.8 1.0
Crack opening, w , [mm]
Stre
ss,
w, [
MPa
]
UTT
3PBT-FEA3PBT-Bi-lin
WST-S-FEAWST-S-Bi-li
WST-L-FEAWST-L-Bi-lin
Fig. 17 – -w relationship for Mix 1.
0.0
1.0
2.0
3.0
0.0 0.2 0.4 0.6 0.8 1.0
Crack opening, w , [mm]
Stre
ss,
w, [
MPa
]
3PBT-FEA
3PBT-Bi-lin
WST-S-FEA
WST-S-Bi-lin
WST-L-FEA
WST-L-Bi-lin
UTT
Fig. 18 – -w relationship for Mix 2.
0.0
1.0
2.0
3.0
4.0
0.0 0.2 0.4 0.6 0.8 1.0
Crack opening, w , [mm]
Stre
ss,
w, [
MPa
]
UTT-3UTT-4
3PBT-FEA
3PBT-Bi-lin
WST-S-FEA
WST-S-Bi-lin
WST-L-FEA
WST-L-Bi-lin
Fig. 19 – -w relationship for Mix 3 (Mix 4 is included forcomparison purpose).
0.0
1.0
2.0
3.0
4.0
0.0 0.2 0.4 0.6 0.8 1.0
Crack opening, w , [mm]
Stre
ss,
w, [
MPa
]
UTT
3PBT-FEA3PBT-Bi-lin
WST-S-FEAWST-S-Bi-lin
WST-L-FEAWST-L-Bi-lin
Fig. 20 – -w relationship for Mix 4.
0.0
1.0
2.0
3.0
4.0
0.0 0.2 0.4 0.6 0.8 1.0
Crack opening, w , [mm]
Stre
ss,
w, [
MPa
]
UTT
3PBT-FEA
3PBT-Bi-lin
WST-S-FEA
WST-S-Bi-lin
WST-L-FEA
WST-L-Bi-lin
Fig. 21 – -w relationship for Mix 5.

Löfgren, I. et al. / Materials and Structures. Submitted for publication: 3/4/20058
5.3 Comparison of dissipated energy By evaluating the specific energy dissipated during
fracture, Gf, at different CMODs the scatter in the testresults can be compared excluding the errors introducedwhen interpreting the test data by means of an inverseanalysis. The work of fracture, WF, can be calculated from the area under the load deflection diagram (or the areaunder the splitting load-CMOD diagram). The specificenergy dissipated, Gf, is the work of fracture divided by theligament area, Alig, which is the projected area on a planeparallel to the ideal crack direction. However, in these teststhe specimens are not completely fractured, i.e. there will always be a compression zone, which theoreticallly shouldbe accounted for when calculating the ligament area - see Fig. 22. On the other hand, as it is difficult to determine theactual length of the fracture zone it has been assumed thatthe whole ligament height could be used. Furthermore, forthe WST, the loss of potential for the vertical load will alsocontribute to the external energy and should be added to theenergy calculated from the splitting force. From the FE-analyses, it has been found that the contribution, to the totalwork of fracture, from the vertical load is about 7% for the small WST-specimen and 5% for the large WST-specimen.It should be pointed out that the evaluated fracture energy isnot suitable as a material parameter for design.Furthermore, it is not possible to directly compare thedissipated energy between the three test methods, as themeasured CMOD corresponds to different crack openings atthe tip of the notch depending on the geometry of thespecimen. On the other hand, the dissipated energy may beused as a qualitative indicator when comparing differentFRC compositions.
Fsp
a
CMOD
a
Max. CMODduring test
2CMOD
h
h
Fig. 22 – Schematic view of stress distribution in a WST-specimen and the development of the fictitious crack, a, with theCMOD (h denotes the total length of the ligament).
For the UTT, the dissipated energy during fracture ispresented in Fig. 23. The effect of the poor fibredistribution can clearly be observed when the dissipatedenergy results for Mix 1 (0.5% fibres) are compared to theresults for Mix 2 (1% fibres); there is approximately afactor two in favour of the mix with the low fibre content.As all the mixes had fewer fibres than expected the values of the dissipated energy are much lower than expected.Barragán [27], who tested both cast and core drilledspecimens, observed a considerable increase in the numberof fibres and the toughness in cores extracted perpendicularto the casting direction. Moreover, cores extractedperpendicular to the casting direction also showed a tougherbehaviour than the reference cylinders.
0
500
1000
1500
2000
2500
0.0 0.5 1.0 1.5 2.0 2
w [mm]
Dis
sipa
ted
ener
gy, G
f,[N
m/m
2 ]
.5
Mix 1
Mix 3
Mix 2
Mix 4
Mix 5
Fig. 23 – Dissipated energy, Gf, versus w for the UTT.
The results from the 3PBTs are presented in Fig. 24. Dueto a malfunctioning transducer, the deflection for specimensof Mix 2 has been calculated on the basis of a relationshipbetween CMOD and deflection according to RILEM TC-162 TDF; see [7]. In Fig. 24, it can be seen that the energydissipated during fracture increases with improved matrixquality and increased fibre volume; the length of the fibres does not seem to have any influence.
0
1000
2000
3000
4000
0.0 1.0 2.0 3.0 4.0 5.0
CMOD [mm]
Dis
sipa
ted
ener
gy,G
f,[N
m/m
2 ]
Mix 1
Mix 3
Mix 2
Mix 5Mix 4
Fig. 24 – Dissipated energy, Gf, versus CMOD for the 3PBT.
The corresponding results from the wedge splitting tests are presented in Figs. 25 and 26; it can be seen that the results from the WSTs show the same tendency as for the3PBTs. Moreover, there is no great difference between the two specimen sizes; it is only for mixes 4 and 5 that thesmall specimens show a different result compared to thelarge ones. However, this is probably related to a highnumber of fibres in the small specimens for Mix 4 (about1.5 times the theoretical, see Fig. 15).
0
500
1000
1500
2000
2500
3000
0.0 1.0 2.0 3.0 4.0 5.0
CMOD [mm]
Dis
sipa
ted
ener
gy,G
f,[N
m/m
2 ]
Mix 1
Mix 2
Mix 3
Mix 5
Mix 4
Fig. 25 – Dissipated energy, Gf, versus CMOD for the small WST-specimens.

Löfgren, I. et al. / Materials and Structures. Submitted for publication: 3/4/2005 9
0
500
1000
1500
2000
2500
3000
0.0 1.0 2.0 3.0 4.0 5
CMOD [mm]
Dis
sipa
ted
ener
gy,G
f, [N
m/m
2 ]
Mix 1
Mix 3
Mix 2
Mix 5
Mix 4
.0
Fig. 26 – Dissipated energy, Gf, versus CMOD for the large WST-specimens.
Fig. 27 shows the coefficient of variance (CoV) for theUTT, which varies between 10% and 40%. In Fig. 28, thecoefficient of variance (CoV) for the 3PBT can be seen. Forthe 3PBT, the CoV varies between 2% and 35%, having thelowest value for Mix 5 with the short fibre. Figures 29 and 30 show the CoV for the WST. For the small WST-specimens, the CoV varies between 10% and 20%. For the large WST-specimens, the CoV varies between 12% and21%.
0%
10%
20%
30%
40%
0.0 0.5 1.0 1.5 2.0 2.5
w [mm]
CO
V fo
r Gf
[%]
Mix 2
Mix 5
Mix 1Mix 4
Mix 3
Fig. 27 – CoV for Gf at different w, for the UTT.
0%
10%
20%
30%
40%
0.0 1.0 2.0 3.0 4.0 5.0
CMOD [mm]
CO
V fo
rGf
[%]
Mix 1
Mix 3
Mix 5
Mix 4
Mix 2
Fig. 28 – CoV for Gf at different CMODs, for the 3PBT.
0%
10%
20%
30%
40%
0.0 1.0 2.0 3.0 4.0 5.0
CMOD [mm]
CO
V fo
r Gf
[%]
Mix 3
Mix 4
Mix 1
Mix 5Mix 2
Fig. 29 – CoV for Gf at different CMODs for the small WST-specimens.
0%
10%
20%
30%
40%
0.0 1.0 2.0 3.0 4.0 5.0
CMOD [mm]
CO
V fo
r Gf
[%]
Mix 2
Mix 3 Mix 1
Mix 5
Mix 4
Fig. 30 – CoV for Gf at different CMODs for the large WST-specimens.
5.4 Influence of WST-specimen sizeFrom the experimental results and the specimen sizes
used in this study, there is no apparent difference, neither inthe relative number of fibres crossing the fracture plane, norin the fracture properties (see Fig. 14 and Figs. 17 to 21).There is a slight increase of the number of fibres in thelarge WST-specimens compared to the smaller specimens(on average a 6% increase). However, as the scatter is quite large there is no significant difference. Moreover, neither ofthe inverse analyses show any significant difference, the slightly lower post-cracking stresses for the small WST-specimens can probably be explained by a slightly largernumber of fibres for the large WST-specimen.
5.5 Influence of a guide-notch for the WST-specimens
The guide-notch successfully prevents any diffusedcracking in the specimen, which corresponds well to theassumption of a discrete crack in the FE-analyses. But theguide-notch seems to slightly increase the energy dissipatedduring fracture, as can be seen in Fig. 31, the increase isbetween 5% and 15%. This could be caused by an increasednumber of fibres across the fracture plane and by the factthat the guide-notch forces the crack to propagate in a waythat does not lead to the least energy consumption.However, as only one test series was investigated, and thescatter is quite large (see Fig. 32), it is not possible to makeany definitive conclusions regarding the effect of the guide-notch.

Löfgren, I. et al. / Materials and Structures. Submitted for publication: 3/4/200510
0
500
1000
1500
2000
2500
3000
3500
0.0 1.0 2.0 3.0 4.0 5.0
CMOD [mm]
Dis
sipa
ted
ener
gy,G
f,[N
m/m
2 ]
1.00
1.05
1.10
1.15
1.20
1.25
Gf.1
50 /
Gf.1
00 [-
]
150-S
100-S150-L
100-L
WST 150-L / WST 100-L
WST 150-S / WST 100-S
Fig. 31 – On the first y-axis, dissipated energy, Gf, versus CMODfor small and large WST-specimens, with (150-S respectively150-L) and without (100-S respectively 100-L) guide-notches. Onthe second y-axis, dissipated energy, Gf, for specimens with theguide-notch relative to specimens without guide-notch.
0%
5%
10%
15%
20%
0.0 1.0 2.0 3.0 4.0 5.0
CMOD [mm]
CO
V fo
r Gf
[%]
150-S
100-S
150-L
100-L
Fig. 32 – CoV for Gf at different CMODs for small and largeWST-specimens, (150-S respectively 150-L) and without (100-Srespectively 100-L) guide-notches.
6 Conclusions and recommendations
The results from this study suggest that the wedgesplitting test method could very well be used as a fracture test for steel fibre-reinforced concrete. The scatter is, on the whole, smaller for the WST than for the 3PBT (see Figs. 28to 30). For the two WST-specimen sizes, there is noapparent difference neither in the number of fibres crossingthe fracture plane nor in the fracture properties (see Fig. 14and Figs. 17 to 21). The major contributing factor to thescatter in the test results is believed to be related to thevariation in the number of fibres across the fracture plane;the coefficient of variance is up to 30%, see Fig. 15. Fromthis study, it is clear that the UTT is sensitive to the castingand compaction procedures as the UTT-specimens had onlyabout half of the expected number of fibres in the fracturesurface. Both the 3PBT and the WST-method had slightlymore fibres than the theoretical value for a random 3D orientation; on average 19% more fibres for the 3PBT, 24%for the small WST-specimens, and 30% for the large WST-specimens. Regarding the scatter in the test results (thefracture energy), similar values have been reported byothers, e.g.: Kooiman [28], CoV from 10% to 30% for3PBT; Lee and Barr [29], CoV in the order of 20% for3PBT; and Barragán et al. [30], CoV 20 to 30% for uni-axial tension tests.
With inverse analysis it was possible to determine a bi-linear -w relationships for the different FRC mixes. Abetter agreement was achieved by using a poly-linearfunction representing the -w relationship. It was notpossible to compare the -w relationships from the inverseanalysis with the results from the UTT because of a poor fibre distribution in the UTT-specimens. The inverseanalyses indicate no systematic differences in the determined parameters between two WST-specimens (see Figs. 17 to 21). Even though the 3PBT-specimens generallyhave a lower relative number of fibres both the crackingstress and the post-cracking stress seems to be slightlyhigher than compared with the WST-specimens. For the 3PBT, the relatively shallow notch depth causes diffusecracking (multiple cracks) for some of the beams in the test series with a fibre volume of 1%, see Fig 33. For the WST-method, the deep notch and the use of a guide-notchsuccessfully prevent any diffused cracking and seem to provide a good solution for mixes with high fibre volumes(1% in this study), but might not be necessary for mixeswith lower fibre volumes. However, the guide-notch seemsto lead to a slightly increase in the energy dissipated during fracture. Then again, as only one test series (six large and six small, specimens) was investigated, and the scatter ofthe test results is quite large, it is not possible to draw morerigorous conclusions. But it is thought that the benefitsoutweigh the small effect on the energy dissipated duringfracture.
Fig. 33 – Picture showing diffused cracking in a beam specimenfrom Mix 5 (Vf = 1%).
In conclusion, the benefits of the WST-method are that it does not require any sophisticated testing equipment and standard cube specimens can be used (albeit with a smallmodification for the groove). Moreover, since the specimenis smaller, less concrete is needed to perform a test; four150 mm cube specimens equals one beam specimen. Adrawback of the WST-method is that friction between thewedge and the roller bearings have a small influence on thesplitting load. Furthermore, quantitative evaluation of thetest result is more complicated than for the UTT, which can be interpreted directly. However, the test result can bequalitatively interpreted as the energy dissipated duringfracture and, furthermore, with inverse analysis it ispossible to determine a -w relationship. The advantage ofdetermining the -w relationship is that this can be viewedas an intrinsic material property and thus it is independent

Löfgren, I. et al. / Materials and Structures. Submitted for publication: 3/4/2005 11
of the specimen size; i.e. no size factor is needed as in the - -design method proposed by RILEM TC TDF-162 [31].
Regarding the size of the specimen, it is recommended that for fibres with a length less than 60 mm a 200 mm specimen should be used while a 150 mm specimen could be used for fibres shorter than 40 mm.
7 REFERENCES
[1] Hillerborg, A., Modeer, M., and Petersson, P.E. ‘Analysis of Crack Formation and Crack Growth in Concrete by Means of Fracture Mechanics and Finite Elements’. Cem. & Concrete Res. 6, 1976, 773-782.
[2] Hillerborg, A. ‘Analysis of Fracture by Means of the Fictitious Crack Model, Particularly for Fibre Reinforced Concrete’. The Int. J. Cem. Comp. 1980. 2. 177-184.
[3] RILEM TC TDF-162 ‘Design of steel fibre reinforced concrete using the –w method – principles and applications’ Materials and Structures, 35 June 2002, pp. 262-278.
[4] Stang, H. ‘Evaluation of properties of cementitious fiber composite materials’, in High Performance Fibre Reinforced Cement Composites, Vol. 1. (eds) H.W. Reinhardt and A.E. Naaman. E & FN Spon, London, 1992, pp. 388–406.
[5] Cornelissen, H.A.W., Hordijk, D.A., and Reinhardt, H.W. ‘Experimental determination of crack softening characteristics of normal and lightweight concrete’. Heron 31, 2 (1986).
[6] RILEM TC TDF-162 ‘Test and design methods for steel fibre reinforced concrete. Recommendations for uni-axial tension test’ Materials and Structures, 34 Jan-Feb 2001, pp. 3-6.
[7] RILEM TC TDF-162 ‘Test and design methods for steel fibre reinforced concrete. Bending test – Final Recommendation’ Materials and Structures, 35, Nov 2002, pp. 579-582.
[8] RILEM TC-50 FMC, ‘Determination of the fracture energy of mortar and concrete by means of three-point bend tests on notched beams’, Materials and Structures, 18(106), 1985, pp. 285.
[9] Østergaard, L. ‘Early-Age Fracture Mechanics and Cracking of Concrete – Experiments and Modelling’. Ph.D. Thesis, Department of Civil Engineering, Technical University of Denmark. 2003.
[10] Linsbauer, H.N. and Tschegg, E.K. ‘Fracture energy determination of concrete with cube shaped specimens’, Zement und Beton, 31(1986), pp 38-40.
[11] Brühwiler, E. and Wittmann, F.H. ‘The wedge splitting test, a new method of performing stable fracture mechanics test’ Eng. Fracture Mech. 35(1/2/3) 1990, 117-125.
[12] Trunk, B., Schober, G., and Wittmann, F.H. ‘Fracture mechanics parameters of autoclaved aerated concrete’, Cem. and Concrete Research, 29(1999), pp. 855-859.
[13] Kim J.-K. and Kim Y.-Y. ‘Fatigue crack growth of high-strength concrete in wedge-splitting test’. Cem. and Concrete Research, 29(1999), pp. 705–712.
[14] Elser M., Tschegg E.K., Finger N., and Stanzl-Tschegg S.E. ‘Fracture Behaviour of Polypropylene-Fibre reinforced Concrete: an experimental investigation’, Comp. Science and Technology, 56(1996), pp. 933-945.
[15] Meda A., Plizzari G.A., and Slowik V. ‘Fracture of fiber reinforced concrete slabs on grade’. In Fracture Mechanics of Concrete Structures, ed. De Borst et al, 2001, pp. 1013-102.
[16] Nemegeer D., Vanbrabant J. and Stang H. ‘Brite Euram Program on Steel Fibre Concret Subtask: Durability: Corrosion Resistance of Cracked Fibre Reinforced Concrete’. In Test and Design Methods for Steel Fibre Reinforced Concrete – Background and Experiences - Proceedings of the RILEM TC 162-TDF Workshop, Ed Schnütgen and Vandevalle, 2003, pp. 47-66.
[17] Löfgren I. ‘The wedge splitting test – a test method for assessment of fracture parameters of FRC?’. In Fracture Mechanics of Concrete Structures, Li Et al (eds), 2004.
[18] Leite J.P. de B., Slowik V. and Mihashi H. ‘Mesolevel models for simulation of fracture behaviour of fibre reinforced concrete’. In Fibre-Reinforced Concrete, Proceedings of the Sixth International RILEM Symposium, ed. di Prisco et al. 2004. pp. 799-808.
[19] Krenchel, H. ‘Fibre Spacing and Specific Fibre Surface, Fibre Reinforced Cement and Concrete’. Edited by Neville, The Construction Press, UK, pp. 69-79, 1975.
[20] Dupont D. ‘Modelling and experimental validation of the constitutive law ( - ) and cracking behaviour of fibre reinforced concrete’. Ph.D. Thesis, Katholieke Universiteit Leuven, 2003.
[21] Roelfstra P.E. and Wittmann F.H. ‘Numerical method to link strain softening with failure of concrete’. In Fracture Toughness and Fracture Energy of Concrete, pp. 163-175. Elsevier, 1986.
[22] Kitsutaka Y. ‘Fracture parameters by polylinear tension-softening analysis’. J. of Eng. Mechanics, 123(5) 1997, pp. 444-450.
[23] Nanakorn P. and Horii H. ‘Back analysis of tension-softening relationship of concrete’. J. Materials, Conc. Struct., Pavements, 32(544) 1996, pp. 265-275.
[24] Que, N.S. and Tin-Loi, F. ‘Numerical evaluation of cohesive fracture parameters from a wedge splitting test’. Engineering Fracture Mechanics, 69 (2002), pp. 1269-1286.
[25] Olesen, J.F. ‘Fictitious crack propagation in fibre-reinforced concrete beams’. Journal of Eng. Mech. 127(3) 2001. pp. 272-280.
[26] TNO Building and Construction Research ‘DIANA Finite Element Analysis User's Manual release 8.1’ Edited by: Frits C. de Witte and Gerd-Jan Schreppers. Delft, The Netherlands, 2002.
[27] Barragán, B.E. ‘Failure and toughness of steel fiber reinforced concrete under tension and shear’, Ph.D. Thesis, Universitat Politécnica de Catalunya, Barcelona, Spain, 2002.
[28] Kooiman, A.G. ‘Modelling Steel Fibre Reinforced Concrete for Structural Design’. Ph.D. Thesis, TU Delft 2000.
[29] Lee, M.K., and Barr, B.I.G. ‘Strength and fracture properties of industrially prepared steel fibre reinforced concrete’. Cem. & Concrete Composites, 25(2003). pp. 321–332.
[30] Barragán, B.E., Gettu R., Miguel A. Martín, M.A, and Zerbino, R. ‘Uniaxial tension test for steel fibre reinforced concrete - a parametric study’. Cem. & Concrete Composites25 (2003) pp. 767–777.
[31] RILEM TC TDF-162 ‘ – Design Method’ Materials and Structures, 33 March 2000, pp. 75-81.


PAPER IV
The WST-method for fracture testing of fibre-reinforced concreteLöfgren, I., Olesen, J.F., and Flansbjer, M.
Paper accepted for publication in Nordic Concrete Research, 2/2005, 19 p.

The WST-method for fracture testing of fibre-reinforced concrete
Ingemar LöfgrenDepartment of Civil and Environmental Engineering Chalmers University of Technology SE-412 96 Göteborg, Sweden E-mail: [email protected].
John Forbes Olesen Department of Civil Engineering Technical University of DenmarkDK-2800 Lyngby, DenmarkE-mail: [email protected]
Mathias Flansbjer SP – Swedish National Testing and Research Institute SE-501 15 Borås, Sweden E-mail:[email protected]
ABSTRACT
To evaluate the reproducibility of the wedge-splitting test method(WST-method) and to provide guidelines, a round robin study was conducted – financed by NORDTEST – in which three labs participated; see Löfgren et al. [1]. The test results from each lab were analysed and a study of the variation was performed. From the study of the intra-lab variations, it is evident that the variations of the steel fibre-reinforced concrete properties are significant. The investigation of the inter-lab variation, based on an analysis of variance (ANOVA), indicated no inter-lab variation. Furthermore, the tensile fracture properties were interpreted from the test results as a bi-linear stress-crack opening relationship using inverse analysis.
Key words: Fibre-reinforced concrete, fracture testing, wedge-splitting test method, round-robin study.
1. INTRODUCTION
Industrialisation of the building industry is presently a very important topic, and use of fibre reinforcement as replacement for ordinary reinforcement of concrete could play an importantrole in this development. In some types of structures like slabs on grade, foundations and walls, fibres are likely to replace the ordinary reinforcement completely, while in other structures such as beams and slabs, fibres can be used in combination with pre-stressed or ordinary
Accepted for publication in Nordic Concrete Research, 2/2005 1

reinforcement. In both cases the potential benefits are due to economical factors, but also the rationalisation and improvement of the working environment at the construction sites. However, for this to be realised simple test methods have to be available to the concrete industry. This is imperative for fibre reinforced concrete, where the industry lacks such a method for their daily production quality control, and it would allow concrete producers to verify and further develop their products. Further, it would provide the structural engineers with pertinent material data allowing design of structures that are safe and cost-effective. Moreover, as the design tools of the structural engineers are becoming more advanced and the design requirements morecomplex, fracture mechanical properties are required for structural analysis. This endorses the view that there is a need for a simple and robust test method for determining the fracture properties of fibre-reinforced cementitious composites, which can be used by small and mediumsize companies in their daily production without having to invest in expensive testing equipment.
During the past four decades, different methods have been proposed and used to characterize the tensile behaviour of fibre-reinforced concrete (FRC), for example: by measuring the flexural strength, as in the early work of Romualdi and Mandel [2]; by determining the behaviour in terms of dimensionless toughness indices (as prescribed in ACI 544 [3] and ASTM C 1018 [4]); by determining the flexural toughness using the round panel test (see ASTM C 1550-2 [5]); or by determine residual flexural strengths at prescribed deflections, see Gopalaratnam & Gettu [6], Barr et al. [7], and RILEM TC 162-TDF [8]. The most recent recommendations on test methods for steel-fibre reinforced concrete (SFRC) are those by RILEM technical committeeTC 162-TDF, “Test and design methods for steel fibre reinforced concrete”, see RILEM-Committee-TDF-162 [8] and [9]. The proposed test methods are a uniaxial tension test (UTT) and a three-point bending test (3PBT) on a notched beam. The three-point bending test on notched beams is probably the most widespread method for determining the fracture properties; see RILEM TC-50 FMC [10] for conventional concrete and RILEM TC 162-TDF [8] for steel fibre-reinforced concrete. The UTT requires sophisticated testing equipment, is quite time-consuming, and it has been shown that the test results may be affected by machine specimeninteraction; see e.g. Østergaard [11]. Drawbacks to the 3PBT are that the specimen is quite large and heavy; furthermore, the method is not suited for evaluation of material properties in existing structures. The wedge splitting test (WST) method, originally proposed by Linsbauer and Tschegg [12] and later developed by Brühwiler and Wittmann [13], is an interesting test methodsince it does not require sophisticated test equipment; the test is stable and mechanical testing machines with a constant actuator displacement rate can be used. Furthermore, a standard cube specimen is used, but the test can also be performed on core-drilled samples. Researchers have used the WST-method extensively, and recently there has been an increased interest in the method. The method has proven itself to be successful for the determination of fracture properties of ordinary concrete, at early age and later, see Østergaard [11] and Hansen et al. [14], and for autoclaved aerated concrete, see Trunk et al. [15]. In addition, the method has been used for the study of fatigue crack growth in high-strength concrete, see Kim and Kim [16], and fracture behaviour of polypropylene fibre-reinforced concrete, see Elser et al. [17]. For steel fibre-reinforced concrete a small number of references can be found; Meda et al. [18] used the WST-method (with three specimen sizes) to determine a bi-linear stress crack opening relationship through inverse analysis. Nemegeer et al. [19] used the WST-method to investigate the corrosion resistance of cracked fibre-reinforced concrete. However, in an experimental study conducted by Löfgren [20] it was demonstrated that horizontal cracks might develop and thus jeopardise the test; this was also shown by Leite et al. [21]. However, to the authors’ knowledge
Accepted for publication in Nordic Concrete Research, 2/20052

no proper recommendations exist for the testing of steel fibre-reinforced concrete using the WST-method (specimen size, interpretation, etc).
The objectives of the project were to carry out a round robin test program (see Löfgren et al. [1]), with three participating labs, in order to verify the reliability of measurements and to provide guidelines for using the wedge splitting test method. The laboratories participating in this project were:
DTU –Technical University of Denmark, Department of Civil Engineering; CTH – Chalmers University of Technology, Department of Structural Engineering and Mechanics; and SP – Swedish National Testing and Research Institute.
2. INTRODUCTION TO THE WEDGE-SPLITTING TEST METHOD
In Figure 1 the specimen geometry and loading procedure are clarified. The specimen is equipped with a groove (to be able to apply the splitting load) and a starter notch (to ensure the crack propagation). Two steel platens with roller bearings are placed partly on top of the specimen partly into the groove, and through a wedging device the splitting force, Fsp, is applied. During a test, the load in the vertical direction, Fv, and the crack mouth opening displacement (CMOD) is monitored.
The applied horizontal splitting force, Fsp, is related to the vertical compressive load, Fv,through (eq. 1), see RILEM Report 5 [22]:
cot1tan1
tan2v
spF
F (1)
were is the wedge angle (here = 15 degrees), and is the coefficient of friction for the roller bearing. The coefficient of friction normally varies between 0.1% and 0.5%. If the friction is neglected in (eq. 1) the splitting force, Fsp, is about 1.866 × Fv, and the error introduced by this is about 0.4% to 1.9%, see RILEM Report 5 [22].
load cell
steel loadingdevice withroller bearings wedging
device
linear support
Clipgauge
cubespecimen
actuator
starter notch(cut-in)
groove (cast)
Accepted for publication in Nordic Concrete Research, 2/2005 3

Figure 1. Schematic view of the equipment and test setup.
In the WST no measurements are made of the real crack opening – this is often due to measurement technique or due to specific test circumstances. As can be seen in Figure 2, while the CMOD is measured at some distance from the tip of the notch the crack tip opening displacement (CTOD) is the crack opening at the tip of the notch. The CTOD, however, represents a ‘true’ crack opening and, thus, is an important parameter when evaluating the fracture properties. Relationships between the CMOD and the CTOD have been evaluated with the aid of FE-analyses of test results on five different mixes.
Fsp
Position ofCMOD gauge
CTODFsp
a
h*
xh*
(a) (b) (c)
ftR
Fc
FtRFv/2d y
dx +CMOD
Fv/2
Figure 2. (a) Schematic view of a cracked specimen and the definition of CMOD and CTOD. (b) The stress distribution in a cracked WST-specimen (h* denotes the total length of the ligament and a the length of the fictitious crack). (c) Simplified stress distribution based on the assumption of a constant residual tensile stress ftR. x denotes the height of the compressive zone, dx the distance (for the undeformed specimen) between the loading points, and dy the distance from the bottom of the specimen to the point where the splitting load is applied (for the undeformed specimen).
For the 150 150 mm2 WST-specimens (see section 3.2), the following expression (based on five mixes with the fibre content varying between 0.5% and 1.0 %) has been evaluated for the relationship between the CMOD and the CTOD (eq. 2):
0084.0551.0 CMODCTOD [mm] (2)
For the 200 200 mm2 WST-specimens, the following expressions have been evaluated for the relationship between the CMOD and the CTOD (eq. 3):
0110.0533.0 CMODCTOD [mm] (3)
As the main benefit from fibre reinforcement is the ability to transfer stress across a crack it is important to characterise the stress-crack opening relationship. Inverse analysis has proven to be successful for determining the non-linear fracture mechanics parameters from the experimentalresult. Inverse analysis – also refereed to as parameter or function estimation – is achieved by minimizing the differences between calculated displacements and target displacements obtained
Accepted for publication in Nordic Concrete Research, 2/20054
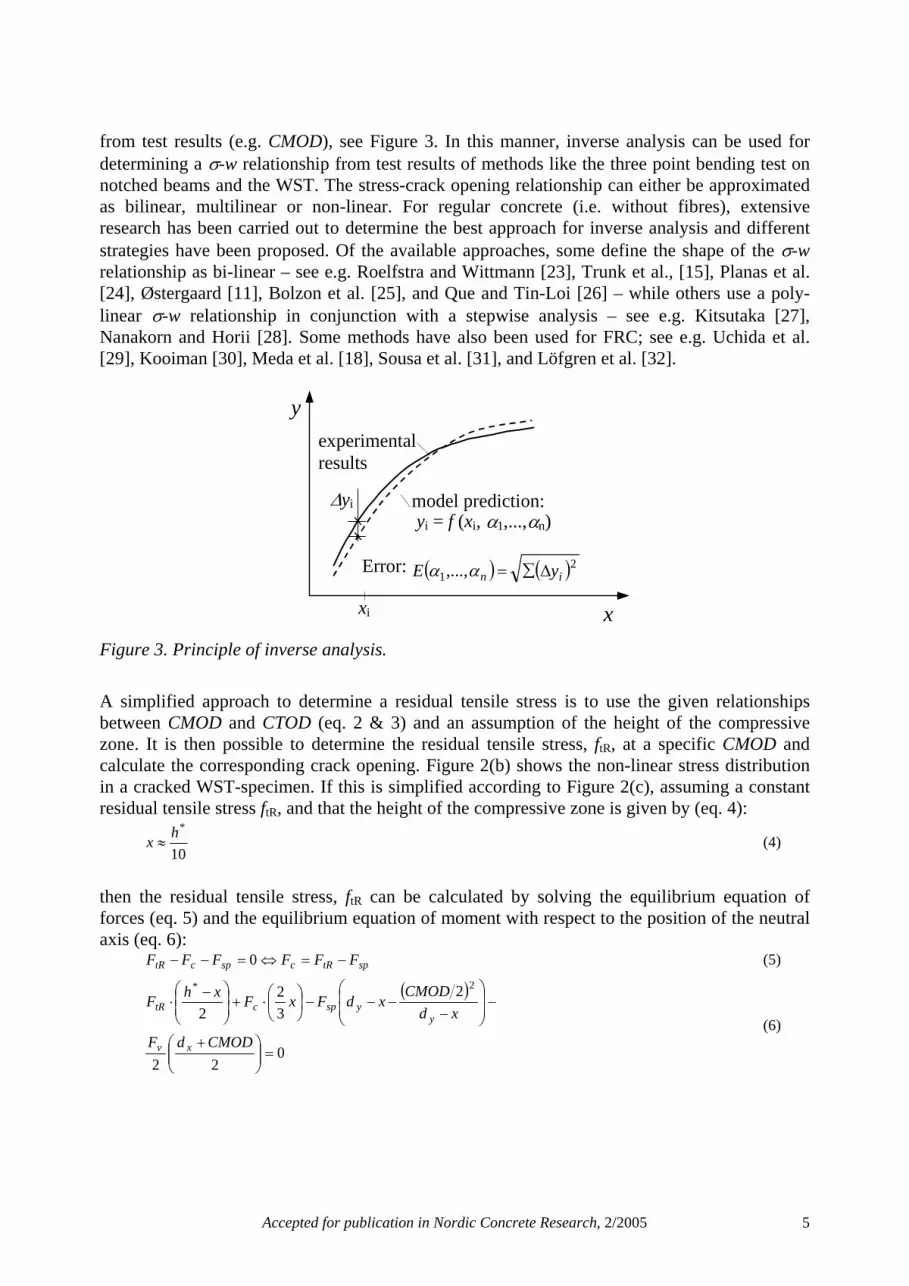
from test results (e.g. CMOD), see Figure 3. In this manner, inverse analysis can be used for determining a -w relationship from test results of methods like the three point bending test on notched beams and the WST. The stress-crack opening relationship can either be approximatedas bilinear, multilinear or non-linear. For regular concrete (i.e. without fibres), extensive research has been carried out to determine the best approach for inverse analysis and different strategies have been proposed. Of the available approaches, some define the shape of the -wrelationship as bi-linear – see e.g. Roelfstra and Wittmann [23], Trunk et al., [15], Planas et al. [24], Østergaard [11], Bolzon et al. [25], and Que and Tin-Loi [26] – while others use a poly-linear -w relationship in conjunction with a stepwise analysis – see e.g. Kitsutaka [27], Nanakorn and Horii [28]. Some methods have also been used for FRC; see e.g. Uchida et al. [29], Kooiman [30], Meda et al. [18], Sousa et al. [31], and Löfgren et al. [32].
experimentalresults
model prediction: yi = f (xi, 1,..., n)
y
x
yi
Error:
xi
21,..., in yE
Figure 3. Principle of inverse analysis.
A simplified approach to determine a residual tensile stress is to use the given relationships between CMOD and CTOD (eq. 2 & 3) and an assumption of the height of the compressivezone. It is then possible to determine the residual tensile stress, ftR, at a specific CMOD and calculate the corresponding crack opening. Figure 2(b) shows the non-linear stress distribution in a cracked WST-specimen. If this is simplified according to Figure 2(c), assuming a constant residual tensile stress ftR, and that the height of the compressive zone is given by (eq. 4):
10
*hx (4)
then the residual tensile stress, ftR can be calculated by solving the equilibrium equation offorces (eq. 5) and the equilibrium equation of moment with respect to the position of the neutral axis (eq. 6):
sptRcspctR FFFFFF 0 (5)
022
232
2
2*
CMODdF
xdCMOD
xdFxFxh
F
xv
yyspctR
(6)
Accepted for publication in Nordic Concrete Research, 2/2005 5
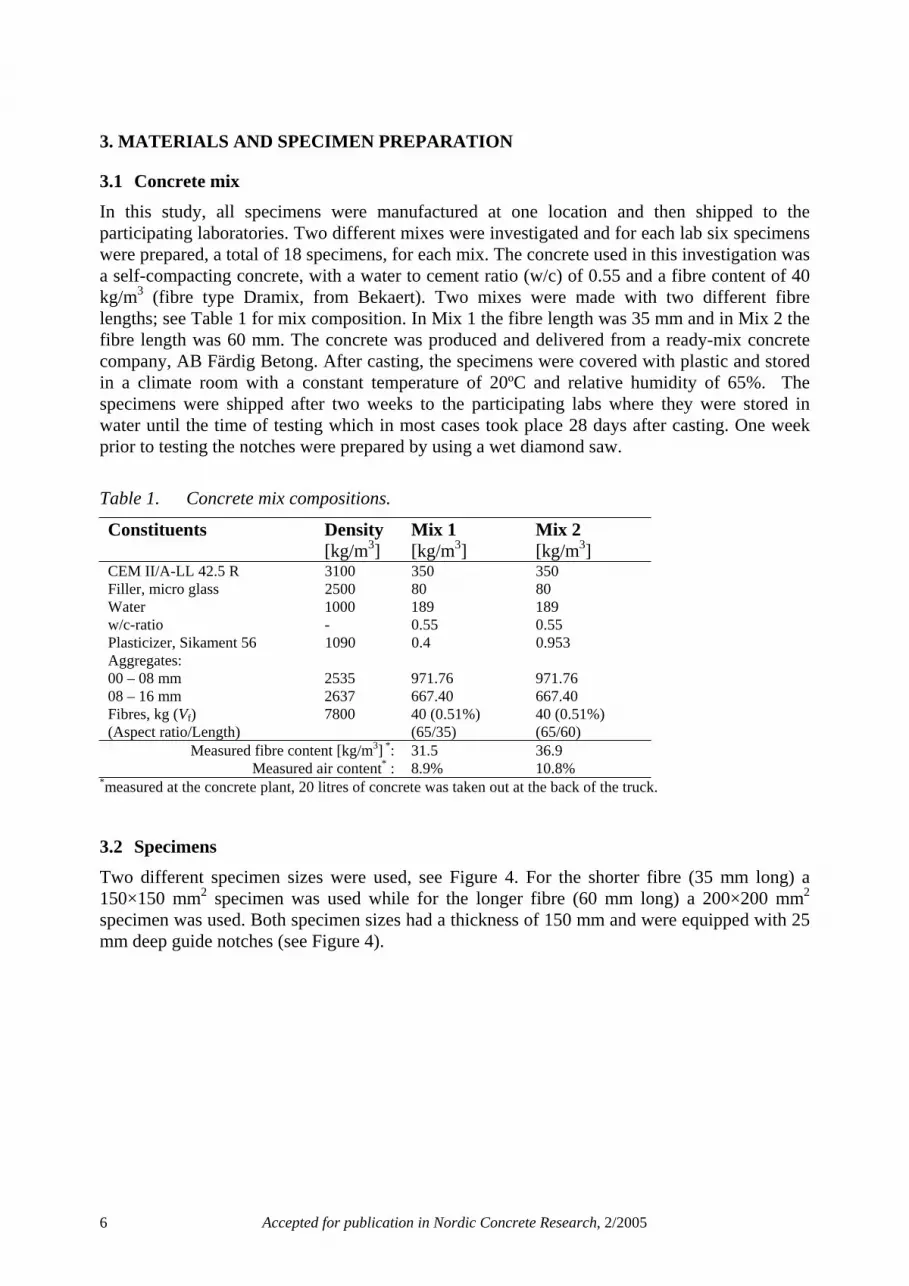
3. MATERIALS AND SPECIMEN PREPARATION
3.1 Concrete mix In this study, all specimens were manufactured at one location and then shipped to the participating laboratories. Two different mixes were investigated and for each lab six specimenswere prepared, a total of 18 specimens, for each mix. The concrete used in this investigation was a self-compacting concrete, with a water to cement ratio (w/c) of 0.55 and a fibre content of 40 kg/m3 (fibre type Dramix, from Bekaert). Two mixes were made with two different fibre lengths; see Table 1 for mix composition. In Mix 1 the fibre length was 35 mm and in Mix 2 the fibre length was 60 mm. The concrete was produced and delivered from a ready-mix concrete company, AB Färdig Betong. After casting, the specimens were covered with plastic and stored in a climate room with a constant temperature of 20ºC and relative humidity of 65%. The specimens were shipped after two weeks to the participating labs where they were stored in water until the time of testing which in most cases took place 28 days after casting. One week prior to testing the notches were prepared by using a wet diamond saw.
Table 1. Concrete mix compositions.
Constituents Density[kg/m3]
Mix 1 [kg/m3]
Mix 2 [kg/m3]
CEM II/A-LL 42.5 R 3100 350 350Filler, micro glass 2500 80 80Water 1000 189 189w/c-ratio - 0.55 0.55Plasticizer, Sikament 56 1090 0.4 0.953Aggregates:00 – 08 mm 2535 971.76 971.7608 – 16 mm 2637 667.40 667.40Fibres, kg (Vf)(Aspect ratio/Length)
7800 40 (0.51%)(65/35)
40 (0.51%) (65/60)
Measured fibre content [kg/m3] *: 31.5 36.9Measured air content* : 8.9% 10.8%
*measured at the concrete plant, 20 litres of concrete was taken out at the back of the truck.
3.2 SpecimensTwo different specimen sizes were used, see Figure 4. For the shorter fibre (35 mm long) a 150×150 mm2 specimen was used while for the longer fibre (60 mm long) a 200×200 mm2
specimen was used. Both specimen sizes had a thickness of 150 mm and were equipped with 25 mm deep guide notches (see Figure 4).
Accepted for publication in Nordic Concrete Research, 2/20056

(a) (b)
Figure 4. Specimen geometries: (a) 150×150 mm2 specimens used for concrete Mix 1 (35 mm long fibres); and (b) 200×200 mm2 specimens used for concrete Mix 2 (60 mm long fibres).
4. TESTS PERFORMED AT THE LABORATORIES
The testing system consists of: frame, actuator, load cell, clip gauge (or other measuringdevice), controller and data acquisition equipment as a minimum (see Figure 5). It is preferable to have a closed-loop controlled testing machine, however, this is not required. The load shall be measured with an accuracy of 1% of the maximum load value in the test. The accuracy of the displacement-measuring device, measuring the CMOD, shall be better than 0.01 mm. The specimens may be removed from the water 60 minutes prior to starting the test. The specimen is then placed in the testing machine and should be pre-loaded to a level of 50 to 100 N. Thereafter the test can begin and the testing machine should be operated so that, in the beginning of the test, the measured CMOD increases at a constant rate of 25 to 50 m/min for CMOD ranging from 0 to 0.2 mm. For CMOD values between 0.2 and 2 mm a constant rate of 0.25 mm/minshould be applied. When the CMOD is larger than 2 mm, the rate of loading may be increased to 0.5 mm/min. The changes in the loading rate should be made progressively in such a way that it influences the test result minimally – i.e. the changes should not be too abrupt as this may result in a sudden increase in the load. The load-CMOD diagram shall be determined by continuously measuring and logging corresponding values of the vertical load, Fv, and the CMOD. During the first two minutes, data shall be logged with a frequency not less than 5 Hz; thereafter, until the end of the test, the frequency shall not be less than 1 Hz.
Accepted for publication in Nordic Concrete Research, 2/2005 7

(a) (b)
Figure 5. (a) Experimental setup used at SP (an Instron 8501 universal testing machine). (b)Experimental setup used at CTH (a deformation controlled testing machine - screw driven).
5. COMPARISON OF TEST RESULTS
5.1 Splitting load-CMOD curves The test results from each lab have been analysed and average splitting load-CMOD curves have been constructed. Furthermore, an average splitting load-CMOD curve based on the total test population (i.e. the individual test results from all labs) have also been calculated. The average curves for the 150×150 mm2 specimens can be seen in Figure 6(a) while the average curves for the 200×200 mm2 specimens can be seen in Figure 6(b). For the 150×150 mm2
specimens, there are only minor differences between the curves. For the 200×200 mm2
specimens, the differences seem to be larger, and mainly different levels of the post-peak load are observed.
Accepted for publication in Nordic Concrete Research, 2/20058

0
500
1 000
1 500
2 000
2 500
3 000
0.0 0.5 1.0 1.5 2.0 2.5 3.0 3.5 4.0
CMOD [mm]
Spitt
ing
load
,Fsp
, [N
]
SP-Av (150)
DTU-Av (150)
Average (150)CTH-Av (150)
0500
1 0001 5002 0002 5003 0003 5004 000
0.0 0.5 1.0 1.5 2.0 2.5 3.0 3.5 4.0
CMOD [mm]
Spitt
ing
load
,Fsp
, [N
] SP-Av (200)DTU-Av (200)
Average (200)CTH-Av (200)
(a) (b)
Figure 6. Splitting load versus CMOD: (a) for the 150×150 mm2 specimens (Mix 1, 40 kg of 35 mm long fibres) - comparison of average values from each lab and total average; and (b) for the 200×200 mm2 specimens (Mix 2, 40 kg of 60 mm long fibres) - comparison of average values from each lab and total average.
By evaluating the specific energy dissipated during fracture, Gf.CMOD, at different CMODs the scatter in the test results can be compared excluding the errors introduced when interpreting the test data by means of an inverse analysis. The work of fracture, Wf, can be calculated from the area under the splitting load-CMOD diagram. The specific energy dissipated, GF, is the work of fracture, WF, divided by the ligament area, Alig, which is the projected area on a plane parallel to the ideal crack direction. However, in these tests the specimens are not completely fractured, i.e. there will always be a compression zone, which theoretically should be accounted for when calculating the ligament area. On the other hand, as it is difficult to determine the actual length of the fracture zone it has been assumed that the whole ligament height could be used. It should be pointed out that the evaluated fracture energy is not suitable as a material parameter for design. Furthermore, it is not possible to directly compare the dissipated energy between the two specimen sizes as the measured CMOD corresponds to different crack openings at the tip of the notch depending on the geometry of the specimen. On the other hand, the dissipated energy maybe used as a qualitative indicator when comparing different FRC compositions.
Figure 7(a) shows the average dissipated energy for the 150×150 mm2 specimens while Figure 7(b) shows the same for the 200×200 mm2 specimens. Similar to the splitting load, the results for the 150×150 mm2 specimens show good agreement while for the 200×200 mm2 specimensthe results from CTH appear to give lower values.
Accepted for publication in Nordic Concrete Research, 2/2005 9

0
200
400
600
800
1 000
0.0 1.0 2.0 3.0 4.0
CMOD [mm]
Diss
ipat
ed e
nerg
y,G
f,
[Nm
/m2 ] SP-Av (150)
DTU-Av (150)
Average(150)
CTH-Av (150)
0
250
500
750
1 000
1 250
1 500
0.0 1.0 2.0 3.0 4.0
CMOD [mm]
Diss
ipat
ed e
nerg
y,G
f,
[Nm
/m2 ]
SP-Av (200)DTU-Av (200)
Average (200)
CTH-Av (200)
(a) (b)
Figure 7. Dissipated energy versus CMOD: (a) for the 150×150 mm2 specimens (Mix 1, 40 kg of 35 mm long fibres) - comparison of average values from each lab and total average; and (b) for the 200×200 mm2 specimens (Mix 2, 40 kg of 60 mm long fibres) - comparison of average values from each lab and total average.
5.2 Intra-lab variationWhen testing steel-fibre reinforced concrete it is often found that the scatter is quite large, and the coefficient of variance (Cov) can be as high as 40%. In this study, the coefficient of variance for the splitting load has been calculated, both individually for each lab and for the total test population. In Figure 8(a) the coefficient of variance for the 150×150 mm2 specimens can be seen and Figure 8(b) shows the same for the 200×200 mm2 specimens. The scatter is quite large; for the 150×150 mm2 specimens the average coefficient of variance is around 24% while it is 32% for the 200×200 mm2 specimens. The reason for the scatter being larger for the 200×200 mm2 specimens is believed to be related to the fibre dimensions. The longer fibres lead to a larger scatter since there are fewer fibres present. The coefficient of variance has also been calculated for the dissipated energy, see Figure 9. For the dissipated energy the coefficient of variance is 20% for the 150×150 mm2 specimens respectively 30% for the 200×200 mm2
specimens.
0%
10%
20%
30%
40%
0.0 1.0 2.0 3.0 4
CMOD [mm]
Coe
ffici
ent o
f var
ianc
e [%
]
SP-Av (150)
DTU-Av (150)
Average (150)
CTH-Av (150)
.00%
10%
20%
30%
40%
0.0 1.0 2.0 3.0 4
CMOD [mm]
Coe
ffici
ent o
fvar
ianc
e [%
]
SP-Av (200)
DTU-Av (200)
Average (200)
CTH-Av (200)
.0
(a) (b)
Figure 8. Coefficient of variance for the splitting load: (a) for the 150×150 mm2 specimens (Mix 1, 40 kg of 35 mm long fibres) - comparison of values from each lab and total average; and (b) for the 200×200 mm2 specimens (Mix 2, 40 kg of 60 mm long fibres) - comparison of values from each lab and total average.
Accepted for publication in Nordic Concrete Research, 2/200510

0%
10%
20%
30%
40%
0.0 1.0 2.0 3.0 4.0
CMOD [mm]
Coe
ffici
ent o
fvar
ianc
e [%
]
SP-Av (150)
DTU-Av (150)
Average (150)
CTH-Av (150)
0%
10%
20%
30%
40%
0.0 1.0 2.0 3.0 4.0
CMOD [mm]
Coe
ffici
ent o
fvar
ianc
e [%
]
SP-Av (200)
DTU-Av (200)
Average (200)
CTH-Av (200)
(a) (b)
Figure 9. Coefficient of variance for the dissipated energy: (a) for the 150×150 mm2
specimens (Mix 1, 40 kg of 35 mm long fibres) - comparison of values from each lab and total average; and (b) for the 200×200 mm2 specimens (Mix 2, 40 kg of 60 mm long fibres) - comparison of values from each lab and total average.
5.3 Inter-lab variation In this round robin test programme, tests were carried out at three labs. To evaluate the reproducibility of the test method, it is important to determine whether there are significant differences introduced by carrying out the test at different labs. A comprehensive study using statistical methods was carried out to investigate the level of variation obtained for the following parameters:
the peak-load (Fmax);the load at CMOD = 1.0 mm (F1.0);the load at CMOD = 2.0 mm (F2.0);the load at CMOD = 3.0 mm (F3.0);the load at CMOD = 4.0 mm (F4.0); and the energy dissipated until a CMOD = 4.0 mm (Gf4.0).
In this study, the analysis of variance method (more commonly known as ANOVA) was used. In essence, the ANOVA method is able to indicate whether there are any significant differences in the test results at a particular confidence level. The mathematical basis of this method can be found in books on statistics. After carrying out the analysis, a p-value was computed which is an indication of the difference in the test results. If the p-value is near zero, this casts doubt on the null hypothesis and suggests that at least one sample-mean is significantly different from the other sample-means. The choice of a critical p-value to determine whether the result is judged "statistically significant" is left to the researcher. It is common to declare a result significant if the p-value is less than 0.05 or 0.01. The level of confidence is represented by the value of .Normally, in statistical inferences, a value of = 0.05 is adopted. This value of has been used in this study. Generally, the ANOVA has four statistical parameters of interest:
The Fstatic, which is calculated from the different sets of results and is the ratio of the Mean Squares (MS) for each source, which in turn is the ratio (SS / df) of the Sum of Squares (SS) to the degrees of freedom (df) associated with each source. The p-value, which is obtained from statistical tables based on the level of confidence, ,and the calculated degrees of freedom (number of labs and number of specimens).
Accepted for publication in Nordic Concrete Research, 2/2005 11

The Fcritic, which is derived from statistical tables based on the level of confidence, ,and the degrees of freedom associated with the test results. The ratio of the Fstatic and the Fcritic. A value greater than unity would indicate that there is a significant difference between the treatments based on the level of confidence, .
The results of the ANOVA can be seen in Table 2 and Table 3. The ratio of Fstatic /Fcritic is less than unity for all the considered parameters (for both the 150×150 mm2 and the 200×200 mm2
specimens) and the ANOVA indicate that no significant difference between the treatments other than the internal variation. However, the result for the 200×200 mm2 specimens shows a larger variation, which also can be seen in Figure 6(b) and 7(b) where the results from CTH is lower than the others, and as the scatter for this series is quite large it is possible that more specimenswere needed to make a more rigorous conclusions. Hence, the ANOVO indicate no inter-lab variation, possible due to the large test scatter, and the test result can be said to be independent of the testing location and the equipment used (with CMOD-control or without).
Table 2. Compilation of ANOVA results for the 150×150 mm2 specimens (Mix 1, 40 kg of 35 mm long fibres).
ANOVA analysis results for the 150×150 mm2 specimens (Mix 1, 40 kg of 35 mm long fibres)Considered parameter
Statistical parameters Fmax F1.0 F2.0 F3.0 F4.0 Gf4.0
F static 1.3015 0.4001 0.1610 0.0796 0.2221 0.1654p-value 0.3053 0.6782 0.8530 0.9239 0.8038 0.8494F crit 3.8056 3.8056 3.8056 3.8056 3.8056 3.8056F static /F critic 0.342 0.105 0.042 0.021 0.058 0.043
Table 3. Compilation of ANOVA results for the 200×200 mm2 specimens (Mix 2, 40 kg of 60 mm long fibres).
ANOVA analysis results for the 200×200 mm2 specimens (Mix 2, 40 kg of 60 mm long fibres)Considered parameter
Statistical parameters Fmax F1.0 F2.0 F3.0 F4.0 Gf4.0
F static 2.2513 1.3092 1.3258 1.1054 0.9818 1.1083p-value 0.1447 0.2992 0.2950 0.3566 0.3974 0.3557F crit 3.8056 3.6823 3.6823 3.6823 3.6823 3.6823F static /F critic 0.592 0.356 0.360 0.300 0.267 0.301
5.4 Comparison of specimens fibre distribution As the variation in the test results is quite large it was decided to determine and compare the fibre distribution. In all the tested specimens the total number of fibres were counted and the average number of fibres per square centimetre have been compared in Figure 10. Furthermore,the coefficient of variance for the number of fibres per square centimetre can be seen in Figure 11. From the figures it becomes clear that the scatter in the fibre distribution is quite large, for the short fibre (35 mm) the coefficient of variance varies between 6% and 18% while for the long fibre (60 mm) it varies between 28% and 38%.
Accepted for publication in Nordic Concrete Research, 2/200512

0.0
0.1
0.2
0.3
0.4
0.5
0.6
0.7
0.8
0.9
1.0
CTH 150 DTU 150 SP 150 Average 150
No.
fibr
es /
cm2
MaxAverageMin
0.0
0.1
0.2
0.3
0.4
0.5
0.6
0.7
CTH 200 DTU 200 SP 200 Average200
No.
fibr
es/ c
m2
MaxAverageMin
(a) (b)
Figure 10. Comparison of the number of fibres per square centimetre: (a) for the 150×150 mm2
specimens (Mix 1, 40 kg of 35 mm long fibres) – max, average, and min; and (b) for the 200×200 mm2 specimens (Mix 2, 40 kg of 60 mm long fibres) – max, average, and min.
0%
10%
20%
30%
40%
CTH 150
DTU 150
SP 150
Averag
e 150
CTH20
0
DTU20
0
SP 200
Averag
e 200
Coe
ffici
ent o
f var
ianc
e [%
Figure 11 Coefficient of variance for number of fibres per square centimetre (no. fibres / cm2).
6. INTERPRETATION OF TEST RESULTS
6.1 Results from inverse analysis As the main benefit from fibre reinforcement is the ability to transfer stress across a crack it is important to characterise the stress-crack opening relationship. The stress-crack opening
Accepted for publication in Nordic Concrete Research, 2/2005 13

relationship is also required for advanced (non-linear) analysis of structural behaviour (cracking, crack propagation and fracture). Hence, to show how the test results may be interpreted, inverse analyses were conducted on the averaged load-CMOD curves (the average of all tested specimens from one mix). The inverse analysis was conducted using a Matlab program,developed at DTU by Østergaard [11]. The programme is based on the cracked hinge model by Olesen [33], see Østergaard & Olesen [34], which uses the fictitious crack concept by Hillerborg et al. [35], see also Hillerborg [36]. In the cracked hinge model it was assumed that the -w relationship could be approximated by a bi-linear function, see Figure 12.
Ec
1
wcw1
b2
a1
a2w
ctfw
cct
ct
wwwwabf
wwwafw
122
11 01
(b)(a)
1ctf
Figure 12. Assumed bi-linear stress-crack opening relationship and definition of the parameters describing the relationship.
In Table 4 the results of the inverse analyses can be seen and the bi-linear stress-crack opening relationships can be seen in Figure 13. There are some minor differences between the obtained stress-crack opening relationships but the overall agreement is quite good. The largest differences are found in the post-cracking parameters (a1, a2, and b2), which is expected as these are highly influenced by the number, orientation and distribution of fibres. The bi-linear stress-crack opening relationships can be seen in Figure 13. There are some minor differences between the obtained stress-crack opening relationships but the overall agreement is quite good.
Table 4. Results of the inverse analyses on the test results: for the 150×150 mm2 specimens (Mix 1, 40 kg of 35 mm long fibres) the 200×200 mm2 specimens (Mix 2, 40 kg of 60 mm long fibres).
WST 150 WST 200 fct a1 a2 b2 %error fct a1 a2 b2 %error[MPa] [mm-1] [mm-1] [-] [MPa] [mm-1] [mm-1] [-]
CTH 2.05 10.01 0.0463 0.399 2.38 CTH 2.18 10.0 0.055 0.48 3.20DTU 1.98 15.12 0.1187 0.508 2.36 DTU 2.49 22.1 0.041 0.51 2.34SP 1.90 10.256 0.0748 0.490 2.58 SP 2.46 20.0 0.026 0.54 2.61Average: 1.98 11.80 0.080 0.47 2.44 Average: 2.37 17.4 0.040 0.51 2.71Cov: 3.9% 12.5% Cov: 7.2% 5.7%
Accepted for publication in Nordic Concrete Research, 2/200514

0.0
0.5
1.0
1.5
2.0
2.5
0.0 0.5 1.0 1.5 2.0Crack opening, w , [mm]
Stre
ss,
w, [
MPa
]
CTH (150)DTU (150)SP (150)Average
0.0
0.5
1.0
1.5
2.0
2.5
3.0
0.0 0.5 1.0 1.5 2.0Crack opening, w , [mm]
Stre
ss,
w, [
MPa
]
CTH (200)DTU (200)SP (200)Average
(a) (b)
Figure 13. Comparison of stress-crack opening relationships ( -w) obtained by inverse analysis: (a) for the 150×150 mm2 specimens (Mix 1, 40 kg of 35 mm long fibres);and (b) for the 200×200 mm2 specimens (Mix 2, 40 kg of 60 mm long fibres).
6.2 Results from simplified analysis A residual tensile stress, ftR, can be determined by the simplified approach, see Section 2. The relationships between CMOD and CTOD (eq. 2 & 3) can be used to calculate the corresponding crack opening, w.For the 150 150 mm2 WST-specimens, the relationship between the CMOD and the CTOD is given by eq. 2. This leads to a crack opening, w=2.20 mm, for a maximum CMOD of 4.0 mm.For the 200 200 mm2 WST-specimens, the relationship between the CMOD and the CTOD is given by eq. 3. This leads to a crack opening, w=2.12 mm, for a maximum CMOD of 4.0 mm.
Figure 14 shows the external forces acting on the specimen and the internal forces, based on the simplified stress distribution. The residual tensile stress, ftR can be calculated by solving the equilibrium equation of forces (eq. 6) and the equilibrium equation of moment with respect to the position of the neutral axis (eq. 6):
Accepted for publication in Nordic Concrete Research, 2/2005 15

Fsp
Position ofCMOD
CTODFsp
xh*
(a) (b)
ftR
Fc
FtRFv/2d y
dx +CMOD
Fv/2
Figure 14. (a) Schematic view of a cracked specimen and the definition of CMOD and CTOD. (b) Simplified stress distribution based on the assumption of a constant residual tensile stress ftR (x denotes the height of the compressive zone).
The result of the simplified analysis can be seen in Figure 15 where the residual tensile stress, ftR, is compared with the bi-linear stress-crack opening relationship determined by inverse analysis. As can be seen, the residual tensile stress, ftR, is an average value of the bi-linear stress-crack opening relationship.
0.0
0.5
1.0
1.5
2.0
2.5
0.0 0.5 1.0 1.5 2.0Crack opening, w , [mm]
Stre
ss,
w, [
MPa
]
CTH (Residual)DTU (Residual)SP (Residual)Average (Bi-lin)
0.0
0.5
1.0
1.5
2.0
2.5
3.0
0.0 0.5 1.0 1.5 2.0Crack opening, w , [mm]
Stre
ss,
w, [
MPa
]
CTH (Residual)DTU (Residual)SP (Residual)Average (Bi-lin)
(a) (b)
Figure 15. Comparison between the simplified analysis (the residual tensile stress ftR) and the inverse analysis (average result): (a) for the 150×150 mm2 specimens (Mix 1, 40 kg of 35 mm long fibres); and (b) for the 200×200 mm2 specimens (Mix 2, 40 kg of 60 mm long fibres).
Accepted for publication in Nordic Concrete Research, 2/200516

7. CONCLUDING REMARKS
To evaluate the reproducibility of the wedge-splitting test method, a round robin study was conducted in which three labs participated (see Löfgren et al. [1]). The participating labs were:
DTU – the Technical University of Denmark, Department of Civil Engineering; CTH – Chalmers University of Technology, Department of Structural Engineering and Mechanics; and SP –Swedish National Testing and Research Institute.
Two different mixes were investigated; the difference between the mixes was the fibre length (Mix 1 with 40 kg of 35 mm long fibres and Mix 2 with 40 kg of 60 mm long fibres). The test results from each lab were analysed and a study of the variation was performed. From the study of the intra-lab variations, it is evident that the variations of the steel fibre-reinforced concrete properties are significant. The coefficient of variance for the splitting load was found to vary between 20% and 35% for the 150×150 mm2 specimens (Mix 1, 40 kg of 35 mm long fibres) while for the 200×200 mm2 specimens (Mix 2, 40 kg of 60 mm long fibres) it varied between 25% and 40%. The investigation of the inter-lab variation, based on an analysis of variance (ANOVA) indicated no inter-lab variation, possible due to the large scatter in the test results. It is possible that more specimens or labs were required to make a more rigorous conclusions. However, the result of this study indicate that the test results can be said to be independent of the testing location and the equipment used (with or without CMOD-control).
The conclusions that can be drawn from this study are that: the wedge-splitting test method is a suitable test method for assessment of fracture properties of steel fibre-reinforced concrete; the test method is easy to handle and the execution is relatively fast; the test results were found to be independent of the testing location and the equipmentused;the test can be run with CMOD-control or without, in a machine with a constant actuator displacement rate (if the rate is equal to or less than 0.25 mm/min);due to variations in fibre distribution, the scatter of the test results is high (but not higher than for the three-point bending test); the dimensions of the specimen (height, width, and thickness) should be at least morethan three times the fibre length, or preferably four times the maximum fibre length; using inverse analysis, the tensile fracture properties may be interpreted from the test results as a bi-linear stress-crack opening relationship.
ACKNOWLEDGMENT
This paper is a product of the NORDTEST, project No. 04032 (1672-04, Part I). The financial support from the NORDTEST organisation is greatly appreciated.
Accepted for publication in Nordic Concrete Research, 2/2005 17

REFERENCES
[1] Löfgren, I., Olesen J.F., and Flansbjer, M.: ‘Application of WST-method for fracture testing of fibre-reinforced concrete’. Report 04:13, Department of Structural Engineering and Mechanics,Chalmers University of Technology, Göteborg 2004, pp 52.
[2] Romualdi, J.P. and Mandel, J.A.: ‘Tensile strength of concrete affected by uniformly distributed and closely spaced short lengths of wire reinforcement’. ACI J. Proc. 61(6) 1964, pp. 657-671.
[3] ACI Committee 544: ‘Measurement of properties of fiber reinforced concrete’. ACI Materials Journal 85(1988), pp. 583-593.
[4] ASTM C 1018: ‘Standard Test Method for Flexural Toughness and First-Crack Strength of Fiber-Reinforced Concrete (Using Beam With Third-Point Loading),’ ASTM, West Conshohocken, Pa., 1997.
[5] ASTM C 1550: ‘Standard Test Method for Flexural Toughness of Fiber-Reinforced Concrete(Using Centrally-Loaded Round Panel),’ ASTM, West Conshohocken, Pa., 2002.
[6] Gopalaratnam, V.S. and Gettu, R.: ‘On the characterization of flexural toughness in fiberreinforced concretes’. Cem. & Concrete Composites 17(1995), pp. 239-254.
[7] Barr B., Gettu R., Al-Oraimi S.K.A., and Bryars L.S.: ‘Toughness measurement – the need tothink again’. Cem. & Concrete Composites 18(1996), pp. 281-297.
[8] RILEM TC TDF-162: ‘Test and design methods for steel fibre reinforced concrete. Bending test – Final Recommendation’, Materials and Structures, 35, Nov 2002, pp. 579-582.
[9] RILEM TC TDF-162: ‘Test and design methods for steel fibre reinforced concrete. Recommendations for uni-axial tension test’, Materials and Structures, 34 Jan-Feb 2001, pp. 3-6.
[10] RILEM TC-50 FMC: ‘Determination of the fracture energy of mortar and concrete by means ofthree-point bend tests on notched beams’, Materials and Structures, 18(106), 1985, pp. 285.
[11] Østergaard, L.: ‘Early-Age Fracture Mechanics and Cracking of Concrete – Experiments andModelling’. Ph.D thesis, Department of Civil Engineering, Technical University of Denmark.2003.
[12] Linsbauer, H.N. and Tschegg, E.K.: ‘Fracture energy determination of concrete with cube shaped specimens’, Zement und Beton, 31, pp 38-40.
[13] Brühwiler, E. and Wittmann, F.H.: ‘The wedge splitting test, a new method of performing stable fracture mechanics test’ Eng. Fracture Mech. 35(1/2/3), 117-125.
[14] de Place Hansen, E.J., Hansen, E.A., Hassanzadeh, M., and Stang, H.: Determination of the Fracture Energy of Concrete: A comparison of the Three-Point Bend Test on Notched Beam and the Wedge-Splitting Test. NORDTEST Project No 1327-97. SP Swedish National Testing and Research Institute, Building Technology, SP Report 1998:09, Borås, Sweden. p. 87.
[15] Trunk, B., Schober, G., and Wittmann, F.H.: ‘Fracture mechanics parameters of autoclaved aerated concrete’, Cem. and Concrete Research, 29(1999), pp. 855-859.
[16] Kim, J.-K. and Kim, Y.-Y.: ‘Fatigue crack growth of high-strength concrete in wedge-splitting test’. Cem. and Concrete Research, 29(1999), pp. 705–712.
[17] Elser, M., Tschegg, E.K., Finger, N., and Stanzl-Tschegg, S.E.: ‘Fracture Behaviour of Polypropylene-Fibre reinforced Concrete: an experimental investigation’, Comp. Science and Technology, 56(1996), pp. 933-945.
[18] Meda, A., Plizzari, G.A., and Slowik, V.: ‘Fracture of fiber reinforced concrete slabs on grade’.In Fracture Mechanics of Concrete Structures, ed. De Borst et al, 2001.
[19] Nemegeer, D., Vanbrabant, J. and Stang, H.: ‘Brite Euram Program on Steel Fibre Concrete Subtask: Durability: Corrosion Resistance of Cracked Fibre Reinforced Concrete’. In Test and Design Methods for Steel Fibre Reinforced Concrete – Background and Experiences - Proceedings of the RILEM TC 162-TDF Workshop, Ed Schnütgen and Vandevalle, 2003.
[20] Löfgren, I.: ‘The wedge splitting test – a test method for assessment of fracture parameters ofFRC?’. In Fracture Mechanics of Concrete Structures, Li Et al (eds), 2004.
[21] Leite, J.P. de B., Slowik, V. and Mihashi, H.: ‘Mesolevel models for simulation of fracturebehaviour of fibre reinforced concrete’. In Fibre-Reinforced Concrete, Proceedings of the Sixth International RILEM Symposium, ed. di Prisco et al. 2004.
Accepted for publication in Nordic Concrete Research, 2/200518

[22] RILEM Report 5: Fracture Mechanics Test Methods for Concrete. Edited by S.P. Shah and A. Carpinteri. Chapman and Hall, London, 1991.
[23] Roelfstra, P.E. and Wittmann, F.H.: ‘Numerical method to link strain softening with failure of concrete. In Fracture Toughness and Fracture Energy of Concrete, pp. 163-175. Elsevier, 1986.
[24] Planas, J., Guinea, G.V., and Elices, M.: ‘Size effect and inverse analysis in concrete fracture’,International Journal of Fracture, 95(1999), pp. 367-378.
[25] Bolzon, G., Fedele, R., and Maier, G.: ‘Parameter identification of a cohesive crack model byKalman filter’, Comput. Methods Appl. Mech. Engrg. 191(2002), pp. 2847-2871.
[26] Que, N.S. and Tin-Loi, F.: ‘Numerical evaluation of cohesive fracture parameters from a wedgesplitting test’ Engineering Fracture Mechanics, 69 (2002), pp. 1269-1286.
[27] Kitsutaka, Y.: ‘Fracture parameters by polylinear tension-softening analysis. J. of Eng. Mechanics,123(5) pp. 444-450, 1997.
[28] Nanakorn, P. and Horii, H.: ‘Back analysis of tension-softening relationship of concrete. J.Materials, Conc. Struct., Pavements, 32(544), pp. 265-275, 1996.
[29] Uchida, Y., Kurihara, N., Rokugo, K., and Koyanagi, W.: ‘Determination of tension softening diagrams of various kinds of concrete by means of numerical analysis’. In Fracture Mechanics of Concrete Structures, FRAMCOS-2, ed. F.H. Wittmann, pp. 17-30, 1995.
[30] Kooiman, A.G.: ‘Modelling Steel Fibre Reinforced Concrete for Structural Design’. Ph.D. Thesis, TU Delft 2000.
[31] Sousa, J.L.A.O, Gettu, R., and Barragán, B.E.: ‘Obtaining the –w curve from the inverse analysisof the notched beam response’ see Annex D of Barragán, B.E. (2002) ‘Failure and toughness of steel fiber reinforced concrete under tension and shear’, Ph.D. Thesis, Universitat Politécnica de Catalunya, Barcelona, Spain, 2002.
[32] Löfgren, I., Stang, H. and Olesen, J.F..: ‘Wedge splitting test – a test to determine fracture properties of FRC’ BEFIB 2004 - Sixth RILEM symposium on fibre reinforced concrete (FRC): Varenna, Italy, 20th-22nd September 2004.
[33] Olesen, J.F.: ‘Fictitious crack propagation in fibre-reinforced concrete beams’. Journal of Eng. Mech. 127(3): pp. 272-280, 2001.
[34] Østergaard, L. and Olesen, JF.: ‘Comparative study of fracture mechanical test methods for concrete’. In Fracture Mechanics of Concrete Structures, FRAMCOS-5, ed. Li et al, pp. 455-462.
[35] Hillerborg, A., Modeer, M., and Petersson, P.E.: ‘Analysis of Crack Formation and Crack Growth in Concrete by Means of Fracture Mechanics and Finite Elements’. Cem. & Concrete Res. 6, 1976, 773-782.
[36] Hillerborg, A.: ‘Analysis of Fracture by Means of the Fictitious Crack Model, Particularly for Fibre Reinforced Concrete’. The Int. J. Cem. Comp. 1980. 2. 177-184.
Accepted for publication in Nordic Concrete Research, 2/2005 19


PAPER V
Fracture Properties of FRC Determined through Inverse Analysis of Wedge Splitting and Three-Point Bending Tests
Ingemar Löfgren, Henrik Stang and John Forbes OlesenJournal of Advanced Concrete Technology Vol. 3, No. 3, pp. 423-434,
October 2005, Japan Concrete Institute.

Journal of Advanced Concrete Technology Vol. 3, No. 3, 423-434, October 2005 / Copyright © 2005 Japan Concrete Institute 423
Technical report
Fracture Properties of FRC Determined through Inverse Analysis of Wedge Splitting and Three-Point Bending Tests Ingemar Löfgren1, Henrik Stang2 and John Forbes Olesen3
Received 10 May 2005, accepted 15 September 2005
Abstract Fracture properties of five different steel fibre-reinforced concretes have been determined, using the wedge splitting test method (WST) and three-point bending tests (3PBT). Furthermore, for the WST method, two different specimen sizes have been investigated. Through inverse analyses, stress-crack opening ( -w) relationships have been determined for each mix and test method. Results from this investigation demonstrate the applicability of the WST method, show that inverse analysis can be used to determine stress-crack opening relationships, and the result demonstrate the effect of increased fibre content and the w/b-ratio. The major factor contributing to the differences in the determined stress-crack opening relationships is believed to be related to the variation in the number of fibres across the fracture plane. However, taking this into consideration, the inverse analyses indicate no systematic differences in the determined parameters be-tween two WST specimen sizes, while the 3PBT seems to give slightly higher post-cracking stresses.
1. Introduction
During the past four decades, different methods have been used to characterize the tensile behaviour of fibre-reinforced concrete (FRC): e.g. by measuring the flexural strength, as in the early work of Romualdi and Mandel (1964), or by determining the behaviour in terms of di-mensionless toughness indices (as prescribed in ACI 544 and ASTM C 1018) to determine residual flexural strengths at prescribed deflections (see Gopalaratnam & Gettu 1995, Barr et al. 1996, and RILEM TC 162-TDF 2002a). It can, however, be argued that, despite these methods, it is the lack of consistent design and test methods that has hampered a widespread utilization of FRC in structural applications. Moreover, inconsistent interpretation of test results, e.g. from bending tests, may lead to difficulties in distinguishing between the intrinsic properties of the material and the structural effects.
The addition of moderate amounts of short (discon-tinuous) fibres to concrete does not significantly affect the tensile strength or the modulus of elasticity. However, the fibres have a considerable impact on the tensile fracture behaviour and the energy dissipated during fracture. It is also generally accepted that fibre-reinforced concretes with low and moderate volume fractions, Vf, of fibres can be regarded as a quasi-brittle material. Thus, the tensile fracture behaviour can be characterized by the
tensile stress versus crack opening response (hereafter abbreviated as the -w relationship), which is also asso-ciated with the so-called fictitious crack model originally suggested by Hillerborg (see Hillerborg et al. 1976). With the -w relationship at hand it is possible to carry out design tasks based on non-linear fracture mechanics (see e.g. RILEM TC 162-TDF 2002b). In the fictitious crack model, the main parameters are the tensile strength, the modulus of elasticity, the fracture energy, and the shape of the -w curve.
For regular concrete, the shape of the -w curve does not vary too much (see Stang 1992 and Cornelissen et al.1986) and for most practical applications it is usually sufficient to determine the fracture energy, GF, and select an appropriate -w relationship. For FRC, on the other hand, the shape of the -w curves varies considerably depending on type and amount of fibres used, quality of the concrete, etc. (see e.g. Li et al. 1993). Furthermore, as pointed out by Hillerborg (1980), the complete fracture energy is of no interest since the stress-free crack open-ing, wc, occurs at very large crack openings for most FRCs, while for most concretes (without fibres) it is seldom larger than 0.3 mm. Consequently, to completely characterize the mechanical behaviour of fibre-reinforced concrete in tension, it is necessary to determine the -wrelationship. The -w relationship may be determined either directly, in a uniaxial tension test (UTT), or indi-rectly by performing an inverse analysis. In an inverse analysis the output from a test (typically a load-CMOD curve) is used as an input for the analysis, and the mate-rial parameters, which minimize the difference between the analytical curve and the test results, are determined.
RILEM technical committee 162-TDF, “Test and de-sign methods for steel fibre-reinforced concrete”, re-cently published recommendations for two test methods for steel fibre-reinforced concrete (SFRC); see RILEM-Committee-162-TDF (2001) and (2002a). The
1Research Assistant, Department of Civil and Environmental Engineering, Chalmers University ofTechnology, Sweden. E-mail: [email protected] 2Associate Professor, Department of Civil Engineering, Technical University of Denmark (DTU), Denmark. 3Associate Professor, Department of Civil Engineering, Technical University of Denmark (DTU), Denmark.

424 I. Löfgren, H. Stang and J. F. Olesen / Journal of Advanced Concrete Technology Vol. 3, No. 3, 423-434, 2005
proposed test methods are a uniaxial tension test (UTT) and a three-point bending test (3PBT) on notched beams. The three-point bending test on notched beams is probably the most widespread method for determining the fracture properties; see RILEM TC-50 FMC (1985) for conventional concrete and RILEM TC 162-TDF (2002) for steel fibre-reinforced concrete. The UTT re-quires sophisticated testing equipment and is quite time-consuming to carry out, and it has been shown that the test result is affected by machine specimen interac-tion (see e.g. Østergaard 2003). Drawbacks with the 3PBT are that the specimen is quite large and heavy; furthermore, the method is not suited for evaluation of material properties in existing structures. The wedge splitting test (WST) method, originally proposed by Linsbauer and Tschegg (1986) and later developed by Brühwiler and Wittmann (1990), is an interesting test method since it does not require sophisticated test equipment; the test is stable and mechanical testing machines with a constant crosshead displacement can be used. Furthermore, a standard cube specimen is used, but the test can also be performed on core-drilled samples.
Researchers have used the WST method extensively, and recently there has been increased interest in it. The method has proved to be successful for the determination of fracture properties of ordinary concrete, at early age and later (see Østergaard 2003), and for autoclaved aer-ated concrete (Trunk et al. 1999). In addition, the method has been used for the study of fatigue crack growth in high-strength concrete (Kim and Kim 1999), and fracture behaviour of polypropylene fibre-reinforced concrete (Elser et al. 1996). For steel fibre-reinforced concrete, a small number of references can be found. Meda et al.(2001) used the WST method (with three specimen sizes) to determine a bi-linear stress-crack opening relationship through inverse analysis. Nemegeer et al. (2003) used the WST method to investigate the corrosion resistance of cracked fibre-reinforced concrete. However, in an ex-perimental study conducted by Löfgren (2004) it was found that there may be problems with horizontal cracks, which was also found by Leite at el. (2004). Still, to the authors’ knowledge there exist no proper recommenda-tions regarding testing steel fibre-reinforced concrete by the WST method (specimen size, interpretation, etc).
In Fig. 1 the specimen geometry and loading proce-dure are clarified. The specimen is equipped with a groove (to be able to apply the splitting load) and a starter notch (to ensure the crack propagation). Two steel plat-ens with roller bearings are placed partly on top of the specimen, partly into the groove, and through a wedging device the splitting force, Fsp, is applied. During a test, the load in the vertical direction, Fv, and the crack mouth opening displacement (CMOD) are monitored.
The purpose of this paper is to demonstrate that the wedge splitting test (WST) method can be used to de-termine fracture properties of steel fibre-reinforced con-crete and that with inverse analysis it is possible to de-termine the -w relationship. In this study, experimental
results from two different test methods are compared: the three-point bending test (3PBT) on notched beam, and the wedge splitting test (WST). Furthermore, for the wedge splitting test, two different specimen sizes have been investigated. Inverse analyses have been performed by using the finite element method (based on non-linear fracture mechanics) and an analytical model based on the cracked hinge model by Olesen (2001).
2. Inverse analysis
Inverse analysis – also referred to as parameter or func-tion estimation – is achieved by minimizing the differ-ences between calculated displacements and target dis-placements (e.g. CMOD) obtained from test results (seeFig. 2). In this manner, inverse analysis can be used to determine a -w relationship from test results of methods like the 3PBT and the WST.
For regular concrete (i.e. without fibres), extensive research has been carried out to determine the best ap-proach for inverse analysis and different strategies have been proposed. Of the available approaches, some define the shape of the -w relationship as bi-linear (see e.g. Roelfstra and Wittmann 1986, Planas et al. 1999, Østergaard 2003, Bolzon et al. 2002, and Que and
load cell
steel loading device with roller bearings wedging
device
linear support
Clip gauge
cube specimen
piston with constant cross-head displacement
starter notch (cut-in)
groove (cast)
Fig. 1 Schematic view of the equipment and test set-up.
experimental results
model prediction: yi = f (xi, 1,..., n)
y
x
yi
Error:
xi
21,..., in yE
Fig. 2 Principle of inverse analysis.

I. Löfgren, H. Stang and J. F. Olesen / Journal of Advanced Concrete Technology Vol. 3, No. 3, 423-434, 2005 425
Tin-Loi 2002). In others, a poly-linear -w relationship (see Fig. 3(b)) is used in conjunction with a stepwise analysis (see e.g. Kitsutaka 1997, Nanakorn and Horii 1996). The inverse analysis approach has also been used for FRC (see e.g. Rokugo et al. 1989, Uchida et al. 1995, Kooiman 2000, Meda et al. 2001, and Sousa et al. 2002). However, there are some problems associated with conducting inverse analysis on FRC. Some of these are: (1) the shape of the -w relationship is not as well de-fined as for regular concrete, but varies depending on the mix constituents; (2) with increasing fibre volumes, it becomes difficult to distinguish between the effect of the tensile strength and the first slope of the -w relation-ship; (3) the inverse problem is often ill-posed, i.e. there exists no unique solution. In addition, depending on the shape of the -w relationship to be determined, a large number of parameters could be needed to describe it. If the -w relationship is complex – requiring many pa-rameters to be estimated – the iteration process becomes difficult and time-consuming. On the other hand, if the
-w relationship is too simple with only a few parameters needing to be estimated, it is not possible to converge to a good solution over the entire load-displacement curve.
To overcome some of the above problems, different approaches have been adopted. Kitsutaka (1995 and 1997) used an stepped analysis in combination with a poly-linear -w relationship, which is an interesting approach, as the shape of the -w relationship is not fixed. Uchida et al. (1995) utilised the stepped analysis tech-nique to determine poly-linear -w relationships for various kinds of concrete. However, the approach relies on the assumption of uniform material properties over the entire height of a cross-section. As a consequence, the tensile strength, and the first part of the -w rela-tionship, will be determined for the first layer closest to the notch, and any variations in material properties across the height influence subsequent parts of the -wrelationship. Though, the influence of varying material properties diminishes with increasing CMOD, as the effect on the response decreases for parts further from the tip of the notch. The method may thus not provide an accurate value of the tensile strength (see Uchida and Barr 1998) and the initial part of the curve may be unre-liable (see Planas et al. 1999). This problem was partly
resolved by assuming the initial part of the softening diagram to be perfect plastic (see Uchida et al 1995). The assumption of uniform properties may well be justified for concrete without fibres, while for FRC it is quite likely that there will be variations due to non-uniform fibre orientation. These variations may not influence the tensile strength much, but a fibre bundle situated close to the notch can have a significant effect on the behaviour and influence the determination of the -w relationship.
2.1 Strategy for inverse analysis In this study, to average out the effects of the variations in fibre distribution and orientation between specimens, inverse analyses were conducted on the averaged load-CMOD curves (the average of all tested specimens from one mix) through use of a Matlab program, de-veloped at DTU by Østergaard (2003), which is based on the cracked hinge model by Olesen (2001) (see Øster-gaard and Olesen 2004). In the cracked hinge model it was assumed that the -w relationship could be ap-proximated by a bi-linear function (see Fig. 3(a)). The inverse analysis is performed in three phases: in phase I the modulus of elasticity is determined; in phase II the tensile strength and the first slope of the curve, a1 in Fig. 3(a), is determined; and subsequently in phase III the other parameters (a2 and b2) are determined. For each phase an optimization procedure is used to find a local minimum and the iteration continues, with globally re-running the optimization process for all phases, until the difference of the determined parameters is less than 1.0% between two subsequent iterations.
Inverse analyses were also conducted by using the fi-nite element programme DIANA (see TNO 2002), with a poly-linear -w relationship (see Fig. 3 (b)). In the FE-analyses, all elements outside the crack were as-sumed to have linear elastic and isotropic behaviour, and the crack was modelled as a discrete crack, using so-called non-linear interface elements. The interface elements can be considered as non-linear springs de-scribing the Mode I fracture properties. Furthermore, plane stress conditions were assumed. In the FE-analyses, no automatic procedure was used for the inverse analy-ses; the -w relationship was manually changed until the analysis result fitted the test result.
3. Experimental program
3.1 Materials In total, five different concrete mixes were used in this investigation. The varied parameters were (see Table 1): the volume fraction of fibres, Vf; the water binder ratio, w/b, of the concrete; and the fibre geometry (the length and diameter of the fibre). Hooked-end steel fibres (type Dramix ) were used: RC 65/60-BN (fibre-length 60 mm, diameter 0.9 mm) and RC 65/35-BN (fibre-length 35 mm, diameter 0.55 mm).
b2
w1 wc
a1
a2
1
1
1ctfw
an
1a21
(a)
w
a1
1
w1 w2 wn wc
b2
1
w
ctfw
(b) Fig. 3 (a) Bi-linear and (b) poly-linear -w relationship.

426 I. Löfgren, H. Stang and J. F. Olesen / Journal of Advanced Concrete Technology Vol. 3, No. 3, 423-434, 2005
3.2 Three-point bending tests The three-point bending tests were conducted according to the recommendations of RILEM TC 162-TDF (2002a) (see Fig. 4) in an Instron 6025 universal testing machine with a capacity of 100 kN. The crack mouth opening displacement, CMOD, was measured at a distance of 8 mm from the bottom of the beam with an Instron clip gauge, having a 10 mm gauge length and a maximum travel of 5 mm. The net load-point deflection was measured by two LVDTs. The tests were performed under CMOD control. For each mix, five specimens were tested.
3.3 Wedge splitting test For the WST method, two different specimen sizes were investigated: small specimens (Fig. 5(a) and large specimens Fig. 5(b)). The actual specimen sizes were chosen such that that they would constitute a represen-tative volume similar to that of the 3PBT, but should also be practical for standard testing procedures (the speci-mens should not be too big or heavy). To avoid wall effect, the starter notch was sawn; and to ensure a vertical crack propagation, a 25 mm deep guide notch was cut on each side of the specimens according to Fig. 5(c) to produce a specimen with an effective thickness of 100 mm. For each mix, six specimens were tested. The tests were performed under CMOD control in an Instron 6025 universal testing machine with a capacity of 100 kN. The CMOD was measured with an Instron clip gauge, gauge
length 10 mm and maximum travel 5 mm. In the tests, a wedge angle of 15° was used and the roller bearings used were of the double-row-deep-groove type (manufactured by SKF, designation 4203 ATN9); see Fig. 6 for the experimental set-up.
4. Test results
4.1 Three-point bending tests From the test results of the individual beams in a test series, average load-CMOD curves have been con-structed; Fig. 7 shows the average load-CMOD curves for the mixes. In Fig. 7 it can be seen that, as the fibre volume increases, both the peak load and the post-peak load increase and the behaviour changes to deflection
Table 1 – Concrete mix compositions Constituents Density
[kg/m3]Mix 1
[kg/m3]Mix 2
[kg/m3]Mix 3
[kg/m3]Mix 4
[kg/m3]Mix 5
[kg/m3]CEM II/A-LL 52.5 R 3100 260 260 360 360 360 Fly ash 2250 - - 100 100 100 Water 1000 150 150 172 172 172 Equivalent w/b-ratio - 0.58 0.58 0.42 0.42 0.42 SIKA ViscoCrete 34 1090 0.4 0.953 0.4 0.4 0.4 Aggregates: 00 – 04 mm 2535 822.6 794.1 745.4 745.4 744.304 – 08 mm 2642 345.8 333.8 313.3 312.9 312.9 08 – 16 mm 2637 700.7 676.5 635 634 634 Fibres, Vf(Aspect ratio/Length)
7800 0.5% (65/60)
1.0% (65/60)
0.5% (65/60)
1.0% (65/60)
1.0% (65/35)
Measured air content 4.5% 7.0% 1.4% 1.4% 1.5%
Table 1 Concrete mix compositions.
550 250 250 25 25
150 75
75
25 150
150
F
h sp
notch
25
A
A–A
A
Fig. 4 Geometry of the three-point bending (3PBT) test according to RILEM TC 162-TDF.
guide notch
100
25
25
casting surface
(c) Top view
Specimens with guide notch
(a) Front view (b) Front view
Fig. 5 Geometry of the wedge splitting test specimens.

I. Löfgren, H. Stang and J. F. Olesen / Journal of Advanced Concrete Technology Vol. 3, No. 3, 423-434, 2005 427
hardening as opposed to softening and the peak-load occurs for larger CMODs. Furthermore, the w/b-ratio had a significant effect, and for the concretes with the lower w/b-ratio the peak- and the post-peak load increased and the behaviour changed to deflection hardening. The variability in the measured load was quite high; the co-efficient of variance (CoV) was 38% for Mix 1 and 2 but decreased as the fibre volume increased, with a CoV of 15 % for Mix 3 and 4 and 10 % for Mix 5.
4.2 Wedge splitting test Figure 8 shows the average splitting load-CMOD curves for the small WST specimens, and the corresponding results for the large WST specimens can be seen in Fig. 9.Similar to the 3PBT, in Fig. 7, it can be observed that the maximum splitting load, Fsp, increases with the amount of fibres and that the behaviour changes from deflection softening to hardening. Furthermore, for the mixes with the lower w/b-ratio higher peak and post-peak loads can be observed and a change in behaviour to deflection hardening. The variability in the measured splitting load was overall slightly lower than for the 3PBT, the coeffi-cient of variance (CoV) varies between 12% and 25% for both specimen sizes.
4.3 Fibre content The number of fibres crossing a crack has a significant
influence on the toughness and the -w relationship. Therefore, the fibres crossing the fracture surface have been counted for all specimens and the fibre efficiency factor, b, has been calculated. This factor defines the efficiency of bridging in terms of amount of fibres crossing a crack with respect to orientation effects. The theoretical fibre efficiency factor, b, in a large volume is as follows (see e.g. Krenchel, 1975): for the 1-D case,
b.1D = 1; for the 2-D case, b.2D = 2/ ( b.2D 0.64); and for the 3-D case, b.3D = 1/2. Figure 10(a) presents the fibre efficiency factor, b.exp, as obtained in the speci-mens, and Fig. 10(b) shows its coefficient of variance (CoV). The experimental fibre efficiency factor, b.exp,was calculated as:
f .expb.exp
f f
NV A
= (1)
where Nf.exp is the number of fibres per unit area, Vf is the fibre volume fraction, and Af is the cross-sectional area of a fibre.
The tendency is that the number of fibres is higher than the theoretical value for random 3-D orientation, some-times closer to the 2-D case. For the short fibre (Mix 5) the difference is smaller when compared to the longer fibre. For the 3PBT, the number of fibres is closest to the theoretical value and shows the smallest scatter (average CoV is 16%), except for Mix 1. For the 3PBT, the av-erage fibre efficiency factor for mixes 1 to 4 is 0.6; this should be compared to a theoretical derived value, con-
Fig. 6 Experimental set-up for the WST.
0
1000
2000
3000
4000
5000
6000
0.0 1.0 2.0 3.0 4.0 5.0
CMOD [mm]
Split
ting
load
, Fsp
,[N
ewto
n]
Mix 1
Mix 2Mix 3
Mix 5
Mix 4
Fig. 8 Average splitting load-CMOD curves for the WST (small specimens).
0
5
10
15
20
25
30
0.0 1.0 2.0 3.0 4.0 5.0
CMOD [mm]
Load
[kN
]
Mix 1
Mix 2
Mix 3
Mix 5
Mix 4
Fig. 7 Average load-CMOD curves for the 3PBT.
0
2000
4000
6000
8000
0.0 1.0 2.0 3.0 4.0 5.0
CMOD [mm]
Split
ting
load
, Fsp
,[N
ewto
n]
Mix 1
Mix 3
Mix 2
Mix 5
Mix 4
Fig. 9 Average splitting load-CMOD curves for the WST (large specimens).

428 I. Löfgren, H. Stang and J. F. Olesen / Journal of Advanced Concrete Technology Vol. 3, No. 3, 423-434, 2005
sidering the beam geometry and fibre length, of 0.58 (see Dupont 2003). When comparing the different specimens it can be seen that in some cases the WST specimens have more fibres than the 3PBT, while in others the amount of fibres are equal or less. For the small WST specimens, on average there seems to be a small increase in the number of fibres of 5% compared to the 3PBT, and the scatter is also higher (average CoV is 18%). For the large WST specimens, there is a small increase in the number of fibres of 10% compared to the 3PBT, and the scatter is also higher (average CoV is 21%). The number of fibres in the large WST specimens was for most mixes, except Mix 4, slightly higher compared to the smaller specimens, on average the increase was 6%.
5. Results of inverse analyses
The comparisons between test results and inverse analyses are shown in Fig. 11 to Fig. 16. As can be seen, the FE-analyses show good agreement for all the speci-mens and mixes, while the bi-linear -w relationship (used in the Matlab program) gives good agreement for only some of the mixes. Evidently, the bi-linear rela-tionship is not able to fit the test results for the specimens with a fibre volume fraction of 1%.
5.1 Stress-crack opening relationship The obtained -w relationships are presented in Fig. 17to Fig. 21 and in Table 2 the tensile strength is presented. The determined poly-linear -w relationships have the following general shape: (1) an initial steep descending part; (2) a gradual ascending part; and (3) ends with a gradual descending part. The gradual ascending part is more pronounced for the mixes with the high fibre volume fraction.
Generally, the 3PBT seems to give a slightly higher tensile strength than does the WST method (see Table 2)and the variation between the two WST specimen sizes is small, less than 10%. For mixes 1 and 2, the agreement between the 3PBT and the WST is quite good (see Fig.
17 and Fig 18). For the other mixes the discrepancy is larger. With the bi-linear -w relationship it is difficult to match the test results in detail; however, it seems that for larger crack openings the bi- and poly-linear -w rela-tionships give similar results. From the -w relationships, the effect of an increased amount of fibres can be seen;
0.4
0.5
0.6
0.7
0.8
Mix 1 Mix 2 Mix 3 Mix 4 Mix 5
Fibr
e ef
ficie
ncy
fact
or,
b.ex
p, [-
]
WST-SWST-L3PBT
b.3D = 0.5
b.2D = 0.64
0%
10%
20%
30%
40%
Mix 1 Mix 2 Mix 3 Mix 4 Mix 5
CO
V -
for
no. o
f fib
res
[%]
WST-SWST-L3PBT
(a) (b)Fig. 10 (a) The fibre efficiency factor, b.exp, and (b) its coefficient of variance, CoV (white represents small WST speci-mens, dark grey for large WST specimens, and black for 3PBT specimens).
0
5
10
15
20
25
30
0 1 2 3 4 5
CMOD [mm]
Load
[kN
]
Mix 1
Mix 2
Mix 3
Mix 5
Mix 4
Fig. 11 Comparison of test results and inverse analyses using a bi-linear -w relationship, for the 3PBT (thick lines represent the test results).
0
5
10
15
20
25
30
0 1 2 3 4 5
CMOD [mm]
Load
[kN
]
Mix 1
Mix 2
Mix 3
Mix 5
Mix 4
Fig. 12 Comparison of test results and FE-analyses for the 3PBT (thick lines represent the test results).

I. Löfgren, H. Stang and J. F. Olesen / Journal of Advanced Concrete Technology Vol. 3, No. 3, 423-434, 2005 429
compare Fig. 17 and Fig. 18 (Mix 1 compared to Mix 2), as well as Fig. 19 and Fig. 20 (Mix 3 compared to Mix 4). In the figures it is clear that the post-cracking stress (the residual stress) increases with increasing fibre content. The post-cracking stress is also higher for the concrete with the low w/b-ratio, probably a result of improved bond and a stronger matrix. Some of the differences in the -w relationships are most likely to be related to the
variation in fibre content and orientation, i.e. specimens with higher fibre content give higher post-cracking stresses (see Fig. 10 and Fig. 17 to Fig. 21). This varia-tion in fibre content and orientation makes an exact comparison between the -w relationships difficult. However, taking this into account it seems as the 3PBT give slightly higher post-cracking stresses (especially for the mixes with Vf = 1.0%).
0
1000
2000
3000
4000
5000
6000
0 1 2 3 4 5
CMOD [mm]
Split
ting
load
, Fsp
,[N
ewto
n]
Mix 1
Mix 2Mix 3
Mix 5
Mix 4
0
1000
2000
3000
4000
5000
6000
0.0 1.0 2.0 3.0 4.0 5.0
CMOD [mm]
Split
ting
load
, Fsp
,[N
ewto
n]
Mix 1
Mix 2Mix 3
Mix 5
Mix 4
Fig. 13 Comparison of test results and inverse analyses Fig. 14 Comparison of test results and FE-analyses for the using a bi-linear -w relationship, for the small WST small WST specimens (thick lines represent the test results).specimens (thick lines represent the test results).
0
2000
4000
6000
8000
0 1 2 3 4 5
CMOD [mm]
Split
ting
load
, Fsp
,[N
ewto
n]
Mix 1
Mix 3
Mix 2
Mix 5
Mix 4
0
2000
4000
6000
8000
0.0 1.0 2.0 3.0 4.0 5.0
CMOD [mm]
Split
ting
load
, Fsp
,[N
ewto
n]
Mix 1
Mix 3
Mix 2
Mix 5
Mix 4
Fig. 15 Comparison of test results and inverse analyses Fig. 16 Comparison of test results and FE-analyses for theusing a bi-linear -w relationship, for the large WST large WST specimens (thick lines represent the test results).specimens (thick lines represent the test results).
0.0
1.0
2.0
3.0
0.0 0.5 1.0 1.5
Crack opening, w , [mm]
Stre
ss,
w, [
MPa
]
3PBT FEA WST-S FEA WST-L FEA3PBT Bi-lin WST-S Bi-lin WST-L Bi-lin
0.0
1.0
2.0
3.0
0.0 0.5 1.0 1.5
Crack opening, w , [mm]
Stre
ss,
w, [
MPa
]
3PBT FEA WST-S FEA WST-L FEA3PBT Bi-lin WST-S Bi-lin WST-L Bi-lin
Fig. 17 -w relationship for Mix 1. Fig. 18 -w relationship for Mix 2.

430 I. Löfgren, H. Stang and J. F. Olesen / Journal of Advanced Concrete Technology Vol. 3, No. 3, 423-434, 2005
5.2 Relationship between CMOD and CTOD With both the 3PBT and the WST usually the CMOD is measured instead of a real crack opening – this is often due to measurement technique or specific test conditions. As can be seen in Fig. 22, while the CMOD is measured at some distance from the tip of the notch, the crack tip opening displacement (CTOD) is the first crack opening in the specimen. When testing fibre-reinforced concrete it is normally difficult to run a test until the specimen has ruptured completely and, therefore it is necessary to specify a limit at which the test can be ended. The limit is usually related to the crack opening characterizing the service or ultimate limit state. As a result, a minimum displacement or CMOD representing the specified crack openings has to be determined. Moreover, when per-forming inverse analysis, it may be also be necessary to continue the test past the minimum specified displace-ment or CMOD in order to enhance the precision of the inverse analysis and get a representative result. The minimum required CMOD may be determined by con-sidering the relationship between the CMOD and CTODtogether with the crack opening profile for the specimen, see Fig. 23. To facilitate such specifications for the WST-method, results from the FE-analyses have been used to determine the relationship between the CMODand CTOD, giving the following expressions (eq. 2 to eq. 4): For the 3PBT (average value of Mix 1 to 5):
0098.07889.0 CMODCTOD (2)
For the small WST (average value of Mix 1 to 5):
0071.05530.0 CMODCTOD (3)
For the large WST (average value of Mix 1 to 5):
0087.05349.0 CMODCTOD (4)
The crack opening profile at different CMOD (ob-tained from the FE-analyses) can be seen in Fig. 23, and at large CMODs the crack profile is linear with a small compressive zone. This reveals that for the large WST
Table 2 Tensile strength (in MPa) determined with the different methods.
Test method
Mix 1
Mix 2
Mix 3
Mix 4
Mix 5
3PBT 2.95 2.69 3.62 3.74 3.72
WST-S 2.73 2.20 3.28 3.68 3.45WST-L 2.64 2.38 3.58 3.57 3.53
Fsp
a
h
Position ofCMOD
CTOD
Fsp
y
Fig. 22 Schematic view of stress distribution in a WST specimen and the definition of CMOD and CTOD (h de-notes the total length of the ligament and a the length of the fictitious crack).
0.0
1.0
2.0
3.0
4.0
0.0 0.5 1.0 1.5
Crack opening, w , [mm]
Stre
ss,
w, [
MPa
]
3PBT FEA WST-S FEA WST-L FEA3PBT Bi-lin WST-S Bi-lin WST-LBi-lin
Fig. 19 -w relationship for Mix 3.
0.0
1.0
2.0
3.0
4.0
0.0 0.5 1.0 1.5
Crack opening, w , [mm]
Stre
ss,
w, [
MPa
]
3PBT FEA WST-S FEA WST-L FEA3PBT Bi-lin WST-S Bi-lin WST-L Bi-lin
Fig. 20 -w relationship for Mix 4.
0.0
1.0
2.0
3.0
4.0
0.0 0.5 1.0 1.5
Crack opening, w , [mm]
Stre
ss,
w, [
MPa
]
3PBT FEA WST-S FEA WST-L FEA3PBT Bi-lin WST-S Bi-lin WST-L Bi-lin
Fig. 21 -w relationship for Mix 5.

I. Löfgren, H. Stang and J. F. Olesen / Journal of Advanced Concrete Technology Vol. 3, No. 3, 423-434, 2005 431
specimen a CMOD equal to 4.5 mm (used in this inves-tigation) results in a CTOD of 2.4 mm (using eq. 4). The
-w relationships were determined up to a crack opening of 1.5 mm. In Fig. 23 it can be seen that at a depth of about 40% (y = 60 mm) of the specimen height the crack opening is 1.5 mm while at half the specimen height the crack opening is 1.2 mm.
6. Discussion
The number of fibres crossing the fracture plane was more than the theoretical number for random 3-D ori-entation, which is no surprise as it has been found in a number of studies (see Dupont 2003 and Kooiman 2000) and since small-scale test specimens always influence the fibre orientation. Moreover, when comparing the average number of fibres for all mixes and specimen it seems as the beam specimens had fewer fibres (per cm2) than the WST specimens and that the small WST specimen had slightly fewer than the large. The reasons for this are not clear, and as the scatter was so high it is difficult to make any rigorous conclusions that can be statistically verified. The important point, however, is that the difference in fibre orientation between different test specimens and any small-scale test specimens and structural elements needs to be addressed if a -w relationship obtained from inverse analysis is to be compared with other result or used for structural design. The differences in fibre con-tent makes an exact comparison of the -w relationships difficult; however, taking this into account it seems as the 3PBT give slightly higher post-cracking stresses (see Fig. 17 to Fig. 21). The reasons for the higher post-cracking stresses for the 3PBT could be a result of the diffused cracking (crack branching and two cracks in some cases) in some of the 3PBT specimens (see Fig. 24), which it is not possible to capture in the inverse analysis. The depth of the notch for the 3PBT was not sufficient to prevent multiple cracks when the fibre volume fraction was 1%. This is an unwanted situation and it may be necessary to increase the notch depth when the volume fraction is 1% or higher. For the WST-specimens, the deep starter notch and the guide notch prevents this type of cracking and the crack is forced to propagate vertically with well-defined boundaries, a situation similar to a uni-axial tension test with notches. Furthermore, the situation with the guide notch corresponds well to the assumptions of a discrete crack in the FE-analysis.
The inverse analyses in this study were conducted on the averaged load-CMOD curves (the average of all tested specimens from one mix). The benefits of this are that it averages out the effects of any variations in fibre distribution and orientation between specimens, a rep-resentative curve are provided, and that only one analysis is required for determination of the -w relationship. When performing the inverse analysis it was found that it is important that the first descending slope of the -wrelationship is estimated realistically – the slope should be steep – and that a sufficient number of points are used
to describe the subsequent parts of the -w relationship. If the tensile strength is to be predicted correctly the initial slope is important; i.e. a less steep slope has to be compensated by a lower tensile strength in order to fit the test data. That the initial slope should be steep is also based on the following observations: (1) the initial part of the -w relationship is quite steep for plain concrete (see Stang 1992 and Cornelissen et al. 1986); and (2) the contribution from fibre bridging comes gradually and it is not until crack openings of at least 0.05 mm that it has any major influence (see Li et al. 1993). Moreover, uni-axial tension tests on fibre-reinforced concrete have also shown that the -w relationship starts with an initial steep descending slope (see e.g. see Li et al. 1993 and Barragán 2002). The shape of the determined -w rela-tionships and their tendencies regarding the effect of the fibre volume fraction and w/b-ratio are comparable with results found in the literature (see for example Li et al.1993 and Barragán 2002). However, a direct comparison is not possible due to variations in fibre content and different mix compositions.
0
20
40
60
80
100
0 2 4 6COD [mm]
y [m
m]
4.0CMOD = 5.0 7.0 10.0
CMOD = 4.5
Fig. 23 The crack opening profile from FE-analysis at different CMOD for the large WST specimens and Mix 4.
Fig. 24 Illustration of diffused cracking in beam specimen from Mix 5 (Vf =1.0%).

432 I. Löfgren, H. Stang and J. F. Olesen / Journal of Advanced Concrete Technology Vol. 3, No. 3, 423-434, 2005
For the WST method two different specimen sizes were investigated using two different fibre lengths. The result of this study – the fibre orientation, the scatter in the test results, and the determined -w relationships – indicate that the two WST specimen sizes are compara-ble for both the investigated fibre lengths. However, a common recommendation is that the outer dimensions of the specimen should be at least two to three times the fibre length to reduce the wall effects (see Soroushian and Lee, 1990, and Kooiman, 2000). Moreover, it is also beneficial to have a larger fracture surface as this reduces the scatter, which results of a previous investigation (see Löfgren 2004) also indicated. Based on this, it is sug-gested that: (1) the outer dimension of the specimen should be at least 3 times the fibre length and/or 5 times the maximum aggregate size; and (2) that the length of the ligament should be at least 1.5 times the fibre length and/or 5 times the maximum aggregate size.
7. Conclusions and recommendations
The results from this study suggest that the wedge split-ting test method could very well be used as a fracture test for steel fibre-reinforced concrete, and that through in-verse analysis it is possible to determine the -w rela-tionship. Regarding the inverse analyses, the poly-linear
-w relationship, used in the FE-analyses, shows good agreement for all the specimens while the bi-linear -wrelationship gives good agreement for the mixes with 0.5 vol-% fibres. For large crack openings (1.0 to 1.5 mm) both methods produce similar results, whereas the bi-linear relationship is not capable of predicting the first part of the -w relationship (crack openings less than 0.5 mm).
The major factor contributing to the differences and variation in the test results and the determined -w rela-tionships is believed to be related to the variation in the number of fibres across the fracture plane; the coefficient of variance was up to 30% (see Fig. 10(b)). The variation in fibre content makes an exact comparison of the -wrelationships difficult; however, taking this into account it seems as the 3PBT gives slightly higher post-cracking stresses (see Fig. 17 to Fig. 21).
Regarding recommendations on specimen sizes to for the WST-method more research may be needed. How-ever, the findings of this study and previous investiga-tions (see Löfgren, 2004) indicates that for fibres with a length less than 60 mm a 200 mm specimen could be sufficient, while a 150 mm specimen may be used for fibres shorter than 40 mm. These specimen sizes should be comparable to the 3PBT according to RILEM TC 162-TDF (2002a) and the uni-axial tension test according to RILEM TC 162-TDF (2001). Furthermore, when testing steel fibre-reinforced concrete it is recommended to use a guide notch as this corresponds well to the situation in an uni-axial tension test with notches, it also prevents horizontal cracks from occurring for high fibre volume fractions. For the WST method, when deter-
mining a -w relationship up to a crack opening of 2 mm it is recommended that the test should not be ended until a CMOD of at least 7 mm is reached; at this CMOD the crack width at half the specimen height is 2 mm and should thus provide adequate precision a representative result.
In conclusion, the benefits of the WST method are that it does not require any sophisticated testing equipment and standard cube specimens can be used. Moreover, since the specimen is smaller, less concrete is needed to perform a test; four 150 mm cube specimens equal one beam specimen. However, a drawback of the WST method is that quantitative evaluation of the test result is more complicated than for the UTT, which can be inter-preted directly. On the other hand, through inverse analysis it is possible to determine a -w relationship that can be used for structural design. However, difference in fibre orientation between test specimens and structural elements needs to be addressed if a -w relationship obtained from inverse analysis is to be used for structural design.
References ACI Committee 544. (1988). “Measurement of
properties of fiber reinforced concrete.” ACI Materials Journal, 85, 583-593.
ASTM C 1018. (1992). “Standard test method for flexural toughness and first crack strength of fiber-reinforced concrete (Using beam with Third-point loading).” ASTM C 1018-92, ASTM Annual Book of Standards, Vol. 04.02, ASTM Philadelphia, U.S.A., 510-516.
Barr, B., Gettu, R., Al-Oraimi, S. K. A. and Bryars, L. S. (1996). “Toughness measurement – the need to think again.” Cem. & Concrete Composites, 18, 281-297.
Barragán, B. E. (2002). “Failure and toughness of steel fiber reinforced concrete under tension and shear.” Ph.D. Thesis, Universitat Politécnica de Catalunya, Barcelona, Spain.
Bolzon, G., Fedele, R. and Maier, G. (2002). “Parameter identification of a cohesive crack model by Kalman filter.” Comput. Methods Appl. Mech. Eng., 191(2002), 2847-2871.
Brühwiler, E. and Wittmann, F. H. (1990). “The wedge splitting test, a new method of performing stable fracture mechanics test.” Eng. Fracture Mech.,35(1/2/3), 117-125.
Cornelissen, H. A. W., Hordijk, D. A. and Reinhardt, H.W. (1986). “Experimental determination of crack softening characteristics of normal and lightweight concrete.” Heron, 31, 2 (1986).
Dupont, D. (2003). “Modelling and experimental validation of the constitutive law ( - ) and cracking behaviour of fibre reinforced concrete.” Ph.D. Thesis, Katholieke Universiteit Leuven.
Elser, M., Tschegg, E. K., Finger, N. and Stanzl-Tschegg, S. E. (1996). “Fracture Behaviour of Polypropylene-Fibre Reinforced Concrete: an

I. Löfgren, H. Stang and J. F. Olesen / Journal of Advanced Concrete Technology Vol. 3, No. 3, 423-434, 2005 433
experimental investigation.” Comp. Science and Technology, 56, 933-945.
Gopalaratnam, V. S. and Gettu, R. (1995). “On the characterization of flexural toughness in fiber reinforced concretes.” Cem. & Concrete Composites,17, 239-254.
Hillerborg, A., Modeer, M. and Petersson, P. E. (1976). “Analysis of crack formation and crack growth in concrete by means of fracture mechanics and finite elements.” Cem. and Concrete Research, 6, 773-782.
Hillerborg, A. (1980). “Analysis of fracture by means of the fictitious crack model, particularly for fibre reinforced concrete.” The Int. J. Cem. Comp., 2, 177-184.
Kim, J.-K. and Kim, Y.-Y. (1999). “Fatigue crack growth of high-strength concrete in wedge-splitting test.” Cem. and Concrete Research, 29, 705–712.
Kitsutaka, Y. (1995). “Fracture parameters of concrete based on poly-linear approximation analysis of tension softening diagrams.” In: Fracture Mechanics of Concrete Structures, Ed. Wittman, F. H., Aedificatio Publisher, Freiburg, Germany, 199-208.
Kitsutaka, Y. (1997). “Fracture parameters by polylinear tension-softening analysis.” J. of Eng. Mechanics,123(5), 444-450, 1997.
Kooiman, A. G. (2000). “Modelling steel fibre reinforced concrete for structural design.” Ph.D. Thesis, TU Delft 2000.
Krenchel, H. (1975). “Fibre spacing and specific fibre surface.” In: Fibre-Reinforced Cement and Concrete,edited by Neville, The Construction Press, UK, 69-79.
Leite, J. P. de B., Slowik, V. and Mihashi, H. (2004). “Mesolevel models for simulation of fracture behaviour of fibre reinforced concrete.” In:Fibre-Reinforced Concrete, Proceedings of the Sixth International RILEM Symposium, eds. di Prisco et al., 799-808.
Li, V. C., Stang, H. and Krenchel, H. (1993). “Micromechanics of crack bridging in fibre-reinforced concrete.” Materials and Structures, 26(1993), 486-494.
Linsbauer, H. N. and Tschegg, E. K. (1986). “Fracture energy determination of concrete with cube shaped specimens.” Zement und Beton, 31, 38-40.
Löfgren, I. (2004). “The wedge splitting test – a test method for assessment of fracture parameters of FRC?” In: Fracture Mechanics of Concrete Structures,FRAMCOS-5, eds. Li et al. , 1155-1162.
Meda A., Plizzari G. A. and Slowik V. (2001). “Fracture of fiber reinforced concrete slabs on grade.” In:Fracture Mechanics of Concrete Structures,FRAMCOS-4, ed. De Borst et al., 1013-1020.
Nanakorn, P. and Horii, H. (1996). “Back analysis of tension-softening relationship of concrete.” J.Materials, Conc. Struct., Pavements, 32(544), 265-275.
Nemegeer, D., Vanbrabant, J. and Stang, H. (2003). “Brite euram program on steel fibre concret subtask:
durability: Corrosion resistance of cracked fibre reinforced concrete.” In: Test and Design Methods for Steel Fibre Reinforced Concrete – Background and Experiences, Proceedings of the RILEM TC 162-TDF Workshop, eds. Schnütgen and Vandevalle, 1996: 47-66.
Olesen, J. F. (2001). “Fictitious crack propagation in fibre-reinforced concrete beams.” Journal of Eng. Mech., 127(3), 272-280.
Planas, J., Guinea, G. V. and Elices, M. (1999). “Size effect and inverse analysis in concrete fracture.” International Journal of Fracture, 95, 367-378.
Que, N. S. and Tin-Loi, F. (2002). “Numerical evaluation of cohesive fracture parameters from a wedge splitting test.” Engineering Fracture Mechanics, 69, 1269-1286.
RILEM TC-50 FMC (1985). “Determination of the fracture energy of mortar and concrete by means of three-point bend tests on notched beams.” Materials and Structures, 18(106), 285.
RILEM TC 162-TDF (2000). “ – Design Method.” Materials and Structures, 33, 75-81.
RILEM TC 162-TDF (2001). “Test and design methods for steel fibre reinforced concrete. Recommendations for uni-axial tension test.” Materials and Structures,34, 3-6.
RILEM TC 162-TDF (2002a). “Test and design methods for steel fibre reinforced concrete. Bending test – Final Recommendation.” Materials and Structures, 35, 579-582.
RILEM TC 162-TDF (2002b). “Design of steel fibre reinforced concrete using the –w method – principles and applications.” Materials and Structures, 35, 262-278.
Roelfstra, P. E. and Wittmann, F. H. (1986). “Numerical method to link strain softening with failure of concrete.” In: Fracture Toughness and Fracture Energy of Concrete, Elsevier, 163-175.
Rokugo, K., Iwasa, M., Seko, S. and Koyanagi, W. (1989). “Tension-softening diagrams of steel fiber reinforced concrete.” In: Fracture of Concrete and Rock, Recent Developments, Eds. Sha, S. P., Swartz, S.E. and Barr, B., Elsevier, New York, 513-522.
Romualdi, J. P. and Mandel, J. A. (1964). “Tensile strength of concrete affected by uniformly distributed and closely spaced short lengths of wire reinforcement.” ACI J. Proc. 61(6), 657-671.
Soroushian, P. and Lee, C-D. (1990): Distribution and orientation of fibers in steel fiber reinforced concrete, ACI Material Journal, 87(5), 433-439.
Sousa, J. L. A. O, Gettu, R. and Barragán, B. E. (2002). “Obtaining the –w curve from the inverse analysis of the notched beam response.” In: Annex D of Barragán, B. E. (2002). “Failure and toughness of steel fiber reinforced concrete under tension and shear.” Ph.D. Thesis, Universitat Politécnica de Catalunya, Barcelona, Spain.
Stang, H. (1992). “Evaluation of properties of

434 I. Löfgren, H. Stang and J. F. Olesen / Journal of Advanced Concrete Technology Vol. 3, No. 3, 423-434, 2005
cementitious fiber composite materials.” In: High Performance Fibre Reinforced Cement Composites,Vol. 1. Eds. H. W. Reinhardt and A. E. Naaman. E & FN Spon, London, 388–406.
TNO Building and Construction Research (2002). “DIANA Finite Element Analysis User's Manual release 8.1.” Eds. Frits C. de Witte and Gerd-Jan Schreppers. Delft, The Netherlands.
Trunk, B., Schober, G. and Wittmann, F. H. (1999). “Fracture mechanics parameters of autoclaved aerated concrete.” Cem. and Concrete Research, 29, 855-859.
Uchida, Y., Kurihara, N., Rokugo, K. and Koyanagi, W. (1995). “Determination of tension softening diagrams of various kinds of concrete by means of numerical analysis.” In: Fracture Mechanics of Concrete
Structures, FRAMCOS-2, ed. F. H. Wittmann, 17-30. Uchida, Y. and Barr, B. I. G. (1998). “Tension softening
curves of concrete determined from different test specimen geometries, In: Fracture Mechanics of Concrete Structures, FRAMCOS-3, eds. Mihashi, H. and Rokugo, K., Aedificato Publisher, Freiburg, Germany, 387-398.
Østergaard, L. (2003). “Early-Age fracture mechanics and cracking of concrete – Experiments and modelling.” Ph.D thesis, Department of Civil Engineering, Technical University of Denmark.
Østergaard & Olesen (2004). “Comparative study of fracture mechanical test methods for concrete.” In:Fracture Mechanics of Concrete Structures,FRAMCOS-5, eds. Li et al., 455-462.

PAPER VI
Fracture Behaviour of Reinforced FRC Beams- Experiments and Analyses
Ingemar LöfgrenPaper submitted for publication in Structural Concrete, Journal of the fib, October 2005


Fracture Behaviour of Reinforced FRC Beams - Experiments and Analyses 1
Fracture Behaviour of Reinforced FRC Beams
Experiments and Analyses
Paper submitted to Structural Concrete, Journal of the fib, October 2005.
Ingemar Löfgren
Research Assistant
Department of Civil and Environmental Engineering - Structural Engineering
Chalmers University of Technology, Göteborg, Sweden
Abstract
The number of practical applications of fibre-reinforced concrete (FRC) isincreasing, as FRC offers a possibility to greatly simplify in-situ cast concreteconstruction. However, a bottleneck has been the lack of standardised test and designmethods or, if these exist, their treatment has not always been systematic. The mainpurpose of this work was to establish a procedure for structural analysis of flexuralmembers with a combination of conventional reinforcement and steel fibres. Theprocedure includes material testing, inverse analysis (to obtain tensile fractureproperties of the FRC), and analysis based on fracture mechanics.
In full-scale experiments, a total of twelve slab strip elements were tested in flexure;the elements had a geometric reinforcement ratio of 0.075% < ρ < 0.121% incombination with a fibre dosage of either 39 or 59 kg/m3 (a volume fraction of 0.5 or0.75%). The results indicate that FRC can be used in combination with lowreinforcement ratios, and that the approach used for the material testing provides thenecessary properties to perform analyses based on non-linear fracture mechanics.Finally, when comparing the peak loads obtained in the experiments with the resultsfrom the analysis, the agreement was good, with a high correlation (>0.9).

2 Löfgren
Introduction
Steel fibre-reinforced concrete (SFRC) is gaining acceptance as a constructionmaterial and the number of practical applications is growing. In some types ofstructures, such as slabs on grade, foundations, and walls, fibres can replace ordinaryreinforcement completely, while in other structures, such as beams and suspended slabs,fibres can be used in combination with ordinary or pre-stressed reinforcement. In bothcases the potential benefits are due to economic factors as well as to rationalisation andimprovement of the working environment at the construction site. From a structuralviewpoint, the main reason for incorporating fibres is to improve the crackingcharacteristics and structural behaviour through the fibres’ ability to bridge cracks. Thismechanism influences both the serviceability and ultimate limit states. The effects onthe service load behaviour are controlled crack propagation, which primarily reduces thecrack spacing and crack width, and increased flexural stiffness. The effect on thebehaviour in the ultimate limit state is increased load resistance.
However, more importantly, if the reinforcement ratio is low the response maychange and the behaviour observed in conventional reinforced concrete – a load plateauwith a slowly increasing load – changes to a softening behaviour when thereinforcement starts to yield. This is a consequence of deformations being localized to afew cracks, and of the fact that the stress carried by the fibres gradually decreases withincreasing crack opening (described by the stress-crack opening relationship). To beable to predict these changes in structural behaviour and, moreover, if economicalstructural applications are to be developed, an understanding is required of how thefibre-reinforced concrete and the reinforcement (its arrangement and properties)influence the structural behaviour. This necessitates a systematic approach to materialtesting and the interpretation of test results, as well as a consistent framework for thestructural analysis.
Regarding flexural behaviour and crack propagation in members with a combinationof fibres and conventional reinforcement, a number of experimental investigations havebeen undertaken and different analytical and empirical design models have beenproposed to predict the flexural behaviour; some of the more recent studies are e.g.RILEM TC 162-TDF1-4, Pfyl5, Dupont6. However, most investigations have focused onbeams with a relatively high longitudinal geometric reinforcement ratio (ρl > 0.2%).Only a few studies concern slab elements, especially with low reinforcement ratios; seee.g. Barros & Figueiras7, Pfyl5, Døssland8. Moreover, in spite of the obvious benefits ofself-compacting fibre-reinforced concrete, even fewer studies deal with structuralelements made of such concrete; see e.g. Døssland8, Groth9, Grünewald10, and Barros etal.11.
The purpose of the present study is therefore to investigate, by means of experimentsand non-linear fracture mechanics analyses, the flexural behaviour of lightly reinforcedconcrete members made of self-compacting fibre-reinforced concrete. The tests reportedin this paper were carried out on slab strips reinforced with a welded mesh fabric andsteel fibres. The welded mesh provided a longitudinal geometric reinforcement ratio of

Fracture Behaviour of Reinforced FRC Beams - Experiments and Analyses 3
0.075% < ρ < 0.121%, and the fibre volume fractions, Vf, used in this investigationwere of 0.5% and 0.75%, corresponding to 39 and 59 kg/m3. The post-crackingbehaviour of the steel fibre-reinforced concrete was determined through inverse analysison results from wedge-splitting tests (WST).
Experimental programme
The present experimental programme consists of four series of slab strip elements, intotal twelve beams, having identical rectangular cross-sections of 750 × 250 mm2
(width × height) and a span length of 3750 mm. Table 1 shows the programme and itsmain parameters: the amount and type of fibres, the configuration of the welded mesh(bar diameter and the spacing), and the yield strength of the welded mesh. Four differentfibre types were used and their properties are specified in Table 2.
Table 1. Summary of test programme
Specimen Concrete Steel fibres Reinforcement (welded wire mesh)Dosage (%) & Type
(see Table 2)φ – Spacing
[mm]Nom. yield
strengthρ
[%]S1:1 6-150/700 Mix 1 0.25 type 1 & 2 φ 6 - s 150 NPS 700 0.075S1:2 7-150/700 Mix 1 0.25 type 1 & 2 φ 7 - s 150 NPS 700 0.103S1:3 7-150/500 Mix 1 0.25 type 1 & 2 φ 7 - s 150 NPS 500 0.103S1:4 6-100/500 Mix 1 0.25 type 1 & 2 φ 6 - s 100 NPS 500 0.121S2:1 6-150/700 Mix 2 0.5 type 1 & 0.25 type 2 φ 6 - s 150 NPS 700 0.075S2:2 7-150/700 Mix 2 0.5 type 1 & 0.25 type 2 φ 7 - s 150 NPS 700 0.103S2:3 7-150/500 Mix 2 0.5 type 1 & 0.25 type 2 φ 7 - s 150 NPS 500 0.103S2:4 6-100/500 Mix 2 0.5 type 1 & 0.25 type 2 φ 6 - s 100 NPS 500 0.121S3:1 6-150/700 Mix 3 0.5 type 3 & 0.25 type 1 φ 6 - s 150 NPS 700 0.075S3:2 7-150/700 Mix 3 0.5 type 3 & 0.25 type 1 φ 7 - s 150 NPS 700 0.103S4:1 6-150/700 Mix 4 0.25 type 2, 3, & 4 φ 6 - s 150 NPS 700 0.075S4:2 7-150/700 Mix 4 0.25 type 2, 3, & 4 φ 7 - s 150 NPS 700 0.103
Table 2. Fibre specification
Fibre type Supplier Brandname
Aspectratio
Length[mm]
Diameter[mm]
Configuration Strength[MPa]
1: RC 65/35 BN Bekaert Dramix® 64 35 0.55 Hooked ends 1 1002: RC 65/60 BN Bekaert Dramix® 67 60 0.90 Hooked ends 1 1003: RC 80/35 BP Bekaert Dramix® 78 35 0.45 Hooked ends 2 3004: OL 13/0.16 Bekaert 81 13 0.16 Straight
(Brass coated)2 000
The concretes used in this study were all self-compacting fibre-reinforced concreteswith a slump flow of 500 to 550 mm, and they were designed to have good segregationresistance. The mix compositions can be seen in Table 3. All mixes were designed tohave a water-to-filler ratio by volume close to one, w / f ≈ 1.0 (Okamura12), and as filler,all solid material smaller than 0.125 mm was included. The packing density of theaggregate skeleton was 0.76. The fibre dosage and type for each mix can be seen inTable 3. All the concrete was produced by a ready-mix producer (AB Färdig Betong) inbatches of 4 m3 or 2 m3 using a central drum mixer with a capacity of 6 m3.
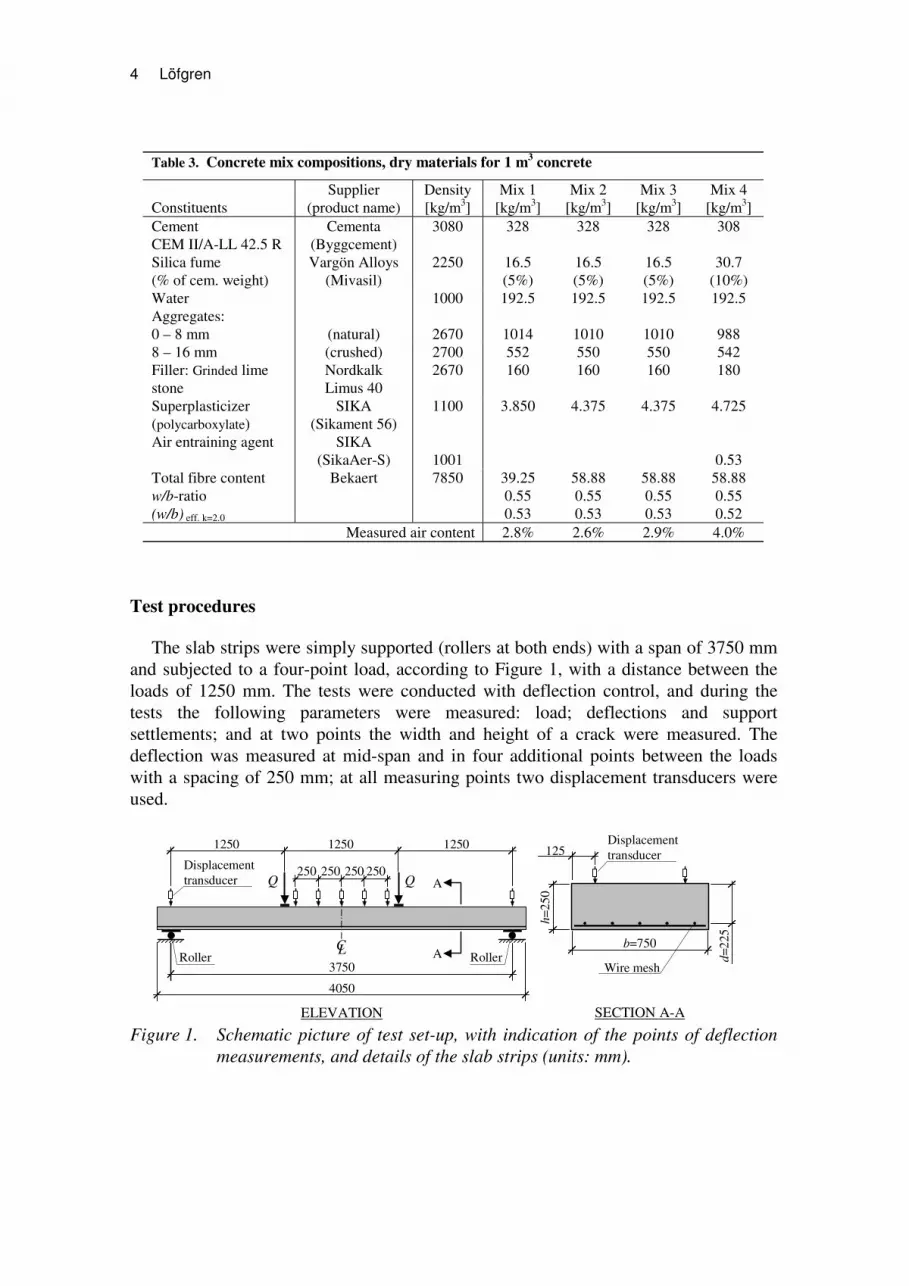
4 Löfgren
Table 3. Concrete mix compositions, dry materials for 1 m3 concrete
ConstituentsSupplier
(product name)Density[kg/m3]
Mix 1[kg/m3]
Mix 2[kg/m3]
Mix 3[kg/m3]
Mix 4[kg/m3]
CementCEM II/A-LL 42.5 R
Cementa(Byggcement)
3080 328 328 328 308
Silica fume(% of cem. weight)
Vargön Alloys(Mivasil)
2250 16.5(5%)
16.5(5%)
16.5(5%)
30.7(10%)
Water 1000 192.5 192.5 192.5 192.5Aggregates:0 – 8 mm (natural) 2670 1014 1010 1010 9888 – 16 mm (crushed) 2700 552 550 550 542Filler: Grinded limestone
NordkalkLimus 40
2670 160 160 160 180
Superplasticizer(polycarboxylate)
SIKA(Sikament 56)
1100 3.850 4.375 4.375 4.725
Air entraining agent SIKA(SikaAer-S) 1001 0.53
Total fibre content Bekaert 7850 39.25 58.88 58.88 58.88w/b-ratio 0.55 0.55 0.55 0.55(w/b) eff. k=2.0 0.53 0.53 0.53 0.52
Measured air content 2.8% 2.6% 2.9% 4.0%
Test procedures
The slab strips were simply supported (rollers at both ends) with a span of 3750 mmand subjected to a four-point load, according to Figure 1, with a distance between theloads of 1250 mm. The tests were conducted with deflection control, and during thetests the following parameters were measured: load; deflections and supportsettlements; and at two points the width and height of a crack were measured. Thedeflection was measured at mid-span and in four additional points between the loadswith a spacing of 250 mm; at all measuring points two displacement transducers wereused.
3750
4050
1250
CL
250 250250 250Displacementtransducer
b=750
h=25
0
d=22
5
SECTION A-AELEVATION
A
A
Wire mesh
125Displacementtransducer
1250 1250
Roller Roller
Figure 1. Schematic picture of test set-up, with indication of the points of deflectionmeasurements, and details of the slab strips (units: mm).

Fracture Behaviour of Reinforced FRC Beams - Experiments and Analyses 5
Materials testing
The tensile fracture behaviour of the fibre-reinforced concretes was determined byconducting wedge-splitting tests (WST) and, through inverse analysis, a stress-crackopening (σ-w) relationship was obtained for each mix. This approach in previousstudies, by the author and other researchers, has been shown to yield reliable results; seeMeda et al.13, Löfgren14, Löfgren et al.15-17. The WST method, originally proposed byLinsbauer and Tschegg18 and later developed by Brühwiler and Wittmann19, is aninteresting test method since it does not require sophisticated test equipment; the test isstable and mechanical testing machines with a constant crosshead displacement can beused. Furthermore, a standard cube specimen is used, but the test can also be performedon core-drilled samples. In Figure 2 the specimen geometry and loading procedure ofthe WST are clarified. The specimen is equipped with a groove (to be able to apply thesplitting load) and a cut-in notch (to ensure the crack propagation). Two steel platenswith roller bearings are placed partly on top of the specimen, partly into the groove, andthrough a wedging device a splitting force, Fsp, is applied. During a test, the verticalload, Fv, is measured with a load cell and the crack mouth opening displacement(CMOD) by a clip gauge. The horizontal splitting force, Fsp, is related to the verticalcompressive load, Fv, through Eq. 1, see RILEM Report 520:
( )( )( )αµαµ
α cot1
tan1
tan2 ⋅+⋅−
⋅⋅
= vsp
FF (1)
where α is the wedge angle (here α = 15 degrees), and µ is the coefficient of friction forthe roller bearing. The coefficient of friction normally varies between 0.1% and 0.5%.In this investigation the specimens had a width and height of 200 mm and a thickness of150 mm.
load cell
steel loadingdevice withroller bearings
wedgingdevice
linear support
Clipgauge
cube specimen200×200×150 mm
actuator
cut-in notch
groove (cast)
Fv / 2
Fsp
Figure 2. Schematic view of the WST equipment and test set-up.

6 Löfgren
Test results
Results from material testing
The mechanical properties of the concretes are listed in Table 4. The compressivestrength was determined at 7 and 28 days on water-cured cube specimens(150×150×150 mm3); it was also measured on cylinder specimens (φ = 150 and h =150). The cylinder specimens were tested at the same time as the full-scale tests wereperformed (at 50 to 55 days) and the cylinders were cured together with the slab stripelements. The modulus of elasticity was determined from three cylinders for each mix;two strain gauges were attached and the strain was measured at a stress level of 0.45×fcc.The tensile strength and the stress-crack opening relationship were determined byconducting inverse analysis using the results from the WST, see Figure 3(b), and can beseen in Table 4 and Figure 3(b); for description of the inverse analysis procedure, seeLöfgren et al.17
Table 4. Properties of the concrete
MixDensity[kg/m3]
fc.cube 7d
[MPa]fc.cube 28d
[MPa]fc.cyl
[MPa]Eci
[GPa]fct
[MPa]Mix 1 2 330 39.2 52.4 55.4 32.7 3.3Mix 2 2 344 41.7 54.3 57.4 33.1 3.3Mix 3 2 384 42.5 54.9 54.3 31.7 3.3Mix 4 2 353 38.6 55.1 55.5 31.3 3.3
0
2 000
4 000
6 000
8 000
10 000
0 2 4 6 8 10
CMOD [mm]
Mix1
Mix2
Mix3
Mix4
Spli
ttin
gL
oad
[N]
0.0
1.0
2.0
3.0
4.0
0.0 0.5 1.0 1.5 2.0
Crack opening [mm]
Ten
sile
stre
ss[M
Pa]
Mix3Mix4
Mix1 Mix2
(a) (b)Figure 3. (a) Result from WST, average splitting load vs. CMOD curves. (b) Stress-
crack opening relationship for WST specimens determined by inverseanalysis.
However, the fibre bridging stress is influenced by the number of fibres crossing thefracture plane and, when the stress-crack opening relationship is determined from amaterial test specimen, it may be necessary to consider any difference in fibreorientation between this specimen and the full-scale specimen. Thus the number offibres was counted in all the WST specimens and an average experimental fibreefficiency factor was determined for each mix; see Figure 4. The experimental fibreefficiency factor, ηb.exp, was calculated as:

Fracture Behaviour of Reinforced FRC Beams - Experiments and Analyses 7
ff
fb AV
N exp.exp. =η (2)
where Nf.exp is the number of fibres per unit area, Vf is the fibre volume fraction, and Af
is the cross-sectional area of a fibre. The experimental fibre efficiency factor, ηb.exp,should be compared to the fibre efficiency factor, ηb, for the slab strips, which dependson whether the fibres have a free (random) or biased orientation. If the fibres areconstrained in all dimensions except one, the orientation becomes 1-D, with ηb.1D = 1;and if the fibres are constrained in one dimension (e.g. a thin slab), a 2-D orientation isachieved, with ηb.2D = 2/π ≈ 0.64. However, if the fibres are free in all three dimensionsa random 3-D orientation is achieved, with ηb.3D = 1/2. As can be seen in Figure 4, in allthe mixes ηb.exp is somewhere between the 2-D and 3-D orientations, which is expectedsince the WST specimens have constraints that cause wall effects and influence thefibre orientation. The dimensions of the slab strip elements (in relation to the length ofthe fibres) are such that the fibre orientation is close to, but slightly higher than, therandom 3-D orientation. For the slab strip elements, the fibre efficiency factor may bedetermined either experimentally (by drilling cores) or by theoretically determining anaverage fibre efficiency factor. Such a theoretical approach was suggested by Dupont &Vandewalle21. Following this approach, the factor was calculated to be ηb.slab = 0.52 andit can be seen in Figure 4 together with the WST specimens. Evidently the WSTspecimens in all mixes had a higher value, thus indicating more fibres being pulled out.To account for the differences in fibre efficiency factor between the WST specimensand the slab strip elements, the stress-crack opening relationship obtained from theinverse analyses (see Figure 3) was reduced with the ratio between the two fibreefficiency factors, according to:
( ) ( )exp.
.exp..
b
slabbbslabb ww
ηη
σσ ⋅= (3)
where σb.exp(w) is the experimental bridging stress from the WST and σb.slab(w) is thebridging stress applicable for the slab strip elements. Note that the tensile strengthshould not be reduced, as this is not influenced by the fibres at the dosages used in thisstudy. The resulting stress-crack opening relationship for the structure is shown inFigure 5. Comparing the different mixes it can be seen that Mix 1, with the low dosage,has the lowest stress level after cracking. Furthermore, when comparing Mixes 2 to 4(which had the same dosage) it can be observed that Mix 2 does not perform as well asthe other two mixes, and that at 0.5 mm the stress descends more rapidly (due to fibrefracture). Comparing Mixes 3 and 4, they have almost the same behaviour but Mix 4 ismore effective for crack openings smaller than 0.2 mm.

8 Löfgren
0.60
0.52 0.52 0.52
0.59
0.63
0.550.52
0.45
0.50
0.55
0.60
0.65
Mix1 Mix2 Mix3 Mix4
Fibr
eef
fici
ency
fact
or[-
] η b.2D = 0.64
η b.3D = 0.5
WST
Slab strip
Figure 4. The average experimental fibre efficiency factor for the WST specimens (atright) compared to the theoretical value for the slab strips (at left) andrandom 2D- and 3D-orientation.
0.0
1.0
2.0
3.0
4.0
0.0 0.5 1.0 1.5 2.0
Crack opening [mm]
Ten
sile
stre
ss[M
Pa]
Mix3
Mix4
Mix1Mix2
Materials test spec. => StructureAdjusted for fibre efficiency
Figure 5. Stress-crack opening relationship for the full-scale elements adjusted toaccount for differences in the fibre efficiency factor for the WST specimensand the slab strip elements.
Results from testing of the slab strip elements
The load vs. deflection and moment vs. crack opening curves obtained from the testsare shown in Figure 6 to Figure 8. The initial response before cracking was almostindependent of the type of mix and type of reinforcement. After the formation of cracks,all the beams exhibited a non-linear load vs. deflection characteristic. The peak-loadand post-peak behaviour was determined by a single crack, which continued to growwhile the other cracks closed. The final failure was caused by rupture of thereinforcement. The higher fibre dosage for Mixes 2 to 4 leads to a stiffer behaviour aftercracking, increased peak-load, and a larger deflection at the peak-load. Comparing thedifferent mixes, Mix 4 resulted in the highest increase in the peak-load but, as the mixcontained some short fibres, it showed a less ductile behaviour than Mix 3. In thefigures it can be observed that the crack width depends on the type and amount ofreinforcement as well as on the efficiency of the fibres. Generally, at the peak-load themeasured crack width was between 0.4 and 0.8 mm. Furthermore, in the tests theprimary flexural cracks had a spacing equal to the welded mesh spacing.

Fracture Behaviour of Reinforced FRC Beams - Experiments and Analyses 9
-60
-40
-20
0
0 10 20 30 40 50
Mid-span deflection [mm]
Loa
d[k
N]
Mix 1
S1:2 7-150/700
S1:4 6-100/500
S1:3 7-150/500
S1:1 6-150/700
0
15
30
45
60
75
90
0.0 0.2 0.4 0.6 0.8 1.0
Crack opening [mm]
Mom
ent[
kNm
]
Mix 1
S1:3 7-150/500
S1:2 7-150/700
(a) (b)Figure 6. Results for specimens from Mix 1: (a) comparison of load vs. deflection
curves and (b) moment vs. crack opening curves.
-60
-40
-20
0
0 10 20 30 40 50
Mid-span deflection [mm]
Loa
d[k
N]
Mix 2
S2:2 7-150/700
S2:3 7-150/500
S2:4 6-100/500
S2:1 6-150/7000
15
30
45
60
75
90
0.0 0.2 0.4 0.6 0.8 1.0
Crack opening [mm]
Mom
ent[
kNm
]
Mix 2
S2:2 7-150/700
S2:3 7-150/500
S2:4 6-100/500
S2:1 6-150/700
(a) (b)Figure 7. Results for specimens from Mix 2: (a) comparison of load vs. deflection
curves and (b) moment vs. crack opening curves.
-60
-40
-20
0
0 10 20 30 40 50
Mid-span deflection [mm]
Loa
d[k
N]
Mix 3 & 4
S4:2 7-150/700
S4:1 6-150/700
S3:1 6-150/700
S3:2 7-150/700
0
15
30
45
60
75
90
0.0 0.2 0.4 0.6 0.8 1.0
Crack opening [mm]
Mom
ent[
kNm
]
Mix 3 & 4
S4:1 6-150/700
S3:1 7-150/700
S4:2 7-150/700
S3:1 6-150/700
(a) (b)Figure 8. Results for specimens from Mixes 3 and 4: (a) comparison of load vs.
deflection curves and (b) moment vs. crack opening curves.

10 Löfgren
Fracture mechanics analyses
To achieve a deeper understanding of the structural and fracture behaviour, non-linear fracture mechanics was applied, using the finite element method. The generalfinite element program Diana was used in all analyses; see TNO22. The concrete wasmodelled with four-node quadrilateral isoparametric plane stress elements, with anelement size of 12.5 mm (20 elements over the height of the section). For thereinforcement, two different approaches were investigated: with truss elements, wherethe interaction between the reinforcement and the concrete was modelled by usingspecial interface elements describing the bond-slip relation; and with the concept of‘embedded’ reinforcement (see TNO22). For the case where the bond-slip wasconsidered, its relationship was chosen according to CEB-FIP MC9023, and confinedconcrete with good bond conditions was assumed. In addition, an analytical approachwas used; see Figure 9 and Löfgren24-25. The analytical model is based on the non-linearhinge model, as proposed by Olesen26 and described by RILEM TC 162-TDF3. Thenon-linear hinge model is based on non-linear fracture mechanics and the fictitiouscrack (or cohesive crack) model, originally proposed by [Hillerborg et al.27]. To be ableto model the behaviour of reinforced FRC members, the model was further developedby Löfgren24-25 to consider: (1) the non-linear stress-strain behaviour in compression;(2) a multi-linear stress-crack opening relationship; and (3) a multi-linear strainhardening relationship for the reinforcement.
N
w
M
s(crack spacing)
M
N
σ c(ε
,y)
y
y 0
σs
d 1
σ c(w
,y)
a
h/2
h/2 a
εc (y)
εs
wCMOD
θ*θ / 2
non-linearsprings
Figure 9. Regional analysis of beam/slab subjected to constant bending moment, thenon-linear hinge and the stress distribution in a cracked section.
Modelling of materials
In all FE analyses of the experiments, a constitutive model based on non-linearfracture mechanics, using a rotating crack model based on total strain, was used for theconcrete; see TNO22. For the case where the bond-slip was considered, the deformationof one crack was smeared over a length corresponding to the size of the localized area(with a width of one or more elements). For the case with ‘embedded’ reinforcement,the deformation of one crack was smeared over the crack spacing obtained in theexperiments. For the tension softening, the multi-linear curves obtained from inverseanalysis were used; see Figure 5. Furthermore, the values used for compressive strengthand modulus of elasticity were according to the values determined on the cylinders (see

Fracture Behaviour of Reinforced FRC Beams - Experiments and Analyses 11
Table 4). The hardening in compression was described by the expression of Thorenfeldtet al.28. The constitutive behaviour of the welded -mesh steel was modelled by the VonMises yield criterion with associated flow and isotropic hardening. The values used forthe different welded meshes are shown in Table 5.
Table 5. Properties of the welded mesh reinforcement
φ – Spacing[mm]
fy,nom
[MPa]fy,act
[MPa]fu
[MPa]εu
[%]Es
[GPa]φ 6 - s 150 700 743 856 6.4 193φ 7 - s 150 700 737 853 7.0 194φ 7 - s 150 500 555 690 5.1 194φ 6 - s 100 500 497 623 6.3 193
Comparison of experiments and analyses
In general, compared with the experimental results, both the FE models and the non-linear hinge model predict a stiffer response, but the peak-load seems to be predictedwith rather good agreement; see Figure 10(a). In the FE analyses, it was difficult tofollow the post-peak response, as multiple cracking and localized crushing made thenumerical solution unstable. The difference in the predicted peak-load between the twomodelling approaches used in the FE analyses was generally small. However, the FEmodel considering the bond-slip worked better for the specimens with the low fibrecontent (Mix 1), where cracks localize with a crack spacing similar to the ones observedin the experiments, than for the specimens with the high fibre content (Mixes 2 to 4),where cracking occurs over a large region and, as a result, the material behaviour in theform of the tensile stress-strain relationship had to be adjusted. On the other hand, theFE model with the ‘embedded’ reinforcement predicted the overall structural behaviourwell for all mixes, but it was not capable of providing a realistic crack pattern (not evenfor the mixes with the low fibre content); see Figure 10(b). In Table 6 a comparison ismade between the peak-loads obtained in the experiments and from analyses. As can beseen, the agreement is rather good with an average ratio between analysis andexperiment close to 1.0; moreover, the correlation is good, 0.99 for the FE analyses and0.94 for the analytical approach.

12 Löfgren
-50
-40
-30
-20
-10
0
0 10 20 30 40
Mid-span deflection [mm]
Loa
d[k
N]
FE bond-slip
FE embeddedreinforcement
Analytical
Experiment
S1:2 7-150/700(Mix1)
Experiment
FE ‘bond-slip’
FE ‘embedded’
(a) (b)Figure 10. Comparison of experiments and analyses for specimen S1:2 7-150/700: (a)
the load vs. deflection curve and (b) crack pattern (the red regions indicatecracked areas).
Table 6. Summary of peak-loads obtained from experiments, FE analyses, and the non-linearhinge model
Specimen MixExperimentQExp [kN]
FEAQFEA [kN]
HingeQHinge [kN]
QFEA/ QExp
[-]QHinge/ QExp
[-]S1:1 6-150/700 Mix 1 -35.3 -36.6 -37.6 1.04 1.06S1:2 7-150/700 Mix 1 -43.9 -44.6 -43.7 1.02 1.00S1:3 7-150/500 Mix 1 -38.9 -39.1 -39.0 1.01 1.00S1:4 6-100/500 Mix 1 -42.3 -41.5 -40.1 0.98 0.95S2:1 6-150/700 Mix 2 -43.0 -43.9 -46.8 1.02 1.09S2:2 7-150/700 Mix 2 -52.8 -55.0 -52.8 1.04 1.00S2:3 7-150/500 Mix 2 -51.5 -51.3 -47.6 1.00 0.92S2:4 6-100/500 Mix 2 -47.8 -49.6 -49.2 1.04 1.03S3:1 6-150/700 Mix 3 -49.2 -50.2 -49.6 1.02 0.95S3:2 7-150/700 Mix 3 -55.1 -55.2 -52.7 1.00 0.96S4:1 6-150/700 Mix 4 -51.9 -52 -54.3 1.00 1.05S4:2 7-150/700 Mix 4 -58.3 -57.6 -60.4 0.99 1.04
Average:CoV [%]:
Correlation:
1.011.93%0.99
1.005.09%0.94
Conclusions
To study the flexural behaviour of lightly reinforced concrete members made of self-compacting fibre-reinforced concrete, a series of tests were carried out and non-linearfracture mechanics were used to simulate the response. Based on the test results and theanalyses, the following conclusions can be drawn:

Fracture Behaviour of Reinforced FRC Beams - Experiments and Analyses 13
1. The combination of welded mesh and steel fibres as reinforcement seemsto be promising as it allows use of reinforcement with smaller diameters (φ≤ 8 mm) than those normally used, which is beneficial since welded meshis available in standardised units for these dimensions and a small bardiameter is also more effective than a large one (see e.g. Fantilli et al.29).
2. A low reinforcement ratio can be used, as long as the fibres provideenough resistance and distribute the cracks.
3. The type of fibre and dosage had a significant effect on the structuralbehaviour, the peak-load, and crack widths.
4. When a welded mesh is used, it influences the crack spacing, which inthese tests resulted in a spacing equal to the mesh spacing.
5. High-strength reinforcement steel can be utilised without impairing theductility or crack widths.
6. The peak-load and post-peak behaviour was determined by a single crack.7. The WST method provided pertinent information regarding the post-
cracking behaviour of the fibre-reinforced concrete.8. By considering the fibre distribution in the material test specimens and the
full-scale elements, it was possible to adjust the stress-crack openingrelationship obtained from the inverse analysis so that it could be used inthe analyses of the full-scale tests with good agreement betweenexperiments and analyses.
Furthermore, using non-linear fracture mechanics, the structural behaviour could bepredicted with good agreement, and both modelling concepts (i.e. FEM and analytical)could be used. The analytical approach is a fast and simple tool that can be used forcross-sectional analyses and the behaviour of simple structures can be determined (e.g.beams). However, input regarding the crack spacing is required. On the other hand, thefinite element model is a more general approach, which is better adapted for morecomplex structures and loading conditions, as it can provide comprehensive resultsregarding the structural behaviour (shear failure, crushing in the compressive zone,long-term deflections, etc.) and the crack spacing may be provided as an output as longas a realistic crack localization is achieved, but not when the embedded reinforcementconcept is used.
Acknowledgements
This research project was financed by a donation from Thomas Concrete Group andcarried out at Chalmers University of Technology.

14 Löfgren
References
1. RILEM Technical Committee 162-TDF: Brite Euram Project nr: BE 97-4163,Test and Design Methods for Steel Fibre Reinforced Concrete, ISBN 90-5682-358-2, June 2002.
2. RILEM Technical Committee 162-TDF: Test and design methods for steel fibrereinforced concrete: σ-ε- Design Method (Chairlady L. Vandewalle), Mat. andStructures 33, March 2000, pp. 75-81.
3. RILEM Technical Committee 162-TDF: Design of steel fibre reinforced concreteusing the σ-w method – principles and applications (Chairlady L. Vandewalle),Mat. and Structures 35, June 2002, pp. 262-278.
4. RILEM Technical Committee 162-TDF: Test and design methods for steel fibrereinforced concrete: Background and Experiences. Proceedings of the RILEM TC162-TDF Workshop, eds. B. Schnütgen and L. Vandewalle. PRO 31, RILEMPublications S.A.R.L., Bagneaux, 2003.
5. Pfyl, T. Tragverhalten von Stahlfaserbeton. Ph.D. dissertation, ETH, Zürich,2003.
6. Dupont D. Modelling and experimental validation of the constitutive law (σ-ε)and cracking behaviour of fibre reinforced concrete. Ph.D. thesis, KatholiekeUniversiteit Leuven, 2003.
7. Barros J.A.O and Figueiras J.A. Flexural Behavior of SFRC: Testing andModeling. Journal of Materials in Civil Engineering, Vol. 11, No. 4, Nov. 1999,pp. 331-339.
8. Døssland, Å. Beams of ordinary and self-compacting concrete reinforced withsteel fibres and ordinary reinforcement tested in moment and shear. In DesignRules for Steel Fibre Reinforced Concrete Structures (ed. T. Kanstad), pp. 99-106, Proc. Nordic miniseminar, Oslo, October 2003. The Norwegian ConcreteAssociation, Oslo.
9. Groth, P. Fibre Reinforced Concrete – Fracture Mechanics Methods Applied onSelf-Compacting Concrete and Energetically Modified Binders. Ph.D. thesis,Luleå University of Technology, 2000.
10. Grünewald, S. Performance-based design of self-compacting fibre reinforcedconcrete. Ph.D. thesis, Delft University, 2004.
11. Barros, J., Pereira, E., Ribeiro, A., Chuna, V., and Antunes, J. Self-compactingsteel fibre reinforced concrete for precasted sandwich panels – experiments andnumerical research. In Fibre Reinforced Concrete from Theory to Practice, eds. S.Ahmad, M. di Prisco, C. Meyer, G.A. Plizzari, S. Shah, International Workshopon Advances in Fiber Reinforced Concrete, Bergamo, Italy, Sept. 24-25, 2004, pp.135-148.
12. Okamura, H. Self-compacting high-performance concrete, Concrete International,Vol. 19 (7), 1997, pp. 50-54.
13. Meda A., Plizzari G.A., and Slowik V. Fracture of fiber reinforced concrete slabson grade. In Fracture Mechanics of Concrete Structures, ed. De Borst et al., 2001.
14. Löfgren, I. The wedge splitting test – a test method for assessment of fractureparameters of FRC? In Fracture Mechanics of Concrete Structures, Vol. 2, ed. Liet al., pp. 1155-1162, Proceedings of FRAMCOS-5, Vail, Colorado, USA, April2004.

Fracture Behaviour of Reinforced FRC Beams - Experiments and Analyses 15
15. Löfgren, I., Stang, H. and Olesen, J.F. Wedge splitting test – a test to determinefracture properties of FRC. In BEFIB 2004 – Sixth RILEM symposium on fibrereinforced concrete (FRC), pp. 379-388, Varenna, Italy, 20-22 September 2004.PRO 39, RILEM Publications S.A.R.L, Bagneaux.
16. Löfgren, I., Olesen J.F., and Flansbjer, M. Application of WST-method forfracture testing of fibre-reinforced concrete. Report 04:13, Department ofStructural Engineering and Mechanics, Chalmers University of Technology,Göteborg 2004, p. 52.
17. Löfgren, I., Stang, H. and Olesen, J.F. Fracture properties of FRC determinedthrough inverse analysis of wedge splitting and three-point bending tests.Accepted for publication in Journal of Advanced Concrete Technology, 2005.
18. Linsbauer, H.N. and Tschegg, E.K. Fracture energy determination of concretewith cube shaped specimens, Zement und Beton 31, 1986, pp. 38-40.
19. Brühwiler, E. and Wittmann, F.H. The wedge splitting test, a new method ofperforming stable fracture mechanics test. Eng. Fracture Mech. 35(1/2/3), 1990,pp. 117-125.
20. RILEM Report 5. Fracture Mechanics Test Methods for Concrete. Edited by S.P.Shah and A. Carpinteri. Chapman and Hall, London, 1991.
21. Dupont, D., and Vandewalle, L. Distribution of steel fibres in rectangularsections. Cement and Concrete Composites, 27, 2005, pp. 391-398.
22. TNO. DIANA Finite Element Analysis, User's Manual, release 8.1. TNO Buildingand Construction Research, 2002.
23. CEB: CEB-FIP Model Code 1990. Bulletin d'Information 213/214, Lausanne,Switzerland, 1993.
24. Löfgren I. Analysis of Flexural Behaviour and Crack Propagation of ReinforcedFRC Members. In Design Rules for Steel Fibre Reinforced Concrete Structures(ed. T. Kanstad), Proc. Nordic miniseminar, Oslo, October 2003. The NorwegianConcrete Association, Oslo, pp. 25-34.
25. Löfgren I. Fibre-reinforced Concrete for Industrial Construction – a fracturemechanics approach to material testing and structural analysis. Ph.D. thesis,Department of Civil and Environmental Engineering, Chalmers University ofTechnology, Göteborg, 2005.
26. Olesen, J. F.: Fictitious crack propagation on fibre-reinforced concrete beams.ASCE, J. of Eng. Mech. 127(3), 2001, pp. 272-280.
27. Hillerborg, A., Modeer, M., and Petersson, P.E. Analysis of Crack Formation andCrack Growth in Concrete by Means of Fracture Mechanics and Finite Elements’.Cem. and Concrete Research 6, 1976, pp. 773-782.
28. Thorenfeld T.E., Tomaszewicz, A., and Jensen, J.J. Mechanical Properties ofHigh-Strength Concrete and Application in Design. Utilization of High StrengthConcrete, Symposium in Stavanger, Norway, 1987. Tapir N-7034 Trondheim.
29. Fantilli, A.P., Ferretti, D., and Rosati, G. Effect of Bar Diameter on the Behaviorof Lightly Reinforced Concrete Beams. Journal of Materials in Civil Engineering,Vol. 17, No. 1, February 1, 2005, pp. 10-18.


Licentiate Theses and Doctoral Theses, Concrete Structures,
Chalmers University of Technology, 1990- 90:1 Stig Öberg: Post Tensioned Shear Reinforcement in Rectangular RC Beams.
Publication 90:1. Göteborg, April 1990. 603 pp. (No. 1021). Doctoral Thesis.
90:2 Johan Hedin: Långtidsegenskaper hos samverkanskonstruktioner av stål och betong (Long Time Behaviour of Composite Steel Concrete Structures).Publication 90:2. Göteborg, August 1990. 53 pp. (No. 1079). Licentiate Thesis.
92:1 Björn Engström: Ductility of Tie Connections in Precast Structures. Publication 92:1. Göteborg, October 1992. 368 pp. (Nos. 936, 999, 1023, 1052). Doctoral Thesis.
93:1 Mario Plos: Shear Behaviour in Concrete Bridges - Full Scale Shear Test. Fracture Mechanics Analyses and Evaluation of Code Model. Publication 93:1. Göteborg, April 1993. 70 pp. (Nos. 1088, 1084). Licentiate Thesis.
93:2 Marianne Grauers: Composite Columns of Hollow Steel Sections Filled with High Strength Concrete. Publication 93:2. Göteborg, June 1993. 140 pp. (No. 1077). Doctoral Thesis.
93:4 Li An: Load Bearing Capacity and Behaviour of Composite Slabs with Profiled Steel Sheet. Publication 93:4. Göteborg, September 1993. 134 pp. (No. 1075). Doctoral Thesis.
93:5 Magnus Åkesson: Fracture Mechanics Analysis of the Transmission in Zone in Prestressed Hollow Core Slabs. Publication 93:5. Göteborg, November, 1993. 64 pp. (No 1112). Licentiate Thesis.
95:1 Christina Claeson: Behavior of Reinforced High Strength Concrete Columns.Publication 95:1. Göteborg, June 1995. 54 pp. (No. 1105). Licentiate Thesis.
95:2 Karin Lundgren: Slender Precast Systems with Load-Bearing Facades.Publication 95:2. Göteborg, November 1995. 60 pp. (No. 1098). Licentiate Thesis.
95:3 Mario Plos: Application of Fracture Mechanics to Concrete Bridges. Finite Element Analysis and Experiments. Publication 95:3. Göteborg, November 1995. 127 pp. (Nos. 1067, 1084, 1088, 1106). Doctoral Thesis.
96:1 Morgan Johansson: New Reinforcement Detailing in Concrete Frame Corners of Civil Shelters. Non-linear Finite Element Analyses and Experiments. Publication 96:1. Göteborg, November 1996. 77 pp. (No. 1106). Licentiate Thesis.
96:2 Magnus Åkesson: Implementation and Application of Fracture Mechanics Models for Concrete Structures. Publication 96:2. Göteborg, November 1996. 159 pp. (No. 1112). Doctoral Thesis.

97:1 Jonas Magnusson: Bond and Anchorage of Deformed Bars in High-Strength Concrete. Publication 97:1. Göteborg, November 1997. 234 pp. (No. 1113). Licentiate Thesis.
98:1 Christina Claeson: Structural Behavior of Reinforced High-Strength Concrete Columns. Publication 98:1. Göteborg 1998. 92 pp + I-IV, 75 pp. (No. 1105). Doctoral Thesis.
99:1 Karin Lundgren: Three-Dimensional Modelling of Bond in Reinforced Concrete. Theoretical Model, Experiments and Applications. Publication 99:1. Göteborg, November 1999. 129 pp. (No. 37). Doctoral Thesis.
00:1 Jonas Magnusson: Bond and Anchorage of Ribbed Bars in High-Strength Concrete. Publication 00:1. Göteborg, February 2000. 300 pp. (No. 1113). Doctoral Thesis.
00:2 Morgan Johansson: Structural Behaviour in Concrete Frame Corners of Civil Defence Shelters. Publication 00:2. Göteborg, March 2000. 220 pp. (No. 1106). Doctoral Thesis.
00:3 Rikard Gustavsson: Static and Dynamic Finite Element Analyses of Concrete Sleepers. Publication 00:3. Göteborg, March 2000. 58 pp. (No. 41). Licentiate Thesis.
00:4 Mathias Johansson: Structural Behaviour of Circular Steel-Concrete Columns. Non-linear Finite Element Analyses and Experiments. Publication 00:4. Göteborg, March 2000. 64 pp. (No. 48). Licentiate Thesis.
01:3 Gunnar Holmberg: Fatigue of Concrete Piles of High Strength Concrete Exposed to Impact Load. Publication 01:3. Göteborg, August 2001. 69 pp. (No. 55). Licentiate Thesis.
02:1 Peter Harryson: Industrial Bridge Construction – merging developments of process, productivity and products with technical solutions. Publication 02:1. Göteborg, January 2002. 90 pp. (No. 34). Licentiate Thesis.
02:2 Ingemar Löfgren: In-situ concrete building systems – developments for industrial constructions. Publication 02:2. Göteborg, March 2002. 125 pp. (No. 35). Licentiate Thesis.
02:4 Joosef Leppänen: Dynamic Behaviour of Concrete Structures subjected to Blast and Fragment Impacts. Publication 02:4. Göteborg, April 2002. 78 pp. (No. 31). Licentiate Thesis.
02:5 Peter Grassl: Constitutive Modelling of Concrete in Compression. Publication 02:5. Göteborg, May 2002. 95 pp. (No. 37). Licentiate Thesis.

02:6 Rikard Gustavson: Structural Behaviour of Concrete Railway Sleepers.Publication 02:6. Göteborg, September 2002. 180 pp. (No. 32). Doctoral Thesis.
02:8 Mathias Johansson: Composite Action and Confinement Effects in Tubular Steel-Concrete Columns. Publication 02:8. Göteborg, November 2002. 173 pp. (No. 33). Doctoral Thesis.
03:1 Per-Ola Svahn: Impact-Loaded Concrete Piles – Theoretical and experimental study of load effects and capacity. Publication 03:1. Göteborg, May 2002. 99 pp. (No. 38). Licentiate Thesis.
04:3 Peter Grassl: Plasticity and Damage Mechanics for Modeling Concrete Failure.Publication 04:3. Göteborg, September 2004. 159 pp. Doctoral Thesis.
04:4 Joosef Leppänen: Concrete Structures Subjected to Fragment Impacts – Dynamic Behaviour and Material Modeling. Publication 04:4, Ny serie nr 2193. Göteborg, 2004. 127 pp. Doctoral Thesis.
2005 Helén Broo: Shear and Torsion Interaction in Prestressed Hollow Core Slabs.Lic 2005:2. Göteborg 2005. 83 pp. Licentiate Thesis.
2005 Per-Ola Svahn: Dynamic Behaviour of Reinforced Concrete Structures: Analyses with a Strong Discontinuity Approach. Ny serie nr 2366. Göteborg 2005. 159 pp. Doctoral Thesis.


