Embed Size (px)
Citation preview
Mindanao Journal of Science and Technology Vol.16 (2018) 171-186
Feed Water Heaters Performance Indicators
and Characteristics on the 405MW
Coal-Thermal Power Plant
Jameson R. Almedilla1*, Leonel L. Pabilona1 and
Eliseo P. Villanueva2
1College of Engineering and Architecture
University of Science and Technology of Southern Philippines – Cagayan de Oro
Cagayan de Oro City, 9000 Philippines *[email protected]
2College of Engineering
Mindanao State University – Iligan Institute of Technology
Iligan City, 9200 Philippines
Date received: August 1, 2018 Revision accepted: October 24, 2018
Abstract
The coal-fired thermal power plant with a capacity of 3x135 MW gross or a total of
405 MW is composed of two high-pressure, one deaerator-heater and four low-
pressure feed water heaters arranged in cascading stages on each of the three units.
The objectives of the study are to determine the performance of these feed water
heaters, both HP and LP, using the American Society of Mechanical Engineers
Performance Test Code (ASME PTC) 12.1 and Heat Exchange Institute (HEI) Inc.
procedures with engineering report and comparative discussions. Performance
indicators such as terminal temperature difference (TTD), drain cooler approach
(DCA) and temperature rise (TR) across heater were used to determine each unit’s
feed water heater system performance. The results showed that the high-pressure feed
water heaters (HPH) were significantly more efficient compared to the low-pressure
feed water heaters (LPH). An alarming off-design condition was encountered by the
last stage heater, LPH7, in unit one where it showed a lower TR of around 2.95°C and
the highest TTD of 49.86ºC. Thus, the results of the test showed that unit one and two
has some problem on its last stage heater while unit three was performing better than
the other two units. Based on the evaluation of the results, the last stage heaters were
recommended to be evaluated for further analysis to prevent failure of equipment and
these need necessary improvements. Generally, heaters are part of power station for
the increase of cycle efficiency.
Keywords: terminal temperature difference, drain cooler approach, temperature rise
J. R. Almedilla et al. / Mindanao Journal of Science and Technology Vol. 16 (2018) 171-186
172
1. Introduction
The determination of the performance on feed water heaters is an essential
milestone of the thermal power plant. These heaters performance are used for
evaluation of the unit’s overall efficiency as a reheat-regenerative Rankine
cycle system. The regenerative Rankine system is accomplished by heating
the compressed liquid at a number of finite heaters by steam, which is bled
from the turbine at selected stages (Kiameh, 2002). Since the temperature of
feed water with pre-heating stages is higher than feed water without heaters,
the efficiency is higher with regeneration (Nag, 1981). Thermal power plants
were involved in these complex systems in order to improve the overall
efficiency with an increased power output for the least input. By adding the
feed water heater in the power plant cycle, the overall efficiency of the power
plant is increased by around 2.4% (Devandiran et al., 2016). The ASME
assembled the PTC 12.1 closed feed water heaters to provide procedures,
directions, and guidance for determining the performance of a closed feed
water heater (ASME PTC 12.1, 1978). Some of the indicators used to
determine the performance were TTD and DCA. The TR across heater can
also be used as performance indicators as employed in the studies of Kumar
(2014), Kushawaha (2015), and Bode (2016) to elaborate discussions and
evaluations. These indicators are important tools for evaluation to monitor the
condition of the heater before serious breakdown and failure occur. Several
researchers previously mentioned have used this method in order to determine
the status of a heater which was quite effective.
This study focused on performance monitoring and determination on the
3x135MW CFPP feed water heater system using ASME PTC 12.1 codes. The
performance indications such as TTD and DCA were calculated based on the
results of the tests. The TR will was included for further analysis and
interpretation of the results. Data needed such as inlet and outlet feed water
temperatures, extraction steam pressure, and heater drain temperature can be
recorded from the data acquisition in the control room station. The extraction
steam saturation temperature was plotted on the software computer-aided
thermodynamic in Table 3. Since the three generating units were built
identically, there were no modifications and alterations on the design related
to the feed water heater system during the test.
The feed water temperature entering the boiler, on a basic Rankine cycle, is
relatively low. Thus, it will increase the boiler heat addition and lower the
cycle efficiency. One possibility to prevent this shortcoming is to increase the
feed water inlet temperature to the boiler. A practical regeneration process
J. R. Almedilla et al. / Mindanao Journal of Science and Technology Vol. 16 (2018) 171-186
173
design is to bleed steam from the turbine (extraction steam) at various points
to pre-heat the feed water through a heater before admitting it to the boiler at
a series of stages (Cengel and Boles, 2008). It does not only increase the cycle
efficiency but it also de-aerates the non-condensable gasses out of the system.
Aside from the classification of either high-pressure or low-pressure, there are
two main types of feed water heater: closed-type and open-type. The
increasing number of heater stages will also increase the efficiency, but it is
not economical to have a large number of heaters just to increase its efficiency.
Thus, based on a techno-economic study, the numbers of heaters generally
used on a large capacity is around six to seven heaters (C. Kumar and D.
Kumar, 2014).
The most commonly used feed water heater in a thermal power plant is the
closed-type. It is a simple shell-and-tube type heat exchanger arranged either
horizontally or vertically. The feed water passes through the tubes of the heat
exchanger while the bled steam transfers energy on the shell side. Closed-type
heaters are very similar to the condensers except that they operate at higher
pressures (Kiameh, 2002). Considering the heat balance design on the heater,
the closed-type heater performance can be monitored using the TTD and DCA
methods, as well as TR, to evaluate its condition. No real law says that the
output feed water must be saturated water, but generally, it is, and this is
specified in the heater heat balance as "TTD = 0" on ideal assumptions (Black
and Veatch, 1996). Accordingly, a too low TTD is too good to be true while a
too high TTD reduced cycle efficiency.
The open-type feed water heater can also be called contact-type heater where
both bled steam and the incoming feed water are mixed in the heater. This type
of heater uses the heat exchanger device known as deaerator. The presence of
dissolved and non-condensable gases (e.g., oxygen, carbon dioxide and etc.)
in the water makes it corrosive, as they react with the metal to form iron oxide
(Nag, 1981) and must be necessarily removed through mechanical scavenging
at the deaerator or chemical scavenging through chemical injections. This type
of heater is not applicable to the ASME PTC 12.1 guidelines and thus, can
only be evaluated by the TR across the heater method.
The two last stage feed water heaters (LPH6 and LPH7) have been observed
operating on an abnormal manner by the operations and maintenance group.
The problem showed an unusual opening of the last stage heater emergency
drain valve which damped water to the condenser. This condition might be an
indication of off-design behavior and it could have bad effects on the unit in
the future. Off-design condition only exists when the unit power output is
J. R. Almedilla et al. / Mindanao Journal of Science and Technology Vol. 16 (2018) 171-186
174
minimum, low or equipment deration where these conditions have not met the
required design values (Kushawaha and Koshti, 2015). This paper is an
evaluation on the performance of the feed water heaters on a 3x135 MW coal-
fired power plant (CFPP). The study aimed to determine the performance of
the feed water heater system using the codes recommended by the ASME PTC
12.1 and HEI Inc. standards for heat exchangers, using performance indicators
as tools. Comparative analysis is also discussed on the later part of the results
of the test since all units were identical.
The study is an important tool for engineers and frontline personnel to study
the condition of the feed water heaters. The results of the study could provide
knowledge and information for the key personnel of the plant and will allow
them to interpret the condition of the feed water heaters before breakdown.
The primary purpose of the study is to detect abnormal and costly performance
trends due to tube leakage, tube fouling, air blanketing and among others. The
effects of these anticipated operating variations effectively mask the
performance-robbing phenomena (e.g., tube sheet leakage) sought in such
tests (Klink, 1989). Klink (1989) described a method for normalizing out the
effect of known operating variations. This study will help operators,
maintenance groups, and concerned people to evaluate the condition which
the unit experiences during off-design behavior.
2. Methodology
2.1 System Setup Description
The experiment involved the determination and monitoring of the
performance of the feed water heater system at each of the three units of a
coal-fired thermal power plant built in 2016 at Villanueva, Misamis Oriental,
Philippines. The gross capacity of each of the three-units is around 135 MW
and identical in design with common auxiliary systems. Performance
indicators were based from the ASME PTC 12.1 and HEI Inc. standards with
TR as an additional indicator for further analysis of the heater condition.
Comparative analysis discussions were also elaborated to investigate the
problem involving at the last stage heater.
The set-up shown in Figure 1 is a schematic and process flow with details of
instruments and location points. The feed water heater system is composed of
two high-pressure heater closed-type, one deaerator heater open-type, and four
low-pressure heater closed-type. They are arranged in a series of stages to
J. R. Almedilla et al. / Mindanao Journal of Science and Technology Vol. 16 (2018) 171-186
175
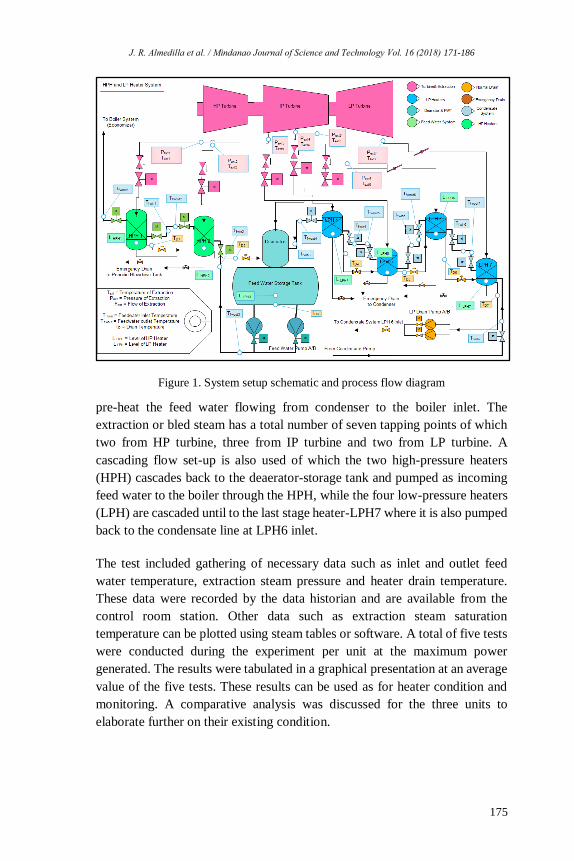
Figure 1. System setup schematic and process flow diagram
pre-heat the feed water flowing from condenser to the boiler inlet. The
extraction or bled steam has a total number of seven tapping points of which
two from HP turbine, three from IP turbine and two from LP turbine. A
cascading flow set-up is also used of which the two high-pressure heaters
(HPH) cascades back to the deaerator-storage tank and pumped as incoming
feed water to the boiler through the HPH, while the four low-pressure heaters
(LPH) are cascaded until to the last stage heater-LPH7 where it is also pumped
back to the condensate line at LPH6 inlet.
The test included gathering of necessary data such as inlet and outlet feed
water temperature, extraction steam pressure and heater drain temperature.
These data were recorded by the data historian and are available from the
control room station. Other data such as extraction steam saturation
temperature can be plotted using steam tables or software. A total of five tests
were conducted during the experiment per unit at the maximum power
generated. The results were tabulated in a graphical presentation at an average
value of the five tests. These results can be used as for heater condition and
monitoring. A comparative analysis was discussed for the three units to
elaborate further on their existing condition.
J. R. Almedilla et al. / Mindanao Journal of Science and Technology Vol. 16 (2018) 171-186
176
2.2 Assumption of the Current Study
The system was assumed to be carried out in a steady flow condition applying
the Steady-State Steady-Flow (SSSF) thermodynamic equations on each
process neglecting kinetic and potential energy (Bode and Gore, 2016). There
is negligible heat transfer between the heater and its pipeline to the
surroundings since both are assumed to be well insulated. There are no
alterations on the design relating to the feed water heater system during the
test and assumed to be identical for the three units. No air-in leakage in the
deaerator device which could affect temperature distribution since it operates
above atmospheric conditions. The various operating conditions affect factors
of the equation for the rate of condensation were overall heat transfer
coefficient, tube surface area, and mean temperature difference across heater.
If any of these parameters changes, the rate of heat transfer from the steam
changes (Kumar, 2017).
2.3 Performance Indicators and Analysis of Data
2.3.1 Performance Indicators
The performance indicators used in determining the condition of the close-
type feed water heater was based from the guidelines on ASME PTC 12.1.
These indicators were used for evaluation and report on the current status of
each of the feed water heaters, as well as a comparison of the units. There are
several studies that used these procedures to predict condition and problem
occurring at the heater. Kumar and Kumar (2014) concluded in their study on
performance analysis of the regenerative feed heating in a steam power plant
that the efficiency of the heater could relatively affect the cycle efficiency.
Other studies included the causes of poor performance of a heater and off-
design behavior causes (Bode and Gore, 2016; Kushwaha and Koshti, 2015).
The first performance indicator mentioned by the code was the TTD. It is used
to provide feedback on the heater’s performance relative to heat transfer. It is
described by the code as the difference in saturation temperature of steam to
the outlet temperature of the feed water heater (ASME PTC 12.1). An
increasing TTD indicates the reduction in heat transfer while a decreasing
TTD denotes improvement (Kushwaha & Koshti, 2015).
TTD=Tsat - Tfwout (1)
The next performance indicator was the DCA. It is used to determine heater
water level based on the temperature difference. It is described as the
J. R. Almedilla et al. / Mindanao Journal of Science and Technology Vol. 16 (2018) 171-186
177
difference between a heater drain outlet temperature to the inlet feed water
heater temperature (ASME PTC 12.1). The increase in DCA of a heater could
mean a flashing or heating at the drain cooler zone of the heater which is
designed to be liquid only. This could significantly damage the area in the
drain zone of a heater.
DCA =Td - Tfwin (2)
The other performance indicator which can be useful for analysis is the TR on
across heater. It is described as the difference between outlet and inlet feed
water heater temperature (EPRI, 2015). The value for the TR must be more
than zero since it indicates a transfer of heat from steam to the feed water by
the heater.
TR =Tfwout - Tfwin (3)
where:
Tsat = Steam saturation temperature
Tfwout = Feed water outlet temperature
Tfwin = Feed water inlet temperature
T(d) = Heater drain temperature
The performance indicators mentioned, TTD, DCA, and DCA, were used for
the engineering report and discussions of the performance of each heater per
unit. The peculiar behavior on the last stage heater observed could now
determine the possible causes and prediction of a problem that could occur.
2.3.2 Designed Performance
The ideal performance indicator can be determined based on the designed heat
balance of the system. Table 1 below shows the designed performance values
for TTD, DCA, and TR of the heaters according to the theoretically designed
heat balance. These can be used as a basis for comparing the three unit's feed
water heater performance.
Table 1. Design Heater Performance
Heater TTD (°C) DCA (°C) TR (°C)
HPH1 0.2 5 22.2
HPH2 0 8.2 41.7 DEA 38.6
LPH4 2.8 5 29
LPH5 2.8 5 34.3
LPH6 2.8 5 22.4
LPH7 2.2 23.2
J. R. Almedilla et al. / Mindanao Journal of Science and Technology Vol. 16 (2018) 171-186
178
The actual TTD is generally around 2.78°C (for Metric units) or 5°F (for
English units), but can be as high as 10°F, for English units (Black & Veatch,
1996). These general TTD values mentioned were the acceptable normal range
based from the zero value design at the above table. A too low TTD, lower
than 2.78°C to zero, is too good to be true. While a too high TTD, above 2.8°C,
can reduce the overall efficiency.
The DCA for the last stage heater-LPH7 cannot be determined but is predicted
to be higher than normal since it is the last stage heater and can be serve as a
sacrificing equipment. The DCA is generally around 10°F but may be as high
as 20°F (Black & Veatch, 1996). It is important to note that both TTD and
DCA were results of difference in temperatures making its conversion fixed
on both units.
The design TR of each heater is expected to be at least more than 20°C and
the HPH2 has the highest temperature rise of around 41.7°C. A properly
performing heater should meet the manufacturer’s design specifications. This
indicator can also be a useful tool for determining the condition and
performance of the feed water heater although it may not have been included
in the PTC 12.1 procedures. The rise in temperature in the feed water can
increase the cycle efficiency of the system, thereby reducing the fuel
consumption and saving expenses on raw material fuel. An increase in feed
water temperature of 5°C can decrease fuel consumption by approximately 1
%.
3. Results and Discussion
3.1 Performance Indicator Results on Heaters
The performance test results shown on each figure are the average values of
the five tests during the experiment. The generation outputs of units one, two
and three have average values of 135.219MW, 135.082MW & 135.087MW,
respectively, during the tests. On each of the figures below, every heater was
arranged as unit 1, 2 and 3 with a variety of near-color representation. The
results showed that some values were near its designed values while some
have unusual results.
The average of the five test results in unit one was summarized and tabulated
in Table 2. It shows that high-pressure heaters TTD with ranges of 4 °C to 6°C
were comparatively lower than the low-pressure heaters TTD of averaging
J. R. Almedilla et al. / Mindanao Journal of Science and Technology Vol. 16 (2018) 171-186
179
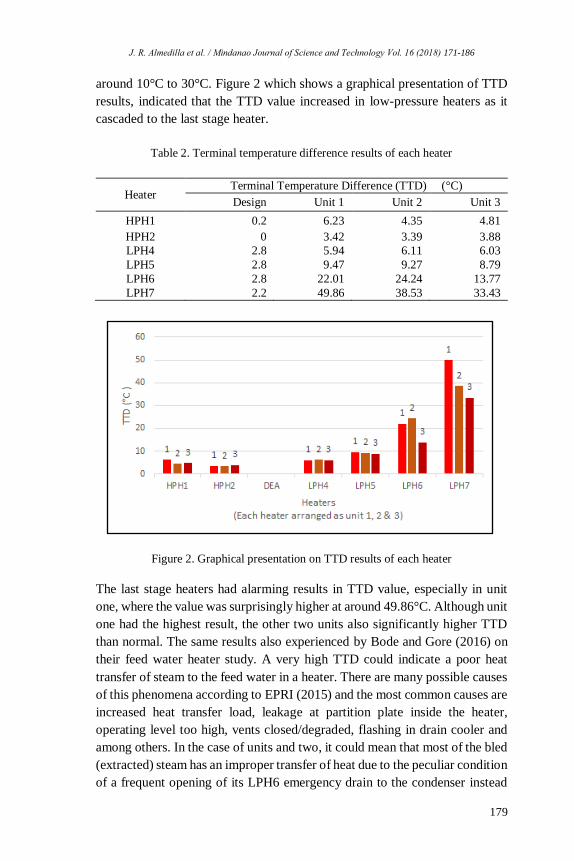
around 10°C to 30°C. Figure 2 which shows a graphical presentation of TTD
results, indicated that the TTD value increased in low-pressure heaters as it
cascaded to the last stage heater.
Table 2. Terminal temperature difference results of each heater
Heater Terminal Temperature Difference (TTD) (°C)
Design Unit 1 Unit 2 Unit 3
HPH1 0.2 6.23 4.35 4.81
HPH2 0 3.42 3.39 3.88
LPH4 2.8 5.94 6.11 6.03
LPH5 2.8 9.47 9.27 8.79
LPH6 2.8 22.01 24.24 13.77
LPH7 2.2 49.86 38.53 33.43
Figure 2. Graphical presentation on TTD results of each heater
The last stage heaters had alarming results in TTD value, especially in unit
one, where the value was surprisingly higher at around 49.86°C. Although unit
one had the highest result, the other two units also significantly higher TTD
than normal. The same results also experienced by Bode and Gore (2016) on
their feed water heater study. A very high TTD could indicate a poor heat
transfer of steam to the feed water in a heater. There are many possible causes
of this phenomena according to EPRI (2015) and the most common causes are
increased heat transfer load, leakage at partition plate inside the heater,
operating level too high, vents closed/degraded, flashing in drain cooler and
among others. In the case of units and two, it could mean that most of the bled
(extracted) steam has an improper transfer of heat due to the peculiar condition
of a frequent opening of its LPH6 emergency drain to the condenser instead
J. R. Almedilla et al. / Mindanao Journal of Science and Technology Vol. 16 (2018) 171-186
180
back to LPH7 making it off-design. The heat energy content in that steam was
dumped back and absorbed by the condenser. As a result, the TTD was
increased. This is not a normal and efficient operation of a feed water heater
and it may deteriorate the internal parts of the heater that could cause a
breakdown of the equipment.
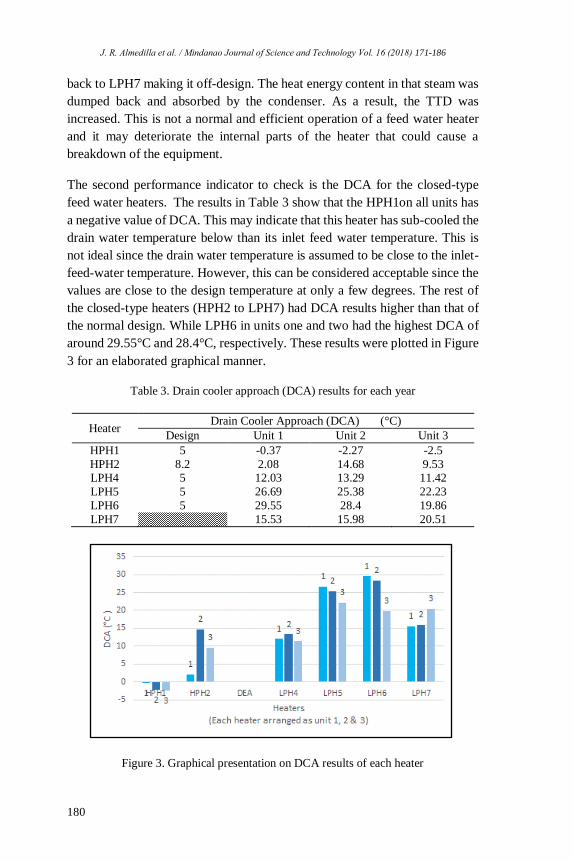
The second performance indicator to check is the DCA for the closed-type
feed water heaters. The results in Table 3 show that the HPH1on all units has
a negative value of DCA. This may indicate that this heater has sub-cooled the
drain water temperature below than its inlet feed water temperature. This is
not ideal since the drain water temperature is assumed to be close to the inlet-
feed-water temperature. However, this can be considered acceptable since the
values are close to the design temperature at only a few degrees. The rest of
the closed-type heaters (HPH2 to LPH7) had DCA results higher than that of
the normal design. While LPH6 in units one and two had the highest DCA of
around 29.55°C and 28.4°C, respectively. These results were plotted in Figure
3 for an elaborated graphical manner.
Table 3. Drain cooler approach (DCA) results for each year
Heater Drain Cooler Approach (DCA) (°C)
Design Unit 1 Unit 2 Unit 3
HPH1 5 -0.37 -2.27 -2.5
HPH2 8.2 2.08 14.68 9.53 LPH4 5 12.03 13.29 11.42
LPH5 5 26.69 25.38 22.23
LPH6 5 29.55 28.4 19.86
LPH7 15.53 15.98 20.51
Figure 3. Graphical presentation on DCA results of each heater
J. R. Almedilla et al. / Mindanao Journal of Science and Technology Vol. 16 (2018) 171-186
181
An improper level of DCA may indicate an abno rmal operating condition in
the drain cooler zoned of a heater according to the importance of proper level
control of feed water heaters (Yokell et al., 2014). The high results of DCA in
a heater mean a potential for flashing in the drain zone (sub-cooling zone) in
a heater. As mentioned previously, DCA is related to the heater water level.
The high results of DCA may indicate that the heater drain has high
temperature and may cause a steaming or flashing formation on this area
provided that the level may not be properly adjusted to its correct range. It is
important to remember that this zone is specifically designed for a water-to-
water closed exchanger, thus, any admission of flashed steam in this zone can
result to potential damage. According to study, flashing phenomenon is
typically more problematic in low-pressure heaters than high-pressure heaters,
although both are susceptible (Yokell et al., 2014). Correct water level also
influences the DCA and flashing on the heater. A heater manufacturer's
recommendation must be followed throughout the operation. In case the heater
is exposed to too high water level, emergency drains allow the passage of
water damping it to the condenser to prevent water ingress to the turbine.
Going back to the TTD results in last stage heaters of units one and two, the
DCA for the LPH6 shows high results and may indicate that the frequent
opening of emergency drain valves is a result of too high water level because
of flashing.
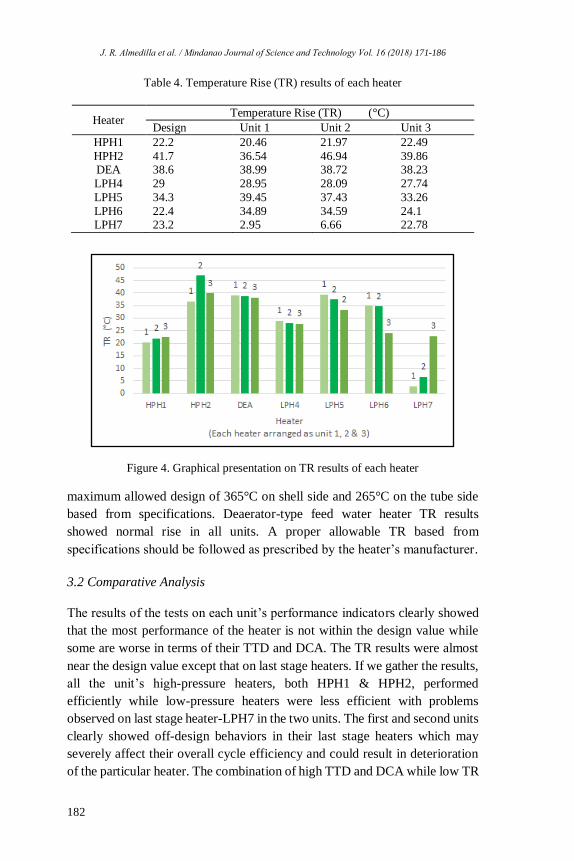
The last performance indicators to monitor in a feed water heater is the TR
across the heater. Table 4 shows the average summarized results of the five
tests during the experiment and a graphical presentation from Figure 4 below.
It showed a normal rise on the last stage heater of unit three but a poor TR on
the other two units. If we recall the TTD results previously, unit one had the
highest TTD and as expected to have the lowest TR of only an increase of
2.95°C only. It clearly shows that the first unit last stage heater-LPH7, as well
as to the second unit, has problems on the operation of its heaters and
experiencing an off-design condition even a maximum load output of 135MW
where it was designed to have low TTD and high TR according to heat
balance. The rest of the heaters (HPH1 to LPH6) had TR result values near its
design. Too much TR could also stress out internal parts and may lead to
damage the components. The highest TR results were found in unit two
(HPH2) where it reached 46.94°C. This number exceeds its design value. In
this condition, an exceeding TR value can be considerably normal provided
that the heater feed water temperature on its outlet is just below its maximum
allowable temperature by the manufacturer. In the HPH2 case, it has a
J. R. Almedilla et al. / Mindanao Journal of Science and Technology Vol. 16 (2018) 171-186
182
Table 4. Temperature Rise (TR) results of each heater
Heater Temperature Rise (TR) (°C)
Design Unit 1 Unit 2 Unit 3
HPH1 22.2 20.46 21.97 22.49
HPH2 41.7 36.54 46.94 39.86 DEA 38.6 38.99 38.72 38.23
LPH4 29 28.95 28.09 27.74
LPH5 34.3 39.45 37.43 33.26
LPH6 22.4 34.89 34.59 24.1 LPH7 23.2 2.95 6.66 22.78
Figure 4. Graphical presentation on TR results of each heater
maximum allowed design of 365°C on shell side and 265°C on the tube side
based from specifications. Deaerator-type feed water heater TR results
showed normal rise in all units. A proper allowable TR based from
specifications should be followed as prescribed by the heater’s manufacturer.
3.2 Comparative Analysis
The results of the tests on each unit’s performance indicators clearly showed
that the most performance of the heater is not within the design value while
some are worse in terms of their TTD and DCA. The TR results were almost
near the design value except that on last stage heaters. If we gather the results,
all the unit’s high-pressure heaters, both HPH1 & HPH2, performed
efficiently while low-pressure heaters were less efficient with problems
observed on last stage heater-LPH7 in the two units. The first and second units
clearly showed off-design behaviors in their last stage heaters which may
severely affect their overall cycle efficiency and could result in deterioration
of the particular heater. The combination of high TTD and DCA while low TR
J. R. Almedilla et al. / Mindanao Journal of Science and Technology Vol. 16 (2018) 171-186
183
on a heater can be a problem (EPRI, 2015). Bode and Gore (2016) stated that
this problem is mainly caused by (1) tube fouling which results to reduction
in heat transfer coefficient; (2) excessive tube plugging resulting in reduced
heat transfer; (3) air binding at shell side that leads to the reduction of heat
transfer area; (4) turbine extraction steam flow failure; and (5) internal or
external leakage.
In the case of the 3x135MW, the LPH6 and LPH7 might already have some
damages because of the performance results, and this may be due to any of the
aforementioned possible causes. Units one and two showed the leading TTD
in most heaters while Unit 3 had most of the lowest TTD. As mentioned from
the previous discussions, low TTD heaters are performing better due to less
heat loss.
The correct water level on the heater can also influence the performance of the
heater. A discussion on the significance of heater drain water level was
elaborated by Buckshumiyanm and Sabarish (2017), in which they explained
that if a feed water heater water level is too high, it might cause (1) water
induction to the turbine through the extraction steam piping; (2) reduction in
overall thermal efficiency; (3) decreased turbine efficiency; and (4) damping
of hot water drains to the condenser. If a feed water heater water level is too
low, it might cause (1) equipment damage due to the leaking of steam to the
drain zone; (2) baffles, tube, partition damage due to impingement and high
flow induced vibration; and (3) overall thermal efficiency decreased due to
steam blowing through drains or leaks points.
The DCA results showed that unit one had the most number of the heaters with
high DCA while unit three had the least. However, it is also important to note
that the low-pressure heaters have high TTD in all units. This is a possible
flashing occurrence on the drain zone part of a heater in the low-pressure side.
This could severely affect the heater drain zone parts if continuously run at a
very long period.
The last performance indicator, TR, in units one and two, had shown that the
last stage heater might be experiencing poor heat transfer due to a very low
rise in temperature of the feed water. This could be due to the frequent opening
of the LPH6 emergency drain valve back to the condenser without utilizing
the heat that was supposed to be used by the LPH7.
The results of the test showed that the unit three 135MW had the most efficient
feed water heater system and its performance indications were within tolerable
J. R. Almedilla et al. / Mindanao Journal of Science and Technology Vol. 16 (2018) 171-186
184
limits. This also confirms that this unit had the high overall cycle efficiency
due to the feed water heater regenerative system performance. However, the
overall cycle efficiency of a unit cannot still be confirmed until performance
test of each sub-systems performance is measured. Nonetheless, the
performance results on the feed water heaters are significant factors in the
overall cycle efficiency.
4. Conclusion and Recommendation
The test results showed that the high-pressure heaters (HPH) had remarkable
results than the low-pressure heaters (LPH). The heaters’ performances in
TTD, DCA, and TR in all units were near its design limits. There were also no
off-design behaviors observed during the experimental test of their
performances.
The LPH6 and LPH7, last stage heater, mostly encountered the problem on
off-design especially that of units one and two. The last stage heaters in the
said units had a poor performance and could indicate that the heater might
have already been damaged. The LPH6 had a problem of an increased rise in
water level that results in the frequent opening of its emergency drain valve.
There is an increased chance of a possibility of flashing in the drain cooler
zone for these heaters.
Unit three at 135MW had the better performance of the heaters and could
contribute a big factor to a high overall cycle efficiency. While its last stage
heater had high TTD and DCA, the rest of its heaters were operating normally.
The following can be recommended for the further study of the paper. First,
conduct periodic maintenance to be recorded in the engine log sheet as
indicated in the manual process of operations or commissioning, in particular,
in the last stage heaters as observed. Proper water heater maintenance will
extend life expectancy of any system. Second, proper preventive maintenance
or (PMS) is very important, especially if there is worst tube leak in shell and
tube heater which makes low performance of heater. Third, a feed water heater
control maybe introduced for performance improvement and improved plant
heat rate. Fourth, inadequate liquid level control can lead to tube failure or
heater drain degradation. Fifth, take note of the importance of proper level
control of feed water heaters. Sixth, proper inspection and investigation on the
LPH6 and last stage heater should be made during the outage period to check
J. R. Almedilla et al. / Mindanao Journal of Science and Technology Vol. 16 (2018) 171-186
185
if there are problems found at the internals of the heater. Seventh, conduct
more routine performance test quarterly or annually to monitor the
degradation of the heater performance or improvement. Lastly, calculation of
the heater’s efficiency and overall cycle efficiency of a unit should be
included.
5. References
American Society of Mechanical Engineers (ASME) A.S. (1978). Performance Test Code 12.1 Closed Feed Water Heaters. New York, NY.
Black, E.B., & Veatch, N.T. (1996). Power Plant Engineering. New York, NY:
Springer.
Bode, V.V., & Gore, V.G. (2016). Performance Analysis of Regenerative Feed Water
heating system in 270 MW Thermal Power Plant. International Research Journal of
Engineering and Technology, 3(4), 1180-1186.
Buckshumiyanm, A., & Sabarish, R. (2017). Performance Analysis of Regenerative
Feed-Water Heaters in 210MW Thermal Power Plant. International Journal of Pure
and Applied Mathematics, 116(20), 25-29.
Cengel, Y.A., & Boles, M.A. (2008). Thermodynamics: An Engineering Approach.
Boston, MA: McGraw-Hill.
Devandiran, E., Shaisundaram, V.S., Ganesh, P.S., & Vivek, S. (2016). Influence of
Feed Water Heaters on the Performance of Coal-Fired Power Plants. International
Journal of Latest Technology in Engineering, Management & Applied Science, 5(3),
115-119.
Electric Power Research Institute (EPRI). (2015). Thermal Performance Engineering
Handbook: Palo Alto, CA.
Heat Exchange Institute (HEI). (2009). Standards for Closed Feed-Water Heaters.
Cleveland, OH: HEI.
Klink, P.H. (1989). An Improved Method for Trending Feed Water Heater
Performance. EI International, Inc., Section 10.
Kumar, C.V., & Kumar, D. (2014). Performance Analysis of Regenerative Feed Heating in a Steam Plant. IOSR Journal of Mechanical and Civil Engineering, 11(2),
1-8.
Kushawaha, K.C., & Koshti, B. (2015). Performance Analysis and Off-design
Behaviour of Feed-water Heater. International Journal of Research in Aeronautical,
3(10), 9-15.

J. R. Almedilla et al. / Mindanao Journal of Science and Technology Vol. 16 (2018) 171-186
186
Kumar, A., & Buckshumiyanm, A. (2017). Performance Analysis of Regenerative Feed-Water Heaters in 210MW Thermal Power Plant. International Journal of
Mechanical Engineering and Technology, 8(8), 1490-1495.
Kiameh, P. (2002). Power Generation Handbook: Selection, Applications, Operation
and Maintenance. New York, NY: McGraw-Hill Professionals.
Nag, P. K. (1981). Power Plant Engineering. McGraw-Hill. New York, NY: McGraw-
Hill Professionals.
Yokell, S., Catapano, M.C., & Svensson, E. (2014). Closed Feedwater Heaters for Power Generation: A Working Guide. New York, NY: McGraw-Hill Education.


