Embed Size (px)
Citation preview
Feasibility study on the implementation of fullservice gas station in Indonesia:
Preference, Satisfaction, and Consumer Belief
Mariany W. Lidia*1
1School of Business and Management, Institut Teknologi Bandung,Indonesia
ABSTRACT
Gas station today is not just a place to buy fuel (BBM), but also provide variousfacilities that offer convenience for consumers. No wonder the gas station is now oneof the most favorite place to rest for the driver vehicle remotely. This especiallyapplies to the gas station that was built with a new concept, which was built with aspirit closer to the consumers. To lure consumers, gas station management could notonly improve the quality of service, cleanliness, ease of payment, or transparency oftransactions. Gas stations also equipped with ample parking, food and beveragecorner, praying room, toilet-in short all the necessities needed people who weretraveling long distance to rest there. In the midst of this free market era, foreigncountries compete to invest in the gas station sector, such as PETRONAS, SHELL,TOTAL and others, it will be a competitor PERTAMINA. Japan has been implementinga full service at all their gas stations. This is interesting, why not try to apply inIndonesia? This study tries to reveal the feasibility of these services is implemented inIndonesia to find out how the preference, satisfaction and consumer belief towardgas station that implement full service.
Key words: full service
Introduction
Customer service satisfactionis an important element in anycompany’s business strategy.Product quality, delivery time,speed, greeting, should beproperly addressed. In Japan,the companies apply a highstandard of customer service andstrict. Satisfaction is noteasily measured, for a number ofreasons (Lindquist & Joseph,
2009). It means different thingsto different people, one’s levelof satisfaction can change, andwhen consumer needs andpreferences change. Input fromcustomer complaints is veryimportant for the improvement ofcustomer service. attitude is anevaluative judgment (Kardes,2002). Solomon (2004) also notedthat attitude is an “overall
1
Advance Statistic
that expresses how much we likeor dislike an object, issue,person or action”. Even, Peterand Olson(2005) stated that,“nearly all definition ofattitude have one thing incommon: they refer to people’sevaluations”. Attitude as aperson’s overall evaluationregards with cognitive andaffective systems that createdattitude (Peter and Olson,2005). Cognitive system consistsof thinking responses, such asbeliefs, whereas affectivesystem refers to feelingresponses toward an object oractivity. Thus we defineattitude as evaluative judgementwhich is created by the person’sbeliefs and affect towardobject. There are currentlyseveral views regarding theformation of attitudes ingeneral. Some studies suggestthat attitude could be derivedfrom both direct and indirectexperiences in life (Loudon andDella Bitta, 1993 in Wu, S.,2003). Peter and Olson (2005)also suggested that attitudeformation is facilitated bydirect and indirect personalexperience. Regarding the directpersonal experience, thoseauthors noted that attitude isfrequently formed as a result ofdirect contact with the object.Whereas, indirect personalexperience means attitudeformation is influenced by theideas and experiences of friendsand family members, exposure tomass media, and personalityfactors. Initially, Japanese
commercial establishments inEurope are experiencing greatsuccess by introducing Japanesestyle customer service. InJapanese market, servicestandards require a shop clerkto wrap a product, hold out areceipt to the customer withboth hands and look at him orher in the eyes with a smile,all within 90 seconds. Anyonewho has had the opportunity tovisit Japan can tell you aboutthe country's unique attitude ofrespect toward others. Ithighlights every aspect ofJapanese life. Especially inbusiness, Japan gives unequalledattention and respect to itscustomers. One example that wecan take is at the gas stationin Japan. The station attendantgreeted each car with a bow anda smile. Next the door windowlowered and some words wereexchanged. Then the stationattendant put gas in each carand while the fuel was flowinghe washed the windows and themirrors. And the othersattendant want to clean yourfloor mats and empty your ashtray (if you smoke), even if yougive them an empty tray, itcomes back with little multi-colored plastic balls. When youhave finished the attendant willdive out into the street andstop the traffic to let youdepart safely with bowing to youas a sign of deep gratitude andrespect.
Goals of the Study
2
Advance Statistic
Purpose of this study is toreveal preference, satisfactionand customer belief of the formthat carried a full service gasstation. Researchers hope theresults of this study can be amaterial consideration in theform on increased expansion ingas station services.
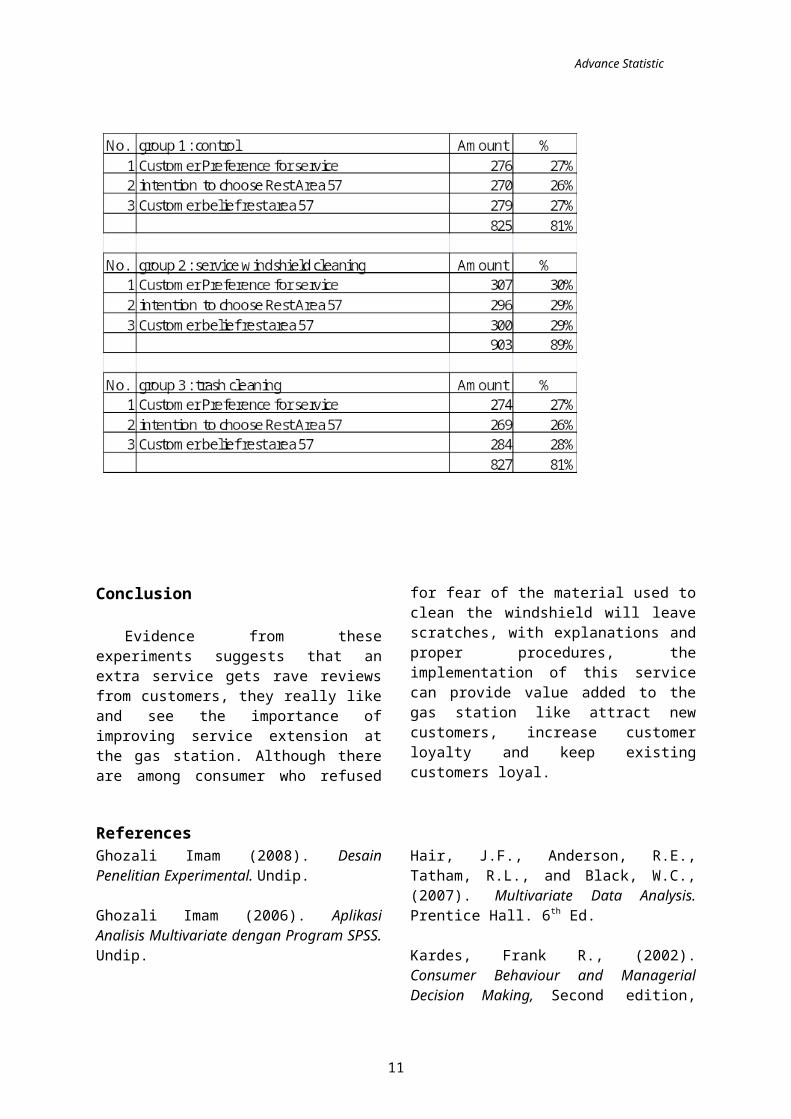
Overview and HypothesesIn this study participants
were divided into three groupswith three levels of differenttreatments. Group 1 was thecontrol group where participantsare not given any treatment butwere given a questionnaire. Ingroup 2 participants were giventreatments windshield cleaningservice. in group 3 participantswere given treatments ofexisting trash cleaning servicein the car. Then participantwill be asked to completequestionnaires with questions toexplore preferences, theirsatisfaction with the servicesalready provided and theirbelief toward gas stations thatprovide such treatments. Basedon the pre survey conducted byresearchers, the average timespent when the vehicle owner torefuel only one to threeminutes. So treatments shouldnot exceed long refueling. Inorder to facilitate filling outthe questionnaire, questions andanswers read by researchers andfrom respondent copied directlyto the sheet. Consideringfilling the fuel is a necessitywhich the drivers must fill outtwo reasons that is out of fuel
or to reserve, so it means toknow the actual response, theresearcher limited theexperiment target is a privatecar, a middle-class car (ex:Toyota Avanza, Rush, Xenia,Honda CRV, Civic, etc)
I expected with theadditional service at the gasstation would moderate giveimpact of information content onservices preferences,satisfaction and consumersbelief. Using Manova will beanalyzed the data to test thehypotheses: 0 : 1 = 2 = 3H 1 : 1 ≠ 2 ≠ 3Where 1, 2 and 3 are the mean(average) of preference,satisfaction and belief ingroups.
METHOD
Participant and DesignType of this study is true
experimental with within-subjectdesign experiment, randomizedblock design. It means researchcarried out by grouping theparticipants into the control orexperimental group to achieverandomization.
Two hundred and four carsowner in gas station Rest AreaKM 57 voluntarily participatedin the study. Participant wererandomly assigned to thefollowing conditions:
Procedure Before doing treatments,participants were voluntarilypleased to receive services car
3
Advance Statistic
windshield/trash cleaning thentheir willingness to answerfurther questions. Eachtreatments (in group 2 and 3)were conducted for 1-2 minutes.After the treatments is done,the experimenter read thequestionnaire that contained thedependent measure. Participantsstated their preference for kindof treatment. Measurement usinga Likert scale incorporates aseries of statements about thetopic concerned in whichconsumers’ will indicate theirdegree of agreement with each,according to a five-point scaleranging from ‘very dislike’ to
‘very like’ and ‘very disagree’to ‘very agree’.
RESULTS
Normality Test
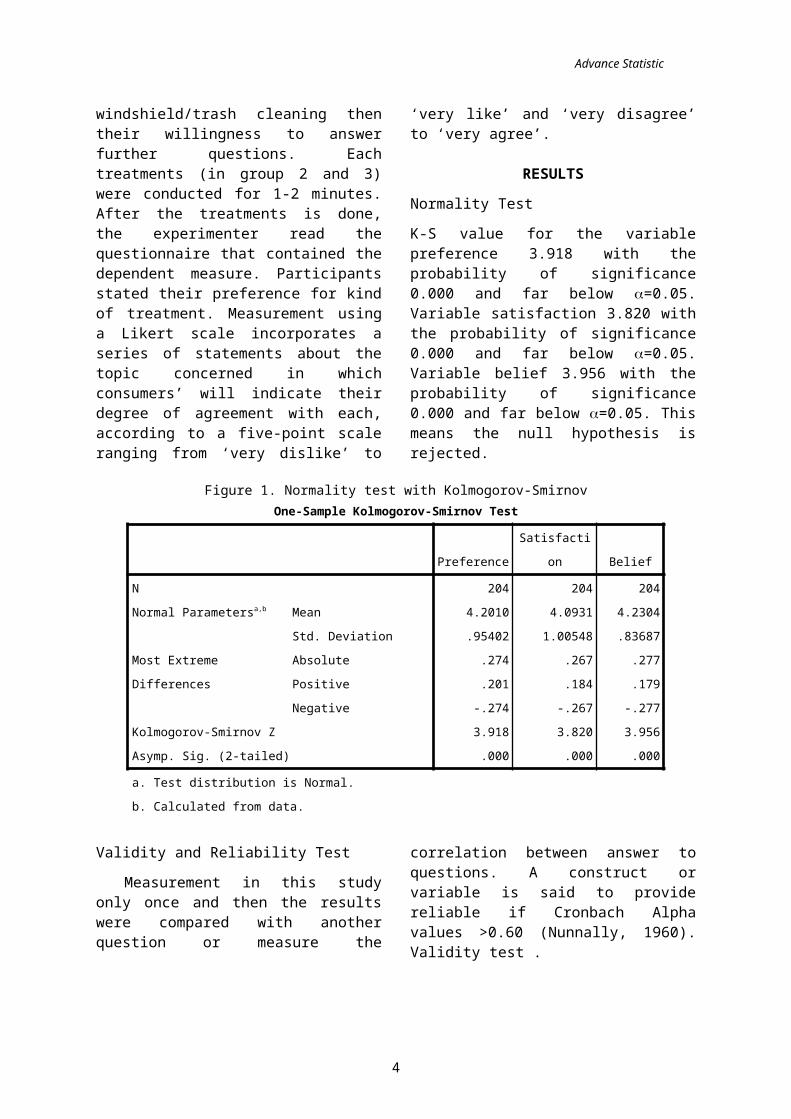
K-S value for the variablepreference 3.918 with theprobability of significance0.000 and far below =0.05.Variable satisfaction 3.820 withthe probability of significance0.000 and far below =0.05.Variable belief 3.956 with theprobability of significance0.000 and far below =0.05. Thismeans the null hypothesis isrejected.
Figure 1. Normality test with Kolmogorov-SmirnovOne-Sample Kolmogorov-Smirnov Test
PreferenceSatisfacti
on Belief
N 204 204 204Normal Parametersa,b Mean 4.2010 4.0931 4.2304
Std. Deviation .95402 1.00548 .83687Most Extreme Differences
Absolute .274 .267 .277Positive .201 .184 .179Negative -.274 -.267 -.277
Kolmogorov-Smirnov Z 3.918 3.820 3.956Asymp. Sig. (2-tailed) .000 .000 .000
a. Test distribution is Normal.b. Calculated from data.
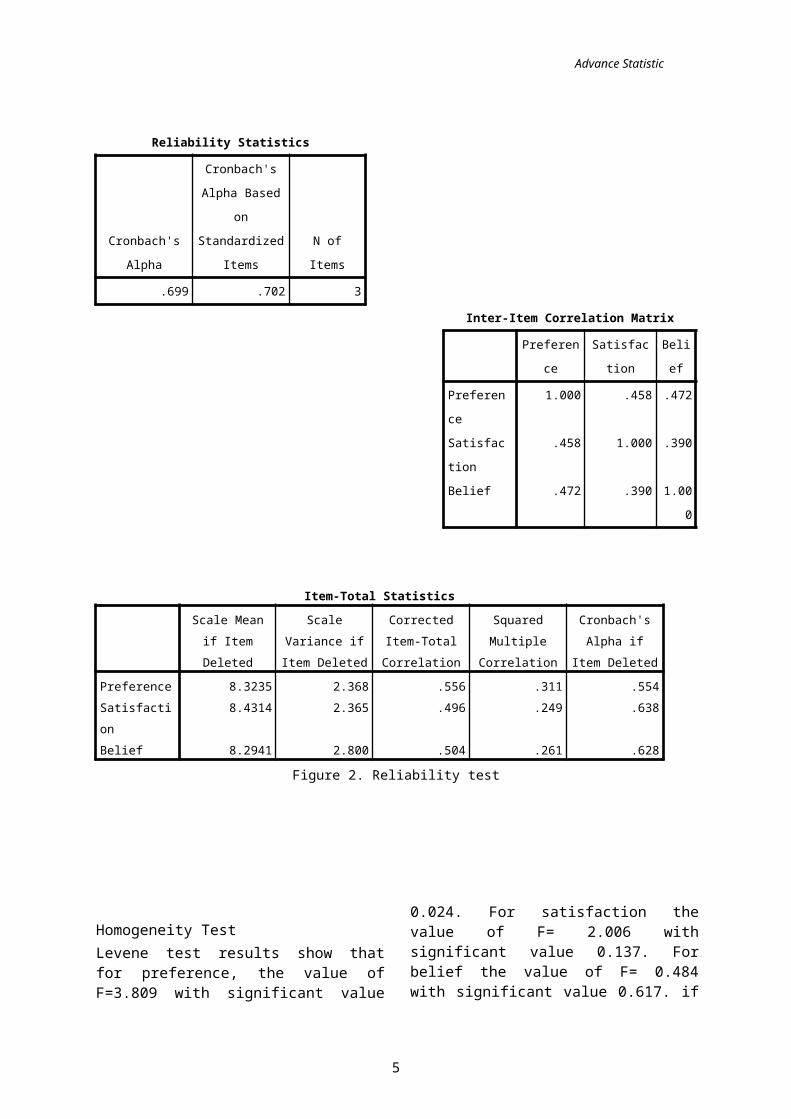
Validity and Reliability Test
Measurement in this studyonly once and then the resultswere compared with anotherquestion or measure the
correlation between answer toquestions. A construct orvariable is said to providereliable if Cronbach Alphavalues >0.60 (Nunnally, 1960).Validity test .
4
Advance Statistic
Reliability Statistics
Cronbach'sAlpha
Cronbach'sAlpha Based
onStandardized
ItemsN ofItems
.699 .702 3
Inter-Item Correlation Matrix
Preference
Satisfaction
Belief
Preference
1.000 .458 .472
Satisfaction
.458 1.000 .390
Belief .472 .390 1.000
Figure 2. Reliability test
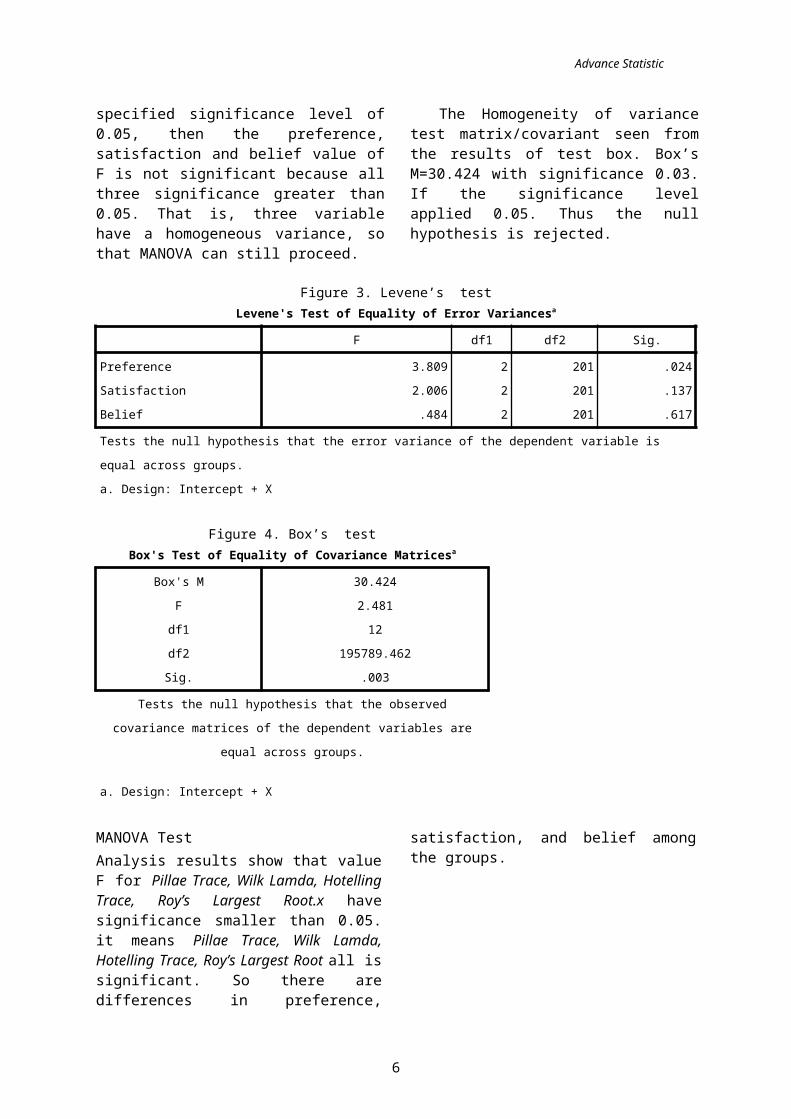
Homogeneity Test Levene test results show thatfor preference, the value ofF=3.809 with significant value
0.024. For satisfaction thevalue of F= 2.006 withsignificant value 0.137. Forbelief the value of F= 0.484with significant value 0.617. if
5
Item-Total StatisticsScale Meanif ItemDeleted
ScaleVariance ifItem Deleted
CorrectedItem-TotalCorrelation
SquaredMultiple
Correlation
Cronbach'sAlpha if
Item DeletedPreference 8.3235 2.368 .556 .311 .554Satisfaction
8.4314 2.365 .496 .249 .638
Belief 8.2941 2.800 .504 .261 .628
Advance Statistic
specified significance level of0.05, then the preference,satisfaction and belief value ofF is not significant because allthree significance greater than0.05. That is, three variablehave a homogeneous variance, sothat MANOVA can still proceed.
The Homogeneity of variancetest matrix/covariant seen fromthe results of test box. Box’sM=30.424 with significance 0.03.If the significance levelapplied 0.05. Thus the nullhypothesis is rejected.
Figure 3. Levene’s test
Levene's Test of Equality of Error Variancesa
F df1 df2 Sig.
Preference 3.809 2 201 .024Satisfaction 2.006 2 201 .137Belief .484 2 201 .617
Tests the null hypothesis that the error variance of the dependent variable is equal across groups.a. Design: Intercept + X
Figure 4. Box’s testBox's Test of Equality of Covariance Matricesa
Box's M 30.424F 2.481df1 12df2 195789.462Sig. .003
Tests the null hypothesis that the observedcovariance matrices of the dependent variables are
equal across groups.
a. Design: Intercept + X
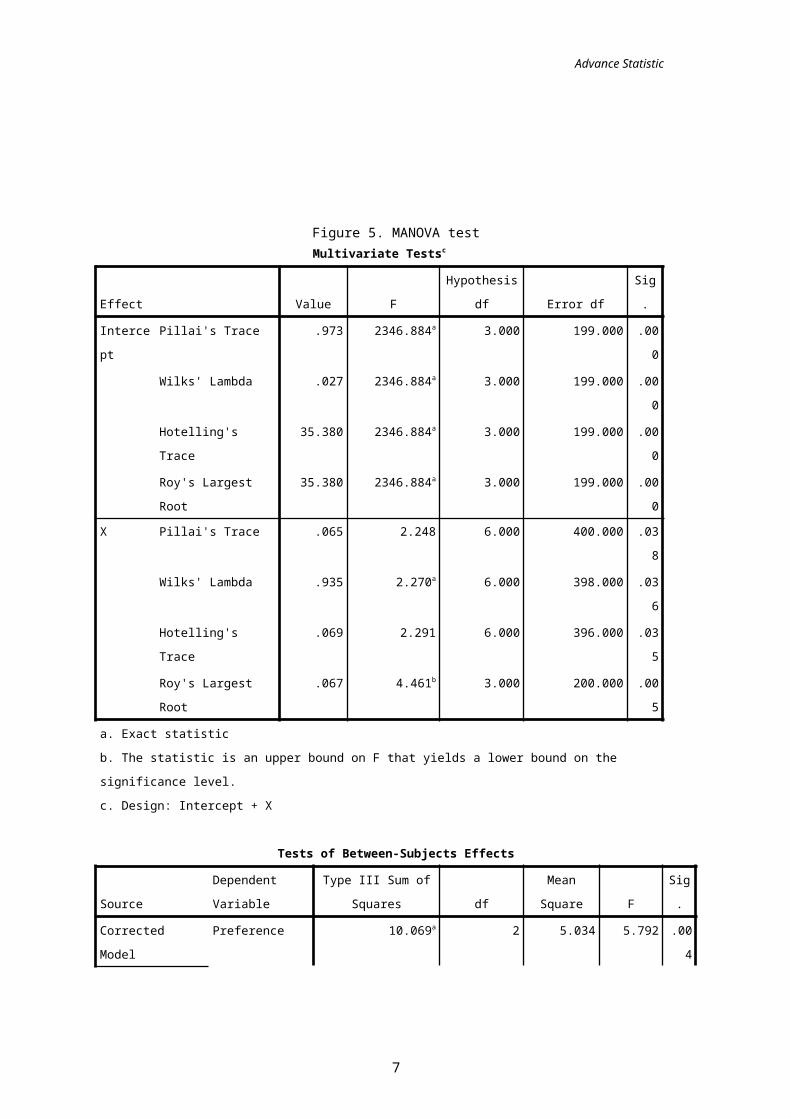
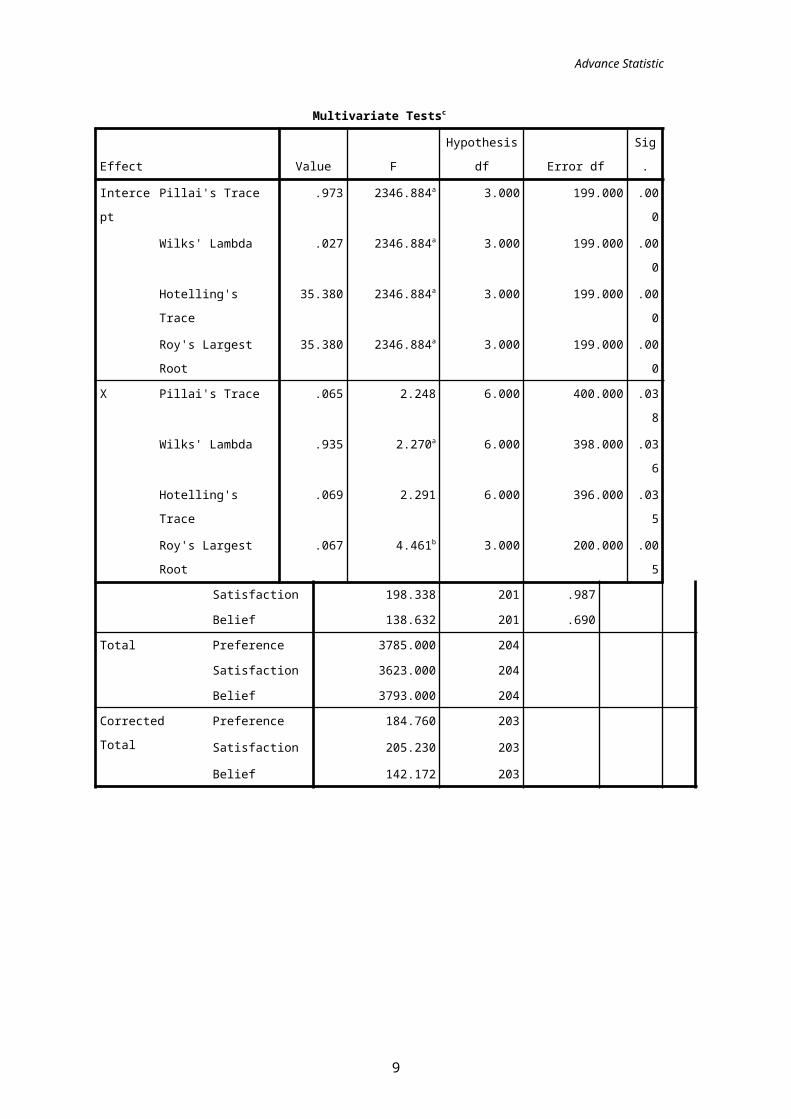
MANOVA TestAnalysis results show that valueF for Pillae Trace, Wilk Lamda, HotellingTrace, Roy’s Largest Root.x havesignificance smaller than 0.05.it means Pillae Trace, Wilk Lamda,Hotelling Trace, Roy’s Largest Root all issignificant. So there aredifferences in preference,
satisfaction, and belief amongthe groups.
6
Advance Statistic
Figure 5. MANOVA testMultivariate Testsc
Effect Value FHypothesis
df Error dfSig.
Intercept
Pillai's Trace .973 2346.884a 3.000 199.000 .000
Wilks' Lambda .027 2346.884a 3.000 199.000 .000
Hotelling's Trace
35.380 2346.884a 3.000 199.000 .000
Roy's Largest Root
35.380 2346.884a 3.000 199.000 .000
X Pillai's Trace .065 2.248 6.000 400.000 .038
Wilks' Lambda .935 2.270a 6.000 398.000 .036
Hotelling's Trace
.069 2.291 6.000 396.000 .035
Roy's Largest Root
.067 4.461b 3.000 200.000 .005
a. Exact statisticb. The statistic is an upper bound on F that yields a lower bound on the significance level.c. Design: Intercept + X
Tests of Between-Subjects Effects
SourceDependent Variable
Type III Sum ofSquares df
MeanSquare F
Sig.
Corrected Model
Preference 10.069a 2 5.034 5.792 .004
7
Advance Statistic
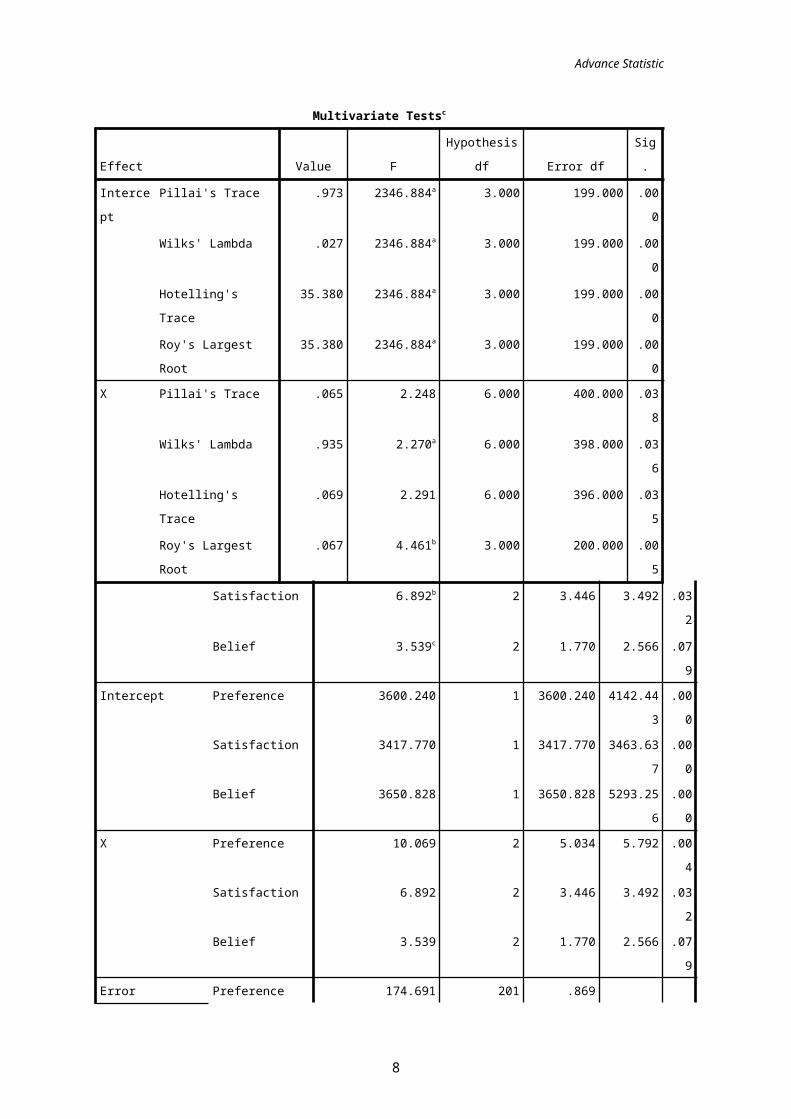
Multivariate Testsc
Effect Value FHypothesis
df Error dfSig.
Intercept
Pillai's Trace .973 2346.884a 3.000 199.000 .000
Wilks' Lambda .027 2346.884a 3.000 199.000 .000
Hotelling's Trace
35.380 2346.884a 3.000 199.000 .000
Roy's Largest Root
35.380 2346.884a 3.000 199.000 .000
X Pillai's Trace .065 2.248 6.000 400.000 .038
Wilks' Lambda .935 2.270a 6.000 398.000 .036
Hotelling's Trace
.069 2.291 6.000 396.000 .035
Roy's Largest Root
.067 4.461b 3.000 200.000 .005
Satisfaction 6.892b 2 3.446 3.492 .032
Belief 3.539c 2 1.770 2.566 .079
Intercept Preference 3600.240 1 3600.240 4142.443
.000
Satisfaction 3417.770 1 3417.770 3463.637
.000
Belief 3650.828 1 3650.828 5293.256
.000
X Preference 10.069 2 5.034 5.792 .004
Satisfaction 6.892 2 3.446 3.492 .032
Belief 3.539 2 1.770 2.566 .079
Error Preference 174.691 201 .869
8
Advance Statistic
Multivariate Testsc
Effect Value FHypothesis
df Error dfSig.
Intercept
Pillai's Trace .973 2346.884a 3.000 199.000 .000
Wilks' Lambda .027 2346.884a 3.000 199.000 .000
Hotelling's Trace
35.380 2346.884a 3.000 199.000 .000
Roy's Largest Root
35.380 2346.884a 3.000 199.000 .000
X Pillai's Trace .065 2.248 6.000 400.000 .038
Wilks' Lambda .935 2.270a 6.000 398.000 .036
Hotelling's Trace
.069 2.291 6.000 396.000 .035
Roy's Largest Root
.067 4.461b 3.000 200.000 .005
Satisfaction 198.338 201 .987
Belief 138.632 201 .690
Total Preference 3785.000 204
Satisfaction 3623.000 204
Belief 3793.000 204
Corrected Total
Preference 184.760 203
Satisfaction 205.230 203
Belief 142.172 203
9
Advance Statistic
Multivariate Testsc
Effect Value FHypothesis
df Error dfSig.
Intercept
Pillai's Trace .973 2346.884a 3.000 199.000 .000
Wilks' Lambda .027 2346.884a 3.000 199.000 .000
Hotelling's Trace
35.380 2346.884a 3.000 199.000 .000
Roy's Largest Root
35.380 2346.884a 3.000 199.000 .000
X Pillai's Trace .065 2.248 6.000 400.000 .038
Wilks' Lambda .935 2.270a 6.000 398.000 .036
Hotelling's Trace
.069 2.291 6.000 396.000 .035
Roy's Largest Root
.067 4.461b 3.000 200.000 .005
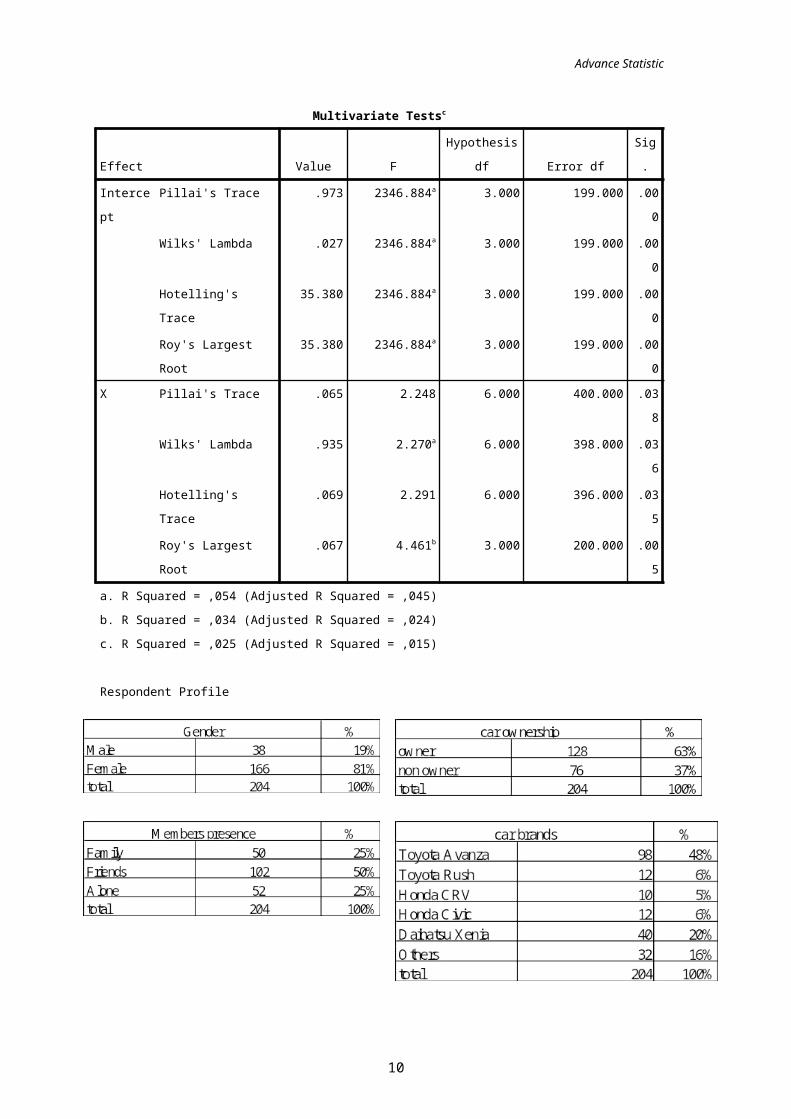
a. R Squared = ,054 (Adjusted R Squared = ,045)b. R Squared = ,034 (Adjusted R Squared = ,024)c. R Squared = ,025 (Adjusted R Squared = ,015)
Respondent Profile
10
Advance Statistic
Conclusion
Evidence from theseexperiments suggests that anextra service gets rave reviewsfrom customers, they really likeand see the importance ofimproving service extension atthe gas station. Although thereare among consumer who refused
for fear of the material used toclean the windshield will leavescratches, with explanations andproper procedures, theimplementation of this servicecan provide value added to thegas station like attract newcustomers, increase customerloyalty and keep existingcustomers loyal.
References Ghozali Imam (2008). DesainPenelitian Experimental. Undip.
Ghozali Imam (2006). AplikasiAnalisis Multivariate dengan Program SPSS.Undip.
Hair, J.F., Anderson, R.E.,Tatham, R.L., and Black, W.C.,(2007). Multivariate Data Analysis.Prentice Hall. 6th Ed.
Kardes, Frank R., (2002).Consumer Behaviour and ManagerialDecision Making, Second edition,
11
Advance Statistic
Upper Saddle Rver, NJ: PrenticeHall.
Kardes, F.R., and Mantel S. P.,.(1999). The Role of Direction ofComparison, Attribute-Based Processing,and Attitude-Based Processing inConsumer Preference. Journal ofConsumers Research, March 1999.
Lindquist J.D. and Joseph M. S(2009). Shopper, Buyer, and ConsumerBehavior. Cencage Learning.
Peter, P. J. and Olson, J.C.,(2005). Consumer Behavior & MarketingStrategy. 7th Edition, McGraw-Hill/Irwin, New York.
Solomon, M. R., (2004). ConsumerBehaviour, buying, having, and being.Pearson Prentice Hall. 6th Ed.
Wanke M., Bohner G., JurkowitschA. (1997). There Are Many Reasons toDrive a BMW: Does Imagined Ease ofArgument Generation Influence Attitudes?Journal of Consumers Research,September 1997.
www.spbukita.com/2011/03/01/istirahat-di-spbu-nyaman-dan-murah/ [Accessed 23 December2004].
12


