Embed Size (px)
Citation preview
Pure appl. geophys. 152 (1998) 75–890033–4553/98/010075–15 $ 1.50+0.20/0
Fault Lengths During the Patras 1993 Earthquake Sequence asEstimated from the Pulse Width of Initial P Wave
G-AKIS TSELENTIS1
Abstract—The pulse width of the initial P wave was measured for three clusters of the aftershocksequence of the Patras (5.4 MS ) July 1993 earthquake. The data set consists of pulse width measure-ments of 250 microearthquakes recorded at a low-noise station of the University of Patras SeismologicalNetwork between 4-7-1993 and 1-8-1993. The statistical relation between the fault length and theearthquake magnitude was established for each one of the three clusters and is compared with otherpublished relations. The relation also, between seismic moment and fault length was examined andshowed a dependence upon the prevailing tectonic regime.
Key words: Pulse width, source length.
1. Introduction
Usually, earthquake source parameters are estimated using spectral techniques;the corner frequency is related to a source dimension through scaling laws thatmake assumptions about source geometry and rupture velocity, and the seismicmoment is evaluated from the long-period spectral level (i.e., BRUNE, 1970). Thisconventional method however is not highly efficient when we deal with a largenumber of earthquakes, as in the present case.
An alternative approach is based on the measured pulse width of the initial Pwave at an observation station of far-field. Pulse width methods, like spectralmethods, do not require precise measurement of pulse amplitudes or instrumentalresponse. Unlike spectral methods, though, the pusle width methods only require avery short part of the first arriving signal, which is relatively free of otherinterfering waveforms such as reflection, scattering, or multiple travel paths (WU
and LEES, 1996). In order to make accurate spectrum estimates, spectral methodstypically use 0.5 to 2 sec of data, whereas the pulse width may be estimated overhalf a wavelength of the P-wave arrival.
O’NEILL and HEALY (1973) proposed such an approach for a spherical source.FRANKEL (1981) applied this method for an expanding circular crack. FRANKEL
and KANAMORI (1983) extended the initial P-wave pulse width method by
1 University of Patras, Seismological Laboratory, Rio 261 10, Greece; [email protected]
G-Akis Tselentis76 Pure appl. geophys.,
incorporating a method of accounting for the seismograph site response, suggestingthat for each seismograph site there was a ‘‘pulse width floor’’, a magnitude levelbelow which the pulse width no longer decreased. OHTAKE (1986) extended themethod to bilateral and unilateral propagation of rectangular faults. O’NEILL
(1984) applied a similar methodology to derive source dimensions of small earth-quakes at Parkfield. TSELENTIS et al. (1987) used the pulse width method to assesssource dimensions of the Kalamata 1986 (S. Greece), aftershock sequence. Re-cently, ZUCCA et al. (1994) and WU and LEES (1996) employed pulse widths toinvestigate the attenuation characteristics of geothermal fields.
The purpose of the present study is to establish the statistical relation betweenthe fault dimension L and earthquake local magnitude for small-sized earthquakesfor the aftershock sequence of the Patras 1993 earthquake.
2. Theory and Method
Seismic sources are usually modeled as step dislocations on a fault plane,producing an impulsive displacement at the recording site.
First, we will derive the relation between the average pulse width of the initialP wave at a far-field station and the source duration time for the three types offaulting; bilateral, unilateral and expanding circular crack.
For the case of uni- and bi-lateral faulting it is assumed that the rupture occurssimultaneously over the entire width of the fault and that the fault length L issubstantially larger than the fault width N, thus neglecting the contribution of thefault width.
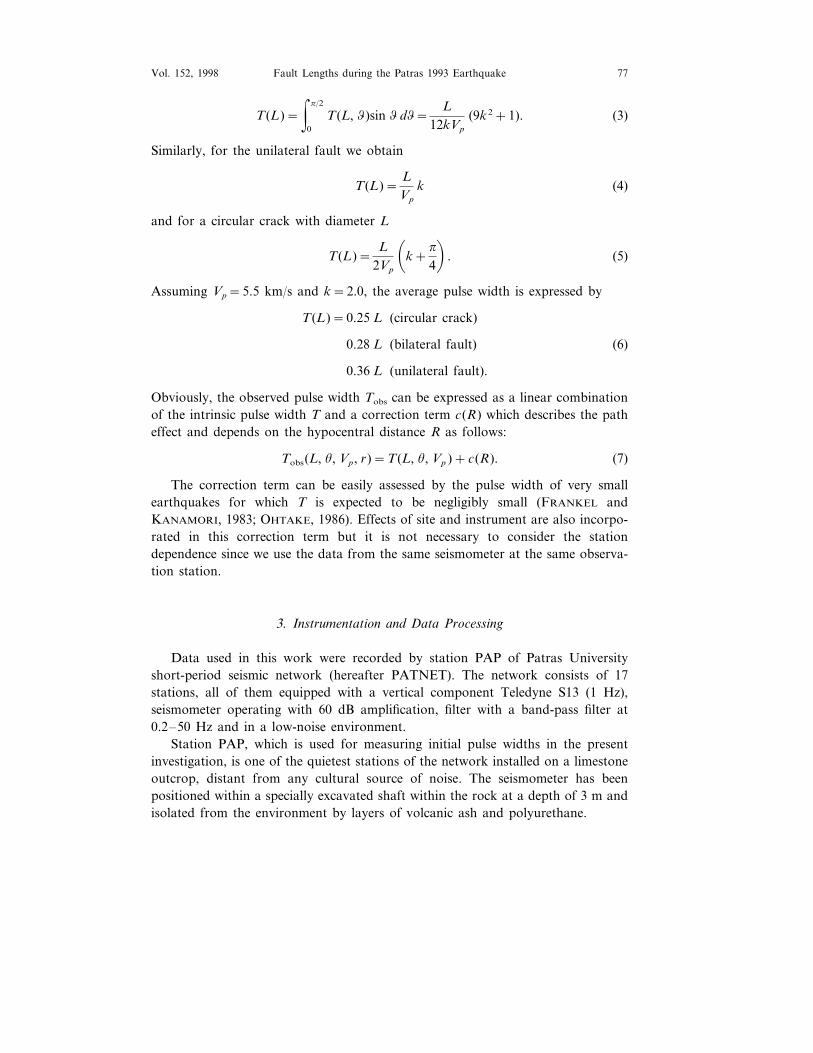
For the case of bilateral rupture of a rectangular fault on which the ruptureinitiates at x=a (Fig. 1), the pulse width of displacement at the observation stationis calculated from simple physics as (OHTAKE, 1986):
T(L, q)=1L& l
0
!(L−a)(k+cos q)Vp
"dl+
& L
l
a(k+cos q)Vp
da
=L
8kVp
(6k2+1+cos 2q) (1)
where L is the fault length, u is the angle between the station and rupture direction,Vp is the P-wave velocity, k=Vp /Vr is the ratio of P wave to rupture velocity andl is given by
l=L2�
1−cos q
k�
. (2)
Averaging over u we obtain
Fault Lengths during the Patras 1993 Earthquake 77Vol. 152, 1998
T(L)=& p/2
0
T(L, q)sin q dq=L
12kVp
(9k2+1). (3)
Similarly, for the unilateral fault we obtain
T(L)=LVp
k (4)
and for a circular crack with diameter L
T(L)=L
2Vp
�k+
p
4�
. (5)
Assuming Vp=5.5 km/s and k=2.0, the average pulse width is expressed by
T(L)=0.25 L (circular crack)
0.28 L (bilateral fault) (6)
0.36 L (unilateral fault).
Obviously, the observed pulse width Tobs can be expressed as a linear combinationof the intrinsic pulse width T and a correction term c(R) which describes the patheffect and depends on the hypocentral distance R as follows:
Tobs(L, u, Vp, r)=T(L, u, Vp )+c(R). (7)
The correction term can be easily assessed by the pulse width of very smallearthquakes for which T is expected to be negligibly small (FRANKEL andKANAMORI, 1983; OHTAKE, 1986). Effects of site and instrument are also incorpo-rated in this correction term but it is not necessary to consider the stationdependence since we use the data from the same seismometer at the same observa-tion station.
3. Instrumentation and Data Processing
Data used in this work were recorded by station PAP of Patras Universityshort-period seismic network (hereafter PATNET). The network consists of 17stations, all of them equipped with a vertical component Teledyne S13 (1 Hz),seismometer operating with 60 dB amplification, filter with a band-pass filter at0.2–50 Hz and in a low-noise environment.
Station PAP, which is used for measuring initial pulse widths in the presentinvestigation, is one of the quietest stations of the network installed on a limestoneoutcrop, distant from any cultural source of noise. The seismometer has beenpositioned within a specially excavated shaft within the rock at a depth of 3 m andisolated from the environment by layers of volcanic ash and polyurethane.
G-Akis Tselentis78 Pure appl. geophys.,
The signals from the seismometers are radio-telemetered via FM subcarriers tothe central recording site at the Seismological Laboratory of the University ofPatras (base station), where a three-component seismometer station is deployed, inreal time. There, they are anti-alias filtered with a 200-Hz analogue Butterworthlow-pass filter, sampled at 100 Hz and converted to digital form with a resolutionof 16 bits.
For the initial phase picking and data processing, SISMWIN (TSELENTIS et al.,1994) an in-house developed software is used. SISMWIN employs features that areparticularly convenient for arrival picking, zooming and noise reduction such asneural algorithms for P- and S-phase automatic picking, noise corrected decon-volved displacement seismograms, etc. Thus for seismograms with S/N ratio greaterthan 5, P- and S-wave arrival times are read with an accuracy of approximately0.02 and 0.05 s, respectively.
For the event location and magnitude calculation the HYPO71PC (LEE andVALDES, 1985) is used. The best velocity model was obtained using all well-recorded (clear P and S arrivals) events by at least six stations. The final velocitymodel used for the area of Patras is shown in Table 1.
The magnitude which is reported for all the events is the local magnitude ML
calculated from the total signal duration. The computation was also done by
Figure 1Simplified geometry of bilateral faulting.
Fault Lengths during the Patras 1993 Earthquake 79Vol. 152, 1998
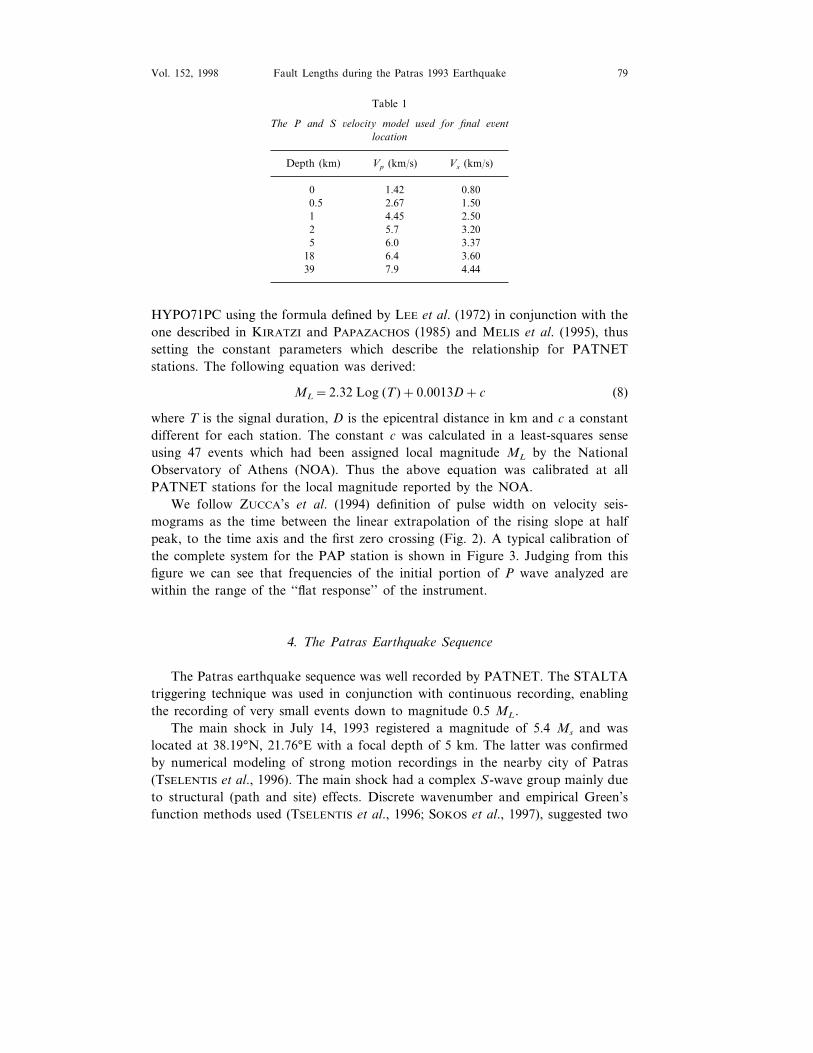
Table 1
The P and S 6elocity model used for final e6entlocation
Depth (km) Vp (km/s) Vs (km/s)
0 1.42 0.800.5 2.67 1.501 4.45 2.502 5.7 3.205 6.0 3.37
18 6.4 3.6039 7.9 4.44
HYPO71PC using the formula defined by LEE et al. (1972) in conjunction with theone described in KIRATZI and PAPAZACHOS (1985) and MELIS et al. (1995), thussetting the constant parameters which describe the relationship for PATNETstations. The following equation was derived:
ML=2.32 Log (T)+0.0013D+c (8)
where T is the signal duration, D is the epicentral distance in km and c a constantdifferent for each station. The constant c was calculated in a least-squares senseusing 47 events which had been assigned local magnitude ML by the NationalObservatory of Athens (NOA). Thus the above equation was calibrated at allPATNET stations for the local magnitude reported by the NOA.
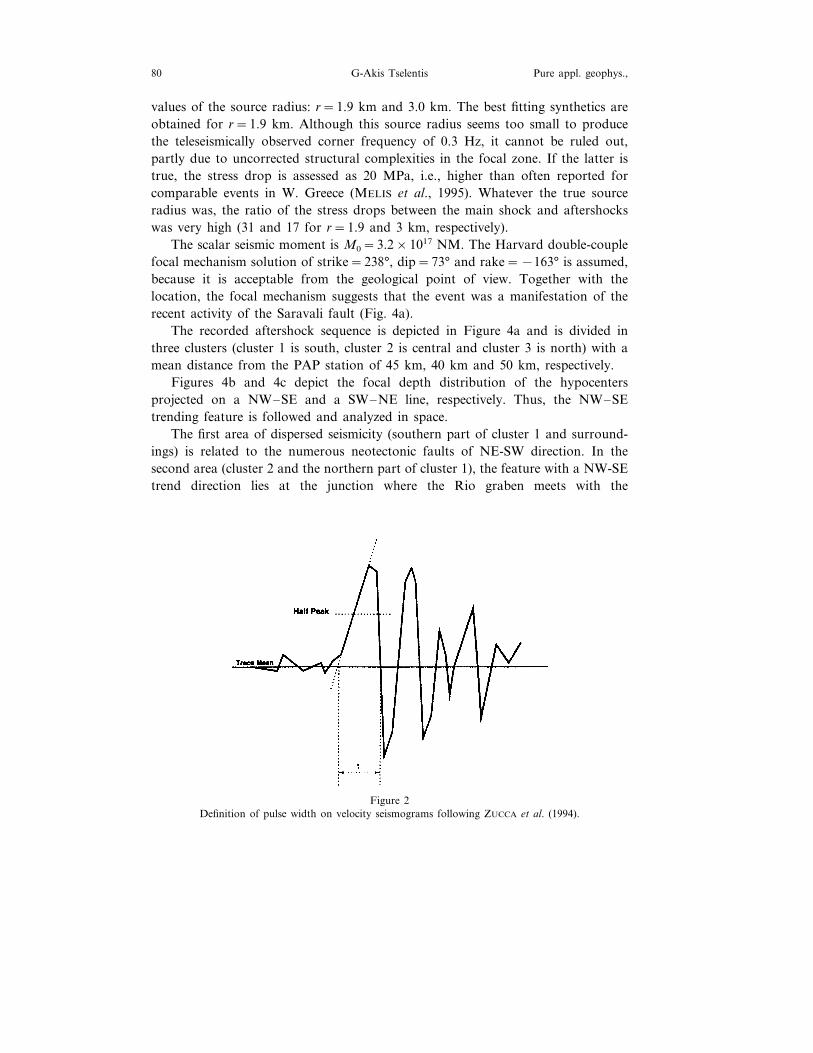
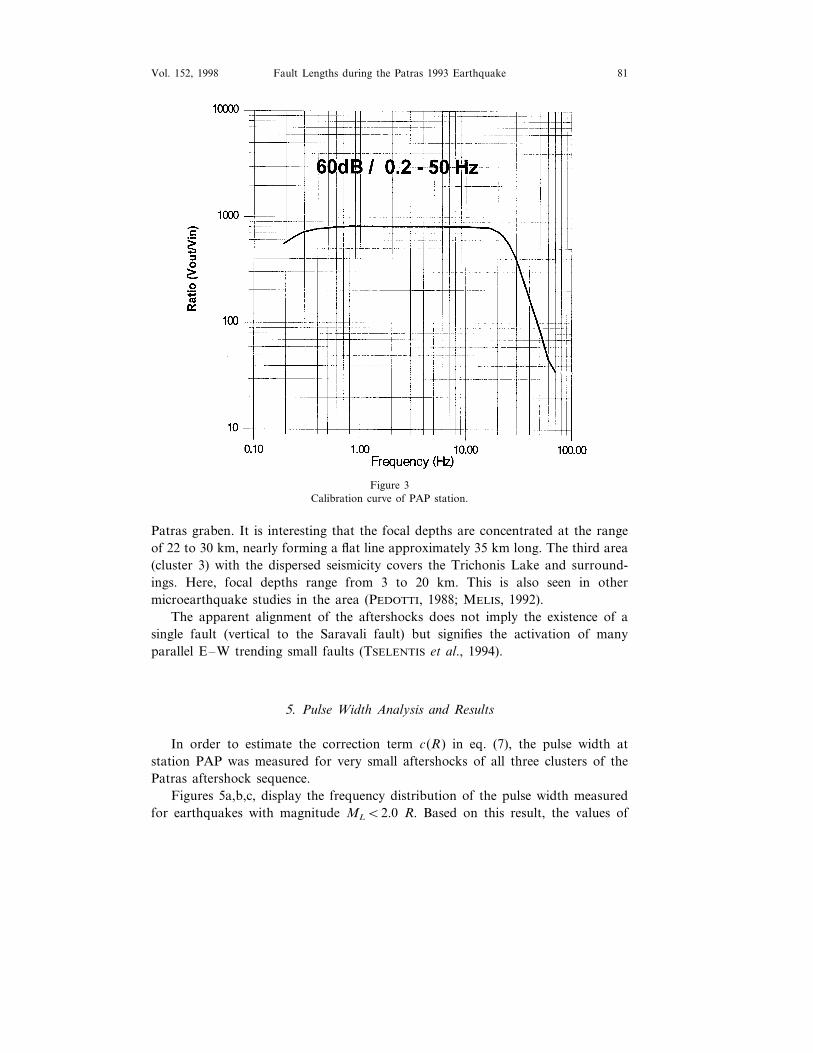
We follow ZUCCA’s et al. (1994) definition of pulse width on velocity seis-mograms as the time between the linear extrapolation of the rising slope at halfpeak, to the time axis and the first zero crossing (Fig. 2). A typical calibration ofthe complete system for the PAP station is shown in Figure 3. Judging from thisfigure we can see that frequencies of the initial portion of P wave analyzed arewithin the range of the ‘‘flat response’’ of the instrument.
4. The Patras Earthquake Sequence
The Patras earthquake sequence was well recorded by PATNET. The STALTAtriggering technique was used in conjunction with continuous recording, enablingthe recording of very small events down to magnitude 0.5 ML.
The main shock in July 14, 1993 registered a magnitude of 5.4 Ms and waslocated at 38.19°N, 21.76°E with a focal depth of 5 km. The latter was confirmedby numerical modeling of strong motion recordings in the nearby city of Patras(TSELENTIS et al., 1996). The main shock had a complex S-wave group mainly dueto structural (path and site) effects. Discrete wavenumber and empirical Green’sfunction methods used (TSELENTIS et al., 1996; SOKOS et al., 1997), suggested two
G-Akis Tselentis80 Pure appl. geophys.,
values of the source radius: r=1.9 km and 3.0 km. The best fitting synthetics areobtained for r=1.9 km. Although this source radius seems too small to producethe teleseismically observed corner frequency of 0.3 Hz, it cannot be ruled out,partly due to uncorrected structural complexities in the focal zone. If the latter istrue, the stress drop is assessed as 20 MPa, i.e., higher than often reported forcomparable events in W. Greece (MELIS et al., 1995). Whatever the true sourceradius was, the ratio of the stress drops between the main shock and aftershockswas very high (31 and 17 for r=1.9 and 3 km, respectively).
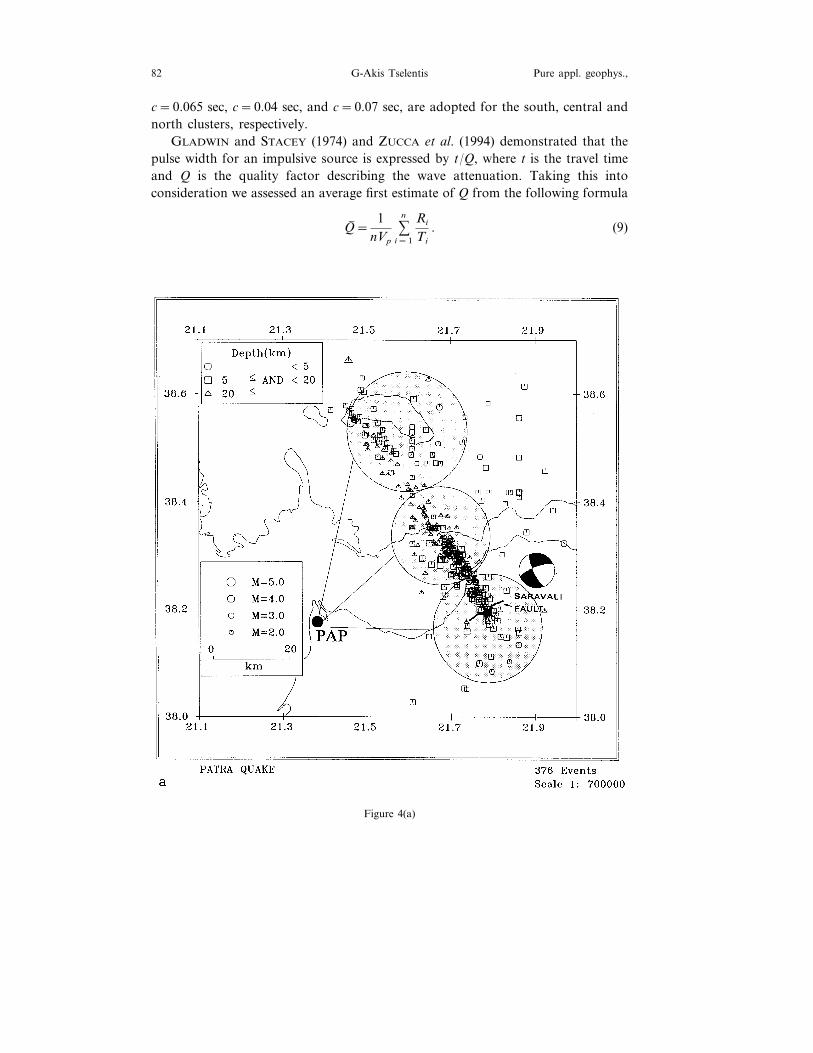
The scalar seismic moment is M0=3.2×10¹⁷ NM. The Harvard double-couplefocal mechanism solution of strike=238°, dip=73° and rake=−163° is assumed,because it is acceptable from the geological point of view. Together with thelocation, the focal mechanism suggests that the event was a manifestation of therecent activity of the Saravali fault (Fig. 4a).
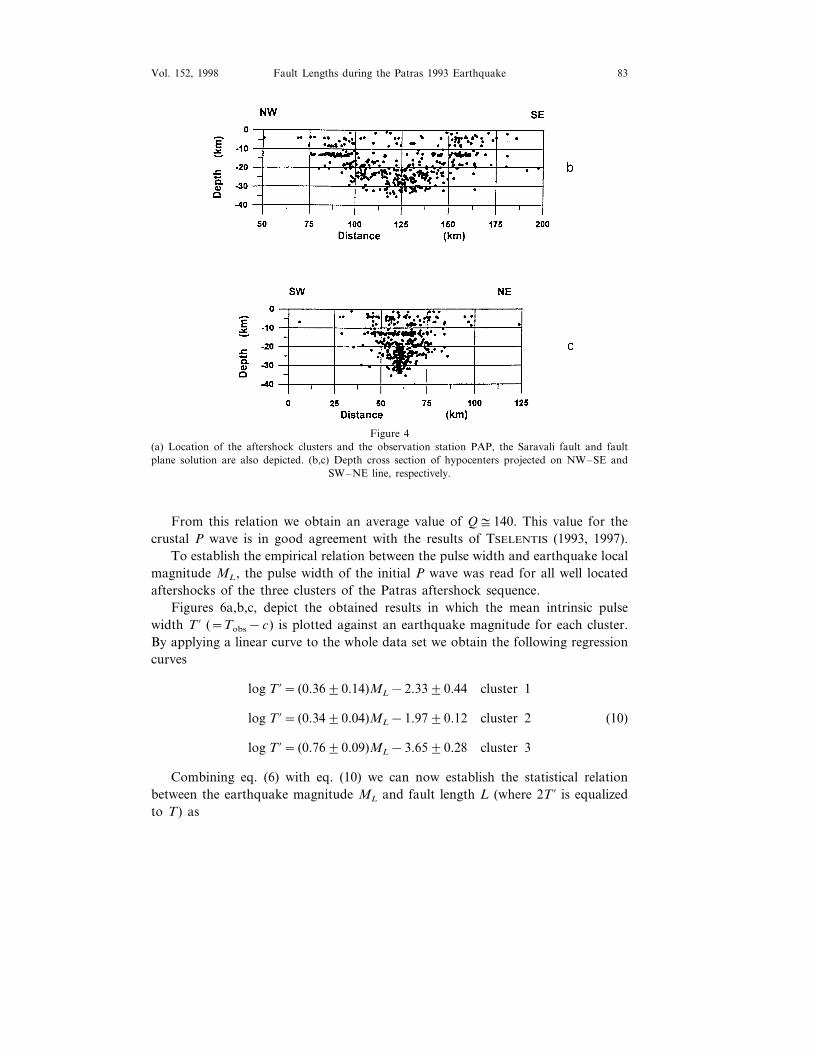
The recorded aftershock sequence is depicted in Figure 4a and is divided inthree clusters (cluster 1 is south, cluster 2 is central and cluster 3 is north) with amean distance from the PAP station of 45 km, 40 km and 50 km, respectively.
Figures 4b and 4c depict the focal depth distribution of the hypocentersprojected on a NW–SE and a SW–NE line, respectively. Thus, the NW–SEtrending feature is followed and analyzed in space.
The first area of dispersed seismicity (southern part of cluster 1 and surround-ings) is related to the numerous neotectonic faults of NE-SW direction. In thesecond area (cluster 2 and the northern part of cluster 1), the feature with a NW-SEtrend direction lies at the junction where the Rio graben meets with the
Figure 2Definition of pulse width on velocity seismograms following ZUCCA et al. (1994).
Fault Lengths during the Patras 1993 Earthquake 81Vol. 152, 1998
Figure 3Calibration curve of PAP station.
Patras graben. It is interesting that the focal depths are concentrated at the rangeof 22 to 30 km, nearly forming a flat line approximately 35 km long. The third area(cluster 3) with the dispersed seismicity covers the Trichonis Lake and surround-ings. Here, focal depths range from 3 to 20 km. This is also seen in othermicroearthquake studies in the area (PEDOTTI, 1988; MELIS, 1992).
The apparent alignment of the aftershocks does not imply the existence of asingle fault (vertical to the Saravali fault) but signifies the activation of manyparallel E–W trending small faults (TSELENTIS et al., 1994).
5. Pulse Width Analysis and Results
In order to estimate the correction term c(R) in eq. (7), the pulse width atstation PAP was measured for very small aftershocks of all three clusters of thePatras aftershock sequence.
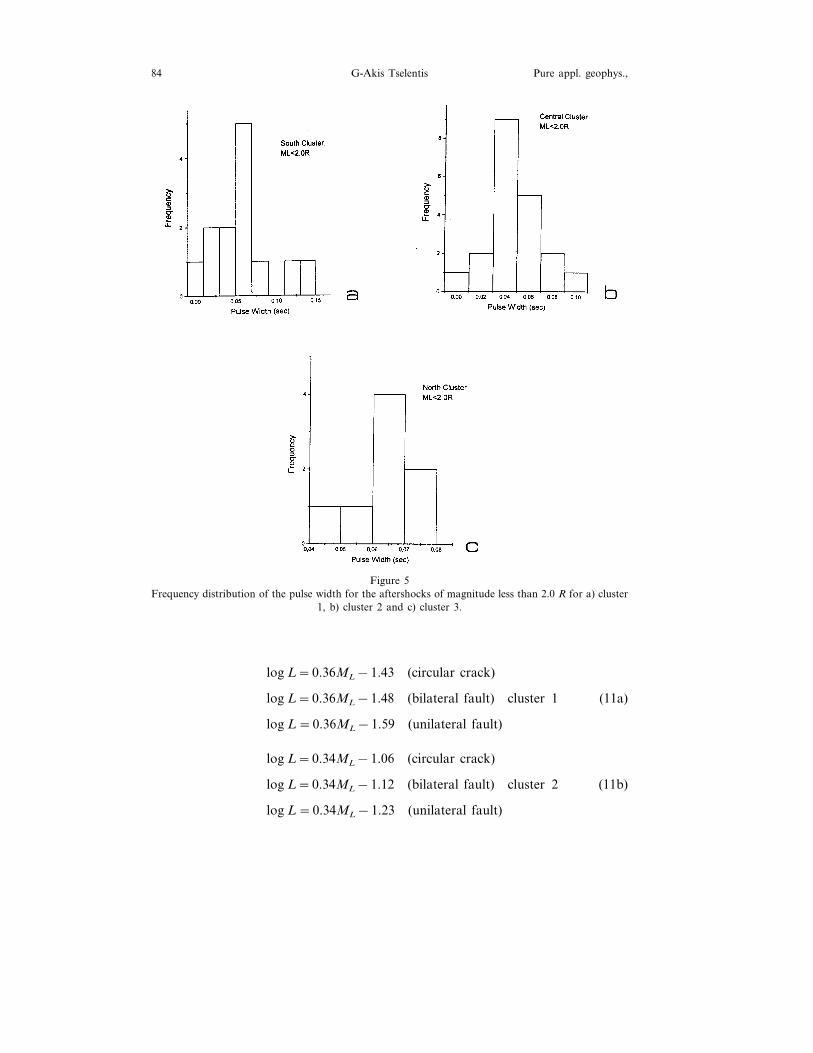
Figures 5a,b,c, display the frequency distribution of the pulse width measuredfor earthquakes with magnitude MLB2.0 R. Based on this result, the values of
G-Akis Tselentis82 Pure appl. geophys.,
c=0.065 sec, c=0.04 sec, and c=0.07 sec, are adopted for the south, central andnorth clusters, respectively.
GLADWIN and STACEY (1974) and ZUCCA et al. (1994) demonstrated that thepulse width for an impulsive source is expressed by t/Q, where t is the travel timeand Q is the quality factor describing the wave attenuation. Taking this intoconsideration we assessed an average first estimate of Q from the following formula
Q( =1
nVp
%n
i=1
Ri
Ti
. (9)
Figure 4(a)
Fault Lengths during the Patras 1993 Earthquake 83Vol. 152, 1998
Figure 4(a) Location of the aftershock clusters and the observation station PAP, the Saravali fault and faultplane solution are also depicted. (b,c) Depth cross section of hypocenters projected on NW–SE and
SW–NE line, respectively.
From this relation we obtain an average value of Q$140. This value for thecrustal P wave is in good agreement with the results of TSELENTIS (1993, 1997).
To establish the empirical relation between the pulse width and earthquake localmagnitude ML, the pulse width of the initial P wave was read for all well locatedaftershocks of the three clusters of the Patras aftershock sequence.
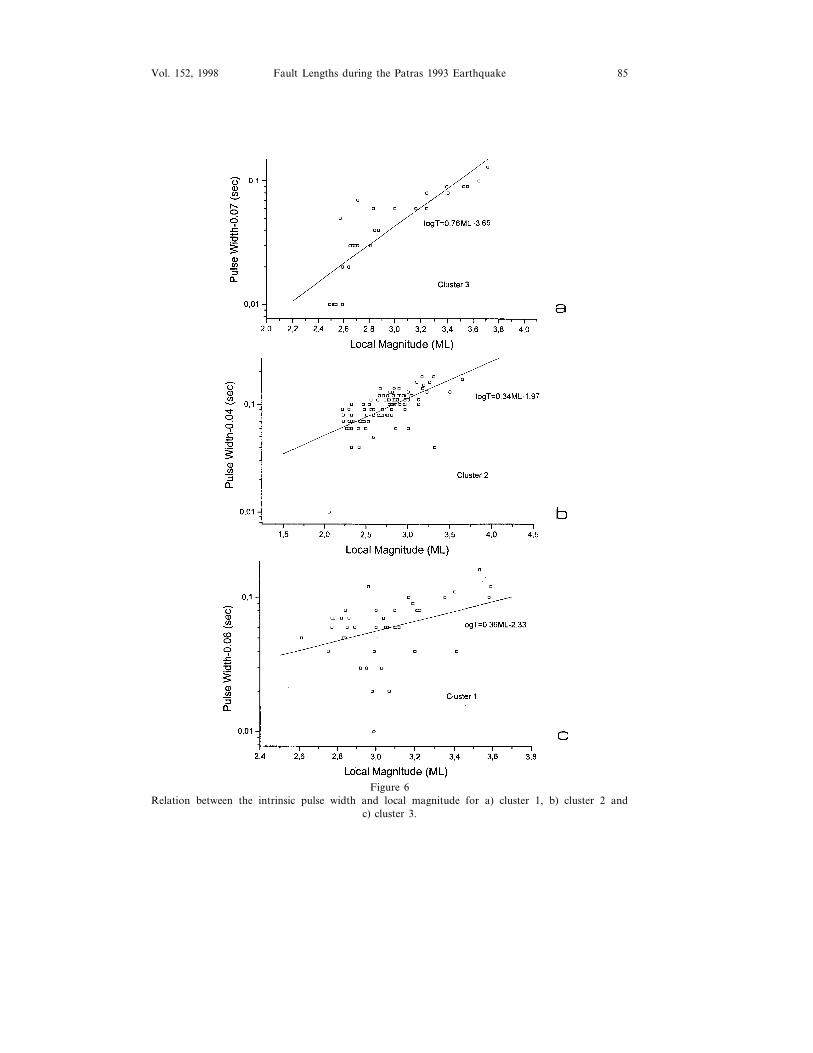
Figures 6a,b,c, depict the obtained results in which the mean intrinsic pulsewidth T % (=Tobs−c) is plotted against an earthquake magnitude for each cluster.By applying a linear curve to the whole data set we obtain the following regressioncurves
log T %= (0.3690.14)ML−2.3390.44 cluster 1
log T %= (0.3490.04)ML−1.9790.12 cluster 2 (10)
log T %= (0.7690.09)ML−3.6590.28 cluster 3
Combining eq. (6) with eq. (10) we can now establish the statistical relationbetween the earthquake magnitude ML and fault length L (where 2T % is equalizedto T) as
G-Akis Tselentis84 Pure appl. geophys.,
Figure 5Frequency distribution of the pulse width for the aftershocks of magnitude less than 2.0 R for a) cluster
1, b) cluster 2 and c) cluster 3.
log L=0.36ML−1.43 (circular crack)
log L=0.36ML−1.48 (bilateral fault) cluster 1 (11a)
log L=0.36ML−1.59 (unilateral fault)
log L=0.34ML−1.06 (circular crack)
log L=0.34ML−1.12 (bilateral fault) cluster 2 (11b)
log L=0.34ML−1.23 (unilateral fault)
Fault Lengths during the Patras 1993 Earthquake 85Vol. 152, 1998
Figure 6Relation between the intrinsic pulse width and local magnitude for a) cluster 1, b) cluster 2 and
c) cluster 3.
G-Akis Tselentis86 Pure appl. geophys.,
log L=0.76ML−2.75 (circular crack)
log L=0.76ML−2.79 (bilateral fault) cluster 3 (11c)
log L=0.76ML−2.90 (unilateral fault)
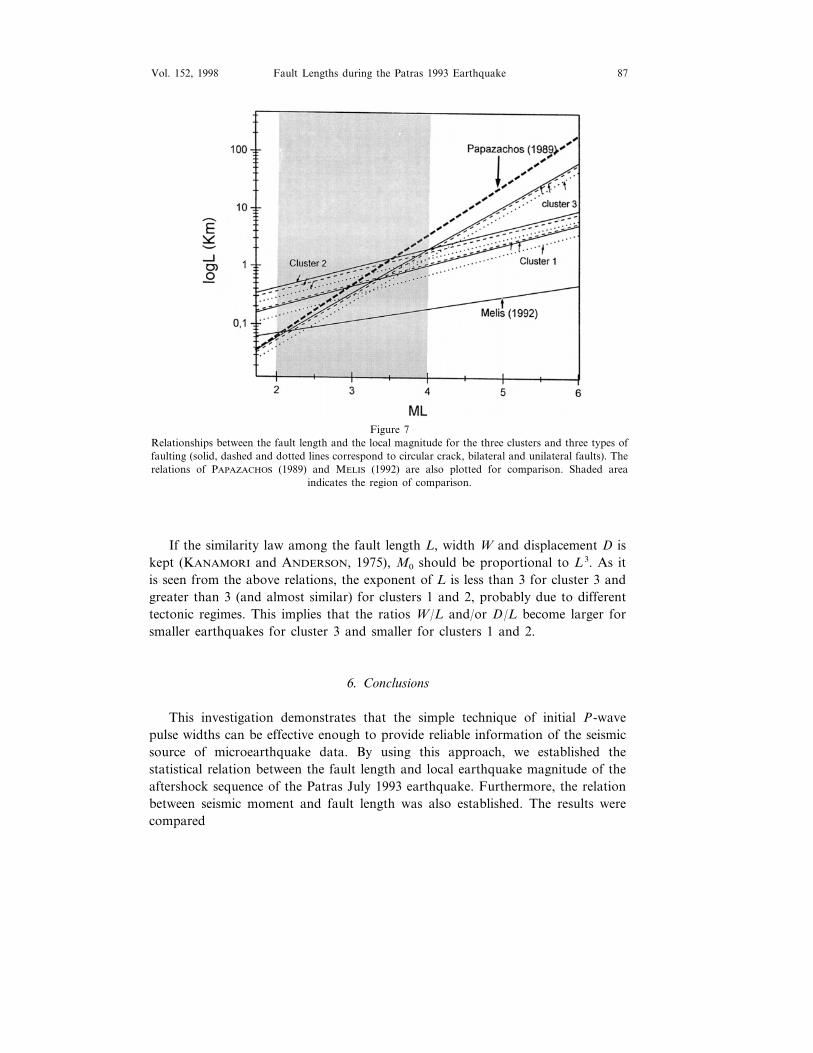
All the above relations are presented in Figure 7. As is seen in the figure, eventscorresponding to clusters 1 and 2 manifest similar dependence between ML andfault length L. This cannot be observed for the events of cluster 3 and possibly canbe explained by the totally different tectonic regime of this region.
PAPAZACHOS (1989) proposed the following statistical correlation between faultlength L and MS
log L=−1.8590.51 MS. (12)
Taking into consideration the recently published relation between ML and MS forthe area of Greece (PAPAZACHOS et al., 1997)
ML=0.58 MS+2.14(3.0BMSB6.0) (13)we obtain
log L=0.87 ML−2.94. (14)
This relation is also depicted in Figure 6 and it seems to be in good agreement withthe results of the present study (for the magnitude interval 2BMLB4.0 for whicheq. (11) can be considered as valid).
MELIS (1992) examined the spectra of 94 microearthquakes in the region of thepresent investigation and proposed the following relations between seismic moment(M0), local magnitude and circular source radius (r in m)
log M0=8.45+1.54 ML (15)
log M0=−2+7.28 log r (16)
from which we can derive the relation (assuming L=2r)
log L=0.21 ML−1.86 (in km). (17)
This relation is also depicted in Figure 6 and it shows systematically lower L formagnitudes higher than 2.0 R.
By combining the relation between seismic moment and ML (eq. 15) with eqs.(11a,b,c) corresponding to the circular crack, we obtain the following relationsbetween seismic moment and source dimensions for clusters 1, 2 and 3, respectively.
M0=9.12×10¹⁴L4.33 (18a)
M0=1.77×10¹³L4.52 (18b)
M0=1.58×10¹⁴L2.03. (18c)
Fault Lengths during the Patras 1993 Earthquake 87Vol. 152, 1998
Figure 7Relationships between the fault length and the local magnitude for the three clusters and three types offaulting (solid, dashed and dotted lines correspond to circular crack, bilateral and unilateral faults). Therelations of PAPAZACHOS (1989) and MELIS (1992) are also plotted for comparison. Shaded area
indicates the region of comparison.
If the similarity law among the fault length L, width W and displacement D iskept (KANAMORI and ANDERSON, 1975), M0 should be proportional to L3. As itis seen from the above relations, the exponent of L is less than 3 for cluster 3 andgreater than 3 (and almost similar) for clusters 1 and 2, probably due to differenttectonic regimes. This implies that the ratios W/L and/or D/L become larger forsmaller earthquakes for cluster 3 and smaller for clusters 1 and 2.
6. Conclusions
This investigation demonstrates that the simple technique of initial P-wavepulse widths can be effective enough to provide reliable information of the seismicsource of microearthquake data. By using this approach, we established thestatistical relation between the fault length and local earthquake magnitude of theaftershock sequence of the Patras July 1993 earthquake. Furthermore, the relationbetween seismic moment and fault length was also established. The results werecompared
G-Akis Tselentis88 Pure appl. geophys.,
with other published relations and revealed that the ratios of fault width and/ordisplacement to length were greater for cluster 3 and smaller for clusters 1 and 2which could be explained by the different tectonics of the regions covered byclusters 1, 2 and 3, respectively.
Acknowledgements
I am grateful to Drs. N. Melis, P. Burton, J. Zahradnik, T. Sokos and ananonymous reviewer for their most useful suggestions.
REFERENCES
BRUNE, J. N. (1970), Tectonic Stress and the Spectra of Seismic Shear Wa6es from Earthquakes, J.Geophys. Res. 75, 4997–5009.
FRANKEL, A. (1981), Source Parameters and Scaling Relationships of Small Earthquakes in the North-eastern Caribbean, Bull. Seismol. Soc. Am. 71, 1173–1190.
FRANKEL, A., and KANAMORI, H. (1983), Determination of Rupture Duration and Stress Drop forEarthquakes in Southern California, Bull. Seismol. Soc. Am. 73, 1527–1551.
GLADWIN, M. T., and STACEY, F. D. (1974), Anelastic Degradation of Acoustic Pulses in Rock, Phys.Earth Planet. Inter. 8, 332–336.
LEE, W. H. K., BENNET, R. E., and MEAGHER, K. L. (1972), A Method of Estimating Magnitude ofLocal Earthquakes from Signal Duration, USGA Open File Report, 1–28.
LEE, W. H. K., and VALDES, C. M. (1985), HYPO71PC: A Personal Computer Version of the HYPO71Earthquake Location Program, USGS Open File Report, 1–28.
MELIS, N. S. (1992), Earthquake Hazard and Crustal Deformation in Central Greece, Ph.D. Thesis,University of Wales, UK.
MELIS, N. S., BURTON, P. W., and BROOKS, M. (1995), Coseismic Crustal Deformation from Microseis-micity in the Patras Area, Geophys. J. Int. 122, 815–836.
OHTAKE, M. (1986), Fault Length of Small Sized Earthquakes as Estimated from the Pulse Width ofInitial P Wa6e, J. Phys. Earth 34, 397–406.
O’NEILL, M. E., and HEALY, J. H. (1973), Determination of Source Parameters of Small Earthquakesfrom P-wa6e Rise Time, Bull. Seismol. Soc. Am. 63, 599–614.
O’NEILL, M. E. (1984), Source Dimensions and Stress Drops of Small Earthquakes near Parkfield,California, Bull. Seismol. Soc. Am. 74 (1), 22–40.
PAPAZACHOS, B. C., KIRATZI, A. A., and KARACOSTAS, B. G. (1997), Toward a HomogeneousMoment-magnitude Determination for Earthquakes in Greece and the Surrounding Area, Bull. Seismol.Soc. Am. 87 (2), 474–483.
PEDOTTI, G. (1988), Etude sismotectonique du Peloponnese et response sismique d ’une 6alle sedimentaireen Grece du Nord, These, Universite Joseph Fourier, Grenoble.
SOKOS, E., TSELENTIS, G.-A., PLICKA, V., and ZAHRADNIK, J. (1987), An Attempt to Explain StrongMotion Records of Patras 93 Earthquake, IASPEI, Abstracts, p. 333.
TSELENTIS, G.-A., MAKROPOULOS, K., and VOULGARIS, N. (1989), Cluster and Spectral Characteristicsof the Aftershock Acti6ity of the Kalamata, September 13, 1986 Earthquake, S. Greece, Tectonophysics169, 135–148.
TSELENTIS, G.-A. (1993), Depth Dependent Seismic Attenuation in W. Greece, Tectonophysics 225,523–528.
TSELENTIS, G.-A., XANALATOS, N., and MELIS, N. S. (1994), SISMWIN: A Computer Program forSeismological Data Phase Picking and Processing, Report C2, Patras Seismological Centre, 76pp.
Fault Lengths during the Patras 1993 Earthquake 89Vol. 152, 1998
TSELENTIS, G.-A., MELIS, N. S., and SOKOS, E. (1994), The Patras (July 1993) Earthquake Sequence asit was Recorded by the Patras Seismic Network, Proc. Conf. Geol. Soc. Greece, Thessaloniki.
TSELENTIS, G.-A., KOUKIS, G., SOKOS, E., RUBAS, D., JANSKY, J., PLICKA, V., PAKZAD, M., andZAHRADNIK, J. (1996), Modelling the Strong Ground Motions in the City of Patras, Greece, during July1993 Earthquake, Proc. Eleventh WCEE, Acapulco, Mexico, vol. 1, pp. 238–246.
TSELENTIS, G.-A. (1997), Intrinsic and Scattering Seismic Attenuation in W. Greece, Pure appl. geophys.,in press.
WU, H., and LEES, J. (1996), Attenuation Structure of Coso Geothermal Area, California, from Wa6ePulse Widths, Bull. Seismol. Soc. Am. 86 (5), 1574–1590.
ZUCCA, J. J., HUTCHINGS, L. J., and KASAMEYER, P. W. (1994), Seismic Velocity and AttenuationStructure of the Geysers Geothermal Field, California, Geothermics 23, 111–126.
(Received June 16, 1997, accepted October 18, 1997)
.


![Miaoulis M [2015], Old Cathedrals of Patras](https://img.dokumen.tips/doc/110x75/6322da3f078ed8e56c0a97c1/miaoulis-m-2015-old-cathedrals-of-patras.jpg)


