Embed Size (px)
Citation preview
econstorMake Your Publications Visible.
A Service of
zbwLeibniz-InformationszentrumWirtschaftLeibniz Information Centrefor Economics
Gulati, Ashok; Juneja, Ritika
Working Paper
Farm mechanization in Indian agriculture with focuson tractors
ZEF Discussion Papers on Development Policy, No. 297
Provided in Cooperation with:Zentrum für Entwicklungsforschung / Center for Development Research (ZEF), University ofBonn
Suggested Citation: Gulati, Ashok; Juneja, Ritika (2020) : Farm mechanization in Indianagriculture with focus on tractors, ZEF Discussion Papers on Development Policy, No. 297,University of Bonn, Center for Development Research (ZEF), Bonn
This Version is available at:http://hdl.handle.net/10419/229975
Standard-Nutzungsbedingungen:
Die Dokumente auf EconStor dürfen zu eigenen wissenschaftlichenZwecken und zum Privatgebrauch gespeichert und kopiert werden.
Sie dürfen die Dokumente nicht für öffentliche oder kommerzielleZwecke vervielfältigen, öffentlich ausstellen, öffentlich zugänglichmachen, vertreiben oder anderweitig nutzen.
Sofern die Verfasser die Dokumente unter Open-Content-Lizenzen(insbesondere CC-Lizenzen) zur Verfügung gestellt haben sollten,gelten abweichend von diesen Nutzungsbedingungen die in der dortgenannten Lizenz gewährten Nutzungsrechte.
Terms of use:
Documents in EconStor may be saved and copied for yourpersonal and scholarly purposes.
You are not to copy documents for public or commercialpurposes, to exhibit the documents publicly, to make thempublicly available on the internet, or to distribute or otherwiseuse the documents in public.
If the documents have been made available under an OpenContent Licence (especially Creative Commons Licences), youmay exercise further usage rights as specified in the indicatedlicence.
www.econstor.eu
ZEF-Discussion Papers on Development Policy No. 297
Ashok Gulati and Ritika Juneja
Farm Mechanization in Indian Agriculture with Focus on Tractors
Bonn, September 2020
The CENTER FOR DEVELOPMENT RESEARCH (ZEF) was established in 1995 as an international,
interdisciplinary research institute at the University of Bonn. Research and teaching at ZEF
address political, economic and ecological development problems. ZEF closely cooperates
with national and international partners in research and development organizations. For
information, see: www.zef.de.
ZEF – Discussion Papers on Development Policy are intended to stimulate discussion among
researchers, practitioners and policy makers on current and emerging development issues.
Each paper has been exposed to an internal discussion within the Center for Development
Research (ZEF) and an external review. The papers mostly reflect work in progress. The
Editorial Committee of the ZEF – DISCUSSION PAPERS ON DEVELOPMENT POLICY includes
Joachim von Braun (Chair), Christian Borgemeister, and Eva Youkhana. Alisher Mirzabaev is
the Managing Editor of the series.
Ashok Gulati and Ritika Juneja, Farm Mechanization in Indian Agriculture with Focus on
Tractors, ZEF – Discussion Papers on Development Policy No. 297, Center for Development
Research, Bonn, September 2020, pp. 30.
ISSN: 1436-9931
Published by:
Zentrum für Entwicklungsforschung (ZEF)
Center for Development Research
Genscherallee 3
D – 53113 Bonn
Germany
Phone: +49-228-73-1861
Fax: +49-228-73-1869
E-Mail: [email protected]
www.zef.de
The authors:
Ashok Gulati, Indian Council for Research on International Economic Relations (ICRIER).
Contact: [email protected]; [email protected]
Ritika Juneja, Indian Council for Research on International Economic Relations (ICRIER).
Contact: [email protected]; [email protected]
Acknowledgements
The authors would like to sincerely thank and appreciate Abhinav Jain’s contribution to this
study. Abhinav was initially a part of the team when data collation and processing were
being undertaken. But he had to leave mid-stream for his higher studies and, therefore,
could not be with us for the analysis and writing of this discussion paper. We would also like
to thank the Tractor and Mechanization Association (TMA) for providing us with relevant
data along with useful insights that helped us immensely to understand and analyze the
dynamics of tractor use in Indian agriculture. Finally, we would also like to express our deep
appreciation and gratitude to the “Program of Accompanying Research for Agricultural
Innovation” (PARI) and the German Federal Ministry of Economic Cooperation and
Development (BMZ) for funding the study.
Abstract
Indian agriculture is dominated by smallholders. With an average holding size of just 1.08
hectares (ha) (in 2015-16), and 86 percent of holdings being of less than 2 ha in size, Indian
agriculture transformed the country from functioning ‘ship-to-mouth’ during the mid-1960s
to being a net exporter of agri-produce today. This would not have been possible without
the onset of the Green Revolution post-1965, which resulted in increased foodgrain
production and productivity. Among various inputs such as seeds, irrigation and fertilizers,
the productivity of farms also depends greatly on the availability and judicious use of farm
power by the farmers. Between the mid-20th century and 2013-14, India witnessed a
tremendous shift away from traditional agriculture processes to mechanized processes.
Today, 88 percent of the total farm power comes from tractors, diesel engine pump-sets,
electric pump-sets and power tillers (2013-14). Additionally, India has emerged as the
largest manufacturer of tractors in the world, followed by the USA and China. But how has
farm mechanization, especially the use of tractors, evolved in India over time? What were
the key drivers of the demand for tractors? And how efficiently are the tractors being used
in terms of usage by number of hours/year? Given the high cost of tractors, it is also
interesting to see how far they have penetrated the small and marginal holdings, i.e., the
issues of inclusiveness, financial viability and sustainability. These are some of the key
questions that are addressed in this study.
Our analysis shows that farm mechanization in India, especially the use of tractors, has
made commendable progress. With major policy changes, entry of private farm machinery
manufacturing companies and foreign collaborations, farm power availability increased
from 0.25 kilowatt per hectare (kW/ha) in 1951 to 2.02 kW/ha in 2017. Furthermore, the
contribution of mechanized sources to farm power increased from some 3 percent in 1951
to 88 percent in 2013-14, replacing human and draught power. In addition, the production
of tractors increased significantly from a meager 880 units in 1951 to about 900,000 units in
2019. This has transformed India from being a net importer of tractors through the 1960s
and 1970s to being an exporter of tractors, exporting some 92,000 units in 2019. In terms of
inclusiveness, although larger farms are more mechanized, the Input Census data (2011-12)
reveals that even in the category of small and marginal holdings (less than 2 ha), an average
of roughly 44 percent of farmers use farm machinery (e.g., tractors, diesel engine pump
sets, electric pump sets and power tillers). This is a good achievement, but further
improvements are always possible and major attempts in this direction are already
underway with heavy policy support through Custom Hiring Centres (CHCs). However, the
fact that farm machinery is expensive also raises concerns over whether it is financially
viable and sustainable to own and use on smallholder farms. It is therefore important to
look at unfolding innovations providing farm machinery services through ‘CHCs’ and
‘Uberization’ models. These innovations make farm machinery and equipments perfectly

divisible as a service to all classes of farmers at the doorstep at affordable cost on a ‘pay per
use’ basis. This seems to be the future of farm machinery usage in India, if it is developed as
a sustainable business model with due support of policy and finance.
Keywords: Farm Mechanization, Tractors, Custom Hiring Centres, Uberization
JEL codes: Q1, Q12, Q15, O31
Executive Summary
In a smallholder agriculture like India’s, it remains a challenge to raise productivity and
increase farmers’ incomes through agri-operations. It requires continuous upgrading of
technology and innovations for easy access to modern inputs at reasonable costs. Farm
mechanization in agriculture is one such catalytic instrument that can facilitate higher
output and productivity by converting many erstwhile subsistence farmers working on small
holdings using human and animal power into vibrant commercial farmers using mechanized
sources of farm power. This can ensure timely farm operations, reduce losses and improve
agricultural incomes, which may further incentivize farmers to increase cropping intensity
and diversify in agriculture. Thus, farm power is an essential input in agriculture for carrying
out different field operations efficiently. This study primarily focuses on the evolution of
farm mechanization, with the prime focus on tractors, its efficiency in usage, its reach to
small and marginal holders, and its financial viability and sustainability. It also tests the
hypothesis that certain key drivers influence the demand for tractors using appropriate
econometric tools, and highlights the innovations in the institutional set-up for use of
tractors in a manner that can help agriculture in general and smallholders in particular.
The evolution of tractor use in Indian agriculture can be traced back to before the country’s
independence and can broadly be classified into three phases – (1) Before the Green
Revolution; (2) Post Green Revolution; and (3) After the tractor industry was fully de-
licensed and freed from any controls. After the introduction of steam tractors in 1914 for
the reclamation of wasteland and the eradication of ‘Kans’1, in 1947, the Central Tractor
Organization (CTO) was set up to promote the use of tractors in agriculture. The beginning
of the domestic production of tractors in India is however marked by the entry of five
manufacturing companies namely Eicher Tractors Ltd.; Tractors and Farm Equipment Ltd.
(TAFE); Gujarat Tractors Ltd.; Escorts Ltd.; and Mahindra & Mahindra Ltd. using foreign
collaborations. As a result, domestic production of tractors rose from a meager 880 units in
1961-62 to 5,000 units in 1965-66. However, the real breakthrough came with the onset of
the Green Revolution that created demand for farm machinery, both for groundwater
irrigation through pump sets (electric and diesel) and tractors for several field operations,
leading to major transformation from human and draught power to mechanized farm power
for better performance and higher productivity. To meet growing needs, the Government
facilitated additional entrepreneurs to begin farm machinery manufacturing in the country.
Another watershed event in the evolution of the tractor industry was the total de-licensing
of the tractor manufacturing in 1991. As a result, both the production and competition in
the industry increased, and in the financial year (FY) 2018-19, India produced almost
1 The dictionary meaning of the term ‘Kans’ is an Indian grass of the genus Saccharum, used in some areas for fodder, thatching, etc., and being a troublesome weed in other areas.
900,000 tractors. These figures are indicative of the growing importance of the Indian
tractor industry, which went from just 880 units in 1961-62 to about 900,000 units in 2018-
19 and thereby became the largest tractor manufacturer in the world. The study also
estimates the drivers of demand for tractors and further examines farm mechanization from
the angles of efficiency in its usage (i.e., hours/year), inclusiveness in terms of its reach to
small and marginal holders, and its financial viability and thus economic sustainability.
Judged on these three parameters, it appears that agricultural mechanization in India is
constrained by the increasing fragmentation of land that puts a damper on the ‘economies
of scale’. Most micro-studies reveal that tractors are used for 500-600 hours per year
against an economic annual norm of 1,000 hours. This indicates an over-capitalization of
farms. On inclusiveness, higher costs of tractors, compared to non-mechanized farming,
make it difficult for smallholders to purchase the machines. This makes the ownership
model inefficient, non-inclusive, and financially unsustainable. A possible way forward to
avoid these pitfalls is the unfolding innovation of “Uberization” and Custom Hiring Centres
(CHCs) for Farm Machinery, i.e., extending farm mechanization as a service on demand
based on a ‘pay per use’ model. This can ensure easy accessibility of cutting-edge
technology suited to the crop and soil profile, even for smallholders. Both the national and
state governments are already encouraging these CHCs through large subsidization
programs, but whether such policy leads to an efficient use of farm machinery in an
economically viable manner, including services being rendered to smallholders, is yet to be
seen.
Table of Content
List of Figures and Tables ............................................................................................................ i
List of Abbreviations .................................................................................................................. ii
1. Introduction ........................................................................................................................ 1
2. Lay of the Land.................................................................................................................... 3
2.1. Indian Tractor Market ................................................................................................. 5
2.2. Tractor Density in India ............................................................................................... 9
3. Drivers of Demand for Tractors in Indian Agriculture ...................................................... 11
3.1. Objective ....................................................................................................................... 11
3.2. Data Sources and Methods ........................................................................................... 12
3.3. Results ........................................................................................................................... 14
4. Farm Mechanization: Assessing Impact ........................................................................... 18
4.1. Efficiency ................................................................................................................... 18
4.2. Inclusiveness.............................................................................................................. 19
4.3. Financial Sustainability .............................................................................................. 19
5. Innovations in Providing Farm Machinery to Smallholders: “Uberization” and “Custom
Hiring Model” ........................................................................................................................... 20
6. Conclusion and Policy Recommendations ........................................................................ 26
7. References ........................................................................................................................ 28
i
List of Figures and Tables
Figure 1: Trend in average farm power availability in India (kilowatt per hectare) .................. 3
Figure 2: Percentage availability of farm power from different farm power sources ............... 4
Figure 3: Yearly production of tractors (in '000 units) ............................................................... 7
Figure 4: Yearly sales of tractors (in '000 units) ......................................................................... 8
Figure 5: Horsepower wise yearly sales of tractors (in ‘000 units) ............................................ 9
Figure 6: Tractor density by state (tractors per ‘000 hectares) ............................................... 10
Figure 7: Percentage share of various horsepower tractors in the total sale of tractors across
major states in 2016-17 ........................................................................................................... 10
Figure 8: No. of new CHCs, farm machinery banks and hi-tech hubs established between
2014-15 and 2018-19 (as of October 2019) ............................................................................. 22
Table 1: Percentage of operational holdings using power operated machinery by major size
groups (2011-12) ........................................................................................................................ 5
Table 2: Explanatory variables with description ...................................................................... 13
Table 3: Correlation matrix of selected variables .................................................................... 14
Table 4: Regression results for determining drivers of the demand for tractors in India at the
national level ............................................................................................................................ 15
Table 5: Granger causality Wald tests ...................................................................................... 16
Table 6: Regression results for determining drivers of the demand for tractors using state-
wide pooled data ...................................................................................................................... 17
Table 7: Prevailing custom hiring rates for different implements (2019) ............................... 22
ii
List of Abbreviations
CHCs Custom Hiring Centres
CPI – AL Consumer Price Index - Agricultural Labour
CTO Central Tractor Organization
FaaS Farming as a Service
FertC Fertiliser Consumption per Hectare
FMTTIs Farm Machinery Training and Testing Institutes
FY Financial Year
GIAR Gross Irrigation Ratio
Ha Hectare
hp Horsepower
ICAR Indian Council of Agricultural Research
Kms Kilometers
KVKs Krishi Vigyan Kendras
Kw/ha Kilo Watt per Hectare
MIDH Mission for Integrated Development of Horticulture
M & M Mahindra & Mahindra
NIAR Net Irrigation Ratio
NMAET National Mission on Agricultural Extension & Technology
NMOOP National Mission on Oilseeds and Oil Palm
OLS Ordinary Least Square
PPP Public Private Partnership
RD Replacement Demand
RKVY Rashtriya Krishi Vikas Yojana
INR/hour Indian Rupees per Hour
SMAM Sub-Mission on Agricultural Mechanization
TAFE Tractors and Farm Equipment Ltd
TMA Tractor and mechanization Association
WPI Wholesale Price Index
1
1. Introduction
Indian agriculture is predominantly characterized as smallholder agriculture with the average
farm holding size showing a continuous decrease from 2.28 hectares in 1970-71 to 1.08
hectares in 2015-16 (Government of India, 2015-16). Overall, 86 percent of total holdings
cover less than 2 ha each, i.e. they are categorized as small and marginal, accounting for
about 47 percent of all agricultural land in 2015-16, the latest year for which official data is
available (Government of India, 2015-16). With such small holding size, large sized, high-cost
farm machinery like tractors does not seem to be an appropriate choice. At the same time,
India has emerged as the largest producer of tractors in the world, followed by the USA and
China, producing about 900,000 tractors and exporting more than 92,000 tractors during the
Financial Year (FY) 2019 (April 2018-March 2019) (Tractor and Mechanization Association,
2019). Not only this, India has also experienced a significant shift away from human and
draught animal power in farming towards mechanical and motorized power. According to
available statistics, in 1951, about 97.4 percent of farm power was coming from human and
draught animals, but in 2013-14 their contribution had reduced to about 12 percent while
that of mechanical and electrical sources had increased from 2.6 percent in 1951 to about 88
percent in 2013-14 (Singh S., R.Singh, & S.Singh, 2014). Most importantly, tractors now
contribute about 48 percent of the total farm power. What led to this dramatic change
towards mechanical power, specifically tractors, in Indian agriculture, is a story of
transformation in Indian agriculture that may provide lessons for many smallholder
economies of South and South-East Asia as well as Sub-Saharan Africa. In order to
understand this transformation, it is necessary to revisit the Green Revolution of the mid-
1960s. The introduction of high yielding varieties of wheat and rice was accompanied by a
rising need for irrigation (Government of India, 2017). Farmers who were open to these new
grain varieties soon realized that the traditional water lifts, which were driven by draught
animals or operated manually, could not meet the water demand of the high yielding
varieties. Lift irrigation was, therefore, quickly mechanized through the use of electric motor
or diesel engine powered pumps. This was followed by the extensive use of tractors for
primary tillage and transport, as well as of tractor-powered or self-propelled harvesting
equipment to save time and labor in the race to grow at least two crops (Kharif and Rabi) in
time. In 1961-62, India produced only 880 tractors with the support of foreign
collaborations, and imported another 2,997 units (Randhawa, 1986; Singh G., 2015). But as
the Green Revolution spread, food grain production and productivity increased in the
country, raising agricultural incomes. This in turn created demand for farm machinery, both
for groundwater irrigation through pump sets (electric and diesel) and tractors for several
field operations. This led to one of the major transformations in Indian agriculture, replacing
human and draught power with new motorized farm machinery for better performance and
higher productivity.
2
In this study, we explore how India achieved its current levels of farm mechanization, with
primary focus on tractors. We use simple Ordinary Least Square (OLS) regression analysis to
test our hypothesis regarding the significance of various driving factors such as farmers’
incomes, long-term agricultural credit, real price of tractors, relative price of tractors with
respect to cost of agriculture labor, and structural changes, on the demand for tractors.
Further, we evaluate the emerging trend and government policy shift towards the institution
of “Uberization of Tractors” that promises a leap forward for more efficient utilization of
tractors on farmers’ fields at lower costs. We also look at how this is giving smallholder
farmers access to modern farm machinery, and whether this business model is scalable and
financially sustainable.
The study is organized as follows: In Section 2, we present a brief review of literature on the
landscape of farm mechanization in Indian agriculture, with focus on tractorization. Section 3
assesses the drivers of demand for tractors in Indian agriculture. It presents the hypothesis,
the methodology, and the regression results. Section 4 critically evaluates the spread of
tractors based on three parameters, namely efficiency in their usage, inclusiveness in terms
of their reach to smallholders, and sustainability in terms of economic viability. Some of the
interesting innovations and government and private company contributions to providing
farm mechanization to smallholder farmers at reasonable costs without locking in capital are
highlighted in Section 5; and Section 6 presents the conclusion and policy recommendations.
3
2. Lay of the Land
Farm mechanization plays a key role in improving agricultural productivity and reducing the
cost of production by timely farm operations. It saves labor and can reduce losses through
better management of valuable inputs, thus enhancing crop output and farm incomes, as
well as helping to reduce drudgery in farm operations. According to experts, the status of
mechanization has been a barometer for the state of rural economy in a country and is
analyzed by the growth of mechanically power-operated farm equipment over traditional
human and animal power operated equipment (Government of India, 2018a). As an
indicative measurement we therefore show the trend in the availability of farm power in
kilowatt or horsepower per hectare. With the increase in cropping intensity, the turnaround
time between harvesting one crop and preparing to sow the next is drastically reduced. This
necessitates the use of farm machinery to complete farm operations within the limited
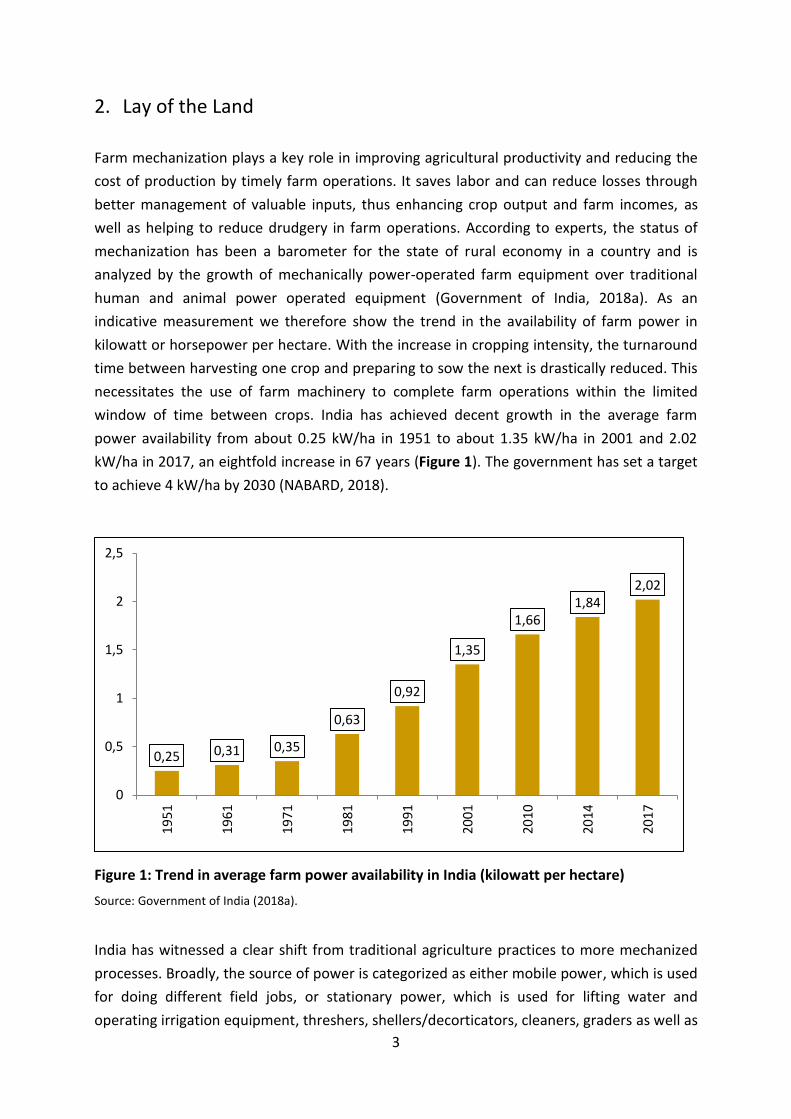
window of time between crops. India has achieved decent growth in the average farm
power availability from about 0.25 kW/ha in 1951 to about 1.35 kW/ha in 2001 and 2.02
kW/ha in 2017, an eightfold increase in 67 years (Figure 1). The government has set a target
to achieve 4 kW/ha by 2030 (NABARD, 2018).
Figure 1: Trend in average farm power availability in India (kilowatt per hectare)
Source: Government of India (2018a).
India has witnessed a clear shift from traditional agriculture practices to more mechanized
processes. Broadly, the source of power is categorized as either mobile power, which is used
for doing different field jobs, or stationary power, which is used for lifting water and
operating irrigation equipment, threshers, shellers/decorticators, cleaners, graders as well as
0,25 0,31 0,35
0,63
0,92
1,35
1,661,84
2,02
0
0,5
1
1,5
2
2,5
1951
1961
1971
1981
199
1
2001
2010
2014
2017
4
for other post-harvest operations. Mobile farm power comes from human, draught animals,
power tillers, tractors and self-propelled machines, whereas stationary power is obtained
from oil engines (diesel, petrol, kerosene) and electric motors. Over the last few decades,
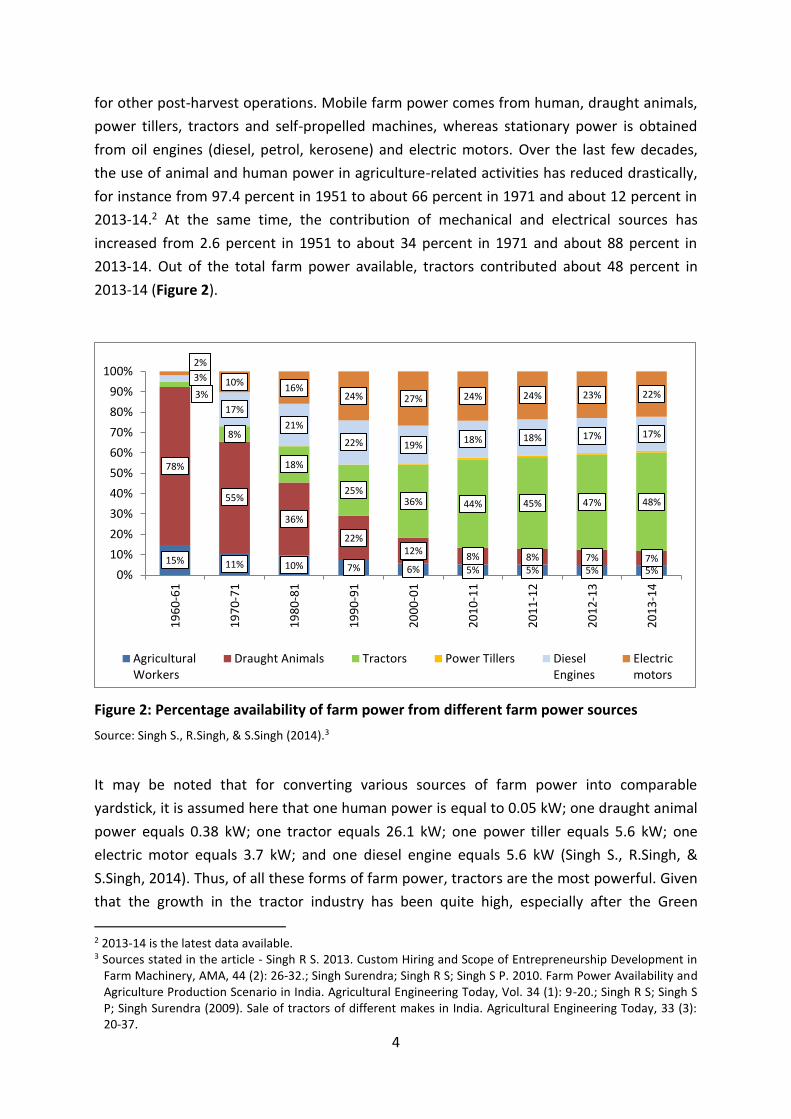
the use of animal and human power in agriculture-related activities has reduced drastically,
for instance from 97.4 percent in 1951 to about 66 percent in 1971 and about 12 percent in
2013-14.2 At the same time, the contribution of mechanical and electrical sources has
increased from 2.6 percent in 1951 to about 34 percent in 1971 and about 88 percent in
2013-14. Out of the total farm power available, tractors contributed about 48 percent in
2013-14 (Figure 2).
Figure 2: Percentage availability of farm power from different farm power sources
Source: Singh S., R.Singh, & S.Singh (2014).3
It may be noted that for converting various sources of farm power into comparable
yardstick, it is assumed here that one human power is equal to 0.05 kW; one draught animal
power equals 0.38 kW; one tractor equals 26.1 kW; one power tiller equals 5.6 kW; one
electric motor equals 3.7 kW; and one diesel engine equals 5.6 kW (Singh S., R.Singh, &
S.Singh, 2014). Thus, of all these forms of farm power, tractors are the most powerful. Given
that the growth in the tractor industry has been quite high, especially after the Green
2 2013-14 is the latest data available. 3 Sources stated in the article - Singh R S. 2013. Custom Hiring and Scope of Entrepreneurship Development in
Farm Machinery, AMA, 44 (2): 26-32.; Singh Surendra; Singh R S; Singh S P. 2010. Farm Power Availability and Agriculture Production Scenario in India. Agricultural Engineering Today, Vol. 34 (1): 9-20.; Singh R S; Singh S P; Singh Surendra (2009). Sale of tractors of different makes in India. Agricultural Engineering Today, 33 (3): 20-37.
15% 11% 10% 7% 6% 5% 5% 5% 5%
78%
55%
36%
22%12%
8% 8% 7% 7%
3%
8%
18%
25%36% 44% 45% 47% 48%
3%
17%
21%
22% 19%18% 18% 17% 17%
2%
10%16%
24% 27% 24% 24% 23% 22%
0%
10%
20%
30%
40%
50%
60%
70%
80%
90%
100%
19
60
-61
19
70
-71
19
80
-81
19
90
-91
20
00
-01
20
10
-11
20
11
-12
20
12
-13
20
13
-14
AgriculturalWorkers
Draught Animals Tractors Power Tillers DieselEngines
Electricmotors
5
Revolution, and even higher after the tractor industry was de-licensed in the 1991 economic
reforms, it is not surprising to see a fast replacement of human and draught power by
tractor power in farm operations.
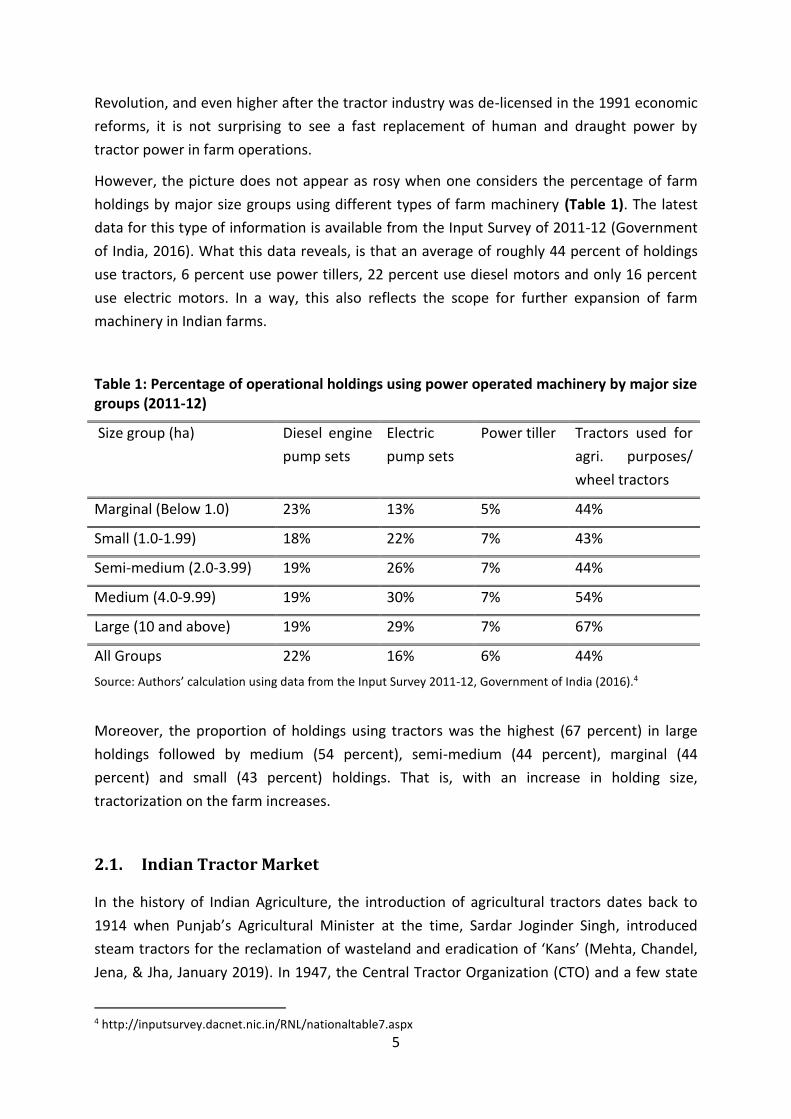
However, the picture does not appear as rosy when one considers the percentage of farm
holdings by major size groups using different types of farm machinery (Table 1). The latest
data for this type of information is available from the Input Survey of 2011-12 (Government
of India, 2016). What this data reveals, is that an average of roughly 44 percent of holdings
use tractors, 6 percent use power tillers, 22 percent use diesel motors and only 16 percent
use electric motors. In a way, this also reflects the scope for further expansion of farm
machinery in Indian farms.
Table 1: Percentage of operational holdings using power operated machinery by major size groups (2011-12)
Size group (ha) Diesel engine
pump sets
Electric
pump sets
Power tiller Tractors used for
agri. purposes/
wheel tractors
Marginal (Below 1.0) 23% 13% 5% 44%
Small (1.0-1.99) 18% 22% 7% 43%
Semi-medium (2.0-3.99) 19% 26% 7% 44%
Medium (4.0-9.99) 19% 30% 7% 54%
Large (10 and above) 19% 29% 7% 67%
All Groups 22% 16% 6% 44%
Source: Authors’ calculation using data from the Input Survey 2011-12, Government of India (2016).4
Moreover, the proportion of holdings using tractors was the highest (67 percent) in large
holdings followed by medium (54 percent), semi-medium (44 percent), marginal (44
percent) and small (43 percent) holdings. That is, with an increase in holding size,
tractorization on the farm increases.
2.1. Indian Tractor Market
In the history of Indian Agriculture, the introduction of agricultural tractors dates back to
1914 when Punjab’s Agricultural Minister at the time, Sardar Joginder Singh, introduced
steam tractors for the reclamation of wasteland and eradication of ‘Kans’ (Mehta, Chandel,
Jena, & Jha, January 2019). In 1947, the Central Tractor Organization (CTO) and a few state
4 http://inputsurvey.dacnet.nic.in/RNL/nationaltable7.aspx
6
tractor organizations were set up to develop and promote the use of tractors in agriculture
(Singh, 2015) . In 1951, the tractor industry was included in the “core sector” of the planned
economic development, which marked its strategic importance. Until 1960, the demand for
tractors was met entirely through imports, mainly from East European countries (Singh,
2015). In 1961, two companies namely Eicher Tractors Ltd. (in collaboration with Gebr,
Eicher Traktorenfabrik, West Germany) and Tractors and Farm Equipment Ltd. (TAFE) (in
collaboration with Messey Ferguson, UK) started manufacturing tractors in India. Further, in
1963, Gujarat Tractors Limited Tractors and Bulldozers Limited (in collaboration with
Motokov-Praha, Czechoslovakia) followed by Escorts Ltd. (in collaboration with Moloimport
Warazawa Zaklady Mechaniczne Ursus, Poland (1964)) were also set up for the domestic
production of tractors. In 1965, Mahindra & Mahindra Ltd. (a major player in the automobile
sector) collaborated with International Tractor Company of India Ltd. which was itself set up
in the year 1963 in collaboration with UK’s International Harvesters (Singh, 2015). As a
result, the domestic production of tractors rose from 880 units in 1961-62 to 5,000 units in
1965-66. However, to protect farmers’ interests, the Government imposed in 1967 a
statutory price control on domestically produced tractors (Singh, 2015) which was later
revoked in 1974.
To meet the growing demand for tractors fueled by the Green Revolution, the Government
decided to invite additional entrepreneurs into tractor manufacturing in 1968. In 1971,
Escorts established Escort Tractors Ltd. and started manufacturing Ford tractors in
collaboration with Ford, U.K. Several other domestic manufactures such as VST Tillers &
Tractors Ltd. etc. also invested in the industry and started domestic production. The real
breakthrough came in 1974, when Punjab Tractors Ltd. became the first public sector
company to start manufacturing tractors with indigenous technology (Mehta, Chandel, Jena,
& Jha, January 2019) and produced the first agricultural tractor ‘Swaraj’. During this period,
the Government ensured adequate rural lending through the expansion of commercial
banks in remote villages for the overall agricultural development. As a result, the tractor
market expanded rapidly. Production crossed the 30,000-mark in 1974-75 (Figure 3).
Further, in 1982, the indigenous Mahindra brand of tractors was launched and the company
became the market leader in the tractor industry.5 As a result, during the 1980s, India
started exporting tractors, mainly to African countries (Singh, 2015).
In 1991, another watershed event in the transformational story of Indian tractor industry
took place: A complete de-licensing of tractor manufacturing in India increased competition
in the industry. The growth in the tractor production was accompanied by an increase in the
number of models produced to meet the diverse needs of the farmers, ranging from 21
horsepower to 50 horsepower (hp) tractors. In this way, the Indian tractor industry has
developed and emerged as the largest market worldwide (excluding sub 20 hp belt driven
tractors used in China), followed by the USA and China (Tractor and Mechanization
5 https://www.business-standard.com/company/m-m-365/information/company-history
7
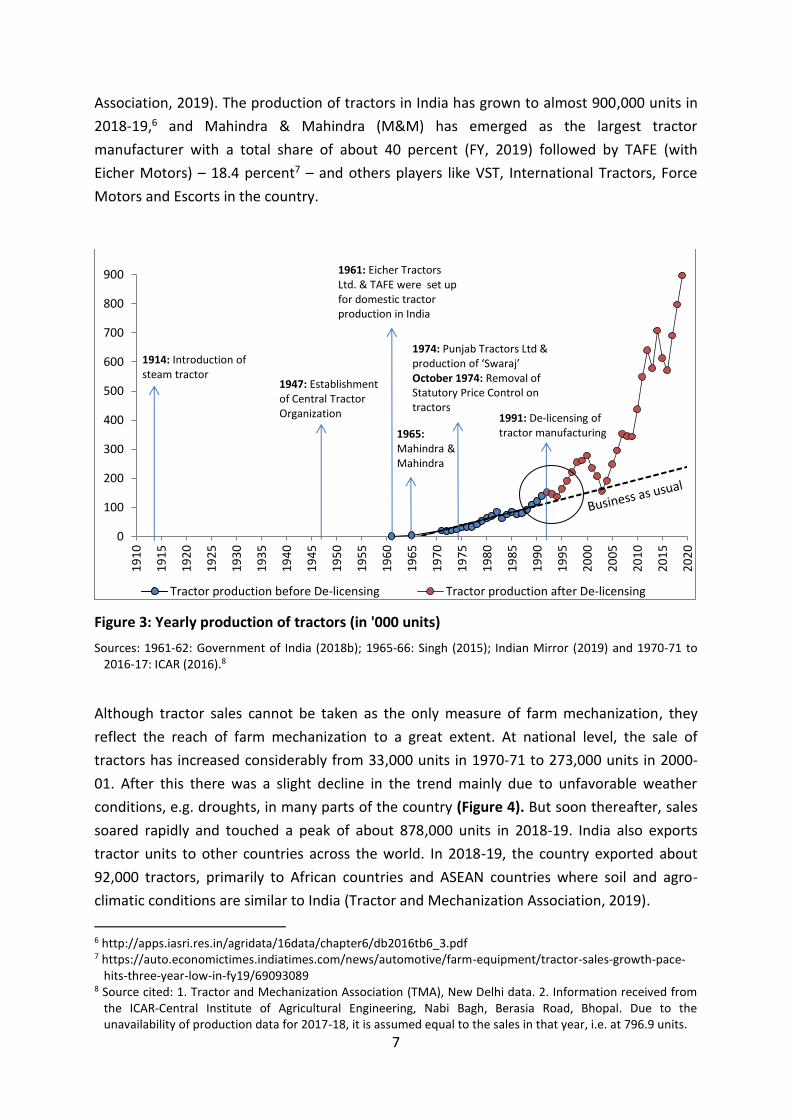
Association, 2019). The production of tractors in India has grown to almost 900,000 units in
2018-19,6 and Mahindra & Mahindra (M&M) has emerged as the largest tractor
manufacturer with a total share of about 40 percent (FY, 2019) followed by TAFE (with
Eicher Motors) – 18.4 percent7 – and others players like VST, International Tractors, Force
Motors and Escorts in the country.
Figure 3: Yearly production of tractors (in '000 units)
Sources: 1961-62: Government of India (2018b); 1965-66: Singh (2015); Indian Mirror (2019) and 1970-71 to 2016-17: ICAR (2016).8
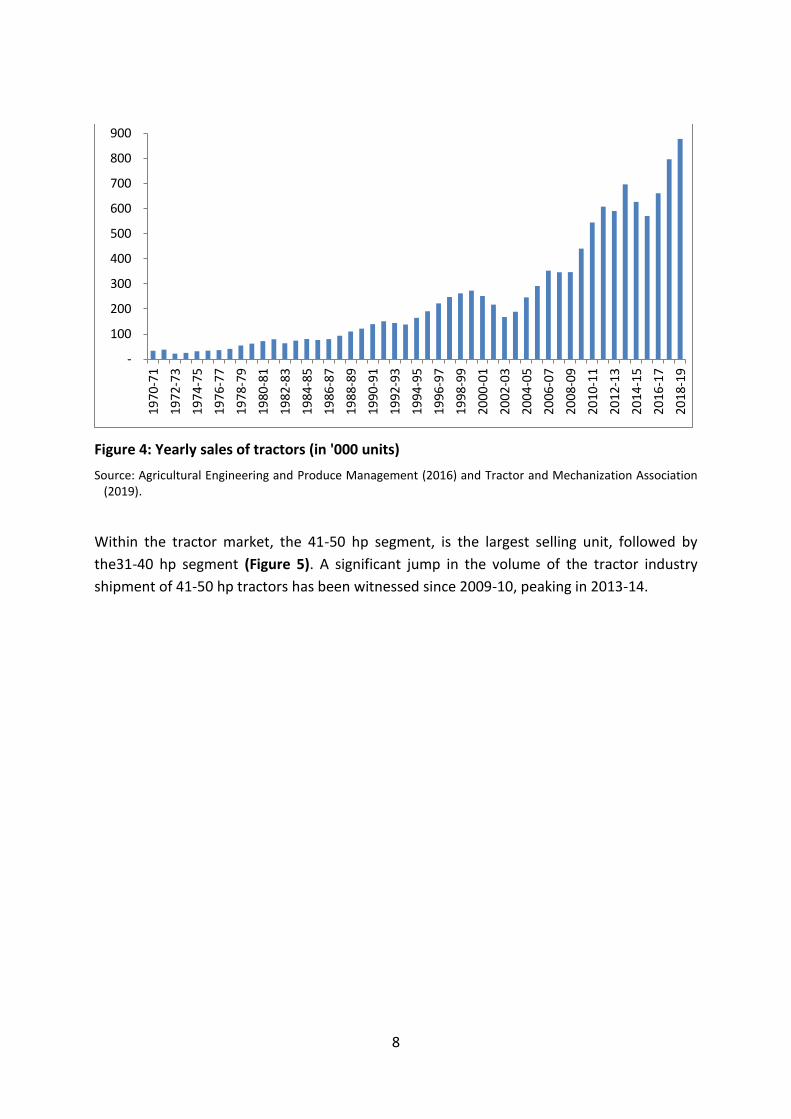
Although tractor sales cannot be taken as the only measure of farm mechanization, they
reflect the reach of farm mechanization to a great extent. At national level, the sale of
tractors has increased considerably from 33,000 units in 1970-71 to 273,000 units in 2000-
01. After this there was a slight decline in the trend mainly due to unfavorable weather
conditions, e.g. droughts, in many parts of the country (Figure 4). But soon thereafter, sales
soared rapidly and touched a peak of about 878,000 units in 2018-19. India also exports
tractor units to other countries across the world. In 2018-19, the country exported about
92,000 tractors, primarily to African countries and ASEAN countries where soil and agro-
climatic conditions are similar to India (Tractor and Mechanization Association, 2019).
6 http://apps.iasri.res.in/agridata/16data/chapter6/db2016tb6_3.pdf 7 https://auto.economictimes.indiatimes.com/news/automotive/farm-equipment/tractor-sales-growth-pace-
hits-three-year-low-in-fy19/69093089 8 Source cited: 1. Tractor and Mechanization Association (TMA), New Delhi data. 2. Information received from
the ICAR-Central Institute of Agricultural Engineering, Nabi Bagh, Berasia Road, Bhopal. Due to the unavailability of production data for 2017-18, it is assumed equal to the sales in that year, i.e. at 796.9 units.
0
100
200
300
400
500
600
700
800
900
19
10
19
15
19
20
19
25
19
30
19
35
19
40
19
45
19
50
19
55
19
60
19
65
19
70
19
75
19
80
19
85
19
90
19
95
20
00
20
05
20
10
20
15
20
20
Tractor production before De-licensing Tractor production after De-licensing
1914: Introduction of steam tractor
1947: Establishment of Central Tractor Organization
1961: Eicher Tractors Ltd. & TAFE were set up for domestic tractor production in India
1965: Mahindra & Mahindra
1974: Punjab Tractors Ltd & production of ‘Swaraj’October 1974: Removal of Statutory Price Control on tractors
1991: De-licensing of tractor manufacturing
8
Figure 4: Yearly sales of tractors (in '000 units)
Source: Agricultural Engineering and Produce Management (2016) and Tractor and Mechanization Association (2019).
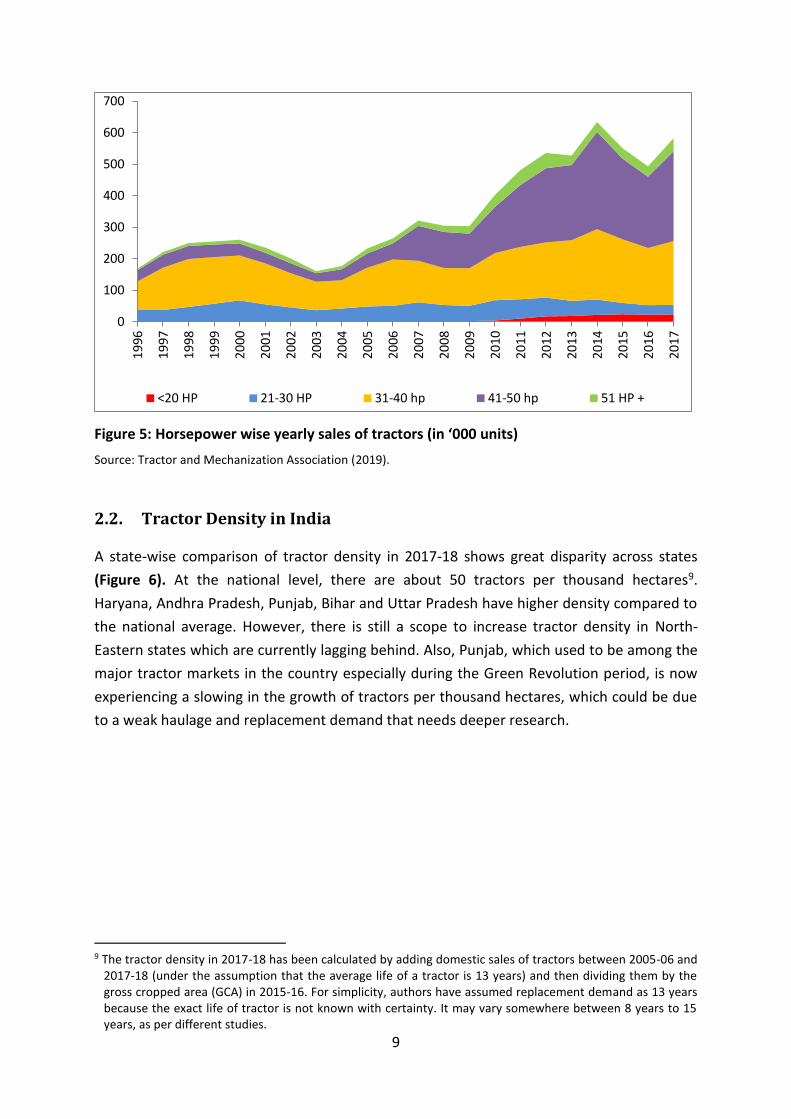
Within the tractor market, the 41-50 hp segment, is the largest selling unit, followed by
the31-40 hp segment (Figure 5). A significant jump in the volume of the tractor industry
shipment of 41-50 hp tractors has been witnessed since 2009-10, peaking in 2013-14.
-
100
200
300
400
500
600
700
800
900
19
70
-71
19
72
-73
1974
-75
19
76
-77
19
78
-79
19
80
-81
19
82
-83
19
84
-85
19
86
-87
19
88
-89
19
90
-91
1992
-93
19
94
-95
19
96
-97
19
98
-99
2000
-01
20
02
-03
20
04
-05
20
06
-07
20
08
-09
20
10
-11
20
12
-13
20
14
-15
20
16
-17
20
18
-19
9
Figure 5: Horsepower wise yearly sales of tractors (in ‘000 units)
Source: Tractor and Mechanization Association (2019).
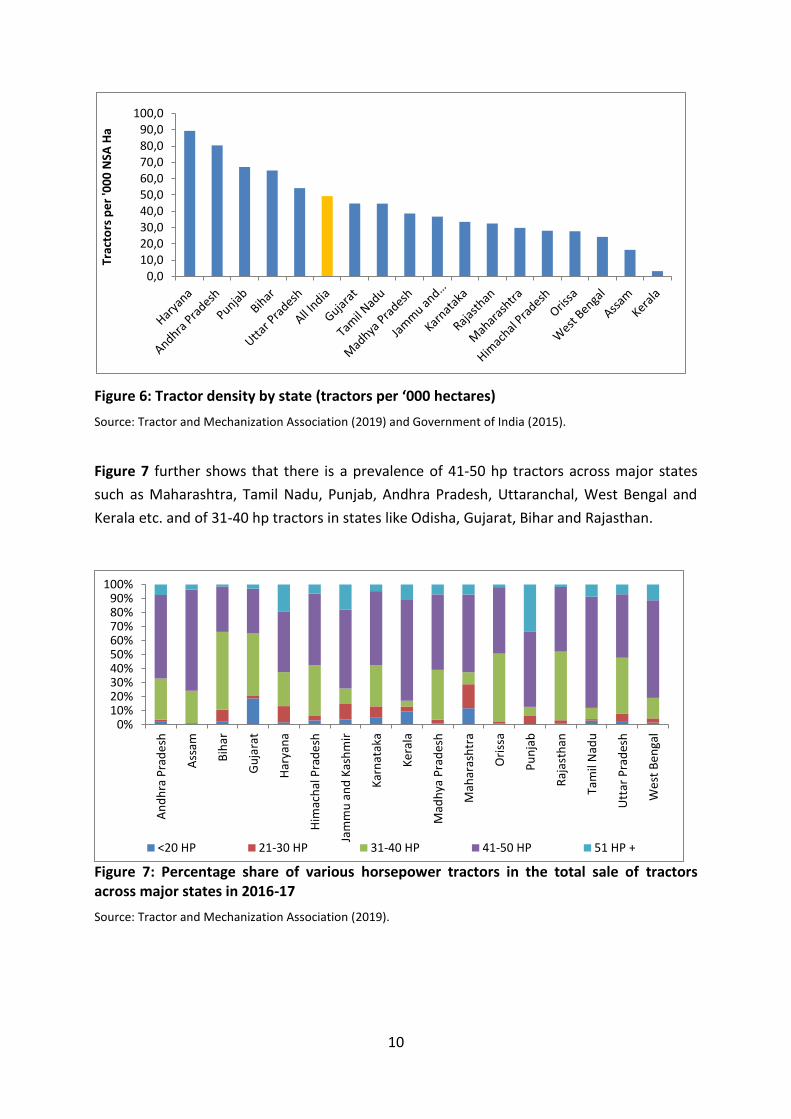
2.2. Tractor Density in India
A state-wise comparison of tractor density in 2017-18 shows great disparity across states
(Figure 6). At the national level, there are about 50 tractors per thousand hectares9.
Haryana, Andhra Pradesh, Punjab, Bihar and Uttar Pradesh have higher density compared to
the national average. However, there is still a scope to increase tractor density in North-
Eastern states which are currently lagging behind. Also, Punjab, which used to be among the
major tractor markets in the country especially during the Green Revolution period, is now
experiencing a slowing in the growth of tractors per thousand hectares, which could be due
to a weak haulage and replacement demand that needs deeper research.
9 The tractor density in 2017-18 has been calculated by adding domestic sales of tractors between 2005-06 and
2017-18 (under the assumption that the average life of a tractor is 13 years) and then dividing them by the gross cropped area (GCA) in 2015-16. For simplicity, authors have assumed replacement demand as 13 years because the exact life of tractor is not known with certainty. It may vary somewhere between 8 years to 15 years, as per different studies.
0
100
200
300
400
500
600
700
19
96
1997
19
98
19
99
20
00
20
01
20
02
20
03
20
04
20
05
20
06
20
07
20
08
20
09
2010
2011
20
12
20
13
20
14
20
15
20
16
20
17
<20 HP 21-30 HP 31-40 hp 41-50 hp 51 HP +
10
0%10%20%30%40%50%60%70%80%90%
100%
An
dh
ra P
rad
esh
Ass
am
Bih
ar
Gu
jara
t
Har
yan
a
Him
ach
al P
rad
esh
Jam
mu
an
d K
ash
mir
Kar
nat
aka
Ke
rala
Mad
hya
Pra
des
h
Mah
aras
htr
a
Ori
ssa
Pu
nja
b
Raj
asth
an
Tam
il N
adu
Utt
ar P
rad
esh
We
st B
en
gal
<20 HP 21-30 HP 31-40 HP 41-50 HP 51 HP +
Figure 6: Tractor density by state (tractors per ‘000 hectares)
Source: Tractor and Mechanization Association (2019) and Government of India (2015).
Figure 7 further shows that there is a prevalence of 41-50 hp tractors across major states
such as Maharashtra, Tamil Nadu, Punjab, Andhra Pradesh, Uttaranchal, West Bengal and
Kerala etc. and of 31-40 hp tractors in states like Odisha, Gujarat, Bihar and Rajasthan.
Figure 7: Percentage share of various horsepower tractors in the total sale of tractors across major states in 2016-17
Source: Tractor and Mechanization Association (2019).
0,010,020,030,040,050,060,070,080,090,0
100,0Tr
acto
rs p
er
'00
0 N
SA H
a
11
3. Drivers of Demand for Tractors in Indian Agriculture
3.1. Objective
The objective of this study is to examine the factors influencing the demand for agricultural
tractors and to evaluate their significance and degree of association with the purchase of
agricultural tractors.
In literature on the subject, it is found that the demand for tractors in Indian agriculture
could be influenced by a host of variables, such as farmers’ income, real price of the tractors,
cost of farm labor, size of the agricultural land holding, availability of affordable agricultural
credit and agricultural profitability (Lal & Singh, 2016; Baregal & Grover, 2017). Further a
study by Mandal and Maity (2013) shows that the replacement cycle of tractors significantly
influences the demand for tractors. Therefore, in order to investigate the major factors
determining the demand for tractors in India, we carry out a regression analysis using
various combinations of the selected explanatory variables explicated in detail below:
Farmers’ Income
Farmers’ income plays a major role in determining the demand for farm machinery
(Morehouse, 1982; Lal & Singh, 2016). To capture the effect of farmers’ income on the
demand for farm tractors, we consider three proxy variables, namely the irrigation ratio
calculated as the ratio of gross irrigated area to gross cropped area;10 the irrigation ratio
calculated as the ratio of net irrigated area to net sown area;11 and the fertilizer
consumption per hectare, because the time series data for farmers’ income is not available.
In a study by Baregal and Grover (2017), it is indicated that the gross irrigated area is a
significant factor determining the demand for tractors in India, as it is expected that with
increasing irrigation cover, the overall productivity and farmers’ incomes rise.
Real Price
According to literature on the subject, the purchase price of the tractors influences the input
costs and thereby the cost of production (Sivakumar & Kaliyamoorthy, 2014; Lal & Singh,
2016). A study by Baregal and Grover (2017) reveals that the real price of tractors is a
significant variable and shows a negative association with the demand for tractors in India.
As the time series of the real price of tractors is not available, we use the Wholesale Price
10 Gross Irrigated Area (GIA) is the total irrigated areas under all crops over the various seasons of the
agriculture year (i.e. from July 1 to June 30 of the following year). Under GIA, area irrigated twice/thrice within the same agriculture year is counted as twofold/threefold (Central Water Commission, 2018).
11 Net Irrigated Area (NIA) is the area irrigated through any source once a year for a particular crop. Areas irrigated more than once within the same agriculture year are counted only once (Central Water Commission, 2018).
12
Index (WPI) of tractors as a ratio to the general Wholesale Price Index of all commodities to
capture its impact of the demand for tractors in this study.
Relative Price
Since tractors compete with labor in agriculture (Vanzetti & Quiggin, 1985), the cost of labor
measured as real farm wages is assumed to capture the substitution price effect on the
demand for tractors. We calculate the relative price of tractors as the ratio of the Wholesale
Price Index of tractors to the real wage rate.
Replacement Cycle
The replacement cycle of a machine is defined as the estimated technical working life until
the full exhaustion of their estimated services (Lips, 2017). In simple words, it is the time
period of utilization before it is replaced. According to the empirical literature, a shorter and
continuous replacement cycle of tractors is a crucial factor to boost tractor demand (Mandal
& Maity, 2013). In this analysis, we assume a replacement cycle of 13 years.
Availability of Credit
Institutional credit plays a critical role in financing the purchase of any machinery. According
to Pingali (2004), “nearly 95 per cent of purchases of mechanised power in India were
through loans taken from banks and agricultural institutions.” Studies have even found that
an increase in supply of long-term credit leads to an increase in the sale of tractors (Sarkar,
2013). According to literature on the subject, the availability of adequate farm credit is an
important determent for the demand for tractors due to the high capital cost involved in the
purchase of tractors and other farm machinery (Morehouse, 1982; Lal & Singh, 2016).
Therefore, provisions for timely availability of credit should be ensured because tractors
directly influence the process of development both on and off farm (Lal & Singh, 2016).
3.2. Data Sources and Methods
This study is entirely based on secondary data for selected dependent and independent
variables over a period of 23 years (from 1995-96 to 2017-18). Time series data for yearly
sales of tractors is collected from the Tractor and Mechanization Association (2019).
Irrigation ratios and fertilizer consumption per hectare are calculated using data from the
Land Use Statistics at a Glance, Government of India (2015) and from the statistical database
of The Fertiliser Association of India (2019). The data on prices of tractors are computed by
dividing the Wholesale Price Index of tractors by the Wholesale Price Index of all
commodities, the data for which is obtained from the Office of the Economic Adviser (2019).
In order to compute the relative price of tractors, the ratio of the Wholesale Price Index of
tractors and the real wage rate is calculated. Further, to compute time series data for the
real wage rate at the national level, the weighted average of the nominal wage rates per
13
state are converted to real wage rates using the Consumer Price Index of agriculture labor in
each state. Data on the nominal wage rates is taken from the Labour Bureau (2017). To
obtain the time series for the replacement demand of tractors, data on sales of tractors is
used with the assumption that the replacement demand arises 13 years after the original
purchase. Data on the availability of agricultural credit is obtained from the Handbook of
Statistics on Indian Economy, Reserve Bank of India (2019).
Thus, the general form of the tractor demand model (log linear) is:
Log Y = a+b1 Log X1 + b2 Log X2 + b3 Log X3 +.....+ bn Log Xn
Where,
Y= Number of tractors demanded
a = Constant term
b1, b 2, b3 ....bn = Elasticities of different explanatory variables
X1, X2, X3, ..., Xn = Explanatory variables
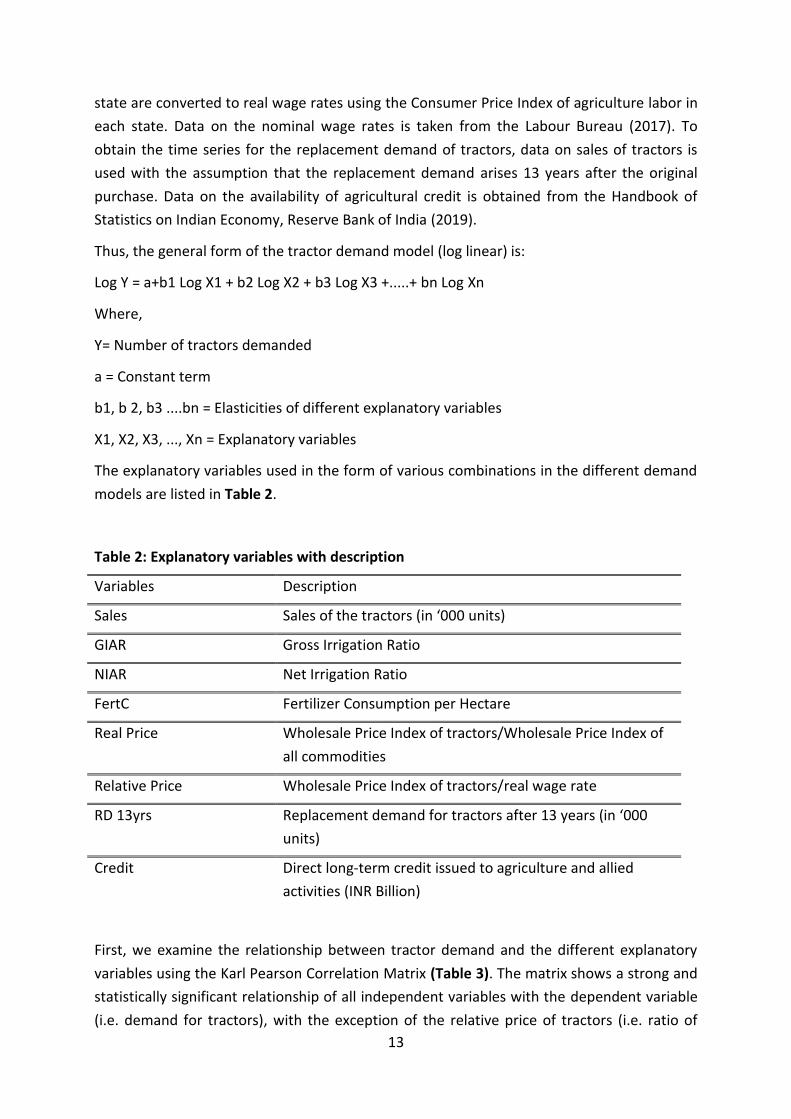
The explanatory variables used in the form of various combinations in the different demand
models are listed in Table 2.
Table 2: Explanatory variables with description
Variables Description
Sales Sales of the tractors (in ‘000 units)
GIAR Gross Irrigation Ratio
NIAR Net Irrigation Ratio
FertC Fertilizer Consumption per Hectare
Real Price Wholesale Price Index of tractors/Wholesale Price Index of
all commodities
Relative Price Wholesale Price Index of tractors/real wage rate
RD 13yrs Replacement demand for tractors after 13 years (in ‘000
units)
Credit Direct long-term credit issued to agriculture and allied
activities (INR Billion)
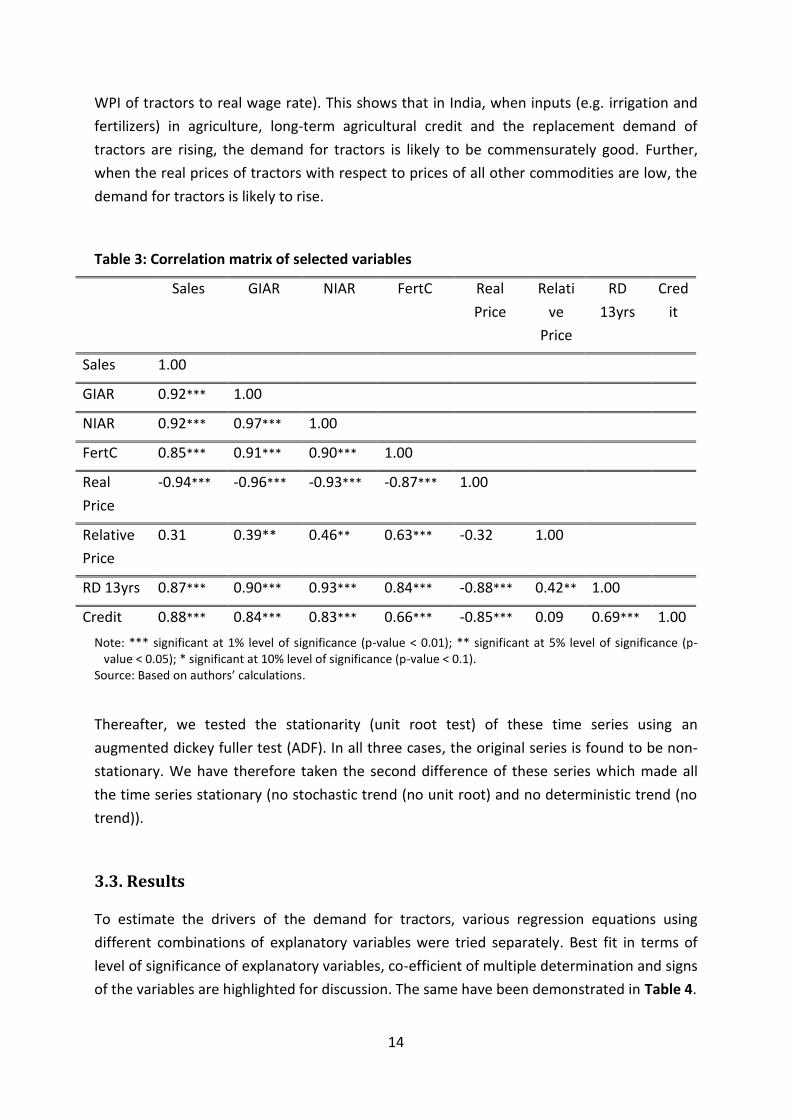
First, we examine the relationship between tractor demand and the different explanatory
variables using the Karl Pearson Correlation Matrix (Table 3). The matrix shows a strong and
statistically significant relationship of all independent variables with the dependent variable
(i.e. demand for tractors), with the exception of the relative price of tractors (i.e. ratio of
14
WPI of tractors to real wage rate). This shows that in India, when inputs (e.g. irrigation and
fertilizers) in agriculture, long-term agricultural credit and the replacement demand of
tractors are rising, the demand for tractors is likely to be commensurately good. Further,
when the real prices of tractors with respect to prices of all other commodities are low, the
demand for tractors is likely to rise.
Table 3: Correlation matrix of selected variables
Sales GIAR NIAR FertC Real
Price
Relati
ve
Price
RD
13yrs
Cred
it
Sales 1.00
GIAR 0.92*** 1.00
NIAR 0.92*** 0.97*** 1.00
FertC 0.85*** 0.91*** 0.90*** 1.00
Real
Price
-0.94*** -0.96*** -0.93*** -0.87*** 1.00
Relative
Price
0.31 0.39** 0.46** 0.63*** -0.32 1.00
RD 13yrs 0.87*** 0.90*** 0.93*** 0.84*** -0.88*** 0.42** 1.00
Credit 0.88*** 0.84*** 0.83*** 0.66*** -0.85*** 0.09 0.69*** 1.00
Note: *** significant at 1% level of significance (p-value < 0.01); ** significant at 5% level of significance (p-value < 0.05); * significant at 10% level of significance (p-value < 0.1).
Source: Based on authors’ calculations.
Thereafter, we tested the stationarity (unit root test) of these time series using an
augmented dickey fuller test (ADF). In all three cases, the original series is found to be non-
stationary. We have therefore taken the second difference of these series which made all
the time series stationary (no stochastic trend (no unit root) and no deterministic trend (no
trend)).
3.3. Results
To estimate the drivers of the demand for tractors, various regression equations using
different combinations of explanatory variables were tried separately. Best fit in terms of
level of significance of explanatory variables, co-efficient of multiple determination and signs
of the variables are highlighted for discussion. The same have been demonstrated in Table 4.
15
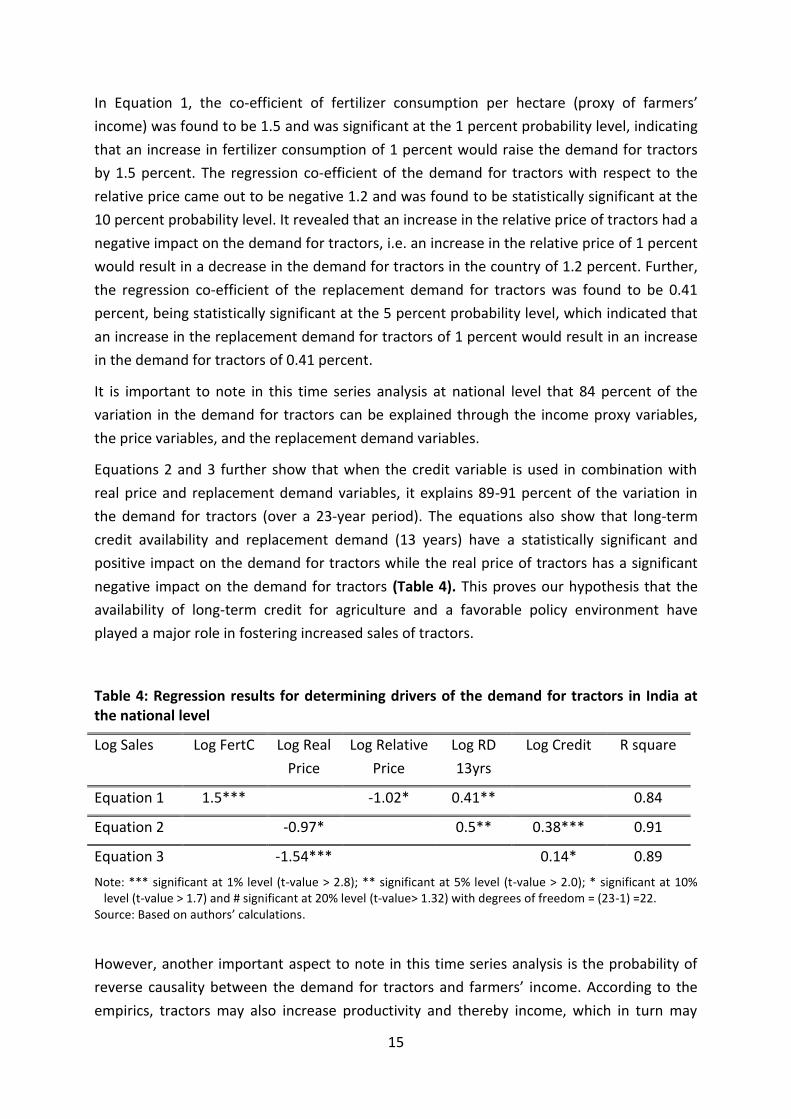
In Equation 1, the co-efficient of fertilizer consumption per hectare (proxy of farmers’
income) was found to be 1.5 and was significant at the 1 percent probability level, indicating
that an increase in fertilizer consumption of 1 percent would raise the demand for tractors
by 1.5 percent. The regression co-efficient of the demand for tractors with respect to the
relative price came out to be negative 1.2 and was found to be statistically significant at the
10 percent probability level. It revealed that an increase in the relative price of tractors had a
negative impact on the demand for tractors, i.e. an increase in the relative price of 1 percent
would result in a decrease in the demand for tractors in the country of 1.2 percent. Further,
the regression co-efficient of the replacement demand for tractors was found to be 0.41
percent, being statistically significant at the 5 percent probability level, which indicated that
an increase in the replacement demand for tractors of 1 percent would result in an increase
in the demand for tractors of 0.41 percent.
It is important to note in this time series analysis at national level that 84 percent of the
variation in the demand for tractors can be explained through the income proxy variables,
the price variables, and the replacement demand variables.
Equations 2 and 3 further show that when the credit variable is used in combination with
real price and replacement demand variables, it explains 89-91 percent of the variation in
the demand for tractors (over a 23-year period). The equations also show that long-term
credit availability and replacement demand (13 years) have a statistically significant and
positive impact on the demand for tractors while the real price of tractors has a significant
negative impact on the demand for tractors (Table 4). This proves our hypothesis that the
availability of long-term credit for agriculture and a favorable policy environment have
played a major role in fostering increased sales of tractors.
Table 4: Regression results for determining drivers of the demand for tractors in India at the national level
Log Sales Log FertC Log Real
Price
Log Relative
Price
Log RD
13yrs
Log Credit R square
Equation 1 1.5*** -1.02* 0.41** 0.84
Equation 2 -0.97* 0.5** 0.38*** 0.91
Equation 3 -1.54*** 0.14* 0.89
Note: *** significant at 1% level (t-value > 2.8); ** significant at 5% level (t-value > 2.0); * significant at 10% level (t-value > 1.7) and # significant at 20% level (t-value> 1.32) with degrees of freedom = (23-1) =22.
Source: Based on authors’ calculations.
However, another important aspect to note in this time series analysis is the probability of
reverse causality between the demand for tractors and farmers’ income. According to the
empirics, tractors may also increase productivity and thereby income, which in turn may
16
.
logGIAR ALL 461.32 12 0.000
logGIAR logFert 82.856 4 0.000
logGIAR logNIAR 131.53 4 0.000
logGIAR logsales 100.7 4 0.000
logFert ALL 252.55 12 0.000
logFert logGIAR 60.575 4 0.000
logFert logNIAR 72.542 4 0.000
logFert logsales 45.508 4 0.000
logNIAR ALL 526.68 12 0.000
logNIAR logGIAR 16.098 4 0.003
logNIAR logFert 205.27 4 0.000
logNIAR logsales 71.893 4 0.000
logsales ALL 1381.1 12 0.000
logsales logGIAR 390.07 4 0.000
logsales logFert 619.33 4 0.000
logsales logNIAR 436.42 4 0.000
Equation Excluded chi2 df Prob > chi2
Granger causality Wald tests
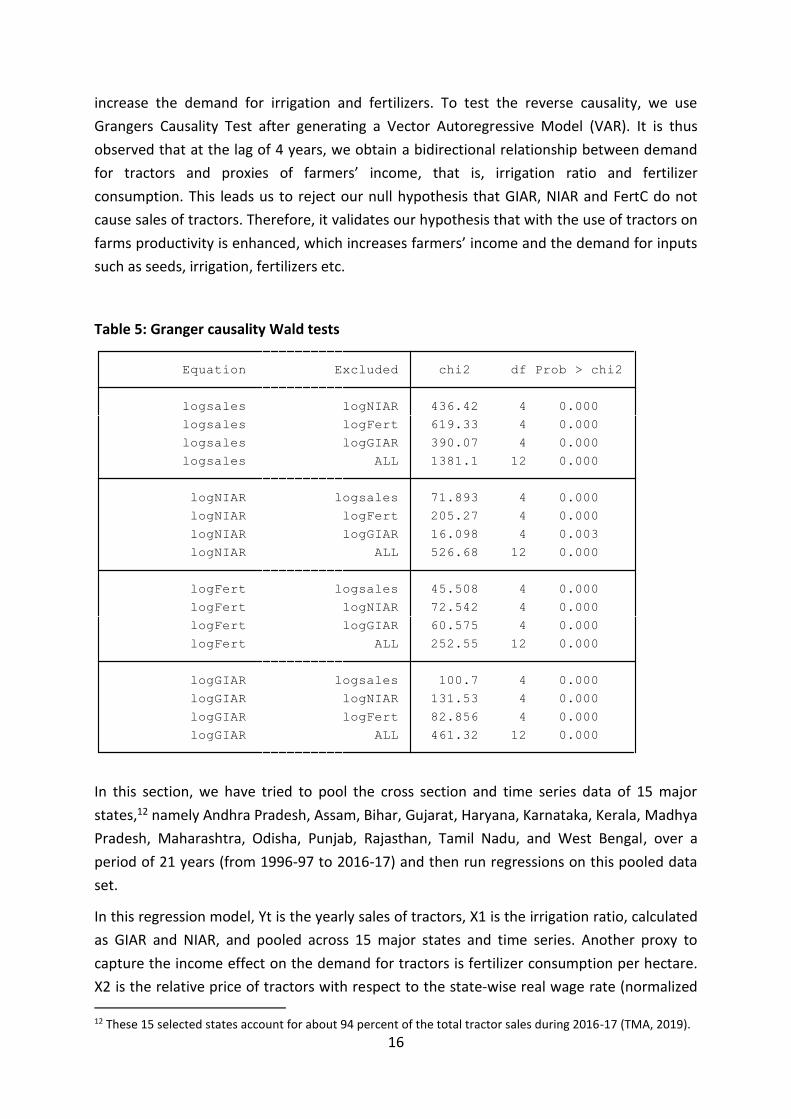
increase the demand for irrigation and fertilizers. To test the reverse causality, we use
Grangers Causality Test after generating a Vector Autoregressive Model (VAR). It is thus
observed that at the lag of 4 years, we obtain a bidirectional relationship between demand
for tractors and proxies of farmers’ income, that is, irrigation ratio and fertilizer
consumption. This leads us to reject our null hypothesis that GIAR, NIAR and FertC do not
cause sales of tractors. Therefore, it validates our hypothesis that with the use of tractors on
farms productivity is enhanced, which increases farmers’ income and the demand for inputs
such as seeds, irrigation, fertilizers etc.
Table 5: Granger causality Wald tests
In this section, we have tried to pool the cross section and time series data of 15 major
states,12 namely Andhra Pradesh, Assam, Bihar, Gujarat, Haryana, Karnataka, Kerala, Madhya
Pradesh, Maharashtra, Odisha, Punjab, Rajasthan, Tamil Nadu, and West Bengal, over a
period of 21 years (from 1996-97 to 2016-17) and then run regressions on this pooled data
set.
In this regression model, Yt is the yearly sales of tractors, X1 is the irrigation ratio, calculated
as GIAR and NIAR, and pooled across 15 major states and time series. Another proxy to
capture the income effect on the demand for tractors is fertilizer consumption per hectare.
X2 is the relative price of tractors with respect to the state-wise real wage rate (normalized
12 These 15 selected states account for about 94 percent of the total tractor sales during 2016-17 (TMA, 2019).
17
using CPI-AL) which captures the price substitution effect on the demand for tractors. Due to
a lack of data availability, the replacement demand as well as long-term credit flow to
agriculture could not be taken into the account. However, it is expected that even in cross-
section time series they will have a significant positive impact on the demand for tractors as
observed in the national time series analysis. Table 5 reports the results of the regressions.
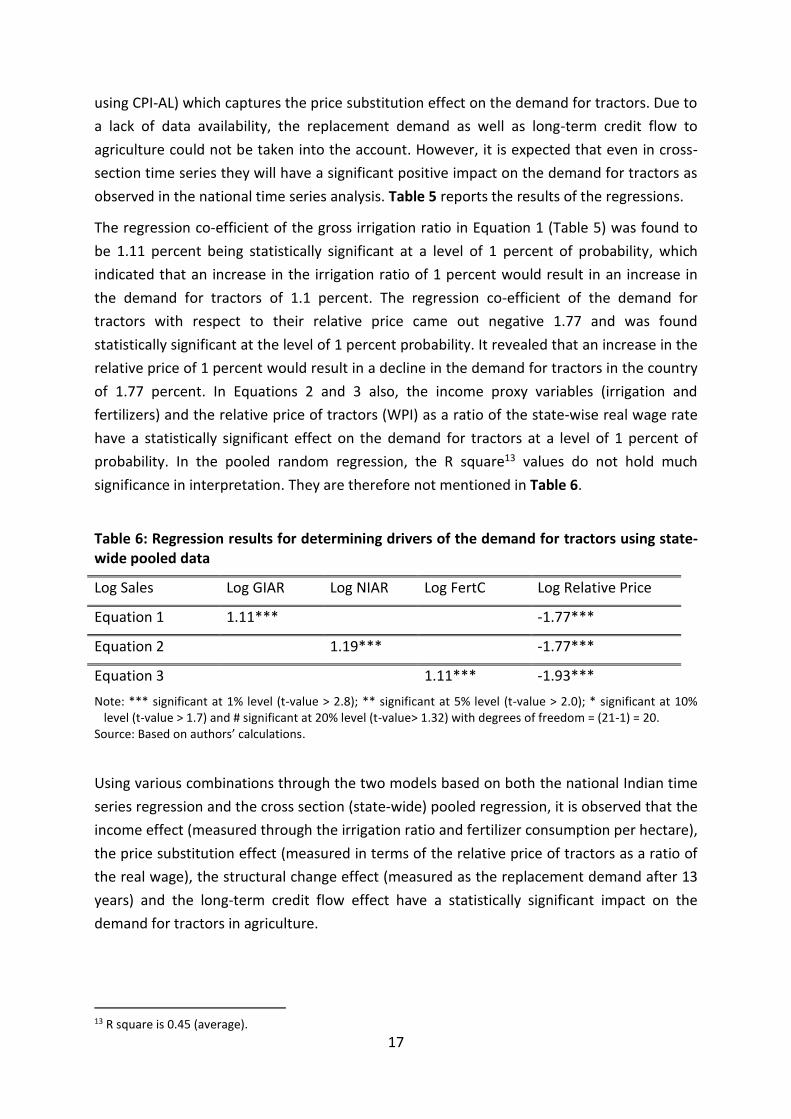
The regression co-efficient of the gross irrigation ratio in Equation 1 (Table 5) was found to
be 1.11 percent being statistically significant at a level of 1 percent of probability, which
indicated that an increase in the irrigation ratio of 1 percent would result in an increase in
the demand for tractors of 1.1 percent. The regression co-efficient of the demand for
tractors with respect to their relative price came out negative 1.77 and was found
statistically significant at the level of 1 percent probability. It revealed that an increase in the
relative price of 1 percent would result in a decline in the demand for tractors in the country
of 1.77 percent. In Equations 2 and 3 also, the income proxy variables (irrigation and
fertilizers) and the relative price of tractors (WPI) as a ratio of the state-wise real wage rate
have a statistically significant effect on the demand for tractors at a level of 1 percent of
probability. In the pooled random regression, the R square13 values do not hold much
significance in interpretation. They are therefore not mentioned in Table 6.
Table 6: Regression results for determining drivers of the demand for tractors using state-wide pooled data
Log Sales Log GIAR Log NIAR Log FertC Log Relative Price
Equation 1 1.11*** -1.77***
Equation 2 1.19*** -1.77***
Equation 3 1.11*** -1.93***
Note: *** significant at 1% level (t-value > 2.8); ** significant at 5% level (t-value > 2.0); * significant at 10% level (t-value > 1.7) and # significant at 20% level (t-value> 1.32) with degrees of freedom = (21-1) = 20.
Source: Based on authors’ calculations.
Using various combinations through the two models based on both the national Indian time
series regression and the cross section (state-wide) pooled regression, it is observed that the
income effect (measured through the irrigation ratio and fertilizer consumption per hectare),
the price substitution effect (measured in terms of the relative price of tractors as a ratio of
the real wage), the structural change effect (measured as the replacement demand after 13
years) and the long-term credit flow effect have a statistically significant impact on the
demand for tractors in agriculture.
13 R square is 0.45 (average).
18
4. Farm Mechanization: Assessing Impact
In order to assess the impact of farm mechanization, this section begins by first examining
the efficiency of tractor use. The efficiency of tractors is usually estimated by their working
capacity per unit of time. Second, we assess the tractor inclusiveness quotient that is the
reach and coverage of farm machinery across vast areas from marginal farm holdings to
small and medium-scale farm holdings. Third, we assess the sustainability of tractorization
by looking at how they affect farmer’s finances and whether the existing practices are
financially viable in the long term.
4.1. Efficiency
The process of agricultural mechanization in India is constrained by the increasing
fragmentation of land. The average holding size has continuously fallen from 2.28 hectares
in 1970-71 to 1.08 hectares in 2015-16, making individual ownership of agricultural
machinery progressively difficult. Further, mechanizing small and non-contiguous groups of
small farms is against ‘economies of scale’, especially for operations like land preparation
and harvesting (Mehta, Chandel, & Senthilkumar, 2014). In addition, tractors are generally
considered economically viable if they run for about 1,000 hours/year (ENVIS Centre:
Punjab, 2015). Most micro-studies on farm mechanization reveal that the utilization is only
about 50-60 percent of this norm, indicating an over-capitalization of farms (Gulati, 2019).
This in fact raises the cost of production per unit and locks in capital in the medium to the
long run. As most tractors (more than 90 percent) are bought on credit, this under-usage
makes it difficult for farmers to pay back their debts.
To illustrate this point, we will consider the case of Punjab, one of the most mechanized
states in the country with farm power availability of 2.6 kW/ha (Indian Council of Food and
Agriculture, 2017), where the majority of farm tasks including ploughing, digging, harvesting,
processing, loading, and sorting are done by machines. According to the state Environmental
Information System (ENVIS), Punjab, the average annual use of tractors is only 450 hours, far
below the recommended 1,000 hours of productive use in agricultural operations (ENVIS
Centre: Punjab, 2015). This leads to over-capitalization and under-utilization of farm
machinery and equipment, and farmers easily become indebted in the process. This again
leads to higher costs of production and a lower net income for farmers, making tractor use
economically unviable and difficult to sustain. Though the use of harvester-combines for
wheat and paddy has been on the increase, their use leaves uncut straw and stubble in the
fields, which is often burnt by the farmers, causing air pollution as well as declining soil
fertility, both of which are environmentally damaging.
19
4.2. Inclusiveness
Land holdings of the majority of Indian farmers are classified as small and marginal. Thus,
any purchase of farm machinery and equipment for different farm operations is a significant
investment which could get locked in for a long period of time when the machinery is
owned. Similarly, the purchase of standalone implements is another persistent issue that has
been associated with owning farm machinery. Such implements do not add to overall
mechanization, since farmers need different machines and technological interventions at
various stages of the crop cycle. Thus, ownership of each and every machine, along with
various implements, would not be economically viable for farmers, especially for those with
small and marginal holdings. Given that farm machinery is not as perfectly divisible as seeds
or fertilizers, the ownership model for farm mechanization is not very inclusive. Moreover,
there are wide technology gaps in meeting the needs of various cropping patterns across
regions. In the absence of good planning and direction, investment in mechanization may
not yield the expected results. Thus, India needs to adopt a policy of selective mechanization
under various conditions in different regions to achieve higher productivity (Mehta, Chandel,
& Senthilkumar, 2014).
4.3. Financial Sustainability
Financing agricultural machinery is yet another area of concern. High costs of machinery and
equipment make it difficult for farmers to purchase all suitable machinery as it increases the
fixed as well as the variable costs of farm operations (due to maintenance and depreciation
costs). Based on data provided by a New Holland Tractors dealership in Faridabad, Haryana,
35 hp and 55 hp tractors were the most commonly sold tractors. Of these, the 35 hp tractor
costs around INR 485,000, while the 55 hp tractor costs INR 755,000. Thus, the high capital
costs involved in procuring such machinery is financially unsustainable for farmers, especially
for those with small and marginal holdings, who lack adequate capital resources and bank
credit for such purchases and who are unable to earn the rate of return over investments in
farm machinery. Therefore, there is a need for institutional innovations in providing services
of farm mechanization on cost-effective terms as well as for reaching small and marginal
farms. This particularly applies to high-cost farm machinery such as harvest combines,
sugarcane harvesters, potato combines, paddy transplanters, laser guided land levelers,
rotavators etc. that can be spearheaded by private players or by state or central government
institutions (Mehta, Chandel, & Senthilkumar, 2014).
20
5. Innovations in Providing Farm Machinery to Smallholders:
“Uberization” and “Custom Hiring Model”
Innovation, in general, could be defined as a new idea, a new policy, a new process or a new
product, which breaks into society and/or markets creating more value than the existing
ways and products. In this section, we are looking at the game-changing innovation in the
institution, where farm equipment or machinery is provided to farmers, especially to those
with small and marginal farms, as a service in a timely and effective manner and at
affordable cost. The Custom Hiring Model introduced by the present government and the
Uberization Model incepted by the private sector are the new innovative on-demand
business models that provide farm machinery and equipment (such as harvest combines and
tractors) along with operator services to farmers at affordable costs and at any point in time.
As mentioned before, it is not economically feasible to mechanize small and non-contiguous
land areas, particularly in the case of operations like land preparation, sowing and
harvesting. Therefore, as India experiences continuous shrinkage in average farm size from
2.28 ha in 1970-71 to 1.08 in 2015-16, the individual ownership of agricultural machinery
becomes progressively less economical and remains beyond the reach of farmers with small
and marginal holdings due to their lack of funds. Therefore, the ‘Uberization Model’ and the
‘Custom Hiring Model’ can both ensure access to cutting-edge technology suited to the crop
and soil profile without high financial input (Ganguly, Gulati, & Braun, 2017). These models
are an innovation in the institutional mechanism that can make farm machinery and
equipments available to farmers at affordable cost on a ‘pay per use’ basis. This could
further save time and labor, reduce crop production costs and postharvest losses and boost
crop output and farm incomes. In addition, it could enable new machines to be used at their
maximum capacity, making it an efficient and financially sustainable business.
Therefore, the model could not only increase farm power availability but also help to
remove the disparities in the availability of farm power between various states as well as
between farmers with land holdings of different size categories. Thus, this model could make
farm mechanization as a service perfectly divisible, accessible and affordable even to
smallholders for whom owning farm machinery may not be economical, thereby increasing
the productivity of farms as well as reducing drudgery associated with various farm
operations. Consequently, the Custom Hiring model and the Uberization model both hold
the potential of being an efficient and equitable way of spreading farm mechanization in
Indian agriculture. It seems that both models can help achieve the three-pillared criteria of
efficiency, inclusiveness, and financial sustainability.
The genesis of the Custom Hiring Model is the Sub-Mission on Agricultural Mechanization
(SMAM) Scheme which was introduced by the Government of India (2016-17) under the
umbrella of the National Mission on Agricultural Extension & Technology (NMAET) in 2014-
21
15. The objective of the scheme was to increase the reach of farm mechanization to farmers
with small and marginal holdings and to regions with low farm power, thus compensating for
adverse economies of scale, which means high cost of individual machinery ownership for a
small holder farmer. Under this program, the central government promoted the
establishment of Custom Hiring Centres (CHCs) to provide hiring services of various kinds of
agricultural machinery with a financial assistance level (subsidy) of 40 percent (of the
machine cost) to farmers, entrepreneurs and societies willing to set up these CHCs
(Government of India, 2018c). These CHCs are required to cover a minimum area of 10
ha/day and at least 300 ha in a cropping season (Government of India, 2016-17). Further, to
foster the use of hi-tech, high-value machines for higher productivity, the Government
promotes the establishment of hi-tech hubs with a financial assistance level of 40 percent (of
the machine cost) (Government of India, 2018c). These hubs are required to cover at least
500 ha per cropping season. To promote the establishment of farm machinery hubs (also
termed as farm machinery banks) for custom hiring with a minimum of 8 farmers per
hub/bank in selected villages, the Government further provides a subsidy of 80 percent of
the project cost.14 The established CHCs and hi-tech hubs will be provided technical
assistance from KVKs/manufacturers/Approved Testing Centres, and ICAR centers for
maintenance and training (Government of India, 2016-17).
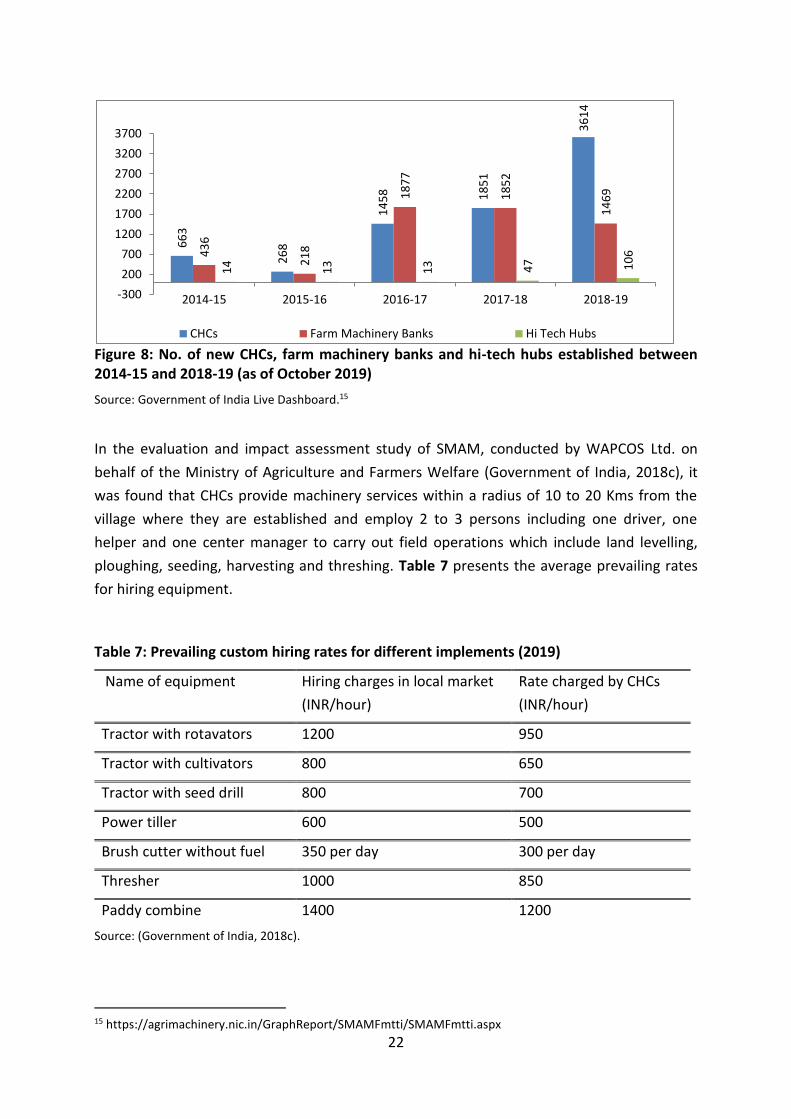
Figure 8 depicts the numbers of CHCs, hi-tech hubs (deals with high end technological
agri/farm implements) and machinery banks (operated cooperatively by at least 8 members
dealing with agri/farm implements of higher value) established each year across India
between the launch of the scheme in 2014-15 and 2018-19. The data is retrieved from an
online dashboard by the Ministry of Agriculture & Farmers Welfare of the Government of
India to track the progress of the scheme in real time.
14 The maximum permissible project cost is Rs.10 lakhs per Farm Machinery Bank.
22
Figure 8: No. of new CHCs, farm machinery banks and hi-tech hubs established between 2014-15 and 2018-19 (as of October 2019)
Source: Government of India Live Dashboard.15
In the evaluation and impact assessment study of SMAM, conducted by WAPCOS Ltd. on
behalf of the Ministry of Agriculture and Farmers Welfare (Government of India, 2018c), it
was found that CHCs provide machinery services within a radius of 10 to 20 Kms from the
village where they are established and employ 2 to 3 persons including one driver, one
helper and one center manager to carry out field operations which include land levelling,
ploughing, seeding, harvesting and threshing. Table 7 presents the average prevailing rates
for hiring equipment.
Table 7: Prevailing custom hiring rates for different implements (2019)
Name of equipment Hiring charges in local market
(INR/hour)
Rate charged by CHCs
(INR/hour)
Tractor with rotavators 1200 950
Tractor with cultivators 800 650
Tractor with seed drill 800 700
Power tiller 600 500
Brush cutter without fuel 350 per day 300 per day
Thresher 1000 850
Paddy combine 1400 1200
Source: (Government of India, 2018c).
15 https://agrimachinery.nic.in/GraphReport/SMAMFmtti/SMAMFmtti.aspx
66
3
26
8
14
58 18
51
36
14
43
6
21
8
18
77
18
52
14
69
14
13
13 47 10
6
-300
200
700
1200
1700
2200
2700
3200
3700
2014-15 2015-16 2016-17 2017-18 2018-19
CHCs Farm Machinery Banks Hi Tech Hubs
23
Farmers who are hiring the equipment revealed in the survey that the charges levied by the
CHCs established under SMAM are INR 100/- to INR 200/- per hour less (about 15 to 20
percent lower) than the prevailing hiring charges levied by other players in the local market.
Farmers also find it flexible to pay in cash for land preparation and seeding but in case of
threshing they pay in kind. In the case of hiring on credit basis, the payment is made at the
time of the harvesting and selling of crops (Government of India, 2018c). This reflects that
CHCs pose tough competition to private players in terms of hiring charges.
However, it needs to be noted that CHCs have received a subsidy of roughly 40 percent on
capital equipment, and by charging 15-20 percent lower rates compared to the informal
farm machinery service market, this policy can potentially destroy that vibrant market and
make the whole model subsidy-driven. Many of the existing private sector players providing
farm machinery services may also turn their private ventures into CHCs to avail this 40
percent subsidy and higher profits despite offering lower rates to farmers. A robust
evaluation of CHCs needs to be carried out to examine whether it ensures the efficient use
of machinery (say 1,000 hours/year of tractor use), whom it serves (farmers of small or large
holdings) and whether these CHCs can be financially viable without the 40 percent subsidy
or with a lower subsidy of say 20 percent. We have not come across any such study, and this
is an issue that needs further research.
Recently, the Government of India has introduced a CHC Farm Machinery Mobile App to
provide farmers with access to farm equipment and machinery available within 50 Kms of
their agricultural land. As of October 2019, 44,233 custom hiring service providers (farmers,
entrepreneurs and societies) have been registered on this app and more than 120,000 farm
equipment are available for rent, which need further scaling up across the country.16
The implementation of the Sub-Mission on Agricultural Mechanization (SMAM) program by
the Ministry of Agriculture is therefore a step towards ensuring the last-mile reach of farm
mechanization to farmers of small and marginal holdings (Government of India, 2018c).
However, the growth in CHCs so far seems driven by the large (40 percent) subsidy
component. India has yet to see intermediate custom hiring interventions in the crop cycle
ranging from sowing to harvesting (Ministry of Agriculture and Farmers Welfare, 2016).
Business models in India are at a nascent stage and need to be evaluated properly before
scaling them up further.
Besides SMAM, the Government also promotes farm mechanization programs through other
missions/schemes such as Rashtriya Krishi Vikas Yojana (RKVY), Mission for Integrated
Development of Horticulture (MIDH) and National Mission on Oilseeds and Oil Palm
(NMOOP) (Government of India, 2016-17). In addition, the governments of Karnataka,
Andhra Pradesh, Madhya Pradesh and Punjab are also promoting CHCs on a Public Private
16 Government of India Live Dashboard (https://agrimachinery.nic.in/GraphReport/SMAMFmtti/SMAMFmtti.aspx)
24
Partnership (PPP) basis. For instance, the Government of Rajasthan has partnered with a
startup named EM3 Agriservices Private Limited, also called “Samadhan - Techno Kheti”, to
establish CHCs in the state. In addition to providing farm equipment for rent, EM3 also offers
“Farming as a Service” (FaaS) that includes soil analysis, seedbed preparation, sowing,
fertilizer application, weed/pest control, top dressing, harvesting and post-harvest
operations. Besides Rajasthan, EM3 has footprints in Madhya Pradesh, Uttar Pradesh
(Chandauli district) and Gujarat, covering more than 8,000 farms in total. Moreover, there
has been increasing participation from private players over the years in providing farm
machines on a rental basis as well as related services. For instance, in 2016, M&M incepted
its agri-equipment service startup called Trringo with an initial capital of INR 10 crore, on a
franchisee-based model to bring in new-age digital technology to the tractor rental business
(Singh S., 2017). Until July 2018, 1.7 Lakh plus hours of service have been provided to more
than 1.2 Lakh farmers through 100 plus hubs operational within a radius of 7-10 Kms in more
than 1,000 villages across five states, namely Gujarat, Rajasthan, Maharashtra, Madhya
Pradesh and Karnataka. EM3’s agri-services has also come into the space for helping farmers
to access cutting edge farm equipment and technologies on a pay-per-use basis on either an
hourly or acreage pricing. EM3 basically follows a command on-demand model and allows
farmers who own machines such as tractors, harvesters and other mechanical equipment to
rent out their assets to farmers with small/marginal holdings in remote parcels who would
otherwise be able to access such technology with their limited credit and capital resources.
They manage supply-demand, data of inventory owners and potential renters through
mechanization and call centers as well as local representatives at the village level. EM3 has
established 1,240 Samadhan - FaaS (Farming as a Service) centers operational in Rajasthan,
Madhya Pradesh, Uttar Pradesh (Chandauli district) and Gujarat covering about 8,000 plus
farms in terms of its service offers. Moreover, Tractors and Farm Equipment Ltd. (TAFE) has
set up JFarm Rajasthan, an advanced agri-research center in Bhawanimandi, Jhalawar
District in November 2016 as a platform that facilitates the hiring of tractors and modern
farm machinery for Rajasthan farmers. TAFE has signed a MoU with the Government to set
up CHCs in six identified zones (Bharatpur, Jodhpur, Jaipur, Jalore, Kota and Sikar) across the
state (TAFE, 2017). Through the app, tractor and equipment owners (in CHCs) are put in
direct touch with the farmers who need farm mechanization services and solutions. The
company has aggressive plans to enroll more than 10,000 CHCs within two years of
operation and serve more than 500,000 farmers. According to Ms. Mallika Srinivasan,
Chairman and CEO of TAFE, “the model has registered more than 450 Custom Hiring Centres
and has connected with over 25,000 farmers.”
As a result of the Government’s initiative and equal participation from the private sector,
farm mechanization has been increasing steadily over the years, which can be seen in the
increase in production, sale and exports of tractors from the country. The Custom Hiring
Model and innovation in the farm machinery sector therefore hold the potential to drive the
next phase of agricultural growth in India. However, a congenial policy framework is
25
required to incentivize the establishment of CHCs as the preferred business model in the
country so that the gap between requirement and availability can be bridged efficiently. It
goes without saying that raising farmers’ awareness and knowledge through various
stakeholders in the agriculture supply chain and incorporating farmers’ inputs for future
implementation of schemes and policies can lead to better value creation.
26
6. Conclusion and Policy Recommendations
This section brings out inferences derived from the analysis and offers recommendations to
make farm mechanization more efficient, inclusive and sustainable:
One of the major concerns in using farm machinery such as tractors in India is the small
holding size of agricultural land and increasing fragmentation. The average size of operated
land holding in India is 1.08 ha and the majority of the landholdings (86 percent) and
operated areas (47 percent) are small and marginal (i.e. of less than 2 ha in size). Moreover,
fragmentation of land holding is expected to increase, especially among farmers with small
and marginal holdings. Therefore, holding sizes in Indian agriculture do not justify individual
ownership and efficient utilization of machines such as tractors (i.e. a minimum of 1,000
hours of productive use in agricultural operations). Another major issue is the limited
investment capacity of farmers, which is most prevalent among those with small and
marginal holdings. The results of our regression modeling also show that farmers’ prosperity
and the relative price of tractors (as a ratio to cost of labor) are statistically significant factors
that affect the demand for tractors. Thus, given the low incomes of farmers with small and
marginal holdings on the one hand and the high capital costs of farm machines and tractors
in relation to cost of agricultural labor on the other hand, individual ownership of farm
machines, tractors and other equipment become financially unsustainable.
One of the possible ways forward, as highlighted in Section 5, is innovation in providing farm
mechanization to farmers based on custom hiring and Uberization models that make farm
machinery and equipment available as a service to farmers of all farm categories at the door-
step at affordable cost on a ‘pay per use’ basis. For instance, in some parts of the state Bihar,
a company named Claro Energy has introduced a mobile solar pump set service operating
under the principle of “pay as you go”, i.e. instead of having individual farmers install solar
panels, there are provisions for hiring solar panels on a rental basis (like the rental UBER cab
service) to generate the energy required for pumping irrigation water for crops.
To increase agricultural productivity, timeliness in farm operations is essential, especially for
seedbed preparation and sowing operations to establish a good crop stand in
deficient/receding soil moisture conditions. Therefore, providing tractors/power tillers, seed
drills/planters and other farm machinery based on custom hiring is the future of farming in
India.
The Government of India (2016-17) has already kick-started the efforts towards ensuring the
last-mile reach of farm machinery like tractors to all farmers, especially to those with small
and marginal holdings, through its Sub-Mission on Agricultural Mechanization (SMAM)
Scheme launched in 2014. Under this scheme, the Government provides broad-base
technological services to farmers in the form of efficient supply of inputs including
agricultural tools, implements and machinery and for extending custom hiring facilities.
27
However, so far, the growth in CHCs has been modest and seems to be driven by the subsidy
support.
Therefore, India has yet to see major custom hiring interventions in the crop cycle ranging
from sowing to harvesting to make the model self-sustained (i.e. without any major
subsidies). In addition, several private companies are also coming forward and joining the
league through the Uberization of tractors and other farm machines and equipment and are
looking for adequate government support to scale up their reach and operation.
Thus, institutional innovations of the Custom Hiring and Uberization models make farm
mechanization as a service perfectly divisible, accessible and affordable to farmers with all
categories of farms and hold potential to efficiently, inclusively and sustainably increase the
level of mechanization and tractorization in the country. For this purpose, the government
needs to create a conducive policy and institutional environment that provides easy credit
access to all farmers, especially to those with marginal and small holdings as well as to
unemployed youth who are likely to be most keen to set up custom hiring centers in the
villages.
Further, both the Government and the industry should invest in research and development
to incorporate new improvements into their designs and products. To tackle regional
disparities in the level of mechanization across the country, the Government should further
provide financial incentives for farmers to replace primitive hand tools as well as draught
animals with improved tools and implements, until this transition picks up speed.
We hope that with these improvements, the farm mechanization system can serve the
needs of the farming community even better and be a role model for many smallholder
economies in Sub-Saharan Africa as well as in South and Southeast Asia.
28
7. References
Baregal, V., & Grover, D. (2017). A quantitative analysis of demand for tractors in India.
Agriculture Update, Volume 12, No. 3, 764-769.
Central Water Commission. (2018). Irrigation Terminology. Retrieved September 2, 2020,
from nwa.mah.nic.in: https://nwa.mah.nic.in/sdmc/irrigation/08_challenges.htm
ENVIS Centre: Punjab. (2015). Farm Mechanization. Retrieved September 2, 2020, from
http://punenvis.nic.in/:
http://punenvis.nic.in/index2.aspx?slid=258&mid=1&langid=1&sublinkid=974
Ganguly, K., Gulati, A., & Braun, J. V. (2017). Innovations spearheading the next
transformations in India‘s agriculture. Germany: Working Paper No. 159, Center for
Development Research, University of Bonn.
Government of India. (2015). Land Use Statistics at a glance. New Delhi: Directorate of
Economics and Statistics.
Government of India. (2015-16). Agriculture Census. New Delhi: Agriculture Census Division,
Department of Agriculture, Co-operation and Farmers' Welfare.
Government of India. (2016). Input Survey Report 2011-12. Retrieved October 30, 2019, from
Agriculture Census.
Government of India. (2016-17). Sub-Mission on Agricultural Mechanization: Operational
Guidelines. Delhi: Ministry of Agriculture and Farmers Welfare.
Government of India. (2017). National Portal on Mechanization and Technology. Retrieved
October 21, 2019, from http://farmech.gov.in/06035-01-15052006.pdf
Government of India. (2018a). Doubling Farmers’ Income (Volume VIII): Input Management
for Resource Use Efficiency & Total Factor Productivity. New Delhi: Department of
Agriculture, Cooperation and Farmers’ Welfare, Ministry of Agriculture & Farmers’
Welfare.
Government of India. (2018b). National Portal on Mechanization and Technology. Retrieved
October 28, 2019, from Need for Farm Mechanization: Study Relating to formulating
Long-Term Mechanization Strategy for each Agro Climatic Zone/State in India:
http://farmech.gov.in/06035-02-15052006.pdf
29
Government of India. (2018c). Monitoring, Concurrent Evaluation and Impact Assessment of
Sub-mission on Agricultural Mechanization. Gurgaon: Ministry of Agriculture and
Farmers Welfare.
ICAR. (2016). Agricultural Research Data Book. Delhi: Government of India.
Indian Council of Food and Agriculture. (2017). Farm Mechanization: Indian Farm
Mechanization Market Overview. New Delhi: India International Centre.
Indian Mirror. (2019). Indian Tractor Industry. Retrieved October 30, 2019, from Indian
Industries: https://www.indianmirror.com/indian-industries/tractor.html
Labour Bureau. (2017). Pocket Book of Labour Statistics. Shimla: Ministry of Labour &
Employment, Government of India .
Lal, B., & Singh, A. (2016). Understanding the Tractor Market: An Exploratory Study in
Haryana (India). Global Journal of Management and Business Research: E Marketing, 28-
34.
Lips, M. (2017). Length of Operational Life and Its Impact on Life-Cycle Costs of a Tractor in
Switzerland. MDPI: Agriculture.
Mandal, S. K., & Maity, A. (2013). Current Trends of Indian Tractor Industry: A Critical Review.
Applied Science Reports, Volume 3, No. 2, 132-139.
Mehta, C. R., Chandel, N. S., & Senthilkumar, T. (2014). Status, Challenges and Strategies for
Farm Mechanization in India. Agricultural Mechanization in Asia, Africa & Latin America,
Volume 45, No.4, 43-50.
Mehta, C. R., Chandel, N. S., Jena, P. C., & Jha, A. (January 2019). Indian Agriculture Counting
on Farm Mechanization. Ama, Agricultural Mechanization in Asia, Africa & Latin
America, Volume 50, No.1, 84-89.
Ministry of Agriculture and Farmers Welfare. (2016). Farm Mechanization in India: The
Custom Hiring Perspective. New Delhi: FICCI and Yes Bank.
Morehouse, W. (1982). Dilemma of Technological Choice Revisited: Case of Combine
Harvester. Economic and Political Weekly, Volume 17, No.35, 83-84.
NABARD. (2018). Sectoral Paper on Farm Mechanization. Mumbai: Farm Sector Policy
Department, NABARD Head Office.
Office of the Economic Adviser. (2019). Wholesale Price Index (WPI). Retrieved September 2,
2020, from eaindustry.nic.in: https://eaindustry.nic.in/
30
Pingali, V. (2004). Input Management, State of Indian Farmer: A Millennium Study. New
Delhi: Department of Agriculture and Cooperation, Ministry of Agriculture, Government
of India.
Randhawa, M. S. (1986). A History of Agriculture in India: 1947-1981. New Delhi: Indian
Council of Agricultural Research.
Reserve Bank of India. (2019). Handbook of Statistics on Indian Economy. Mumbai: Reserve
Bank of India.
Sarkar, A. (2013). Tractor Production and Sales in India, 1989–2009. Review of Agrarian
Studies.
Singh, G. (2015). Agricultural Mechanisation Development in India. Indian Journal of
Agricultural Economics, Volume 70 , No.1, 64-82.
Singh, S., R. Singh, & S. Singh. (2014). Farm Power Availability on Indian Farms. Agricultural
Engineering Today, Volume 39, No.1, 48-52.
Sivakumar, V., & Kaliyamoorthy, S. (2014). Factors Influencing the Purchase of Agricultural
Tractors: An Empirical Study. IOSR Journal of Business and Management, Volume 16,
No.1, 42-46.
TAFE. (2017). TAFE launches ‘JFarm Services’ – a custom hiring platform. Tractors and Farm
Equipment Limited (TAFE) (p. 2). Kota, Rajasthan: TAFE.
Tractor and Mechanization Association. (2019). Indian Tractor Industry. Retrieved September
1, 2020, from tmaindia.in: http://www.tmaindia.in/tractor-industry.php
The Fertiliser Association of India. (2019). Statistics. Retrieved September 2, 2020, from
faidelhi.org: https://www.faidelhi.org/statistics/statistical-database
Vanzetti, D., & Quiggin, J. (1985). A Comparative Analysis of Agricultural Tractor Investment
Models. Australian Journal of Agricultural Economics, Volume 45, No.3, 122-141.


