Embed Size (px)
Citation preview
Driving
EnhancingGROWTH,performanceAt Millat Tractors, we believe in delivering performance above anything else. With our time tested products and dynamic team, we have paved the way for high growth with performance even in difficult time’s. Over the last couple of years with Covid19 Pandemic, we have continually strived to develop cost-effective solutions – that not only fulfill the technological demands of the farming community, but also provide empowering opportunities for the community at large strived
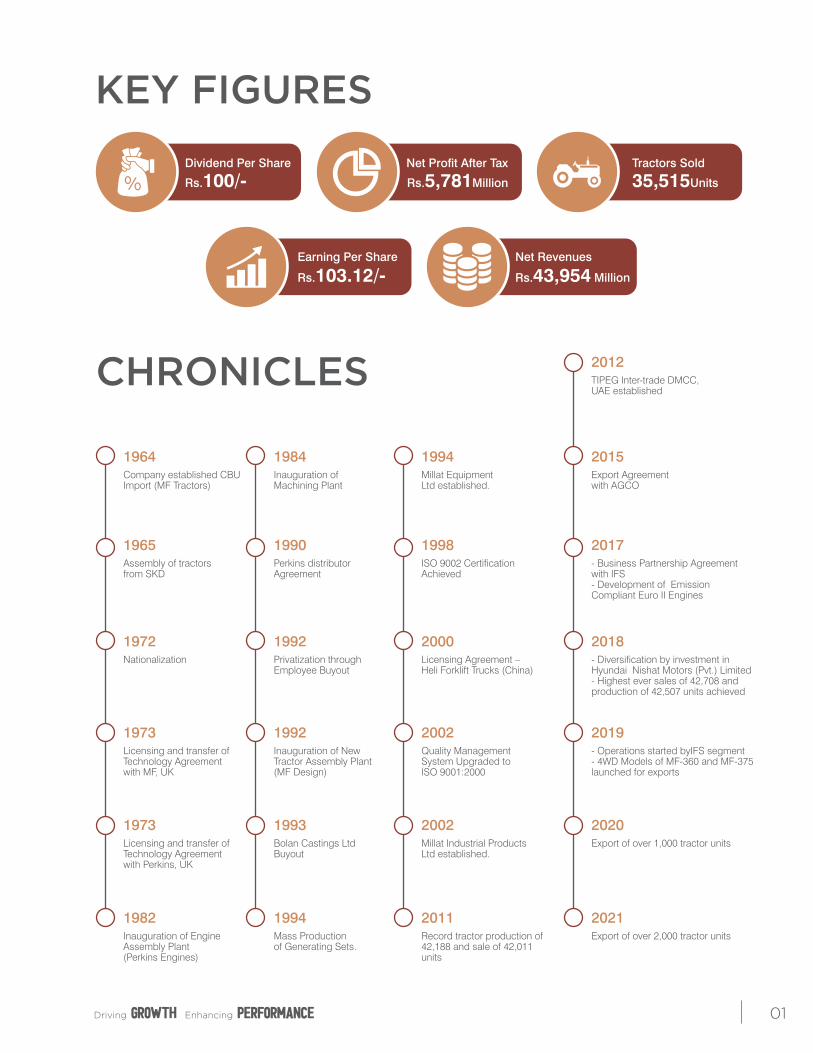
CHRONICLES
KEY FIGURESDividend Per Share
Earning Per Share
Net Profit After Tax
Net Revenues
Tractors Sold
Rs.100/-
Rs.103.12/- Rs.43,954 Million
Rs.5,781Million 35,515Units
1965Assembly of tractorsfrom SKD
1972Nationalization
1973Licensing and transfer ofTechnology Agreement with MF, UK
1973Licensing and transfer ofTechnology Agreement with Perkins, UK
1982Inauguration of EngineAssembly Plant(Perkins Engines)
1984Inauguration ofMachining Plant
1990Perkins distributorAgreement
1992Privatization throughEmployee Buyout
1992Inauguration of New Tractor Assembly Plant (MF Design)
2017- Business Partnership Agreementwith IFS- Development of EmissionCompliant Euro II Engines
1993Bolan Castings LtdBuyout
1994Mass Productionof Generating Sets.
1994Millat Equipment Ltd established.
1998ISO 9002 CertificationAchieved
2000Licensing Agreement – Heli Forklift Trucks (China)
2002Quality Management System Upgraded toISO 9001:2000
2002Millat Industrial Products Ltd established.
2011Record tractor production of42,188 and sale of 42,011 units
2012TIPEG Inter-trade DMCC, UAE established
2015Export Agreement with AGCO
2019- Operations started byIFS segment - 4WD Models of MF-360 and MF-375 launched for exports
2020Export of over 1,000 tractor units
2021Export of over 2,000 tractor units
1964Company established CBUImport (MF Tractors)
2018- Diversification by investment inHyundai Nishat Motors (Pvt.) Limited- Highest ever sales of 42,708 and production of 42,507 units achieved
Driving EnhancingGROWTH performance 01
CONTENTS
01COMPANY OVERVIEW
Vision & Mission Statement 07
Company Overview 08
Group Structure 09
Financial Highlights 10
Corporate Information 12
Objectives & Strategic Planning 13
Code of Conduct 13
Core Values 14
Health, Safety and Environment Policy 15
Position of the Organization within the Value Chain 16
PESTLE Analysis 18
SWOT Analysis 20
Composition of Local versus Imported Material
and Sensitivity Analysis 21
02STRATEGY ANDRESOURCE ALLOCATION
Strategic Objectives 24
Key Performance Indicators 26
Resource Allocation Plans 27
Capital Structure of the Company 27
03RISKS AND OPPORTUNITIES
Risks and Opportunities 30
04Notice of ANNUALGENERAL MEETING
Notice of Annual General Meeting 34
55 اطالع عام براے ساالنہ اجالس عام
05GOVERNANCE
Board of Directors 58
Board Committees 59
Chairman’s Review 60
65 چيرئمین کا جائزہ
Directors’ Report to the Shareholders 66
83 ڈائریکٹرز رپورٹ برائے شيرئ ہولڈرز
Corporate Social Responsibility Report 84
87 سی ایس ار رپورٹ
Organization Structure 88
Statement on COVID -19 90
Conflict of Interest Policy 91
Annual Report 202102
06PERFORMANCE AND POSITION
Summary of Cash Flows 94
Six Years at a Glance 96
Statement of Value Addition and its Distribution 97
Horizontal Analysis 98
Vertical Analysis 100
Commentary on Financial Analysis 102
Segmental Review of Business Performance 103
DuPont Analysis 104
Graphical Analysis of Statement of Financial Position 105
07CORPORATE COMPLIANCE AND FINANCIAL STATEMENTS
Independent Auditor’s Review Report 108
Statement of Compliance 109
Independent Auditor’s Report to the Members 111
Statement of Financial Position 114
Statement of Profit or Loss and other
Comprehensive Income 116
Statement of Changes in Equity 117
Statement of Cash Flows 118
Notes to the Financial Statements 119
08GROUP FINANCIAL STATEMENTS
Group Directors’ Report 174
179 گروپ ڈائریکٹرز رپورٹ
Independent Auditor’s Report to the Members 180
Consolidated Statement of Financial Position 184
Consolidated Statement of Profit or Loss
and other Comprehensive Income 186
Consolidated Statement of Changes In Equity 187
Consolidated Statement of Cash Flows 188
Notes to the Consolidated Financial Statements 189
09OTHERS
Pattern of Shareholding 257
Category of Shareholders 258
Consolidated Pattern of Shareholding 259
Consolidated Category of Shareholders 260
Electronic Transmission Form 261
Form of Proxy (English) 263
264 فارم اف پراکسی
Driving EnhancingGROWTH performance 03
Company overview

Vision &Mission Statement
Annual Report 202106

VISION
“Millat to be a global group of companies,
recognized for a range of quality products
with innovative design capabilities.”
MISSION
“To be market leader in agricultural tractors
and machinery, building company’s image
through innovation and competitiveness,
grow by expanding market and investing
into group companies, ensuring satisfaction
to customer and stakeholders and to fulfill
social obligations.”
Driving EnhancingGROWTH performance 07
COMPANY OVERVIEWMillat Tractors Limited (MTL), an ISO 9001:2008 certified company is Pakistan’s leading engineering concern in the automobile sector engaged in the manufacturing and marketing of the world renowned Massey Ferguson (MF) tractors under licensing agreement with AGCO Ltd. UK; Forklift Trucks under license from Anhui Forklift Trucks, China; Prime Movers; Diesel Generating Sets and a range of allied agricultural and industrial implements.
Millat Tractors has played a pivotal role in transfer of technology and transformation of fledgling local light engineering sector into a robust, vibrant, quality conscious Auto Vending Industry. The Company is regarded as a pioneer in setting up country’s automotive vendor base. Today, a local content of more than 90% has been achieved in Massey Ferguson tractors. The company offers eight tractor models in the range of 50 hp -100 hp, diesel gen sets of capacities -12.5kVA to 150 kVA and a 3 and 4 ton forklift truck.
Annual Report 202108
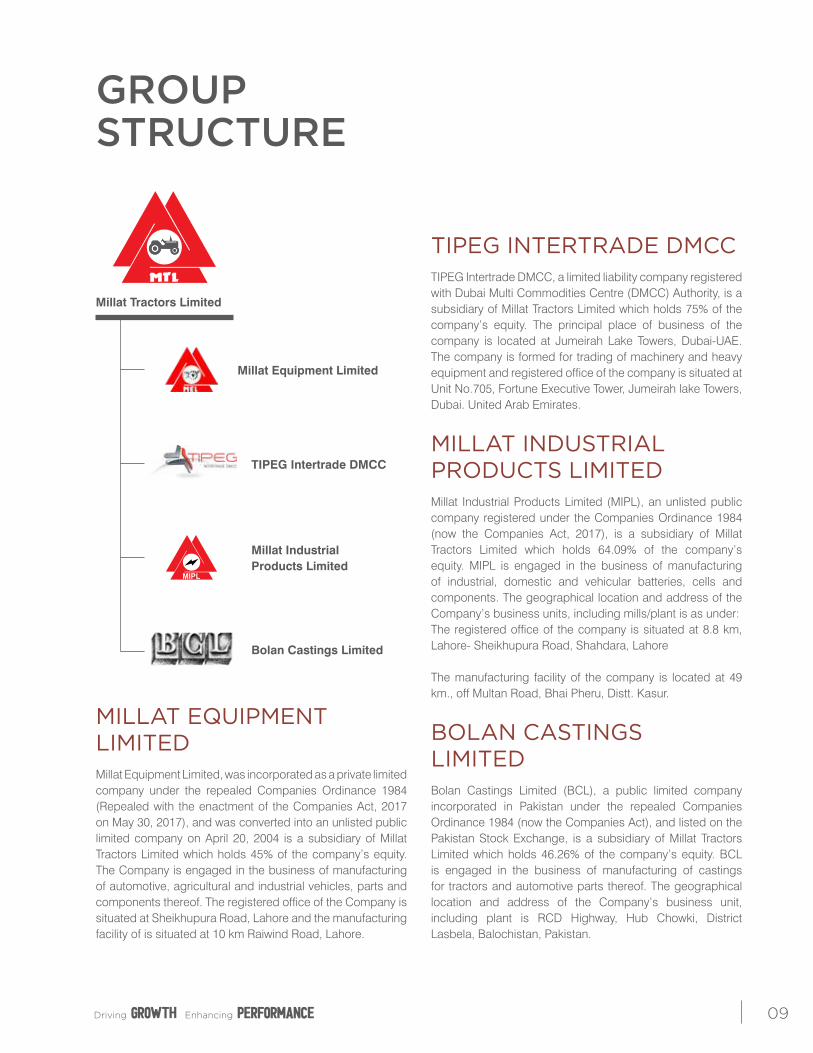
GROUP STRUCTURE
Millat Tractors Limited
Millat Equipment Limited
TIPEG Intertrade DMCC
Millat Industrial Products Limited
Bolan Castings Limited
MILLAT EQUIPMENT LIMITEDMillat Equipment Limited, was incorporated as a private limited company under the repealed Companies Ordinance 1984 (Repealed with the enactment of the Companies Act, 2017 on May 30, 2017), and was converted into an unlisted public limited company on April 20, 2004 is a subsidiary of Millat Tractors Limited which holds 45% of the company’s equity. The Company is engaged in the business of manufacturing of automotive, agricultural and industrial vehicles, parts and components thereof. The registered office of the Company is situated at Sheikhupura Road, Lahore and the manufacturing facility of is situated at 10 km Raiwind Road, Lahore.
TIPEG INTERTRADE DMCCTIPEG Intertrade DMCC, a limited liability company registered with Dubai Multi Commodities Centre (DMCC) Authority, is a subsidiary of Millat Tractors Limited which holds 75% of the company’s equity. The principal place of business of the company is located at Jumeirah Lake Towers, Dubai-UAE. The company is formed for trading of machinery and heavy equipment and registered office of the company is situated at Unit No.705, Fortune Executive Tower, Jumeirah lake Towers, Dubai. United Arab Emirates.
MILLAT INDUSTRIAL PRODUCTS LIMITEDMillat Industrial Products Limited (MIPL), an unlisted public company registered under the Companies Ordinance 1984 (now the Companies Act, 2017), is a subsidiary of Millat Tractors Limited which holds 64.09% of the company’s equity. MIPL is engaged in the business of manufacturing of industrial, domestic and vehicular batteries, cells and components. The geographical location and address of the Company’s business units, including mills/plant is as under:The registered office of the company is situated at 8.8 km, Lahore- Sheikhupura Road, Shahdara, Lahore
The manufacturing facility of the company is located at 49 km., off Multan Road, Bhai Pheru, Distt. Kasur.
BOLAN CASTINGS LIMITEDBolan Castings Limited (BCL), a public limited company incorporated in Pakistan under the repealed Companies Ordinance 1984 (now the Companies Act), and listed on the Pakistan Stock Exchange, is a subsidiary of Millat Tractors Limited which holds 46.26% of the company’s equity. BCL is engaged in the business of manufacturing of castings for tractors and automotive parts thereof. The geographical location and address of the Company’s business unit, including plant is RCD Highway, Hub Chowki, District Lasbela, Balochistan, Pakistan.
Driving EnhancingGROWTH performance 09
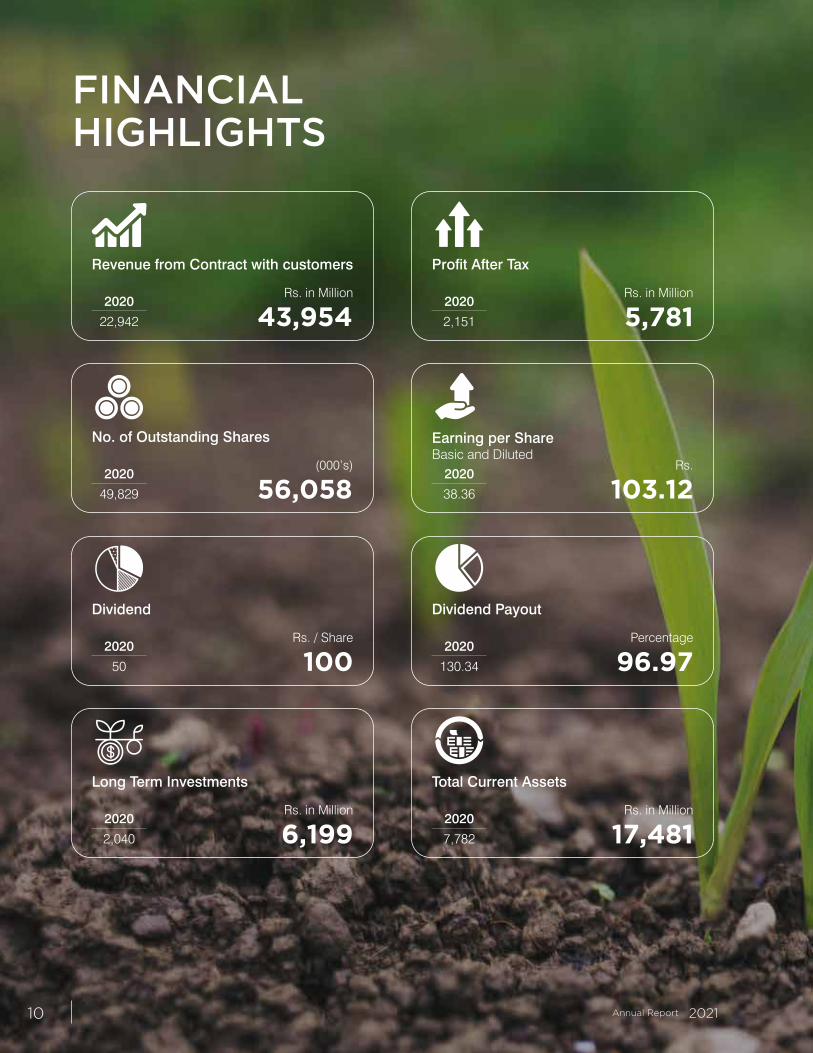
FINANCIAL HIGHLIGHTS
2020
22,942
2020
50
2020
49,829
2020
2,040
2020
2,151
2020
130.34
2020
38.36
2020
7,782
Rs. in Million
Rs. / Share
(000’s)
Rs. in Million
Rs. in Million
Percentage
Rs.
Rs. in Million
Revenue from Contract with customers
Dividend
No. of Outstanding Shares
Long Term Investments
Profit After Tax
Dividend Payout
Earning per ShareBasic and Diluted
Total Current Assets
43,954
100
56,058
6,199
5,781
96.97
103.12
17,481
Annual Report 202110
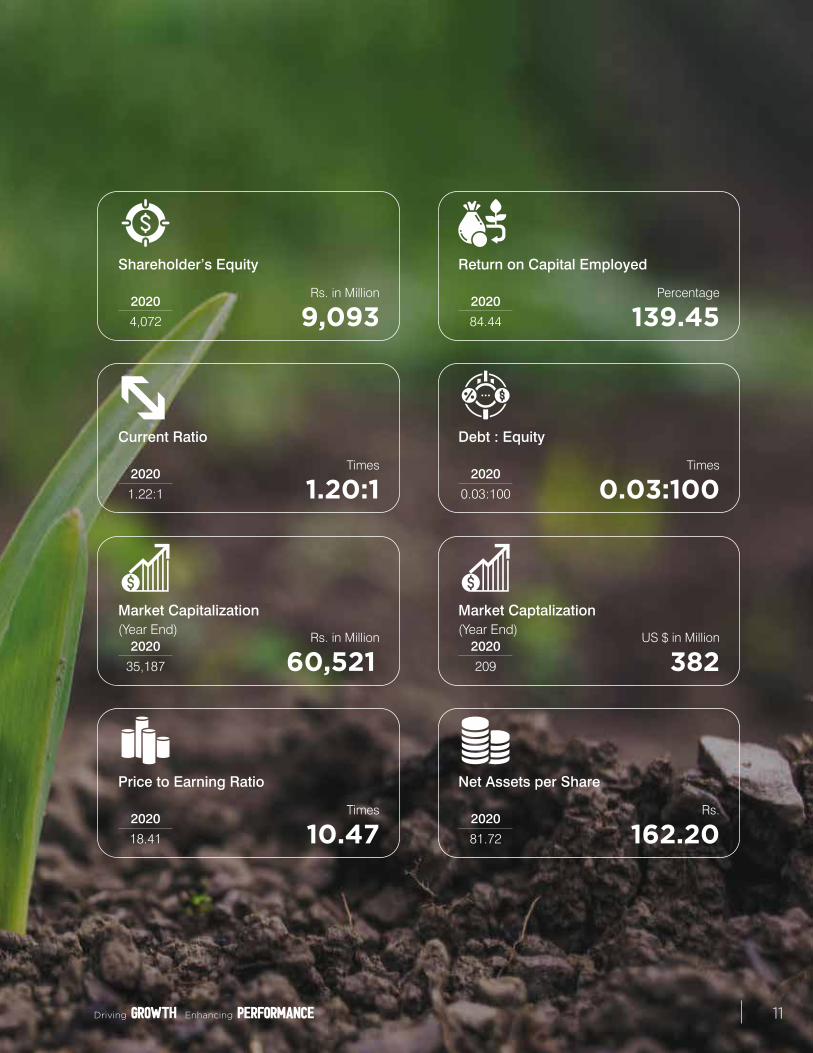
2020
4,072
2020
35,187
2020
1.22:1
2020
18.41
2020
84.44
2020
209
2020
0.03:100
2020
81.72
Rs. in Million
Rs. in Million
Times
Times
Percentage
US $ in Million
Times
Rs.
Shareholder’s Equity
Market Capitalization(Year End)
Current Ratio
Price to Earning Ratio
Return on Capital Employed
Market Captalization(Year End)
Debt : Equity
Net Assets per Share
9,093
60,521
1.20:1
10.47
139.45
382
0.03:100
162.20
Driving EnhancingGROWTH performance 11
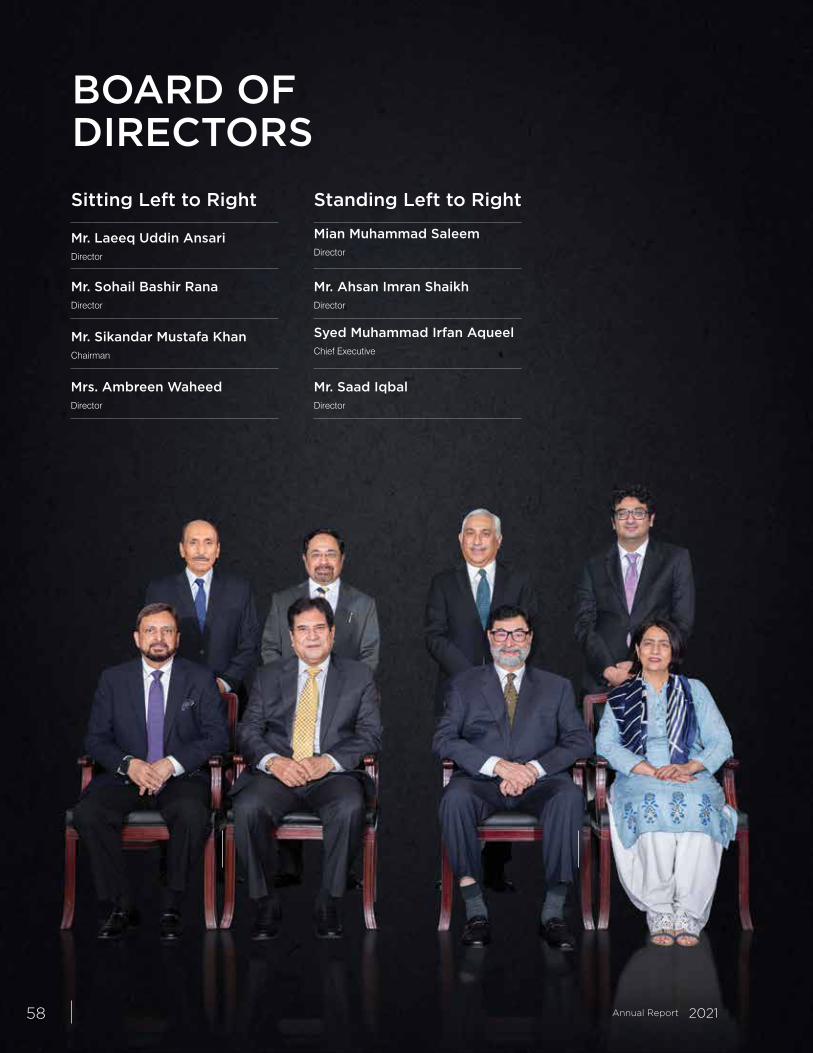
CORPORATE INFORMATIONBOARD OF DIRECTORSChairmanMr. Sikandar Mustafa Khan
Chief ExecutiveSyed Muhammad Irfan Aqueel
DirectorsMr. Sohail Bashir RanaMr. Laeeq Uddin AnsariMian Muhammad SaleemMr. Saad IqbalMrs. Ambreen WaheedMr. Ahsan Imran Shaikh
Company SecretaryMr. Muhammad Faisal Azeem
Chief Financial OfficerMr. Sohail A. Nisar
AuditorsM/s. A. F. Ferguson & Co.Chartered Accountants
Legal AdvisorsRiaa Barker GilleteAkhtar Ali & AssociatesCh. Law Associates Inn
Company Share RegistrarM/s. Hameed Majeed Associates (Pvt.) Ltd.,1st Floor, H.M. House, 7-Bank Square, Lahore.Tel: 042-37235081-82Fax: 042-37358817E-mail: [email protected]
BankersBank Alfalah Ltd.Habib Bank Ltd.MCB Bank Ltd.Standard Chartered Bank (Pakistan) Ltd.United Bank Ltd.Allied Bank Ltd.Meezan Bank Ltd.
REGISTERED OFFICE AND PLANT9 - km Sheikhupura Road, Distt. Sheikhupura.Tel: 042-37911021-25, UAN: 111-200-786Fax: 042-37924166, 37925835Website: www.millat.com.pkE-mail: [email protected]
REGIONAL OFFICESKarachi3-A, Faiyaz Centre, Sindhi MuslimCo-operative Housing Society, KarachiTel: 021-34553752UAN: 111-200-786Fax: 021-34556321
IslamabadH. No. 22, St. No. 41, Sector F-6/1, IslamabadTel: 051-2271470UAN: 111-200-786Fax: 051-2270693
Multan Cantt.Garden Town, (Daulatabad), Shershah Road, Multan - Cantt.Tel: 061-6537371Fax: 061-6539271
SukkurHouse No B/106 Akuwat Nagar Society, Near Gol Masjid, Airport Road, SukkurTel: 071-5815041Fax: 071-5815042
Annual Report 202112
OBJECTIVES & STRATEGIC PLANNING
CODE OF CONDUCT
OBJECTIVESConstantly endeavour to be market leader in terms of market share and technology pace-setters in areas of operations and to continuously improve efficiency and competitive strength. To offer customers quality products and support services at competitive prices and to their satisfaction.
By continuously improving performance, aim to generate earnings sufficient to ensure a secure future for the Company and to protect and increase shareholders’ return. To enhance creativity and job satisfaction, provide employees opportunity for personal development. Be an integral part of national economy with a strong sense of responsibility to society and the environment.
STRATEGIC PLANNINGTo make optimum use of ancillary industry in Pakistan to maximize indigenization of tractor parts and farm equipment. To create in-house plant facilities for manufacture of components for tractors and other agricultural machinery which cannot be fabricated by the ancillary industry, where investments required are heavy or where technology involved is intricate.
MTL will maintain a strong R&D Department to provide technical assistance to local manufacturers and for product development. Ensure customer satisfaction by providing quality products at competitive prices which warranty coverage and ensuring after sale service.
The Company’s Code of Conduct conforms to the Millat Group Vision and the Company’s Mission Statement.
The Code of Conduct defines the expected behaviors for all employees of Millat Tractors Limited (MTL). MTL will conduct its business fairly, impartially, in an ethical and proper manner, in full compliance with all applicable laws and regulations, and consistent with the values of the Company, Integrity must be ensured in all Company business relationships, including those with customers, suppliers, shareholders, other communities and among employees. The highest standards of ethical business conduct are required of employees in the performance of their responsibilities. Employees will not engage in any conduct or activity that may raise doubts to the honesty, impartiality and reputation of the organization or result in embarrassment to the Company.
Every employee of the Company will ensure that he/she:
• Will not engage in any activity that might create a conflict of interest for him/her or MTL. Conflict of interest shall be disclosed where it exists and guidance sought.
• Will not take advantage of his/her position for personal gain through the inappropriate use of Company name or non-public information or abuse of position.
• Will refrain from insider trading.
• Will follow all restrictions on use and disclosure of information. This includes protecting Company’s information and ensuring that non-company proprietary information is used and disclosed only as authorized by the owner of the information or as otherwise permitted by law and abide by the employee non-disclosure & confidentiality undertaking already signed by him/her.
• Will observe fair dealing in all of his/her transactions and interactions.
• Will protect all assets of the Company and use them only for appropriate Company-approved activities.
• Without exception, will comply with all statutory applicable laws, regulations, company policies and rules etc.
Driving EnhancingGROWTH performance 13

CORE VALUES• Our Customers are our first priority.
• Profitability for the prosperity of our stakeholders that allows us to constantly invest, improve and succeed.
• Corporate Social Responsibilities to Enrich the Lives of community where we operate.
• Recognition and Reward for the talented and high performing employees.
• Excellence in every thing we do.
• Integrity in all our dealings.
• Respect for our customers and each other.
Annual Report 202114
HEALTH, SAFETY & ENVIRONMENT POLICYSAFETY POLICYAll the employees have been provided appropriate safety equipment during performance of their duties.
An upgraded fire fighting system has been installed to cope with any mishap.
All the machinery has been fenced and guarded properly to avoid any type of accident causing injury to the employees as well as to the machinery.
Special arrangements have been made for the availability of filtered drinking water for the employees.
All the employees are insured under Group Life Insurance Scheme.
Regular safety inspections are carried out to improve the preparedness.
Safety fire drills & other exercises are carried out periodically to keep employees prepared for any unforeseen incident.
HEALTH POLICYMTL is committed to managing its operations and ensuring the safety and health of its employees, visitors, contractors, customers, vendors and all those who are affected by its operations.
While striving to achieve health and safety excellence, MTL commits:
• To provide premises, plant, equipment and work instructions that are free from all kinds of health and safety risks
• To carry out comprehensive risk assessment and mitigate any potential threat to health and safety of employees
• To maintain high standards of health and safety wherever possible and keep measurable standards and improvement plans
• To comply with all applicable health & safety codes, National legislation and International regulatory requirements
• To evaluate risks before commencement of new activities or starting operations in new locations
• To communicate the health and safety policy to all stakeholders including employees, visitors, vendors and customers
• To train its employees on health and safety standards so that everyone takes the responsibility of safe operations and stands accountable for unsafe actions
• To investigate and report all incidents/ near misses and ensure corrective actions to avoid recurrence
• To drive safety culture emphasizing on collective participation and excellence
ENVIRONMENT POLICYThe Company has a separate horticulture department to make the environment pleasant, green and full of flowers. The Company also participates in various competitions on horticulture arranged by Government and other Institutions.
Driving EnhancingGROWTH performance 15
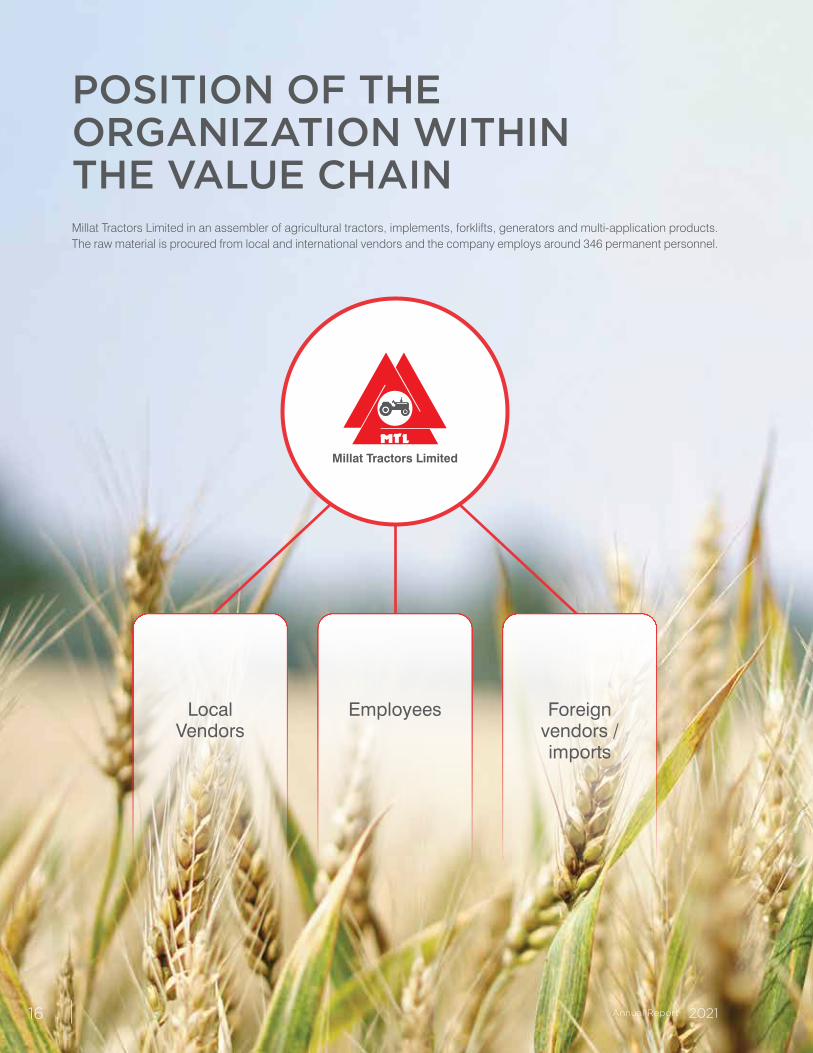
POSITION OF THE ORGANIZATION WITHIN THE VALUE CHAINMillat Tractors Limited in an assembler of agricultural tractors, implements, forklifts, generators and multi-application products. The raw material is procured from local and international vendors and the company employs around 346 permanent personnel.
Millat Tractors Limited
Local Vendors
Employees Foreign vendors / imports
Annual Report 202116
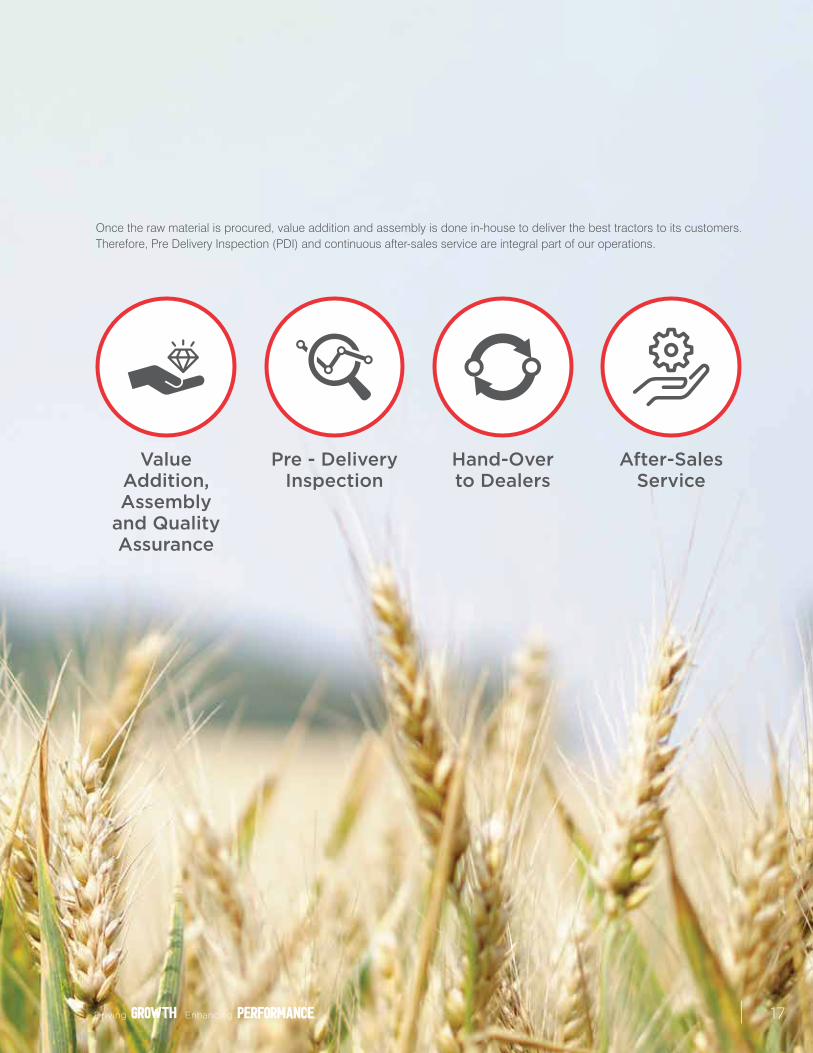
Once the raw material is procured, value addition and assembly is done in-house to deliver the best tractors to its customers. Therefore, Pre Delivery Inspection (PDI) and continuous after-sales service are integral part of our operations.
Value Addition, Assembly
and Quality Assurance
Hand-Over to Dealers
After-Sales Service
Pre - Delivery Inspection
Driving EnhancingGROWTH performance 17
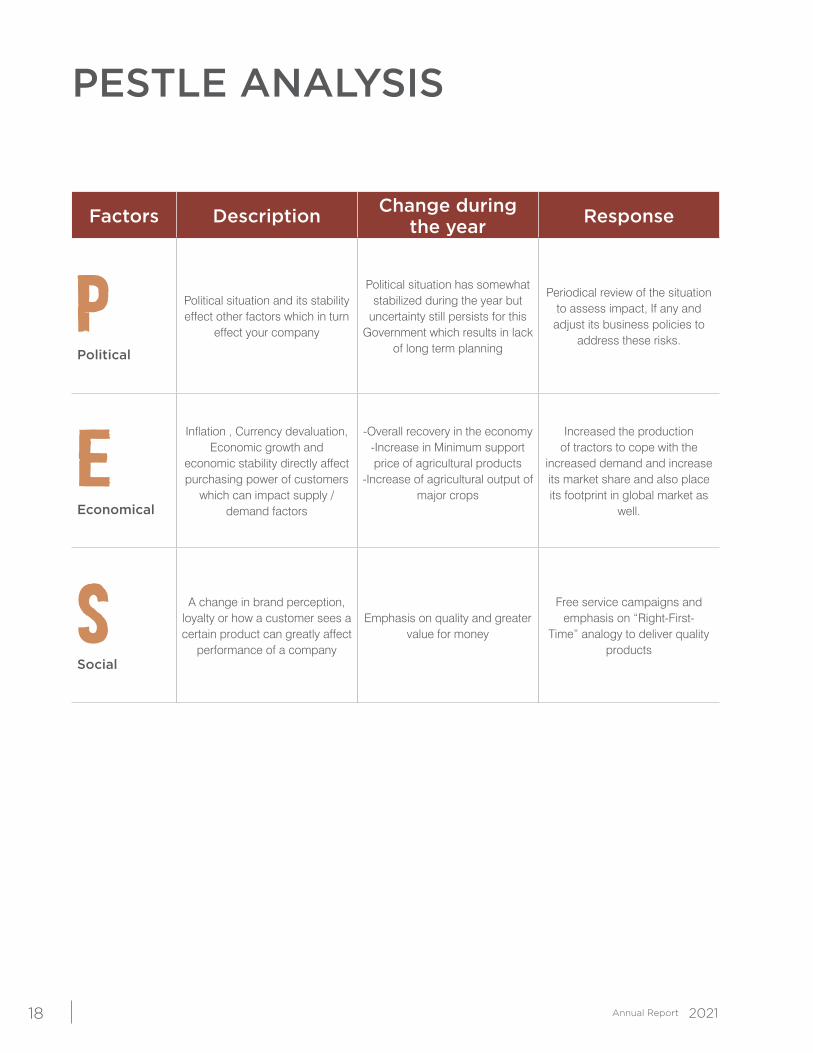
PESTLE ANALYSIS
Factors Description Change during the year Response
PPolitical
Political situation and its stability effect other factors which in turn
effect your company
Political situation has somewhat stabilized during the year but
uncertainty still persists for this Government which results in lack
of long term planning
Periodical review of the situation to assess impact, If any and
adjust its business policies to address these risks.
EEconomical
Inflation , Currency devaluation, Economic growth and
economic stability directly affect purchasing power of customers
which can impact supply / demand factors
-Overall recovery in the economy-Increase in Minimum support price of agricultural products
-Increase of agricultural output of major crops
Increased the production of tractors to cope with the
increased demand and increase its market share and also place its footprint in global market as
well.
SSocial
A change in brand perception, loyalty or how a customer sees a certain product can greatly affect
performance of a company
Emphasis on quality and greater value for money
Free service campaigns and emphasis on “Right-First-
Time” analogy to deliver quality products
Annual Report 202118
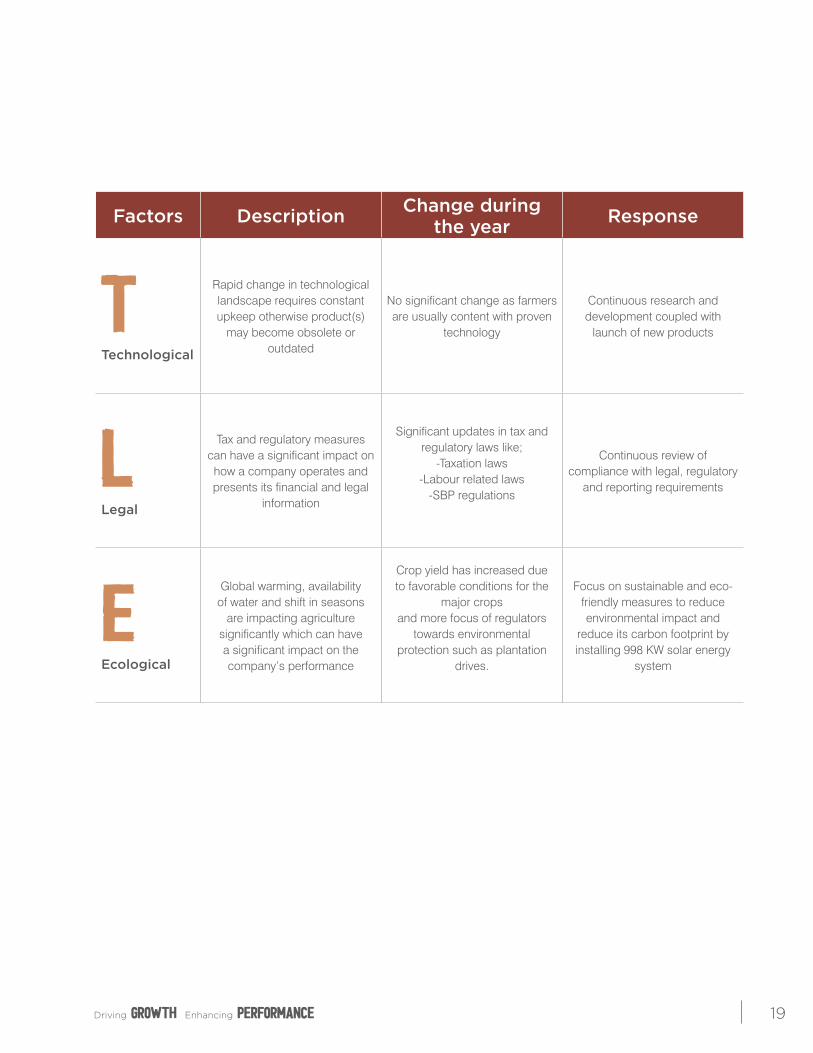
Factors Description Change during the year Response
TTechnological
Rapid change in technological landscape requires constant upkeep otherwise product(s)
may become obsolete or outdated
No significant change as farmers are usually content with proven
technology
Continuous research and development coupled with
launch of new products
lLegal
Tax and regulatory measures can have a significant impact on how a company operates and presents its financial and legal
information
Significant updates in tax and regulatory laws like;
-Taxation laws-Labour related laws
-SBP regulations
Continuous review of compliance with legal, regulatory
and reporting requirements
eEcological
Global warming, availability of water and shift in seasons
are impacting agriculture significantly which can have a significant impact on the company’s performance
Crop yield has increased due to favorable conditions for the
major cropsand more focus of regulators
towards environmental protection such as plantation
drives.
Focus on sustainable and eco-friendly measures to reduce environmental impact and
reduce its carbon footprint by installing 998 KW solar energy
system
Driving EnhancingGROWTH performance 19
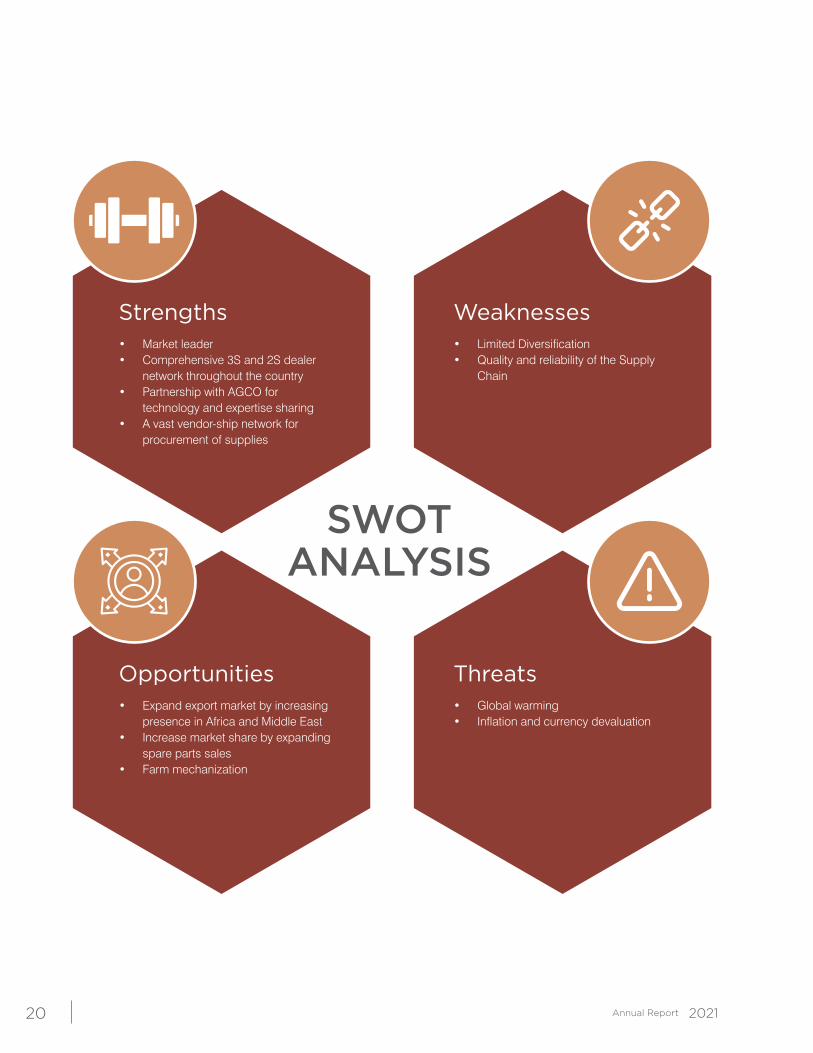
SWOT ANALYSIS
Strengths
Opportunities
Weaknesses
Threats
• Market leader• Comprehensive 3S and 2S dealer
network throughout the country• Partnership with AGCO for
technology and expertise sharing• A vast vendor-ship network for
procurement of supplies
• Expand export market by increasing presence in Africa and Middle East
• Increase market share by expanding spare parts sales
• Farm mechanization
• Limited Diversification• Quality and reliability of the Supply
Chain
• Global warming• Inflation and currency devaluation
Annual Report 202120
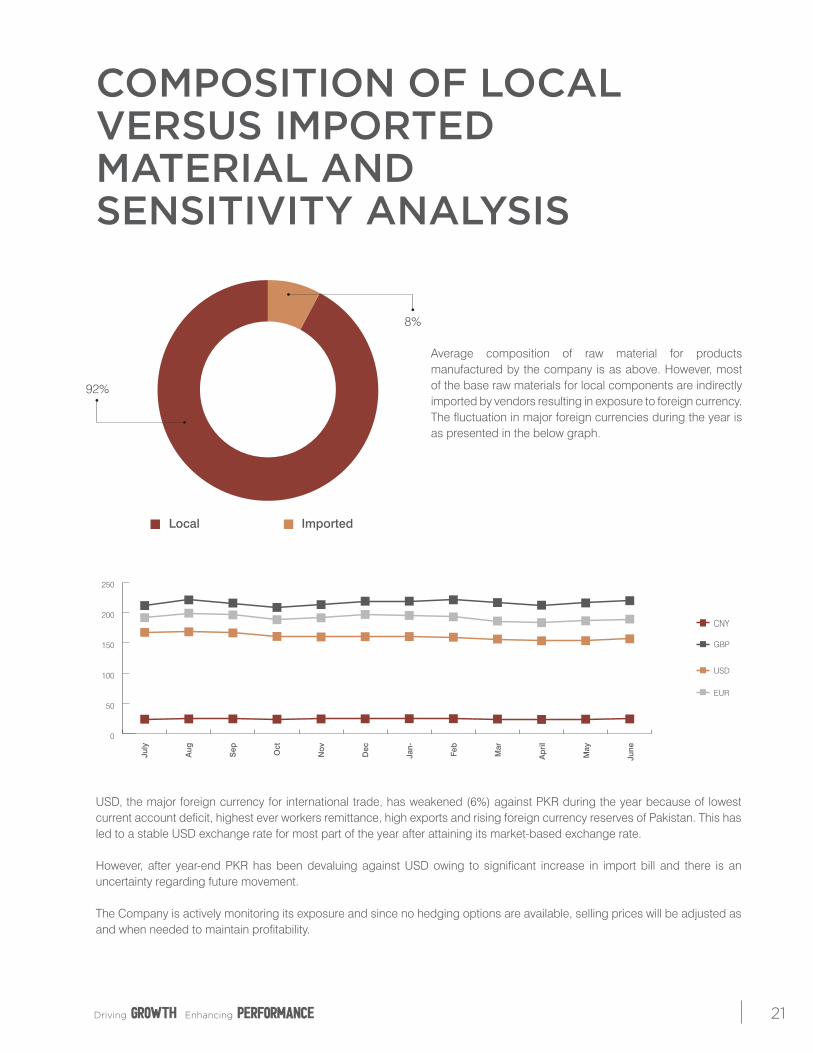
COMPOSITION OF LOCAL VERSUS IMPORTED MATERIAL AND SENSITIVITY ANALYSIS
Average composition of raw material for products manufactured by the company is as above. However, most of the base raw materials for local components are indirectly imported by vendors resulting in exposure to foreign currency. The fluctuation in major foreign currencies during the year is as presented in the below graph.
USD, the major foreign currency for international trade, has weakened (6%) against PKR during the year because of lowest current account deficit, highest ever workers remittance, high exports and rising foreign currency reserves of Pakistan. This has led to a stable USD exchange rate for most part of the year after attaining its market-based exchange rate.
However, after year-end PKR has been devaluing against USD owing to significant increase in import bill and there is an uncertainty regarding future movement.
The Company is actively monitoring its exposure and since no hedging options are available, selling prices will be adjusted as and when needed to maintain profitability.
92%
8%
Local Imported
July
Aug
Sep Oct
Nov
Dec
Jan-
Feb
Mar
Ap
ril
May
June
CNY
GBP
USD
EUR
0
50
100
150
200
250
Driving EnhancingGROWTH performance 21


strategy & resource alLocation

STRATEGIC OBJECTIVESLONG TERM OBJECTIVES• Constantly endeavor to be market leader in terms of
market share
• Technology pace-setters in areas of operations
• Continuously improve efficiency and competitive strength.
• Offer customers quality products and support services at competitive prices and customer satisfaction.
• Ensure sustainability of company returns to shareholders
• Enhance creativity and job satisfaction
• Provide employees opportunity for personal development.
• Be an integral part of national economy with a strong sense of responsibility to society and the environment.
MEDIUM AND SHORT-TERM OBJECTIVES• Increase export market share
• Ensure safe navigation in these testing waters
• Secure working capital requirements by effective cash flow management
• Ensure employee retention
• Safeguard shareholders’ return
STRATEGIC PLANMillat Tractors Limited will ensure its facilities and operations are state of the art and enabled with latest technology to
Annual Report 202124
deliver quality products at optimum price point. In order to achieve this, the company will continue to invest in its employees and technology.
Support to vendor industry will continue even more so in these times. The company will continue to enable them through technological and financial support. The company also plans to work closely with those charged with governance of this country to ensure maximum wealth creation for all stakeholders.
LIQUIDITY ANALYSISGiven the current situation under global pandemic of COVID-19, it is important to discuss and assure our stakeholders of the company’s liquidity position. During the year, sales of the Company has increased significantly which resulted in favorable cash flows to the Company. The Company has managed to effectively use these funds and also provide support to fellow vendors industry in these testing times.
However, during the year Sales tax refunds of the Company have ballooned up-to Rs 4.59 Billion which is creating problems for the Company with the increased activity level. Management of the Company is actively pursuing this matter at every possible forum so that operations of your Company are not disturbed.
SIGNIFICANT PLANS The company aims to expand its global outreach by expanding its export operations and focus on diversification through providing IT-enabled solutions. The immediate goal is to keep the company secure with aspect to the global pandemic and ensure safety and well-being of all stakeholders and employees.
CHANGES IN OBJECTIVESThere has been no significant change in strategy and objectives from prior years other than those caused by the global pandemic.
Driving EnhancingGROWTH performance 25
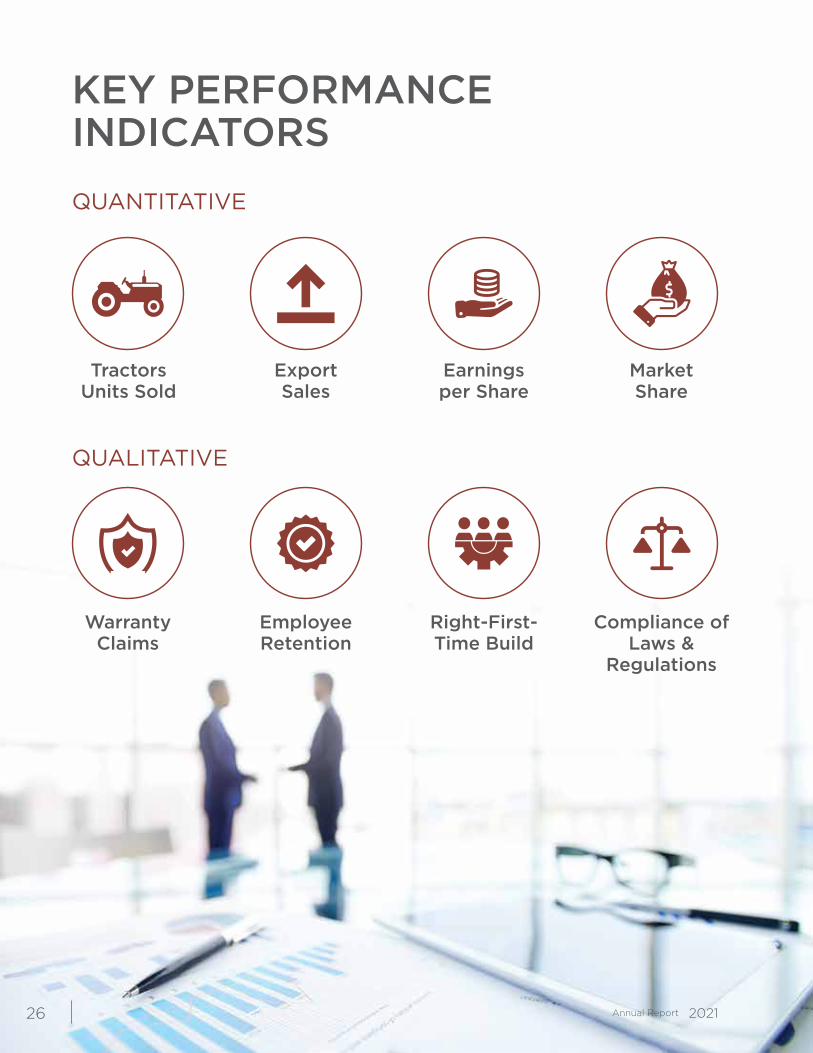
KEY PERFORMANCE INDICATORS
TractorsUnits Sold
QUANTITATIVE
QUALITATIVE
Export Sales
Earningsper Share
MarketShare
Right-First-Time Build
Compliance ofLaws &
Regulations
Employee Retention
Warranty Claims
Annual Report 202126
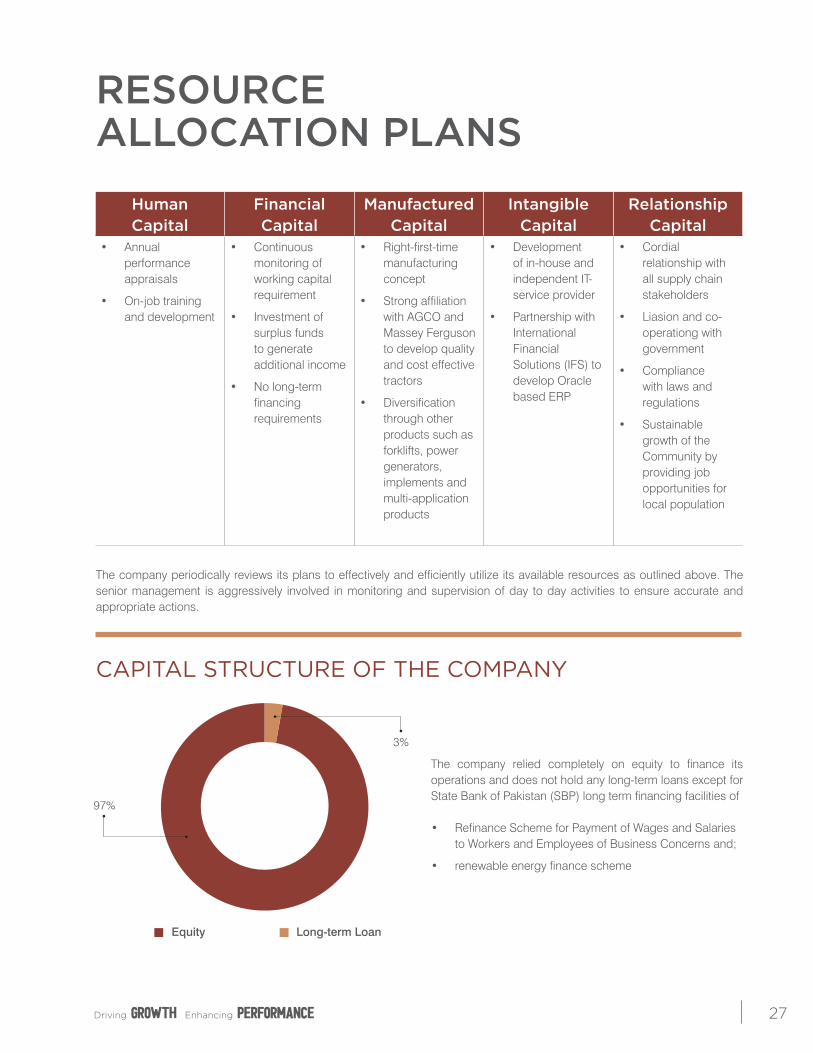
RESOURCE ALLOCATION PLANS
Human Capital
Financial Capital
Manufactured Capital
Intangible Capital
Relationship Capital
• Annual performance appraisals
• On-job training and development
• Continuous monitoring of working capital requirement
• Investment of surplus funds to generate additional income
• No long-term financing requirements
• Right-first-time manufacturing concept
• Strong affiliation with AGCO and Massey Ferguson to develop quality and cost effective tractors
• Diversification through other products such as forklifts, power generators, implements and multi-application products
• Development of in-house and independent IT-service provider
• Partnership with International Financial Solutions (IFS) to develop Oracle based ERP
• Cordial relationship with all supply chain stakeholders
• Liasion and co-operationg with government
• Compliance with laws and regulations
• Sustainable growth of the Community by providing job opportunities for local population
The company periodically reviews its plans to effectively and efficiently utilize its available resources as outlined above. The senior management is aggressively involved in monitoring and supervision of day to day activities to ensure accurate and appropriate actions.
The company relied completely on equity to finance its operations and does not hold any long-term loans except for State Bank of Pakistan (SBP) long term financing facilities of
• Refinance Scheme for Payment of Wages and Salaries to Workers and Employees of Business Concerns and;
• renewable energy finance scheme
CAPITAL STRUCTURE OF THE COMPANY
97%
3%
Equity Long-term Loan
Driving EnhancingGROWTH performance 27


risks &opportunities
RISKS AND OPPORTUNITIES
Risks Source Magnitude Chance of occurrence Plan to address
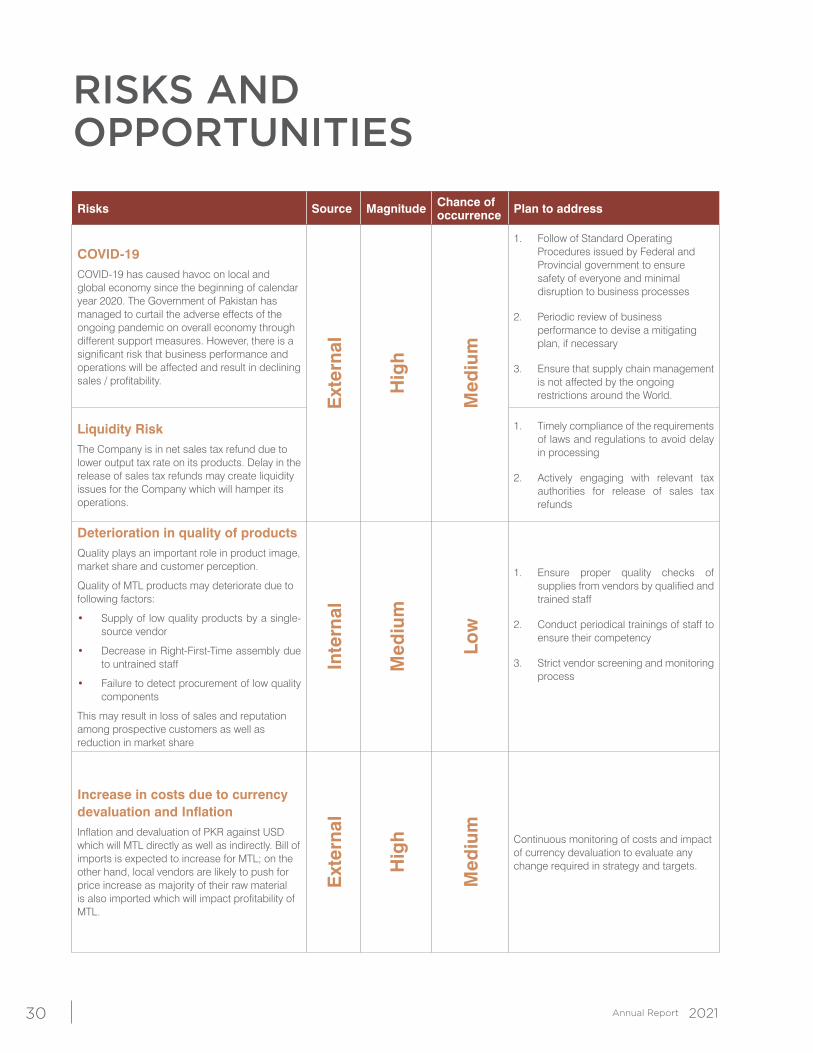
COVID-19COVID-19 has caused havoc on local and global economy since the beginning of calendar year 2020. The Government of Pakistan has managed to curtail the adverse effects of the ongoing pandemic on overall economy through different support measures. However, there is a significant risk that business performance and operations will be affected and result in declining sales / profitability.
Ext
erna
l
Hig
h
Med
ium
1. Follow of Standard Operating Procedures issued by Federal and Provincial government to ensure safety of everyone and minimal disruption to business processes
2. Periodic review of business performance to devise a mitigating plan, if necessary
3. Ensure that supply chain management is not affected by the ongoing restrictions around the World.
Liquidity RiskThe Company is in net sales tax refund due to lower output tax rate on its products. Delay in the release of sales tax refunds may create liquidity issues for the Company which will hamper its operations.
1. Timely compliance of the requirements of laws and regulations to avoid delay in processing
2. Actively engaging with relevant tax authorities for release of sales tax refunds
Deterioration in quality of productsQuality plays an important role in product image, market share and customer perception.
Quality of MTL products may deteriorate due to following factors:
• Supply of low quality products by a single-source vendor
• Decrease in Right-First-Time assembly due to untrained staff
• Failure to detect procurement of low quality components
This may result in loss of sales and reputation among prospective customers as well as reduction in market share
Inte
rnal
Med
ium
Low
1. Ensure proper quality checks of supplies from vendors by qualified and trained staff
2. Conduct periodical trainings of staff to ensure their competency
3. Strict vendor screening and monitoring process
Increase in costs due to currency devaluation and InflationInflation and devaluation of PKR against USD which will MTL directly as well as indirectly. Bill of imports is expected to increase for MTL; on the other hand, local vendors are likely to push for price increase as majority of their raw material is also imported which will impact profitability of MTL.
Ext
erna
l
Hig
h
Med
ium
Continuous monitoring of costs and impact of currency devaluation to evaluate any change required in strategy and targets.
Annual Report 202130
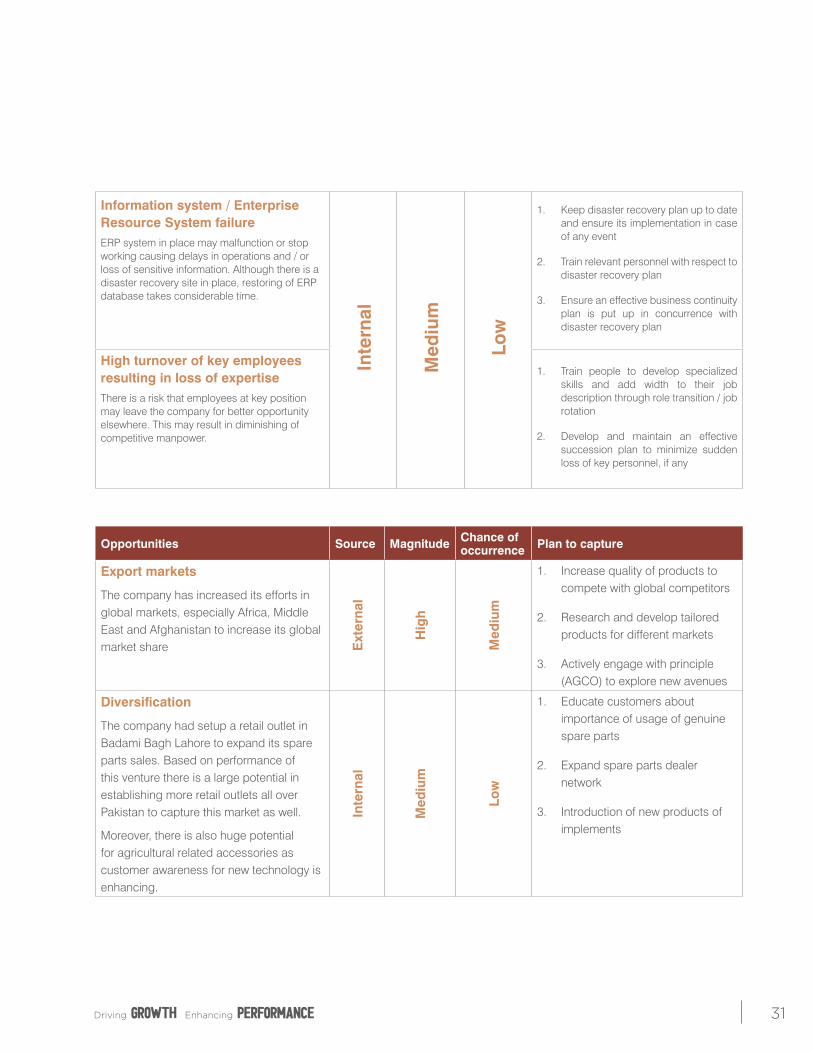
Information system / Enterprise Resource System failureERP system in place may malfunction or stop working causing delays in operations and / or loss of sensitive information. Although there is a disaster recovery site in place, restoring of ERP database takes considerable time.
Inte
rnal
Med
ium
Low
1. Keep disaster recovery plan up to date and ensure its implementation in case of any event
2. Train relevant personnel with respect to disaster recovery plan
3. Ensure an effective business continuity plan is put up in concurrence with disaster recovery plan
High turnover of key employees resulting in loss of expertiseThere is a risk that employees at key position may leave the company for better opportunity elsewhere. This may result in diminishing of competitive manpower.
1. Train people to develop specialized skills and add width to their job description through role transition / job rotation
2. Develop and maintain an effective succession plan to minimize sudden loss of key personnel, if any
Opportunities Source Magnitude Chance of occurrence Plan to capture
Export markets
The company has increased its efforts in global markets, especially Africa, Middle East and Afghanistan to increase its global market share E
xter
nal
Hig
h
Med
ium
1. Increase quality of products to compete with global competitors
2. Research and develop tailored products for different markets
3. Actively engage with principle (AGCO) to explore new avenues
Diversification
The company had setup a retail outlet in Badami Bagh Lahore to expand its spare parts sales. Based on performance of this venture there is a large potential in establishing more retail outlets all over Pakistan to capture this market as well.
Moreover, there is also huge potential for agricultural related accessories as customer awareness for new technology is enhancing.
Inte
rnal
Med
ium
Low
1. Educate customers about importance of usage of genuine spare parts
2. Expand spare parts dealer network
3. Introduction of new products of implements
Driving EnhancingGROWTH performance 31

Noticeof annualgeneralmeeting
NOTICE OF ANNUAL GENERAL MEETINGNotice is hereby given that 58th Annual General Meeting of Millat Tractors Limited will be held at the Registered Office of the Company at 9 K.M. Sheikhupura Road, Shahdara, Lahore, on Saturday October 30, 2021 at 11:30 A.M to transact the following business:
A. ORDINARY BUSINESS1) To confirm minutes of the 57th Annual General Meeting held
on October 26, 2020.
2) To receive, consider and adopt the Financial Statements ofthe Company and the Group for the year ended June 30,2021 together with the Chairman’s Review, Directors’ andAuditors’ Reports thereon.
3) To approve final cash dividend of Rs.50.00 per share i.e.,500% in addition to the interim dividend of Rs. 50.00 pershare i.e.,500% already paid making a total cash dividend
of Rs. 100.00 per share i.e., 1,000%.
4) To appoint auditors and fix their remuneration for theyear ending June 30, 2022.
5) To elect eight directors of the Company for a period of threeyears. The retiring directors are M/s. Sikandar MustafaKhan, Sohail Bashir Rana, Laeeq Uddin Ansari, MianMuhammad Saleem, Saad Iqbal, Ahsan Imran Shaikh andMrs. Ambreen Waheed.
As resolved by the Board in its meeting held on September17, 2021 the number of Directors to be elected shall beeight of which two male independent and one female
independent director are proposed to be elected.
B. SPECIAL BUSINESS6) To ratify and approve issuance of 12.5% Bonus Shares
already issued and approved by the Board, by passingthe following ordinary resolution.
“RESOLVED THAT:A sum of Rs. 62,286,390 out of the profit available forappropriations as at December 31, 2020 be capitalizedand be applied to the issue of 6,228,639 ordinary sharesof Rs.10 each allotted as fully paid Bonus Shares to themembers whose names appear in the register of membersas at the close of business on March 11, 2021 in theproportion of one share for every eight ordinary shares heldi.e.,12.5%.
These Bonus Shares shall rank pari passu in all respects with existing shares except that these shares shall not qualify for the interim dividend declared for the year ending June 30, 2021.
The Directors be and are hereby authorized and empowered to give effect to this resolution and to do or cause to be done all acts, deeds and things that may be necessary or required for the issue, allotment and distribution of Bonus Shares.”
“RESOLVED that the Directors be and are hereby authorized to consolidate all fractions of bonus shares and sell the same in the Stock Market and pay the proceeds of sales when realized to charitable institution(s).
7) To consider and if deemed appropriate to approve issuance of 20% Bonus Shares in addition to 12.5% Bonus Shares already issued by passing the following resolution as an ordinary resolution:
“RESOLVED THATA sum of Rs. 112,115,502 (rounded to Rs. 112,115,500) out of the profit available for appropriations as at June 30, 2021 be capitalized and be applied to the issue of 11,211,550.2(rounded to 11,211,550) ordinary shares of Rs.10 each allotted as fully paid Bonus Shares to the members whose names appear in the register of members as at the close of business on October 23, 2021 in the proportion of one share for every five ordinary shares held i. e.,20%.
These Bonus Shares shall rank pari passu in all respects with existing shares except that these shares shall not qualify for the final dividend declared for the year ended June 30, 2021.The Directors be and are hereby authorized and empowered to give effect to this resolution and to do or cause to be done all acts, deeds and things that may be necessary or required for the issue, allotment and distribution of Bonus Shares.”“RESOLVED that the Directors be and are hereby authorized to consolidate all fractions of bonus shares and sell the same in the Stock Market and pay the proceeds of sales when realized to charitable institution(s).”
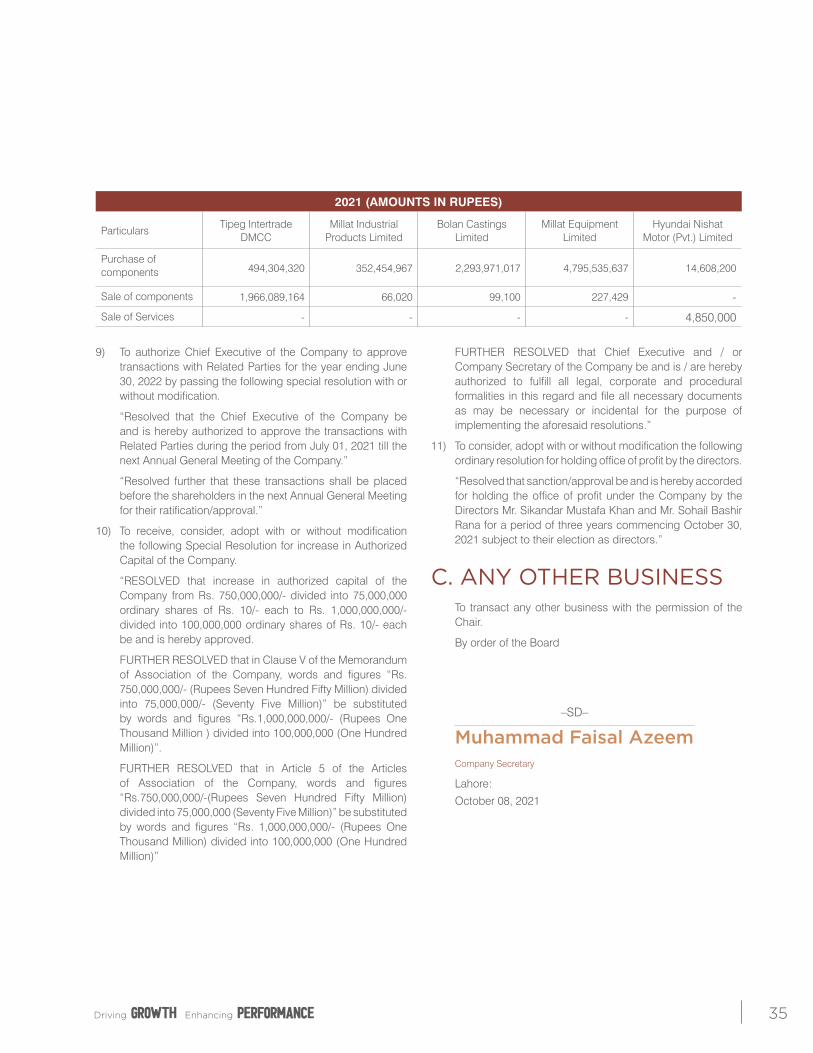
8) To ratify and approve transactions conducted with Related Parties for the year ended June 30, 2021 by passing the following special resolution with or without modification.“Resolved that the following transactions conducted with Related Parties for the year ended June 30, 2021 be and are hereby ratified, approved and confirmed.”
Annual Report 202134
9) To authorize Chief Executive of the Company to approvetransactions with Related Parties for the year ending June30, 2022 by passing the following special resolution with orwithout modification.
“Resolved that the Chief Executive of the Company beand is hereby authorized to approve the transactions withRelated Parties during the period from July 01, 2021 till thenext Annual General Meeting of the Company.”
“Resolved further that these transactions shall be placedbefore the shareholders in the next Annual General Meetingfor their ratification/approval.”
10) To receive, consider, adopt with or without modificationthe following Special Resolution for increase in AuthorizedCapital of the Company.
“RESOLVED that increase in authorized capital of theCompany from Rs. 750,000,000/- divided into 75,000,000ordinary shares of Rs. 10/- each to Rs. 1,000,000,000/-divided into 100,000,000 ordinary shares of Rs. 10/- eachbe and is hereby approved.
FURTHER RESOLVED that in Clause V of the Memorandumof Association of the Company, words and figures “Rs.750,000,000/- (Rupees Seven Hundred Fifty Million) divided into 75,000,000/- (Seventy Five Million)” be substitutedby words and figures “Rs.1,000,000,000/- (Rupees OneThousand Million ) divided into 100,000,000 (One HundredMillion)”.
FURTHER RESOLVED that in Article 5 of the Articlesof Association of the Company, words and figures“Rs.750,000,000/-(Rupees Seven Hundred Fifty Million)divided into 75,000,000 (Seventy Five Million)” be substituted by words and figures “Rs. 1,000,000,000/- (Rupees OneThousand Million) divided into 100,000,000 (One HundredMillion)”
FURTHER RESOLVED that Chief Executive and / or Company Secretary of the Company be and is / are hereby authorized to fulfill all legal, corporate and procedural formalities in this regard and file all necessary documents as may be necessary or incidental for the purpose of implementing the aforesaid resolutions.”
11) To consider, adopt with or without modification the followingordinary resolution for holding office of profit by the directors.
“Resolved that sanction/approval be and is hereby accorded for holding the office of profit under the Company by theDirectors Mr. Sikandar Mustafa Khan and Mr. Sohail BashirRana for a period of three years commencing October 30,2021 subject to their election as directors.”
C. ANY OTHER BUSINESSTo transact any other business with the permission of the Chair.
By order of the Board
–SD–
Muhammad Faisal AzeemCompany Secretary
Lahore:
October 08, 2021
2021 (AMOUNTS IN RUPEES)
Particulars Tipeg Intertrade
DMCCMillat Industrial
Products LimitedBolan Castings
LimitedMillat Equipment
LimitedHyundai Nishat
Motor (Pvt.) Limited
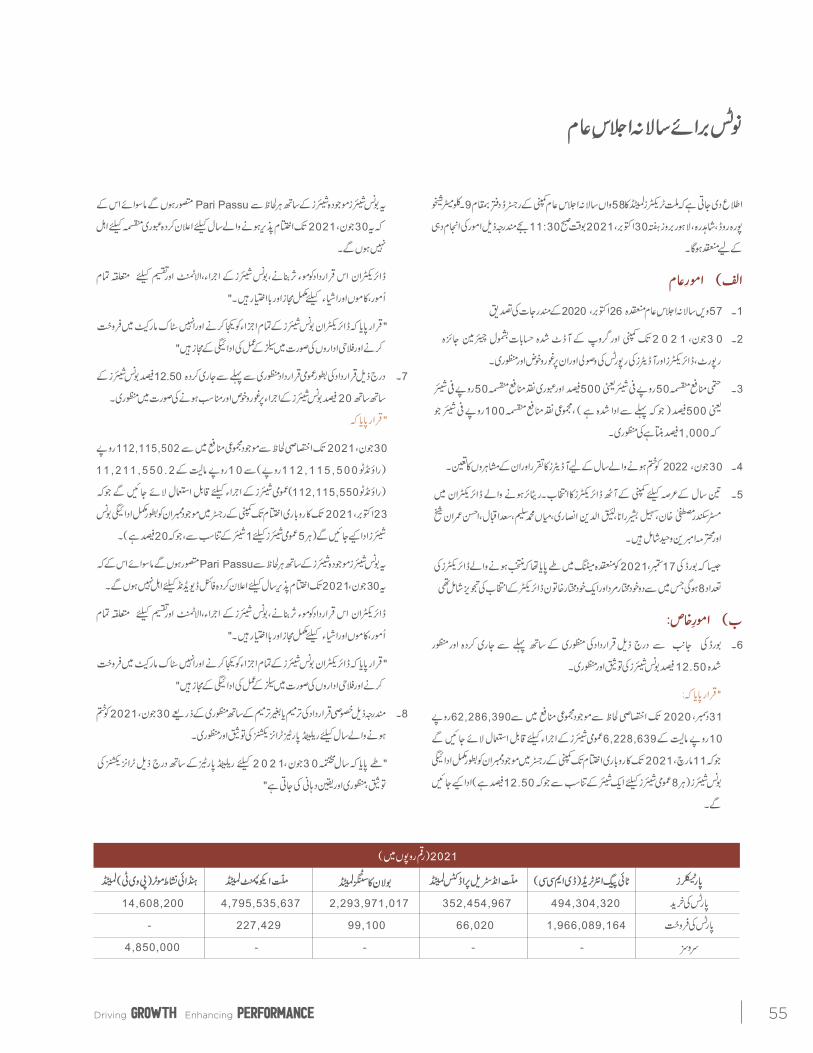
Purchase of components 494,304,320 352,454,967 2,293,971,017 4,795,535,637 14,608,200
Sale of components 1,966,089,164 66,020 99,100 227,429 -
Sale of Services - - - - 4,850,000
Driving EnhancingGROWTH performance 35
NOTES1. The share transfer books of the Company will remain
closed from October 24, 2021 to October 30, 2021 (bothdays inclusive) and no transfer will be accepted during thisperiod. Transfers received, complete in all respect by theShares Registrar, M/s. Hameed Majeed Associates (Pvt.)Limited, 1st Floor, H.M. House, 7-Bank Square, Lahoreby the close of business on October 23, 2021 will beconsidered in time for the purpose of payment of final cashdividend, issuance of bonus shares, and for the purposeof attending and voting at the meeting.
2. A member entitled to attend and vote at this meetingmay appoint another person as his/her proxy to attendthe meeting and vote for him/her. Proxies in order to beeffective must be received at the Registered Office of theCompany duly stamped and signed not less than 48 hoursbefore the meeting.
3. Members, who have deposited their shares into CentralDepository Company of Pakistan will further have to follow
the under mentioned guidelines.
A. Attending of Meeting in Person:i) In case of individuals, the account holder or sub-account
holder and/or the person whose securities are in groupaccount and their registration detail are uploaded asper the regulations, shall authenticate his/her identity byshowing his/her original Computerized National IdentityCard (CNIC)/ original passport at the time of attendingthe meeting.
ii) In case of corporate entity, the Board of Directorsresolution/power of attorney with specimen signature ofthe nominee shall be produced at the time of meeting.
B. Appointment of Proxies:i) In case of individuals, the account holder or sub-account
holder and /or the person whose securities are in groupaccount and their registration details are uploaded asper the regulations, shall submit the proxy form as perthe above requirement.
ii) Attested copies of CNIC or the passport of the beneficial owners and the proxy shall be furnished with the proxyform.
iii) The proxy shall produce his/her original CNIC/originalpassport at the time of the meeting.
iv) In case of corporate entity, the Board of Directorsresolution/power of attorney with specimen signatureshall be submitted along with proxy form to theCompany.
4. Filing of Consent for Election of DirectorsAs required u/s 159(3) of Companies Act, 2017, any member who seeks to contest an election to the office of a director,shall whether he/ she is retiring director or otherwise, filewith the Company, not later than fourteen days before thedate of meeting at which elections are to be held, a noticeof his/her intention to offer himself/herself for election asa director along with consent to act as a director in form28, duly completed as required under section 167(1) of theCompanies Act, 2017; and a detailed personal profile alongwith office address for placement on to the Company’swebsite in accordance with SECP’s SRO No.1196(I)/2019dated October 03, 2019 before the election.
The following declaration should also be furnished asrequired under the Code of Corporate Governance andListing Regulations of the Stock Exchange: I hereby declarethat:
a) I am a member of the Company.(Number of sharesheld along with Folio number or CDC participant id and account number, be mentioned)
b) I am not ineligible to become a director of the company under any applicable laws and regulations.
c) I am not serving as a director on the Boards of morethan seven (07) listed companies.
d) I am a registered tax payer and my National Tax No. is------------------.
e) I have never been declared defaulter in payment of any loan to banking company, a Development FinancialInstitution or a Non Banking Financial Institution.
f) Neither I nor my spouse has ever been engaged in thebusiness of “Stock Brokerage” in any Stock Exchange.
In case of Independent director, an additional declaration confirming that he/she qualifies the criteria of independence as contained in Section 166 of the Companies Act, 2017.
5. Participation in the Annual GeneralMeetingSECP, through its Circular No. 04 of 2021 dated February 15, 2021, has directed the listed companies to also arrange theprovision of video link facility. Accordingly, in the best healthinterest of our valued shareholders and to ensure maximumparticipation, the Company has also arranged video linkfacility for attending this AGM. The shareholders interestedin attending AGM through video link are requested toregister their following particulars by sending an email [email protected].
Annual Report 202136
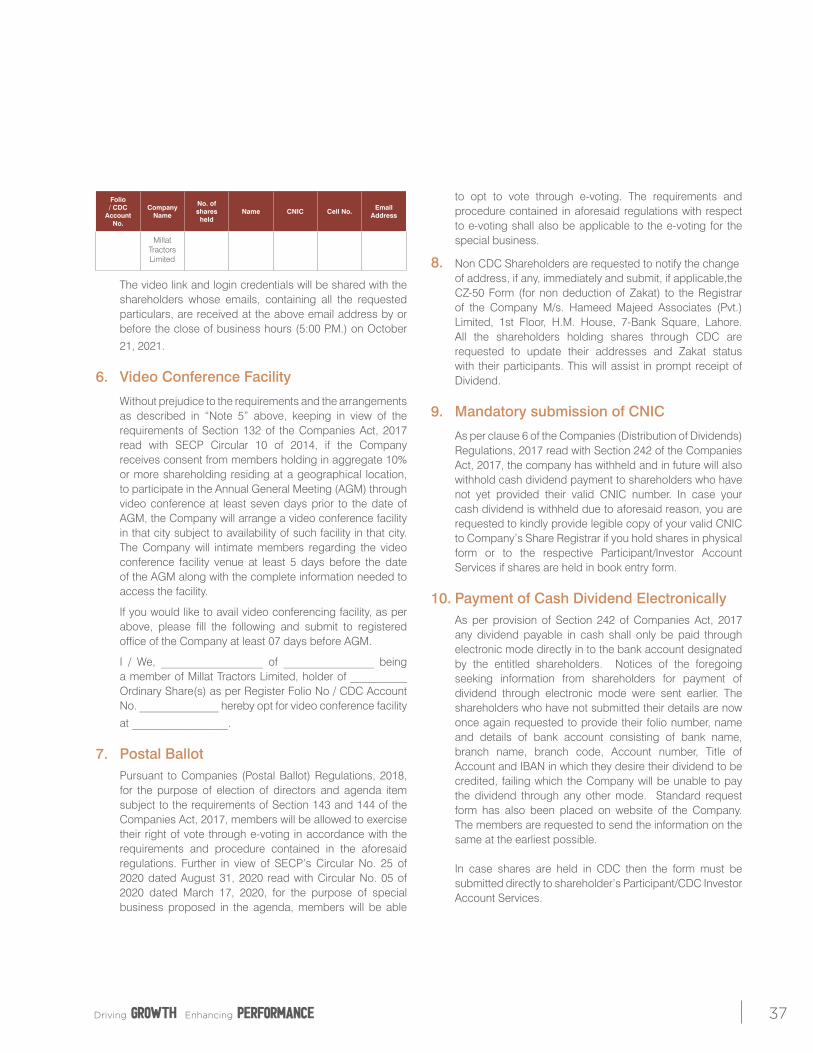
Folio / CDC
Account No.
CompanyName
No. of shares
heldName CNIC Cell No. Email
Address
MillatTractorsLimited
The video link and login credentials will be shared with the shareholders whose emails, containing all the requested particulars, are received at the above email address by or before the close of business hours (5:00 P.M.) on October
21, 2021.
6. Video Conference Facility
Without prejudice to the requirements and the arrangements as described in “Note 5” above, keeping in view of the requirements of Section 132 of the Companies Act, 2017 read with SECP Circular 10 of 2014, if the Company receives consent from members holding in aggregate 10% or more shareholding residing at a geographical location, to participate in the Annual General Meeting (AGM) through video conference at least seven days prior to the date of AGM, the Company will arrange a video conference facility in that city subject to availability of such facility in that city. The Company will intimate members regarding the video conference facility venue at least 5 days before the date of the AGM along with the complete information needed to access the facility.
If you would like to avail video conferencing facility, as per above, please fill the following and submit to registered office of the Company at least 07 days before AGM.
I / We, __________________ of ________________ being a member of Millat Tractors Limited, holder of __________ Ordinary Share(s) as per Register Folio No / CDC Account No. ______________ hereby opt for video conference facility
at _________________.
7. Postal Ballot Pursuant to Companies (Postal Ballot) Regulations, 2018,
for the purpose of election of directors and agenda item subject to the requirements of Section 143 and 144 of the Companies Act, 2017, members will be allowed to exercise their right of vote through e-voting in accordance with the requirements and procedure contained in the aforesaid regulations. Further in view of SECP’s Circular No. 25 of 2020 dated August 31, 2020 read with Circular No. 05 of 2020 dated March 17, 2020, for the purpose of special business proposed in the agenda, members will be able
to opt to vote through e-voting. The requirements and procedure contained in aforesaid regulations with respect to e-voting shall also be applicable to the e-voting for the special business.
8. Non CDC Shareholders are requested to notify the change of address, if any, immediately and submit, if applicable,the CZ-50 Form (for non deduction of Zakat) to the Registrar of the Company M/s. Hameed Majeed Associates (Pvt.) Limited, 1st Floor, H.M. House, 7-Bank Square, Lahore. All the shareholders holding shares through CDC are requested to update their addresses and Zakat status with their participants. This will assist in prompt receipt of Dividend.
9. Mandatory submission of CNIC
As per clause 6 of the Companies (Distribution of Dividends) Regulations, 2017 read with Section 242 of the Companies Act, 2017, the company has withheld and in future will also withhold cash dividend payment to shareholders who have not yet provided their valid CNIC number. In case your cash dividend is withheld due to aforesaid reason, you are requested to kindly provide legible copy of your valid CNIC to Company’s Share Registrar if you hold shares in physical form or to the respective Participant/Investor Account Services if shares are held in book entry form.
10. Payment of Cash Dividend Electronically
As per provision of Section 242 of Companies Act, 2017 any dividend payable in cash shall only be paid through electronic mode directly in to the bank account designated by the entitled shareholders. Notices of the foregoing seeking information from shareholders for payment of dividend through electronic mode were sent earlier. The shareholders who have not submitted their details are now once again requested to provide their folio number, name and details of bank account consisting of bank name, branch name, branch code, Account number, Title of Account and IBAN in which they desire their dividend to be credited, failing which the Company will be unable to pay the dividend through any other mode. Standard request form has also been placed on website of the Company. The members are requested to send the information on the same at the earliest possible.
In case shares are held in CDC then the form must be submitted directly to shareholder’s Participant/CDC Investor Account Services.
Driving EnhancingGROWTH performance 37
11. Deduction of Tax from Dividend IncomeThe rates of deduction of income tax under section 150of the Income Tax Ordinance, 2001 out of payments ofdividend shall be as follows:
(a) Members whose names are appearing in ActiveTaxpayers List (ATL) 15%
(b) Members whose names are not appearing in ActiveTaxpayers List (ATL) 30%
To enable the Company to make tax deduction from cash dividend @15.00% instead of 30.00% all the members whose names are not entered into the Active Tax-payers List (ATL) provided on the website of FBR, despite the fact that they are filers, are advised to make sure that their names are entered into ATL before the date of payment of cash dividend, otherwise tax on their dividend will be deducted @ 30.00% instead of 15.00%.
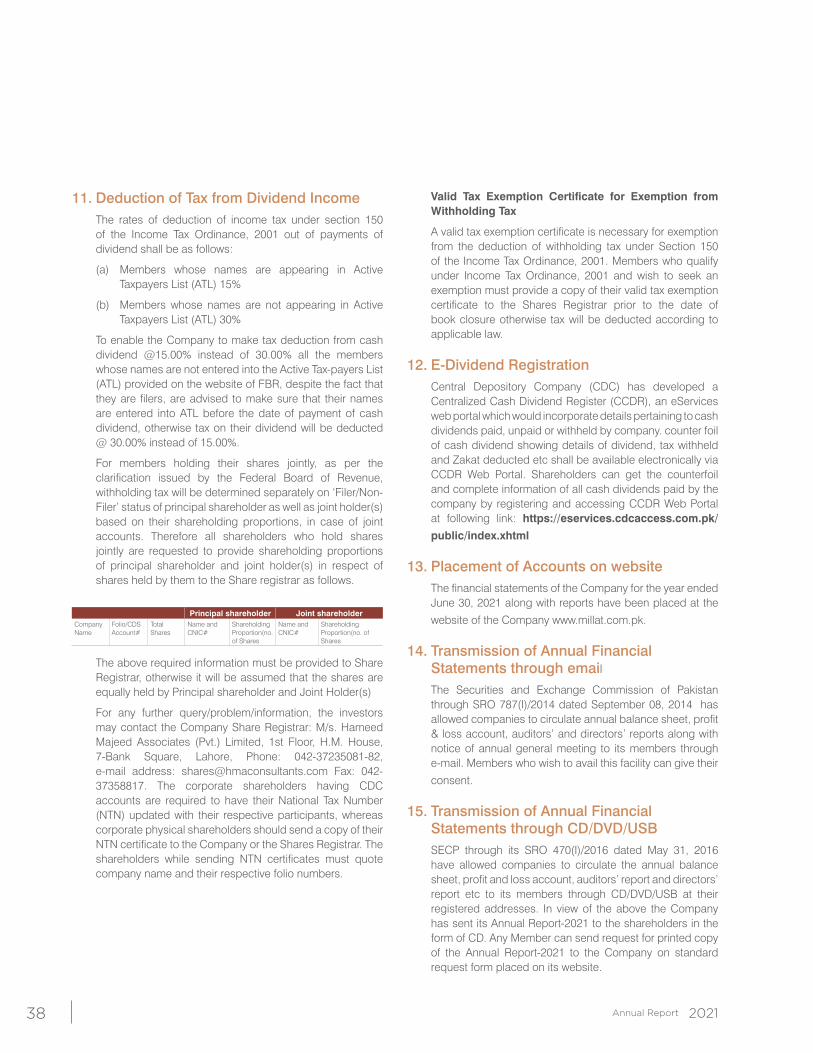
For members holding their shares jointly, as per the clarification issued by the Federal Board of Revenue, withholding tax will be determined separately on ‘Filer/Non-Filer’ status of principal shareholder as well as joint holder(s) based on their shareholding proportions, in case of joint accounts. Therefore all shareholders who hold shares jointly are requested to provide shareholding proportions of principal shareholder and joint holder(s) in respect of shares held by them to the Share registrar as follows.
Principal shareholder Joint shareholderCompany Name
Folio/CDS Account#
Total Shares
Name and CNIC#
Shareholding Proportion(no. of Shares
Name and CNIC#
Shareholding Proportion(no. of Shares
The above required information must be provided to Share Registrar, otherwise it will be assumed that the shares are equally held by Principal shareholder and Joint Holder(s)
For any further query/problem/information, the investors may contact the Company Share Registrar: M/s. Hameed Majeed Associates (Pvt.) Limited, 1st Floor, H.M. House, 7-Bank Square, Lahore, Phone: 042-37235081-82,e-mail address: [email protected] Fax: 042-37358817. The corporate shareholders having CDCaccounts are required to have their National Tax Number(NTN) updated with their respective participants, whereascorporate physical shareholders should send a copy of their NTN certificate to the Company or the Shares Registrar. The shareholders while sending NTN certificates must quotecompany name and their respective folio numbers.
Valid Tax Exemption Certificate for Exemption from Withholding Tax
A valid tax exemption certificate is necessary for exemption from the deduction of withholding tax under Section 150 of the Income Tax Ordinance, 2001. Members who qualify under Income Tax Ordinance, 2001 and wish to seek an exemption must provide a copy of their valid tax exemption certificate to the Shares Registrar prior to the date of book closure otherwise tax will be deducted according to applicable law.
12. E-Dividend RegistrationCentral Depository Company (CDC) has developed aCentralized Cash Dividend Register (CCDR), an eServicesweb portal which would incorporate details pertaining to cash dividends paid, unpaid or withheld by company. counter foilof cash dividend showing details of dividend, tax withheldand Zakat deducted etc shall be available electronically viaCCDR Web Portal. Shareholders can get the counterfoiland complete information of all cash dividends paid by thecompany by registering and accessing CCDR Web Portalat following link: https://eservices.cdcaccess.com.pk/
public/index.xhtml
13. Placement of Accounts on websiteThe financial statements of the Company for the year ended June 30, 2021 along with reports have been placed at the
website of the Company www.millat.com.pk.
14. Transmission of Annual FinancialStatements through emailThe Securities and Exchange Commission of Pakistanthrough SRO 787(I)/2014 dated September 08, 2014 hasallowed companies to circulate annual balance sheet, profit& loss account, auditors’ and directors’ reports along withnotice of annual general meeting to its members throughe-mail. Members who wish to avail this facility can give their
consent.
15. Transmission of Annual FinancialStatements through CD/DVD/USBSECP through its SRO 470(I)/2016 dated May 31, 2016 have allowed companies to circulate the annual balancesheet, profit and loss account, auditors’ report and directors’ report etc to its members through CD/DVD/USB at theirregistered addresses. In view of the above the Companyhas sent its Annual Report-2021 to the shareholders in theform of CD. Any Member can send request for printed copyof the Annual Report-2021 to the Company on standardrequest form placed on its website.
Annual Report 202138
16. Conversion of Physical Shares in to Book Entry Form
Securities and Exchange Commission of Pakistan (SECP) through its circular no. CSD/ED/Misc/2016-639-640 dated March 26, 2021 has advised the Listed Companies to adhere with the provisions of section 72 of the Companies Act, 2017( the Act) by replacing shares issued by them in physical form with the shares to be issued in the Book entry Form. The shareholders having physical folios/share certificates are requested to convert their shares from physical form to book entry form at the earliest. The shareholders may contact any stock broker, CDC Participant (member of PSX) or CDC Investor Account services for assistance in opening of CDS Account and subsequent deposit of physical shares into the account in Book entry form.
The same would facilitate the shareholders in many ways including safe custody of shares, no loss of shares, avoidance of formalities required for issuance of duplicate shares and readily available for sale and purchase in open market at prevailing better rates. The shareholders may contact our share registrar for details.
STATEMENT U/S 134(3) OF THE COMPANIES ACT, 2017AGENDA ITEM NO.6 & 7
Issuance of Bonus Shares The Board of Directors is of the view that the Company’s
financial position and its reserves justify this capitalization for the issue of Bonus Shares. The Directors of the Company, directly or indirectly are not interested in the resolution except to the extent of their shareholding in the Company.
Disposal of Bonus Share Fractions
The Board in its 179th & 181st meetings held on February 19, 2021 and September 17, 2021 has recommended that the fractions of bonus shares will be immaterial and of no significant financial disadvantage to the shareholders. Therefore the proceeds of the above may be donated to one or more charitable institutions (engaged in the welfare of human being) in line with the Company’s policy of maximum participation in welfare.
AGENDA ITEM NO.8
Related Party Transactions (RPTs)
(As per Regulation 5(1) of The Companies (Related party Transactions and Maintenance of Related Records) regulations, 2018
The Related Party Transactions conducted with group companies had to be approved by the Board duly recommended by the Audit Committee periodically pursuant to regulation 15 of the Code of Corporate Governance. However, the majority of Company Directors were interested in these transactions due to their common directorship and holding of shares in the group companies, the quorum of directors could not be formed for approval of these transactions therefore, these transactions have to be approved by the shareholders in General Meeting. It may be noted that principal activity of the company is assembly/manufacture of Agri tractors for which components are procured from approximately 150 vending industries including group companies in the normal course of business. Bolan Castings Limited (BCL) and Millat Equipment Limited (MEL) manufacture intricate tractor components i.e., major tractor castings and gears & shafts etc respectively for which limited sources are available in the country. Millat Industrial Products Limited (MIPL) manufactures tractor batteries while tractors and components are exported through TIPEG INTERTRADE DMCC (TIPEG). In addition, components are imported through TIPEG for in house use by the Company. During the year sale of scrap and swarf etc was also made to BCL for in house consumption.
The commercial reasons for entering into RPTs are the following.
a. Availability of state of the art production facilities. b. Advanced Technical Know How. c. Dedicated production facilities. d. Elaborated testing facilities for MTL. e. Smooth supply chain
The Company has the following equity in the Subsidiary Companies.
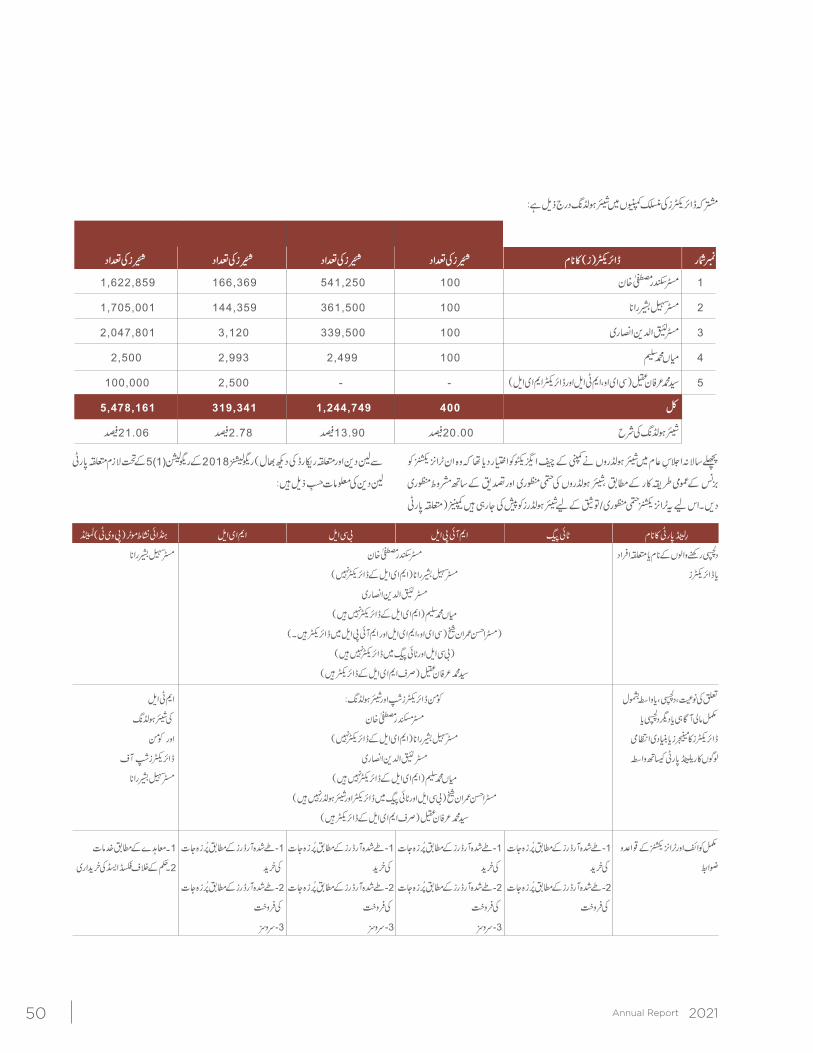
TIPEG Inter Trade DMCC 75.00% Millat Industrial Products Limited 64.09% Bolan Castings Limited 46.26% Millat Equipment Limited 45.00% The common directors and their relatives have the following shareholding in the associated companies.
Driving EnhancingGROWTH performance 39
Name of related party TIPEG MIPL BCL MELHyundai Nishat
Motor (Pvt.) Limited
Names of interested or concerned persons or directors
Mr. Sikandar Mustafa KhanMr. Sohail Bashir Rana(Not a Director in MEL)
Mr. Laeeq Uddin Ansari Mian Muhammad Saleem(Not a Director in MEL)
Mr. Ahsan Imran Shaikh (CEO, MEL and Director of MIPL Not a Director in BCL and TIPEG)Syed Muhammad Irfan Aqueel ( Director of MEL only)
Sohail Bashir Rana
Nature of relationship, interest or concern along with complete information of financial or other interest or concern of directors, managers or key managerial personnel in related party
Common Directorship & shareholding:Mr. Sikandar Mustafa Khan
Mr. Sohail Bashir Rana(Not a Director in MEL)Mr. Laeeq Uddin Ansari
Mian Muhammad Saleem(Not a Director in MEL)Mr. Ahsan Imran Shaikh (Not a Director & shareholder in BCL and TIPEG)
Syed Muhammad Irfan Aqueel ( Director of MEL only)
Shareholding of MTL & common Directorship of Mr. Sohail Bashir Rana
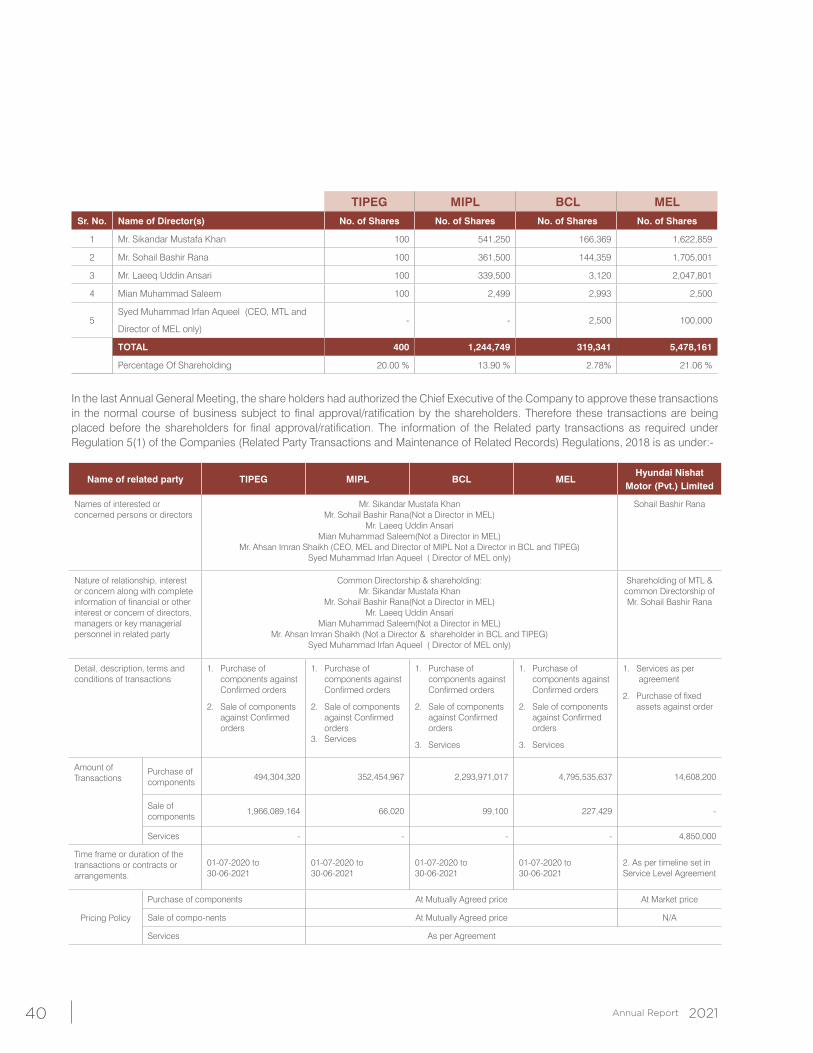
Detail, description, terms and conditions of transactions
1. Purchase ofcomponents against Confirmed orders
2. Sale of components against Confirmed orders
1. Purchase of components against Confirmed orders
2. Sale of components against Confirmed orders
3. Services
1. Purchase of components against Confirmed orders
2. Sale of components against Confirmed orders
3. Services
1. Purchase of components against Confirmed orders
2. Sale of components against Confirmed orders
3. Services
1. Services as per agreement
2. Purchase of fixed assets against order
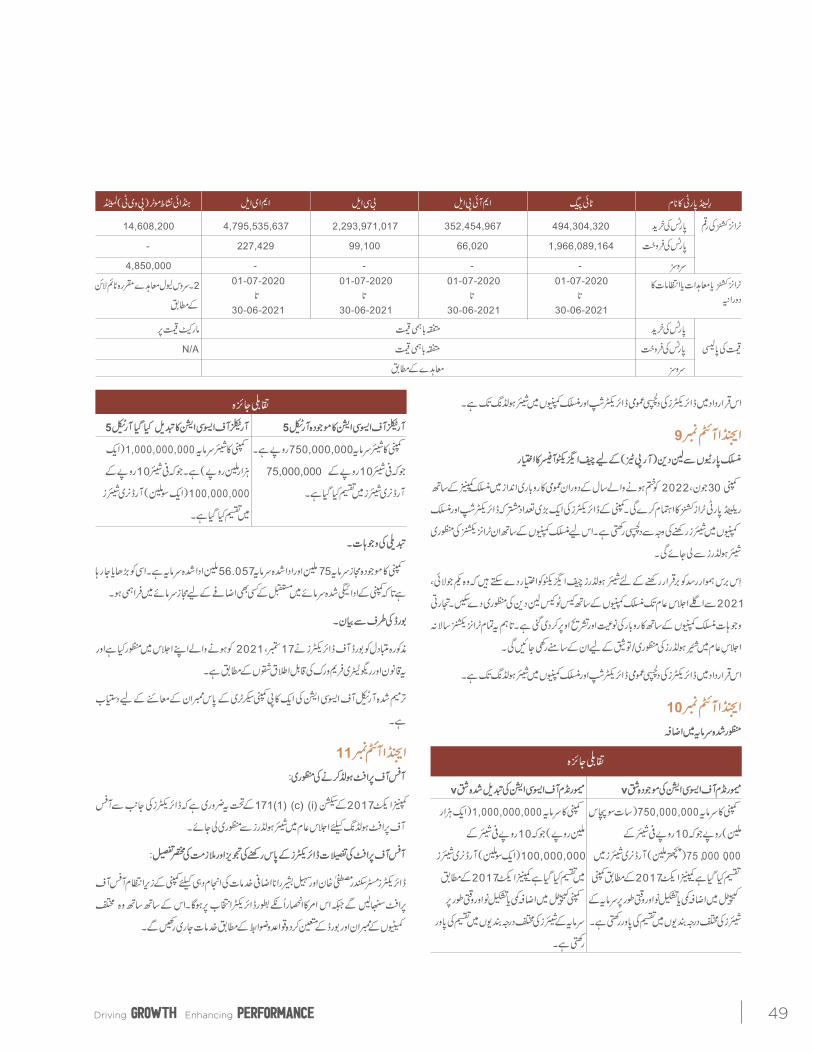
Amount of Transactions
Purchase of components
494,304,320 352,454,967 2,293,971,017 4,795,535,637 14,608,200
Sale of components
1,966,089,164 66,020 99,100 227,429 -
Services - - - - 4,850,000
Time frame or duration of the transactions or contracts or arrangements.
01-07-2020 to 30-06-2021
01-07-2020 to 30-06-2021
01-07-2020 to 30-06-2021
01-07-2020 to 30-06-2021
2. As per timeline set in Service Level Agreement
Pricing Policy
Purchase of components At Mutually Agreed price At Market price
Sale of compo-nents At Mutually Agreed price N/A
Services As per Agreement
TIPEG MIPL BCL MEL
Sr. No. Name of Director(s) No. of Shares No. of Shares No. of Shares No. of Shares
1 Mr. Sikandar Mustafa Khan 100 541,250 166,369 1,622,859
2 Mr. Sohail Bashir Rana 100 361,500 144,359 1,705,001
3 Mr. Laeeq Uddin Ansari 100 339,500 3,120 2,047,801
4 Mian Muhammad Saleem 100 2,499 2,993 2,500
5Syed Muhammad Irfan Aqueel (CEO, MTL and
Director of MEL only)- - 2,500 100,000
TOTAL 400 1,244,749 319,341 5,478,161
Percentage Of Shareholding 20.00 % 13.90 % 2.78% 21.06 %
In the last Annual General Meeting, the share holders had authorized the Chief Executive of the Company to approve these transactions in the normal course of business subject to final approval/ratification by the shareholders. Therefore these transactions are being placed before the shareholders for final approval/ratification. The information of the Related party transactions as required under Regulation 5(1) of the Companies (Related Party Transactions and Maintenance of Related Records) Regulations, 2018 is as under:-
Annual Report 202140
The Directors are interested in the resolution to the extent of their common directorships and shareholding in the group companies.
AGENDA ITEM NO.9 Authorization to CEO for Related Party Transactions
(RPTs)
The Company shall be conducting Related Party Transactions (RPTs) with subsidiary companies during the year ending June 30, 2022 in the normal course of business. The majority of Directors are interested in these transactions due to their common directorship and shareholding in the subsidiary companies. Therefore these transactions with subsidiary companies have to be approved by the shareholders.
In order to ensure smooth supply during the year, the shareholders may authorize the Chief Executive to approve transactions with subsidiary companies on case to case basis for the period from July 01, 2021 to Next AGM. The summary of commercial reasons, nature and scope of RPTs is explained above. However, these transactions shall be placed before the shareholders in the next AGM for their approval/ratification.
The Directors are interested in the resolution to the extent of their common directorships and shareholding in the subsidiary companies.
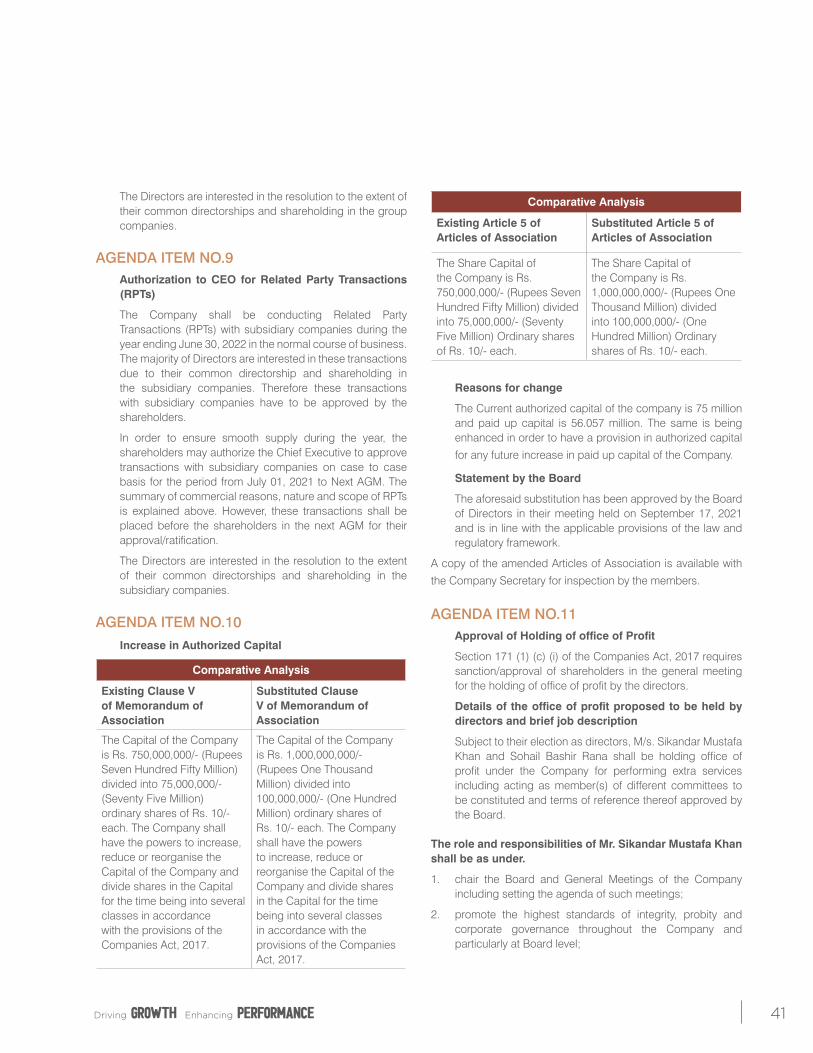
AGENDA ITEM NO.10 Increase in Authorized Capital
Reasons for change
The Current authorized capital of the company is 75 million and paid up capital is 56.057 million. The same is being enhanced in order to have a provision in authorized capital
for any future increase in paid up capital of the Company.
Statement by the Board
The aforesaid substitution has been approved by the Board of Directors in their meeting held on September 17, 2021 and is in line with the applicable provisions of the law and regulatory framework.
A copy of the amended Articles of Association is available with
the Company Secretary for inspection by the members.
AGENDA ITEM NO.11 Approval of Holding of office of Profit
Section 171 (1) (c) (i) of the Companies Act, 2017 requires sanction/approval of shareholders in the general meeting for the holding of office of profit by the directors.
Details of the office of profit proposed to be held by directors and brief job description
Subject to their election as directors, M/s. Sikandar Mustafa Khan and Sohail Bashir Rana shall be holding office of profit under the Company for performing extra services including acting as member(s) of different committees to be constituted and terms of reference thereof approved by the Board.
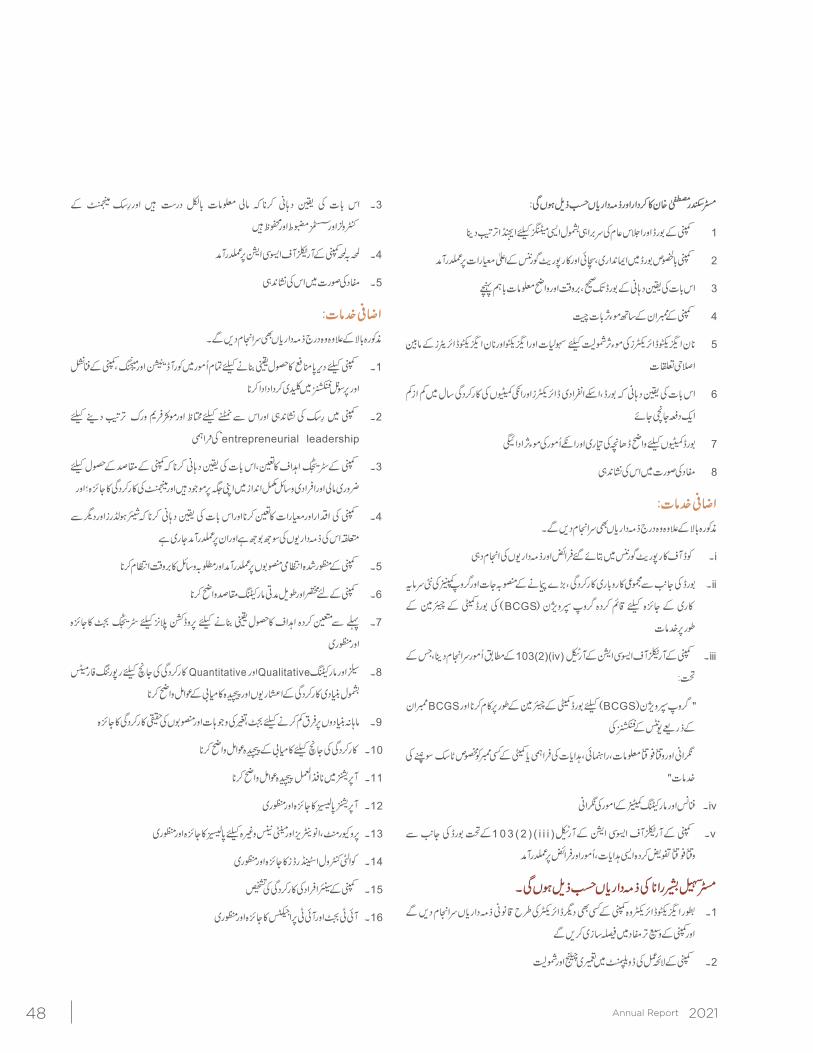
The role and responsibilities of Mr. Sikandar Mustafa Khan shall be as under.
1. chair the Board and General Meetings of the Company including setting the agenda of such meetings;
2. promote the highest standards of integrity, probity and corporate governance throughout the Company and particularly at Board level;
Comparative Analysis
Existing Clause V of Memorandum of Association
Substituted Clause V of Memorandum of Association
The Capital of the Company is Rs. 750,000,000/- (Rupees Seven Hundred Fifty Million) divided into 75,000,000/- (Seventy Five Million) ordinary shares of Rs. 10/- each. The Company shall have the powers to increase, reduce or reorganise the Capital of the Company and divide shares in the Capital for the time being into several classes in accordance with the provisions of the Companies Act, 2017.
The Capital of the Company is Rs. 1,000,000,000/- (Rupees One Thousand Million) divided into 100,000,000/- (One Hundred Million) ordinary shares of Rs. 10/- each. The Company shall have the powers to increase, reduce or reorganise the Capital of the Company and divide shares in the Capital for the time being into several classes in accordance with the provisions of the Companies Act, 2017.
Comparative Analysis
Existing Article 5 of Articles of Association
Substituted Article 5 of Articles of Association
The Share Capital of the Company is Rs. 750,000,000/- (Rupees Seven Hundred Fifty Million) divided into 75,000,000/- (Seventy Five Million) Ordinary shares of Rs. 10/- each.
The Share Capital of the Company is Rs. 1,000,000,000/- (Rupees One Thousand Million) divided into 100,000,000/- (One Hundred Million) Ordinary shares of Rs. 10/- each.
Driving EnhancingGROWTH performance 41
3. ensure that the Board receives accurate, timely and clearinformation;
4. ensure effective communication with members of theCompany;
5. facilitate the effective contribution of non-executive directors and ensure constructive relations between executive andnon-executive directors;
6. ensure that the performance of the Board, its committeesand individual directors is evaluated at least once a year;and
7. ensure clear structure for, and the effective running of,Board committees.
8. Disclosure of interest where it exists.
Extra ServicesIn addition to the above he will perform the following.
i) To perform duties and responsibilities as defined in theCode of Corporate Governance.
ii) To act as Chairman of Board’s Committee for Groupsupervision (BCGS) constituted by the Board to reviewoverall business performance, major projects and newinvestments of group companies.
iii) To perform functions as contained in Article 103 (2) (iv)of the Articles of Association of the Company whichreads as under:
“act as Chairman of Board’s Committee for GroupSupervision (BCGS) and monitor the functions of unitsthrough BCGS members and in furtherance thereof,may from time to time call for
information, issue directions, guidelines or assign aspecific task to any member of the Committee.”
iv) To monitor functioning of Finance and Marketingcommittees.
v) Exercise such powers, functions & duties as maybe assigned / delegated by the Board from time totime pursuant to Article 103(2) (iii) of the Articles ofAssociation of the Company.
The role and responsibilities of Mr. Sohail Bashir Rana shall be as under.1. As Executive director he shall have the same general legal
responsibilities to the Company as any other director andshall be required to take decisions in the best interests ofthe Company.
2. constructively challenge and contribute to the developmentof Company strategy;
3. ensure that financial information is accurate and thatfinancial controls and systems of risk management arerobust and defensible;
4. at all time comply with the Articles of Association of theCompany;
5. disclose interest where it exists.
Extra ServicesIn addition to the above he will perform the following.
1. Play a key role in coordinating and managing all operational, financial and personnel functions of the Company to ensure continued profit growth.
2. Provide entrepreneurial leadership of the Company within aframework of prudent and effective controls which enablerisk to be assessed and managed.
3. Set the Company’s strategic goals, ensure that thenecessary financial and human resources are in place for the Company to meet its objectives, and review managementperformance; and
4. Set the Company’s values and standards and ensure thatits obligations to its shareholders and others are understood and met.
5. Implement the approved operational plans of the Companyand arrange timely availability of required resources.
6. Define short term and long term marketing objectives for the Company.
7. Review and approve strategies budgets for productionplans to ensure these meet objectives already set.
8. Define reporting formats including key performanceindicators and critical success factors for sales andmarketing qualitative and quantitative performancemeasurement.
9. Review actual performance against budget, reasons forvariations and plans to bridge the gaps on monthly basis.
10. Define critical success factors for performancemeasurement.
11. Define critical controls to be implemented in the operations.
12. Review and approve operations policies.
13. Review and approve policies for procurement, inventories,maintenance etc.
Annual Report 202142
14. Review and approve quality control standards.
15. Review performance evaluation of senior personnel of theCompany.
16. Review and approve IT Budget and approve IT projects.
Remuneration of the directors including perks and benefits, pecuniary or otherwise;
The maximum per annum limit of remunerations to the above directors shall be as under.
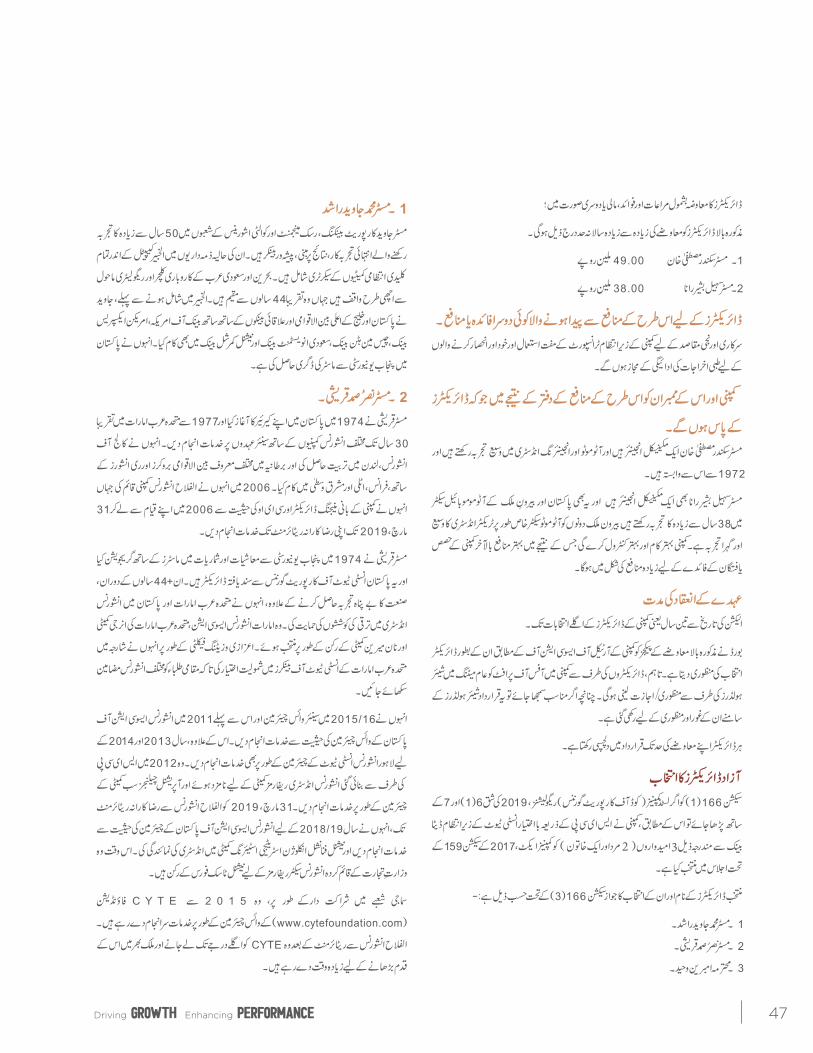
1. Mr. Sikandar Mustafa Khan Rs. 49.00 million
2. Mr. Sohail Bashir Rana Rs. 38.00 million
Any other benefit or profits arising out of such profit for the directors
Authorized for free use of Company maintained transport for official and private purposes and reimbursement of medical expenses for self and dependants.
Benefits to the Company and its members as a result of such office of profit to be held by the directors
Mr. Sikandar Mustafa Khan is a mechanical engineer and has varied experience in the automotive and engineering industry and has been associated with it since 1972. Mr. Sohail Bashir Rana is also a mechanical engineer with over 38 years experience in the automobile sector in Pakistan and abroad. Both have a vast and in depth experience of the automotive sector especially of tractor industry. The Company will have improved working and better controls resulting in better profitability ultimately for the benefit of shareholders of the company in the shape of higher dividends.
Period of holding of such officeThree years from the date of election i.e., up till next elections of directors of the Company.
The board approves the above remuneration packages in accordance with Articles of Association of the Company subject to their election as directors. However, the holding of office of profit in the Company by the directors has to be sanctioned/approved by the shareholders in the general meeting. Therefore the resolution is placed before the shareholders for their consideration and approval, if deemed appropriate.
Each director is interested in the resolution to the extent of his remuneration.
SELECTION OF INDEPENDENT DIRECTORS
As per Section 166 (1) read with clause 6(1) and 7 of Listed Companies (Code of Corporate Governance) Regulations, 2019, the company has selected following three candidates ( two male and one Female to be elected under section 159 of the Companies Act, 2017 in this AGM) from the data bank maintained by the institute duly authorized by SECP.
The names of directors selected and justification for their selection as required under section 166(3) is as under:-
1. Mr. Mohammad Javed Rashid2. Mr. Nasr us Samad Qureshi3. Ms. Ambreen Waheed
1. Mohammad Javed RashidMr. Javed is a highly seasoned, results oriented,professional banker with over 50 years’ experience in thecorporate banking, risk management and quality assurance areas. His recent responsibilities include Secretary to allkey management committees within Alkhabeer Capital.Well conversant with the business culture and regulatoryenvironment of Bahrain and Saudi Arabia where he hasresided for nearly 44 years. Prior to joining Alkhabeer,Javed worked for prime international as well as regionalbanks in Pakistan and the Gulf, like Bank of America,American Express Bank, Chase Manhattan Bank, the SaudiInvestment Bank and the National Commercial Bank. Heholds a Master’s degree from the University of the Punjab in Pakistan.
2. Nasar us Samad QureshiMr. Qureshi started his career in 1974 in Pakistan and served in senior positions with various insurance companies foralmost 30 years in UAE from 1977. He has received trainingat College of Insurance, London and with various leadinginternational brokers and reinsures in the UK, France, Italyand the Middle East. In 2006 he establish Alfalah InsuranceCompany where he served as founding Managing Director& CEO of the company from its inception in 2006 till hisvoluntary retirement on March 31, 2019.
Mr. Qureshi graduated from University of the Punjab in 1974 with majors in Economics and Statistics and is a certifieddirector from Pakistan Institute of Corporate Governance.During these 44+ years, besides gaining immenseindustry experience, he supported efforts for development
Driving EnhancingGROWTH performance 43
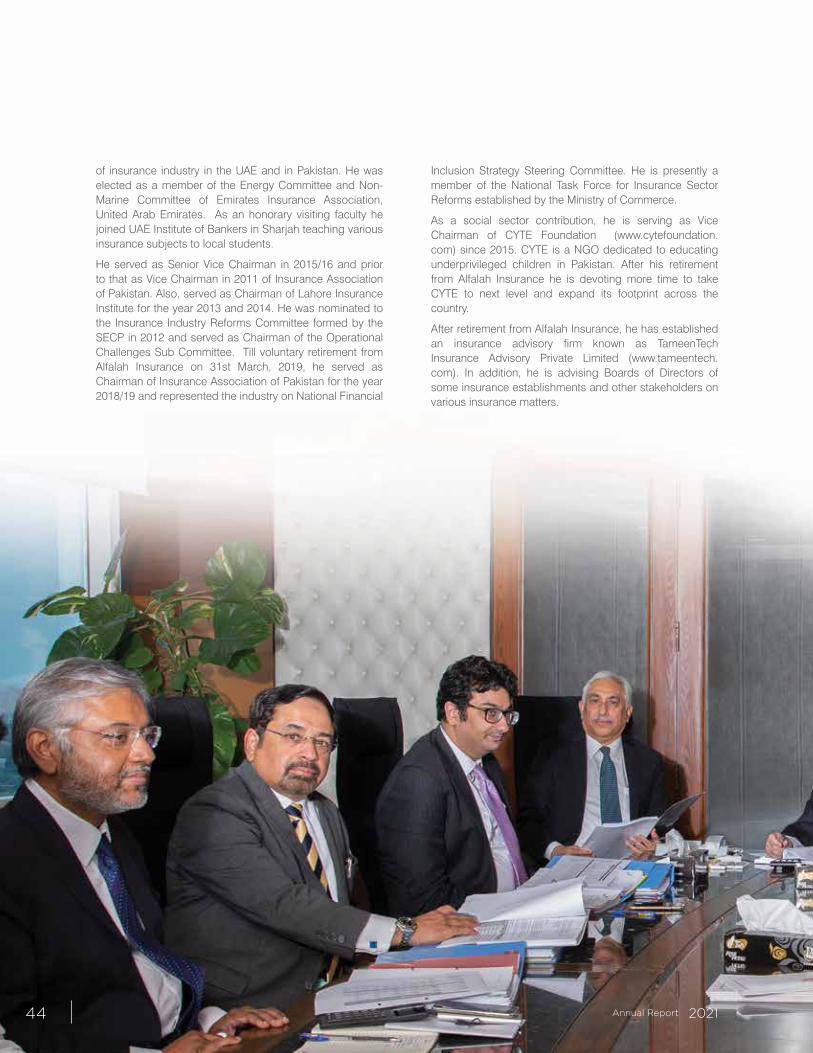
of insurance industry in the UAE and in Pakistan. He was elected as a member of the Energy Committee and Non-Marine Committee of Emirates Insurance Association, United Arab Emirates. As an honorary visiting faculty he joined UAE Institute of Bankers in Sharjah teaching various insurance subjects to local students.
He served as Senior Vice Chairman in 2015/16 and prior to that as Vice Chairman in 2011 of Insurance Association of Pakistan. Also, served as Chairman of Lahore Insurance Institute for the year 2013 and 2014. He was nominated to the Insurance Industry Reforms Committee formed by the SECP in 2012 and served as Chairman of the Operational Challenges Sub Committee. Till voluntary retirement from Alfalah Insurance on 31st March, 2019, he served as Chairman of Insurance Association of Pakistan for the year 2018/19 and represented the industry on National Financial
Inclusion Strategy Steering Committee. He is presently a member of the National Task Force for Insurance Sector Reforms established by the Ministry of Commerce.
As a social sector contribution, he is serving as Vice Chairman of CYTE Foundation (www.cytefoundation.com) since 2015. CYTE is a NGO dedicated to educating underprivileged children in Pakistan. After his retirement from Alfalah Insurance he is devoting more time to take CYTE to next level and expand its footprint across the country.
After retirement from Alfalah Insurance, he has established an insurance advisory firm known as TameenTech Insurance Advisory Private Limited (www.tameentech.com). In addition, he is advising Boards of Directors of some insurance establishments and other stakeholders on various insurance matters.
Annual Report 202144
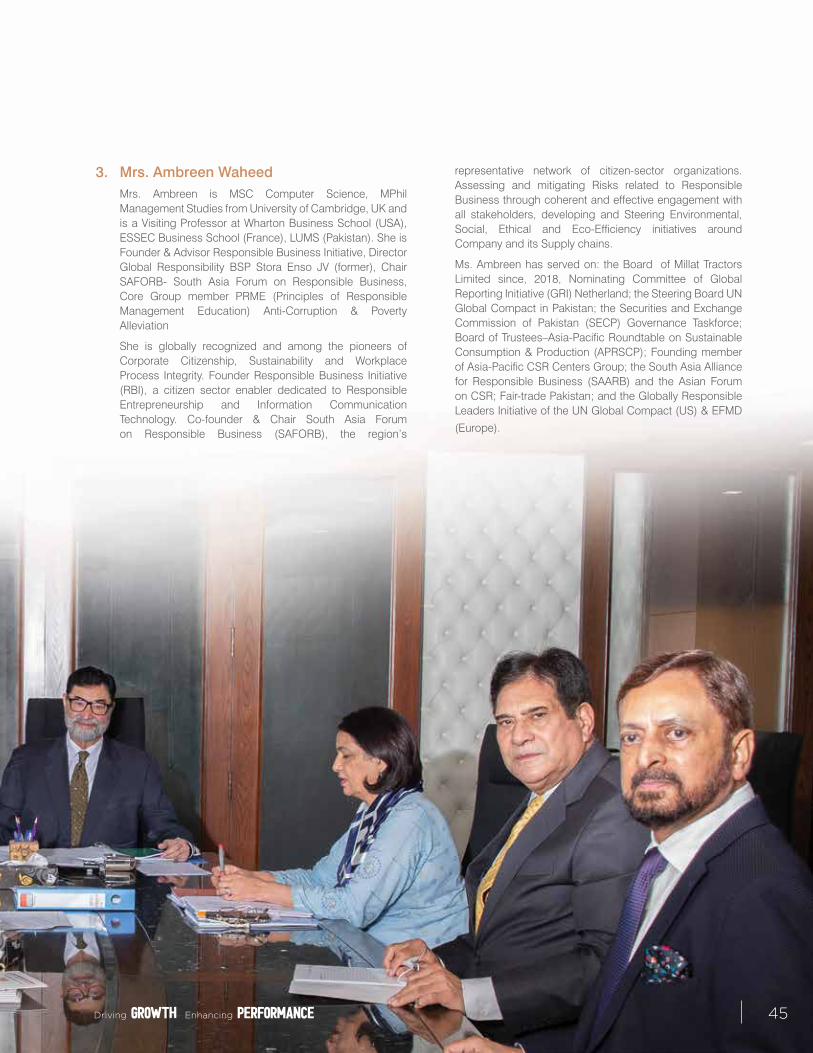
3. Mrs. Ambreen Waheed
Mrs. Ambreen is MSC Computer Science, MPhil Management Studies from University of Cambridge, UK and is a Visiting Professor at Wharton Business School (USA), ESSEC Business School (France), LUMS (Pakistan). She is Founder & Advisor Responsible Business Initiative, Director Global Responsibility BSP Stora Enso JV (former), Chair SAFORB- South Asia Forum on Responsible Business, Core Group member PRME (Principles of Responsible Management Education) Anti-Corruption & Poverty Alleviation
She is globally recognized and among the pioneers of Corporate Citizenship, Sustainability and Workplace Process Integrity. Founder Responsible Business Initiative (RBI), a citizen sector enabler dedicated to Responsible Entrepreneurship and Information Communication Technology. Co-founder & Chair South Asia Forum on Responsible Business (SAFORB), the region’s
representative network of citizen-sector organizations. Assessing and mitigating Risks related to Responsible Business through coherent and effective engagement with all stakeholders, developing and Steering Environmental, Social, Ethical and Eco-Efficiency initiatives around Company and its Supply chains.
Ms. Ambreen has served on: the Board of Millat Tractors Limited since, 2018, Nominating Committee of Global Reporting Initiative (GRI) Netherland; the Steering Board UN Global Compact in Pakistan; the Securities and Exchange Commission of Pakistan (SECP) Governance Taskforce; Board of Trustees–Asia-Pacific Roundtable on Sustainable Consumption & Production (APRSCP); Founding member of Asia-Pacific CSR Centers Group; the South Asia Alliance for Responsible Business (SAARB) and the Asian Forum on CSR; Fair-trade Pakistan; and the Globally Responsible Leaders Initiative of the UN Global Compact (US) & EFMD
(Europe).
Driving EnhancingGROWTH performance 45
Annual Report 202146
Driving EnhancingGROWTH performance 47
32
Annual Report 202148
Driving EnhancingGROWTH performance 49
Annual Report 202150
Driving EnhancingGROWTH performance 51
Annual Report 202152
Driving EnhancingGROWTH performance 53
Annual Report 202154
Driving EnhancingGROWTH performance 55


Governance
BOARD OF DIRECTORS
Mr. Sikandar Mustafa KhanChairman
Mr. Ahsan Imran Shaikh Director
Mr. Sohail Bashir RanaDirector
Syed Muhammad Irfan AqueelChief Executive
Sitting Left to Right Standing Left to Right
Mr. Laeeq Uddin AnsariDirector
Mian Muhammad SaleemDirector
Mrs. Ambreen WaheedDirector
Mr. Saad IqbalDirector
Annual Report 202158
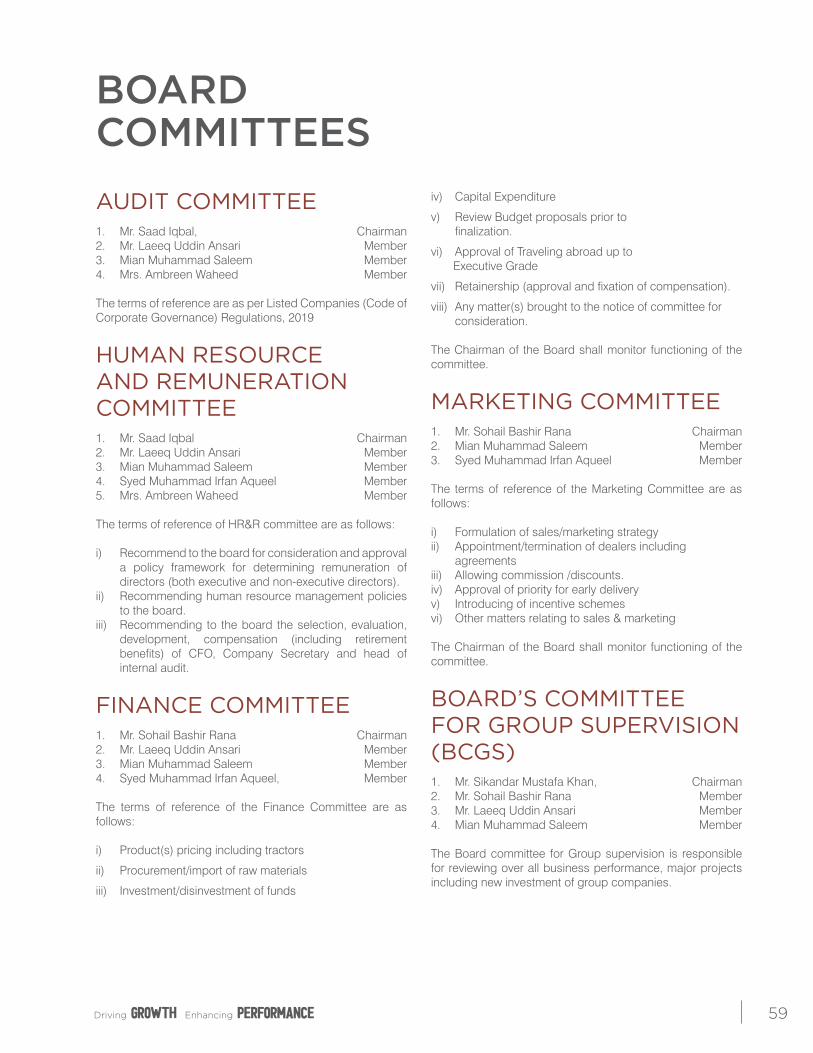
BOARD COMMITTEESAUDIT COMMITTEE1. Mr. Saad Iqbal, Chairman2. Mr. Laeeq Uddin Ansari Member3. Mian Muhammad Saleem Member4. Mrs. Ambreen Waheed Member
The terms of reference are as per Listed Companies (Code of Corporate Governance) Regulations, 2019
HUMAN RESOURCE AND REMUNERATION COMMITTEE1. Mr. Saad Iqbal Chairman2. Mr. Laeeq Uddin Ansari Member3. Mian Muhammad Saleem Member4. Syed Muhammad Irfan Aqueel Member5. Mrs. Ambreen Waheed Member
The terms of reference of HR&R committee are as follows:
i) Recommend to the board for consideration and approval a policy framework for determining remuneration of directors (both executive and non-executive directors).
ii) Recommending human resource management policies to the board.
iii) Recommending to the board the selection, evaluation, development, compensation (including retirement benefits) of CFO, Company Secretary and head of internal audit.
FINANCE COMMITTEE1. Mr. Sohail Bashir Rana Chairman2. Mr. Laeeq Uddin Ansari Member3. Mian Muhammad Saleem Member4. Syed Muhammad Irfan Aqueel, Member
The terms of reference of the Finance Committee are as follows:
i) Product(s) pricing including tractors
ii) Procurement/import of raw materials
iii) Investment/disinvestment of funds
iv) Capital Expenditure
v) Review Budget proposals prior to finalization.
vi) Approval of Traveling abroad up to Executive Grade
vii) Retainership (approval and fixation of compensation).
viii) Any matter(s) brought to the notice of committee for consideration.
The Chairman of the Board shall monitor functioning of the committee.
MARKETING COMMITTEE1. Mr. Sohail Bashir Rana Chairman2. Mian Muhammad Saleem Member3. Syed Muhammad Irfan Aqueel Member
The terms of reference of the Marketing Committee are as follows:
i) Formulation of sales/marketing strategyii) Appointment/termination of dealers including agreementsiii) Allowing commission /discounts.iv) Approval of priority for early deliveryv) Introducing of incentive schemesvi) Other matters relating to sales & marketing
The Chairman of the Board shall monitor functioning of the committee.
BOARD’S COMMITTEE FOR GROUP SUPERVISION (BCGS)1. Mr. Sikandar Mustafa Khan, Chairman2. Mr. Sohail Bashir Rana Member3. Mr. Laeeq Uddin Ansari Member4. Mian Muhammad Saleem Member
The Board committee for Group supervision is responsible for reviewing over all business performance, major projects including new investment of group companies.
Driving EnhancingGROWTH performance 59
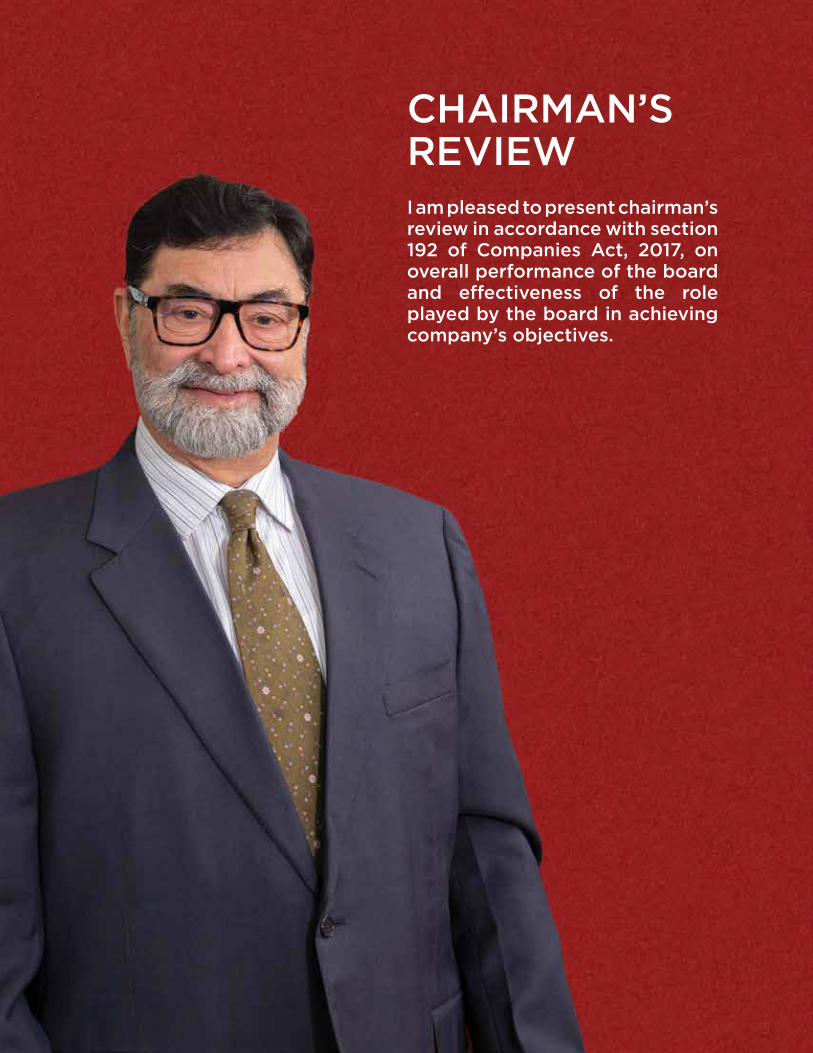
CHAIRMAN’S REVIEWI am pleased to present chairman’s review in accordance with section 192 of Companies Act, 2017, on overall performance of the board and effectiveness of the role played by the board in achieving company’s objectives.
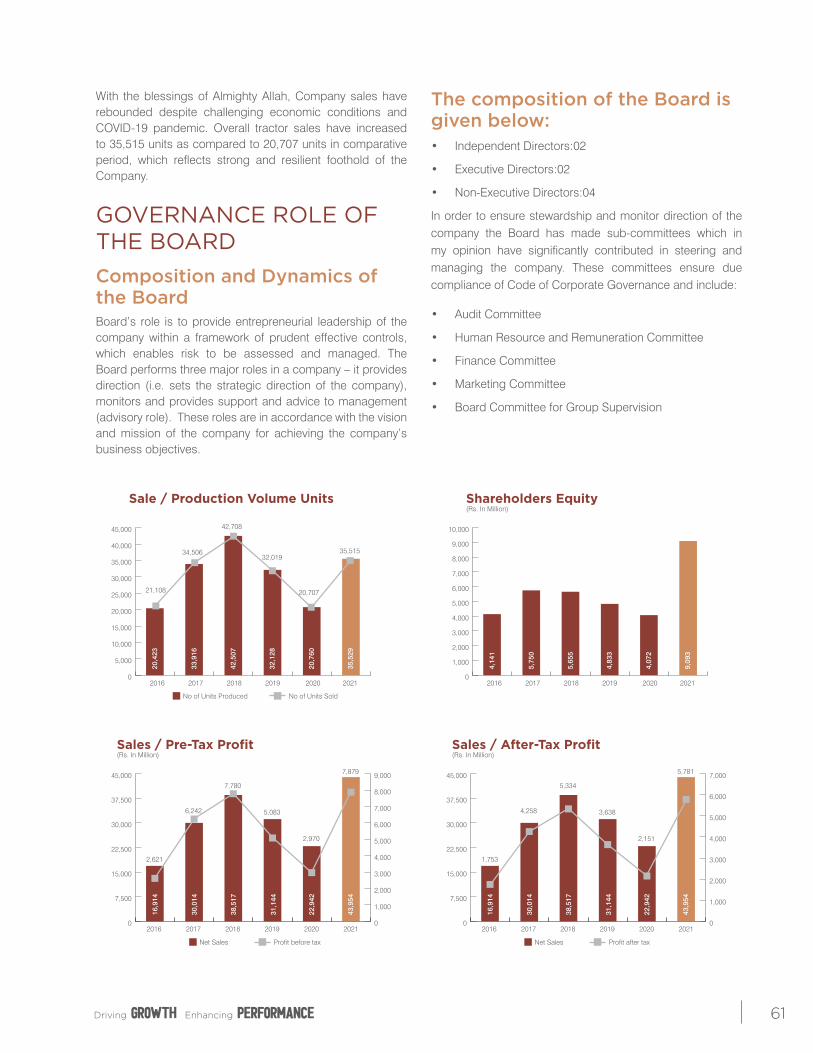
CHAIRMAN’S REVIEW
With the blessings of Almighty Allah, Company sales have rebounded despite challenging economic conditions and COVID-19 pandemic. Overall tractor sales have increased to 35,515 units as compared to 20,707 units in comparative period, which reflects strong and resilient foothold of the Company..
GOVERNANCE ROLE OF THE BOARDComposition and Dynamics of the BoardBoard’s role is to provide entrepreneurial leadership of the company within a framework of prudent effective controls, which enables risk to be assessed and managed. The Board performs three major roles in a company – it provides direction (i.e. sets the strategic direction of the company), monitors and provides support and advice to management (advisory role). These roles are in accordance with the vision and mission of the company for achieving the company’s business objectives.
The composition of the Board is given below:• Independent Directors:02
• Executive Directors:02
• Non-Executive Directors:04
In order to ensure stewardship and monitor direction of the company the Board has made sub-committees which in my opinion have significantly contributed in steering and managing the company. These committees ensure due compliance of Code of Corporate Governance and include:
• Audit Committee
• Human Resource and Remuneration Committee
• Finance Committee
• Marketing Committee
• Board Committee for Group Supervision
Sale / Production Volume Units
0
5,000
10,000
15,000
20,000
25,000
30,000
35,000
40,000
45,000
21,108
34,506
42,708
32,019
20,707
35,515
2019 2020 2021201820172016
No of Units Produced No of Units Sold
20,4
23
33,9
16
42,5
07
32,1
28
20,7
60
35,5
29
Shareholders Equity(Rs. In Million)
0
1,000
2,000
3,000
4,000
5,000
6,000
7,000
8,000
9,000
10,000
2019 2020 2021201820172016
4,14
1
5,75
0
5,65
5
4,83
3
4,07
2
9,09
3
0
7,500
15,000
22,500
30,000
37,500
45,000
1,753
4,258
5,334
3,638
2,151
5,781
Net Sales Profit after tax
16,9
14
30,0
14
38,5
17
31,1
44
22,9
42
43,9
54
Sales / After-Tax Profit(Rs. In Million)
0
1,000
2,000
3,000
4,000
5,000
6,000
7,000
2019 2020 20212018201720160
7,500
15,000
22,500
30,000
37,500
45,000
2,621
6,242
7,780
5,083
2,970
7,879
Net Sales Profit before tax
16,9
14
30,0
14
38,5
17
31,1
44
22,9
42
43,9
54
Sales / Pre-Tax Profit(Rs. In Million)
0
1,000
2,000
3,000
4,000
5,000
6,000
7,000
8,000
9,000
2019 2020 2021201820172016
Driving EnhancingGROWTH performance 61
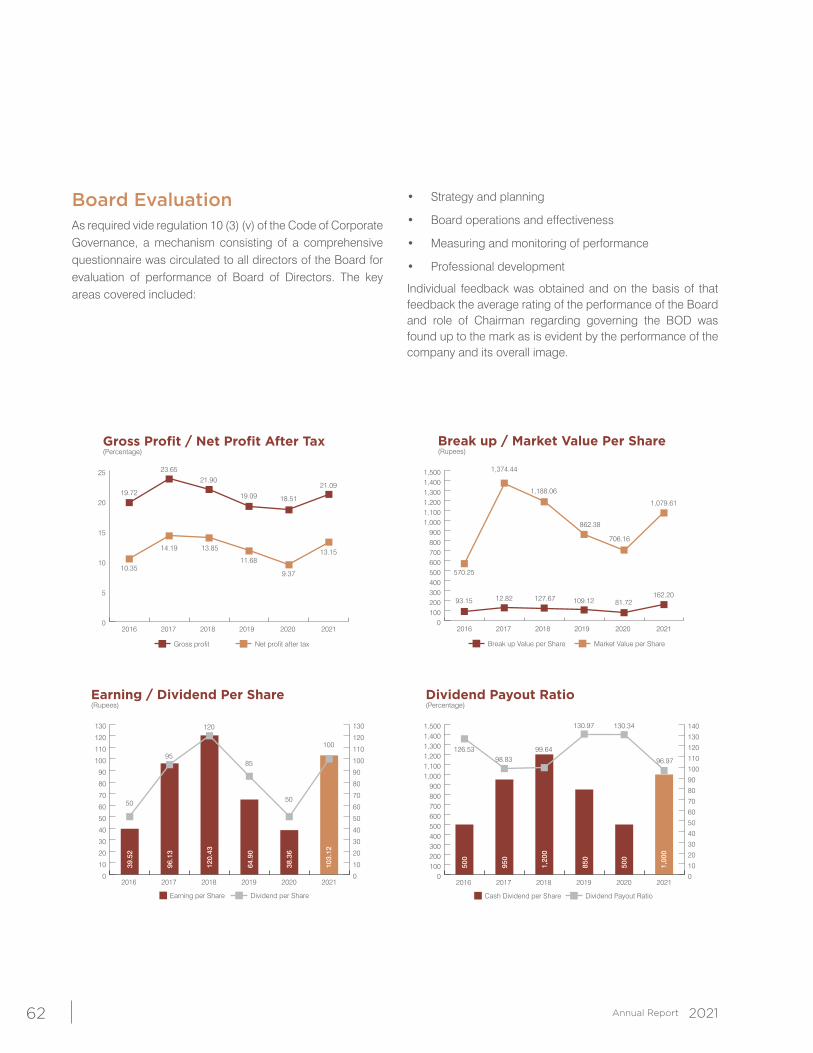
Board EvaluationAs required vide regulation 10 (3) (v) of the Code of Corporate Governance, a mechanism consisting of a comprehensive questionnaire was circulated to all directors of the Board for evaluation of performance of Board of Directors. The key areas covered included:
• Strategy and planning
• Board operations and effectiveness
• Measuring and monitoring of performance
• Professional development
Individual feedback was obtained and on the basis of that feedback the average rating of the performance of the Board and role of Chairman regarding governing the BOD was found up to the mark as is evident by the performance of the company and its overall image.
Gross Profit / Net Profit After Tax(Percentage)
0
5
10
15
20
25
19.72
23.6521.90
19.09 18.51
21.09
10.35
14.19 13.85
11.68
9.37
13.15
2019 2020 2021201820172016
Net profit after taxGross profit
Break up / Market Value Per Share(Rupees)
0100200300400500600700800900
1,0001,1001,2001,3001,4001,500
570.25
1,374.44
1,188.06
862.38
706.16
1,079.61
93.15 12.82 127.67 109.12 81.72162.20
2019 2020 2021201820172016
Market Value per ShareBreak up Value per Share
0
10
20
30
40
50
60
70
80
90
100
110
120
130
50
95
120
85
50
100
Earning per Share Dividend per Share
39.5
2
96.1
3
120.
43
64.9
0
38.3
6
103.
12
Earning / Dividend Per Share(Rupees)
0
10
20
30
40
50
60
70
80
90
100
110
120
130
2019 2020 20212018201720160
100200300400500600700800900
1,0001,1001,2001,3001,4001,500
126.5398.83
99.64
130.97 130.34
96.97
Cash Dividend per Share Dividend Payout Ratio
500
950
1,20
0
850
500
1,00
0
Dividend Payout Ratio(Percentage)
0
10
20
30
40
50
60
70
80
90
100
110
120
130
140
2019 2020 2021201820172016
Annual Report 202162
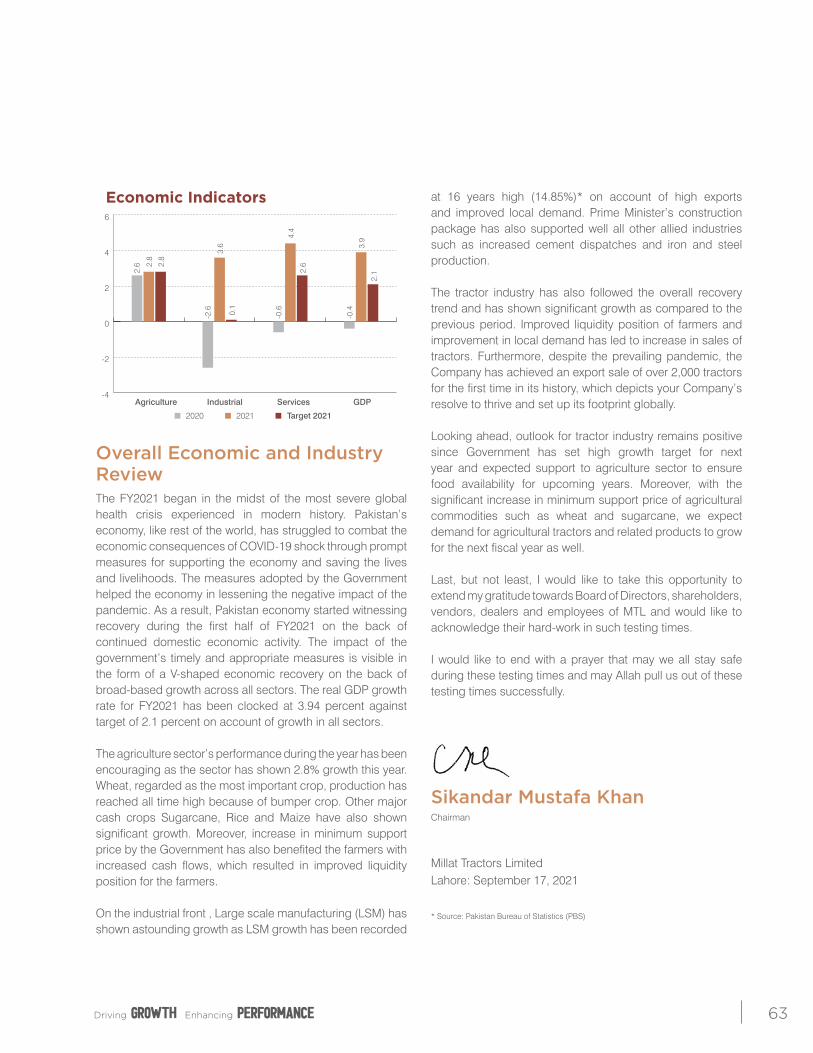
Economic Indicators
-4
-2
0
2
4
6
2.6 2.
8
2.8
-0.4
3.9
2.1
-0.6
4.4
2.6
-2.6
3.6
0.1
Agriculture Industrial Services GDP
2020 2021 Target 2021
Overall Economic and Industry ReviewThe FY2021 began in the midst of the most severe global health crisis experienced in modern history. Pakistan’s economy, like rest of the world, has struggled to combat the economic consequences of COVID-19 shock through prompt measures for supporting the economy and saving the lives and livelihoods. The measures adopted by the Government helped the economy in lessening the negative impact of the pandemic. As a result, Pakistan economy started witnessing recovery during the first half of FY2021 on the back of continued domestic economic activity. The impact of the government’s timely and appropriate measures is visible in the form of a V-shaped economic recovery on the back of broad-based growth across all sectors. The real GDP growth rate for FY2021 has been clocked at 3.94 percent against target of 2.1 percent on account of growth in all sectors.
The agriculture sector’s performance during the year has been encouraging as the sector has shown 2.8% growth this year. Wheat, regarded as the most important crop, production has reached all time high because of bumper crop. Other major cash crops Sugarcane, Rice and Maize have also shown significant growth. Moreover, increase in minimum support price by the Government has also benefited the farmers with increased cash flows, which resulted in improved liquidity position for the farmers.
On the industrial front , Large scale manufacturing (LSM) has shown astounding growth as LSM growth has been recorded
at 16 years high (14.85%)* on account of high exports and improved local demand. Prime Minister’s construction package has also supported well all other allied industries such as increased cement dispatches and iron and steel production.
The tractor industry has also followed the overall recovery trend and has shown significant growth as compared to the previous period. Improved liquidity position of farmers and improvement in local demand has led to increase in sales of tractors. Furthermore, despite the prevailing pandemic, the Company has achieved an export sale of over 2,000 tractors for the first time in its history, which depicts your Company’s resolve to thrive and set up its footprint globally.
Looking ahead, outlook for tractor industry remains positive since Government has set high growth target for next year and expected support to agriculture sector to ensure food availability for upcoming years. Moreover, with the significant increase in minimum support price of agricultural commodities such as wheat and sugarcane, we expect demand for agricultural tractors and related products to grow for the next fiscal year as well.
Last, but not least, I would like to take this opportunity to extend my gratitude towards Board of Directors, shareholders, vendors, dealers and employees of MTL and would like to acknowledge their hard-work in such testing times.
I would like to end with a prayer that may we all stay safe during these testing times and may Allah pull us out of these testing times successfully.
Sikandar Mustafa Khan Chairman
Millat Tractors LimitedLahore: September 17, 2021
* Source: Pakistan Bureau of Statistics (PBS)
Driving EnhancingGROWTH performance 63
Annual Report 202164
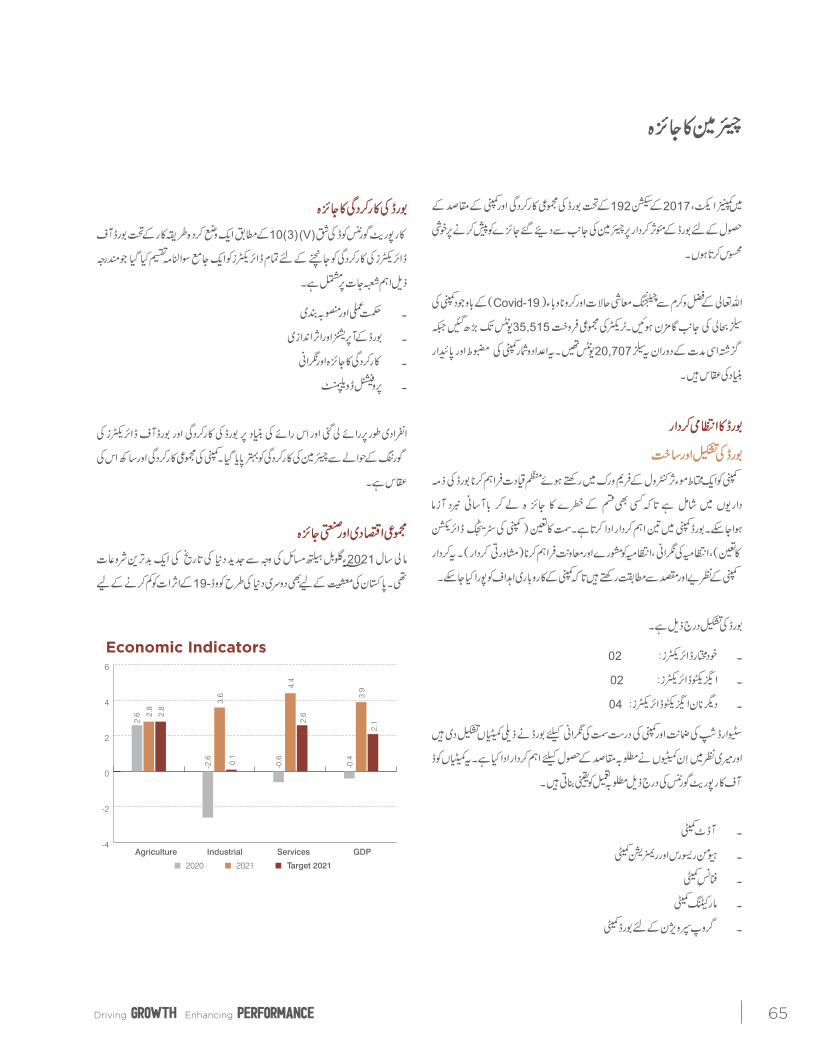
Economic Indicators
-4
-2
0
2
4
6
2.6 2.
8
2.8
-0.4
3.9
2.1
-0.6
4.4
2.6
-2.6
3.6
0.1
Agriculture Industrial Services GDP
2020 2021 Target 2021
Driving EnhancingGROWTH performance 65
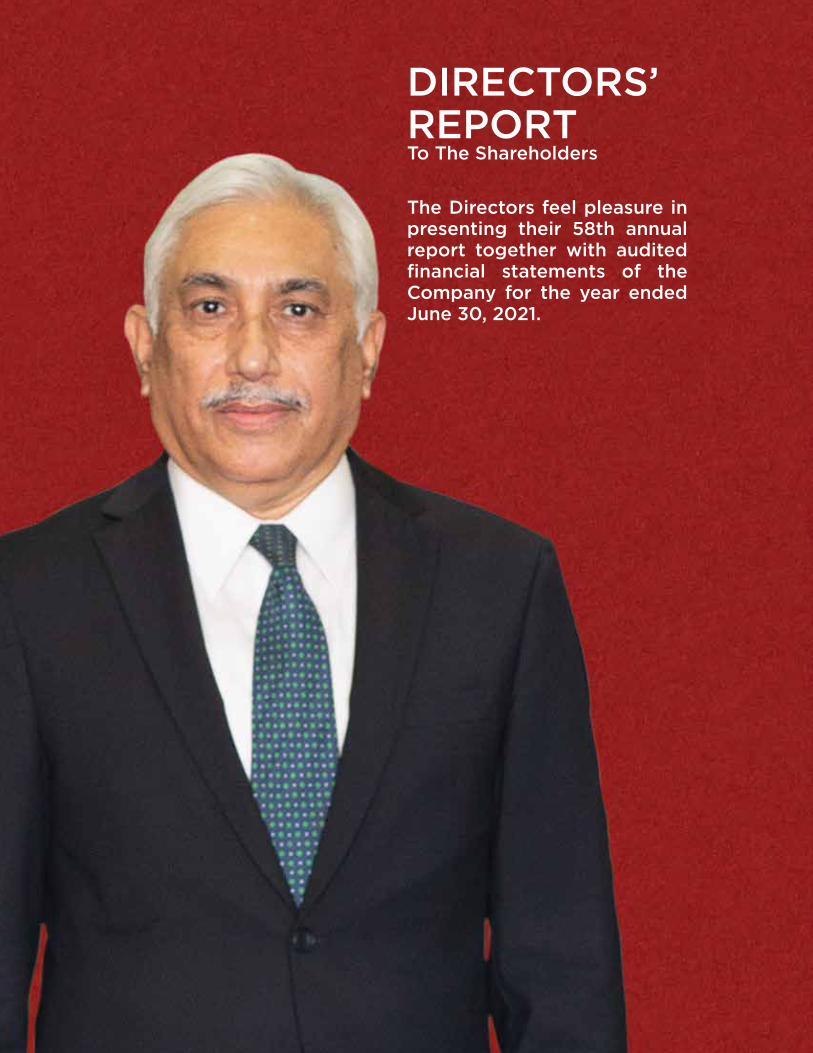
DIRECTORS’REPORTTo The Shareholders
The Directors feel pleasure in presenting their 58th annual report together with audited financial statements of the Company for the year ended June 30, 2021.
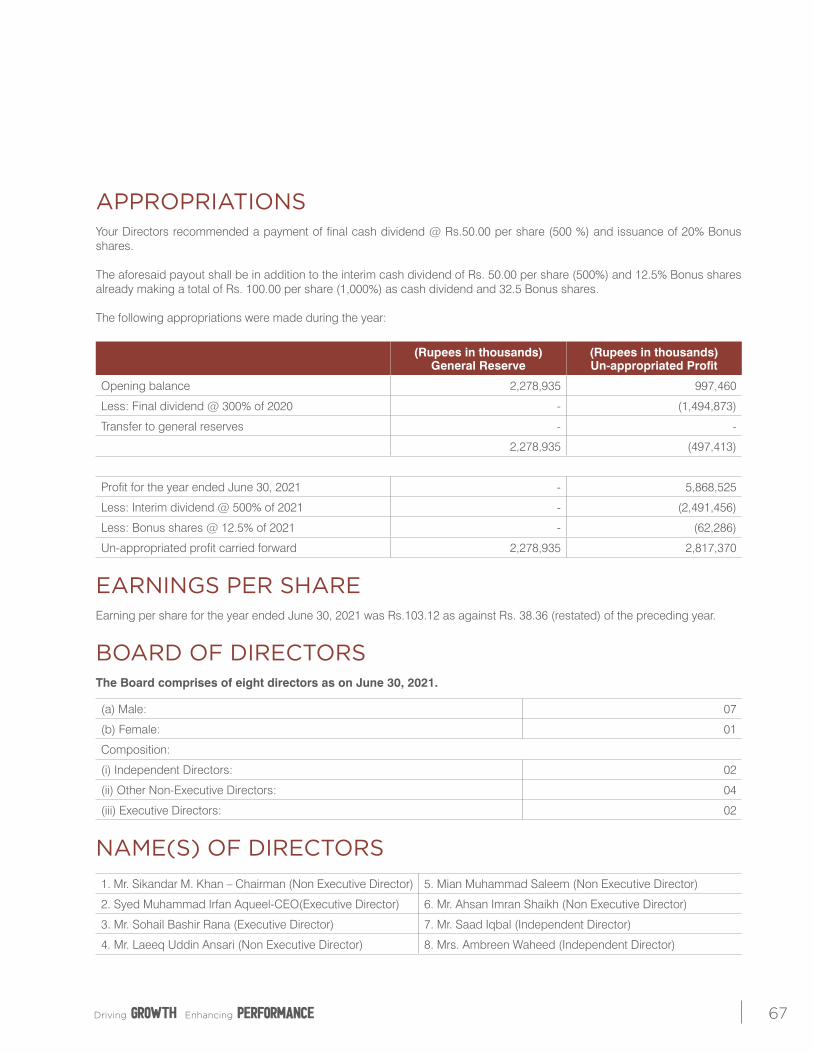
APPROPRIATIONSYour Directors recommended a payment of final cash dividend @ Rs.50.00 per share (500 %) and issuance of 20% Bonus shares.
The aforesaid payout shall be in addition to the interim cash dividend of Rs. 50.00 per share (500%) and 12.5% Bonus shares already making a total of Rs. 100.00 per share (1,000%) as cash dividend and 32.5 Bonus shares.
The following appropriations were made during the year:
(Rupees in thousands) General Reserve
(Rupees in thousands)Un-appropriated Profit
Opening balance 2,278,935 997,460
Less: Final dividend @ 300% of 2020 - (1,494,873)
Transfer to general reserves - -
2,278,935 (497,413)
Profit for the year ended June 30, 2021 - 5,868,525
Less: Interim dividend @ 500% of 2021 - (2,491,456)
Less: Bonus shares @ 12.5% of 2021 - (62,286)
Un-appropriated profit carried forward 2,278,935 2,817,370
EARNINGS PER SHAREEarning per share for the year ended June 30, 2021 was Rs.103.12 as against Rs. 38.36 (restated) of the preceding year.
BOARD OF DIRECTORSThe Board comprises of eight directors as on June 30, 2021.
(a) Male: 07
(b) Female: 01
Composition:
(i) Independent Directors: 02
(ii) Other Non-Executive Directors: 04
(iii) Executive Directors: 02
NAME(S) OF DIRECTORS 1. Mr. Sikandar M. Khan – Chairman (Non Executive Director) 5. Mian Muhammad Saleem (Non Executive Director)
2. Syed Muhammad Irfan Aqueel-CEO(Executive Director) 6. Mr. Ahsan Imran Shaikh (Non Executive Director)
3. Mr. Sohail Bashir Rana (Executive Director) 7. Mr. Saad Iqbal (Independent Director)
4. Mr. Laeeq Uddin Ansari (Non Executive Director) 8. Mrs. Ambreen Waheed (Independent Director)
Driving EnhancingGROWTH performance 67
Since the last report, there has been a change in the composition of the Board, Director, Mr. Latif Khalid Hashmi passed away on 09-02-2021 and Mr. Ahsan Imran Shaikh was appointed as director w.e.f March 22, 2021. The three years term of the present Board shall expire on October 30, 2021. The Board has fixed eight number of directors to be elected for the next term of which two independent (male) and one female independent director are proposed to be elected (after selection of independent directors from data bank of directors and completion of due diligence) on completion of present tenure as resolved by the Board in its meeting held on September 17, 2021.
BOARD COMMITTEES The names of members of Board Committees as on June 30, 2021 are as follows:-
1. Audit Committee Mr. Saad Iqbal Chairman Mr. Laeeq Uddin Ansari Member Mian Muhammad Saleem Member Mrs. Ambreen Waheed, Member
2. Human Resource & Remuneration Committee
Mr. Saad Iqbal Chairman Mr. Laeeq Uddin Ansari Member Mian Muhammad Saleem Member Syed Muhammad Irfan Aqueel Member Mrs. Ambreen Waheed Member
3. Finance Committee Mr. Sohail Bashir Rana Chairman Mr. Laeeq Uddin Ansari Member Mian Muhammad Saleem Member Syed Muhammad Irfan Aqueel Member
4. Marketing Committee Mr. Sohail Bashir Rana Chairman Mian Muhammad Saleem Member Syed Muhammad Irfan Aqueel Member
5. Board’s Committee for Group Supervision
Mr. Sikandar Mustafa Khan Chairman Mr. Sohail Bashir Rana Member Mr. Laeeq Uddin Ansari Member Mian Muhammad Saleem Member
DIRECTOR’S REMUNERATION POLICYThe Directors Remuneration policy of non-executive directors including independent directors as approved by the Board is as follows:-
i) Non-Executive Directors (Including Independent Directors)
Any fee / remuneration payable to the Independent and / or Non-Executive Directors of the Company shall be in following manner.
Meeting Fee
Independent and / or Non- Executive Director(s) may receive remuneration by way of fee for attending meetings of the Board or Committee(s) thereof as per Articles of Association of the Company.
Performing Extra Service
The remuneration for performing extra service may be paid to Non- Executive Director(s) as may be decided by the Board of Directors of the Company from time to time, depending on the extra time and effort as may be devoted and contribution as may be made by the Non-Executive Director(s).
Reimbursement of actual expenses incurred
Independent and / or Non- Executive Director(s) may also be paid / reimbursed such sums either as fixed allowance and /or actual as fair compensation for travel, boarding and lodging and incidental and /or actual out of pocket expenses incurred by such Directors for attending Board / Committee Meetings.
Annual Report 202168
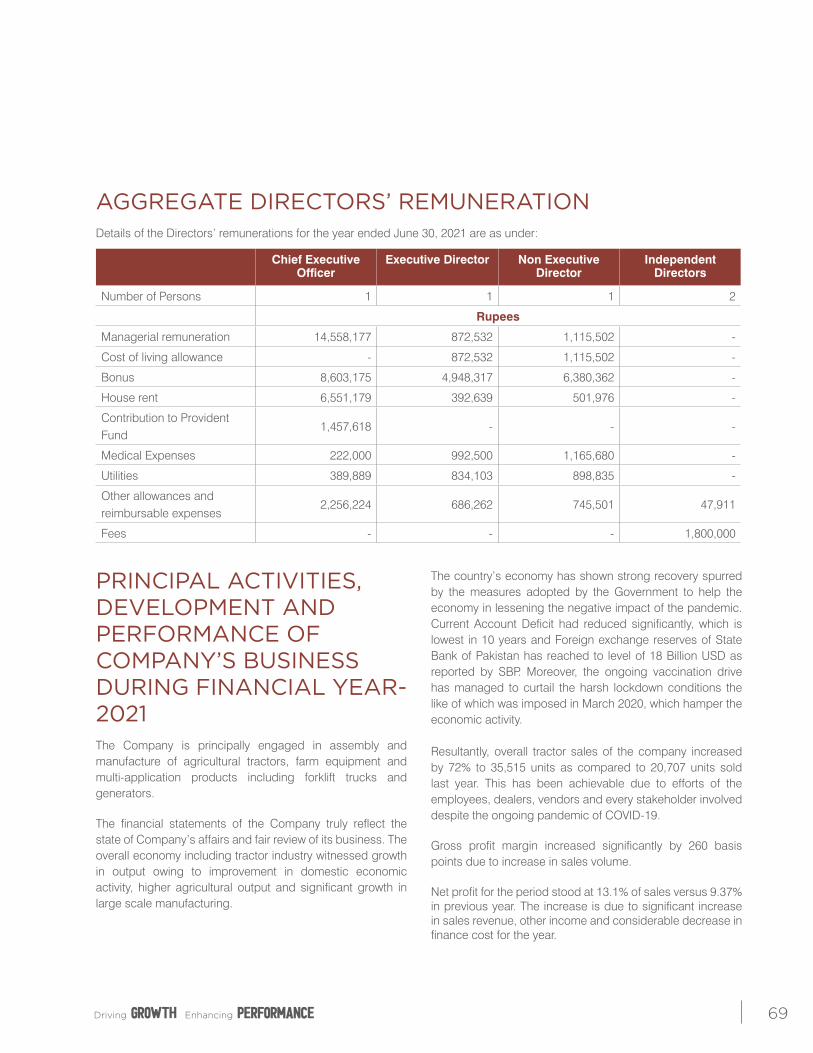
AGGREGATE DIRECTORS’ REMUNERATIONDetails of the Directors’ remunerations for the year ended June 30, 2021 are as under:
Chief Executive Officer
Executive Director Non Executive Director
Independent Directors
Number of Persons 1 1 1 2
Rupees
Managerial remuneration 14,558,177 872,532 1,115,502 -
Cost of living allowance - 872,532 1,115,502 -
Bonus 8,603,175 4,948,317 6,380,362 -
House rent 6,551,179 392,639 501,976 -
Contribution to Provident Fund
1,457,618 - - -
Medical Expenses 222,000 992,500 1,165,680 -
Utilities 389,889 834,103 898,835 -
Other allowances and reimbursable expenses
2,256,224 686,262 745,501 47,911
Fees - - - 1,800,000
PRINCIPAL ACTIVITIES, DEVELOPMENT AND PERFORMANCE OF COMPANY’S BUSINESS DURING FINANCIAL YEAR-2021The Company is principally engaged in assembly and manufacture of agricultural tractors, farm equipment and multi-application products including forklift trucks and generators.
The financial statements of the Company truly reflect the state of Company’s affairs and fair review of its business. The overall economy including tractor industry witnessed growth in output owing to improvement in domestic economic activity, higher agricultural output and significant growth in large scale manufacturing.
The country’s economy has shown strong recovery spurred by the measures adopted by the Government to help the economy in lessening the negative impact of the pandemic. Current Account Deficit had reduced significantly, which is lowest in 10 years and Foreign exchange reserves of State Bank of Pakistan has reached to level of 18 Billion USD as reported by SBP. Moreover, the ongoing vaccination drive has managed to curtail the harsh lockdown conditions the like of which was imposed in March 2020, which hamper the economic activity.
Resultantly, overall tractor sales of the company increased by 72% to 35,515 units as compared to 20,707 units sold last year. This has been achievable due to efforts of the employees, dealers, vendors and every stakeholder involved despite the ongoing pandemic of COVID-19.
Gross profit margin increased significantly by 260 basis points due to increase in sales volume.
Net profit for the period stood at 13.1% of sales versus 9.37% in previous year. The increase is due to significant increase in sales revenue, other income and considerable decrease in finance cost for the year.
Driving EnhancingGROWTH performance 69
PRINCIPAL RISKS AND UNCERTAINTIES FACING THE COMPANYEffective risk management is the key to sustainable business. Our risk management framework, coupled with our internal control policies have helped us maintain our focus and mitigating principal risks affecting our Company. The internal control framework established by the Company ensures appropriate risk mitigation plans by assigning designated accountability and policy framework for upward communication of any material issues and incidents. The Company is susceptible to the following principal risks which are mitigated via specific policies and plans:
Operational risks
Operational risks are those which hinder the entity from running its operations smoothly. Our main operational risks are:
Taxation regime of Pakistan
The taxation measures taken by the government during the fiscal year to increase tax-net seem to have not been fruitful due to inconsistencies in the application of law and frequent ad-hoc operational changes. This was most evident in processing of sales tax refunds, which have accumulated to the tune of Rs. 4.59 billion. Extreme measures need to be taken to rationalize tax laws and increase investors’ confidence.
Environmental Risk
The effects of global warming continued to increase during this fiscal year. Unexpected temperature shifts, locust attack and water shortage are critical indicators of the fact that we need to ramp up our efforts to address this risk quickly and effectively.
The unforeseen changes in environment may hamper the growth trajectory of the agricultural products, which is worrisome for a country that relies so much on it financially and economically. Our company is also directly linked with agriculture and any adverse impact severely affects company’s performance as well.
Financial Risks
Financial risks are those that may cause financial loss to the entity. Financial risk has been described in detail in note 47 of the attached financial statements that include market risks, credit risks and liquidity risk.
Compliance Risk
Non-compliance with laws and regulations may result in imposition of punitive action. Therefore, the Company has zero tolerance policy for non-compliance activities and behaviours. In addition, to mitigate such risks, a very comprehensive and effective compliance function is in place in the Company. Further, the Company’s Code of Conduct clearly defines expectations from employees of the Company. The Company encourages employees and business partners to report compliance violations that they may encounter
CHANGES DURING FINANCIAL YEAR CONCERNING THE NATURE OF THE BUSINESS OF THE COMPANY There has been no change in the principal activity of the Company during the year. The Company continued to increase its efforts in retail and exports sector and has delivered highest ever export sales during the year crossing the over 2,000 tractors export mark for the first time in the history of the company.
FUTURE PROSPECTS OF PROFITTractor sales are expected to retain the same trajectory in upcoming fiscal year provided rupee devaluation, pace of vaccination against COVID-19, success in managing the avoidance of lockdown and other economic indicators move along the predicted path. With recent approval of budget for 2021-2022, it is expected that tractor sales will increase to meet the growth targets set by the Government.
Annual Report 202170
ADEQUACY OF INTERNAL FINANCIAL CONTROLSThe Board of Millat Tractors Limited is responsible for the establishment and maintenance of the Company’s system of internal control in order to identify and manage risks faced by the Company.
The System provides reasonable, though not absolute, assurance that:
• assets are safeguarded against unauthorized use or disposition;
• proper and reliable accounting records are available for use within the business; and
• adequate control mechanisms have been established within the operational businesses
• Internal financial controls deployed within the Company have been satisfactory throughout the year.
MAIN TRENDS AND FACTORS LIKELY TO AFFECT THE FUTURE DEVELOPMENT, PERFORMANCE AND POSITION OF THE COMPANY’S BUSINESSThe major factors that are likely to affect the company’s business are:
• Rupee parity
• Kharif and Rabi season crop output
• Supply chain performance
• Security situation in Afghanistan for export market
• Pace of CPEC and other development projects
Shift in any of these parameters will impact company’s performance. It is anticipated that upcoming fiscal year will be on the same trajectory as current year.
DUTY & TAXESInformation about taxes and levies is given in the respective notes to the annexed financial statements.
AUDITORSThe present auditors M/s. A. F. Ferguson & Company, Chartered Accountants, Lahore retire and offer themselves for re-appointment. The Board Audit Committee and Board of Directors of the Company have endorsed their appointment at remuneration of Rs. 2,680,000 for shareholders’ consideration at the forthcoming Annual General Meeting. The external auditors have certified that they have been given satisfactory rating under the Quality Control Review of the Institute of Chartered Accountants of Pakistan and are registered with Audit Oversight Board of Pakistan and being eligible offer themselves for re-appointment.
DIRECTORS’ ORIENTATION PROGRAMAn orientation course was arranged for the Directors to acquaint them with the code, applicable laws, their duties and responsibilities to enable them to effectively manage affairs of the Company for and on behalf of the shareholders. Written material was also provided to them.
SUBSEQUENT EVENTSNo material changes or commitments affecting the financial position of the Company have occurred between the end of the financial year of the Company and the date of this report except as disclosed in this report.
AUDITOR’S OBSERVATIONSNo adverse remark, observation was given by the auditor’s in their report for the year ended June 30, 2021.
Driving EnhancingGROWTH performance 71
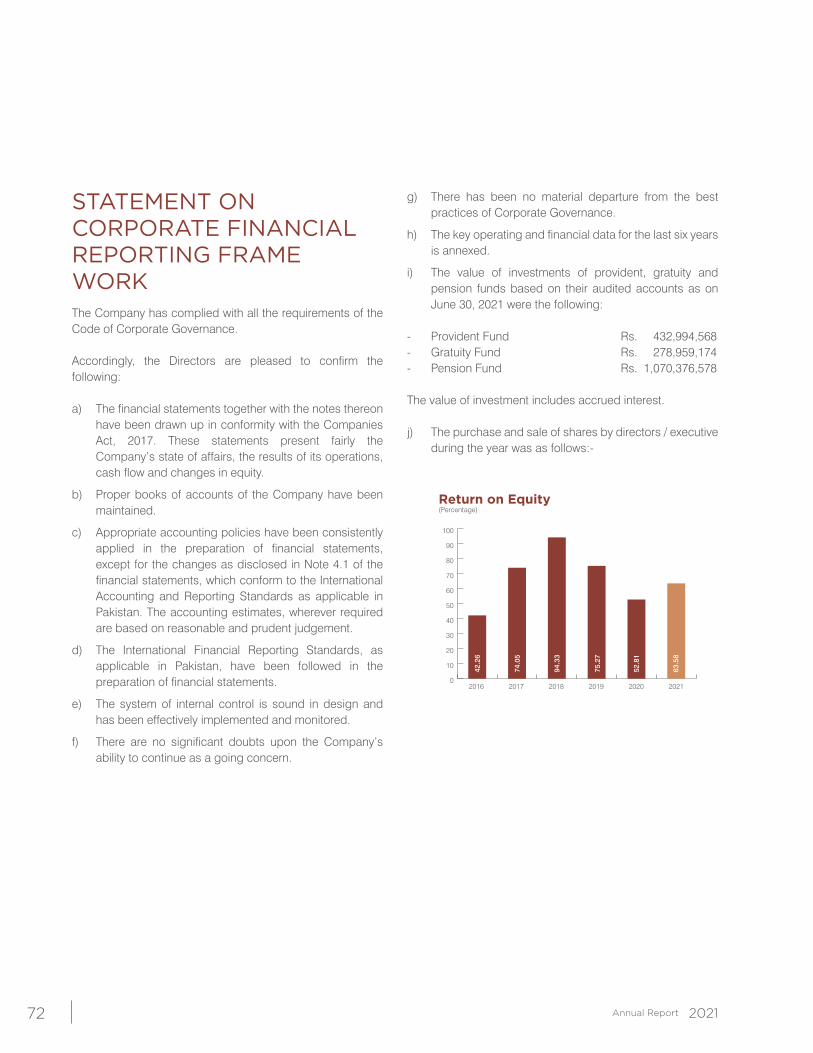
STATEMENT ON CORPORATE FINANCIAL REPORTING FRAME WORKThe Company has complied with all the requirements of the Code of Corporate Governance.
Accordingly, the Directors are pleased to confirm the following:
a) The financial statements together with the notes thereon have been drawn up in conformity with the Companies Act, 2017. These statements present fairly the Company’s state of affairs, the results of its operations, cash flow and changes in equity.
b) Proper books of accounts of the Company have been maintained.
c) Appropriate accounting policies have been consistently applied in the preparation of financial statements, except for the changes as disclosed in Note 4.1 of the financial statements, which conform to the International Accounting and Reporting Standards as applicable in Pakistan. The accounting estimates, wherever required are based on reasonable and prudent judgement.
d) The International Financial Reporting Standards, as applicable in Pakistan, have been followed in the preparation of financial statements.
e) The system of internal control is sound in design and has been effectively implemented and monitored.
f) There are no significant doubts upon the Company’s ability to continue as a going concern.
g) There has been no material departure from the best practices of Corporate Governance.
h) The key operating and financial data for the last six years is annexed.
i) The value of investments of provident, gratuity and pension funds based on their audited accounts as on June 30, 2021 were the following:
- Provident Fund Rs. 432,994,568 - Gratuity Fund Rs. 278,959,174- Pension Fund Rs. 1,070,376,578
The value of investment includes accrued interest. j) The purchase and sale of shares by directors / executive
during the year was as follows:-
0
10
20
30
40
50
60
70
80
90
100
42.2
6
74.0
5
94.3
3
75.2
7
52.8
1
63.5
8
Return on Equity(Percentage)
2019 2020 2021201820172016
Annual Report 202172
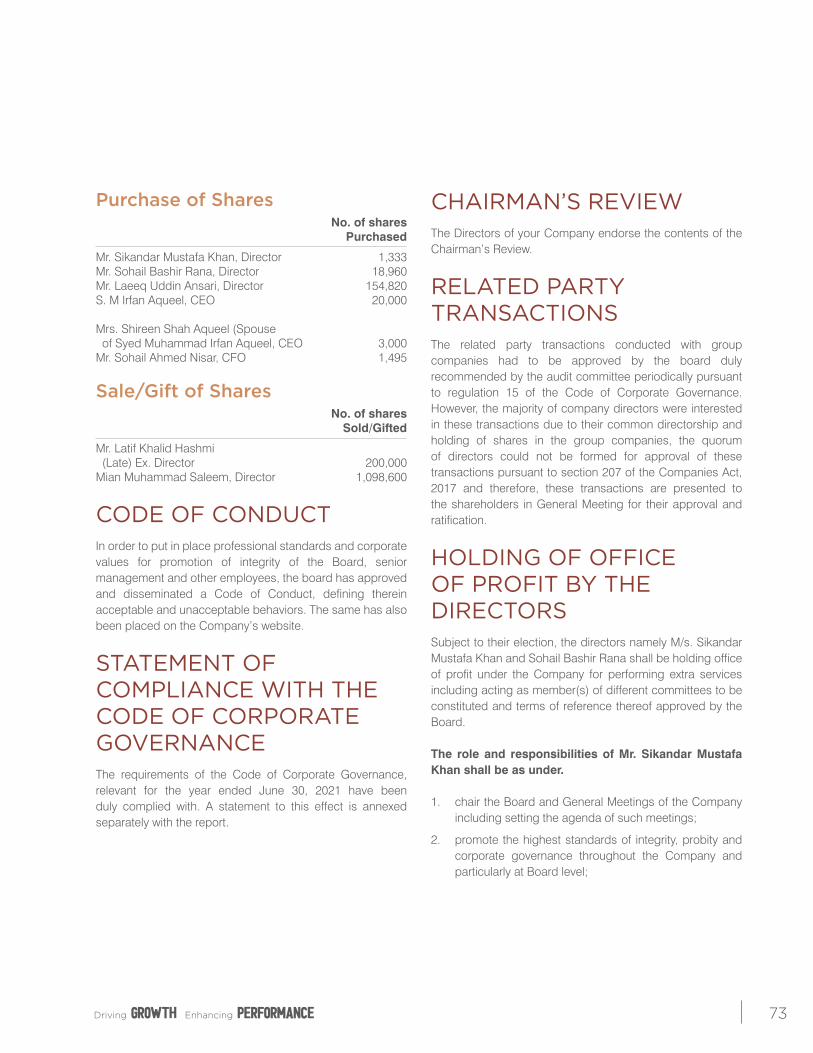
Purchase of Shares No. of shares Purchased
Mr. Sikandar Mustafa Khan, Director 1,333Mr. Sohail Bashir Rana, Director 18,960Mr. Laeeq Uddin Ansari, Director 154,820S. M Irfan Aqueel, CEO 20,000 Mrs. Shireen Shah Aqueel (Spouse of Syed Muhammad Irfan Aqueel, CEO 3,000 Mr. Sohail Ahmed Nisar, CFO 1,495
Sale/Gift of Shares No. of shares Sold/Gifted
Mr. Latif Khalid Hashmi (Late) Ex. Director 200,000Mian Muhammad Saleem, Director 1,098,600
CODE OF CONDUCTIn order to put in place professional standards and corporate values for promotion of integrity of the Board, senior management and other employees, the board has approved and disseminated a Code of Conduct, defining therein acceptable and unacceptable behaviors. The same has also been placed on the Company’s website.
STATEMENT OF COMPLIANCE WITH THE CODE OF CORPORATE GOVERNANCEThe requirements of the Code of Corporate Governance, relevant for the year ended June 30, 2021 have been duly complied with. A statement to this effect is annexed separately with the report.
CHAIRMAN’S REVIEWThe Directors of your Company endorse the contents of the Chairman’s Review.
RELATED PARTY TRANSACTIONS The related party transactions conducted with group companies had to be approved by the board duly recommended by the audit committee periodically pursuant to regulation 15 of the Code of Corporate Governance. However, the majority of company directors were interested in these transactions due to their common directorship and holding of shares in the group companies, the quorum of directors could not be formed for approval of these transactions pursuant to section 207 of the Companies Act, 2017 and therefore, these transactions are presented to the shareholders in General Meeting for their approval and ratification.
HOLDING OF OFFICE OF PROFIT BY THE DIRECTORS Subject to their election, the directors namely M/s. Sikandar Mustafa Khan and Sohail Bashir Rana shall be holding office of profit under the Company for performing extra services including acting as member(s) of different committees to be constituted and terms of reference thereof approved by the Board.
The role and responsibilities of Mr. Sikandar Mustafa Khan shall be as under.
1. chair the Board and General Meetings of the Company including setting the agenda of such meetings;
2. promote the highest standards of integrity, probity and corporate governance throughout the Company and particularly at Board level;
Driving EnhancingGROWTH performance 73
3. ensure that the Board receives accurate, timely and clear information;
4. ensure effective communication with members of the Company;
5. facilitate the effective contribution of non-executive directors and ensure constructive relations between executive and non-executive directors;
6. ensure that the performance of the Board, its committees and individual directors is evaluated at least once a year; and
7. ensure clear structure for, and the effective running of, Board committees.
8. disclosure of interest where it exists.
Extra Services
In addition to the above he will perform the following.
i) To perform duties and responsibilities as defined in the Code of Corporate Governance.
ii) To act as Chairman of Board’s Committee for Group supervision (BCGS) constituted by the Board to review overall business performance, major projects and new investments of group companies.
iii) To perform functions as contained in Article 103 (2) (iv) of the Articles of Association of the Company which reads as under:
“act as Chairman of Board’s Committee for Group Supervision (BCGS) and monitor the functions of units through BCGS members and in furtherance thereof, may from time to time call for information, issue directions, guidelines or assign a specific task to any member of the Committee.”
iv) To monitor functioning of Finance and Marketing committees.
v) Exercise such powers, functions & duties as may be assigned / delegated by the Board from time to time pursuant to Article 103(2) (iii) of the Articles of Association of the Company.
The role and responsibilities of Mr. Sohail Bashir Rana shall be as under.
1. As Executive director he shall have the same general legal responsibilities to the Company as any other director and shall be required to take decisions in the best interests of the Company.
2. constructively challenge and contribute to the development of Company strategy;
3. ensure that financial information is accurate and that financial controls and systems of risk management are robust and defensible;
4. at all time comply with the Articles of Association of the Company;
5. disclose interest where it exists.
Extra Services
In addition to the above he will perform the following.
1. Play a key role in coordinating and managing all operational, financial and personnel functions of the Company to ensure continued profit growth.
2. Provide entrepreneurial leadership of the Company within a framework of prudent and effective controls which enable risk to be assessed and managed.
3. Set the Company’s strategic goals, ensure that the necessary financial and human resources are in place for the Company to meet its objectives, and review management performance; and
4. Set the Company’s values and standards and ensure that its obligations to its shareholders and others are understood and met.
5. Implement the approved operational plans of the Company and arrange timely availability of required resources.
6. Define short term and long term marketing objectives for the Company.
Annual Report 202174
7. Review and approve strategies budgets for production plans to ensure these meet objectives already set.
8. Define reporting formats including key performance indicators and critical success factors for sales and marketing qualitative and quantitative performance measurement.
9. Review actual performance against budget, reasons for variations and plans to bridge the gaps on monthly basis.
10. Define critical success factors for performance measurement.
11. Define critical controls to be implemented in the operations.
12. Review and approve operations policies.
13. Review and approve policies for procurement, inventories, maintenance etc.
14. Review and approve quality control standards.
15. Review performance evaluation of senior personnel of the Company.
16. Review and approve IT Budget and approve IT projects.
The board shall approve their remuneration packages in accordance with Articles of Association of the Company subject to their election as directors. However, the holding of office of profit in the Company by the directors has to be sanctioned/ approved by the shareholders in the general meeting. Therefore a resolution is being placed before the shareholders in the forthcoming AGM for their consideration and approval, if deemed appropriate. Each director is interested in the resolution to the extent of his remuneration.
PATTERN OF SHAREHOLDINGThe pattern of shareholding is annexed.
NUMBER OF EMPLOYEESThe numbers of permanent employees as on June 30, 2021 were 346 compared to 360 of last year.
CONSOLIDATED FINANCIAL STATEMENTSConsolidated financial statements of the Company as on June 30, 2021 are annexed.
CORPORATE SOCIAL RESPONSIBILITYDisclosure of Corporate Social Responsibility is annexed and forms part of this report.
WEB PRESENCECompany’s periodic financial statements for the current financial year including annual reports for the last three years are available on the Company’s website www.millat.com.pk for information of the investors.
For and on behalf of the Board
Chief Executive Chairman
Lahore: September 17, 2021
Driving EnhancingGROWTH performance 75
Annual Report 202176
Driving EnhancingGROWTH performance 77
Annual Report 202178
Driving EnhancingGROWTH performance 79
Annual Report 202180
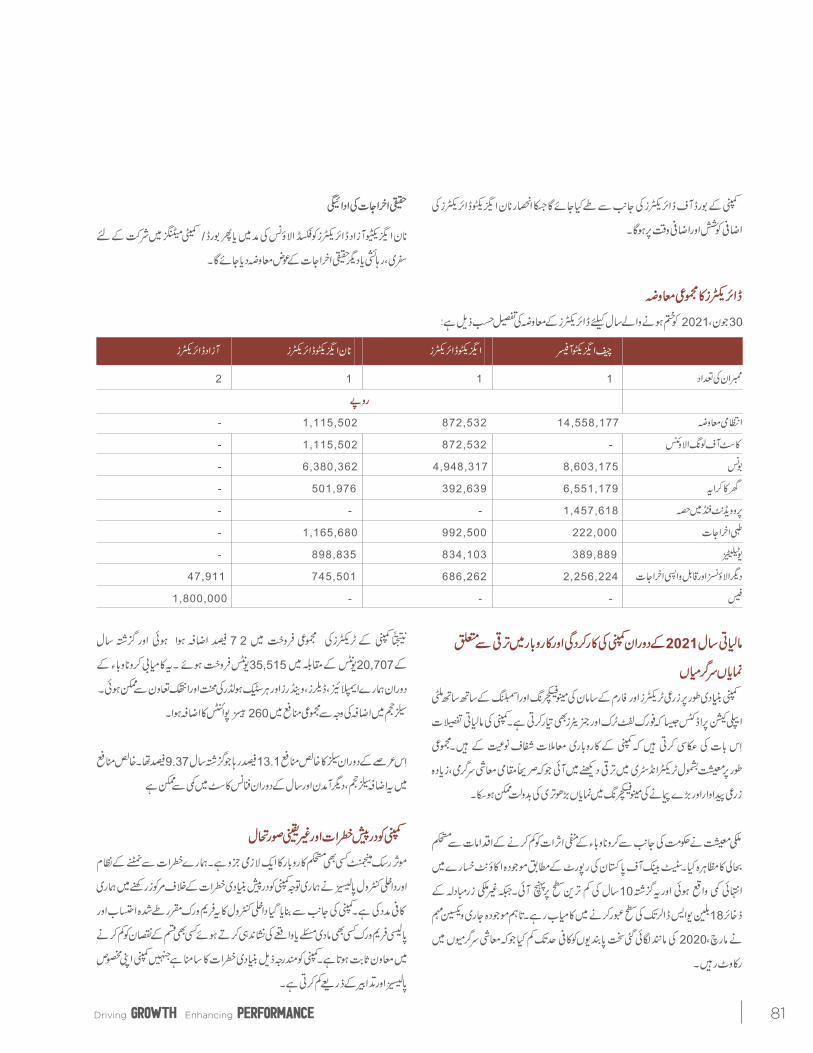
Driving EnhancingGROWTH performance 81
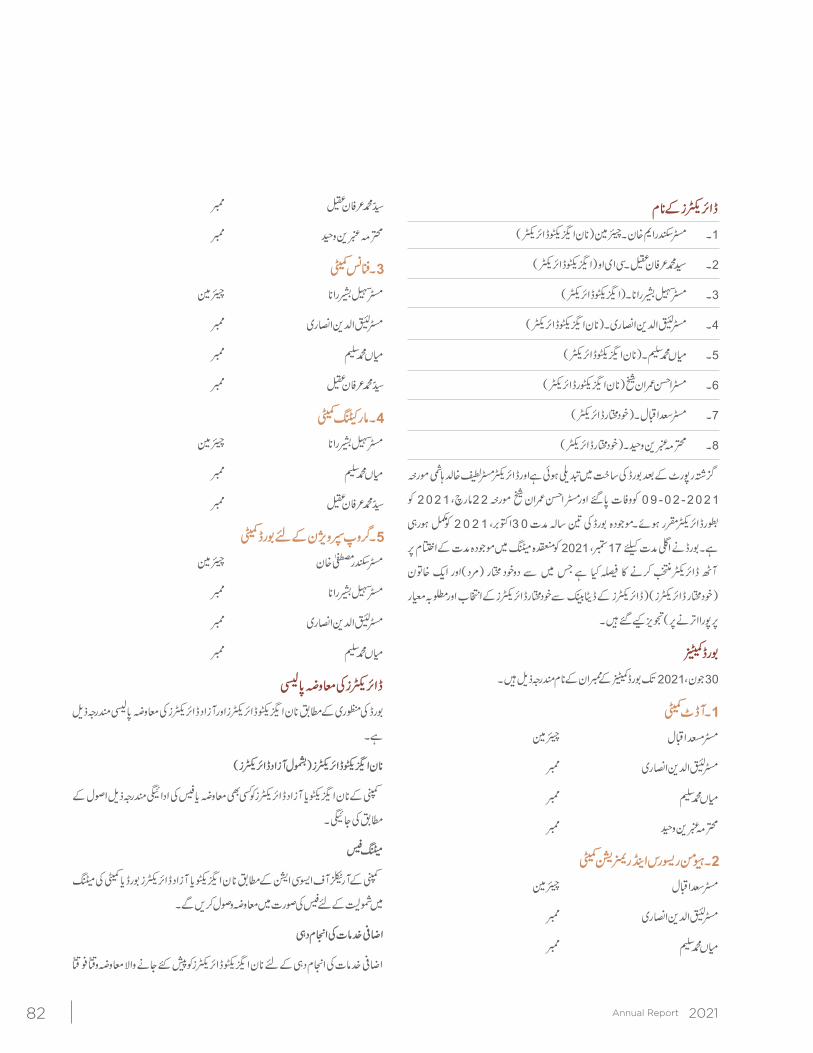
Annual Report 202182
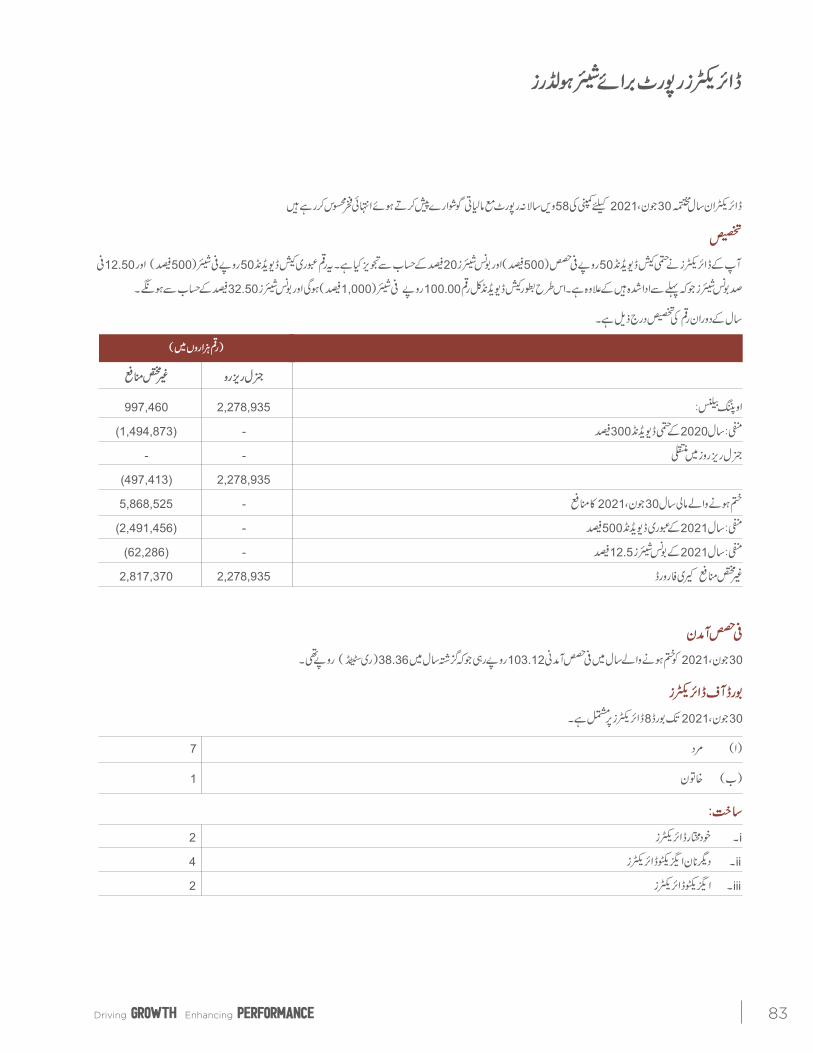
Driving EnhancingGROWTH performance 83
CORPORATE SUSTAINABILITYMTL strongly believes in discharging its responsibilities as a corporate citizen of Pakistan and acts as a contributory member of the society. MTL recognizes the importance of its employees, their work life balances, safety & security, reducing carbon footprints for better atmosphere, community uplift programs for the underprivileged, customers & products, ethical behavior, contribution to the national exchequer and community welfare programs.
MTL fulfills its Corporate Social Responsibilities (CSR) in a manner that positively impacts its customers, employees, shareholders, community, and the environment. The company demonstrates active corporate citizenship by promoting and patronizing various activities under its philanthropic and non-philanthropic CSR programs
EDUCATIONAL PATRONAGEMTL promotes and patronizes multiple activities in the field of education under its CSR program. Children Education Award Scheme is one of such activities where the Company recognizes better educational performance of Employees’ Children and awards scholarships.
The Company also recognises the significance of continuous learning and its importance in career development of its employees which eventually lead to benefit the society. Therefore, the Company provides assistance in improvement of educational qualification that outlines the relaxation in working hours to support educational initiatives of its employees.
The Company has donated Rs. 250,000/- to Government High School, Nizampura Lahore. MTL also provided sponsorship to 4 students of Tehzib-ul-Ihlas Schools worth Rs. 900,000/-. Besides, that sponsorship of Rs. 200,000/- was given to a student named Shamsa Riaz for higher studies to Malaysia. Additionally, educational/skill development and training activities were also supported by offering Internship opportunity to 200 students of various disciplines, imparting practical knowledge related to their studies.
ENVIRONMENTAL PROTECTION MEASURESTo combat the looming threat of global warming and its effects on the environment, a tree plantation drive was organized during
the year whereby employees of the Company were facilitated to plant a tree within factory premises and nurture it to sustainable growth. The Company also maintains in-house nurseries and vegetable farms to cultivate organic agricultural products and has also participated in various flower exhibitions throughout the year.
COMMUNITY WELFARE SCHEMESMTL’s CSR program patronizes several measures to protect the environment. One of these measures is active participation in flower shows.
Various sports activities were encouraged by the Company to bring the people together from various communities. A sum of Rs. 1,032,198 has been spent to sponsor Governor Cup Golf and Polo Tournament.
Contribution of Rs. 500,000 a Computer and Printer worth Rs. 43,115 granted to Lahore Hospital Welfare Society. MTL also sponsored Rs.393,665 in Junior National Tennis Championship organized by Punjab Lawn Tennis Association.
CONSUMER PROTECTIONThe company has modern production facility with a manufacturing capacity to meet the local as well as export requirements. The company continuously strives to provide a wide range of products built on global standards and powerful after sales support to its customers. MTL also conducts multiple awareness programs and carries out surveys to obtain feedback from the market to improve its products. There are defined rules for customers’ convenience, to directly contact the company in case of dissatisfaction.
Additionally, the Company has partnered with its principal M/s AGCO for product improvement plans to exceed customers’ expectations.
INDUSTRIAL RELATIONSThe Company is an equal opportunity employer and maintains a cordial relationship between the management and workforce. The management holds regular meetings with the labor union leaders to ensure all their needs are fulfilled and to provide a safe and friendly work environment. The Company also facilitates education of employees’ children and also provides financial assistance to employees to fulfill their religious obligations like; Hajj under Company’s Hajj Scheme.
CORPORATE SOCIAL RESPONSIBILITY REPORT
Annual Report 202184

In order to improve employee satisfaction and boost their morale, the company organizes various activities such as ‘Annual Dinner’ and ‘Annual Gift Scheme’.
EMPLOYMENT OF PEOPLE WITH SPECIAL NEEDSSince the company is an equal opportunity employer, it guarantees that its staffing process stays fair to physical disabilities subject to work requirements. Personnel with special physical needs are working in various capacities in Millat Tractors.
OCCUPATIONAL SAFETY AND HEALTHMTL urges its workers to be vigilant and careful to ensure the wellbeing and safety of themselves and fellow workers. All employees are urged to follow strict health and safety protocols.
All of the personnel employed at factory premises are provided with appropriate PPEs and necessary safety apparatuses to ensure safe and secure working conditions. In order to combat with the COVID-19, pandemic, MTL has taken vigorous precautionary steps to protect its employees from COVID-19 and spreading the disease. Around PKR 7.3 Million has been spent on the purchase of PPE’s, Masks, Disinfection Spray, and Sanitizers.
ETHICS AND ANTI-CORRUPTIONMTL strongly believes in ethical business operation and condemns all sorts of unethical practices while doing business. The company actively discourages all forms of corruption and any form of conduct that violates principles of business ethics. The company is fully committed to be compliant with all principles of fairness, transparency and integrity.
To ensure compliance with professional, ethical and moral code as well as legal measures, the company has a formal Code of Conduct. It is an integral part of the formal governance regime in
the company and is the key element in the Millat’s way of doing business. The way company wants to achieve its ambitious goals, is elaborated in the Code which forms its ethical foundation, values for guiding the right behavior and leadership attitudes for driving corporate culture in the desired direction. The code defines the core principles and ethical standards that form the basis to create value in the company. The defined principles and standards are further incorporated in other governing documents as appropriate. The purpose of the code is to highlight the standards of behavior and conduct of employees while dealing with customers, suppliers, clients, co-workers, management and the general public. The code highlights expected behavior as well as punitive measures against violations.
CORPORATE PHILANTHROPYBeyond commercial activities, company has also contributed to spread awareness and knowledge in agriculture sector by sponsoring and participating exhibitions including; Farmer’s Expo arranged by Bayer.
Driving EnhancingGROWTH performance 85
Annual Report 202186
Driving EnhancingGROWTH performance 87
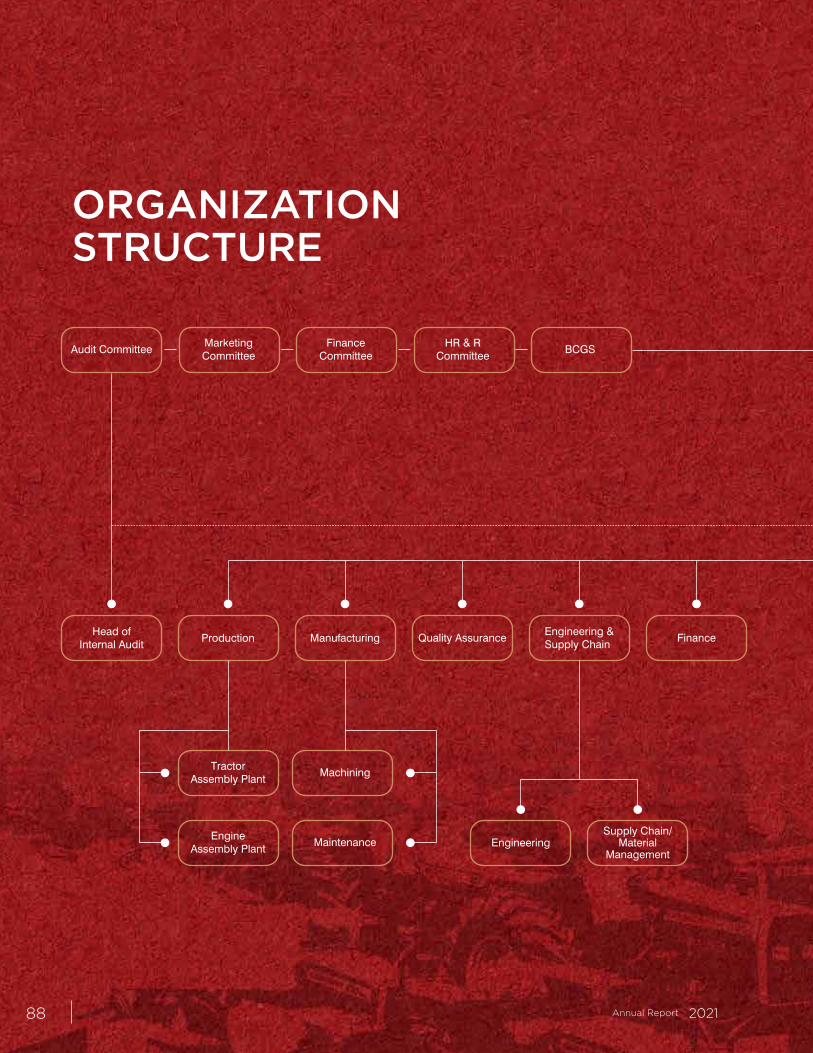
CHAIRMAN
CHIEF EXECUTIVE
COMPANY SECRETARYBOARD COMMITTEES
Head ofInternal Audit
MarketingInformationTechnology
Human ResourceIndustrial
Products DivisionIFS Business
Administration& Purchase
TractorAssembly Plant
EngineAssembly Plant
Machining
Maintenance Service Sales (North)Sales (South)EngineeringSupply Chain/
MaterialManagement
Parts /Ware House
Distribution
Quality AssuranceEngineering &Supply Chain
FinanceProduction Manufacturing
Audit CommitteeHR & R
CommitteeFinance
CommitteeMarketingCommittee
BCGS
BOARD OF DIRECTORSORGANIZATION STRUCTURE
Annual Report 202188
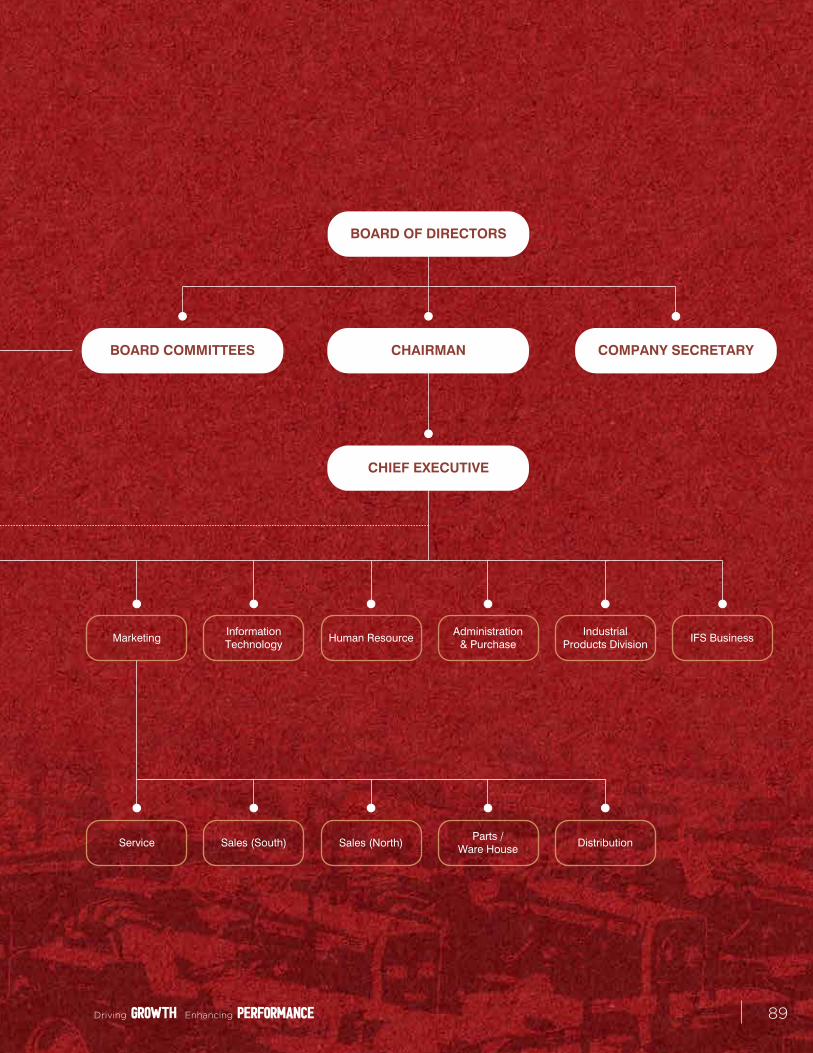
CHAIRMAN
CHIEF EXECUTIVE
COMPANY SECRETARYBOARD COMMITTEES
Head ofInternal Audit
MarketingInformationTechnology
Human ResourceIndustrial
Products DivisionIFS Business
Administration& Purchase
TractorAssembly Plant
EngineAssembly Plant
Machining
Maintenance Service Sales (North)Sales (South)EngineeringSupply Chain/
MaterialManagement
Parts /Ware House
Distribution
Quality AssuranceEngineering &Supply Chain
FinanceProduction Manufacturing
Audit CommitteeHR & R
CommitteeFinance
CommitteeMarketingCommittee
BCGS
BOARD OF DIRECTORS
Driving EnhancingGROWTH performance 89

STATEMENT ON COVID-19The pandemic of COVID-19 that has rapidly spread all across the world has not only endangered human lives but has also adversely impacted the global economy. On March 23, 2020, the Government of the Punjab announced a temporary lock down as a measure to reduce the spread of the COVID–19. Complying with the lockdown, the Company temporarily suspended its operations from March 24, 2020. In the Company’s case, the lockdown was subsequently relaxed from March 30, 2020. After implementing all the necessary Standard Operating Procedures (SOPs) to ensure safety of employees, i.e. screening of employees including any visitor at the time of entrance, guiding the staff to wear masks and maintain social distancing etc. Company henceforth resumed its operations and has taken all necessary steps to ensure
smooth and adequate continuation of its business in order to maintain business performance.
The measures adopted by the Government helped the economy in lessening the negative impact of the pandemic. As a result, Pakistan economy started witnessing recovery during the first half of FY2021 on the back of continued domestic economic activity. The tractor industry has also followed the overall recovery trend and has shown significant growth as compared to the previous period. Improved liquidity position of farmers and improvement in local demand has led to increase in sales of tractors. Furthermore, despite the prevailing pandemic, the Company has achieved an export sale of over 2,000 tractors for the first time in its history, which depicts your Company’s resolve to thrive and set up its footprint globally.
According to management’s assessment, there is no significant accounting impact of the effects of COVID-19 on these financial statements.
Annual Report 202190
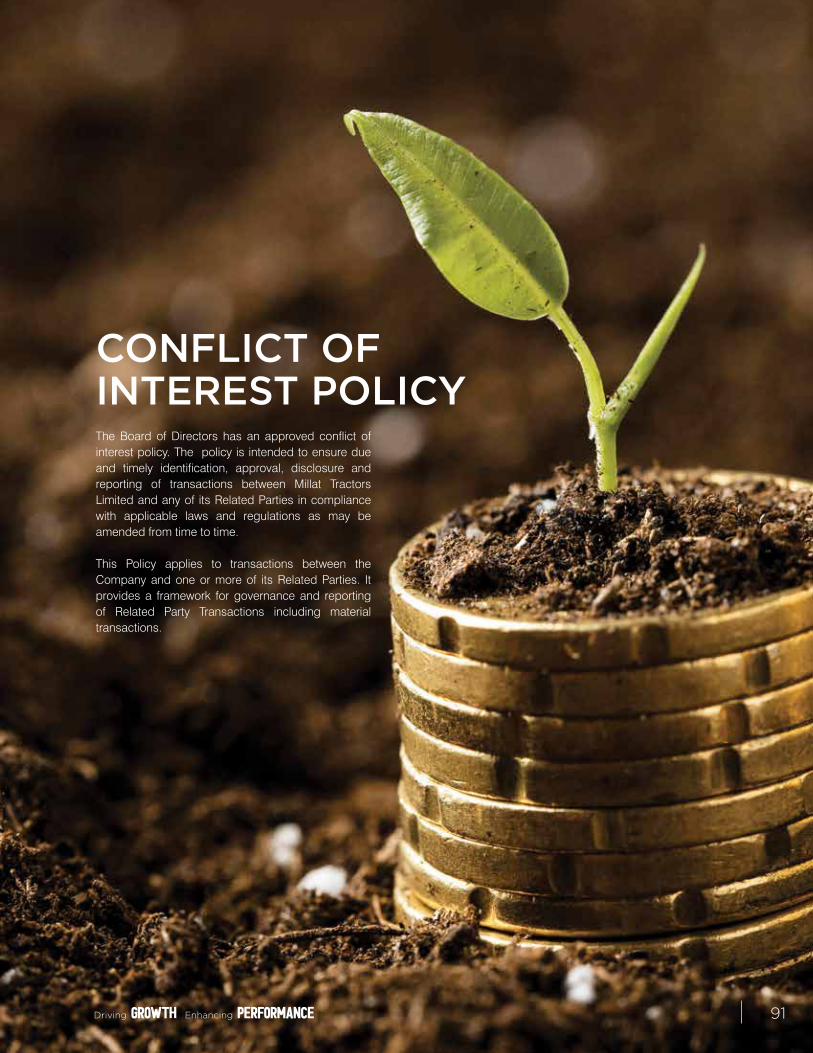
CONFLICT OF INTEREST POLICYThe Board of Directors has an approved conflict of interest policy. The policy is intended to ensure due and timely identification, approval, disclosure and reporting of transactions between Millat Tractors Limited and any of its Related Parties in compliance with applicable laws and regulations as may be amended from time to time.
This Policy applies to transactions between the Company and one or more of its Related Parties. It provides a framework for governance and reporting of Related Party Transactions including material transactions.
Driving EnhancingGROWTH performance 91


performance& position
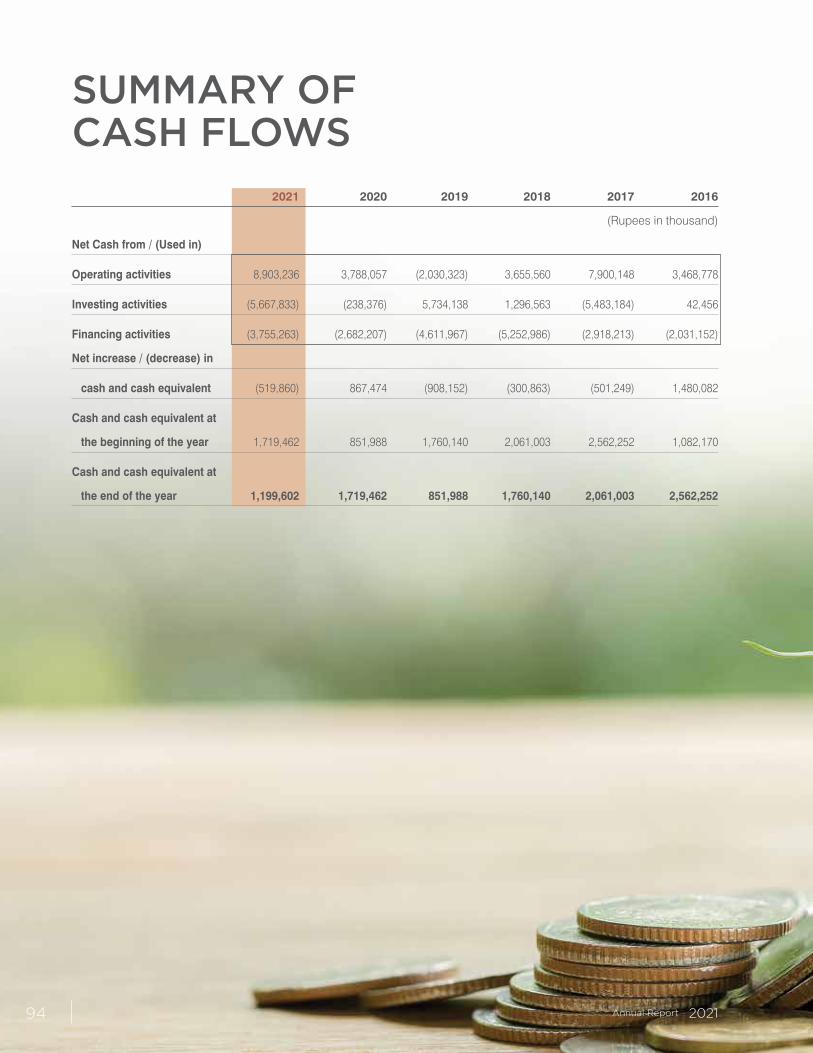
SUMMARY OF CASH FLOWS 2021 2020 2019 2018 2017 2016
(Rupees in thousand)
Net Cash from / (Used in)
Operating activities 8,903,236 3,788,057 (2,030,323) 3,655,560 7,900,148 3,468,778
Investing activities (5,667,833) (238,376) 5,734,138 1,296,563 (5,483,184) 42,456
Financing activities (3,755,263) (2,682,207) (4,611,967) (5,252,986) (2,918,213) (2,031,152)
Net increase / (decrease) in
cash and cash equivalent (519,860) 867,474 (908,152) (300,863) (501,249) 1,480,082
Cash and cash equivalent at
the beginning of the year 1,719,462 851,988 1,760,140 2,061,003 2,562,252 1,082,170
Cash and cash equivalent at
the end of the year 1,199,602 1,719,462 851,988 1,760,140 2,061,003 2,562,252
Annual Report 202194
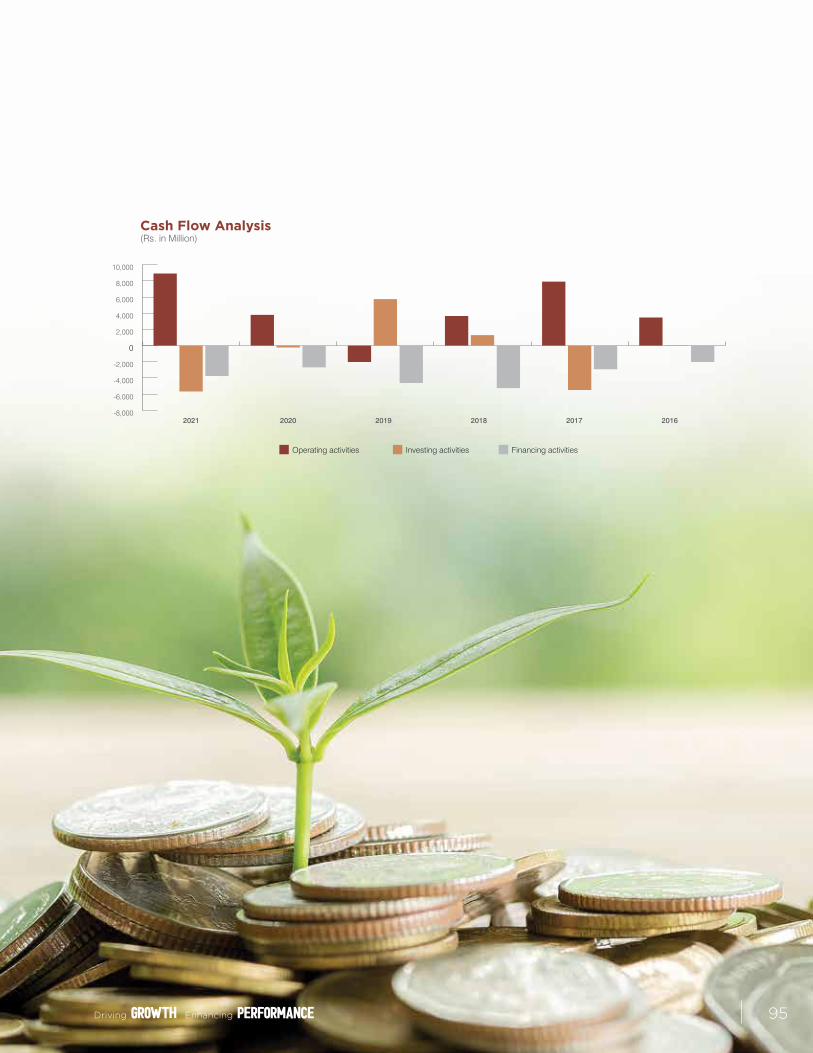
Cash Flow Analysis(Rs. in Million)
Operating activities Investing activities Financing activities
20202021 2019 2018 2017 2016-8,000
-6,000
-4,000
-2,000
0
2,000
4,000
6,000
8,000
10,000
Driving EnhancingGROWTH performance 95
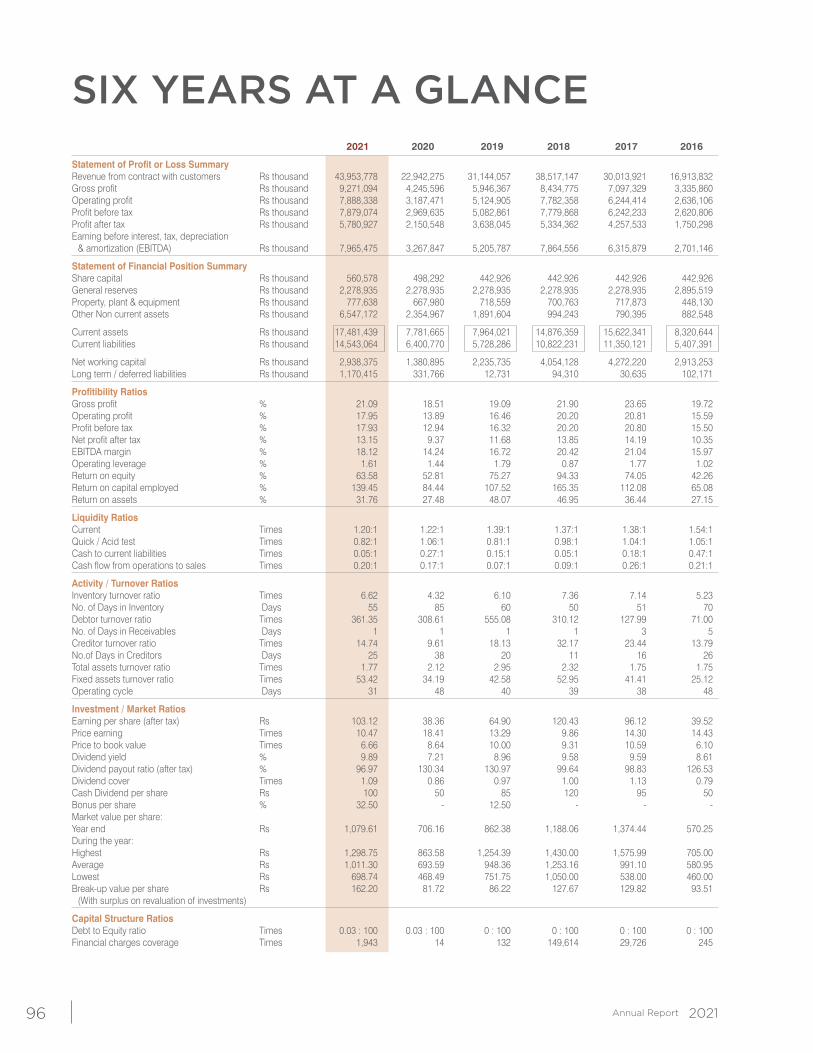
SIX YEARS AT A GLANCE 2021 2020 2019 2018 2017 2016
Statement of Profit or Loss Summary Revenue from contract with customers Rs thousand 43,953,778 22,942,275 31,144,057 38,517,147 30,013,921 16,913,832 Gross profit Rs thousand 9,271,094 4,245,596 5,946,367 8,434,775 7,097,329 3,335,860 Operating profit Rs thousand 7,888,338 3,187,471 5,124,905 7,782,358 6,244,414 2,636,106 Profit before tax Rs thousand 7,879,074 2,969,635 5,082,861 7,779,868 6,242,233 2,620,806 Profit after tax Rs thousand 5,780,927 2,150,548 3,638,045 5,334,362 4,257,533 1,750,298 Earning before interest, tax, depreciation
& amortization (EBITDA) Rs thousand 7,965,475 3,267,847 5,205,787 7,864,556 6,315,879 2,701,146
Statement of Financial Position Summary Share capital Rs thousand 560,578 498,292 442,926 442,926 442,926 442,926 General reserves Rs thousand 2,278,935 2,278,935 2,278,935 2,278,935 2,278,935 2,895,519 Property, plant & equipment Rs thousand 777,638 667,980 718,559 700,763 717,873 448,130 Other Non current assets Rs thousand 6,547,172 2,354,967 1,891,604 994,243 790,395 882,548
Current assets Rs thousand 17,481,439 7,781,665 7,964,021 14,876,359 15,622,341 8,320,644 Current liabilities Rs thousand 14,543,064 6,400,770 5,728,286 10,822,231 11,350,121 5,407,391
Net working capital Rs thousand 2,938,375 1,380,895 2,235,735 4,054,128 4,272,220 2,913,253 Long term / deferred liabilities Rs thousand 1,170,415 331,766 12,731 94,310 30,635 102,171
Profitibility Ratios Gross profit % 21.09 18.51 19.09 21.90 23.65 19.72 Operating profit % 17.95 13.89 16.46 20.20 20.81 15.59 Profit before tax % 17.93 12.94 16.32 20.20 20.80 15.50 Net profit after tax % 13.15 9.37 11.68 13.85 14.19 10.35 EBITDA margin % 18.12 14.24 16.72 20.42 21.04 15.97 Operating leverage % 1.61 1.44 1.79 0.87 1.77 1.02 Return on equity % 63.58 52.81 75.27 94.33 74.05 42.26 Return on capital employed % 139.45 84.44 107.52 165.35 112.08 65.08 Return on assets % 31.76 27.48 48.07 46.95 36.44 27.15
Liquidity Ratios Current Times 1.20:1 1.22:1 1.39:1 1.37:1 1.38:1 1.54:1Quick / Acid test Times 0.82:1 1.06:1 0.81:1 0.98:1 1.04:1 1.05:1Cash to current liabilities Times 0.05:1 0.27:1 0.15:1 0.05:1 0.18:1 0.47:1Cash flow from operations to sales Times 0.20:1 0.17:1 0.07:1 0.09:1 0.26:1 0.21:1
Activity / Turnover Ratios Inventory turnover ratio Times 6.62 4.32 6.10 7.36 7.14 5.23 No. of Days in Inventory Days 55 85 60 50 51 70 Debtor turnover ratio Times 361.35 308.61 555.08 310.12 127.99 71.00 No. of Days in Receivables Days 1 1 1 1 3 5 Creditor turnover ratio Times 14.74 9.61 18.13 32.17 23.44 13.79 No.of Days in Creditors Days 25 38 20 11 16 26 Total assets turnover ratio Times 1.77 2.12 2.95 2.32 1.75 1.75 Fixed assets turnover ratio Times 53.42 34.19 42.58 52.95 41.41 25.12 Operating cycle Days 31 48 40 39 38 48
Investment / Market Ratios Earning per share (after tax) Rs 103.12 38.36 64.90 120.43 96.12 39.52 Price earning Times 10.47 18.41 13.29 9.86 14.30 14.43 Price to book value Times 6.66 8.64 10.00 9.31 10.59 6.10 Dividend yield % 9.89 7.21 8.96 9.58 9.59 8.61 Dividend payout ratio (after tax) % 96.97 130.34 130.97 99.64 98.83 126.53 Dividend cover Times 1.09 0.86 0.97 1.00 1.13 0.79 Cash Dividend per share Rs 100 50 85 120 95 50Bonus per share % 32.50 - 12.50 - - - Market value per share: Year end Rs 1,079.61 706.16 862.38 1,188.06 1,374.44 570.25 During the year: Highest Rs 1,298.75 863.58 1,254.39 1,430.00 1,575.99 705.00 Average Rs 1,011.30 693.59 948.36 1,253.16 991.10 580.95 Lowest Rs 698.74 468.49 751.75 1,050.00 538.00 460.00 Break-up value per share Rs 162.20 81.72 86.22 127.67 129.82 93.51
(With surplus on revaluation of investments)
Capital Structure Ratios Debt to Equity ratio Times 0.03 : 100 0.03 : 100 0 : 100 0 : 100 0 : 100 0 : 100 Financial charges coverage Times 1,943 14 132 149,614 29,726 245
Annual Report 202196
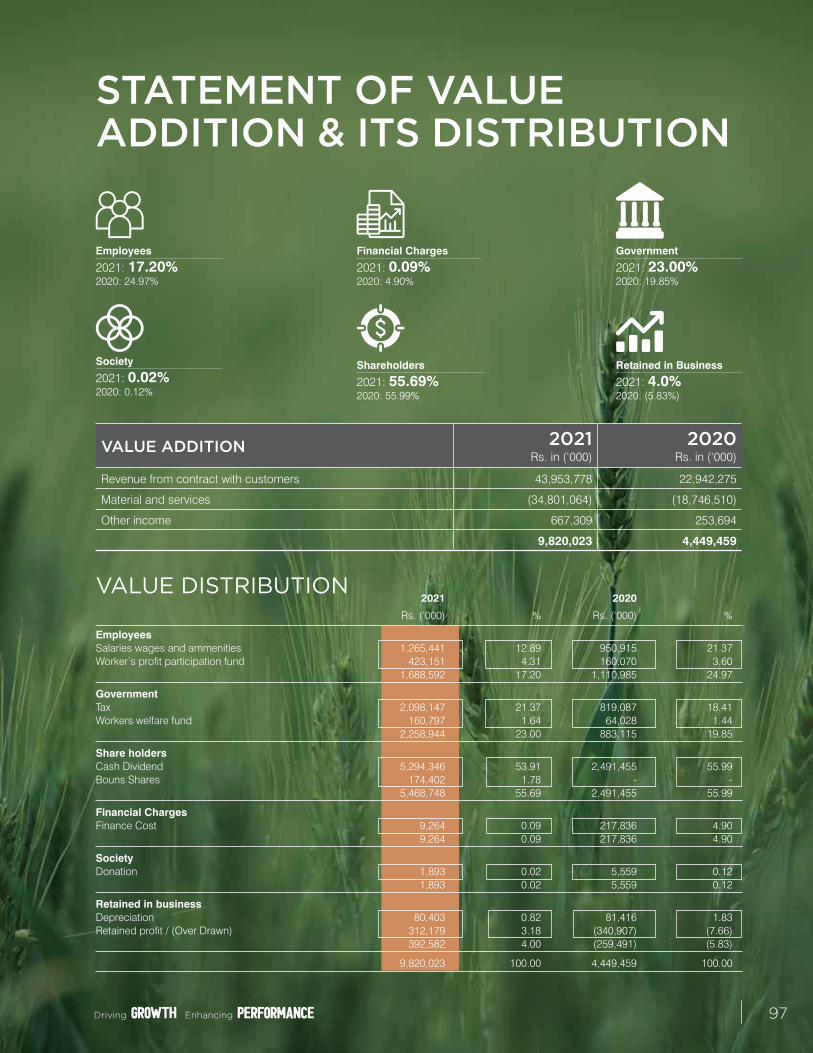
STATEMENT OF VALUE ADDITION & ITS DISTRIBUTION
2021 2020
Rs. (‘000) % Rs. (‘000) %
Employees Salaries wages and ammenities 1,265,441 12.89 950,915 21.37 Worker’s profit participation fund 423,151 4.31 160,070 3.60 1,688,592 17.20 1,110,985 24.97
Government Tax 2,098,147 21.37 819,087 18.41 Workers welfare fund 160,797 1.64 64,028 1.44 2,258,944 23.00 883,115 19.85
Share holders Cash Dividend 5,294,346 53.91 2,491,455 55.99 Bouns Shares 174,402 1.78 - - 5,468,748 55.69 2,491,455 55.99
Financial Charges Finance Cost 9,264 0.09 217,836 4.90 9,264 0.09 217,836 4.90
Society Donation 1,893 0.02 5,559 0.12 1,893 0.02 5,559 0.12
Retained in business Depreciation 80,403 0.82 81,416 1.83 Retained profit / (Over Drawn) 312,179 3.18 (340,907) (7.66) 392,582 4.00 (259,491) (5.83)
9,820,023 100.00 4,449,459 100.00
VALUE DISTRIBUTION
Employees
2021: 17.20%2020: 24.97%
Financial Charges
2021: 0.09%2020: 4.90%
Government
2021: 23.00%2020: 19.85%
Society
2021: 0.02%2020: 0.12%
Shareholders
2021: 55.69%2020: 55.99%
Retained in Business
2021: 4.0%2020: (5.83%)
VALUE ADDITION 2021Rs. in (‘000)
2020Rs. in (‘000)
Revenue from contract with customers 43,953,778 22,942,275
Material and services (34,801,064) (18,746,510)
Other income 667,309 253,694
9,820,023 4,449,459
Driving EnhancingGROWTH performance 97
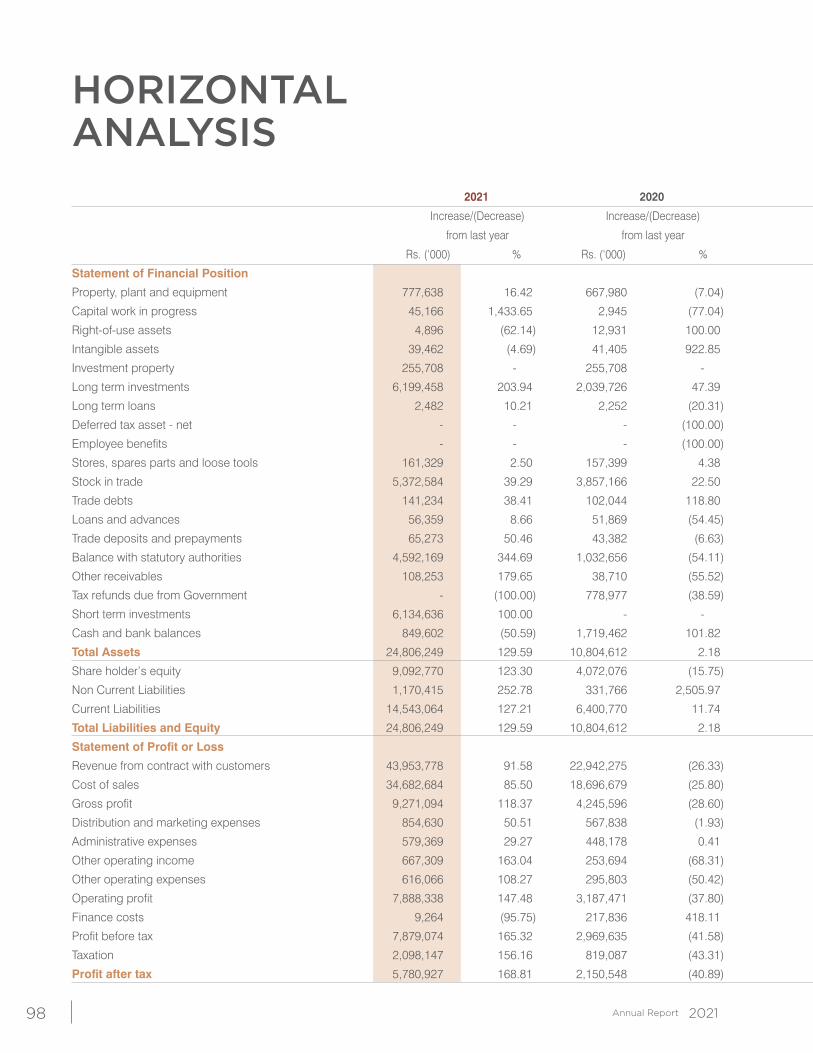
HORIZONTAL ANALYSIS 2021 2020 2019 2018 2017 2016
Increase/(Decrease) Increase/(Decrease) Increase/(Decrease) Increase/(Decrease) Increase/(Decrease) Increase/(Decrease)
from last year from last year from last year from last year from last year from last year
Rs. (‘000) % Rs. (‘000) % Rs. (‘000) % Rs. (‘000) % Rs. (‘000) % Rs. (‘000) %
Statement of Financial Position
Property, plant and equipment 777,638 16.42 667,980 (7.04) 718,559 2.54 700,763 (2.38) 717,873 60.2 448,130 (7.7)
Capital work in progress 45,166 1,433.65 2,945 (77.04) 12,827 (51.87) 26,648 282.10 6,974 (96.9) 225,134 7.4
Right-of-use assets 4,896 (62.14) 12,931 100.00 - - - - - - - -
Intangible assets 39,462 (4.69) 41,405 922.85 4,048 100.00 - (100.00) 897 (72.8) 3,295 (14.8)
Investment property 255,708 - 255,708 - 255,708 - 255,708 - 255,708 - 255,708 -
Long term investments 6,199,458 203.94 2,039,726 47.39 1,383,879 95.10 709,300 46.47 484,279 22.0 396,928 7.4
Long term loans 2,482 10.21 2,252 (20.31) 2,826 9.24 2,587 0.47 2,575 73.6 1,483 (22.4)
Deferred tax asset - net - - - (100.00) 12,797 100.00 - - - - - -
Employee benefits - - - (100.00) 219,519 100.00 - (100.00) 39,962 100.0 - (100.0)
Stores, spares parts and loose tools 161,329 2.50 157,399 4.38 150,799 14.88 131,266 10.84 118,431 5.8 111,913 4.5
Stock in trade 5,372,584 39.29 3,857,166 22.50 3,148,589 (24.26) 4,157,062 14.00 3,646,581 43.3 2,545,484 4.8
Trade debts 141,234 38.41 102,044 118.80 46,637 (28.88) 65,578 (66.25) 194,311 (32.1) 286,194 55.2
Loans and advances 56,359 8.66 51,869 (54.45) 113,876 191.76 39,031 (28.37) 54,488 (24.4) 72,071 4.9
Trade deposits and prepayments 65,273 50.46 43,382 (6.63) 46,461 185.35 16,282 (16.98) 19,611 (19.5) 24,366 7.1
Balance with statutory authorities 4,592,169 344.69 1,032,656 (54.11) 2,250,219 17.83 1,909,792 (24.41) 2,526,588 113.4 1,184,143 54.3
Other receivables 108,253 179.65 38,710 (55.52) 87,023 97.25 44,118 (54.63) 97,246 (7.2) 104,756 70.3
Tax refunds due from Government - (100.00) 778,977 (38.59) 1,268,429 74.85 725,454 290.27 185,886 (70.5) 629,148 (22.8)
Short term investments 6,134,636 100.00 - - - (100.00) 7,267,636 8.18 6,718,196 739.4 800,317 14.3
Cash and bank balances 849,602 (50.59) 1,719,462 101.82 851,988 63.80 520,140 (74.76) 2,061,003 (19.6) 2,562,252 136.8
Total Assets 24,806,249 129.59 10,804,612 2.18 10,574,184 (36.19) 16,571,365 (3.26) 17,130,609 77.5 9,651,322 25.2
Share holder’s equity 9,092,770 123.30 4,072,076 (15.75) 4,833,167 (14.53) 5,654,824 (1.65) 5,749,853 38.8 4,141,760 (12.1)
Non Current Liabilities 1,170,415 252.78 331,766 2,505.97 12,731 (86.50) 94,310 207.85 30,635 (70.0) 102,171 391.0
Current Liabilities 14,543,064 127.21 6,400,770 11.74 5,728,286 (47.07) 10,822,231 (4.65) 11,350,121 109.9 5,407,391 81.6
Total Liabilities and Equity 24,806,249 129.59 10,804,612 2.18 10,574,184 (36.19) 16,571,365 (3.26) 17,130,609 77.5 9,651,322 25.2
Statement of Profit or Loss
Revenue from contract with customers 43,953,778 91.58 22,942,275 (26.33) 31,144,057 (19.14) 38,517,147 28.33 30,013,921 77.5 16,913,832 (26.3)
Cost of sales 34,682,684 85.50 18,696,679 (25.80) 25,197,690 (16.24) 30,082,372 31.27 22,916,592 68.8 13,577,972 (26.8)
Gross profit 9,271,094 118.37 4,245,596 (28.60) 5,946,367 (29.50) 8,434,775 18.84 7,097,329 112.8 3,335,860 (24.1)
Distribution and marketing expenses 854,630 50.51 567,838 (1.93) 579,004 (8.06) 629,779 17.38 536,522 53.2 350,155 (32.0)
Administrative expenses 579,369 29.27 448,178 0.41 446,327 (9.33) 492,280 4.40 471,550 10.9 425,327 1.4
Other operating income 667,309 163.04 253,694 (68.31) 800,474 (23.51) 1,046,461 71.53 610,091 124.1 272,249 (32.6)
Other operating expenses 616,066 108.27 295,803 (50.42) 596,605 3.43 576,819 26.79 454,934 131.5 196,521 (25.7)
Operating profit 7,888,338 147.48 3,187,471 (37.80) 5,124,905 (34.15) 7,782,358 24.63 6,244,414 136.9 2,636,106 (26.8)
Finance costs 9,264 (95.75) 217,836 418.11 42,044 1,588.51 2,490 14.17 2,181 (85.7) 15,300 63.5
Profit before tax 7,879,074 165.32 2,969,635 (41.58) 5,082,861 (34.67) 7,779,868 24.63 6,242,233 138.2 2,620,806 (27.0)
Taxation 2,098,147 156.16 819,087 (43.31) 1,444,816 (40.92) 2,445,506 23.22 1,984,700 128.0 870,508 (28.1)
Profit after tax 5,780,927 168.81 2,150,548 (40.89) 3,638,045 (31.80) 5,334,362 25.29 4,257,533 143.2 1,750,298 (26.5)
Annual Report 202198
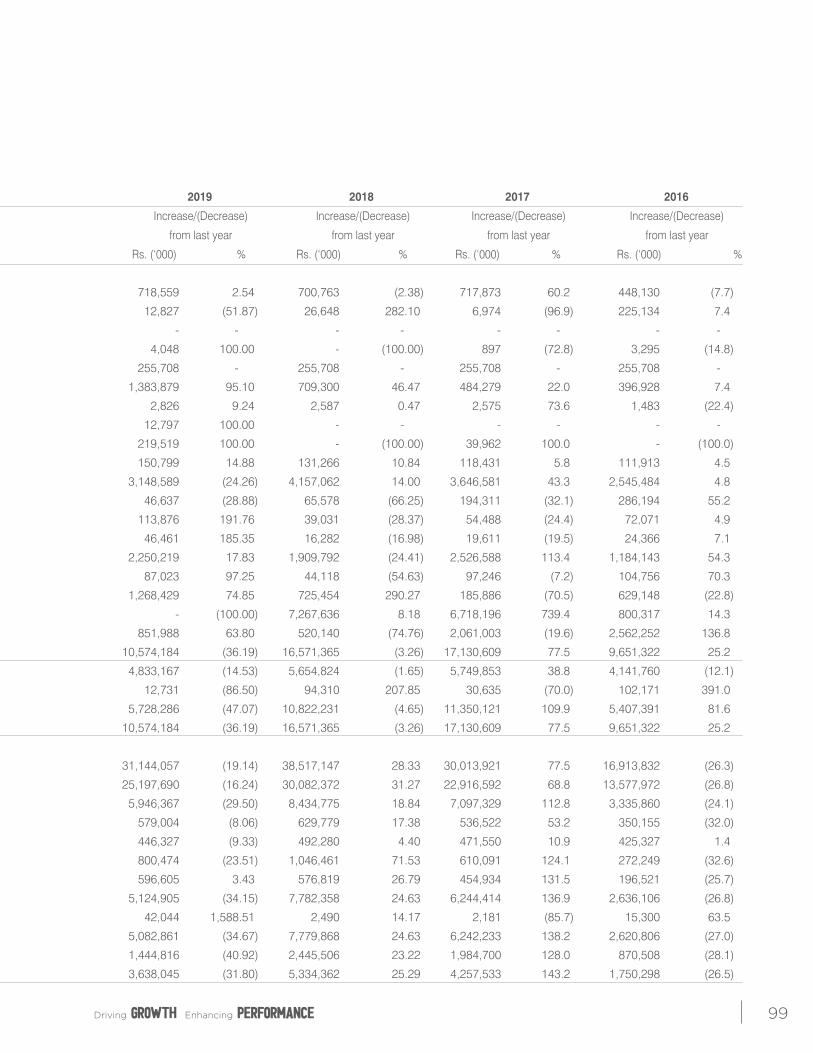
2021 2020 2019 2018 2017 2016
Increase/(Decrease) Increase/(Decrease) Increase/(Decrease) Increase/(Decrease) Increase/(Decrease) Increase/(Decrease)
from last year from last year from last year from last year from last year from last year
Rs. (‘000) % Rs. (‘000) % Rs. (‘000) % Rs. (‘000) % Rs. (‘000) % Rs. (‘000) %
Statement of Financial Position
Property, plant and equipment 777,638 16.42 667,980 (7.04) 718,559 2.54 700,763 (2.38) 717,873 60.2 448,130 (7.7)
Capital work in progress 45,166 1,433.65 2,945 (77.04) 12,827 (51.87) 26,648 282.10 6,974 (96.9) 225,134 7.4
Right-of-use assets 4,896 (62.14) 12,931 100.00 - - - - - - - -
Intangible assets 39,462 (4.69) 41,405 922.85 4,048 100.00 - (100.00) 897 (72.8) 3,295 (14.8)
Investment property 255,708 - 255,708 - 255,708 - 255,708 - 255,708 - 255,708 -
Long term investments 6,199,458 203.94 2,039,726 47.39 1,383,879 95.10 709,300 46.47 484,279 22.0 396,928 7.4
Long term loans 2,482 10.21 2,252 (20.31) 2,826 9.24 2,587 0.47 2,575 73.6 1,483 (22.4)
Deferred tax asset - net - - - (100.00) 12,797 100.00 - - - - - -
Employee benefits - - - (100.00) 219,519 100.00 - (100.00) 39,962 100.0 - (100.0)
Stores, spares parts and loose tools 161,329 2.50 157,399 4.38 150,799 14.88 131,266 10.84 118,431 5.8 111,913 4.5
Stock in trade 5,372,584 39.29 3,857,166 22.50 3,148,589 (24.26) 4,157,062 14.00 3,646,581 43.3 2,545,484 4.8
Trade debts 141,234 38.41 102,044 118.80 46,637 (28.88) 65,578 (66.25) 194,311 (32.1) 286,194 55.2
Loans and advances 56,359 8.66 51,869 (54.45) 113,876 191.76 39,031 (28.37) 54,488 (24.4) 72,071 4.9
Trade deposits and prepayments 65,273 50.46 43,382 (6.63) 46,461 185.35 16,282 (16.98) 19,611 (19.5) 24,366 7.1
Balance with statutory authorities 4,592,169 344.69 1,032,656 (54.11) 2,250,219 17.83 1,909,792 (24.41) 2,526,588 113.4 1,184,143 54.3
Other receivables 108,253 179.65 38,710 (55.52) 87,023 97.25 44,118 (54.63) 97,246 (7.2) 104,756 70.3
Tax refunds due from Government - (100.00) 778,977 (38.59) 1,268,429 74.85 725,454 290.27 185,886 (70.5) 629,148 (22.8)
Short term investments 6,134,636 100.00 - - - (100.00) 7,267,636 8.18 6,718,196 739.4 800,317 14.3
Cash and bank balances 849,602 (50.59) 1,719,462 101.82 851,988 63.80 520,140 (74.76) 2,061,003 (19.6) 2,562,252 136.8
Total Assets 24,806,249 129.59 10,804,612 2.18 10,574,184 (36.19) 16,571,365 (3.26) 17,130,609 77.5 9,651,322 25.2
Share holder’s equity 9,092,770 123.30 4,072,076 (15.75) 4,833,167 (14.53) 5,654,824 (1.65) 5,749,853 38.8 4,141,760 (12.1)
Non Current Liabilities 1,170,415 252.78 331,766 2,505.97 12,731 (86.50) 94,310 207.85 30,635 (70.0) 102,171 391.0
Current Liabilities 14,543,064 127.21 6,400,770 11.74 5,728,286 (47.07) 10,822,231 (4.65) 11,350,121 109.9 5,407,391 81.6
Total Liabilities and Equity 24,806,249 129.59 10,804,612 2.18 10,574,184 (36.19) 16,571,365 (3.26) 17,130,609 77.5 9,651,322 25.2
Statement of Profit or Loss
Revenue from contract with customers 43,953,778 91.58 22,942,275 (26.33) 31,144,057 (19.14) 38,517,147 28.33 30,013,921 77.5 16,913,832 (26.3)
Cost of sales 34,682,684 85.50 18,696,679 (25.80) 25,197,690 (16.24) 30,082,372 31.27 22,916,592 68.8 13,577,972 (26.8)
Gross profit 9,271,094 118.37 4,245,596 (28.60) 5,946,367 (29.50) 8,434,775 18.84 7,097,329 112.8 3,335,860 (24.1)
Distribution and marketing expenses 854,630 50.51 567,838 (1.93) 579,004 (8.06) 629,779 17.38 536,522 53.2 350,155 (32.0)
Administrative expenses 579,369 29.27 448,178 0.41 446,327 (9.33) 492,280 4.40 471,550 10.9 425,327 1.4
Other operating income 667,309 163.04 253,694 (68.31) 800,474 (23.51) 1,046,461 71.53 610,091 124.1 272,249 (32.6)
Other operating expenses 616,066 108.27 295,803 (50.42) 596,605 3.43 576,819 26.79 454,934 131.5 196,521 (25.7)
Operating profit 7,888,338 147.48 3,187,471 (37.80) 5,124,905 (34.15) 7,782,358 24.63 6,244,414 136.9 2,636,106 (26.8)
Finance costs 9,264 (95.75) 217,836 418.11 42,044 1,588.51 2,490 14.17 2,181 (85.7) 15,300 63.5
Profit before tax 7,879,074 165.32 2,969,635 (41.58) 5,082,861 (34.67) 7,779,868 24.63 6,242,233 138.2 2,620,806 (27.0)
Taxation 2,098,147 156.16 819,087 (43.31) 1,444,816 (40.92) 2,445,506 23.22 1,984,700 128.0 870,508 (28.1)
Profit after tax 5,780,927 168.81 2,150,548 (40.89) 3,638,045 (31.80) 5,334,362 25.29 4,257,533 143.2 1,750,298 (26.5)
Driving EnhancingGROWTH performance 99
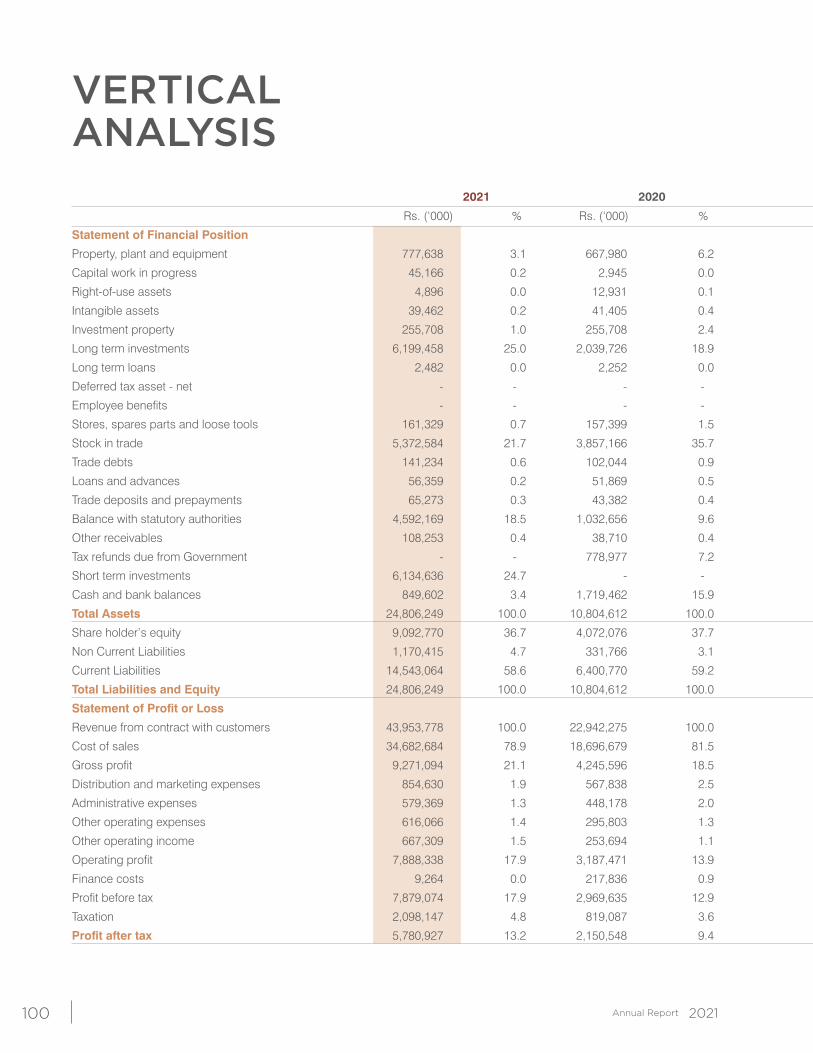
VERTICAL ANALYSIS 2021 2020 2019 2018 2017 2016
Rs. (‘000) % Rs. (‘000) % Rs. (‘000) % Rs. (‘000) % Rs. (‘000) % Rs. (‘000) %
Statement of Financial Position
Property, plant and equipment 777,638 3.1 667,980 6.2 718,559 6.8 700,763 4.2 717,873 4.2 448,130 4.6
Capital work in progress 45,166 0.2 2,945 0.0 12,827 0.1 26,648 0.2 6,974 0.0 225,134 2.3
Right-of-use assets 4,896 0.0 12,931 0.1 - - - - - - - -
Intangible assets 39,462 0.2 41,405 0.4 4,048 0.0 - - 897 0.0 3,295 0.0
Investment property 255,708 1.0 255,708 2.4 255,708 2.4 255,708 1.5 255,708 1.5 255,708 2.6
Long term investments 6,199,458 25.0 2,039,726 18.9 1,383,879 13.1 709,300 4.3 484,279 2.8 396,928 4.1
Long term loans 2,482 0.0 2,252 0.0 2,826 0.0 2,587 0.0 2,575 0.0 1,483 0.0
Deferred tax asset - net - - - - 12,797 0.1 - - - - - -
Employee benefits - - - - 219,519 2.1 - - 39,962 0.2 - -
Stores, spares parts and loose tools 161,329 0.7 157,399 1.5 150,799 1.4 131,266 0.8 118,431 0.7 111,913 1.2
Stock in trade 5,372,584 21.7 3,857,166 35.7 3,148,589 29.8 4,157,062 25.1 3,646,581 21.3 2,545,484 26.4
Trade debts 141,234 0.6 102,044 0.9 46,637 0.4 65,578 0.4 194,311 1.1 286,194 3.0
Loans and advances 56,359 0.2 51,869 0.5 113,876 1.1 39,031 0.2 54,488 0.3 72,071 0.7
Trade deposits and prepayments 65,273 0.3 43,382 0.4 46,461 0.4 16,282 0.1 19,611 0.1 24,366 0.3
Balance with statutory authorities 4,592,169 18.5 1,032,656 9.6 2,250,219 21.3 1,909,792 11.5 2,526,588 14.7 1,184,143 12.3
Other receivables 108,253 0.4 38,710 0.4 87,023 0.8 44,118 0.3 97,246 0.6 104,756 1.1
Tax refunds due from Government - - 778,977 7.2 1,268,429 12.0 725,454 4.4 185,886 1.1 629,148 6.5
Short term investments 6,134,636 24.7 - - - - 7,267,636 43.9 6,718,196 39.2 800,317 8.3
Cash and bank balances 849,602 3.4 1,719,462 15.9 851,988 8.1 520,140 3.1 2,061,003 12.0 2,562,252 26.5
Total Assets 24,806,249 100.0 10,804,612 100.0 10,574,184 100.0 16,571,365 100.0 17,130,609 100.0 9,651,322 100.0
Share holder’s equity 9,092,770 36.7 4,072,076 37.7 4,833,167 45.7 5,654,824 34.1 5,749,853 33.6 4,141,760 42.9
Non Current Liabilities 1,170,415 4.7 331,766 3.1 12,731 0.1 94,310 0.6 30,635 0.2 102,171 1.1
Current Liabilities 14,543,064 58.6 6,400,770 59.2 5,728,286 54.2 10,822,231 65.3 11,350,121 66.3 5,407,391 56.0
Total Liabilities and Equity 24,806,249 100.0 10,804,612 100.0 10,574,184 100.0 16,571,365 100.0 17,130,609 100.0 9,651,322 100.0
Statement of Profit or Loss
Revenue from contract with customers 43,953,778 100.0 22,942,275 100.0 31,144,057 100.0 38,517,147 100.0 30,013,921 100.0 16,913,832 100.0
Cost of sales 34,682,684 78.9 18,696,679 81.5 25,197,690 80.9 30,082,372 78.1 22,916,592 76.4 13,577,972 80.3
Gross profit 9,271,094 21.1 4,245,596 18.5 5,946,367 19.1 8,434,775 21.9 7,097,329 23.6 3,335,860 19.7
Distribution and marketing expenses 854,630 1.9 567,838 2.5 579,004 1.9 629,779 1.6 536,522 1.8 350,155 2.1
Administrative expenses 579,369 1.3 448,178 2.0 446,327 1.4 492,280 1.3 471,550 1.6 425,327 2.5
Other operating expenses 616,066 1.4 295,803 1.3 596,605 1.9 576,819 1.5 454,934 1.5 196,521 1.2
Other operating income 667,309 1.5 253,694 1.1 800,474 2.6 1,046,461 2.7 610,091 2.0 272,249 1.6
Operating profit 7,888,338 17.9 3,187,471 13.9 5,124,905 16.5 7,782,358 20.2 6,244,414 20.8 2,636,106 15.6
Finance costs 9,264 0.0 217,836 0.9 42,044 0.1 2,490 0.0 2,181 0.0 15,300 0.1
Profit before tax 7,879,074 17.9 2,969,635 12.9 5,082,861 16.3 7,779,868 20.2 6,242,233 20.8 2,620,806 15.5
Taxation 2,098,147 4.8 819,087 3.6 1,444,816 4.6 2,445,506 6.3 1,984,700 6.6 870,508 5.1
Profit after tax 5,780,927 13.2 2,150,548 9.4 3,638,045 11.7 5,334,362 13.8 4,257,533 14.2 1,750,298 10.3
Annual Report 2021100
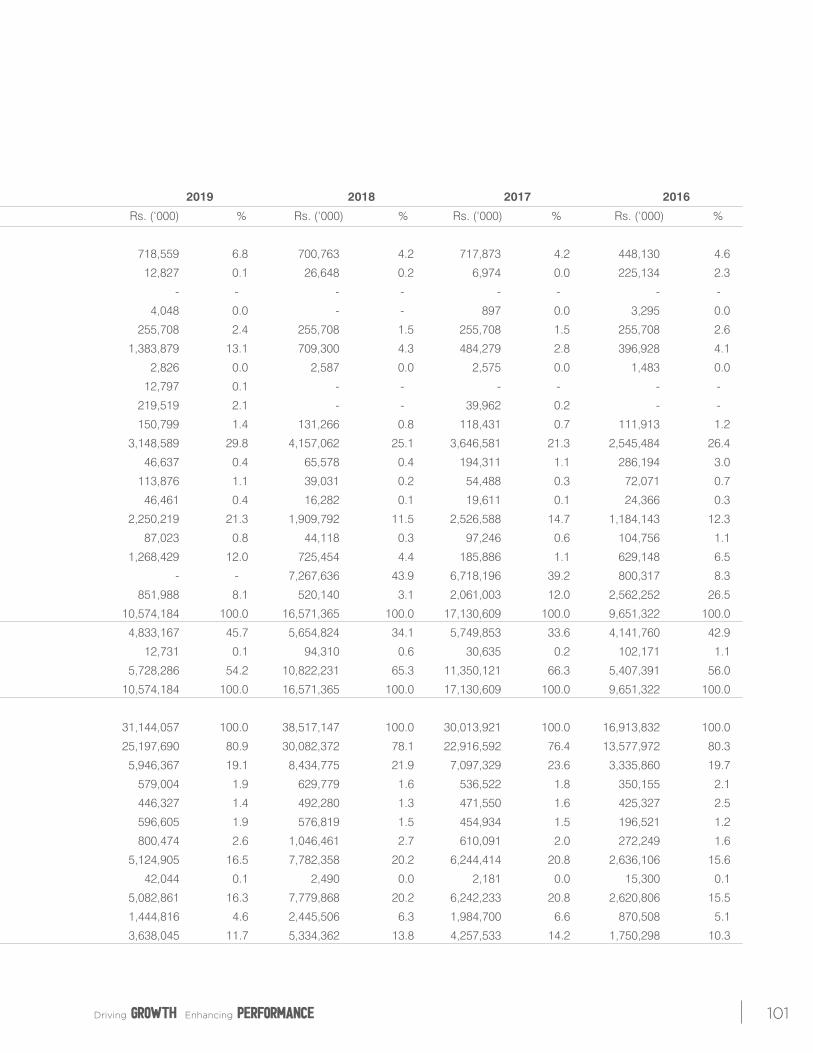
2021 2020 2019 2018 2017 2016
Rs. (‘000) % Rs. (‘000) % Rs. (‘000) % Rs. (‘000) % Rs. (‘000) % Rs. (‘000) %
Statement of Financial Position
Property, plant and equipment 777,638 3.1 667,980 6.2 718,559 6.8 700,763 4.2 717,873 4.2 448,130 4.6
Capital work in progress 45,166 0.2 2,945 0.0 12,827 0.1 26,648 0.2 6,974 0.0 225,134 2.3
Right-of-use assets 4,896 0.0 12,931 0.1 - - - - - - - -
Intangible assets 39,462 0.2 41,405 0.4 4,048 0.0 - - 897 0.0 3,295 0.0
Investment property 255,708 1.0 255,708 2.4 255,708 2.4 255,708 1.5 255,708 1.5 255,708 2.6
Long term investments 6,199,458 25.0 2,039,726 18.9 1,383,879 13.1 709,300 4.3 484,279 2.8 396,928 4.1
Long term loans 2,482 0.0 2,252 0.0 2,826 0.0 2,587 0.0 2,575 0.0 1,483 0.0
Deferred tax asset - net - - - - 12,797 0.1 - - - - - -
Employee benefits - - - - 219,519 2.1 - - 39,962 0.2 - -
Stores, spares parts and loose tools 161,329 0.7 157,399 1.5 150,799 1.4 131,266 0.8 118,431 0.7 111,913 1.2
Stock in trade 5,372,584 21.7 3,857,166 35.7 3,148,589 29.8 4,157,062 25.1 3,646,581 21.3 2,545,484 26.4
Trade debts 141,234 0.6 102,044 0.9 46,637 0.4 65,578 0.4 194,311 1.1 286,194 3.0
Loans and advances 56,359 0.2 51,869 0.5 113,876 1.1 39,031 0.2 54,488 0.3 72,071 0.7
Trade deposits and prepayments 65,273 0.3 43,382 0.4 46,461 0.4 16,282 0.1 19,611 0.1 24,366 0.3
Balance with statutory authorities 4,592,169 18.5 1,032,656 9.6 2,250,219 21.3 1,909,792 11.5 2,526,588 14.7 1,184,143 12.3
Other receivables 108,253 0.4 38,710 0.4 87,023 0.8 44,118 0.3 97,246 0.6 104,756 1.1
Tax refunds due from Government - - 778,977 7.2 1,268,429 12.0 725,454 4.4 185,886 1.1 629,148 6.5
Short term investments 6,134,636 24.7 - - - - 7,267,636 43.9 6,718,196 39.2 800,317 8.3
Cash and bank balances 849,602 3.4 1,719,462 15.9 851,988 8.1 520,140 3.1 2,061,003 12.0 2,562,252 26.5
Total Assets 24,806,249 100.0 10,804,612 100.0 10,574,184 100.0 16,571,365 100.0 17,130,609 100.0 9,651,322 100.0
Share holder’s equity 9,092,770 36.7 4,072,076 37.7 4,833,167 45.7 5,654,824 34.1 5,749,853 33.6 4,141,760 42.9
Non Current Liabilities 1,170,415 4.7 331,766 3.1 12,731 0.1 94,310 0.6 30,635 0.2 102,171 1.1
Current Liabilities 14,543,064 58.6 6,400,770 59.2 5,728,286 54.2 10,822,231 65.3 11,350,121 66.3 5,407,391 56.0
Total Liabilities and Equity 24,806,249 100.0 10,804,612 100.0 10,574,184 100.0 16,571,365 100.0 17,130,609 100.0 9,651,322 100.0
Statement of Profit or Loss
Revenue from contract with customers 43,953,778 100.0 22,942,275 100.0 31,144,057 100.0 38,517,147 100.0 30,013,921 100.0 16,913,832 100.0
Cost of sales 34,682,684 78.9 18,696,679 81.5 25,197,690 80.9 30,082,372 78.1 22,916,592 76.4 13,577,972 80.3
Gross profit 9,271,094 21.1 4,245,596 18.5 5,946,367 19.1 8,434,775 21.9 7,097,329 23.6 3,335,860 19.7
Distribution and marketing expenses 854,630 1.9 567,838 2.5 579,004 1.9 629,779 1.6 536,522 1.8 350,155 2.1
Administrative expenses 579,369 1.3 448,178 2.0 446,327 1.4 492,280 1.3 471,550 1.6 425,327 2.5
Other operating expenses 616,066 1.4 295,803 1.3 596,605 1.9 576,819 1.5 454,934 1.5 196,521 1.2
Other operating income 667,309 1.5 253,694 1.1 800,474 2.6 1,046,461 2.7 610,091 2.0 272,249 1.6
Operating profit 7,888,338 17.9 3,187,471 13.9 5,124,905 16.5 7,782,358 20.2 6,244,414 20.8 2,636,106 15.6
Finance costs 9,264 0.0 217,836 0.9 42,044 0.1 2,490 0.0 2,181 0.0 15,300 0.1
Profit before tax 7,879,074 17.9 2,969,635 12.9 5,082,861 16.3 7,779,868 20.2 6,242,233 20.8 2,620,806 15.5
Taxation 2,098,147 4.8 819,087 3.6 1,444,816 4.6 2,445,506 6.3 1,984,700 6.6 870,508 5.1
Profit after tax 5,780,927 13.2 2,150,548 9.4 3,638,045 11.7 5,334,362 13.8 4,257,533 14.2 1,750,298 10.3
Driving EnhancingGROWTH performance 101
COMMENTARY ON FINANCIAL RESULTSPROFITABILITYGross profit margin has increased by 258 basis points owing to increase in sales volume, higher HHP model sales and effective management of the production costs.
Increase in operating profit is due to increase in sales volumes and income from short term investments and dividend income.
Resultantly, profit before tax was higher as compared to last year. Finance cost has decreased due to significant increase in liquidity. During the year the Company had surplus funds and did not require any short term borrowing to meet its working capital requirements.
LIQUIDITYThe company’s short-term liquidity remained healthy as current ratio remained above one which is a healthy sign. Net operating cycle has decreased by 17 days due to the effective inventory management despite higher activity level.However, Sales tax refunds due from Government has increased during the year and stands at Rs. 4.5 billion at year end due to delay in sales tax refunds. With higher activity level, accumulation of sales tax may create hurdles in the operations of the Company in future.
Overall, the balance sheet remains healthy and no short-term or long-term issues are envisaged.
SOLVENCYThe company relied completely on equity to finance its operations and does not hold any long-term loans except for State Bank of Pakistan (SBP) long term financing facilities of
• Refinance Scheme for Payment of Wages and Salaries to Workers and Employees of Business Concerns and;
• renewable energy finance scheme
These loans carry nominal interest rate which will not impact profitability significantly.
INVESTOREPS increased because of increase in net profits. The Company has already disbursed interim payout of Rs.50 per share cash dividend and 12.5% bonus shares. The market price of the share took a hit last year due to the COVID-19 but has recovered quickly after that which showed strong confidence of investors in the Company’s Fundamentals.
Annual Report 2021102
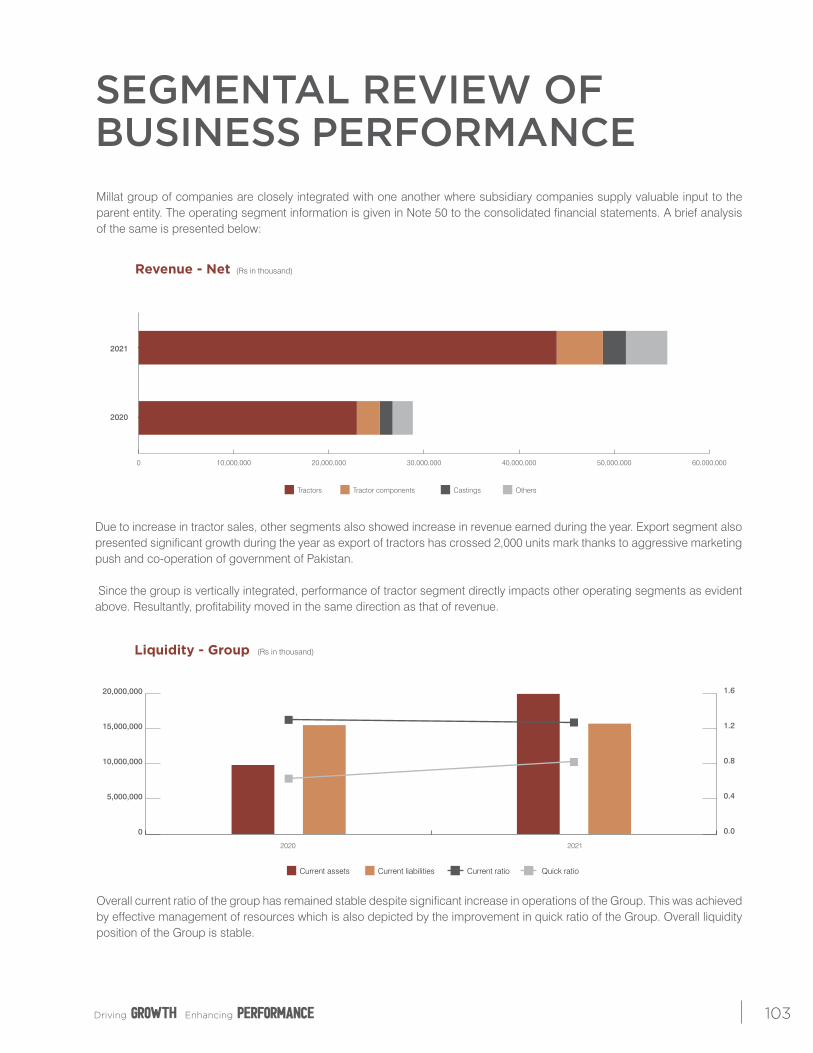
SEGMENTAL REVIEW OF BUSINESS PERFORMANCEMillat group of companies are closely integrated with one another where subsidiary companies supply valuable input to the parent entity. The operating segment information is given in Note 50 to the consolidated financial statements. A brief analysis of the same is presented below:
Due to increase in tractor sales, other segments also showed increase in revenue earned during the year. Export segment also presented significant growth during the year as export of tractors has crossed 2,000 units mark thanks to aggressive marketing push and co-operation of government of Pakistan.
Since the group is vertically integrated, performance of tractor segment directly impacts other operating segments as evident above. Resultantly, profitability moved in the same direction as that of revenue.
Overall current ratio of the group has remained stable despite significant increase in operations of the Group. This was achieved by effective management of resources which is also depicted by the improvement in quick ratio of the Group. Overall liquidity position of the Group is stable.
Revenue - Net (Rs in thousand)
Tractors Tractor components Castings Others
2021
2020
0 10,000,000 20,000,000 30,000,000 40,000,000 50,000,000 60,000,000
Liquidity - Group (Rs in thousand)
0
5,000,000
10,000,000
15,000,000
20,000,000
Current assets Current liabilities Current ratio Quick ratio
0.0
0.4
0.8
1.2
1.6
20212020
Driving EnhancingGROWTH performance 103
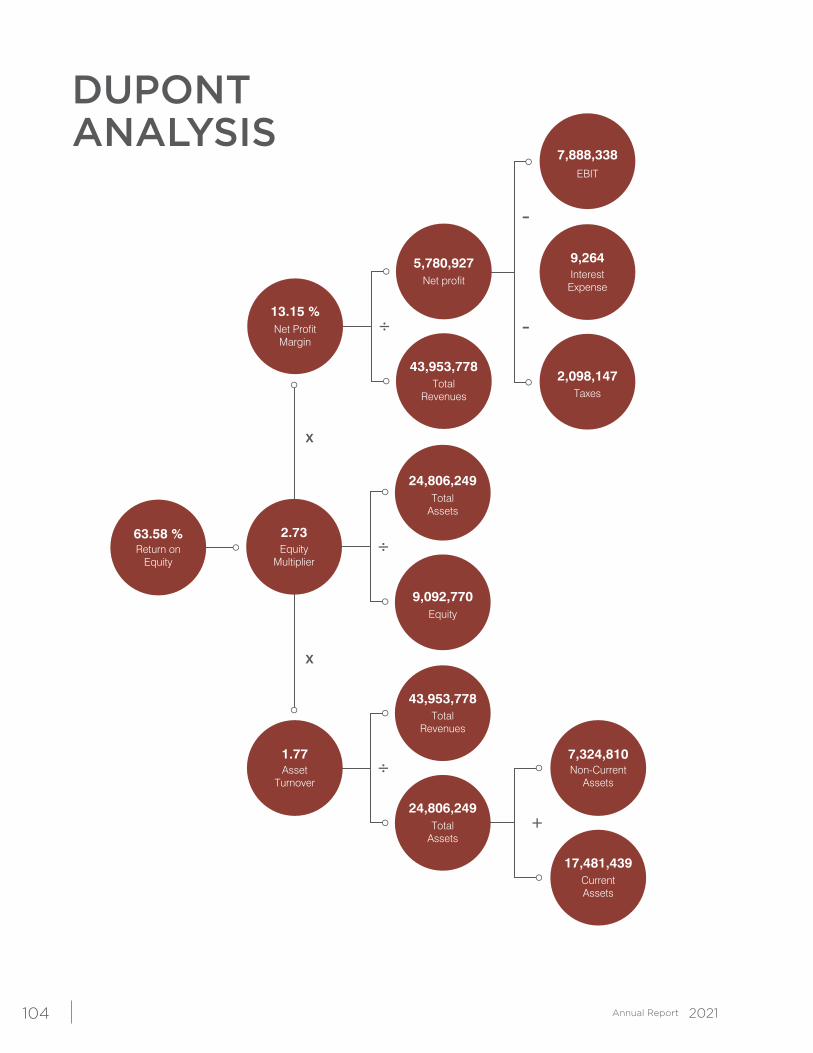
DUPONT ANALYSIS
Return onEquity
63.58 %
AssetTurnover
1.77
TotalRevenues
43,953,778
TotalAssets
24,806,249
CurrentAssets
17,481,439
Non-CurrentAssets
7,324,810
x
x
÷
TotalAssets
24,806,249
Equity
9,092,770
÷
+
Net profit
5,780,927
TotalRevenues
43,953,778
÷
InterestExpense
9,264
EBIT
7,888,338
Taxes
2,098,147
-
-
EquityMultiplier
2.73
Net ProfitMargin
13.15 %
Annual Report 2021104
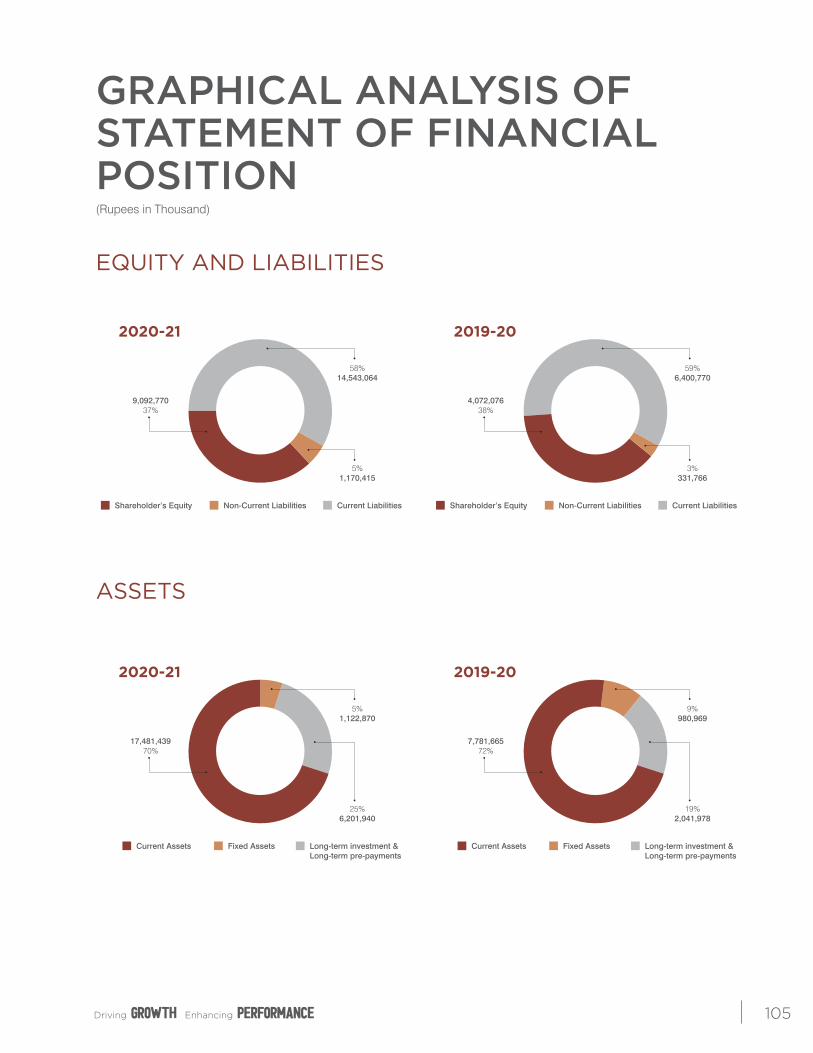
GRAPHICAL ANALYSIS OFSTATEMENT OF FINANCIAL POSITION
EQUITY AND LIABILITIES
ASSETS
(Rupees in Thousand)
2019-20
Shareholder’s Equity Non-Current Liabilities Current Liabilities
4,072,07638%
59%6,400,770
3%331,766
2019-20
7,781,66572%
9%980,969
19%2,041,978
Current Assets Fixed Assets Long-term investment &Long-term pre-payments
2020-21
Current Assets Fixed Assets Long-term investment &Long-term pre-payments
17,481,43970%
5%1,122,870
25%6,201,940
2020-21
Shareholder’s Equity Non-Current Liabilities Current Liabilities
9,092,77037%
58%14,543,064
5%1,170,415
Driving EnhancingGROWTH performance 105

107
CORPORATE COMPLIANCEAND FINANCIAL STATEMENTS
108
INDEPENDENTAUDITOR’S REVIEW REPORT TO THE MEMBERS OF MILLAT TRACTORS LIMITEDReview Report on the Statement of Compliance Contained in Listed Companies (Code Of Corporate Governance) Regulations, 2019
We have reviewed the enclosed Statement of Compliance with the Listed Companies (Code of Corporate Governance) Regulations, 2019 (the Regulations) prepared by the Board of Directors of Millat Tractors Limited (the Company) for the year ended June 30, 2021 in accordance with the requirements of regulation 36 of the Regulations.
The responsibility for compliance with the Regulations is that of the Board of Directors of the Company. Our responsibility is to review whether the Statement of Compliance reflects the status of the Company’s compliance with the provisions of the Regulations and report if it does not and to highlight any non-compliance with the requirements of the Regulations. A review is limited primarily to inquiries of the Company’s personnel and review of various documents prepared by the Company to comply with the Regulations.
As a part of our audit of the financial statements we are required to obtain an understanding of the accounting and internal control systems sufficient to plan the audit and develop an effective audit approach. We are not required to consider whether the Board of Directors’ statement on internal control covers all risks and controls or to form an opinion on the effectiveness of such internal controls, the Company’s corporate governance procedures and risks.
The Regulations require the Company to place before the Audit Committee, and upon recommendation of the Audit Committee, place before the Board of Directors for their review and approval, its related party transactions. We are only required and have ensured compliance of this requirement to the extent of the approval of the related party transactions by the Board of Directors upon recommendation of the Audit Committee.
Based on our review, nothing has come to our attention which causes us to believe that the Statement of Compliance does not appropriately reflect the Company’s compliance, in all material respects, with the requirements contained in the Regulations as applicable to the Company for the year ended June 30, 2021.
A. F. Ferguson & Co Chartered AccountantsLahore Date: September 30, 2021
A.F. FERGUSON & CO., Chartered Accountants, a member firm of the PwC network23-C, Aziz Avenue, Canal Bank, Gulberg-V, P.O.Box 39, Lahore-54660, PakistanTel: +92 (42) 3571 5868-71 / 3577 5747-50; Fax: +92 (42) 3577 5754 www.pwc.com/pk
KARACHI LAHORE ISLAMABAD
109
STATEMENT OF COMPLIANCE WITH LISTED COMPANIES (CODE OF CORPORATEGOVERNANCE) REGULATIONS, 2019
The Company has complied with the requirements of the Regulations in the following manner:
1. The total number of directors are eight as per the following:
a. Male: seven b. Female: one
2. The composition of board is as follows:
Category Names
i) Independent Directors Mr. Saad Iqbal Mrs. Ambreen Waheed
(Female Director)
ii) Non-executive Directors Mr. Sikandar Mustafa Khan Mr. Laeeq Uddin Ansari Mian Muhammad Saleem *Mr. Ahsan Imran Shaikh
iii) Executive Directors Syed Muhammad Irfan Aqueel, CEO Mr. Sohail Bashir Rana
*the member replaced Mr. Latif Khalid Hashmi in March, 2021.
3. The directors have confirmed that none of them is serving as a director on more than seven listed companies, including this company; (excluding the listed subsidiaries of listed holding companies)
4. The company has prepared a Code of Conduct and has ensured that appropriate steps have been taken to disseminate it throughout the company along with its supporting policies and procedures;
5. The board has developed a vision/mission statement, overall corporate strategy and significant policies of the company. The Board Has ensured that complete record of particulars of significant policies along with the date of approval or updating is maintained by the company;
6. All the powers of the Board have been duly exercised and decisions on relevant matters have been taken by Board/shareholders as empowered by the relevant provisions of the Act and these Regulations;
7. The meetings of the Board were presided over by the Chairman and, in his absence, by a director elected by the Board for this purpose. The board has complied with the requirements of Act and Regulations with respect to frequency, recording and circulating minutes of meeting of Board;
8. The Board have a formal policy and transparent procedures for remuneration of directors in accordance with the Act and these Regulations;
9. No Directors’ Training program was arranged by the Board during the year. However, all directors have either acquired the prescribed certification in previous years or meet exemption criteria as contained in these regulations except Mr. Ahsan Imran Shaikh who was appointed in March, 2021;
10. The Board has approved appointment of chief financial officer, company secretary and head of internal audit, including their remuneration and terms and conditions of employment and complied with relevant requirements of the Regulations;
11. Chief financial officer and chief executive officer duly endorsed the financial statements before approval of the Board;
12. The Board has formed committees comprising of members given below:
a) Audit Committee
Mr. Saad Iqbal, Chairman- Independent Director Mr. Laeeq Uddin Ansari, Member *Mian Muhammad Saleem, Member Mrs. Ambreen Waheed, Member
b) HR and Remuneration Committee
Mr. Saad Iqbal, Chairman- Independent Director Mr. Laeeq Uddin Ansari, Member Mian Muhammad Saleem, Member Mrs. Ambreen Waheed, Member Syed Muhammad Irfan Aqueel, Member *the member replaced Mr. Latif Khalid Hashmi in
March, 2021.
13. The terms of reference of the aforesaid committees have been formed, documented and advised to the committee for compliance;
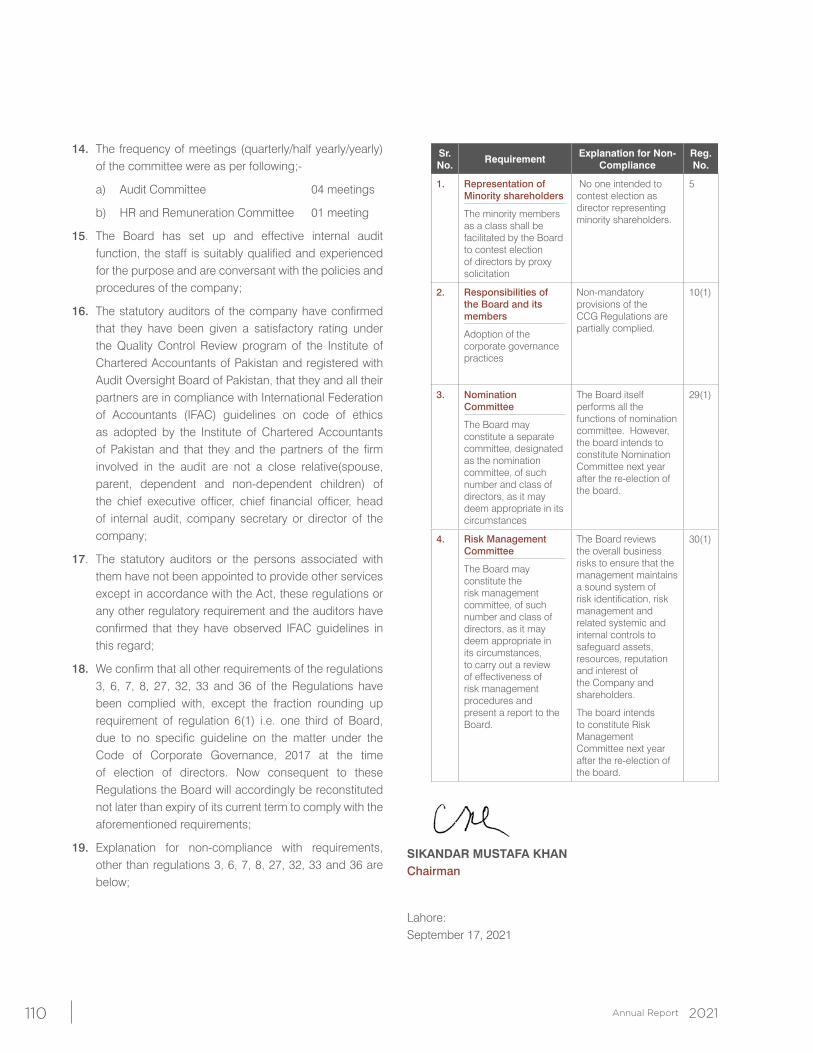
110
14. The frequency of meetings (quarterly/half yearly/yearly) of the committee were as per following;-
a) Audit Committee 04 meetings
b) HR and Remuneration Committee 01 meeting
15. The Board has set up and effective internal audit function, the staff is suitably qualified and experienced for the purpose and are conversant with the policies and procedures of the company;
16. The statutory auditors of the company have confirmed that they have been given a satisfactory rating under the Quality Control Review program of the Institute of Chartered Accountants of Pakistan and registered with Audit Oversight Board of Pakistan, that they and all their partners are in compliance with International Federation of Accountants (IFAC) guidelines on code of ethics as adopted by the Institute of Chartered Accountants of Pakistan and that they and the partners of the firm involved in the audit are not a close relative(spouse, parent, dependent and non-dependent children) of the chief executive officer, chief financial officer, head of internal audit, company secretary or director of the company;
17. The statutory auditors or the persons associated with them have not been appointed to provide other services except in accordance with the Act, these regulations or any other regulatory requirement and the auditors have confirmed that they have observed IFAC guidelines in this regard;
18. We confirm that all other requirements of the regulations 3, 6, 7, 8, 27, 32, 33 and 36 of the Regulations have been complied with, except the fraction rounding up requirement of regulation 6(1) i.e. one third of Board, due to no specific guideline on the matter under the Code of Corporate Governance, 2017 at the time of election of directors. Now consequent to these Regulations the Board will accordingly be reconstituted not later than expiry of its current term to comply with the aforementioned requirements;
19. Explanation for non-compliance with requirements, other than regulations 3, 6, 7, 8, 27, 32, 33 and 36 are below;
Sr. No. Requirement Explanation for Non-
ComplianceReg. No.
1. Representation of Minority shareholders
The minority members as a class shall be facilitated by the Board to contest election of directors by proxy solicitation
No one intended to contest election as director representing minority shareholders.
5
2. Responsibilities of the Board and its members
Adoption of the corporate governance practices
Non-mandatory provisions of the CCG Regulations are partially complied.
10(1)
3. Nomination Committee
The Board may constitute a separate committee, designated as the nomination committee, of such number and class of directors, as it may deem appropriate in its circumstances
The Board itself performs all the functions of nomination committee. However, the board intends to constitute Nomination Committee next year after the re-election of the board.
29(1)
4. Risk Management Committee
The Board may constitute the risk management committee, of such number and class of directors, as it may deem appropriate in its circumstances, to carry out a review of effectiveness of risk management procedures and present a report to the Board.
The Board reviews the overall business risks to ensure that the management maintains a sound system of risk identification, risk management and related systemic and internal controls to safeguard assets, resources, reputation and interest of the Company and shareholders.
The board intends to constitute Risk Management Committee next year after the re-election of the board.
30(1)
SIKANDAR MUSTAFA KHANChairman
Lahore: September 17, 2021
111
Opinion
We have audited the annexed financial statements of Millat Tractors Limited (the Company), which comprise the statement of financial position as at June 30, 2021, and the statement of profit or loss and other comprehensive income, the statement of changes in equity, the statement of cash flows for the year then ended, and notes to the financial statements, including a summary of significant accounting policies and other explanatory information, and we state that we have obtained all the information and explanations which, to the best of our knowledge and belief, were necessary for the purposes of the audit.
In our opinion and to the best of our information and according to the explanations given to us, the statement of financial position, statement of profit or loss and other comprehensive income, the statement of changes in equity and the statement of cash flows together with the notes forming part thereof conform with the accounting and reporting standards as applicable in Pakistan and give the information required by the Companies Act, 2017 (XIX of 2017), in the manner so required and respectively give a true and fair view of the state of the Company’s affairs as at June 30, 2021 and of the profit and other comprehensive income, the changes in equity and its cash flows for the year then ended.
Basis for Opinion
We conducted our audit in accordance with International Standards on Auditing (ISAs) as applicable in Pakistan. Our responsibilities under those standards are further described in the Auditor’s Responsibilities for the Audit of the Financial Statements section of our report. We are independent of the Company in accordance with the International Ethics Standards Board for Accountants’ Code of Ethics for Professional Accountants as adopted by the Institute of Chartered Accountants of Pakistan (the Code) and we have fulfilled our other ethical responsibilities in accordance with the Code. We believe that the audit evidence we have obtained is sufficient and appropriate to provide a basis for our opinion.
Key Audit Matters
Key audit matters are those matters that, in our professional judgment, were of most significance in our audit of the financial statements of the current period. These matters were addressed in the context of our audit of the financial statements as a whole, and in forming our opinion thereon, and we do not provide a separate opinion on these matters.
Following are the Key audit matters:
INDEPENDENTAUDITOR’S REPORT To the members of Millat Tractors LimitedReport on the Audit of the Financial Statements
A.F. FERGUSON & CO., Chartered Accountants, a member firm of the PwC network23-C, Aziz Avenue, Canal Bank, Gulberg-V, P.O.Box 39, Lahore-54660, PakistanTel: +92 (42) 3571 5868-71 / 3577 5747-50; Fax: +92 (42) 3577 5754 www.pwc.com/pk
KARACHI LAHORE ISLAMABAD
Sr. # Key audit matter How the matter was addressed in our audit
1 Revenue recognition
(Refer note 4.14 and note 33 to the annexed financial statements)
The Company is principally engaged in assembling and manufacturing of agricultural tractors, implements and multi-application products.
Revenue from sale of tractors is recognized when the performance obligation is satisfied by transferring control to customer i.e. upon delivery and acknowledgement from the customer. The Company recognizes revenue from the sales of own manufactured goods measured net of discounts and commissions.
Our audit procedures in relation to the matter, amongst others, included the following:
• evaluated management controls over revenue and checked their validation;
• performed verification of sales with underlying documentation including dispatch documents and sales invoices;
• tested on a sample basis, specific revenue transactions recorded before and after the reporting date with underlying documentation to assess whether revenue has been recognized in the correct period;
• verified that sales prices are approved by the appropriate authority;
112
Information Other than the Separate and Consolidated Financial Statements and Auditor’s Reports Thereon
Management is responsible for the other information. The other information comprises the information included in the annual report, but does not include the separate and consolidated financial statements and our auditor’s reports thereon.
Our opinion on the financial statements does not cover the other information and we do not express any form of assurance conclusion thereon.
In connection with our audit of the financial statements, our responsibility is to read the other information and, in doing so, consider whether the other information is materially inconsistent with the financial statements or our knowledge obtained in the audit or otherwise appears to be materially misstated. If, based on the work we have performed, we conclude that there is a material misstatement of this other information, we are required to report that fact. We have nothing to report in this regard.
Responsibilities of Management and Board of Directors for the Financial Statements
Management is responsible for the preparation and fair presentation of the financial statements in accordance with the accounting and reporting standards as applicable in Pakistan and the requirements of Companies Act, 2017 (XIX of 2017) and for such internal control as management determines is necessary to enable the preparation of financial statements that are free from material misstatement, whether due to fraud or error.
In preparing the financial statements, management is responsible for assessing the Company’s ability to continue as a going concern, disclosing, as applicable, matters related to going concern and using the going concern basis of accounting unless management either intends to liquidate the Company or to cease operations, or has no realistic alternative but to do so.
Board of directors are responsible for overseeing the Company’s financial reporting process.
Auditor’s Responsibilities for the Audit of the Financial Statements
Our objectives are to obtain reasonable assurance about whether the financial statements as a whole are free from material misstatement, whether due to fraud or error, and to issue an auditor’s report that includes our opinion. Reasonable assurance is
Sr. # Key audit matter How the matter was addressed in our audit
We considered revenue recognition as a key audit matter due to revenue being one of the key performance indicators of the Company and for the year revenue has increased significantly as compared to the last year. In addition, revenue was also considered as an area of inherent risk of material misstatement and significant audit risk as part of the audit process.
• performed audit procedures to analyze variation in the price and quantity sold during the year;
• tested on a sample basis, specific discounts and commission as per Company’s policy; and
• assessed the adequacy of disclosures made in the financial statements related to revenue.
2 Investment measured at Fair Value
(Refer note 4.9, note 22.2 and note 48.1 to the annexed financial statements)
The Company holds investment in the equity instrument of Hyundai Nishat Motor (Private) Limited (‘HNMPL’). Due to HNMPL being a non-listed company, their shares do not have a quoted price in an active market.
Therefore, fair value of their shares has been determined through valuation methodology based on discounted cash flow method. This involves several estimation techniques and management’s judgements to obtain reasonable expected future cash flow of the business and related discount rate.
Due to the significant level of judgment and estimation required to determine the fair value of the investment, we consider it to be a key audit matter.
Our audit procedures in relation to the matter, amongst others, included the following:
• understood and evaluated the process by which the cash flow forecast was prepared and approved, including confirming the mathematical accuracy of the underlying calculations;
• evaluated the cash flow forecast by obtaining an understanding of respective businesses of HNMPL;
• obtained an understanding of the work performed by the management on the model for the purpose of valuation;
• obtained corroborating evidence relating to the values as determined by the management by challenging key assumptions for the growth rates in the cash flow forecast by comparing them to historical results and economic forecasts and challenging the discount rate by independently estimating a range based on market data;
• performed sensitivity analysis around key assumptions to ascertain the extent of change individually in the value of the investment; and
• assessed the adequacy of the disclosures made by the Company in this area with regard to applicable accounting and reporting standards.
113
a high level of assurance, but is not a guarantee that an audit conducted in accordance with ISAs as applicable in Pakistan will always detect a material misstatement when it exists. Misstatements can arise from fraud or error and are considered material if, individually or in the aggregate, they could reasonably be expected to influence the economic decisions of users taken on the basis of these financial statements.
As part of an audit in accordance with ISAs as applicable in Pakistan, we exercise professional judgment and maintain professional skepticism throughout the audit. We also:
• Identify and assess the risks of material misstatement of the financial statements, whether due to fraud or error, design and perform audit procedures responsive to those risks, and obtain audit evidence that is sufficient and appropriate to provide a basis for our opinion. The risk of not detecting a material misstatement resulting from fraud is higher than for one resulting from error, as fraud may involve collusion, forgery, intentional omissions, misrepresentations, or the override of internal control.
• Obtain an understanding of internal control relevant to the audit in order to design audit procedures that are appropriate in the circumstances, but not for the purpose of expressing an opinion on the effectiveness of the Company’s internal control.
• Evaluate the appropriateness of accounting policies used and the reasonableness of accounting estimates and related disclosures made by management.
• Conclude on the appropriateness of management’s use of the going concern basis of accounting and, based on the audit evidence obtained, whether a material uncertainty exists related to events or conditions that may cast significant doubt on the Company’s ability to continue as a going concern. If we conclude that a material uncertainty exists, we are required to draw attention in our auditor’s report to the related disclosures in the financial statements or, if such disclosures are inadequate, to modify our opinion. Our conclusions are based on the audit evidence obtained up to the date of our auditor’s report. However, future events or conditions may cause the Company to cease to continue as a going concern.
• Evaluate the overall presentation, structure and content of the financial statements, including the disclosures, and whether the financial statements represent the underlying transactions and events in a manner that achieves fair presentation.
We communicate with the board of directors regarding, among other matters, the planned scope and timing of the audit and significant audit findings, including any significant deficiencies in internal control that we identify during our audit.
We also provide the Board of Directors with a statement that we have complied with relevant ethical requirements regarding independence, and to communicate with them all relationships and other matters that may reasonably be thought to bear on our independence, and where applicable, related safeguards.
From the matters communicated with the board of directors, we determine those matters that were of most significance in the audit of the financial statements of the current period and are therefore the key audit matters. We describe these matters in our auditor’s report unless law or regulation precludes public disclosure about the matter or when, in extremely rare circumstances, we determine that a matter should not be communicated in our report because the adverse consequences of doing so would reasonably be expected to outweigh the public interest benefits of such communication.
Report on Other Legal and Regulatory Requirements
Based on our audit, we further report that in our opinion:
a) proper books of account have been kept by the Company as required by the Companies Act, 2017 (XIX of 2017);
b) the statement of financial position, the statement of profit or loss and other comprehensive income, the statement of changes in equity and the statement of cash flows together with the notes thereon have been drawn up in conformity with the Companies Act, 2017 (XIX of 2017) and are in agreement with the books of account and returns;
c) investments made, expenditure incurred and guarantees extended during the year were for the purpose of the Company’s business; and
d) zakat deductible at source under the Zakat and Ushr Ordinance, 1980 (XVIII of 1980), was deducted by the company and deposited in the Central Zakat Fund established under section 7 of that Ordinance.
The engagement partner on the audit resulting in this independent auditor’s report is Hammad Ali Ahmad.
A. F. Ferguson & Co Chartered AccountantsLahore Date: September 30, 2021
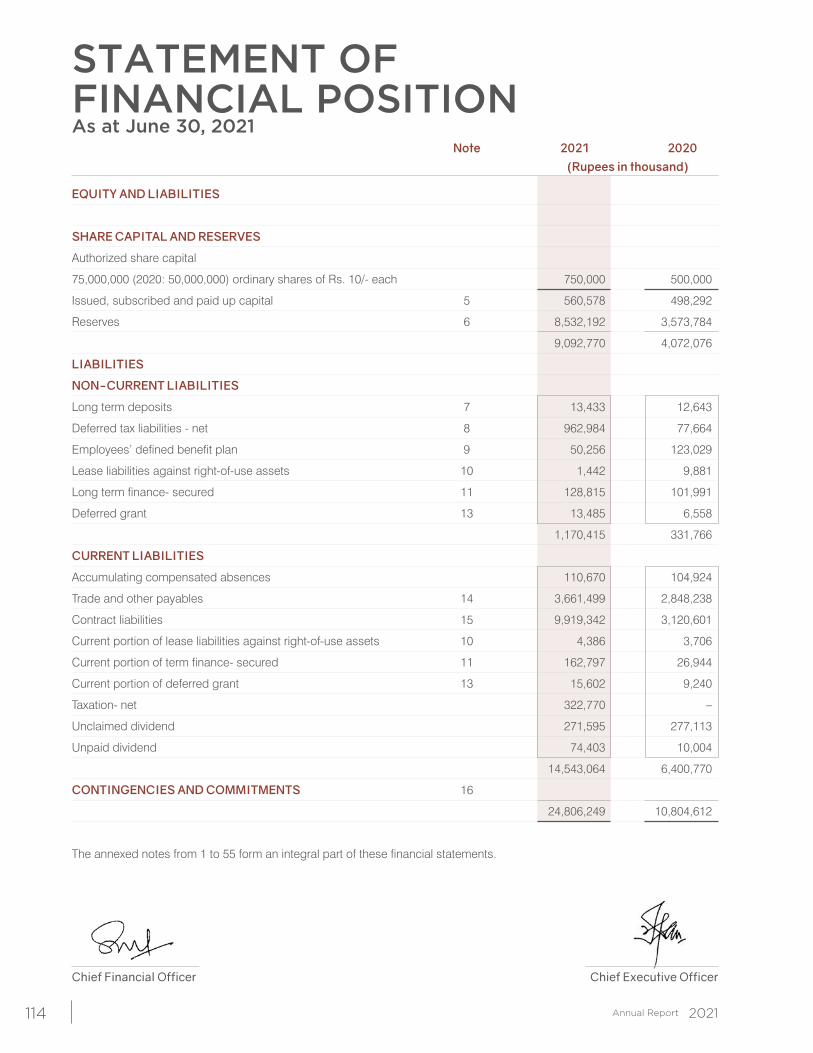
114
Note 2021 2020 (Rupees in thousand)
EQUITY AND LIABILITIES
SHARE CAPITAL AND RESERVES
Authorized share capital
75,000,000 (2020: 50,000,000) ordinary shares of Rs. 10/- each 750,000 500,000
Issued, subscribed and paid up capital 5 560,578 498,292
Reserves 6 8,532,192 3,573,784
9,092,770 4,072,076
LIABILITIES
NON-CURRENT LIABILITIES
Long term deposits 7 13,433 12,643
Deferred tax liabilities - net 8 962,984 77,664
Employees’ defined benefit plan 9 50,256 123,029
Lease liabilities against right-of-use assets 10 1,442 9,881
Long term finance- secured 11 128,815 101,991
Deferred grant 13 13,485 6,558
1,170,415 331,766
CURRENT LIABILITIES
Accumulating compensated absences 110,670 104,924
Trade and other payables 14 3,661,499 2,848,238
Contract liabilities 15 9,919,342 3,120,601
Current portion of lease liabilities against right-of-use assets 10 4,386 3,706
Current portion of term finance- secured 11 162,797 26,944
Current portion of deferred grant 13 15,602 9,240
Taxation- net 322,770 –
Unclaimed dividend 271,595 277,113
Unpaid dividend 74,403 10,004
14,543,064 6,400,770
CONTINGENCIES AND COMMITMENTS 16
24,806,249 10,804,612
The annexed notes from 1 to 55 form an integral part of these financial statements.
Chief Financial Officer Chief Executive Officer
STATEMENT OF FINANCIAL POSITIONAs at June 30, 2021
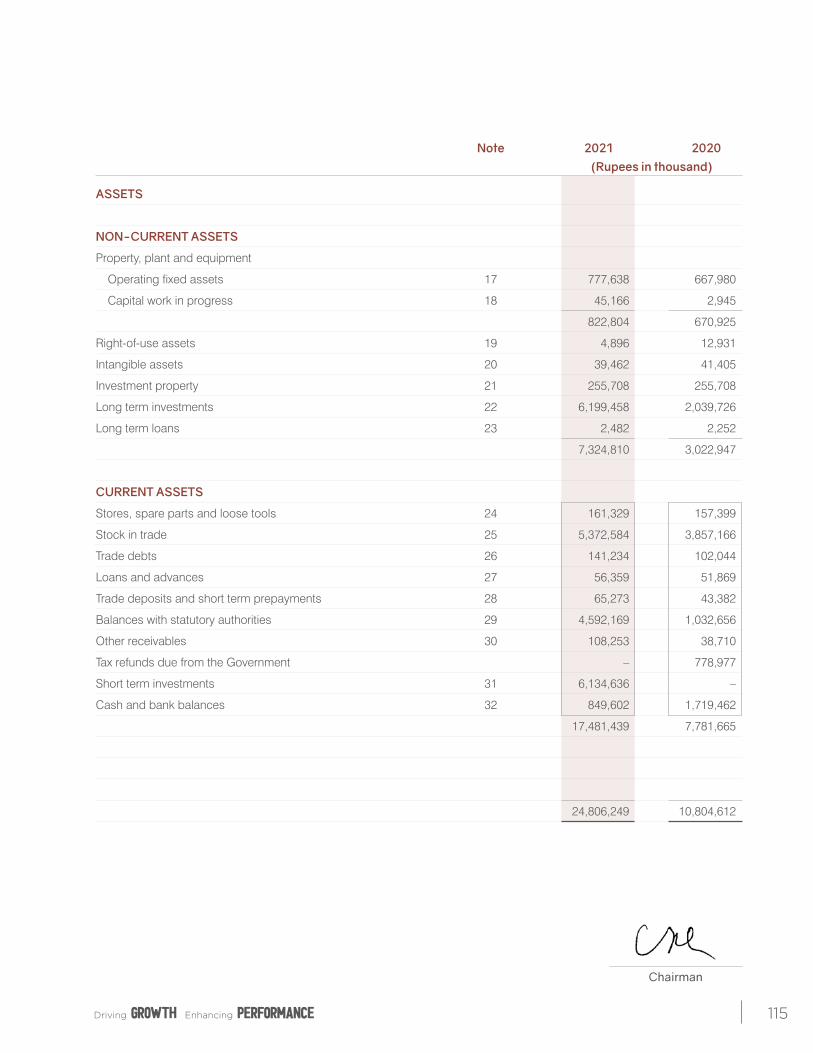
115
Chairman
Note 2021 2020 (Rupees in thousand)
ASSETS
NON-CURRENT ASSETS
Property, plant and equipment
Operating fixed assets 17 777,638 667,980
Capital work in progress 18 45,166 2,945
822,804 670,925
Right-of-use assets 19 4,896 12,931
Intangible assets 20 39,462 41,405
Investment property 21 255,708 255,708
Long term investments 22 6,199,458 2,039,726
Long term loans 23 2,482 2,252
7,324,810 3,022,947
CURRENT ASSETS
Stores, spare parts and loose tools 24 161,329 157,399
Stock in trade 25 5,372,584 3,857,166
Trade debts 26 141,234 102,044
Loans and advances 27 56,359 51,869
Trade deposits and short term prepayments 28 65,273 43,382
Balances with statutory authorities 29 4,592,169 1,032,656
Other receivables 30 108,253 38,710
Tax refunds due from the Government – 778,977
Short term investments 31 6,134,636 –
Cash and bank balances 32 849,602 1,719,462
17,481,439 7,781,665
24,806,249 10,804,612
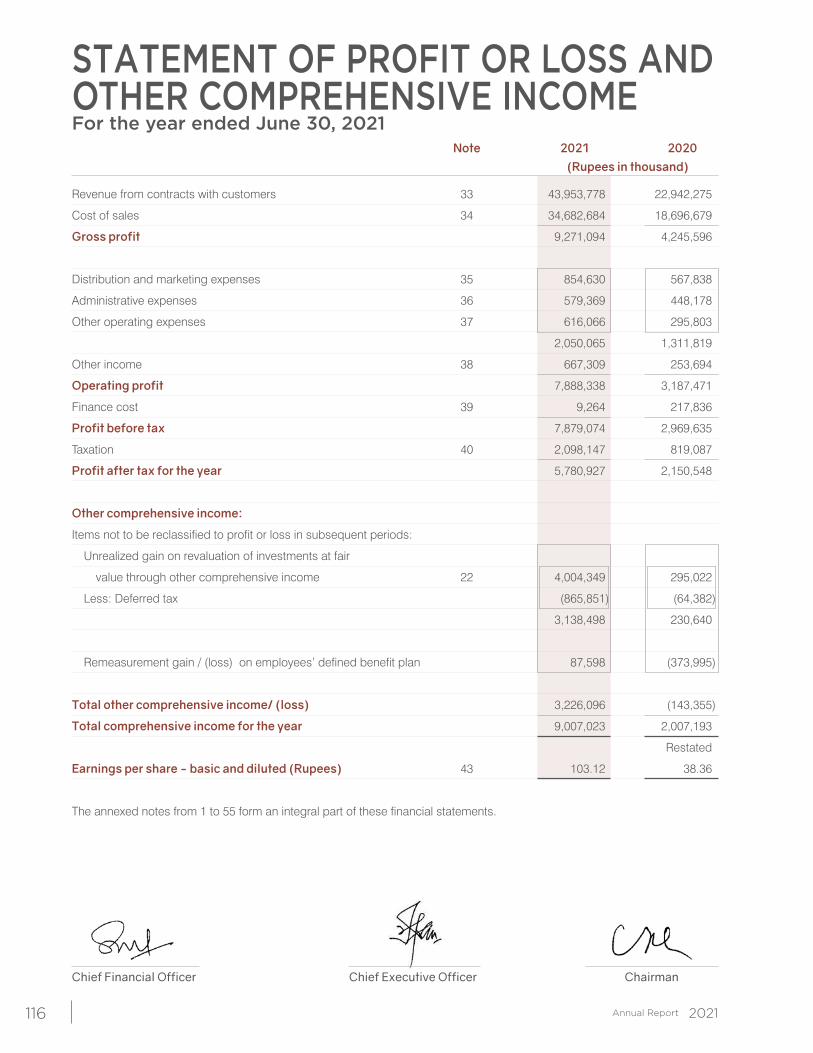
116
Note 2021 2020 (Rupees in thousand)
Revenue from contracts with customers 33 43,953,778 22,942,275
Cost of sales 34 34,682,684 18,696,679
Gross profit 9,271,094 4,245,596
Distribution and marketing expenses 35 854,630 567,838
Administrative expenses 36 579,369 448,178
Other operating expenses 37 616,066 295,803
2,050,065 1,311,819
Other income 38 667,309 253,694
Operating profit 7,888,338 3,187,471
Finance cost 39 9,264 217,836
Profit before tax 7,879,074 2,969,635
Taxation 40 2,098,147 819,087
Profit after tax for the year 5,780,927 2,150,548
Other comprehensive income:
Items not to be reclassified to profit or loss in subsequent periods:
Unrealized gain on revaluation of investments at fair
value through other comprehensive income 22 4,004,349 295,022
Less: Deferred tax (865,851) (64,382)
3,138,498 230,640
Remeasurement gain / (loss) on employees’ defined benefit plan 87,598 (373,995)
Total other comprehensive income/ (loss) 3,226,096 (143,355)
Total comprehensive income for the year 9,007,023 2,007,193
Restated
Earnings per share - basic and diluted (Rupees) 43 103.12 38.36
The annexed notes from 1 to 55 form an integral part of these financial statements.
STATEMENT OF PROFIT OR LOSS AND OTHER COMPREHENSIVE INCOMEFor the year ended June 30, 2021
Chief Financial Officer Chief Executive Officer Chairman
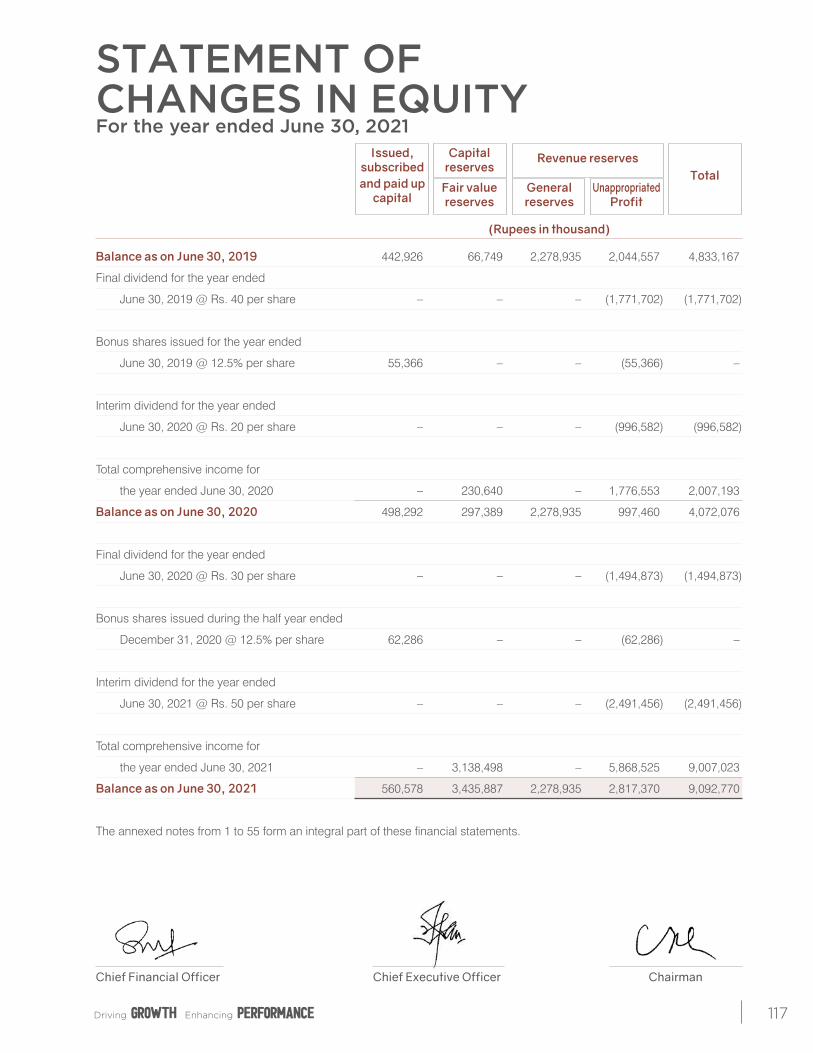
117
STATEMENT OFCHANGES IN EQUITYFor the year ended June 30, 2021
Chief Financial Officer Chief Executive Officer Chairman
Issued, Capital Revenue reserves
Total subscribed reserves
and paid up Fair value General Unappropriated capital reserves reserves Profit
(Rupees in thousand)
Balance as on June 30, 2019 442,926 66,749 2,278,935 2,044,557 4,833,167
Final dividend for the year ended
June 30, 2019 @ Rs. 40 per share – – – (1,771,702) (1,771,702)
Bonus shares issued for the year ended
June 30, 2019 @ 12.5% per share 55,366 – – (55,366) –
Interim dividend for the year ended
June 30, 2020 @ Rs. 20 per share – – – (996,582) (996,582)
Total comprehensive income for
the year ended June 30, 2020 – 230,640 – 1,776,553 2,007,193
Balance as on June 30, 2020 498,292 297,389 2,278,935 997,460 4,072,076
Final dividend for the year ended
June 30, 2020 @ Rs. 30 per share – – – (1,494,873) (1,494,873)
Bonus shares issued during the half year ended
December 31, 2020 @ 12.5% per share 62,286 – – (62,286) –
Interim dividend for the year ended
June 30, 2021 @ Rs. 50 per share – – – (2,491,456) (2,491,456)
Total comprehensive income for
the year ended June 30, 2021 – 3,138,498 – 5,868,525 9,007,023
Balance as on June 30, 2021 560,578 3,435,887 2,278,935 2,817,370 9,092,770
The annexed notes from 1 to 55 form an integral part of these financial statements.
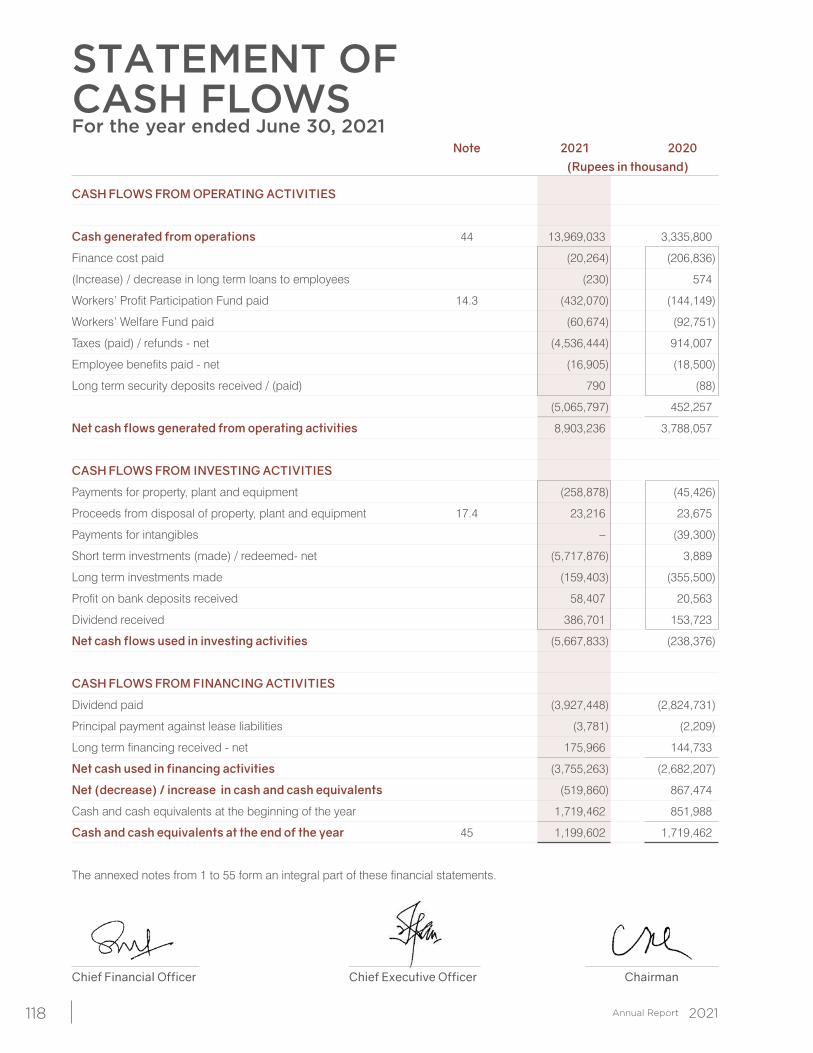
118
Note 2021 2020 (Rupees in thousand)
CASH FLOWS FROM OPERATING ACTIVITIES
Cash generated from operations 44 13,969,033 3,335,800
Finance cost paid (20,264) (206,836)
(Increase) / decrease in long term loans to employees (230) 574
Workers’ Profit Participation Fund paid 14.3 (432,070) (144,149)
Workers’ Welfare Fund paid (60,674) (92,751)
Taxes (paid) / refunds - net (4,536,444) 914,007
Employee benefits paid - net (16,905) (18,500)
Long term security deposits received / (paid) 790 (88)
(5,065,797) 452,257
Net cash flows generated from operating activities 8,903,236 3,788,057
CASH FLOWS FROM INVESTING ACTIVITIES
Payments for property, plant and equipment (258,878) (45,426)
Proceeds from disposal of property, plant and equipment 17.4 23,216 23,675
Payments for intangibles – (39,300)
Short term investments (made) / redeemed- net (5,717,876) 3,889
Long term investments made (159,403) (355,500)
Profit on bank deposits received 58,407 20,563
Dividend received 386,701 153,723
Net cash flows used in investing activities (5,667,833) (238,376)
CASH FLOWS FROM FINANCING ACTIVITIES
Dividend paid (3,927,448) (2,824,731)
Principal payment against lease liabilities (3,781) (2,209)
Long term financing received - net 175,966 144,733
Net cash used in financing activities (3,755,263) (2,682,207)
Net (decrease) / increase in cash and cash equivalents (519,860) 867,474
Cash and cash equivalents at the beginning of the year 1,719,462 851,988
Cash and cash equivalents at the end of the year 45 1,199,602 1,719,462
The annexed notes from 1 to 55 form an integral part of these financial statements.
STATEMENT OF CASH FLOWSFor the year ended June 30, 2021
Chief Financial Officer Chief Executive Officer Chairman
119
1. Legal status and nature of business
1.1 Millat Tractors Limited (the Company) is a public limited company and was incorporated in Pakistan in 1964 under the Companies Act, 1913 (now the Companies Act, 2017), and is listed on the Pakistan Stock Exchange Limited. The registered office and factory of the Company is situated at 9 km Sheikhupura Road, District Sheikhupura. The Company also has regional offices located in Karachi, Multan, Sukkur and Islamabad.
The Company is principally engaged in assembling and manufacturing of agricultural tractors, implements and multi-
application products. The Company is also involved in the sale, implementation and support of IFS applications in Pakistan.
1.2 Summary of significant transactions and events in the current reporting period
The Company’s financial position and performance was particularly affected by the following events and transactions during the reporting period:
- Revenue from contracts with customers increased by Rs. 21,011,503 thousand (92%) as compared to prior year
- refer notes 33;
- Additional long term investment was made by the Company in Hyundai Nishat Motors (Private) Limited (HNMPL) amounting to Rs. 159,403 thousand under the Share Subscription Agreement (SSA) and Shareholders Agreement (SHA) between both parties - refer note 22;
- Fair value remeasurement of long term investment in HNMPL (Level-3), at the reporting date, resulted in an estimated fair value gain of Rs. 3,980,925 thousand. The resulting fair value gain has been recognised in the other comprehensive income in these financial statements - refer note 4.9, 22.2 and 48.1 respectively;
- Short term investments of the Company increased by Rs. 6,134,636 thousand as compared to prior year - refer to note 31;
- During the year, the Company obtained and repaid certain long term financing against the State Bank of Pakistan’s (SBP) salary refinance scheme of salaries and wages. Moreover, the Company also availed long term financing against the SBP refinance scheme for renewable energy for setting-up and comissioning a 998KWp solar power system - refer to note 11; and
- Balances with statutory authorities on account of sales tax refunds increased by Rs. 3,559,513 as compared to the prior year - refer to note 29.
1.2.1 Impact of COVID-19 on the financial statements
The pandemic of COVID-19 that has rapidly spread all across the world has not only endangered human lives but has also adversely impacted the global economy. On March 23, 2020, the Government of the Punjab announced a temporary lock down as a measure to reduce the spread of the COVID–19. Complying with the lockdown, the Company temporarily suspended its operations from March 24, 2020. In the Company’s case, the lockdown was subsequently relaxed from March 30, 2020. After implementing all the necessary Standard Operating Procedures (SOPs) to ensure safety of employees, the Company henceforth resumed its operations and has taken all necessary steps to ensure smooth and adequate continuation of its business in order to maintain business performance despite slowed down economic activity.
According to management’s assessment, there is no significant accounting impact of the effects of COVID-19 on
these financial statements. 2 Statement of compliance
These financial statements have been prepared in accordance with the approved accounting and reporting standards as applicable in Pakistan. The accounting and reporting standards applicable in Pakistan comprise of:
NOTES TO THE FINANCIAL STATEMENTSFor the year ended June 30, 2021
NOTES TO THE FINANCIAL STATEMENTSFor the year ended June 30, 2021
120
- International Financial Reporting Standards (IFRS Standards) issued by the International Accounting Standards Board (IASB) as notified under the Companies Act, 2017; and
- Provisions and directives issued under the Companies Act, 2017. Where the provisions of the directives issued under the Companies Act, 2017 differ from the IFRS Standards, the
provisions of and directives issued under the Companies Act, 2017 have been followed. 3 Basis of preparation
These financial statements represent the separate financial statements of Millat Tractors Limited, in which investments in the subsidiary companies, namely Millat Equipment Limited (MEL), Bolan Castings Limited (BCL), Millat Industrial Products Limited (MIPL) and TIPEG Intertrade DMCC have been accounted for at cost less accumulated impairment losses, if any. The consolidated financial statements of the Group are being issued separately.
3.1 Basis of measurement
These financial statements have been prepared under the historical cost convention except for valuation of certain financial instruments at fair value or amortised cost and recognition of certain employees’ retirement benefit plan at present value.
3.2 Critical accounting estimates and judgments
The Company’s significant accounting policies are stated in note 4 to these financial statements. Not all of these significant policies require the management to make difficult, subjective or complex judgments or estimates. The following is intended to provide an understanding of the policies the management considers critical because of their complexity, judgment of estimation involved in their application and their impact on these financial statements. Estimates and judgments are continually evaluated and are based on historical experience, including expectation of future events that are believed to be reasonable under the circumstances. These judgments involve assumptions or estimates in respect of future events and the actual results may differ from these estimates. The areas involving higher degree of judgments or complexity or areas where assumptions and estimates are significant to the financial statements are as follows:
3.2.1 Employees’ retirement benefits and other obligations
The Company uses the valuation performed by an independent actuary as the present value of its retirement benefit obligations i.e. employees’ defined benefit plan and other obligations. The valuation is based on assumptions as mentioned in note 4.2 to these financial statements.
3.2.2 Provision for taxation
The Company takes into account the current income tax law and the decisions taken by appellate authorities. Instances where the Company’s view differs from the view taken by the income tax department at the assessment stage and where the Company considers that its views on items of material nature are in accordance with law and the outcome is expected in favor of the Company, are shown as contingent liabilities.
3.2.3 Estimated useful lives, residual values and method of depreciation of property, plant and equipment
The Company reviews the useful lives, residual value and method of depreciation of property, plant and equipment on a regular basis. Any change in estimates in future years might affect the carrying amounts of respective items of property, plant and equipment with a corresponding effect on the depreciation charge and impairment.
3.2.4 Provision for inventories and stores
The Company regularly reviews the inventories for impairment. Provision for obsolete and slow-moving inventories is based on management’s estimate of the condition and usability of inventories and stores.
121
3.2.5 Impairment of trade receivables
The Company applies the IFRS 9 simplified approach to measuring expected credit losses which uses a lifetime expected loss allowance for all trade receivables and contract assets.
The expected loss rates are based on the payment profiles of sales over a period of time before the reporting date
and the corresponding historical credit losses experienced within this period. The historical loss rates are adjusted to reflect current and forward-looking information on macroeconomic factors affecting the ability of the customers to settle the receivables.
3.2.6 Fair value of unquoted investments
Fair value of unquoted investments is determined by using valuation techniques. The Company uses its judgment to select an appropriate method and makes assumptions that are mainly based on market conditions existing at the end of each reporting period. The Company has used discounted cash flow analysis for this purpose as fully explained in note 22.2 to these financial statements.
3.2.7 Lease term of right of use asset and lease liability
In determining the lease term, management considers all facts and circumstances that create an economic incentive to exercise an extension option, or not exercise a termination option. Extension options (or periods after termination options) are only included in the lease term if the lease is reasonably certain to be extended (or not terminated).
3.3 Functional and presentation currency
The financial statements are presented in Pak Rupees which is the Company’s functional and presentation currency. 4 Summary of significant accounting policies
The significant accounting policies which have been adopted in the preparation of financial statements of the Company are consistent with previous year except as mentioned in note 4.1 to these financial statements, and which are as follows:
4.1 Changes in accounting standards, interpretations and pronouncements
a) Standards, interpretations and amendments to published approved accounting standards that became effective during the year but are not relevant
The Company has adopted the following accounting standard and the amendments and interpretation of IFRSs which became effective for the current year:
- IFRS 3 – Business combinations’, definition of a business (Amendment)
- IAS 8 – Accounting Policies, Changes in Accounting Estimates and Errors’ , definition of materiality (Amendments)
- IFRS 9 - Financial Instruments’ , Interest rate benchmark reform (Amendment)
- IFRS 7 - Financial Instruments-Disclosures , Interest rate benchmark reform (Amendment)
- IFRS 16 – Leases’, COVID-19 related rent concessions (Amendment) The adoption of the above amendments, improvements to accounting standards and interpretations did not have any
effect on the financial statements of the Company.
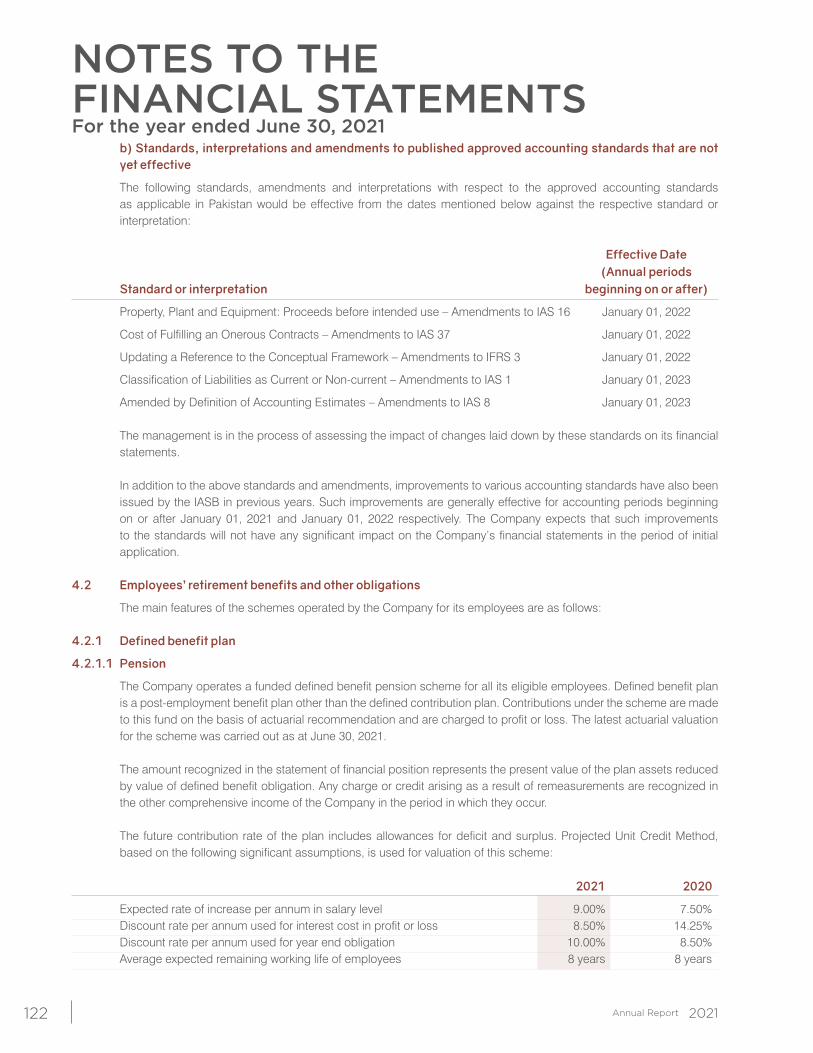
NOTES TO THE FINANCIAL STATEMENTSFor the year ended June 30, 2021
122
b) Standards, interpretations and amendments to published approved accounting standards that are not yet effective
The following standards, amendments and interpretations with respect to the approved accounting standards as applicable in Pakistan would be effective from the dates mentioned below against the respective standard or interpretation:
Effective Date (Annual periods Standard or interpretation beginning on or after)
Property, Plant and Equipment: Proceeds before intended use – Amendments to IAS 16 January 01, 2022
Cost of Fulfilling an Onerous Contracts – Amendments to IAS 37 January 01, 2022
Updating a Reference to the Conceptual Framework – Amendments to IFRS 3 January 01, 2022
Classification of Liabilities as Current or Non-current – Amendments to IAS 1 January 01, 2023
Amended by Definition of Accounting Estimates – Amendments to IAS 8 January 01, 2023 The management is in the process of assessing the impact of changes laid down by these standards on its financial
statements. In addition to the above standards and amendments, improvements to various accounting standards have also been
issued by the IASB in previous years. Such improvements are generally effective for accounting periods beginning on or after January 01, 2021 and January 01, 2022 respectively. The Company expects that such improvements to the standards will not have any significant impact on the Company’s financial statements in the period of initial application.
4.2 Employees’ retirement benefits and other obligations
The main features of the schemes operated by the Company for its employees are as follows: 4.2.1 Defined benefit plan
4.2.1.1 Pension
The Company operates a funded defined benefit pension scheme for all its eligible employees. Defined benefit plan is a post-employment benefit plan other than the defined contribution plan. Contributions under the scheme are made to this fund on the basis of actuarial recommendation and are charged to profit or loss. The latest actuarial valuation for the scheme was carried out as at June 30, 2021.
The amount recognized in the statement of financial position represents the present value of the plan assets reduced
by value of defined benefit obligation. Any charge or credit arising as a result of remeasurements are recognized in the other comprehensive income of the Company in the period in which they occur.
The future contribution rate of the plan includes allowances for deficit and surplus. Projected Unit Credit Method,
based on the following significant assumptions, is used for valuation of this scheme:
2021 2020
Expected rate of increase per annum in salary level 9.00% 7.50% Discount rate per annum used for interest cost in profit or loss 8.50% 14.25% Discount rate per annum used for year end obligation 10.00% 8.50% Average expected remaining working life of employees 8 years 8 years
123
The Board Members of the Millat Tractors Limited Employees’ Pension Fund Trust are managing the Pension Fund as per the applicable Pension Fund Deed, Rules and Regulations of the fund.
4.2.2 Defined contribution plans
4.2.2.1 Gratuity
The Company operates an approved defined contribution funded gratuity scheme for permanent employees who joined the Company before July 01, 2004. Under the scheme, based on the graduated scale, the contributions are calculated with reference to last drawn salary of the employees and are paid over to the Employees’ Gratuity Fund Trust.
The Board Members of the Millat Tractors Limited Employees’ Gratuity Fund Trust are managing the Gratuity Fund as per the applicable Gratuity Fund Deed, Rules and Regulations of the fund.
4.2.2.2 Provident fund
The Company operates an approved defined contribution provident fund for all permanent employees. Equal contributions are made by employees and the Company at the rate of 10 percent of basic salary per month.
The Board Members of the Millat Tractors Limited Employees’ Provident Fund Trust (‘the Trust’) are managing the Provident Fund as per the applicable Provident Fund Deed, Rules and Regulations of the fund.
4.2.3 Accumulating compensated absences
The Company provides for accumulating compensated absences, when the employees render services that increase their entitlement to future compensated absences and are charged to profit or loss.
4.3 Taxation
Current
Provision for current tax is based on the taxable income for the year determined in accordance with the prevailing law for taxation of income. The charge for current tax is calculated using prevailing tax rates or tax rates expected to apply to the profit for the year, if enacted. The charge for current tax also includes adjustments, where considered necessary, to provision for taxation made in previous years arising from assessments framed during the year for such years.
Deferred
Deferred tax is accounted for using the balance sheet liability method in respect of all temporary differences arising from differences between the carrying amount of assets and liabilities in the financial statements and the corresponding tax bases used in the computation of the taxable profit. Deferred tax liabilities are generally recognized for all taxable temporary differences and deferred tax assets are recognized to the extent that it is probable that taxable profits will be available against which the deductible temporary differences, unused tax losses and tax credits can be utilized.
Deferred tax is calculated at the rates that are expected to apply to the year when the differences reverse based on
tax rates that have been enacted or substantively enacted by the end of the reporting period. Deferred tax is charged or credited in the profit or loss, except in the case of items credited or charged to other comprehensive income.
4.4 Property, plant and equipment
Property, plant and equipment except for freehold and leasehold land are stated at cost less accumulated depreciation and any identified impairment loss, if any. Freehold and leasehold land is stated at cost less any identified impairment loss, if any.
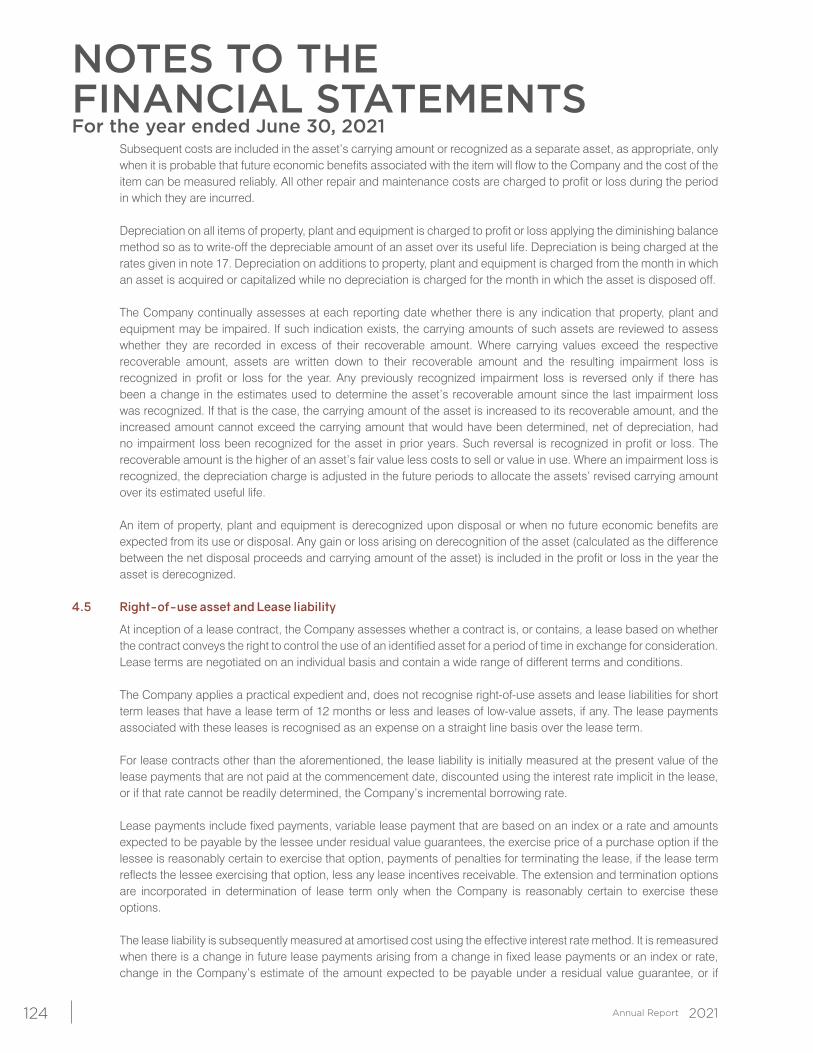
NOTES TO THE FINANCIAL STATEMENTSFor the year ended June 30, 2021
124
Subsequent costs are included in the asset’s carrying amount or recognized as a separate asset, as appropriate, only when it is probable that future economic benefits associated with the item will flow to the Company and the cost of the item can be measured reliably. All other repair and maintenance costs are charged to profit or loss during the period in which they are incurred.
Depreciation on all items of property, plant and equipment is charged to profit or loss applying the diminishing balance
method so as to write-off the depreciable amount of an asset over its useful life. Depreciation is being charged at the rates given in note 17. Depreciation on additions to property, plant and equipment is charged from the month in which an asset is acquired or capitalized while no depreciation is charged for the month in which the asset is disposed off.
The Company continually assesses at each reporting date whether there is any indication that property, plant and
equipment may be impaired. If such indication exists, the carrying amounts of such assets are reviewed to assess whether they are recorded in excess of their recoverable amount. Where carrying values exceed the respective recoverable amount, assets are written down to their recoverable amount and the resulting impairment loss is recognized in profit or loss for the year. Any previously recognized impairment loss is reversed only if there has been a change in the estimates used to determine the asset’s recoverable amount since the last impairment loss was recognized. If that is the case, the carrying amount of the asset is increased to its recoverable amount, and the increased amount cannot exceed the carrying amount that would have been determined, net of depreciation, had no impairment loss been recognized for the asset in prior years. Such reversal is recognized in profit or loss. The recoverable amount is the higher of an asset’s fair value less costs to sell or value in use. Where an impairment loss is recognized, the depreciation charge is adjusted in the future periods to allocate the assets’ revised carrying amount over its estimated useful life.
An item of property, plant and equipment is derecognized upon disposal or when no future economic benefits are
expected from its use or disposal. Any gain or loss arising on derecognition of the asset (calculated as the difference between the net disposal proceeds and carrying amount of the asset) is included in the profit or loss in the year the asset is derecognized.
4.5 Right-of-use asset and Lease liability
At inception of a lease contract, the Company assesses whether a contract is, or contains, a lease based on whether the contract conveys the right to control the use of an identified asset for a period of time in exchange for consideration. Lease terms are negotiated on an individual basis and contain a wide range of different terms and conditions.
The Company applies a practical expedient and, does not recognise right-of-use assets and lease liabilities for short
term leases that have a lease term of 12 months or less and leases of low-value assets, if any. The lease payments associated with these leases is recognised as an expense on a straight line basis over the lease term.
For lease contracts other than the aforementioned, the lease liability is initially measured at the present value of the
lease payments that are not paid at the commencement date, discounted using the interest rate implicit in the lease, or if that rate cannot be readily determined, the Company’s incremental borrowing rate.
Lease payments include fixed payments, variable lease payment that are based on an index or a rate and amounts
expected to be payable by the lessee under residual value guarantees, the exercise price of a purchase option if the lessee is reasonably certain to exercise that option, payments of penalties for terminating the lease, if the lease term reflects the lessee exercising that option, less any lease incentives receivable. The extension and termination options are incorporated in determination of lease term only when the Company is reasonably certain to exercise these options.
The lease liability is subsequently measured at amortised cost using the effective interest rate method. It is remeasured
when there is a change in future lease payments arising from a change in fixed lease payments or an index or rate, change in the Company’s estimate of the amount expected to be payable under a residual value guarantee, or if
125
the Company changes its assessment of whether it will exercise a purchase, extension or termination option. The corresponding adjustment is made to the carrying amount of the right-to-use asset, or is recorded in the statement of profit and loss account if the carrying amount of right-to-use asset has been reduced to zero.
The right-of-use asset is initially measured based on the initial amount of the lease liability adjusted for any lease
payments made at or before the commencement date, plus any initial direct costs incurred and an estimate of costs to dismantle and remove the underlying asset or to restore the underlying asset or the site on which it is located, less any lease incentive received. The right-of-use asset is depreciated on a straight line method over the lease term as this method most closely reflects the expected pattern of consumption of future economic benefits. The right-of-use asset is reduced by impairment losses.
4.6 Capital work in progress
All expenditure connected with specific assets incurred during installation and construction period including advances to suppliers and contractors are carried under this head. These are transferred to specific assets as and when these assets are available for use.
Capital work-in-progress is stated at cost less any identified impairment loss, if any. 4.7 Intangible assets
Expenditure incurred to acquire and developing computer software are capitalized as intangible assets and stated at cost less accumulated amortization and any identified impairment loss, if any.
The useful lives of intangible assets are assessed as either finite or indefinite. Intangible assets with finite life are amortised using the straight line method over a period of three years and Intangible
assets with indefinite useful lives are not amortised, but are tested for impairment annually, either individually or at the cash-generating unit level. The assessment of indefinite life is reviewed annually to determine whether the indefinite life continues to be supportable. If not, the change in useful life from indefinite to finite is made on a prospective basis.
Amortization on additions to finite intangible assets is charged from the month in which an asset is acquired or
capitalized while no amortization is charged for the month in which the asset is disposed off. The Company assesses at each reporting date whether there is any indication that intangible assets may be impaired.
If such indication exists, the carrying amounts of such assets are reviewed to assess whether they are recorded in excess of their recoverable amount. Where carrying amounts exceed the respective recoverable amount, assets are written down to their recoverable amounts and the resulting impairment loss is recognized in profit or loss. The recoverable amount is the higher of an asset’s fair value less costs to sell and value in use. Where an impairment loss is recognized, the amortization charge is adjusted in the future periods to allocate the asset’s revised carrying amount over its estimated useful life.
4.8 Investment property
Property not held for own use or for sale in the ordinary course of business is classified as investment property. The investment property of the Company comprises land and is valued using the cost method i.e. at cost less any identified impairment loss.
The Company assesses at each reporting date whether there is any indication that investment property may be
impaired. If such indication exists, the carrying amount of such assets is reviewed to assess whether they are recorded in excess of their recoverable amount. Where carrying value exceeds the respective recoverable amount, assets are written down to their recoverable amounts and the resulting impairment loss is recognized in the profit or loss for the year. The recoverable amount is the higher of an asset’s fair value less costs to sell and value in use.
NOTES TO THE FINANCIAL STATEMENTSFor the year ended June 30, 2021
126
The gain or loss on disposal or retirement of an investment property represented by the difference between the sale proceeds and the carrying amount of the asset is recognized in profit or loss.
4.9 Investments and other financial assets
4.9.1 Subsidiary and associated undertakings
A subsidiary is an entity controlled by the Company. The Company controls an investee when the Company is exposed, or has rights, to variable returns from its involvement with the investee and has the ability to affect those returns through its power over the investee.
An associate is an entity over which the Company has significant influence and that is neither a subsidiary nor an
interest in a joint venture. Significant influence is the power to participate in the financial and operating policy decisions of the investee but not having control or joint control over those policies.
Investments in subsidiary and associated undertakings are carried at cost less impairment loss, if any. At each reporting date, the Company reviews the carrying amounts of the investments in subsidiary and associates to
assess whether there is any indication that such investments have suffered an impairment loss. If any such indication exists, the recoverable amount is estimated in order to determine the extent of the impairment loss, if any. In making an estimate of recoverable amount of these investments, the management considers future dividend stream and an estimate of the terminal value of these investments. Impairment losses are recognized as expense in the profit or loss.
4.9.2 Financial assets other than investments in subsidiary and associated undertakings
4.9.2.1 Classification
The Company classifies its financial assets in the following measurement categories:
- at Fair Value through Profit or Loss (“FVPL”),- at Fair Value through Other Comprehensive Income (“FVOCI”), or- at amortised cost.
The Company determines the classification of financial assets at initial recognition. The classification of instruments
(other than equity instruments) is driven by the Company’s business model for managing the financial assets and their contractual cash flow characteristics.
For assets measured at fair value, gains and losses will either be recorded in profit or loss or OCI. For investments in
equity instruments that are not held for trading, this will depend on whether the Company has made an irrevocable election at the time of initial recognition to account for the equity investment at fair value through other comprehensive income.
The Company reclassifies debt investments when and only when its business model for managing those assets
changes. 4.9.2.2 Recognition and derecognition
Regular way purchases and sales of financial assets are recognised on trade-date i.e. the date on which the Company commits to purchase or sell the asset. Financial assets are derecognised when the rights to receive cash flows from the financial assets have expired or have been transferred and the Company has transferred substantially all the risks and rewards of ownership.
127
4.9.2.3 Measurement
At initial recognition, the Company measures a financial asset at its fair value plus, in the case of a financial asset not at Fair Value through Profit or Loss (FVPL), transaction costs that are directly attributable to the acquisition of the financial asset. Transaction costs of financial assets carried at FVPL are expensed in profit or loss.
Financial assets with embedded derivatives are considered in their entirety when determining whether their cash flows
are Solely Payment of Principal and Interest (SPPI).
a) Debt instruments
Subsequent measurement of debt instruments depends on the Company’s business model for managing the asset and the cash flow characteristics of the asset. There are three measurement categories into which the Company classifies its debt instruments:
i) Financial assets at amortised cost
Assets that are held for collection of contractual cash flows where those cash flows represent solely payments of principal and interest are measured at amortised cost. Interest income from these financial assets is included in other income using the effective interest rate method. Any gain or loss arising on derecognition is recognised directly in profit or loss and presented in other income/(operating expenses), together with foreign exchange gains and losses. Impairment losses are presented as separate line item in the statement of profit or loss.
ii) Financial assets at Fair Value through Other Comprehensive Income
Assets that are held for both collection of contractual cash flows and for selling the financial assets, where the assets’ cash flows represent solely payments of principal and interest, are measured at FVOCI. Movements in the carrying amount are taken through OCI, except for the recognition of impairment gains or losses, interest revenue and foreign exchange gains and losses which are recognised in profit or loss. When the financial asset is derecognised, the cumulative gain or loss previously recognised in OCI is reclassified from equity to profit or loss and recognised in other income/(operating expenses). Interest income from these financial assets is included in other income using the effective interest rate method. Foreign exchange gains and losses are presented in other income/(operating expenses).
iii) Financial assets at Fair Value through Profit or Loss
Assets that do not meet the criteria for amortised cost or FVOCI are measured at FVPL. A gain or loss on a debt investment that is subsequently measured at FVPL is recognised in profit or loss and presented net within other income/(operating expenses) in the period in which it arises.
b) Equity instruments
The Company subsequently measures all equity investments at fair value. Where the Company’s management has elected to present fair value gains and losses on equity investments in OCI, there is no subsequent reclassification of fair value gains and losses to profit or loss following the derecognition of the investment. Dividends from such investments continue to be recognised in profit or loss as other income when the Company’s right to receive payments is established.
Changes in the fair value of financial assets at FVPL are recognised in other income/(operating expenses) in profit
or loss as applicable. Impairment losses (and reversal of impairment losses) on equity investments measured at FVOCI are not reported separately from other changes in fair value.
NOTES TO THE FINANCIAL STATEMENTSFor the year ended June 30, 2021
128
4.9.2.4 Impairment of financial assets
The Company applies the IFRS 9 simplified approach to measure expected credit losses, which uses a lifetime expected loss allowance for all trade receivables and contract assets. Instruments within the scope of the new requirements included loans and other debt-type financial assets measured at amortised cost and fair value through other comprehensive income, trade receivables, contract assets recognised and measured under IFRS 15 and that are not measured at fair value through profit or loss.
To measure the expected credit losses, trade receivables and contract assets are grouped based on shared credit risk
characteristics and the days past due. The contract assets relate to unbilled work in progress and have substantially the same risk characteristics as the trade receivables for the same types of contracts. The Company therefore concludes that the expected loss rates for trade receivables are a reasonable approximation of the loss rates for the contract assets. Recognition of credit losses is no longer dependent on the Company first identifying a credit loss event. Instead the Company considers a broader range of information when assessing credit risk and measuring expected credit losses, including past events, current conditions, reasonable and supportable forecasts that affect the expected collectability of the future cash flows of the instrument.
A distinction is made between, financial instruments that have not deteriorated significantly in credit quality since initial
recognition or that have low credit risk (Stage 1). Financial instruments that have deteriorated significantly in credit quality since initial recognition and whose credit risk is not low (Stage 2). Stage 3 would cover financial assets that have objective evidence of impairment at the reporting date. ‘12-month expected credit losses’ are recognised for the first category while ‘lifetime expected credit losses’ are recognised for the second category.
Measurement of the expected credit losses is determined by a probability-weighted estimate of credit losses over the
expected life of the financial instrument. Individual receivables which are known to be uncollectible are written off by reducing the carrying amount directly.
The other receivables are assessed collectively to determine whether there is objective evidence that an impairment has been incurred but not yet been identified. For these receivables the estimated impairment losses are recognised in a separate provision for impairment. The Company considers that there is evidence of impairment, if any, of the indicators were present i.e. significant financial difficulties of the debtor, probability that the debtor will enter bankruptcy or financial reorganization, and default or late payments.
Trade receivables and contract assets are written off when there is no reasonable expectation of recovery. Indicators
that there is no reasonable expectation of recovery include, amongst others, the failure of a debtor to engage in a repayment plan with the Company, and a failure to make contractual payments past due date. Impairment losses on trade receivables and contract assets are presented as net impairment losses in the profit or loss. Subsequent recoveries of amounts previously written off are credited against the same line item.
4.10 Stores, spare parts and loose tools
Stores, spare parts and loose tools are valued at lower of net realizable value or moving average cost. Items in transit are valued at cost comprising of invoice value and other incidental charges paid thereon.
Provision for obsolete and slow-moving stores, spare parts and loose tools is based on management estimate of the
condition and usability of such stores. Net realizable value signifies the estimated selling price in the ordinary course of business less costs necessarily
to be incurred in order to make the sale. Provision for obsolete and slow moving stores and spares is based on management estimate.
129
4.11 Stock in trade
Stock of raw materials, except for those in transit, work in process and finished goods are valued principally at the lower of moving average cost and net realizable value.
Items in transit are stated at cost comprising invoice value and other incidental charges paid thereon. Cost of raw materials and trading stock comprises the invoice value plus other charges paid thereon. Cost of work in process and finished goods include direct material, labor and appropriate portion of manufacturing
overheads. Net realizable value signifies the estimated selling price in the ordinary course of business less costs necessarily to be
incurred in order to make the sale. Provision for obsolete and slow-moving stock in trade is based on management estimate.
4.12 Trade debts
Trade debts are carried at original invoice amount less any expected credit losses based on review of outstanding amounts at the year end in accordance with the simplified approach as mentioned in note 4.9.2.4. Bad debts are written off when identified.
4.13 Cash and cash equivalents
For the purposes of the cash flow statement, cash and cash equivalents are stated at cost and comprise of cash in hand, cash at banks on current, saving and deposit accounts and other short term highly liquid instruments that are readily convertible into known amounts of cash which are subject to insignificant risk of changes in values. Cash equivalents are held for the purpose of meeting short-term cash commitments rather than for investment or other purpose.
4.14 Revenue recognition
4.14.1 Revenue from sale of tractors, implements and multi-application products, along with the provision of after market services. Revenue is recognized when performance obligations are satisfied by transferring control of a good or service to a customer, either at a point in time or over time of an amount that reflects the consideration to which the entity expects to be entitled in exchange for those goods or services.
Revenue is recognised in accordance with the aforementioned principle by applying the following steps:
i) Identify the contract with a customer.ii) Identify the performance obligation in the contract.iii) Determine the transaction price of the contract.iv) Allocate the transaction price to each of the separate performance obligations in the contract.v) Recognise the revenue when (or as) the entity satisfies a performance obligation.
Revenue is recognised either at a point in time or over time, when (or as) the Company satisfies performance obligations by transferring the promised goods or services to its customers. Any bundled goods or services that are distinct are separately recognized, and any discounts or rebates on the contract price are generally allocated to the separate elements
4.14.2 a) Sale of goods
Revenue from contracts for sale of tractors, implements, multi-application products and trading goods is recognized upon delivery and acknowledgement of the good by the customer i.e. point in time when the performance obligation of the Company is satisfied. Since there is only one performance obligation the revenue is recognized at full amount. Payments for sale of tractors are received in advance from customers, while in the case of implements and multi-application products credit periods are provided as per Company policy on a case to case basis. There are no returns or refunds against sales, once acknowledged by the customer.
NOTES TO THE FINANCIAL STATEMENTSFor the year ended June 30, 2021
130
b) Sale of service warranties
The Company provides various types of warranties. When determining the nature of warranty-related promises, the Company considers:
- whether the customer has the option to separately purchase the warranty; and- whether all or part of the warranty provides the customer with an additional service beyond the basic assurance
that it will perform in accordance with published specifications. Standard-type warranties of free repair, parts replacement, assurance and major rectification to the customer
along with free service after specific intervals are not offered separately for any consideration by the Company and rather are embedded in the sale price of the good. Accordingly, the same are not considered to be separate performance obligations and are accounted for under IAS 37.
For extended-type warranties or separate after sale services offered by the Company the same are treated as
separate performance obligations. Revenue from such warranties or after sale services contracts is recognized over time i.e. duration of the contract.
Others
- Dividend is recognized as income when the right to receive dividend is established. - Profit on bank deposits is recognized on effective rate of interest method. - Investment income is recognized when right to receive the income is established.
4.15 Research cost
These costs are charged to profit or loss when incurred. 4.16 Borrowing costs
Borrowing costs are recognized as an expense in the period in which these are incurred except to the extent of borrowing costs that are directly attributable to the acquisition, construction or production of a qualifying asset. Such borrowing costs are capitalized as part of the cost of that asset up to the date of its commissioning.
4.17 Trade and other payables
Liabilities for trade and other amounts payable are measured at cost which is the fair value of the consideration to be paid in future for goods and services received, whether or not billed to the Company.
4.18 Provisions
Provisions for legal claims, service warranties and make good obligations are recognised when the Company has a present legal or constructive obligation as a result of past events, it is probable that an outflow of resources will be required to settle the obligation and the amount can be reliably estimated. Provisions are not recognised for future operating losses.
Where there are a number of similar obligations, the likelihood that an outflow will be required in settlement is
determined by considering the class of obligations as a whole. A provision is recognised even if the likelihood of an outflow with respect to any one item included in the same class of obligations may be small.
Provisions are measured at the present value of management’s best estimate of the expenditure required to settle the
present obligation at the end of the reporting period. The discount rate used to determine the present value is a pre-tax rate that reflects current market assessments of the time value of money and the risks specific to the liability. The increase in the provision due to the passage of time is recognised as interest expense.
131
4.19 Foreign currency transactions and translation
All monetary assets and liabilities in foreign currencies are translated into Pak Rupees at the rates of exchange prevailing at the reporting date. Transactions in foreign currencies are translated into Pak Rupees at exchange rate prevailing at the date of transaction. Foreign exchange gains and losses on translation are recognized in the profit or loss. All non-monetary items are translated into Pak Rupees at exchange rates prevailing on the date of transaction or on the date when fair values are determined.
4.20 Financial liabilities
Financial liabilities are recognized when the Company becomes a party to the contractual provisions of the instrument and de-recognized when the obligation specified in the contract is discharged, cancelled or expired. The Company derecognizes financial liabilities only when its obligations under the financial liabilities are discharged, cancelled or expired. The difference between the carrying amount of the financial liability derecognised and the consideration paid and payable, including any non-cash assets transferred or liabilities assumed, is recognised in the statement of profit or loss and other comprehensive income.
All financial liabilities are initially measured at cost, which is the fair value of the consideration given and received
respectively. These financial liabilities are subsequently measured at Fair Value through Profit and Loss (“FVPL”) or at amortised cost, as the case may be. Financial liabilities are measured at amortised cost, unless they are required to be measured at FVPL (such as instruments held for trading or derivatives) or the Company has opted to measure them at FVPL. The particular recognition methods adopted are disclosed in the individual policy statements associated with each item.
Where management has opted to recognise a financial liability at FVTPL, any changes associated with the Company’s
own credit risk will be recognized in other comprehensive income/(loss). Currently, there are no financial liabilities designated at FVPL.
The accounting policy for financial assets other than investments in subsidiary and associated undertakings is
disclosed in note 4.9.2 to the financial statements above. 4.21 Off-setting of financial assets and liabilities
Financial assets and liabilities are offset and the net amount is reported in the financial statements only when there is a legally enforceable right to set off the recognized amount and the Company intends either to settle on a net basis or to realize the assets and to settle the liabilities simultaneously.
4.22 Reserves
Reserve are classified into two categories as follows:
4.22.1 Revenue reserve
Revenue reserve is the reserve which is regarded as available for distribution through the profit or loss including general reserves and other specific reserves created out of profit and un-appropriated or accumulated profits of previous years.
4.22.2 Capital reserve
Capital reserve includes all the reserves other than reserve which are classified as revenue reserve. 4.23 Earning per share
The company presents basic and diluted Earning Per Share (EPS) data for its ordinary shares. Basic EPS is calculated by dividing the profit after tax attributable to ordinary shareholders of the company by the weighted average number of ordinary shares outstanding during the year. Diluted EPS is determined by adjusting the profit or loss attributable to ordinary shareholders and the weighted average number of ordinary shares outstanding for the effects of all dilutive potential ordinary shares.
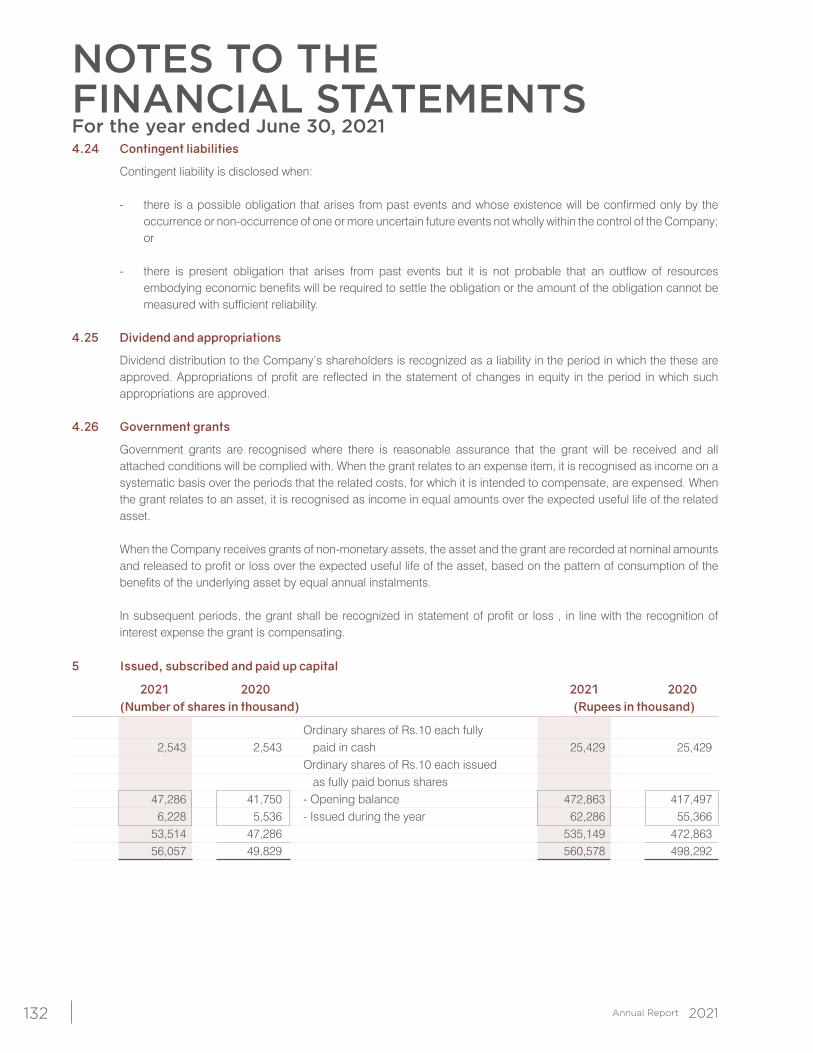
NOTES TO THE FINANCIAL STATEMENTSFor the year ended June 30, 2021
132
4.24 Contingent liabilities
Contingent liability is disclosed when:
- there is a possible obligation that arises from past events and whose existence will be confirmed only by the occurrence or non-occurrence of one or more uncertain future events not wholly within the control of the Company; or
- there is present obligation that arises from past events but it is not probable that an outflow of resources embodying economic benefits will be required to settle the obligation or the amount of the obligation cannot be measured with sufficient reliability.
4.25 Dividend and appropriations
Dividend distribution to the Company’s shareholders is recognized as a liability in the period in which the these are approved. Appropriations of profit are reflected in the statement of changes in equity in the period in which such appropriations are approved.
4.26 Government grants
Government grants are recognised where there is reasonable assurance that the grant will be received and all attached conditions will be complied with. When the grant relates to an expense item, it is recognised as income on a systematic basis over the periods that the related costs, for which it is intended to compensate, are expensed. When the grant relates to an asset, it is recognised as income in equal amounts over the expected useful life of the related asset.
When the Company receives grants of non-monetary assets, the asset and the grant are recorded at nominal amounts
and released to profit or loss over the expected useful life of the asset, based on the pattern of consumption of the benefits of the underlying asset by equal annual instalments.
In subsequent periods, the grant shall be recognized in statement of profit or loss , in line with the recognition of
interest expense the grant is compensating.
5 Issued, subscribed and paid up capital
2021 2020 2021 2020 (Number of shares in thousand) (Rupees in thousand)
Ordinary shares of Rs.10 each fully 2,543 2,543 paid in cash 25,429 25,429 Ordinary shares of Rs.10 each issued as fully paid bonus shares 47,286 41,750 - Opening balance 472,863 417,497 6,228 5,536 - Issued during the year 62,286 55,366 53,514 47,286 535,149 472,863 56,057 49,829 560,578 498,292
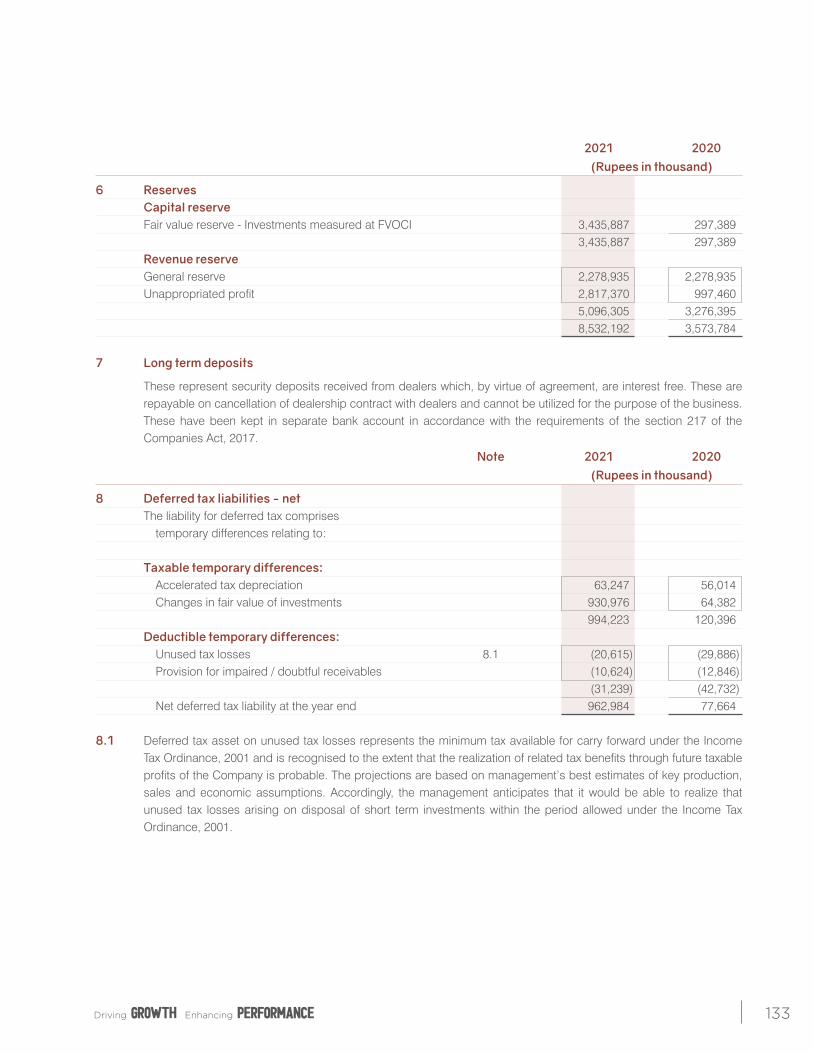
133
2021 2020 (Rupees in thousand)
6 Reserves Capital reserve Fair value reserve - Investments measured at FVOCI 3,435,887 297,389 3,435,887 297,389 Revenue reserve General reserve 2,278,935 2,278,935 Unappropriated profit 2,817,370 997,460 5,096,305 3,276,395 8,532,192 3,573,784
7 Long term deposits
These represent security deposits received from dealers which, by virtue of agreement, are interest free. These are repayable on cancellation of dealership contract with dealers and cannot be utilized for the purpose of the business. These have been kept in separate bank account in accordance with the requirements of the section 217 of the Companies Act, 2017.
Note 2021 2020 (Rupees in thousand)
8 Deferred tax liabilities - net The liability for deferred tax comprises temporary differences relating to: Taxable temporary differences: Accelerated tax depreciation 63,247 56,014 Changes in fair value of investments 930,976 64,382 994,223 120,396 Deductible temporary differences: Unused tax losses 8.1 (20,615) (29,886) Provision for impaired / doubtful receivables (10,624) (12,846) (31,239) (42,732) Net deferred tax liability at the year end 962,984 77,664 8.1 Deferred tax asset on unused tax losses represents the minimum tax available for carry forward under the Income
Tax Ordinance, 2001 and is recognised to the extent that the realization of related tax benefits through future taxable profits of the Company is probable. The projections are based on management’s best estimates of key production, sales and economic assumptions. Accordingly, the management anticipates that it would be able to realize that unused tax losses arising on disposal of short term investments within the period allowed under the Income Tax Ordinance, 2001.
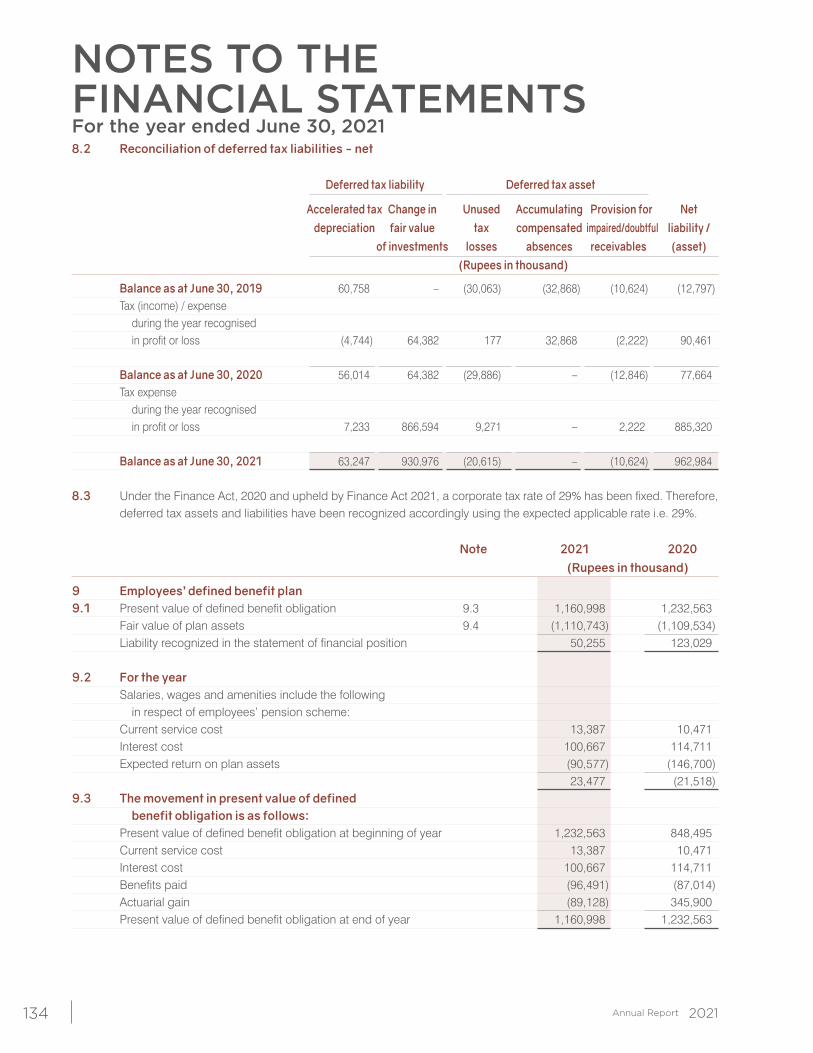
NOTES TO THE FINANCIAL STATEMENTSFor the year ended June 30, 2021
134
8.2 Reconciliation of deferred tax liabilities - net
Deferred tax liability Deferred tax asset
Accelerated tax Change in Unused Accumulating Provision for Net depreciation fair value tax compensated impaired/doubtful liability / of investments losses absences receivables (asset) (Rupees in thousand)
Balance as at June 30, 2019 60,758 – (30,063) (32,868) (10,624) (12,797) Tax (income) / expense during the year recognised in profit or loss (4,744) 64,382 177 32,868 (2,222) 90,461 Balance as at June 30, 2020 56,014 64,382 (29,886) – (12,846) 77,664 Tax expense during the year recognised in profit or loss 7,233 866,594 9,271 – 2,222 885,320 Balance as at June 30, 2021 63,247 930,976 (20,615) – (10,624) 962,984 8.3 Under the Finance Act, 2020 and upheld by Finance Act 2021, a corporate tax rate of 29% has been fixed. Therefore,
deferred tax assets and liabilities have been recognized accordingly using the expected applicable rate i.e. 29%.
Note 2021 2020 (Rupees in thousand)
9 Employees’ defined benefit plan 9.1 Present value of defined benefit obligation 9.3 1,160,998 1,232,563 Fair value of plan assets 9.4 (1,110,743) (1,109,534) Liability recognized in the statement of financial position 50,255 123,029 9.2 For the year Salaries, wages and amenities include the following in respect of employees’ pension scheme: Current service cost 13,387 10,471 Interest cost 100,667 114,711 Expected return on plan assets (90,577) (146,700) 23,477 (21,518)9.3 The movement in present value of defined benefit obligation is as follows: Present value of defined benefit obligation at beginning of year 1,232,563 848,495 Current service cost 13,387 10,471 Interest cost 100,667 114,711 Benefits paid (96,491) (87,014) Actuarial gain (89,128) 345,900 Present value of defined benefit obligation at end of year 1,160,998 1,232,563
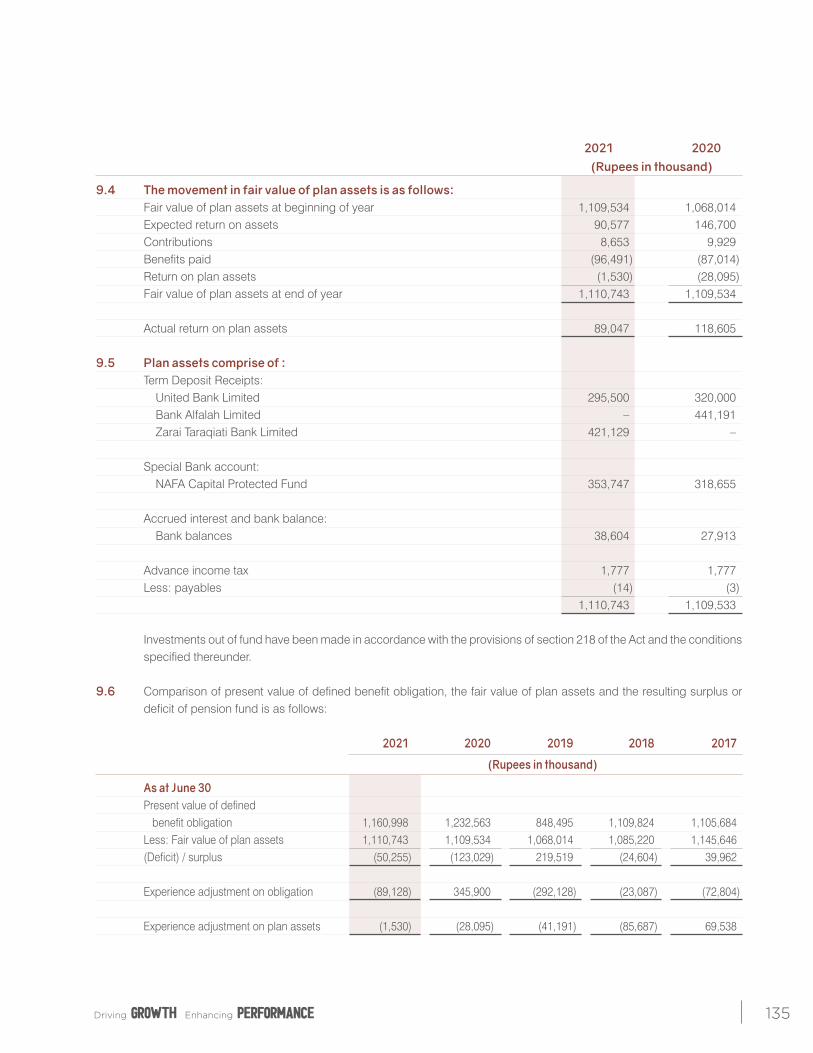
135
2021 2020 (Rupees in thousand)
9.4 The movement in fair value of plan assets is as follows: Fair value of plan assets at beginning of year 1,109,534 1,068,014 Expected return on assets 90,577 146,700 Contributions 8,653 9,929 Benefits paid (96,491) (87,014) Return on plan assets (1,530) (28,095) Fair value of plan assets at end of year 1,110,743 1,109,534 Actual return on plan assets 89,047 118,605 9.5 Plan assets comprise of : Term Deposit Receipts: United Bank Limited 295,500 320,000 Bank Alfalah Limited – 441,191 Zarai Taraqiati Bank Limited 421,129 – Special Bank account: NAFA Capital Protected Fund 353,747 318,655 Accrued interest and bank balance: Bank balances 38,604 27,913 Advance income tax 1,777 1,777 Less: payables (14) (3) 1,110,743 1,109,533 Investments out of fund have been made in accordance with the provisions of section 218 of the Act and the conditions
specified thereunder.
9.6 Comparison of present value of defined benefit obligation, the fair value of plan assets and the resulting surplus or deficit of pension fund is as follows:
2021 2020 2019 2018 2017
(Rupees in thousand)
As at June 30 Present value of defined benefit obligation 1,160,998 1,232,563 848,495 1,109,824 1,105,684 Less: Fair value of plan assets 1,110,743 1,109,534 1,068,014 1,085,220 1,145,646 (Deficit) / surplus (50,255) (123,029) 219,519 (24,604) 39,962
Experience adjustment on obligation (89,128) 345,900 (292,128) (23,087) (72,804)
Experience adjustment on plan assets (1,530) (28,095) (41,191) (85,687) 69,538
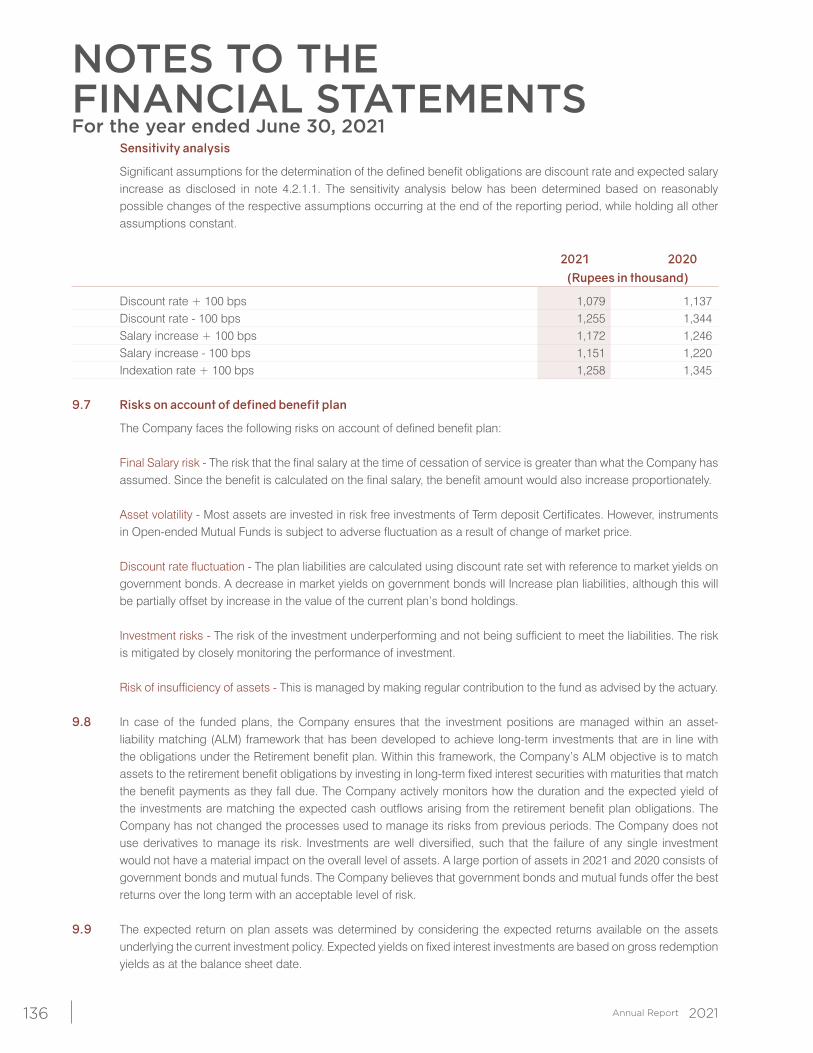
NOTES TO THE FINANCIAL STATEMENTSFor the year ended June 30, 2021
136
Sensitivity analysis
Significant assumptions for the determination of the defined benefit obligations are discount rate and expected salary increase as disclosed in note 4.2.1.1. The sensitivity analysis below has been determined based on reasonably possible changes of the respective assumptions occurring at the end of the reporting period, while holding all other assumptions constant.
2021 2020 (Rupees in thousand)
Discount rate + 100 bps 1,079 1,137 Discount rate - 100 bps 1,255 1,344 Salary increase + 100 bps 1,172 1,246 Salary increase - 100 bps 1,151 1,220 Indexation rate + 100 bps 1,258 1,345 9.7 Risks on account of defined benefit plan
The Company faces the following risks on account of defined benefit plan: Final Salary risk - The risk that the final salary at the time of cessation of service is greater than what the Company has
assumed. Since the benefit is calculated on the final salary, the benefit amount would also increase proportionately. Asset volatility - Most assets are invested in risk free investments of Term deposit Certificates. However, instruments
in Open-ended Mutual Funds is subject to adverse fluctuation as a result of change of market price. Discount rate fluctuation - The plan liabilities are calculated using discount rate set with reference to market yields on
government bonds. A decrease in market yields on government bonds will Increase plan liabilities, although this will be partially offset by increase in the value of the current plan’s bond holdings.
Investment risks - The risk of the investment underperforming and not being sufficient to meet the liabilities. The risk
is mitigated by closely monitoring the performance of investment. Risk of insufficiency of assets - This is managed by making regular contribution to the fund as advised by the actuary. 9.8 In case of the funded plans, the Company ensures that the investment positions are managed within an asset-
liability matching (ALM) framework that has been developed to achieve long-term investments that are in line with the obligations under the Retirement benefit plan. Within this framework, the Company’s ALM objective is to match assets to the retirement benefit obligations by investing in long-term fixed interest securities with maturities that match the benefit payments as they fall due. The Company actively monitors how the duration and the expected yield of the investments are matching the expected cash outflows arising from the retirement benefit plan obligations. The Company has not changed the processes used to manage its risks from previous periods. The Company does not use derivatives to manage its risk. Investments are well diversified, such that the failure of any single investment would not have a material impact on the overall level of assets. A large portion of assets in 2021 and 2020 consists of government bonds and mutual funds. The Company believes that government bonds and mutual funds offer the best returns over the long term with an acceptable level of risk.
9.9 The expected return on plan assets was determined by considering the expected returns available on the assets underlying the current investment policy. Expected yields on fixed interest investments are based on gross redemption yields as at the balance sheet date.
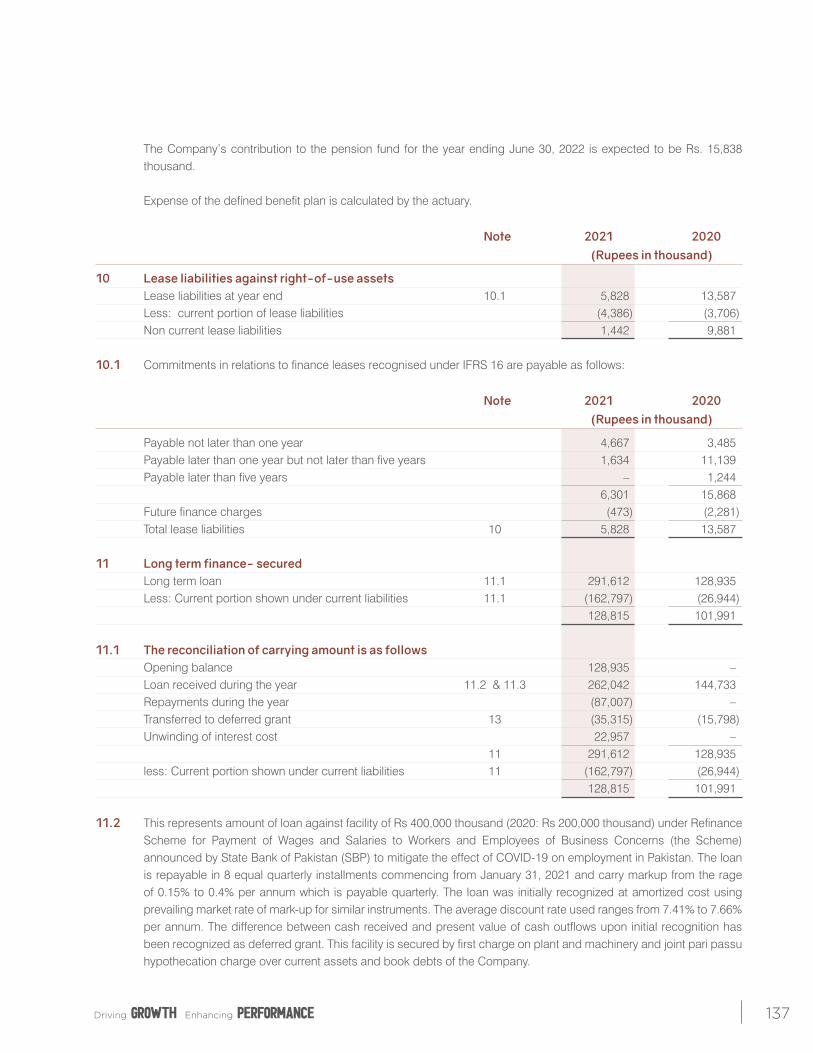
137
The Company’s contribution to the pension fund for the year ending June 30, 2022 is expected to be Rs. 15,838 thousand.
Expense of the defined benefit plan is calculated by the actuary.
Note 2021 2020 (Rupees in thousand)
10 Lease liabilities against right-of-use assets Lease liabilities at year end 10.1 5,828 13,587 Less: current portion of lease liabilities (4,386) (3,706) Non current lease liabilities 1,442 9,881 10.1 Commitments in relations to finance leases recognised under IFRS 16 are payable as follows:
Note 2021 2020 (Rupees in thousand)
Payable not later than one year 4,667 3,485 Payable later than one year but not later than five years 1,634 11,139 Payable later than five years – 1,244 6,301 15,868 Future finance charges (473) (2,281) Total lease liabilities 10 5,828 13,587 11 Long term finance- secured Long term loan 11.1 291,612 128,935 Less: Current portion shown under current liabilities 11.1 (162,797) (26,944) 128,815 101,991 11.1 The reconciliation of carrying amount is as follows Opening balance 128,935 – Loan received during the year 11.2 & 11.3 262,042 144,733 Repayments during the year (87,007) – Transferred to deferred grant 13 (35,315) (15,798) Unwinding of interest cost 22,957 – 11 291,612 128,935 less: Current portion shown under current liabilities 11 (162,797) (26,944) 128,815 101,991
11.2 This represents amount of loan against facility of Rs 400,000 thousand (2020: Rs 200,000 thousand) under Refinance Scheme for Payment of Wages and Salaries to Workers and Employees of Business Concerns (the Scheme) announced by State Bank of Pakistan (SBP) to mitigate the effect of COVID-19 on employment in Pakistan. The loan is repayable in 8 equal quarterly installments commencing from January 31, 2021 and carry markup from the rage of 0.15% to 0.4% per annum which is payable quarterly. The loan was initially recognized at amortized cost using prevailing market rate of mark-up for similar instruments. The average discount rate used ranges from 7.41% to 7.66% per annum. The difference between cash received and present value of cash outflows upon initial recognition has been recognized as deferred grant. This facility is secured by first charge on plant and machinery and joint pari passu hypothecation charge over current assets and book debts of the Company.
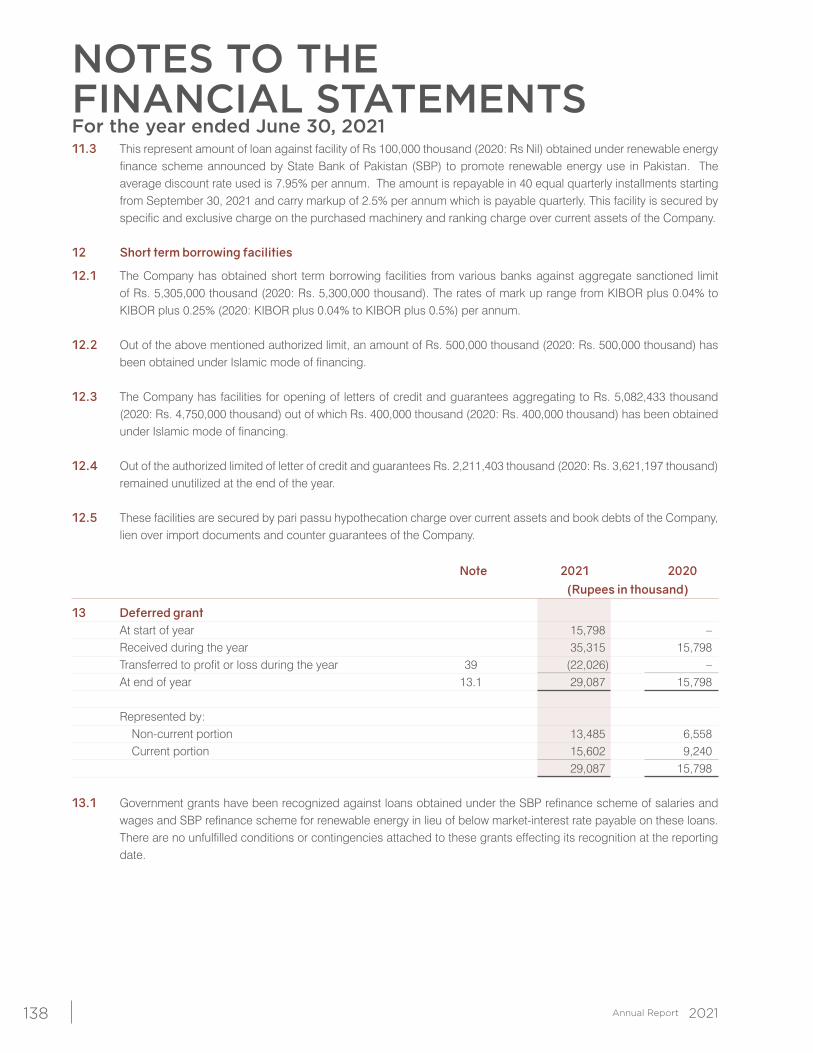
NOTES TO THE FINANCIAL STATEMENTSFor the year ended June 30, 2021
138
11.3 This represent amount of loan against facility of Rs 100,000 thousand (2020: Rs Nil) obtained under renewable energy finance scheme announced by State Bank of Pakistan (SBP) to promote renewable energy use in Pakistan. The average discount rate used is 7.95% per annum. The amount is repayable in 40 equal quarterly installments starting from September 30, 2021 and carry markup of 2.5% per annum which is payable quarterly. This facility is secured by specific and exclusive charge on the purchased machinery and ranking charge over current assets of the Company.
12 Short term borrowing facilities
12.1 The Company has obtained short term borrowing facilities from various banks against aggregate sanctioned limit of Rs. 5,305,000 thousand (2020: Rs. 5,300,000 thousand). The rates of mark up range from KIBOR plus 0.04% to KIBOR plus 0.25% (2020: KIBOR plus 0.04% to KIBOR plus 0.5%) per annum.
12.2 Out of the above mentioned authorized limit, an amount of Rs. 500,000 thousand (2020: Rs. 500,000 thousand) has
been obtained under Islamic mode of financing. 12.3 The Company has facilities for opening of letters of credit and guarantees aggregating to Rs. 5,082,433 thousand
(2020: Rs. 4,750,000 thousand) out of which Rs. 400,000 thousand (2020: Rs. 400,000 thousand) has been obtained under Islamic mode of financing.
12.4 Out of the authorized limited of letter of credit and guarantees Rs. 2,211,403 thousand (2020: Rs. 3,621,197 thousand)
remained unutilized at the end of the year. 12.5 These facilities are secured by pari passu hypothecation charge over current assets and book debts of the Company,
lien over import documents and counter guarantees of the Company.
Note 2021 2020 (Rupees in thousand)
13 Deferred grant At start of year 15,798 – Received during the year 35,315 15,798 Transferred to profit or loss during the year 39 (22,026) – At end of year 13.1 29,087 15,798 Represented by: Non-current portion 13,485 6,558 Current portion 15,602 9,240 29,087 15,798 13.1 Government grants have been recognized against loans obtained under the SBP refinance scheme of salaries and
wages and SBP refinance scheme for renewable energy in lieu of below market-interest rate payable on these loans. There are no unfulfilled conditions or contingencies attached to these grants effecting its recognition at the reporting date.
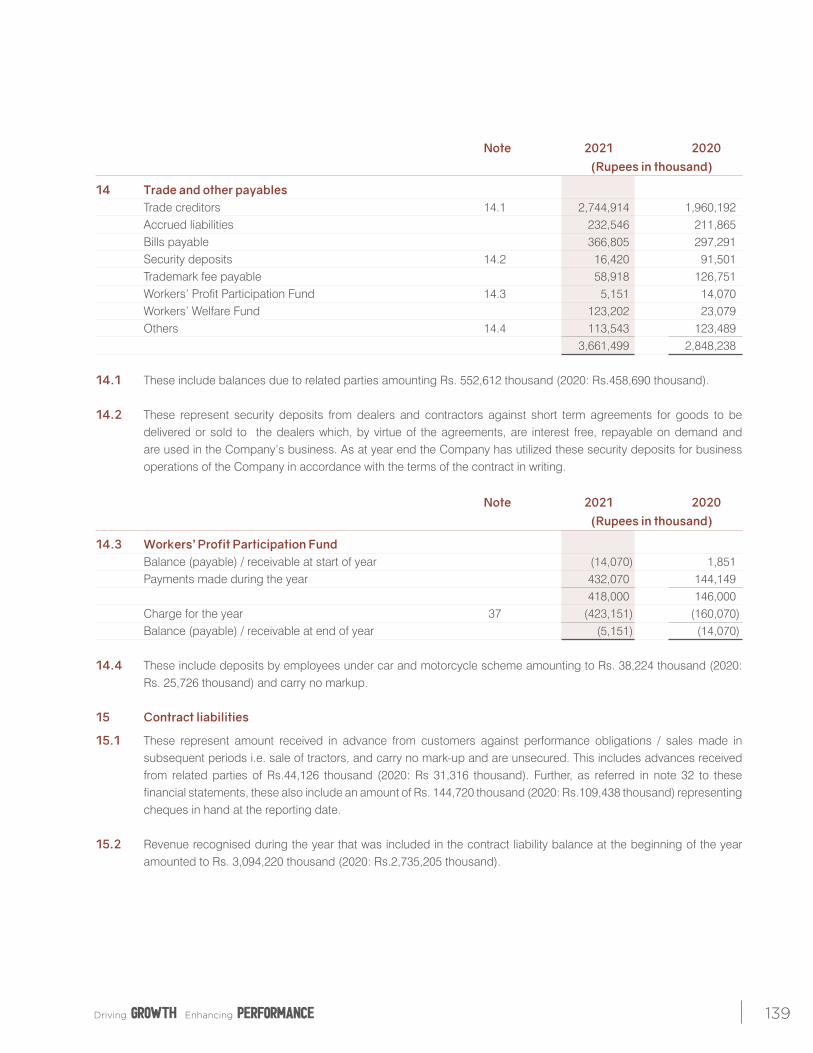
139
Note 2021 2020 (Rupees in thousand)
14 Trade and other payables Trade creditors 14.1 2,744,914 1,960,192 Accrued liabilities 232,546 211,865 Bills payable 366,805 297,291 Security deposits 14.2 16,420 91,501 Trademark fee payable 58,918 126,751 Workers’ Profit Participation Fund 14.3 5,151 14,070 Workers’ Welfare Fund 123,202 23,079 Others 14.4 113,543 123,489 3,661,499 2,848,238 14.1 These include balances due to related parties amounting Rs. 552,612 thousand (2020: Rs.458,690 thousand). 14.2 These represent security deposits from dealers and contractors against short term agreements for goods to be
delivered or sold to the dealers which, by virtue of the agreements, are interest free, repayable on demand and are used in the Company’s business. As at year end the Company has utilized these security deposits for business operations of the Company in accordance with the terms of the contract in writing.
Note 2021 2020 (Rupees in thousand)
14.3 Workers’ Profit Participation Fund Balance (payable) / receivable at start of year (14,070) 1,851 Payments made during the year 432,070 144,149 418,000 146,000 Charge for the year 37 (423,151) (160,070) Balance (payable) / receivable at end of year (5,151) (14,070) 14.4 These include deposits by employees under car and motorcycle scheme amounting to Rs. 38,224 thousand (2020:
Rs. 25,726 thousand) and carry no markup. 15 Contract liabilities
15.1 These represent amount received in advance from customers against performance obligations / sales made in subsequent periods i.e. sale of tractors, and carry no mark-up and are unsecured. This includes advances received from related parties of Rs.44,126 thousand (2020: Rs 31,316 thousand). Further, as referred in note 32 to these financial statements, these also include an amount of Rs. 144,720 thousand (2020: Rs.109,438 thousand) representing cheques in hand at the reporting date.
15.2 Revenue recognised during the year that was included in the contract liability balance at the beginning of the year
amounted to Rs. 3,094,220 thousand (2020: Rs.2,735,205 thousand).
NOTES TO THE FINANCIAL STATEMENTSFor the year ended June 30, 2021
140
16 Contingencies and commitments
16.1 Contingencies
16.1.1 The Company has provided guarantee amounting to Rs. 5,000 thousand (2020: Rs.5,000 thousand) to banks for repayment of loan by employees. An amount of Rs. 1,133 thousand (2020: Rs. 1,133 thousand) was utilized by employees as at June 30, 2021.
16.1.2 Guarantees issued by the banks on behalf of the Company in the normal course of business amount to Rs. 1,039,465
thousand (2020: Rs.524,559 thousand). 16.1.3 Income tax returns for the years from 2007 to 2020 have been filed by the Company under the provisions of section
120 of the Income Tax Ordinance, 2001 (the Ordinance). The Income tax department has disputed with the Company’s treatment on certain tax matters for the tax years 2013,
2015 and 2016, entailing an additional tax liability of Rs. 678,595 thousand. Of these the only significant tax matter, amounting to Rs. 507,588 thousand, relates to disallowances made by tax authorities in respect of consumption of stock and consequently value of closing stock claimed by the Company in its income tax returns for the tax year 2015. Both the Company and Income tax department are currently in appeal at the Commissioner Inland Revenue Appeals and Appellate tribunal level regarding the tax matters, decisions of which are pending. The management in consultation with their tax advisor is confident that all the tax matters will eventually be decided in the favor of the Company; therefore no provision has been made in these financial statements accordingly.
16.1.4 The Company is defending a demand of Rs 289,430 thousand from the Additional Commissioner Inland Revenue,
Lahore and later upheld by the Deputy Commissioner Inland Revenue (Appeals) against the Company regarding the reduced payment of sales tax on sale of tractors by the Company to its customers in the period June 2016.
The Company filed the appeal in 2017 against the aforementioned orders, to the Appellate Tribunal Inland Revenue
(ATIR) which was ruled in favor of the Company and later challenged by the Commissioner Inland Revenue, Lahore in the High Court, Lahore. During the current year the High Court, Lahore remanded back the case to the ATIR. Hence, the matter is currently pending in ATIR.
The management and the legal advisor are confident that outcome of the case would be in the Company’s favor
and no payment in this regard would be required, hence no provision there against has been made in these financial statements.
16.1.5 During the current year the Income tax department has disputed the Company’s payment against Workers’ Welfare
Fund for years 2014 to 2020 and thereby created a demand of Rs. 657,509 thousand under section 4(9) of Workers Welfare Fund Ordinance, 1971.
The Company has submitted its response on the aforementioned order to the Income tax department which is currently
pending a response. The management in consultation with their tax advisor is confident that the matter will eventually be decided in the favor of the Company; therefore no provision has been made in these financial statements.
141
16.1.6 The Deputy Commission Inland Revenue has issued withholding tax assessment orders u/s 161/205 of the Ordinance for the tax year 2011 creating an initial demand of Rs. 176,000 thousand. The Company preferred an appeal before the Commissioner Inland Revenue (Appeals) (CIR(A)). The CIR(A) passed an order dated January 21, 2015 remanding back the issue to Deputy Commissioner. Reassessment proceedings after being finalized on January 25, 2016 reduced the demand to Rs. 51,000 thousand. The Company is in the process of filing appeal against reassessment proceedings with CIR(A). Furthermore, the tax authorities have filed an appeal before Appellate Tribunal Inland Revenue (ATIR) against the order passed by CIR(A). The management in consultation with their tax advisor are confident that the above matter will eventually be decided in favor of the Company; therefore no provision has been created in these financial statements.
16.1.7 The Company is defending a suit for Rs. 19,579 thousand, filed in previous years by an ex-vendor on account of
damages and inconvenience. Previously, the case was pending before the Civil Court, Lahore. However during the last year it was held by the Civil Court that the damages of Rs. 15,000 thousand has been awarded in favor of vendor for the aforementioned inconvenience. In addition to that the Company is also required to pay the amount of parts already supplied by the vendor which amounts to Rs 4,579 thousand along with mark up @ 7% per annum till its realization. However the Company has filed an appeal in the Honorable High Court, Lahore against the aforesaid order of Civil Court. The management and the legal advisor are confident that outcome of the case would be in the Company’s favor and no payment in this regard would be required, hence no provision there against has been made in these financial statements.
16.1.8 The Company is defending a demand of Rs. 3,944 thousand from the Additional Commissioner Inland Revenue,
Lahore, regarding non payment of sales tax on replacements of warranty parts supplied by the Company to its customers. The Company filed the appeal in 2010 against the aforementioned order passed, to Commissioner of Inland Revenue, Lahore. Which held that the Company is liable to pay the amount of sales tax on warranty parts which amounts to Rs 3,944 thousand along with default surcharge and penalty @ 5% under section 33 of Sales Tax Act, 1990. The Company has filed an appeal against the aforementioned order in the Honorable High Court, Lahore. The management and the legal advisor are confident of favorable outcome of the case, hence no provision in this regard has been made in these financial statements.
16.1.9 The Company is defending a demand of Rs. 31,869 thousand from the Customs Authorities (Authorities), alleging
the Company for non payment of custom duty and other additional duties. The demand is on account of purchase of certain starter motors and alternators to be used for the manufacture of the tractors. The Company filed an appeal against the said demand and the order passed by Additional Collector, Lahore and Collector Appeals, Lahore before the Customs Appellate Tribunal, Lahore and the said tribunal passed order in favor of the Company. The Custom department has filed reference against the decision in Honorable High Court, Lahore, judgment of which is pending. The Company made payment of Rs. 8,000 thousand under protest in response to demand notice served and obtained stay order from Honorable High Court, Lahore against further recovery action of Authorities. The management are confident that the outcome of the case would be decided in their favor hence no provision relating to aforesaid demand has been made in these financial statements.
16.2 Commitments
Commitments in respect of outstanding letters of credit for import of raw material amounting to Rs. 1,831,565 thousand (2020: Rs. 604,243 thousand) at the reporting date.
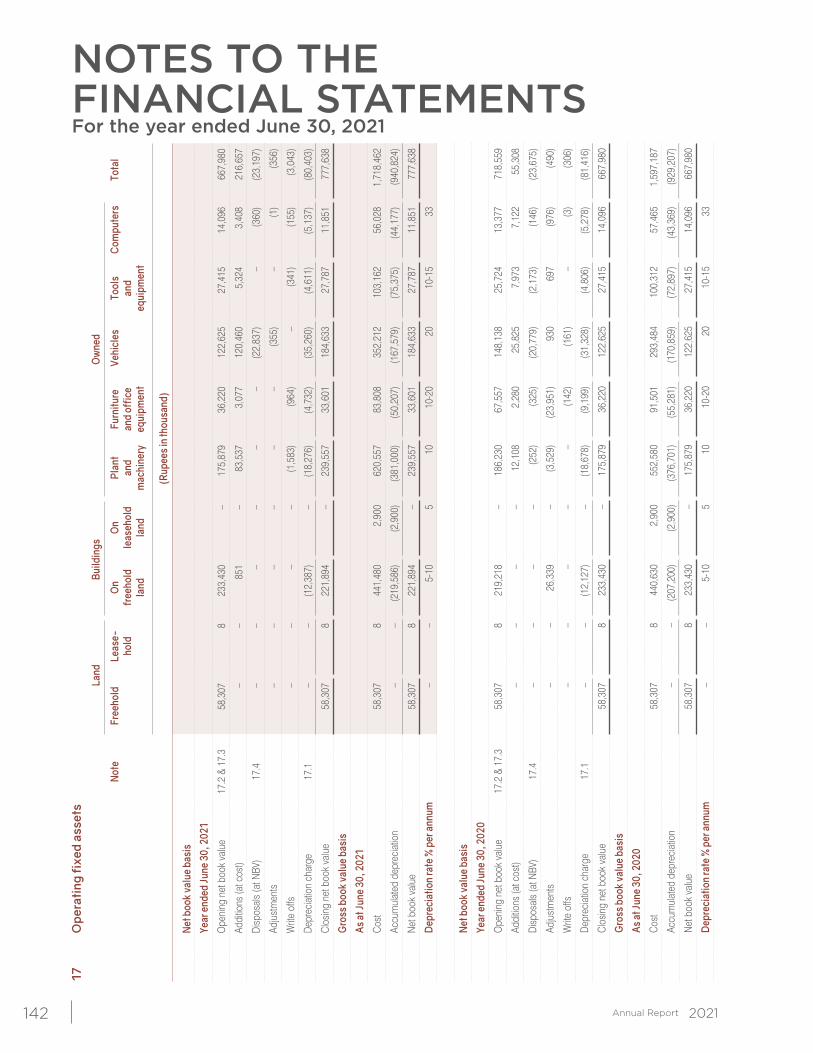
NOTES TO THE FINANCIAL STATEMENTSFor the year ended June 30, 2021
142
17
Ope
rati
ng fi
xed
asse
ts
Land
Bu
ildin
gs
Ow
ned
N
ote
Free
hold
Le
ase-
O
n O
n Pl
ant
Furn
iture
Ve
hicl
es
Tool
s C
ompu
ters
To
tal
ho
ld
free
hold
le
aseh
old
and
and
offic
e
and
land
la
nd
mac
hine
ry
equi
pmen
t
equi
pmen
t
(R
upee
s in
thou
sand
)
N
et b
ook
valu
e ba
sis
Ye
ar e
nded
June
30,
202
1
O
peni
ng n
et b
ook
valu
e 17
.2 &
17.
3 5
8,30
7
8
233
,430
–
1
75,8
79
36,
220
1
22,6
25
27,
415
1
4,09
6
667
,980
Ad
ditio
ns (a
t cos
t)
–
–
851
–
8
3,53
7
3,0
77
120
,460
5
,324
3
,408
2
16,6
57
Di
spos
als
(at N
BV)
17.4
–
–
–
–
–
–
(2
2,83
7)
–
(360
) (2
3,19
7)
Ad
just
men
ts
–
–
–
–
–
–
(355
) –
(1
) (3
56)
W
rite
offs
–
–
–
–
(1
,583
) (9
64)
–
(341
) (1
55)
(3,0
43)
De
prec
iatio
n ch
arge
17
.1
–
–
(12,
387)
–
(18,
276)
(4
,732
) (3
5,26
0)
(4,6
11)
(5,1
37)
(80,
403)
Cl
osin
g ne
t boo
k va
lue
5
8,30
7
8
221
,894
–
239
,557
3
3,60
1
184
,633
2
7,78
7
11,
851
7
77,6
38
G
ross
boo
k va
lue
basi
s
As
at J
une
30, 2
021
Co
st
5
8,30
7
8
441
,480
2
,900
6
20,5
57
83,
808
3
52,2
12
103
,162
5
6,02
8
1,7
18,4
62
Ac
cum
ulat
ed d
epre
ciat
ion
–
–
(219
,586
) (2
,900
) (3
81,0
00)
(50,
207)
(1
67,5
79)
(75,
375)
(4
4,17
7)
(940
,824
)
Ne
t boo
k va
lue
5
8,30
7
8
221
,894
–
2
39,5
57
33,
601
1
84,6
33
27,
787
1
1,85
1
777
,638
D
epre
ciat
ion
rate
% p
er a
nnum
–
–
5-
10
5 10
10
-20
20
10-1
5 33
N
et b
ook
valu
e ba
sis
Ye
ar e
nded
June
30,
202
0
O
peni
ng n
et b
ook
valu
e 17
.2 &
17.
3 5
8,30
7
8
219
,218
–
1
86,2
30
67,
557
1
48,1
38
25,
724
1
3,37
7
718
,559
Ad
ditio
ns (a
t cos
t)
–
–
–
–
1
2,10
8
2,2
80
25,
825
7
,973
7
,122
5
5,30
8
Di
spos
als
(at N
BV)
17.4
–
–
–
–
(252
) (3
25)
(20,
779)
(2
,173
) (1
46)
(23,
675)
Ad
just
men
ts
–
–
26,
339
–
(3
,529
) (2
3,95
1)
930
6
97
(976
) (4
90)
W
rite
offs
–
–
–
–
–
(142
) (1
61)
–
(3)
(306
)
De
prec
iatio
n ch
arge
17
.1
–
–
(1
2,12
7)
–
(18,
678)
(9
,199
) (3
1,32
8)
(4,8
06)
(5,2
78)
(81,
416)
Cl
osin
g ne
t boo
k va
lue
5
8,30
7
8
233
,430
–
1
75,8
79
36,
220
1
22,6
25
27,
415
1
4,09
6
667
,980
G
ross
boo
k va
lue
basi
s
As
at J
une
30, 2
020
Co
st
5
8,30
7
8
440
,630
2
,900
5
52,5
80
91,
501
2
93,4
84
100
,312
5
7,46
5
1,5
97,1
87
Ac
cum
ulat
ed d
epre
ciat
ion
–
–
(207
,200
) (2
,900
) (3
76,7
01)
(55,
281)
(1
70,8
59)
(72,
897)
(4
3,36
9)
(929
,207
)
Ne
t boo
k va
lue
5
8,30
7
8
233
,430
–
1
75,8
79
36,
220
1
22,6
25
27,
415
1
4,09
6
667
,980
D
epre
ciat
ion
rate
% p
er a
nnum
–
–
5-10
5
10
10-2
0 20
10
-15
33
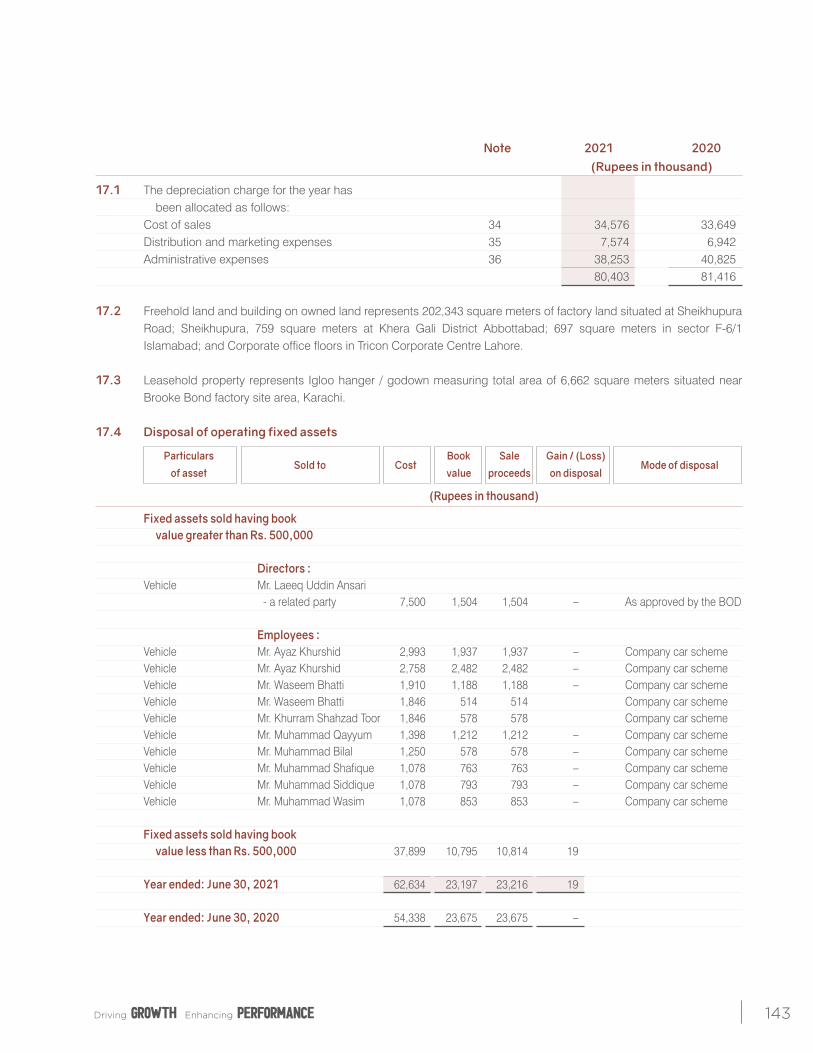
143
Note 2021 2020 (Rupees in thousand)
17.1 The depreciation charge for the year has been allocated as follows: Cost of sales 34 34,576 33,649 Distribution and marketing expenses 35 7,574 6,942 Administrative expenses 36 38,253 40,825 80,403 81,416 17.2 Freehold land and building on owned land represents 202,343 square meters of factory land situated at Sheikhupura
Road; Sheikhupura, 759 square meters at Khera Gali District Abbottabad; 697 square meters in sector F-6/1 Islamabad; and Corporate office floors in Tricon Corporate Centre Lahore.
17.3 Leasehold property represents Igloo hanger / godown measuring total area of 6,662 square meters situated near
Brooke Bond factory site area, Karachi. 17.4 Disposal of operating fixed assets
Particulars Sold to Cost
Book Sale Gain / (Loss) Mode of disposal
of asset value proceeds on disposal
(Rupees in thousand)
Fixed assets sold having book value greater than Rs. 500,000
Directors : Vehicle Mr. Laeeq Uddin Ansari - a related party 7,500 1,504 1,504 – As approved by the BOD
Employees : Vehicle Mr. Ayaz Khurshid 2,993 1,937 1,937 – Company car scheme Vehicle Mr. Ayaz Khurshid 2,758 2,482 2,482 – Company car scheme Vehicle Mr. Waseem Bhatti 1,910 1,188 1,188 – Company car scheme Vehicle Mr. Waseem Bhatti 1,846 514 514 Company car scheme Vehicle Mr. Khurram Shahzad Toor 1,846 578 578 Company car scheme Vehicle Mr. Muhammad Qayyum 1,398 1,212 1,212 – Company car scheme Vehicle Mr. Muhammad Bilal 1,250 578 578 – Company car scheme Vehicle Mr. Muhammad Shafique 1,078 763 763 – Company car scheme Vehicle Mr. Muhammad Siddique 1,078 793 793 – Company car scheme Vehicle Mr. Muhammad Wasim 1,078 853 853 – Company car scheme Fixed assets sold having book value less than Rs. 500,000 37,899 10,795 10,814 19 Year ended: June 30, 2021 62,634 23,197 23,216 19 Year ended: June 30, 2020 54,338 23,675 23,675 –
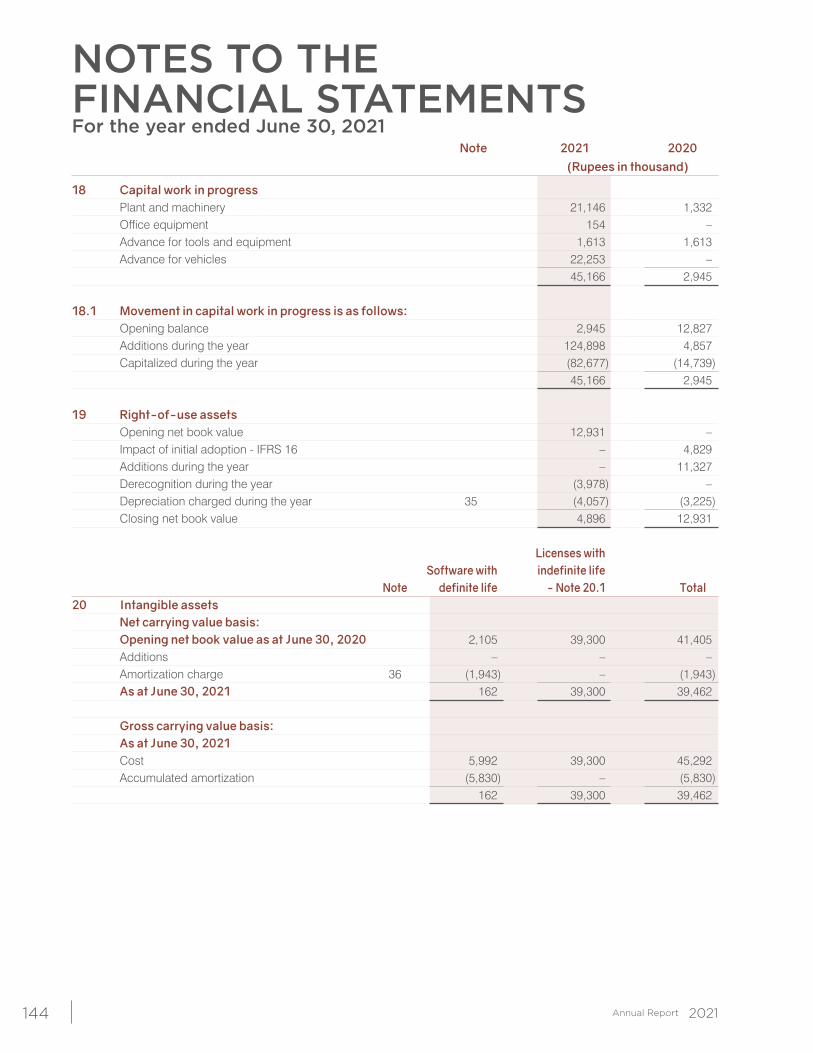
NOTES TO THE FINANCIAL STATEMENTSFor the year ended June 30, 2021
144
Note 2021 2020 (Rupees in thousand)
18 Capital work in progress Plant and machinery 21,146 1,332 Office equipment 154 – Advance for tools and equipment 1,613 1,613 Advance for vehicles 22,253 – 45,166 2,945 18.1 Movement in capital work in progress is as follows: Opening balance 2,945 12,827 Additions during the year 124,898 4,857 Capitalized during the year (82,677) (14,739) 45,166 2,945 19 Right-of-use assets Opening net book value 12,931 – Impact of initial adoption - IFRS 16 – 4,829 Additions during the year – 11,327 Derecognition during the year (3,978) – Depreciation charged during the year 35 (4,057) (3,225) Closing net book value 4,896 12,931 Licenses with Software with indefinite life Note definite life - Note 20.1 Total20 Intangible assets Net carrying value basis: Opening net book value as at June 30, 2020 2,105 39,300 41,405 Additions – – – Amortization charge 36 (1,943) – (1,943) As at June 30, 2021 162 39,300 39,462 Gross carrying value basis: As at June 30, 2021 Cost 5,992 39,300 45,292 Accumulated amortization (5,830) – (5,830) 162 39,300 39,462
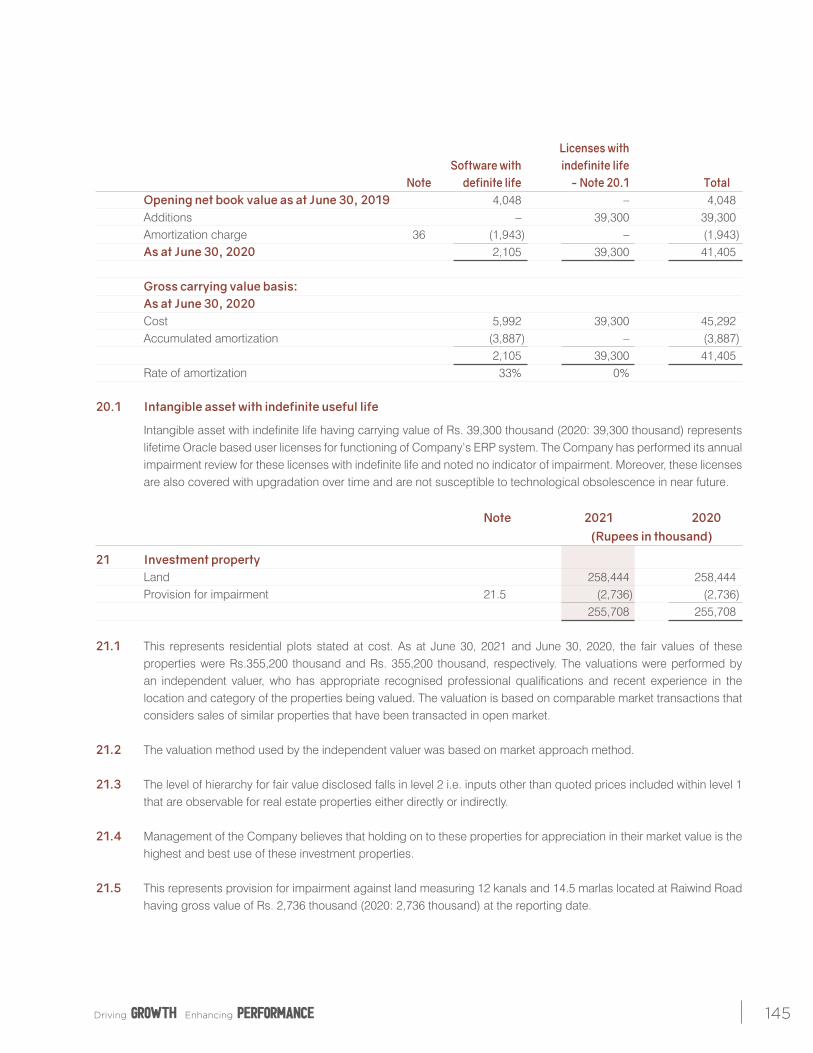
145
Licenses with Software with indefinite life Note definite life - Note 20.1 Total Opening net book value as at June 30, 2019 4,048 – 4,048 Additions – 39,300 39,300 Amortization charge 36 (1,943) – (1,943) As at June 30, 2020 2,105 39,300 41,405 Gross carrying value basis: As at June 30, 2020 Cost 5,992 39,300 45,292 Accumulated amortization (3,887) – (3,887) 2,105 39,300 41,405 Rate of amortization 33% 0%
20.1 Intangible asset with indefinite useful life
Intangible asset with indefinite life having carrying value of Rs. 39,300 thousand (2020: 39,300 thousand) represents lifetime Oracle based user licenses for functioning of Company’s ERP system. The Company has performed its annual impairment review for these licenses with indefinite life and noted no indicator of impairment. Moreover, these licenses are also covered with upgradation over time and are not susceptible to technological obsolescence in near future.
Note 2021 2020 (Rupees in thousand)
21 Investment property Land 258,444 258,444 Provision for impairment 21.5 (2,736) (2,736) 255,708 255,708 21.1 This represents residential plots stated at cost. As at June 30, 2021 and June 30, 2020, the fair values of these
properties were Rs.355,200 thousand and Rs. 355,200 thousand, respectively. The valuations were performed by an independent valuer, who has appropriate recognised professional qualifications and recent experience in the location and category of the properties being valued. The valuation is based on comparable market transactions that considers sales of similar properties that have been transacted in open market.
21.2 The valuation method used by the independent valuer was based on market approach method. 21.3 The level of hierarchy for fair value disclosed falls in level 2 i.e. inputs other than quoted prices included within level 1
that are observable for real estate properties either directly or indirectly. 21.4 Management of the Company believes that holding on to these properties for appreciation in their market value is the
highest and best use of these investment properties. 21.5 This represents provision for impairment against land measuring 12 kanals and 14.5 marlas located at Raiwind Road
having gross value of Rs. 2,736 thousand (2020: 2,736 thousand) at the reporting date.
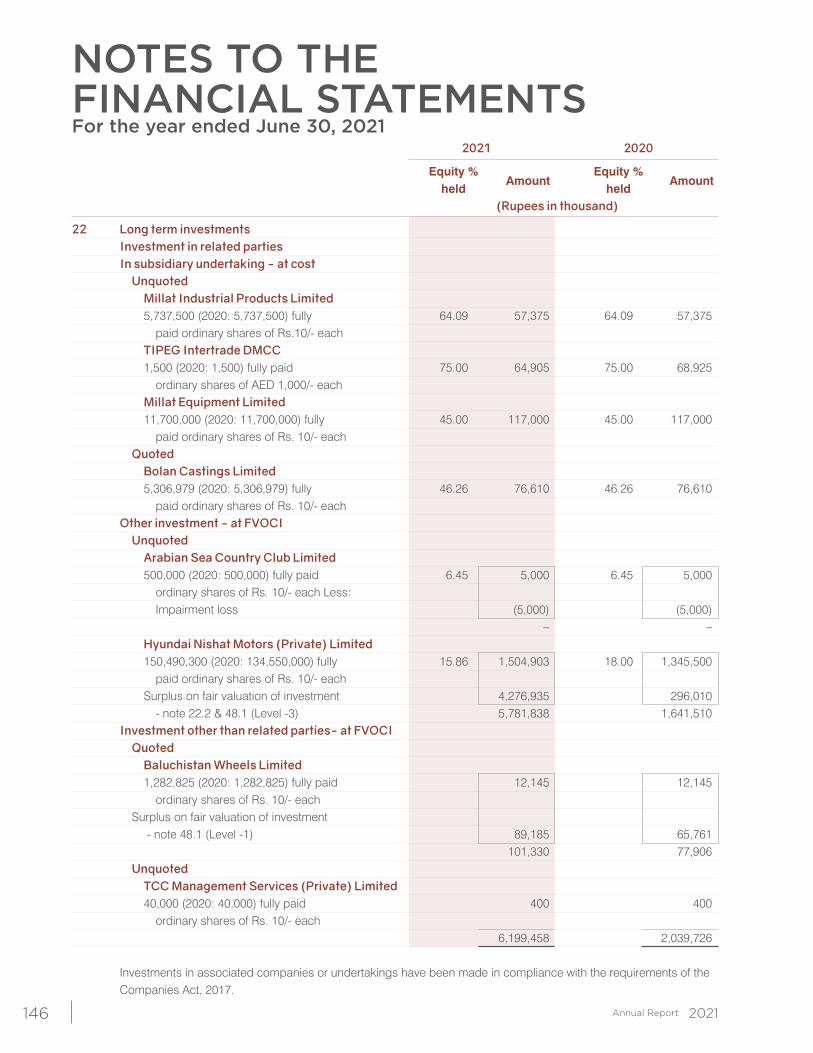
NOTES TO THE FINANCIAL STATEMENTSFor the year ended June 30, 2021
146
2021 2020
Equity % Amount
Equity % Amount
held held (Rupees in thousand)
22 Long term investments Investment in related parties In subsidiary undertaking - at cost Unquoted Millat Industrial Products Limited 5,737,500 (2020: 5,737,500) fully 64.09 57,375 64.09 57,375 paid ordinary shares of Rs.10/- each TIPEG Intertrade DMCC 1,500 (2020: 1,500) fully paid 75.00 64,905 75.00 68,925 ordinary shares of AED 1,000/- each Millat Equipment Limited 11,700,000 (2020: 11,700,000) fully 45.00 117,000 45.00 117,000 paid ordinary shares of Rs. 10/- each Quoted Bolan Castings Limited 5,306,979 (2020: 5,306,979) fully 46.26 76,610 46.26 76,610 paid ordinary shares of Rs. 10/- each Other investment - at FVOCI Unquoted Arabian Sea Country Club Limited 500,000 (2020: 500,000) fully paid 6.45 5,000 6.45 5,000 ordinary shares of Rs. 10/- each Less: Impairment loss (5,000) (5,000) – – Hyundai Nishat Motors (Private) Limited 150,490,300 (2020: 134,550,000) fully 15.86 1,504,903 18.00 1,345,500 paid ordinary shares of Rs. 10/- each Surplus on fair valuation of investment 4,276,935 296,010 - note 22.2 & 48.1 (Level -3) 5,781,838 1,641,510 Investment other than related parties- at FVOCI Quoted Baluchistan Wheels Limited 1,282,825 (2020: 1,282,825) fully paid 12,145 12,145 ordinary shares of Rs. 10/- each Surplus on fair valuation of investment - note 48.1 (Level -1) 89,185 65,761 101,330 77,906 Unquoted TCC Management Services (Private) Limited 40,000 (2020: 40,000) fully paid 400 400 ordinary shares of Rs. 10/- each 6,199,458 2,039,726 Investments in associated companies or undertakings have been made in compliance with the requirements of the
Companies Act, 2017.
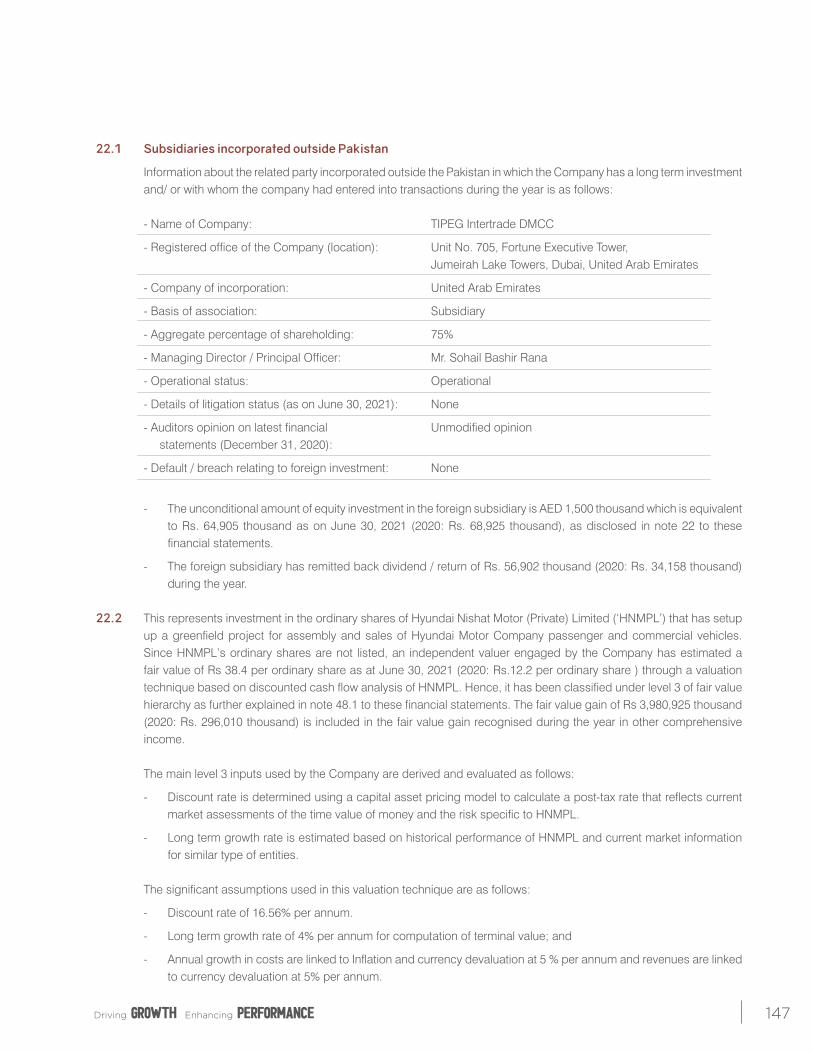
147
22.1 Subsidiaries incorporated outside Pakistan
Information about the related party incorporated outside the Pakistan in which the Company has a long term investment and/ or with whom the company had entered into transactions during the year is as follows:
- Name of Company: TIPEG Intertrade DMCC
- Registered office of the Company (location): Unit No. 705, Fortune Executive Tower, Jumeirah Lake Towers, Dubai, United Arab Emirates
- Company of incorporation: United Arab Emirates
- Basis of association: Subsidiary
- Aggregate percentage of shareholding: 75%
- Managing Director / Principal Officer: Mr. Sohail Bashir Rana
- Operational status: Operational
- Details of litigation status (as on June 30, 2021): None
- Auditors opinion on latest financial Unmodified opinion statements (December 31, 2020):
- Default / breach relating to foreign investment: None
- The unconditional amount of equity investment in the foreign subsidiary is AED 1,500 thousand which is equivalent
to Rs. 64,905 thousand as on June 30, 2021 (2020: Rs. 68,925 thousand), as disclosed in note 22 to these financial statements.
- The foreign subsidiary has remitted back dividend / return of Rs. 56,902 thousand (2020: Rs. 34,158 thousand) during the year.
22.2 This represents investment in the ordinary shares of Hyundai Nishat Motor (Private) Limited (‘HNMPL’) that has setup
up a greenfield project for assembly and sales of Hyundai Motor Company passenger and commercial vehicles. Since HNMPL’s ordinary shares are not listed, an independent valuer engaged by the Company has estimated a fair value of Rs 38.4 per ordinary share as at June 30, 2021 (2020: Rs.12.2 per ordinary share ) through a valuation technique based on discounted cash flow analysis of HNMPL. Hence, it has been classified under level 3 of fair value hierarchy as further explained in note 48.1 to these financial statements. The fair value gain of Rs 3,980,925 thousand (2020: Rs. 296,010 thousand) is included in the fair value gain recognised during the year in other comprehensive income.
The main level 3 inputs used by the Company are derived and evaluated as follows:
- Discount rate is determined using a capital asset pricing model to calculate a post-tax rate that reflects current market assessments of the time value of money and the risk specific to HNMPL.
- Long term growth rate is estimated based on historical performance of HNMPL and current market information for similar type of entities.
The significant assumptions used in this valuation technique are as follows:
- Discount rate of 16.56% per annum.
- Long term growth rate of 4% per annum for computation of terminal value; and
- Annual growth in costs are linked to Inflation and currency devaluation at 5 % per annum and revenues are linked to currency devaluation at 5% per annum.
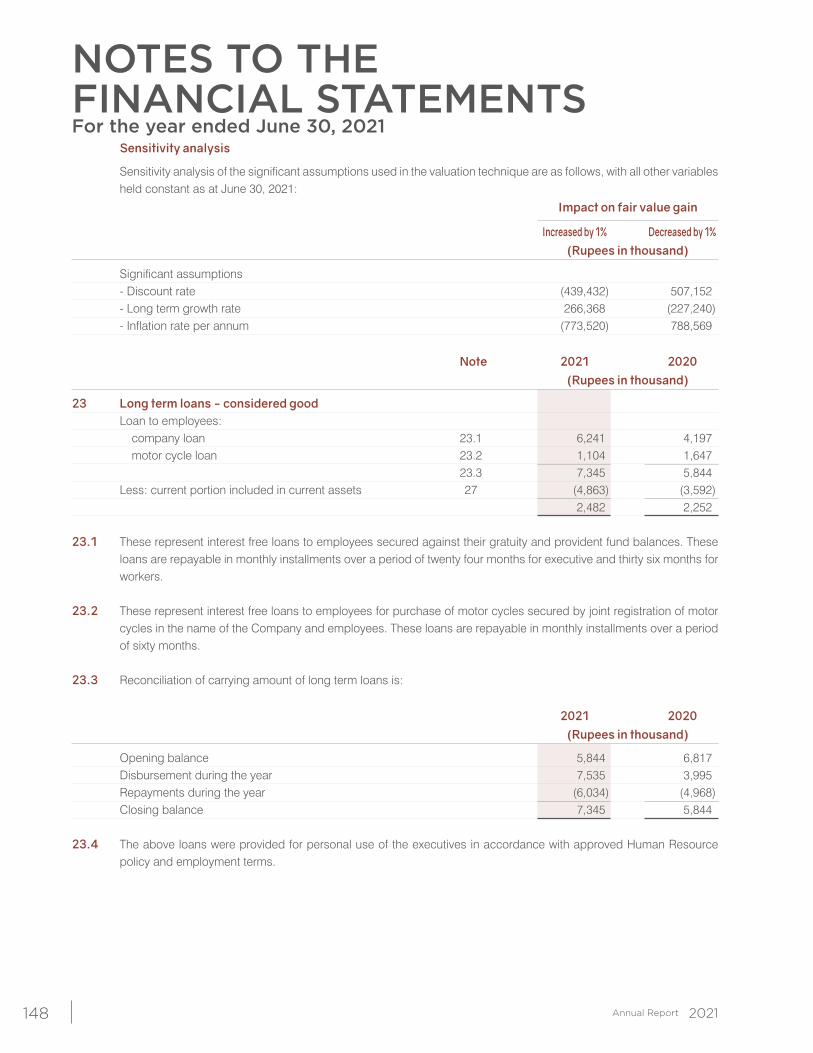
NOTES TO THE FINANCIAL STATEMENTSFor the year ended June 30, 2021
148
Sensitivity analysis
Sensitivity analysis of the significant assumptions used in the valuation technique are as follows, with all other variables held constant as at June 30, 2021:
Impact on fair value gain
Increased by 1% Decreased by 1% (Rupees in thousand)
Significant assumptions - Discount rate (439,432) 507,152 - Long term growth rate 266,368 (227,240) - Inflation rate per annum (773,520) 788,569
Note 2021 2020 (Rupees in thousand)
23 Long term loans - considered good Loan to employees: company loan 23.1 6,241 4,197 motor cycle loan 23.2 1,104 1,647 23.3 7,345 5,844 Less: current portion included in current assets 27 (4,863) (3,592) 2,482 2,252 23.1 These represent interest free loans to employees secured against their gratuity and provident fund balances. These
loans are repayable in monthly installments over a period of twenty four months for executive and thirty six months for workers.
23.2 These represent interest free loans to employees for purchase of motor cycles secured by joint registration of motor
cycles in the name of the Company and employees. These loans are repayable in monthly installments over a period of sixty months.
23.3 Reconciliation of carrying amount of long term loans is:
2021 2020 (Rupees in thousand)
Opening balance 5,844 6,817 Disbursement during the year 7,535 3,995 Repayments during the year (6,034) (4,968) Closing balance 7,345 5,844 23.4 The above loans were provided for personal use of the executives in accordance with approved Human Resource
policy and employment terms.
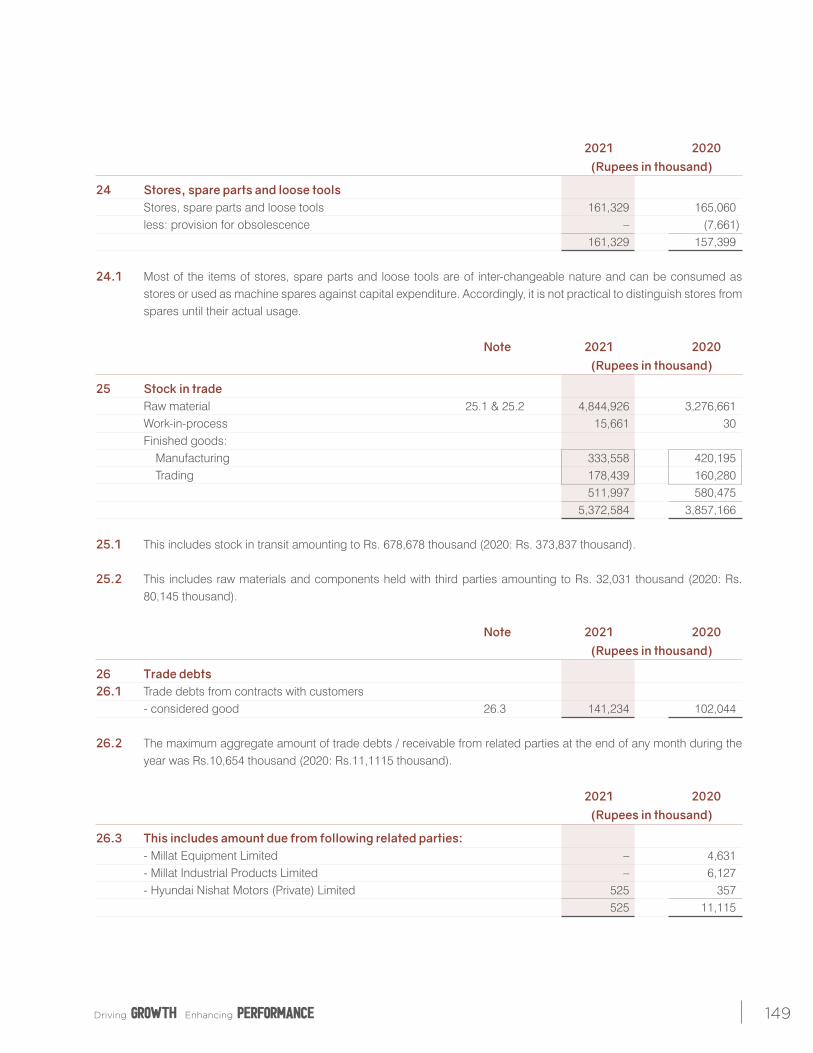
149
2021 2020 (Rupees in thousand)
24 Stores, spare parts and loose tools Stores, spare parts and loose tools 161,329 165,060 less: provision for obsolescence – (7,661) 161,329 157,399 24.1 Most of the items of stores, spare parts and loose tools are of inter-changeable nature and can be consumed as
stores or used as machine spares against capital expenditure. Accordingly, it is not practical to distinguish stores from spares until their actual usage.
Note 2021 2020 (Rupees in thousand)
25 Stock in trade Raw material 25.1 & 25.2 4,844,926 3,276,661 Work-in-process 15,661 30 Finished goods: Manufacturing 333,558 420,195 Trading 178,439 160,280 511,997 580,475 5,372,584 3,857,166 25.1 This includes stock in transit amounting to Rs. 678,678 thousand (2020: Rs. 373,837 thousand). 25.2 This includes raw materials and components held with third parties amounting to Rs. 32,031 thousand (2020: Rs.
80,145 thousand).
Note 2021 2020 (Rupees in thousand)
26 Trade debts26.1 Trade debts from contracts with customers - considered good 26.3 141,234 102,044 26.2 The maximum aggregate amount of trade debts / receivable from related parties at the end of any month during the
year was Rs.10,654 thousand (2020: Rs.11,1115 thousand).
2021 2020 (Rupees in thousand)
26.3 This includes amount due from following related parties: - Millat Equipment Limited – 4,631 - Millat Industrial Products Limited – 6,127 - Hyundai Nishat Motors (Private) Limited 525 357 525 11,115
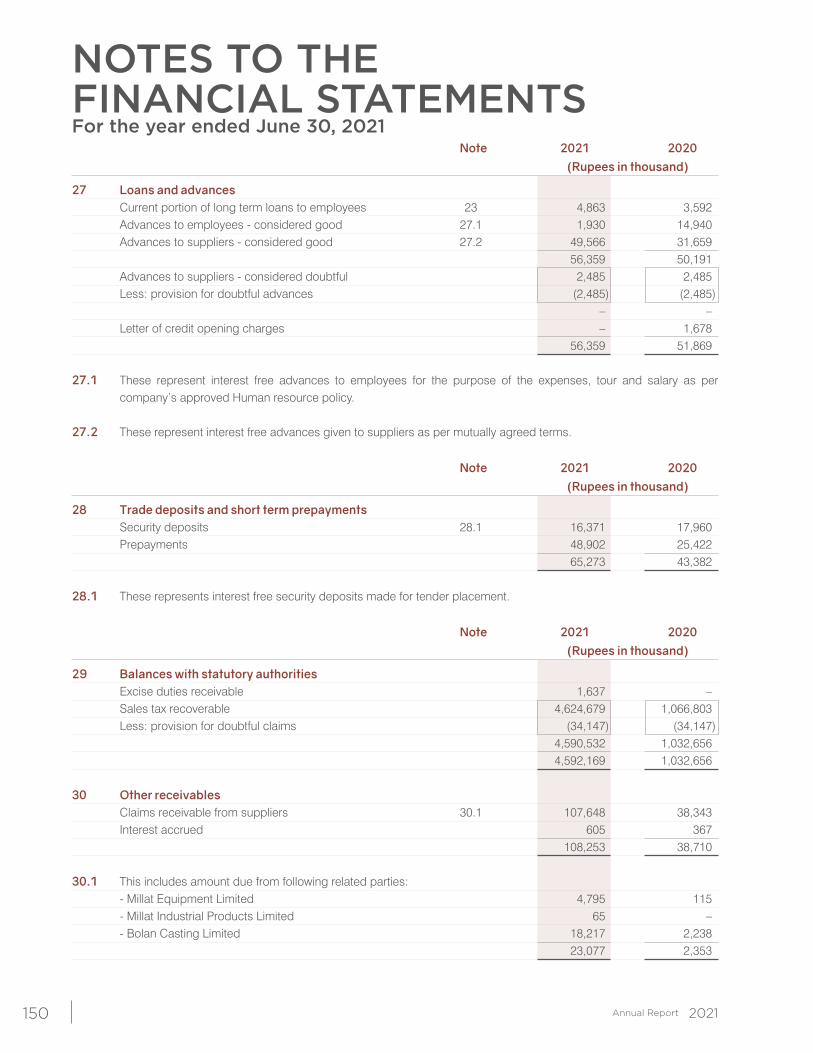
NOTES TO THE FINANCIAL STATEMENTSFor the year ended June 30, 2021
150
Note 2021 2020 (Rupees in thousand)
27 Loans and advances Current portion of long term loans to employees 23 4,863 3,592 Advances to employees - considered good 27.1 1,930 14,940 Advances to suppliers - considered good 27.2 49,566 31,659 56,359 50,191 Advances to suppliers - considered doubtful 2,485 2,485 Less: provision for doubtful advances (2,485) (2,485) – – Letter of credit opening charges – 1,678 56,359 51,869 27.1 These represent interest free advances to employees for the purpose of the expenses, tour and salary as per
company’s approved Human resource policy. 27.2 These represent interest free advances given to suppliers as per mutually agreed terms.
Note 2021 2020 (Rupees in thousand)
28 Trade deposits and short term prepayments Security deposits 28.1 16,371 17,960 Prepayments 48,902 25,422 65,273 43,382 28.1 These represents interest free security deposits made for tender placement.
Note 2021 2020 (Rupees in thousand)
29 Balances with statutory authorities Excise duties receivable 1,637 – Sales tax recoverable 4,624,679 1,066,803 Less: provision for doubtful claims (34,147) (34,147) 4,590,532 1,032,656 4,592,169 1,032,656
30 Other receivables Claims receivable from suppliers 30.1 107,648 38,343 Interest accrued 605 367 108,253 38,710 30.1 This includes amount due from following related parties: - Millat Equipment Limited 4,795 115 - Millat Industrial Products Limited 65 – - Bolan Casting Limited 18,217 2,238 23,077 2,353
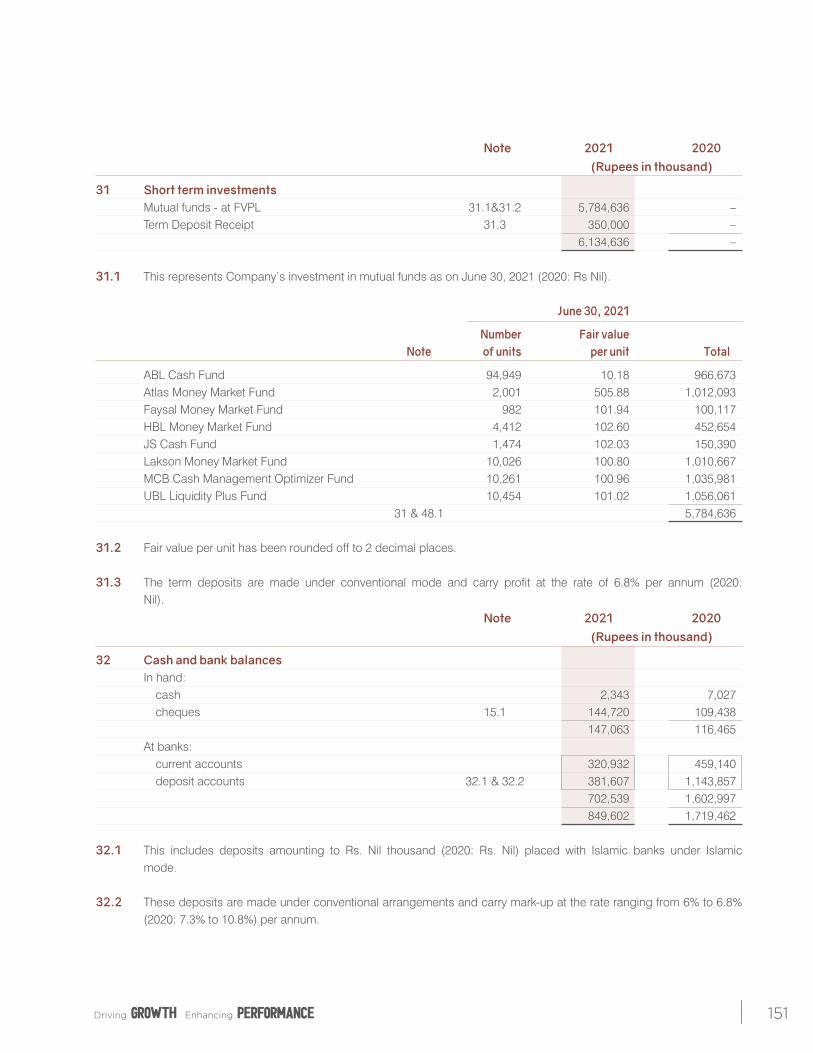
151
Note 2021 2020 (Rupees in thousand)
31 Short term investments Mutual funds - at FVPL 31.1&31.2 5,784,636 – Term Deposit Receipt 31.3 350,000 – 6,134,636 – 31.1 This represents Company’s investment in mutual funds as on June 30, 2021 (2020: Rs Nil). June 30, 2021
Number Fair value Note of units per unit Total
ABL Cash Fund 94,949 10.18 966,673 Atlas Money Market Fund 2,001 505.88 1,012,093 Faysal Money Market Fund 982 101.94 100,117 HBL Money Market Fund 4,412 102.60 452,654 JS Cash Fund 1,474 102.03 150,390 Lakson Money Market Fund 10,026 100.80 1,010,667 MCB Cash Management Optimizer Fund 10,261 100.96 1,035,981 UBL Liquidity Plus Fund 10,454 101.02 1,056,061 31 & 48.1 5,784,636 31.2 Fair value per unit has been rounded off to 2 decimal places. 31.3 The term deposits are made under conventional mode and carry profit at the rate of 6.8% per annum (2020:
Nil).
Note 2021 2020 (Rupees in thousand)
32 Cash and bank balances In hand: cash 2,343 7,027 cheques 15.1 144,720 109,438 147,063 116,465 At banks: current accounts 320,932 459,140 deposit accounts 32.1 & 32.2 381,607 1,143,857 702,539 1,602,997 849,602 1,719,462 32.1 This includes deposits amounting to Rs. Nil thousand (2020: Rs. Nil) placed with Islamic banks under Islamic
mode. 32.2 These deposits are made under conventional arrangements and carry mark-up at the rate ranging from 6% to 6.8%
(2020: 7.3% to 10.8%) per annum.
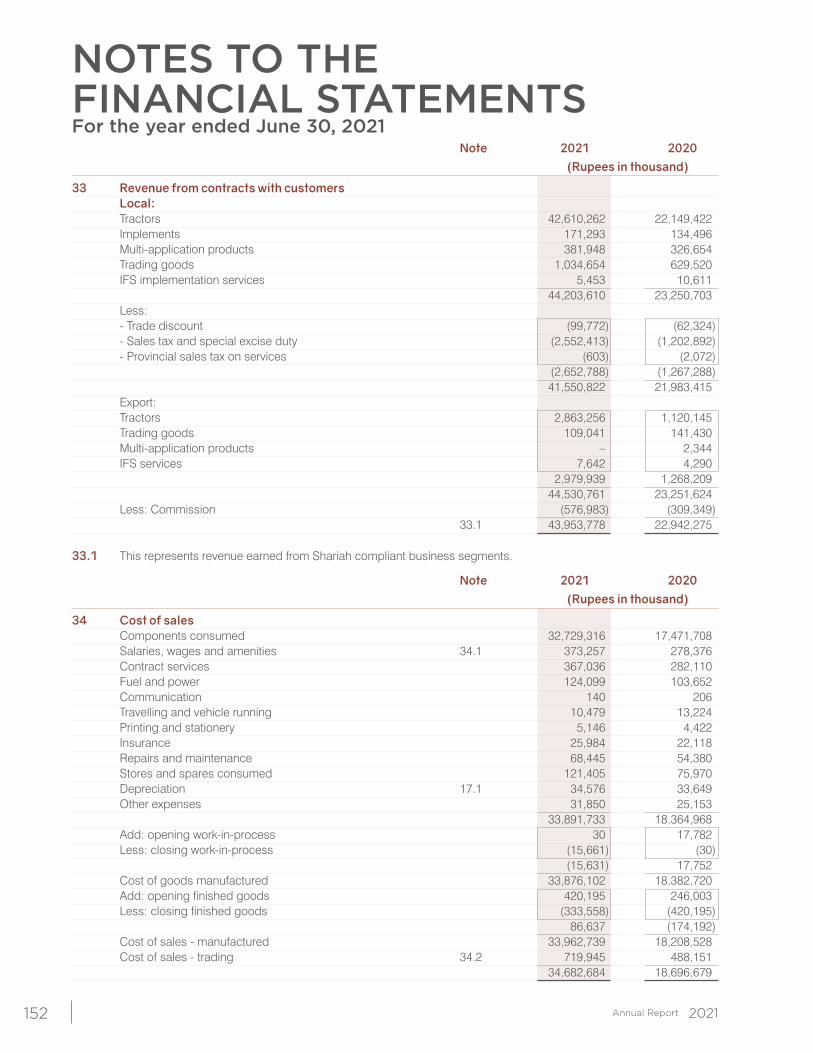
NOTES TO THE FINANCIAL STATEMENTSFor the year ended June 30, 2021
152
Note 2021 2020 (Rupees in thousand)
33 Revenue from contracts with customers Local: Tractors 42,610,262 22,149,422 Implements 171,293 134,496 Multi-application products 381,948 326,654 Trading goods 1,034,654 629,520 IFS implementation services 5,453 10,611 44,203,610 23,250,703 Less: - Trade discount (99,772) (62,324) - Sales tax and special excise duty (2,552,413) (1,202,892) - Provincial sales tax on services (603) (2,072) (2,652,788) (1,267,288) 41,550,822 21,983,415 Export: Tractors 2,863,256 1,120,145 Trading goods 109,041 141,430 Multi-application products – 2,344 IFS services 7,642 4,290 2,979,939 1,268,209 44,530,761 23,251,624 Less: Commission (576,983) (309,349) 33.1 43,953,778 22,942,275 33.1 This represents revenue earned from Shariah compliant business segments.
Note 2021 2020 (Rupees in thousand)
34 Cost of sales Components consumed 32,729,316 17,471,708 Salaries, wages and amenities 34.1 373,257 278,376 Contract services 367,036 282,110 Fuel and power 124,099 103,652 Communication 140 206 Travelling and vehicle running 10,479 13,224 Printing and stationery 5,146 4,422 Insurance 25,984 22,118 Repairs and maintenance 68,445 54,380 Stores and spares consumed 121,405 75,970 Depreciation 17.1 34,576 33,649 Other expenses 31,850 25,153 33,891,733 18,364,968 Add: opening work-in-process 30 17,782 Less: closing work-in-process (15,661) (30) (15,631) 17,752 Cost of goods manufactured 33,876,102 18,382,720 Add: opening finished goods 420,195 246,003 Less: closing finished goods (333,558) (420,195) 86,637 (174,192) Cost of sales - manufactured 33,962,739 18,208,528 Cost of sales - trading 34.2 719,945 488,151 34,682,684 18,696,679
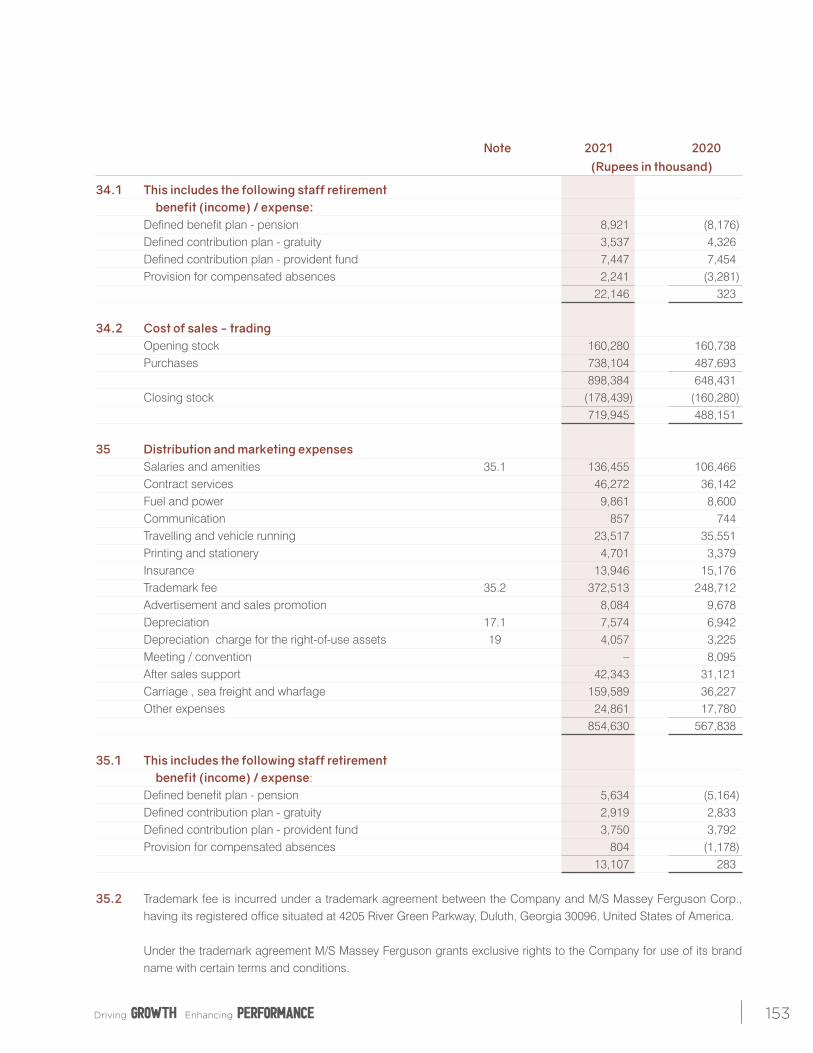
153
Note 2021 2020 (Rupees in thousand)
34.1 This includes the following staff retirement benefit (income) / expense: Defined benefit plan - pension 8,921 (8,176) Defined contribution plan - gratuity 3,537 4,326 Defined contribution plan - provident fund 7,447 7,454 Provision for compensated absences 2,241 (3,281) 22,146 323
34.2 Cost of sales - trading Opening stock 160,280 160,738 Purchases 738,104 487,693 898,384 648,431 Closing stock (178,439) (160,280) 719,945 488,151
35 Distribution and marketing expenses Salaries and amenities 35.1 136,455 106,466 Contract services 46,272 36,142 Fuel and power 9,861 8,600 Communication 857 744 Travelling and vehicle running 23,517 35,551 Printing and stationery 4,701 3,379 Insurance 13,946 15,176 Trademark fee 35.2 372,513 248,712 Advertisement and sales promotion 8,084 9,678 Depreciation 17.1 7,574 6,942 Depreciation charge for the right-of-use assets 19 4,057 3,225 Meeting / convention – 8,095 After sales support 42,343 31,121 Carriage , sea freight and wharfage 159,589 36,227 Other expenses 24,861 17,780 854,630 567,838
35.1 This includes the following staff retirement benefit (income) / expense: Defined benefit plan - pension 5,634 (5,164) Defined contribution plan - gratuity 2,919 2,833 Defined contribution plan - provident fund 3,750 3,792 Provision for compensated absences 804 (1,178) 13,107 283 35.2 Trademark fee is incurred under a trademark agreement between the Company and M/S Massey Ferguson Corp.,
having its registered office situated at 4205 River Green Parkway, Duluth, Georgia 30096, United States of America. Under the trademark agreement M/S Massey Ferguson grants exclusive rights to the Company for use of its brand
name with certain terms and conditions.
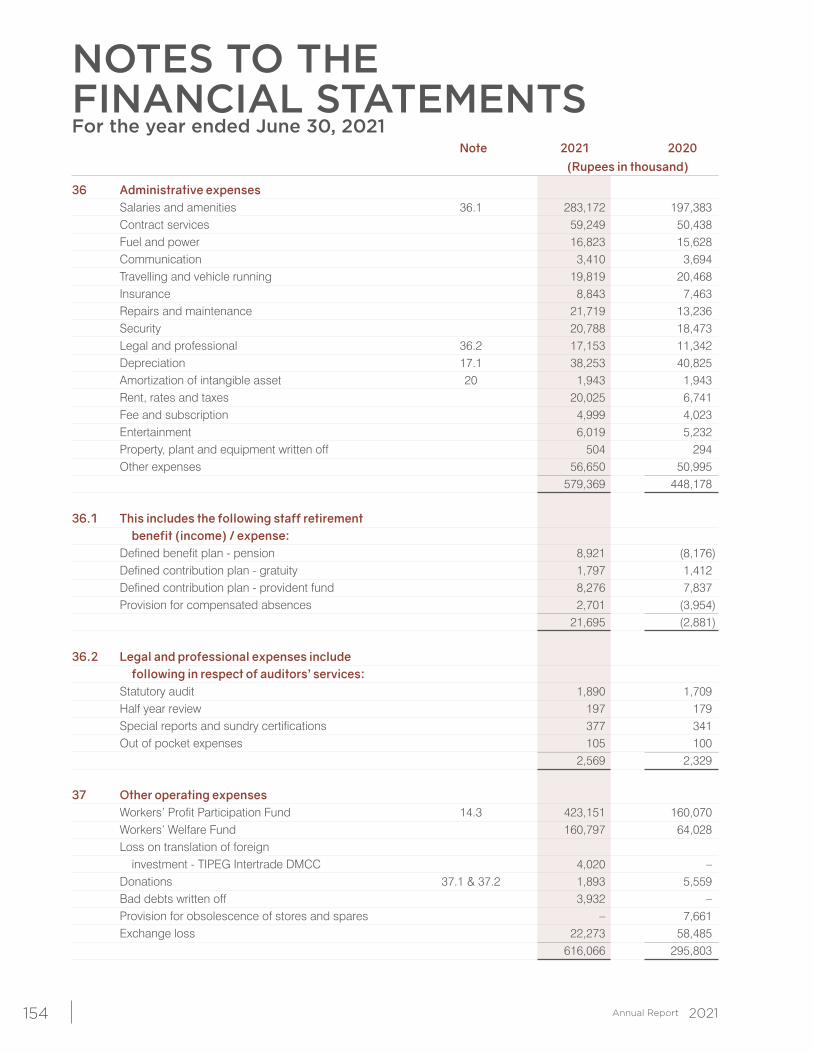
NOTES TO THE FINANCIAL STATEMENTSFor the year ended June 30, 2021
154
Note 2021 2020 (Rupees in thousand)
36 Administrative expenses Salaries and amenities 36.1 283,172 197,383 Contract services 59,249 50,438 Fuel and power 16,823 15,628 Communication 3,410 3,694 Travelling and vehicle running 19,819 20,468 Insurance 8,843 7,463 Repairs and maintenance 21,719 13,236 Security 20,788 18,473 Legal and professional 36.2 17,153 11,342 Depreciation 17.1 38,253 40,825 Amortization of intangible asset 20 1,943 1,943 Rent, rates and taxes 20,025 6,741 Fee and subscription 4,999 4,023 Entertainment 6,019 5,232 Property, plant and equipment written off 504 294 Other expenses 56,650 50,995 579,369 448,178 36.1 This includes the following staff retirement benefit (income) / expense: Defined benefit plan - pension 8,921 (8,176) Defined contribution plan - gratuity 1,797 1,412 Defined contribution plan - provident fund 8,276 7,837 Provision for compensated absences 2,701 (3,954) 21,695 (2,881)
36.2 Legal and professional expenses include following in respect of auditors’ services: Statutory audit 1,890 1,709 Half year review 197 179 Special reports and sundry certifications 377 341 Out of pocket expenses 105 100 2,569 2,329 37 Other operating expenses Workers’ Profit Participation Fund 14.3 423,151 160,070 Workers’ Welfare Fund 160,797 64,028 Loss on translation of foreign investment - TIPEG Intertrade DMCC 4,020 – Donations 37.1 & 37.2 1,893 5,559 Bad debts written off 3,932 – Provision for obsolescence of stores and spares – 7,661 Exchange loss 22,273 58,485 616,066 295,803
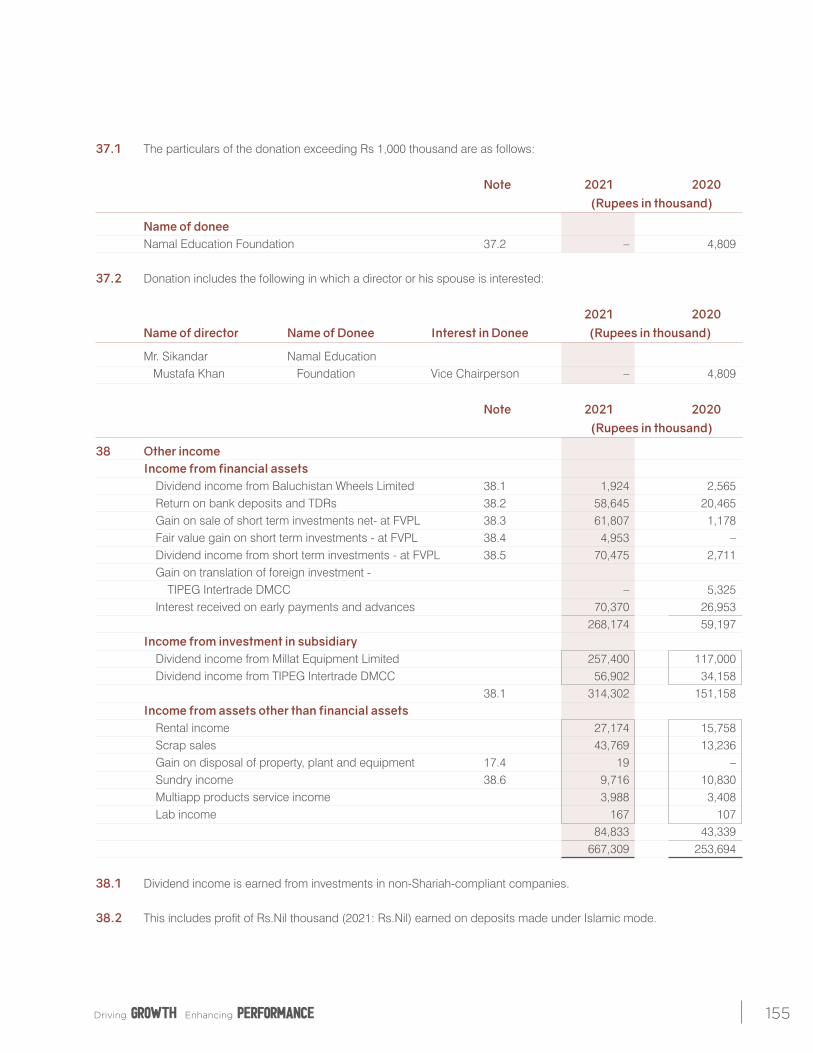
155
37.1 The particulars of the donation exceeding Rs 1,000 thousand are as follows:
Note 2021 2020 (Rupees in thousand)
Name of donee Namal Education Foundation 37.2 – 4,809
37.2 Donation includes the following in which a director or his spouse is interested:
2021 2020 Name of director Name of Donee Interest in Donee (Rupees in thousand)
Mr. Sikandar Namal Education Mustafa Khan Foundation Vice Chairperson – 4,809
Note 2021 2020 (Rupees in thousand)
38 Other income Income from financial assets Dividend income from Baluchistan Wheels Limited 38.1 1,924 2,565 Return on bank deposits and TDRs 38.2 58,645 20,465 Gain on sale of short term investments net- at FVPL 38.3 61,807 1,178 Fair value gain on short term investments - at FVPL 38.4 4,953 – Dividend income from short term investments - at FVPL 38.5 70,475 2,711 Gain on translation of foreign investment - TIPEG Intertrade DMCC – 5,325 Interest received on early payments and advances 70,370 26,953 268,174 59,197 Income from investment in subsidiary Dividend income from Millat Equipment Limited 257,400 117,000 Dividend income from TIPEG Intertrade DMCC 56,902 34,158 38.1 314,302 151,158 Income from assets other than financial assets Rental income 27,174 15,758 Scrap sales 43,769 13,236 Gain on disposal of property, plant and equipment 17.4 19 – Sundry income 38.6 9,716 10,830 Multiapp products service income 3,988 3,408 Lab income 167 107 84,833 43,339 667,309 253,694 38.1 Dividend income is earned from investments in non-Shariah-compliant companies. 38.2 This includes profit of Rs.Nil thousand (2021: Rs.Nil) earned on deposits made under Islamic mode.
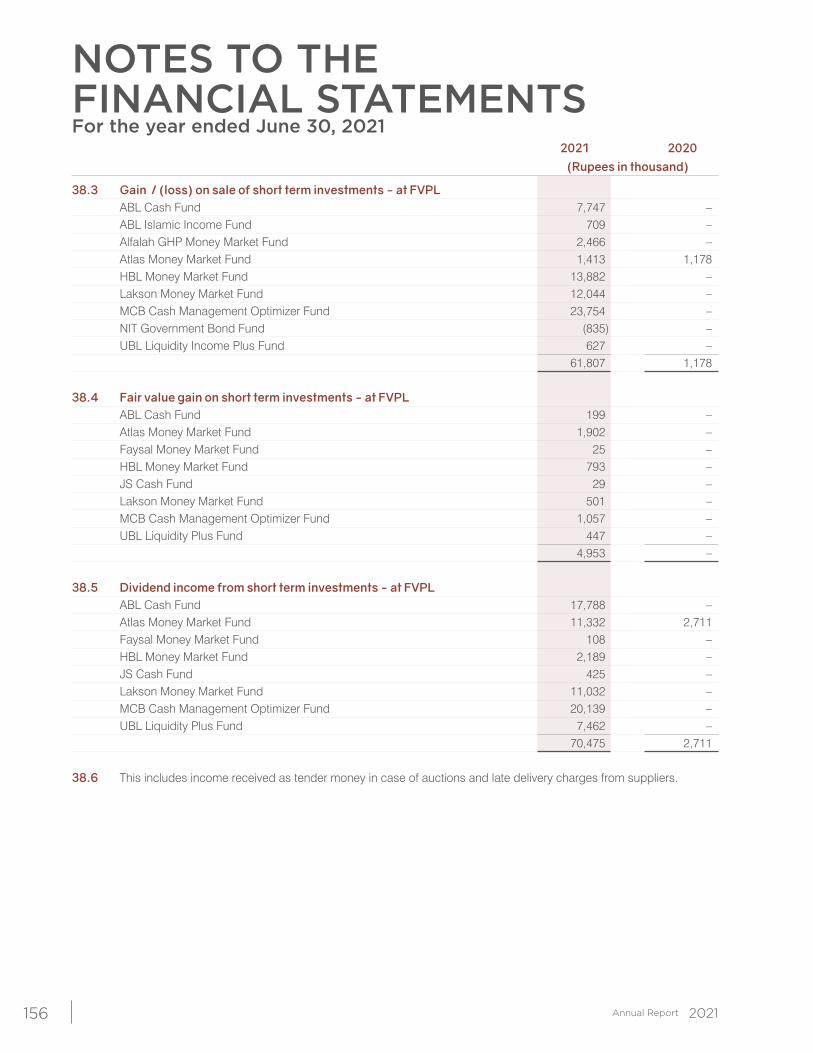
NOTES TO THE FINANCIAL STATEMENTSFor the year ended June 30, 2021
156
2021 2020 (Rupees in thousand)
38.3 Gain / (loss) on sale of short term investments - at FVPL ABL Cash Fund 7,747 – ABL Islamic Income Fund 709 – Alfalah GHP Money Market Fund 2,466 – Atlas Money Market Fund 1,413 1,178 HBL Money Market Fund 13,882 – Lakson Money Market Fund 12,044 – MCB Cash Management Optimizer Fund 23,754 – NIT Government Bond Fund (835) – UBL Liquidity Income Plus Fund 627 – 61,807 1,178 38.4 Fair value gain on short term investments - at FVPL ABL Cash Fund 199 – Atlas Money Market Fund 1,902 – Faysal Money Market Fund 25 – HBL Money Market Fund 793 – JS Cash Fund 29 – Lakson Money Market Fund 501 – MCB Cash Management Optimizer Fund 1,057 – UBL Liquidity Plus Fund 447 – 4,953 – 38.5 Dividend income from short term investments - at FVPL ABL Cash Fund 17,788 – Atlas Money Market Fund 11,332 2,711 Faysal Money Market Fund 108 – HBL Money Market Fund 2,189 – JS Cash Fund 425 – Lakson Money Market Fund 11,032 – MCB Cash Management Optimizer Fund 20,139 – UBL Liquidity Plus Fund 7,462 – 70,475 2,711 38.6 This includes income received as tender money in case of auctions and late delivery charges from suppliers.
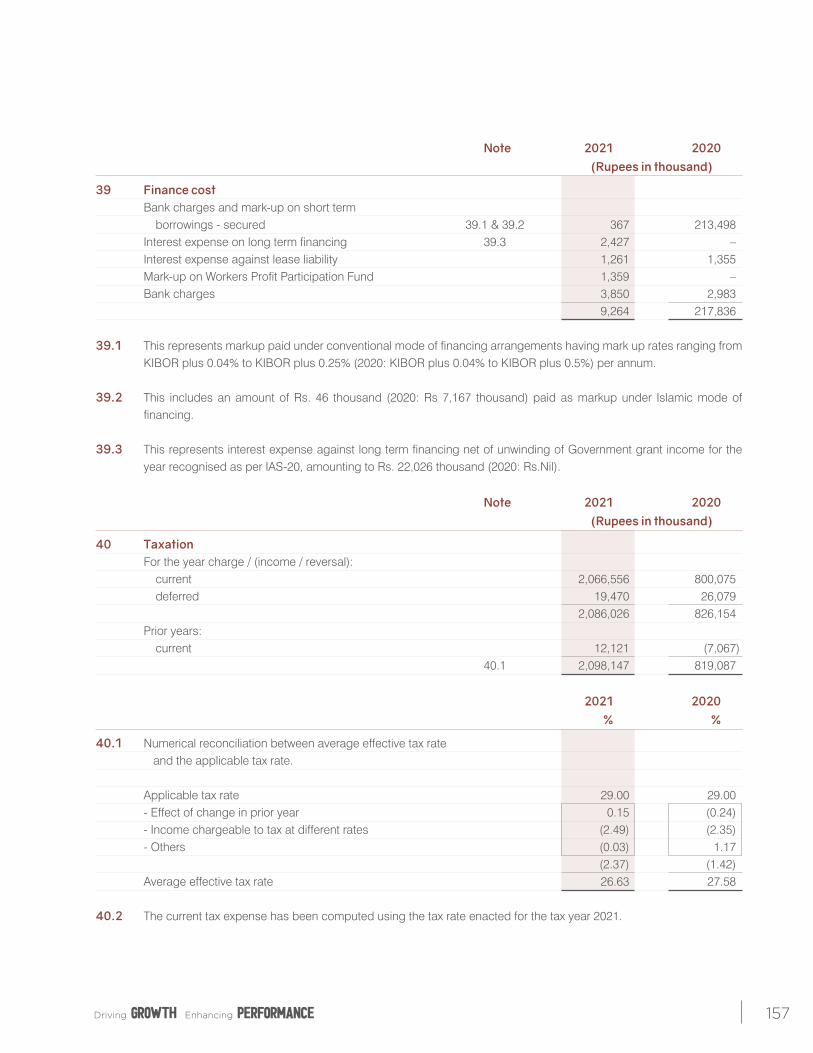
157
Note 2021 2020 (Rupees in thousand)
39 Finance cost Bank charges and mark-up on short term borrowings - secured 39.1 & 39.2 367 213,498 Interest expense on long term financing 39.3 2,427 – Interest expense against lease liability 1,261 1,355 Mark-up on Workers Profit Participation Fund 1,359 – Bank charges 3,850 2,983 9,264 217,836 39.1 This represents markup paid under conventional mode of financing arrangements having mark up rates ranging from
KIBOR plus 0.04% to KIBOR plus 0.25% (2020: KIBOR plus 0.04% to KIBOR plus 0.5%) per annum. 39.2 This includes an amount of Rs. 46 thousand (2020: Rs 7,167 thousand) paid as markup under Islamic mode of
financing. 39.3 This represents interest expense against long term financing net of unwinding of Government grant income for the
year recognised as per IAS-20, amounting to Rs. 22,026 thousand (2020: Rs.Nil).
Note 2021 2020 (Rupees in thousand)
40 Taxation For the year charge / (income / reversal): current 2,066,556 800,075 deferred 19,470 26,079 2,086,026 826,154 Prior years: current 12,121 (7,067) 40.1 2,098,147 819,087
2021 2020 % %
40.1 Numerical reconciliation between average effective tax rate and the applicable tax rate. Applicable tax rate 29.00 29.00 - Effect of change in prior year 0.15 (0.24) - Income chargeable to tax at different rates (2.49) (2.35) - Others (0.03) 1.17 (2.37) (1.42) Average effective tax rate 26.63 27.58 40.2 The current tax expense has been computed using the tax rate enacted for the tax year 2021.
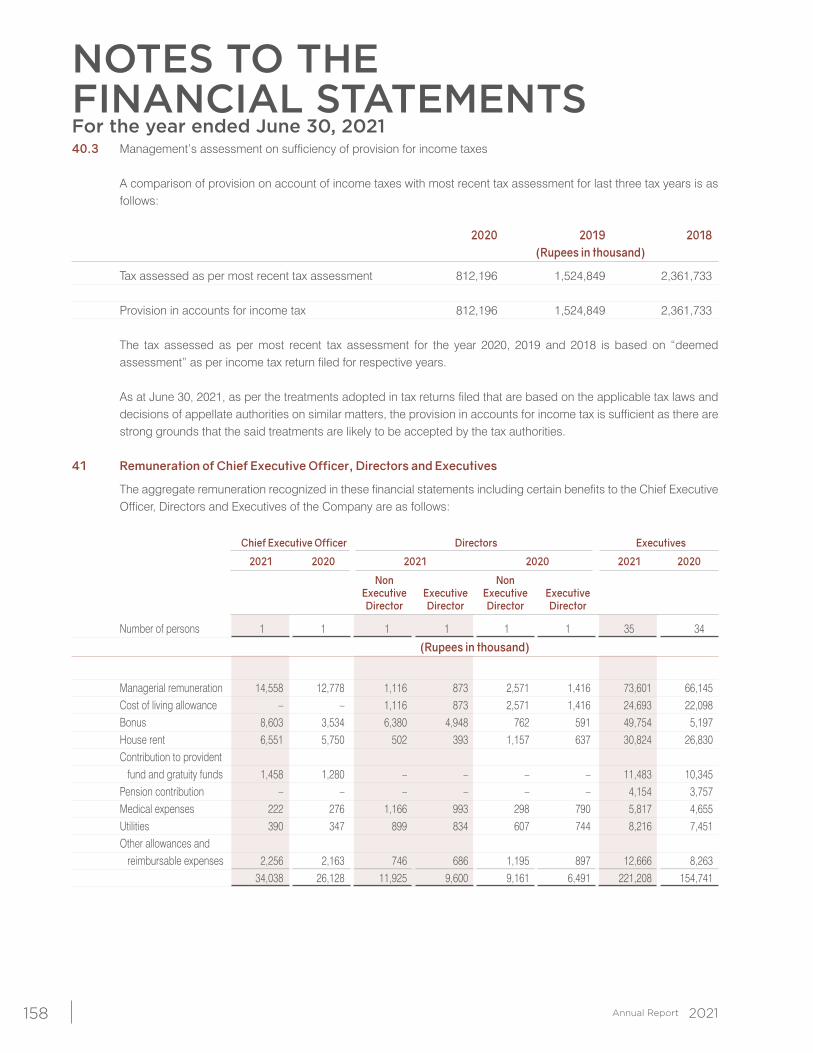
NOTES TO THE FINANCIAL STATEMENTSFor the year ended June 30, 2021
158
40.3 Management’s assessment on sufficiency of provision for income taxes A comparison of provision on account of income taxes with most recent tax assessment for last three tax years is as
follows: 2020 2019 2018 (Rupees in thousand)
Tax assessed as per most recent tax assessment 812,196 1,524,849 2,361,733 Provision in accounts for income tax 812,196 1,524,849 2,361,733 The tax assessed as per most recent tax assessment for the year 2020, 2019 and 2018 is based on “deemed
assessment” as per income tax return filed for respective years. As at June 30, 2021, as per the treatments adopted in tax returns filed that are based on the applicable tax laws and
decisions of appellate authorities on similar matters, the provision in accounts for income tax is sufficient as there are strong grounds that the said treatments are likely to be accepted by the tax authorities.
41 Remuneration of Chief Executive Officer, Directors and Executives
The aggregate remuneration recognized in these financial statements including certain benefits to the Chief Executive Officer, Directors and Executives of the Company are as follows:
Chief Executive Officer Directors Executives
2021 2020 2021 2020 2021 2020
Non Non Executive Executive Executive Executive Director Director Director Director
Number of persons 1 1 1 1 1 1 35 34
(Rupees in thousand)
Managerial remuneration 14,558 12,778 1,116 873 2,571 1,416 73,601 66,145 Cost of living allowance – – 1,116 873 2,571 1,416 24,693 22,098 Bonus 8,603 3,534 6,380 4,948 762 591 49,754 5,197 House rent 6,551 5,750 502 393 1,157 637 30,824 26,830 Contribution to provident fund and gratuity funds 1,458 1,280 – – – – 11,483 10,345 Pension contribution – – – – – – 4,154 3,757 Medical expenses 222 276 1,166 993 298 790 5,817 4,655 Utilities 390 347 899 834 607 744 8,216 7,451 Other allowances and reimbursable expenses 2,256 2,163 746 686 1,195 897 12,666 8,263 34,038 26,128 11,925 9,600 9,161 6,491 221,208 154,741
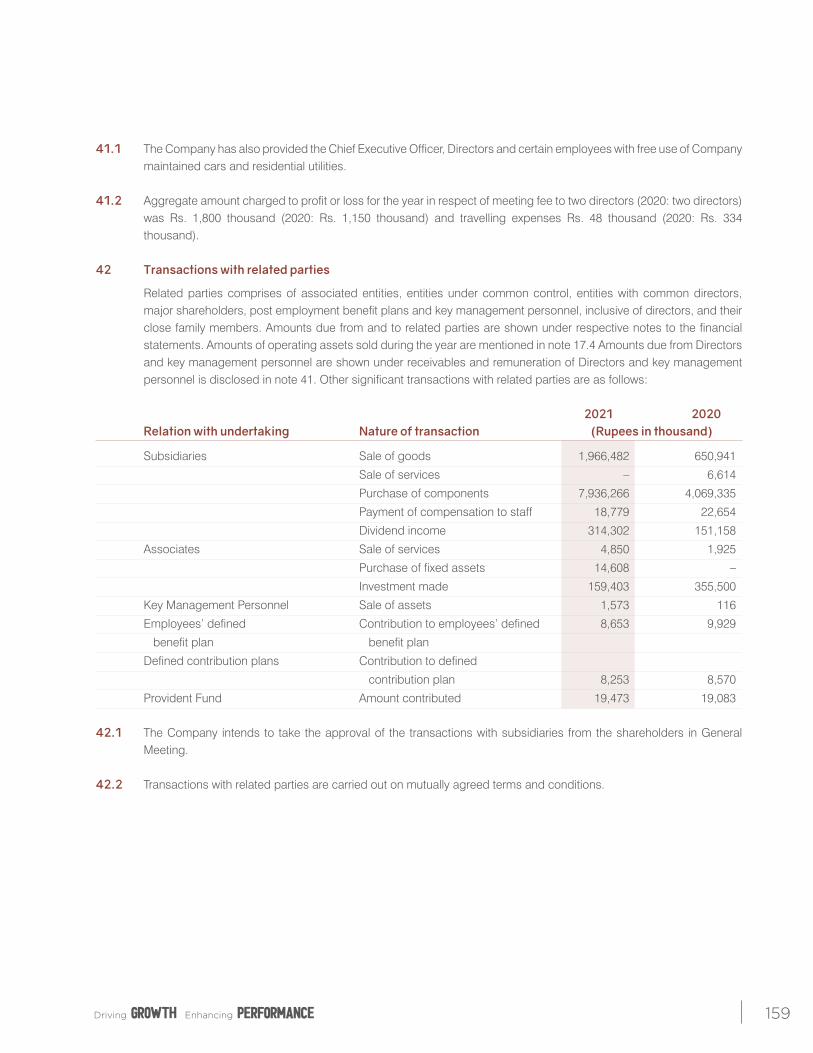
159
41.1 The Company has also provided the Chief Executive Officer, Directors and certain employees with free use of Company maintained cars and residential utilities.
41.2 Aggregate amount charged to profit or loss for the year in respect of meeting fee to two directors (2020: two directors)
was Rs. 1,800 thousand (2020: Rs. 1,150 thousand) and travelling expenses Rs. 48 thousand (2020: Rs. 334 thousand).
42 Transactions with related parties
Related parties comprises of associated entities, entities under common control, entities with common directors, major shareholders, post employment benefit plans and key management personnel, inclusive of directors, and their close family members. Amounts due from and to related parties are shown under respective notes to the financial statements. Amounts of operating assets sold during the year are mentioned in note 17.4 Amounts due from Directors and key management personnel are shown under receivables and remuneration of Directors and key management personnel is disclosed in note 41. Other significant transactions with related parties are as follows:
2021 2020 Relation with undertaking Nature of transaction (Rupees in thousand)
Subsidiaries Sale of goods 1,966,482 650,941
Sale of services – 6,614
Purchase of components 7,936,266 4,069,335
Payment of compensation to staff 18,779 22,654
Dividend income 314,302 151,158
Associates Sale of services 4,850 1,925
Purchase of fixed assets 14,608 –
Investment made 159,403 355,500
Key Management Personnel Sale of assets 1,573 116
Employees’ defined Contribution to employees’ defined 8,653 9,929
benefit plan benefit plan
Defined contribution plans Contribution to defined
contribution plan 8,253 8,570
Provident Fund Amount contributed 19,473 19,083 42.1 The Company intends to take the approval of the transactions with subsidiaries from the shareholders in General
Meeting. 42.2 Transactions with related parties are carried out on mutually agreed terms and conditions.
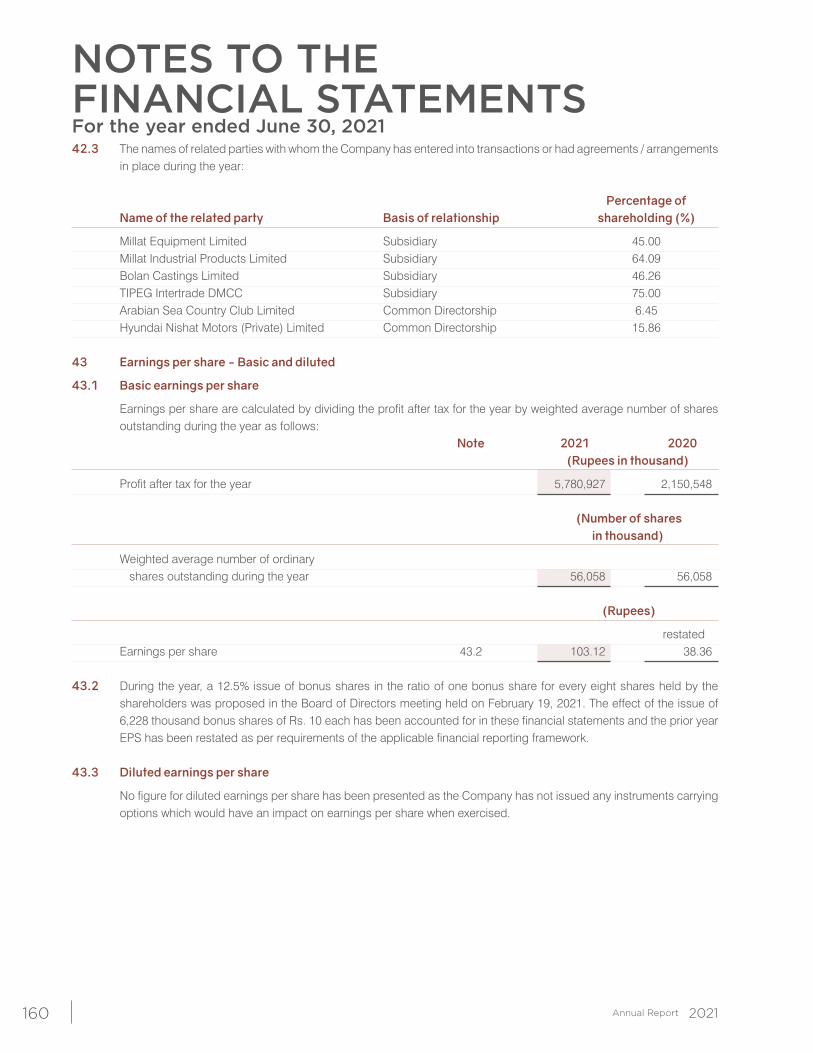
NOTES TO THE FINANCIAL STATEMENTSFor the year ended June 30, 2021
160
42.3 The names of related parties with whom the Company has entered into transactions or had agreements / arrangements in place during the year:
Percentage of Name of the related party Basis of relationship shareholding (%)
Millat Equipment Limited Subsidiary 45.00 Millat Industrial Products Limited Subsidiary 64.09 Bolan Castings Limited Subsidiary 46.26 TIPEG Intertrade DMCC Subsidiary 75.00 Arabian Sea Country Club Limited Common Directorship 6.45 Hyundai Nishat Motors (Private) Limited Common Directorship 15.86
43 Earnings per share - Basic and diluted
43.1 Basic earnings per share
Earnings per share are calculated by dividing the profit after tax for the year by weighted average number of shares outstanding during the year as follows:
Note 2021 2020 (Rupees in thousand)
Profit after tax for the year 5,780,927 2,150,548 (Number of shares in thousand)
Weighted average number of ordinary shares outstanding during the year 56,058 56,058 (Rupees)
restated Earnings per share 43.2 103.12 38.36 43.2 During the year, a 12.5% issue of bonus shares in the ratio of one bonus share for every eight shares held by the
shareholders was proposed in the Board of Directors meeting held on February 19, 2021. The effect of the issue of 6,228 thousand bonus shares of Rs. 10 each has been accounted for in these financial statements and the prior year EPS has been restated as per requirements of the applicable financial reporting framework.
43.3 Diluted earnings per share
No figure for diluted earnings per share has been presented as the Company has not issued any instruments carrying options which would have an impact on earnings per share when exercised.
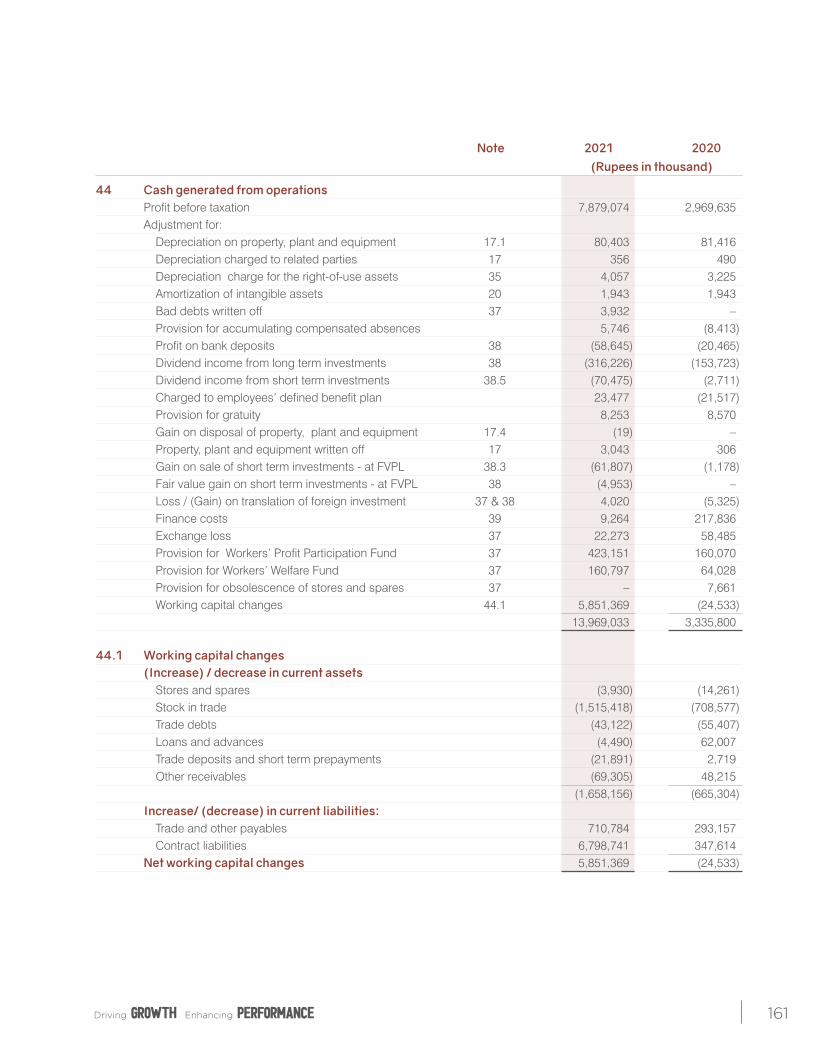
161
Note 2021 2020 (Rupees in thousand)
44 Cash generated from operations Profit before taxation 7,879,074 2,969,635 Adjustment for: Depreciation on property, plant and equipment 17.1 80,403 81,416 Depreciation charged to related parties 17 356 490 Depreciation charge for the right-of-use assets 35 4,057 3,225 Amortization of intangible assets 20 1,943 1,943 Bad debts written off 37 3,932 – Provision for accumulating compensated absences 5,746 (8,413) Profit on bank deposits 38 (58,645) (20,465) Dividend income from long term investments 38 (316,226) (153,723) Dividend income from short term investments 38.5 (70,475) (2,711) Charged to employees’ defined benefit plan 23,477 (21,517) Provision for gratuity 8,253 8,570 Gain on disposal of property, plant and equipment 17.4 (19) – Property, plant and equipment written off 17 3,043 306 Gain on sale of short term investments - at FVPL 38.3 (61,807) (1,178) Fair value gain on short term investments - at FVPL 38 (4,953) – Loss / (Gain) on translation of foreign investment 37 & 38 4,020 (5,325) Finance costs 39 9,264 217,836 Exchange loss 37 22,273 58,485 Provision for Workers’ Profit Participation Fund 37 423,151 160,070 Provision for Workers’ Welfare Fund 37 160,797 64,028 Provision for obsolescence of stores and spares 37 – 7,661 Working capital changes 44.1 5,851,369 (24,533) 13,969,033 3,335,800
44.1 Working capital changes (Increase) / decrease in current assets Stores and spares (3,930) (14,261) Stock in trade (1,515,418) (708,577) Trade debts (43,122) (55,407) Loans and advances (4,490) 62,007 Trade deposits and short term prepayments (21,891) 2,719 Other receivables (69,305) 48,215 (1,658,156) (665,304) Increase/ (decrease) in current liabilities: Trade and other payables 710,784 293,157 Contract liabilities 6,798,741 347,614 Net working capital changes 5,851,369 (24,533)
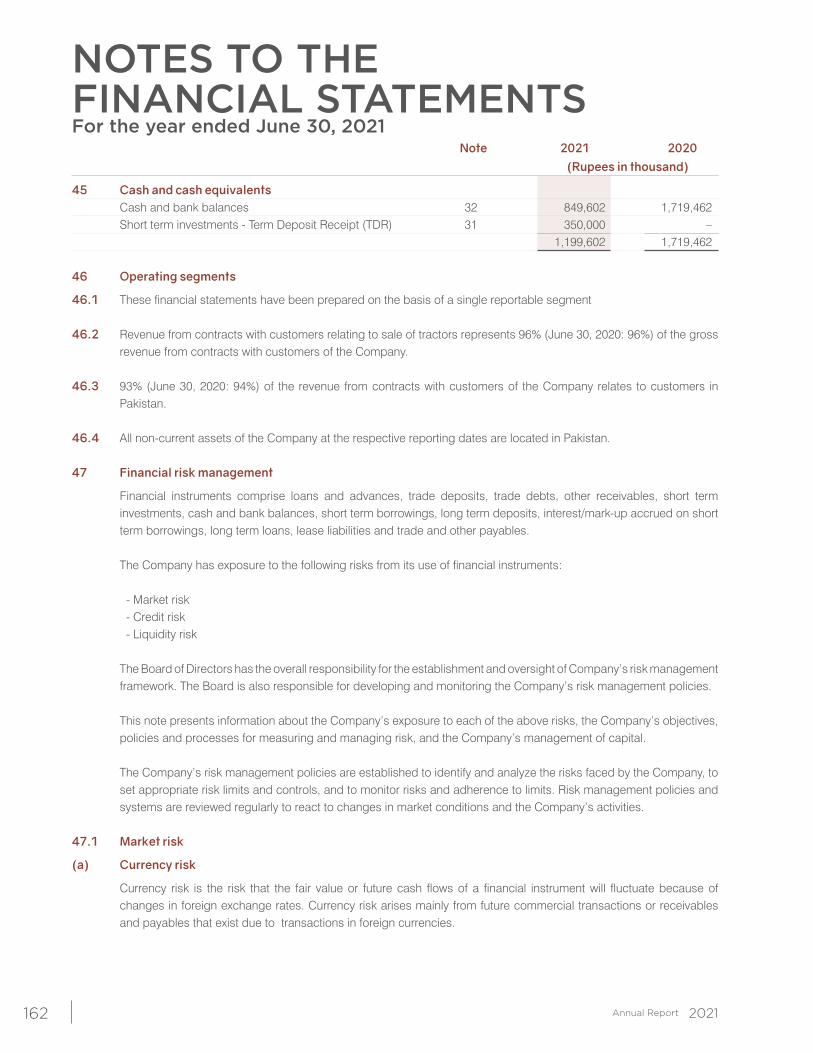
NOTES TO THE FINANCIAL STATEMENTSFor the year ended June 30, 2021
162
Note 2021 2020 (Rupees in thousand)
45 Cash and cash equivalents Cash and bank balances 32 849,602 1,719,462 Short term investments - Term Deposit Receipt (TDR) 31 350,000 – 1,199,602 1,719,462 46 Operating segments
46.1 These financial statements have been prepared on the basis of a single reportable segment 46.2 Revenue from contracts with customers relating to sale of tractors represents 96% (June 30, 2020: 96%) of the gross
revenue from contracts with customers of the Company. 46.3 93% (June 30, 2020: 94%) of the revenue from contracts with customers of the Company relates to customers in
Pakistan. 46.4 All non-current assets of the Company at the respective reporting dates are located in Pakistan. 47 Financial risk management
Financial instruments comprise loans and advances, trade deposits, trade debts, other receivables, short term investments, cash and bank balances, short term borrowings, long term deposits, interest/mark-up accrued on short term borrowings, long term loans, lease liabilities and trade and other payables.
The Company has exposure to the following risks from its use of financial instruments: - Market risk - Credit risk - Liquidity risk The Board of Directors has the overall responsibility for the establishment and oversight of Company’s risk management
framework. The Board is also responsible for developing and monitoring the Company’s risk management policies. This note presents information about the Company’s exposure to each of the above risks, the Company’s objectives,
policies and processes for measuring and managing risk, and the Company’s management of capital. The Company’s risk management policies are established to identify and analyze the risks faced by the Company, to
set appropriate risk limits and controls, and to monitor risks and adherence to limits. Risk management policies and systems are reviewed regularly to react to changes in market conditions and the Company’s activities.
47.1 Market risk
(a) Currency risk
Currency risk is the risk that the fair value or future cash flows of a financial instrument will fluctuate because of changes in foreign exchange rates. Currency risk arises mainly from future commercial transactions or receivables and payables that exist due to transactions in foreign currencies.
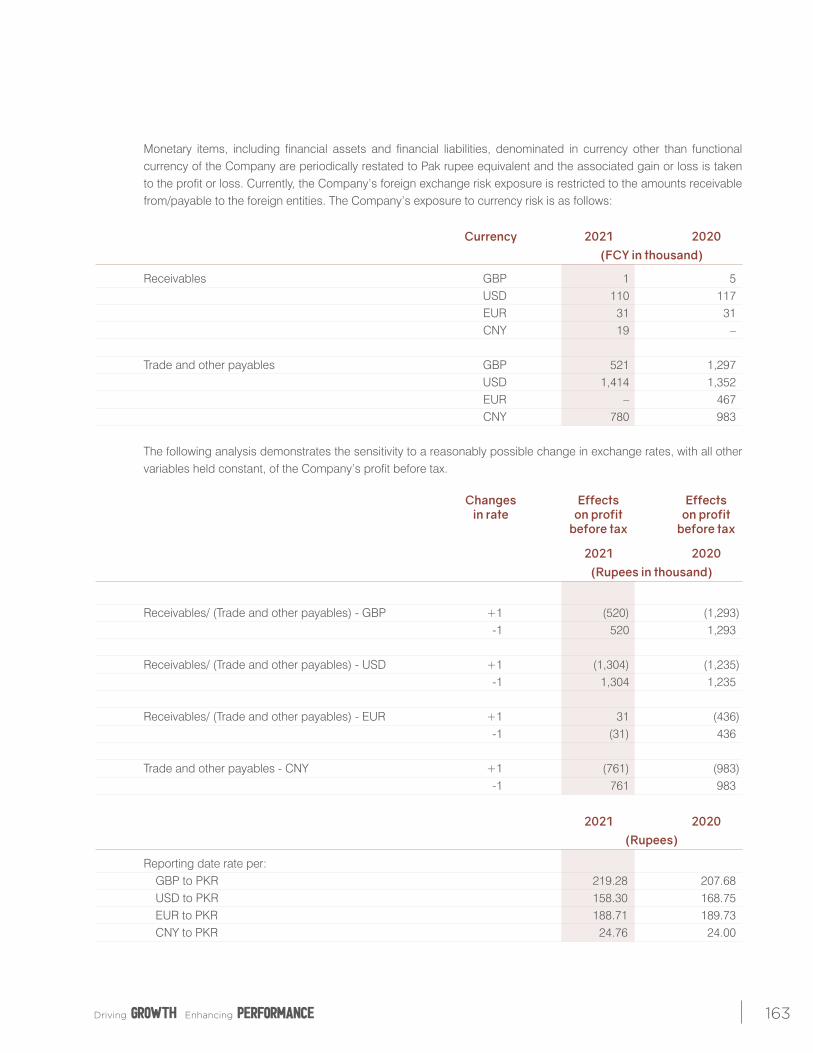
163
Monetary items, including financial assets and financial liabilities, denominated in currency other than functional currency of the Company are periodically restated to Pak rupee equivalent and the associated gain or loss is taken to the profit or loss. Currently, the Company’s foreign exchange risk exposure is restricted to the amounts receivable from/payable to the foreign entities. The Company’s exposure to currency risk is as follows:
Currency 2021 2020 (FCY in thousand)
Receivables GBP 1 5 USD 110 117 EUR 31 31 CNY 19 – Trade and other payables GBP 521 1,297 USD 1,414 1,352 EUR – 467 CNY 780 983 The following analysis demonstrates the sensitivity to a reasonably possible change in exchange rates, with all other
variables held constant, of the Company’s profit before tax. Changes Effects Effects in rate on profit on profit before tax before tax
2021 2020 (Rupees in thousand)
Receivables/ (Trade and other payables) - GBP +1 (520) (1,293) -1 520 1,293 Receivables/ (Trade and other payables) - USD +1 (1,304) (1,235) -1 1,304 1,235 Receivables/ (Trade and other payables) - EUR +1 31 (436) -1 (31) 436 Trade and other payables - CNY +1 (761) (983) -1 761 983
2021 2020 (Rupees)
Reporting date rate per: GBP to PKR 219.28 207.68 USD to PKR 158.30 168.75 EUR to PKR 188.71 189.73 CNY to PKR 24.76 24.00
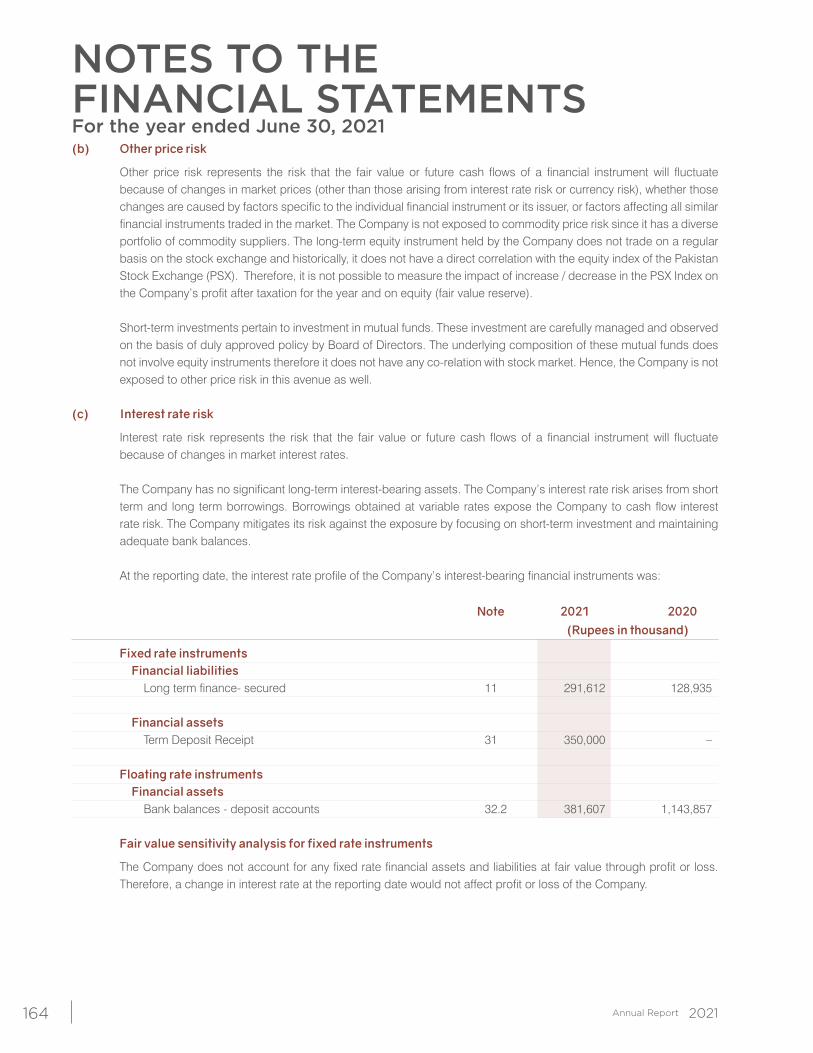
NOTES TO THE FINANCIAL STATEMENTSFor the year ended June 30, 2021
164
(b) Other price risk
Other price risk represents the risk that the fair value or future cash flows of a financial instrument will fluctuate because of changes in market prices (other than those arising from interest rate risk or currency risk), whether those changes are caused by factors specific to the individual financial instrument or its issuer, or factors affecting all similar financial instruments traded in the market. The Company is not exposed to commodity price risk since it has a diverse portfolio of commodity suppliers. The long-term equity instrument held by the Company does not trade on a regular basis on the stock exchange and historically, it does not have a direct correlation with the equity index of the Pakistan Stock Exchange (PSX). Therefore, it is not possible to measure the impact of increase / decrease in the PSX Index on the Company’s profit after taxation for the year and on equity (fair value reserve).
Short-term investments pertain to investment in mutual funds. These investment are carefully managed and observed
on the basis of duly approved policy by Board of Directors. The underlying composition of these mutual funds does not involve equity instruments therefore it does not have any co-relation with stock market. Hence, the Company is not exposed to other price risk in this avenue as well.
(c) Interest rate risk
Interest rate risk represents the risk that the fair value or future cash flows of a financial instrument will fluctuate because of changes in market interest rates.
The Company has no significant long-term interest-bearing assets. The Company’s interest rate risk arises from short
term and long term borrowings. Borrowings obtained at variable rates expose the Company to cash flow interest rate risk. The Company mitigates its risk against the exposure by focusing on short-term investment and maintaining adequate bank balances.
At the reporting date, the interest rate profile of the Company’s interest-bearing financial instruments was:
Note 2021 2020 (Rupees in thousand)
Fixed rate instruments Financial liabilities Long term finance- secured 11 291,612 128,935 Financial assets Term Deposit Receipt 31 350,000 – Floating rate instruments Financial assets Bank balances - deposit accounts 32.2 381,607 1,143,857 Fair value sensitivity analysis for fixed rate instruments
The Company does not account for any fixed rate financial assets and liabilities at fair value through profit or loss. Therefore, a change in interest rate at the reporting date would not affect profit or loss of the Company.
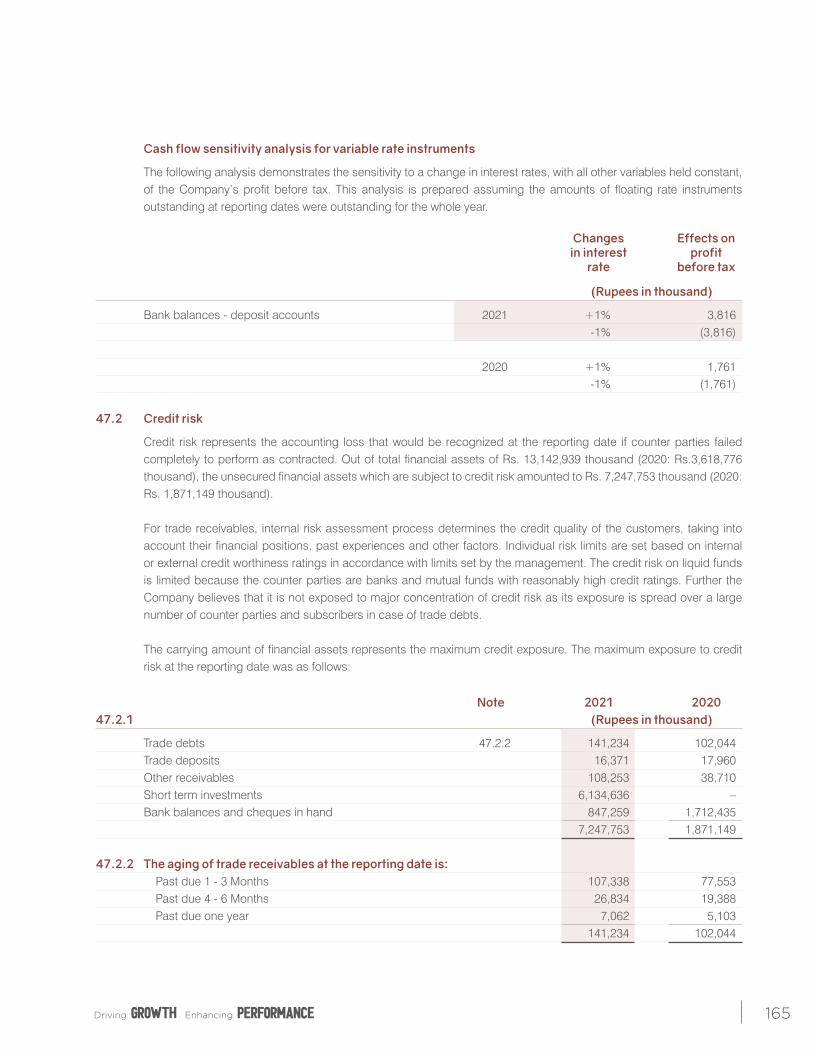
165
Cash flow sensitivity analysis for variable rate instruments
The following analysis demonstrates the sensitivity to a change in interest rates, with all other variables held constant, of the Company’s profit before tax. This analysis is prepared assuming the amounts of floating rate instruments outstanding at reporting dates were outstanding for the whole year.
Changes Effects on in interest profit rate before tax
(Rupees in thousand)
Bank balances - deposit accounts 2021 +1% 3,816 -1% (3,816) 2020 +1% 1,761 -1% (1,761) 47.2 Credit risk
Credit risk represents the accounting loss that would be recognized at the reporting date if counter parties failed completely to perform as contracted. Out of total financial assets of Rs. 13,142,939 thousand (2020: Rs.3,618,776 thousand), the unsecured financial assets which are subject to credit risk amounted to Rs. 7,247,753 thousand (2020: Rs. 1,871,149 thousand).
For trade receivables, internal risk assessment process determines the credit quality of the customers, taking into
account their financial positions, past experiences and other factors. Individual risk limits are set based on internal or external credit worthiness ratings in accordance with limits set by the management. The credit risk on liquid funds is limited because the counter parties are banks and mutual funds with reasonably high credit ratings. Further the Company believes that it is not exposed to major concentration of credit risk as its exposure is spread over a large number of counter parties and subscribers in case of trade debts.
The carrying amount of financial assets represents the maximum credit exposure. The maximum exposure to credit
risk at the reporting date was as follows:
Note 2021 202047.2.1 (Rupees in thousand)
Trade debts 47.2.2 141,234 102,044 Trade deposits 16,371 17,960 Other receivables 108,253 38,710 Short term investments 6,134,636 – Bank balances and cheques in hand 847,259 1,712,435 7,247,753 1,871,149
47.2.2 The aging of trade receivables at the reporting date is: Past due 1 - 3 Months 107,338 77,553 Past due 4 - 6 Months 26,834 19,388 Past due one year 7,062 5,103 141,234 102,044
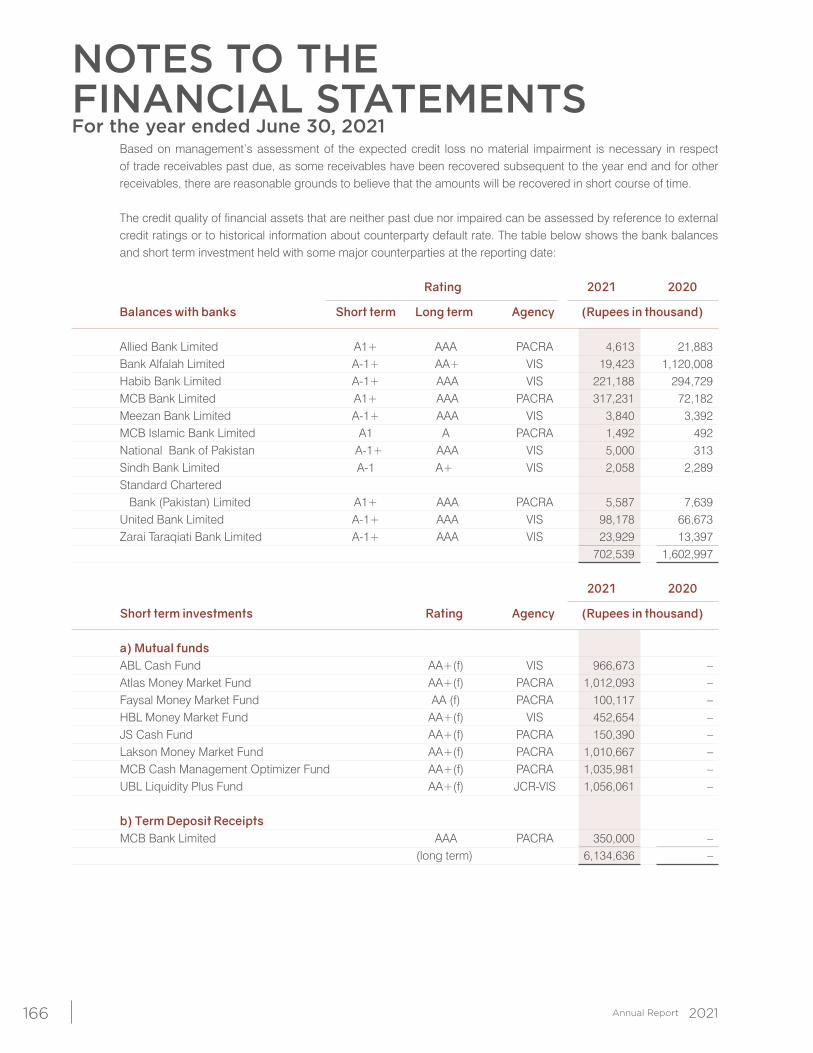
NOTES TO THE FINANCIAL STATEMENTSFor the year ended June 30, 2021
166
Based on management’s assessment of the expected credit loss no material impairment is necessary in respect of trade receivables past due, as some receivables have been recovered subsequent to the year end and for other receivables, there are reasonable grounds to believe that the amounts will be recovered in short course of time.
The credit quality of financial assets that are neither past due nor impaired can be assessed by reference to external credit ratings or to historical information about counterparty default rate. The table below shows the bank balances and short term investment held with some major counterparties at the reporting date:
Rating 2021 2020
Balances with banks Short term Long term Agency (Rupees in thousand)
Allied Bank Limited A1+ AAA PACRA 4,613 21,883 Bank Alfalah Limited A-1+ AA+ VIS 19,423 1,120,008 Habib Bank Limited A-1+ AAA VIS 221,188 294,729 MCB Bank Limited A1+ AAA PACRA 317,231 72,182 Meezan Bank Limited A-1+ AAA VIS 3,840 3,392 MCB Islamic Bank Limited A1 A PACRA 1,492 492 National Bank of Pakistan A-1+ AAA VIS 5,000 313 Sindh Bank Limited A-1 A+ VIS 2,058 2,289 Standard Chartered Bank (Pakistan) Limited A1+ AAA PACRA 5,587 7,639 United Bank Limited A-1+ AAA VIS 98,178 66,673 Zarai Taraqiati Bank Limited A-1+ AAA VIS 23,929 13,397 702,539 1,602,997
2021 2020
Short term investments Rating Agency (Rupees in thousand)
a) Mutual funds ABL Cash Fund AA+(f) VIS 966,673 – Atlas Money Market Fund AA+(f) PACRA 1,012,093 – Faysal Money Market Fund AA (f) PACRA 100,117 – HBL Money Market Fund AA+(f) VIS 452,654 – JS Cash Fund AA+(f) PACRA 150,390 – Lakson Money Market Fund AA+(f) PACRA 1,010,667 – MCB Cash Management Optimizer Fund AA+(f) PACRA 1,035,981 – UBL Liquidity Plus Fund AA+(f) JCR-VIS 1,056,061 – b) Term Deposit Receipts MCB Bank Limited AAA PACRA 350,000 – (long term) 6,134,636 –
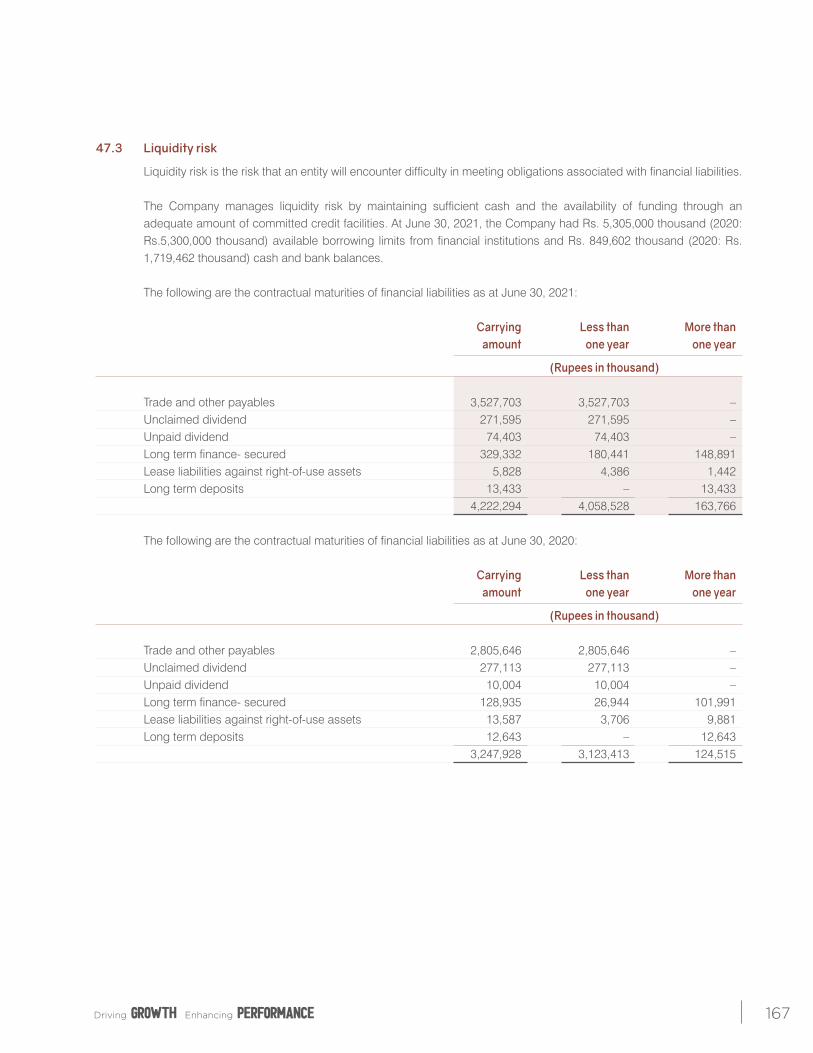
167
47.3 Liquidity risk
Liquidity risk is the risk that an entity will encounter difficulty in meeting obligations associated with financial liabilities. The Company manages liquidity risk by maintaining sufficient cash and the availability of funding through an
adequate amount of committed credit facilities. At June 30, 2021, the Company had Rs. 5,305,000 thousand (2020: Rs.5,300,000 thousand) available borrowing limits from financial institutions and Rs. 849,602 thousand (2020: Rs. 1,719,462 thousand) cash and bank balances.
The following are the contractual maturities of financial liabilities as at June 30, 2021: Carrying Less than More than amount one year one year
(Rupees in thousand) Trade and other payables 3,527,703 3,527,703 – Unclaimed dividend 271,595 271,595 – Unpaid dividend 74,403 74,403 – Long term finance- secured 329,332 180,441 148,891 Lease liabilities against right-of-use assets 5,828 4,386 1,442 Long term deposits 13,433 – 13,433 4,222,294 4,058,528 163,766 The following are the contractual maturities of financial liabilities as at June 30, 2020: Carrying Less than More than amount one year one year
(Rupees in thousand) Trade and other payables 2,805,646 2,805,646 – Unclaimed dividend 277,113 277,113 – Unpaid dividend 10,004 10,004 – Long term finance- secured 128,935 26,944 101,991 Lease liabilities against right-of-use assets 13,587 3,706 9,881 Long term deposits 12,643 – 12,643 3,247,928 3,123,413 124,515
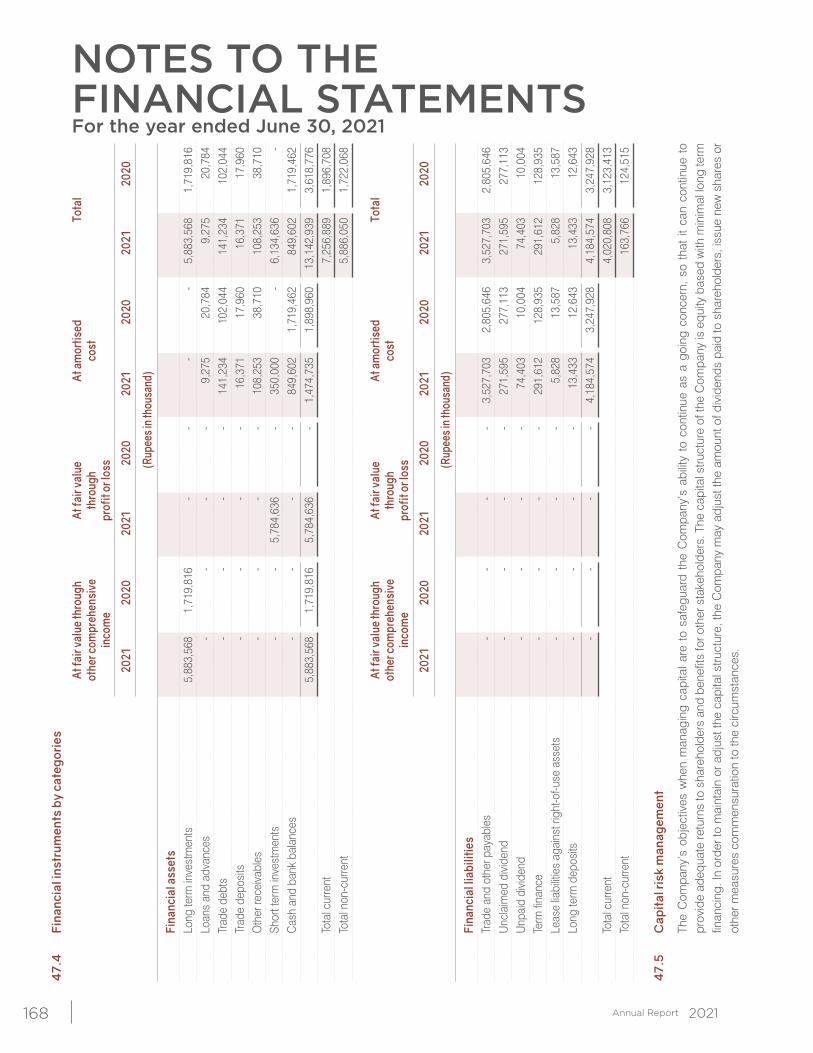
NOTES TO THE FINANCIAL STATEMENTSFor the year ended June 30, 2021
168
47.
4
Fina
ncia
l ins
trum
ents
by
cate
gori
es
At fa
ir va
lue
thro
ugh
At fa
ir va
lue
At a
mor
tised
To
tal
othe
r com
preh
ensi
ve
thro
ugh
cost
inco
me
prof
it or
loss
2021
20
20
2021
20
20
2021
20
20
2021
20
20
(Rup
ees i
n th
ousa
nd)
Fi
nanc
ial a
sset
s
Long
term
inve
stm
ents
5
,883
,568
1
,719
,816
-
-
-
-
5
,883
,568
1
,719
,816
Loan
s an
d ad
vanc
es
-
-
-
-
9,2
75
20,
784
9
,275
2
0,78
4
Trad
e de
bts
-
-
-
-
141
,234
1
02,0
44
141
,234
1
02,0
44
Tr
ade
depo
sits
-
-
-
-
1
6,37
1
17,
960
1
6,37
1
17,
960
O
ther
rece
ivab
les
-
-
-
-
108
,253
3
8,71
0
108
,253
3
8,71
0
Shor
t ter
m in
vest
men
ts
-
-
5,7
84,6
36
-
350
,000
-
6
,134
,636
-
Cas
h an
d ba
nk b
alan
ces
-
-
-
-
849
,602
1
,719
,462
8
49,6
02
1,7
19,4
62
5,8
83,5
68
1,7
19,8
16
5,7
84,6
36
-
1,4
74,7
35
1,8
98,9
60
13,
142,
939
3
,618
,776
Tota
l cur
rent
7
,256
,889
1
,896
,708
Tota
l non
-cur
rent
5
,886
,050
1
,722
,068
At fa
ir va
lue
thro
ugh
At fa
ir va
lue
At a
mor
tised
To
tal
othe
r com
preh
ensi
ve
thro
ugh
co
st
in
com
e pr
ofit
or lo
ss
2021
20
20
2021
20
20
2021
20
20
2021
20
20
(Rup
ees i
n th
ousa
nd)
Fi
nanc
ial l
iabi
litie
s
Trad
e an
d ot
her p
ayab
les
-
-
-
-
3,5
27,7
03
2,8
05,6
46
3,5
27,7
03
2,8
05,6
46
U
ncla
imed
div
iden
d -
-
-
-
2
71,5
95
277
,113
2
71,5
95
277
,113
Unp
aid
divi
dend
-
-
-
-
7
4,40
3
10,
004
7
4,40
3
10,
004
Te
rm fi
nanc
e -
-
-
-
2
91,6
12
128
,935
2
91,6
12
128
,935
Leas
e lia
bilit
ies
agai
nst r
ight
-of-u
se a
sset
s -
-
-
-
5
,828
1
3,58
7
5,8
28
13,
587
Lo
ng te
rm d
epos
its
-
-
-
-
13,
433
1
2,64
3
13,
433
1
2,64
3
-
-
-
-
4
,184
,574
3
,247
,928
4
,184
,574
3
,247
,928
Tota
l cur
rent
4
,020
,808
3
,123
,413
Tota
l non
-cur
rent
1
63,7
66
124
,515
47.
5 C
apit
al ri
sk m
anag
emen
t
Th
e C
ompa
ny’s
obj
ectiv
es w
hen
man
agin
g ca
pita
l are
to
safe
guar
d th
e C
ompa
ny’s
abi
lity
to c
ontin
ue a
s a
goin
g co
ncer
n, s
o th
at it
can
con
tinue
to
prov
ide
adeq
uate
retu
rns
to s
hare
hold
ers
and
bene
fits
for o
ther
sta
keho
lder
s. T
he c
apita
l stru
ctur
e of
the
Com
pany
is e
quity
bas
ed w
ith m
inim
al lo
ng te
rm
finan
cing
. In
orde
r to
mai
ntai
n or
adj
ust t
he c
apita
l stru
ctur
e, th
e C
ompa
ny m
ay a
djus
t the
am
ount
of d
ivid
ends
pai
d to
sha
reho
lder
s, is
sue
new
sha
res
or
othe
r mea
sure
s co
mm
ensu
ratio
n to
the
circ
umst
ance
s.
169
48 Fair values of financial assets and liabilities
Fair value is the price that would be received to sell an asset or paid to transfer a liability in an orderly transaction between market participants at the measurement date. Underlying the definition of the fair value is the presumption that the Company is a going concern and there is no intention or requirement to curtail materially the scale of its operations or to undertake a transaction on adverse terms.
A financial instrument is regarded as quoted in an active market if quoted prices are readily and regularly available
from an exchange dealer, broker, industry group, pricing service, or regulatory agency, and those prices represent actual and regularly occurring market transactions on arm’s length basis.
The carrying values of other financial assets and financial liabilities reflected in financial statements approximate to
their fair values. Fair value is determined on the basis of objective evidence at each reporting date. 48.1 Fair value hierarchy
IFRS 13 “Fair Value Measurement requires the Company to classify fair value measurement and fair value hierarchy that reflects the significance of the inputs used in making the measurement of fair value hierarchy, which has the following levels:
Level 1: The fair value of financial instruments traded in active markets is based on quoted market prices at the
reporting date. A market is regarded as active if quoted prices are readily and regularly available from an exchange, dealer, broker, industry group, pricing service, or regulatory agency, and those prices represent actual and regularly occurring market transactions on an arm’s length basis. The quoted market price used for financial assets held by the Company is the current bid price.
Level 2: The fair value of financial instruments that are not traded in an active market is determined by using valuation
techniques. These valuation techniques maximise the use of observable market data where it is available and rely as little as possible on entity specific estimates. If all significant inputs required to fair value an instrument are observable.
Level 3: If one or more of the significant inputs is not based on observable market data. Specific valuation techniques
used to value financial instruments include:
- Quoted market prices or dealer quotes for similar instruments.
- The fair value of interest Rate swaps is calculated as the present value of the estimated future cash flows based on observable yield curves.
- Other techniques, such as discounted cash flow analysis, are used to determine fair value for the remaining financial instruments.
The carrying values of all financial and liabilities reflected in the financial statements approximate their fair values. Transfer between levels of the fair value hierarchy are recognized at the end of the reporting period during which the
changes have occurred, if any. The Company’s policy is to recognize transfers into and transfers out of fair value hierarchy levels as at the end of the reporting period. Changes between various levels of fair value hierarchy are analyzed at the end of each reporting period during the annual valuation discussion between the Chief Financial Officer and the management of investee company. As part of this discussion, the investee company presents a report that explains the reason for the fair value movement, if any. There have been no transfers between various levels of the fair value hierarchy during the respective reporting periods.
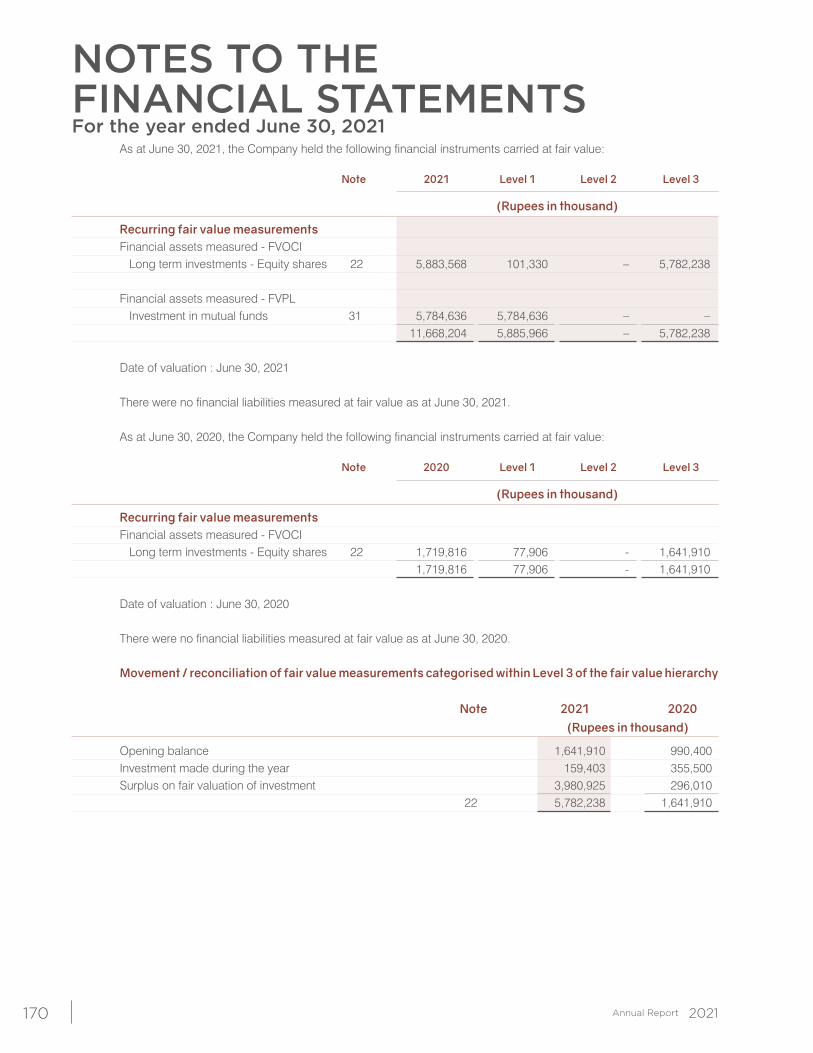
NOTES TO THE FINANCIAL STATEMENTSFor the year ended June 30, 2021
170
As at June 30, 2021, the Company held the following financial instruments carried at fair value:
Note 2021 Level 1 Level 2 Level 3
(Rupees in thousand)
Recurring fair value measurements Financial assets measured - FVOCI Long term investments - Equity shares 22 5,883,568 101,330 – 5,782,238
Financial assets measured - FVPL Investment in mutual funds 31 5,784,636 5,784,636 – – 11,668,204 5,885,966 – 5,782,238 Date of valuation : June 30, 2021 There were no financial liabilities measured at fair value as at June 30, 2021. As at June 30, 2020, the Company held the following financial instruments carried at fair value: Note 2020 Level 1 Level 2 Level 3
(Rupees in thousand)
Recurring fair value measurements Financial assets measured - FVOCI Long term investments - Equity shares 22 1,719,816 77,906 - 1,641,910 1,719,816 77,906 - 1,641,910 Date of valuation : June 30, 2020 There were no financial liabilities measured at fair value as at June 30, 2020. Movement / reconciliation of fair value measurements categorised within Level 3 of the fair value hierarchy
Note 2021 2020 (Rupees in thousand)
Opening balance 1,641,910 990,400 Investment made during the year 159,403 355,500 Surplus on fair valuation of investment 3,980,925 296,010 22 5,782,238 1,641,910
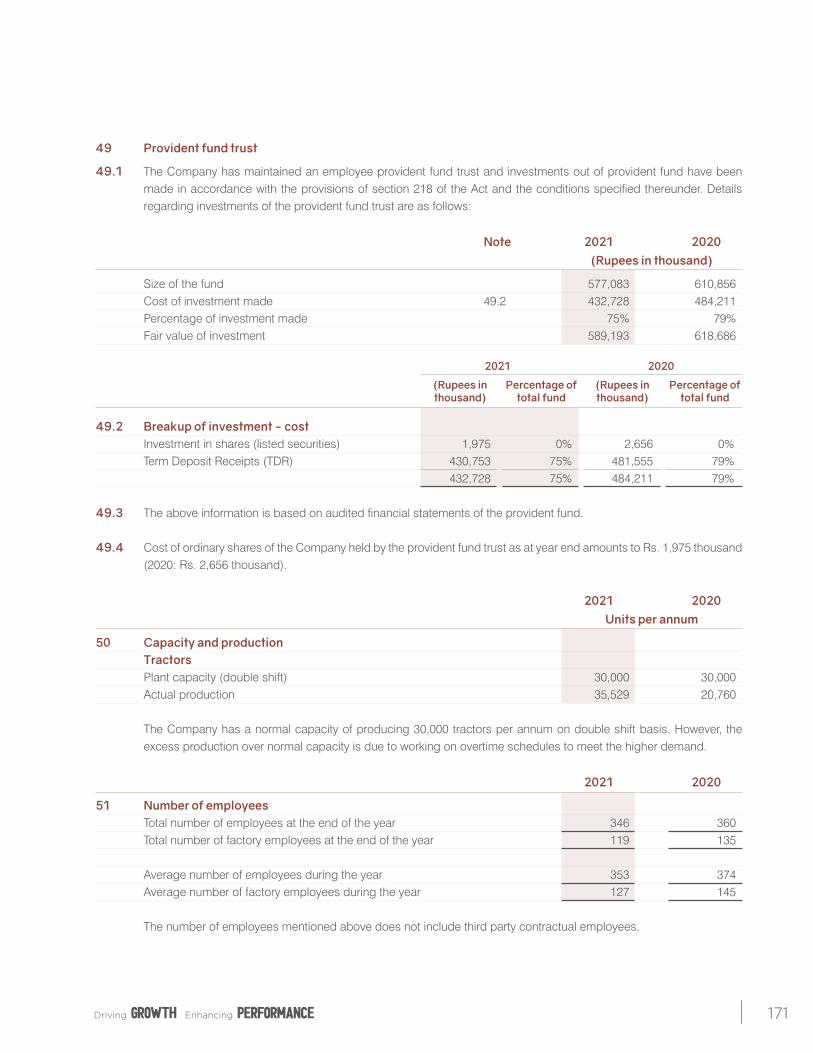
171
49 Provident fund trust
49.1 The Company has maintained an employee provident fund trust and investments out of provident fund have been made in accordance with the provisions of section 218 of the Act and the conditions specified thereunder. Details regarding investments of the provident fund trust are as follows:
Note 2021 2020 (Rupees in thousand)
Size of the fund 577,083 610,856 Cost of investment made 49.2 432,728 484,211 Percentage of investment made 75% 79% Fair value of investment 589,193 618,686 2021 2020
(Rupees in Percentage of (Rupees in Percentage of thousand) total fund thousand) total fund
49.2 Breakup of investment - cost Investment in shares (listed securities) 1,975 0% 2,656 0% Term Deposit Receipts (TDR) 430,753 75% 481,555 79% 432,728 75% 484,211 79% 49.3 The above information is based on audited financial statements of the provident fund. 49.4 Cost of ordinary shares of the Company held by the provident fund trust as at year end amounts to Rs. 1,975 thousand
(2020: Rs. 2,656 thousand).
2021 2020 Units per annum
50 Capacity and production Tractors Plant capacity (double shift) 30,000 30,000 Actual production 35,529 20,760 The Company has a normal capacity of producing 30,000 tractors per annum on double shift basis. However, the
excess production over normal capacity is due to working on overtime schedules to meet the higher demand.
2021 2020
51 Number of employees Total number of employees at the end of the year 346 360 Total number of factory employees at the end of the year 119 135 Average number of employees during the year 353 374 Average number of factory employees during the year 127 145 The number of employees mentioned above does not include third party contractual employees.
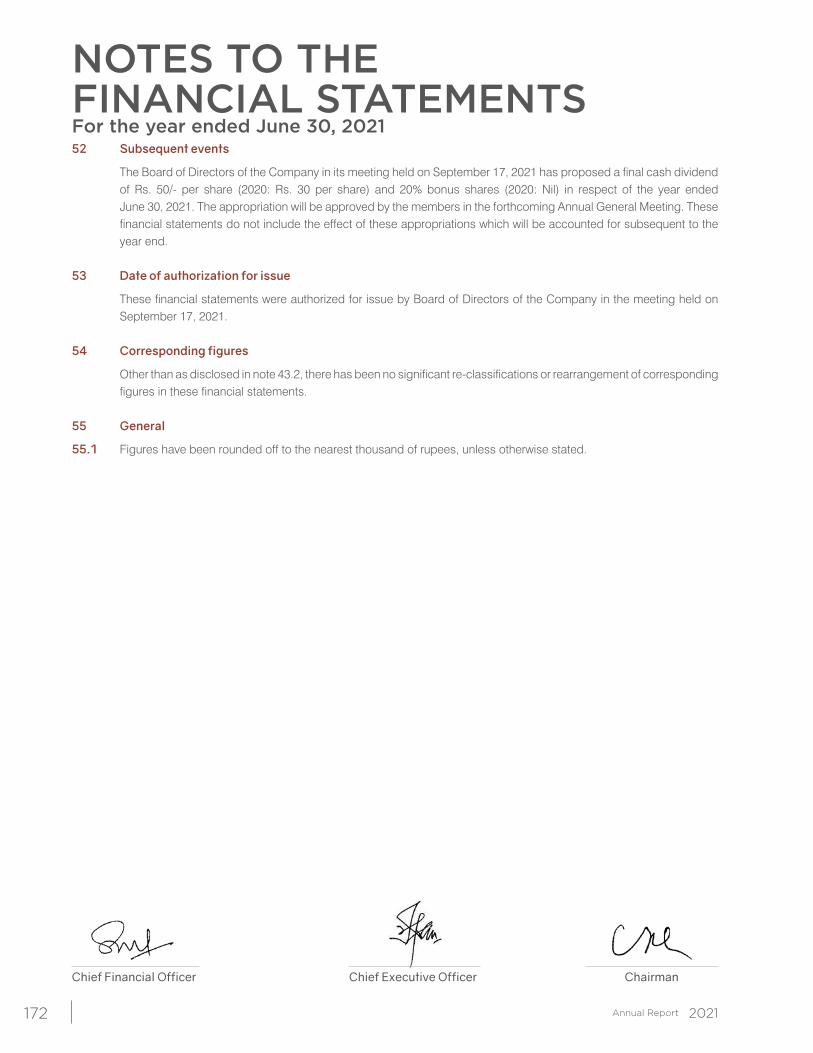
NOTES TO THE FINANCIAL STATEMENTSFor the year ended June 30, 2021
172
52 Subsequent events
The Board of Directors of the Company in its meeting held on September 17, 2021 has proposed a final cash dividend of Rs. 50/- per share (2020: Rs. 30 per share) and 20% bonus shares (2020: Nil) in respect of the year ended June 30, 2021. The appropriation will be approved by the members in the forthcoming Annual General Meeting. These financial statements do not include the effect of these appropriations which will be accounted for subsequent to the year end.
53 Date of authorization for issue
These financial statements were authorized for issue by Board of Directors of the Company in the meeting held on September 17, 2021.
54 Corresponding figures
Other than as disclosed in note 43.2, there has been no significant re-classifications or rearrangement of corresponding figures in these financial statements.
55 General
55.1 Figures have been rounded off to the nearest thousand of rupees, unless otherwise stated.
Chief Financial Officer Chief Executive Officer Chairman

173
CONSOLIDATEDFINANCIAL STATEMENTS
174
The Directors are pleased to present their report together with the audited Group Consolidated Financial Statements for the year ended June 30, 2021.
THE GROUP
The Group comprises Millat Tractors Limited (MTL) (Holding Company) and its subsidiaries i.e., Millat Industrial Products Limited (MIPL), TIPEG INTERTRADE DMCC, Dubai, U.A.E., Bolan Castings Limited (BCL) and Millat Equipment Limited (MEL).
MILLAT INDUSTRIAL PRODUCTS LIMITED
a. BOARD OF DIRECTORS
The present Board consists of seven directors of which six directors were elected in the 19th Annual General Meeting of the Company held on October 30, 2020. During the year a casual vacancy was created due to death of Mr. Latif Khalid Hashmi which was filled by appointment of Mr. Sohail Ahmed Nisar. The Directors of the company are: M/s. Sikandar Mustafa Khan, Sohail Bashir Rana, Laeeq Uddin Ansari, Mian Muhammad Saleem, Ahsan Imran Shaikh, Javed Aslam and Sohail Ahmad Nisar.
b. PRINCIPAL ACTIVITIES, DEVELOPMENT AND PERFORMANCE OF COMPANY’S BUSINESS
The Company is engaged in the business of manufacture and sale of vehicular, industrial and domestic batteries. Sales during the year were Rs. 1,716.362 million and net profit after tax was Rs. 76.550 million. Earning per share for the year was Rs. 8.55.
Solar batteries with enhanced backup time are being made to meet the requirement of solar customers. Sale of deep cycle batteries also increased during the year. Keeping in view the market requirement, maintenance free battery will be marketed in near future.
c. PRINCIPAL RISKS AND UNCERTAINTIES
The major risks and uncertainties being faced by the Company are fluctuation in prices of raw material, increased cost of imported raw material due to unprecedented devaluation of Rupee, low demand of batteries for UPS in view of improved electricity supply and entry of new competitors in the market. During
GROUP DIRECTORS’ REPORT
the year, increase in prices in both local and imported raw materials has adversely affected the profit margin. No changes have occurred during the financial year concerning the nature of the business of the company.
d. FUTURE PROSPECTS OF PROFIT
The Company aims to increase profit by setting a challenging sales target in the next financial year. New entrant and changing market dynamics will be countered by quality and cost control.
e. ADEQUACY OF INTERNAL FINANCIAL CONTROLS
Adequate internal financial controls are in place and are being meticulously observed by concerned personals and being monitored by internal audit department on regular basis.
TIPEG INTERTRADE DMCC
a. BOARD OF DIRECTORS
The Directors of the Company are: M/s. Sikandar Mustafa Khan, Sohail Bashir Rana, Laeeq Uddin Ansari and Mian Muhammad Saleem. During the year a casual vacancy was created due to death of Mr. Latif Khalid Hashmi.
b. PRINCIPAL ACTIVITIES, DEVELOPMENT AND PERFORMANCE OF COMPANY’S BUSINESS
TIPEG Intertrade DMCC, Dubai, U.A.E is a Limited Liability Company registered with Dubai Multi Commodities Centre Authority. Millat Tractors Limited has a holding of 75% in the equity of the Company. The principal activity of the Company is trading in machinery and heavy equipment and parts thereof. The principal place of business of the Company is located at Jumeirah Lake Towers, Dubai, UAE. TIPEG earned a net profit of AED 1.025 million and registered sale of AED 42.268 million for the period. Earnings per share were AED 512.50. So far performance of the Company has been satisfactory and business will further expand after higher exports of tractors from Pakistan.
c. PRINCIPAL RISKS AND UNCERTAINTIES
Currently no apparent risk or uncertainty is likely to affect the performance of the Company. No changes have occurred during the financial year concerning the nature of the business of the company
175
d. FUTURE PROSPECTS OF PROFIT
The Company aims to enhance its revenue by marketing products of MTL and other group companies in African and other international markets.
e. ADEQUACY OF INTERNAL FINANCIAL CONTROLS
Adequate internal financial controls are in place and are being observed.
BOLAN CASTINGS LIMITED
a. BOARD OF DIRECTORS
The present Board consists of seven directors who were elected in the Annual General Meeting of the Company held on October 28, 2020. During the year a casual vacancy was created due to death of Mr. Latif Khalid Hashmi which was filled by appointment of Mian Muhammad Saleem. The Directors of the company are: M/s. Sikandar Mustafa Khan, Sohail Bashir Rana, Laeeq Uddin Ansari, Mian Muhammad Saleem, Aamir Amin, Tabassum Rana, Abdul Hamid Ahmed Dagia.
b. PRINCIPAL ACTIVITIES, DEVELOPMENT AND PERFORMANCE OF COMPANY’S BUSINESS
BCL is a public limited company listed on Pakistan Stock Exchange. BCL manufactures intricate tractor components i.e., major tractor castings for MTL. MTL holds 46.26% shares of the total paid up capital of the Company. 10,674 M.T of casting has been produced during the year against 6,623 M.T of last year resulting in an increase of 61.16%, while 9,634 M.T of casting has been sold against 6,839 M.T sold last year i.e., an increase of 40.86%.
Unlike other economies across the world, Pakistan’s economy began to revive at a faster pace during the current financial year, owing to significant rise in domestic economic activity. The tractors industry also showed a robust sign of growth in the current financial year and have witnessed the hike in tractors sale due to high local as well as foreign demand which have resulted the vendors also to gear-up their efforts in providing parts and accessories at a fast space in spite of challenges due to inflation and devaluation of Pakistani Rupees against foreign currencies which resulted increase in cost of production.
The sales revenues of the company for the year amounted to Rs.2,418.8 million against Rs. 1,332.56 million of last year. The gross profit was Rs. 303.30 million against gross loss of Rs. 88.13 million of last year. Profit before tax was Rs. 223.91 million against loss before tax Rs. 259.61 million of last year. The profit after tax was Rs. 132.38 million against loss after tax Rs. 271.68 million of last year.
c. PRINCIPAL RISKS AND UNCERTAINTIES
Effective risk management is the key to sustainable business. Risk management framework, coupled with internal control policies have helped the company to maintain focus and mitigating principle risks affecting the company. However, overall risks arising from the Company’s financial instruments are limited as there is no significant exposure to market risk in respect of such instruments. Internal Audit department provides independent report to Board of Directors on the effectiveness of risk management and control processes.
d. FUTURE PROSPECTS OF PROFIT
The economic is steadily progressing towards more sustainable and inclusive growth and it depends on government economic policies to facilitate the industries to overcome the economic challenges due to Covid-19 and devaluation in Pakistani Rupees. As the government has given economic stimulus packages for agriculture and initiative for Kissan programs. It is believed that the tractors and its vending industry will experience a boost in terms of economic performance due to recent economic development. Additionally, BCL is also endeavoring for new sales avenues and at the same time adopting cost-cutting measures.
e. ADEQUACY OF INTERNAL FINANCIAL CONTROLS
BCL maintains a system of internal controls, which is designed to identify, evaluate and manage risks that may affect the achievement of business objectives rather than to eliminate these risks and can, therefore, provide only reasonable assurance against material misstatement or loss. Audit Committee is responsible for reviewing the effectiveness of the system of internal controls.
176
MILLAT EQUIPMENT LIMITED
a. BOARD OF DIRECTORS
The Directors of the Company are: M/s. Sikandar Mustafa Khan, Laeeq Uddin Ansari, Muhammad Mustafa Khan, Muhammad Mustafa Sohail, Murad Naseer uddin Ansari, Qaiser Saleem and Syed Muhammad Irfan Aqueel. They were elected in EOGM held on June 30, 2021. Mr. Ahsan Imran Shaikh is CEO of the company who was appointed on July 01, 2021.
b. PRINCIPAL ACTIVITIES, DEVELOPMENT AND PERFORMANCE OF COMPANY’S BUSINESS
MEL is a non listed public limited company and is engaged in manufacturing of gears, shafts and other related parts for MTL. The shareholding of MTL in the paid up capital of MEL is 45%. The Company’s principal activities are producing a range of transmission shafts and gears for the various models of Massey Ferguson tractors in Pakistan. Financial performance of the company during the year was exceptional. MEL earned an after tax profit of Rs. 787.03 million and registered sale of Rs. 4,859.64 million for the year. Earnings per share were Rs. 30.27.
c. PRINCIPAL RISKS AND UNCERTAINTIES
In an apparent view, other than being a single customer company and risk associated with it there appears no odd that may have any material adverse effect on Company’s business in a foreseeable future. No changes have occurred during the financial year concerning the nature of the business of the company.
d. FUTURE PROSPECTS OF PROFIT
Despite the current economic hardships along with pandemic situation being faced, the tractor demand will increase significantly as economic activity in the country has geared up during current year. Therefore, profitability of company is expected to improve in the upcoming financial year.
e. ADEQUACY OF INTERNAL FINANCIAL CONTROLS
Adequate internal financial controls are already in place and Board’s Audit Committee ensures complete and satisfactory implementation of the same
SUBSEQUENT EVENTS
No material changes or commitments affecting the financial position of the Group Companies have occurred between the end of the financial year of the Companies and the date of this report except as disclosed in their respective annual reports.
CHANGE IN NATURE OF BUSNIESS
During the year there has been no major change in the nature of business of any group company.
AUDITOR’S OBSERVATIONS
No adverse remark, observation was given by the auditors’ of any group company in their reports for the year/period ended June 30, 2021.
FUTURE PROSPECTS
There is no significant doubt about the group companies’ ability to continue as going concerns and therefore future prospects are positive.
PATTERN OF SHAREHOLDING
The pattern of shareholding of MTL is annexed to the Directors’ Report and the shareholding pattern of MIPL, TIPEG, BCL and MEL is enclosed.
EARNINGS PER SHARE
Earnings per share of the group for the year ended June 30, 2021 was Rs. 117.13 as against Rs. 35.04 (restated) of the preceding year.
Chief Executive Officer ChairmanLahore: September 17, 2021
177
178
179
180
INDEPENDENTAUDITOR’S REPORT To the members of Millat Tractors Limited
Opinion
We have audited the annexed consolidated financial statements of Millat Tractors Limited and its subsidiaries (the Group), which comprise the consolidated statement of financial position as at June 30, 2021, and the consolidated statement of profit or loss and other comprehensive income, the consolidated statement of changes in equity and the consolidated statement of cash flows for the year then ended, and notes to the consolidated financial statements, including a summary of significant accounting policies and other explanatory information.
In our opinion, the consolidated financial statements give a true and fair view of the consolidated financial position of the Group as at June 30, 2021, and of its consolidated financial performance and its consolidated cash flows for the year then ended in accordance with the accounting and reporting standards as applicable in Pakistan.
Basis for Opinion
We conducted our audit in accordance with International Standards on Auditing (ISAs) as applicable in Pakistan. Our responsibilities under those standards are further described in the Auditor’s Responsibilities for the Audit of the Consolidated Financial Statements section of our report. We are independent of the Group in accordance with the International Ethics Standards Board for Accountants’ Code of Ethics for Professional Accountants as adopted by the Institute of Chartered Accountants of Pakistan (the Code), and we have fulfilled our other ethical responsibilities in accordance with the Code. We believe that the audit evidence we have obtained is sufficient and appropriate to provide a basis for our opinion.
Key Audit Matters
Key audit matters are those matters that, in our professional judgment, were of most significance in our audit of the consolidated financial statements of the current period. These matters were addressed in the context of our audit of the consolidated financial statements as a whole, and in forming our opinion thereon, and we do not provide a separate opinion on these matters.Following are the Key audit matters:
Sr. # Key audit matter How the matter was addressed in our audit
1 Revenue recognition
(Refer note 4.16, note 35 to the annexed consolidated financial statements)
The Group is principally engaged in assembling and manufacturing of agricultural tractors, implements and multi-application products.
Revenue from sale of tractors is recognized when the performance obligation is satisfied by transferring control to customer i.e. upon delivery and acknowledgement from the customer. The Group recognizes revenue from the sales of own manufactured goods measured net of discounts and commissions.
Our audit procedures in relation to the matter, amongst others, included the following:
• evaluated management controls over revenue and checked their validation;
• performed verification of sales with underlying documentation including dispatch documents and sales invoices;
• tested on a sample basis, specific revenue transactions recorded before and after the reporting date with underlying documentation to assess whether revenue has been recognized in the correct period;
• verified that sales prices are approved by the appropriate authority;
A.F. FERGUSON & CO., Chartered Accountants, a member firm of the PwC network23-C, Aziz Avenue, Canal Bank, Gulberg-V, P.O.Box 39, Lahore-54660, PakistanTel: +92 (42) 3571 5868-71 / 3577 5747-50; Fax: +92 (42) 3577 5754 www.pwc.com/pk
KARACHI LAHORE ISLAMABAD
181
Sr. # Key audit matter How the matter was addressed in our audit
We consider revenue recognition as a key audit matter due to revenue being one of the key performance indicators of the Group and for the year revenue has increased significantly as compared to the last year. In addition, revenue was also considered as an area of inherent risk of material misstatement and significant audit risk as part of the audit process.
• performed audit procedures to analyze variation in the price and quantity sold during the year;
• tested on a sample basis, specific discounts and commission as per Group’s policy; and
• assessed the adequacy of disclosures made in the consolidated financial statements related to revenue.
2 Investment measured at Fair Value
(Refer note 4.11, note 22.2 and note 49.1 to the annexed consolidated financial statements)
The Group holds investment in the equity instrument of Hyundai Nishat Motor (Private) Limited (‘HNMPL’). Due to HNMPL being a non-listed company, their shares do not have a quoted price in an active market.
Therefore, fair value of their shares has been determined through valuation methodology based on discounted cash flow method. This involves several estimation techniques and management’s judgements to obtain reasonable expected future cash flow of the business and related discount rate.
Due to the significant level of judgment and estimation required to determine the fair value of the investment, we consider it to be a key audit matter.
Our audit procedures in relation to the matter, amongst others, included the following:
• understood and evaluated the process by which the cash flow forecast was prepared and approved, including confirming the mathematical accuracy of the underlying calculations;
• evaluated the cash flow forecast by obtaining an understanding of respective businesses of HNMPL;
• obtained an understanding of the work performed by the management on the model for the purpose of valuation;
• obtained corroborating evidence relating to the values as determined by the management by challenging key assumptions for the growth rates in the cash flow forecast by comparing them to historical results and economic forecasts and challenging the discount rate by independently estimating a range based on market data;
• performed sensitivity analysis around key assumptions to ascertain the extent of change individually in the value of the investment; and
• assessed the adequacy of the disclosures made by the Group in this area with regard to applicable accounting and reporting standards.
182
Information Other than the Consolidated and Separate Financial Statements and Auditor’s Reports Thereon
Management is responsible for the other information. The other information comprises the information included in the annual report, but does not include the consolidated and separate financial statements and our auditor’s reports thereon.
Our opinion on the consolidated financial statements does not cover the other information and we do not express any form of assurance conclusion thereon.
In connection with our audit of the consolidated financial statements, our responsibility is to read the other information and, in doing so, consider whether the other information is materially inconsistent with the consolidated financial statements or our knowledge obtained in the audit or otherwise appears to be materially misstated. If, based on the work we have performed, we conclude that there is a material misstatement of this other information, we are required to report that fact. We have nothing to report in this regard.
Responsibilities of Management and Board of Directors for the Consolidated Financial Statements
Management is responsible for the preparation and fair presentation of the consolidated financial statements in accordance with the accounting and reporting standards as applicable in Pakistan and Companies Act, 2017 and for such internal control as management determines is necessary to enable the preparation of consolidated financial statements that are free from material misstatement, whether due to fraud or error.
In preparing the consolidated financial statements, management is responsible for assessing the Group’s ability to continue as a going concern, disclosing, as applicable, matters related to going concern and using the going concern basis of accounting unless management either intends to liquidate the Group or to cease operations, or has no realistic alternative but to do so.
The Board of Directors is responsible for overseeing the Group’s financial reporting process.
Auditor’s Responsibilities for the Audit of the Consolidated Financial Statements
Our objectives are to obtain reasonable assurance about whether the consolidated financial statements as a whole are free from material misstatement, whether due to fraud or error, and to issue an auditor’s report that includes our opinion. Reasonable assurance is a high level of assurance, but is not a guarantee that an audit conducted in accordance with ISAs as applicable in Pakistan will always detect a material misstatement when it exists. Misstatements can arise from fraud or error and are considered material if, individually or in the aggregate, they could reasonably be expected to influence the economic decisions of users taken on the basis of these consolidated financial statements.
As part of an audit in accordance with ISAs as applicable in Pakistan, we exercise professional judgment and maintain professional skepticism throughout the audit. We also:
• Identify and assess the risks of material misstatement of the consolidated financial statements, whether due to fraud or error, design and perform audit procedures responsive to those risks, and obtain audit evidence that is sufficient and appropriate to provide a basis for our opinion. The risk of not detecting a material misstatement resulting from fraud is higher than for one resulting from error, as fraud may involve collusion, forgery, intentional omissions, misrepresentations, or the override of internal control.
• Obtain an understanding of internal control relevant to the audit in order to design audit procedures that are appropriate in the circumstances, but not for the purpose of expressing an opinion on the effectiveness of the Group’s internal control.
• Evaluate the appropriateness of accounting policies used and the reasonableness of accounting estimates and related disclosures made by management.
• Conclude on the appropriateness of management’s use of the going concern basis of accounting and, based on the audit evidence obtained, whether a material uncertainty exists related to events or conditions that may cast significant doubt on the Group’s ability to continue as a going concern. If we conclude that a material uncertainty exists, we are required to draw attention in our auditor’s report to the related disclosures in the consolidated financial statements or, if such disclosures are inadequate, to modify our opinion. Our conclusions are based on the audit evidence obtained up to the date of our auditor’s report. However, future events or conditions may cause the Group to cease to continue as a going concern.
• Evaluate the overall presentation, structure and content of the consolidated financial statements, including the disclosures, and whether the consolidated financial statements represent the underlying transactions and events in a manner that achieves fair presentation.
183
• Obtain sufficient appropriate audit evidence regarding the financial information of the entities or business activities within the Group to express an opinion on the consolidated financial statements. We are responsible for the direction, supervision and performance of the group audit. We remain solely responsible for our audit opinion.
We communicate with the Board of Directors regarding, among other matters, the planned scope and timing of the audit and significant audit findings, including any significant deficiencies in internal control that we identify during our audit.
We also provide the Board of Directors with a statement that we have complied with relevant ethical requirements regarding independence, and to communicate with them all relationships and other matters that may reasonably be thought to bear on our independence, and where applicable, related safeguards.
From the matters communicated with the Board of Directors, we determine those matters that were of most significance in the audit of the consolidated financial statements of the current period and are therefore the key audit matters. We describe these matters in our auditor’s report unless law or regulation precludes public disclosure about the matter or when, in extremely rare circumstances, we determine that a matter should not be communicated in our report because the adverse consequences of doing so would reasonably be expected to outweigh the public interest benefits of such communication.
The engagement partner on the audit resulting in this independent auditor’s report is Hammad Ali Ahmad.
A. F. Ferguson & Co Chartered AccountantsLahore Date: September 30, 2021
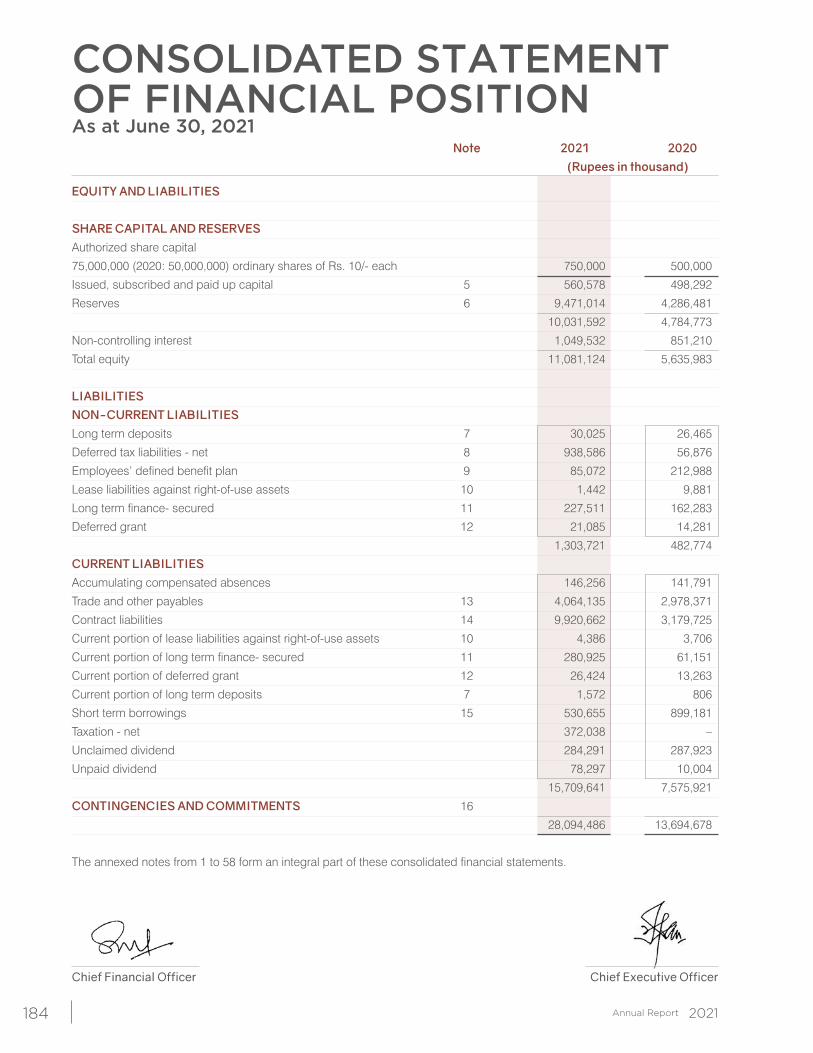
184
Note 2021 2020 (Rupees in thousand)
EQUITY AND LIABILITIES SHARE CAPITAL AND RESERVES
Authorized share capital
75,000,000 (2020: 50,000,000) ordinary shares of Rs. 10/- each 750,000 500,000
Issued, subscribed and paid up capital 5 560,578 498,292
Reserves 6 9,471,014 4,286,481
10,031,592 4,784,773
Non-controlling interest 1,049,532 851,210
Total equity 11,081,124 5,635,983
LIABILITIES NON-CURRENT LIABILITIES
Long term deposits 7 30,025 26,465
Deferred tax liabilities - net 8 938,586 56,876
Employees’ defined benefit plan 9 85,072 212,988
Lease liabilities against right-of-use assets 10 1,442 9,881
Long term finance- secured 11 227,511 162,283
Deferred grant 12 21,085 14,281
1,303,721 482,774
CURRENT LIABILITIES
Accumulating compensated absences 146,256 141,791
Trade and other payables 13 4,064,135 2,978,371
Contract liabilities 14 9,920,662 3,179,725
Current portion of lease liabilities against right-of-use assets 10 4,386 3,706
Current portion of long term finance- secured 11 280,925 61,151
Current portion of deferred grant 12 26,424 13,263
Current portion of long term deposits 7 1,572 806
Short term borrowings 15 530,655 899,181
Taxation - net 372,038 –
Unclaimed dividend 284,291 287,923
Unpaid dividend 78,297 10,004
15,709,641 7,575,921
CONTINGENCIES AND COMMITMENTS 16
28,094,486 13,694,678
The annexed notes from 1 to 58 form an integral part of these consolidated financial statements.
Chief Financial Officer Chief Executive Officer
CONSOLIDATED STATEMENT OF FINANCIAL POSITIONAs at June 30, 2021
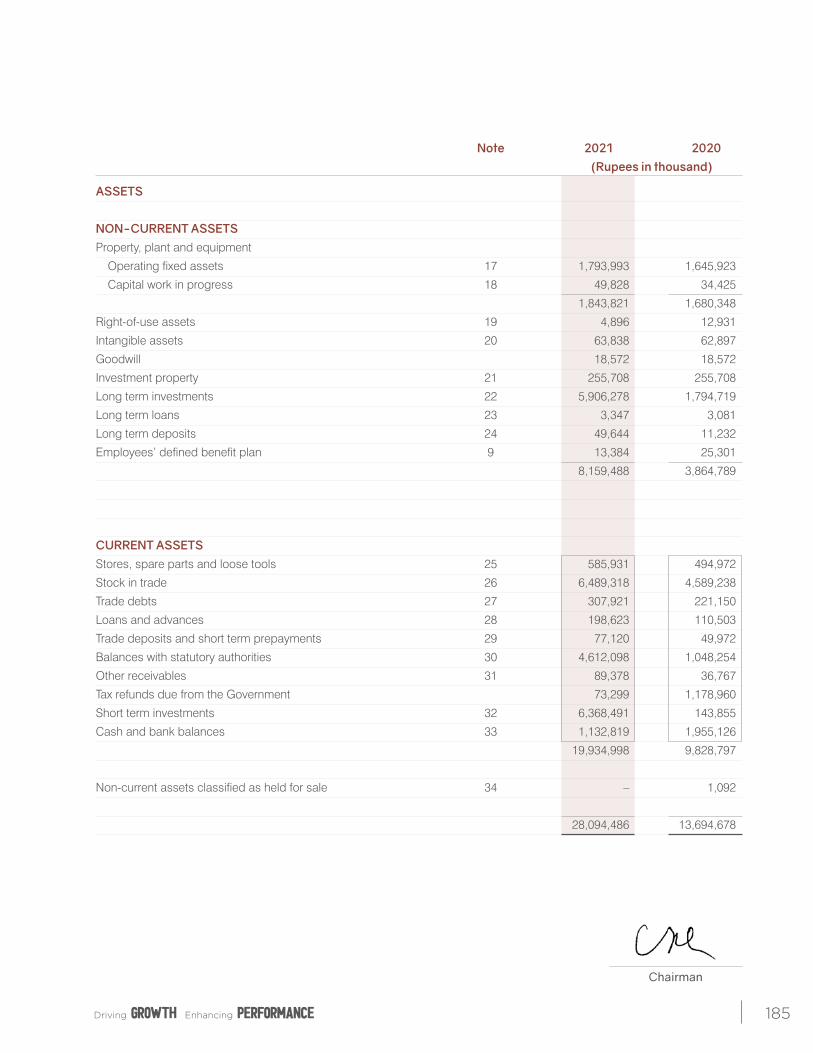
185
Note 2021 2020 (Rupees in thousand)
ASSETS
NON-CURRENT ASSETS Property, plant and equipment
Operating fixed assets 17 1,793,993 1,645,923
Capital work in progress 18 49,828 34,425
1,843,821 1,680,348
Right-of-use assets 19 4,896 12,931
Intangible assets 20 63,838 62,897
Goodwill 18,572 18,572
Investment property 21 255,708 255,708
Long term investments 22 5,906,278 1,794,719
Long term loans 23 3,347 3,081
Long term deposits 24 49,644 11,232
Employees’ defined benefit plan 9 13,384 25,301
8,159,488 3,864,789
CURRENT ASSETS
Stores, spare parts and loose tools 25 585,931 494,972
Stock in trade 26 6,489,318 4,589,238
Trade debts 27 307,921 221,150
Loans and advances 28 198,623 110,503
Trade deposits and short term prepayments 29 77,120 49,972
Balances with statutory authorities 30 4,612,098 1,048,254
Other receivables 31 89,378 36,767
Tax refunds due from the Government 73,299 1,178,960
Short term investments 32 6,368,491 143,855
Cash and bank balances 33 1,132,819 1,955,126
19,934,998 9,828,797
Non-current assets classified as held for sale 34 – 1,092
28,094,486 13,694,678
Chairman
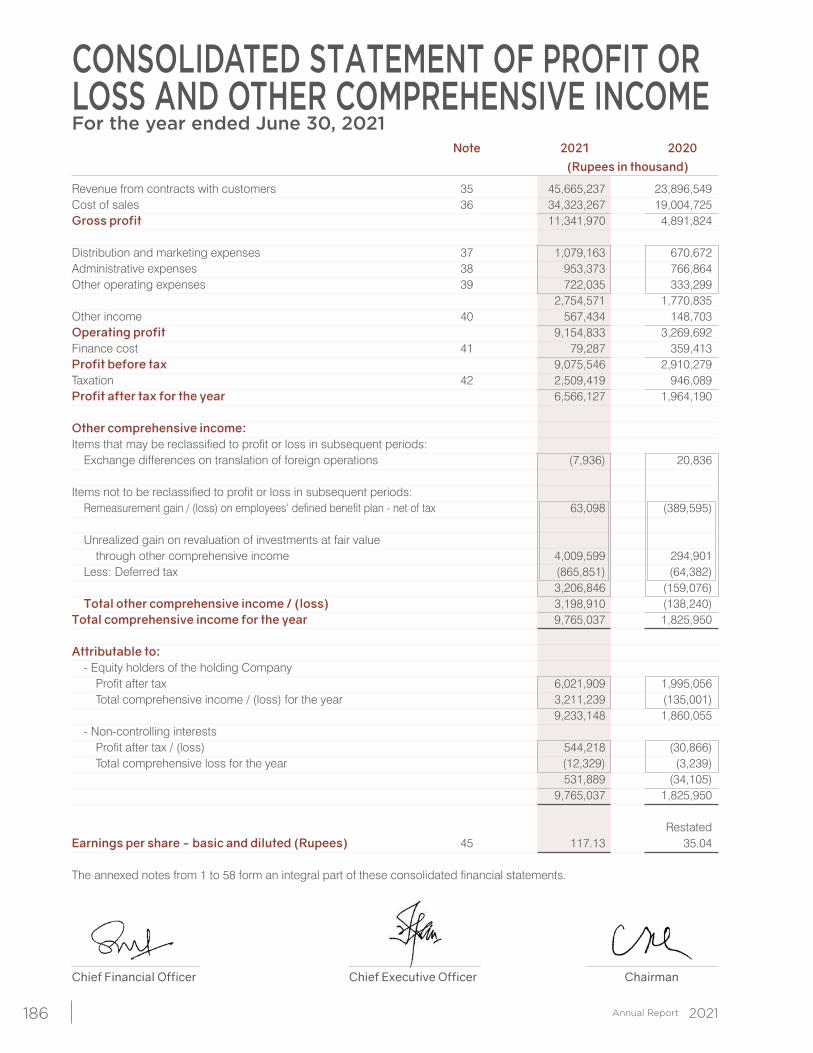
186
Note 2021 2020 (Rupees in thousand)
Revenue from contracts with customers 35 45,665,237 23,896,549 Cost of sales 36 34,323,267 19,004,725 Gross profit 11,341,970 4,891,824 Distribution and marketing expenses 37 1,079,163 670,672 Administrative expenses 38 953,373 766,864 Other operating expenses 39 722,035 333,299 2,754,571 1,770,835 Other income 40 567,434 148,703 Operating profit 9,154,833 3,269,692 Finance cost 41 79,287 359,413 Profit before tax 9,075,546 2,910,279 Taxation 42 2,509,419 946,089 Profit after tax for the year 6,566,127 1,964,190 Other comprehensive income: Items that may be reclassified to profit or loss in subsequent periods: Exchange differences on translation of foreign operations (7,936) 20,836 Items not to be reclassified to profit or loss in subsequent periods: Remeasurement gain / (loss) on employees’ defined benefit plan - net of tax 63,098 (389,595) Unrealized gain on revaluation of investments at fair value through other comprehensive income 4,009,599 294,901 Less: Deferred tax (865,851) (64,382) 3,206,846 (159,076) Total other comprehensive income / (loss) 3,198,910 (138,240)Total comprehensive income for the year 9,765,037 1,825,950 Attributable to: - Equity holders of the holding Company Profit after tax 6,021,909 1,995,056 Total comprehensive income / (loss) for the year 3,211,239 (135,001) 9,233,148 1,860,055 - Non-controlling interests Profit after tax / (loss) 544,218 (30,866) Total comprehensive loss for the year (12,329) (3,239) 531,889 (34,105) 9,765,037 1,825,950 Restated Earnings per share - basic and diluted (Rupees) 45 117.13 35.04
The annexed notes from 1 to 58 form an integral part of these consolidated financial statements.
CONSOLIDATED STATEMENT OF PROFIT OR LOSS AND OTHER COMPREHENSIVE INCOMEFor the year ended June 30, 2021
Chief Financial Officer Chief Executive Officer Chairman
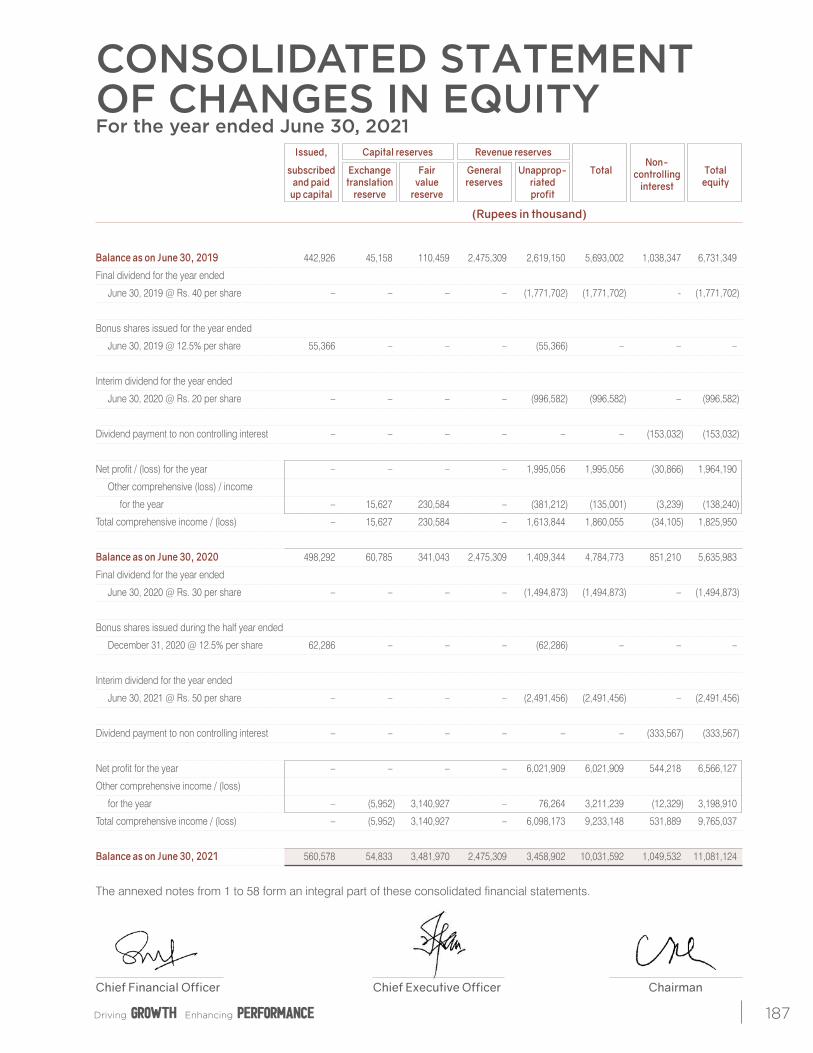
187
CONSOLIDATED STATEMENT OF CHANGES IN EQUITYFor the year ended June 30, 2021
Chief Financial Officer Chief Executive Officer Chairman
Issued, Capital reserves Revenue reserves
subscribed Exchange Fair General Unapprop- Total Non-
Total and paid translation value reserves riated
controlling equity
up capital reserve reserve profit interest
(Rupees in thousand)
Balance as on June 30, 2019 442,926 45,158 110,459 2,475,309 2,619,150 5,693,002 1,038,347 6,731,349
Final dividend for the year ended
June 30, 2019 @ Rs. 40 per share – – – – (1,771,702) (1,771,702) - (1,771,702)
Bonus shares issued for the year ended
June 30, 2019 @ 12.5% per share 55,366 – – – (55,366) – – –
Interim dividend for the year ended
June 30, 2020 @ Rs. 20 per share – – – – (996,582) (996,582) – (996,582)
Dividend payment to non controlling interest – – – – – – (153,032) (153,032)
Net profit / (loss) for the year – – – – 1,995,056 1,995,056 (30,866) 1,964,190
Other comprehensive (loss) / income
for the year – 15,627 230,584 – (381,212) (135,001) (3,239) (138,240)
Total comprehensive income / (loss) – 15,627 230,584 – 1,613,844 1,860,055 (34,105) 1,825,950
Balance as on June 30, 2020 498,292 60,785 341,043 2,475,309 1,409,344 4,784,773 851,210 5,635,983
Final dividend for the year ended
June 30, 2020 @ Rs. 30 per share – – – – (1,494,873) (1,494,873) – (1,494,873)
Bonus shares issued during the half year ended
December 31, 2020 @ 12.5% per share 62,286 – – – (62,286) – – –
Interim dividend for the year ended
June 30, 2021 @ Rs. 50 per share – – – – (2,491,456) (2,491,456) – (2,491,456)
Dividend payment to non controlling interest – – – – – – (333,567) (333,567)
Net profit for the year – – – – 6,021,909 6,021,909 544,218 6,566,127
Other comprehensive income / (loss)
for the year – (5,952) 3,140,927 – 76,264 3,211,239 (12,329) 3,198,910
Total comprehensive income / (loss) – (5,952) 3,140,927 – 6,098,173 9,233,148 531,889 9,765,037
Balance as on June 30, 2021 560,578 54,833 3,481,970 2,475,309 3,458,902 10,031,592 1,049,532 11,081,124
The annexed notes from 1 to 58 form an integral part of these consolidated financial statements.
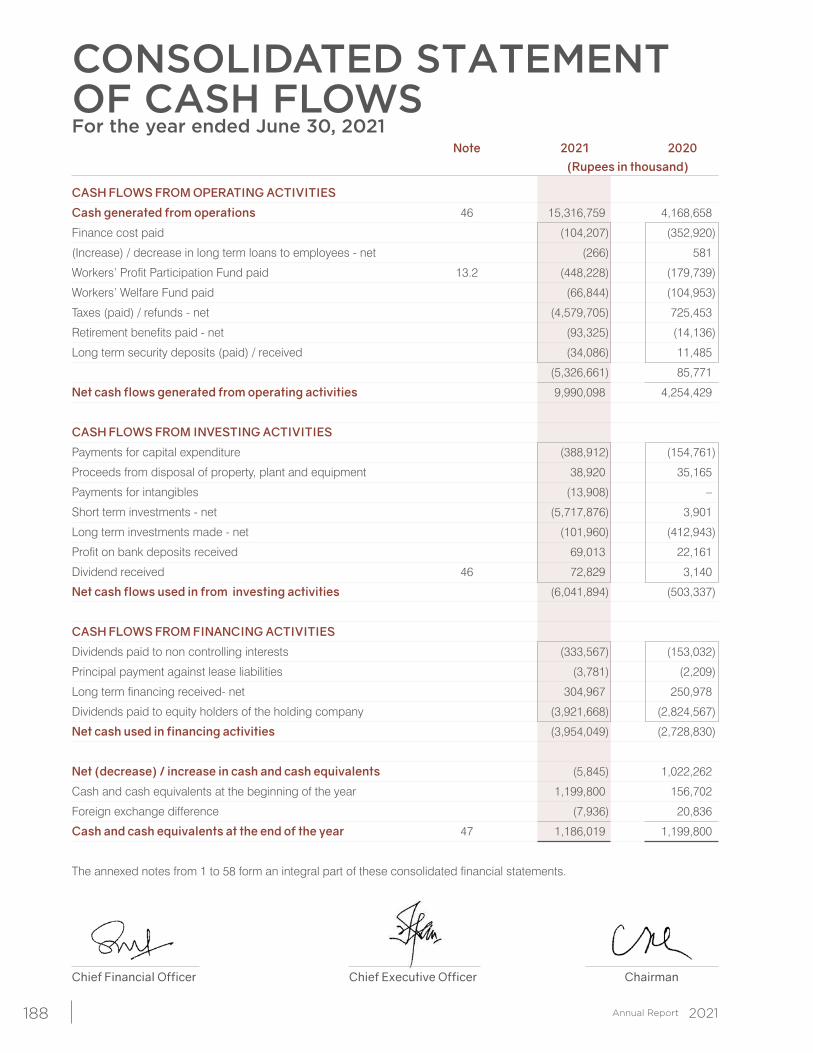
188
Note 2021 2020 (Rupees in thousand)
CASH FLOWS FROM OPERATING ACTIVITIES
Cash generated from operations 46 15,316,759 4,168,658
Finance cost paid (104,207) (352,920)
(Increase) / decrease in long term loans to employees - net (266) 581
Workers’ Profit Participation Fund paid 13.2 (448,228) (179,739)
Workers’ Welfare Fund paid (66,844) (104,953)
Taxes (paid) / refunds - net (4,579,705) 725,453
Retirement benefits paid - net (93,325) (14,136)
Long term security deposits (paid) / received (34,086) 11,485
(5,326,661) 85,771
Net cash flows generated from operating activities 9,990,098 4,254,429
CASH FLOWS FROM INVESTING ACTIVITIES
Payments for capital expenditure (388,912) (154,761)
Proceeds from disposal of property, plant and equipment 38,920 35,165
Payments for intangibles (13,908) –
Short term investments - net (5,717,876) 3,901
Long term investments made - net (101,960) (412,943)
Profit on bank deposits received 69,013 22,161
Dividend received 46 72,829 3,140
Net cash flows used in from investing activities (6,041,894) (503,337)
CASH FLOWS FROM FINANCING ACTIVITIES
Dividends paid to non controlling interests (333,567) (153,032)
Principal payment against lease liabilities (3,781) (2,209)
Long term financing received- net 304,967 250,978
Dividends paid to equity holders of the holding company (3,921,668) (2,824,567)
Net cash used in financing activities (3,954,049) (2,728,830)
Net (decrease) / increase in cash and cash equivalents (5,845) 1,022,262
Cash and cash equivalents at the beginning of the year 1,199,800 156,702
Foreign exchange difference (7,936) 20,836
Cash and cash equivalents at the end of the year 47 1,186,019 1,199,800
The annexed notes from 1 to 58 form an integral part of these consolidated financial statements.
CONSOLIDATED STATEMENT OF CASH FLOWSFor the year ended June 30, 2021
Chief Financial Officer Chief Executive Officer Chairman
189
1 Legal status and nature of business
1.1 Holding company:
Millat Tractors Limited - (MTL)
Millat Tractors Limited (the Company) is a public limited company and was incorporated in Pakistan in 1964 under the Companies Act, 1913 (now the Companies Act, 2017), and is listed on the Pakistan Stock Exchange Limited. The registered office and factory of the Company is situated at 9 km Sheikhupura Road, District Sheikhupura. The Company also has regional offices located in Karachi, Multan, Sukkur and Islamabad.
The Company is principally engaged in assembling and manufacturing of agricultural tractors, implements and multi-
application products. The Company is also involved in the sale, implementation and support of IFS applications in Pakistan.
Subsidiary companies:
a) Millat Industrial Products Limited (MIPL)
Millat Industrial Products Limited (MIPL), an unlisted public company registered under the Companies Ordinance 1984 (now the Companies Act, 2017), is a subsidiary of Millat Tractors Limited which holds 64.09% of the MIPL’s equity. MIPL is engaged in the business of manufacturing of industrial, domestical and vehicular batteries, cells and components. The geographical location and address of the MIPL’s business units, including mills/plant is as under:
- The registered office of MIPL is situated at 8.8 km, Lahore- Sheikhupura Road, Shahdara, Lahore - The manufacturing facility of MIPL is located at 49 km., off Multan Road, Bhai Pheru, Distt. Kasur. b) Tipeg Intertrade DMCC
TIPEG Intertrade DMCC, a limited liability company registered with Dubai Multi Commodities Centre (DMCC) Authority, is a subsidiary of Millat Tractors Limited which holds 75% of the TIPEG Intertrade DMCC’s equity. The principal place of business of the TIPEG Intertrade DMCC is located at Jumeirah Lake Towers, Dubai-UAE. TIPEG Intertrade DMCC is formed for trading of machinery and heavy equipment and its registered office is situated at Unit No.705, Fortune Executive Tower, Jumeirah lake Towers, Dubai, United Arab Emirates.
c) Millat Equipment Limited (MEL)
Millat Equipment Limited, was incorporated as a private limited company under the repealed Companies Ordinance 1984 (Repealed with the enactment of the Companies Act, 2017 on May 30, 2017), and was converted into an unlisted public limited company on April 20, 2004 is a subsidiary of Millat Tractors Limited which holds 45% of the MEL’s equity. MEL is engaged in the business of manufacturing of automotive, agricultural and industrial vehicles, parts and components thereof. The registered office of MEL is situated at Sheikhupura Road, Lahore and the manufacturing facility of is situated at 10 km Raiwind Road, Lahore.
d) Bolan Castings Limited (BCL)
Bolan Castings Limited (BCL), a public limited company incorporated in Pakistan under the repealed Companies Ordinance 1984 (now the Companies Act), and listed on the Pakistan Stock Exchange, is a subsidiary of Millat Tractors Limited which holds 46.26% of the BCL’s equity. BCL is engaged in the business of manufacturing of castings for tractors and automotive parts thereof. The geographical location and address of BCL’s business unit, including plant is RCD Highway, Hub Chowki, District Lasbela, Balochistan, Pakistan.
NOTES TO THE CONSOLIDATED FINANCIAL STATEMENTSFor the year ended June 30, 2021
NOTES TO THE CONSOLIDATEDFINANCIAL STATEMENTSFor the year ended June 30, 2021
190
1.2 Summary of significant transactions and events in the current reporting period
The Group’s financial position and performance was particularly affected by the following events and transactions during the reporting period:
- Revenue of the Group increased by Rs. 21,768,688 thousand (91%) as compared to prior year due to increase in
volumes - refer notes 35. - Additional long term investment were made by the Group in Hyundai Nishat Motors (Private) Limited (HNMPL)
amounting to Rs. 159,403 thousand under the Share Subscription Agreement (SSA) and Shareholders Agreement (SHA) between both parties - refer note 22.
- Investments in HNMPL (level-3) have been remeasured, using a valuation technique based on discounted cash flow analysis, at the reporting date resulting in an estimated fair value gain of Rs. 3,980,925 thousand. - refer note 22.2 and 49.1. The resulting fair value gain has been recognised in the other comprehensive income in these consolidated financial statements.
- Short term investments of the Group has increased by Rs. 6,224,636 thousand as compared to prior year - refer to note 32;
- During the year, the Group has obtained and repaid certain long term financing against the State Bank of Pakistan’s (SBP) salary refinance scheme of salaries and wages. Moreover, the Group also availed long term financing against the SBP refinance scheme for renewable energy for setting-up and comissioning solar power system - refer to note 11.
- Balances with statutory authorities on account of sales tax refunds increased by Rs. 3,563,844 as compared to the prior year - refer to note 30; and
- During the year, the BCL terminated a funded pension scheme which was operating for all its permanent employees by distributing plan assets amounting to Rs 115,857 thousand among current employees and pensioners - refer to note 9.
1.3 Impact of COVID-19 on the consolidated financial statements
The pandemic of COVID-19 that has rapidly spread all across the world has not only endangered human lives but has also adversely impacted the global economy. On March 23, 2020, the Government of the Punjab announced a temporary lock down as a measure to reduce the spread of the COVID–19. Complying with the lockdown, the Group temporarily suspended its operations from March 24, 2020. In the Group’s case, the lockdown was subsequently relaxed from March 30, 2020. After implementing all the necessary Standard Operating Procedures (SOPs) to ensure safety of employees, the Group henceforth resumed its operations and has taken all necessary steps to ensure smooth and adequate continuation of its business in order to maintain business performance despite slowed down economic activity.
According to management’s assessment, there is no significant accounting impact of the effects of COVID-19 on
these consolidated financial statements.
191
2 Statement of compliance
These consolidated financial statements have been prepared in accordance with the approved accounting and reporting standards as applicable in Pakistan. The accounting and reporting standards applicable in Pakistan comprise of:
- International Financial Reporting Standards (IFRS Standards) issued by the International Accounting Standards Board (IASB) as notified under the Companies Act, 2017; and
- Provisions and directives issued under the Companies Act, 2017.
Where the provisions of the directives issued under the Companies Act, 2017 differ from the IFRS Standards, the provisions of and directives issued under the Companies Act, 2017 have been followed.
3 Basis of preparation
These consolidated financial statements have been prepared under the historical cost convention except for revaluation of certain financial instruments at fair value or amortised cost and recognition of certain employee’s retirement benefit plan at present value.
3.1 Basis of measurement
These consolidated financial statements have been prepared under the historical cost convention except for revaluation of certain financial instruments at fair value or amortised cost and recognition of certain employee retirement benefits at present value.
3.2 Critical accounting estimates and judgments
The Group’s significant accounting policies are stated in note 4 to these consolidated financial statements. Not all of these significant policies require the management to make difficult, subjective or complex judgments or estimates. The following is intended to provide an understanding of the policies the management considers critical because of their complexity, judgment of estimation involved in their application and their impact on these consolidated financial statements. Estimates and judgments are continually evaluated and are based on historical experience, including expectation of future events that are believed to be reasonable under the circumstances. These judgments involve assumptions or estimates in respect of future events and the actual results may differ from these estimates. The areas involving higher degree of judgments or complexity or areas where assumptions and estimates are significant to the consolidated financial statements are as follows:
3.2.1 Employees’ retirement benefits and other obligations
The Group uses the valuation performed by an independent actuary as the present value of its retirement benefit obligations i.e. employees’ defined benefit plan and other obligations. The valuation is based on assumptions as mentioned in note 4.4 to these consolidated financial statements.
3.2.2 Provision for taxation
The Group takes into account the current income tax law and the decisions taken by appellate authorities. Instances where the Group’s view differs from the view taken by the income tax department at the assessment stage and where the Group considers that its views on items of material nature are in accordance with law and the outcome is expected in favour of the Group are shown as contingent liabilities.
NOTES TO THE CONSOLIDATEDFINANCIAL STATEMENTSFor the year ended June 30, 2021
192
3.2.3 Estimated useful lives, residual values and method of depreciation of property, plant and equipment
The Group reviews the useful lives of property, plant and equipment on a regular basis. Any change in estimates in future years might affect the carrying amounts of respective items of property, plant and equipment with a corresponding effect on the depreciation charge and impairment.
3.2.4 Provision for inventories and stores
The Group regularly reviews the inventories for impairment. Provision for obsolete and slow-moving inventories is based on management’s estimate of the condition and usability of inventories and stores.
3.2.5 Impairment of trade receivables
The Group applies the IFRS 9 simplified approach to measuring expected credit losses which uses a lifetime expected loss allowance for all trade receivables and contract assets.
The expected loss rates are based on the payment profiles of sales over a period of time before the reporting date
and the corresponding historical credit losses experienced within this period. The historical loss rates are adjusted to reflect current and forward-looking information on macroeconomic factors affecting the ability of the customers to settle the receivables.
3.2.6 Fair value of unquoted investments
Fair value of unquoted investments is determined by using valuation techniques. The Group uses its judgment to select an appropriate method and makes assumptions that are mainly based on market conditions existing at the end of each reporting period. The Group has used discounted cash flow analysis for this purpose as fully explained in note 22.2 to these consolidated financial statements.
3.2.7 Recording and impairment of goodwill
Goodwill is initially measured at cost (being the excess of the aggregate of the consideration transferred and the amount recognised for non-controlling interests) and any previous interest held over the net identifiable assets acquired and liabilities assumed. If the fair value of the net assets acquired is in excess of the aggregate consideration transferred, the Group re-assesses whether it has correctly identified all of the assets acquired and all of the liabilities assumed and reviews the procedures used to measure the amounts to be recognised at the acquisition date. If the reassessment still results in an excess of the fair value of net assets acquired over the aggregate consideration transferred, then the gain is recognised in profit or loss account.
After initial recognition, goodwill is measured at cost less any accumulated impairment losses. For the purpose of
impairment testing, goodwill acquired in a business combination is, from the acquisition date, allocated to each of the Group’s Cash-Generating Units (CGU) that are expected to benefit from the combination, irrespective of whether other assets or liabilities of the acquiree are assigned to those units.
Where goodwill has been allocated to a CGU and part of the operation within that unit is disposed of, the goodwill
associated with the disposed operation is included in the carrying amount of the operation when determining the gain or loss on disposal. Goodwill disposed in these circumstances is measured based on the relative values of the disposed operation and the portion of the cash-generating unit retained.
3.2.8 Lease term of right of use asset and lease liability
In determining the lease term, management considers all facts and circumstances that create an economic incentive to exercise an extension option, or not exercise a termination option. Extension options (or periods after termination options) are only included in the lease term if the lease is reasonably certain to be extended (or not terminated).
193
3.3 Functional and presentation currency
The consolidated financial statements are presented in Pak Rupees which is the Group’s functional and presentation currency.
4 Summary of significant accounting policies
The significant accounting policies which have been adopted in the preparation of these consolidated financial statements of the Group are consistent with previous year except as discussed in Note 4.1 and are as follows:
4.1 Changes in accounting standards, interpretations and pronouncements
a) Standards, interpretations and amendments to published approved accounting standards that became effective during the year but are not relevant
The Group has adopted the following accounting standard and the amendments and interpretation of IFRSs which became effective for the current year:
- IFRS 3 – Business combinations’, definition of a business (Amendment)
- IAS 8 – Accounting Policies, Changes in Accounting Estimates and Errors’ , definition of materiality (Amendments)
- IFRS 9 - Financial Instruments’ , Interest rate benchmark reform (Amendment)
- IFRS 7 - Financial Instruments-Disclosures , Interest rate benchmark reform (Amendment)
- IFRS 16 – Leases’, COVID-19 related rent concessions (Amendment) The adoption of the above amendments, improvements to accounting standards and interpretations did not have any
effect on the consolidated financial statements of the Group. b) Standards, interpretations and amendments to published approved accounting standards that are not
yet effective
The following standards, amendments and interpretations with respect to the approved accounting standards as applicable in Pakistan would be effective from the dates mentioned below against the respective standard or interpretation:
Effective Date (Annual periods Standard or interpretation beginning on or after)
Property, Plant and Equipment: Proceeds before intended use – Amendments to IAS 16 January 01, 2022
Cost of Fulfilling an Onerous Contracts – Amendments to IAS 37 January 01, 2022
Updating a Reference to the Conceptual Framework – Amendments to IFRS 3 January 01, 2022
Classification of Liabilities as Current or Non-current – Amendments to IAS 1 January 01, 2023
Amended by Definition of Accounting Estimates – Amendments to IAS 8 January 01, 2023 The management is in the process of assessing the impact of changes laid down by these standards on its
consolidated financial statements.
NOTES TO THE CONSOLIDATEDFINANCIAL STATEMENTSFor the year ended June 30, 2021
194
In addition to the above standards and amendments, improvements to various accounting standards have also been issued by the IASB in previous years. Such improvements are generally effective for accounting periods beginning on or after January 01, 2021 and January 01, 2022 respectively. The Group expects that such improvements to the standards will not have any significant impact on the Group’s consolidated financial statements in the period of initial application.
Further, the following new standards have been issued by IASB which are yet to be notified by the SECP for the
purpose of applicability in Pakistan:
IASB effective date (Annual periods Standard beginning on or after)
IFRS 17 – Insurance Contracts January 01, 2023 4.2 Principles of consolidation
4.2.1 Subsidiaries
A subsidiary is an entity controlled by the holding company. The holding company controls an investee when the holding company is exposed, or has rights, to variable returns from its involvement with the investee and has the ability to affect those returns through its power over the investee.
The purchase method of accounting is used to account for the acquisition of subsidiaries by the Group. The cost
of an acquisition is measured as the fair value of the assets given, equity instruments issued and liabilities incurred or assumed at the date of exchange, plus costs directly attributable to the acquisition. Identifiable assets acquired and liabilities and contingent liabilities assumed in a business combination are measured initially at their fair values at the acquisition date, irrespective of the extent of any non-controlling interest. The excess of the cost of acquisition over the fair value of the Group’s share of the identifiable net assets acquired is recorded as goodwill. If the cost of acquisition is less than the fair value of the net assets of the subsidiary acquired, the difference is recognized directly in the profit or loss. The assets, liabilities, income and expenses of subsidiaries are consolidated on a line by line basis and the carrying amount of investments held by the holding company is eliminated against the subsidiaries’ shareholders’ equity in the consolidated financials statements. Inter-group transactions, balances and unrealized gains on transactions between Group companies are eliminated. Unrealized losses are also eliminated but considered an impairment indicator of the asset transferred. The accounting policies used in preparation of consolidated financial statements of the holding company are consistent with accounting policies of its subsidiaries. When necessary, adjustments are made to bring the accounting policies in line with that of the holding company.
All significant intra-group transactions and balances between Group enterprises, and unrealised profits are eliminated
on consolidation. 4.2.2 Non-controlling interest
The Group applies a policy of treating transactions with non-controlling interests as transactions with parties external to the Group. Disposals to non-controlling interests result in gains and losses for the Group that are recorded in the profit or loss. Group elected to measures the non-controlling interest in the acquiree at the proportionate share of its interest in the acquree’s identifiable net assets on fair value.
195
4.3 Segment reporting
Segment reporting is based on the operating (business) segments of the Group. An operating segment is a component of the Group that engages in business activities from which it may earn revenues and incur expenses, including revenues and expenses that relate to transactions with any of the Company’s other components. An operating segment’s operating results are reviewed regularly by the Chief Executive Officer (the CEO) to assess segment’s performance, and for which discrete financial information is available. Segment results that are reported to the CEO include items directly attributable to a segment as well as those that can be allocated on a reasonable basis.
Accordingly, for reporting purposes, the Group has been organised into business units based on its products and
services and has three separate reportable segments, as follows:
The “tractors segment”, which deals with assembling and manufacturing of agricultural tractors, implements and multi-application products.
The “tractor components segment” i.e. equipment and parts, which is engaged in the business of manufacturing of
automotive, agricultural and industrial vehicles parts and components thereof. The “castings segment”, which is engaged in the business of manufacturing of castings for tractors and automotive
parts thereof. Other business activities of the Group have been presented under “others segment”. Accordingly, no operating
segments have been aggregated to form the above reportable operating segments. 4.4 Employees’ retirement benefits and other obligations
The main features of the schemes operated by the Group for its employees are as follows: 4.4.1 Defined benefit plan
4.4.1.1 Pension
MTL operates, while BCL previously operated a funded defined benefit pension scheme for all eligible employees. A defined benefit plan is a post-employment benefit plan other than the defined contribution plan. Contributions under the scheme are made to this fund on the basis of actuarial recommendation and are charged to profit or loss. The latest actuarial valuation for the scheme was carried out as at June 30, 2021.
The amount recognized in the consolidated statement of financial position represents the present value of the plan
assets reduced by value of defined benefit obligation. Any charge or credit arising as a result of remeasurements are recognized in the other comprehensive income of the Group in the period in which they occur.
The future contribution rate of the plan includes allowances for deficit and surplus. Projected Unit Credit Method, using
the following significant assumptions, is used for valuation of this scheme:
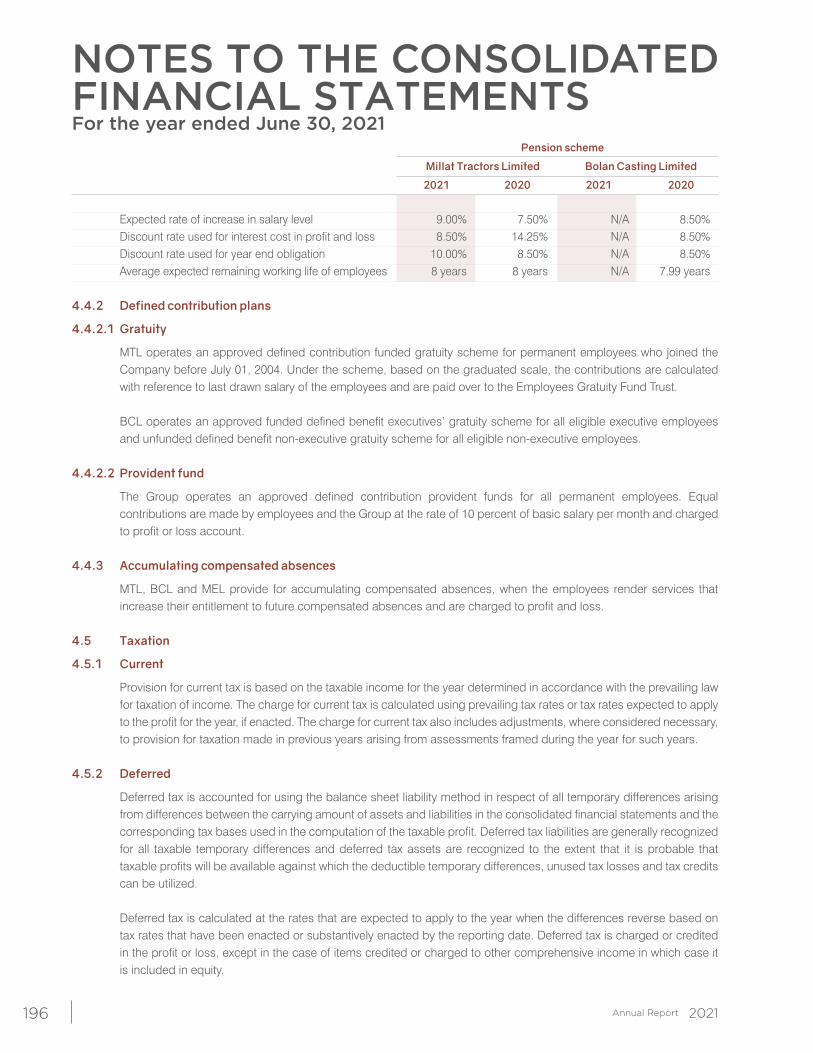
NOTES TO THE CONSOLIDATEDFINANCIAL STATEMENTSFor the year ended June 30, 2021
196
Pension scheme
Millat Tractors Limited Bolan Casting Limited
2021 2020 2021 2020
Expected rate of increase in salary level 9.00% 7.50% N/A 8.50% Discount rate used for interest cost in profit and loss 8.50% 14.25% N/A 8.50% Discount rate used for year end obligation 10.00% 8.50% N/A 8.50% Average expected remaining working life of employees 8 years 8 years N/A 7.99 years
4.4.2 Defined contribution plans
4.4.2.1 Gratuity
MTL operates an approved defined contribution funded gratuity scheme for permanent employees who joined the Company before July 01, 2004. Under the scheme, based on the graduated scale, the contributions are calculated with reference to last drawn salary of the employees and are paid over to the Employees Gratuity Fund Trust.
BCL operates an approved funded defined benefit executives’ gratuity scheme for all eligible executive employees
and unfunded defined benefit non-executive gratuity scheme for all eligible non-executive employees. 4.4.2.2 Provident fund
The Group operates an approved defined contribution provident funds for all permanent employees. Equal contributions are made by employees and the Group at the rate of 10 percent of basic salary per month and charged to profit or loss account.
4.4.3 Accumulating compensated absences
MTL, BCL and MEL provide for accumulating compensated absences, when the employees render services that increase their entitlement to future compensated absences and are charged to profit and loss.
4.5 Taxation
4.5.1 Current
Provision for current tax is based on the taxable income for the year determined in accordance with the prevailing law for taxation of income. The charge for current tax is calculated using prevailing tax rates or tax rates expected to apply to the profit for the year, if enacted. The charge for current tax also includes adjustments, where considered necessary, to provision for taxation made in previous years arising from assessments framed during the year for such years.
4.5.2 Deferred
Deferred tax is accounted for using the balance sheet liability method in respect of all temporary differences arising from differences between the carrying amount of assets and liabilities in the consolidated financial statements and the corresponding tax bases used in the computation of the taxable profit. Deferred tax liabilities are generally recognized for all taxable temporary differences and deferred tax assets are recognized to the extent that it is probable that taxable profits will be available against which the deductible temporary differences, unused tax losses and tax credits can be utilized.
Deferred tax is calculated at the rates that are expected to apply to the year when the differences reverse based on
tax rates that have been enacted or substantively enacted by the reporting date. Deferred tax is charged or credited in the profit or loss, except in the case of items credited or charged to other comprehensive income in which case it is included in equity.
197
4.6 Property, plant and equipment
Property, plant and equipment except for freehold and leasehold land are stated at cost less accumulated depreciation and accumulated impairment loss. Freehold and leasehold land is stated at cost less any accumulated impairment loss.
Subsequent costs are included in the asset’s carrying amount or recognized as a separate asset, as appropriate, only
when it is probable that future economic benefits associated with the item will flow to the Group and the cost of the item can be measured reliably. All other repair and maintenance costs are charged to profit or loss during the period in which they are incurred.
Depreciation on all items of property, plant and equipment except for leasehold office building is charged to profit or loss applying the diminishing balance method so as to write-off the depreciable amount of an asset over its useful life. Depreciation on leasehold office building is provided on a straight line basis so as to write off the depreciable amount of an asset over the life of the asset. Depreciation is being charged at the rates given in note 17. Depreciation on additions to property, plant and equipment is charged from the month in which an asset is available for use while no depreciation is charged for the month in which the asset is disposed off.
The Group continually assesses at each reporting date whether there is any indication that property, plant and equipment
may be impaired. If such indication exists, the carrying amounts of such assets are reviewed to assess whether they are recorded in excess of their recoverable amount. Where carrying values exceed the respective recoverable amount, assets are written down to their recoverable amount and the resulting impairment loss is recognized in profit or loss for the year. Any previously recognized impairment loss is reversed only if there has been a change in the estimates used to determine the asset’s recoverable amount since the last impairment loss was recognized. If that is the case, the carrying amount of the asset is increased to its recoverable amount, and the increased amount cannot exceed the carrying amount that would have been determined, net of depreciation, had no impairment loss been recognized for the asset in prior years. Such reversal is recognized in profit or loss. The recoverable amount is the higher of an assets’ fair value less costs to sell and value in use. Where an impairment loss is recognized, the depreciation charge is adjusted in the future periods to allocate the assets’ revised carrying amount over its estimated useful life.
An item of property, plant and equipment is derecognized upon disposal or when no future economic benefits are
expected from its use or disposal. Any gain or loss arising on derecognition of the asset (calculated as the difference between the net disposal proceeds and carrying amount of the asset) is included in the profit or loss in the year the asset is derecognized.
4.7 Right-of-use asset and Lease liability
At inception of a lease contract, the Group assesses whether a contract is, or contains, a lease based on whether the contract conveys the right to control the use of an identified asset for a period of time in exchange for consideration. Lease terms are negotiated on an individual basis and contain a wide range of different terms and conditions.
The Group applies a practical expedient and, does not recognise right-of-use assets and lease liabilities for short
term leases that have a lease term of 12 months or less and leases of low-value assets, if any. The lease payments associated with these leases is recognised as an expense on a straight line basis over the lease term.
For lease contracts other than the aforementioned, the lease liability is initially measured at the present value of the
lease payments that are not paid at the commencement date, discounted using the interest rate implicit in the lease, or if that rate cannot be readily determined, the Group’s incremental borrowing rate.
NOTES TO THE CONSOLIDATEDFINANCIAL STATEMENTSFor the year ended June 30, 2021
198
Lease payments include fixed payments, variable lease payment that are based on an index or a rate and amounts expected to be payable by the lessee under residual value guarantees, the exercise price of a purchase option if the lessee is reasonably certain to exercise that option, payments of penalties for terminating the lease, if the lease term reflects the lessee exercising that option, less any lease incentives receivable. The extension and termination options are incorporated in determination of lease term only when the Group is reasonably certain to exercise these options.
The lease liability is subsequently measured at amortised cost using the effective interest rate method. It is remeasured
when there is a change in future lease payments arising from a change in fixed lease payments or an index or rate, change in the Group’s estimate of the amount expected to be payable under a residual value guarantee, or if the Group changes its assessment of whether it will exercise a purchase, extension or termination option. The corresponding adjustment is made to the carrying amount of the right-to-use asset, or is recorded in the statement of profit and loss account if the carrying amount of right-to-use asset has been reduced to zero.
The right-of-use asset is initially measured based on the initial amount of the lease liability adjusted for any lease
payments made at or before the commencement date, plus any initial direct costs incurred and an estimate of costs to dismantle and remove the underlying asset or to restore the underlying asset or the site on which it is located, less any lease incentive received. The right-of-use asset is depreciated on a straight line method over the lease term as this method most closely reflects the expected pattern of consumption of future economic benefits. The right-of-use asset is reduced by impairment losses.
4.8 Capital work-in-progress
All expenditure connected with specific assets i.e. property, plant and equipment or intangible assets incurred during installation and construction period including advances to suppliers and contractors are carried under this head. These are transferred to specific assets as and when these assets are available for use.
Capital work-in-progress is stated at cost less any identified impairment loss, if any. 4.9 Intangible assets
Expenditure incurred to acquire computer software are capitalized as intangible assets and stated at cost less accumulated amortization and any identified impairment loss. Intangible assets are amortized using the straight line method over a period of three years.
The useful lives of intangible assets are assessed as either finite or indefinite. Intangible assets with finite life are amortised using the straight line method over a period of three years and Intangible
assets with indefinite useful lives are not amortised, but are tested for impairment annually, either individually or at the cash-generating unit level. The assessment of indefinite life is reviewed annually to determine whether the indefinite life continues to be supportable. If not, the change in useful life from indefinite to finite is made on a prospective basis.
Amortization on additions to finite intangible assets is charged from the month in which an asset is acquired or
capitalized while no amortization is charged for the month in which the asset is disposed off. The Group assesses at each reporting date whether there is any indication that intangible assets may be impaired.
If such indication exists, the carrying amounts of such assets are reviewed to assess whether they are recorded in excess of their recoverable amount. Where carrying amounts exceed the respective recoverable amount, assets are written down to their recoverable amounts and the resulting impairment loss is recognized in profit or loss. The recoverable amount is the higher of an asset’s fair value less costs to sell and value in use. Where an impairment loss is recognized, the amortization charge is adjusted in the future periods to allocate the asset’s revised carrying amount over its estimated useful life.
199
4.10 Investment property
Property not held for own use or for sale in the ordinary course of business is classified as investment property. The investment property of the Group comprises land and is valued using the cost method, at cost less any accumulated impairment loss.
The Group assesses at each reporting date whether there is any indication that investment property may be impaired.
If such indication exists, the carrying amount of such assets is reviewed to assess whether they are recorded in excess of their recoverable amount. Where carrying value exceeds the respective recoverable amount, assets are written down to their recoverable amounts and the resulting impairment loss is recognized in the profit or loss for the year. The recoverable amount is the higher of an asset’s fair value less costs to sell and value in use.
The gain or loss on disposal or retirement of an asset represented by the difference between the sale proceeds and the carrying amount of the asset is recognized as an income or expense.
4.11 Investments and other financial assets
4.11.1 Classification
The Group classifies its financial assets in the following measurement categories:
- at Fair Value through Profit or Loss (“FVPL”),- at Fair Value through Other Comprehensive Income (“FVOCI”), or- at amortised cost.
The Group determines the classification of financial assets at initial recognition. The classification of instruments
(other than equity instruments) is driven by the Group’s business model for managing the financial assets and their contractual cash flow characteristics.
For assets measured at fair value, gains and losses will either be recorded in profit or loss or OCI. For investments
in equity instruments that are not held for trading, this will depend on whether the Group has made an irrevocable election at the time of initial recognition to account for the equity investment at fair value through other comprehensive income (FVOCI).
The Group reclassifies debt investments when and only when its business model for managing those assets changes. 4.11.2 Recognition and derecognition
Regular way purchases and sales of financial assets are recognised on trade-date i.e. the date on which the Group commits to purchase or sell the asset. Financial assets are derecognised when the rights to receive cash flows from the financial assets have expired or have been transferred and the Group has transferred substantially all the risks and rewards of ownership.
4.11.3 Measurement
At initial recognition, the Group measures a financial asset at its fair value plus, in the case of a financial asset not at fair value through profit or loss (FVPL), transaction costs that are directly attributable to the acquisition of the financial asset. Transaction costs of financial assets carried at FVPL are expensed in profit or loss.
Financial assets with embedded derivatives are considered in their entirety when determining whether their cash flows
are Solely Payment of Principal and Interest (SPPI).
NOTES TO THE CONSOLIDATEDFINANCIAL STATEMENTSFor the year ended June 30, 2021
200
a) Debt instruments
Subsequent measurement of debt instruments depends on the Group’s business model for managing the asset and the cash flow characteristics of the asset. There are three measurement categories into which the Group classifies its debt instruments:
i) Financial assets at amortized cost
Assets that are held for collection of contractual cash flows where those cash flows represent solely payments of principal and interest are measured at amortised cost. Interest income from these financial assets is included in other income using the effective interest rate method. Any gain or loss arising on derecognition is recognised directly in profit or loss and presented in other income/(operating expenses), together with foreign exchange gains and losses. Impairment losses are presented as separate line item in the statement of profit or loss.
ii) Financial assets at fair value through other comprehensive income
Assets that are held for both collection of contractual cash flows and for selling the financial assets, where the assets’ cash flows represent solely payments of principal and interest, are measured at FVOCI. Movements in the carrying amount are taken through OCI, except for the recognition of impairment gains or losses, interest revenue and foreign exchange gains and losses which are recognised in profit or loss. When the financial asset is derecognised, the cumulative gain or loss previously recognised in OCI is reclassified from equity to profit or loss and recognised in other income/(operating expenses). Interest income from these financial assets is included in other income using the effective interest rate method. Foreign exchange gains and losses are presented in other income/(operating expenses).
iii) Financial assets at fair value through profit or loss
Assets that do not meet the criteria for amortised cost or FVOCI are measured at FVPL. A gain or loss on a debt investment that is subsequently measured at FVPL is recognised in profit or loss and presented net within other income/(operating expenses) in the period in which it arises.
b) Equity instruments
The Group subsequently measures all equity investments at fair value. Where the Group’s management has elected to present fair value gains and losses on equity investments in OCI, there is no subsequent reclassification of fair value gains and losses to profit or loss following the derecognition of the investment. Dividends from such investments continue to be recognised in profit or loss as other income when the Group’s right to receive payments is established.
Changes in the fair value of financial assets at FVPL are recognised in other income/(operating expenses) in
the statement of profit or loss as applicable. Impairment losses (and reversal of impairment losses) on equity investments measured at FVOCI are not reported separately from other changes in fair value.
4.11.4 Impairment of financial assets
The Group applies the IFRS 9 simplified approach to measure expected credit losses, which uses a lifetime expected loss allowance for all trade receivables and contract assets. Instruments within the scope of the new requirements included loans and other debt-type financial assets measured at amortised cost and fair value through other comprehensive income, trade receivables, contract assets recognised and measured under IFRS 15 and that are not measured at fair value through profit or loss.
To measure the expected credit losses, trade receivables and contract assets are grouped based on shared credit risk
characteristics and the days past due. The contract assets relate to unbilled work in progress and have substantially the same risk characteristics as the trade receivables for the same types of contracts. The Group therefore concludes that the expected loss rates for trade receivables are a reasonable approximation of the loss rates for the contract
201
assets. Recognition of credit losses is no longer dependent on the Group first identifying a credit loss event. Instead the Group considers a broader range of information when assessing credit risk and measuring expected credit losses, including past events, current conditions, reasonable and supportable forecasts that affect the expected collectability of the future cash flows of the instrument.
A distinction is made between, financial instruments that have not deteriorated significantly in credit quality since initial
recognition or that have low credit risk (Stage 1). Financial instruments that have deteriorated significantly in credit quality since initial recognition and whose credit risk is not low (Stage 2). Stage 3 would cover financial assets that have objective evidence of impairment at the reporting date. ‘12-month expected credit losses’ are recognised for the first category while ‘lifetime expected credit losses’ are recognised for the second category.
Measurement of the expected credit losses is determined by a probability-weighted estimate of credit losses over the
expected life of the financial instrument. Individual receivables which are known to be uncollectible are written off by reducing the carrying amount directly. The
other receivables are assessed collectively to determine whether there is objective evidence that an impairment has been incurred but not yet been identified. For these receivables the estimated impairment losses are recognised in a separate provision for impairment. The Group considers that there is evidence of impairment, if any, of the indicators were present i.e. significant financial difficulties of the debtor, probability that the debtor will enter bankruptcy or financial reorganisation, and default or late payments.
Trade receivables and contract assets are written off when there is no reasonable expectation of recovery. Indicators
that there is no reasonable expectation of recovery include, amongst others, the failure of a debtor to engage in a repayment plan with the Group, and a failure to make contractual payments past due date. Impairment losses on trade receivables and contract assets are presented as net impairment losses in the profit or loss. Subsequent recoveries of amounts previously written off are credited against the same line item.
4.12 Stores, spare parts and loose tools
Stores and spares are valued at lower of net realizable value or moving average cost, while items considered obsolete are carried at nil value. Items in transit are valued at cost comprising of invoice value and other incidental charges paid thereon.
Provision for obsolete and slow-moving stores, spare parts and loose tools is based on management estimate of the
condition and usability of such stores. Net realizable value signifies the estimated selling price in the ordinary course of business less costs necessarily
to be incurred in order to make the sale. Provision for obsolete and slow-moving stores and spares is based on management estimate as to the condition and usability of such stores, spare parts and loose tools.
4.13 Stock in trade
Stock of raw materials, except for those in transit, work-in-process and finished goods are valued principally at the lower of moving average cost and net realizable value.
Cost of raw materials and trading stock comprises the invoice value plus other charges paid thereon. Cost of work-in-process and finished goods include direct material, labour and appropriate portion of manufacturing
overheads. Items in transit are stated at cost comprising invoice value and other incidental charges paid thereon.
NOTES TO THE CONSOLIDATEDFINANCIAL STATEMENTSFor the year ended June 30, 2021
202
Net realizable value signifies the estimated selling price in the ordinary course of business less costs necessarily to be incurred in order to make the sale. Provision for obsolete and slow-moving stock-in-trade is based on management estimate.
4.14 Trade debts
Trade debts are carried at original invoice amount less any expected credit losses based on review of outstanding amounts at the year end in accordance with the simplified approach as mentioned in note 4.10.4. Bad debts are written off when identified.
4.15 Cash and cash equivalents
For the purposes of the cash flow statement, cash and cash equivalents are stated at cost and comprise of cash in hand, cash at banks on current, saving and deposit accounts and other short term highly liquid instruments that are readily convertible into known amounts of cash which are subject to insignificant risk of changes in values. Cash equivalents are held for the purpose of meeting short-term cash commitments rather than for investment or other purpose.
4.16 Revenue recognition
Revenue from the sale of goods along with provisions of after market services is recognised when performance obligations are satisfied by transferring control of a good or service to a customer, either at a point in time or over time of an amount that reflects the consideration to which the entity expects to be entitled in exchange for those goods or services.
Revenue is recognised in accordance with the aforementioned principle by applying the following steps:
i) Identify the contract with a customer. ii) Identify the performance obligation in the contract. iii) Determine the transaction price of the contract. iv) Allocate the transaction price to each of the separate performance obligations in the contract. v) Recognise the revenue when (or as) the entity satisfies a performance obligation.
Revenue is recognised either at a point in time or over time, when (or as) the Group satisfies performance obligations
by transferring the promised goods or services to its customers. Any bundled goods or services that are distinct are separately recognized, and any discounts or rebates on the contract price are generally allocated to the separate elements
4.16.1 a) Sale of goods
Revenue from contracts for tractors, implements and tractor components, multi-application products, trading goods, batteries and casting is recognized upon delivery and acknowledgement of the good by the customer i.e. point in time when the performance obligation of the Group is satisfied. Since there is only one performance obligation the revenue is recognized at full amount. Payments for sale of goods are either received in in advance or made with credit terms as per Group policy on a case to case basis.
b) Sale of service warranties
The Group provides various types of warranties. When determining the nature of warranty-related promises, the Group considers:
203
- whether the customer has the option to separately purchase the warranty; and - whether all or part of the warranty provides the customer with an additional service beyond the basic assurance
that it will perform in accordance with published specifications. Standard-type warranties of free repair, parts replacement, assurance and major rectification to the customer
along with free service after specific intervals are not offered separately for any consideration by the Group and rather are embedded in the sale price of the good. Accordingly, the same are not considered to be separate performance obligations and are accounted for under IAS 37.
For extended-type warranties or separate after sale services offered by the Group the same are treated as
separate performance obligations. Revenue from such warranties or after sale services is recognized over time i.e. duration of the contract.
Others
- Dividend is recognized as income when the right to receive dividend is established. - Profit on bank deposits is recognized on effective rate of interest method. - Investment income is recognized when right to receive the income is established.
4.17 Research cost
These costs are charged to profit and loss when incurred. 4.18 Borrowing costs
Borrowing costs are recognized as an expense in the period in which these are incurred except to the extent of borrowing costs that are directly attributable to the acquisition, construction or production of a qualifying asset. Such borrowing costs are capitalized as part of the cost of that asset up to the date of its commissioning.
4.19 Trade and other payables
Liabilities for trade and other amounts payable are measured at cost which is the fair value of the consideration to be paid in future for goods and services received, whether or not billed to the Group.
4.20 Provisions
Provisions for legal claims, service warranties and make good obligations are recognised when the group has a present legal or constructive obligation as a result of past events, it is probable that an outflow of resources will be required to settle the obligation and the amount can be reliably estimated. Provisions are not recognised for future operating losses.
Where there are a number of similar obligations, the likelihood that an outflow will be required in settlement is determined by considering the class of obligations as a whole. A provision is recognised even if the likelihood of an outflow with respect to any one item included in the same class of obligations may be small.
Provisions are measured at the present value of management’s best estimate of the expenditure required to settle the
present obligation at the end of the reporting period. The discount rate used to determine the present value is a pre-tax rate that reflects current market assessments of the time value of money and the risks specific to the liability. The increase in the provision due to the passage of time is recognised as interest expense.
NOTES TO THE CONSOLIDATEDFINANCIAL STATEMENTSFor the year ended June 30, 2021
204
4.21 Foreign currency transactions and translation
All monetary assets and liabilities in foreign currencies are translated into Pak Rupees at the rates of exchange prevailing at the reporting date. Transactions in foreign currencies are translated into Pak Rupees at exchange rate prevailing at the date of transaction. Foreign exchange gains and losses on translation are recognized in the profit or loss. All non-monetary items are translated into Pak Rupees at exchange rates prevailing on the date of transaction or on the date when fair values are determined.
On consolidation, the assets and liabilities of foreign operations are translated into Pak Rupees at the rate of exchange
prevailing at the reporting date and their profit or loss are translated at average rates prevailing during the year. The exchange differences arising on translation for consolidation are recognised in other comprehensive income. On disposal of a foreign operation, the component of other comprehensive income relating to that particular foreign operation is recognised in profit or loss.
4.22 Financial liabilities
Financial liabilities are recognized when the Group becomes a party to the contractual provisions of the instrument and de-recognized when the obligation specified in the contract is discharged, cancelled or expired. The Group derecognises financial liabilities only when its obligations under the financial liabilities are discharged, cancelled or expired. The difference between the carrying amount of the financial liability derecognised and the consideration paid and payable, including any non-cash assets transferred or liabilities assumed, is recognised in the statement of profit or loss and other comprehensive income.
All financial liabilities are initially measured at cost, which is the fair value of the consideration given and received
respectively. These financial liabilities are subsequently measured at fair value through profit and loss (“FVPL”) or at amortised cost, as the case may be. Financial liabilities are measured at amortised cost, unless they are required to be measured at FVPL (such as instruments held for trading or derivatives) or the Group has opted to measure them at FVPL. The particular recognition methods adopted are disclosed in the individual policy statements associated with each item.
Where management has opted to recognise a financial liability at FVPL, any changes associated with the Group’s
own credit risk will be recognized in other comprehensive income/(loss). Currently, there are no financial liabilities designated at FVPL.
4.23 Offsetting of financial assets and liabilities
Financial assets and liabilities are offset and the net amount is reported in the consolidated financial statements only when there is a legally enforceable right to set off the recognized amount and the Group intends either to settle on a net basis or to realize the assets and to settle the liabilities simultaneously.
4.24 Reserves
Reserve are classified into two categories as follows: 4.24.1 Revenue reserve
Revenue reserve is the reserve which is regarded as available for distribution through the profit or loss including general reserves and other specific reserves created out of profit and un-appropriated or accumulated profits of previous years.
205
4.24.2 Capital reserve
Capital reserve includes all the reserves other than reserve which are classified as revenue reserve. 4.25 Earning per share
The Group presents basic and diluted Earning Per Share (EPS) data for its ordinary shares. Basic EPS is calculated by dividing the profit after tax attributable to ordinary shareholders of the Group by the weighted average number of ordinary shares outstanding during the year. Diluted EPS is determined by adjusting the profit and loss attributable to ordinary shareholders and the weighted average number of ordinary shares outstanding for the effects of all dilutive potential ordinary shares.
4.26 Contingent liabilities
Contingent liability is disclosed when:
- there is a possible obligation that arises from past events and whose existence will be confirmed only by the occurrence or non-occurrence of one or more uncertain future events not wholly within the control of the Group; or
- there is present obligation that arises from past events but it is not probable that an outflow of resources embodying economic benefits will be required to settle the obligation or the amount of the obligation cannot be measured with sufficient reliability.
4.27 Dividend and appropriations
Dividend distribution to the Group’s shareholders is recognized as a liability in the period in which the dividends are approved. However, if these are approved after the reporting period but before the consolidated financial statements are authorized for issue, they are disclosed in the notes to the consolidated financial statements.
4.28 Government grants
Government grants are recognised where there is reasonable assurance that the grant will be received and all attached conditions will be complied with. When the grant relates to an expense item, it is recognised as income on a systematic basis over the periods that the related costs, for which it is intended to compensate, are expensed. When the grant relates to an asset, it is recognised as income in equal amounts over the expected useful life of the related asset.
When the Group receives grants of non-monetary assets, the asset and the grant are recorded at nominal amounts
and released to profit or loss over the expected useful life of the asset, based on the pattern of consumption of the benefits of the underlying asset by equal annual instalments.
In subsequent periods, the grant shall be recognized in statement of profit or loss , in line with the recognition of
interest expense the grant is compensating. 4.29 Non-current assets held for sale
The Company classifies non-current assets as held for sale if their carrying amounts will be recovered principally through a sale transaction rather than through continuing use. Non-current assets classified as held for sale are measured at the lower of their carrying amount and fair value less costs to sell. Costs to sell are the incremental costs directly attributable to the disposal of an asset, excluding finance costs and income tax expense.
NOTES TO THE CONSOLIDATEDFINANCIAL STATEMENTSFor the year ended June 30, 2021
206
The criteria for held for sale classification is regarded as met only when:
i) When the sale is highly probable.
ii) The asset is available for immediate sale in its present condition.
iii) Actions required to complete the sale should indicate that it is unlikely that significant changes to the sale will be made or that the decision to sell will be withdrawn.
iv) Management must be committed to the plan to sell the asset and the sale expected to be completed within one year from the date of the classification.
Property, plant and equipment and intangible assets are not depreciated or amortized once classified as held for sale. Assets and liabilities classified as held for sale are presented separately as current items in the statement of financial
position.
5 Issued, subscribed and paid up capital
2021 2020 2021 2020 (Number of shares in thousand) (Rupees in thousand)
Ordinary shares of Rs 10 each fully 2,543 2,543 paid in cash 25,429 25,429 Ordinary shares of Rs 10 each issued as fully paid bonus shares 47,286 41,750 - Opening balance 472,863 417,497 6,228 5,536 - Issued during the year 62,286 55,366 53,514 47,286 535,149 472,863 56,057 49,829 560,578 498,292
2021 2020 (Rupees in thousand)
6 Reserves Capital reserve Fair value reserve - Investments measured at FVOCI 3,481,970 341,043 Exchange translation reserve 54,833 60,785 3,536,803 401,828 Revenue reserve General reserve 2,475,309 2,475,309 Unappropriated profit 3,458,902 1,409,344 5,934,211 3,884,653 9,471,014 4,286,481
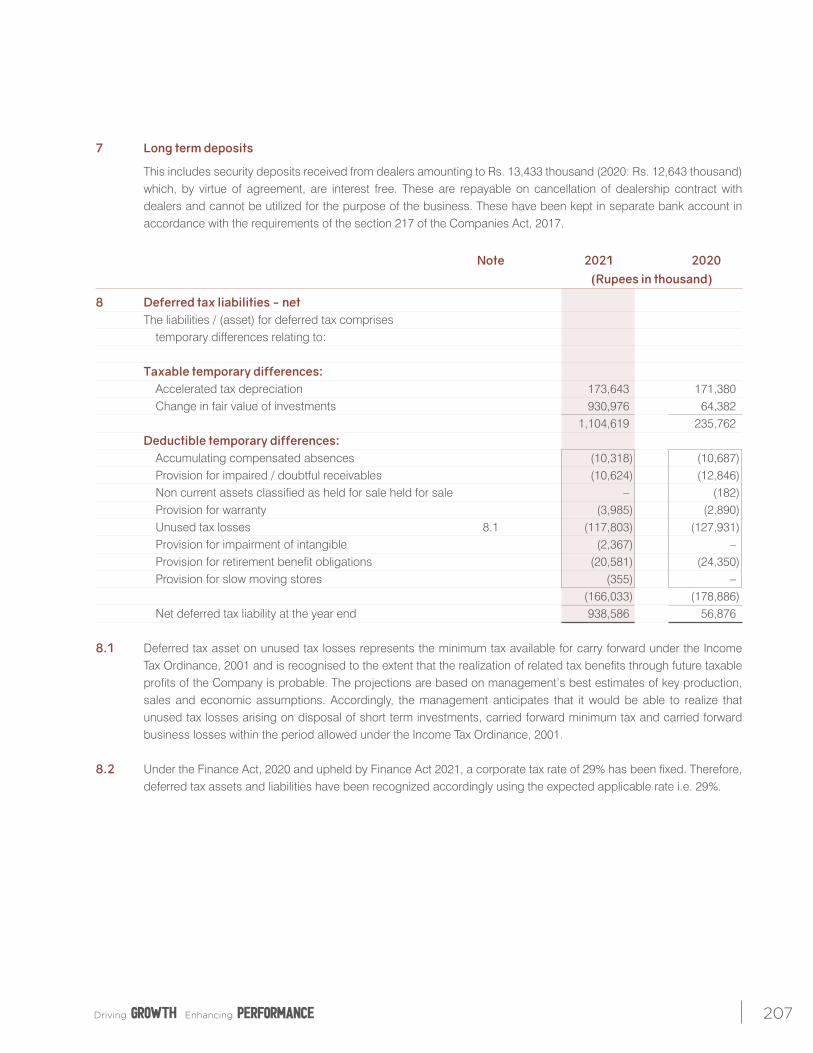
207
7 Long term deposits
This includes security deposits received from dealers amounting to Rs. 13,433 thousand (2020: Rs. 12,643 thousand) which, by virtue of agreement, are interest free. These are repayable on cancellation of dealership contract with dealers and cannot be utilized for the purpose of the business. These have been kept in separate bank account in accordance with the requirements of the section 217 of the Companies Act, 2017.
Note 2021 2020 (Rupees in thousand)
8 Deferred tax liabilities - net The liabilities / (asset) for deferred tax comprises temporary differences relating to: Taxable temporary differences: Accelerated tax depreciation 173,643 171,380 Change in fair value of investments 930,976 64,382 1,104,619 235,762 Deductible temporary differences: Accumulating compensated absences (10,318) (10,687) Provision for impaired / doubtful receivables (10,624) (12,846) Non current assets classified as held for sale held for sale – (182) Provision for warranty (3,985) (2,890) Unused tax losses 8.1 (117,803) (127,931) Provision for impairment of intangible (2,367) – Provision for retirement benefit obligations (20,581) (24,350) Provision for slow moving stores (355) – (166,033) (178,886) Net deferred tax liability at the year end 938,586 56,876 8.1 Deferred tax asset on unused tax losses represents the minimum tax available for carry forward under the Income
Tax Ordinance, 2001 and is recognised to the extent that the realization of related tax benefits through future taxable profits of the Company is probable. The projections are based on management’s best estimates of key production, sales and economic assumptions. Accordingly, the management anticipates that it would be able to realize that unused tax losses arising on disposal of short term investments, carried forward minimum tax and carried forward business losses within the period allowed under the Income Tax Ordinance, 2001.
8.2 Under the Finance Act, 2020 and upheld by Finance Act 2021, a corporate tax rate of 29% has been fixed. Therefore,
deferred tax assets and liabilities have been recognized accordingly using the expected applicable rate i.e. 29%.
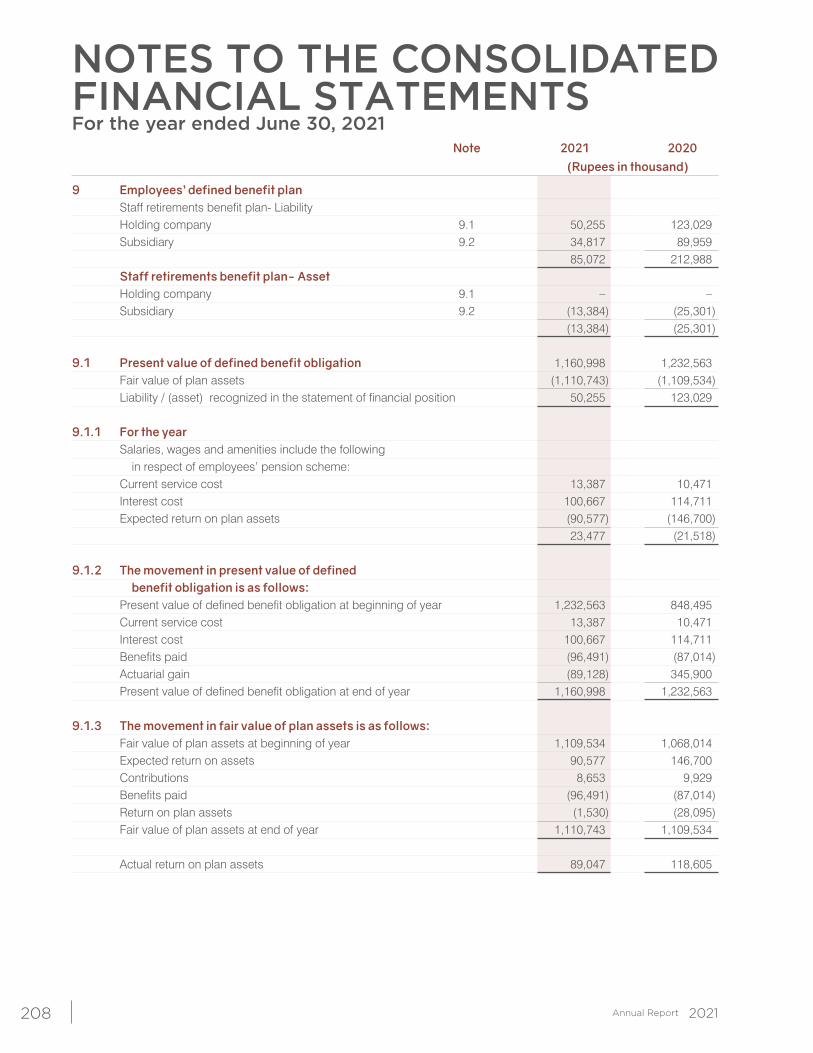
NOTES TO THE CONSOLIDATEDFINANCIAL STATEMENTSFor the year ended June 30, 2021
208
Note 2021 2020 (Rupees in thousand)
9 Employees’ defined benefit plan Staff retirements benefit plan- Liability Holding company 9.1 50,255 123,029 Subsidiary 9.2 34,817 89,959 85,072 212,988 Staff retirements benefit plan- Asset Holding company 9.1 – – Subsidiary 9.2 (13,384) (25,301) (13,384) (25,301)
9.1 Present value of defined benefit obligation 1,160,998 1,232,563 Fair value of plan assets (1,110,743) (1,109,534) Liability / (asset) recognized in the statement of financial position 50,255 123,029
9.1.1 For the year Salaries, wages and amenities include the following in respect of employees’ pension scheme: Current service cost 13,387 10,471 Interest cost 100,667 114,711 Expected return on plan assets (90,577) (146,700) 23,477 (21,518)
9.1.2 The movement in present value of defined benefit obligation is as follows: Present value of defined benefit obligation at beginning of year 1,232,563 848,495 Current service cost 13,387 10,471 Interest cost 100,667 114,711 Benefits paid (96,491) (87,014) Actuarial gain (89,128) 345,900 Present value of defined benefit obligation at end of year 1,160,998 1,232,563 9.1.3 The movement in fair value of plan assets is as follows: Fair value of plan assets at beginning of year 1,109,534 1,068,014 Expected return on assets 90,577 146,700 Contributions 8,653 9,929 Benefits paid (96,491) (87,014) Return on plan assets (1,530) (28,095) Fair value of plan assets at end of year 1,110,743 1,109,534 Actual return on plan assets 89,047 118,605
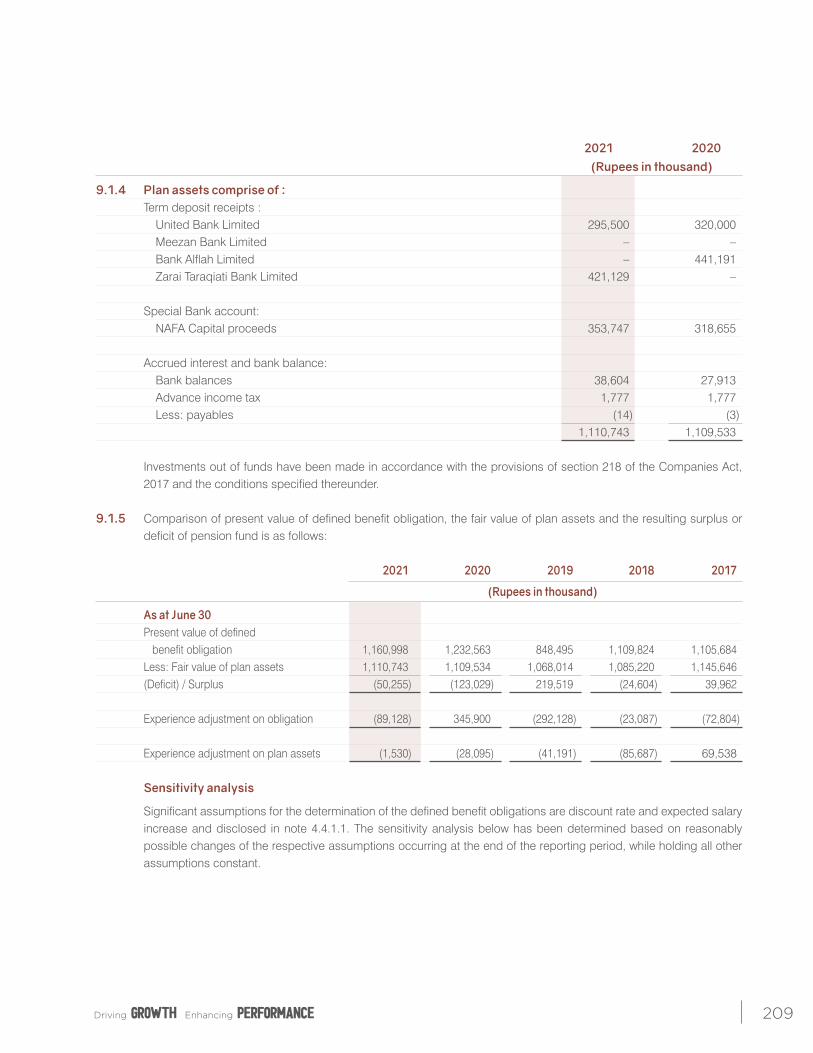
209
2021 2020 (Rupees in thousand)
9.1.4 Plan assets comprise of : Term deposit receipts : United Bank Limited 295,500 320,000 Meezan Bank Limited – – Bank Alflah Limited – 441,191 Zarai Taraqiati Bank Limited 421,129 – Special Bank account: NAFA Capital proceeds 353,747 318,655 Accrued interest and bank balance: Bank balances 38,604 27,913 Advance income tax 1,777 1,777 Less: payables (14) (3) 1,110,743 1,109,533 Investments out of funds have been made in accordance with the provisions of section 218 of the Companies Act,
2017 and the conditions specified thereunder.
9.1.5 Comparison of present value of defined benefit obligation, the fair value of plan assets and the resulting surplus or deficit of pension fund is as follows:
2021 2020 2019 2018 2017
(Rupees in thousand)
As at June 30 Present value of defined benefit obligation 1,160,998 1,232,563 848,495 1,109,824 1,105,684 Less: Fair value of plan assets 1,110,743 1,109,534 1,068,014 1,085,220 1,145,646 (Deficit) / Surplus (50,255) (123,029) 219,519 (24,604) 39,962
Experience adjustment on obligation (89,128) 345,900 (292,128) (23,087) (72,804)
Experience adjustment on plan assets (1,530) (28,095) (41,191) (85,687) 69,538 Sensitivity analysis
Significant assumptions for the determination of the defined benefit obligations are discount rate and expected salary increase and disclosed in note 4.4.1.1. The sensitivity analysis below has been determined based on reasonably possible changes of the respective assumptions occurring at the end of the reporting period, while holding all other assumptions constant.
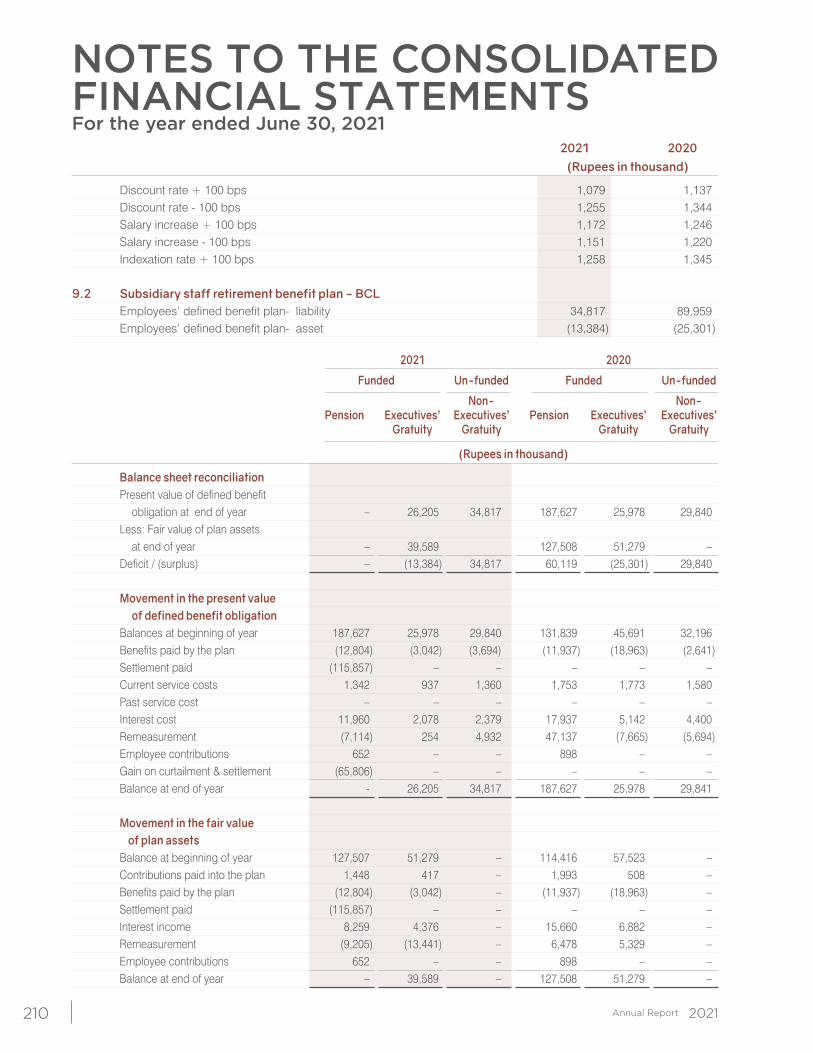
NOTES TO THE CONSOLIDATEDFINANCIAL STATEMENTSFor the year ended June 30, 2021
210
2021 2020 (Rupees in thousand)
Discount rate + 100 bps 1,079 1,137 Discount rate - 100 bps 1,255 1,344 Salary increase + 100 bps 1,172 1,246 Salary increase - 100 bps 1,151 1,220 Indexation rate + 100 bps 1,258 1,345
9.2 Subsidiary staff retirement benefit plan - BCL Employees’ defined benefit plan- liability 34,817 89,959 Employees’ defined benefit plan- asset (13,384) (25,301) 2021 2020
Funded Un-funded Funded Un-funded
Non- Non- Pension Executives’ Executives’ Pension Executives’ Executives’ Gratuity Gratuity Gratuity Gratuity
(Rupees in thousand)
Balance sheet reconciliation Present value of defined benefit obligation at end of year – 26,205 34,817 187,627 25,978 29,840 Less: Fair value of plan assets at end of year – 39,589 127,508 51,279 – Deficit / (surplus) – (13,384) 34,817 60,119 (25,301) 29,840 Movement in the present value of defined benefit obligation Balances at beginning of year 187,627 25,978 29,840 131,839 45,691 32,196 Benefits paid by the plan (12,804) (3,042) (3,694) (11,937) (18,963) (2,641) Settlement paid (115,857) – – – – – Current service costs 1,342 937 1,360 1,753 1,773 1,580 Past service cost – – – – – – Interest cost 11,960 2,078 2,379 17,937 5,142 4,400 Remeasurement (7,114) 254 4,932 47,137 (7,665) (5,694) Employee contributions 652 – – 898 – – Gain on curtailment & settlement (65,806) – – – – – Balance at end of year - 26,205 34,817 187,627 25,978 29,841 Movement in the fair value of plan assets Balance at beginning of year 127,507 51,279 – 114,416 57,523 – Contributions paid into the plan 1,448 417 – 1,993 508 – Benefits paid by the plan (12,804) (3,042) – (11,937) (18,963) – Settlement paid (115,857) – – – – – Interest income 8,259 4,376 – 15,660 6,882 – Remeasurement (9,205) (13,441) – 6,478 5,329 – Employee contributions 652 – – 898 – – Balance at end of year – 39,589 – 127,508 51,279 –
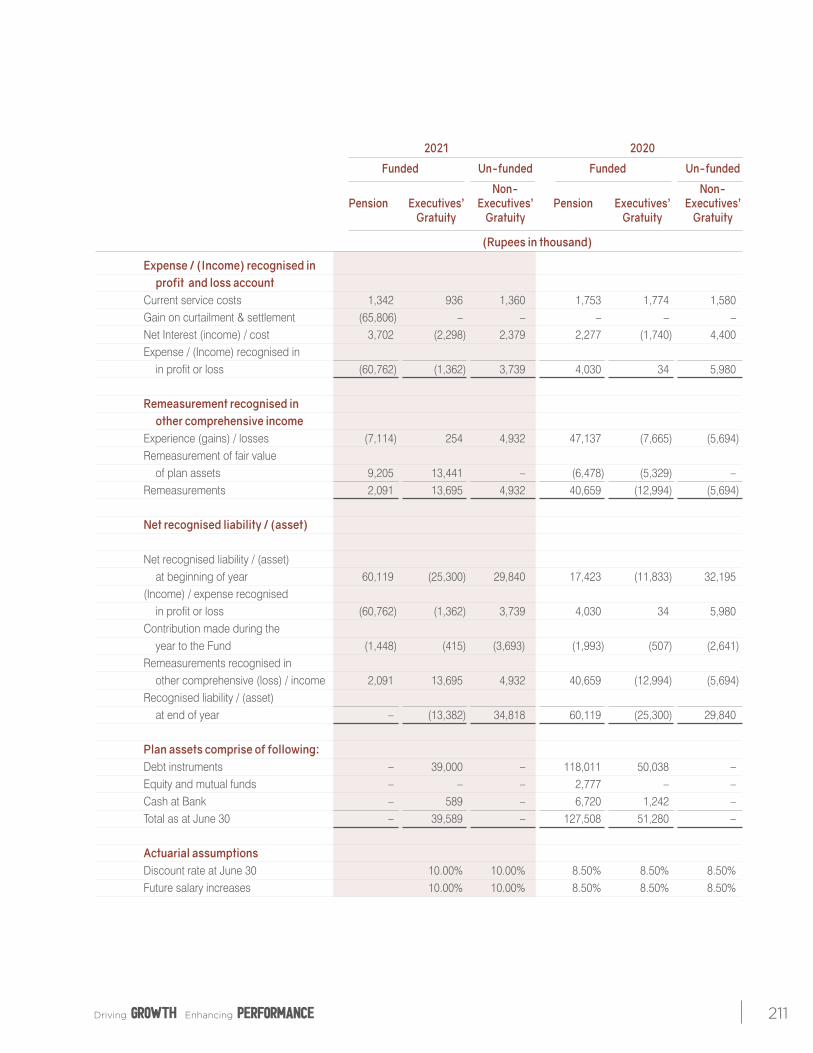
211
2021 2020
Funded Un-funded Funded Un-funded
Non- Non- Pension Executives’ Executives’ Pension Executives’ Executives’ Gratuity Gratuity Gratuity Gratuity
(Rupees in thousand)
Expense / (Income) recognised in profit and loss account Current service costs 1,342 936 1,360 1,753 1,774 1,580 Gain on curtailment & settlement (65,806) – – – – – Net Interest (income) / cost 3,702 (2,298) 2,379 2,277 (1,740) 4,400 Expense / (Income) recognised in in profit or loss (60,762) (1,362) 3,739 4,030 34 5,980 Remeasurement recognised in other comprehensive income Experience (gains) / losses (7,114) 254 4,932 47,137 (7,665) (5,694) Remeasurement of fair value of plan assets 9,205 13,441 – (6,478) (5,329) – Remeasurements 2,091 13,695 4,932 40,659 (12,994) (5,694) Net recognised liability / (asset) Net recognised liability / (asset) at beginning of year 60,119 (25,300) 29,840 17,423 (11,833) 32,195 (Income) / expense recognised in profit or loss (60,762) (1,362) 3,739 4,030 34 5,980 Contribution made during the year to the Fund (1,448) (415) (3,693) (1,993) (507) (2,641) Remeasurements recognised in other comprehensive (loss) / income 2,091 13,695 4,932 40,659 (12,994) (5,694) Recognised liability / (asset) at end of year – (13,382) 34,818 60,119 (25,300) 29,840 Plan assets comprise of following: Debt instruments – 39,000 – 118,011 50,038 – Equity and mutual funds – – – 2,777 – – Cash at Bank – 589 – 6,720 1,242 – Total as at June 30 – 39,589 – 127,508 51,280 – Actuarial assumptions Discount rate at June 30 10.00% 10.00% 8.50% 8.50% 8.50% Future salary increases 10.00% 10.00% 8.50% 8.50% 8.50%
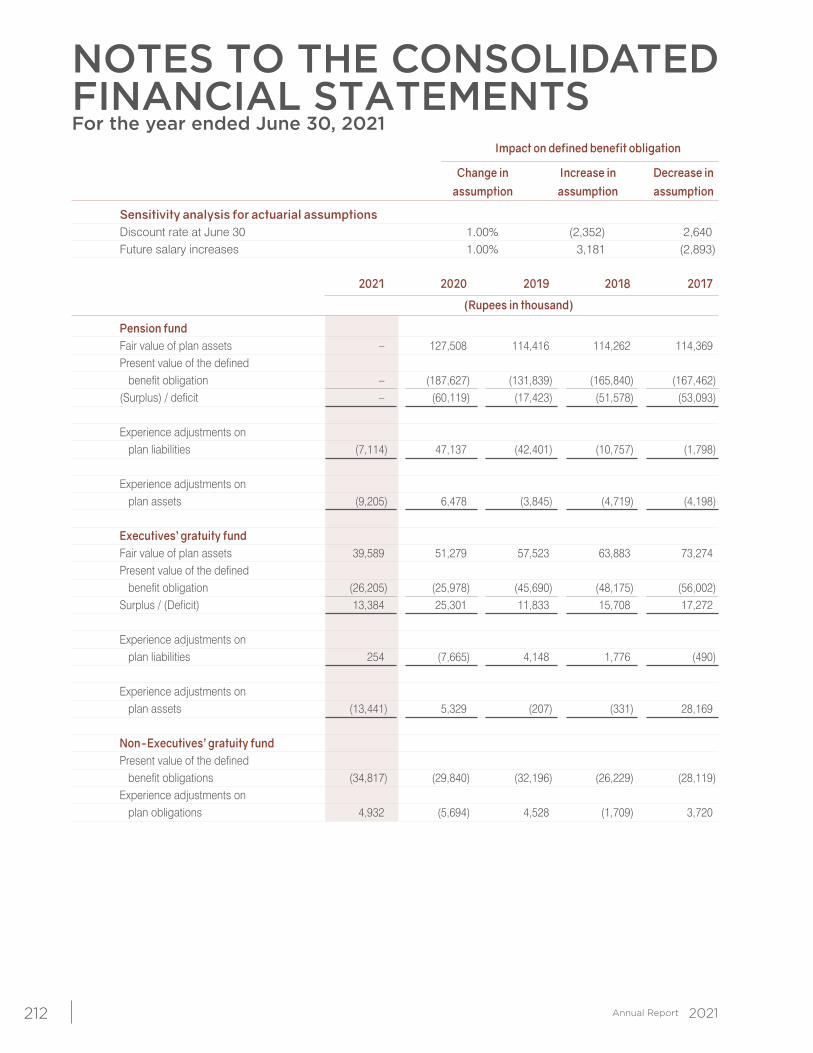
NOTES TO THE CONSOLIDATEDFINANCIAL STATEMENTSFor the year ended June 30, 2021
212
Impact on defined benefit obligation
Change in Increase in Decrease in assumption assumption assumption
Sensitivity analysis for actuarial assumptions Discount rate at June 30 1.00% (2,352) 2,640 Future salary increases 1.00% 3,181 (2,893) 2021 2020 2019 2018 2017
(Rupees in thousand)
Pension fund Fair value of plan assets – 127,508 114,416 114,262 114,369 Present value of the defined benefit obligation – (187,627) (131,839) (165,840) (167,462) (Surplus) / deficit – (60,119) (17,423) (51,578) (53,093) Experience adjustments on plan liabilities (7,114) 47,137 (42,401) (10,757) (1,798) Experience adjustments on plan assets (9,205) 6,478 (3,845) (4,719) (4,198) Executives’ gratuity fund Fair value of plan assets 39,589 51,279 57,523 63,883 73,274 Present value of the defined benefit obligation (26,205) (25,978) (45,690) (48,175) (56,002) Surplus / (Deficit) 13,384 25,301 11,833 15,708 17,272 Experience adjustments on plan liabilities 254 (7,665) 4,148 1,776 (490) Experience adjustments on plan assets (13,441) 5,329 (207) (331) 28,169 Non-Executives’ gratuity fund Present value of the defined benefit obligations (34,817) (29,840) (32,196) (26,229) (28,119) Experience adjustments on plan obligations 4,932 (5,694) 4,528 (1,709) 3,720
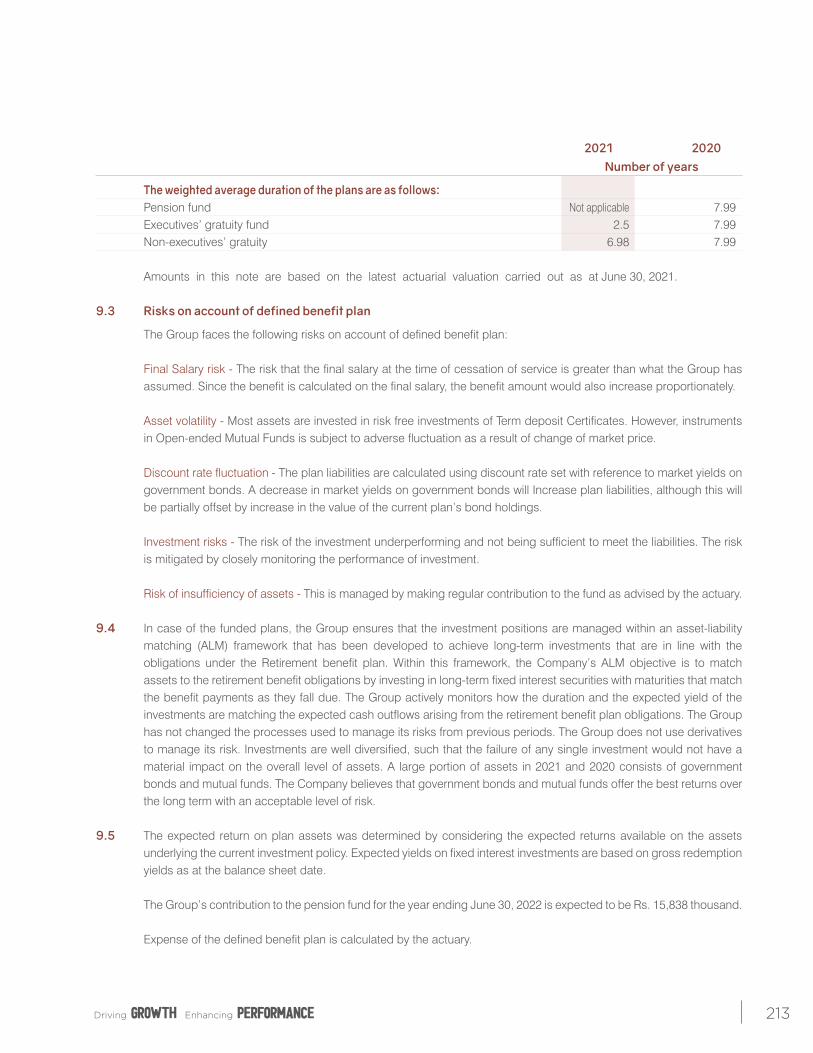
213
2021 2020 Number of years
The weighted average duration of the plans are as follows: Pension fund Not applicable 7.99 Executives’ gratuity fund 2.5 7.99 Non-executives’ gratuity 6.98 7.99 Amounts in this note are based on the latest actuarial valuation carried out as at June 30, 2021.
9.3 Risks on account of defined benefit plan
The Group faces the following risks on account of defined benefit plan: Final Salary risk - The risk that the final salary at the time of cessation of service is greater than what the Group has
assumed. Since the benefit is calculated on the final salary, the benefit amount would also increase proportionately. Asset volatility - Most assets are invested in risk free investments of Term deposit Certificates. However, instruments
in Open-ended Mutual Funds is subject to adverse fluctuation as a result of change of market price. Discount rate fluctuation - The plan liabilities are calculated using discount rate set with reference to market yields on
government bonds. A decrease in market yields on government bonds will Increase plan liabilities, although this will be partially offset by increase in the value of the current plan’s bond holdings.
Investment risks - The risk of the investment underperforming and not being sufficient to meet the liabilities. The risk
is mitigated by closely monitoring the performance of investment. Risk of insufficiency of assets - This is managed by making regular contribution to the fund as advised by the actuary. 9.4 In case of the funded plans, the Group ensures that the investment positions are managed within an asset-liability
matching (ALM) framework that has been developed to achieve long-term investments that are in line with the obligations under the Retirement benefit plan. Within this framework, the Company’s ALM objective is to match assets to the retirement benefit obligations by investing in long-term fixed interest securities with maturities that match the benefit payments as they fall due. The Group actively monitors how the duration and the expected yield of the investments are matching the expected cash outflows arising from the retirement benefit plan obligations. The Group has not changed the processes used to manage its risks from previous periods. The Group does not use derivatives to manage its risk. Investments are well diversified, such that the failure of any single investment would not have a material impact on the overall level of assets. A large portion of assets in 2021 and 2020 consists of government bonds and mutual funds. The Company believes that government bonds and mutual funds offer the best returns over the long term with an acceptable level of risk.
9.5 The expected return on plan assets was determined by considering the expected returns available on the assets
underlying the current investment policy. Expected yields on fixed interest investments are based on gross redemption yields as at the balance sheet date.
The Group’s contribution to the pension fund for the year ending June 30, 2022 is expected to be Rs. 15,838 thousand. Expense of the defined benefit plan is calculated by the actuary.
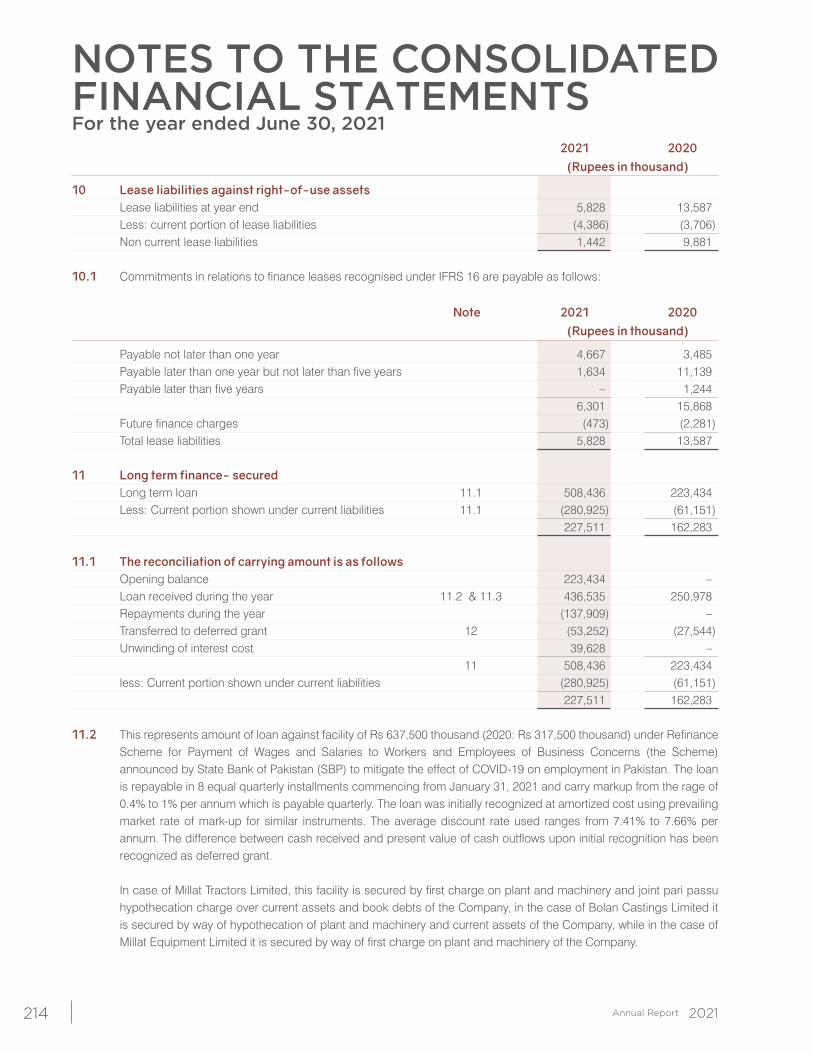
NOTES TO THE CONSOLIDATEDFINANCIAL STATEMENTSFor the year ended June 30, 2021
214
2021 2020 (Rupees in thousand)
10 Lease liabilities against right-of-use assets Lease liabilities at year end 5,828 13,587 Less: current portion of lease liabilities (4,386) (3,706) Non current lease liabilities 1,442 9,881 10.1 Commitments in relations to finance leases recognised under IFRS 16 are payable as follows:
Note 2021 2020 (Rupees in thousand)
Payable not later than one year 4,667 3,485 Payable later than one year but not later than five years 1,634 11,139 Payable later than five years – 1,244 6,301 15,868 Future finance charges (473) (2,281) Total lease liabilities 5,828 13,587 11 Long term finance- secured Long term loan 11.1 508,436 223,434 Less: Current portion shown under current liabilities 11.1 (280,925) (61,151) 227,511 162,283
11.1 The reconciliation of carrying amount is as follows Opening balance 223,434 – Loan received during the year 11.2 & 11.3 436,535 250,978 Repayments during the year (137,909) – Transferred to deferred grant 12 (53,252) (27,544) Unwinding of interest cost 39,628 – 11 508,436 223,434 less: Current portion shown under current liabilities (280,925) (61,151) 227,511 162,283
11.2 This represents amount of loan against facility of Rs 637,500 thousand (2020: Rs 317,500 thousand) under Refinance Scheme for Payment of Wages and Salaries to Workers and Employees of Business Concerns (the Scheme) announced by State Bank of Pakistan (SBP) to mitigate the effect of COVID-19 on employment in Pakistan. The loan is repayable in 8 equal quarterly installments commencing from January 31, 2021 and carry markup from the rage of 0.4% to 1% per annum which is payable quarterly. The loan was initially recognized at amortized cost using prevailing market rate of mark-up for similar instruments. The average discount rate used ranges from 7.41% to 7.66% per annum. The difference between cash received and present value of cash outflows upon initial recognition has been recognized as deferred grant.
In case of Millat Tractors Limited, this facility is secured by first charge on plant and machinery and joint pari passu
hypothecation charge over current assets and book debts of the Company, in the case of Bolan Castings Limited it is secured by way of hypothecation of plant and machinery and current assets of the Company, while in the case of Millat Equipment Limited it is secured by way of first charge on plant and machinery of the Company.
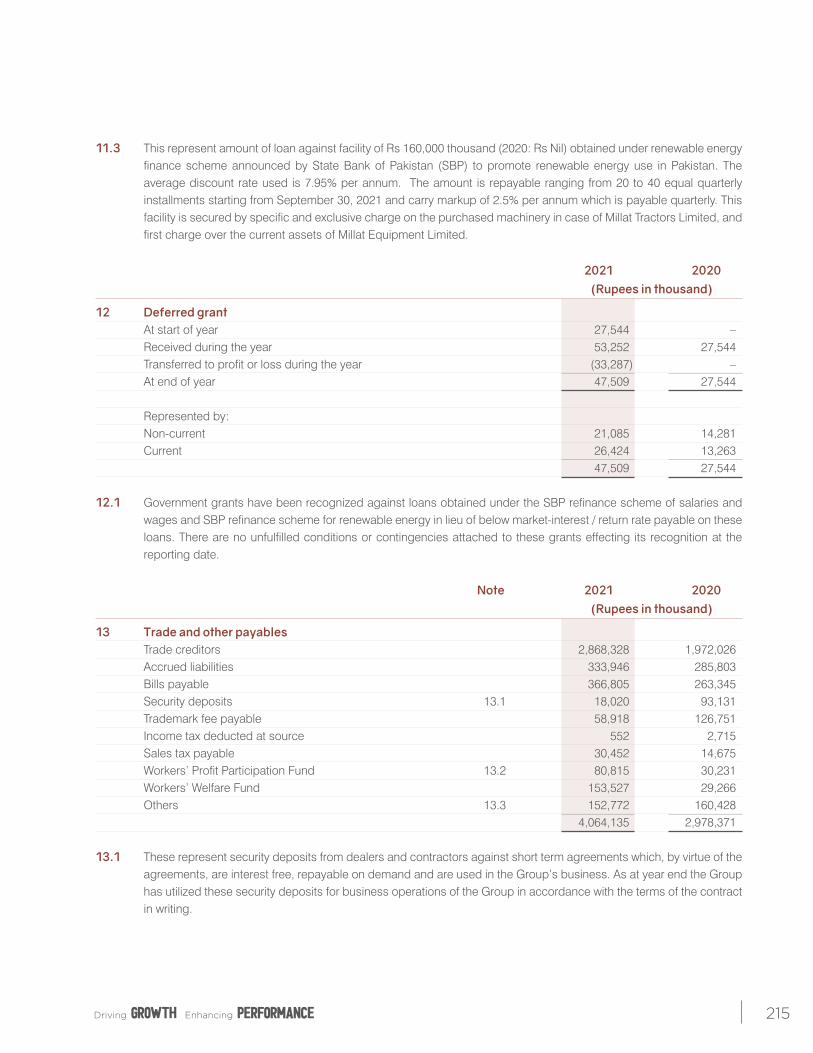
215
11.3 This represent amount of loan against facility of Rs 160,000 thousand (2020: Rs Nil) obtained under renewable energy finance scheme announced by State Bank of Pakistan (SBP) to promote renewable energy use in Pakistan. The average discount rate used is 7.95% per annum. The amount is repayable ranging from 20 to 40 equal quarterly installments starting from September 30, 2021 and carry markup of 2.5% per annum which is payable quarterly. This facility is secured by specific and exclusive charge on the purchased machinery in case of Millat Tractors Limited, and first charge over the current assets of Millat Equipment Limited.
2021 2020 (Rupees in thousand)
12 Deferred grant At start of year 27,544 – Received during the year 53,252 27,544 Transferred to profit or loss during the year (33,287) – At end of year 47,509 27,544 Represented by: Non-current 21,085 14,281 Current 26,424 13,263 47,509 27,544 12.1 Government grants have been recognized against loans obtained under the SBP refinance scheme of salaries and
wages and SBP refinance scheme for renewable energy in lieu of below market-interest / return rate payable on these loans. There are no unfulfilled conditions or contingencies attached to these grants effecting its recognition at the reporting date.
Note 2021 2020 (Rupees in thousand)
13 Trade and other payables Trade creditors 2,868,328 1,972,026 Accrued liabilities 333,946 285,803 Bills payable 366,805 263,345 Security deposits 13.1 18,020 93,131 Trademark fee payable 58,918 126,751 Income tax deducted at source 552 2,715 Sales tax payable 30,452 14,675 Workers’ Profit Participation Fund 13.2 80,815 30,231 Workers’ Welfare Fund 153,527 29,266 Others 13.3 152,772 160,428 4,064,135 2,978,371 13.1 These represent security deposits from dealers and contractors against short term agreements which, by virtue of the
agreements, are interest free, repayable on demand and are used in the Group’s business. As at year end the Group has utilized these security deposits for business operations of the Group in accordance with the terms of the contract in writing.
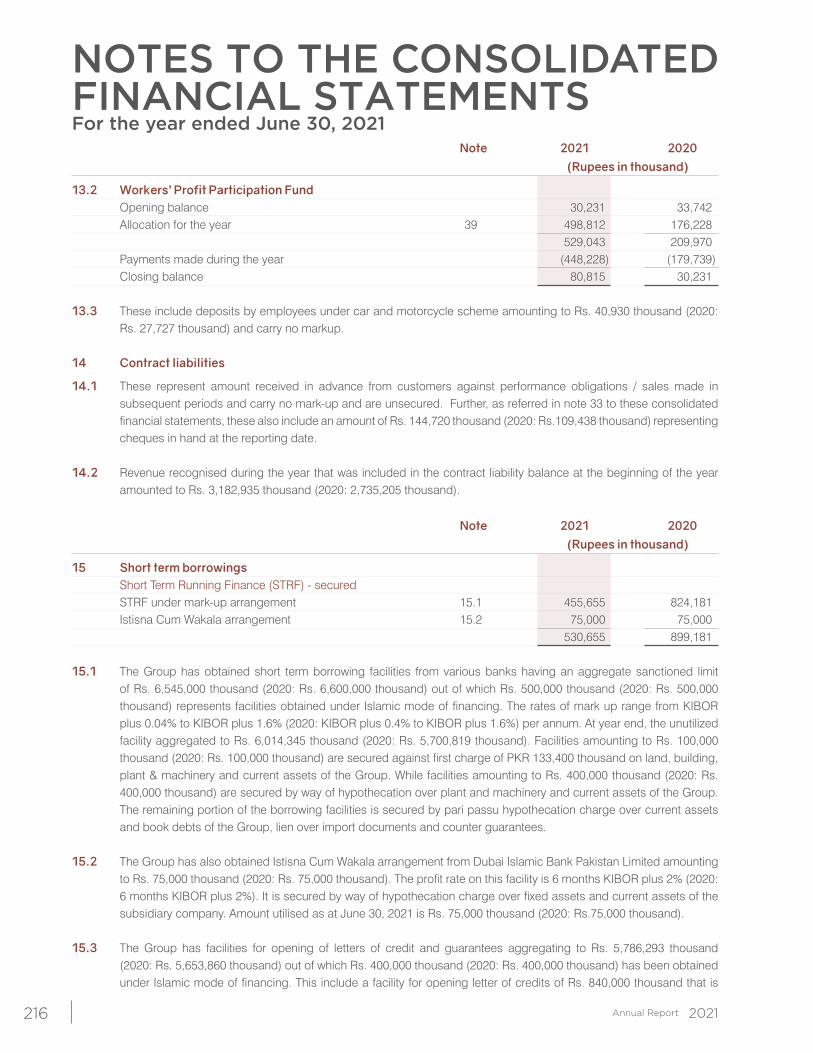
NOTES TO THE CONSOLIDATEDFINANCIAL STATEMENTSFor the year ended June 30, 2021
216
Note 2021 2020 (Rupees in thousand)
13.2 Workers’ Profit Participation Fund Opening balance 30,231 33,742 Allocation for the year 39 498,812 176,228 529,043 209,970 Payments made during the year (448,228) (179,739) Closing balance 80,815 30,231 13.3 These include deposits by employees under car and motorcycle scheme amounting to Rs. 40,930 thousand (2020:
Rs. 27,727 thousand) and carry no markup. 14 Contract liabilities
14.1 These represent amount received in advance from customers against performance obligations / sales made in subsequent periods and carry no mark-up and are unsecured. Further, as referred in note 33 to these consolidated financial statements, these also include an amount of Rs. 144,720 thousand (2020: Rs.109,438 thousand) representing cheques in hand at the reporting date.
14.2 Revenue recognised during the year that was included in the contract liability balance at the beginning of the year
amounted to Rs. 3,182,935 thousand (2020: 2,735,205 thousand).
Note 2021 2020 (Rupees in thousand)
15 Short term borrowings Short Term Running Finance (STRF) - secured STRF under mark-up arrangement 15.1 455,655 824,181 Istisna Cum Wakala arrangement 15.2 75,000 75,000 530,655 899,181 15.1 The Group has obtained short term borrowing facilities from various banks having an aggregate sanctioned limit
of Rs. 6,545,000 thousand (2020: Rs. 6,600,000 thousand) out of which Rs. 500,000 thousand (2020: Rs. 500,000 thousand) represents facilities obtained under Islamic mode of financing. The rates of mark up range from KIBOR plus 0.04% to KIBOR plus 1.6% (2020: KIBOR plus 0.4% to KIBOR plus 1.6%) per annum. At year end, the unutilized facility aggregated to Rs. 6,014,345 thousand (2020: Rs. 5,700,819 thousand). Facilities amounting to Rs. 100,000 thousand (2020: Rs. 100,000 thousand) are secured against first charge of PKR 133,400 thousand on land, building, plant & machinery and current assets of the Group. While facilities amounting to Rs. 400,000 thousand (2020: Rs. 400,000 thousand) are secured by way of hypothecation over plant and machinery and current assets of the Group. The remaining portion of the borrowing facilities is secured by pari passu hypothecation charge over current assets and book debts of the Group, lien over import documents and counter guarantees.
15.2 The Group has also obtained Istisna Cum Wakala arrangement from Dubai Islamic Bank Pakistan Limited amounting
to Rs. 75,000 thousand (2020: Rs. 75,000 thousand). The profit rate on this facility is 6 months KIBOR plus 2% (2020: 6 months KIBOR plus 2%). It is secured by way of hypothecation charge over fixed assets and current assets of the subsidiary company. Amount utilised as at June 30, 2021 is Rs. 75,000 thousand (2020: Rs.75,000 thousand).
15.3 The Group has facilities for opening of letters of credit and guarantees aggregating to Rs. 5,786,293 thousand (2020: Rs. 5,653,860 thousand) out of which Rs. 400,000 thousand (2020: Rs. 400,000 thousand) has been obtained under Islamic mode of financing. This include a facility for opening letter of credits of Rs. 840,000 thousand that is
217
a sub-facility of the short term borrowings facilities as disclosed in note 16. At year end, the unutilized potion of the group-wide facilities for opening of letters of credit and guarantees aggregated to Rs. 2,437,563 thousand (2020: Rs. 4,532,279 thousand). These facilities are secured by pari passu hypothecation charge over current assets and book debts of the respective subsidiary company, lien over import documents and counter guarantees.
16 Contingencies and commitments
16.1 Contingencies
16.1.1 The Group has given guarantee amounting to Rs. 5,000 thousand (2020: Rs. 5,000) to bank for repayment of loan by employees. An amount of Rs.1,133 thousand (2020: Rs. 1,133) was utilized by employees as at June 30, 2021.
16.1.2 Guarantees issued by various banks on behalf of the Group in the normal course of business amount to Rs. 1,115,633
thousand (2020: Rs.540,970 thousand). 16.1.3 Holding company
16.1.3.1 Income tax returns for the years from 2007 to 2020 have been filed by the Company under the provisions of section 120 of the Income Tax Ordinance, 2001 (the Ordinance).
The Income tax department has disputed with the Company’s treatment on certain tax matters for the tax years 2013,
2015 and 2016, entailing an additional tax liability of Rs. 678,595 thousand. Of these the only significant tax matter, amounting to Rs. 507,588 thousand, relates to disallowances made by tax authorities in respect of consumption of stock and consequently value of closing stock claimed by the Company in its income tax returns for the tax year 2015. Both the Company and Income tax department are currently in appeal at the Commissioner Inland Revenue Appeals and Appellate tribunal level regarding the tax matters, decisions of which are pending. The management in consultation with their tax advisor is confident that all the tax matters will eventually be decided in the favor of the Company; therefore no provision has been made in these financial statements accordingly.
16.1.3.2 The Deputy Commission Inland Revenue has issued withholding tax assessment orders u/s 161/205 of the Ordinance
for the tax year 2011 creating an initial demand of Rs. 176,000 thousand. The Company preferred an appeal before the Commissioner Inland Revenue (Appeals) (CIR(A)). The CIR(A) passed an order dated January 21, 2015 remanding back the issue to Deputy Commissioner. Reassessment proceedings after being finalized on January 25, 2016 reduced the demand to Rs. 51,000 thousand. The Company is in the process of filing appeal against reassessment proceedings with CIR(A). Furthermore, the tax authorities have filed an appeal before Appellate Tribunal (ATIR) against the order passes by CIR(A). The management in consultation with their tax advisor are confident that the above matter will eventually be decided in favor of the Company; therefore no provision has been created in these financial statements accordingly.
16.1.3.3 The Company is defending a demand of Rs 289,430 thousand from the Additional Commissioner Inland Revenue,
Lahore and later upheld by the Deputy Commissioner Inland Revenue (Appeals) against the Company regarding the reduced payment of sales tax on sale of tractors by the Company to its customers in the period June 2016.
The Company filed the appeal in 2017 against the aforementioned orders, to the Appellate Tribunal Inland Revenue (ATIR) which was ruled in favor of the Company and later challenged by the Commissioner Inland Revenue, Lahore in the High Court, Lahore. During the current year the High Court, Lahore remanded back the case to the ATIR. Hence, the matter is currently pending in ATIR.
The management and the legal advisor are confident that outcome of the case would be in the Company’s favor
and no payment in this regard would be required, hence no provision there against has been made in these financial statements.
NOTES TO THE CONSOLIDATEDFINANCIAL STATEMENTSFor the year ended June 30, 2021
218
16.1.3.4 The Company is defending a suit for Rs. 19,579 thousand, filed in previous years by an ex-vendor on account of damages and inconvenience. Previously, the case was pending before the Civil Court, Lahore. However during the last year it was held by the Civil Court that the damages of Rs. 15,000 thousand has been awarded in favor of vendor for the aforementioned inconvenience. In addition to that the Company is also required to pay the amount of parts already supplied by the vendor which amounts to Rs 4,579 thousand along with mark up @ 7% per annum till its realization. However the Company has filed an appeal in the Honorable High Court, Lahore against the aforesaid order of Civil Court. The management and the legal advisor are confident that outcome of the case would be in the Company’s favor and no payment in this regard would be required, hence no provision there against has been made in these financial statements.
16.1.3.5 The Company is defending a demand of Rs. 31,869 thousand from the Customs Authorities (Authorities), alleging
the Company for non payment of custom duty and other additional duties. The demand is on account of purchase of certain starter motors and alternators to be used for the manufacture of the tractors. The Company filed an appeal against the said demand and the order passed by Additional Collector, Lahore and Collector Appeals, Lahore before the Customs Appellate Tribunal, Lahore and the said tribunal passed order in favor of the Company. The Custom department has filed reference against the decision in Honorable High Court, Lahore, judgment of which is pending. The Company made payment of Rs. 8,000 thousand under protest in response to demand notice served and obtained stay order from Honorable High Court, Lahore against further recovery action of Authorities. The management are confident that the outcome of the case would be decided in their favor hence no provision relating to aforesaid demand has been made in these financial statements.
16.1.3.6 During the current year the Income tax department has disputed the Company’s payment against Workers’ Welfare
Fund for years 2014 to 2020 and thereby created a demand of Rs. 657,509 thousand under section 4(9) of Workers Welfare Fund Ordinance, 1971.
The Company has submitted its response on the aforementioned order to the Income tax department which is currently
pending a response. The management in consultation with their tax advisor is confident that the matter will eventually be decided in the favor of the Company; therefore no provision has been made in these financial statements.
Subsidiaries
16.1.4 a) Bolan Casting Limited
16.1.4.1 In 2014, the Company received a reassessment order dated 26 June 2014, from the Income Tax Department, in respect of return filed for the tax year 2008. The Department had revised the return filed by the Company and reduced the income tax refund claimed by the Company by Rs. 6,020 thousand. The said order was challenged before the Commissioner (Appeals) who declared the order in original as time barred and annulled it. Subsequently, the Income Tax Department filed appeal against the order before the Appellate Tribunal Inland Revenue which has not been heard yet. The management of the Company, based on the views of its tax consultant, is confident that the final decision will be given in favour of the Company and therefore, no provision has been made in these financial statements for this amount.
16.1.4.2 In a suit filed against the Company before the Senior Civil Judge at Hub Balochistan, Altaf Hussain Agha (the Plaintiff) claims that in the year 2004 the Company allegedly encroached upon the land measuring 5 acres - 2 roads - 34 poles belonging to him that he purchased in year 2003. The Plaintiff has also sought mesne profits from the Company for such alleged encroachment. The Company claims ownership to the said piece of land and disputes the alleged encroachment claim whatsoever. The written statement of the Company was filed, the issues were framed and the Plaintiff had produced his witnesses. However, suit was decreed against the Company by the Senior Civil Judge. The original order was challenged by the Company before Balochistan High Court, which suspended the said order. In November, 2019, the Government of Balochistan enhanced the limit of session courts from claims of Rs. 5,000
219
thousand to Rs. 100,000 thousand. Hence, the case of the Company was transferred to Session Court, Hub on November 21, 2019. The Company’s appeal was dismissed by Senior Civil Judge on August 18, 2020. The Company decided to file an appeal against the order in Balochistan High Court Quetta on September 08, 2020 for revision and suspension of the order. The case is pending for hearing. The exposure on account of profits claimed under the suit amounts to Rs. 48,000 thousand (2020: Rs. 48,000 thousand). The management of the Company based on the views of its legal advisor is confident that decision will be given in favour of the Company and therefore, no provision has been made in these financial statements.
16.1.5 b) Millat Industrial Products Limited
16.1.5.1 Withholding tax proceedings u/s 161/205 were finalized for tax year 2011 vide order dated August 18, 2014 creating demand of Rs. 11,408 thousand. Out of total demand, department has adjusted the demand of Rs. 3,341 thousand against refunds available from previous tax years.
Consequently, company filed appeal and stay application to CIR(A) against the outstanding demand of Rs. 8,067
thousand. Stay was granted by CIR(A) subject to payment of Rs. 2,000 thousand. In the appellant order, CIR(A) confirmed the demand of Rs. 13 thousand while remaining issues were remanded back with direction for fresh assessment. On this instance, the company is under appeal before ATIR and appeal has not been heard till date.
Re-assessment proceedings u/s 124/129 read with 161/2015 were finalized for tax year 2011 vide order dated June
30, 2016 creating demand of Rs 5,927 thousand. Company had filed appeal to CIR(A) which was finalized vide order dated September 9, 2016 granting relief of Rs. 5,904 thousand. After appeal effect, company shall have net tax payable of Rs. 13 thousand. Department is under appeal before ATIR and the appeal has not been fixed for hearing till date.
16.1.5.2 Audit proceedings has been finalized u/s 122(5A), for tax years 2013,2015, 2016 and 2017 by Additional Commissioner
creating additional demand of Rs.381,648,695 thousand. The Company has filed appeal to CIR(A) against the order which is yet to be heard. The Company has secured stay of demand against recovery notice. On the basis of available records and history of assessment, prima facie the case lies in favor of the company. No tax liability is anticipated.
16.1.5.3 The Company received notice from the Directorate of Intelligence and Investigation – Federal Board of Revenue (FBR), Karachi on April 28, 2017. In the said notice it was alleged that the Company had purchased goods from a dummy / fake supplier who got registered with the Regional Tax Officers at Karachi and issued fake sales tax invoices to the Company and accordingly the Company has claimed illegal / inadmissible input tax adjustment amounting to Rs 2,439 thousand.
As a result the name of the Company was included in the First Information Report (FIR) No. 678(931)/I&I/IR/
KHI(AB-521)/2016/3617 dated April 28, 2017 registered by the Additional Director, Intelligence and Investigation - FBR, Karachi. Total demand raised against the company is Rs. 2,439 thousand which the FBR allowed to deposit in two equal instalments of which first instalment of Rs. 1,219 thousand was deposited on June 16, 2017 and second Instalment of Rs. 1,219 thousand was deposited on September 25, 2017 by the company. The legal advisor of the company has stated that the company has “Good case & chances of success are very bright”.
16.1.5.4 Sales tax audit u/s 25 of the Sales Tax Act, 1990 has been initiated by FBR on dated May 3, 2018. Proceedings are in
process hence, no tax liability can be anticipated at this stage. Proceeding was finalized vide order dated March 22, 2019 creating demand of Rs. 939 thousand. Company filled appeal to CIR(A) dated April 4, 2019 and appeal has been discharged. Company has filed appeal to the Appellate Tribunal Inland Revenue u/s 46 of the Sales Tax Act, 1990.
The legal advisor of the company has stated that the company has “Good case & chances of success are bright”.
NOTES TO THE CONSOLIDATEDFINANCIAL STATEMENTSFor the year ended June 30, 2021
220
16.1.5.5 The Competition Commission of Pakistan has imposed a penalty of Rs 1,000 thousand on the company for being purportedly involved in deceptive marketing practice vide it’s order dated March 30, 2018. The company challenged the same before the competition Appellate Tribunal Islamabad submitting, “That the petitioner is not involved in any deceptive marketing practice”. The Appellate Tribunal has admitted the case for hearing and during the pendency of appeal, the operation of impugned order dated, March 30, 2018 is suspended till the final decision of the order.
16.1.5.6 During the current year the Income tax department has disputed the Company’s payment against Workers’ Welfare
Fund for years 2014 to 2020 and thereby created a demand of Rs. 15,101 thousand under section 4(9) of Workers Welfare Fund Ordinance, 1971.
The Company has submitted its response on the aforementioned order to the Income tax department which is currently
pending a response. The management in consultation with their tax advisor is confident that the matter will eventually be decided in the favor of the Company; therefore no provision has been made in these financial statements.
16.1.6 c) Millat Equipment Limited
16.1.6.1 The Assistant Commissioner Inland Revenue (ACIR) passed an order u/s 122(5A) dated 21 June 2019, creating a demand of Rs. 29,600 thousand. The Company filed an appeal to Commissioner Inland Revenue-Appeals (CIR-A) against the order of ACIR, who remanded the case back to ACIR for reassessment. The ACIR finalized the proceedings by reducing the demand to Rs. 4,900 thousand. Being aggrieved by the order, the Company has filed a second appeal to CIR-A, which is pending adjudication. The management, based upon the opinion of the Company’s tax counsel, is confident that the matter will be decided in favor of the Company, accordingly, no provision has been made in these financial statements.
16.1.6.2 The Additional Commissioner Inland Revenue (ACIR) passed an order u/s 122(5A) dated 13 April 2021, creating a
demand of Rs. 63,200 thousand. The Company filed application for stay of demand to Commissioner Inland Revenue-Appeals (CIR-A) dated 22 June 2021. Stay of demand for a period of 30 days was provided by the Commissioner Inland Revenue vide order dated 23 July 2021. The management, based upon the opinion of the Company’s tax counsel, is confident that the matter will be decided in favor of the Company, accordingly, no provision has been made in these financial statements.
16.1.6.3 The Additional Commissioner Inland Revenue (ACIR) passed an order u/s 122(1) dated 29 October 2020, creating a demand of Rs. 109.08 million. The Company filed appeal before Commissioner Inland Revenue-Appeals (CIR-A) dated 27 November 2020. Further, the Company filed application for stay of demand to Commissioner Inland Revenue-Appeals (CIR-A) dated 08 February 2021, which was rejected by CIR-A on the grounds that stay order for more than sixty days cannot be awarded by that forum. Being aggrieved on the decision, the Company filed request for stay of demand before Appellate Tribunal Inland Revenue (ATIR), which was granted to the Company vide order dated 27 July 2021. The management, based upon the opinion of the Company’s tax counsel, is confident that the matter will be decided in favor of the Company, accordingly, no provision has been made in these financial statements.
16.2 Commitments
16.2.1 Commitments in respect of outstanding letters of credit amounting to Rs. 2,374,237 thousand (2020: Rs. 709,571 thousand) at the reporting date.
16.2.2 The aggregate commitments in respect of capital expenditure as at June 30, 2021 amount to Rs. Nil thousand (June
30, 2020: 650 thousand).
Note 2021 2020 (Rupees in thousand)
17 Operating fixed assets Operating property, plant and equipment 17.1 1,793,993 1,645,923
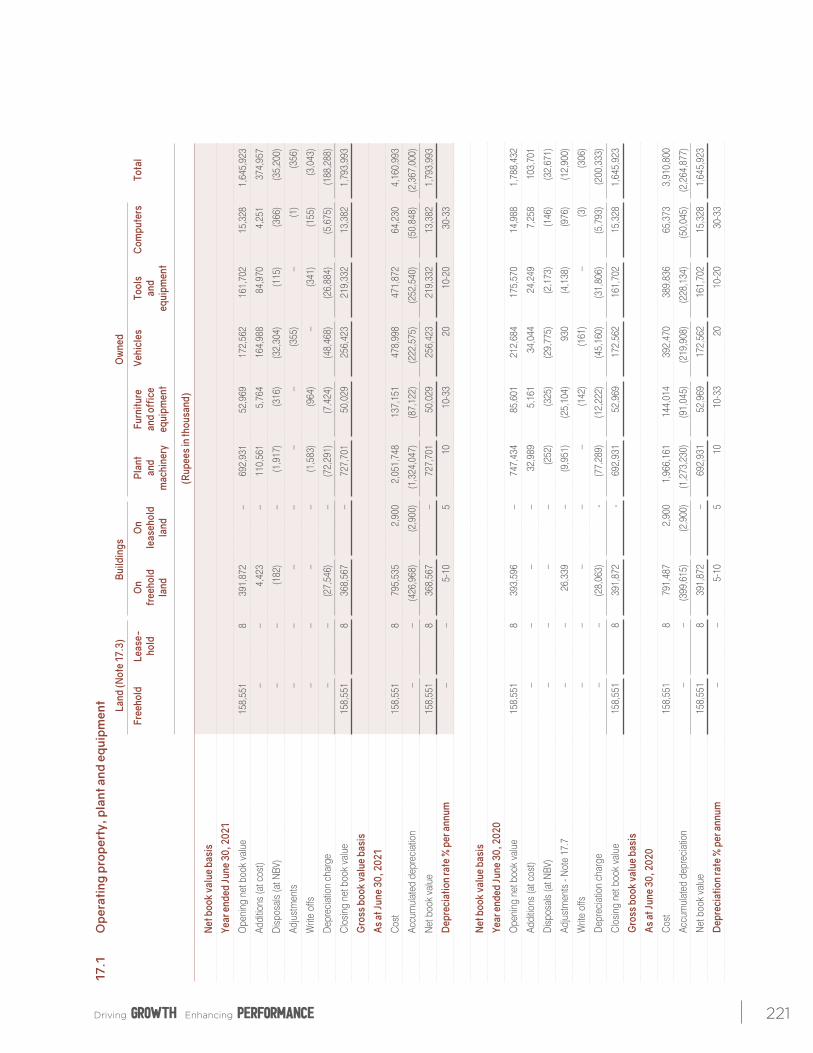
221
17.1
O
pera
ting
pro
pert
y, p
lant
and
equ
ipm
ent
La
nd (N
ote
17.3
) Bu
ildin
gs
Ow
ned
Free
hold
Le
ase-
O
n O
n Pl
ant
Furn
iture
Ve
hicl
es
Tool
s C
ompu
ters
To
tal
ho
ld
free
hold
le
aseh
old
and
and
offic
e
and
land
la
nd
mac
hine
ry
equi
pmen
t
equi
pmen
t
(R
upee
s in
thou
sand
)
N
et b
ook
valu
e ba
sis
Ye
ar e
nded
June
30,
202
1
O
peni
ng n
et b
ook
valu
e
158
,551
8
3
91,8
72
– 6
92,9
31
52,
969
1
72,5
62
161
,702
1
5,32
8
1,6
45,9
23
Ad
ditio
ns (a
t cos
t)
– –
4
,423
–
1
10,5
61
5,7
64
164
,988
8
4,97
0
4,2
51
374
,957
D
ispo
sals
(at N
BV)
–
–
(182
) –
(1
,917
) (3
16)
(32,
304)
(1
15)
(366
) (3
5,20
0)
Ad
just
men
ts
–
–
–
–
– –
(3
55)
–
(1)
(356
)
W
rite
offs
– –
–
–
(1,5
83)
(964
) –
(341
) (1
55)
(3,0
43)
D
epre
ciat
ion
char
ge
–
–
(27,
546)
–
(72,
291)
(7
,424
) (4
8,46
8)
(26,
884)
(5
,675
) (1
88,2
88)
C
losi
ng n
et b
ook
valu
e
158
,551
8
3
68,5
67
–
7
27,7
01
50,
029
2
56,4
23
219
,332
1
3,38
2
1,7
93,9
93
G
ross
boo
k va
lue
basi
s
As
at J
une
30, 2
021
C
ost
1
58,5
51
8
795
,535
2
,900
2
,051
,748
1
37,1
51
478
,998
4
71,8
72
64,
230
4
,160
,993
Ac
cum
ulat
ed d
epre
ciat
ion
–
–
(426
,968
) (2
,900
) (1
,324
,047
) (8
7,12
2)
(222
,575
) (2
52,5
40)
(50,
848)
(2
,367
,000
)
N
et b
ook
valu
e
158
,551
8
3
68,5
67
–
727
,701
5
0,02
9
256
,423
2
19,3
32
13,
382
1
,793
,993
D
epre
ciat
ion
rate
% p
er a
nnum
– –
5
-10
5
1
0
10-
33
20
1
0-20
3
0-33
N
et b
ook
valu
e ba
sis
Ye
ar e
nded
June
30,
202
0
O
peni
ng n
et b
ook
valu
e
158
,551
8
3
93,5
96
–
747
,434
8
5,60
1
212
,684
1
75,5
70
14,
988
1
,788
,432
Ad
ditio
ns (a
t cos
t)
– –
–
–
32,
989
5
,161
3
4,04
4
24,
249
7
,258
1
03,7
01
D
ispo
sals
(at N
BV)
–
–
– –
(2
52)
(325
) (2
9,77
5)
(2,1
73)
(146
) (3
2,67
1)
Ad
just
men
ts -
Not
e 17
.7
–
–
2
6,33
9
–
(9,9
51)
(25,
104)
9
30
(4,1
38)
(976
) (1
2,90
0)
W
rite
offs
– –
–
–
–
(142
) (1
61)
–
(3)
(306
)
D
epre
ciat
ion
char
ge
–
–
(28,
063)
-
(7
7,28
9)
(12,
222)
(4
5,16
0)
(31,
806)
(5
,793
) (2
00,3
33)
C
losi
ng n
et b
ook
valu
e
158
,551
8
3
91,8
72
-
692
,931
5
2,96
9
172
,562
1
61,7
02
15,
328
1
,645
,923
G
ross
boo
k va
lue
basi
s
As
at J
une
30, 2
020
C
ost
1
58,5
51
8
791
,487
2
,900
1
,966
,161
1
44,0
14
392
,470
3
89,8
36
65,
373
3
,910
,800
Ac
cum
ulat
ed d
epre
ciat
ion
–
–
(399
,615
) (2
,900
) (1
,273
,230
) (9
1,04
5)
(219
,908
) (2
28,1
34)
(50,
045)
(2
,264
,877
)
N
et b
ook
valu
e
158
,551
8
3
91,8
72
–
692
,931
5
2,96
9
172
,562
1
61,7
02
15,
328
1
,645
,923
D
epre
ciat
ion
rate
% p
er a
nnum
– –
5
-10
5
1
0
10-
33
20
1
0-20
3
0-33
NOTES TO THE CONSOLIDATEDFINANCIAL STATEMENTSFor the year ended June 30, 2021
222
Note 2021 2020 (Rupees in thousand)
17.2 The depreciation charge for the year has been allocated as follows: Cost of sales 36 125,122 134,808 Distribution and marketing expenses 37 8,642 8,107 Administrative expenses 38 54,524 57,418 188,288 200,333 17.3 The freehold land and building on owned land of the Group are as follows:
- 202,343 square meters of factory land situated at Sheikhupura Road, Sheikhupura - MTL;
- 759 square meters of land at Khera Gali District Abbottabad - MTL;
- 697 square meters of land in sector F-6/1 Islamabad - MTL;
- Corporate office floors in Tricon Corporate Centre Lahore - MTL;
- 113 Kanal and 12.5 Marlas of land, situated at Mauza Bhoptian, tehsil and district Lahore - MEL;
- 52 Kanals and 10 Marlas is located at 49-K.M., off Multan Road, Bhai Pheru, Distt. Kasur - MIPL; and
- 22.93 acres of factory land situated at Main RCD Highway, Hub chowki, Tehsil Hub, District Lasbella, Balochistan - BCL
17.4 Leasehold property represents Igloo Hanger Godown measuring total area of 6,662 square meters situated near
Brooke Bond factory site area, Karachi. 17.5 Tools and equipment includes dies and moulds having book value of Rs 2,207 thousand (2020: 2,597 thousand)
which are in possession of vendors and these dies and moulds are used by the vendors for producing certain parts for supply to the Group.
17.6 Disposal of operating property, plant and equipment Particulars
Sold to Cost Book Sale Gain / (Loss)
Mode of disposal
of assets value proceeds on disposal
(Rupees in thousand)
Fixed assets sold having book value greater than Rs. 500,000 Directors : Vehicle Mr. Laeeq Uddin Ansari 7,500 1,504 1,504 - As approved by the BOD - a related party Employees : Vehicle Mr. Ayaz Khurshid 2,993 1,937 1,937 - Company car scheme Vehicle Mr. Ayaz Khurshid 2,758 2,482 2,482 - Company car scheme Vehicle Mr. Waseem Bhatti 1,910 1,188 1,188 - Company car scheme Vehicle Mr. Waseem Bhatti 1,846 514 514 - Company car scheme Vehicle Mr. Khurram Shahzad Toor 1,846 578 578 - Company car scheme Vehicle Mr. Muhammad Qayyum 1,398 1,212 1,212 - Company car scheme Vehicle Mr. Muhammad Bilal 1,250 578 578 - Company car scheme
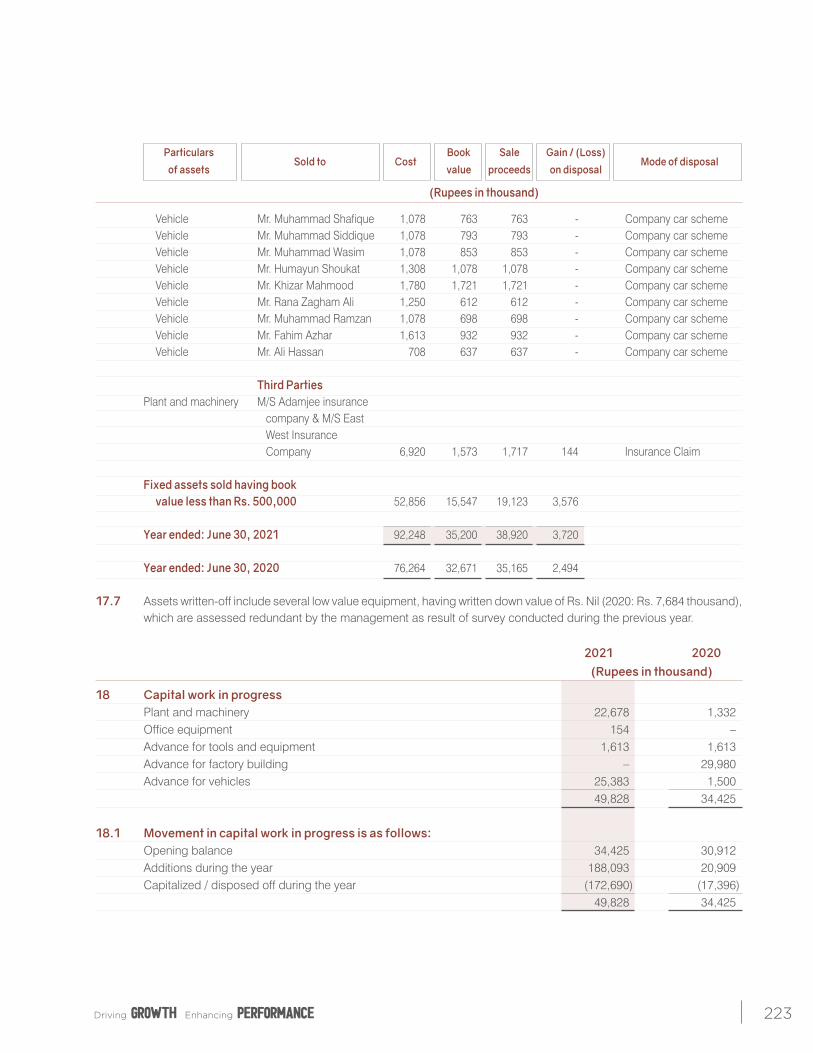
223
Particulars Sold to Cost
Book Sale Gain / (Loss) Mode of disposal
of assets value proceeds on disposal
(Rupees in thousand)
Vehicle Mr. Muhammad Shafique 1,078 763 763 - Company car scheme Vehicle Mr. Muhammad Siddique 1,078 793 793 - Company car scheme Vehicle Mr. Muhammad Wasim 1,078 853 853 - Company car scheme Vehicle Mr. Humayun Shoukat 1,308 1,078 1,078 - Company car scheme Vehicle Mr. Khizar Mahmood 1,780 1,721 1,721 - Company car scheme Vehicle Mr. Rana Zagham Ali 1,250 612 612 - Company car scheme Vehicle Mr. Muhammad Ramzan 1,078 698 698 - Company car scheme Vehicle Mr. Fahim Azhar 1,613 932 932 - Company car scheme Vehicle Mr. Ali Hassan 708 637 637 - Company car scheme Third Parties Plant and machinery M/S Adamjee insurance company & M/S East West Insurance Company 6,920 1,573 1,717 144 Insurance Claim Fixed assets sold having book value less than Rs. 500,000 52,856 15,547 19,123 3,576 Year ended: June 30, 2021 92,248 35,200 38,920 3,720 Year ended: June 30, 2020 76,264 32,671 35,165 2,494 17.7 Assets written-off include several low value equipment, having written down value of Rs. Nil (2020: Rs. 7,684 thousand),
which are assessed redundant by the management as result of survey conducted during the previous year.
2021 2020 (Rupees in thousand)
18 Capital work in progress Plant and machinery 22,678 1,332 Office equipment 154 – Advance for tools and equipment 1,613 1,613 Advance for factory building – 29,980 Advance for vehicles 25,383 1,500 49,828 34,425 18.1 Movement in capital work in progress is as follows: Opening balance 34,425 30,912 Additions during the year 188,093 20,909 Capitalized / disposed off during the year (172,690) (17,396) 49,828 34,425
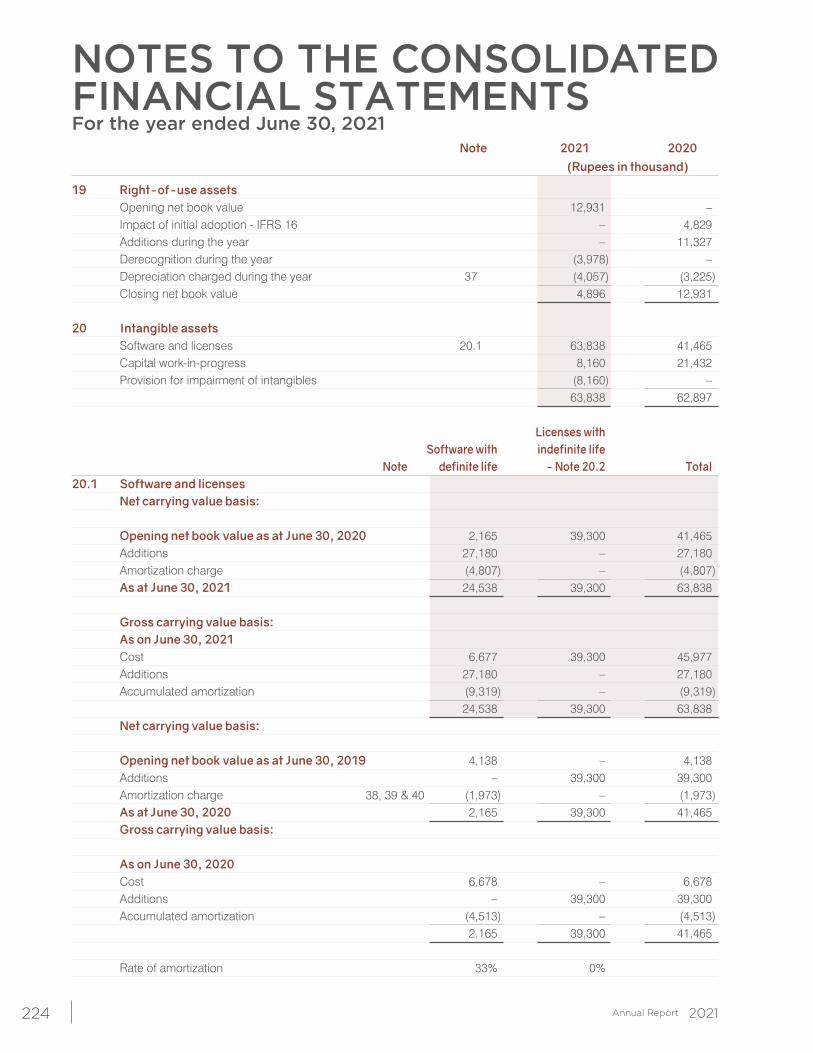
NOTES TO THE CONSOLIDATEDFINANCIAL STATEMENTSFor the year ended June 30, 2021
224
Note 2021 2020 (Rupees in thousand)
19 Right-of-use assets Opening net book value 12,931 – Impact of initial adoption - IFRS 16 – 4,829 Additions during the year – 11,327 Derecognition during the year (3,978) – Depreciation charged during the year 37 (4,057) (3,225) Closing net book value 4,896 12,931 20 Intangible assets Software and licenses 20.1 63,838 41,465 Capital work-in-progress 8,160 21,432 Provision for impairment of intangibles (8,160) – 63,838 62,897 Licenses with Software with indefinite life Note definite life - Note 20.2 Total20.1 Software and licenses Net carrying value basis: Opening net book value as at June 30, 2020 2,165 39,300 41,465 Additions 27,180 – 27,180 Amortization charge (4,807) – (4,807) As at June 30, 2021 24,538 39,300 63,838 Gross carrying value basis: As on June 30, 2021 Cost 6,677 39,300 45,977 Additions 27,180 – 27,180 Accumulated amortization (9,319) – (9,319) 24,538 39,300 63,838 Net carrying value basis: Opening net book value as at June 30, 2019 4,138 – 4,138 Additions – 39,300 39,300 Amortization charge 38, 39 & 40 (1,973) – (1,973) As at June 30, 2020 2,165 39,300 41,465 Gross carrying value basis: As on June 30, 2020 Cost 6,678 – 6,678 Additions – 39,300 39,300 Accumulated amortization (4,513) – (4,513) 2,165 39,300 41,465
Rate of amortization 33% 0%
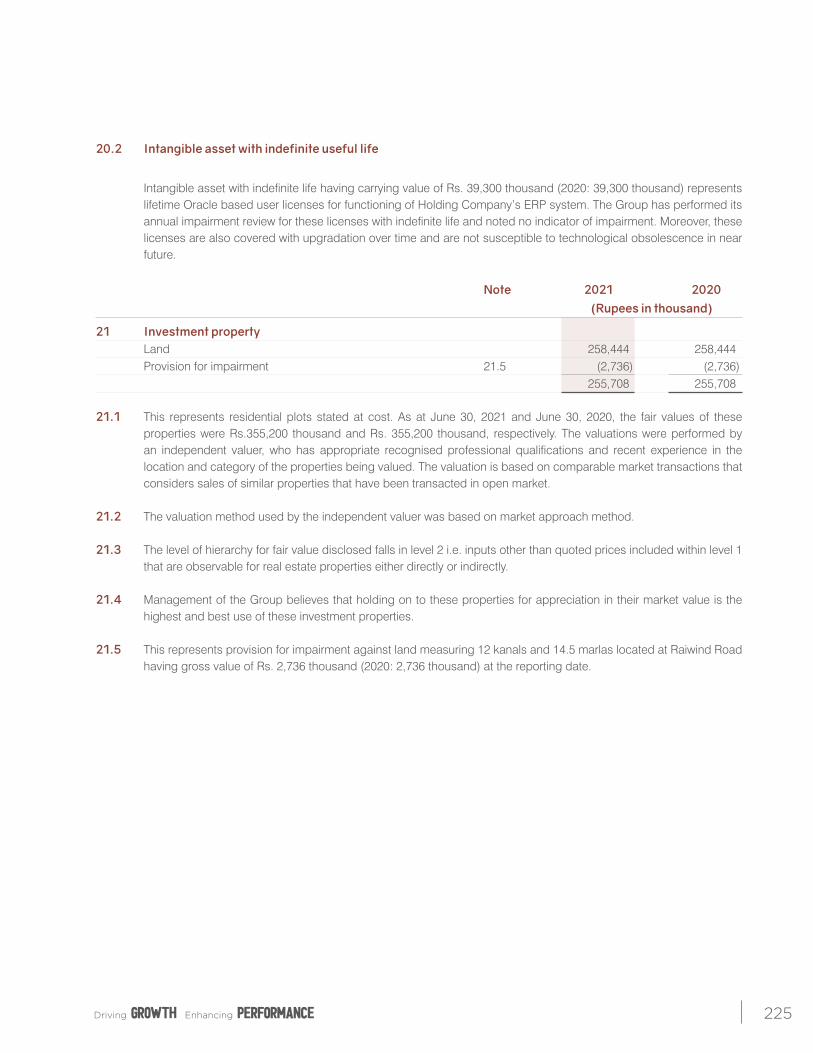
225
20.2 Intangible asset with indefinite useful life
Intangible asset with indefinite life having carrying value of Rs. 39,300 thousand (2020: 39,300 thousand) represents
lifetime Oracle based user licenses for functioning of Holding Company’s ERP system. The Group has performed its annual impairment review for these licenses with indefinite life and noted no indicator of impairment. Moreover, these licenses are also covered with upgradation over time and are not susceptible to technological obsolescence in near future.
Note 2021 2020 (Rupees in thousand)
21 Investment property Land 258,444 258,444 Provision for impairment 21.5 (2,736) (2,736) 255,708 255,708 21.1 This represents residential plots stated at cost. As at June 30, 2021 and June 30, 2020, the fair values of these
properties were Rs.355,200 thousand and Rs. 355,200 thousand, respectively. The valuations were performed by an independent valuer, who has appropriate recognised professional qualifications and recent experience in the location and category of the properties being valued. The valuation is based on comparable market transactions that considers sales of similar properties that have been transacted in open market.
21.2 The valuation method used by the independent valuer was based on market approach method. 21.3 The level of hierarchy for fair value disclosed falls in level 2 i.e. inputs other than quoted prices included within level 1
that are observable for real estate properties either directly or indirectly. 21.4 Management of the Group believes that holding on to these properties for appreciation in their market value is the
highest and best use of these investment properties. 21.5 This represents provision for impairment against land measuring 12 kanals and 14.5 marlas located at Raiwind Road
having gross value of Rs. 2,736 thousand (2020: 2,736 thousand) at the reporting date.
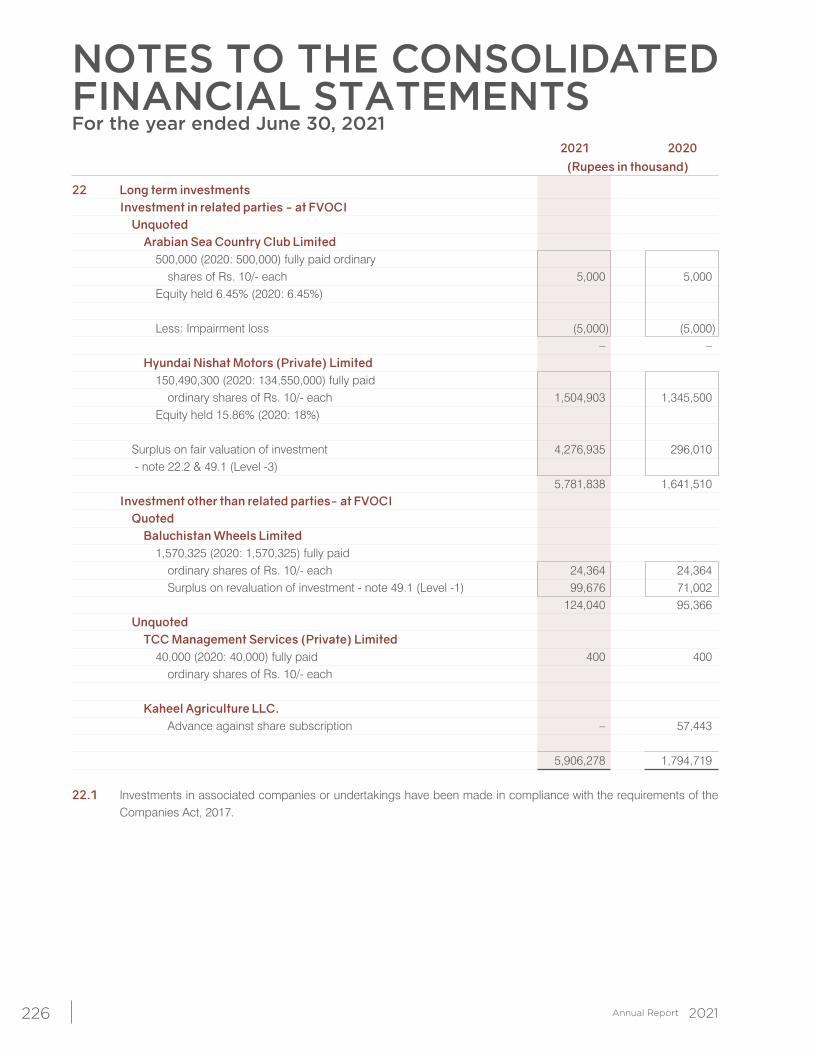
NOTES TO THE CONSOLIDATEDFINANCIAL STATEMENTSFor the year ended June 30, 2021
226
2021 2020 (Rupees in thousand)
22 Long term investments Investment in related parties - at FVOCI Unquoted Arabian Sea Country Club Limited 500,000 (2020: 500,000) fully paid ordinary shares of Rs. 10/- each 5,000 5,000 Equity held 6.45% (2020: 6.45%) Less: Impairment loss (5,000) (5,000) – – Hyundai Nishat Motors (Private) Limited 150,490,300 (2020: 134,550,000) fully paid ordinary shares of Rs. 10/- each 1,504,903 1,345,500 Equity held 15.86% (2020: 18%) Surplus on fair valuation of investment 4,276,935 296,010 - note 22.2 & 49.1 (Level -3) 5,781,838 1,641,510 Investment other than related parties- at FVOCI Quoted Baluchistan Wheels Limited 1,570,325 (2020: 1,570,325) fully paid ordinary shares of Rs. 10/- each 24,364 24,364 Surplus on revaluation of investment - note 49.1 (Level -1) 99,676 71,002 124,040 95,366 Unquoted TCC Management Services (Private) Limited 40,000 (2020: 40,000) fully paid 400 400 ordinary shares of Rs. 10/- each Kaheel Agriculture LLC. Advance against share subscription – 57,443 5,906,278 1,794,719 22.1 Investments in associated companies or undertakings have been made in compliance with the requirements of the
Companies Act, 2017.
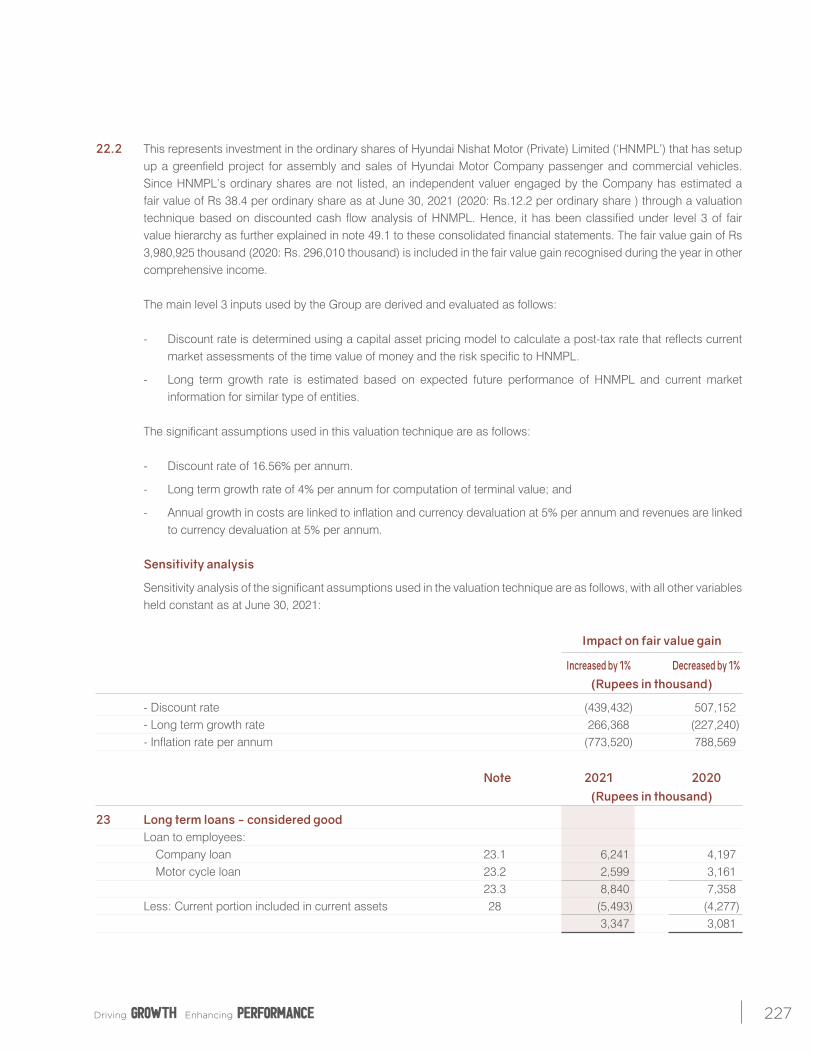
227
22.2 This represents investment in the ordinary shares of Hyundai Nishat Motor (Private) Limited (‘HNMPL’) that has setup up a greenfield project for assembly and sales of Hyundai Motor Company passenger and commercial vehicles. Since HNMPL’s ordinary shares are not listed, an independent valuer engaged by the Company has estimated a fair value of Rs 38.4 per ordinary share as at June 30, 2021 (2020: Rs.12.2 per ordinary share ) through a valuation technique based on discounted cash flow analysis of HNMPL. Hence, it has been classified under level 3 of fair value hierarchy as further explained in note 49.1 to these consolidated financial statements. The fair value gain of Rs 3,980,925 thousand (2020: Rs. 296,010 thousand) is included in the fair value gain recognised during the year in other comprehensive income.
The main level 3 inputs used by the Group are derived and evaluated as follows:
- Discount rate is determined using a capital asset pricing model to calculate a post-tax rate that reflects current market assessments of the time value of money and the risk specific to HNMPL.
- Long term growth rate is estimated based on expected future performance of HNMPL and current market information for similar type of entities.
The significant assumptions used in this valuation technique are as follows:
- Discount rate of 16.56% per annum.
- Long term growth rate of 4% per annum for computation of terminal value; and
- Annual growth in costs are linked to inflation and currency devaluation at 5% per annum and revenues are linked to currency devaluation at 5% per annum.
Sensitivity analysis
Sensitivity analysis of the significant assumptions used in the valuation technique are as follows, with all other variables held constant as at June 30, 2021:
Impact on fair value gain
Increased by 1% Decreased by 1% (Rupees in thousand)
- Discount rate (439,432) 507,152 - Long term growth rate 266,368 (227,240) - Inflation rate per annum (773,520) 788,569
Note 2021 2020 (Rupees in thousand)
23 Long term loans - considered good Loan to employees: Company loan 23.1 6,241 4,197 Motor cycle loan 23.2 2,599 3,161 23.3 8,840 7,358 Less: Current portion included in current assets 28 (5,493) (4,277) 3,347 3,081
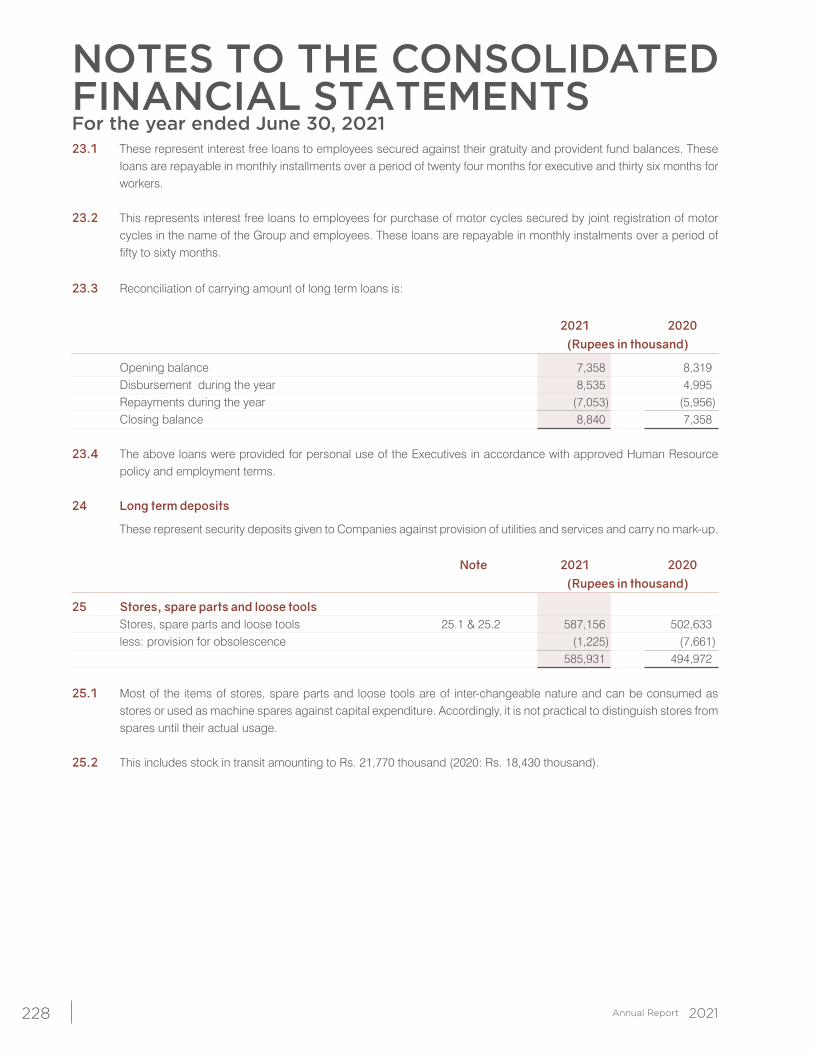
NOTES TO THE CONSOLIDATEDFINANCIAL STATEMENTSFor the year ended June 30, 2021
228
23.1 These represent interest free loans to employees secured against their gratuity and provident fund balances. These loans are repayable in monthly installments over a period of twenty four months for executive and thirty six months for workers.
23.2 This represents interest free loans to employees for purchase of motor cycles secured by joint registration of motor cycles in the name of the Group and employees. These loans are repayable in monthly instalments over a period of fifty to sixty months.
23.3 Reconciliation of carrying amount of long term loans is:
2021 2020 (Rupees in thousand)
Opening balance 7,358 8,319 Disbursement during the year 8,535 4,995 Repayments during the year (7,053) (5,956) Closing balance 8,840 7,358 23.4 The above loans were provided for personal use of the Executives in accordance with approved Human Resource
policy and employment terms. 24 Long term deposits
These represent security deposits given to Companies against provision of utilities and services and carry no mark-up.
Note 2021 2020 (Rupees in thousand)
25 Stores, spare parts and loose tools Stores, spare parts and loose tools 25.1 & 25.2 587,156 502,633 less: provision for obsolescence (1,225) (7,661) 585,931 494,972 25.1 Most of the items of stores, spare parts and loose tools are of inter-changeable nature and can be consumed as
stores or used as machine spares against capital expenditure. Accordingly, it is not practical to distinguish stores from spares until their actual usage.
25.2 This includes stock in transit amounting to Rs. 21,770 thousand (2020: Rs. 18,430 thousand).
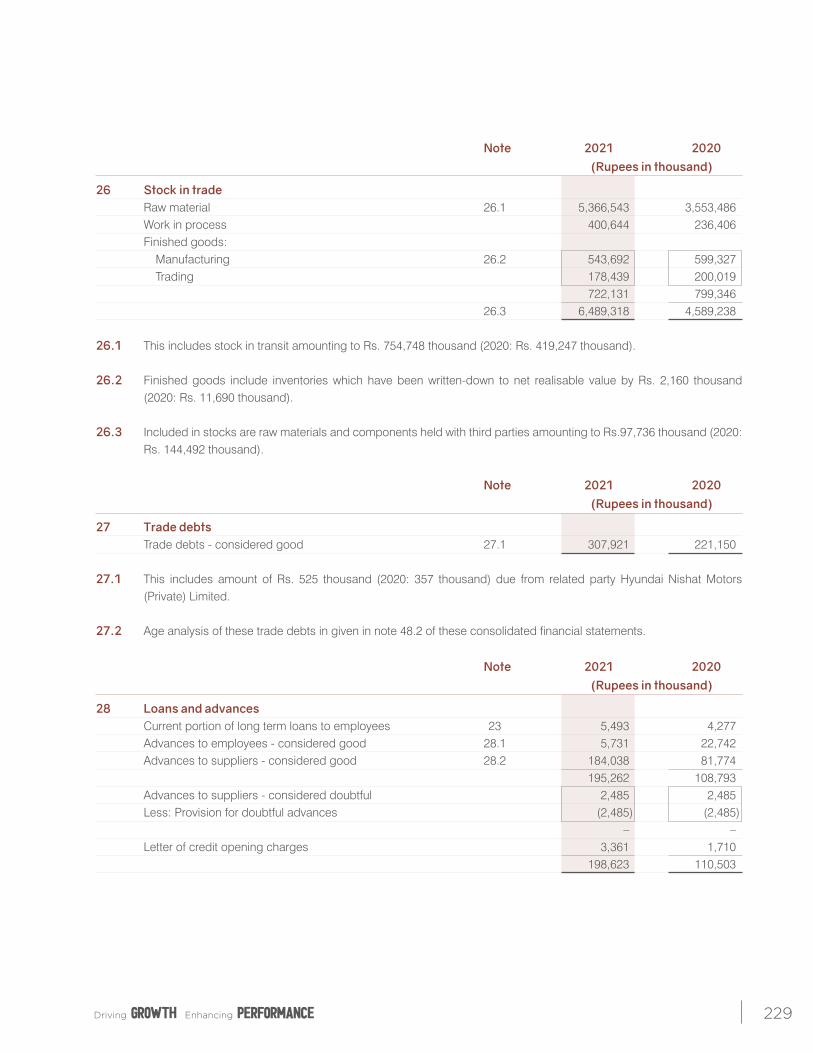
229
Note 2021 2020 (Rupees in thousand)
26 Stock in trade Raw material 26.1 5,366,543 3,553,486 Work in process 400,644 236,406 Finished goods: Manufacturing 26.2 543,692 599,327 Trading 178,439 200,019 722,131 799,346 26.3 6,489,318 4,589,238
26.1 This includes stock in transit amounting to Rs. 754,748 thousand (2020: Rs. 419,247 thousand). 26.2 Finished goods include inventories which have been written-down to net realisable value by Rs. 2,160 thousand
(2020: Rs. 11,690 thousand). 26.3 Included in stocks are raw materials and components held with third parties amounting to Rs.97,736 thousand (2020:
Rs. 144,492 thousand).
Note 2021 2020 (Rupees in thousand)
27 Trade debts Trade debts - considered good 27.1 307,921 221,150 27.1 This includes amount of Rs. 525 thousand (2020: 357 thousand) due from related party Hyundai Nishat Motors
(Private) Limited. 27.2 Age analysis of these trade debts in given in note 48.2 of these consolidated financial statements.
Note 2021 2020 (Rupees in thousand)
28 Loans and advances Current portion of long term loans to employees 23 5,493 4,277 Advances to employees - considered good 28.1 5,731 22,742 Advances to suppliers - considered good 28.2 184,038 81,774 195,262 108,793 Advances to suppliers - considered doubtful 2,485 2,485 Less: Provision for doubtful advances (2,485) (2,485) – – Letter of credit opening charges 3,361 1,710 198,623 110,503
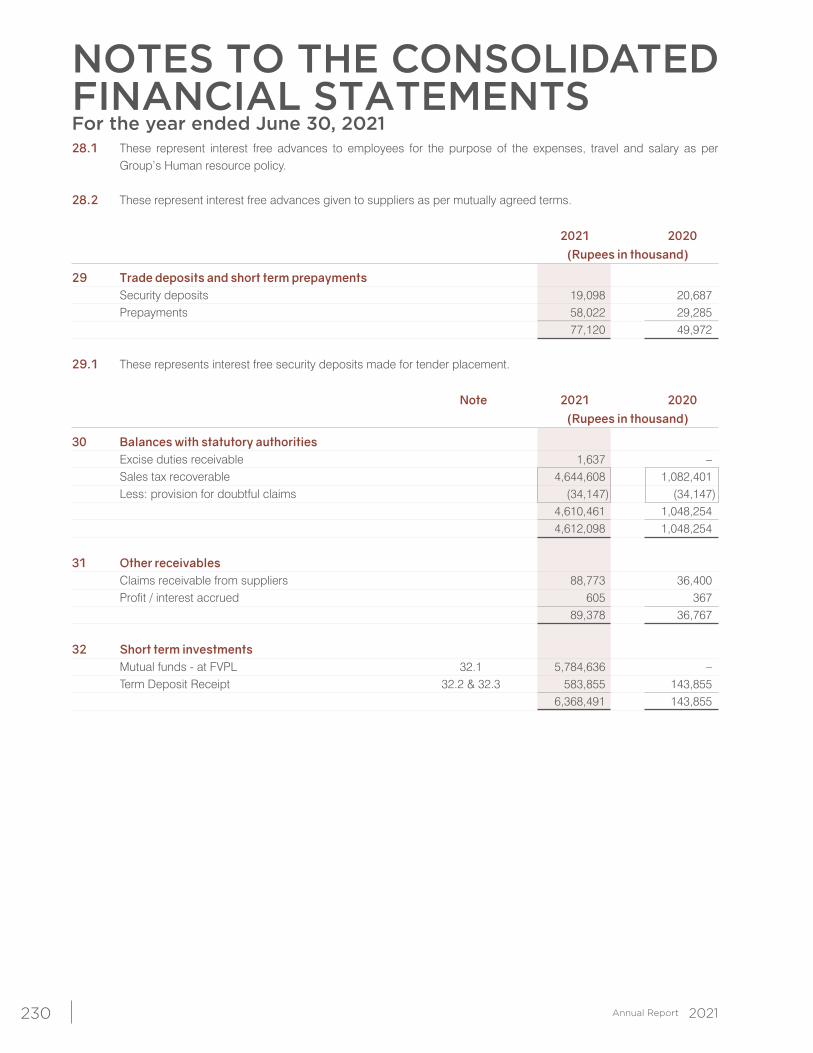
NOTES TO THE CONSOLIDATEDFINANCIAL STATEMENTSFor the year ended June 30, 2021
230
28.1 These represent interest free advances to employees for the purpose of the expenses, travel and salary as per Group’s Human resource policy.
28.2 These represent interest free advances given to suppliers as per mutually agreed terms.
2021 2020 (Rupees in thousand)
29 Trade deposits and short term prepayments Security deposits 19,098 20,687 Prepayments 58,022 29,285 77,120 49,972 29.1 These represents interest free security deposits made for tender placement.
Note 2021 2020 (Rupees in thousand)
30 Balances with statutory authorities Excise duties receivable 1,637 – Sales tax recoverable 4,644,608 1,082,401 Less: provision for doubtful claims (34,147) (34,147) 4,610,461 1,048,254 4,612,098 1,048,254
31 Other receivables Claims receivable from suppliers 88,773 36,400 Profit / interest accrued 605 367 89,378 36,767
32 Short term investments Mutual funds - at FVPL 32.1 5,784,636 – Term Deposit Receipt 32.2 & 32.3 583,855 143,855 6,368,491 143,855
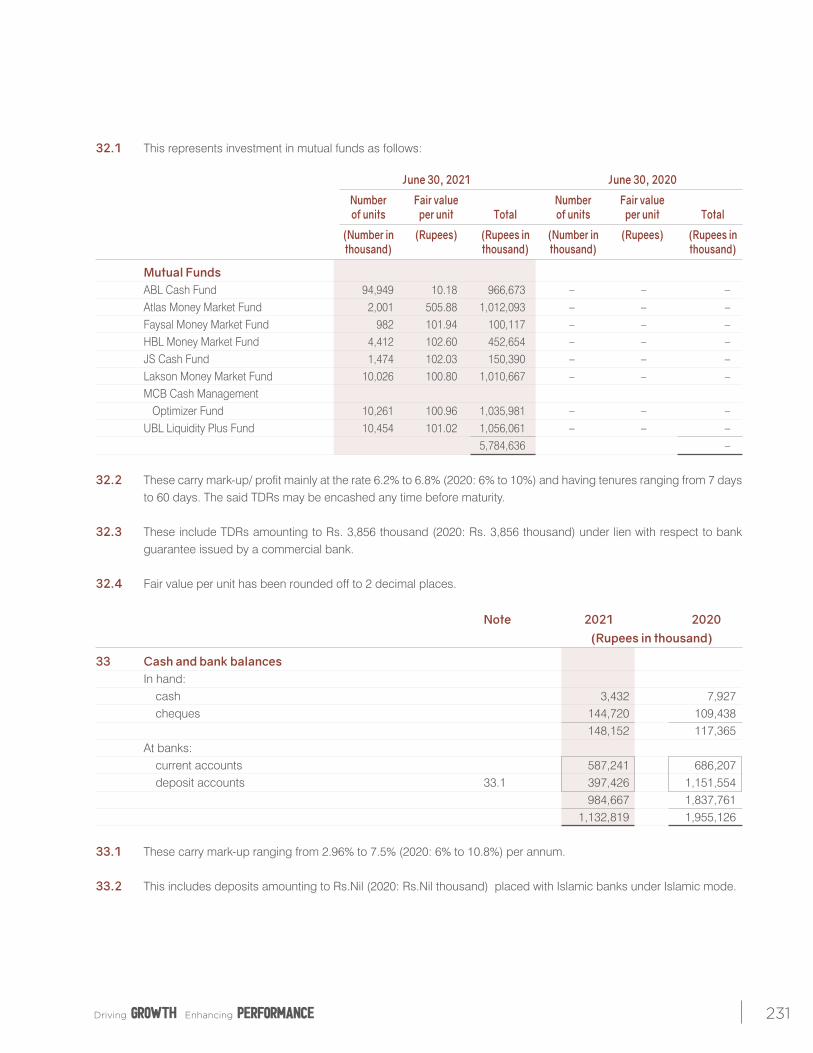
231
32.1 This represents investment in mutual funds as follows: June 30, 2021 June 30, 2020
Number Fair value Number Fair value of units per unit Total of units per unit Total
(Number in (Rupees) (Rupees in (Number in (Rupees) (Rupees in thousand) thousand) thousand) thousand)
Mutual Funds ABL Cash Fund 94,949 10.18 966,673 – – – Atlas Money Market Fund 2,001 505.88 1,012,093 – – – Faysal Money Market Fund 982 101.94 100,117 – – – HBL Money Market Fund 4,412 102.60 452,654 – – – JS Cash Fund 1,474 102.03 150,390 – – – Lakson Money Market Fund 10,026 100.80 1,010,667 – – – MCB Cash Management Optimizer Fund 10,261 100.96 1,035,981 – – – UBL Liquidity Plus Fund 10,454 101.02 1,056,061 – – – 5,784,636 –
32.2 These carry mark-up/ profit mainly at the rate 6.2% to 6.8% (2020: 6% to 10%) and having tenures ranging from 7 days to 60 days. The said TDRs may be encashed any time before maturity.
32.3 These include TDRs amounting to Rs. 3,856 thousand (2020: Rs. 3,856 thousand) under lien with respect to bank
guarantee issued by a commercial bank.
32.4 Fair value per unit has been rounded off to 2 decimal places.
Note 2021 2020 (Rupees in thousand)
33 Cash and bank balances In hand: cash 3,432 7,927 cheques 144,720 109,438 148,152 117,365 At banks: current accounts 587,241 686,207 deposit accounts 33.1 397,426 1,151,554 984,667 1,837,761 1,132,819 1,955,126 33.1 These carry mark-up ranging from 2.96% to 7.5% (2020: 6% to 10.8%) per annum. 33.2 This includes deposits amounting to Rs.Nil (2020: Rs.Nil thousand) placed with Islamic banks under Islamic mode.
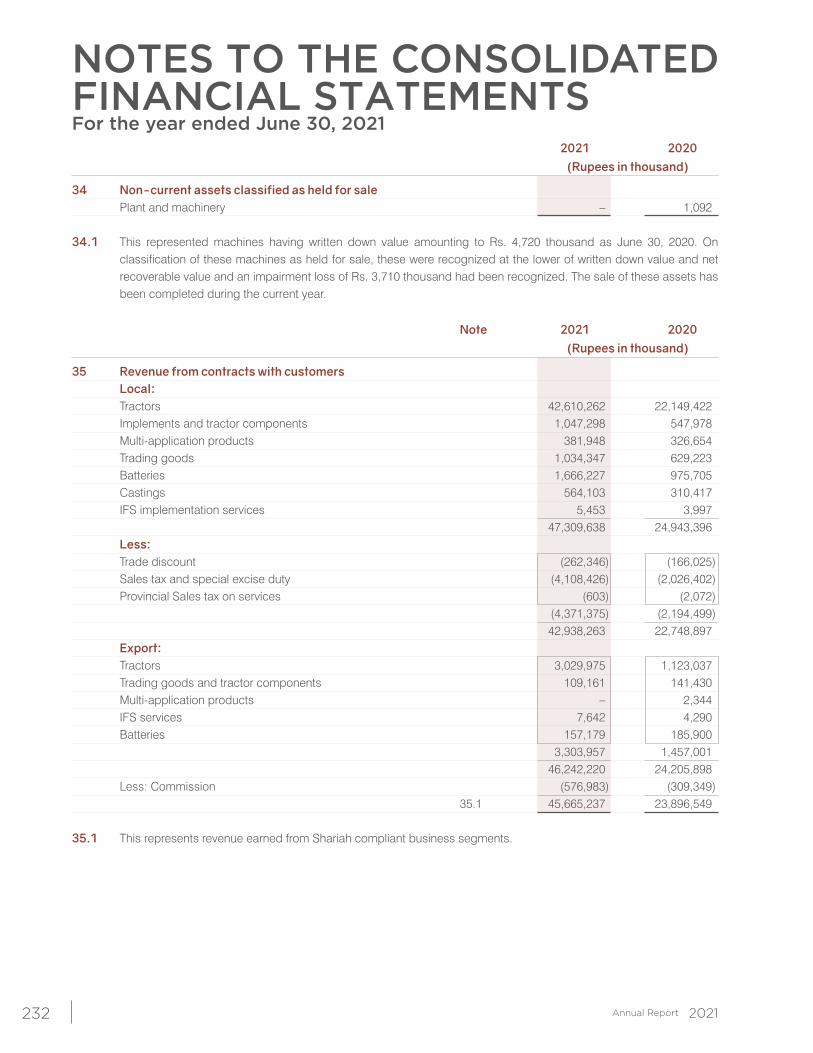
NOTES TO THE CONSOLIDATEDFINANCIAL STATEMENTSFor the year ended June 30, 2021
232
2021 2020 (Rupees in thousand)
34 Non-current assets classified as held for sale Plant and machinery – 1,092 34.1 This represented machines having written down value amounting to Rs. 4,720 thousand as June 30, 2020. On
classification of these machines as held for sale, these were recognized at the lower of written down value and net recoverable value and an impairment loss of Rs. 3,710 thousand had been recognized. The sale of these assets has been completed during the current year.
Note 2021 2020 (Rupees in thousand)
35 Revenue from contracts with customers Local: Tractors 42,610,262 22,149,422 Implements and tractor components 1,047,298 547,978 Multi-application products 381,948 326,654 Trading goods 1,034,347 629,223 Batteries 1,666,227 975,705 Castings 564,103 310,417 IFS implementation services 5,453 3,997 47,309,638 24,943,396 Less: Trade discount (262,346) (166,025) Sales tax and special excise duty (4,108,426) (2,026,402) Provincial Sales tax on services (603) (2,072) (4,371,375) (2,194,499) 42,938,263 22,748,897 Export: Tractors 3,029,975 1,123,037 Trading goods and tractor components 109,161 141,430 Multi-application products – 2,344 IFS services 7,642 4,290 Batteries 157,179 185,900 3,303,957 1,457,001 46,242,220 24,205,898 Less: Commission (576,983) (309,349) 35.1 45,665,237 23,896,549 35.1 This represents revenue earned from Shariah compliant business segments.
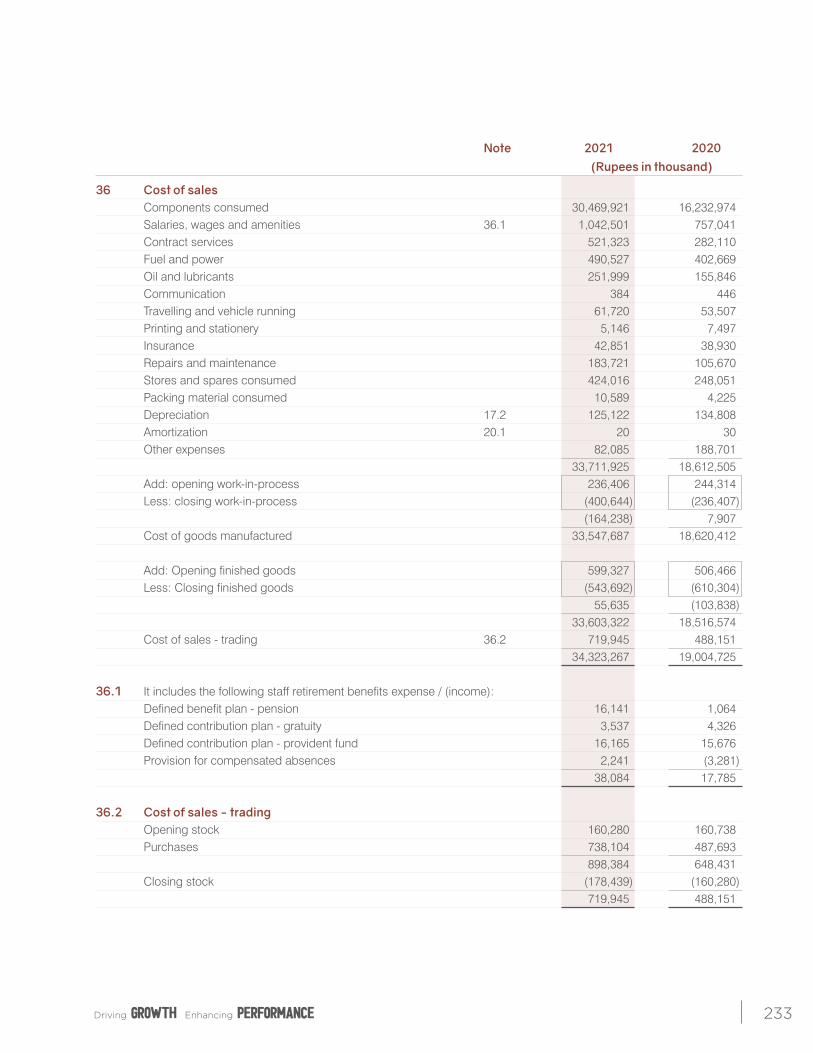
233
Note 2021 2020 (Rupees in thousand)
36 Cost of sales Components consumed 30,469,921 16,232,974 Salaries, wages and amenities 36.1 1,042,501 757,041 Contract services 521,323 282,110 Fuel and power 490,527 402,669 Oil and lubricants 251,999 155,846 Communication 384 446 Travelling and vehicle running 61,720 53,507 Printing and stationery 5,146 7,497 Insurance 42,851 38,930 Repairs and maintenance 183,721 105,670 Stores and spares consumed 424,016 248,051 Packing material consumed 10,589 4,225 Depreciation 17.2 125,122 134,808 Amortization 20.1 20 30 Other expenses 82,085 188,701 33,711,925 18,612,505 Add: opening work-in-process 236,406 244,314 Less: closing work-in-process (400,644) (236,407) (164,238) 7,907 Cost of goods manufactured 33,547,687 18,620,412
Add: Opening finished goods 599,327 506,466 Less: Closing finished goods (543,692) (610,304) 55,635 (103,838) 33,603,322 18,516,574 Cost of sales - trading 36.2 719,945 488,151 34,323,267 19,004,725 36.1 It includes the following staff retirement benefits expense / (income): Defined benefit plan - pension 16,141 1,064 Defined contribution plan - gratuity 3,537 4,326 Defined contribution plan - provident fund 16,165 15,676 Provision for compensated absences 2,241 (3,281) 38,084 17,785
36.2 Cost of sales - trading Opening stock 160,280 160,738 Purchases 738,104 487,693 898,384 648,431 Closing stock (178,439) (160,280) 719,945 488,151
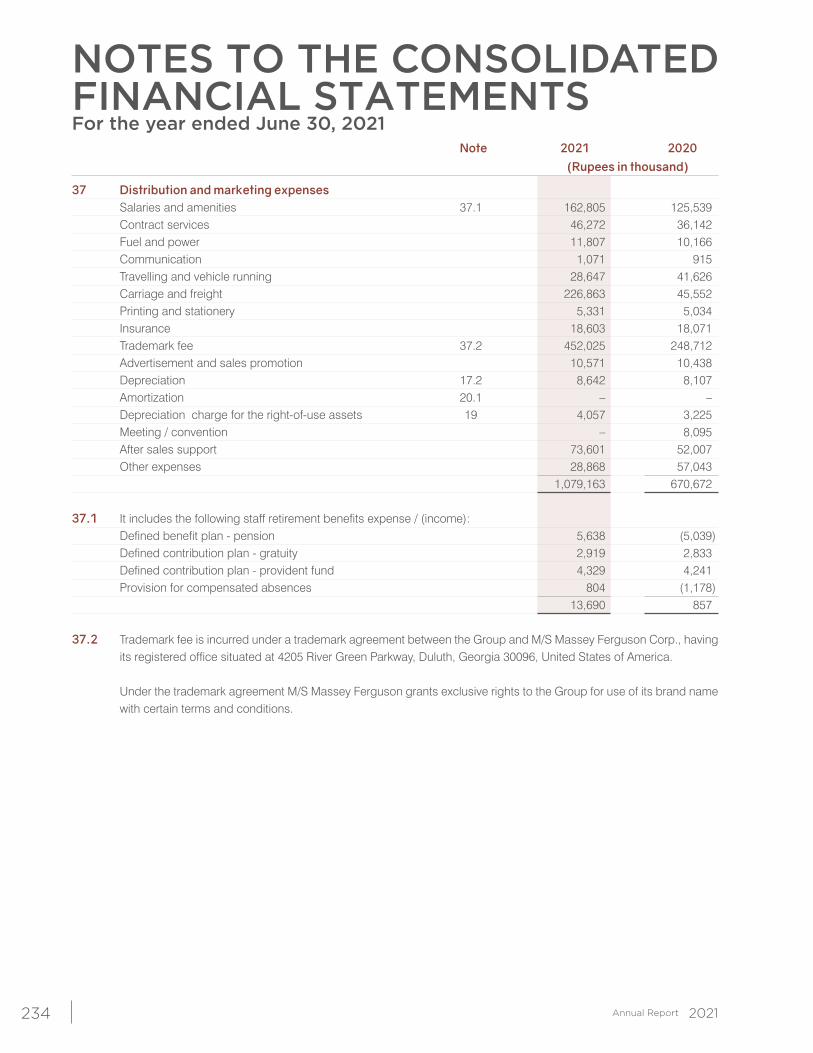
NOTES TO THE CONSOLIDATEDFINANCIAL STATEMENTSFor the year ended June 30, 2021
234
Note 2021 2020 (Rupees in thousand)
37 Distribution and marketing expenses Salaries and amenities 37.1 162,805 125,539 Contract services 46,272 36,142 Fuel and power 11,807 10,166 Communication 1,071 915 Travelling and vehicle running 28,647 41,626 Carriage and freight 226,863 45,552 Printing and stationery 5,331 5,034 Insurance 18,603 18,071 Trademark fee 37.2 452,025 248,712 Advertisement and sales promotion 10,571 10,438 Depreciation 17.2 8,642 8,107 Amortization 20.1 – – Depreciation charge for the right-of-use assets 19 4,057 3,225 Meeting / convention – 8,095 After sales support 73,601 52,007 Other expenses 28,868 57,043 1,079,163 670,672 37.1 It includes the following staff retirement benefits expense / (income): Defined benefit plan - pension 5,638 (5,039) Defined contribution plan - gratuity 2,919 2,833 Defined contribution plan - provident fund 4,329 4,241 Provision for compensated absences 804 (1,178) 13,690 857 37.2 Trademark fee is incurred under a trademark agreement between the Group and M/S Massey Ferguson Corp., having
its registered office situated at 4205 River Green Parkway, Duluth, Georgia 30096, United States of America. Under the trademark agreement M/S Massey Ferguson grants exclusive rights to the Group for use of its brand name
with certain terms and conditions.
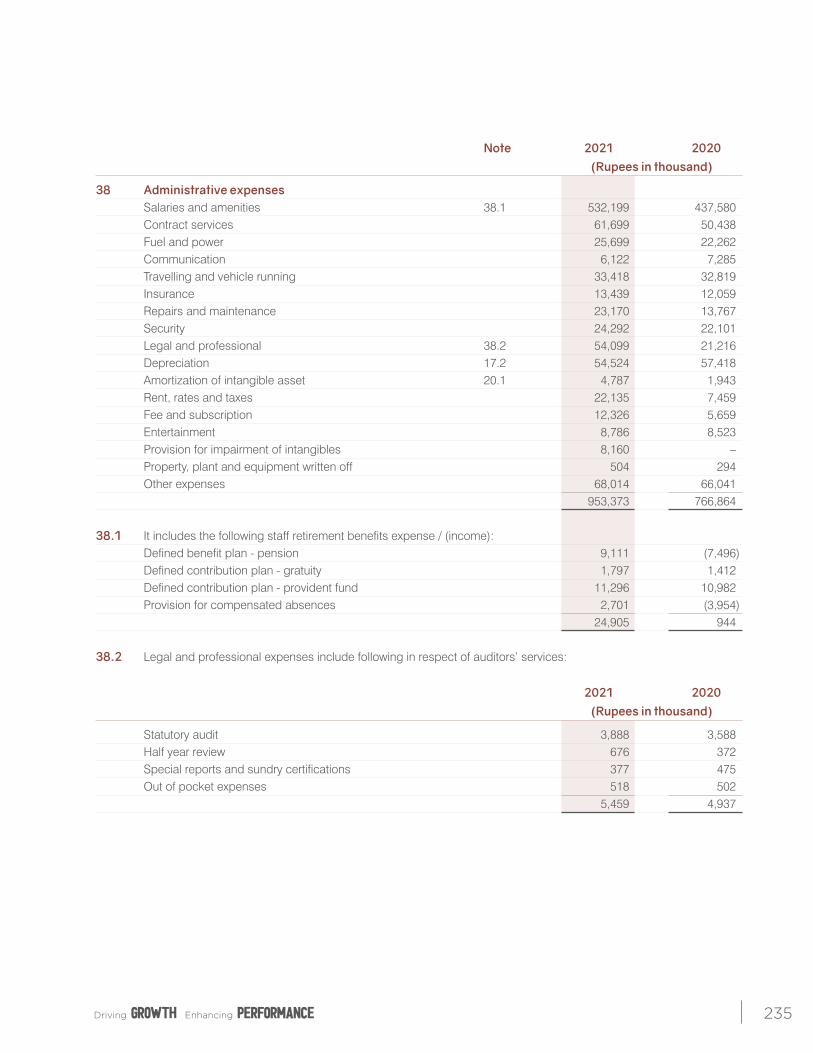
235
Note 2021 2020 (Rupees in thousand)
38 Administrative expenses Salaries and amenities 38.1 532,199 437,580 Contract services 61,699 50,438 Fuel and power 25,699 22,262 Communication 6,122 7,285 Travelling and vehicle running 33,418 32,819 Insurance 13,439 12,059 Repairs and maintenance 23,170 13,767 Security 24,292 22,101 Legal and professional 38.2 54,099 21,216 Depreciation 17.2 54,524 57,418 Amortization of intangible asset 20.1 4,787 1,943 Rent, rates and taxes 22,135 7,459 Fee and subscription 12,326 5,659 Entertainment 8,786 8,523 Provision for impairment of intangibles 8,160 – Property, plant and equipment written off 504 294 Other expenses 68,014 66,041 953,373 766,864
38.1 It includes the following staff retirement benefits expense / (income): Defined benefit plan - pension 9,111 (7,496) Defined contribution plan - gratuity 1,797 1,412 Defined contribution plan - provident fund 11,296 10,982 Provision for compensated absences 2,701 (3,954) 24,905 944
38.2 Legal and professional expenses include following in respect of auditors’ services:
2021 2020 (Rupees in thousand)
Statutory audit 3,888 3,588 Half year review 676 372 Special reports and sundry certifications 377 475 Out of pocket expenses 518 502 5,459 4,937
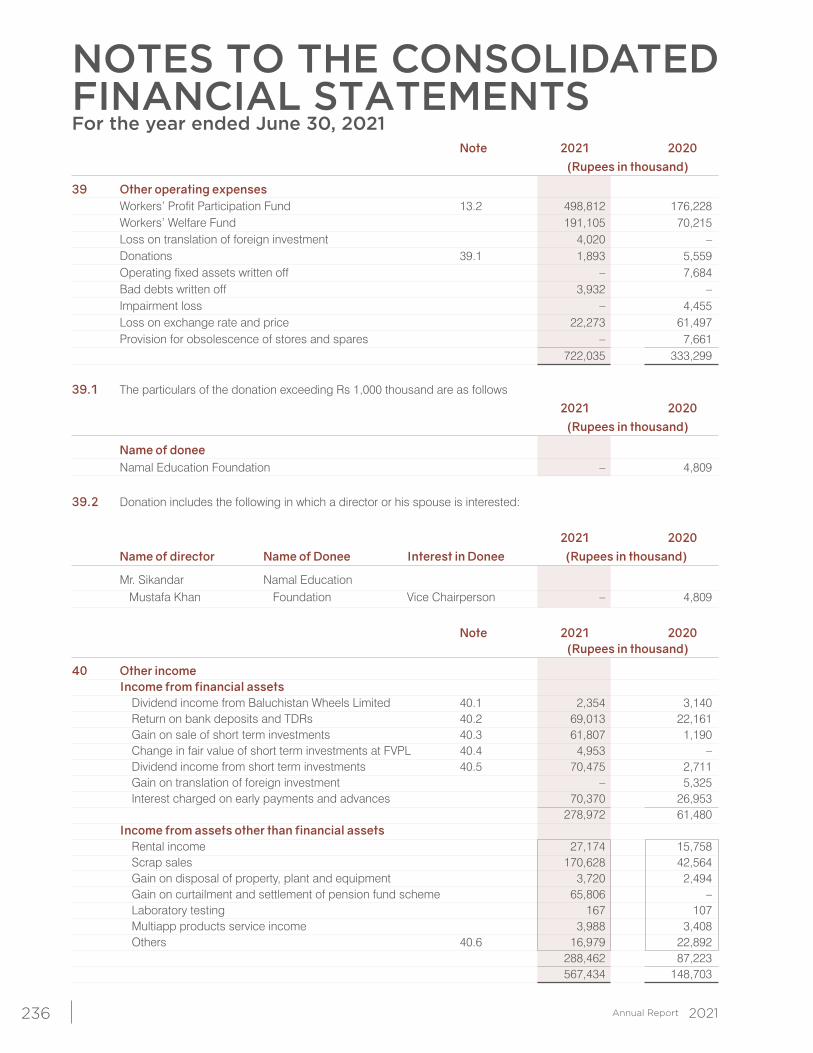
NOTES TO THE CONSOLIDATEDFINANCIAL STATEMENTSFor the year ended June 30, 2021
236
Note 2021 2020 (Rupees in thousand)
39 Other operating expenses Workers’ Profit Participation Fund 13.2 498,812 176,228 Workers’ Welfare Fund 191,105 70,215 Loss on translation of foreign investment 4,020 – Donations 39.1 1,893 5,559 Operating fixed assets written off – 7,684 Bad debts written off 3,932 – Impairment loss – 4,455 Loss on exchange rate and price 22,273 61,497 Provision for obsolescence of stores and spares – 7,661 722,035 333,299 39.1 The particulars of the donation exceeding Rs 1,000 thousand are as follows
2021 2020 (Rupees in thousand)
Name of donee Namal Education Foundation – 4,809 39.2 Donation includes the following in which a director or his spouse is interested:
2021 2020 Name of director Name of Donee Interest in Donee (Rupees in thousand)
Mr. Sikandar Namal Education Mustafa Khan Foundation Vice Chairperson – 4,809
Note 2021 2020 (Rupees in thousand)
40 Other income Income from financial assets Dividend income from Baluchistan Wheels Limited 40.1 2,354 3,140 Return on bank deposits and TDRs 40.2 69,013 22,161 Gain on sale of short term investments 40.3 61,807 1,190 Change in fair value of short term investments at FVPL 40.4 4,953 – Dividend income from short term investments 40.5 70,475 2,711 Gain on translation of foreign investment – 5,325 Interest charged on early payments and advances 70,370 26,953 278,972 61,480 Income from assets other than financial assets Rental income 27,174 15,758 Scrap sales 170,628 42,564 Gain on disposal of property, plant and equipment 3,720 2,494 Gain on curtailment and settlement of pension fund scheme 65,806 – Laboratory testing 167 107 Multiapp products service income 3,988 3,408 Others 40.6 16,979 22,892 288,462 87,223 567,434 148,703
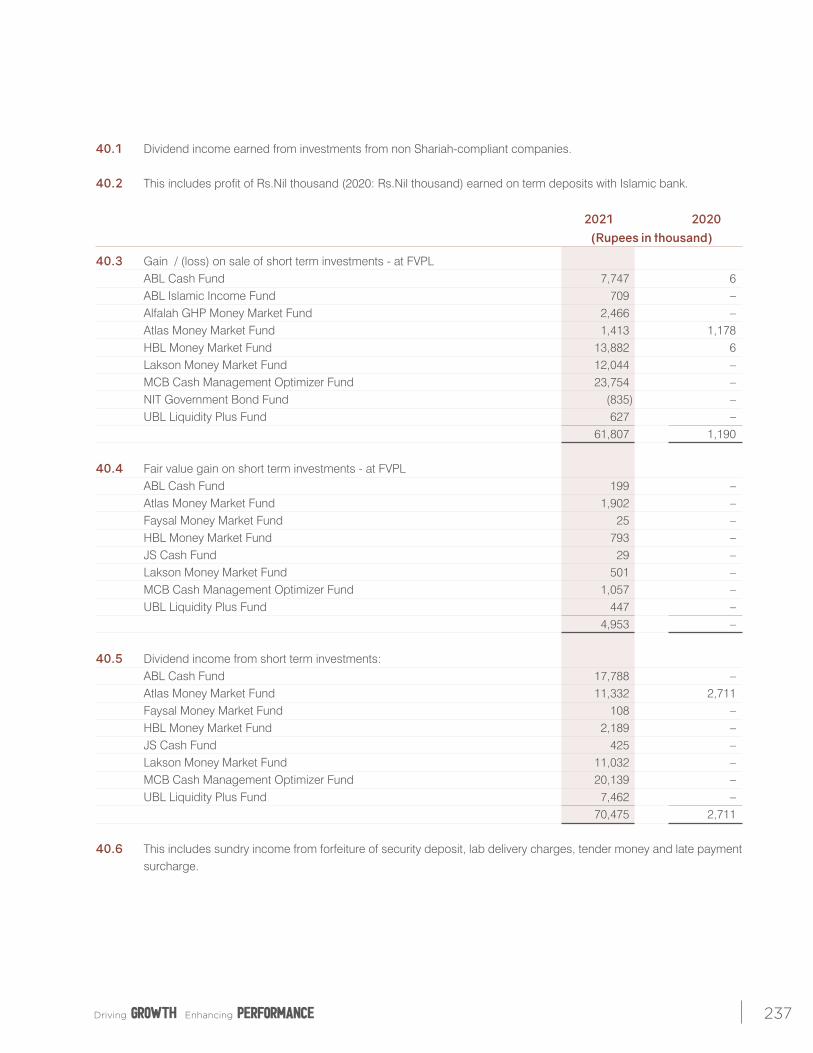
237
40.1 Dividend income earned from investments from non Shariah-compliant companies. 40.2 This includes profit of Rs.Nil thousand (2020: Rs.Nil thousand) earned on term deposits with Islamic bank.
2021 2020 (Rupees in thousand)
40.3 Gain / (loss) on sale of short term investments - at FVPL ABL Cash Fund 7,747 6 ABL Islamic Income Fund 709 – Alfalah GHP Money Market Fund 2,466 – Atlas Money Market Fund 1,413 1,178 HBL Money Market Fund 13,882 6 Lakson Money Market Fund 12,044 – MCB Cash Management Optimizer Fund 23,754 – NIT Government Bond Fund (835) – UBL Liquidity Plus Fund 627 – 61,807 1,190 40.4 Fair value gain on short term investments - at FVPL ABL Cash Fund 199 – Atlas Money Market Fund 1,902 – Faysal Money Market Fund 25 – HBL Money Market Fund 793 – JS Cash Fund 29 – Lakson Money Market Fund 501 – MCB Cash Management Optimizer Fund 1,057 – UBL Liquidity Plus Fund 447 – 4,953 – 40.5 Dividend income from short term investments: ABL Cash Fund 17,788 – Atlas Money Market Fund 11,332 2,711 Faysal Money Market Fund 108 – HBL Money Market Fund 2,189 – JS Cash Fund 425 – Lakson Money Market Fund 11,032 – MCB Cash Management Optimizer Fund 20,139 – UBL Liquidity Plus Fund 7,462 – 70,475 2,711 40.6 This includes sundry income from forfeiture of security deposit, lab delivery charges, tender money and late payment
surcharge.
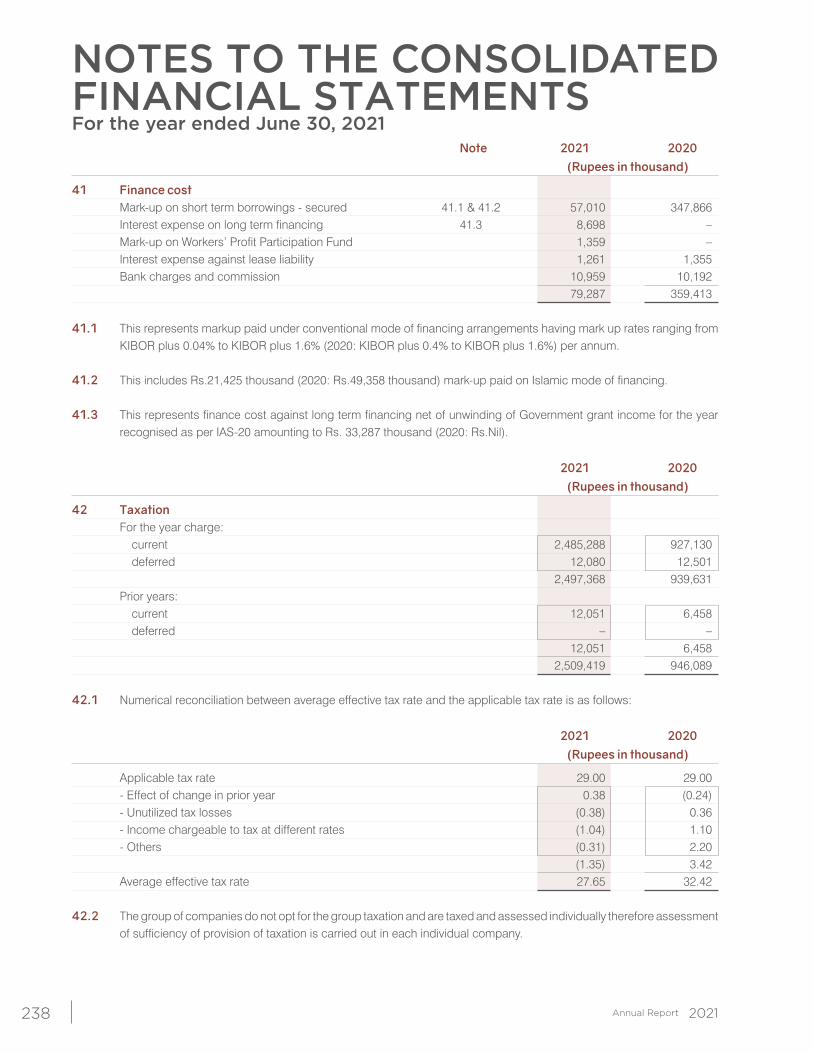
NOTES TO THE CONSOLIDATEDFINANCIAL STATEMENTSFor the year ended June 30, 2021
238
Note 2021 2020 (Rupees in thousand)
41 Finance cost Mark-up on short term borrowings - secured 41.1 & 41.2 57,010 347,866 Interest expense on long term financing 41.3 8,698 – Mark-up on Workers’ Profit Participation Fund 1,359 – Interest expense against lease liability 1,261 1,355 Bank charges and commission 10,959 10,192 79,287 359,413 41.1 This represents markup paid under conventional mode of financing arrangements having mark up rates ranging from
KIBOR plus 0.04% to KIBOR plus 1.6% (2020: KIBOR plus 0.4% to KIBOR plus 1.6%) per annum. 41.2 This includes Rs.21,425 thousand (2020: Rs.49,358 thousand) mark-up paid on Islamic mode of financing. 41.3 This represents finance cost against long term financing net of unwinding of Government grant income for the year
recognised as per IAS-20 amounting to Rs. 33,287 thousand (2020: Rs.Nil).
2021 2020 (Rupees in thousand)
42 Taxation For the year charge: current 2,485,288 927,130 deferred 12,080 12,501 2,497,368 939,631 Prior years: current 12,051 6,458 deferred – – 12,051 6,458 2,509,419 946,089 42.1 Numerical reconciliation between average effective tax rate and the applicable tax rate is as follows:
2021 2020 (Rupees in thousand)
Applicable tax rate 29.00 29.00 - Effect of change in prior year 0.38 (0.24) - Unutilized tax losses (0.38) 0.36 - Income chargeable to tax at different rates (1.04) 1.10 - Others (0.31) 2.20 (1.35) 3.42 Average effective tax rate 27.65 32.42 42.2 The group of companies do not opt for the group taxation and are taxed and assessed individually therefore assessment
of sufficiency of provision of taxation is carried out in each individual company.
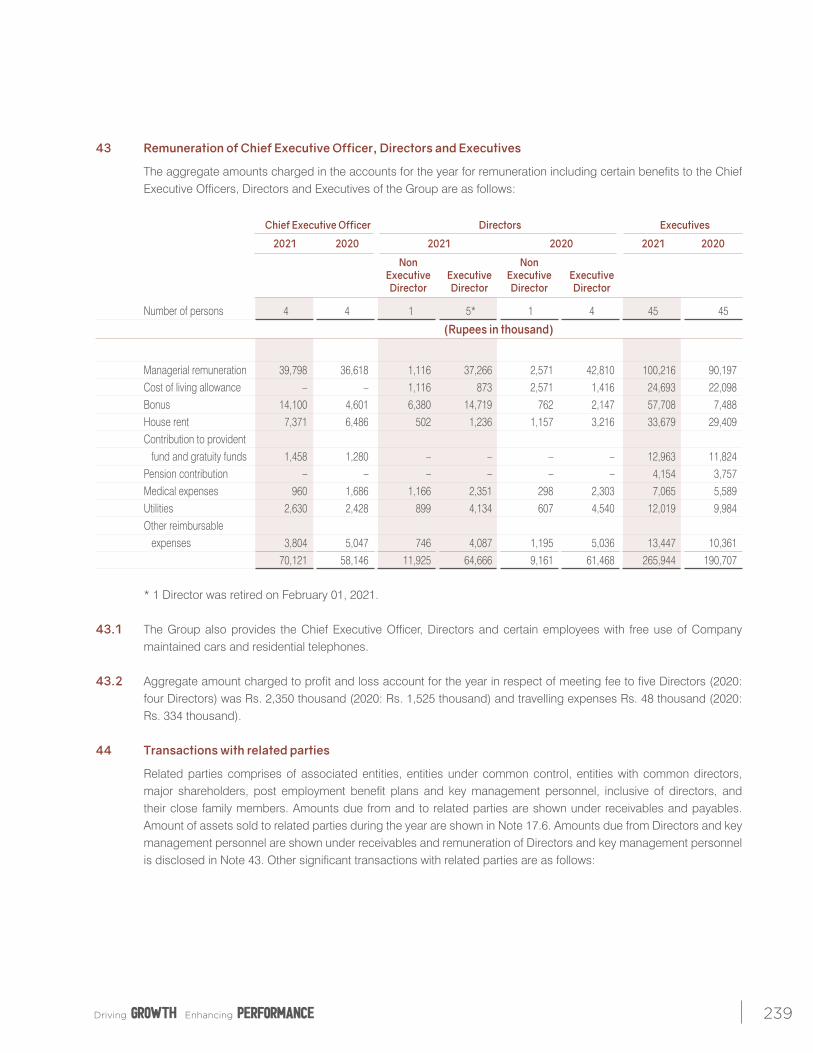
239
43 Remuneration of Chief Executive Officer, Directors and Executives
The aggregate amounts charged in the accounts for the year for remuneration including certain benefits to the Chief Executive Officers, Directors and Executives of the Group are as follows:
Chief Executive Officer Directors Executives
2021 2020 2021 2020 2021 2020
Non Non Executive Executive Executive Executive Director Director Director Director
Number of persons 4 4 1 5* 1 4 45 45
(Rupees in thousand)
Managerial remuneration 39,798 36,618 1,116 37,266 2,571 42,810 100,216 90,197 Cost of living allowance – – 1,116 873 2,571 1,416 24,693 22,098 Bonus 14,100 4,601 6,380 14,719 762 2,147 57,708 7,488 House rent 7,371 6,486 502 1,236 1,157 3,216 33,679 29,409 Contribution to provident fund and gratuity funds 1,458 1,280 – – – – 12,963 11,824 Pension contribution – – – – – – 4,154 3,757 Medical expenses 960 1,686 1,166 2,351 298 2,303 7,065 5,589 Utilities 2,630 2,428 899 4,134 607 4,540 12,019 9,984 Other reimbursable expenses 3,804 5,047 746 4,087 1,195 5,036 13,447 10,361 70,121 58,146 11,925 64,666 9,161 61,468 265,944 190,707 * 1 Director was retired on February 01, 2021. 43.1 The Group also provides the Chief Executive Officer, Directors and certain employees with free use of Company
maintained cars and residential telephones. 43.2 Aggregate amount charged to profit and loss account for the year in respect of meeting fee to five Directors (2020:
four Directors) was Rs. 2,350 thousand (2020: Rs. 1,525 thousand) and travelling expenses Rs. 48 thousand (2020: Rs. 334 thousand).
44 Transactions with related parties
Related parties comprises of associated entities, entities under common control, entities with common directors, major shareholders, post employment benefit plans and key management personnel, inclusive of directors, and their close family members. Amounts due from and to related parties are shown under receivables and payables. Amount of assets sold to related parties during the year are shown in Note 17.6. Amounts due from Directors and key management personnel are shown under receivables and remuneration of Directors and key management personnel is disclosed in Note 43. Other significant transactions with related parties are as follows:
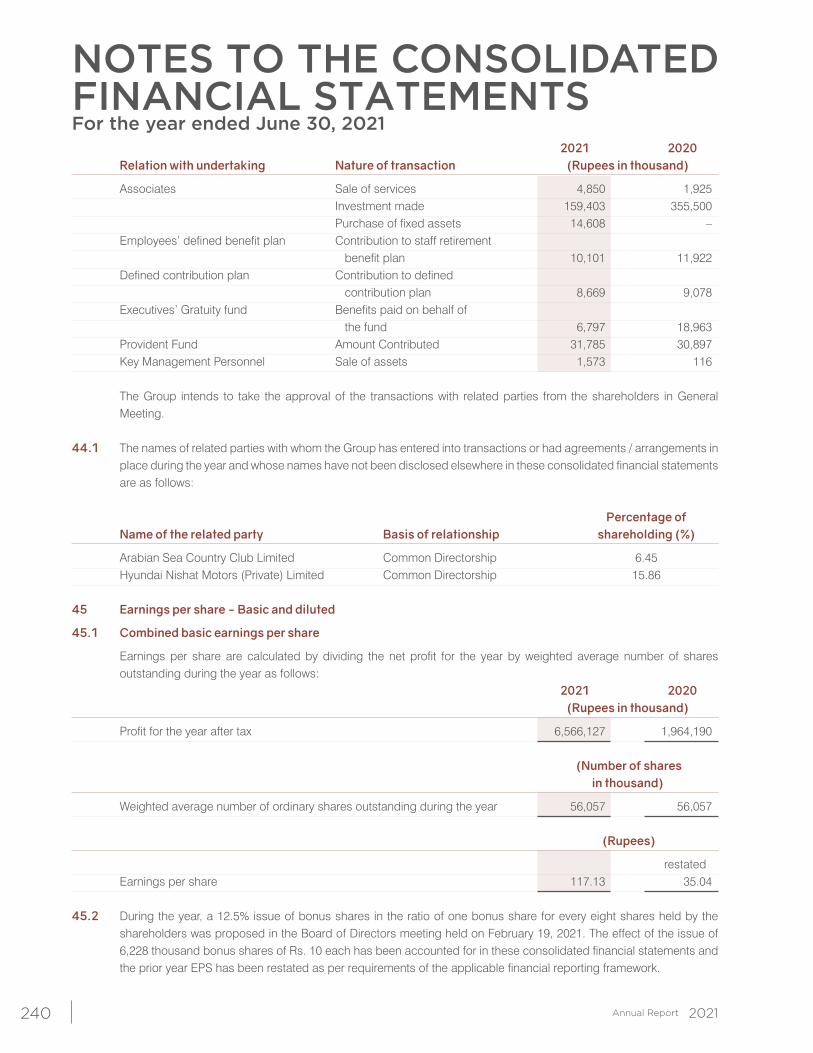
NOTES TO THE CONSOLIDATEDFINANCIAL STATEMENTSFor the year ended June 30, 2021
240
2021 2020 Relation with undertaking Nature of transaction (Rupees in thousand)
Associates Sale of services 4,850 1,925 Investment made 159,403 355,500 Purchase of fixed assets 14,608 – Employees’ defined benefit plan Contribution to staff retirement benefit plan 10,101 11,922 Defined contribution plan Contribution to defined contribution plan 8,669 9,078 Executives’ Gratuity fund Benefits paid on behalf of the fund 6,797 18,963 Provident Fund Amount Contributed 31,785 30,897 Key Management Personnel Sale of assets 1,573 116 The Group intends to take the approval of the transactions with related parties from the shareholders in General
Meeting. 44.1 The names of related parties with whom the Group has entered into transactions or had agreements / arrangements in
place during the year and whose names have not been disclosed elsewhere in these consolidated financial statements are as follows:
Percentage of Name of the related party Basis of relationship shareholding (%)
Arabian Sea Country Club Limited Common Directorship 6.45 Hyundai Nishat Motors (Private) Limited Common Directorship 15.86
45 Earnings per share - Basic and diluted
45.1 Combined basic earnings per share
Earnings per share are calculated by dividing the net profit for the year by weighted average number of shares outstanding during the year as follows:
2021 2020 (Rupees in thousand)
Profit for the year after tax 6,566,127 1,964,190 (Number of shares in thousand)
Weighted average number of ordinary shares outstanding during the year 56,057 56,057 (Rupees)
restated Earnings per share 117.13 35.04 45.2 During the year, a 12.5% issue of bonus shares in the ratio of one bonus share for every eight shares held by the
shareholders was proposed in the Board of Directors meeting held on February 19, 2021. The effect of the issue of 6,228 thousand bonus shares of Rs. 10 each has been accounted for in these consolidated financial statements and the prior year EPS has been restated as per requirements of the applicable financial reporting framework.
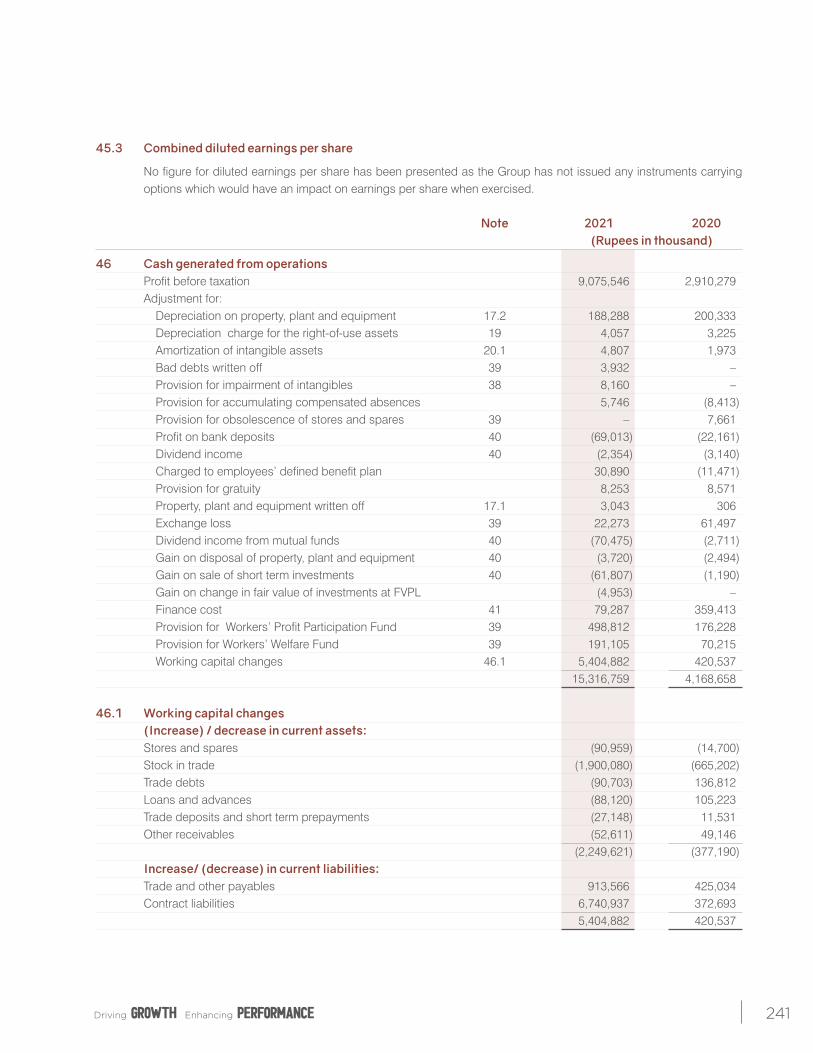
241
45.3 Combined diluted earnings per share
No figure for diluted earnings per share has been presented as the Group has not issued any instruments carrying options which would have an impact on earnings per share when exercised.
Note 2021 2020 (Rupees in thousand)
46 Cash generated from operations Profit before taxation 9,075,546 2,910,279 Adjustment for: Depreciation on property, plant and equipment 17.2 188,288 200,333 Depreciation charge for the right-of-use assets 19 4,057 3,225 Amortization of intangible assets 20.1 4,807 1,973 Bad debts written off 39 3,932 – Provision for impairment of intangibles 38 8,160 – Provision for accumulating compensated absences 5,746 (8,413) Provision for obsolescence of stores and spares 39 – 7,661 Profit on bank deposits 40 (69,013) (22,161) Dividend income 40 (2,354) (3,140) Charged to employees’ defined benefit plan 30,890 (11,471) Provision for gratuity 8,253 8,571 Property, plant and equipment written off 17.1 3,043 306 Exchange loss 39 22,273 61,497 Dividend income from mutual funds 40 (70,475) (2,711) Gain on disposal of property, plant and equipment 40 (3,720) (2,494) Gain on sale of short term investments 40 (61,807) (1,190) Gain on change in fair value of investments at FVPL (4,953) – Finance cost 41 79,287 359,413 Provision for Workers’ Profit Participation Fund 39 498,812 176,228 Provision for Workers’ Welfare Fund 39 191,105 70,215 Working capital changes 46.1 5,404,882 420,537 15,316,759 4,168,658
46.1 Working capital changes (Increase) / decrease in current assets: Stores and spares (90,959) (14,700) Stock in trade (1,900,080) (665,202) Trade debts (90,703) 136,812 Loans and advances (88,120) 105,223 Trade deposits and short term prepayments (27,148) 11,531 Other receivables (52,611) 49,146 (2,249,621) (377,190) Increase/ (decrease) in current liabilities: Trade and other payables 913,566 425,034 Contract liabilities 6,740,937 372,693 5,404,882 420,537
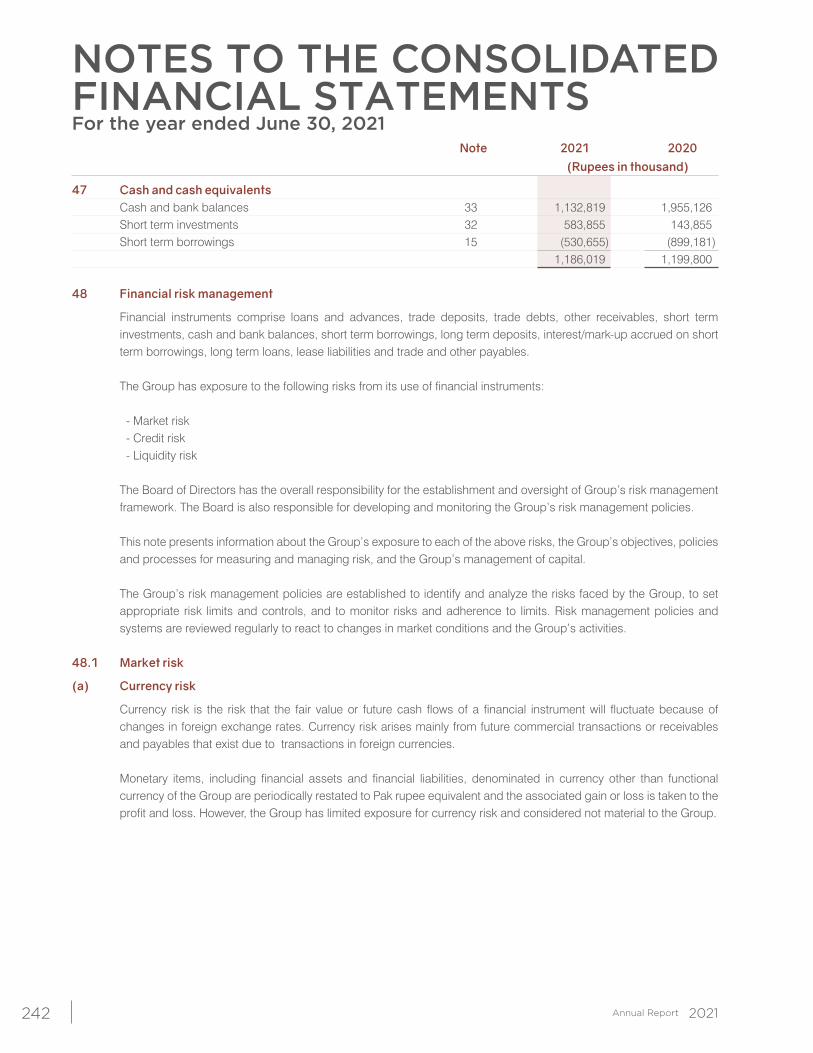
NOTES TO THE CONSOLIDATEDFINANCIAL STATEMENTSFor the year ended June 30, 2021
242
Note 2021 2020 (Rupees in thousand)
47 Cash and cash equivalents Cash and bank balances 33 1,132,819 1,955,126 Short term investments 32 583,855 143,855 Short term borrowings 15 (530,655) (899,181) 1,186,019 1,199,800 48 Financial risk management
Financial instruments comprise loans and advances, trade deposits, trade debts, other receivables, short term investments, cash and bank balances, short term borrowings, long term deposits, interest/mark-up accrued on short term borrowings, long term loans, lease liabilities and trade and other payables.
The Group has exposure to the following risks from its use of financial instruments:
- Market risk - Credit risk - Liquidity risk The Board of Directors has the overall responsibility for the establishment and oversight of Group’s risk management
framework. The Board is also responsible for developing and monitoring the Group’s risk management policies. This note presents information about the Group’s exposure to each of the above risks, the Group’s objectives, policies
and processes for measuring and managing risk, and the Group’s management of capital. The Group’s risk management policies are established to identify and analyze the risks faced by the Group, to set
appropriate risk limits and controls, and to monitor risks and adherence to limits. Risk management policies and systems are reviewed regularly to react to changes in market conditions and the Group’s activities.
48.1 Market risk
(a) Currency risk
Currency risk is the risk that the fair value or future cash flows of a financial instrument will fluctuate because of changes in foreign exchange rates. Currency risk arises mainly from future commercial transactions or receivables and payables that exist due to transactions in foreign currencies.
Monetary items, including financial assets and financial liabilities, denominated in currency other than functional
currency of the Group are periodically restated to Pak rupee equivalent and the associated gain or loss is taken to the profit and loss. However, the Group has limited exposure for currency risk and considered not material to the Group.
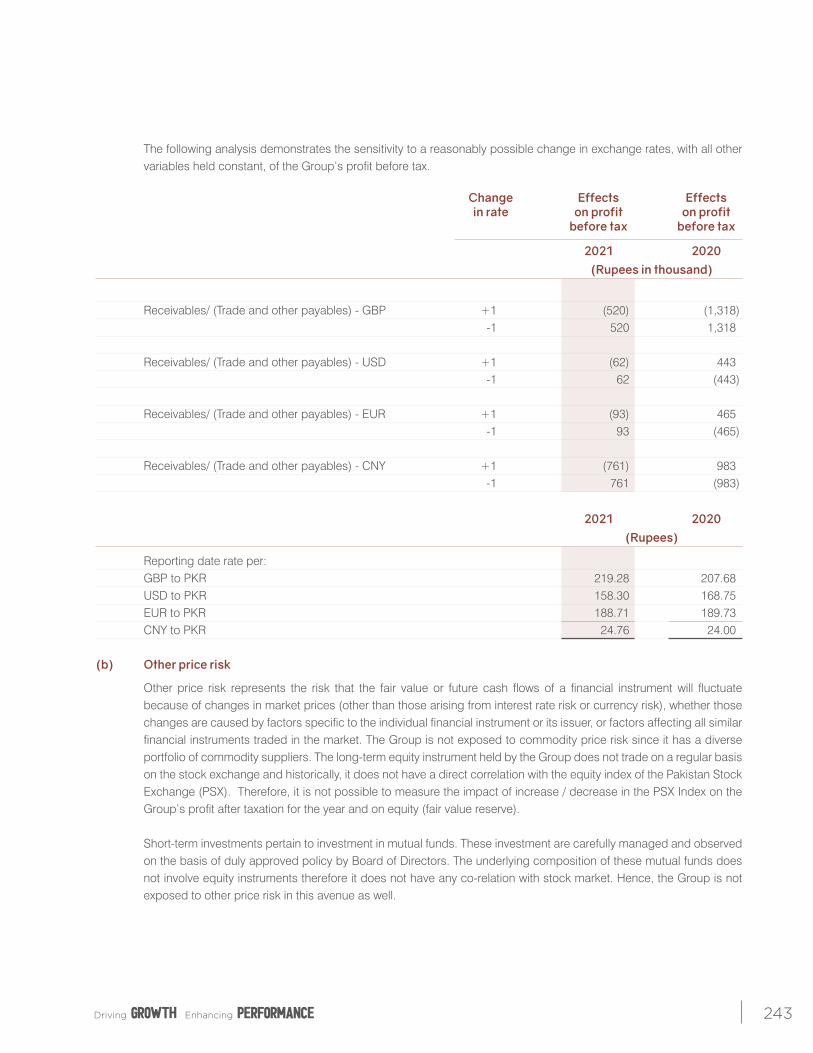
243
The following analysis demonstrates the sensitivity to a reasonably possible change in exchange rates, with all other variables held constant, of the Group’s profit before tax.
Change Effects Effects in rate on profit on profit before tax before tax
2021 2020 (Rupees in thousand)
Receivables/ (Trade and other payables) - GBP +1 (520) (1,318) -1 520 1,318 Receivables/ (Trade and other payables) - USD +1 (62) 443 -1 62 (443) Receivables/ (Trade and other payables) - EUR +1 (93) 465 -1 93 (465) Receivables/ (Trade and other payables) - CNY +1 (761) 983 -1 761 (983)
2021 2020 (Rupees)
Reporting date rate per: GBP to PKR 219.28 207.68 USD to PKR 158.30 168.75 EUR to PKR 188.71 189.73 CNY to PKR 24.76 24.00 (b) Other price risk
Other price risk represents the risk that the fair value or future cash flows of a financial instrument will fluctuate because of changes in market prices (other than those arising from interest rate risk or currency risk), whether those changes are caused by factors specific to the individual financial instrument or its issuer, or factors affecting all similar financial instruments traded in the market. The Group is not exposed to commodity price risk since it has a diverse portfolio of commodity suppliers. The long-term equity instrument held by the Group does not trade on a regular basis on the stock exchange and historically, it does not have a direct correlation with the equity index of the Pakistan Stock Exchange (PSX). Therefore, it is not possible to measure the impact of increase / decrease in the PSX Index on the Group’s profit after taxation for the year and on equity (fair value reserve).
Short-term investments pertain to investment in mutual funds. These investment are carefully managed and observed
on the basis of duly approved policy by Board of Directors. The underlying composition of these mutual funds does not involve equity instruments therefore it does not have any co-relation with stock market. Hence, the Group is not exposed to other price risk in this avenue as well.
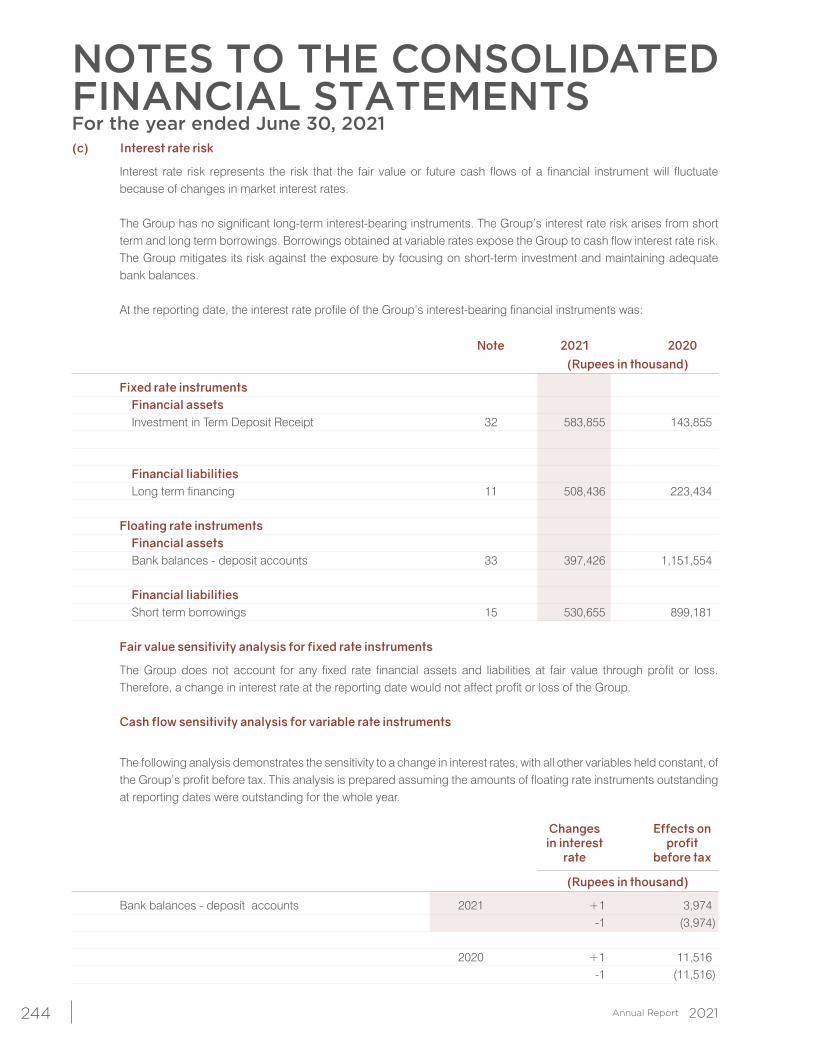
NOTES TO THE CONSOLIDATEDFINANCIAL STATEMENTSFor the year ended June 30, 2021
244
(c) Interest rate risk
Interest rate risk represents the risk that the fair value or future cash flows of a financial instrument will fluctuate because of changes in market interest rates.
The Group has no significant long-term interest-bearing instruments. The Group’s interest rate risk arises from short
term and long term borrowings. Borrowings obtained at variable rates expose the Group to cash flow interest rate risk. The Group mitigates its risk against the exposure by focusing on short-term investment and maintaining adequate bank balances.
At the reporting date, the interest rate profile of the Group’s interest-bearing financial instruments was:
Note 2021 2020 (Rupees in thousand)
Fixed rate instruments Financial assets Investment in Term Deposit Receipt 32 583,855 143,855 Financial liabilities Long term financing 11 508,436 223,434 Floating rate instruments Financial assets Bank balances - deposit accounts 33 397,426 1,151,554 Financial liabilities Short term borrowings 15 530,655 899,181 Fair value sensitivity analysis for fixed rate instruments
The Group does not account for any fixed rate financial assets and liabilities at fair value through profit or loss. Therefore, a change in interest rate at the reporting date would not affect profit or loss of the Group.
Cash flow sensitivity analysis for variable rate instruments
The following analysis demonstrates the sensitivity to a change in interest rates, with all other variables held constant, of the Group’s profit before tax. This analysis is prepared assuming the amounts of floating rate instruments outstanding at reporting dates were outstanding for the whole year.
Changes Effects on in interest profit rate before tax
(Rupees in thousand)
Bank balances - deposit accounts 2021 +1 3,974 -1 (3,974) 2020 +1 11,516 -1 (11,516)
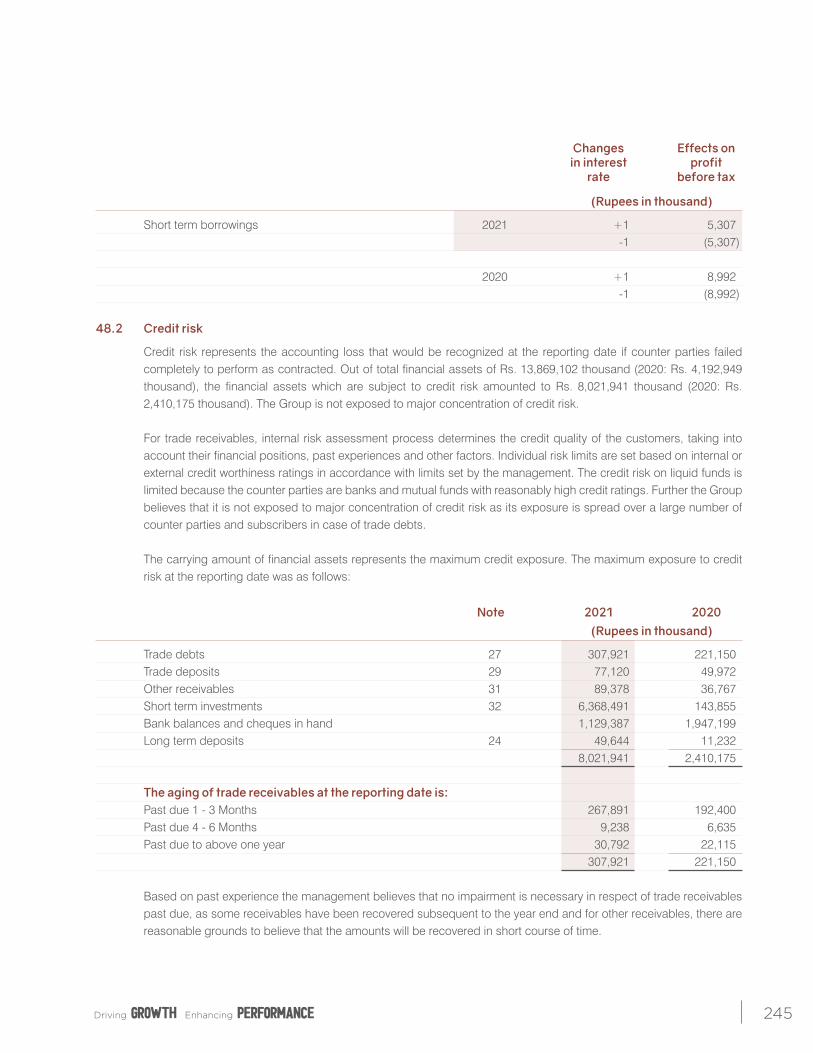
245
Changes Effects on in interest profit rate before tax
(Rupees in thousand)
Short term borrowings 2021 +1 5,307 -1 (5,307) 2020 +1 8,992 -1 (8,992) 48.2 Credit risk
Credit risk represents the accounting loss that would be recognized at the reporting date if counter parties failed completely to perform as contracted. Out of total financial assets of Rs. 13,869,102 thousand (2020: Rs. 4,192,949 thousand), the financial assets which are subject to credit risk amounted to Rs. 8,021,941 thousand (2020: Rs. 2,410,175 thousand). The Group is not exposed to major concentration of credit risk.
For trade receivables, internal risk assessment process determines the credit quality of the customers, taking into
account their financial positions, past experiences and other factors. Individual risk limits are set based on internal or external credit worthiness ratings in accordance with limits set by the management. The credit risk on liquid funds is limited because the counter parties are banks and mutual funds with reasonably high credit ratings. Further the Group believes that it is not exposed to major concentration of credit risk as its exposure is spread over a large number of counter parties and subscribers in case of trade debts.
The carrying amount of financial assets represents the maximum credit exposure. The maximum exposure to credit
risk at the reporting date was as follows:
Note 2021 2020 (Rupees in thousand)
Trade debts 27 307,921 221,150 Trade deposits 29 77,120 49,972 Other receivables 31 89,378 36,767 Short term investments 32 6,368,491 143,855 Bank balances and cheques in hand 1,129,387 1,947,199 Long term deposits 24 49,644 11,232 8,021,941 2,410,175 The aging of trade receivables at the reporting date is: Past due 1 - 3 Months 267,891 192,400 Past due 4 - 6 Months 9,238 6,635 Past due to above one year 30,792 22,115 307,921 221,150
Based on past experience the management believes that no impairment is necessary in respect of trade receivables past due, as some receivables have been recovered subsequent to the year end and for other receivables, there are reasonable grounds to believe that the amounts will be recovered in short course of time.
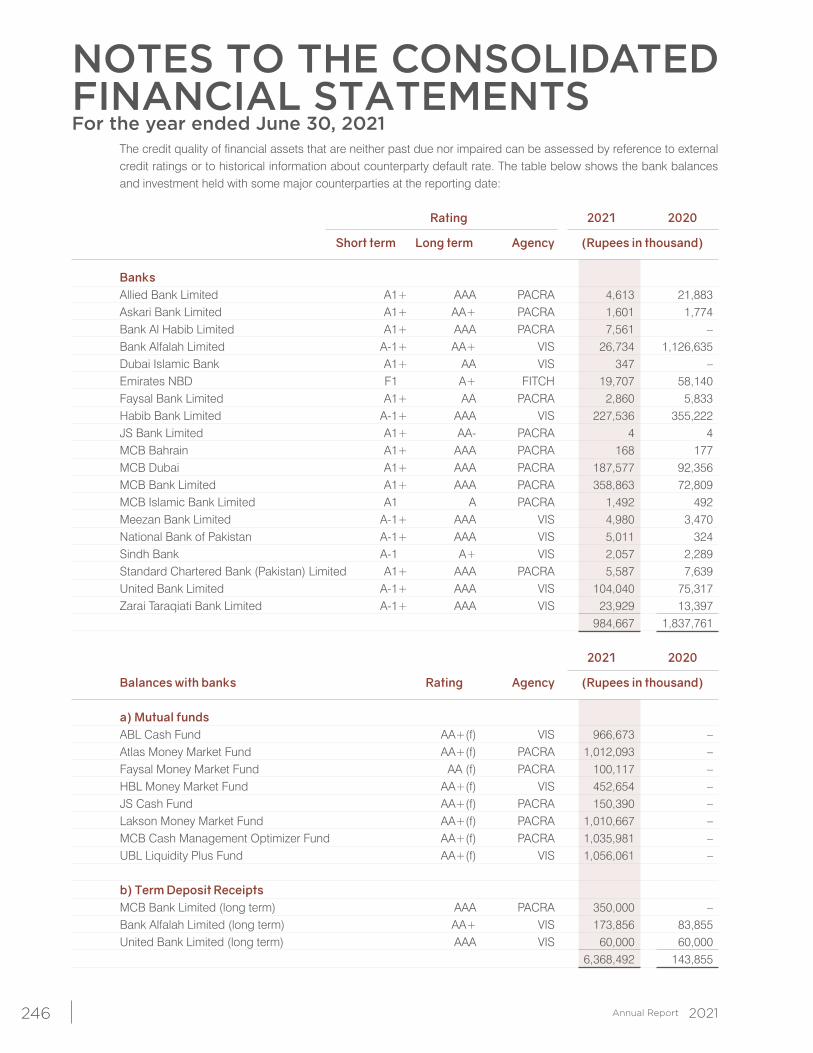
NOTES TO THE CONSOLIDATEDFINANCIAL STATEMENTSFor the year ended June 30, 2021
246
The credit quality of financial assets that are neither past due nor impaired can be assessed by reference to external credit ratings or to historical information about counterparty default rate. The table below shows the bank balances and investment held with some major counterparties at the reporting date:
Rating 2021 2020
Short term Long term Agency (Rupees in thousand)
Banks Allied Bank Limited A1+ AAA PACRA 4,613 21,883 Askari Bank Limited A1+ AA+ PACRA 1,601 1,774 Bank Al Habib Limited A1+ AAA PACRA 7,561 – Bank Alfalah Limited A-1+ AA+ VIS 26,734 1,126,635 Dubai Islamic Bank A1+ AA VIS 347 – Emirates NBD F1 A+ FITCH 19,707 58,140 Faysal Bank Limited A1+ AA PACRA 2,860 5,833 Habib Bank Limited A-1+ AAA VIS 227,536 355,222 JS Bank Limited A1+ AA- PACRA 4 4 MCB Bahrain A1+ AAA PACRA 168 177 MCB Dubai A1+ AAA PACRA 187,577 92,356 MCB Bank Limited A1+ AAA PACRA 358,863 72,809 MCB Islamic Bank Limited A1 A PACRA 1,492 492 Meezan Bank Limited A-1+ AAA VIS 4,980 3,470 National Bank of Pakistan A-1+ AAA VIS 5,011 324 Sindh Bank A-1 A+ VIS 2,057 2,289 Standard Chartered Bank (Pakistan) Limited A1+ AAA PACRA 5,587 7,639 United Bank Limited A-1+ AAA VIS 104,040 75,317 Zarai Taraqiati Bank Limited A-1+ AAA VIS 23,929 13,397 984,667 1,837,761
2021 2020
Balances with banks Rating Agency (Rupees in thousand)
a) Mutual funds ABL Cash Fund AA+(f) VIS 966,673 – Atlas Money Market Fund AA+(f) PACRA 1,012,093 – Faysal Money Market Fund AA (f) PACRA 100,117 – HBL Money Market Fund AA+(f) VIS 452,654 – JS Cash Fund AA+(f) PACRA 150,390 – Lakson Money Market Fund AA+(f) PACRA 1,010,667 – MCB Cash Management Optimizer Fund AA+(f) PACRA 1,035,981 – UBL Liquidity Plus Fund AA+(f) VIS 1,056,061 –
b) Term Deposit Receipts MCB Bank Limited (long term) AAA PACRA 350,000 – Bank Alfalah Limited (long term) AA+ VIS 173,856 83,855 United Bank Limited (long term) AAA VIS 60,000 60,000 6,368,492 143,855
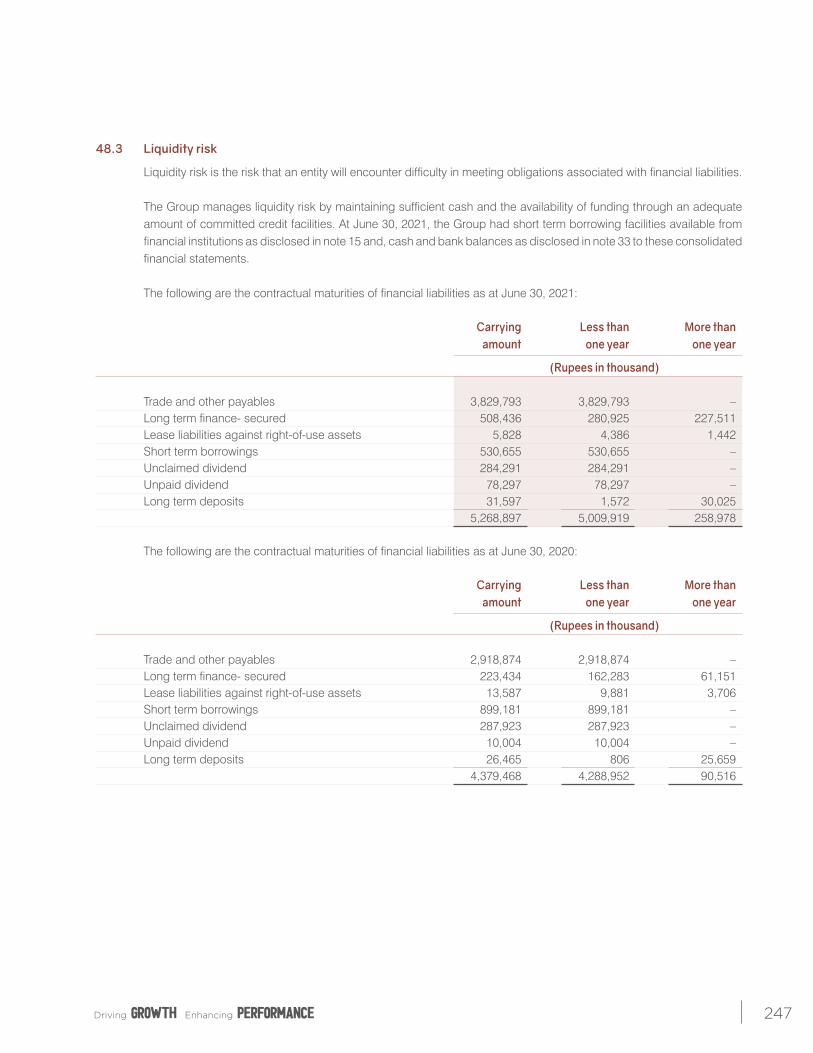
247
48.3 Liquidity risk
Liquidity risk is the risk that an entity will encounter difficulty in meeting obligations associated with financial liabilities. The Group manages liquidity risk by maintaining sufficient cash and the availability of funding through an adequate
amount of committed credit facilities. At June 30, 2021, the Group had short term borrowing facilities available from financial institutions as disclosed in note 15 and, cash and bank balances as disclosed in note 33 to these consolidated financial statements.
The following are the contractual maturities of financial liabilities as at June 30, 2021: Carrying Less than More than amount one year one year
(Rupees in thousand) Trade and other payables 3,829,793 3,829,793 – Long term finance- secured 508,436 280,925 227,511 Lease liabilities against right-of-use assets 5,828 4,386 1,442 Short term borrowings 530,655 530,655 – Unclaimed dividend 284,291 284,291 – Unpaid dividend 78,297 78,297 – Long term deposits 31,597 1,572 30,025 5,268,897 5,009,919 258,978 The following are the contractual maturities of financial liabilities as at June 30, 2020: Carrying Less than More than amount one year one year
(Rupees in thousand) Trade and other payables 2,918,874 2,918,874 – Long term finance- secured 223,434 162,283 61,151 Lease liabilities against right-of-use assets 13,587 9,881 3,706 Short term borrowings 899,181 899,181 – Unclaimed dividend 287,923 287,923 – Unpaid dividend 10,004 10,004 – Long term deposits 26,465 806 25,659 4,379,468 4,288,952 90,516
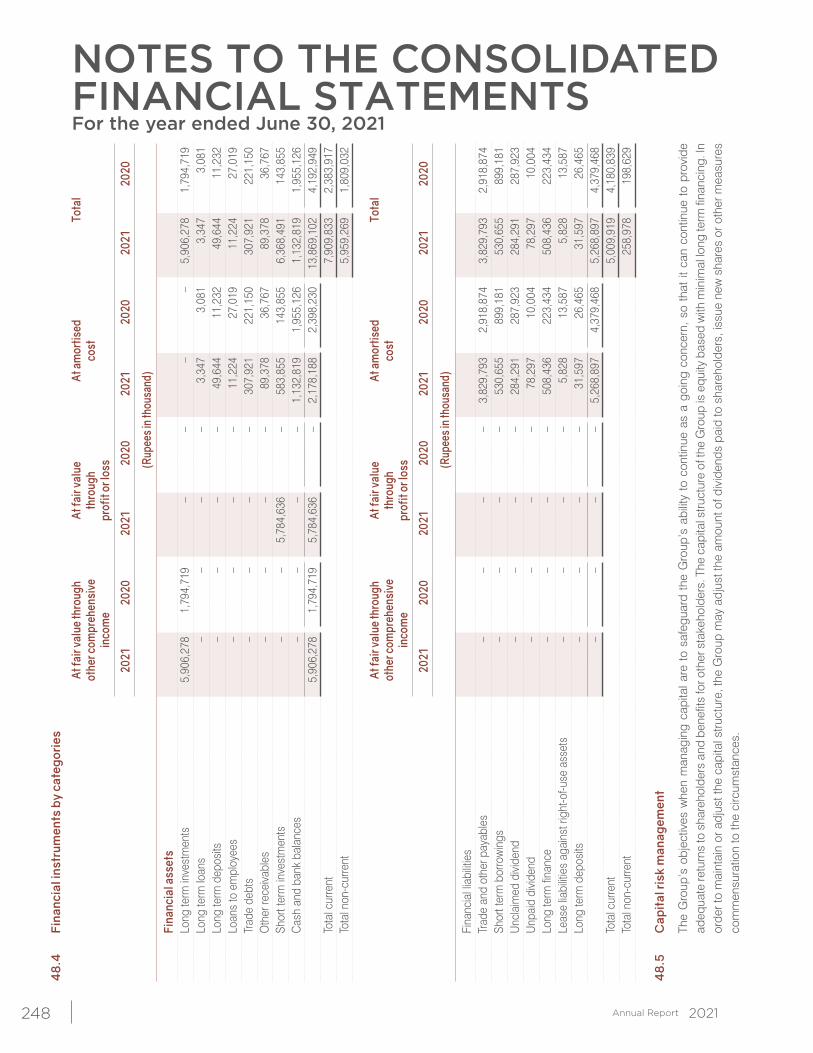
NOTES TO THE CONSOLIDATEDFINANCIAL STATEMENTSFor the year ended June 30, 2021
248
48.
4
Fina
ncia
l ins
trum
ents
by
cate
gori
es
At fa
ir va
lue
thro
ugh
At fa
ir va
lue
At a
mor
tised
To
tal
othe
r com
preh
ensi
ve
thro
ugh
cost
inco
me
prof
it or
loss
2021
20
20
2021
20
20
2021
20
20
2021
20
20
(Rup
ees i
n th
ousa
nd)
Fi
nanc
ial a
sset
s
Lo
ng te
rm in
vest
men
ts
5,9
06,2
78
1,7
94,7
19
– –
–
–
5
,906
,278
1
,794
,719
Long
term
loan
s –
–
– –
3
,347
3
,081
3
,347
3
,081
Long
term
dep
osits
–
–
–
–
49,
644
1
1,23
2
49,
644
1
1,23
2
Loan
s to
em
ploy
ees
– –
– –
1
1,22
4
27,
019
1
1,22
4
27,
019
Tr
ade
debt
s –
–
– –
3
07,9
21
221
,150
3
07,9
21
221
,150
Oth
er re
ceiv
able
s –
–
– –
89,
378
3
6,76
7
89,
378
3
6,76
7
Shor
t ter
m in
vest
men
ts
– –
5,7
84,6
36
–
583
,855
1
43,8
55
6,3
68,4
91
143
,855
Cas
h an
d ba
nk b
alan
ces
– –
–
–
1
,132
,819
1
,955
,126
1
,132
,819
1
,955
,126
5
,906
,278
1
,794
,719
5
,784
,636
–
2
,178
,188
2
,398
,230
1
3,86
9,10
2
4,1
92,9
49
To
tal c
urre
nt
7,9
09,8
33
2,3
83,9
17
To
tal n
on-c
urre
nt
5,9
59,2
69
1,8
09,0
32
At fa
ir va
lue
thro
ugh
At fa
ir va
lue
At a
mor
tised
To
tal
othe
r com
preh
ensi
ve
thro
ugh
cost
inco
me
prof
it or
loss
2021
20
20
2021
20
20
2021
20
20
2021
20
20
(Rup
ees i
n th
ousa
nd)
Fi
nanc
ial l
iabi
litie
s
Tr
ade
and
othe
r pay
able
s –
–
– –
3
,829
,793
2
,918
,874
3
,829
,793
2
,918
,874
Shor
t ter
m b
orro
win
gs
– –
–
–
530
,655
8
99,1
81
530
,655
8
99,1
81
U
ncla
imed
div
iden
d –
–
– –
284
,291
2
87,9
23
284
,291
2
87,9
23
U
npai
d di
vide
nd
– –
–
–
78,
297
1
0,00
4
78,
297
1
0,00
4
Long
term
fina
nce
– –
–
–
5
08,4
36
223
,434
5
08,4
36
223
,434
Leas
e lia
bilit
ies
agai
nst r
ight
-of-u
se a
sset
s –
–
– –
5
,828
1
3,58
7
5,8
28
13,
587
Lo
ng te
rm d
epos
its
– –
–
–
31,
597
2
6,46
5
31,
597
2
6,46
5
–
–
– –
5
,268
,897
4
,379
,468
5
,268
,897
4
,379
,468
Tota
l cur
rent
5
,009
,919
4
,180
,839
Tota
l non
-cur
rent
2
58,9
78
198
,629
48.
5 C
apit
al ri
sk m
anag
emen
t
Th
e G
roup
’s o
bjec
tives
whe
n m
anag
ing
capi
tal a
re t
o sa
fegu
ard
the
Gro
up’s
abi
lity
to c
ontin
ue a
s a
goin
g co
ncer
n, s
o th
at it
can
con
tinue
to
prov
ide
adeq
uate
retu
rns
to s
hare
hold
ers
and
bene
fits
for o
ther
sta
keho
lder
s. T
he c
apita
l stru
ctur
e of
the
Gro
up is
equ
ity b
ased
with
min
imal
long
term
fina
ncin
g. In
or
der t
o m
aint
ain
or a
djus
t the
cap
ital s
truct
ure,
the
Gro
up m
ay a
djus
t the
am
ount
of d
ivid
ends
pai
d to
sha
reho
lder
s, is
sue
new
sha
res
or o
ther
mea
sure
s co
mm
ensu
ratio
n to
the
circ
umst
ance
s.
249
49 Fair values of financial assets and liabilities
Fair value is the price that would be received to sell an asset or paid to transfer a liability in an orderly transaction between market participants at the measurement date. Underlying the definition of the fair value is the presumption that the Group is a going concern and there is no intention or requirement to curtail materially the scale of its operations or to undertake a transaction on adverse terms.
A financial instrument is regarded as quoted in an active market if quoted prices are readily and regularly available
from an exchange dealer, broker, industry group, pricing service, or regulatory agency, and those prices represent actual and regularly occurring market transactions on arm’s length basis.
The carrying values of other financial assets and financial liabilities reflected in the consolidated financial statements
approximate to their fair values. Fair value is determined on the basis of objective evidence at each reporting date. 49.1 Fair value hierarchy
IFRS 13 “Fair Value Measurement requires the Group to classify fair value measurement and fair value hierarchy that reflects the significance of the inputs used in making the measurement of fair value hierarchy, which has the following levels:
Level 1: The fair value of financial instruments traded in active markets is based on quoted market prices at the
reporting date. A market is regarded as active if quoted prices are readily and regularly available from an exchange, dealer, broker, industry group, pricing service, or regulatory agency, and those prices represent actual and regularly occurring market transactions on an arm’s length basis. The quoted market price used for financial assets held by the Group is the current bid price.
Level 2: The fair value of financial instruments that are not traded in an active market is determined by using valuation
techniques. These valuation techniques maximise the use of observable market data where it is available and rely as little as possible on entity specific estimates. If all significant inputs required to fair value an instrument are observable.
Level 3: If one or more of the significant inputs is not based on observable market data. Specific valuation techniques
used to value financial instruments include
- Quoted market prices or dealer quotes for similar instruments.
- The fair value of interest Rate swaps is calculated as the present value of the estimated future cash flows based on observable yield curves.
- Other techniques, such as discounted cash flow analysis, are used to determine fair value for the remaining financial instruments.
The carrying values of all financial and liabilities reflected in the financial statements approximate their fair values. Transfer between levels of the fair value hierarchy are recognized at the end of the reporting period during which the
changes have occurred, if any. Furthermore, there have been no transfers between various levels of the fair value hierarchy. The Group’s policy is to recognize transfers into and transfers out of fair value hierarchy levels as at the end of the reporting period. Changes between various levels of fair value hierarchy are analyzed at the end of each reporting period during the annual valuation discussion between the Chief Financial Officer and the management of investee Company. As part of this discussion, the investee company presents a report that explains the reason for the fair value movement, if any.
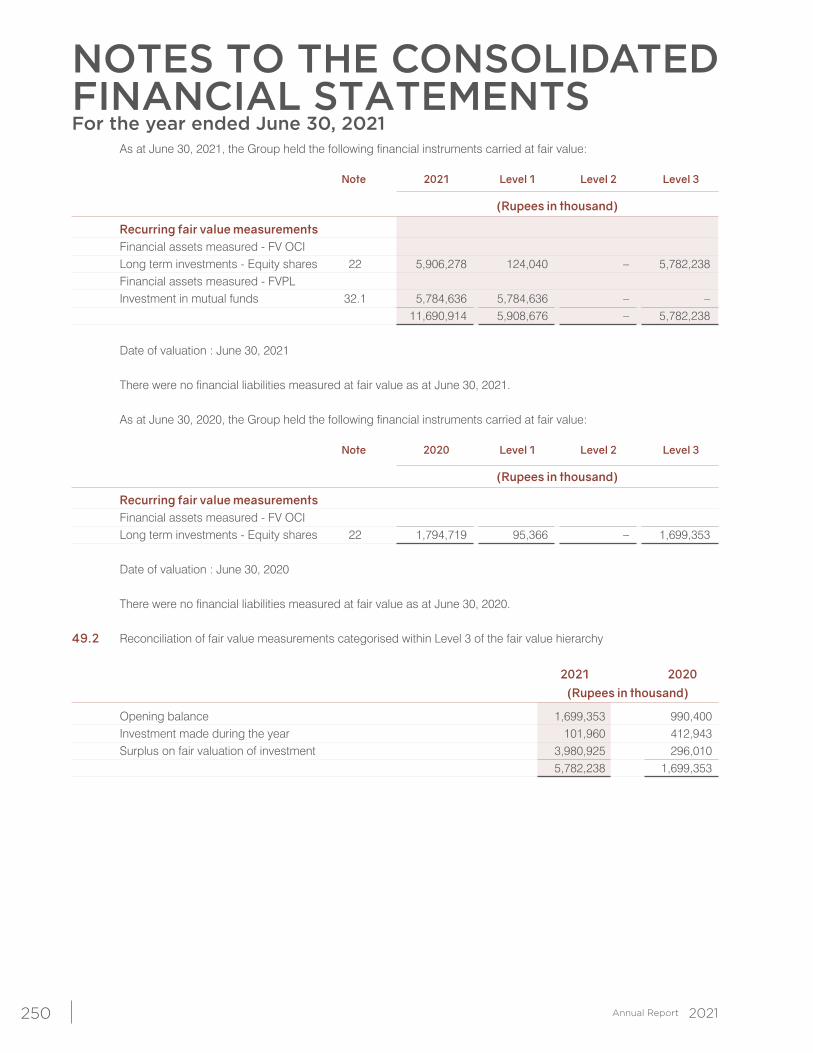
NOTES TO THE CONSOLIDATEDFINANCIAL STATEMENTSFor the year ended June 30, 2021
250
As at June 30, 2021, the Group held the following financial instruments carried at fair value:
Note 2021 Level 1 Level 2 Level 3
(Rupees in thousand)
Recurring fair value measurements Financial assets measured - FV OCI Long term investments - Equity shares 22 5,906,278 124,040 – 5,782,238 Financial assets measured - FVPL Investment in mutual funds 32.1 5,784,636 5,784,636 – – 11,690,914 5,908,676 – 5,782,238 Date of valuation : June 30, 2021 There were no financial liabilities measured at fair value as at June 30, 2021. As at June 30, 2020, the Group held the following financial instruments carried at fair value: Note 2020 Level 1 Level 2 Level 3
(Rupees in thousand)
Recurring fair value measurements Financial assets measured - FV OCI Long term investments - Equity shares 22 1,794,719 95,366 – 1,699,353 Date of valuation : June 30, 2020 There were no financial liabilities measured at fair value as at June 30, 2020. 49.2 Reconciliation of fair value measurements categorised within Level 3 of the fair value hierarchy
2021 2020 (Rupees in thousand)
Opening balance 1,699,353 990,400 Investment made during the year 101,960 412,943 Surplus on fair valuation of investment 3,980,925 296,010 5,782,238 1,699,353
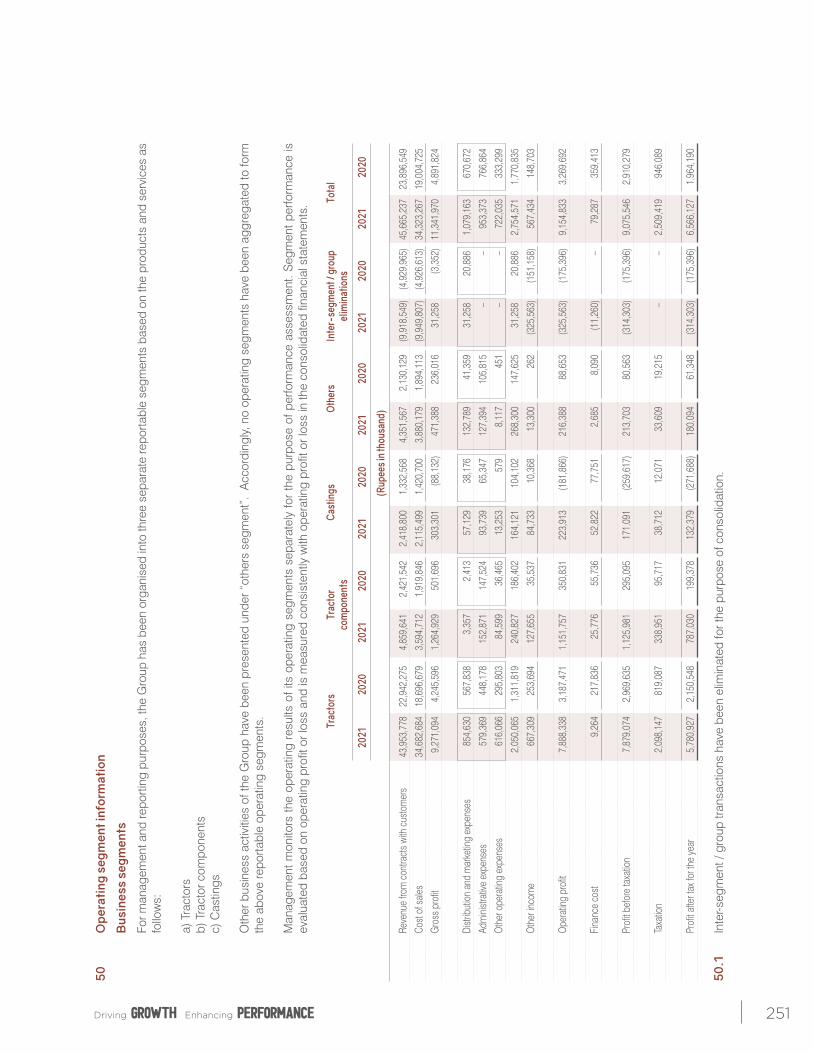
251
50
Ope
rati
ng s
egm
ent i
nfor
mat
ion
B
usin
ess
segm
ents
Fo
r man
agem
ent a
nd re
porti
ng p
urpo
ses,
the
Gro
up h
as b
een
orga
nise
d in
to th
ree
sepa
rate
repo
rtabl
e se
gmen
ts b
ased
on
the
prod
ucts
and
ser
vice
s as
fo
llow
s:
a)
Tra
ctor
s
b) T
ract
or c
ompo
nent
s
c) C
astin
gs
O
ther
bus
ines
s ac
tiviti
es o
f the
Gro
up h
ave
been
pre
sent
ed u
nder
“ot
hers
seg
men
t”.
Acc
ordi
ngly,
no
oper
atin
g se
gmen
ts h
ave
been
agg
rega
ted
to fo
rm
the
abov
e re
porta
ble
oper
atin
g se
gmen
ts.
M
anag
emen
t mon
itors
the
oper
atin
g re
sults
of i
ts o
pera
ting
segm
ents
sep
arat
ely
for
the
purp
ose
of p
erfo
rman
ce a
sses
smen
t. S
egm
ent p
erfo
rman
ce is
ev
alua
ted
base
d on
ope
ratin
g pr
ofit o
r los
s an
d is
mea
sure
d co
nsis
tent
ly w
ith o
pera
ting
profi
t or l
oss
in th
e co
nsol
idat
ed fi
nanc
ial s
tate
men
ts.
Tr
acto
rs
Trac
tor
Cast
ings
O
ther
s In
ter-
segm
ent /
gro
up
Tota
l
co
mpo
nent
s
el
imin
atio
ns
20
21
2020
20
21
2020
20
21
2020
20
21
2020
20
21
2020
20
21
2020
(R
upee
s in
thou
sand
)
Re
venu
e fro
m c
ontra
cts
with
cus
tom
ers
43,
953,
778
22
,942
,275
4
,859
,641
2
,421
,542
2
,418
,800
1
,332
,568
4
,351
,567
2
,130
,129
(9
,918
,549
) (4
,929
,965
) 4
5,66
5,23
7
23,8
96,5
49
Co
st o
f sale
s 3
4,68
2,68
4
18,6
96,6
79
3,5
94,7
12
1,9
19,8
46
2,1
15,4
99
1,4
20,7
00
3,8
80,1
79
1,8
94,1
13
(9,9
49,8
07)
(4,9
26,6
13)
34,
323,
267
19
,004
,725
Gros
s pr
ofit
9,2
71,0
94
4,2
45,5
96
1,2
64,9
29
501
,696
3
03,3
01
(88,
132)
4
71,3
88
236
,016
3
1,25
8
(3,3
52)
11,
341,
970
4
,891
,824
Dist
ribut
ion
and
mar
ketin
g ex
pens
es
854
,630
5
67,8
38
3,3
57
2,4
13
57,
129
3
8,17
6
132
,789
4
1,35
9
31,
258
2
0,88
6
1,0
79,1
63
670
,672
Adm
inist
rativ
e ex
pens
es
579
,369
4
48,1
78
152
,871
1
47,5
24
93,
739
6
5,34
7
127
,394
1
05,8
15
–
–
953
,373
7
66,8
64
O
ther
ope
ratin
g ex
pens
es
616
,066
2
95,8
03
84,
599
3
6,46
5
13,
253
5
79
8,1
17
451
–
–
7
22,0
35
333
,299
2
,050
,065
1
,311
,819
2
40,8
27
186
,402
1
64,1
21
104
,102
2
68,3
00
147
,625
3
1,25
8
20,
886
2
,754
,571
1
,770
,835
Oth
er in
com
e 6
67,3
09
253
,694
1
27,6
55
35,
537
8
4,73
3
10,
368
1
3,30
0
262
(3
25,5
63)
(151
,158
) 5
67,4
34
148
,703
Ope
ratin
g pr
ofit
7,8
88,3
38
3,1
87,4
71
1,1
51,7
57
350
,831
2
23,9
13
(181
,866
) 2
16,3
88
88,
653
(3
25,5
63)
(175
,396
) 9
,154
,833
3
,269
,692
Fina
nce
cost
9
,264
2
17,8
36
25,
776
5
5,73
6
52,
822
7
7,75
1
2,6
85
8,0
90
(11,
260)
–
7
9,28
7
359
,413
Profi
t bef
ore
taxa
tion
7,8
79,0
74
2,9
69,6
35
1,1
25,9
81
295
,095
1
71,0
91
(259
,617
) 2
13,7
03
80,
563
(3
14,3
03)
(175
,396
) 9
,075
,546
2
,910
,279
Taxa
tion
2,0
98,1
47
819
,087
3
38,9
51
95,
717
3
8,71
2
12,
071
3
3,60
9
19,
215
–
–
2
,509
,419
9
46,0
89
Pr
ofit a
fter t
ax fo
r the
year
5
,780
,927
2
,150
,548
7
87,0
30
199
,378
1
32,3
79
(271
,688
) 1
80,0
94
61,
348
(3
14,3
03)
(175
,396
) 6
,566
,127
1
,964
,190
50.1
In
ter-s
egm
ent /
gro
up tr
ansa
ctio
ns h
ave
been
elim
inat
ed fo
r the
pur
pose
of c
onso
lidat
ion.
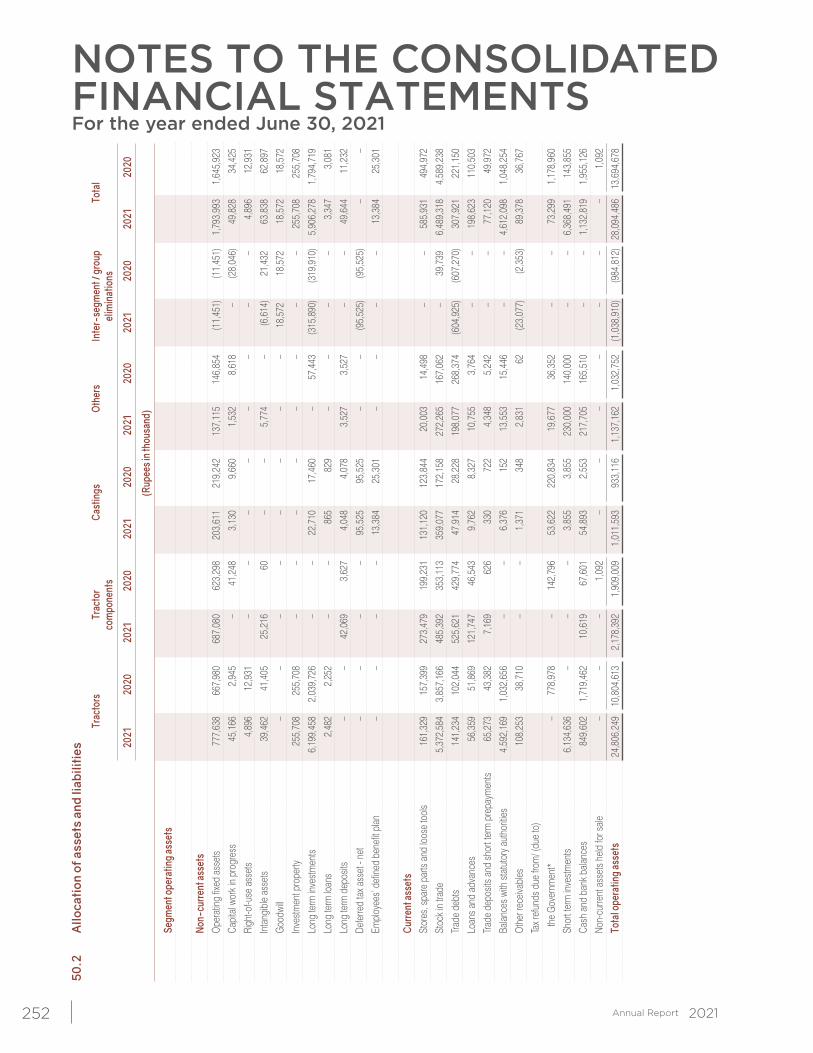
NOTES TO THE CONSOLIDATEDFINANCIAL STATEMENTSFor the year ended June 30, 2021
252
50.2
A
lloca
tion
of a
sset
s an
d lia
bilit
ies
Tr
acto
rs
Trac
tor
Cast
ings
O
ther
s In
ter-
segm
ent /
gro
up
Tota
l
co
mpo
nent
s
el
imin
atio
ns
20
21
2020
20
21
2020
20
21
2020
20
21
2020
20
21
2020
20
21
2020
(R
upee
s in
thou
sand
)
Se
gmen
t ope
ratin
g as
sets
Non-
curre
nt as
sets
Ope
ratin
g fix
ed a
sset
s 7
77,6
38
667
,980
6
87,0
80
623
,298
2
03,6
11
219
,242
1
37,1
15
146
,854
(1
1,45
1)
(11,
451)
1
,793
,993
1
,645
,923
Capi
tal w
ork i
n pr
ogre
ss
45,
166
2
,945
–
4
1,24
8
3,1
30
9,6
60
1,5
32
8,6
18
–
(28,
046)
4
9,82
8
34,
425
Ri
ght-o
f-use
ass
ets
4,8
96
12,
931
–
–
–
–
–
–
–
– 4
,896
1
2,93
1
Inta
ngib
le as
sets
3
9,46
2
41,
405
2
5,21
6
60
–
–
5,7
74
–
(6,6
14)
21,
432
6
3,83
8
62,
897
Go
odwi
ll –
–
–
– –
–
–
– 1
8,57
2
18,
572
1
8,57
2
18,
572
In
vest
men
t pro
perty
2
55,7
08
255
,708
–
–
–
– –
–
–
– 2
55,7
08
255
,708
Long
term
inve
stm
ents
6
,199
,458
2
,039
,726
–
–
2
2,71
0
17,
460
–
5
7,44
3
(315
,890
) (3
19,9
10)
5,9
06,2
78
1,7
94,7
19
Lo
ng te
rm lo
ans
2
,482
2
,252
–
–
8
65
829
–
–
–
–
3
,347
3
,081
Long
term
dep
osits
–
–
42,
069
3
,627
4
,048
4
,078
3
,527
3
,527
–
–
49,
644
1
1,23
2
Defe
rred
tax a
sset
- ne
t –
–
–
–
95,
525
9
5,52
5
–
–
(95,
525)
(9
5,52
5)
–
–
Empl
oyee
s’ de
fined
ben
efit p
lan
–
–
–
–
13,
384
2
5,30
1
–
–
–
–
13,
384
2
5,30
1
Curre
nt as
sets
Stor
es, s
pare
par
ts a
nd lo
ose
tool
s 1
61,3
29
157
,399
2
73,4
79
199
,231
1
31,1
20
123
,844
2
0,00
3
14,
498
–
–
5
85,9
31
494
,972
Stoc
k in
trade
5
,372
,584
3
,857
,166
4
85,3
92
353
,113
3
59,0
77
172
,158
2
72,2
65
167
,062
–
3
9,73
9
6,4
89,3
18
4,5
89,2
38
Tra
de d
ebts
1
41,2
34
102
,044
5
25,6
21
429
,774
4
7,91
4
28,
228
1
98,0
77
268
,374
(6
04,9
25)
(607
,270
) 3
07,9
21
221
,150
Loan
s an
d ad
vanc
es
56,
359
5
1,86
9
121
,747
4
6,54
3
9,7
62
8,3
27
10,
755
3
,764
–
–
198
,623
1
10,5
03
Tra
de d
epos
its a
nd s
hort
term
pre
paym
ents
6
5,27
3
43,
382
7
,169
6
26
330
7
22
4,3
48
5,2
42
–
–
77,
120
4
9,97
2
Balan
ces
with
sta
tuto
ry a
utho
rities
4
,592
,169
1
,032
,656
–
–
6,3
76
152
1
3,55
3
15,
446
–
–
4
,612
,098
1
,048
,254
Oth
er re
ceiva
bles
1
08,2
53
38,
710
–
–
1
,371
3
48
2,8
31
62
(2
3,07
7)
(2,3
53)
89,
378
3
6,76
7
Tax r
efun
ds d
ue fr
om/ (
due
to)
the
Gove
rnm
ent*
–
7
78,9
78
–
142
,796
5
3,62
2
220
,834
1
9,67
7
36,
352
–
–
73,
299
1
,178
,960
Shor
t ter
m in
vest
men
ts
6,1
34,6
36
–
–
– 3
,855
3
,855
2
30,0
00
140
,000
–
–
6
,368
,491
1
43,8
55
Ca
sh a
nd b
ank b
alanc
es
849
,602
1
,719
,462
1
0,61
9
67,
601
5
4,89
3
2,5
53
217
,705
1
65,5
10
–
–
1,1
32,8
19
1,9
55,1
26
No
n-cu
rrent
ass
ets
held
for s
ale
–
–
– 1
,092
–
–
–
–
–
–
– 1
,092
Tota
l ope
ratin
g as
sets
2
4,80
6,24
9
10,8
04,6
13
2,1
78,3
92
1,9
09,0
09
1,0
11,5
93
933
,116
1
,137
,162
1
,032
,752
(1
,038
,910
) (9
84,8
12)
28,
094,
486
13
,694
,678
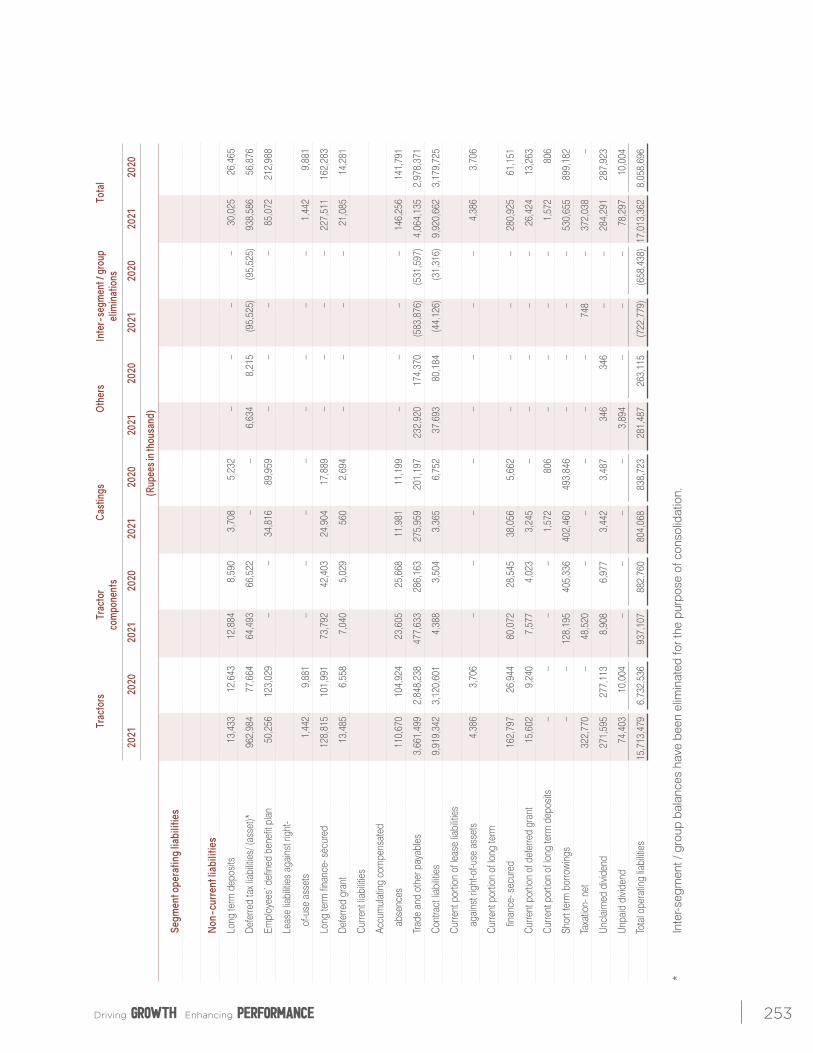
253
Tr
acto
rs
Trac
tor
Cast
ings
O
ther
s In
ter-
segm
ent /
gro
up
Tota
l
co
mpo
nent
s
el
imin
atio
ns
20
21
2020
20
21
2020
20
21
2020
20
21
2020
20
21
2020
20
21
2020
(R
upee
s in
thou
sand
)
Se
gmen
t ope
ratin
g lia
bilit
ies
N
on-c
urre
nt li
abili
ties
Lo
ng te
rm d
epos
its
13,
433
1
2,64
3
12,
884
8
,590
3
,708
5
,232
–
–
–
–
3
0,02
5
26,
465
De
ferre
d ta
x lia
biliti
es/ (
asse
t)*
962
,984
7
7,66
4
64,
493
6
6,52
2
–
–
6,6
34
8,2
15
(95,
525)
(9
5,52
5)
938
,586
5
6,87
6
Em
ploy
ees’
defi
ned
bene
fit p
lan
50,
256
1
23,0
29
–
–
34,
816
8
9,95
9
–
–
–
–
85,
072
2
12,9
88
Le
ase
liabi
lities
aga
inst
righ
t-
of-u
se a
sset
s 1
,442
9
,881
–
–
–
–
–
–
–
–
1,4
42
9,8
81
Lo
ng te
rm fi
nanc
e- s
ecur
ed
128
,815
1
01,9
91
73,
792
4
2,40
3
24,
904
1
7,88
9
–
–
–
–
227
,511
1
62,2
83
De
ferre
d gr
ant
13,
485
6
,558
7
,040
5
,029
5
60
2,6
94
–
–
–
–
21,
085
1
4,28
1
Cu
rrent
liabi
lities
Ac
cum
ulat
ing
com
pens
ated
abse
nces
1
10,6
70
104
,924
2
3,60
5
25,
668
1
1,98
1
11,
199
–
–
–
–
146
,256
1
41,7
91
Tr
ade
and
othe
r pay
able
s 3
,661
,499
2
,848
,238
4
77,6
33
286
,163
2
75,9
59
201
,197
2
32,9
20
174
,370
(5
83,8
76)
(531
,597
) 4
,064
,135
2
,978
,371
Co
ntra
ct lia
biliti
es
9,9
19,3
42
3,1
20,6
01
4,3
88
3,5
04
3,3
65
6,7
52
37,
693
8
0,18
4
(44,
126)
(3
1,31
6)
9,9
20,6
62
3,1
79,7
25
Cu
rrent
por
tion
of le
ase
liabi
lities
agai
nst r
ight
-of-u
se a
sset
s 4
,386
3
,706
–
–
–
–
–
–
–
–
4
,386
3
,706
Cu
rrent
por
tion
of lo
ng te
rm
finan
ce- s
ecur
ed
162
,797
2
6,94
4
80,
072
2
8,54
5
38,
056
5
,662
–
–
–
–
280
,925
6
1,15
1
Cu
rrent
por
tion
of d
efer
red
gran
t 1
5,60
2
9,2
40
7,5
77
4,0
23
3,2
45
–
–
–
–
–
26,
424
1
3,26
3
Cu
rrent
por
tion
of lo
ng te
rm d
epos
its
–
–
–
–
1
,572
8
06
–
–
–
–
1,5
72
806
Sh
ort t
erm
bor
rowi
ngs
–
–
128
,195
4
05,3
36
402
,460
4
93,8
46
–
–
–
–
5
30,6
55
899
,182
Ta
xatio
n- n
et
322
,770
–
4
8,52
0
–
–
–
–
–
748
–
3
72,0
38
–
Un
clai
med
divi
dend
2
71,5
95
277
,113
8
,908
6
,977
3
,442
3
,487
3
46
346
–
–
284
,291
2
87,9
23
Un
paid
divi
dend
7
4,40
3
10,
004
–
–
–
–
3
,894
–
–
–
78,
297
1
0,00
4
To
tal o
pera
ting
liabi
lities
1
5,71
3,47
9
6,7
32,5
36
937
,107
8
82,7
60
804
,068
8
38,7
23
281
,487
2
63,1
15
(722
,779
) (6
58,4
38)
17,0
13,3
62
8,0
58,6
96
* In
ter-s
egm
ent /
gro
up b
alan
ces
have
bee
n el
imin
ated
for t
he p
urpo
se o
f con
solid
atio
n.
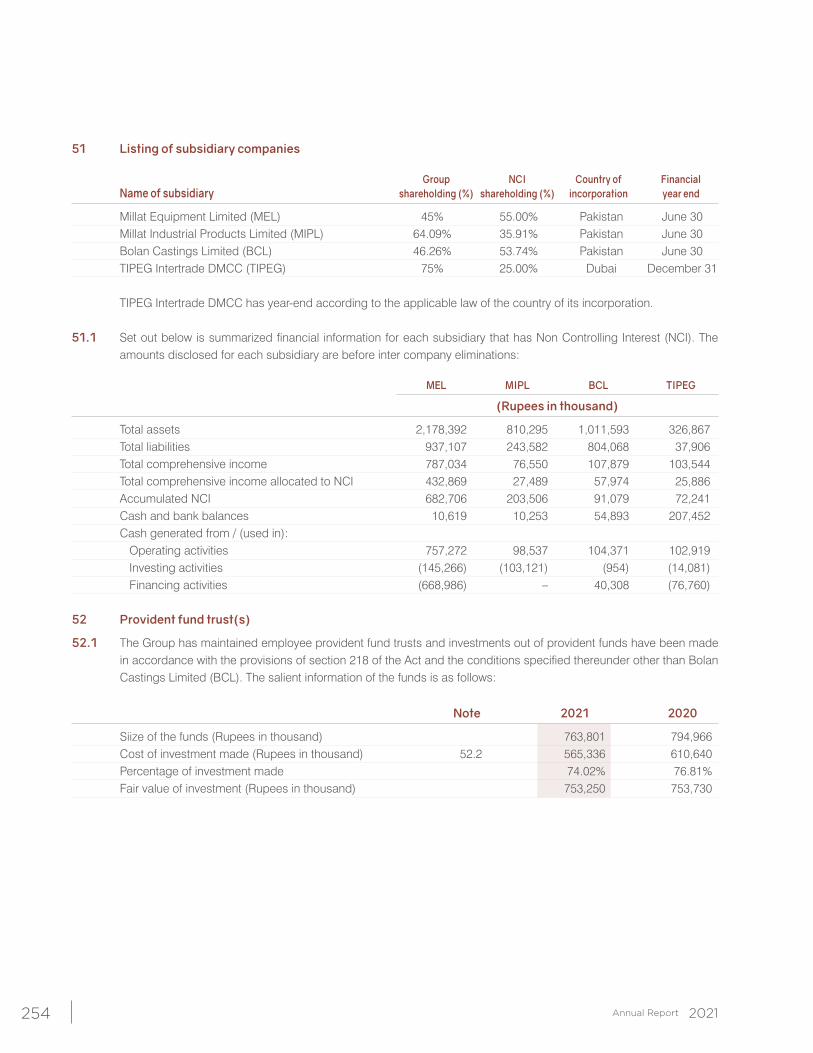
254
51 Listing of subsidiary companies Group NCI Country of Financial
Name of subsidiary shareholding (%) shareholding (%) incorporation year end
Millat Equipment Limited (MEL) 45% 55.00% Pakistan June 30 Millat Industrial Products Limited (MIPL) 64.09% 35.91% Pakistan June 30 Bolan Castings Limited (BCL) 46.26% 53.74% Pakistan June 30 TIPEG Intertrade DMCC (TIPEG) 75% 25.00% Dubai December 31 TIPEG Intertrade DMCC has year-end according to the applicable law of the country of its incorporation. 51.1 Set out below is summarized financial information for each subsidiary that has Non Controlling Interest (NCI). The
amounts disclosed for each subsidiary are before inter company eliminations: MEL MIPL BCL TIPEG
(Rupees in thousand)
Total assets 2,178,392 810,295 1,011,593 326,867 Total liabilities 937,107 243,582 804,068 37,906 Total comprehensive income 787,034 76,550 107,879 103,544 Total comprehensive income allocated to NCI 432,869 27,489 57,974 25,886 Accumulated NCI 682,706 203,506 91,079 72,241 Cash and bank balances 10,619 10,253 54,893 207,452 Cash generated from / (used in): Operating activities 757,272 98,537 104,371 102,919 Investing activities (145,266) (103,121) (954) (14,081) Financing activities (668,986) – 40,308 (76,760) 52 Provident fund trust(s)
52.1 The Group has maintained employee provident fund trusts and investments out of provident funds have been made in accordance with the provisions of section 218 of the Act and the conditions specified thereunder other than Bolan Castings Limited (BCL). The salient information of the funds is as follows:
Note 2021 2020
Siize of the funds (Rupees in thousand) 763,801 794,966 Cost of investment made (Rupees in thousand) 52.2 565,336 610,640 Percentage of investment made 74.02% 76.81% Fair value of investment (Rupees in thousand) 753,250 753,730
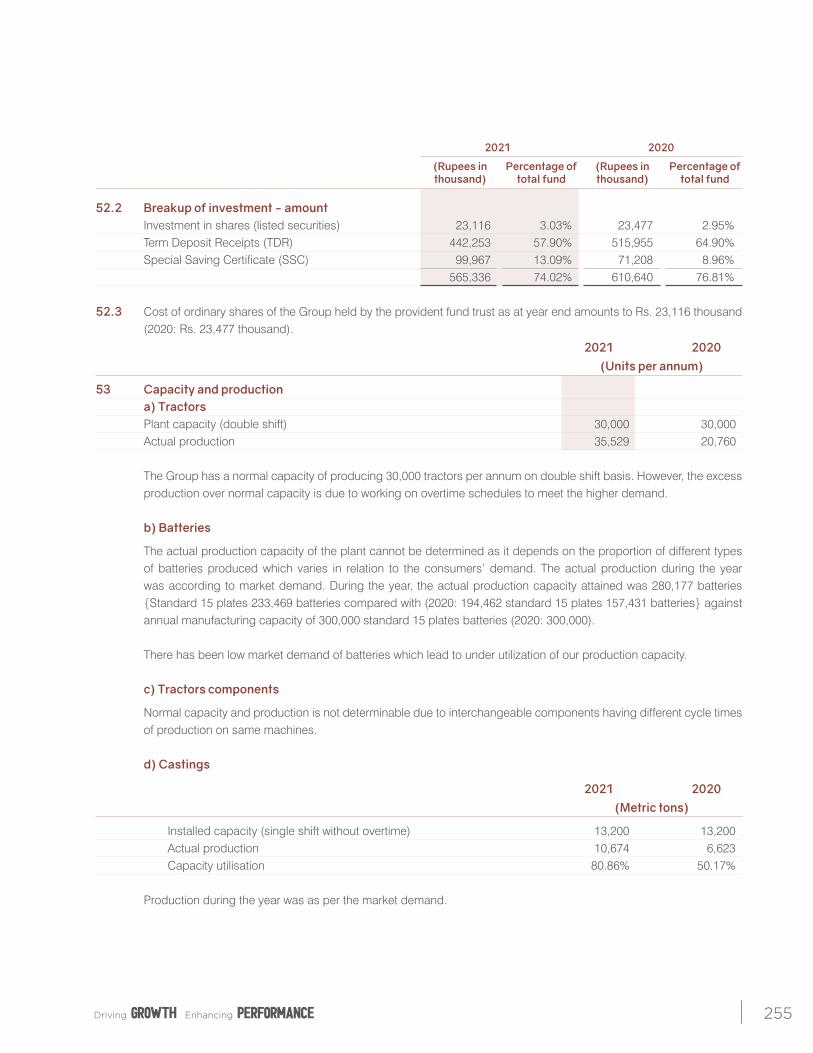
255
2021 2020
(Rupees in Percentage of (Rupees in Percentage of thousand) total fund thousand) total fund
52.2 Breakup of investment - amount Investment in shares (listed securities) 23,116 3.03% 23,477 2.95% Term Deposit Receipts (TDR) 442,253 57.90% 515,955 64.90% Special Saving Certificate (SSC) 99,967 13.09% 71,208 8.96% 565,336 74.02% 610,640 76.81% 52.3 Cost of ordinary shares of the Group held by the provident fund trust as at year end amounts to Rs. 23,116 thousand
(2020: Rs. 23,477 thousand).
2021 2020 (Units per annum)
53 Capacity and production a) Tractors Plant capacity (double shift) 30,000 30,000 Actual production 35,529 20,760 The Group has a normal capacity of producing 30,000 tractors per annum on double shift basis. However, the excess
production over normal capacity is due to working on overtime schedules to meet the higher demand. b) Batteries
The actual production capacity of the plant cannot be determined as it depends on the proportion of different types of batteries produced which varies in relation to the consumers’ demand. The actual production during the year was according to market demand. During the year, the actual production capacity attained was 280,177 batteries {Standard 15 plates 233,469 batteries compared with (2020: 194,462 standard 15 plates 157,431 batteries} against annual manufacturing capacity of 300,000 standard 15 plates batteries (2020: 300,000).
There has been low market demand of batteries which lead to under utilization of our production capacity. c) Tractors components
Normal capacity and production is not determinable due to interchangeable components having different cycle times of production on same machines.
d) Castings
2021 2020 (Metric tons)
Installed capacity (single shift without overtime) 13,200 13,200 Actual production 10,674 6,623 Capacity utilisation 80.86% 50.17% Production during the year was as per the market demand.
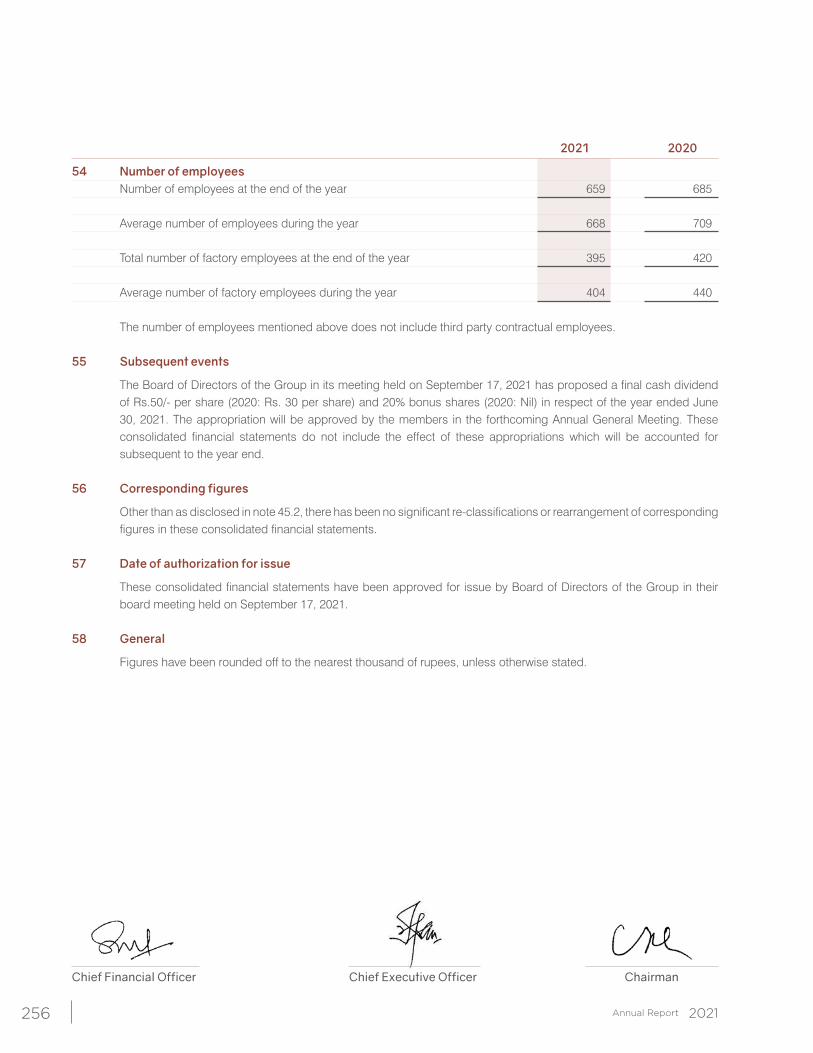
256
Chief Financial Officer Chief Executive Officer Chairman
2021 2020
54 Number of employees Number of employees at the end of the year 659 685 Average number of employees during the year 668 709 Total number of factory employees at the end of the year 395 420 Average number of factory employees during the year 404 440 The number of employees mentioned above does not include third party contractual employees. 55 Subsequent events
The Board of Directors of the Group in its meeting held on September 17, 2021 has proposed a final cash dividend of Rs.50/- per share (2020: Rs. 30 per share) and 20% bonus shares (2020: Nil) in respect of the year ended June 30, 2021. The appropriation will be approved by the members in the forthcoming Annual General Meeting. These consolidated financial statements do not include the effect of these appropriations which will be accounted for subsequent to the year end.
56 Corresponding figures
Other than as disclosed in note 45.2, there has been no significant re-classifications or rearrangement of corresponding figures in these consolidated financial statements.
57 Date of authorization for issue
These consolidated financial statements have been approved for issue by Board of Directors of the Group in their board meeting held on September 17, 2021.
58 General
Figures have been rounded off to the nearest thousand of rupees, unless otherwise stated.
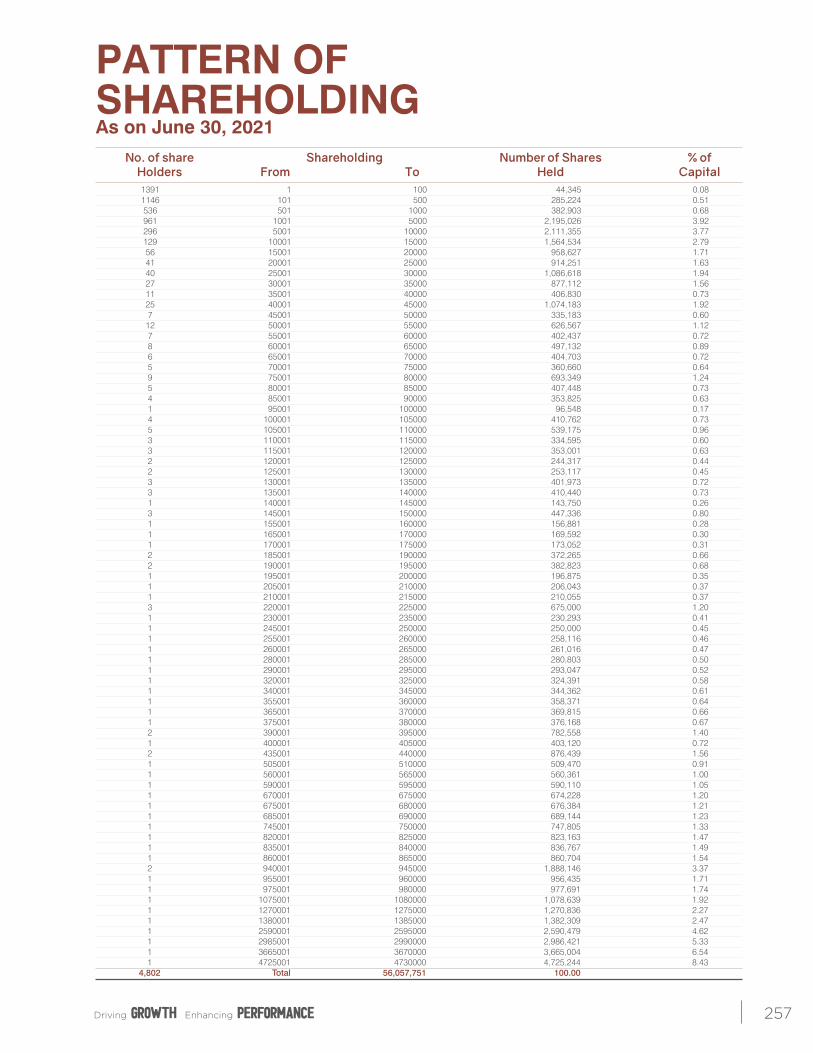
257
No. of share Shareholding Number of Shares % of Holders From To Held Capital 1391 1 100 44,345 0.08 1146 101 500 285,224 0.51 536 501 1000 382,903 0.68 961 1001 5000 2,195,026 3.92 296 5001 10000 2,111,355 3.77 129 10001 15000 1,564,534 2.79 56 15001 20000 958,627 1.71 41 20001 25000 914,251 1.63 40 25001 30000 1,086,618 1.94 27 30001 35000 877,112 1.56 11 35001 40000 406,830 0.73 25 40001 45000 1,074,183 1.92 7 45001 50000 335,183 0.60 12 50001 55000 626,567 1.12 7 55001 60000 402,437 0.72 8 60001 65000 497,132 0.89 6 65001 70000 404,703 0.72 5 70001 75000 360,660 0.64 9 75001 80000 693,349 1.24 5 80001 85000 407,448 0.73 4 85001 90000 353,825 0.63 1 95001 100000 96,548 0.17 4 100001 105000 410,762 0.73 5 105001 110000 539,175 0.96 3 110001 115000 334,595 0.60 3 115001 120000 353,001 0.63 2 120001 125000 244,317 0.44 2 125001 130000 253,117 0.45 3 130001 135000 401,973 0.72 3 135001 140000 410,440 0.73 1 140001 145000 143,750 0.26 3 145001 150000 447,336 0.80 1 155001 160000 156,881 0.28 1 165001 170000 169,592 0.30 1 170001 175000 173,052 0.31 2 185001 190000 372,265 0.66 2 190001 195000 382,823 0.68 1 195001 200000 196,875 0.35 1 205001 210000 206,043 0.37 1 210001 215000 210,055 0.37 3 220001 225000 675,000 1.20 1 230001 235000 230,293 0.41 1 245001 250000 250,000 0.45 1 255001 260000 258,116 0.46 1 260001 265000 261,016 0.47 1 280001 285000 280,803 0.50 1 290001 295000 293,047 0.52 1 320001 325000 324,391 0.58 1 340001 345000 344,362 0.61 1 355001 360000 358,371 0.64 1 365001 370000 369,815 0.66 1 375001 380000 376,168 0.67 2 390001 395000 782,558 1.40 1 400001 405000 403,120 0.72 2 435001 440000 876,439 1.56 1 505001 510000 509,470 0.91 1 560001 565000 560,361 1.00 1 590001 595000 590,110 1.05 1 670001 675000 674,228 1.20 1 675001 680000 676,384 1.21 1 685001 690000 689,144 1.23 1 745001 750000 747,805 1.33 1 820001 825000 823,163 1.47 1 835001 840000 836,767 1.49 1 860001 865000 860,704 1.54 2 940001 945000 1,888,146 3.37 1 955001 960000 956,435 1.71 1 975001 980000 977,691 1.74 1 1075001 1080000 1,078,639 1.92 1 1270001 1275000 1,270,836 2.27 1 1380001 1385000 1,382,309 2.47 1 2590001 2595000 2,590,479 4.62 1 2985001 2990000 2,986,421 5.33 1 3665001 3670000 3,665,004 6.54 1 4725001 4730000 4,725,244 8.43 4,802 Total 56,057,751 100.00
PATTERN OFSHAREHOLDINGAs on June 30, 2021
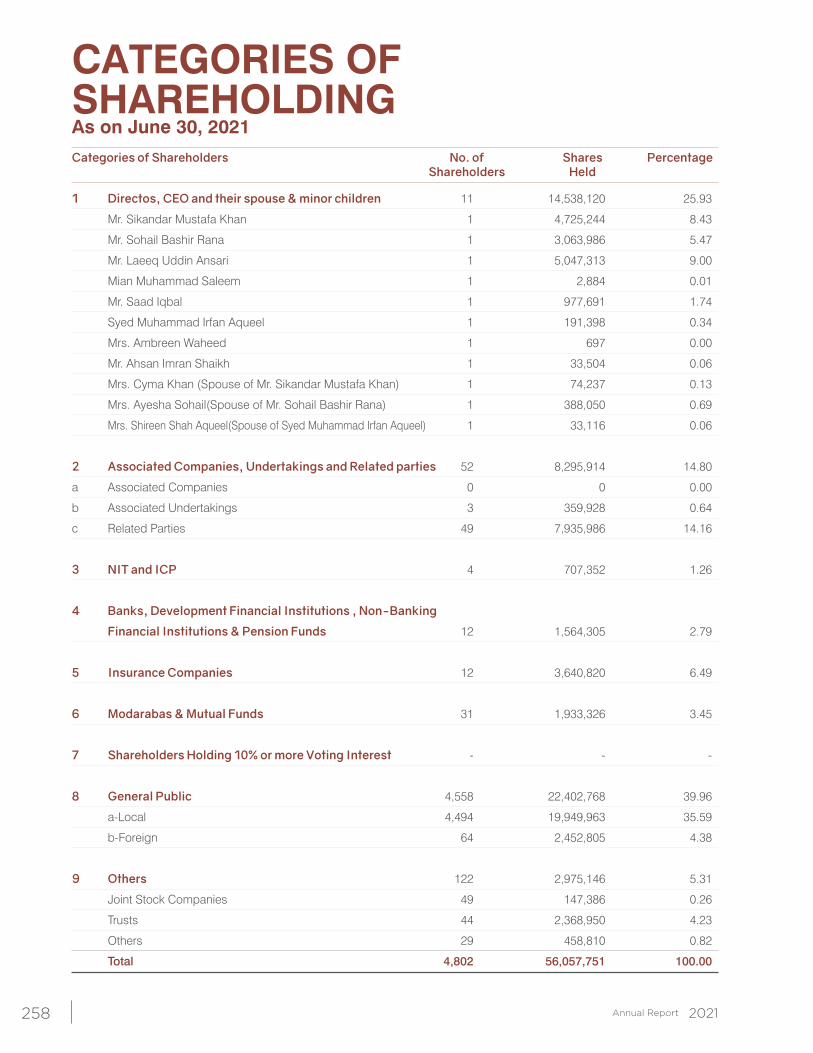
258
Categories of Shareholders No. of Shares Percentage Shareholders Held
1 Directos, CEO and their spouse & minor children 11 14,538,120 25.93
Mr. Sikandar Mustafa Khan 1 4,725,244 8.43
Mr. Sohail Bashir Rana 1 3,063,986 5.47
Mr. Laeeq Uddin Ansari 1 5,047,313 9.00
Mian Muhammad Saleem 1 2,884 0.01
Mr. Saad Iqbal 1 977,691 1.74
Syed Muhammad Irfan Aqueel 1 191,398 0.34
Mrs. Ambreen Waheed 1 697 0.00
Mr. Ahsan Imran Shaikh 1 33,504 0.06
Mrs. Cyma Khan (Spouse of Mr. Sikandar Mustafa Khan) 1 74,237 0.13
Mrs. Ayesha Sohail(Spouse of Mr. Sohail Bashir Rana) 1 388,050 0.69
Mrs. Shireen Shah Aqueel(Spouse of Syed Muhammad Irfan Aqueel) 1 33,116 0.06
2 Associated Companies, Undertakings and Related parties 52 8,295,914 14.80
a Associated Companies 0 0 0.00
b Associated Undertakings 3 359,928 0.64
c Related Parties 49 7,935,986 14.16
3 NIT and ICP 4 707,352 1.26
4 Banks, Development Financial Institutions , Non-Banking
Financial Institutions & Pension Funds 12 1,564,305 2.79
5 Insurance Companies 12 3,640,820 6.49
6 Modarabas & Mutual Funds 31 1,933,326 3.45
7 Shareholders Holding 10% or more Voting Interest - - -
8 General Public 4,558 22,402,768 39.96
a-Local 4,494 19,949,963 35.59
b-Foreign 64 2,452,805 4.38
9 Others 122 2,975,146 5.31
Joint Stock Companies 49 147,386 0.26
Trusts 44 2,368,950 4.23
Others 29 458,810 0.82
Total 4,802 56,057,751 100.00
CATEGORIES OF SHAREHOLDINGAs on June 30, 2021
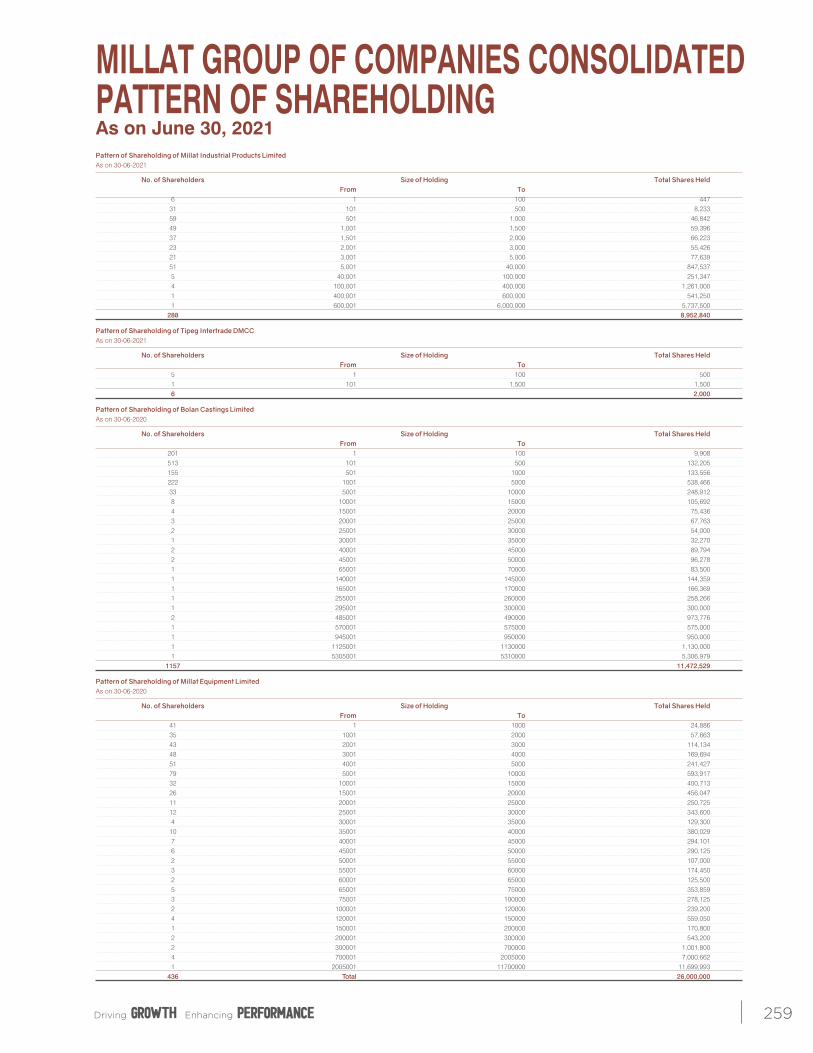
259
MILLAT GROUP OF COMPANIES CONSOLIDATEDPATTERN OF SHAREHOLDINGAs on June 30, 2021Pattern of Shareholding of Millat Industrial Products Limited As on 30-06-2021
No. of Shareholders Size of Holding Total Shares Held From To 6 1 100 447 31 101 500 8,233 59 501 1,000 46,842 49 1,001 1,500 59,396 37 1,501 2,000 66,223 23 2,001 3,000 55,426 21 3,001 5,000 77,639 51 5,001 40,000 847,537 5 40,001 100,000 251,347 4 100,001 400,000 1,261,000 1 400,001 600,000 541,250 1 600,001 6,000,000 5,737,500 288 8,952,840
Pattern of Shareholding of Tipeg Intertrade DMCCAs on 30-06-2021
No. of Shareholders Size of Holding Total Shares Held From To 5 1 100 500 1 101 1,500 1,500 6 2,000
Pattern of Shareholding of Bolan Castings LimitedAs on 30-06-2020
No. of Shareholders Size of Holding Total Shares Held From To 201 1 100 9,908 513 101 500 132,205 155 501 1000 133,556 222 1001 5000 538,466 33 5001 10000 248,912 8 10001 15000 105,692 4 15001 20000 75,436 3 20001 25000 67,763 2 25001 30000 54,000 1 30001 35000 32,270 2 40001 45000 89,794 2 45001 50000 96,278 1 65001 70000 83,500 1 140001 145000 144,359 1 165001 170000 166,369 1 255001 260000 258,266 1 295001 300000 300,000 2 485001 490000 973,776 1 570001 575000 575,000 1 945001 950000 950,000 1 1125001 1130000 1,130,000 1 5305001 5310000 5,306,979 1157 11,472,529
Pattern of Shareholding of Millat Equipment LimitedAs on 30-06-2020
No. of Shareholders Size of Holding Total Shares Held From To 41 1 1000 24,886 35 1001 2000 57,663 43 2001 3000 114,134 48 3001 4000 169,694 51 4001 5000 241,427 79 5001 10000 593,917 32 10001 15000 400,713 26 15001 20000 456,047 11 20001 25000 250,725 12 25001 30000 343,600 4 30001 35000 129,300 10 35001 40000 380,029 7 40001 45000 294,101 6 45001 50000 290,125 2 50001 55000 107,000 3 55001 60000 174,450 2 60001 65000 125,500 5 65001 75000 353,859 3 75001 100000 278,125 2 100001 120000 239,200 4 120001 150000 559,050 1 150001 200000 170,800 2 200001 300000 543,200 2 300001 700000 1,001,800 4 700001 2005000 7,000,662 1 2005001 11700000 11,699,993 436 Total 26,000,000
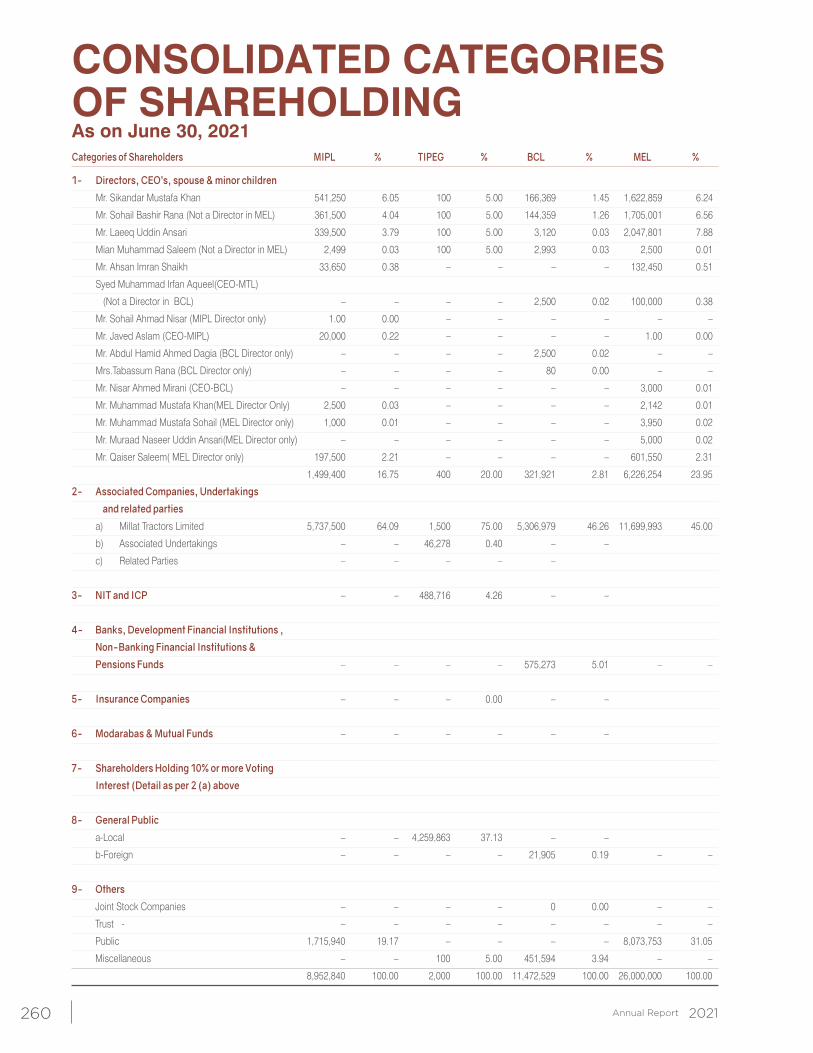
260
CONSOLIDATED CATEGORIES OF SHAREHOLDINGAs on June 30, 2021Categories of Shareholders MIPL % TIPEG % BCL % MEL %
1- Directors, CEO’s, spouse & minor children
Mr. Sikandar Mustafa Khan 541,250 6.05 100 5.00 166,369 1.45 1,622,859 6.24
Mr. Sohail Bashir Rana (Not a Director in MEL) 361,500 4.04 100 5.00 144,359 1.26 1,705,001 6.56
Mr. Laeeq Uddin Ansari 339,500 3.79 100 5.00 3,120 0.03 2,047,801 7.88
Mian Muhammad Saleem (Not a Director in MEL) 2,499 0.03 100 5.00 2,993 0.03 2,500 0.01
Mr. Ahsan Imran Shaikh 33,650 0.38 – – – – 132,450 0.51
Syed Muhammad Irfan Aqueel(CEO-MTL)
(Not a Director in BCL) – – – – 2,500 0.02 100,000 0.38
Mr. Sohail Ahmad Nisar (MIPL Director only) 1.00 0.00 – – – – – –
Mr. Javed Aslam (CEO-MIPL) 20,000 0.22 – – – – 1.00 0.00
Mr. Abdul Hamid Ahmed Dagia (BCL Director only) – – – – 2,500 0.02 – –
Mrs.Tabassum Rana (BCL Director only) – – – – 80 0.00 – –
Mr. Nisar Ahmed Mirani (CEO-BCL) – – – – – – 3,000 0.01
Mr. Muhammad Mustafa Khan(MEL Director Only) 2,500 0.03 – – – – 2,142 0.01
Mr. Muhammad Mustafa Sohail (MEL Director only) 1,000 0.01 – – – – 3,950 0.02
Mr. Muraad Naseer Uddin Ansari(MEL Director only) – – – – – – 5,000 0.02
Mr. Qaiser Saleem( MEL Director only) 197,500 2.21 – – – – 601,550 2.31
1,499,400 16.75 400 20.00 321,921 2.81 6,226,254 23.95
2- Associated Companies, Undertakings
and related parties
a) Millat Tractors Limited 5,737,500 64.09 1,500 75.00 5,306,979 46.26 11,699,993 45.00
b) Associated Undertakings – – 46,278 0.40 – –
c) Related Parties – – – – –
3- NIT and ICP – – 488,716 4.26 – –
4- Banks, Development Financial Institutions ,
Non-Banking Financial Institutions &
Pensions Funds – – – – 575,273 5.01 – –
5- Insurance Companies – – – 0.00 – –
6- Modarabas & Mutual Funds – – – – – –
7- Shareholders Holding 10% or more Voting
Interest (Detail as per 2 (a) above
8- General Public
a-Local – – 4,259,863 37.13 – –
b-Foreign – – – – 21,905 0.19 – –
9- Others
Joint Stock Companies – – – – 0 0.00 – –
Trust - – – – – – – – –
Public 1,715,940 19.17 – – – – 8,073,753 31.05
Miscellaneous – – 100 5.00 451,594 3.94 – –
8,952,840 100.00 2,000 100.00 11,472,529 100.00 26,000,000 100.00
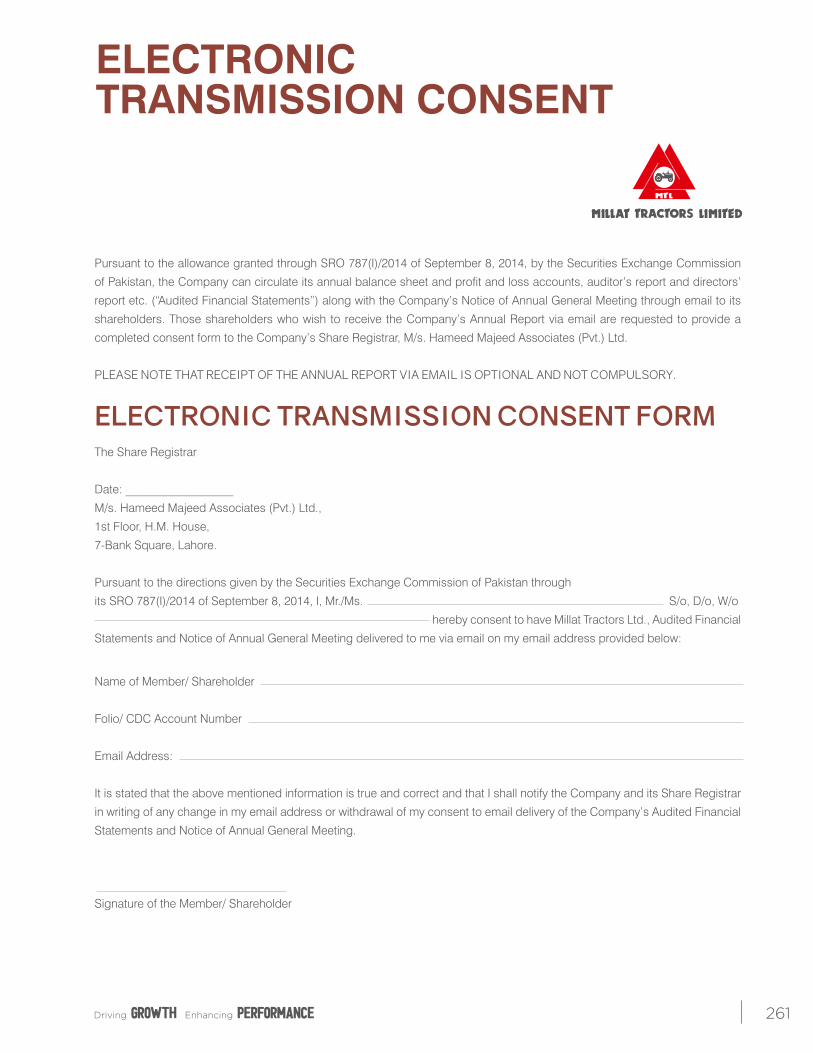
261
ELECTRONICTRANSMISSION CONSENT
Pursuant to the allowance granted through SRO 787(I)/2014 of September 8, 2014, by the Securities Exchange Commission
of Pakistan, the Company can circulate its annual balance sheet and profit and loss accounts, auditor’s report and directors’
report etc. (“Audited Financial Statements”) along with the Company’s Notice of Annual General Meeting through email to its
shareholders. Those shareholders who wish to receive the Company’s Annual Report via email are requested to provide a
completed consent form to the Company’s Share Registrar, M/s. Hameed Majeed Associates (Pvt.) Ltd.
PLEASE NOTE THAT RECEIPT OF THE ANNUAL REPORT VIA EMAIL IS OPTIONAL AND NOT COMPULSORY.
ELECTRONIC TRANSMISSION CONSENT FORMThe Share Registrar
Date: __________________
M/s. Hameed Majeed Associates (Pvt.) Ltd.,
1st Floor, H.M. House,
7-Bank Square, Lahore.
Pursuant to the directions given by the Securities Exchange Commission of Pakistan through
its SRO 787(I)/2014 of September 8, 2014, I, Mr./Ms. S/o, D/o, W/o
hereby consent to have Millat Tractors Ltd., Audited Financial
Statements and Notice of Annual General Meeting delivered to me via email on my email address provided below:
Name of Member/ Shareholder
Folio/ CDC Account Number
Email Address:
It is stated that the above mentioned information is true and correct and that I shall notify the Company and its Share Registrar
in writing of any change in my email address or withdrawal of my consent to email delivery of the Company’s Audited Financial
Statements and Notice of Annual General Meeting.
Signature of the Member/ Shareholder
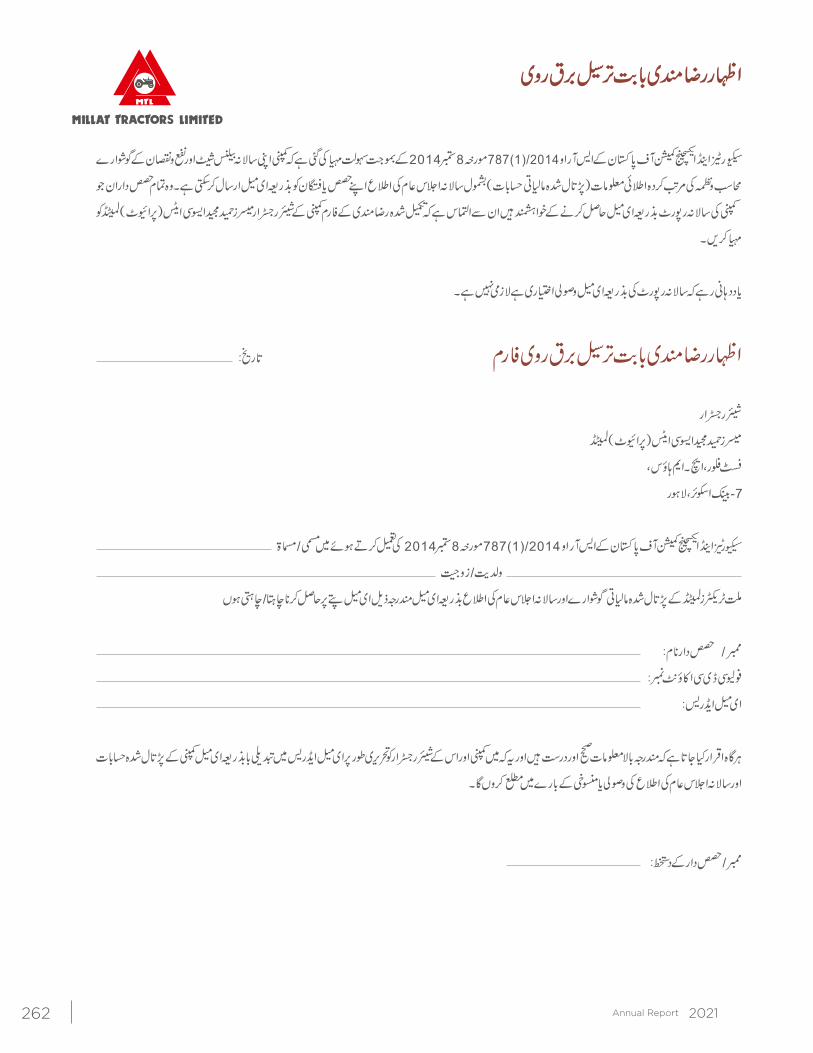
262
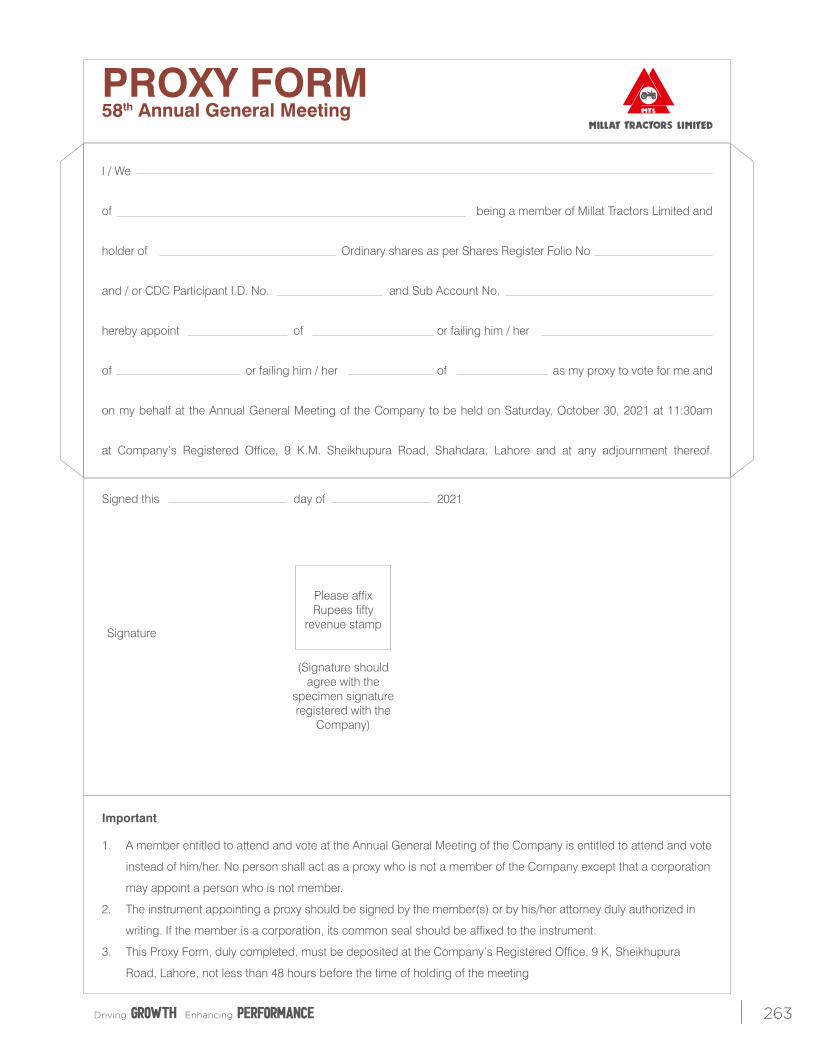
263
I / We
of being a member of Millat Tractors Limited and
holder of Ordinary shares as per Shares Register Folio No
and / or CDC Participant I.D. No. and Sub Account No.
hereby appoint of or failing him / her
of or failing him / her of as my proxy to vote for me and
on my behalf at the Annual General Meeting of the Company to be held on Saturday, October 30, 2021 at 11:30am
at Company’s Registered Office, 9 K.M. Sheikhupura Road, Shahdara, Lahore and at any adjournment thereof.
Signed this day of 2021
Important
1. A member entitled to attend and vote at the Annual General Meeting of the Company is entitled to attend and vote
instead of him/her. No person shall act as a proxy who is not a member of the Company except that a corporation
may appoint a person who is not member.
2. The instrument appointing a proxy should be signed by the member(s) or by his/her attorney duly authorized in
writing. If the member is a corporation, its common seal should be affixed to the instrument.
3. This Proxy Form, duly completed, must be deposited at the Company’s Registered Office, 9 K, Sheikhupura
Road, Lahore, not less than 48 hours before the time of holding of the meeting
PROXY FORM58th Annual General Meeting
Please affix Rupees fifty
revenue stampSignature
(Signature should agree with the
specimen signature registered with the
Company)
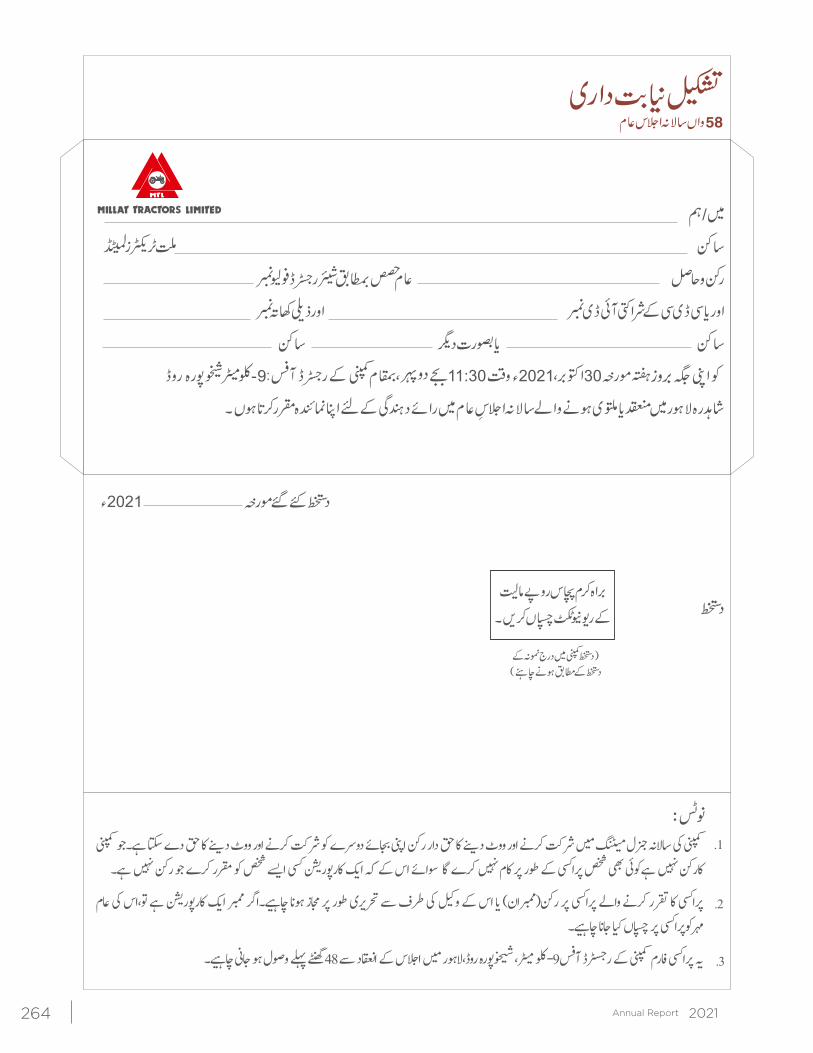
264
11:30 302021 دو��
2021
� �۔� � دے � � �
د�� ووٹ اور �� �� � دو�ے �� ا� ر� دار � � �
د�� ووٹ اور �� �� �� �������� �ل ��� � �
�۔ � ��
� ر� � �ے �ر � � ا�� � ���ر�ر�� ا�� � � اس � �ا� �ے � �
�� �م � �ر � �ا� � � ��� � �
�� �ر�
�م � �،اس � ���ر�ر�� ا�� � ۔ا� � ��� �� �ز � �ر �ى ��� � �ف � و�� � اس � ر�(�ان) �� � �ا� وا� �� �ر � �ا�
۔ � ��� �� � �� �ں � ���ا�
۔ � ��� �� � و�ل � �48 � ا�د � ا�س �� روڈ،��ر ���رہ ����
�� ،�
� �� آ�9-� ر�ڈ � � �رم �ا� ��
،KM9،