Embed Size (px)
Citation preview

PIRE Library and Information Services
This material has been acquired for you from another institution via reciprocal borrowing agreements. As such, it is subject to PIRE’s Annual Business Copyright License.
This license allows PIRE staff to share copies of journal articles, subject to certain restrictions.
Before you share this item with another staff person, please go to http://www.copyright.com and look up the journal title in the Get Permission box. The box to the right of the journal result will indicate if you are allowed to share a print or digital copy. If it does not, you are responsible for paying any royalties under the “pay per view” option before sharing that item.
Please note that items cannot be shared with non-PIRE staff, or with staff outside of the United States.
Questions? Please email Julie Murphy at [email protected] or refer to PIRE’s Copyright Compliance Policy at http://company.pire.org/Internal/library/copyright.htm
NOTICE
WARNING CONCERING COPYRIGHT RESTRICTIONS
The copyright law of the United States (Title 17, United States Code) governs the making of photocopies or other reproductions or copyrighted material.
Under certain conditions specified in the law, libraries and archives are authorized to furnish a photocopy or other reproduction. One of these specified conditions is that the reproduction is not to be used for any purpose other than private study, scholarship, or research. If a user makes a request for, or later uses, a photocopy or reproduction for purposes in excess of “fair use”, that use may be liable for copyright infringement.
This library reserves the right to refuse to accept a copying order if, in its judgment, fulfillment of the order would involve violation of copyright law. No further reproduction and distribution of this copy is permitted by transmission or any other means.
ORIGINAL PAPER
Factors Associated with Depression Among Mexican AmericansLiving in U.S.–Mexico Border and Non-Border Areas
Patrice A. C. Vaeth1• Raul Caetano1
• Britain A. Mills2
� Springer Science+Business Media New York 2015
Abstract Factors associated with CES-D depression
among Mexican Americans living on and off the U.S.–
Mexico border are examined. Data are from two studies of
Mexican American adults. The Border Survey conducted
face-to-face interviews in urban U.S.–Mexico border
counties of California, Arizona, New Mexico, and Texas
(N = 1307). The non-border HABLAS survey conducted
face-to-face interviews in Houston, Los Angeles, New
York, Philadelphia, and Miami (N = 1288). Both surveys
used a multistage cluster sample design with response rates
of 67 and 76 %, respectively. The multivariate analysis
showed that border residence and higher perceived neigh-
borhood collective efficacy were protective for depression
among men. Among men, lower education, unemployment,
increased weekly drinking, and poor health status were
associated with depression. Among women, alcohol-related
problems and poorer health status were also associated
with depression. Further examinations of how neighbor-
hood perceptions vary by gender and how these perceptions
influence the likelihood of depression are warranted.
Keywords Mexican Americans � U.S.–Mexico border �Depression � Neighborhood � Perceived collective efficacy
Introduction
The U.S. Census Bureau estimated that in 2013, the 24
counties of California, Arizona, New Mexico, and Texas
that share common borders with Mexico were home to
approximately 7.5 million people [1]. The border popula-
tion is predominantly Hispanic (approximately 68 %), the
majority of which are of Mexican origin [1, 2]. There are
several unique characteristics of the border that impact the
well-being of its residents. These include high rates of
poverty, under-education, and unemployment [2]. The
border is also characterized by poor indices of health and
many lack health insurance coverage [2]. In addition, the
border is a designated ‘‘medically underserved area’’ due to
the paucity of health care professionals there relative to
non-border areas [2–5].
The extent to which living on the border, with its
socioeconomic and health disadvantages, puts its residents
at risk for mental health problems, such as depression, is
important to assess as this condition is a major cause of
disability that impairs psychosocial functioning and quality
of life [6]. Data from the 2005–2009 state Behavioral Risk
Factor Surveillance System (BRFSS) surveys for Arizona,
California, New Mexico, and Texas show approximately
equal lifetime prevalence rates of depressive disorder on
and off the border (17.4 and 18.3 %, for border and non-
border residents respectively) [7]. Border residents, how-
ever, were significantly less likely than non-border resi-
dents to report one or more days of poor mental health in
the previous month (i.e., stress, depression, and problems
with emotions) (34.5 vs. 39.2 % for border and non-border
residents, respectively: p value = 0.001) [7]. The actual
number of poor mental health days in the previous month,
however, is comparable between border and non-border
locations [8]. For example, BRFSS data from the border
& Patrice A. C. Vaeth
1 Prevention Research Center, 180 Grand Avenue, Suite 1200,
Oakland, CA 94612-3749, USA
2 University of Texas School of Public Health, Dallas Regional
Campus, Dallas, TX, USA
123
J Immigrant Minority Health
DOI 10.1007/s10903-015-0236-7
and non-border areas in which our current study collected
data indicate that on the border, the approximate average
number of poor mental health days was 3.54 (range of
2.4 days in Santa Cruz County, Arizona to 5.1 days in
Imperial County, California) versus 3.62 days in non-bor-
der areas (range of 2.9 days in Harris County, where the
city of Houston, Texas is located to 4.4 days in Philadel-
phia County, where the city of Philadelphia, Pennsylvania
is located); [8]. Unfortunately, BRFSS response rates
across states are low and vary widely. For example, in
2009, overall response rates in Arizona, California, New
Mexico, and Texas were 23.17, 27.75, 50.90, and 29.40 %,
respectively [9]. Another limitation of BRFSS data is its
land-line data collection methodology. The BRFSS did not
pilot a cell phone survey until 2008 [10]. Because of the
increasing number of homes with wireless only telephones,
the potential for survey under-coverage is great. For
example, from 2007 to 2009, the prevalence of wireless
only telephone technology within households ranged from
approximately 17 to 27 % in Arizona, 9 to 16 % in Cali-
fornia, 17 to 26 % in New Mexico, and 20 to 30 % in
Texas [11]. The potential for bias is even greater among
Hispanic households since Hispanic adults are more likely
to be wireless only compared to adults of other ethnicities
[12].
Several studies have linked perceptions of neighborhood
disorganization and instability to depression [13–18].
Adverse neighborhood conditions are thought to lead to
depression because social disorder exposes residents to
greater daily stress [16]. Residents of disadvantaged
neighborhoods are also more vulnerable to depression
following negative life events because such neighborhoods
lack appropriate resources for coping [16]. Finally, the
social disorder of neighborhoods with adverse conditions
makes it difficult to form and maintain meaningful social
ties [16].
Utilizing the concept of collective efficacy, this paper
examines the association between neighborhood disorder
and depression among Mexican Americans living in U.S.–
Mexico border and non-border regions. Developed by
Sampson [19, 20], collective efficacy reflects the percep-
tions of neighborhood residents that their neighborhood
acts in socially cohesive ways and implements informal
social controls that maintain public order. We hypothesize
that because of the socioeconomic and health disparities on
the border relative to non-border areas, border residents
will perceive their neighborhoods to be lower in collective
efficacy and will be more likely to experience depression.
We will control for several sociodemographic factors in
our analyses because of their documented association with
depression. These include: age, gender, socioeconomic
status [21–24], level of acculturation, birthplace [24, 25],
alcohol consumption [21, 24, 26, 27], and physical health
status [28–30]. Because our data were collected via face-to-
face household interviews, we avoid the limitations raised
by telephone surveys (as per BRFSS discussed earlier).
Methods
Sample and Data Collection
The data used for these analyses are from two separate
studies of Mexican American adults: one from those living
in U.S.–Mexico border areas (Border Survey) and the
other, from those living in non-border areas (Hispanic
Americans Baseline Alcohol Survey (HABLAS)). For the
Border Survey, interviews were conducted among 1307
self-identified Mexican Americans in the U.S.–Mexico
border counties of California (Imperial County: N = 365),
Arizona (Cochise, Santa Cruz, and Yuma Counties:
N = 173), New Mexico (Dona Ana County: N = 65), and
Texas (Cameron, El Paso, Hidalgo and Webb Counties:
N = 704) between March 2009 and July 2010. Data for the
Border Survey were collected in urban areas for increased
comparability with the non-border sample. The non-border
self-identified Mexican American respondents were inter-
viewed in 2006 as part of HABLAS (N = 1288). The
majority of HABLAS respondents were interviewed in
non-border cities of California and Texas (Los Angeles:
N = 609 and Houston: N = 513). Additional interviews
were conducted in New York (N = 86), Philadelphia
(N = 59), and Miami (N = 21). Both surveys employed
identical multistage cluster sampling methodologies;
weighted response rates were 67 and 76 %, for the Border
Survey and HABLAS, respectively.
Both surveys (Border Survey and HABLAS) utilized
identical questionnaires with the exception of questions
regarding drinking across the border in Mexico, which
were asked only in the Border Survey given the close
proximity to Mexico. The questionnaire that was initially
developed for the non-border HABLAS survey (and that
was also used in the Border Survey), was pre-tested in
English, translated into Spanish, and then back-translated
to English. The added questions for the Border Survey on
drinking in Mexico were similarly pre-tested in English,
translated into Spanish, and then back-translated to Eng-
lish. In both surveys, trained bilingual interviewers con-
ducted approximately hour-long Computer Assisted
Personal Interviews (CAPI) in respondents’ homes in either
Spanish or English. With the CAPI, questions and appro-
priate skip patterns were programed into laptop computers
and our interviewers entered the responses. In the Border
Survey, 55 % of the interviews were conducted mostly or
completely in Spanish whereas in the HABLAS survey,
this proportion was higher, at 71 %. The interviewers for
J Immigrant Minority Health
123

both surveys underwent the same supervised training pro-
cedure in order to ensure the uniformity of data collection
and interviewing approaches.
Respondents in both samples received a $25 incentive
for their participation in the study. All respondents signed a
written informed consent and the Committee for the Pro-
tection of Human Subjects of the University of the Texas
Health Science Center at Houston approved both the Bor-
der Survey and HABLAS.
Measures
Depression
Self-reported depression was assessed using the 20-item
Center for Epidemiological Studies Depression Scale
(CES-D) [31]. This valid and reliable scale is often used as
a measure of depression in epidemiologic research [32].
Items were rated on a 4-point Likert-type scale ranging
from 0 to 3 (total scale range: 0–60). A cumulative score of
16 or greater is considered an indicator of depression [32].
This dichotomous variable was coded ‘‘0’’ for ‘‘no
depression’’ and ‘‘1’’ for ‘‘depression.’’ The scale’s intra-
group reliability for these data was good (Cronbach’s a:
0.84 and 0.88; Guttman’s split-half coefficient: 0.81 and
0.87 for men and women, respectively).
Perceived Neighborhood Collective Efficacy
Collective efficacy is a valid and reliable cumulative
measure of the respondents’ perceived social control and
social cohesion within their neighborhood environment
[19, 20]. Perceived social control was measured using a
5-item Likert-type scale on the likelihood of the following:
that neighbors would intervene if children skipped school,
children spray-painted graffiti, children were disrespectful
toward adults, fights broke out in front of their house, and
the fire station was closed due to budget cuts. Perceived
social cohesion was measured using a 5-item Likert-type
scale of agreement on the following statements: people
around here are willing to help their neighbors, this is a
close-knit neighborhood, people in this neighborhood can
be trusted, people in this neighborhood generally don’t
get along with each other, and people in this neighborhood
do not share the same values. Because social cohesion and
informal social control were closely associated (r = 0.80),
Sampson et al. concluded that the two measures were
assessing aspects of the same latent construct and therefore
combined them into the collective efficacy summary
measure [19]. Although not as strong as the correlation
reported by Sampson et al., we similarly observed a rela-
tively strong correlation between the two subscales in our
data (r = 0.54). This cumulative collective efficacy
measure had an acceptable level of intra-group reliability
for our data (Cronbach’s a: 0.79 and 0.81 for men and
women, respectively).
Because of the well documented strong association
between alcohol consumption and depression [21, 24, 26,
27], these analyses controlled for the number of drinks
consumed per week, binge drinking, and alcohol-related
problems. The number of drinks consumed per week, a
continuous measure which is widely used in epidemio-
logical studies of alcohol use and related problems [33–35],
was assessed by combining self-reported frequency and
quantity of drinking wine, beer, liquor, and mixed drinks
with liquor in the previous 12 months (for methodological
discussions also see Room [36] and Greenfield and Kerr
[37]). Binge drinking was defined as per the National
Institute of Alcohol Abuse and Alcoholism: that is, drink-
ing 4 or more (women) or 5 or more (men) standard drinks
per occasion within a 2-hour period in the past 12 months
(standard drink: 12 oz of beer, 5 oz of wine, 1� ounces of
liquor) [38]. Respondents were categorized as abstainers,
current drinkers who did not binge in the past year (ref-
erence), and current drinkers who binged 1 or more times
in the previous year. The presence of alcohol-related
problems was assessed with the following items: salience
of drinking (defined as when drinking becomes a higher
priority than one’s health, social relationships, hobbies/in-
terests, and obligations; [39]), need to drink, increased
tolerance, impaired control, withdrawal symptoms, pro-
longed intoxication, financial problems, belligerence,
police problems, accidents, health problems, problems with
spouse, problems with others, and job problems [39, 40].
Based on the positive responses to these items, an additive
scale was built. In the analyses, this variable was repre-
sented as dichotomous: zero (reference) versus 1 or more
problem as is frequent in studies of alcohol epidemiology
[41–43].
Sociodemographic Covariates
These analyses also controlled for several sociodemograpic
factors because of their documented association with
depression [7, 21–24]. The main sociodemographic inde-
pendent variable for these analyses was border versus non-
border (reference) location. Additional sociodemographic
covariates were also controlled for these in these analyses
and included: age (18–29, 30–39, 40–49, and 50? years);
level of education (some college/vocational school/beyond
(reference), high school diploma/GED, and no high school
diploma); income (continuous); marital status (mar-
ried/cohabitating (reference), separated/divorced/widowed,
and never married/never lived with anyone); employment
status (working full- or part-time (reference), unemployed/
temporary illness/student, homemaker, retired/disabled/
J Immigrant Minority Health
123

never worked); religious preference (Protestant (refer-
ence), Catholic, other religion, and no preference). Place of
birth (U.S. vs. foreign-born as the reference) and level of
acculturation (low as the reference versus medium and
high) were also controlled for in the analyses because prior
research has linked these factors to depression among
Hispanics [24, 25]. Developed by Caetano [44], the
acculturation scale has demonstrated validity and reliability
and consists of 12 questions covering the following infor-
mation: daily use of and ability to speak, read, and write
English and Spanish; preference for media in English or
Spanish; ethnicity of people with whom respondents
interact at church, at parties, the current neighborhood and
the neighborhood where they were raised; and a series of
questions about values thought to be characteristic of the
Hispanic lifestyle. With the exception of the items used to
assess language use, all other items were coded in a 4-point
Likert scale (strongly agree to strongly disagree). The
scales intra-group reliability for these data was good
(Cronbach’s a: 0.90 and 0.91 for men and women,
respectively). A continuous score of acculturation was
computed, then subjects were grouped into three categories
using tertiles to form low, medium, and high acculturation
levels [44].
Self-rated health status was also controlled for in the
analysis because of the strong and well documented asso-
ciation between physical and mental health [28–30]. Self-
rated health status was assessed by asking respondents to
indicate whether their general health status ranged from
poor to excellent. In the analyses, this variable was cate-
gorized as excellent/very good/good (reference), fair, and
poor.
Statistical Analysis
To account for the multistage cluster sample design used in
both surveys, analyses were conducted with Stata 13 [45].
Data were weighted to correct for unequal probabilities of
selection into the sample. A post-stratification weight was
also applied, which corrects for nonresponse and adjusts
the sample to known Hispanic population distributions on
demographic variables. Bivariate associations between
categorical variables were assessed with Chi square
statistics. The tables depict weighted percentages with
unweighted Ns. Multivariate logistic regression was used
to assess predictors of depression. Due to non-response on
the income item (15.2 %), log-transformed income was
multiply imputed and used in the analyses (see Caetano and
Mills; [46]). Preliminary models were fit using the average
of the 10 imputed income values and final model estimates
were obtained by combining estimates from analyses on
each of the 10 imputed datasets using Rubin’s rules [47,
48]. Because the prevalence and predictors of depression
vary by gender [20, 21, 23], gender-specific models were
run. Also, because previous analyses of this sample
detected interactions involving border proximity, gender,
and age [34, 49], age by location interactions were initially
tested in both male and female depression models.
Results
Sample Description
The sample was composed of 2595 Mexican Americans:
1307 residing in U.S.–Mexico border areas and 1288
residing in non-border areas. The gender distribution in the
sample was almost equally split, with women representing
51 % of the sample (border: 53 %; non-border: 48 %). The
percentage of respondents married or cohabitating was also
comparable across locations (border: 58 %; non-border:
60 %), as was the percentage of respondents with less than
a high school education (border: 49 %; non-border: 48 %).
The mean annual income was 28.5 K ± 2.0 for those on
the border compared to 26.0 K ± 1.2 for non-border resi-
dents. Fifty-five percent of respondents of the Border
Survey and 71 % of respondents of HABLAS were born
outside of the U.S. Also, although not a control variable in
our analyses, it is interesting to note that 55 % of the
border sample and 71 % of the non-border sample was
interviewed completely or mostly in Spanish. The mean
age of the border sample was higher (41.3 ± 1.0 vs.
37.8 ± 0.6 years non-border sample) and those in non-
border areas were more likely to be employed part- or full-
time (61 vs. 45 % among border residents).
Perceived Neighborhood Collective Efficacy
on and off the Border
Perceived neighborhood collective efficacy was signifi-
cantly higher among border than non-border residents
(37.39 ± 0.35 vs. 36.21 ± 0.44, p = 0.04, for border and
non-border residents, respectively). Differences in the
mean scores for collective efficacy among men were not
statistically significant (37.24 ± 0.64 vs. 36.56 ± 0.51, for
border and non-border men, respectively). However,
among women, those on the border had significantly higher
perceived collective efficacy than those off the border
(37.24 ± 0.64 vs. 35.84 ± 0.46, p = 0.01).
Bivariate Results
The weighted prevalence of depression was slightly lower
among both men and women on the border compared to
those off the border (Table 1). These differences, however,
were not statistically significant. The bivariate analysis also
J Immigrant Minority Health
123
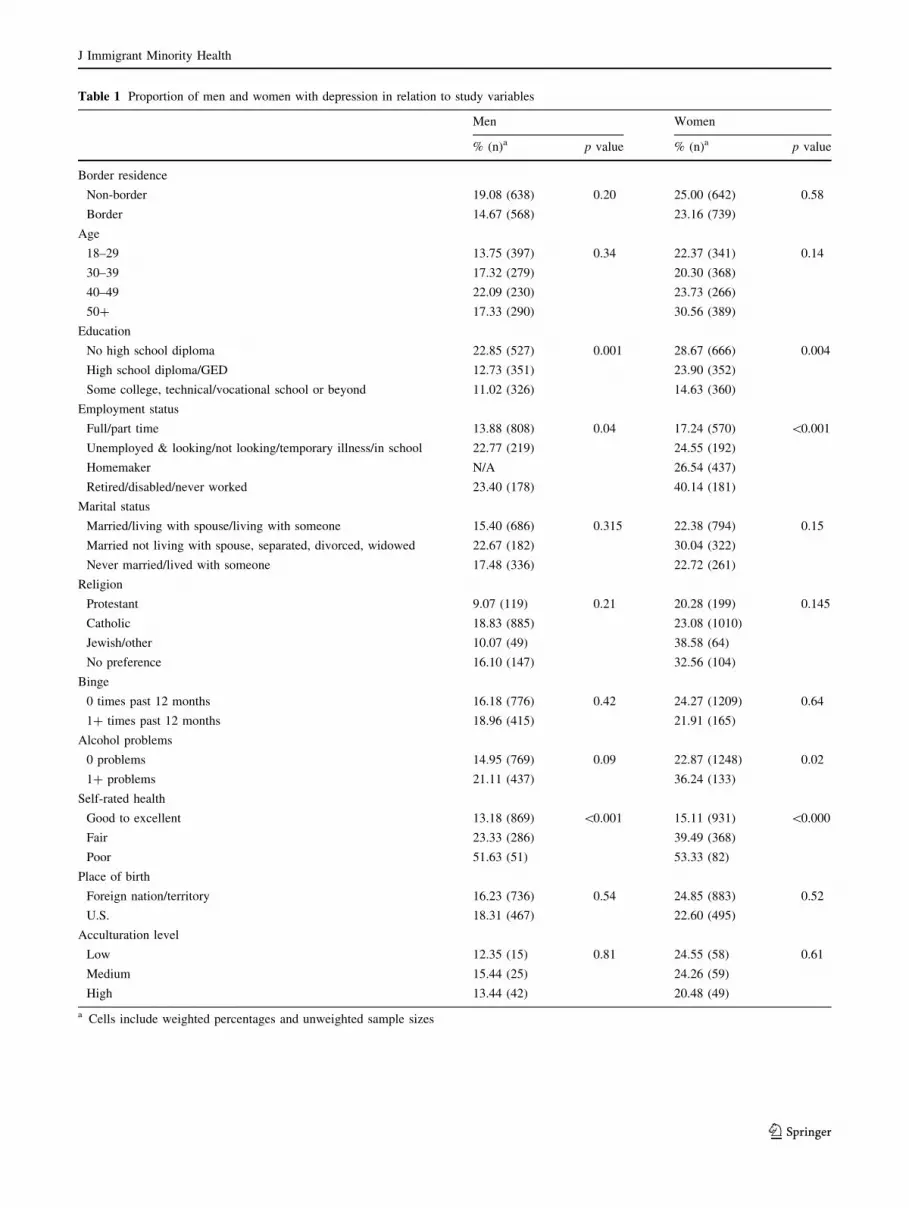
Table 1 Proportion of men and women with depression in relation to study variables
Men Women
% (n)a p value % (n)a p value
Border residence
Non-border 19.08 (638) 0.20 25.00 (642) 0.58
Border 14.67 (568) 23.16 (739)
Age
18–29 13.75 (397) 0.34 22.37 (341) 0.14
30–39 17.32 (279) 20.30 (368)
40–49 22.09 (230) 23.73 (266)
50? 17.33 (290) 30.56 (389)
Education
No high school diploma 22.85 (527) 0.001 28.67 (666) 0.004
High school diploma/GED 12.73 (351) 23.90 (352)
Some college, technical/vocational school or beyond 11.02 (326) 14.63 (360)
Employment status
Full/part time 13.88 (808) 0.04 17.24 (570) \0.001
Unemployed & looking/not looking/temporary illness/in school 22.77 (219) 24.55 (192)
Homemaker N/A 26.54 (437)
Retired/disabled/never worked 23.40 (178) 40.14 (181)
Marital status
Married/living with spouse/living with someone 15.40 (686) 0.315 22.38 (794) 0.15
Married not living with spouse, separated, divorced, widowed 22.67 (182) 30.04 (322)
Never married/lived with someone 17.48 (336) 22.72 (261)
Religion
Protestant 9.07 (119) 0.21 20.28 (199) 0.145
Catholic 18.83 (885) 23.08 (1010)
Jewish/other 10.07 (49) 38.58 (64)
No preference 16.10 (147) 32.56 (104)
Binge
0 times past 12 months 16.18 (776) 0.42 24.27 (1209) 0.64
1? times past 12 months 18.96 (415) 21.91 (165)
Alcohol problems
0 problems 14.95 (769) 0.09 22.87 (1248) 0.02
1? problems 21.11 (437) 36.24 (133)
Self-rated health
Good to excellent 13.18 (869) \0.001 15.11 (931) \0.000
Fair 23.33 (286) 39.49 (368)
Poor 51.63 (51) 53.33 (82)
Place of birth
Foreign nation/territory 16.23 (736) 0.54 24.85 (883) 0.52
U.S. 18.31 (467) 22.60 (495)
Acculturation level
Low 12.35 (15) 0.81 24.55 (58) 0.61
Medium 15.44 (25) 24.26 (59)
High 13.44 (42) 20.48 (49)
a Cells include weighted percentages and unweighted sample sizes
J Immigrant Minority Health
123
showed that the proportion of men and women with
depression was greater among those without a high school
diploma and those who were retired, disabled, or who had
never worked. While depressed individuals reported lower
annual family incomes than non-depressed individuals, this
association was statistically significant only among
women. In particular, depressed women reported a mean
income of 20.03 K (±2.03) compared to 27.10 K (±1.39)
reported by non-depressed women, p = 0.003 (data not
shown). While there was no association between binge
drinking and depression, men and women with 1 or more
alcohol-related problem were more likely to be depressed,
although this association was only marginally significant
among men. Depressed men also drank a statistically sig-
nificantly higher number of drinks per week than non-de-
pressed men (13.13 ± 2.11 vs. 7.50 ± 0.61 for depressed
and non-depressed men respectively, p = 0.01; data not
shown). Among women, however, there was no statisti-
cally significant difference in the volume of alcohol con-
sumption in relation to depression. Self-rated health was
also associated with depression. For men and women, the
proportion of depressed individuals increased in a step-
wise manner as health status decreased.
Multivariate Results
Interactions between border residence and age in predicting
depression were not statistically significant and therefore are
not reported further. The multivariate logistic regression for
men showed that border residence, as well as higher per-
ceived neighborhood collective efficacy, were protective for
depression (Table 2). Among the sociodemographic vari-
ables, men with no high school diploma, compared to those
with at least some college or technical/vocational education
were at an increased risk for depression. Unemployed men
were also more likely to be depressed compared to their
employed counterparts. A higher volume of alcohol con-
sumed per week was also associated with depression.
Finally, those with poor self-rated health were more than five
times more likely to suffer from depression compared to men
who rated their health as good, very good, or excellent.
Among women, neither border location nor perceived
collective efficacy was associated with depression
(Table 2). In addition, neither measure of alcohol con-
sumption was associated with depression; however, women
with 1 or more alcohol-related problem were almost three
times more likely to be depressed compared to women with
no problems. Self-rated health status was also associated
with depression. Women in fair health had a more than
3-fold increased likelihood of depression and those in poor
health were almost seven times more likely to be depressed
compared to women of good to excellent health.
Discussion
We hypothesized that the prevalence of CES-D depression
would be higher on the border than off the border. In contrast,
we found that on the border, the prevalence of depression
was slightly lower than the prevalence off the border; how-
ever, these differences were not statistically significant (i.e.,
15 % of border men and 23 % of border women were
depressed vs. 19 % of non-border men and 25 % of non-
border women). In the multivariate analyses, after control-
ling for the effects of covariates, residing on the border,
compared to off the border, was protective for depression
among men, but not women. These were surprising findings
given the socioeconomic and health disparities on the border
relative to non-border areas. However, in spite of its
socioeconomic hardships, border regions are unique because
of the level of symbiosis, or cross-border interdependence
between Mexico and the U.S. [50, 51]. Border culture has
been shaped by a history of interactions between Mexico and
the U.S., including the geographical mobility between the
two countries and the associated international and ethnic
conflicts and compromises that have arisen over time. All
this has resulted in a sense of uniqueness, great resiliency,
and a growing social and political awareness among resi-
dents on both sides of the border [50, 51]. This uniqueness is
evident in the blending of both Mexican and Anglo tradi-
tions, language, religion, values, and customs.
The rich and unique qualities of border culture may also
provide some explanation as to why, contrary to our
hypothesis, border residents perceived their neighborhoods
to be more socially cohesive and better able to implement
informal social controls (i.e., collective efficacy) than did
non-border residents. The analyses also showed that higher
perceived neighborhood collective efficacy was associated
with a lesser likelihood of depression. This finding is in
accordance with previous findings in this area [14, 15]. It is
possible that stronger collective efficacy buffers the effects
of daily stressors that lead to depression [15]. These find-
ings, however, were only significant for men, a finding
previously seen in the literature [52]. For example, Vaeth
et al. [52] found that among men, but not women, the
likelihood of depression decreased as the sense of collec-
tive efficacy increased and this association was indepen-
dent of other risk factors for depression such as heavy
drinking, alcohol-related problems, and intimate partner
violence. Higher perceived collective efficacy was not
protective for depression among women, in spite of the fact
that the mean levels for women were essentially equal to
those of men. This could be due to the differences in the
nature and size of social support systems between men and
women [53, 54]. For example men’s social networks have
been reported to consist more of co-workers and friends
J Immigrant Minority Health
123

whereas women’s consist mostly of kin [53, 54]. Uchino
et al. [55] have described how familial sources of support
are important factors in protecting one’s health and well-
being. Indeed, Marquez and Romo [56] emphasize how the
border region is grounded in strong family values and
family unity. Unfortunately, we did not have a measure of
family unity or family cohesion to examine in these
analyses.
Among women, in the multivariate logistic regression
model, the likelihood of depression did not vary by loca-
tion. Ryan-Ibarra et al. similarly found that the prevalence
of depression did not vary in relation to border residence
status among California women [57]. In this study, binge
drinking predicted depression in both border and non-
border areas of California [57]. In our study, binge drinking
was not associated with women’s depression; however, the
presence of alcohol-related problems was. Women with 1
or more problem were almost three times more likely to be
depressed compared to women with no problems. This
association has been well documented by previous research
[21, 22, 24, 25]. The only other variable that was associated
with depression among women was self-rated health status.
Women who reported their health as fair had a more than
3-fold increased likelihood of depression and those in poor
health were at nearly a 7-fold increased risk. Poor self-
rated health was also associated with a 5-fold increased
Table 2 Odds ratios and 95 % confidence intervals from multiple logistic regression models predicting depression among men and women
Men (n = 1091)
OR (CI)aWomen (n = 1230)
OR (CI)a
Border location (reference = non-border) 0.52b (0.29–0.93) 1.17 (0.71–1.93)
Age (ref. = 18–29)
30–39 1.67 (0.87–3.20) 0.86 (0.49–1.53)
40–49 1.76 (0.80–3.88) 1.13 (0.62–2.07)
50? 1.11 (0.39–3.18) 0.65 (0.28–1.53)
Education (reference = some college, technical/vocational school or beyond)
No high school diploma 2.10b (1.02–4.30) 1.37 (0.75–2.50)
High school diploma/GED 0.89 (0.46–1.73) 1.49 (0.79–2.83)
Income (continuous) 1.00 (0.98–1.01) 0.99 (0.98–1.00)
Employment status (reference = full/part time)
Unemployed & looking/not looking/temporary illness/in school 2.08b (1.01–4.27) 1.63 (0.85–3.14)
Homemaker Not applicable 1.40 (0.84–2.31)
Retired/disabled/never worked 1.72 (0.68–4.39) 1.56 (0.73–3.35)
Marital status (reference = married/living with spouse, living with someone)
Married not living with spouse, separated, divorced, widowed 1.13 (0.52–2.44) 1.22 (0.71–2.10)
Never married/lived with someone 1.16 (0.59–2.30) 0.99 (0.60–1.63)
Religion (reference = catholic)
Protestant 0.60 (0.20–1.75) 0.90 (0.49–1.65)
Jewish/other 0.46 (0.13–1.63) 2.27 (0.81–6.38)
No Preference 0.89 (0.39–2.01) 1.20 (0.54–2.65)
Collective efficacy (continuous) 0.96b (0.93–0.99) 0.99 (0.96–1.02)
Drinks per week (continuous, 5 drinks per week) 1.02b (1.00–1.03) 0.98 (0.94–1.02)
Binge 1? times in past 12 months (reference = no binge) 0.91 (0.47–1.77) 0.64 (0.30–1.34)
Alcohol problems (reference = no problems) 1.17 (0.58–2.38) 2.96c (1.32–6.65)
Self-rated health (reference = good to excellent)
Fair 1.55 (0.91–2.65) 3.30d (2.20–4.95)
Poor 5.02c (1.70–14.85) 6.93d (3.05–15.75)
U.S.–born (reference = foreign-born) 1.61 (0.79–3.28) 1.24 (0.72–2.11)
Acculturation level (reference = low)
Medium 0.89 (0.46–1.71) 1.04 (0.68–1.59)
High 0.85 (0.38–1.93) 1.04 (0.56–1.95)
a OR (CI) Odds ratio (95 % confidence interval); b p\ 0.05; c p\ 0.01; d p\ 0.001
J Immigrant Minority Health
123
likelihood of depression among men. These findings were
not surprising given the strong association between phys-
ical and mental health status [27–29].
Among men, those with less than a high school educa-
tion were approximately two times more likely to be
depressed. This is in contrast to findings from the Collab-
orative Psychiatric Epidemiology Studies (CPES) and the
National Latino and Asian American Study (NLAAS) that
showed no association between level of education and
major depressive disorder in CPES and any depressive
disorder in NLAAS among Hispanics [58, 59]. Unem-
ployed men were also at increased risk for depression,
although this was not the case among women, a finding that
is also supported in the literature [22]. Finally, among men,
the likelihood of depression increased as the weekly con-
sumption of drinks increased. It is possible that drinking
contributes to the development of depression and/or that
depressed men are drinking more in a chronic manner as a
coping mechanism. It is surprising, however, that neither
binge drinking nor the presence of alcohol-related prob-
lems was associated with depression among men.
Regarding binge drinking, this behavior is prevalent among
Mexican American men and often occurs at social events
[34, 35, 60]. In fact there is some evidence that binge
drinking may have a protective effect on depression among
men [52].
This study has some important strengths. Using the same
selection and interviewing methodology, data were col-
lected from representative samples of Mexican Americans
living in both border and non-border areas of the U.S., thus
allowing for comparisons across locations. In addition, this
study collected comprehensive data on a variety of topics,
including depression, health status, collective efficacy, and
alcohol use during face-to-face interviews. Importantly,
interviews were conducted by bilingual interviewers so that
both English and Spanish speakers were included and in
fact, 55 % of the border sample and 71 % of the non-
border sample was interviewed completely or mostly in
Spanish. In spite of the larger proportion of non-border
residents who were interviewed in Spanish, there were no
differences in level of acculturation between border and
non-border groups [61]. Further, in this study, level of
acculturation was not associated with depression for either
men or women.
This study also has some limitations. In spite of rela-
tively good response rates for both the border and non-
border samples, the border response rate was only 67 %
(compared to 76 % off the border). Because the two sur-
veys were restricted to urban areas, our findings may not be
generalizable to the rural Mexican American population. In
addition, the Border Survey and HABLAS were not con-
ducted concurrently; however, the epidemiology of alcohol
in large populations is relatively stable [62, 63], as is the
prevalence of depression given the chronic nature of this
condition [6, 64]. Another limitation of this study is that the
identification of depression with the CES-D is not based on
clinical criteria. However, research has shown a good level
of agreement between the CES-D’s use of a cut-off point of
16 or more depressive symptoms and a clinical diagnosis of
depression [32, 65]. Also, this is a cross-sectional analysis
and a temporal order in the relationships between our
independent variables and depression cannot be estab-
lished. Finally, this paper focuses on a special U.S. popu-
lation and the generalizability of these findings to other
populations in the world may be limited. However, in the
U.S., Mexican Americans have a strong and growing
presence, representing 64 % of the total Hispanic popula-
tion in 2012 [66]. Given the significant impact of depres-
sion on functional status and quality of life [6], further
examinations of how neighborhood perceptions vary by
gender and how these perceptions influence the likelihood
of depression are warranted.
Acknowledgments Preparation of this article was supported by
grants (RO1-AA013642 and RO1-AA016827) from the National
Institute on Alcohol Abuse and Alcoholism to the Prevention
Research Center, Pacific Institute for Research and Evaluation, USA.
References
1. United States Census Bureau. American Fact Finder. Annual
Estimates of the Resident Population: April 2010 to July 1 2013.
2014. http://factfinder2.census.gov/faces/nav/jsf/pages/index.
xhtml. Accessed 10 Oct 2014.
2. Bhavsar GP, Martin AB, Probst JC, Torres ME, Iyer M, Hardin J.
Rural border health chartbook II. Columbia: South Carolina Rural
Health Research Center, Rural Health Research & Policy Cen-
ters; 2014.
3. Soden DL. At the cross roads: U.S./Mexico border counties in
transition. U.S./Mexico border County Coalition. 2006.
4. Gerber J. Developing the U.S.–Mexico border region for a
prosperous and secure relationship: human and physical infras-
tructure along the U.S. border with Mexico. 2009.
5. Pan American Health Organization. United States–Mexico border
area. Health in the Americas Volume II-Countries. 2007. http://www.
paho.org/hia/archivosvol2/paisesing/United%20States%20Mexico
%20Border%20Area%20English.pdf. Accessed 10 Oct 2014.
6. Hellerstein DJ, Agosti V, Bosi M, Black SR. Impairment in
psychosocial functioning associated with dysthymic disorder in
the NESARC study. J Affect Disord. 2010;127(1–3):84–8.
7. Martin AB, Torres M, Vyavaharkar M, Chen Z, Towne S, Probst
JC. Rural border health chartbook. Columbia: South Carolina
Rural Health Research Center, Rural Health Research & Policy
Centers; 2013.
8. University of Wisconsin Population Health Institute School of
Public Health. 2015. County Health Rankings & Roadmaps. Poor
mental health days, 2010. http://www.countyhealthrankings.org/.
Accessed 21 May 2015.
9. Centers for Disease Control. Behavioral risk factor surveillance
system 2009 summary data quality report. Version #1. 2011.
http://www.cdc.gov/brfss/annual_data/2009/pdf/2009_Summary_
Data_Quality_Report.pdf. Accessed 24 Feb 2015.
J Immigrant Minority Health
123

10. Centers for Disease Control. Behavioral risk factor surveillance
system cell phone pilot operational protocol. 2008. http://www.
ndhealth.gov/brfss/publications/2008%20BRFSS%20Cell%20
Phone%20Pilot%20Opeartional%20Protocol-Final.pdf. Accessed
24 Feb 2015.
11. Blumberg SJ, Luke JV, Ganesh N, Davern ME, Boudreaux MH,
Soderberg K. Wireless substitution: state-level estimates from the
National Health Interview Survey, January 2007–June 2010.
National health statistics reports; no 39. Hyattsville, MD:
National Center for Health Statistics. 2011.
12. Blumberg SJ, Luke JV. Wireless substitution: early release of
estimates from the National Health Interview Survey, January–
June 2012. National Center for Health Statistics. July 2014. http://
www.cdc.gov/nchs/data/nhis/earlyrelease/wireless201407.pdf.
Accessed 3 Mar 2015.
13. Aneshensel CS, Sucoff CA. The neighborhood context of ado-
lescent mental health. J Health Soc Behav. 1996;37(4):293–310.
14. Ross CE. Neighborhood disadvantage and adult depression.
J Health Soc Behav. 2000;41:177–87.
15. Latkin CA, Curry AD. Stressful neighborhoods and depression: a
prospective study of the impact of neighborhood disorder.
J Health Soc Behav. 2003;44(1):34–44.
16. Cutrona CE, Russell DW, Brown PA, Clark LA, Hessling RM,
Gardner KA. Neighborhood context, personality, and stressful
life events as predictors of depression among African American
women. J Abnorm Psychol. 2005;114(1):3–15.
17. Gary TL, Stark SA, LaVeist TA. Neighborhood characteristics
and mental health among African Americans and Whites living in
a racially integrated urban community. Health Place.
2007;13(2):569–75.
18. Echeverria S, Diez-Roux AV, Shea S, Borrell LN, Jackson S.
Association of neighborhood problems and neighborhood social
cohesion with mental health and health behaviors: the Multi-
Ethnic Study of Atherosclerosis. Health Place.
2008;14(4):853–65.
19. Sampson RJ, Raudenbush SW, Earls F. Neighborhoods and
violent crime: a multilevel study of collective efficacy. Science.
1997;277(5328):918–24.
20. Sampson RJ. The neighborhood context of well-being. Perspect
Biol Med. 2003;46(3):S53–64.
21. Hasin DS, Goodwin RD, Stinson FS, Grant BF. Epidemiology of
major depressive disorder. Results from the National Epidemio-
logic Survey on alcoholism and related conditions. Arch Gen
Psychiat. 2005;62(10):1097–106.
22. Kessler RC. Epidemiology of women and depression. J Affect
Disord. 2003;74(1):5–13.
23. Paul KI, Moser K. Unemployment impairs mental health: meta-
analyses. J Vocat Behav. 2009;74:264–82.
24. Golding JM, Burnam MA, Benjamin B, Wells KB. Risk factors
for secondary depression among Mexican Americans and non-
Hispanic Whites. J Nerv Ment Dis. 1993;181(3):166–75.
25. Grant BF, Stinson FS, Hasin DS, Dawson DA, Chou P, Anderson
K. Immigration and lifetime prevalence of DSM-IV psychiatric
disorders among Mexican Americans and non-Hispanic Whites in
the United States. Results from the National Epidemiologic
Survey on alcohol and related conditions. Arc Gen Psychiat.
2004;61:1226–33.
26. Grant BF, Stinson FS, Dawson DA, Chou P, Dufour MC,
Compton W, Pickering RP, Kaplan K. Prevalence and co-oc-
currence of substance use disorders and independent mood and
anxiety disorders. Results from the National Epidemiologic
Survey on alcohol and related conditions. Arch Gen Psychiat.
2004;61(8):807–16.
27. Sullivan LE, Fiellin DA, O’Connor PG. The prevalence and
impact of alcohol problems in major depression: a systematic
review. Am J Med. 2005;118(4):330–41.
28. Egede LE. Major depression in individuals with chronic medical
disorders: prevalence, correlates, and association with health
resource utilization, lost productivity, and functional disability.
Gen Hosp Psychiatry. 2007;29(5):409–16.
29. Katon W, Lin EHB, Kroenke K. The association of depression
and anxiety with medical symptom burden in patients with
chronic medical illness. Gen Hosp Psychiat. 2007;29(2):147–55.
30. Moussavi S, Chatterji S, Verdes E, Tandon A, Patel V, Ustun B.
Depression, chronic diseases, and decrements in health: results
from the World Health Surveys. Lancet. 2007;370(9590):851–8.
31. Radloff LS. The CES-D Scale: a self-report depression scale for
research in the general population. Appl Psych Meas.
1977;1:385–401.
32. Radloff L, Locke BZ. The community mental health survey and
the CES-D scale. In: Weissman MM, Myers JK, Ross CE, editors.
Community surveys of psychiatric disorders. New Brunswick:
Rutgers University Press; 1986. p. 177–89.
33. Moore AA, Gould R, Reuben DB, Greendale GA, Carter K,
Karlamangla ZK. Longitudinal pattern and predictors of alcohol
consumption in the United States. Am J Public Health.
2005;95:458–65.
34. Caetano R, Mills BA. Vaeth PAC. Alcohol consumption and
binge drinking among U.S.–Mexico border and non-border
Mexican Americans. Alcohol Clin Exp Res. 2012;36(4):667–85.
35. Ramisetty-Mikler S, Caetano R, Rodriguez LA. The 2006 His-
panic Americans Baseline Alcohol Survey (HABLAS): alcohol
consumption patterns and sociodemographic predictors among
Hispanic national groups in the United States. J Subst Use.
2010;15(6):402–16.
36. Room R. Measuring alcohol consumption in the U.S.: methods
and rationales. In: Clark WB, Hilton ME, editors. Alcohol in
America. Drinking practices and problems. Albany: State
University of New York Press; 1991.
37. Greenfield TK, Kerr WC. Alcohol measurement methodology in
epidemiology: recent advances and opportunities [Review].
Addiction. 2008;103(7):1082–99.
38. National Institute on Alcohol Abuse and Alcoholism. NIAAA
council approved definition of binge drinking. No. 3. Publications
Distribution Center; Rockville, MD. NIAAA Newsletter; p.3.
http://pubs.niaaa.nih.gov/publications/Newsletter/winter2004/
Newsletter_Number3.pdf. Accessed 25 June 2014.
39. Edwards G, Gross MM. Alcohol dependence: provisional
description of a clinical syndrome. Brit Med J. 1976;1:1058–61.
40. Hilton ME. Demographic characteristics and the frequency of
heavy drinking as predictors of self-reported problems. In: Clark
WB, Hilton ME, editors. Alcohol in America. Drinking practices
and problems. Albany: State University of New York Press; 1991.
41. Vaeth PAC, Caetano R, Ramisetty-Mikler S, Rodriguez LA.
Hispanic Americans Baseline Alcohol Survey (HABLAS): alco-
hol-related problems across Hispanic National Groups. J Stud
Alcohol Drugs. 2009;70:991–9.
42. Caetano R, McGrath C, Ramisetty-Mikler S, Field CA. Drinking,
alcohol problems and five-year recurrence and incidence of male
to female and female to male partner violence. Alcohol Clin Exp
Res. 2005;29(1):98–106.
43. Caetano R, Kaskutas LA. Changes in drinking problems among
Whites, Blacks, and Hispanics, 1984–1992. Subst Use Misuse.
1996;31:1547–71.
44. Caetano R. Acculturation and drinking patterns among US His-
panics. Brit J Addict. 1987;82:789–99.
45. StataCorp. Stata statistical software: release 13. College Station:
StataCorp LP; 2013.
46. Caetano R, Mills BA. The Hispanic Americans Baseline Alcohol
Survey (HABAS): is the ‘‘Prevention Paradox’’ applicable to
alcohol problems across Hispanic national groups? Alcohol Clin
Exp Res. 2011;35(7):1256–64.
J Immigrant Minority Health
123

47. Carlin JB, Galati JC, Royston P. A new framework for managing
and analyzing multiply imputed data in Stata. Stata J.
2008;8(1):49–67.
48. Rubin DB. The calculation of posterior distributions by data
augmentation: comment: a noniterative sampling/importance
resampling alternative to the data augmentation algorithm for
creating a few imputations when fractions of missing information
are modest: The SIR algorithm. J Am Stat Assoc.
1987;82(398):543–6.
49. Caetano R, Vaeth PAC, Mills BA, Rodriguez LA. Alcohol abuse
and dependence among U.S.–Mexico border and non-border
Mexican Americans. Alcohol Clin Exp Res. 2013;37(5):847–53.
50. Ganster P, Lorey D. The U.S.–Mexican Border into the Twenty-
first Century. Plymouth: Rowman & Littlefield Publishers, Inc.;
2008.
51. Martinez OJ, Lorey D. Border people: life and society in the
U.S.–Mexico borderlands, vol. 2. Tucson: The University of
Arizona Press; 1994.
52. Vaeth PAC, Ramisetty-Mikler S, Caetano R. Depression among
couples in the United States in the context of intimate partner
violence. J Interpers Violence. 2010;25(5):771–90.
53. Moore G. Structural determinants of men’s and women’s per-
sonal networks. Am Soc Rev. 1990;55(5):726–35.
54. Munch A, McPherson JM, Smith-Lovin L. Gender, children, and
social contact: the effects of childrearing for men and women.
Am Soc Rev. 1997;62(4):509–20.
55. Uchino BN, Cacioppo JT, Kiecolt-Glaser JK. The relationship
between social support and physiological processes: a review
with emphasis on underlying mechanisms and implications for
health. Psychol Bull. 1996;119(3):488–531.
56. Marquez RR, Romo HD. Transformations of La Familia on the
U.S.–Mexico border. Notre Dame: University of Notre Dame
Press; 2008.
57. Ryan-Ibarra S, Epstein JF, Induni M, Wright MA. Current
depression among women in California according to residence in
the California–Mexico border region. Rev Panam Salud Publica.
2012;31(5):417–26.
58. Gavin AR, Walton E, Chae DH, Alegrıa M, Jackson JS, Takeuchi
D. The associations between socioeconomic status and major
depressive disorder among Blacks, Latinos, Asians, and non-
Hispanic Whites. Psychol Med. 2010;40(1):51–61.
59. Cook B, Alegrıa M, Lin JY, Guo J. Pathways and correlates
connecting Latinos’ mental health with exposure to the United
States. Am J Public Health. 2009;99(12):2247–54.
60. Treno AJ, Alaniz ML, Gruenewald PJ. The use of drinking places
by gender, age and ethnic groups: an analysis of routine drinking
activities. Addiction. 2000;95(4):537–51.
61. Mills BA, Caetano R. Decomposing associations between
acculturation and drinking in Mexican Americans. Alcohol Clin
Exp Res. 2012;36:1205–11.
62. Caetano R, Baruah J, Ramisetty-Mikler S, Ebama MS. Sociode-
mographic predictors of pattern and volume of alcohol con-
sumption across Hispanics, Blacks, and Whites: 10-year trend
(1992–2002). Alcohol Clin Exp Res. 2010;34(10):1782–92.
63. Caetano R, Clark CL. Trends in alcohol consumption patterns
among Whites, Blacks and Hispanics: 1984 and 1995. J Stud
Alcohol. 1998;59(6):659–68.
64. Keller MB, Lavori PW, Mueller TI, Endicott J, Coryell W,
Hirschfeld RM, Shea T. Time to recovery, chronicity, and levels
of psychopathology in major depression. A 5-year prospective
follow-up of 431 subjects. Arch Gen Psychiat.
1992;49(10):809–16.
65. Weissman MM, Sholomskas D, Pottenger M, Prusoff BA, Locke
BZ. Assessing depressive symptoms in five psychiatric popula-
tions: a validation study. Am J Epidemiol. 1977;106(3):203–14.
66. U.S. Census. Hispanic Americans by the numbers: from the U.S.
Census Bureau. 2014. http://www.infoplease.com/spot/hhmcen
sus1.html. Accessed 26 May 2015.
J Immigrant Minority Health
123


