Embed Size (px)
Citation preview
�����������������
Citation: Wang, W.; Watanabe, M.;
Ono, K.; Zhou, D. Exploring
Visualisation Methodology of
Landscape Design on Rural Tourism
in China. Buildings 2022, 12, 64.
https://doi.org/10.3390/buildings
12010064
Academic Editor: Hernan Casakin
Received: 8 December 2021
Accepted: 4 January 2022
Published: 10 January 2022
Publisher’s Note: MDPI stays neutral
with regard to jurisdictional claims in
published maps and institutional affil-
iations.
Copyright: © 2022 by the authors.
Licensee MDPI, Basel, Switzerland.
This article is an open access article
distributed under the terms and
conditions of the Creative Commons
Attribution (CC BY) license (https://
creativecommons.org/licenses/by/
4.0/).
buildings
Article
Exploring Visualisation Methodology of Landscape Design onRural Tourism in ChinaWeijia Wang 1,*, Makoto Watanabe 2, Kenta Ono 2 and Donghong Zhou 3
1 Graduate School of Engineering, Chiba University, Yayoi-cho 1-33, Inage-ku, Chiba 263-8522, Japan2 Division of Design Science, Faculty of Engineering, Chiba University, Yayoi-cho 1-33, Inage-ku,
Chiba 263-8522, Japan; [email protected] (M.W.); [email protected] (K.O.)3 School of Design, China Academy of Art, Hangzhou 310002, China; [email protected]* Correspondence: [email protected]
Abstract: Rural tourism has become a hot topic in China in the context of the nation’s rural revitalisa-tion. Rural tourism allows tourists to experience local life and promotes local economic development.However, there is considerable controversy over the landscape design of ancient Chinese villages.Many problems, such as how to design and protect the landscape of these ancient villages and howto improve the tourist experience, are not resolved. For our research object, we selected the ancientGaotiankeng Village in Kaihua County, Zhejiang Province. Using questionnaires, image interviews,and some user experience techniques such as mental maps, we collected user experience data by as-sessing design cases. The visualisation method presented a wide range of experience in the landscapeand planning field. This study primarily used computer image processing, image entropy calculation,and colour mapping to process the data. A visualisation framework was defined to highlight thelandscape aesthetics, landscape service, and tourists’ emotion. The results indicated the relationshipof three elements. The objective of our study was to develop a method of landscape design andplanning that can effectively enhance tourists’ experience and provide practical suggestions for rurallandscapes and relatively better services.
Keywords: visualisation methodology; landscape design; tourists’ experience; landscape aesthetics;entropy
1. Introduction
The rural issues that China faces are a priority for the Chinese government. Thedevelopment of local economy through tourism is one of the most promising approaches.Design and landscape planning methods provide an opportunity for the rural tourismindustry to enhance tourist experience. According to People’s Daily Online [1], fromJanuary to August 2020, the total number of local tourists travelling in rural places was1.207 billion, which generated a total income of CNY 592.5 billion, an operating rate of94.5%, and 10.61 million jobs in the industry. Although rural design and rural tourism hasbecome a sought-after topic, the development and utilisation of ancient villages presentsome limitations. The landscape design and planning efficiency has not been completelyrealised, causing some wastage of resources and ecological destruction. Homogenisationor standardised design has affected many ancient villages in China, leading them to losetheir original culture and traditional characteristics, leading them to become similar to acommunity within a city.
In the last six decades since 1960, considerable progress has been witnessed in land-scape visualisation through the work of photography [2,3]. Several major technologies,such as eyes-tracking images, have been developed to determine user perception andexperience. The literature has revealed that six mapping methods are predominantlyavailable for visual landscape research [4]: compartment analysis, 3D landscapes, grid-cellanalysis, visibility analysis, landscape metrics, and eye-tracking analysis. Entropy images
Buildings 2022, 12, 64. https://doi.org/10.3390/buildings12010064 https://www.mdpi.com/journal/buildings
Buildings 2022, 12, 64 2 of 20
are used to connect visualisation with landscape aesthetics, which emphasise the subjectiveimpressions of visual complexity in landscape scenes [5]. However, no specific visualisationframework is available for designers or planners to evaluate and improve tourist experiencethrough the design method. Therefore, designers and planners cannot directly use thevisualisation method to improve user experience through design projects.
According to Andrew Lovett [6], the visualisation method should answer three mainquestions: ‘when’? (to use the visualisation method), ‘what’? (to include the information),and ‘how’? (to display the information). A standardised expression is provided for thevisualisation method for such a framework. The following points summarise the maincontributions of this study:
1. A visualisation method is proposed to evaluate user experience during an entire trip.2. A new visualisation framework is proposed to analyse the correlation among
emotion (user experience), landscape aesthetics (type), and landscape services (active andpassive enjoyment), and the results show the models of this relationship.
3. The use the visualisation method is discussed.The purpose of this study was to study and discuss the possibility of using visual
methods to help design and planning for rural tourism user experience. A relativelycomplete visualisation framework was proposed using related user experience designmethods. This framework was applied in the rural design and planning to render it highlypractical. Simultaneously, the framework was used to improve tourist experience underthe premise of protecting the culture of ancient villages.
2. Literature Review2.1. Background of Ancient Villages
The rural landscape is to a large extent a historical product, integrating the positivefactors of society and environment [7]. Providing a unique cultural value is indispensableand a core necessity for ancient villages. The Chinese government has promoted the ruralland consolidation project from top to bottom at an unprecedented scale in recent years,vigorously developing tourism projects with the help of the excellent natural resourceslocated in the countryside. The extension and expansion have continued in numerousvillages, especially ancient villages [8].
An ancient village is similar to a museum: it contains treasures, and serves to conveyregional culture and represent history. Therefore, an interdisciplinary exploration andpractice is indispensable for current landscape designs. At the same time, dynamic thinkingcan reduce the hidden risks of the loss of ecological and cultural landscapes [9]. Forexample, it can help to determine approaches to design and offer service through touristuser experience. The relevant content of the design cooperates with the planning anddesign of the landscape to enhance the tourist experience. Such designs are creative [10],and can organically combine ecology and human perception and reflect a respect for theecological environment [11].
The historical landscape of ancient villages in China is an essential element of suchvillages. Rural settlements, where people gather and settle down, are also space for peoplein the city and villages to gather. These landscapes are not merely rural buildings, but alsopublic facilities for residents [12] and have their own cultural attributes. Consequently, arural settlement is a community with architectural form and people: it contains variousactivities, economic activities, and active elements.
2.2. Landscape Service in Rural Places
To begin, two changes are critical in the context of the Anthropocene [13,14]. First, theemphasis on the ecological environment has become mainstream; second, the approachto utilise the full potential of the initiative of the people shaping the ecosystem throughnot only design, but also through economic and social development. The process anddynamics of designing and implementing nature-based solutions [15] include creating andusing multidisciplinary and interdisciplinary knowledge, which helps reach solutions that
Buildings 2022, 12, 64 3 of 20
successfully balance economic, social, and ecological goals. Planning and conceptualisationmust occur at various levels instead of on the basis of one-sided decisions [16].
Landscape service indicates that human activities, as well as biological and nonbi-ological factors, together shape the landscape. The interdisciplinary concept integratesadditional services related to providing space [17]. Tiziano Cattaneo et al. [18] proposedthe use of the design as a tool that would serve to revive the lost relationship betweenthe environment, culture, heritage, and citizens to promote inclusive tourism as a meansfor social integration. Tourism promotes local development, while increased tourism in-frastructure provides access to new areas. This new access positively affects the visitorrate [19]. Rural development is driven by rural tourism. With the recent increase in thenumber of tourists in ancient villages, many tourists have shown great expectations fromancient villages. From their visits, they can learn about the local people and traditionallocal culture. The wisdom of traditional culture cannot be ignored [20].
The landscape, being the core of tourist attractions, acts as the start and end factorwhich attracts tourists, prompting them to evaluate the experience as satisfactory [21].Aesthetic perceptions and preferences can be location-specific for most people, based onlocal geographic and cultural characteristics, moral beliefs, life experience, and the useof specific areas. Therefore, this tour is a continuous superimposing of past personalexperience with actual activities, and it depends on the individual.
Roy Haines-Young and Marion Potschin grouped landscape services [22] and land-scape service (LS) classification under the Common International Classification of Ecosys-tem Services (CICES):
• Provisioning: nutrition, material, energy, daily activities;• Regulation and maintenance: regulation of wastes, flow regulation, regulation of
physical environment, regulation of biotic environment, regulation of the spatialstructure;
• Cultural and social class: health, enjoyment, self-fulfilment (personal), social fulfilment.
‘Passive enjoyment’ is considered to be an attractive atmosphere that does not requirehuman intervention. Created by nature, this atmosphere may be a quiet place for readingor the opportunity to see what cannot be seen in the city: wild animals or cultural, historiclandscapes, and heritage structures [23], providing human aesthetic appreciation. On theother hand, ‘active enjoyment’ gives visitors either the possibility of interacting with thelandscape or participating in the atmosphere. In this case, the distance between humansand the landscape is reduced. This allows visitors to enjoy time with nature, such asthrough hiking, swimming, gardening, hunting, or fishing and provides children play andrecreational opportunities, such as tourism, ecotourism, and research activities [24]. Iftourism is considered as a means of social inclusion and resource, social innovation in thefield of community development can be interpreted as modifying the process of planning,governance, and design in order to improve the participation of communities, residents,and tourists. The focus is then on a collaborative and innovative society in the context ofrural communities.
2.3. Visualization Methods Based on Landscape Atheistic
Various forms of visual communication have a long history in environmental manage-ment (Table 1), especially in landscape architecture and planning [25].
Visualisation has a dual advantage: it can realistically improve virtual viewing abil-ity and the degree of interaction while significantly reducing related costs. The use ofvisualisation as a participatory tool continues to expand. The opportunities and demandsfor visualisation are increasing with the participation of members of the public and thedevelopment of the landscape planning field, covering a more comprehensive range ofissues. Beatrice John et al. used decision-visualisation environments to obtain an active de-velopment network and form an efficient discussion community [26]. They also organisedactivities and shared their indirections, made suggestions for design and planning, anddetermined whether the differences in viewing behaviour were complicated [2]. The differ-
Buildings 2022, 12, 64 4 of 20
ence in degree is relative, while the complexity is represented by the spectral entropy of thephoto. The eye-tracking experiment serves to measure visual behaviour when observingphotos. More urbanised landscapes offer more extensive and decentralised exploration [27].
Table 1. Development of visualisation in the landscape.
Years Methodology Literature
1960 Photographs and photomontages have been widely used. [2,3]
1990 CAD, GIS and landscape visualization software enhanced the possibilitiesfor digital representation. [28]
In the past decadeThe availability of free virtual globe software has opened up additional
opportunities for real-time display, particularly given the scope forcustomization and incorporation of 3D buildings or vegetation.
[29]
Currently
CAD or GIS database and then generate three main types of 3D outputs.1. Rendered still images (or scrolling panoramas) from defined viewpoints,
2. animatedsequences (showingfly-throughs along specified paths orchanges over time),
3. real-time models (or virtual worlds) where the user has the ability tofreely navigate a landscape.
[6,28]
Using the entropy methods also combines different approach used in order to analysea specific scene. Pearson’s correlation coefficients calculated the eye-tracking metrics andthe inverse function of the spectral entropy. These results confirm the findings of theanalysis performed on the different urbanization classes, as they also indicate an increasein visual exploration when the visual complexity of the landscape image increases. Entropyis relevant to applications in environmental aesthetics [30]. Lien Dupont et al. computedif differences in viewing behaviour are related to differences in complexity, expressedby the photograph’s spectral entropy [27]. Numerous studies have shown that imageentropy is strongly correlated with rated visual diversity and complexity. Consequently,entropy strongly indicates subjective impressions of visual complexity in landscape scenes.Stamps mentioned that numerous studies have demonstrated image entropy to be highlycorrelated with rated visual diversity and with visual complexity [31]. Entropy, thus,strongly indicates subjective impressions of visual complexity in landscape scenes [5]. Thisconclusion is relevant for our study, which is concerned with the visual complexity of alandscape view as perceived and experienced by people.
3. Case Study Selection and Survey Method3.1. Gaotiankeng Village
The Gaotiankeng Village (Figure 1) is located in Quzhou, in western Zhejiang Province,at an altitude of approximately 700 m and has a history spanning approximately 800 years.Here, the average temperature in summer is approximately 5 ◦C lower than that in thesurrounding areas, making it a natural summer tourist spot. Although the mountain peak isnot high, Shan Lan is surrounded by beautiful scenery and blue sky. It is also the best pointto observe starry sky in the Donghua area. The Gaotiankeng Village is a typical ancientvillage from the area south of the Yangtze River. The buildings in the village mainly consistof rammed earth structures, with various shapes and spectacular views. The villagers stillretain a simple lifestyle of digging ponds in front of their own houses to feed freshwaterfish, a feature that has excellent development potential.
Buildings 2022, 12, 64 5 of 20
Buildings 2022, 12, x FOR PEER REVIEW 5 of 22
The Gaotiankeng Village (Figure 1) is located in Quzhou, in western Zhejiang Prov-
ince, at an altitude of approximately 700 m and has a history spanning approximately 800
years. Here, the average temperature in summer is approximately 5 °C lower than that in
the surrounding areas, making it a natural summer tourist spot. Although the mountain
peak is not high, Shan Lan is surrounded by beautiful scenery and blue sky. It is also the
best point to observe starry sky in the Donghua area. The Gaotiankeng Village is a typical
ancient village from the area south of the Yangtze River. The buildings in the village
mainly consist of rammed earth structures, with various shapes and spectacular views.
The villagers still retain a simple lifestyle of digging ponds in front of their own houses to
feed freshwater fish, a feature that has excellent development potential.
Figure 1. Location and the panoramic rendering of Gaotiankeng Village. Google map link:
https://www.google.com/maps/@29.3125082,118.2288567,966m/data=!3m1!1e3!5m1!1e4. (Accessed
date on 12 December 2017).
3.2. Design Goals and Outcomes
Four design goals have been defined based on the planning and designing project:
building and design, environment, community inclusion, and economic growth. We es-
tablished different design outputs across the project. As shown in Figure 2, for the design
and planning of the Gaotiankeng Village, we created 30 nodes in the main tour route. The
output is the concrete expression of the four set goals, and the overall design and planning
of the landscape’s appearance, location, material, service content, etc. were performed.
Figure 2 clearly indicates that the design output of the four goals overlaps to a certain
extent. For example, the improvement of community tolerance is closely linked to land-
scape design and environment creation. The rural does not need high-cost design; instead,
it requires flexible design and a layout with extensible functions.
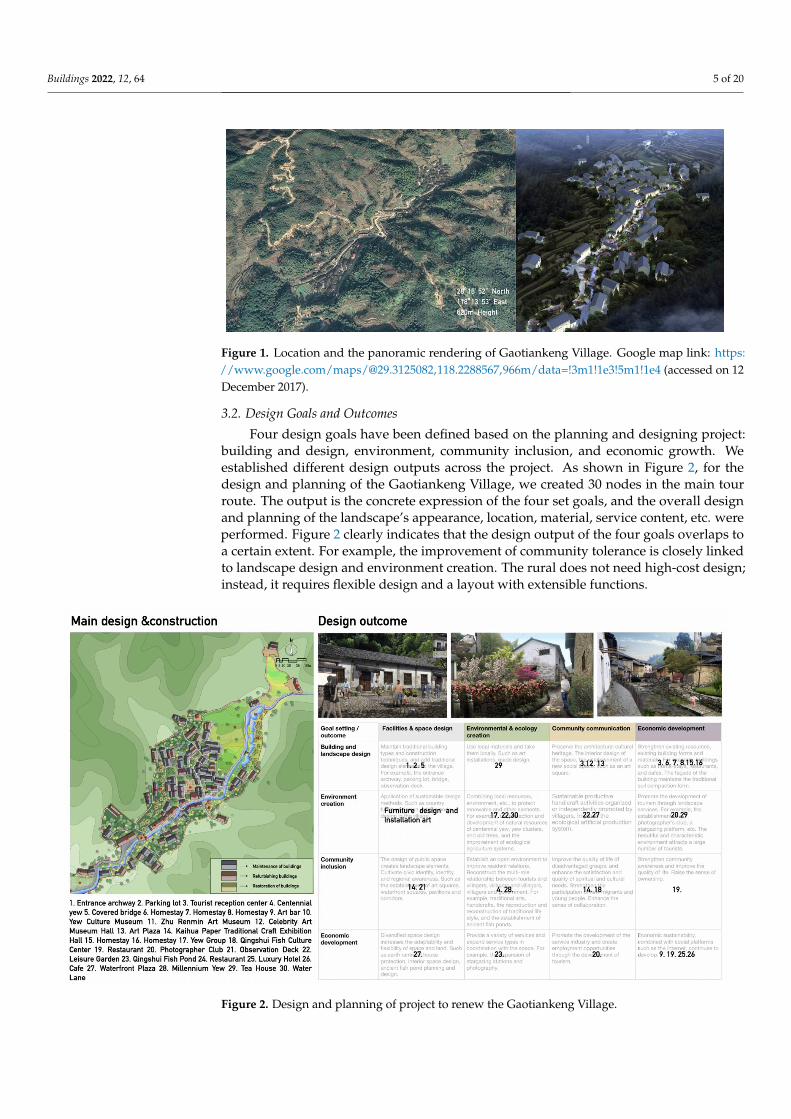
Figure 1. Location and the panoramic rendering of Gaotiankeng Village. Google map link: https://www.google.com/maps/@29.3125082,118.2288567,966m/data=!3m1!1e3!5m1!1e4 (accessed on 12December 2017).
3.2. Design Goals and Outcomes
Four design goals have been defined based on the planning and designing project:building and design, environment, community inclusion, and economic growth. Weestablished different design outputs across the project. As shown in Figure 2, for thedesign and planning of the Gaotiankeng Village, we created 30 nodes in the main tourroute. The output is the concrete expression of the four set goals, and the overall designand planning of the landscape’s appearance, location, material, service content, etc. wereperformed. Figure 2 clearly indicates that the design output of the four goals overlaps toa certain extent. For example, the improvement of community tolerance is closely linkedto landscape design and environment creation. The rural does not need high-cost design;instead, it requires flexible design and a layout with extensible functions.
Buildings 2022, 12, x FOR PEER REVIEW 6 of 22
Figure 2. Design and planning of project to renew the Gaotiankeng Village.
3.3. Survey Method
To understand the user’s landscape and service preferences, we used questionnaires,
mental maps, and photo interviews. Furthermore, we took a tour and conducted a record-
ing to produce a comprehensive view of the user’s perception and aesthetics. The tourist’s
perception of the landscape and their preferences when traveling are highly complicated
and can be disturbed by many external substances. Therefore, our approach involved a
timely inquiry. Photos provide a visual stimulation that matches real life. The landscape
experience is positive, since the photos holistically show the landscape [32]. Due to this,
perception-based assessment is highly reliable and is suitable for capturing people’s land-
scape preferences [33]. Measuring the biophysical characteristics of the landscape and its
spatial layout allows us to quantitatively describe the visual characteristics of the land-
scape [34].
Along with this, we also used an image questionnaire. A total of 20 tourists partici-
pated in our survey of questionnaires and interviews. The female participants outnum-
bered the male participants (56.8% vs. 43.2%). The questionnaires were based on a Likert
scale, 5-point with indicating ‘not at all’ and indicating 5 ‘very much’. Among the 32 tour-
ists who followed the survey, 26 took the same route (as the main tour route) (Figure 3),
and the 20 tourists who participated were from this group. The survey was an image ques-
tionnaire, with a total of 12 equidistant nodes for tourists to score and evaluate. Since
many buildings served as the display or experience spaces of traditional culture, the types
of services provided by the landscapes were different. We classified these according to the
enjoyment of landscape service, but the service content level—such as service attitude and
service quality—were not considered in this study. The interviews served to collect as
much comprehensive information about user experience as possible.
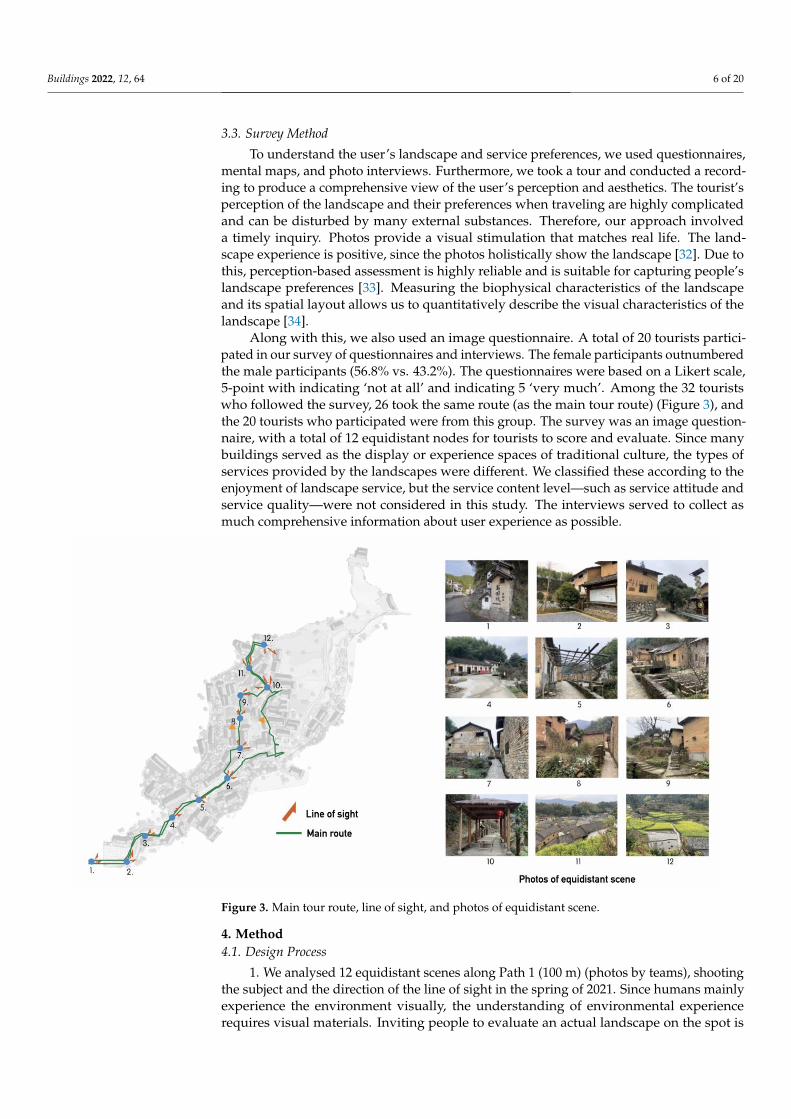
Figure 2. Design and planning of project to renew the Gaotiankeng Village.
Buildings 2022, 12, 64 6 of 20
3.3. Survey Method
To understand the user’s landscape and service preferences, we used questionnaires,mental maps, and photo interviews. Furthermore, we took a tour and conducted a record-ing to produce a comprehensive view of the user’s perception and aesthetics. The tourist’sperception of the landscape and their preferences when traveling are highly complicatedand can be disturbed by many external substances. Therefore, our approach involveda timely inquiry. Photos provide a visual stimulation that matches real life. The land-scape experience is positive, since the photos holistically show the landscape [32]. Due tothis, perception-based assessment is highly reliable and is suitable for capturing people’slandscape preferences [33]. Measuring the biophysical characteristics of the landscapeand its spatial layout allows us to quantitatively describe the visual characteristics of thelandscape [34].
Along with this, we also used an image questionnaire. A total of 20 tourists partici-pated in our survey of questionnaires and interviews. The female participants outnumberedthe male participants (56.8% vs. 43.2%). The questionnaires were based on a Likert scale,5-point with indicating ‘not at all’ and indicating 5 ‘very much’. Among the 32 touristswho followed the survey, 26 took the same route (as the main tour route) (Figure 3), andthe 20 tourists who participated were from this group. The survey was an image question-naire, with a total of 12 equidistant nodes for tourists to score and evaluate. Since manybuildings served as the display or experience spaces of traditional culture, the types ofservices provided by the landscapes were different. We classified these according to theenjoyment of landscape service, but the service content level—such as service attitude andservice quality—were not considered in this study. The interviews served to collect asmuch comprehensive information about user experience as possible.
Buildings 2022, 12, x FOR PEER REVIEW 7 of 22
Figure 3. Main tour route, line of sight, and photos of equidistant scene.
4. Method
4.1. Design Process
1. We analysed 12 equidistant scenes along Path 1 (100 m) (photos by teams), shoot-
ing the subject and the direction of the line of sight in the spring of 2021. Since humans
mainly experience the environment visually, the understanding of environmental experi-
ence requires visual materials. Inviting people to evaluate an actual landscape on the spot
is expensive and time-consuming. It also limits the types of landscapes that can be studied
by restricting the location; thus, using a specific location and case is a suitable choice. Con-
cerns about the representation validity of photos in visual landscape assessment can be
found in the literature. For example, Marjanne Sevenant compares three stimuli: in-situ
landscape, panoramic, and standard normal photos. The site landscape in this study was
evaluated during the field visit, indicating that standard formal photos were more suitable
for measuring landscape preference variables [35]. Each point in a total of 12 equidistant
points was measured on the mainline and photographed. The measurement started from
the village entrance and ended with the viewing platform on the top of the mountain.
2. Computer image processing and the depth of field was utilised to distinguish be-
tween the foreground, middle ground, and background [36]. The foreground and back-
ground elements in the visualisation play important roles in determining the tourists’ vis-
ual preferences, but the middle ground is key [36].
3. The picture was processed using image entropy processing. The formation of im-
age entropy is as follows:
𝐻 = −∑
𝑖
∑
𝑗
𝑃𝑖,𝑗lg𝑃𝑖,𝑗 (1)
The processing has two steps (Figure 4): the first step is the grayscale calculation for
the entropy of the photo, while the second step is to superimpose the original image and
use the rainbow colour template to map the entropy image to obtain the final 10-pixel
image. An entropy image is a collection of the entropy values of every image patch [37].
An entropy image is a collection of the entropy value of every image patch. (Signal Pro-
cessing: Image Communication, 2018)
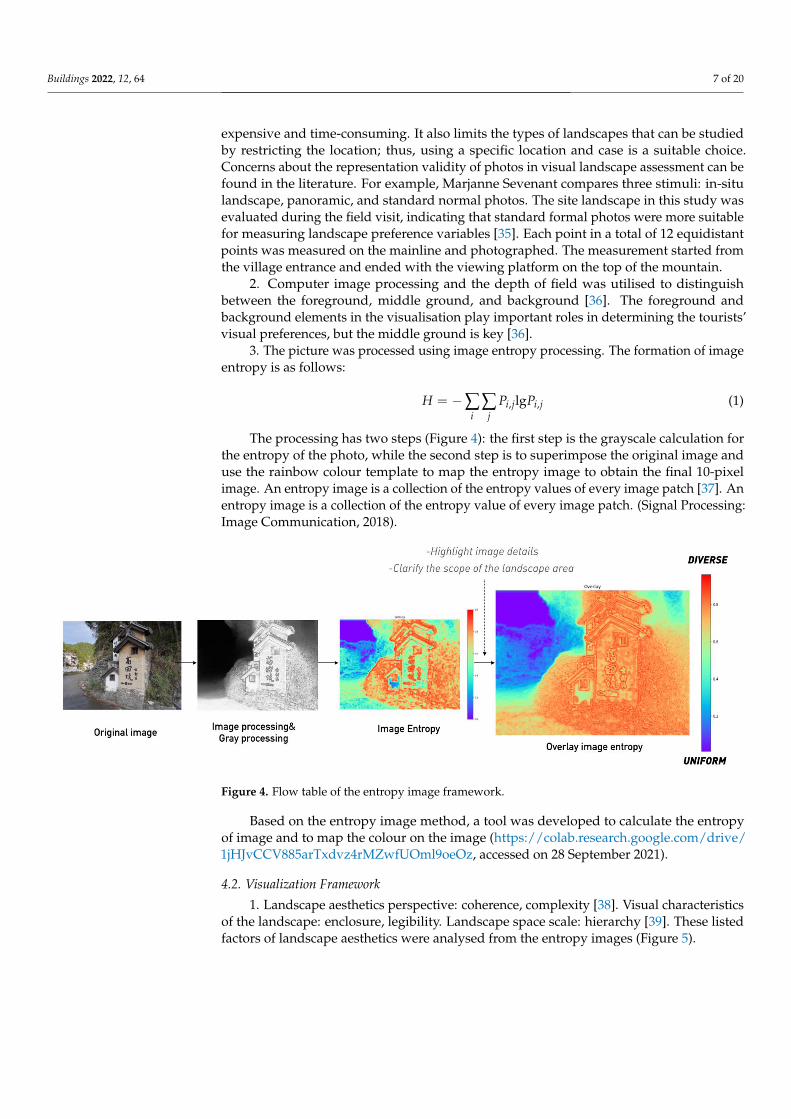
Figure 3. Main tour route, line of sight, and photos of equidistant scene.
4. Method4.1. Design Process
1. We analysed 12 equidistant scenes along Path 1 (100 m) (photos by teams), shootingthe subject and the direction of the line of sight in the spring of 2021. Since humans mainlyexperience the environment visually, the understanding of environmental experiencerequires visual materials. Inviting people to evaluate an actual landscape on the spot is
Buildings 2022, 12, 64 7 of 20
expensive and time-consuming. It also limits the types of landscapes that can be studiedby restricting the location; thus, using a specific location and case is a suitable choice.Concerns about the representation validity of photos in visual landscape assessment can befound in the literature. For example, Marjanne Sevenant compares three stimuli: in-situlandscape, panoramic, and standard normal photos. The site landscape in this study wasevaluated during the field visit, indicating that standard formal photos were more suitablefor measuring landscape preference variables [35]. Each point in a total of 12 equidistantpoints was measured on the mainline and photographed. The measurement started fromthe village entrance and ended with the viewing platform on the top of the mountain.
2. Computer image processing and the depth of field was utilised to distinguishbetween the foreground, middle ground, and background [36]. The foreground andbackground elements in the visualisation play important roles in determining the tourists’visual preferences, but the middle ground is key [36].
3. The picture was processed using image entropy processing. The formation of imageentropy is as follows:
H = −∑i
∑j
Pi,jlgPi,j (1)
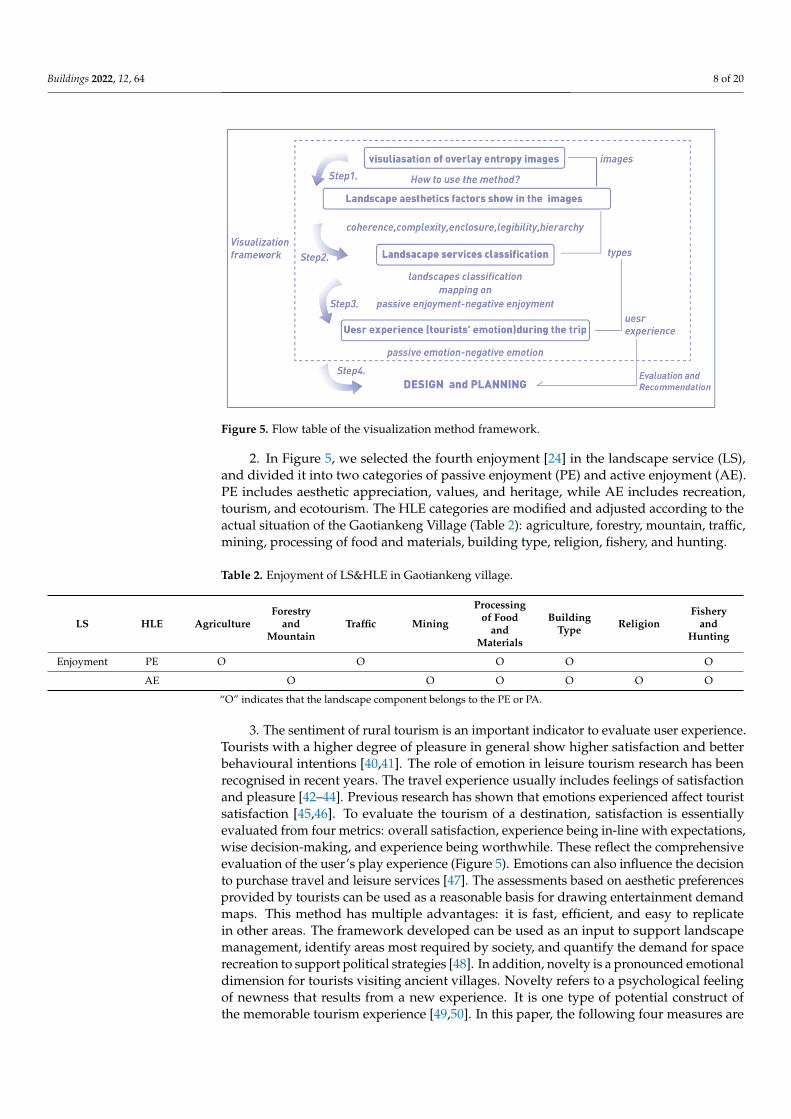
The processing has two steps (Figure 4): the first step is the grayscale calculation forthe entropy of the photo, while the second step is to superimpose the original image anduse the rainbow colour template to map the entropy image to obtain the final 10-pixelimage. An entropy image is a collection of the entropy values of every image patch [37]. Anentropy image is a collection of the entropy value of every image patch. (Signal Processing:Image Communication, 2018).
Buildings 2022, 12, x FOR PEER REVIEW 8 of 22
Figure 4. Flow table of the entropy image framework.
Based on the entropy image method, a tool was developed to calculate the entropy
of image and to map the colour on the image (https://colab.re-
search.google.com/drive/1jHJvCCV885arTxdvz4rMZwfUOml9oeOz, Accessed date on
28 September 2021).
4.2. Visualization framework
1. Landscape aesthetics perspective: coherence, complexity [38]. Visual characteris-
tics of the landscape: enclosure, legibility. Landscape space scale: hierarchy [39]. These
listed factors of landscape aesthetics were analysed from the entropy images (Figure 5).
Figure 5. Flow table of the visualization method framework.
2. In Figure 5, we selected the fourth enjoyment [24] in the landscape service (LS),
and divided it into two categories of passive enjoyment (PE) and active enjoyment (AE).
PE includes aesthetic appreciation, values, and heritage, while AE includes recreation,
tourism, and ecotourism. The HLE categories are modified and adjusted according to the
actual situation of the Gaotiankeng Village (Table 2): agriculture, forestry, mountain, traf-
fic, mining, processing of food and materials, building type, religion, fishery, and hunting.
Figure 4. Flow table of the entropy image framework.
Based on the entropy image method, a tool was developed to calculate the entropyof image and to map the colour on the image (https://colab.research.google.com/drive/1jHJvCCV885arTxdvz4rMZwfUOml9oeOz, accessed on 28 September 2021).
4.2. Visualization Framework
1. Landscape aesthetics perspective: coherence, complexity [38]. Visual characteristicsof the landscape: enclosure, legibility. Landscape space scale: hierarchy [39]. These listedfactors of landscape aesthetics were analysed from the entropy images (Figure 5).
Buildings 2022, 12, 64 8 of 20
Buildings 2022, 12, x FOR PEER REVIEW 8 of 22
Figure 4. Flow table of the entropy image framework.
Based on the entropy image method, a tool was developed to calculate the entropy
of image and to map the colour on the image (https://colab.re-
search.google.com/drive/1jHJvCCV885arTxdvz4rMZwfUOml9oeOz, Accessed date on
28 September 2021).
4.2. Visualization framework
1. Landscape aesthetics perspective: coherence, complexity [38]. Visual characteris-
tics of the landscape: enclosure, legibility. Landscape space scale: hierarchy [39]. These
listed factors of landscape aesthetics were analysed from the entropy images (Figure 5).
Figure 5. Flow table of the visualization method framework.
2. In Figure 5, we selected the fourth enjoyment [24] in the landscape service (LS),
and divided it into two categories of passive enjoyment (PE) and active enjoyment (AE).
PE includes aesthetic appreciation, values, and heritage, while AE includes recreation,
tourism, and ecotourism. The HLE categories are modified and adjusted according to the
actual situation of the Gaotiankeng Village (Table 2): agriculture, forestry, mountain, traf-
fic, mining, processing of food and materials, building type, religion, fishery, and hunting.
Figure 5. Flow table of the visualization method framework.
2. In Figure 5, we selected the fourth enjoyment [24] in the landscape service (LS),and divided it into two categories of passive enjoyment (PE) and active enjoyment (AE).PE includes aesthetic appreciation, values, and heritage, while AE includes recreation,tourism, and ecotourism. The HLE categories are modified and adjusted according to theactual situation of the Gaotiankeng Village (Table 2): agriculture, forestry, mountain, traffic,mining, processing of food and materials, building type, religion, fishery, and hunting.
Table 2. Enjoyment of LS&HLE in Gaotiankeng village.
LS HLE AgricultureForestry
andMountain
Traffic Mining
Processingof Food
andMaterials
BuildingType Religion
Fisheryand
Hunting
Enjoyment PE O O O O O
AE O O O O O O
“O” indicates that the landscape component belongs to the PE or PA.
3. The sentiment of rural tourism is an important indicator to evaluate user experience.Tourists with a higher degree of pleasure in general show higher satisfaction and betterbehavioural intentions [40,41]. The role of emotion in leisure tourism research has beenrecognised in recent years. The travel experience usually includes feelings of satisfactionand pleasure [42–44]. Previous research has shown that emotions experienced affect touristsatisfaction [45,46]. To evaluate the tourism of a destination, satisfaction is essentiallyevaluated from four metrics: overall satisfaction, experience being in-line with expectations,wise decision-making, and experience being worthwhile. These reflect the comprehensiveevaluation of the user’s play experience (Figure 5). Emotions can also influence the decisionto purchase travel and leisure services [47]. The assessments based on aesthetic preferencesprovided by tourists can be used as a reasonable basis for drawing entertainment demandmaps. This method has multiple advantages: it is fast, efficient, and easy to replicatein other areas. The framework developed can be used as an input to support landscapemanagement, identify areas most required by society, and quantify the demand for spacerecreation to support political strategies [48]. In addition, novelty is a pronounced emotionaldimension for tourists visiting ancient villages. Novelty refers to a psychological feelingof newness that results from a new experience. It is one type of potential construct ofthe memorable tourism experience [49,50]. In this paper, the following four measures are
Buildings 2022, 12, 64 9 of 20
selected as the evaluation dimensions and questionnaire design of the Gaotiankeng Village(Figure 6):
Buildings 2022, 12, x FOR PEER REVIEW 9 of 22
Table 2. Enjoyment of LS&HLE in Gaotiankeng village.
LS HLE Agriculture Forestry and
Mountain Traffic Mining
Processing of
Food and
Materials
Building
Type Religion
Fishery and
Hunting
Enjoyment PE O O O O O
AE O O O O O O
“O ”indicates that the landscape component belongs to the PE or PA.
3. The sentiment of rural tourism is an important indicator to evaluate user experi-
ence. Tourists with a higher degree of pleasure in general show higher satisfaction and
better behavioural intentions [40,41]. The role of emotion in leisure tourism research has
been recognised in recent years. The travel experience usually includes feelings of satis-
faction and pleasure [42–44]. Previous research has shown that emotions experienced af-
fect tourist satisfaction [45,46]. To evaluate the tourism of a destination, satisfaction is es-
sentially evaluated from four metrics: overall satisfaction, experience being in-line with
expectations, wise decision-making, and experience being worthwhile. These reflect the
comprehensive evaluation of the user’s play experience (Figure 5). Emotions can also in-
fluence the decision to purchase travel and leisure services [47]. The assessments based
on aesthetic preferences provided by tourists can be used as a reasonable basis for draw-
ing entertainment demand maps. This method has multiple advantages: it is fast, efficient,
and easy to replicate in other areas. The framework developed can be used as an input to
support landscape management, identify areas most required by society, and quantify the
demand for space recreation to support political strategies [48]. In addition, novelty is a
pronounced emotional dimension for tourists visiting ancient villages. Novelty refers to a
psychological feeling of newness that results from a new experience. It is one type of po-
tential construct of the memorable tourism experience [49,50]. In this paper, the following
four measures are selected as the evaluation dimensions and questionnaire design of the
Gaotiankeng Village (Figure 6):
Figure 6. Evaluation dimensions of emotion in questionnaire.
The image questionnaire survey method measured the negative and positive emo-
tions of the tourists according to the travel psychology evaluation scale. The four dimen-
sions are defined by the colour dimension CMYK (Figure 6). The survey results confirmed
the primary hue according to two parts with the highest scores.
4. As shown in Figure 7, we placed the ‘emotion, ’landscape atheistic factors’, and
‘landscape service’ parameters in a cube. The colour hue represents the emotion degree.
The entropy image shows that the landscape atheistic forms coherence, complexity, en-
closure, legibility, and hierarchy. For the service element according to the entropy image
result, the range is ‘0–1’ We split the whole value into three equal parts, and the parts with
the highest and lowest values were excluded. The adjacent values of three equal points,
0.83, 0.49, 0.17, which can be clear distinction in the visual ground, were taken. The colour
Figure 6. Evaluation dimensions of emotion in questionnaire.
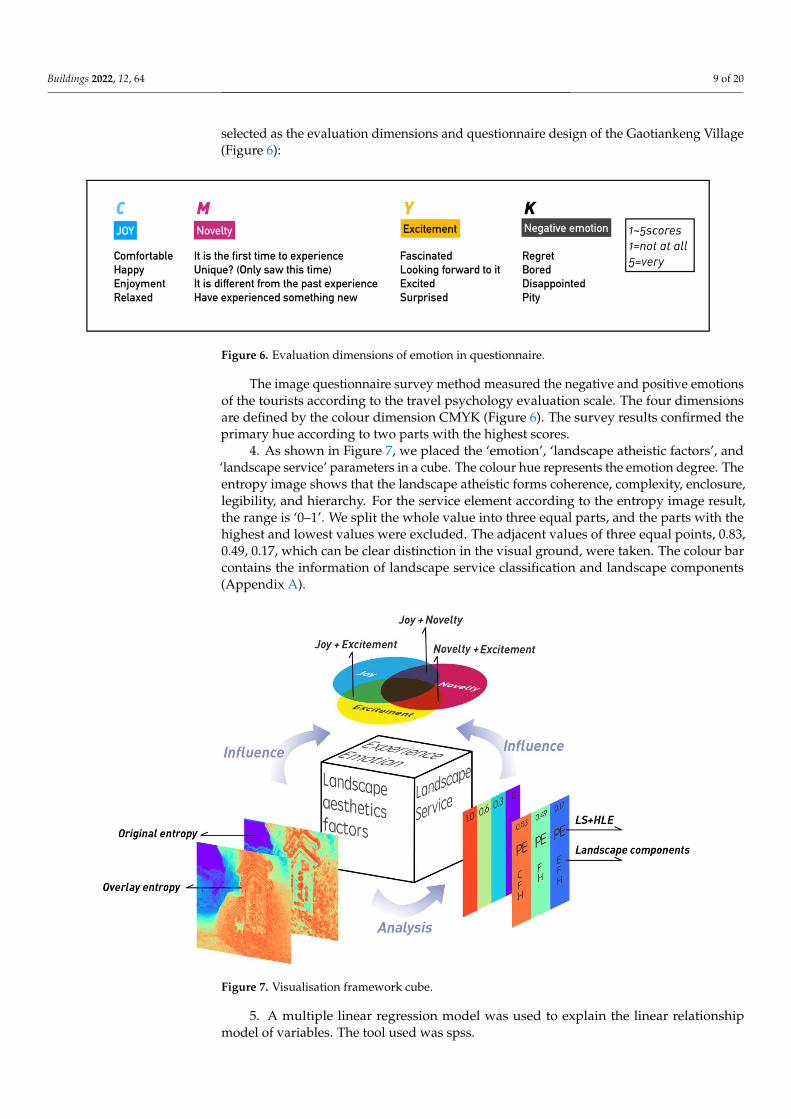
The image questionnaire survey method measured the negative and positive emotionsof the tourists according to the travel psychology evaluation scale. The four dimensionsare defined by the colour dimension CMYK (Figure 6). The survey results confirmed theprimary hue according to two parts with the highest scores.
4. As shown in Figure 7, we placed the ‘emotion’, ‘landscape atheistic factors’, and‘landscape service’ parameters in a cube. The colour hue represents the emotion degree. Theentropy image shows that the landscape atheistic forms coherence, complexity, enclosure,legibility, and hierarchy. For the service element according to the entropy image result,the range is ‘0–1’. We split the whole value into three equal parts, and the parts with thehighest and lowest values were excluded. The adjacent values of three equal points, 0.83,0.49, 0.17, which can be clear distinction in the visual ground, were taken. The colour barcontains the information of landscape service classification and landscape components(Appendix A).
Buildings 2022, 12, x FOR PEER REVIEW 10 of 22
bar contains the information of landscape service classification and landscape compo-
nents (Appendix A).
Figure 7. Visualisation framework cube.
5. A multiple linear regression model was used to explain the linear relationship
model of variables. The tool used was spss.
6. This framework cube could give the designers and planners practical recommen-
dations during the design project.
5. Result
5.1. Identity of Visualisation
5.1.1. Landscape Aesthetics Perspective: Coherence, Complexity
Ode et al. [38] used three dimensions to describe the visual landscape characteristics:
(1) the distribution of landscape elements, describing the richness and diversity of ele-
ments in the landscape; (2) the spatial organisation of landscape elements, describing the
arrangement of different components in space; and (3) the changes and shapes of elements
and patterns, describing the degree of changes in the landscape and the shapes of elements
and patterns. Research has shown that complexity and coherence are closely linked con-
cepts for the landscape experience of tourists [51]. Metrics for the arrangement of units
and the degree of repetition in the landscape are essential for describing the consistency
associated with complexity [38]. Therefore, capturing the changes and shapes of the land-
scape space, organisational elements and patterns are essential. Figure 8 shows that the
indicators of the arrangement of units in the landscape and the degree of repetition are
high. This is especially true for the architectural landscape and the road landscape, which
appear up to 9–10 times out of 12 times, giving continuity to the visitor experience.
Figure 7. Visualisation framework cube.
5. A multiple linear regression model was used to explain the linear relationshipmodel of variables. The tool used was spss.
Buildings 2022, 12, 64 10 of 20
6. This framework cube could give the designers and planners practical recommenda-tions during the design project.
5. Result5.1. Identity of Visualisation5.1.1. Landscape Aesthetics Perspective: Coherence, Complexity
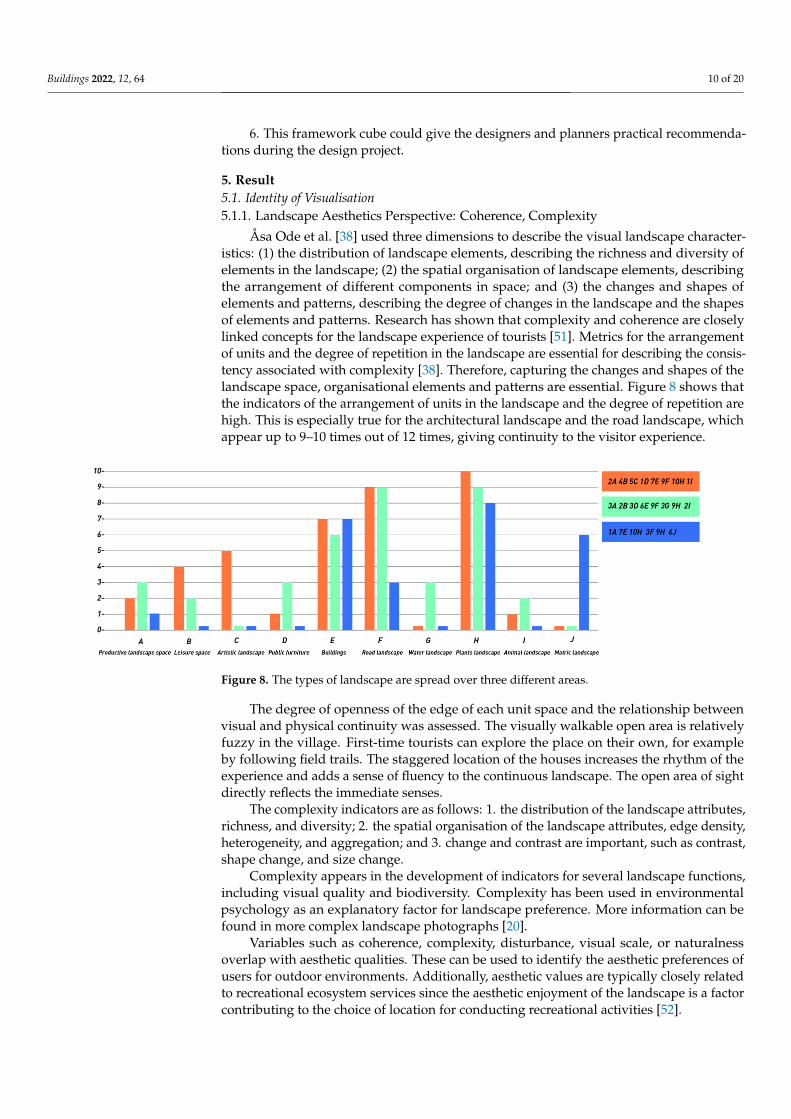
Åsa Ode et al. [38] used three dimensions to describe the visual landscape character-istics: (1) the distribution of landscape elements, describing the richness and diversity ofelements in the landscape; (2) the spatial organisation of landscape elements, describingthe arrangement of different components in space; and (3) the changes and shapes ofelements and patterns, describing the degree of changes in the landscape and the shapesof elements and patterns. Research has shown that complexity and coherence are closelylinked concepts for the landscape experience of tourists [51]. Metrics for the arrangementof units and the degree of repetition in the landscape are essential for describing the consis-tency associated with complexity [38]. Therefore, capturing the changes and shapes of thelandscape space, organisational elements and patterns are essential. Figure 8 shows thatthe indicators of the arrangement of units in the landscape and the degree of repetition arehigh. This is especially true for the architectural landscape and the road landscape, whichappear up to 9–10 times out of 12 times, giving continuity to the visitor experience.
Buildings 2022, 12, x FOR PEER REVIEW 11 of 22
Figure 8. The types of landscape are spread over three different areas.
The degree of openness of the edge of each unit space and the relationship between
visual and physical continuity was assessed. The visually walkable open area is relatively
fuzzy in the village. First-time tourists can explore the place on their own, for example by
following field trails. The staggered location of the houses increases the rhythm of the
experience and adds a sense of fluency to the continuous landscape. The open area of sight
directly reflects the immediate senses.
The complexity indicators are as follows: 1. the distribution of the landscape attrib-
utes, richness, and diversity; 2. the spatial organisation of the landscape attributes, edge
density, heterogeneity, and aggregation; and 3. change and contrast are important, such
as contrast, shape change, and size change.
Complexity appears in the development of indicators for several landscape func-
tions, including visual quality and biodiversity. Complexity has been used in environ-
mental psychology as an explanatory factor for landscape preference. More information
can be found in more complex landscape photographs [20].
Variables such as coherence, complexity, disturbance, visual scale, or naturalness
overlap with aesthetic qualities. These can be used to identify the aesthetic preferences of
users for outdoor environments. Additionally, aesthetic values are typically closely re-
lated to recreational ecosystem services since the aesthetic enjoyment of the landscape is
a factor contributing to the choice of location for conducting recreational activities [52].
5.1.2. Visual Characteristics of the Landscape: Enclosure, Legibility
As shown in Figure 9, we classified the 12 pictures into types of enclosures. Accord-
ing to the classification and description of Robinson’s permeability of enclosure [53], we
classified the enclosures in the pictures as visually enclosed, physically enclosed/visually
enclosed, physically open/visually open, physically enclosed/visually open, and physi-
cally open/visually open. We connected the type to each figure and marked it according
to the composition form of each figure. The first 10 pictures represent the nodes before the
summit and depict the process of traversing the village, with type one–three interspersed
with each other; 11–12 are type four, located at the top of the mountain and looking down
at the landscape, with a bird’s eye view of the village.
Figure 8. The types of landscape are spread over three different areas.
The degree of openness of the edge of each unit space and the relationship betweenvisual and physical continuity was assessed. The visually walkable open area is relativelyfuzzy in the village. First-time tourists can explore the place on their own, for exampleby following field trails. The staggered location of the houses increases the rhythm of theexperience and adds a sense of fluency to the continuous landscape. The open area of sightdirectly reflects the immediate senses.
The complexity indicators are as follows: 1. the distribution of the landscape attributes,richness, and diversity; 2. the spatial organisation of the landscape attributes, edge density,heterogeneity, and aggregation; and 3. change and contrast are important, such as contrast,shape change, and size change.
Complexity appears in the development of indicators for several landscape functions,including visual quality and biodiversity. Complexity has been used in environmentalpsychology as an explanatory factor for landscape preference. More information can befound in more complex landscape photographs [20].
Variables such as coherence, complexity, disturbance, visual scale, or naturalnessoverlap with aesthetic qualities. These can be used to identify the aesthetic preferences ofusers for outdoor environments. Additionally, aesthetic values are typically closely relatedto recreational ecosystem services since the aesthetic enjoyment of the landscape is a factorcontributing to the choice of location for conducting recreational activities [52].
Buildings 2022, 12, 64 11 of 20
5.1.2. Visual Characteristics of the Landscape: Enclosure, Legibility
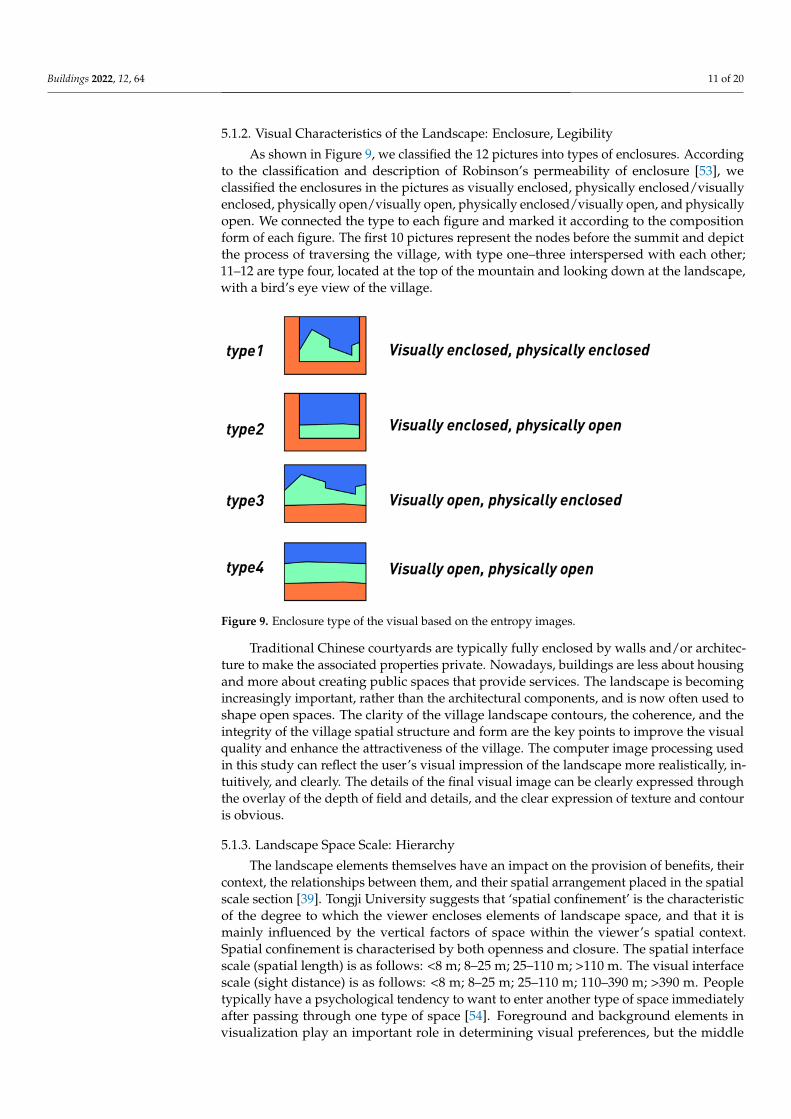
As shown in Figure 9, we classified the 12 pictures into types of enclosures. Accordingto the classification and description of Robinson’s permeability of enclosure [53], weclassified the enclosures in the pictures as visually enclosed, physically enclosed/visuallyenclosed, physically open/visually open, physically enclosed/visually open, and physicallyopen. We connected the type to each figure and marked it according to the compositionform of each figure. The first 10 pictures represent the nodes before the summit and depictthe process of traversing the village, with type one–three interspersed with each other;11–12 are type four, located at the top of the mountain and looking down at the landscape,with a bird’s eye view of the village.
Buildings 2022, 12, x FOR PEER REVIEW 12 of 22
Figure 9. Enclosure type of the visual based on the entropy images.
Traditional Chinese courtyards are typically fully enclosed by walls and/or architec-
ture to make the associated properties private. Nowadays, buildings are less about hous-
ing and more about creating public spaces that provide services. The landscape is becom-
ing increasingly important, rather than the architectural components, and is now often
used to shape open spaces. The clarity of the village landscape contours, the coherence,
and the integrity of the village spatial structure and form are the key points to improve
the visual quality and enhance the attractiveness of the village. The computer image pro-
cessing used in this study can reflect the user’s visual impression of the landscape more
realistically, intuitively, and clearly. The details of the final visual image can be clearly
expressed through the overlay of the depth of field and details, and the clear expression
of texture and contour is obvious.
5.1.3. Landscape Space Scale: Hierarchy
The landscape elements themselves have an impact on the provision of benefits, their
context, the relationships between them, and their spatial arrangement placed in the spa-
tial scale section [39]. Tongji University suggests that ‘spatial confinement’ is the charac-
teristic of the degree to which the viewer encloses elements of landscape space, and that
it is mainly influenced by the vertical factors of space within the viewer’s spatial context.
Spatial confinement is characterised by both openness and closure. The spatial interface
scale (spatial length) is as follows: <8 m; 8–25 m; 25–110 m; >110 m. The visual interface
scale (sight distance) is as follows: <8 m; 8–25 m; 25–110 m; 110–390 m; >390 m. People
typically have a psychological tendency to want to enter another type of space immedi-
ately after passing through one type of space [54]. Foreground and background elements
in visualization play an important role in determining visual preferences, but the middle
ground is the most important [34]. As shown in the Figure 7, there are four levels from 0
to 1. We removed the highest and lowest values, where the lowest value represented the
mid-play and sky views and the highest value represented the closest distance and com-
plex changing views, such as rocks and leaves. As shown in the image, the middle region
is divided into three parts: orange, green, and blue. According to the HLE classification,
we mapped the landscape types in three different regions.
5.2. Rhythm of Changes in Emotions
First, we defined the colours for the four emotions: joy, novelty, excitement, and neg-
ative emotion, according to which we could quickly identify the colours after superimpo-
sition. As shown in the diagram, joy + novelty = purple tones, joy + excitement = green
tones, novelty + excitement = red tones. As three colours are superimposed, the primary
Figure 9. Enclosure type of the visual based on the entropy images.
Traditional Chinese courtyards are typically fully enclosed by walls and/or architec-ture to make the associated properties private. Nowadays, buildings are less about housingand more about creating public spaces that provide services. The landscape is becomingincreasingly important, rather than the architectural components, and is now often used toshape open spaces. The clarity of the village landscape contours, the coherence, and theintegrity of the village spatial structure and form are the key points to improve the visualquality and enhance the attractiveness of the village. The computer image processing usedin this study can reflect the user’s visual impression of the landscape more realistically, in-tuitively, and clearly. The details of the final visual image can be clearly expressed throughthe overlay of the depth of field and details, and the clear expression of texture and contouris obvious.
5.1.3. Landscape Space Scale: Hierarchy
The landscape elements themselves have an impact on the provision of benefits, theircontext, the relationships between them, and their spatial arrangement placed in the spatialscale section [39]. Tongji University suggests that ‘spatial confinement’ is the characteristicof the degree to which the viewer encloses elements of landscape space, and that it ismainly influenced by the vertical factors of space within the viewer’s spatial context.Spatial confinement is characterised by both openness and closure. The spatial interfacescale (spatial length) is as follows: <8 m; 8–25 m; 25–110 m; >110 m. The visual interfacescale (sight distance) is as follows: <8 m; 8–25 m; 25–110 m; 110–390 m; >390 m. Peopletypically have a psychological tendency to want to enter another type of space immediatelyafter passing through one type of space [54]. Foreground and background elements invisualization play an important role in determining visual preferences, but the middle
Buildings 2022, 12, 64 12 of 20
ground is the most important [34]. As shown in the Figure 7, there are four levels from 0to 1. We removed the highest and lowest values, where the lowest value represented themid-play and sky views and the highest value represented the closest distance and complexchanging views, such as rocks and leaves. As shown in the image, the middle region isdivided into three parts: orange, green, and blue. According to the HLE classification, wemapped the landscape types in three different regions.
5.2. Rhythm of Changes in Emotions
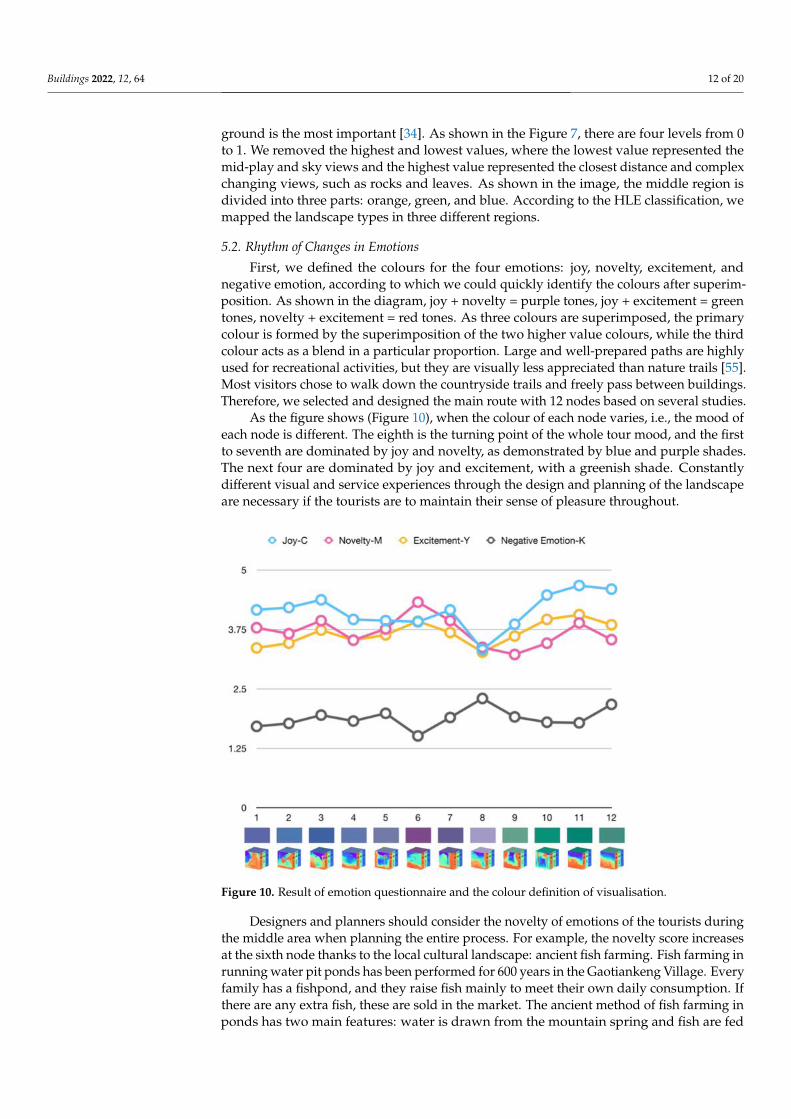
First, we defined the colours for the four emotions: joy, novelty, excitement, andnegative emotion, according to which we could quickly identify the colours after superim-position. As shown in the diagram, joy + novelty = purple tones, joy + excitement = greentones, novelty + excitement = red tones. As three colours are superimposed, the primarycolour is formed by the superimposition of the two higher value colours, while the thirdcolour acts as a blend in a particular proportion. Large and well-prepared paths are highlyused for recreational activities, but they are visually less appreciated than nature trails [55].Most visitors chose to walk down the countryside trails and freely pass between buildings.Therefore, we selected and designed the main route with 12 nodes based on several studies.
As the figure shows (Figure 10), when the colour of each node varies, i.e., the mood ofeach node is different. The eighth is the turning point of the whole tour mood, and the firstto seventh are dominated by joy and novelty, as demonstrated by blue and purple shades.The next four are dominated by joy and excitement, with a greenish shade. Constantlydifferent visual and service experiences through the design and planning of the landscapeare necessary if the tourists are to maintain their sense of pleasure throughout.
Buildings 2022, 12, x FOR PEER REVIEW 13 of 22
colour is formed by the superimposition of the two higher value colours, while the third
colour acts as a blend in a particular proportion. Large and well-prepared paths are highly
used for recreational activities, but they are visually less appreciated than nature trails
[55]. Most visitors chose to walk down the countryside trails and freely pass between
buildings. Therefore, we selected and designed the main route with 12 nodes based on
several studies.
As the figure shows (Figure 10), when the colour of each node varies, i.e., the mood
of each node is different. The eighth is the turning point of the whole tour mood, and the
first to seventh are dominated by joy and novelty, as demonstrated by blue and purple
shades. The next four are dominated by joy and excitement, with a greenish shade. Con-
stantly different visual and service experiences through the design and planning of the
landscape are necessary if the tourists are to maintain their sense of pleasure throughout.
Figure 10. Result of emotion questionnaire and the colour definition of visualisation.
Designers and planners should consider the novelty of emotions of the tourists dur-
ing the middle area when planning the entire process. For example, the novelty score in-
creases at the sixth node thanks to the local cultural landscape: ancient fish farming. Fish
farming in running water pit ponds has been performed for 600 years in the Gaotiankeng
Village. Every family has a fishpond, and they raise fish mainly to meet their own daily
consumption. If there are any extra fish, these are sold in the market. The ancient method
of fish farming in ponds has two main features: water is drawn from the mountain spring
and fish are fed on the grass in the mountains. The fishponds (Figure 11) in the village are
built along the mountain, with water coming in from high places and water coming out
from low places so that the grass carp are not muddy and, as a result, taste better. This
element of the human landscape is unique to the village; therefore, it is new and exciting
for foreign visitors. The uniqueness of the landscape highlights its difference from other
regions, and the creation of differentiation is also an essential topic of discussion in village
planning.
Figure 10. Result of emotion questionnaire and the colour definition of visualisation.
Designers and planners should consider the novelty of emotions of the tourists duringthe middle area when planning the entire process. For example, the novelty score increasesat the sixth node thanks to the local cultural landscape: ancient fish farming. Fish farming inrunning water pit ponds has been performed for 600 years in the Gaotiankeng Village. Everyfamily has a fishpond, and they raise fish mainly to meet their own daily consumption. Ifthere are any extra fish, these are sold in the market. The ancient method of fish farming inponds has two main features: water is drawn from the mountain spring and fish are fed
Buildings 2022, 12, 64 13 of 20
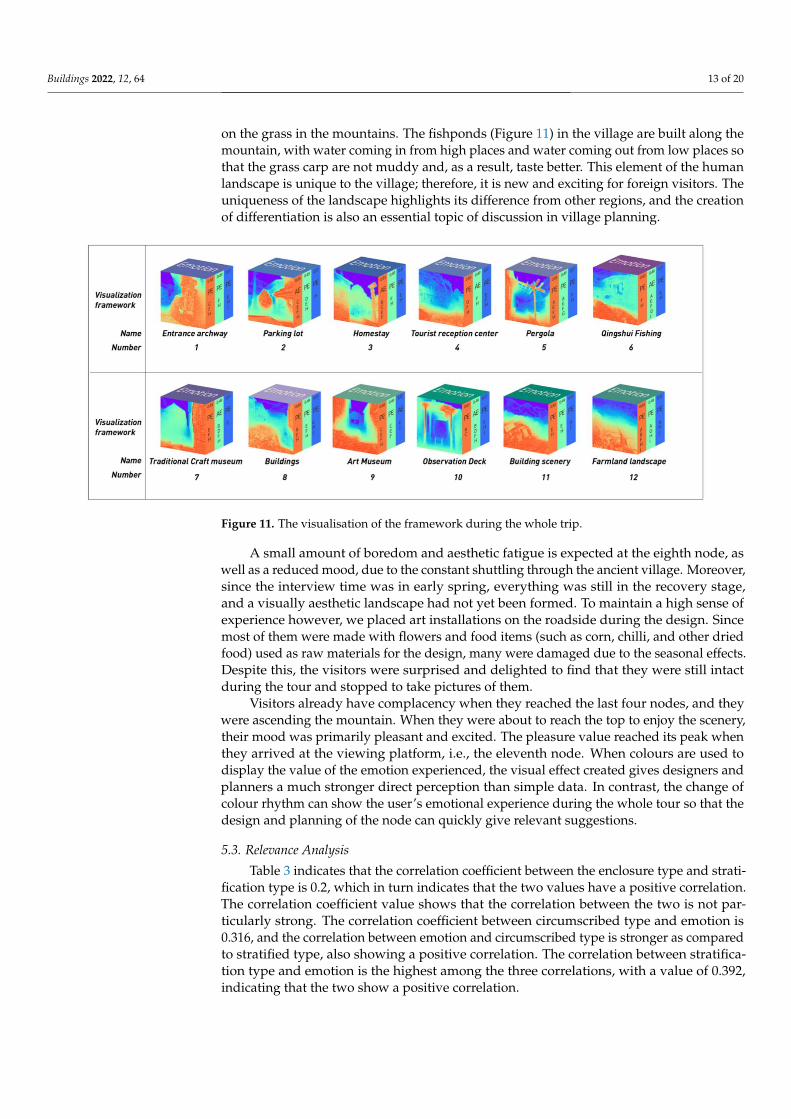
on the grass in the mountains. The fishponds (Figure 11) in the village are built along themountain, with water coming in from high places and water coming out from low places sothat the grass carp are not muddy and, as a result, taste better. This element of the humanlandscape is unique to the village; therefore, it is new and exciting for foreign visitors. Theuniqueness of the landscape highlights its difference from other regions, and the creationof differentiation is also an essential topic of discussion in village planning.
Buildings 2022, 12, x FOR PEER REVIEW 14 of 22
Figure 11. The visualisation of the framework during the whole trip.
A small amount of boredom and aesthetic fatigue is expected at the eighth node, as
well as a reduced mood, due to the constant shuttling through the ancient village. More-
over, since the interview time was in early spring, everything was still in the recovery
stage, and a visually aesthetic landscape had not yet been formed. To maintain a high
sense of experience however, we placed art installations on the roadside during the de-
sign. Since most of them were made with flowers and food items (such as corn, chilli, and
other dried food) used as raw materials for the design, many were damaged due to the
seasonal effects. Despite this, the visitors were surprised and delighted to find that they
were still intact during the tour and stopped to take pictures of them.
Visitors already have complacency when they reached the last four nodes, and they
were ascending the mountain. When they were about to reach the top to enjoy the scenery,
their mood was primarily pleasant and excited. The pleasure value reached its peak when
they arrived at the viewing platform, i.e., the eleventh node. When colours are used to
display the value of the emotion experienced, the visual effect created gives designers and
planners a much stronger direct perception than simple data. In contrast, the change of
colour rhythm can show the user’s emotional experience during the whole tour so that the
design and planning of the node can quickly give relevant suggestions.
Figure 11. The visualisation of the framework during the whole trip.
A small amount of boredom and aesthetic fatigue is expected at the eighth node, aswell as a reduced mood, due to the constant shuttling through the ancient village. Moreover,since the interview time was in early spring, everything was still in the recovery stage,and a visually aesthetic landscape had not yet been formed. To maintain a high sense ofexperience however, we placed art installations on the roadside during the design. Sincemost of them were made with flowers and food items (such as corn, chilli, and other driedfood) used as raw materials for the design, many were damaged due to the seasonal effects.Despite this, the visitors were surprised and delighted to find that they were still intactduring the tour and stopped to take pictures of them.
Visitors already have complacency when they reached the last four nodes, and theywere ascending the mountain. When they were about to reach the top to enjoy the scenery,their mood was primarily pleasant and excited. The pleasure value reached its peak whenthey arrived at the viewing platform, i.e., the eleventh node. When colours are used todisplay the value of the emotion experienced, the visual effect created gives designers andplanners a much stronger direct perception than simple data. In contrast, the change ofcolour rhythm can show the user’s emotional experience during the whole tour so that thedesign and planning of the node can quickly give relevant suggestions.
5.3. Relevance Analysis
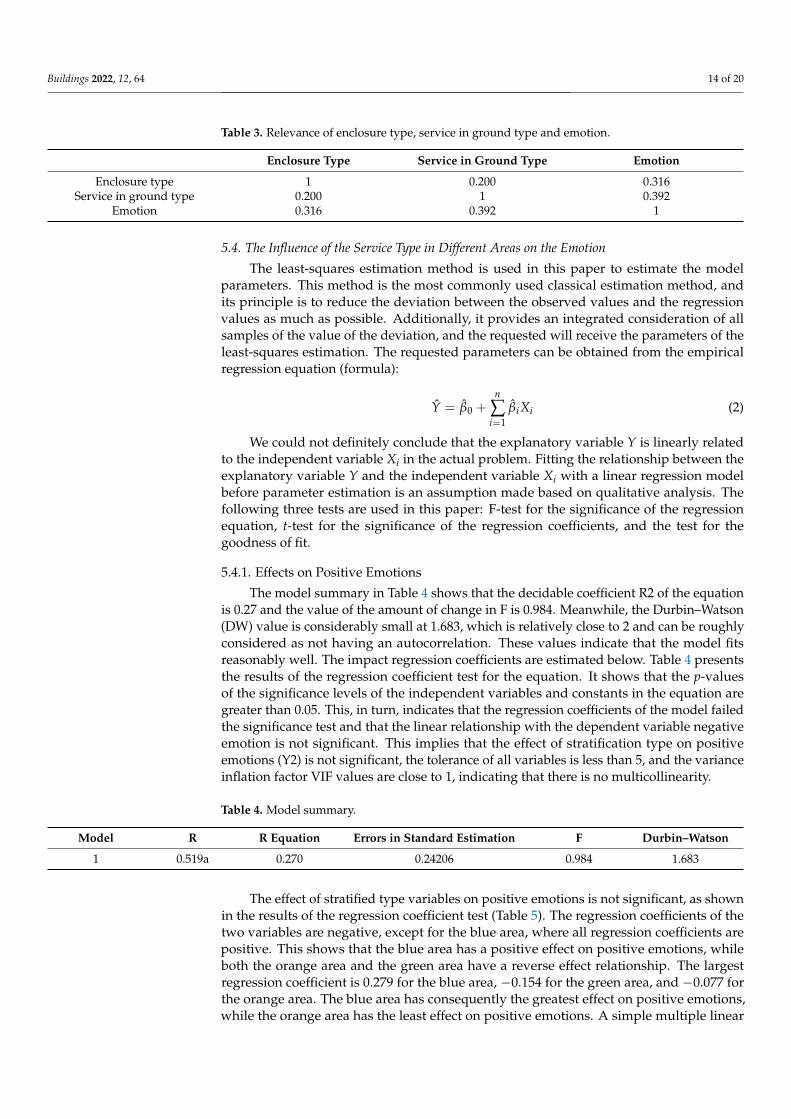
Table 3 indicates that the correlation coefficient between the enclosure type and strati-fication type is 0.2, which in turn indicates that the two values have a positive correlation.The correlation coefficient value shows that the correlation between the two is not par-ticularly strong. The correlation coefficient between circumscribed type and emotion is0.316, and the correlation between emotion and circumscribed type is stronger as comparedto stratified type, also showing a positive correlation. The correlation between stratifica-tion type and emotion is the highest among the three correlations, with a value of 0.392,indicating that the two show a positive correlation.
Buildings 2022, 12, 64 14 of 20
Table 3. Relevance of enclosure type, service in ground type and emotion.
Enclosure Type Service in Ground Type Emotion
Enclosure type 1 0.200 0.316Service in ground type 0.200 1 0.392
Emotion 0.316 0.392 1
5.4. The Influence of the Service Type in Different Areas on the Emotion
The least-squares estimation method is used in this paper to estimate the modelparameters. This method is the most commonly used classical estimation method, andits principle is to reduce the deviation between the observed values and the regressionvalues as much as possible. Additionally, it provides an integrated consideration of allsamples of the value of the deviation, and the requested will receive the parameters of theleast-squares estimation. The requested parameters can be obtained from the empiricalregression equation (formula):
Y = β0 +n
∑i=1
βiXi (2)
We could not definitely conclude that the explanatory variable Y is linearly relatedto the independent variable Xi in the actual problem. Fitting the relationship between theexplanatory variable Y and the independent variable Xi with a linear regression modelbefore parameter estimation is an assumption made based on qualitative analysis. Thefollowing three tests are used in this paper: F-test for the significance of the regressionequation, t-test for the significance of the regression coefficients, and the test for thegoodness of fit.
5.4.1. Effects on Positive Emotions
The model summary in Table 4 shows that the decidable coefficient R2 of the equationis 0.27 and the value of the amount of change in F is 0.984. Meanwhile, the Durbin–Watson(DW) value is considerably small at 1.683, which is relatively close to 2 and can be roughlyconsidered as not having an autocorrelation. These values indicate that the model fitsreasonably well. The impact regression coefficients are estimated below. Table 4 presentsthe results of the regression coefficient test for the equation. It shows that the p-valuesof the significance levels of the independent variables and constants in the equation aregreater than 0.05. This, in turn, indicates that the regression coefficients of the model failedthe significance test and that the linear relationship with the dependent variable negativeemotion is not significant. This implies that the effect of stratification type on positiveemotions (Y2) is not significant, the tolerance of all variables is less than 5, and the varianceinflation factor VIF values are close to 1, indicating that there is no multicollinearity.
Table 4. Model summary.
Model R R Equation Errors in Standard Estimation F Durbin–Watson
1 0.519a 0.270 0.24206 0.984 1.683
The effect of stratified type variables on positive emotions is not significant, as shownin the results of the regression coefficient test (Table 5). The regression coefficients of thetwo variables are negative, except for the blue area, where all regression coefficients arepositive. This shows that the blue area has a positive effect on positive emotions, whileboth the orange area and the green area have a reverse effect relationship. The largestregression coefficient is 0.279 for the blue area, −0.154 for the green area, and −0.077 forthe orange area. The blue area has consequently the greatest effect on positive emotions,while the orange area has the least effect on positive emotions. A simple multiple linear
Buildings 2022, 12, 64 15 of 20
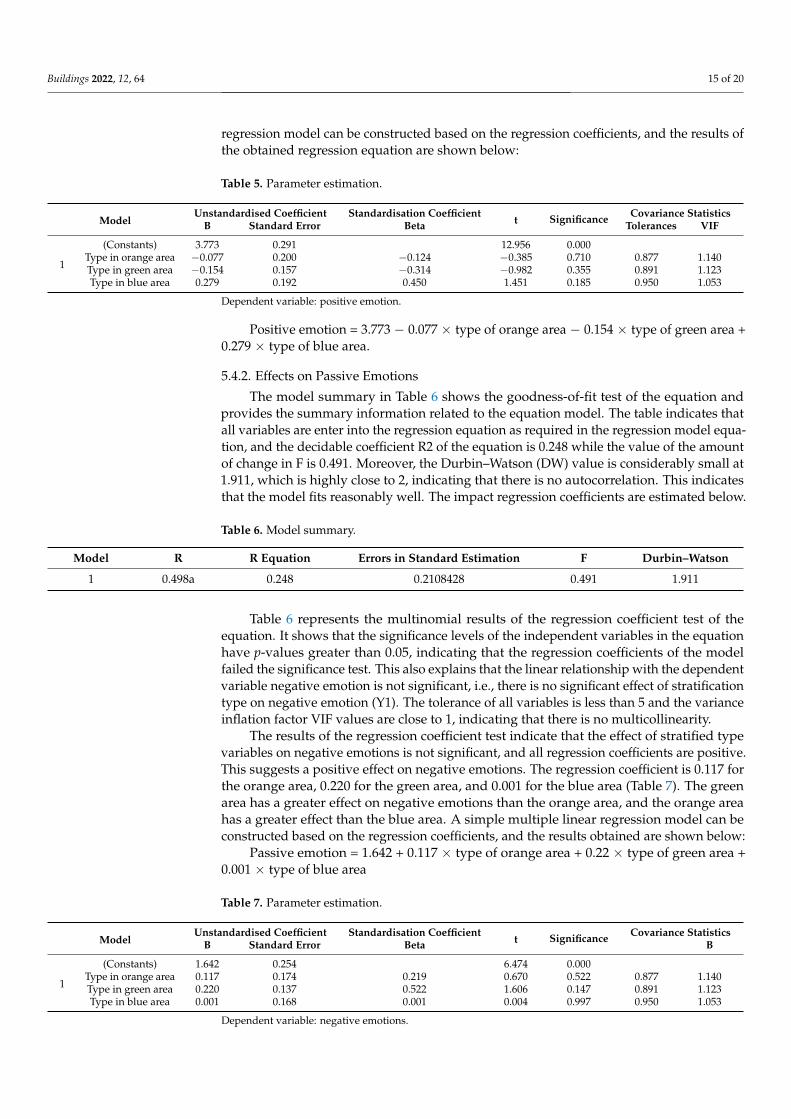
regression model can be constructed based on the regression coefficients, and the results ofthe obtained regression equation are shown below:
Table 5. Parameter estimation.
ModelUnstandardised Coefficient Standardisation Coefficient
t Significance Covariance StatisticsB Standard Error Beta Tolerances VIF
1
(Constants) 3.773 0.291 12.956 0.000Type in orange area −0.077 0.200 −0.124 −0.385 0.710 0.877 1.140Type in green area −0.154 0.157 −0.314 −0.982 0.355 0.891 1.123Type in blue area 0.279 0.192 0.450 1.451 0.185 0.950 1.053
Dependent variable: positive emotion.
Positive emotion = 3.773 − 0.077 × type of orange area − 0.154 × type of green area +0.279 × type of blue area.
5.4.2. Effects on Passive Emotions
The model summary in Table 6 shows the goodness-of-fit test of the equation andprovides the summary information related to the equation model. The table indicates thatall variables are enter into the regression equation as required in the regression model equa-tion, and the decidable coefficient R2 of the equation is 0.248 while the value of the amountof change in F is 0.491. Moreover, the Durbin–Watson (DW) value is considerably small at1.911, which is highly close to 2, indicating that there is no autocorrelation. This indicatesthat the model fits reasonably well. The impact regression coefficients are estimated below.
Table 6. Model summary.
Model R R Equation Errors in Standard Estimation F Durbin–Watson
1 0.498a 0.248 0.2108428 0.491 1.911
Table 6 represents the multinomial results of the regression coefficient test of theequation. It shows that the significance levels of the independent variables in the equationhave p-values greater than 0.05, indicating that the regression coefficients of the modelfailed the significance test. This also explains that the linear relationship with the dependentvariable negative emotion is not significant, i.e., there is no significant effect of stratificationtype on negative emotion (Y1). The tolerance of all variables is less than 5 and the varianceinflation factor VIF values are close to 1, indicating that there is no multicollinearity.
The results of the regression coefficient test indicate that the effect of stratified typevariables on negative emotions is not significant, and all regression coefficients are positive.This suggests a positive effect on negative emotions. The regression coefficient is 0.117 forthe orange area, 0.220 for the green area, and 0.001 for the blue area (Table 7). The greenarea has a greater effect on negative emotions than the orange area, and the orange areahas a greater effect than the blue area. A simple multiple linear regression model can beconstructed based on the regression coefficients, and the results obtained are shown below:
Passive emotion = 1.642 + 0.117 × type of orange area + 0.22 × type of green area +0.001 × type of blue area
Table 7. Parameter estimation.
ModelUnstandardised Coefficient Standardisation Coefficient
t Significance Covariance StatisticsB Standard Error Beta B
1
(Constants) 1.642 0.254 6.474 0.000Type in orange area 0.117 0.174 0.219 0.670 0.522 0.877 1.140Type in green area 0.220 0.137 0.522 1.606 0.147 0.891 1.123Type in blue area 0.001 0.168 0.001 0.004 0.997 0.950 1.053
Dependent variable: negative emotions.
Buildings 2022, 12, 64 16 of 20
6. Discussion
When producing mental maps with the tourists, our team found that they were highlycautious in selecting their destinations. They have a basic understanding of the locallandscape features, culture, etc. Whether through articles, social media, or advertisements,they get a general image of the characteristics of the village before visiting it. They alsomaintain a sense of anticipation and curiosity. The results show that the type of servicein the blue area has a positive effect on positive emotions, while the type of service inboth the green and orange areas has a reverse effect on them. Since the trip scenario in theGaotiankeng Village can be similar to the hiking scene, the tourists had expectations alongthese lines. Therefore, the planning and design of the type of blue area is often easy toignore, whereas the environment and the landscape or services affect the emotions duringthe trip.
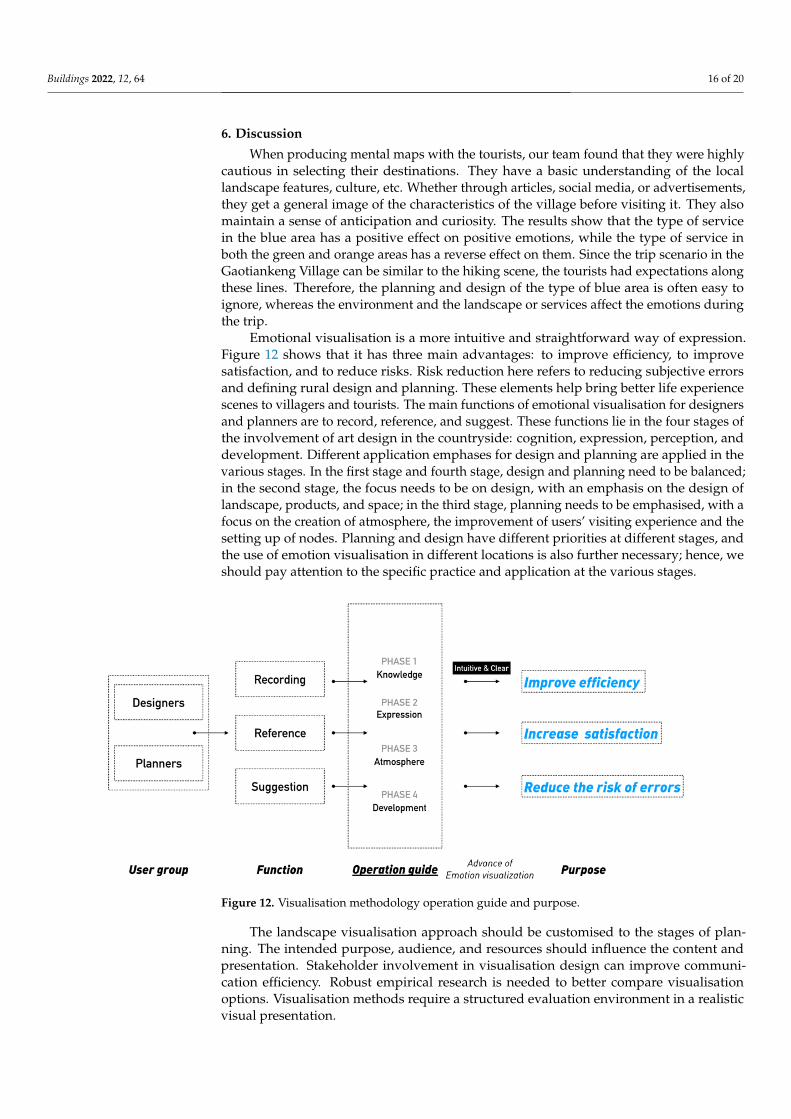
Emotional visualisation is a more intuitive and straightforward way of expression.Figure 12 shows that it has three main advantages: to improve efficiency, to improvesatisfaction, and to reduce risks. Risk reduction here refers to reducing subjective errorsand defining rural design and planning. These elements help bring better life experiencescenes to villagers and tourists. The main functions of emotional visualisation for designersand planners are to record, reference, and suggest. These functions lie in the four stages ofthe involvement of art design in the countryside: cognition, expression, perception, anddevelopment. Different application emphases for design and planning are applied in thevarious stages. In the first stage and fourth stage, design and planning need to be balanced;in the second stage, the focus needs to be on design, with an emphasis on the design oflandscape, products, and space; in the third stage, planning needs to be emphasised, with afocus on the creation of atmosphere, the improvement of users’ visiting experience and thesetting up of nodes. Planning and design have different priorities at different stages, andthe use of emotion visualisation in different locations is also further necessary; hence, weshould pay attention to the specific practice and application at the various stages.
Buildings 2022, 12, x FOR PEER REVIEW 18 of 22
Figure 12. Visualisation methodology operation guide and purpose.
The landscape visualisation approach should be customised to the stages of plan-
ning. The intended purpose, audience, and resources should influence the content and
presentation. Stakeholder involvement in visualisation design can improve communica-
tion efficiency. Robust empirical research is needed to better compare visualisation op-
tions. Visualisation methods require a structured evaluation environment in a realistic
visual presentation.
In more conceptual terms, visualisations represent a mechanism to support the
‘boundary management’ functions [56] as crucial for the creation of knowledge systems
underpinning sustainable development. However, assessing aesthetic values remains
challenging, since they are only partially defined by the biophysical characteristics of the
landscape that can be quantitatively described (e.g., vegetation type, spatial pattern)
[57,58]. Hence, the limitations of this visualization method are difficult to assess all the
aesthetic values, but this method can assess the main factors of aesthetics. The visualiza-
tion framework needs to process one step by step, there were different results would ap-
pear if one of the steps’ results are different. Mostly, the mental factors and perception
factors depend on the individual. Therefore, the topic needs further thought.
First, the quantification of landscape services assessment needs to be given im-
portance. The assessment of landscape services essentially deals with the complex and
dynamic relationship between humans and the environment. Quantification helps plan-
ners and designers solve real problems and promote the ecological development of rural
tourism.
Second, the relationship between emotion and landscape needs to be explored. Beau-
tiful environments are dependent on human perception and aesthetics, and the environ-
ment is the ambiance that people can perceive. Therefore, quantifying the atmosphere and
presenting the data in a simple and clear form are essential for stakeholders to be able to
create a beautiful environment together.
Third, the historical expression of the cultural landscape, such as the ancient camphor
tree in the village, carries sentimental value for visitors. This emotion is deeper and richer
than the general sense of ‘beauty’. Therefore, special attention should be paid to the emo-
tional impact of such historical landscape services on people. Designers should ‘moderate
design’ and avoid ‘excessive design’ to avoid destroying the carrier of people’s feelings.
7. Conclusions
Figure 12. Visualisation methodology operation guide and purpose.
The landscape visualisation approach should be customised to the stages of plan-ning. The intended purpose, audience, and resources should influence the content andpresentation. Stakeholder involvement in visualisation design can improve communi-cation efficiency. Robust empirical research is needed to better compare visualisationoptions. Visualisation methods require a structured evaluation environment in a realisticvisual presentation.
Buildings 2022, 12, 64 17 of 20
In more conceptual terms, visualisations represent a mechanism to support the ‘bound-ary management’ functions [56] as crucial for the creation of knowledge systems underpin-ning sustainable development. However, assessing aesthetic values remains challenging,since they are only partially defined by the biophysical characteristics of the landscapethat can be quantitatively described (e.g., vegetation type, spatial pattern) [57,58]. Hence,the limitations of this visualization method are difficult to assess all the aesthetic values,but this method can assess the main factors of aesthetics. The visualization frameworkneeds to process one step by step, there were different results would appear if one of thesteps’ results are different. Mostly, the mental factors and perception factors depend on theindividual. Therefore, the topic needs further thought.
First, the quantification of landscape services assessment needs to be given importance.The assessment of landscape services essentially deals with the complex and dynamicrelationship between humans and the environment. Quantification helps planners anddesigners solve real problems and promote the ecological development of rural tourism.
Second, the relationship between emotion and landscape needs to be explored. Beauti-ful environments are dependent on human perception and aesthetics, and the environmentis the ambiance that people can perceive. Therefore, quantifying the atmosphere andpresenting the data in a simple and clear form are essential for stakeholders to be able tocreate a beautiful environment together.
Third, the historical expression of the cultural landscape, such as the ancient camphortree in the village, carries sentimental value for visitors. This emotion is deeper and richerthan the general sense of ‘beauty’. Therefore, special attention should be paid to the emo-tional impact of such historical landscape services on people. Designers should ‘moderatedesign’ and avoid ‘excessive design’ to avoid destroying the carrier of people’s feelings.
7. Conclusions
This paper presents a visualisation-based technique applied to enhance visitor ex-perience. This evaluated technique can be used to for landscape planning and design.We developed a visualisation framework and analysed the relationship among emotions(positive and negative emotions in user experience), landscape aesthetics (selected metrics:coherence, complexity, enclosure, legibility, hierarchy, which can be mapped on the entropyimage), and landscape services (active and passive enjoyment) in detail. From the visu-alisation framework, we can conclude that the indicators related to landscape aestheticsand services generate different emotions throughout the tour. Users experience a feelingof novelty and thus positive emotions for rare landscapes, whereas when the landscaperemains the same long periods of time, boredom and negative emotions are generated. Thelandscapes of the middle ground and background in the nodes’ images must be focusedwhile planning the type of landscape services, where a good atmosphere can generate posi-tive emotions and a bad atmosphere can lead to negative emotions. Designers and plannerstend to pay attention to the design of main objects in a specific project, and they typicallyignore the landscapes around the main object which influence the tourists’ experience.
Although the traditional visualisation method only shows a single aspect of informa-tion based on local landscape and geographical elements, this visualisation frameworkconnects landscape aesthetics, landscape services, and user experience, thereby causingemotional component visualisation and showing multiple aspects of information. Emotionvisualisation is the assessment tool and presentation method that can be utilised in ruraldesign planning. The positive and negative emotions generated by users during tourismcan inform and advise designers at different design stages to enhance user experience. Thevisualisation framework presented in this paper has general relevance, is not limited to aspecific location, and can be used in landscape design, landscape planning, route planning,and landscape services.
This study selected an ancient village in western Zhejiang, China, as the design andplanning sample to preserve the cultural landscape of the village and to showcase the localculture and characteristics to a large extent to visitors. The visualisation approach can be
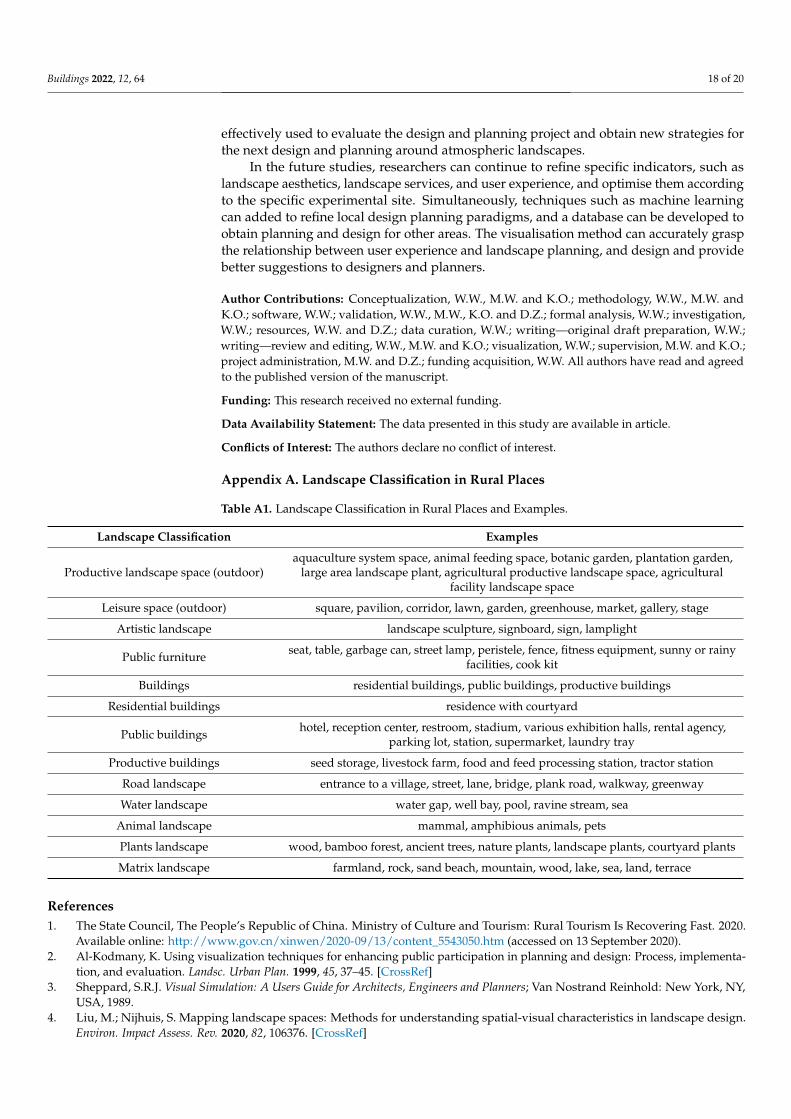
Buildings 2022, 12, 64 18 of 20
effectively used to evaluate the design and planning project and obtain new strategies forthe next design and planning around atmospheric landscapes.
In the future studies, researchers can continue to refine specific indicators, such aslandscape aesthetics, landscape services, and user experience, and optimise them accordingto the specific experimental site. Simultaneously, techniques such as machine learningcan added to refine local design planning paradigms, and a database can be developed toobtain planning and design for other areas. The visualisation method can accurately graspthe relationship between user experience and landscape planning, and design and providebetter suggestions to designers and planners.
Author Contributions: Conceptualization, W.W., M.W. and K.O.; methodology, W.W., M.W. andK.O.; software, W.W.; validation, W.W., M.W., K.O. and D.Z.; formal analysis, W.W.; investigation,W.W.; resources, W.W. and D.Z.; data curation, W.W.; writing—original draft preparation, W.W.;writing—review and editing, W.W., M.W. and K.O.; visualization, W.W.; supervision, M.W. and K.O.;project administration, M.W. and D.Z.; funding acquisition, W.W. All authors have read and agreedto the published version of the manuscript.
Funding: This research received no external funding.
Data Availability Statement: The data presented in this study are available in article.
Conflicts of Interest: The authors declare no conflict of interest.
Appendix A. Landscape Classification in Rural Places
Table A1. Landscape Classification in Rural Places and Examples.
Landscape Classification Examples
Productive landscape space (outdoor)aquaculture system space, animal feeding space, botanic garden, plantation garden,
large area landscape plant, agricultural productive landscape space, agriculturalfacility landscape space
Leisure space (outdoor) square, pavilion, corridor, lawn, garden, greenhouse, market, gallery, stage
Artistic landscape landscape sculpture, signboard, sign, lamplight
Public furniture seat, table, garbage can, street lamp, peristele, fence, fitness equipment, sunny or rainyfacilities, cook kit
Buildings residential buildings, public buildings, productive buildings
Residential buildings residence with courtyard
Public buildings hotel, reception center, restroom, stadium, various exhibition halls, rental agency,parking lot, station, supermarket, laundry tray
Productive buildings seed storage, livestock farm, food and feed processing station, tractor station
Road landscape entrance to a village, street, lane, bridge, plank road, walkway, greenway
Water landscape water gap, well bay, pool, ravine stream, sea
Animal landscape mammal, amphibious animals, pets
Plants landscape wood, bamboo forest, ancient trees, nature plants, landscape plants, courtyard plants
Matrix landscape farmland, rock, sand beach, mountain, wood, lake, sea, land, terrace
References1. The State Council, The People’s Republic of China. Ministry of Culture and Tourism: Rural Tourism Is Recovering Fast. 2020.
Available online: http://www.gov.cn/xinwen/2020-09/13/content_5543050.htm (accessed on 13 September 2020).2. Al-Kodmany, K. Using visualization techniques for enhancing public participation in planning and design: Process, implementa-
tion, and evaluation. Landsc. Urban Plan. 1999, 45, 37–45. [CrossRef]3. Sheppard, S.R.J. Visual Simulation: A Users Guide for Architects, Engineers and Planners; Van Nostrand Reinhold: New York, NY,
USA, 1989.4. Liu, M.; Nijhuis, S. Mapping landscape spaces: Methods for understanding spatial-visual characteristics in landscape design.
Environ. Impact Assess. Rev. 2020, 82, 106376. [CrossRef]
Buildings 2022, 12, 64 19 of 20
5. Stamps, A.E., III. Advances in visual diversity and entropy. Environ. Plan. B Plan. Des. 2003, 30, 449–463. [CrossRef]6. Appleton, K.; Lovett, A.; Sünnenberg, G.; Dockerty, T. Rural landscape visualisation from GIS databases: A comparison of
approaches, options and problems. Comput. Environ. Urban Syst. 2002, 26, 141–162. [CrossRef]7. Agnoletti, M. Rural landscape, nature conservation and culture: Some notes on research trends and management approaches
from a (southern) European perspective. Landsc. Urban Plan. 2014, 126, 66–73. [CrossRef]8. Peng, J.; Yan, S.; Strijker, D.; Wu, Q.; Chen, W.; Ma, Z. The influence of place identity on perceptions of landscape change:
Exploring evidence from rural land consolidation projects in Eastern China. Land Use Policy 2020, 99, 104891. [CrossRef]9. Geiger, W.F. Sponge city and lid technology—Vision and tradition. Landsc. Archit. Front. 2015, 3, 10–22.10. Von Haaren, C.; Warren-Kretzschmar, B.; Milos, C.; Werthmann, C. Opportunities for design approaches in landscape planning.
Landsc. Urban Plan. 2014, 130, 159–170. [CrossRef]11. Kongjian, Y. Cultural variations in landscape preference: Comparisons among Chinese sub-groups and Western design experts.
Landsc. Urban Plan. 1995, 32, 107–126. [CrossRef]12. Que, W. A brief talk on the foresight of urban rail transit network planning. Shanxi Archit. 2008, 34, 73–74.13. Crutzen, P.J. Novel Urban Ecosystems: Concepts, Definitions and a Strategy to Support Urban Sustainability and Resilience.
Landsc. Archit. Front. 2016, 4, 10–21.14. Phillips, J. The Sustainability Dynamics Framework—A holistic approach to define and evaluate sustainability and unsustainabil-
ity in the Anthropocene. Environ. Impact Assess. Rev. 2020, 84, 106436. [CrossRef]15. Nesshöver, C.; Assmuth, T.; Irvine, K.N.; Rusch, G.M.; Waylen, K.A.; Delbaere, B.; Haase, D.; Jones-Walters, L.; Keune, H.; Kovacs,
E.; et al. The science, policy and practice of nature-based solutions: An interdisciplinary perspective. Sci. Total Environ. 2017, 579,1215–1227. [CrossRef]
16. Kondolf, G.M.; Shi, S. Combining scientific and social methods in river restoration: An interview with G. Mathias Kondolf.Landsc. Arch. Front. 2017, 5, 48. [CrossRef]
17. Vallés-Planells, M.; Galiana, F.; Van Eetvelde, V. A classification of landscape services to support local landscape planning. Ecol.Soc. 2014, 19, 44. [CrossRef]
18. Cattaneo, T.; Giorgi, E.; Ni, M. Landscape, architecture and environmental regeneration: A research by design approach forinclusive tourism in a rural village in China. Sustainability 2018, 11, 128. [CrossRef]
19. Pomfret, G. Package mountaineer tourists holidaying in the French Alps: An evaluation of key influences encouraging theirparticipation. Tour. Manag. 2011, 32, 501–510. [CrossRef]
20. Jiao, Y.; Li, X.; Liang, L.; Takeuchi, K.; Okuro, T.; Zhang, D.; Sun, L. Indigenous ecological knowledge and natural resourcemanagement in the cultural landscape of China’s Hani Terraces. Ecol. Res. 2012, 27, 247–263. [CrossRef]
21. Wang, F.; Xie, C.W.; Bi-Hu, W.U. A Study on The Influence Of Spatial Scale To Tourists’ Satisfaction And The Intermediary RoleOf Sentimental Experience. Hum. Geogr. 2018, 33, 142–151. [CrossRef]
22. Haines-Young, R.; Potschin, M. The links between biodiversity, ecosystem services and human well-being. In Ecosystem Ecology:A New Synthesis; Cambridge University Press: Cambridge, UK, 2010; Volume 1, pp. 110–139.
23. Bastian, O.; Walz, U.; Decker, A. Historical landscape elements: Part of our cultural heritage—A methodological study fromSaxony. In The Carpathians: Integrating Nature and Society Towards Sustainability; Springer: New York, NY, USA, 2013; pp. 441–459.
24. Gómez-Baggethun, E.; Barton, D.N. Classifying and valuing ecosystem services for urban planning. Ecol. Econ. 2013, 86, 235–245.[CrossRef]
25. Zube, E.H.; Simcox, D.E.; Law, C.S. Perceptual landscape simulations: History and prospect. Landsc. J. 1987, 6, 62–80. [CrossRef]26. John, B.; Lang, D.J.; von Wehrden, H.; John, R.; Wiek, A. Advancing decision-visualization environments—Empirically informed
design recommendations. Futures 2020, 123, 102614. [CrossRef]27. Dupont, L.; Ooms, K.; Duchowski, A.T.; Antrop, M.; Van Eetvelde, V. Investigating the visual exploration of the rural-urban
gradient using eye-tracking. Spat. Cogn. Comput. 2017, 17, 65–88. [CrossRef]28. Lovett, A.; Appleton, K.; Warren-Kretzschmar, B.; Von Haaren, C. Using 3D visualization methods in landscape planning: An
evaluation of options and practical issues. Landsc. Urban Plan. 2015, 142, 85–94. [CrossRef]29. Schroth, O.; Hayek, U.W.; Lange, E.; Sheppard, S.R.; Schmid, W.A. Multiple-case study of landscape visualizations as a tool in
transdisciplinary planning workshops. Landsc. J. 2011, 30, 53–71. [CrossRef]30. Stamps, A.E., III. Entropy, visual diversity, and preference. J. Gen. Psychol. 2002, 129, 300–320. [CrossRef]31. Stamps, A.E., III. Mystery, complexity, legibility and coherence: A meta-analysis. J. Environ. Psychol. 2004, 24, 1–16. [CrossRef]32. Natori, Y.; Chenoweth, R. Differences in rural landscape perceptions and preferences between farmers and naturalists. J. Environ.
Psychol. 2008, 28, 250–267. [CrossRef]33. Daniel, T.C. Whither scenic beauty? Visual landscape quality assessment in the 21st century. Landsc. Urban Plan. 2001, 54, 267–281.
[CrossRef]34. Ode, Å.; Fry, G.; Tveit, M.S.; Messager, P.; Miller, D. Indicators of perceived naturalness as drivers of landscape preference. J.
Environ. Manag. 2009, 90, 375–383. [CrossRef] [PubMed]35. Sevenant, M.; Antrop, M. Landscape representation validity: A comparison between on-site observations and photographs with
different angles of view. Landsc. Res. 2011, 36, 363–385. [CrossRef]36. Lange, E. The limits of realism: Perceptions of virtual landscapes. Landsc. Urban Plan. 2001, 54, 163–182. [CrossRef]
Buildings 2022, 12, 64 20 of 20
37. Cun, X.; Pun, C.-M.; Gao, H. Applying stochastic second-order entropy images to multi-modal image registration. Signal Process.Image Commun. 2018, 65, 201–209. [CrossRef]
38. Ode, Å.; Hagerhall, C.M.; Sang, N. Analysing visual landscape complexity: Theory and application. Landsc. Res. 2010, 35, 111–131.[CrossRef]
39. Blaschke, T. The role of the spatial dimension within the framework of sustainable landscapes and natural capital. Landsc. UrbanPlan. 2006, 75, 198–226. [CrossRef]
40. Hosany, S.; Prayag, G. Patterns of tourists’ emotional responses, satisfaction, and intention to recommend. J. Bus. Res. 2013, 66,730–737. [CrossRef]
41. Bigné, J.E.; Andreu, L. Emotions in segmentation: An empirical study. Ann. Tour. Res. 2004, 31, 682–696. [CrossRef]42. Russell, J.A.; Pratt, G. A description of the affective quality attributed to environments. J. Personal. Soc. Psychol. 1980, 38, 311.
[CrossRef]43. Aho, S.K. Towards a general theory of touristic experiences: Modelling experience process in tourism. Tour. Rev. 2001, 56, 33–37.
[CrossRef]44. Trauer, B.; Ryan, C. Destination image, romance and place experience—An application of intimacy theory in tourism. Tour. Manag.
2005, 26, 481–491. [CrossRef]45. Del Bosque, I.R.; San Martín, H. Tourist satisfaction a cognitive-affective model. Ann. Tour. Res. 2008, 35, 551–573. [CrossRef]46. Bigné, J.E.; Andreu, L.; Gnoth, J. The theme park experience: An analysis of pleasure, arousal and satisfaction. Tour. Manag. 2005,
26, 833–844. [CrossRef]47. Chuang, S.-C. The effects of emotions on the purchase of tour commodities. J. Travel Tour. Mark. 2007, 22, 1–13. [CrossRef]48. Peña, L.; Casado-Arzuaga, I.; Onaindia, M. Mapping recreation supply and demand using an ecological and a social evaluation
approach. Ecosyst. Serv. 2015, 13, 108–118. [CrossRef]49. Kim, J.-H.; Ritchie, J.B.; McCormick, B. Development of a scale to measure memorable tourism experiences. J. Travel Res. 2010, 51,
12–25. [CrossRef]50. Farber, M.E.; Hall, T.E. Emotion and environment: Visitors’ extraordinary experiences along the Dalton Highway in Alaska. J.
Leis. Res. 2007, 39, 248–270. [CrossRef]51. Kaplan, R.; Kaplan, S. The Experience of Nature: A Psychological Perspective; Cambridge University Press: Cambridge, UK, 1989.52. Zoderer, B.M.; Tasser, E.; Erb, K.-H.; Stanghellini, P.S.L.; Tappeiner, U. Identifying and mapping the tourists perception of cultural
ecosystem services: A case study from an Alpine region. Land Use Policy 2016, 56, 251–261. [CrossRef]53. Robinson, N. The Planting Design Handbook, 2nd ed.; Ashgate Publishing Limited: Farnham, UK, 2004.54. Liu, B.Y.; Zhang, T. Landscape Space Sequence Organization Based on Visual Sense. Chin. Landsc. Archit. 2010, 11, 31–35.55. Gundersen, V.; Vistad, O.I. Public opinions and use of various types of recreational infrastructure in boreal forest settings. Forests
2016, 7, 113. [CrossRef]56. Cash, D.W.; Clark, W.C.; Alcock, F.; Dickson, N.M.; Eckley, N.; Guston, D.H. Knowledge systems for sustainable development.
Proc. Natl. Acad. Sci. USA 2003, 100, 8086–8091. [CrossRef] [PubMed]57. Burkhard, B.; Maes, J. Mapping ecosystem services. Adv. Books 2017, 1, e12837.58. Daniel, T.C.; Muhar, A.; Arnberger, A.; Aznar, O.; Boyd, J.W.; Chan, K.M.A.; Costanza, R.; Elmqvist, T.; Flint, C.G.; Gobster, P.H.
Contributions of cultural services to the ecosystem services agenda. Proc. Natl. Acad. Sci. USA 2012, 109, 8812–8819. [CrossRef][PubMed]