Embed Size (px)
Citation preview
Exploring Dimensionality within the 2015 NCSC
Operational Administration Data
Nathan Dadey
Center for Assessment
December 2016
All rights reserved. Any or all portions of this document may be used to support additional study or
use without prior permission.
Development of this report was supported by a grant from the U.S. Department of Education,
Office of Special Education Programs (H373X100002, Project Officer: [email protected]).
The contents do not necessarily represent the policy of the U.S. Department of Education, and
no assumption of endorsement by the Federal government should be made.
The University of Minnesota is committed to the policy that all persons shall have equal access to its programs,
facilities, and employment without regard to race, color, creed, religion, national origin, sex, age, marital status,
disability, public assistance status, veteran status, or sexual orientation. This document is available in alternative
formats upon request.

1
Exploring Dimensionality within the 2015 NCSC Operational Administration Data
Executive Summary
The item response data produced by the 2015 Spring administration of the National Center and State
Collaborative (NCSC) assessments in mathematics and English language arts (ELA) displayed evidence
of multidimensionality, as evaluated by two specialized procedures - DIMTEST and DETECT. The
results of these procedures are documented in the NCSC 2015 Operational Assessment Technical Manual,
as are initial hypotheses about the nature of the multiple dimensions.
The goal of this study is to further explore dimensionality in the 2015 data. Specifically, we use
exploratory factor analysis to provide an alternative evaluation of dimensionality. We also draw on the
knowledge of experts, by conducting “dimensionality review” workshops in which they generated
potential explanations for the factor analysis results, which we then investigated empirically.
The exploratory factor analyses confirmed the surprising findings first noted in the Technical Manual.
Virtually all assessment forms in math and ELA displayed evidence of two factors (also referred to as
dimensions). One of the two dimensions is defined by items for which the correct answer is not the last
response option (i.e., not “C” for items with 3 response options and not “B” for items with 2 response
options) whereas the other dimension is defined by items for which the correct answer is the last response
option. In addition, for ELA assessment forms in grades 3 and 4, there was an additional third dimension
defined by items on foundational topics to which students responded verbally.
These findings are also supported by the results of two dimensionality review workshops, in which
content experts generated hypotheses about the factors influencing student performance on the NSCS
assessments. These hypotheses also lead us to additional investigation of the response options. We found
that forms vary in the number of correct answers allotted to the response options (e.g., how many correct
answers are “A”), that that the percent of correct responses in a particular category is associated, albeit
not strongly, to multidimensionality. This finding suggests that some students select the first or last
response option in a systematic fashion, and that these systematic preferences are captured as
multidimensionality on forms that have more correct answers as A or C. This type of behavior could
potentially be corrected through revisions to the test administration procedure.

2
Exploring Dimensionality within the 2015 NCSC Operational
Administration Data
Nathan Dadey
Center for Assessment
December, 2016
Introduction
Overview
The item response data produced by the 2015 Spring administration of the National Center and State
Collaborative (NCSC) assessments in mathematics and English language arts1 (ELA) displayed evidence
of multidimensionality. Specifically, two procedures designed to assess multidimensionality, DIMTEST
(Stout, Douglas, Junker, & Roussos, 1993) and DETECT (Zhang & Stout, 1999), indicated that the data
from every assessment form displayed sizable departures from unidimensionality (NCSC, 2015).
Multidimensionality is potentially problematic from both psychometric and content perspectives.
Essentially, if the assessment data are multidimensional, then student performance may not be adequately
summarized by a unidimensional test score.
The purpose of this work is to further investigate dimensionality within the 2015 data. It is meant to
supplement and extend the original analyses, which were conducted by the vendor for the 2015 Spring
administration, Measured Progress, and documented in the 2015 Operational Assessment Technical
Manual (NCSC, 2015).
There are three sections to this investigation. In the first section, we examine the item response data using
methods rooted in exploratory factor analysis (EFA) – affording a second opinion on multidimensionality.
We compare the factor analysis results to those produced by DETECT to show the findings are generally
consistent across methods. In the second section, we summarize the results of two “dimensionality
review” workshops, conducted with experts knowledgeable on educational measurement, students with
significant disabilities and the assessed content. The goal of each workshop was to generate
interpretations for each factor2 suggested by the factor analyses, as well as possible explanations for why
such factors could occur. In the third section, we present the results of analyses informed by the
dimensionality review workshops. In particular, we examine students who appear to be guessing in a
1 The constructed response writing tasks were not included as an operational (i.e., core item) in the scaling of the
Spring 2015 operational assessment results. We also exclude these constructed response writing tasks. 2 We use the terms “factors” and “dimensions” interchangeably – despite developing out of different methodological
traditions, factor analysis (FA) and multidimensional item response theory (MIRT) are so similar that MIRT can be
seen as a special case of FA (see Reckase, 2009, p. 63).

3
systematic fashion – selecting a particular response option (e.g., always selecting “A” as the correct
answer).
Prior Findings
The DETECT and DIMTEST procedures indicated that the data from each NCSC assessment form
displayed sizable departures from unidimensionality, although the degree to which dimensionality was
present varied across forms, grades and subjects. This finding can be seen through inspection of an index
of dimensionality produced by the DETECT procedure – a “multidimensionality effect size” (NCSC,
2015, p. 180). This statistic indicates “the amount of multidimensionality the test displays, that is the size
of the departure from being perfectly fitted by a unidimensional model (Zhang & Stout, 1999, p. 219).”
The larger the value, the more multidimensional the data. Figure 1 below graphically presents the effect
sizes produced by DETECT (see Table 8-4, NCSC, 2015, p. 180-181).
Figure 1. Multidimensionality Effect Sizes from DETECT. The red lines indicate the mean across forms
for each grade.
4
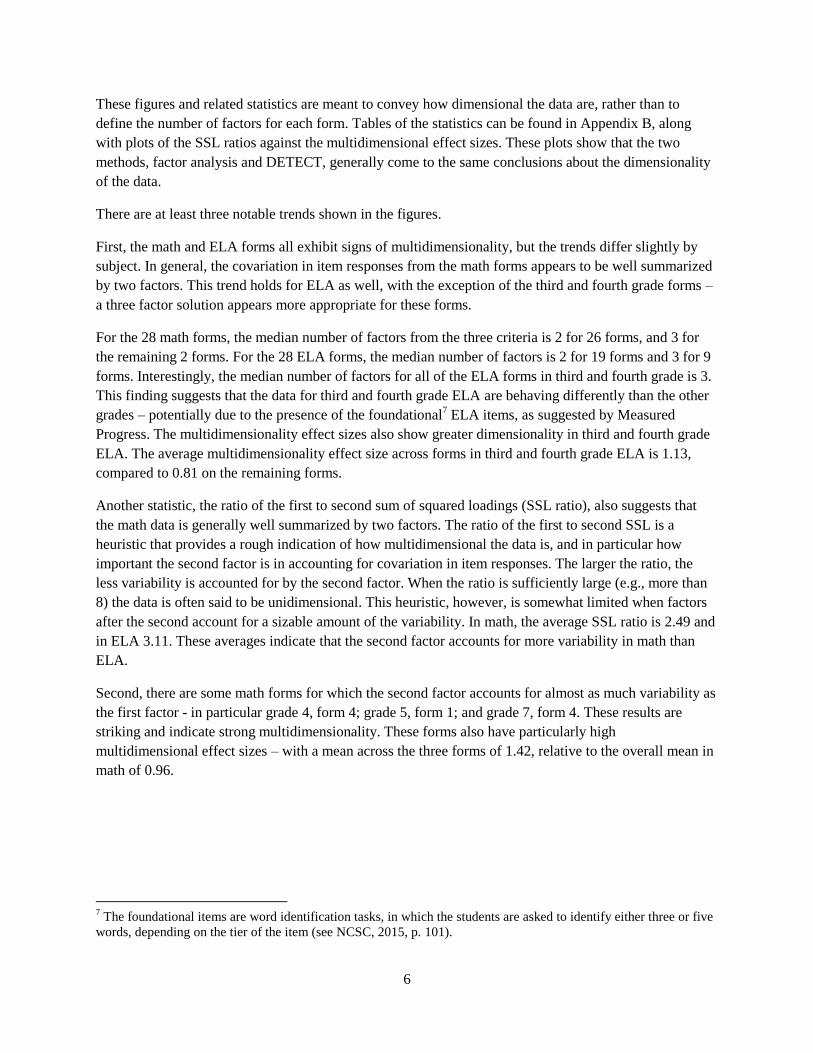
The technical report provides a heuristic for the interpretation of these effect size statistics – “that values
less than 0.2 indicate very weak multidimensionality (or near unidimensionality), values of 0.2 to 0.4
weak to moderate multidimensionality; values of 0.4 to 1.0 moderate to strong multidimensionality, and
values greater than 1.0 very strong multidimensionality” (NCSC, 2015, p. 180). Given these heuristics,
every test form exhibits moderate to very strong multidimensionality, with the exclusion of 11th Grade
Math form 2, with an effect size of 0.40.
Prompted by this strong evidence of multidimensionality, Measured Progress examined item clusters,
another result of the DETECT procedure. The DETECT procedure operates in a similar fashion to cluster
analysis – grouping items to maximize positive bivariate relationships3 between items within each cluster.
Unlike typical cluster analysis approaches, however, the DETECT procedure searches for the number of
clusters as well as the groupings of items within each cluster. These clusters of items are as dimensionally
homogenous as possible (see Zhang & Stout, 1999; Stout, Froelich & Gao, 2001).
Measured Progress examined these clusters in relation to multiple item characteristics and found two
trends. First, for all grades and subjects, the membership of items in clusters was strongly predicted by the
position of the correct response option (e.g., items with a correct response option of “A” predicted
membership in one cluster). Second, for third and fourth grade ELA, the foundational items constituted
one cluster while the remaining items constituted a second. In their conclusion, Measured Progress noted
that the dimensionality attributable to the foundational items is not particularly problematic, as it can be
“controlled by the combination of strict test specifications in regard to content, psychometric
characteristics and scoring… from form to form and year to year,” but that dimensionality related to “the
ordering of selected-response items is a new phenomenon that will require close study and some changes
to either test administration practices or test specifications, or both (p. 182).”
Data This study uses student responses to the NCSC core items, i.e., the items used for the operational scaling,
from the Spring 2015 operational administration. In addition to item responses, we also use data on
student characteristics, including demographics, modes of communication and received accommodations.
Much of this information on students comes from two surveys completed during the assessment
administration process – the Learner Characteristics Inventory (LCI) survey and Student Response
Check4 (SRC). When needed, we also use the characteristics of the items (e.g., aligned standard, depth of
knowledge level) captured in the test maps.
The data for this study was provided through a separate agreement, independent of those in place to
support the 2015 operational administration. Only states and jurisdictions that provided approval for this
separate agreement by March 15th, 2016 were included in the study. These states and jurisdictions are:
AR, AZ, CNMI (the Northern Mariana Islands), DC, ID, IN, ME, MT, NM, RI and SC. Counts of
students and items per form are provided in Table 1 below. The details of the data cleaning process are
provided in Appendix A.
3 Specifically, positive item covariances conditional on the test composite (Zhang & Stout, 1999).
4 “The SRC is a three-question content-neutral task during which a student is asked to demonstrate his or her
preferred mode(s) of communication (NCSC, n.d., p. 19).” This survey is completed by each student before taking
the assessment(s) if the test administrator is uncertain that the student’s response

5
Table 1. Counts of Students and Items by Subject, Grade and Form.
Subject Grade Items per Form Students per Form
1 2 3 4 1 2 3 4
Math 3 35 35 35 35
1062 936 990 952
4 33 33 33 33
1057 976 1031 1015
5 35 35 34 33
1156 1076 1008 898
6 35 35 35 35
1076 1070 1046 1039
7 34 35 34 34
1031 1012 1003 1124
8 35 34 35 35
1207 1008 1133 1070
11 34 35 34 34
618 520 640 556
ELA 3 42 37 42 42
903 873 903 876
4 41 39 41 41
917 904 968 934
5 32 32 34 31
1154 1073 1007 897
6 33 32 33 32
1075 1070 1047 1037
7 33 36 35 34
1026 1014 1004 1120
8 35 36 35 36
1206 1008 1132 1064
11 32 33 33 35
680 592 691 618
Notes: The above counts contain all students within the data. The actual sample sizes used in the analysis vary
slightly due to the patterns of non-response. For ELA in third and fourth grade, there were four additional forms that
contained non-verbal items (i.e., non-verbal forms). These forms have been excluded here due to their small sample
sizes (i.e., generally less than a hundred students).
Exploratory Factor Analysis
The results from the DIMTEST and DETECT procedures provide one evaluation of dimensionality. A
second is provided by using traditional exploratory factor analysis (EFA) methods. Using EFA, we first
examine how many factors reasonability summarize the covariation between items, and then interpret the
resulting factors based on item features. Specifically, we use a number of factor analytic5 approaches –
scree plots, parallel analysis (Hayton, Allen & Scarpello, 2004; Horn, 1965), Veclier’s Minimum Average
Partial criterion (MAP; Velicer, 1976), and the Very Simple Structure (VSS) criterion – to examine the
potential number of factors for each form. After selecting a reasonable number of factors to model for
each form, we then conduct a final set of EFAs with varimax rotation6 and interpret the factors based on
the resulting factor loadings.
Examining the Potential Number of Factors
Figures 2 to 5 contain scree plots for each form. In addition, each plot also contains statistics that provide
guidance on how many factors could be reasonably retained. The first statistic is actually the median of
three separate statistical criterion (parallel analysis, MAP and VSS), followed by the ratio of the first to
second eigenvalues (or the sum of squared loadings; SSL) produced by exploratory factor analysis and
then the multidimensional effect size produced by DETECT.
5 Conducted on polychoric correlation matrices of item responses.
6 All of the EFAs are estimated using the fa function in the psych R package (Revelle, 2106) using Ordinary Least
Squares extraction without Kaiser normalization.
6
These figures and related statistics are meant to convey how dimensional the data are, rather than to
define the number of factors for each form. Tables of the statistics can be found in Appendix B, along
with plots of the SSL ratios against the multidimensional effect sizes. These plots show that the two
methods, factor analysis and DETECT, generally come to the same conclusions about the dimensionality
of the data.
There are at least three notable trends shown in the figures.
First, the math and ELA forms all exhibit signs of multidimensionality, but the trends differ slightly by
subject. In general, the covariation in item responses from the math forms appears to be well summarized
by two factors. This trend holds for ELA as well, with the exception of the third and fourth grade forms –
a three factor solution appears more appropriate for these forms.
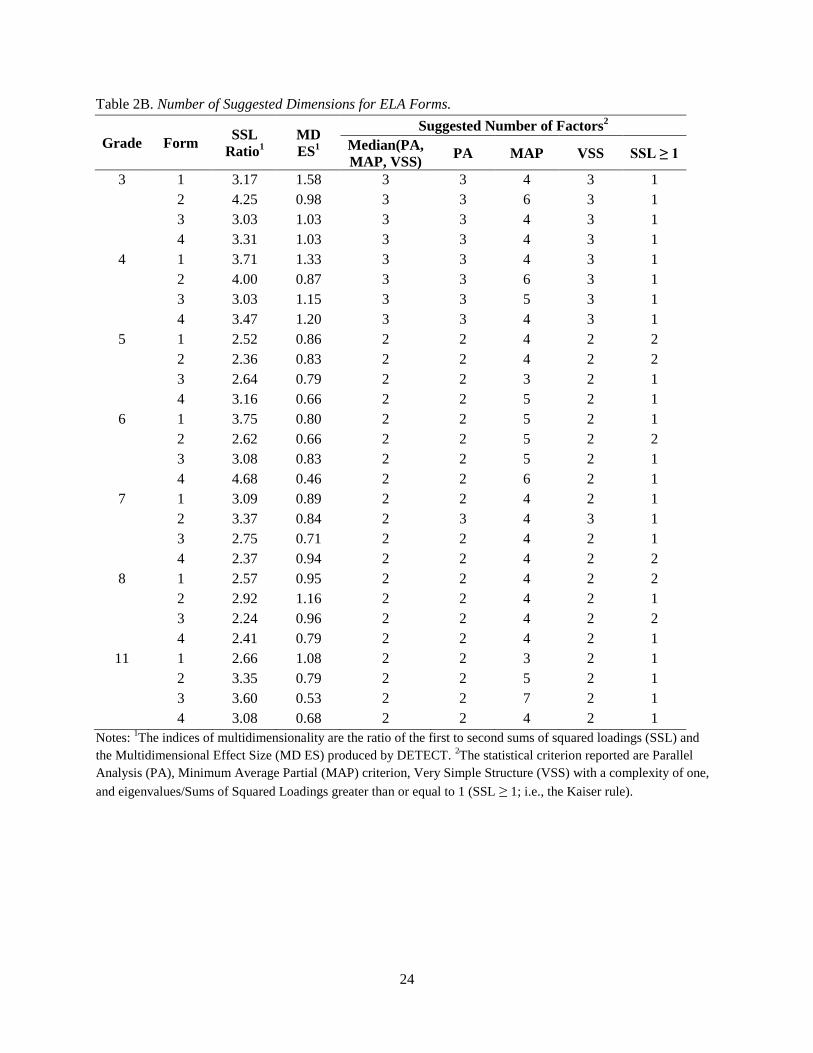
For the 28 math forms, the median number of factors from the three criteria is 2 for 26 forms, and 3 for
the remaining 2 forms. For the 28 ELA forms, the median number of factors is 2 for 19 forms and 3 for 9
forms. Interestingly, the median number of factors for all of the ELA forms in third and fourth grade is 3.
This finding suggests that the data for third and fourth grade ELA are behaving differently than the other
grades – potentially due to the presence of the foundational7 ELA items, as suggested by Measured
Progress. The multidimensionality effect sizes also show greater dimensionality in third and fourth grade
ELA. The average multidimensionality effect size across forms in third and fourth grade ELA is 1.13,
compared to 0.81 on the remaining forms.
Another statistic, the ratio of the first to second sum of squared loadings (SSL ratio), also suggests that
the math data is generally well summarized by two factors. The ratio of the first to second SSL is a
heuristic that provides a rough indication of how multidimensional the data is, and in particular how
important the second factor is in accounting for covariation in item responses. The larger the ratio, the
less variability is accounted for by the second factor. When the ratio is sufficiently large (e.g., more than
8) the data is often said to be unidimensional. This heuristic, however, is somewhat limited when factors
after the second account for a sizable amount of the variability. In math, the average SSL ratio is 2.49 and
in ELA 3.11. These averages indicate that the second factor accounts for more variability in math than
ELA.
Second, there are some math forms for which the second factor accounts for almost as much variability as
the first factor - in particular grade 4, form 4; grade 5, form 1; and grade 7, form 4. These results are
striking and indicate strong multidimensionality. These forms also have particularly high
multidimensional effect sizes – with a mean across the three forms of 1.42, relative to the overall mean in
math of 0.96.
7 The foundational items are word identification tasks, in which the students are asked to identify either three or five
words, depending on the tier of the item (see NCSC, 2015, p. 101).

7
Figure 2. Scree Plots and Related Statistics for Unrotated Factor Solution in Math, Grades 3 to 6. Note, n indicates the number of items.

8
Figure 3. Scree Plots and Related Statistics for Unrotated Factor Solution in Math, Grades 7, 8 and 11. Note, n indicates the number of items.

9
Figure 4. Scree Plots and Related Statistics for Unrotated Factor Solution in ELA, Grades 3 to 6. Note, n indicates the number of items.

10
Figure 5. Scree Plots and Related Statistics for Unrotated Factor Solution in ELA, Grades 7, 8 and 11. Note, n indicates the number of items.

11
Third, dimensionality appears to be greater in the earlier grades in both math and ELA, although there is
substantial variability across forms within each grade. This can be seen in the patterns of the
multidimensional effect sizes presented in Figure 1, as well as the plot of the SSL ratios in Figure 6. This
substantial variability across forms is somewhat surprising, as the forms within each grade have
approximatively 50% of their items in common.
Figure 6. SSL Ratios by Subject and Grade.
Note: Smaller SSL Ratios indicate that the second factor accounts for more variability.
Examining the Factor Loadings
To better understand how each factor could be interpreted, we conducted another set of exploratory factor
analyses, this time setting the number of factors extracted equal to the median number of factors across
the three statistical criteria (PA, MAP, and VSS) and rotating the loadings using varimax. The median
number of factors aligns well with visual inspection of the scree plots, in that it appears to select the
“major” factors while ignoring “minor factors”, thus favoring parsimony.
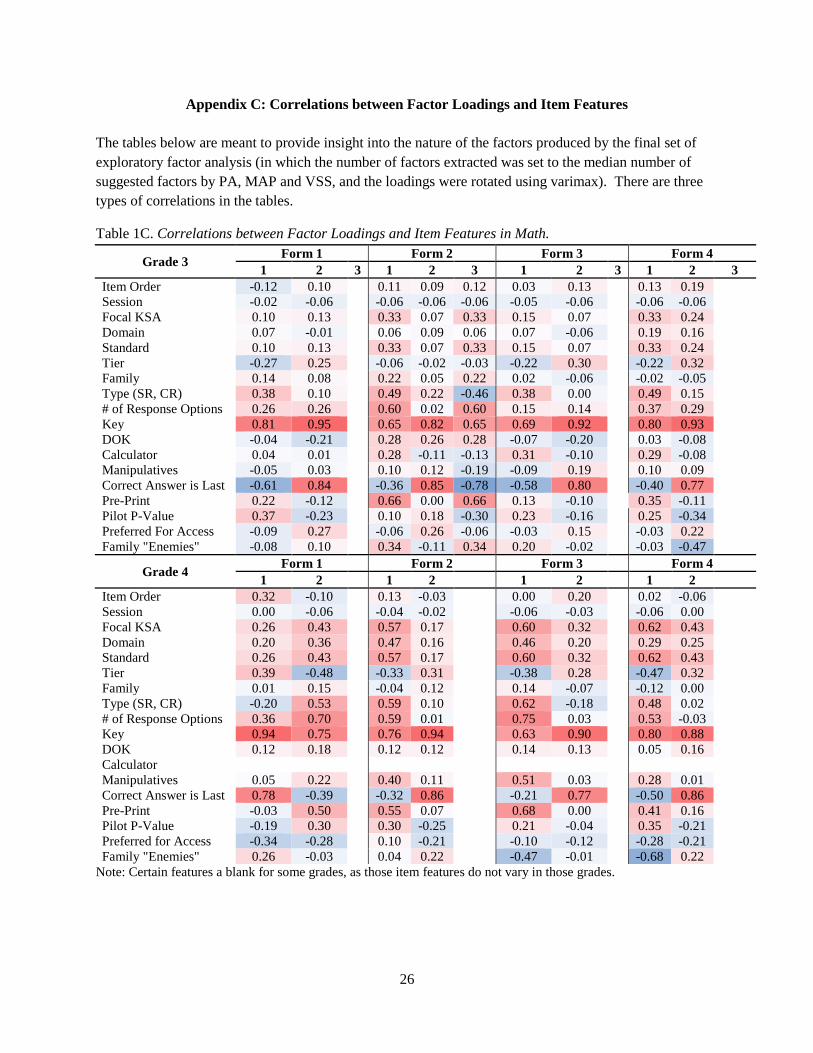
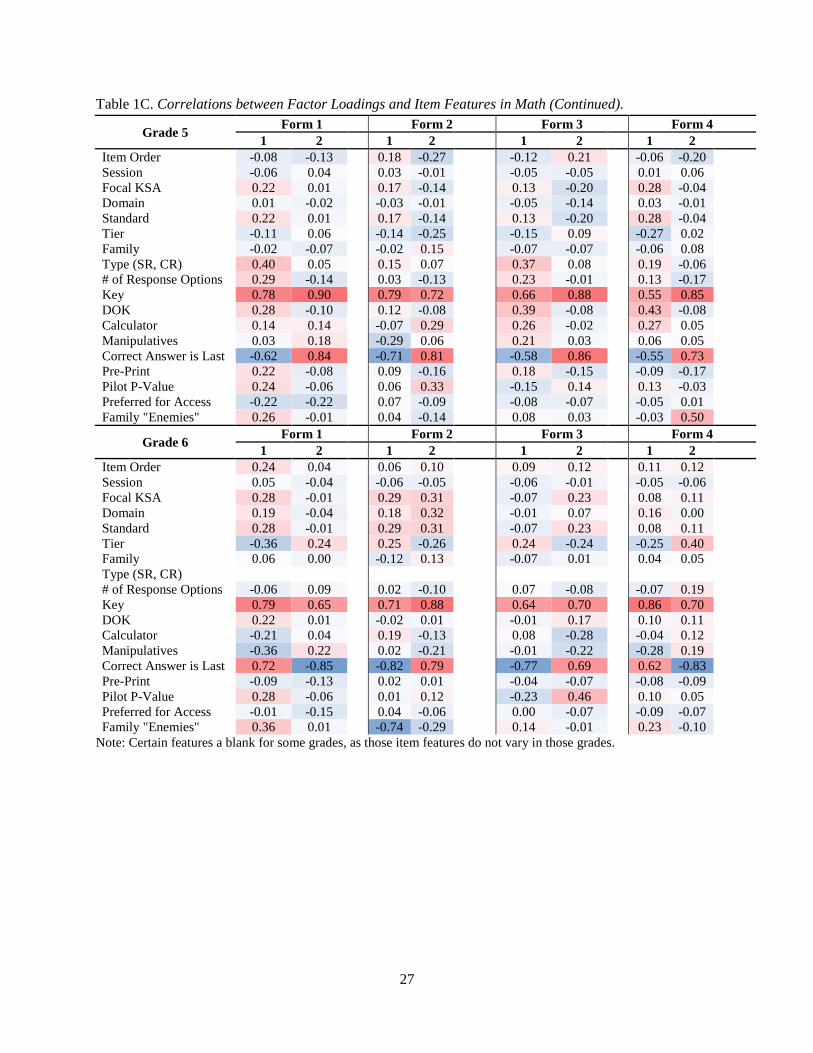
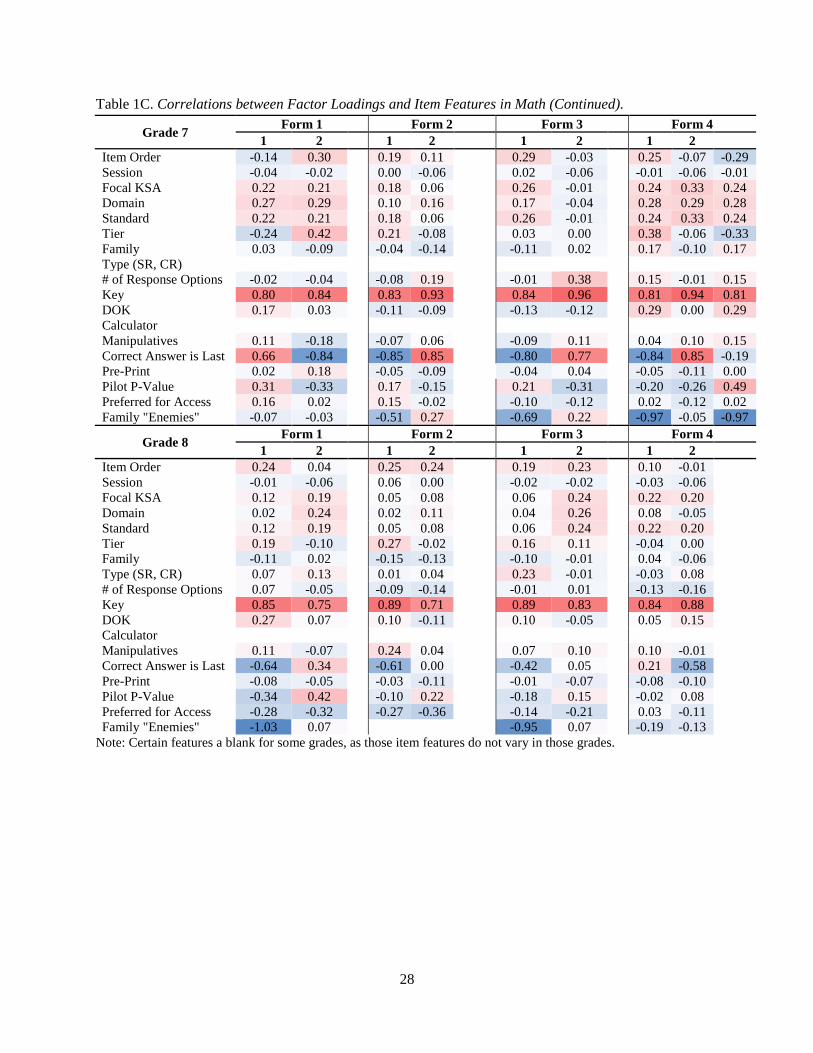
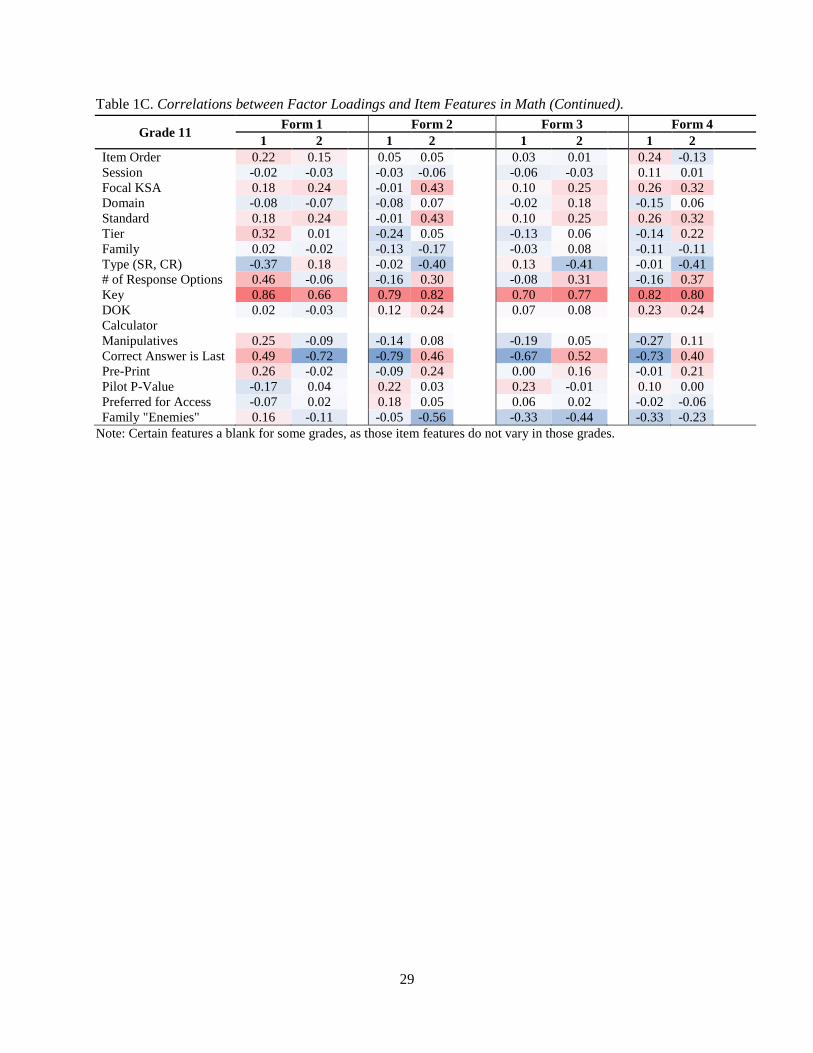
We then correlated8 the resulting factor loadings with all available item features. The complete set of
correlations is given in Appendix C. Across virtually every form in math and ELA, the correct-response
option (i.e., A, B or C) and whether the correct answer was last (i.e., B if there are 2 response options, C if
there are 3 response options), strongly correlated with the factor loadings. On a number of forms, the
number of response options is also highly correlated with the factor loadings.
The factor loadings also correlate with features relating to difficulty of the items, as well as their content.
In terms of difficulty, item p-values correlate moderately with at least one of the factors in each ELA
form, excluding some forms in grades 6 and 8. The math forms showed a similar, but weaker, trend with
moderate correlations between a factor’s loadings and p-values (approximately 0.30), often appearing
only on a single form within a given grade. In terms of content, the third and fourth grade ELA forms
displayed strong correlations with a number of item features related to content coverage and alignment –
8 For dichotomous or ordered categorical item features (e.g., tier or DOK level), we use Spearman rank order
correlations. For continuous variables (e.g., p-values), we use Pearson product moment correlations. Finally, for
nominal categorical item features (e.g., common core standard domain), we use Intraclass Correlations (ICCs).

12
the content type (Foundational, Informational Passage, Literary Passage and Writing), item family, depth
of knowledge (DOK) level, Common Core Connector (CCC) standard and CCC domain all generally
correlate strongly the loadings for at least one factor. These features are interrelated, and any one
feature—say content type—can readily account for much of the variation in the other features. Also, it is
worth noting that the content type category Foundational-Verbal is not present in the other grades. In
math, a similar trend appears for the grade 4 forms, as well as grade 3 forms to a lesser extent, with
loadings from at least one factor correlating moderately with Focal Knowledge, Skill and Ability; CCC
Domain; CCC Standard; and Tier. Finally, for some math forms in grades 3 and 4, whether the item
required preprinted materials, either a reference sheet or the actual item in the case of constructed
response items, correlated moderately with the factor loadings.
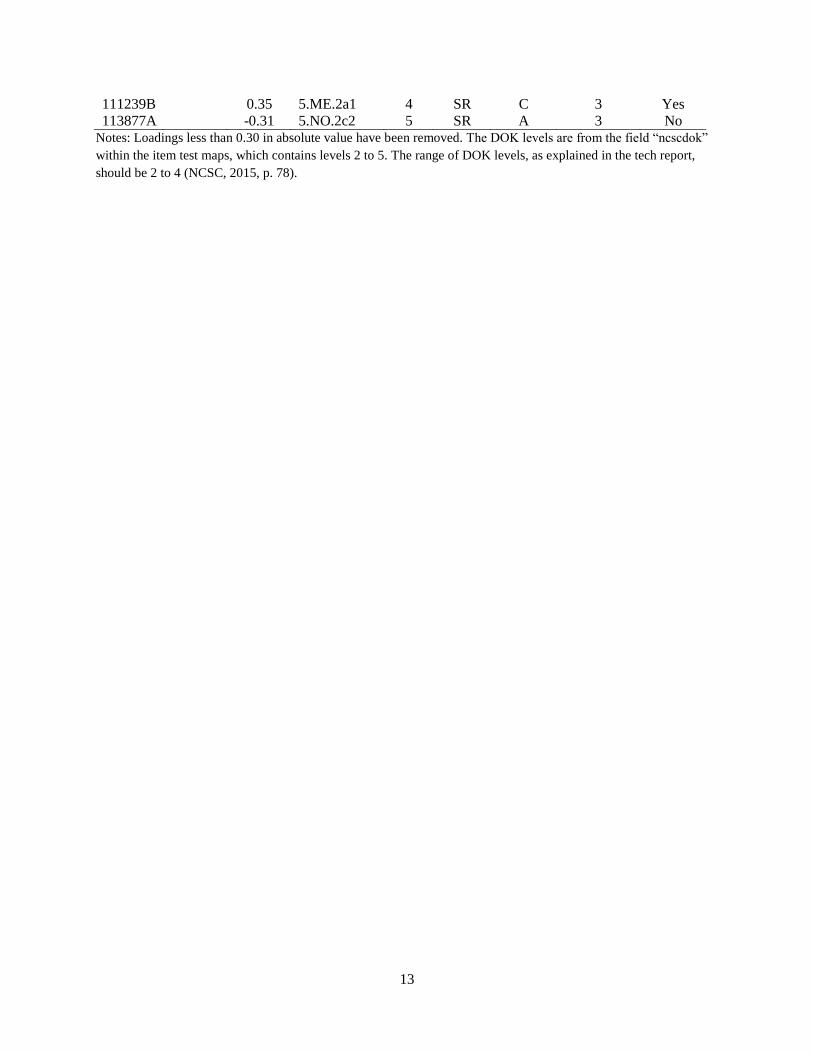
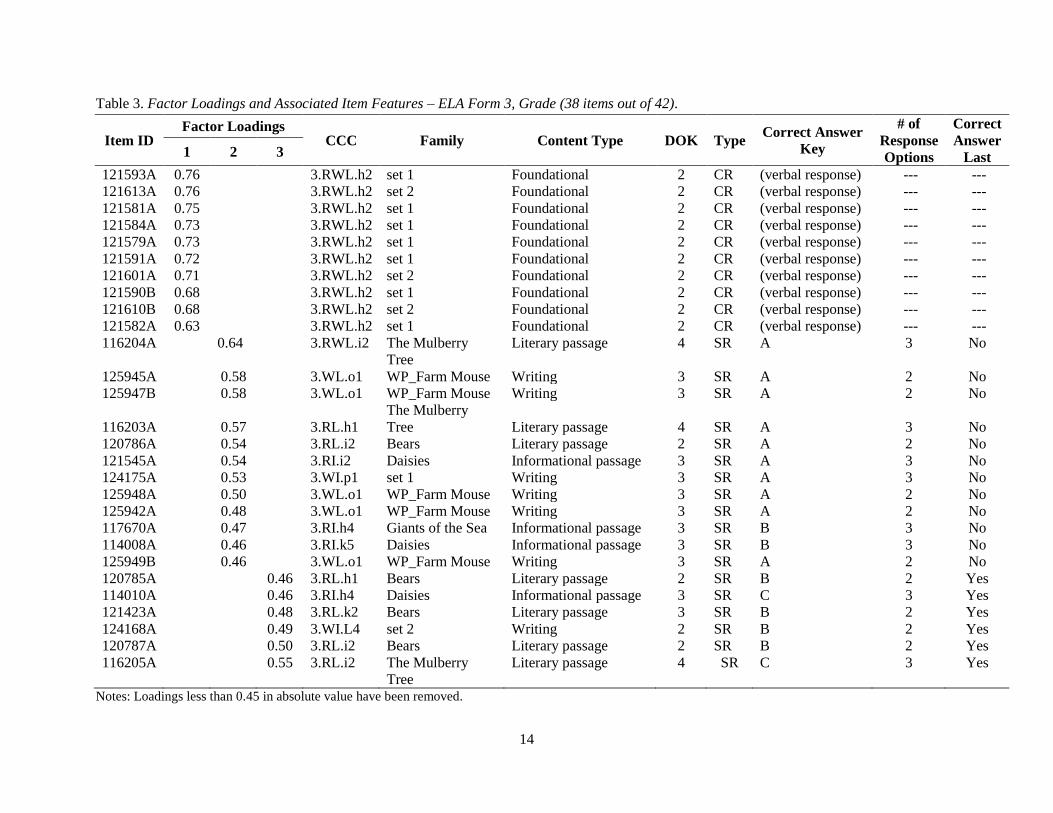
Tables 2 and 3 below illustrate the relationships between the factor loadings and item features highlighted
above. Table 2 shows the loadings from grade 5, form 1 in math, and Table 3 shows the loadings from
grade 3, form 3 in ELA. These two forms appeared highly multidimensional in terms of both the
DETECT and factor analysis results. In the two tables, we have excluded items with weak loadings on
both factors (below 0.35 is absolute value in math, below 0.45 in ELA; the loadings in ELA are larger
overall). We also use these forms in the next set of analyses, the item review workshops.
Table 2. Factor Loadings and Associated Item Features – Math Form 1, Grade 5 (29 items out of 35).
Item ID Factor Loadings Primary
Standard DOK Type
Correct
Answer
Key
# of
Response
Options
Correct
Answer
Last 1 2
121514A 0.57 0.20 5.GM.1c3 3 CR 1pt
120737A 0.51 0.15 5.GM.1c3 3 CR 1pt
113852A 0.51 -0.17 5.NO.1b4 3 SR A 3 No
112372A 0.49 -0.02 5.NO.1b1 2 SR A 2 No
112378A 0.48 -0.15 5.NO.1b4 3 SR A 3 No
111276A 0.46 -0.24 5.PRF.1a1 4 SR A 3 No
111291A 0.45 -0.04 5.NO.1b4 2 SR A 2 No
111244B 0.45 0.22 5.NO.1b1 3 SR B 3 No
112346A 0.44 -0.14 5.ME.1b2 3 SR A 2 No
112409A 0.42 0.16 5.PRF.1a1 4 SR B 3 No
113892A 0.41 -0.18 5.PRF.1a1 4 SR A 3 No
113838A 0.40 -0.14 5.ME.1b2 3 SR A 3 No
113843B 0.39 -0.19 5.ME.2a1 3 SR A 3 No
113844A 0.36 0.07 5.ME.2a1 2 SR A 2 No
113889A 0.34 -0.02 5.PRF.1a1 4 SR A 2 No
112373B 0.12 0.49 5.NO.1b1 2 SR C 3 Yes
113883A -0.01 0.47 5.NO.2c2 5 SR C 3 Yes
111263A -0.15 0.46 5.NO.2c2 5 SR C 3 Yes
111303A 0.15 0.46 5.NO.2c1 5 SR C 3 Yes
111260A 0.05 0.45 5.NO.2a5 5 SR C 3 Yes
113846B -0.04 0.42 5.NO.1b1 3 SR C 3 Yes
113898B -0.12 0.42 5.PRF.2b1 5 SR C 3 Yes
111234A 0.01 0.41 5.ME.1b2 5 SR C 3 Yes
112416A -0.03 0.41 5.PRF.2b1 4 SR C 3 Yes
111337A 0.09 0.36 5.GM.1c3 3 SR C 3 Yes
112396A 0.07 0.35 5.NO.2a5 4 SR B 2 Yes
112340A 0.21 0.35 5.GM.1c3 3 SR B 2 Yes
13
111239B -0.23 0.35 5.ME.2a1 4 SR C 3 Yes
113877A 0.23 -0.31 5.NO.2c2 5 SR A 3 No Notes: Loadings less than 0.30 in absolute value have been removed. The DOK levels are from the field “ncscdok”
within the item test maps, which contains levels 2 to 5. The range of DOK levels, as explained in the tech report,
should be 2 to 4 (NCSC, 2015, p. 78).
14
Table 3. Factor Loadings and Associated Item Features – ELA Form 3, Grade (38 items out of 42).
Item ID Factor Loadings
CCC Family Content Type DOK Type Correct Answer
Key
# of
Response
Options
Correct
Answer
Last 1 2 3
121593A 0.76 0.26 0.12 3.RWL.h2 set 1 Foundational 2 CR (verbal response) --- ---
121613A 0.76 0.19 0.11 3.RWL.h2 set 2 Foundational 2 CR (verbal response) --- ---
121581A 0.75 0.15 0.07 3.RWL.h2 set 1 Foundational 2 CR (verbal response) --- ---
121584A 0.73 0.13 0.05 3.RWL.h2 set 1 Foundational 2 CR (verbal response) --- ---
121579A 0.73 0.21 0.06 3.RWL.h2 set 1 Foundational 2 CR (verbal response) --- ---
121591A 0.72 0.28 0.16 3.RWL.h2 set 1 Foundational 2 CR (verbal response) --- ---
121601A 0.71 0.11 0.06 3.RWL.h2 set 2 Foundational 2 CR (verbal response) --- ---
121590B 0.68 0.26 0.11 3.RWL.h2 set 1 Foundational 2 CR (verbal response) --- ---
121610B 0.68 0.26 0.12 3.RWL.h2 set 2 Foundational 2 CR (verbal response) --- ---
121582A 0.63 0.11 0.03 3.RWL.h2 set 1 Foundational 2 CR (verbal response) --- ---
116204A 0.16 0.64 0.17 3.RWL.i2 The Mulberry
Tree
Literary passage 4 SR A 3 No
125945A 0.12 0.58 0.17 3.WL.o1 WP_Farm Mouse Writing 3 SR A 2 No
125947B 0.11 0.58 0.12 3.WL.o1 WP_Farm Mouse Writing 3 SR A 2 No
116203A 0.09 0.57 0.11 3.RL.h1
The Mulberry
Tree Literary passage 4 SR A 3 No
120786A 0.20 0.54 0.18 3.RL.i2 Bears Literary passage 2 SR A 2 No
121545A 0.18 0.54 0.09 3.RI.i2 Daisies Informational passage 3 SR A 3 No
124175A 0.12 0.53 0.19 3.WI.p1 set 1 Writing 3 SR A 3 No
125948A 0.11 0.50 0.01 3.WL.o1 WP_Farm Mouse Writing 3 SR A 2 No
125942A 0.20 0.48 0.13 3.WL.o1 WP_Farm Mouse Writing 3 SR A 2 No
117670A 0.11 0.47 0.25 3.RI.h4 Giants of the Sea Informational passage 3 SR B 3 No
114008A 0.13 0.46 0.35 3.RI.k5 Daisies Informational passage 3 SR B 3 No
125949B 0.19 0.46 -0.03 3.WL.o1 WP_Farm Mouse Writing 3 SR A 2 No
120785A 0.08 0.21 0.46 3.RL.h1 Bears Literary passage 2 SR B 2 Yes
114010A 0.08 0.17 0.46 3.RI.h4 Daisies Informational passage 3 SR C 3 Yes
121423A 0.09 0.18 0.48 3.RL.k2 Bears Literary passage 3 SR B 2 Yes
124168A 0.08 0.16 0.49 3.WI.L4 set 2 Writing 2 SR B 2 Yes
120787A 0.12 0.19 0.50 3.RL.i2 Bears Literary passage 2 SR B 2 Yes
116205A 0.05 0.17 0.55 3.RL.i2 The Mulberry
Tree
Literary passage 4 SR C 3 Yes
Notes: Loadings less than 0.45 in absolute value have been removed.

15
The patterns of loadings in Tables 2 and 3 are remarkably clear. In Table 2, (Grade 5 math, form 1) all
items with strong loadings on factor 1 have a correct answer that is not the last response option, excluding
constructed response items. Similarly, items with strong positive loadings on factor 2 all have the correct
answer as the last response option. In addition, items that load highly on factor 1 have slightly lower
DOK levels than items that load strongly on factor 2.
In Table 3 (Grade 3 ELA, form 3), all of the items that load strongly on factor 1 are Foundational-Verbal
items, which students respond to verbally. These foundational items also have the lowest DOK level,
level 2. However, the p-values for these items are low, indicating that students found these items difficult
to get correct (with a mean p-value of 0.33, relative to the overall mean of 0.51). All of the items that load
strongly on factor 2 have a correct answer that is not the last response option while all of the items that
load strongly on factor 3 do have the correct answer as the last response option. Finally, items that load
highly on factor 2 have a higher DOK level (an average of 3.01) than the items that load highly on factor
3 (an average of 2.67).
Given the often messy nature of factor analysis, the results for these two forms are surprisingly clear. This
clarity is compelling, implying that the factors are not statistical artifacts, but instead provide insight into
ways in which students are responding to the items (e.g., that some students are systematically favoring
certain item response options or that responding verbally is qualitatively different than responding to the
other test items). These results also support the initial conclusions drawn by Measured Progress.
However, the evaluations conducted up to this point have been statistical in nature. In the next section, we
draw on the expertise of experts to determine if the findings made sense from the prospective of those
who know the students and content well.
Dimensionality Review Workshops
We conducted two workshops, one for math and one for ELA, with the goal of generating hypotheses
about the factors that influence student performance on the NCSC assessments. The math workshop was
conducted on August 26th, 2016 and the ELA workshop was conducted on September 9
th, 2016. The
workshops were run electronically via webinar format. For the math workshop, five experts with
backgrounds in the content areas, assessment, and students with severe disabilities participated. Four of
these five participants returned for the following ELA workshop (as a consequence, the results of the
second workshop are influenced by the first).
Each hour and a half workshop was made up of three tasks that provided increasing amounts of
information to the participants. In each task, we recorded the participants’ comments, resulting in a series
of hypotheses that are increasingly informed by the empirical results. Below we detail the process and
present the hypotheses generated from the third and final task. A complete summary of the results are
provided in Appendix D.
In the first workshop on the 26th, participants were first introduced to the concept of factor analysis
through a non-academic example. Since the participants in the second workshop had all participated in the
first, this introduction was omitted in the second workshop. After this introduction, the participants were
then asked to brainstorm, as a group, factors that could influence student performance on the NCSC
assessments in the given content area in general, and with specific emphasis on grade 5 in math and grade

16
3 in ELA. These grades had forms that exhibited strong signs of dimensionality, and we selected one form
in each content area for review in the remaining two tasks. In math, this form was grade 5, form 1 and in
ELA, this form was grade 3, form 3 (i.e., the forms we focused on in the previous section).
After this first brainstorming task, participants were instructed to review two electronic documents. The
first was an item spreadsheet that contained a number of features for items that had strong factor loadings.
The item spreadsheets did not, however, contain the factor loadings. The participants were also provided
with the items, as they appeared in the print version of the assessment. They were then given time to
review the spreadsheet and items in order to generate hypotheses about why these items might group
together as factors (we informed the participants that our analysis suggested that there were two factors
for the math workshop, three in ELA). After approximately 20 minutes of individual review of the
materials, the participants reconvened to generate new hypotheses and revise their previous hypotheses
from the first task.
In the third and final task, the participants were instructed to review an item spreadsheet that was updated
with the factor loadings. They were again given time to review the results individually, this time for
approximately 10 minutes, before participating in a group discussion aimed at generating a third, and
final, set of hypotheses about the specific factors presented in the updated item spreadsheets.
For form 1 in fifth grade math, hypotheses generated by the group to explain the groupings of items by
factor included:
Item complexity. The items appear to group based on the interaction of Tier and DOK, with
factor 1 having higher Tier and DOK levels and factor 2 having lower Tier and DOK levels.
Context. ‘Pure math’ versus ‘Functional Context’
Correct Response Option Location. Every item in the second factor has the last option as the
correct option. Reports from the field indicate that scrolling may be one root cause of students
selecting the last response option more often. In particular, students with physical disabilities may
have not been able to scroll up.
Interaction between Item Complexity and Correct Response Option Location. A
combination of hypotheses 1 and 3, in which both item complexity and the position of the
response options differentiates between the dimensions.
The participants were then asked if they wanted to come to consensus on hypotheses and suggest ways to
follow up on these hypotheses. The group concluded that scrolling and answer choice option were
compelling hypotheses. The participants also suggested reviewing the factor analysis results in light of the
categories from the LCI, as well as examining the results of cluster analysis using LCI categories.
For form 3 in third grade ELA, the participants felt that the factor structure was unambiguously explained
by a combination of the item content type and response option placement—specifically, that factor 1 was
related to the foundational verbal items and factors 2 and 3 were related to the placement of the correct
response option. Factor 2 had items for which the correct answer was not the last option, factor 3 had
items for which the correct answer was the last response option.

17
Further Investigation In this final section we detail additional investigations that build on the hypotheses generated during the
workshops, as well investigations that attempt to relate multidimensionality to features of the students, as
recommended by the experts during the review workshops.
Form Response Option Proportions.
During discussion about the position of the correct response option, the experts mentioned hearing reports
from the educators administering the NCSC assessments that they felt that the “C” response option was
the correct response option disproportionately (e.g., “why is C the correct answer so often?”). While it is
unclear to us how often the correct answer should be “C” or any other response option, a clear approach is
to examine whether the forms have different proportions of correct response options, and whether these
differences in proportions relate to the levels of dimensionality across forms.
To investigate this possibility, we compute the percent of correct answers by each response option, where
the number of items used to calculate the percentage is just the number of selected response items. Across
all forms, the number of correct answers for a response option range from 7 to 16 in Math and 6 to 15 in
ELA for option “A”; 4 to 17 in Math and 10 to 16 in ELA for option “B”; and 3 to 16 in Math and 5 to 13
in ELA for option “C”. These counts translate into percentages that range from 9% to 57%.
For Math, these percentages are strongly related to the presence of multidimensionality, as captured by
the multidimensional effect sizes. The Pearson correlations between the effect size and the percent of
correct answers falling into response options A, B and C are 0.24, -0.71 and 0.47, respectively. While
these correlations do seem strong, particularly for option B, the scatterplots, shown in Figure 7, indicate
that such conclusions warrant caution.
Figure 7. Percent of Correct Answers by Response Option vs. Multidimensional Effect Size for Math.
Note: The grey line is the OLS regression line.
For ELA, these trends are much weaker. The correlations are 0.15, -0.15, and -0.01 for response options
A, B and C, respectively. Figure 8 shows these trends as scatterplots.

18
Figure 8. Percent of Correct Answers by Response Option vs. Multidimensional Effect Size for ELA.
Note: The grey line is the OLS regression line.
The findings, although not conclusive, suggest that some students select the first or last response option in
a systematic fashion, and that these systematic preferences are captured as multidimensionality on forms
that have more correct answers as A or C.
Student Characteristics.
We examine the relationships between student characteristics and dimensionality in a fashion similar to
the examination of the percent of correct answers in the previous section. To do so, we calculate the
percent of students falling into the categories captured by the LCI, SAR and SRC variables, along with
general student demographics, for each form. We then correlate those percentages with the
multidimensional effect sizes. In math, this produces correlations greater than or equal to 0.30 for the
following variables:
SAR_ScribeBefore (Accommodation Before: Scribe / Transcription)
LCI_AugmentativeComm (Student has Augmentative Communication System (in addition to or
in place of oral speech))
HispanicOrLatinaEthnicity
ELAReportingStatus (ELA reporting status is exempt due to ELL stauts)
SRC_AbleTouchScreen (Student was able to highlight or touch the response)
LCI_Reading (Aware of text or Braille and follows directionality)
LCI_PrimaryLanguage (Primary Language is Russian)
LCI_ReceptiveLanguage (Aware of text or Braille and follows directionality)
SRC_AbleRespondVerbally (Student Response Check - Student was able to Respond Verbally)
In ELA, this produces correlations greater than or equal to 0.30 with the following variables:
LCI_OralSpeech (Student uses Speech to Communicate)
LCI_Braille (Student does not use Braille)
MigrantStatus (Student has migrant status)
While these relationships suggest that multidimensionality may be related to students’ physical and/or
verbal communicative abilities, they are at best preliminary.

19
Students with Response Option Favoritism
An alternative way to tackle the issues around response option selection is to use students as the unit of
analysis, rather than the assessment forms. To do so, we examine the number of times each student selects
each response option. For each student, we summed the number of times she selected response options
“A”, “B”, “C”, as well as the last response option (“B” for items with 2 response options, “C” for items
with 3 response options). Figure 9 shows the distribution of these sums for the forms we focused on
previously, math grade 5 form 1 and ELA grade 3 form 3. Appendix D provides similar figures for all
forms.
Figure 9. Distributions of the Number of Times Each Response Option was Selected by Each Student.
There are a number of students who selected a particular response option far more than would be
anticipated based on the number of times that response is the correct answer, or if they were guessing
randomly. In math grade 5, form 1 the correct answer is “A” for 14 items. There are a small number of
students who selected response option “A” far more often. For example, 28 students selected response
option “A” 28 times or more, double the number of times it appears as the correct answer. Applying this
same approach for each of four response options selections shown in Figure 9, “A”, “B”, “C” and last,
identifies 120 out of 1156 students for math grade 5, form 1. For ELA grade 3, form 3 this approach
identifies 23 out of 903 students. Using twice the number of times a response option is correct is arbitrary,
but does give a sense for how extreme some students’ response patterns are.
To see if these students are driving the multidimensionality observed in the data, we estimated the final
EFAs presented in the prior section, excluding the students whose selected a response option twice, or

20
more than twice, the number of times that item was the correct answer (referred to after as “response
option favoritism”). Figure 10 shows screeplots for the original EFAs with screeplots based on the EFAs
that excluded students who favored particular response options.
Figure 10. Scree Plots for Unrotated Factor Solution including and excluding Students Favoring
Particular Reponses Options for Math Grade 5, Form 1 and ELA Grade 3 Form 3.
The patterns in the figure show that excluding students displaying favoritism for a particular response
option does decrease the amount of dimensionality for the math form, but not the ELA form. In general,
the exclusion of these students decreases the dimensionality of the data in math, as shown by the figures
in Appendix F. This trend generally holds for the ELA forms as well, excluding third and fourth grade
ELA, which contain the foundational items. These findings suggest that there is some group of students
who do favor particular response options, and that this favoritism does translate into dimensionality in
math and in ELA in grades 5 and up. However, this type of response option favoritism, as defined here,
does not fully explain multidimensionality. The plot for math in Figure 10 illustrates this point. The sum
of squared loadings for the second factor decreases when these students are excluded, but not enough –
the trend still suggests that the second factor accounts for a sizable amount of variability.
Discussion Examining dimensionality is akin to the evaluation of a Rorschach test – subjective and prone to over or
under interpretation. To address this concern, we solicited the help of experts who were relatively
unaware of our findings or those of Measured Progresses. They came to similar conclusions about the
factors. Our results suggest that some students favor a particular response option and that this favoritism
is reflected as multidimensionality on certain forms. To conclude we do suggest that:
1. Future form development and revision carefully consider the balance of the number of correct
responses per selected response option, particularly in math.
2. Students’ preferential selection of a given response option be studied further, potentially
using qualitative means. Such behavior, if undesirable, could be corrected through revisions
to the test administration procedure.

21
References
Finch, H., & Monahan, P. (2008). A bootstrap generalization of modified parallel analysis for IRT
dimensionality assessment. Applied Measurement in Education, 21, 119–140.
Horn, J. L. (1965). A rationale and test for the number of factors in factor analysis. Psychometrika, 30,
179–185.
National Center and State Collaborative. (2015). National Center and State Collaborative 2015
operational assessment technical manual.
National Center and State Collaborative. (n.d.). NCSC assessment system user guide for test
administrators.
Reckase, M. D. (2009). Multidimensional item response theory. New York, NY: Springer Stout, W.,
Froelich, A. G., & Gao, F. (2001). Using resampling methods to produce an improved DIMTEST
procedure. In A. Boomsma, M. A. J. van Duijn, & T. A. B. Snijders (Eds.), Essays on item response
theory (pp. 357–375). New York, NY: Springer-Verlag.
Velicer, W. F. (1976). Determining the number of components from the matrix of partial correlations.
Psychometrika, 41, 321-327.
Yen, W. M. (1993). Scaling performance assessments: Strategies for managing local item dependence.
Journal of Educational Measurement, 30, 187-213.
Zhang, J., & Stout, W. (1999b). The theoretical DETECT index of dimensionality and its application to
approximate simple structure. Psychometrika, 64, 213–249.
22
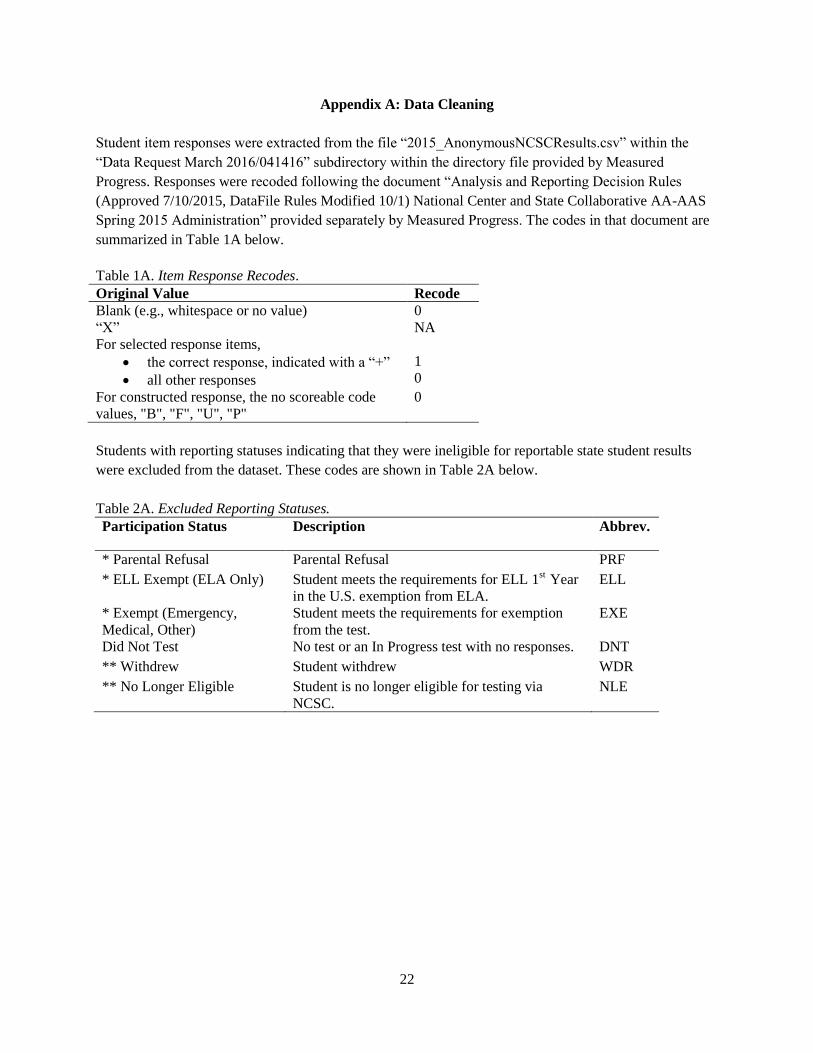
Appendix A: Data Cleaning
Student item responses were extracted from the file “2015_AnonymousNCSCResults.csv” within the
“Data Request March 2016/041416” subdirectory within the directory file provided by Measured
Progress. Responses were recoded following the document “Analysis and Reporting Decision Rules
(Approved 7/10/2015, DataFile Rules Modified 10/1) National Center and State Collaborative AA-AAS
Spring 2015 Administration” provided separately by Measured Progress. The codes in that document are
summarized in Table 1A below.
Table 1A. Item Response Recodes.
Original Value Recode
Blank (e.g., whitespace or no value) 0
“X” NA
For selected response items,
the correct response, indicated with a “+”
all other responses
1
0
For constructed response, the no scoreable code
values, "B", "F", "U", "P"
0
Students with reporting statuses indicating that they were ineligible for reportable state student results
were excluded from the dataset. These codes are shown in Table 2A below.
Table 2A. Excluded Reporting Statuses.
Participation Status Description Abbrev.
* Parental Refusal Parental Refusal PRF
* ELL Exempt (ELA Only) Student meets the requirements for ELL 1st
Year
in the U.S. exemption from ELA.
ELL
* Exempt (Emergency,
Medical, Other)
Student meets the requirements for exemption
from the test.
EXE
Did Not Test No test or an In Progress test with no responses. DNT
** Withdrew Student withdrew WDR
** No Longer Eligible Student is no longer eligible for testing via
NCSC.
NLE

23
Appendix B: Suggested Number of Dimensions by Method
Table 1B. Number of Suggested Dimensions for Math Forms.
Grade Form SSL
Ratio1
MD
ES1
Suggested Number of Factors2
Median(PA,
MAP, VSS) PA MAP VSS SSL ≥ 1
3 1 2.00 1.36 3 4 3 1 3
2 4.06 0.86 3 6 3 1 3
3 3.30 0.96 3 4 3 1 3
4 3.34 0.76 3 4 3 1 3
4 1 2.49 1.19 3 4 3 1 3
2 1.79 1.13 3 6 3 1 3
3 2.36 1.02 3 5 3 1 3
4 1.35 1.31 3 4 3 1 3
5 1 1.39 1.64 2 4 2 2 2
2 1.88 1.05 2 4 2 2 2
3 1.98 1.01 2 3 2 1 2
4 2.46 0.67 2 5 2 1 2
6 1 2.24 0.88 2 5 2 1 2
2 1.98 1.02 2 5 2 2 2
3 2.52 1.06 2 5 2 1 2
4 2.47 0.99 2 6 2 1 2
7 1 2.17 1.01 2 4 2 1 2
2 2.53 1.13 3 4 3 1 2
3 2.56 0.83 2 4 2 1 2
4 1.51 1.21 2 4 2 2 2
8 1 2.70 0.66 2 4 2 2 2
2 3.24 0.91 2 4 2 1 2
3 3.17 0.83 2 4 2 2 2
4 2.32 0.94 2 4 2 1 2
11 1 2.76 0.67 2 3 2 1 2
2 3.55 0.40 2 5 2 1 2
3 2.45 0.66 2 7 2 1 2
4 3.21 0.62 2 4 2 1 2
Notes: 1The indices of multidimensionality are the ratio of the first to second sums of squared loadings (SSL) and
the Multidimensional Effect Size (MD ES) produced by DETECT. 2The statistical criterion reported are Parallel
Analysis (PA), Minimum Average Partial (MAP) criterion, Very Simple Structure (VSS) with a complexity of one,
and eigenvalues/Sums of Squared Loadings greater than or equal to 1 (SSL ≥ 1; i.e., the Kaiser rule).
24
Table 2B. Number of Suggested Dimensions for ELA Forms.
Grade Form SSL
Ratio1
MD
ES1
Suggested Number of Factors2
Median(PA,
MAP, VSS) PA MAP VSS SSL ≥ 1
3 1 3.17 1.58 3 3 4 3 1
2 4.25 0.98 3 3 6 3 1
3 3.03 1.03 3 3 4 3 1
4 3.31 1.03 3 3 4 3 1
4 1 3.71 1.33 3 3 4 3 1
2 4.00 0.87 3 3 6 3 1
3 3.03 1.15 3 3 5 3 1
4 3.47 1.20 3 3 4 3 1
5 1 2.52 0.86 2 2 4 2 2
2 2.36 0.83 2 2 4 2 2
3 2.64 0.79 2 2 3 2 1
4 3.16 0.66 2 2 5 2 1
6 1 3.75 0.80 2 2 5 2 1
2 2.62 0.66 2 2 5 2 2
3 3.08 0.83 2 2 5 2 1
4 4.68 0.46 2 2 6 2 1
7 1 3.09 0.89 2 2 4 2 1
2 3.37 0.84 2 3 4 3 1
3 2.75 0.71 2 2 4 2 1
4 2.37 0.94 2 2 4 2 2
8 1 2.57 0.95 2 2 4 2 2
2 2.92 1.16 2 2 4 2 1
3 2.24 0.96 2 2 4 2 2
4 2.41 0.79 2 2 4 2 1
11 1 2.66 1.08 2 2 3 2 1
2 3.35 0.79 2 2 5 2 1
3 3.60 0.53 2 2 7 2 1
4 3.08 0.68 2 2 4 2 1
Notes: 1The indices of multidimensionality are the ratio of the first to second sums of squared loadings (SSL) and
the Multidimensional Effect Size (MD ES) produced by DETECT. 2The statistical criterion reported are Parallel
Analysis (PA), Minimum Average Partial (MAP) criterion, Very Simple Structure (VSS) with a complexity of one,
and eigenvalues/Sums of Squared Loadings greater than or equal to 1 (SSL ≥ 1; i.e., the Kaiser rule).

25
Figure 1B. Scatterplots of SSL Ratios vs. Multidimensional Effect Sizes.
Note: The SSL Ratio only conveys how important the second factor is in relation to the first (e.g.,
SSL(F1)/SSL(F2)). Thus, when there is a third factor that accounts for a sizable amount of item variability, as is
often the case in ELA, the SSL ratio will not correlate well with the Multidimensional Effect size, even though both
the EFA results and the DETECT results are both indicating similar levels of multidimensionality.
26
Appendix C: Correlations between Factor Loadings and Item Features
The tables below are meant to provide insight into the nature of the factors produced by the final set of
exploratory factor analysis (in which the number of factors extracted was set to the median number of
suggested factors by PA, MAP and VSS, and the loadings were rotated using varimax). There are three
types of correlations in the tables.
Table 1C. Correlations between Factor Loadings and Item Features in Math.
Grade 3 Form 1 Form 2 Form 3 Form 4
1 2 3 1 2 3 1 2 3 1 2 3
Item Order -0.12 0.10
0.11 0.09 0.12 0.03 0.13
0.13 0.19
Session -0.02 -0.06
-0.06 -0.06 -0.06 -0.05 -0.06
-0.06 -0.06
Focal KSA 0.10 0.13
0.33 0.07 0.33 0.15 0.07
0.33 0.24
Domain 0.07 -0.01
0.06 0.09 0.06 0.07 -0.06
0.19 0.16
Standard 0.10 0.13
0.33 0.07 0.33 0.15 0.07
0.33 0.24
Tier -0.27 0.25
-0.06 -0.02 -0.03 -0.22 0.30
-0.22 0.32
Family 0.14 0.08
0.22 0.05 0.22 0.02 -0.06
-0.02 -0.05
Type (SR, CR) 0.38 0.10
0.49 0.22 -0.46 0.38 0.00
0.49 0.15
# of Response Options 0.26 0.26
0.60 0.02 0.60 0.15 0.14
0.37 0.29
Key 0.81 0.95
0.65 0.82 0.65 0.69 0.92
0.80 0.93
DOK -0.04 -0.21
0.28 0.26 0.28 -0.07 -0.20
0.03 -0.08
Calculator 0.04 0.01
0.28 -0.11 -0.13 0.31 -0.10
0.29 -0.08
Manipulatives -0.05 0.03
0.10 0.12 -0.19 -0.09 0.19
0.10 0.09
Correct Answer is Last -0.61 0.84
-0.36 0.85 -0.78 -0.58 0.80
-0.40 0.77
Pre-Print 0.22 -0.12
0.66 0.00 0.66 0.13 -0.10
0.35 -0.11
Pilot P-Value 0.37 -0.23
0.10 0.18 -0.30 0.23 -0.16
0.25 -0.34
Preferred For Access -0.09 0.27
-0.06 0.26 -0.06 -0.03 0.15
-0.03 0.22
Family "Enemies" -0.08 0.10
0.34 -0.11 0.34 0.20 -0.02
-0.03 -0.47
Grade 4 Form 1 Form 2 Form 3 Form 4
1 2 1 2 1 2 1 2
Item Order 0.32 -0.10
0.13 -0.03
0.00 0.20
0.02 -0.06
Session 0.00 -0.06
-0.04 -0.02
-0.06 -0.03
-0.06 0.00
Focal KSA 0.26 0.43
0.57 0.17
0.60 0.32
0.62 0.43
Domain 0.20 0.36
0.47 0.16
0.46 0.20
0.29 0.25
Standard 0.26 0.43
0.57 0.17
0.60 0.32
0.62 0.43
Tier 0.39 -0.48
-0.33 0.31
-0.38 0.28
-0.47 0.32
Family 0.01 0.15
-0.04 0.12
0.14 -0.07
-0.12 0.00
Type (SR, CR) -0.20 0.53
0.59 0.10
0.62 -0.18
0.48 0.02
# of Response Options 0.36 0.70
0.59 0.01
0.75 0.03
0.53 -0.03
Key 0.94 0.75
0.76 0.94
0.63 0.90
0.80 0.88
DOK 0.12 0.18
0.12 0.12
0.14 0.13
0.05 0.16
Calculator
Manipulatives 0.05 0.22
0.40 0.11
0.51 0.03
0.28 0.01
Correct Answer is Last 0.78 -0.39
-0.32 0.86
-0.21 0.77
-0.50 0.86
Pre-Print -0.03 0.50
0.55 0.07
0.68 0.00
0.41 0.16
Pilot P-Value -0.19 0.30
0.30 -0.25
0.21 -0.04
0.35 -0.21
Preferred for Access -0.34 -0.28
0.10 -0.21
-0.10 -0.12
-0.28 -0.21
Family "Enemies" 0.26 -0.03
0.04 0.22
-0.47 -0.01
-0.68 0.22
Note: Certain features a blank for some grades, as those item features do not vary in those grades.
27
Table 1C. Correlations between Factor Loadings and Item Features in Math (Continued).
Grade 5 Form 1 Form 2 Form 3 Form 4
1 2 1 2 1 2 1 2
Item Order -0.08 -0.13
0.18 -0.27
-0.12 0.21
-0.06 -0.20
Session -0.06 0.04
0.03 -0.01
-0.05 -0.05
0.01 0.06
Focal KSA 0.22 0.01
0.17 -0.14
0.13 -0.20
0.28 -0.04
Domain 0.01 -0.02
-0.03 -0.01
-0.05 -0.14
0.03 -0.01
Standard 0.22 0.01
0.17 -0.14
0.13 -0.20
0.28 -0.04
Tier -0.11 0.06
-0.14 -0.25
-0.15 0.09
-0.27 0.02
Family -0.02 -0.07
-0.02 0.15
-0.07 -0.07
-0.06 0.08
Type (SR, CR) 0.40 0.05
0.15 0.07
0.37 0.08
0.19 -0.06
# of Response Options 0.29 -0.14
0.03 -0.13
0.23 -0.01
0.13 -0.17
Key 0.78 0.90
0.79 0.72
0.66 0.88
0.55 0.85
DOK 0.28 -0.10
0.12 -0.08
0.39 -0.08
0.43 -0.08
Calculator 0.14 0.14
-0.07 0.29
0.26 -0.02
0.27 0.05
Manipulatives 0.03 0.18
-0.29 0.06
0.21 0.03
0.06 0.05
Correct Answer is Last -0.62 0.84
-0.71 0.81
-0.58 0.86
-0.55 0.73
Pre-Print 0.22 -0.08
0.09 -0.16
0.18 -0.15
-0.09 -0.17
Pilot P-Value 0.24 -0.06
0.06 0.33
-0.15 0.14
0.13 -0.03
Preferred for Access -0.22 -0.22
0.07 -0.09
-0.08 -0.07
-0.05 0.01
Family "Enemies" 0.26 -0.01
0.04 -0.14
0.08 0.03
-0.03 0.50
Grade 6 Form 1 Form 2 Form 3 Form 4
1 2 1 2 1 2 1 2
Item Order 0.24 0.04
0.06 0.10
0.09 0.12
0.11 0.12
Session 0.05 -0.04
-0.06 -0.05
-0.06 -0.01
-0.05 -0.06
Focal KSA 0.28 -0.01
0.29 0.31
-0.07 0.23
0.08 0.11
Domain 0.19 -0.04
0.18 0.32
-0.01 0.07
0.16 0.00
Standard 0.28 -0.01
0.29 0.31
-0.07 0.23
0.08 0.11
Tier -0.36 0.24
0.25 -0.26
0.24 -0.24
-0.25 0.40
Family 0.06 0.00
-0.12 0.13
-0.07 0.01
0.04 0.05
Type (SR, CR)
# of Response Options -0.06 0.09
0.02 -0.10
0.07 -0.08
-0.07 0.19
Key 0.79 0.65
0.71 0.88
0.64 0.70
0.86 0.70
DOK 0.22 0.01
-0.02 0.01
-0.01 0.17
0.10 0.11
Calculator -0.21 0.04
0.19 -0.13
0.08 -0.28
-0.04 0.12
Manipulatives -0.36 0.22
0.02 -0.21
-0.01 -0.22
-0.28 0.19
Correct Answer is Last 0.72 -0.85
-0.82 0.79
-0.77 0.69
0.62 -0.83
Pre-Print -0.09 -0.13
0.02 0.01
-0.04 -0.07
-0.08 -0.09
Pilot P-Value 0.28 -0.06
0.01 0.12
-0.23 0.46
0.10 0.05
Preferred for Access -0.01 -0.15
0.04 -0.06
0.00 -0.07
-0.09 -0.07
Family "Enemies" 0.36 0.01
-0.74 -0.29
0.14 -0.01
0.23 -0.10
Note: Certain features a blank for some grades, as those item features do not vary in those grades.
28
Table 1C. Correlations between Factor Loadings and Item Features in Math (Continued).
Grade 7 Form 1 Form 2 Form 3 Form 4
1 2 1 2 1 2 1 2
Item Order -0.14 0.30
0.19 0.11
0.29 -0.03
0.25 -0.07 -0.29
Session -0.04 -0.02
0.00 -0.06
0.02 -0.06
-0.01 -0.06 -0.01
Focal KSA 0.22 0.21
0.18 0.06
0.26 -0.01
0.24 0.33 0.24
Domain 0.27 0.29
0.10 0.16
0.17 -0.04
0.28 0.29 0.28
Standard 0.22 0.21
0.18 0.06
0.26 -0.01
0.24 0.33 0.24
Tier -0.24 0.42
0.21 -0.08
0.03 0.00
0.38 -0.06 -0.33
Family 0.03 -0.09
-0.04 -0.14
-0.11 0.02
0.17 -0.10 0.17
Type (SR, CR)
# of Response Options -0.02 -0.04
-0.08 0.19
-0.01 0.38
0.15 -0.01 0.15
Key 0.80 0.84
0.83 0.93
0.84 0.96
0.81 0.94 0.81
DOK 0.17 0.03
-0.11 -0.09
-0.13 -0.12
0.29 0.00 0.29
Calculator
Manipulatives 0.11 -0.18
-0.07 0.06
-0.09 0.11
0.04 0.10 0.15
Correct Answer is Last 0.66 -0.84
-0.85 0.85
-0.80 0.77
-0.84 0.85 -0.19
Pre-Print 0.02 0.18
-0.05 -0.09
-0.04 0.04
-0.05 -0.11 0.00
Pilot P-Value 0.31 -0.33
0.17 -0.15
0.21 -0.31
-0.20 -0.26 0.49
Preferred for Access 0.16 0.02
0.15 -0.02
-0.10 -0.12
0.02 -0.12 0.02
Family "Enemies" -0.07 -0.03
-0.51 0.27
-0.69 0.22
-0.97 -0.05 -0.97
Grade 8 Form 1 Form 2 Form 3 Form 4
1 2 1 2 1 2 1 2
Item Order 0.24 0.04
0.25 0.24
0.19 0.23
0.10 -0.01
Session -0.01 -0.06
0.06 0.00
-0.02 -0.02
-0.03 -0.06
Focal KSA 0.12 0.19
0.05 0.08
0.06 0.24
0.22 0.20
Domain 0.02 0.24
0.02 0.11
0.04 0.26
0.08 -0.05
Standard 0.12 0.19
0.05 0.08
0.06 0.24
0.22 0.20
Tier 0.19 -0.10
0.27 -0.02
0.16 0.11
-0.04 0.00
Family -0.11 0.02
-0.15 -0.13
-0.10 -0.01
0.04 -0.06
Type (SR, CR) 0.07 0.13
0.01 0.04
0.23 -0.01
-0.03 0.08
# of Response Options 0.07 -0.05
-0.09 -0.14
-0.01 0.01
-0.13 -0.16
Key 0.85 0.75
0.89 0.71
0.89 0.83
0.84 0.88
DOK 0.27 0.07
0.10 -0.11
0.10 -0.05
0.05 0.15
Calculator
Manipulatives 0.11 -0.07
0.24 0.04
0.07 0.10
0.10 -0.01
Correct Answer is Last -0.64 0.34
-0.61 0.00
-0.42 0.05
0.21 -0.58
Pre-Print -0.08 -0.05
-0.03 -0.11
-0.01 -0.07
-0.08 -0.10
Pilot P-Value -0.34 0.42
-0.10 0.22
-0.18 0.15
-0.02 0.08
Preferred for Access -0.28 -0.32
-0.27 -0.36
-0.14 -0.21
0.03 -0.11
Family "Enemies" -1.03 0.07
-0.95 0.07
-0.19 -0.13
Note: Certain features a blank for some grades, as those item features do not vary in those grades.
29
Table 1C. Correlations between Factor Loadings and Item Features in Math (Continued).
Grade 11 Form 1 Form 2 Form 3 Form 4
1 2 1 2 1 2 1 2
Item Order 0.22 0.15
0.05 0.05
0.03 0.01
0.24 -0.13
Session -0.02 -0.03
-0.03 -0.06
-0.06 -0.03
0.11 0.01
Focal KSA 0.18 0.24
-0.01 0.43
0.10 0.25
0.26 0.32
Domain -0.08 -0.07
-0.08 0.07
-0.02 0.18
-0.15 0.06
Standard 0.18 0.24
-0.01 0.43
0.10 0.25
0.26 0.32
Tier 0.32 0.01
-0.24 0.05
-0.13 0.06
-0.14 0.22
Family 0.02 -0.02
-0.13 -0.17
-0.03 0.08
-0.11 -0.11
Type (SR, CR) -0.37 0.18
-0.02 -0.40
0.13 -0.41
-0.01 -0.41
# of Response Options 0.46 -0.06
-0.16 0.30
-0.08 0.31
-0.16 0.37
Key 0.86 0.66
0.79 0.82
0.70 0.77
0.82 0.80
DOK 0.02 -0.03
0.12 0.24
0.07 0.08
0.23 0.24
Calculator
Manipulatives 0.25 -0.09
-0.14 0.08
-0.19 0.05
-0.27 0.11
Correct Answer is Last 0.49 -0.72
-0.79 0.46
-0.67 0.52
-0.73 0.40
Pre-Print 0.26 -0.02
-0.09 0.24
0.00 0.16
-0.01 0.21
Pilot P-Value -0.17 0.04
0.22 0.03
0.23 -0.01
0.10 0.00
Preferred for Access -0.07 0.02
0.18 0.05
0.06 0.02
-0.02 -0.06
Family "Enemies" 0.16 -0.11
-0.05 -0.56
-0.33 -0.44
-0.33 -0.23
Note: Certain features a blank for some grades, as those item features do not vary in those grades.

30
Table 2C. Correlations between Factor Loadings and Item Features in ELA.
Grade 3 Form 1 Form 2 Form 3 Form 4
1 2 3 1 2 3 1 2 3 1 2 3
Item Order -0.08 0.18 -0.18 0.15 -0.01 -0.26 0.08 0.01 -0.34 -0.02 0.10 -0.38
Session 0.07 0.02 0.07 -0.06 0.06 -0.06 0.12 0.12 0.12 0.11 0.04 0.11
# of Response Options 0.98 0.09 0.98 -0.02 0.96 -0.02 0.98 0.07 0.98 0.97 0.14 0.97
Key 0.98 0.76 0.98 0.72 0.96 0.72 0.98 0.69 0.98 0.97 0.74 0.97
Correct Answer is Last 0.08 -0.78 0.52 -0.72 -0.01 0.58 0.05 -0.70 0.30 0.04 -0.75 0.47
Type (SR, CR) 0.76 0.01 -0.20 0.20 0.52 -0.25 0.64 -0.06 -0.44 0.78 -0.04 -0.34
Tier -0.03 -0.26 0.23 -0.15 -0.39 0.11 0.10 -0.35 -0.26 0.13 -0.33 0.30
DOK -0.46 0.09 0.09 0.09 -0.34 -0.02 -0.61 0.20 0.17 -0.58 -0.09 0.28
Pilot P-Value -0.42 0.06 0.55 0.13 -0.33 0.61 -0.53 0.24 0.72 -0.49 0.37 0.57
Content Type 0.97 0.08 0.97 -0.02 0.94 -0.02 0.97 0.11 0.97 0.96 0.13 0.96
Family 0.74 0.06 0.74 -0.09 0.63 -0.09 0.74 0.04 0.74 0.74 0.10 0.74
CCC 0.98 0.17 0.98 0.18 0.94 0.18 0.97 0.19 0.97 0.97 0.38 0.97
CCC Domain 0.98 0.22 0.98 0.21 0.94 0.21 0.97 0.18 0.97 0.97 0.14 0.97
Grade 4 Form 1 Form 2 Form 3 Form 4
1 2 3 1 2 3 1 2 3 1 2 3
Item Order -0.11 -0.28 0.01 -0.21 -0.27 -0.05 -0.08 0.05 -0.04 -0.02 -0.18 0.03
Session 0.10 0.06 0.10 0.10 0.10 0.10 -0.03 0.01 -0.03 0.07 -0.03 0.07
# of Response Options 0.97 0.21 0.97 -0.01 0.96 -0.01 0.22 0.97 0.22 0.97 0.16 0.97
Key 0.98 0.79 0.98 0.65 0.97 0.65 0.79 0.97 0.79 0.97 0.66 0.97
Correct Answer is Last 0.02 -0.65 0.33 -0.76 -0.10 0.57 -0.77 0.16 0.31 0.15 -0.80 0.38
Type (SR, CR) 0.70 -0.04 -0.38 0.14 0.47 -0.15 -0.32 0.61 -0.23 0.74 -0.14 -0.37
Tier -0.08 -0.42 0.15 -0.23 -0.27 0.03 -0.38 -0.06 -0.08 -0.04 -0.15 0.06
DOK -0.65 -0.28 0.34 -0.16 -0.27 0.15 0.02 -0.57 0.41 -0.55 -0.01 0.06
Pilot P-Value -0.67 0.41 0.32 0.14 -0.57 0.33 0.47 -0.73 0.44 -0.54 0.36 0.53
Content Type 0.96 0.03 0.96 -0.02 0.51 -0.02 0.15 0.96 0.15 0.96 0.14 0.96
Family 0.69 0.13 0.69 0.01 0.19 0.01 0.22 0.69 0.22 0.62 0.11 0.62
CCC 0.96 0.26 0.96 0.05 0.32 0.05 0.26 0.94 0.26 0.95 0.00 0.95
CCC Domain 0.96 -0.04 0.96 -0.06 0.46 -0.06 0.12 0.95 0.12 0.96 0.07 0.96
Grade 5 Form 1 Form 2 Form 3 Form 4
1 2 1 2 1 2 1 2
Item Order -0.08 0.07
-0.04 0.08
0.26 0.02
0.01 0.05
Session -0.10 -0.05
-0.09 -0.04
0.04 -0.09
-0.10 -0.03
# of Response Options 0.17 -0.05
0.07 -0.03
-0.05 -0.08
0.15 -0.07
Key 0.78 0.59
0.81 0.58
0.82 0.62
0.75 0.64
Correct Answer is Last -0.74 0.83
-0.83 0.78
-0.84 0.79
-0.78 0.84
Type (SR, CR) 0.23 0.08
0.34 -0.05
0.21 -0.11
0.41 -0.43
Tier -0.23 -0.18
-0.16 -0.21
0.04 0.00
-0.21 0.01
DOK -0.06 -0.17
-0.07 -0.19
0.06 -0.18
-0.04 -0.33
Pilot P-Value 0.30 0.55
0.28 0.48
0.04 0.47
0.55 0.11
Content Type 0.07 -0.07
0.04 -0.05
-0.02 -0.09
-0.04 -0.04
Family -0.04 -0.14
-0.12 -0.14
-0.02 -0.22
-0.06 -0.09
CCC 0.03 -0.13
0.10 0.06
-0.13 0.03
0.10 0.05
CCC Domain 0.06 -0.11
0.15 -0.10
0.00 -0.09
0.16 0.18

31
Table 2C. Correlations between Factor Loadings and Item Features in ELA (Continued).
Grade 6 Form 1 Form 2 Form 3 Form 4
1 2 1 2 1 2 1 2
Item Order -0.17 0.04
0.02 -0.47
-0.06 -0.10
0.12 -0.55
Session -0.10 0.08
-0.07 0.19
-0.10 -0.02
-0.07 0.30
# of Response Options -0.01 -0.07
-0.01 0.22
-0.07 -0.07
0.01 0.24
Key 0.62 0.66
0.74 0.66
0.03 -0.03
0.55 0.45
Correct Answer is Last -0.79 0.86
-0.76 0.85
-0.07 -0.03
-0.77 0.70
Type (SR, CR) -0.03 0.25
0.31 -0.02
0.25 -0.08
0.15 0.15
Tier -0.20 -0.01
0.01 -0.37
0.07 -0.08
0.05 -0.52
DOK -0.13 -0.01
0.10 -0.36
0.17 -0.16
0.11 -0.40
Pilot P-Value 0.16 0.35
-0.15 0.79
0.05 0.15
-0.08 0.95
Content Type -0.09 0.14
0.14 0.07
-0.09 0.04
0.25 0.05
Family 0.02 0.28
-0.01 0.35
0.02 0.00
0.05 0.68
CCC -0.05 0.33
0.16 0.20
0.11 -0.16
0.08 0.02
CCC Domain -0.14 0.36
0.18 0.07
-0.07 0.01
0.29 0.04
Grade 7
Form 1 Form 2 Form 3 Form 4
1 2 1 2 3 1 2 1 2
Item Order -0.11 0.02
-0.48 0.07 0.07 -0.05 0.00
-0.39 0.28
Session 0.15 -0.09
0.32 -0.01 0.32 -0.03 -0.07
0.46 0.10
# of Response Options 0.08 -0.01
0.30 0.06 0.30 0.02 -0.04
0.39 0.19
Key 0.67 0.74
0.63 0.73 0.63 0.67 0.74
0.61 0.84
Correct Answer is Last -0.68 0.74
-0.59 0.84 -0.61 -0.75 0.82
-0.71 0.78
Type (SR, CR) 0.00 0.20
0.33 -0.05 0.20 -0.15 0.19
0.30 -0.24
Tier -0.36 0.21
-0.55 0.09 -0.20 -0.31 0.15
-0.65 0.46
DOK 0.31 -0.04
-0.19 0.13 -0.13 0.19 -0.05
-0.32 0.26
Pilot P-Value 0.43 0.10
0.75 0.05 -0.09 0.46 -0.02
0.80 -0.46
Content Type 0.00 -0.08
-0.04 -0.04 -0.04 -0.03 -0.07
-0.08 -0.09
Family 0.30 -0.19
0.58 -0.10 0.58 0.11 -0.19
0.66 0.25
CCC -0.15 0.14
-0.11 -0.02 -0.11 -0.09 0.20
-0.18 -0.08
CCC Domain -0.08 -0.12
-0.01 -0.13 -0.01 -0.11 -0.08
-0.07 -0.02
Grade 8
Form 1 Form 2 Form 3 Form 4
1 2 1 2 1 2 1 2
Item Order -0.31 0.09
-0.22 0.28
-0.33 0.23
-0.27 0.18
Session 0.05 -0.02
0.05 0.02
0.02 -0.02
0.03 0.02
# of Response Options -0.04 0.17
0.11 0.04
-0.07 -0.06
-0.04 -0.06
Key 0.79 0.67
0.63 0.77
0.77 0.84
0.61 0.80
Correct Answer is Last -0.79 0.87
-0.86 0.80
-0.86 0.85
-0.79 0.83
Type (SR, CR) 0.31 0.00
0.26 -0.03
0.10 -0.05
0.13 0.08
Tier -0.10 -0.31
0.03 -0.15
-0.24 -0.02
-0.22 -0.05
DOK 0.11 -0.31
0.06 -0.25
0.09 -0.16
-0.02 -0.20
Pilot P-Value -0.14 0.67
-0.30 0.27
0.06 0.10
0.15 0.28
Content Type 0.04 0.02
0.10 0.04
0.19 -0.01
0.33 -0.08
Family 0.19 0.02
0.13 0.02
0.15 -0.06
0.26 0.06
CCC -0.08 -0.19
-0.09 -0.14
0.11 -0.06
0.25 -0.25
CCC Domain 0.02 -0.09
0.04 -0.07
0.17 -0.02
0.27 -0.14

32
Table 2C. Correlations between Factor Loadings and Item Features in ELA (Continued).
Grade 11 Form 1 Form 2 Form 3 Form 4
1 2 1 2 1 2 1 2
Item Order -0.12 0.20
-0.11 0.13
-0.16 0.22
-0.24 0.11
Session -0.06 -0.04
-0.11 -0.09
-0.08 -0.05
0.06 -0.09
# of Response Options 0.01 -0.07
-0.03 -0.04
-0.02 -0.03
-0.06 -0.03
Key 0.61 0.81
0.50 0.69
0.38 0.78
0.63 0.81
Correct Answer is Last -0.78 0.79
-0.76 0.80
-0.71 0.77
-0.85 0.83
Type (SR, CR) 0.32 0.01
0.17 0.00
0.31 0.09
0.28 0.07
Tier -0.22 -0.06
-0.23 0.00
-0.19 0.09
-0.09 0.03
DOK -0.26 0.09
-0.09 0.16
-0.14 0.35
-0.43 0.45
Pilot P-Value 0.51 0.27
0.62 0.10
0.58 0.17
0.33 0.13
Content Type -0.03 0.11
-0.08 0.06
-0.08 0.09
-0.07 0.05
Family 0.03 -0.07
0.08 -0.01
0.05 -0.09
-0.05 -0.11
CCC 0.38 -0.03
0.23 -0.02
0.30 -0.11
0.01 -0.26
CCC Domain -0.03 0.07
-0.14 0.01
0.00 0.02
-0.06 -0.11

33
Appendix D: Full Dimensionality Review Workshop Summaries
Mathematics, Grade 5, Form 1
8/26/16
Introduction
The goal of the workshop was to have experts familiar with the subject domain, population and
assessment generate hypothesis about the factors that could influence student performance on the NCSC
assessment. To generate hypotheses, participants engaged in a series of three tasks that increased the
amount of information available to them. These tasks were structured to elicit as much information as
possible from the participants without leading them to a particular conclusion. Thus participants were not
presented with the factor loadings until the third and final task.
Task 1
In the first task, the participants were asked to generate hypotheses about what factors may influence
student performance on the 5th grade without reviewing them items or a spreadsheet of item design
features. Prior to this task, participants were given a conceptual overview of factor analysis to provide
context.
Hypotheses included factors dealing with:
Opportunity to learn (OTL).
Student disability characteristics (as captured by the LCI instrument).
Teacher ability to instruct the subject domain to the population, e.g., teacher capacity to provide
OTL.
Teacher ability to carry out the assessment and record the results, e.g., an unintended interaction
with examinee and examiner.
Student familiarity of the item content, e.g., whether the item content the students have
experience in, such as work problems dealing with money.
o Students may have selected responses that had familiar content, regardless of whether it
was the correct answer.
Student (and teacher) familiarity with item response selection. Often, these students are presented
with response options horizontally.
Student (and teacher) understanding of the nature of the response task (e.g. selection of a choice,
scrolling).
The interaction of the content and the design of the supports within the items - i.e. aspects of
items were mean to be a support, but instead complicated cognition.

34
Task 2
In the second task, the participants were given a spreadsheet containing features9 of a subset of items, as
well as the items themselves as they were displayed in the print version of the assessment. The item
subset was made up of the 29 items that had factor loadings greater than 0.30 in absolute value on either
of the factors produced by exploratory factor analysis10
. The participants were given time to review the
materials independently, to generate hypotheses about potential factors that items could group by. This
review was followed by group conversation on the generated hypotheses.
Hypotheses about the way items might group by factors included:
Visual items vs. non-visual items.
Two option vs. three option items.
Items that are context neutral vs. those that provide context, particularly if the context might be
familiar.
o There were reports that teachers were flummoxed by the pure math problems – there was
nothing familiar for the teacher to hang his or her hat on.
Location of the correct response option, e.g., whether the correct answer was the first or last
option.
One step versus two step items – whether the problem solving process required a single step or
two.
Task 3
In the final task, participants were provided with and updated item spreadsheet that contained the factor
loadings. The rows of the updated spreadsheet were sorted by factor loadings, thus grouping the items by
factor. The participants were asked to revise their hypotheses in light of the factor loadings.
Hypotheses that could explain the groupings of items by factor included:
Item complexity. The items appear to group based on the interaction of Tier and DOK, with
factor 1 having higher Tier and DOK levels and factor 2 having lower Tier and DOK levels.
Context. ‘Pure math’ versus ‘Functional Context’
Correct Response Option Location. Every item in the second factor is has the last option as
the correct option. Reports from the field indicate that scrolling may be one root cause of
students selecting the last response option more often. In particular, students with physical
disabilities may have not been able to scroll up.
Interaction between item complexity and correct response option location. A
combination of hypotheses 1 and 3, in which both item complexity and the position of the
response options differentiates between the dimensions.
9 The item features were: Session, Item #, Domain; Primary Standard; Focal Knowledge, Skill and Ability; Tier;
DOK; # of Response Options; Correct Answer; and Calculator Use. 10
As defined by exploratory factor analysis conducted on the polychoric correlation matrix of the fifth grade
mathematics form one. Two factors were specified and the loadings subject to varimax rotation.

35
The participants were then asked if they wanted to come to consensus on hypotheses and suggest ways to
follow up on these hypotheses. The group concluded that the combination of scrolling and answer choice
option seems to be a very compelling hypothesis. The group suggested that follow up analysis could
include reviewing the factor analysis results in light of the categories from the LCI, as well as examining
the results of cluster analysis using LCI categories.
English Language Arts, Grade 3, Form 3
9/9/16
Introduction
This workshop was conducted after the workshop for the fifth grade, form one mathematics assessment.
All of the participants involved in this ELA workshop had taken part in the previous mathematics
workshop.
Task 1
In the first task, the participants were asked to generate hypotheses about what factors may influence
student performance without explicit consideration of the items or item design features. Instead of
attempting to ignore the participants’ previous hypotheses, generated in the context of math, we instead
provided them with those hypotheses. We ask them to draw on those hypotheses to generate new or
revised hypotheses about what factors influence student performance on the ELA assessments.
Hypotheses included factors dealing with:
The number of selected response options.
The “foundational” item type, e.g., whether students had to read a word aloud (these items are
present in third and fourth grade).
The writing item type, e.g., whether the item was meant to capture aspects of the writing process.
The multiple sessions the assessment was administered in.
The passages themselves (e.g., a factor for each passage) as well as by passage length, familiarity
with passage content or passage type (e.g., literary or informational).
The presence of graphics, e.g., whether the passage or response options contained pictures.
Item complexity, as captured by the Tier or DOK item features.
Scrolling, particularly when it is difficult to refer back to the passage.
Task 2
In the second task, the participants were provided with information for a subset of 29 items that had factor
loadings greater than 0.45 in absolute value on three factors produced by exploratory factor analysis11
.
11
As defined by exploratory factor analysis conducted on the polychoric correlation matrix. Three factors were
specified and the loadings subject to varimax rotation.

36
The information provided was (1) a spreadsheet containing features12
of the items as well as the items
themselves, as they appeared in the print version of the assessment. At the start of task 2, we informed the
participants that unlike mathematics, the factor analysis indicated that a three factor solution was
appropriate.
Hypotheses about the way items might group by factors included:
Content type: verbal items (e.g., foundational verbal items) vs. reading passages vs. writing.
Length of Passage (and perhaps whether the correct answer was on a separate page).
Type of Passage – information vs. literary.
An interaction between the number of responses and the item tier.
A factor related to the verbal items and two additional factors related to the position of the correct
response option (e.g., last vs. not last), similar to the finding in mathematics.
Task 3
In the final task, participants were provided with and updated item spreadsheet that contained the factor
loadings. The rows of the updated spreadsheet were sorted by factor loadings, thus grouping the items by
factor. The participants were asked to revise their hypotheses in light of the factor loadings.
The participants felt that the factor structure was unambiguously explained by a combination of the item
content type and response option placement. Specifically, that factor 1 was related to the foundational
verbal items and factors 2 and 3 were related to the placement of the correct response option. Factor 2 had
items for which the correct answer as not the last option, factor 3 had items for which the correct answer
was the last response option.
The participants expressed concern about these results occurring both in mathematics and reading. One
participant suggested that if the patterns shown in the two workshops are pervasive, that steps be taken in
the design and administration of the assessment to prevent or minimize the presence of dimensionality
(possibly by implementing student-level randomization of the item choices).
12
The item features were: Session, Question #, Content Type, Family, Tier, # of Response Options, Correct Answer,
DOK, Common Core Connector (CCC) Domain, and Full CCC.

37
Appendix E: Distributions of Selected Item Response Options per Student
Figure 1E. Math Grade 3 – Distribution of the Number of Times Each Student Selected Each Response Option by Item Tier.

38
Figure 2E. Math Grade 4.

39
Figure 3E. Math Grade 5.

40
Figure 4E. Math Grade 6.

41
Figure 5E. Math Grade 7.

42
Figure 6E. Math Grade 7.

43
Figure 7E. Math Grade 8.

44
Figure 8E. Math Grade 11.

45
Figure 8E. ELA Grade 3.
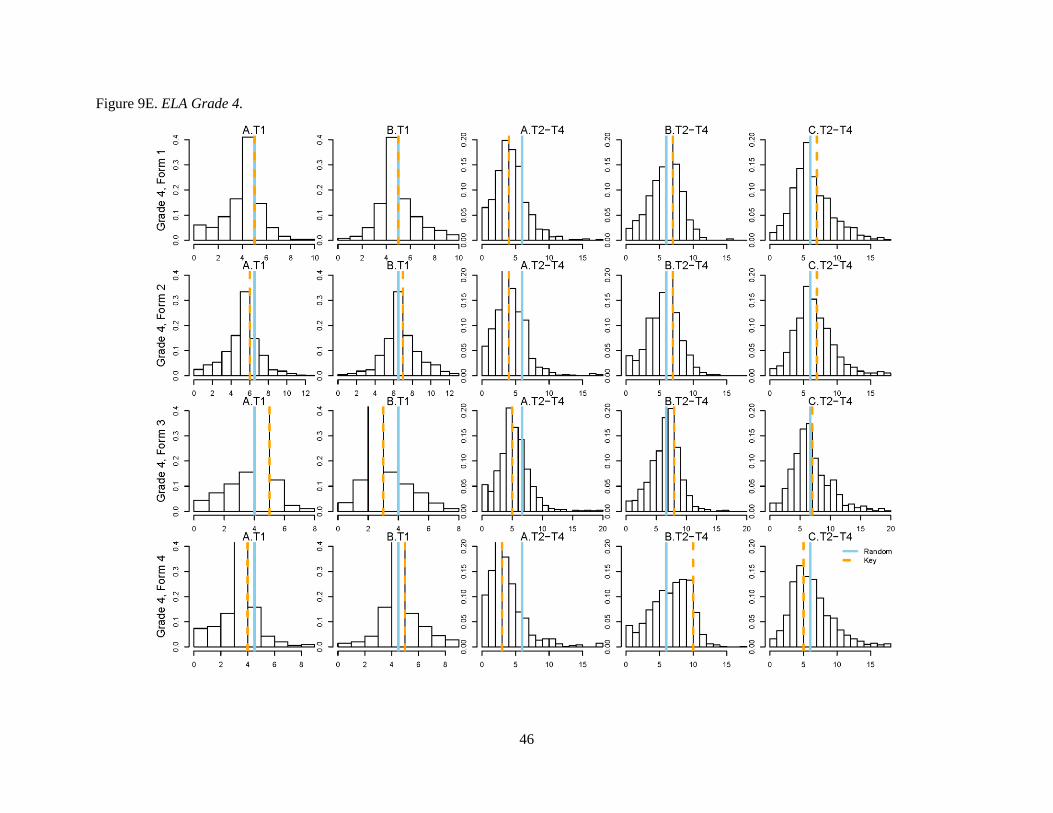
46
Figure 9E. ELA Grade 4.

47
Figure 10E. ELA Grade 5.
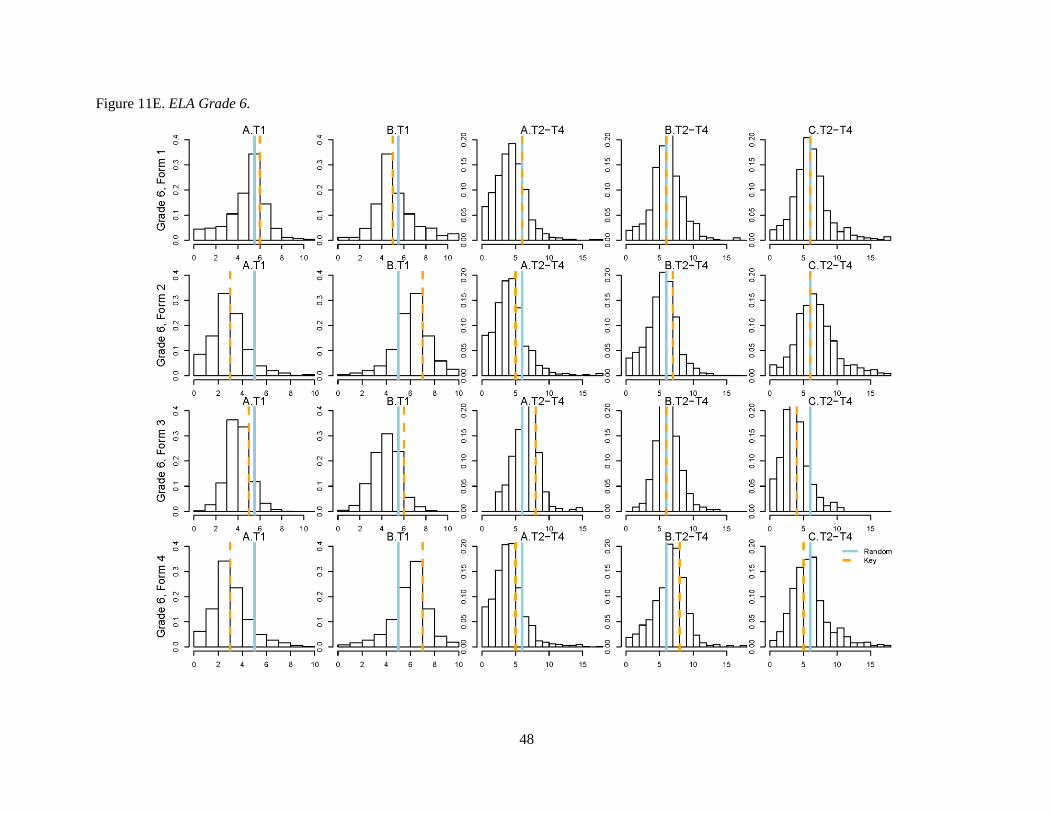
48
Figure 11E. ELA Grade 6.

49
Figure 12E. ELA Grade 7.
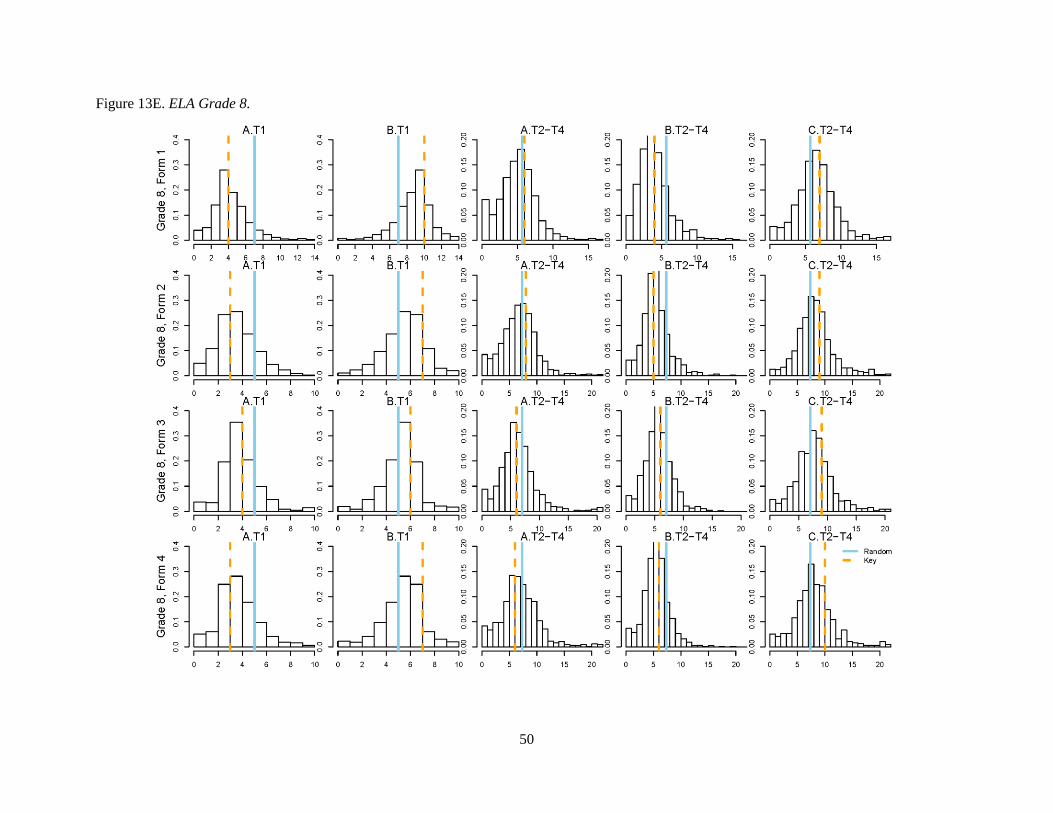
50
Figure 13E. ELA Grade 8.

51
Figure 14E. ELA Grade 11.
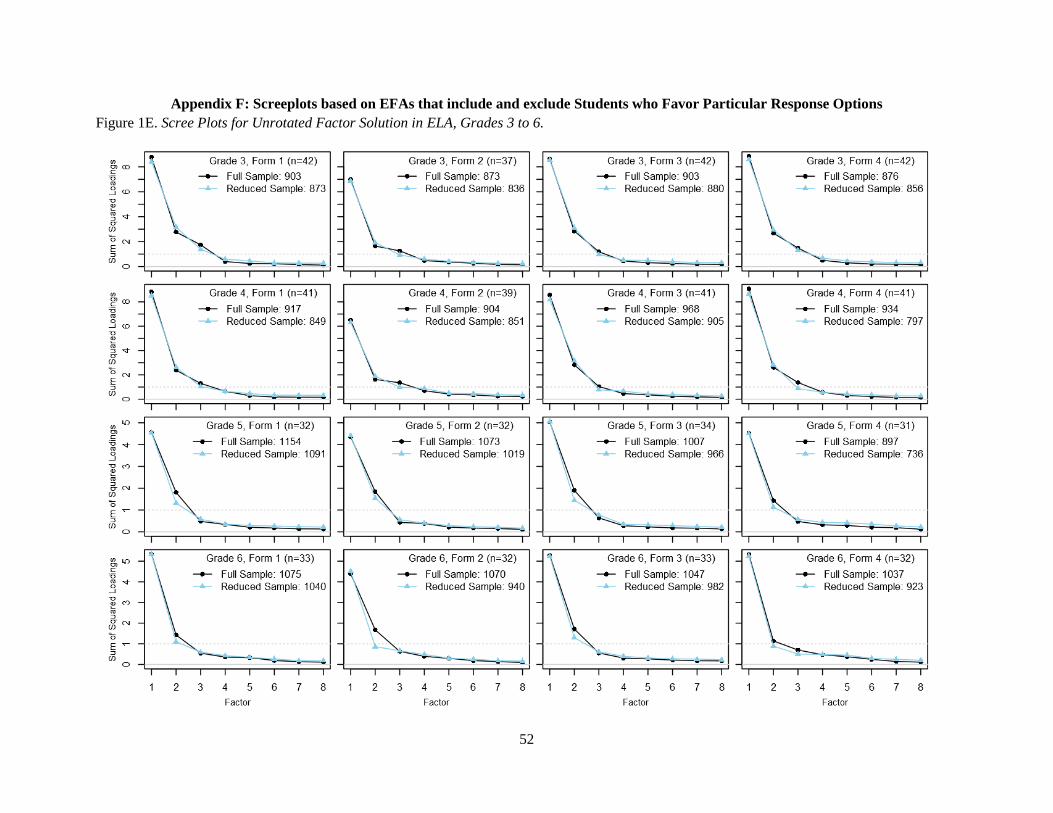
52
Appendix F: Screeplots based on EFAs that include and exclude Students who Favor Particular Response Options
Figure 1E. Scree Plots for Unrotated Factor Solution in ELA, Grades 3 to 6.

53
Figure 2E. Scree Plots for Unrotated Factor Solution in ELA, Grades 7, 8 and 11.

54
Figure 3E. Scree Plots for Unrotated Factor Solution in Math, Grades 3 to 6.

55
Figure 4E. Scree Plots for Unrotated Factor Solution in Math, Grades 7, 8 and 11.