Embed Size (px)
Citation preview
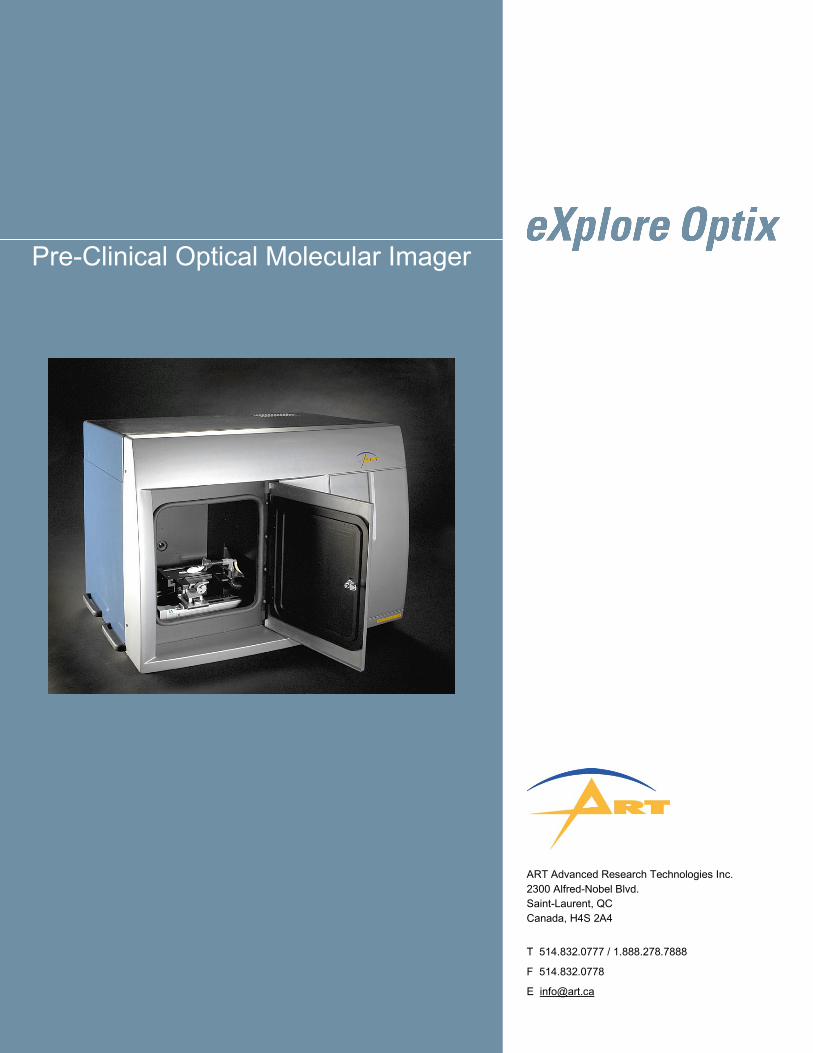
Pre-Clinical Optical Molecular Imager
ART Advanced Research Technologies Inc. 2300 Alfred-Nobel Blvd. Saint-Laurent, QC Canada, H4S 2A4
T 514.832.0777 / 1.888.278.7888
F 514.832.0778
Page 2 of 16 2004.01.19
A
RT
Adva
nced
Res
earc
h Te
chno
logi
es In
c.
Table of Contents
Summary....................................................................................................3
Keywords.............................................................................................................3 Glossary ..............................................................................................................3
I. Introduction ................................................................................................4
II. Optical Imaging ..........................................................................................4
III. Optical Molecular Imaging..........................................................................5
1. TD Optical Molecular Imaging.......................................................................................5
2. Unique Benefits of the TD Optical Imaging Strategy ....................................................6
IV. eXplore Optix .............................................................................................7
V. eXplore Optix System Performance ...........................................................9
1. Depth Localization.......................................................................................................10
2. Concentration Recovery .............................................................................................11
VI. Applications..............................................................................................11
1. Tumor Biology .............................................................................................................12
2. Neurobiology ...............................................................................................................13
3. Kinetic Modeling and Toxicity Studies ........................................................................14
a. Kinetic Modeling of Receptor Binding........................................................................14 b. Gastric Emptying .........................................................................................................15
VII. References...............................................................................................16
Page 3 of 16 2004.01.19
A
RT
Adva
nced
Res
earc
h Te
chno
logi
es In
c.
Summary
In vivo imaging of targeted molecular probes, or molecular imaging, is an emerging field for studying animal models. Optical imaging is particularly suited for molecular imaging, as fluorescent probes are safe, sensitive and can be specifically conjugated to small molecules, antibodies and other proteins. ART’s proprietary time-domain optical imaging platform has been adapted to image small animals for the purpose of providing in vivo biodistribution and pharmacokinetic data. eXplore OptixTM* is a unique system that allows the user to map parameters such as absorption, fluorophore concentration and fluorescence lifetime and is the foremost technique for providing depth of information. This paper provides an overview of optical imaging technology and how it is applied to molecular imaging. It also provides a description of ART’s time-domain optical imaging technology platform and how it is applied to eXplore Optix. Specific applications of the system are provided.
Keywords
Optical imaging, time-domain, molecular imaging, molecular probes, contrast agents, in vivo, longitudinal analysis, pharmacokinetics, biodistribution, fluorescence spectroscopy, small animals, pre-clinical research, toxicology, animal models.
Glossary
ART has posted a glossary on www.art.ca.
* eXplore OptixTM is distributed worldwide by GE Medical Systems
Page 4 of 16 2004.01.19
A
RT
Adva
nced
Res
earc
h Te
chno
logi
es In
c.
I. Introduction
Molecular imaging of small animals is becoming an important process in pre-clinical drug development. Optical imaging based on fluorescent probes has emerged as a technique providing valuable information on the specificity and efficacy of drugs.
The pre-clinical optical imaging system, eXplore OptixTM, developed by ART Advanced Research Technologies Inc. (ART), enables extensive characterization of fluorescent material embedded in organic tissue. This innovative design uses the time-domain approach to extract a wealth of data from each set of measurements providing accurate, quantitative information.
This paper provides an overview of optical imaging technologies and how the time-domain based modality is applicable to fluorescence molecular imaging. This paper also describes the eXplore Optix device and the technology platform upon which it is based. Finally, performance capabilities of eXplore Optix are demonstrated through specific applications and case studies.
II. Optical Imaging
Optical imaging technologies analyze the propagation of light particles (photons) through a medium such as tissue. They rely on non-ionizing radiation, typically produced by a low-intensity laser, that interacts with the tissue to emit a signal captured by a high-sensitivity photon detector. For in vivo optical imaging, the observation of photon behavior in the near-infrared (NIR) region is favored because of tissue’s low absorption properties in this spectral band (typically, between 650 and 1100 nm), thus allowing light to penetrate several centimeters of tissue [1].
NIR photons traveling through tissue are highly scattered before either being totally absorbed by the tissue or emerging at the surface where they are detected. Since scattered photons have no preferential direction or orientation, it is possible to statistically differentiate one from another by observing the time at which they emerge from the scattering medium; this is known as Time Domain (TD) imaging.
Page 5 of 16 2004.01.19
A
RT
Adva
nced
Res
earc
h Te
chno
logi
es In
c.
III. Optical Molecular Imaging
Molecular imaging is defined as the measurement and/or imaging of specific molecules (genes, proteins) and molecular pathways in vivo [see 2 for a review on molecular imaging]. It is a technique by which one can obtain data about physiological processes at the molecular level. This is in contrast with anatomical imaging methods, such as radiography, which provide structural data.
The technique of molecular imaging requires the addition of exogenous contrast through the injection of an agent. This agent, called a probe, consists of a molecule, which is chosen to target an intrinsic molecule in the living specimen, and a marker, which enables the visualization of the molecule of interest.
Fluorescent markers are used for generating contrast with optical imaging. Optical probes are safe and can be generated by the conjugation of an optical fluorophore to a molecule of interest [see 3 for a review of fluorescent optical probes]. TD optical molecular imaging measures the fluorescent molecular probe via its absorption and fluorescence signatures.
1. TD Optical Molecular Imaging
Traditional in vivo optical molecular imaging systems grossly measure all of the photons that propagate through tissue without any temporal discrimination. This is known as the Continuous Wave (CW) technique [4]. The method is limited to providing the attenuation or the total loss of photons in tissue. It cannot discriminate absorption events from scattering events, which impedes its capability to uncouple location (depth) from concentration in the image. Bioluminescence measurements by definition are CW since they are not generated in response to a light stimulus.
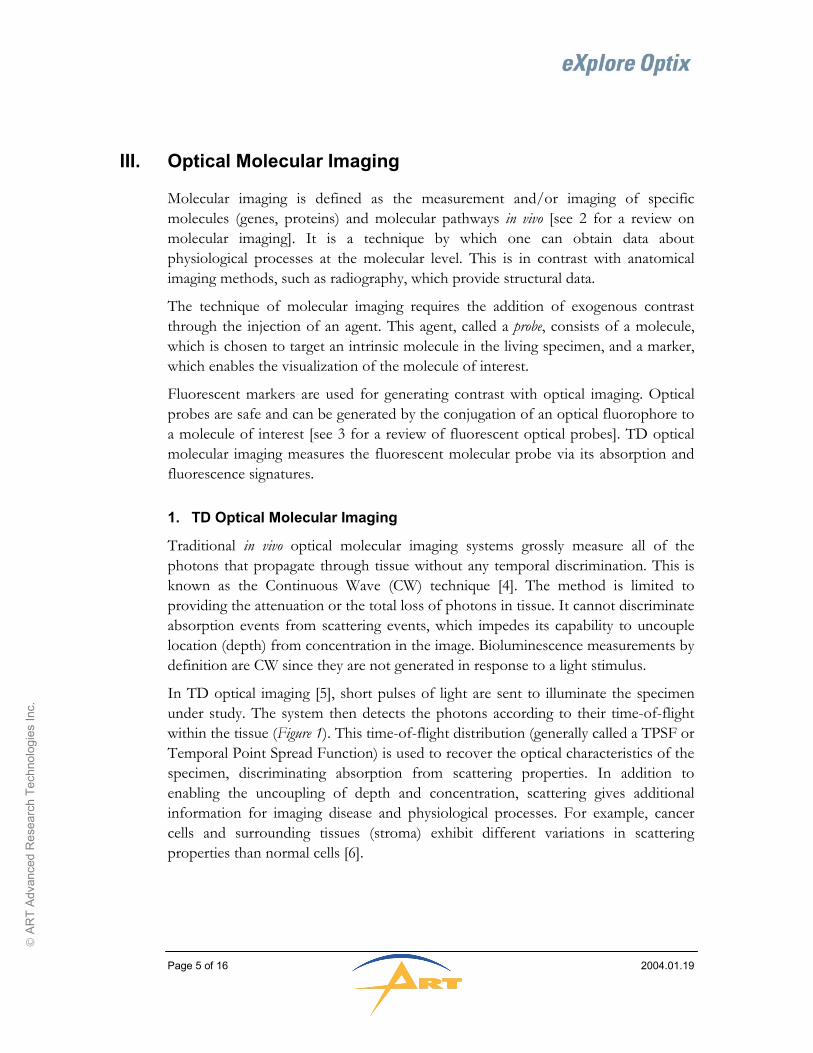
In TD optical imaging [5], short pulses of light are sent to illuminate the specimen under study. The system then detects the photons according to their time-of-flight within the tissue (Figure 1). This time-of-flight distribution (generally called a TPSF or Temporal Point Spread Function) is used to recover the optical characteristics of the specimen, discriminating absorption from scattering properties. In addition to enabling the uncoupling of depth and concentration, scattering gives additional information for imaging disease and physiological processes. For example, cancer cells and surrounding tissues (stroma) exhibit different variations in scattering properties than normal cells [6].
Page 6 of 16 2004.01.19
A
RT
Adva
nced
Res
earc
h Te
chno
logi
es In
c.
Figure 1: Light propagation in tissue and TD measurement.
With TD optical molecular imaging, short pulses of light excite a fluorescent probe producing an additional TPSF at the fluorescent wavelength (emission wavelength), from which many parameters, including fluorescence lifetime, are derived.
2. Unique Benefits of the TD Optical Imaging Strategy
Accurate surface information of the embedded fluorescent material.
Accurate depth information of the embedded fluorescent material.
The temporal information (TPSF) contained in the signal enables quantification of inclusion depth. The CW intensity measurement includes all photons, whereas TD temporally discriminates photons, which have probed different depths, resulting in greater depth sensitivity [7].
Accurate recovery of fluorophore concentration.
Depth information leads to an accurate recovery of fluorophore concentration when the data is reconstructed in post-processing.
Tomographic images.
Due to the temporal dimension in TD measurements, the signal already contains volumetric information about the tissue, thus tomographic (3D) images can be obtained with both topography and off-axis detection schemes. ART is currently working on a number of tomographic data processing approaches that will be incorporated into an optional eXplore Optix software package.
Fluorescence lifetime [8].
This allows the distinction between different fluorescent materials. Furthermore, with an appropriately designed probe, changes in fluorescence lifetime occur with varying tissue properties such as pH, oxygenation level and calcium levels, and can thus be used to establish those properties.
Scattered photons
Absorbed photons
Temporal point spread function (TPSF)
I
t
Laser pulse Light propagation in tissue
Page 7 of 16 2004.01.19
A
RT
Adva
nced
Res
earc
h Te
chno
logi
es In
c.
IV. eXplore Optix
eXplore Optix measures, quantifies and visualizes fluorescence intensity and lifetime for multiple molecular imaging applications in small laboratory animals, such as mice and rats (for examples of applications, see section VI).
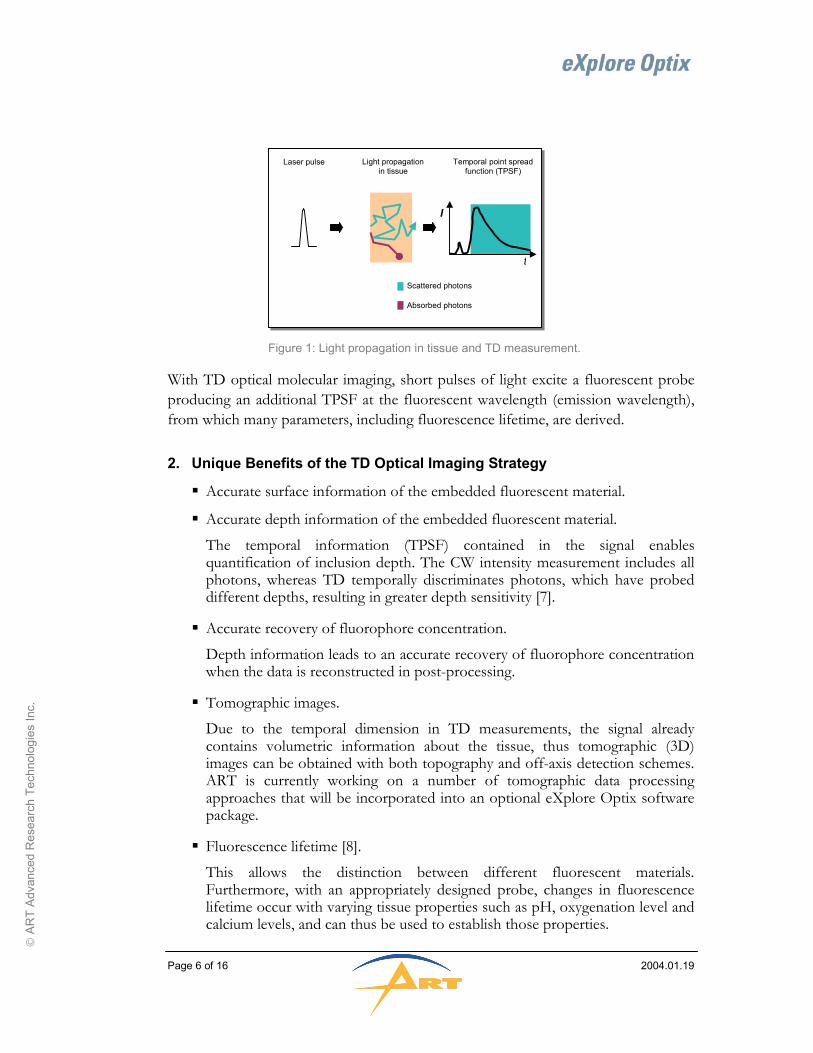
Configured in reflection geometry, the illumination source and detector point(s) of the acquisition system of the eXplore Optix device are scanned over the region of interest via galvanometer mirrors. The pulsed laser source wavelength can be customized to the desired fluorescence excitation wavelength (between discrete wavelengths 405 - 440 nm and 630 - 900 nm), while the detector is sensitive to the spectral band of 450 - 900 nm. In addition to top and side digital cameras for capturing visible images of the animal, a profilometer camera is incorporated into the system to obtain the shape of the animal. Figure 2 is a schematic of the acquisition system.
Figure 2: eXplore Optix system schematic. The animal is positioned on the animal table and a region of interest is selected via a top and side live camera. The animal is then translated into the imaging section of the system where the optics are housed. The entire system is light tight. TCSPC = time correlated single photon counting PMT = photon multiplier tube
Pulsed laser diode
PMT detector
Galvomirrors
FilterVision camera
Profilometer camera
Profilometer laser
PC
TCSPC cardTranslation stage
Heated animal supportwith weight sensor
Sample
Pulsed laser diode
PMT detector
Galvomirrors
FilterVision camera
Profilometer camera
Profilometer laser
PC
TCSPC cardTranslation stage
Heated animal supportwith weight sensor
Sample
Pulsed laser diode
PMT detector
Galvomirrors
FilterVision camera
Profilometer camera
Profilometer laser
PC
TCSPC cardTranslation stage
Heated animal supportwith weight sensor
Sample
Pulsed laser diode
PMT detector
Galvomirrors
FilterVision camera
Profilometer camera
Profilometer laser
PC
TCSPC cardTranslation stage
Heated animal supportwith weight sensor
Sample
Page 8 of 16 2004.01.19
A
RT
Adva
nced
Res
earc
h Te
chno
logi
es In
c.
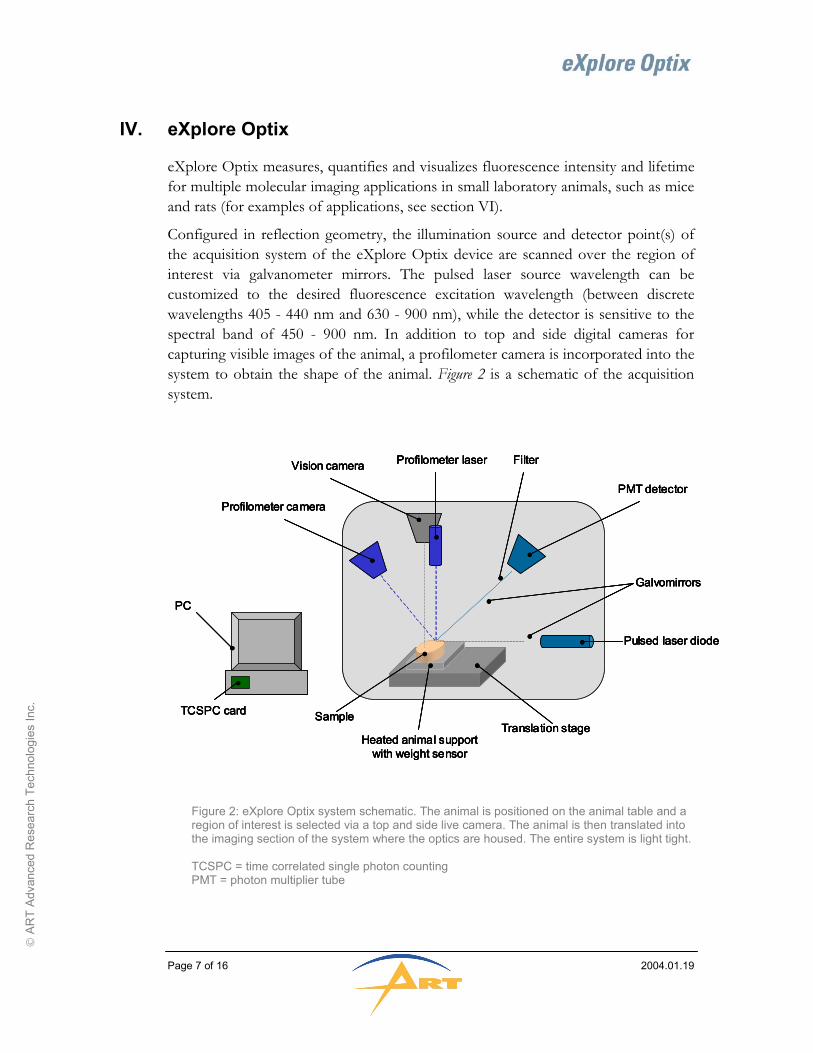
Figure 3 depicts the steps taken in order to scan an animal. eXplore Optix incorporates an interface for inhalation anaesthetic systems and an animal positioning plate that is maintained at a comfortable temperature level (between 26 – 42 ºC) to avoid undue stress on the animal. The system also offers flexible scanning options (whole body, selected region of interest, line scan or point scan) with a maximum scanning area of 20 by 9 cm. Either absorption or emission scans can be selected. The total scanning time is on the order of minutes, depending on the selected scanning area and resolution. Signal conditioning and data processing are done automatically after acquisition.
Figure 3: eXplore Optix system principle of operation.
The topography acquisition scheme utilizes one illumination source and one detection point to collect fluorescence images. These topography scans provide an accurate description of the in-plane location of objects. In addition, using the TPSF from TD data, depth and concentration information are derived. In contrast, the off-axis acquisition scheme utilizes a “multiple detectors-per-source” configuration, enabling another method for localizing and obtaining depth and concentration information of fluorescent objects. The principle of operation is similar to that shown in Figure 3, except that the detection geometry must be supplied (the number of detection points and interval between points) prior to conducting the scan. The addition of detectors allows multiple views to be taken into account for the recovery of fluorophore distribution and concentration.
Immediately after acquisition, multiple 2D images can be visualized. Absorption, lifetime and intensity options are all available. In addition, the software enables the
Position animal on plate and set parameters (temperature, anesthetics)
Select region of interest and configure scanning parameters (laser power, duration, topography or
off-axis scan, acquisition rate, etc.)
Initiate scanning
Conduct analysis through signal conditioning and data processing.
Page 9 of 16 2004.01.19
A
RT
Adva
nced
Res
earc
h Te
chno
logi
es In
c.
selection of pixels in the image from which a rendition of depth and relative concentration can be recovered using the unique TPSF information.
Due to the temporal dimension in TD measurements, volumetric (3D) images can be obtained with both acquisition schemes. Currently, ART is working on a number of tomographic data processing approaches using image reconstruction by solving the inverse model [9,10]. Here the physics of photon migration is incorporated into the model and an accurate recovery of object shape, location, concentration and fluorescence lifetime can be obtained. Tomography will be incorporated into an optional software package with advanced image processing and visualization capabilities.
V. eXplore Optix System Performance
An important issue of fluorescence imaging is localizing the depth of fluorescent material in tissue. Without accurate depth information, any attempt at evaluating fluorophore concentration quantitatively is not possible without large assumptions leading to potential errors. This ability has important consequences in assessing tumor growth and metastasis. Additionally, pharmacokinetic applications will yield unrealistic data without precise quantitative measurements.
In view of the above, eXplore Optix was tested to assess its performance capabilities, with particular regard to concentration recovery and depth sensitivity. A group of experiments were performed using varying concentrations, volumes and cross-sectional areas of solid and liquid Cy5.5 fluorescence inclusions buried in liquid phantoms. The liquid optical absorption and scatter coefficients were typical values for biological tissue. The TPSF was analyzed in a number of different ways (e.g. intensity, gated-intensity with varied gate width, fitted lifetime and absorption coefficient).
eXplore Optix detected a fluorescence signal of 1 nM at 5 – 9 mm below the phantom surface (670 nm excitation, 700 nm emission). Based on these results, eXplore Optix would thus be capable of spotting the equivalent of 64 femtomoles of fluorophore in a 64 mm3 volume at a depth of 7 mm. Presently, most studies aim to measure concentration or binding of cell surface receptors, which limits the concentration sensitivity due to low numbers of receptors present. It is estimated that sensitivity of a receptor concentration on the order of 1-30 nM is required in a region of interest, with injection doses of between 1 and 800 nM [11].
Page 10 of 16 2004.01.19
A
RT
Adva
nced
Res
earc
h Te
chno
logi
es In
c.
1. Depth Localization
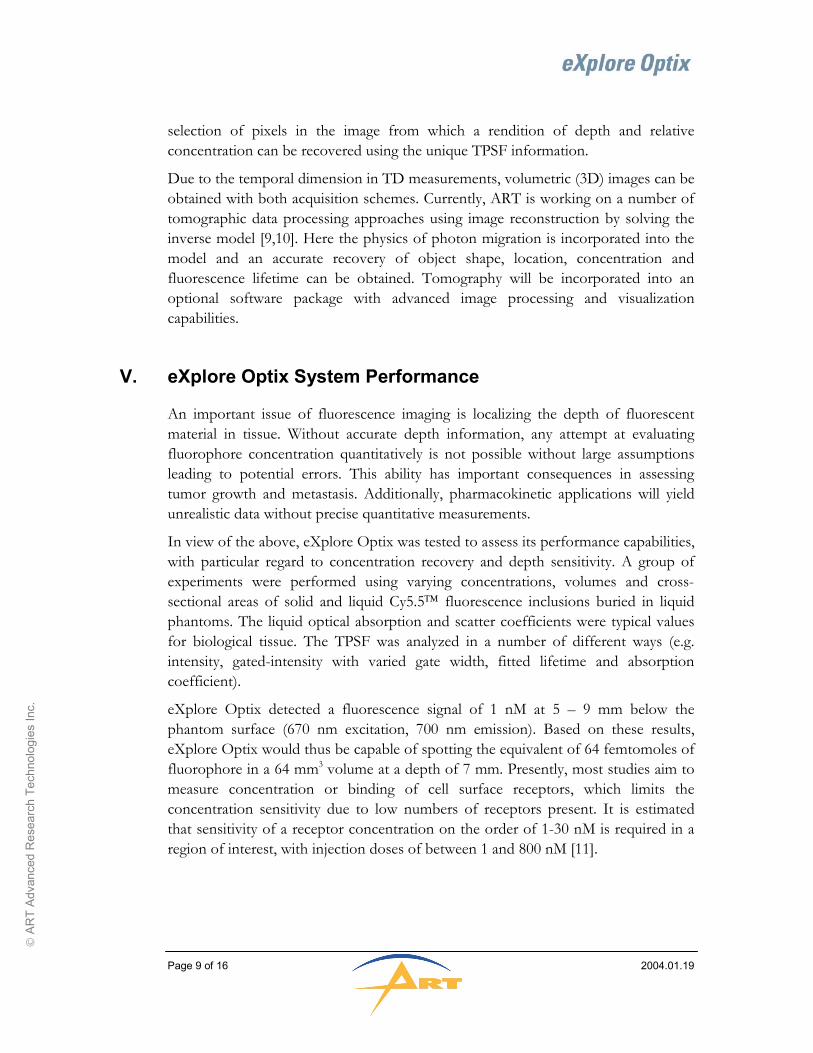
Overall, the results of the system’s depth sensitivity evaluation demonstrate that the temporal information contained in the signal enables the quantification of inclusion depth with a high degree of precision.
Recovered depth (mm) for different concentrations (C) Real depth (mm) C=1
(nM) C=10 (nM)
C=50 (nM)
C=100 (nM)
0-4 0.15 0.15 0.15 Not done
3-7 3.7 3.4 3.1 3.4
5-9 6.15 5.65 5.95 6.15
8-12 Noise Noise 9.95 10.2
11-15 Noise Noise 13.65 13.8
Table 1: Depth recovery algorithm from topography TD measurements on eXplore Optix liquid phantoms, as described above.
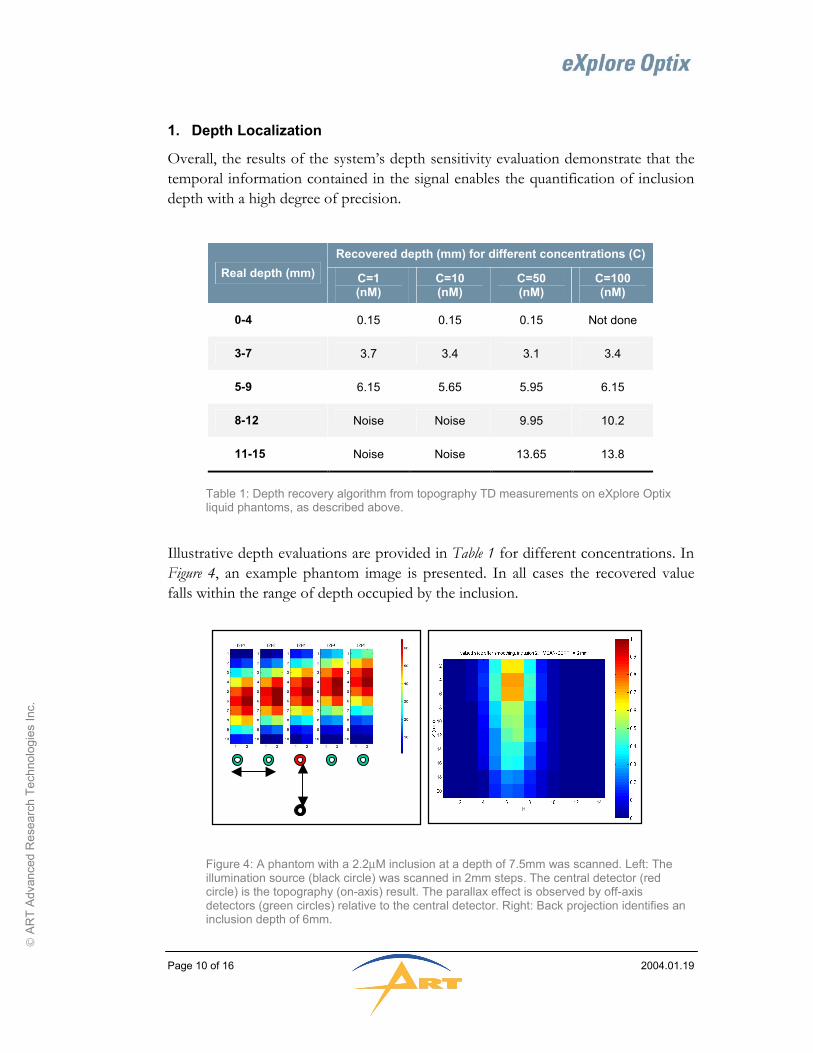
Illustrative depth evaluations are provided in Table 1 for different concentrations. In Figure 4, an example phantom image is presented. In all cases the recovered value falls within the range of depth occupied by the inclusion.
Figure 4: A phantom with a 2.2µM inclusion at a depth of 7.5mm was scanned. Left: The illumination source (black circle) was scanned in 2mm steps. The central detector (red circle) is the topography (on-axis) result. The parallax effect is observed by off-axis detectors (green circles) relative to the central detector. Right: Back projection identifies an inclusion depth of 6mm.
Page 11 of 16 2004.01.19
A
RT
Adva
nced
Res
earc
h Te
chno
logi
es In
c.
2. Concentration Recovery
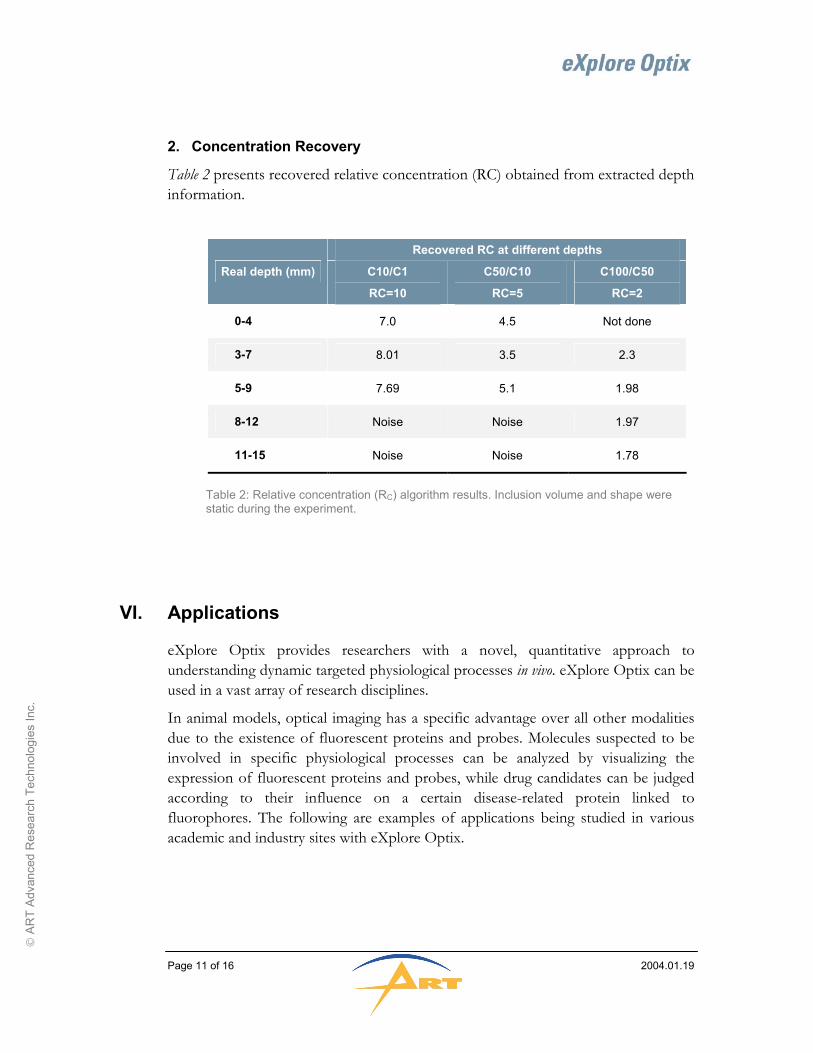
Table 2 presents recovered relative concentration (RC) obtained from extracted depth information.
Recovered RC at different depths Real depth (mm) C10/C1
RC=10 C50/C10
RC=5 C100/C50
RC=2
0-4 7.0 4.5 Not done
3-7 8.01 3.5 2.3
5-9 7.69 5.1 1.98
8-12 Noise Noise 1.97
11-15 Noise Noise 1.78
Table 2: Relative concentration (RC) algorithm results. Inclusion volume and shape were static during the experiment.
VI. Applications
eXplore Optix provides researchers with a novel, quantitative approach to understanding dynamic targeted physiological processes in vivo. eXplore Optix can be used in a vast array of research disciplines.
In animal models, optical imaging has a specific advantage over all other modalities due to the existence of fluorescent proteins and probes. Molecules suspected to be involved in specific physiological processes can be analyzed by visualizing the expression of fluorescent proteins and probes, while drug candidates can be judged according to their influence on a certain disease-related protein linked to fluorophores. The following are examples of applications being studied in various academic and industry sites with eXplore Optix.
Page 12 of 16 2004.01.19
A
RT
Adva
nced
Res
earc
h Te
chno
logi
es In
c.
1. Tumor Biology
Tumor biology is one of the most active scientific and clinical research areas due to the incidence of cancer and its resulting death rates. Pre-clinical tumor models are often based on the ectopic injection of human tumor cell lines in the surface area of immune deficient mice to survey and standardize in vivo tumor growth and tumor size. The same parameters are difficult to determine in orthotopic or genetically generated tumor models, since they are located deep in the animal’s body.
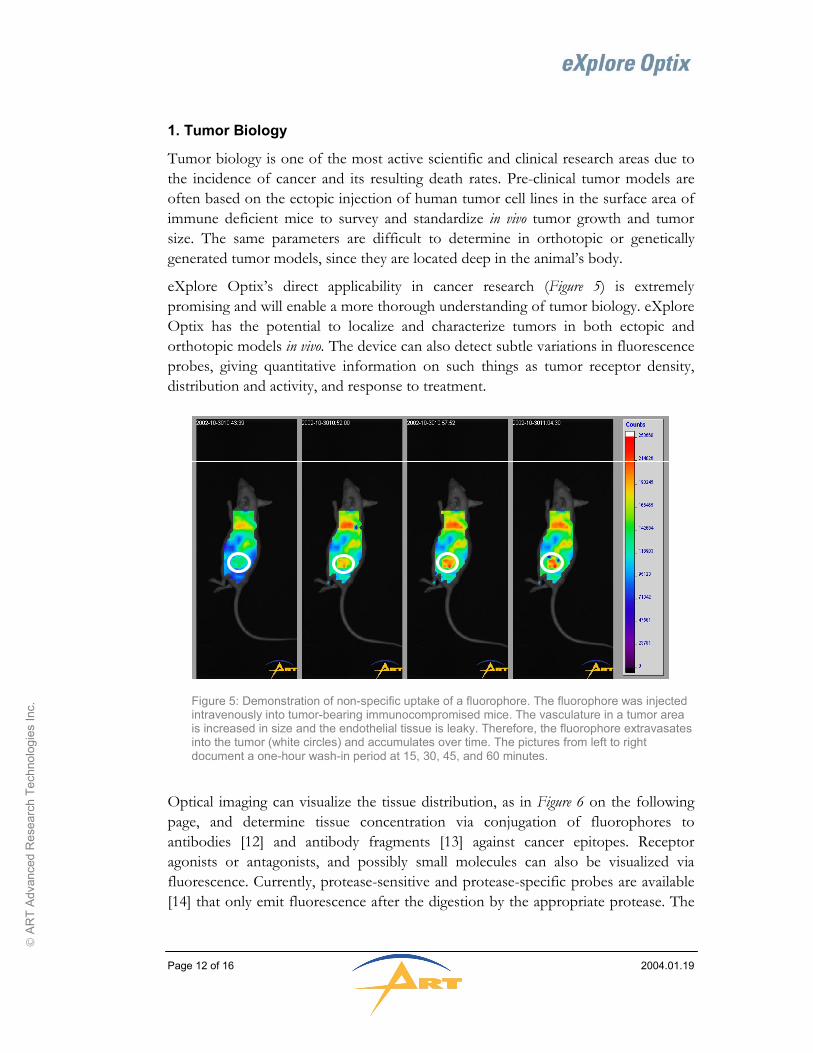
eXplore Optix’s direct applicability in cancer research (Figure 5) is extremely promising and will enable a more thorough understanding of tumor biology. eXplore Optix has the potential to localize and characterize tumors in both ectopic and orthotopic models in vivo. The device can also detect subtle variations in fluorescence probes, giving quantitative information on such things as tumor receptor density, distribution and activity, and response to treatment.
Figure 5: Demonstration of non-specific uptake of a fluorophore. The fluorophore was injected intravenously into tumor-bearing immunocompromised mice. The vasculature in a tumor area is increased in size and the endothelial tissue is leaky. Therefore, the fluorophore extravasates into the tumor (white circles) and accumulates over time. The pictures from left to right document a one-hour wash-in period at 15, 30, 45, and 60 minutes.
Optical imaging can visualize the tissue distribution, as in Figure 6 on the following page, and determine tissue concentration via conjugation of fluorophores to antibodies [12] and antibody fragments [13] against cancer epitopes. Receptor agonists or antagonists, and possibly small molecules can also be visualized via fluorescence. Currently, protease-sensitive and protease-specific probes are available [14] that only emit fluorescence after the digestion by the appropriate protease. The
Page 13 of 16 2004.01.19
A
RT
Adva
nced
Res
earc
h Te
chno
logi
es In
c.
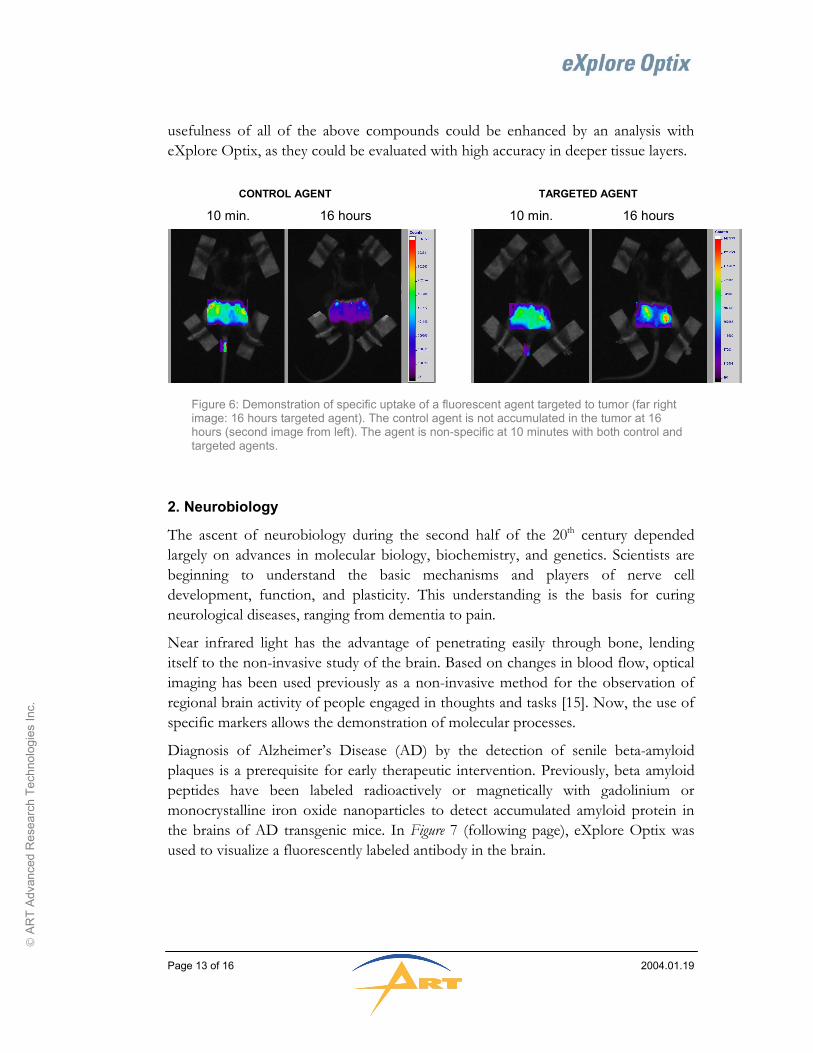
usefulness of all of the above compounds could be enhanced by an analysis with eXplore Optix, as they could be evaluated with high accuracy in deeper tissue layers.
Figure 6: Demonstration of specific uptake of a fluorescent agent targeted to tumor (far right image: 16 hours targeted agent). The control agent is not accumulated in the tumor at 16 hours (second image from left). The agent is non-specific at 10 minutes with both control and targeted agents.
2. Neurobiology
The ascent of neurobiology during the second half of the 20th century depended largely on advances in molecular biology, biochemistry, and genetics. Scientists are beginning to understand the basic mechanisms and players of nerve cell development, function, and plasticity. This understanding is the basis for curing neurological diseases, ranging from dementia to pain.
Near infrared light has the advantage of penetrating easily through bone, lending itself to the non-invasive study of the brain. Based on changes in blood flow, optical imaging has been used previously as a non-invasive method for the observation of regional brain activity of people engaged in thoughts and tasks [15]. Now, the use of specific markers allows the demonstration of molecular processes.
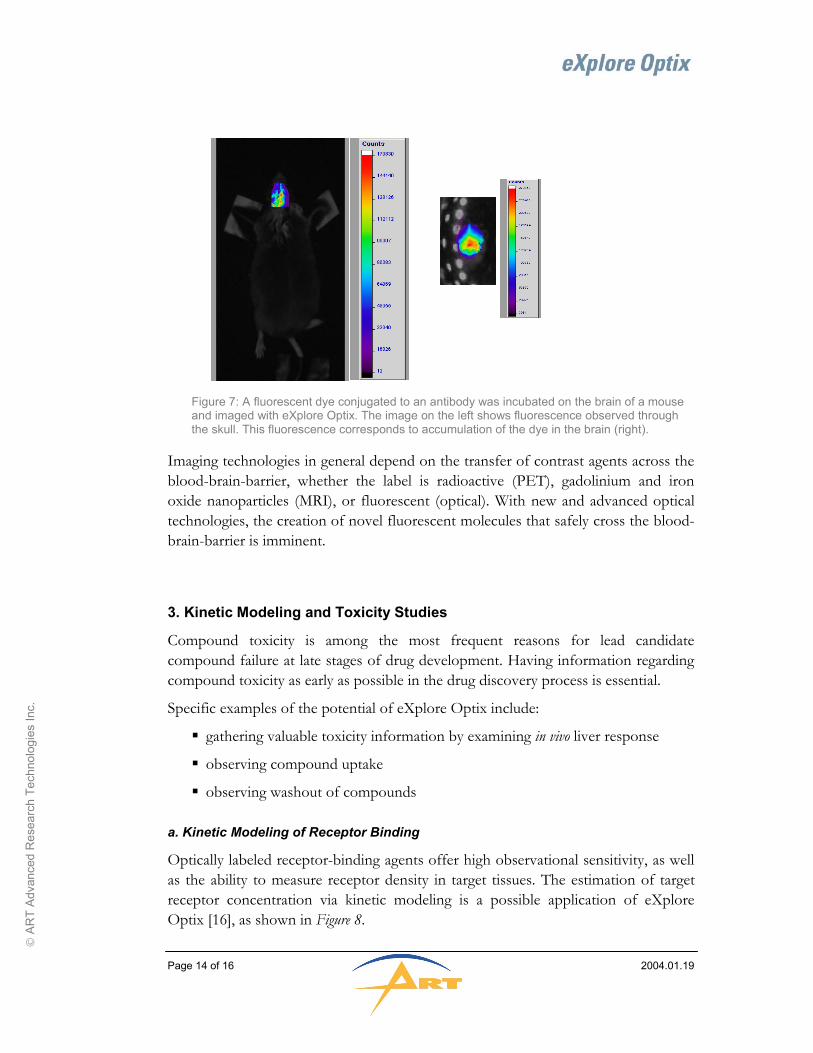
Diagnosis of Alzheimer’s Disease (AD) by the detection of senile beta-amyloid plaques is a prerequisite for early therapeutic intervention. Previously, beta amyloid peptides have been labeled radioactively or magnetically with gadolinium or monocrystalline iron oxide nanoparticles to detect accumulated amyloid protein in the brains of AD transgenic mice. In Figure 7 (following page), eXplore Optix was used to visualize a fluorescently labeled antibody in the brain.
CONTROL AGENT TARGETED AGENT 16 hours 10 min. 16 hours 10 min.
Page 14 of 16 2004.01.19
A
RT
Adva
nced
Res
earc
h Te
chno
logi
es In
c.
Figure 7: A fluorescent dye conjugated to an antibody was incubated on the brain of a mouse and imaged with eXplore Optix. The image on the left shows fluorescence observed through the skull. This fluorescence corresponds to accumulation of the dye in the brain (right).
Imaging technologies in general depend on the transfer of contrast agents across the blood-brain-barrier, whether the label is radioactive (PET), gadolinium and iron oxide nanoparticles (MRI), or fluorescent (optical). With new and advanced optical technologies, the creation of novel fluorescent molecules that safely cross the blood-brain-barrier is imminent.
3. Kinetic Modeling and Toxicity Studies
Compound toxicity is among the most frequent reasons for lead candidate compound failure at late stages of drug development. Having information regarding compound toxicity as early as possible in the drug discovery process is essential.
Specific examples of the potential of eXplore Optix include:
gathering valuable toxicity information by examining in vivo liver response
observing compound uptake
observing washout of compounds
a. Kinetic Modeling of Receptor Binding
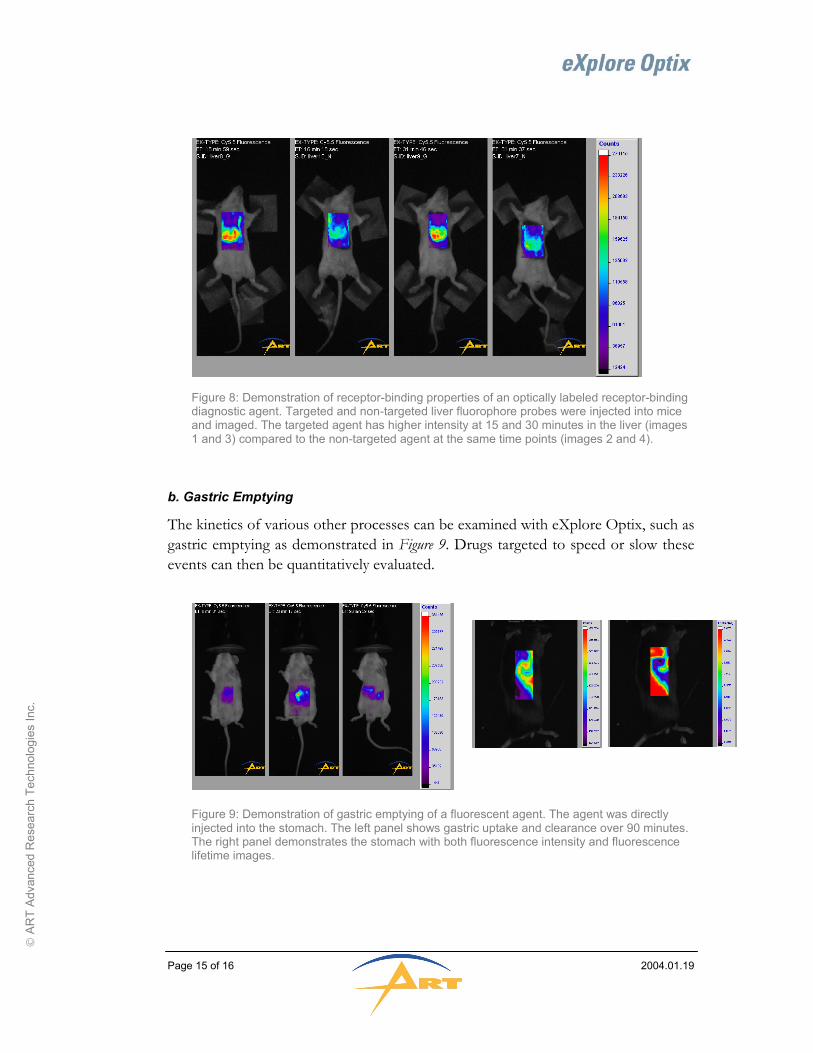
Optically labeled receptor-binding agents offer high observational sensitivity, as well as the ability to measure receptor density in target tissues. The estimation of target receptor concentration via kinetic modeling is a possible application of eXplore Optix [16], as shown in Figure 8.
Page 15 of 16 2004.01.19
A
RT
Adva
nced
Res
earc
h Te
chno
logi
es In
c.
Figure 8: Demonstration of receptor-binding properties of an optically labeled receptor-binding diagnostic agent. Targeted and non-targeted liver fluorophore probes were injected into mice and imaged. The targeted agent has higher intensity at 15 and 30 minutes in the liver (images 1 and 3) compared to the non-targeted agent at the same time points (images 2 and 4).
b. Gastric Emptying
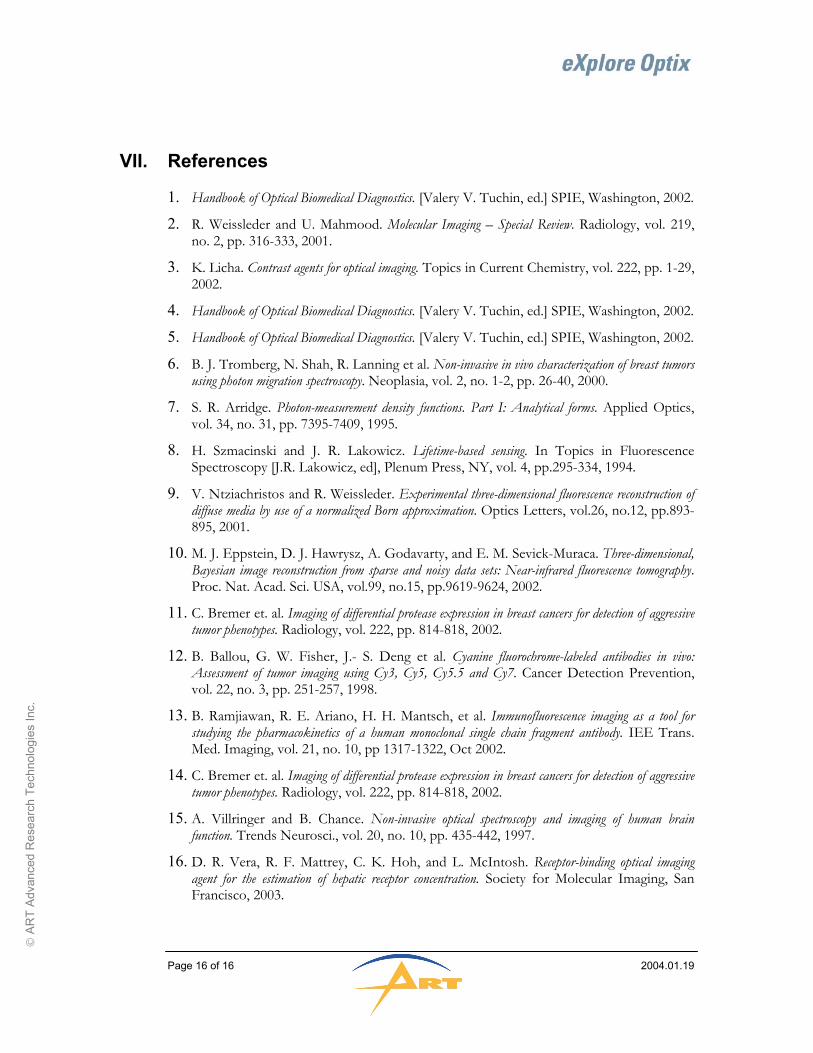
The kinetics of various other processes can be examined with eXplore Optix, such as gastric emptying as demonstrated in Figure 9. Drugs targeted to speed or slow these events can then be quantitatively evaluated.
Figure 9: Demonstration of gastric emptying of a fluorescent agent. The agent was directly injected into the stomach. The left panel shows gastric uptake and clearance over 90 minutes. The right panel demonstrates the stomach with both fluorescence intensity and fluorescence lifetime images.
Page 16 of 16 2004.01.19
A
RT
Adva
nced
Res
earc
h Te
chno
logi
es In
c.
VII. References
1. Handbook of Optical Biomedical Diagnostics. [Valery V. Tuchin, ed.] SPIE, Washington, 2002.
2. R. Weissleder and U. Mahmood. Molecular Imaging – Special Review. Radiology, vol. 219, no. 2, pp. 316-333, 2001.
3. K. Licha. Contrast agents for optical imaging. Topics in Current Chemistry, vol. 222, pp. 1-29, 2002.
4. Handbook of Optical Biomedical Diagnostics. [Valery V. Tuchin, ed.] SPIE, Washington, 2002.
5. Handbook of Optical Biomedical Diagnostics. [Valery V. Tuchin, ed.] SPIE, Washington, 2002.
6. B. J. Tromberg, N. Shah, R. Lanning et al. Non-invasive in vivo characterization of breast tumors using photon migration spectroscopy. Neoplasia, vol. 2, no. 1-2, pp. 26-40, 2000.
7. S. R. Arridge. Photon-measurement density functions. Part I: Analytical forms. Applied Optics, vol. 34, no. 31, pp. 7395-7409, 1995.
8. H. Szmacinski and J. R. Lakowicz. Lifetime-based sensing. In Topics in Fluorescence Spectroscopy [J.R. Lakowicz, ed], Plenum Press, NY, vol. 4, pp.295-334, 1994.
9. V. Ntziachristos and R. Weissleder. Experimental three-dimensional fluorescence reconstruction of diffuse media by use of a normalized Born approximation. Optics Letters, vol.26, no.12, pp.893-895, 2001.
10. M. J. Eppstein, D. J. Hawrysz, A. Godavarty, and E. M. Sevick-Muraca. Three-dimensional, Bayesian image reconstruction from sparse and noisy data sets: Near-infrared fluorescence tomography. Proc. Nat. Acad. Sci. USA, vol.99, no.15, pp.9619-9624, 2002.
11. C. Bremer et. al. Imaging of differential protease expression in breast cancers for detection of aggressive tumor phenotypes. Radiology, vol. 222, pp. 814-818, 2002.
12. B. Ballou, G. W. Fisher, J.- S. Deng et al. Cyanine fluorochrome-labeled antibodies in vivo: Assessment of tumor imaging using Cy3, Cy5, Cy5.5 and Cy7. Cancer Detection Prevention, vol. 22, no. 3, pp. 251-257, 1998.
13. B. Ramjiawan, R. E. Ariano, H. H. Mantsch, et al. Immunofluorescence imaging as a tool for studying the pharmacokinetics of a human monoclonal single chain fragment antibody. IEE Trans. Med. Imaging, vol. 21, no. 10, pp 1317-1322, Oct 2002.
14. C. Bremer et. al. Imaging of differential protease expression in breast cancers for detection of aggressive tumor phenotypes. Radiology, vol. 222, pp. 814-818, 2002.
15. A. Villringer and B. Chance. Non-invasive optical spectroscopy and imaging of human brain function. Trends Neurosci., vol. 20, no. 10, pp. 435-442, 1997.
16. D. R. Vera, R. F. Mattrey, C. K. Hoh, and L. McIntosh. Receptor-binding optical imaging agent for the estimation of hepatic receptor concentration. Society for Molecular Imaging, San Francisco, 2003.


