Embed Size (px)
Citation preview
EXPERIMENTAL STUDY ON RESILIENT BEHAVIOR OF GEOCELL-
REINFORCED RECYCLED ASPHALT PAVEMENT
BASE LAYER: MODEL DEVELOPMENT
by
MANIKANTA SALADHI
Presented to the Faculty of the Graduate School of
The University of Texas at Arlington
in Partial Fulfillment of the Requirements
for the Degree of
MASTER OF SCIENCE IN CIVIL ENGINEERING
THE UNIVERSITY OF TEXAS AT ARLINGTON
December 2017

ii
Copyright © by Manikanta Saladhi 2017
All Rights Reserved

iii
This work is dedicated to my mother and advisor.

iv
Acknowledgements
I would first like to express my sincere gratitude to my thesis advisor Dr. Anand. J.
Puppala for his constant encouragement, motivation and immense knowledge that
shaped my research. He inflicted in me a strong sense of positive attitude and hard
work and taught me the life’s most important lessons.
I would also like to thank my dissertation committee Dr. Laureano R. Hoyos and
Dr. Xinbao Yu for readily accepting to serve in my committee and for their valuable
suggestions.
I would also like to thank Dr. Aravind Pedarla, Dr. Aritra Banerjee, and Dr. Tejo
Bheemasetti without whom this thesis would not have been successful. Their
participation has provided me with insight without which I could not have made
the decisions I did.
I would also like to acknowledge Tom Taylor, Anu George, Rinu Samuel,
Sayantan, Das, Puneet Bhaskar, Sarat, Burak, Danny, Liela, Ali, and Leopoldo for
their sincere support and encouragement during this research work.
Finally, I would like to take the opportunity to express my immense appreciation
to my family who provided unwavering support and love throughout my masters.
To my friends, who have been a constant source of comfort through my extensive
research and writing, I extend my thanks.
November 17, 2017.
v
Abstract
EXPERIMENTAL STUDY ON RESILIENT BEHAVIOR OF GEOCELL-
REINFORCED RECYCLED ASPHALT PAVEMENT
BASE LAYER: MODEL DEVELOPMENT
Manikanta Saladhi, MS
The University of Texas at Arlington, 2017
Supervising Professor: Anand.J.Puppala.
Recycled Asphalt Material (RAP) is defined as removed and reprocessed
pavement materials containing asphalt and aggregates. These materials are obtained
when asphalt pavements are removed for the rehabilitation and maintenance of
distressed pavements. The use of RAP as a base/subbase aggregate in pavement
construction is technically and environmentally a sustainable solution, and
conserve use of natural resources by requiring less virgin aggregate in pavement
construction. Past studies showed that the use of 100% RAP as base course lacks
shear strength and can undergo large deformations. Geocells are a system of three-
dimensional, interconnected, honeycombed cellular structures that resist the lateral
expansion of soil particles and act like a slab to distribute surface loads over a larger
area of the foundation soil. Most of the recent studies on geocell-reinforced RAP
bases show that they improve the pavement service life, strength and stiffness of
base layer. The main objective of this research was to develop and construct a
vi
large-scale laboratory test setup, which was used to perform a series of cyclic plate
load tests to examine resilient behavior of geocell-reinforced RAP bases.
Six large-scale laboratory cyclic plate load tests and two static plate load
tests were conducted on unreinforced and geocell-reinforced RAP base road
sections. The unpaved road sections consisted of moderate subgrade,
unreinforced/geocell-reinforced RAP base, and a RAP cover. The test results
showed that the geocell-reinforcement improved the performance of RAP bases.
The high hoop strength of the geocell reinforcement provided more confinement
and offered additional resistance against lateral movement of RAP base. The
geocell reinforcement significantly reduced the permanent and resilient
deformations of RAP base when compared to that of unreinforced RAP bases,
thereby increasing resilient modulus of the reinforced base layer. The geocell-
reinforced RAP base layer acted as a stiff mattress foundation and resulted in lower
compression of RAP base and subgrade. The geocell reinforcement significantly
reduced the permanent deformations of RAP base approximately by 50% when
compared to that of unreinforced RAP base. Additionally, the geocell
reinforcement had increased resilient modulus of RAP base by a factor of 3.0,
compared to that of unreinforced RAP base.
vii
TABLE OF CONTENTS
Acknowledgements ................................................................................................ iv
Abstract ................................................................................................................... v
List of Figures ......................................................................................................... x
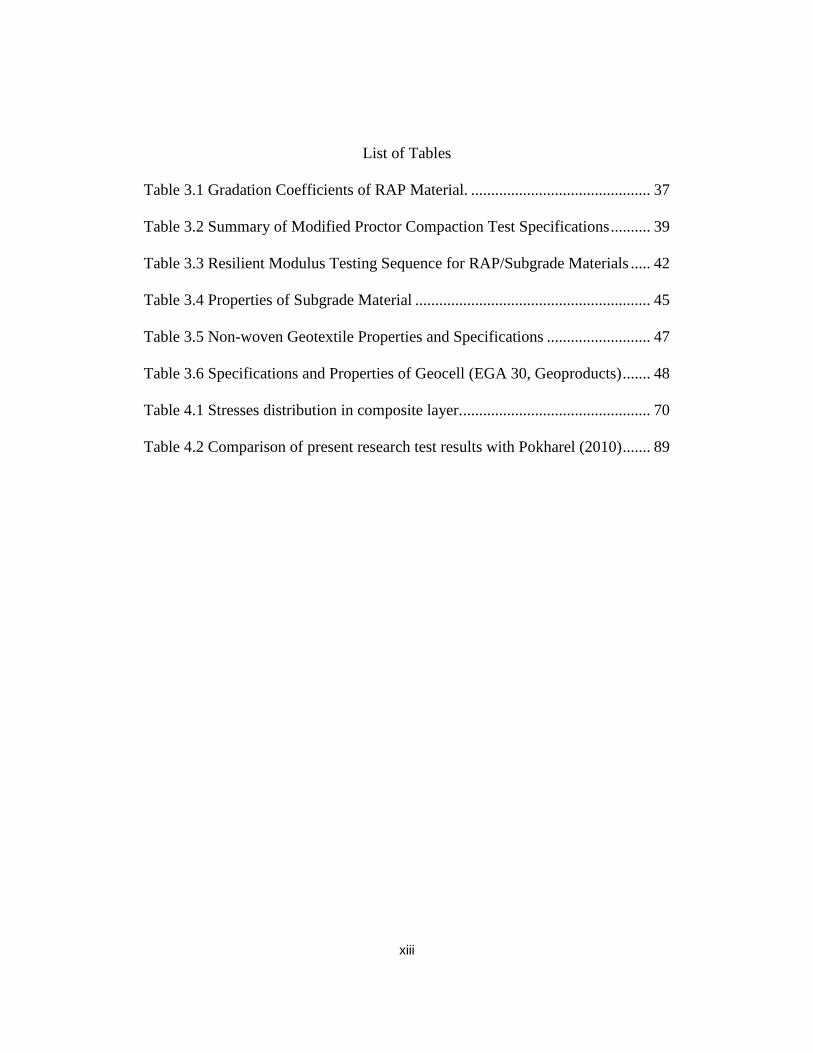
List of Tables ....................................................................................................... xiii
Chapter 1 INTRODUCTION .................................................................................. 1
1.1 Background ................................................................................................... 1
1.2 Research Objective ....................................................................................... 4
1.3 Organization of Thesis .................................................................................. 5
Chapter 2 LITERATURE REVIEW ...................................................................... 7
2.1 Introduction ................................................................................................... 7
2.2 Geosynthetics in Pavement Design ............................................................... 8
2.2.1 Background ............................................................................................ 8
2.2.2 Applications of Geosynthetics ............................................................. 10
2.2.3 Functions of Geosynthetics in Pavement Design ................................. 11
2.2.4 Past Studies on Geosynthetics under Static and Cyclic
Loading ......................................................................................................... 13
2.2.5 Geocells and their Application in Road Construction ......................... 16
2.3 Recycled Asphalt Pavement (RAP) aggregate ........................................... 24
2.3.1 Current Production and Use of RAP .................................................... 24
2.3.2 Characteristics of RAP ......................................................................... 25
viii
2.3.3 Performance of RAP as Base Course Materials................................... 27
2.3.4 Geocell-Reinforced RAP Bases ........................................................... 32
2.4 Summary ..................................................................................................... 35
Chapter 3 MATERIAL PROPERTIES AND EXPERIMENTAL
SETUP .................................................................................................................. 36
3.1 Introduction ................................................................................................. 36
3.2 Material Characterization of RAP .............................................................. 36
3.2.1 Grain Size Distribution ........................................................................ 36
3.2.2 Modified Proctor Compaction Tests .................................................... 38
3.2.3 Engineering Tests ................................................................................. 40
3.3 Material Characterization of Subgrade ....................................................... 44
3.4 Geotextiles .................................................................................................. 46
3.5 Geocells ...................................................................................................... 48
3.6 Large-Scale Laboratory Testing Setup ....................................................... 49
3.6.1 Large Testing Box ................................................................................ 50
3.6.2 Loading Frame ..................................................................................... 51
3.6.3 Accumulator and Hydraulic Regulator ................................................ 52
3.6.4 Cyclic Load Regulator ......................................................................... 54
3.6.5 Data Acquisition System ...................................................................... 57
3.6.6 Linear Variable Displacement Transducers (LVDT’s) ........................ 59
3.6.7 Software ............................................................................................... 60
ix
3.7 Preparation of Test Specimen ..................................................................... 62
3.7.1 Subgrade Bedding Material ................................................................. 62
3.7.2 RAP Base Course ................................................................................. 62
3.8 Summary ..................................................................................................... 65
Chapter 4 RESULTS AND DISCUSSIONS ....................................................... 67
4.1 Introduction ................................................................................................. 67
4.2 Test Results ................................................................................................. 68
4.2.1 Static Plate Load tests .......................................................................... 71
4.2.2 Cyclic plate load tests .......................................................................... 73
4.2.3 Structural Number ................................................................................ 90
4.4 Summary ..................................................................................................... 92
Chapter 5 CONCLUSION ................................................................................... 94
5.1 Introduction ................................................................................................. 94
5.2 Conclusions ................................................................................................. 94
5.3 Future recommendations for the study ....................................................... 95
References ......................................................................................................... 97

x
List of Figures
Figure 1.1 Tasks performed to address the research objective. .............................. 5
Figure 3.1 RAP stockpile at Grandview, Texas. ................................................... 37
Figure 3.2 Grain size distribution of RAP material .............................................. 38
Figure 3.3 Compaction test results for RAP material ........................................... 40
Figure 3.4 Variation of Mr of RAP with deviatoric stress at 4 psi confinement ... 43
Figure 3.5 Subgrade stockpiled at the lab ............................................................. 44
Figure 3.6 Grain size distribution of subgrade material ....................................... 45
Figure 3.7 Compaction test results for subgrade material .................................... 46
Figure 3.8 Non-woven geotextile material in the lab ........................................... 47
Figure 3.9 Geocell placed in a large testing box ................................................... 49
Figure 3.10 Schematic diagram of large-scale laboratory setup ........................... 50
Figure 3.11 Front of the large testing box............................................................. 51
Figure 3.12 The loading frame.............................................................................. 52
Figure 3.13 Accumulator with a pressure gauge. ................................................. 53
Figure 3.14 Hydraulic regulator/pump ................................................................. 54
Figure 3.15 Cyclic load wave form ....................................................................... 56
Figure 3.16 Cyclic load regulator ......................................................................... 57
Figure 3.17 Eight normalized transducer input channels ...................................... 58
Figure 3.18 Model 8000-8 StrainSmart data acquisition system .......................... 59
xi
Figure 3.19 LVDT’s placed at center and 1 ft. away from center of loading plate
............................................................................................................................... 60
Figure 3.20 RMC tools window showing the algorithm ...................................... 61
Figure 3.21 StrainSmart 8000 window showing the test data .............................. 61
Figure 3.22 Compacted subgrade in the large testing box .................................... 63
Figure 3.23 Geocell mattress placed on the subgrade ........................................... 64
Figure 3.24 Geocell-reinforced RAP base layer ................................................... 64
Figure 3.25 Installation of geocell-reinforced RAP base in the test section ......... 65
Figure 4.1 Schematic sectional view of all the test sections. ................................ 68
Figure 4.2 Illustration for definition of resilient modulus (Banerjee 2017). ........ 69
Figure 4.3 Stress distribution through the test section under an applied load. ..... 69
Figure 4.4 Static loading testing box. ................................................................... 71
Figure 4.5 Load-settlement response for 6-in. unreinforced base section. ........... 72
Figure 4.6 Load-settlement response for 6-in. Geocell-reinforced base section. . 72
Figure 4.7 LVDT’s placed at the center and 1 feet away from the center. ........... 73
Figure 4.8 Load-response curve for 6-in. unreinforced base section. ................... 74
Figure 4.9 Permanent deformation for 6-in. unreinforced RAP base section. ...... 76
Figure 4.10 Resilient deformation at center for 6-in. unreinforced base section. . 77
Figure 4.11 Resilient modulus at center for 6-in. unreinforced RAP base section.
............................................................................................................................... 77
Figure 4.12 Permanent deformation for 4-in. Geocell-reinforced base section. ... 80
xii
Figure 4.13 Resilient deformation for 4-in. Geocell-reinforced base section. ...... 80
Figure 4.14 Resilient modulus at center for 4-in. Geocell-reinforced base section.
............................................................................................................................... 81
Figure 4.15 Permanent deformation for 6-in. Geocell-reinforced base section. ... 83
Figure 4.16 Resilient deformation for 6-in. Geocell-reinforced base section. ...... 83
Figure 4.17 Resilient modulus at center for 6-in. Geocell-reinforced base section.
............................................................................................................................... 84
Figure 4.18 Variation of permanent deformation with number of loading cycles.85
Figure 4.19 Comparison of permanent deformation with number of cycles. ....... 86
Figure 4.20 Variation of resilient deformation with number of loading cycles. ... 87
Figure 4.21 Variation of resilient modulus with number of loading cycles ......... 88
Figure 4.22 Comparison of resilient modulus at various loading cycles .............. 88
Figure 4.23 Variation of ratio of Mr of geocell-reinforced with Mr of unreinforced
RAP base section at various loading cycles .......................................................... 89
xiii
List of Tables
Table 3.1 Gradation Coefficients of RAP Material. ............................................. 37
Table 3.2 Summary of Modified Proctor Compaction Test Specifications .......... 39
Table 3.3 Resilient Modulus Testing Sequence for RAP/Subgrade Materials ..... 42
Table 3.4 Properties of Subgrade Material ........................................................... 45
Table 3.5 Non-woven Geotextile Properties and Specifications .......................... 47
Table 3.6 Specifications and Properties of Geocell (EGA 30, Geoproducts) ....... 48
Table 4.1 Stresses distribution in composite layer. ............................................... 70
Table 4.2 Comparison of present research test results with Pokharel (2010) ....... 89
1
Chapter 1
Introduction
1.1 Background
According to the National Asphalt Pavement Association (NAPA), over
90% of the U.S. highways and roads are constructed with hot mix asphalt (HMA).
As the U.S infrastructure ages, highways and roads must be frequently repaired,
maintained, and reconstructed for quality performance, sometimes as often as every
year. A large quantity of Recycled Asphalt Pavement (RAP) materials is produced
every year for the rehabilitation and maintenance of flexible pavements. In 1993,
the Federal Highway Administration (FHWA) and the U.S. Environmental
Protection Agency (EPA) reported that more than 90 million tons of RAP were
produced every year. According to the recycled materials policy of the FHWA,
recycled materials of original road construction can be reused for maintenance and
rehabilitation (FHWA-RD-93-147).
RAP is most commonly used as an aggregate material, as an alternative to
virgin aggregates and asphalt binders. The FHWA supports and promotes the use
of RAP in road construction. The NAPA estimates that about 500 million tons of
asphalt pavement materials are produced annually, including 60 million tons of
RAP, 40 million tons of which are reused for highway applications (NAPA, 2013).
The applications of RAP include its use as a subbase aggregate in pavement
construction, embankment fill material, driveway construction material, parking
2
lots, bicycle paths, and road rehabilitation. More than 99% of RAP from old
pavements is utilized in the construction of new pavements as a base course
material, resulting in cost savings, and preservation of natural resources,
environmental protection, and conservation of energy.
RAP is coated with aged bitumen, resulting in very limited bonding which
affects the quality of a base course due to its inconsistency, variability, high
deformation, low strength, creep, and temperature dependencies (Dong and Huang
2014). Past studies have not recommended the use of 100% RAP as a base course
in pavement construction because it lacks shear strength, which induces excess
deformations (McGarrah 2007). These deformations cause rutting and subsequent
pavement failure. Therefore, RAP is chemically stabilized to increase its strength
and stiffness for use as a base course material (Guthrie et al. 2007; Potturi 2006;
Taha et al. 2002). Puppala et al. (2017) conducted studies, including long-term
durability studies, on chemically treated RAP and recommended it as a base layer
for road construction. Tests conducted on the stabilized RAP materials showed that
the treatments enhanced the permeability, shear modulus, strength, stiffness, and
unconfined compression strength. Although, the chemically treated RAP showed
improved performance as a base course material, it required using a thicker base
(Taha 2003).
Geosynthetic material was first used in highway or pavement construction
in the 1930s. The inclusion of geosynthetic materials at the interface of the base
3
and subgrade or within the base course improved the pavement life, strength, and
stiffness, and reduced the thickness of the base layer. In the early 1970s, the U.S.
Army Corps of Engineers developed geocells, a cellular confinement system.
Geocells are a system of three-dimensional, interconnected, honeycombed cellular
structures that resist the lateral expansion of soil particles and act like a slab to
distribute surface loads over a large area of the foundation soil. Geocells have been
widely used in different civil engineering applications such as subgrade
reinforcement, base course reinforcement, foundation support, and retaining walls.
Most of the recent studies on geocell-reinforced RAP bases show that they improve
the pavement life, strength, and stiffness, and reduce the thickness of the base layer
(Asha and Latha 2014; Cowland and Wong 1993; Giroud and Han 2004b; Mhaiskar
and Mandal 1996). The geocell reinforcement increases the bearing capacity,
improves the resilient modulus, and reduces the plastic deformations of the base
layer in pavement construction. (Chaney et al. 2000; Han et al. 2011; Pokharel et
al. 2011; Thakur et al. 2012; Xie and Yang 2009).
Transportation departments currently use geocell layers as base layers, and
the use of RAP as an infill material of geocells is of interest to researchers and
practitioners in this field. Yet, limited research has been conducted on the behavior
and performance of geocell-reinforced RAP bases in flexible pavements (Thakur,
2011). Hence, there is a strong need for research that addresses the behavior of such
systems by performing large-scale box tests on these materials.
4
1.2 Research Objective
The primary objective of this research is to develop and construct a large-
scale laboratory test setup, which can perform a series of cyclic plate load tests to
identify and evaluate the resilient properties of a geocell-reinforced RAP base. The
research is divided into the following tasks:
• Review the past studies and perform basic and advanced laboratory tests
to characterize the properties of RAP and subgrades.
• Develop a large-scale experimental setup to conduct a series of cyclic
plate load tests on unreinforced and geocell-reinforced test sections,
• Compare the performance of flexible pavement with unreinforced and
geocell-reinforced RAP base layers under cyclic loading.
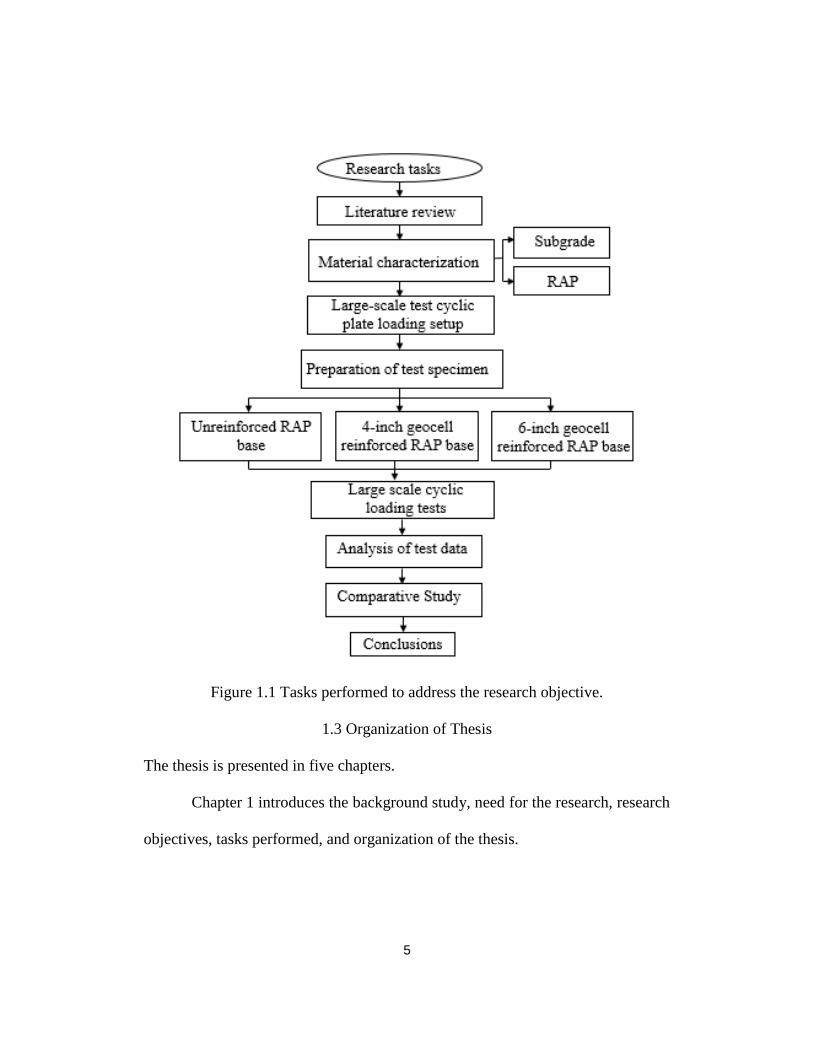
The following flowchart outlines the tasks performed to address the
research objective.
5
Figure 1.1 Tasks performed to address the research objective.
1.3 Organization of Thesis
The thesis is presented in five chapters.
Chapter 1 introduces the background study, need for the research, research
objectives, tasks performed, and organization of the thesis.
6
Chapter 2 presents information about the use of geosynthetics and recycled
materials in pavement construction. A detailed literature review on the performance
of geocell-reinforced RAP bases in flexible pavements is also presented.
Chapter 3 focuses on the basic and engineering properties of the materials
(subgrade, RAP, geocell, and geotextile), types of laboratory tests performed,
laboratory equipment setup, and procedures adopted to prepare the test section.
Chapter 4 includes the analysis of experimental data obtained from large-
scale laboratory cyclic plate loading tests conducted on different road base sections.
A comparative study of three different test sections is also analyzed and discussed.
Chapter 5 provides the summary and conclusions drawn from the research
and offers recommendations for future study.
A list of references is included towards the end of the research to support
the thesis paper.
7
Chapter 2
Literature Review
2.1 Introduction
A variety of factors affect the service life of roads and pavements adversely,
such as maintenance, traffic loading, subgrade conditions, water drainage, and
climatic and environmental conditions (Yoder and Witczak 1975). These factors
lead to a wide variety of pavement problems which need to be addressed to ensure
acceptable long-term pavement performance. The performance of pavements is
enhanced by stabilizing the subgrade, strengthening the base layer while allowing
for drainage, and improving stress distribution (Handbook of Geosynthetics 2002).
The use of geosynthetics has been proven to enhance highway performance,
resulting it being superior to highways built with conventional materials (Yang
2006).
This chapter presents a detailed literature review on the use of geosynthetics
and recycled asphalt pavement materials in pavement construction. The primary
objective is to outline the past studies on the performance of geocell-reinforced
reclaimed asphalt pavement (RAP) bases and its behavior under repeated cyclic
loadings.
8
2.2 Geosynthetics in Pavement Design
2.2.1 Background
In the past, a variety of materials, such as cotton textile, tree branches, plant
fibers, and wood shavings, were used to enhance the engineering properties and
stability of soils (Becham and Mills 1935, Holtz 1978, Broms 1979). The Great
Wall of China (built around 200 B.C.) is a prime example of a structure with
sections constructed of mixtures of clay and gravel reinforced with tree branches.
The reinforcement of earthen revetments and fortifications has been practiced in
Europe since Roman times (Jones 1985). Some embankments, levees, and roads
were constructed on brush fascines, bamboo fascines, and timber logs (Holtz 1978,
Broms 1979). In 1960s, Casagrande recommended that embankment dams be
reinforced with steel plates and rods; however, the idea was rejected as being too
expensive (Holtz 1990). Nevertheless, tie rods were used between two large
retaining walls to stabilize an ore pile in Cleveland (Terzaghi 1948). The Swedish
Geotechnical Institute also used tie rods to connect rows of short steel channel
sections under crests of embankments to increase the stability of soft-soil
embankments (Wager 1968, Wager and Holtz 1976). This method of using tie rods
as reinforcement is known as the Wager System. The aforementioned reinforced
embankments were subjected to full-scale tests which resulted in the modification
of some design standards (Wager 1968). The Wager system, albeit expensive, was
9
used in Denmark and Sweden for highways and railroad embankments, as no other
foundation alternatives were feasible.
In the 1920s, cotton textiles were used in the state of South Carolina to
reinforce soft soil in the design of unpaved roads. The examination of the road after
several years revealed that the cotton textiles, which were used as reinforcement,
were still in good condition (Becham and Mills1935). After a few decades,
geosynthetics were considered to be useful civil engineering construction materials
(Holtz 1990). Most geosynthetic materials are made up of synthetic polymers of
polypropylene, polyester, or polyethylene, and the polymeric nature of the
materials makes them suitable for use in soil, rock, and earth applications where
long-term performance is required (Koerner 1998, Muller 2007, Sarby 2007).
Geosynthetics were first used as filters in the United States and as reinforcement in
the UK in the 1960s (Sarby 2007). In 1970, non-woven geotextiles were used for
the first time to maintain the filtration and internal integrity of a dam embankment
in France (Giroud et al. 1977). During the early 1970s, geotextiles were used in fin
drains (Healy and Long 1971), basal-reinforcement beneath embankments (Holtz
1975), and reinforced soil wall (Puig et al. 1977). Since 1977, geosynthetics have
emerged as exciting engineering materials that can be used in a wide range of civil
engineering applications.
10
2.2.2 Applications of Geosynthetics
Various types of geosynthetics, such as geotextiles, geogrids, geofoams,
geocells, geonets, geomembranes, and geocomposites, have been manufactured and
made available for diverse engineering applications (Holtz 1977, Zornberg 2011).
Currently, geosynthetics are used in many geotechnical, transportation, and
geoenvironmental applications such as roads, landfills, embankments, and retaining
structures (Rowe 2001, Dixon et al. 2003, Shukla 2006, Heimann 2011, and Zeigler
2014). In pavement construction, geosynthetics are primarily used for subgrade
stabilization and separation, and base reinforcement (Steward et al. 1977, Bender
and Barenberg 1978, Brown et al. 1982, Barker 1988, Al-Qadi et al. 1994, Holtz et
al. 1995).
Pavements with weak subgrades are underlain by an aggregate base course
layer which, when integrated with geosynthetics, improves the pavement
performance by (1) increasing the elastic modulus of the base aggregate,(2)
improving the stress distribution within the subgrade, (3) reducing lateral
movement of the base aggregate, (4) reducing shear strains at the top of the
subgrade, (5) increasing the bearing capacity of the pavement section, and (6)
extending the service life of the pavement (Barksdale et al. 1989, Bathrust and
Karpurapu 1993, Cancelli et al. 1996, Ling and Liu 2001, Zornberg and Gupta
2009, Thakur et al. 2012, Rajagopal 2014).
11
2.2.3 Functions of Geosynthetics in Pavement Design
The basic functions of geosynthetics in pavement design are subgrade
separation and stabilization, base reinforcement, and filtration or drainage.
2.2.3.1 Subgrade separation and stabilization
In highway and road construction, a layer of base course aggregates is
placed on the subgrade to improve the bearing capacity (Ferguson and Hoover
1967). Due to repeated loading, the base course develops tensile cracks and loosens,
causing the fines in the subgrade soil to migrate up to the base course, which affects
its structural strength (Kercher et al. 2010). One of most common purposes of
geosynthetics is to prevent the intermixing of two adjacent materials, thus
maintaining, and often enhancing, the integrity and functioning of both of the
materials (Jorenby 1986, Al-Qadi 1994, Berg 2000). Geosynthetics, like
geotextiles, are placed at the interface of the subgrade and base course to improve
the subgrade bearing capacity (Floss and Gold 1994, Meyer 1998, Meyer and Elias
1999, Cuelho 2009). Separation is a major function of most applications of
geotextiles, geofoams, geocomposites, and geocells, (Keller and Berry 2015, Shin
et al. 2016, Shukla 2016).
2.2.3.2 Base reinforcement
The improved performance of pavement due to geosynthetic reinforcement
is primarily attributed to three mechanisms: (1) lateral restraint, (2) increased
bearing capacity, and (3) the tensioned membrane effect (Giroud and Noiray 1982,
12
Giroud et al. 1984, Perkins and Ismeik 1997, Holtz et al. 1998). When the base
layer is subjected to traffic loading, the base course material tends to move laterally
unless it is reinforced by geosynthetics, and interaction between the base aggregate
and the geosynthetic material allows the transfer of shearing load from the base
layer to a tensile load in the reinforcement (Zornberg 2015). The tensile strength of
reinforcement and the interface friction between the reinforcement and the adjacent
soil develop an apparent cohesion in the reinforced soil system and limit the
induced lateral strains in the base layer (Shukla and Hin 2006). Therefore, the
presence of a reinforcement layer increases the confinement of the fill material,
thereby increasing the rigidity of system and reducing vertical and horizontal
deformations (Cancelli and Montanelli 1999, Perkins 1999, Som and Sahu 1999,
Jenner and Paul 2000). This mechanism of geosynthetics is referred to as the “slab
effect or confinement effect.”
The tension membrane effect is induced by vertical deformations, leading
to a concave shape in the geosynthetic. The tension developed in the geosynthetic
material contributes to the support of the applied load in a wider area and reduces
the vertical stress on the subgrade (Haas 1988, Giroud 1990). The inclusion of
geosynthetics increases the bearing capacity of a subgrade by changing the mode
of failure from punching failure to general failure (Bourdeau et al. 1982, Guido et
al. 1985, Love et al. 1987, Barksdale et al. 1989; Adams and Collin 1997). Lateral
13
restraint is usually considered the primary contributor to the improved performance
of geosynthetic-reinforced flexible pavements (Zornberg 2015).
2.2.3.3 Filtration/ Drainage
Excess pore water pressures develop and are likely to produce water flow
from the subgrade to the base under traffic loading (Christopher 2009). The fine
soil particles in the subgrade may become suspended in the pore water as a result
of a shearing action and may migrate to the base layer in the absence of the proper
filter (Christopher 2009). Geosynthetics may function as a filter that allows
adequate water flow from the subgrade to the base, with a limited migration of soil
particles (Shukla and Hin 2006, Al-Qadi 2002). Geosynthetic reinforcement at the
base-subgrade interface dissipates the excess pore water pressure, thereby
maintaining its effective strength (Barksdale 1989). Geotextiles and geocomposites
are most commonly used for filtration purposes in roadways (Giroud 1989, Hudson
1991, Austin 1996).
2.2.4 Past Studies on Geosynthetics under Static and Cyclic Loading
Al-Qadi et al. (1994) conducted experimental and analytical investigations
to evaluate the performance of unreinforced and geogrid/geotextile-reinforced
materials under cyclic loading. (The reinforced materials were placed beneath the
base course.) The authors observed that the unreinforced sections required only
about 25 cycles for the first 1.25 cm of displacement/settlement, whereas the
geogrid/geotextile-reinforced sections required 200 cycles to reach the same
14
settlement. They concluded that geosynthetics significantly enhanced the
performance of pavement sections constructed on subgrade soils with a low
California bearing ratio (CBR) by reducing horizontal and vertical displacements.
They also observed that the reinforcing mechanisms of geotextiles and geogrids
were different. The primary function of geotextiles was identified as separation,
which proved to be more significant than the reinforcement function of geogrids.
As a result, geotextile-reinforced sections performed better than geogrid-reinforced
sections with regard to rut depth.
Ling and Liu (2001) described the performance of geosynthetic-reinforced
asphalt pavements under monotonic, cyclic, and dynamic loading conditions. The
authors indicated that the geogrid reinforcement contributed to an improvement in
the stiffness and strength of asphalt pavement. When the unreinforced pavement
section was subjected to monotonic loading, it failed at a normalized strength of
600. The geogrid-reinforced pavement section sustained, even though the stress
was three times the strength of that for the unreinforced pavement. The authors
observed that the stiffness of geogrid-reinforced pavement sections was 60% higher
than that for the unreinforced asphalt pavement sections. Under cyclic loading, the
settlement over the geogrid-reinforced pavement sections reduced significantly as
compared to that for unreinforced sections (Ling et al., 2001).
Hufenus et al. (2006) conducted full-scale field tests on geosynthetic
reinforced unpaved roads to investigate the bearing capacity and performance of a
15
soft subgrade. The authors indicated that the use of stiffer geosynthetics, with strain
ranges of 1-3% in unpaved road sections, improved the load carrying capacity and
compactability of fill layers, with less than 0.5m thickness, on very weak subgrades
(CBR ≤ 2) (Hufenus et al. 2006). The authors also reported that the thickness of
the reinforced fill layer was reduced by 30% for specified compaction values and
load carrying capacities when compared to unreinforced fill layers.
Rahman et al. (2014) investigated the resilient moduli and permanent
deformation characteristics of recycled concrete aggregate (RCA) and crushed
brick (CB) materials with biaxial and triaxial geogrid reinforcement under repeated
loading triaxial tests. The authors reported that the inclusion of geogrid
reinforcement as base/subbase materials in pavement applications significantly
affected the resilient modulus and permanent deformation characteristics of RCA
and CB materials. The test results showed that the resilient modulus of biaxial-and-
triaxial-geogrid-reinforced RCA was increased by 24% and 34%, respectively,
when compared to that for unreinforced RCA at maximum confining stress of 137.9
kPa. The permanent deformation values obtained from biaxial-and-triaxial-
geogrid-reinforced RCA pavement sections were decreased by 29% and 36%,
respectively, as compared to that for unreinforced RCA at a deviator stress of 150
kPa. The authors also reported that the resilient modulus of biaxial-and-triaxial-
geogrid-reinforced CB was increased by 16% and 55%, respectively, as compared
to that for unreinforced CB at maximum confining stress of 137.9 kPa. The
16
permanent deformation values obtained from biaxial-and-triaxial-geogrid-
reinforced CB pavement sections were decreased by 29% and 37%, respectively,
when compared with unreinforced CB at a deviatoric stress of 150 kPa.
Suku et al. (2016) examined the behavior of geocell-reinforced granular
bases of 1.5 cm 3 cm thickness when subjected to repeated loading. The test results
showed that the resilient modulus of the 1.5 cm thick geocell-reinforced section
was much higher than that of the 3 cm unreinforced section. The resilient modulus
of the unreinforced and geocell-reinforced sections varied from 200 MPa to 250
MPa and 250 MPa to 400 MPa, respectively. The resilient deformation of geocell-
reinforced sections was found to be 0.06 cm, while the resilient deformation was
0.1 cm for the unreinforced section. The permanent deformation of unreinforced
sections reached 6.3 cm after 2500 cycles; the permanent deformation of the
geocell-reinforced sections was found to be 2 cm.
2.2.5 Geocells and their Application in Road Construction
Geocells are three-dimensional (3D), polymeric, geosynthetic materials that
increase soil bearing capacity, extend service life, improve modulus, reduce base
course thickness and vertical deformation, and minimize operational costs
(Cowland and Wong 1993, Rose and Walker 2002, Giroud and Han 2004, Kief and
Rajagopal 2008, Pokharel et al. 2010, Thakur et al. 2012). These interconnected
honeycomb-like cellular structures resist the lateral movement of soil particles and
act like a slab to distribute surface loads over a wider area of the foundation soil
17
(Bush et al. 1990, Rowe et al. 1995, Krishnaswamy et al. 2000). General
applications of geocells include roadways, railways, retaining walls, slope
protection systems, embankments, and foundations (Bathurst and Karpurapu 1993,
Cancelli et al. 1993, Bathurst and Crowe 1994, Wang 2004, Hedge 2017).
In the early 1970s, the United States Army Corps of Engineers (USACE),
in collaboration with Presto Geosystems, developed a technology known as the
‘cellular confinement system,’ primarily for the improvement of sand roads used
by military vehicles (Webster 1977). In the preliminary stages, the cellular
confinement systems were designed using stapled plastic pipe matrices, hexagonal
glued aluminum sheets, welded polymeric strips, and pre-fabricated polymeric
systems also known as ‘sand grids’ (Webster 1981). After various phases of testing,
it was concluded that high-density polyethylene (HDPE) strips performed better
with respect to shear strength and structural support (Webster 1981). Over the
years, the HDPE cellular confinement systems, or geocells, have been used in slope
erosion control, channel lining, and earth retention systems (Engel and Flato 1987,
Crowe et al. 1989, Bathrust et al. 1993, Wu and Austin 1992, Richardson 2004,
Leshchinsky and Ling 2009).
2.2.5.1 Reinforcement Mechanisms of Geocells
The improved performance of geosynthetic reinforcements has contributed
to three mechanisms: (1) confinement effect, (2) tension membrane effect, (3) stress
distribution.
18
Confinement Effect: The 3D structure of geocells can improve the performance of
roads and highways by reinforcing the recycled materials or poorly graded soils of
the base course (Han et al. 2011, Thakur et al. 2012, Suku et al. 2016). The geocell
reinforcement in the base course provides lateral confinement against lateral
spreading due to traffic loads, thereby increasing the load-carrying capacity (Bush
et al. 1990, Krishnaswamy et al. 2000, Singh et al. 2007). When the geocell-
reinforced base is subjected to external loading, it causes high lateral stress on the
perimeter of the geocell walls. The high hoop strength from adjacent cells offers
additional resistance for loaded cells against lateral movement of soil particles
(Mhaiskar 1992), resulting in an increase in the stiffness and strength of the base
course (Rajagopal 1999, Pokharel et al. 2009, Han et al. 2011, Thakur 2011).
Geocell-reinforced base layers demonstrate significant improvement by
distributing stresses more uniformly than those without reinforcement
(Leshchinsky and Ling 2013). The reduction in maximum stress minimizes the
vertical settlement and increases bearing capacity of the infill material (Han et al.
2008a, Pokharel et al. 2009, Emersleben and Meyer 2008).
Tension Membrane Effect: When an external load is applied to the geocell through
its infill material, the geocell deforms locally, and tensile forces develop. The
upward component of the tensile force resists both the vertical load and pressure
transferred to the subgrade, providing vertical confinement for the infill material
due to the tension membrane effect. Giroud and Han (2004a) stated that the tension
19
membrane effect becomes more significant when large compression deformations
take place. Zhang et al. (2010) observed that when vertical deformation of the
geocell-reinforced base layer is minimal, the confinement effect is more significant
than the tension membrane effect.
Stress Distribution: The inclusion of geocell reinforcement results in a high-stress-
distribution angle (angle with vertical) which distributes surface loads over a wider
area on the subgrade and results in lower compression (Zhou and Wen 2008,
Thakur et al. 2012, Hedge and Sitaram 2015). The permanent deformation induced
by external stress is mostly carried by the geocell mattress. Gradually, as the stress
is reduced at the base-subgrade interface, the load-carrying capacity of the subgrade
increases (Bathurst 1988, Rajagopal et al. 1999, Das et al. 2003, Han et al. 2008,
Latha et al. 2009, Pokharel. 2010).
2.2.5.2 Past studies on geocell-reinforced base layers
Mhaiskar and Mandal (1992a, b) conducted experimental studies and finite
element analyses (using ANSYS) on geocell-reinforced sand base courses of
different thicknesses under monotonic and cyclic loading conditions. Using finite
element analysis, Mhaiskar and Mandal (1992b) observed that the modulus of the
geocell-reinforced sand base was three times greater than the unreinforced base.
They also observed that the pressure bulb was almost contained within the geocell
layer, demonstrating that the transfer of stresses to the subgrade was minimal when
geocell reinforcement was used in the sand base. The ultimate load-carrying
20
capacity increased with a decrease in the width-to-height ratio, indicating that the
modulus of the geocell material plays a more significant role than the seam strength
in improving the strength of the subgrade (Mhaiskar and Mandal 1992b). The
authors reported that the geocell-reinforced soil had a higher load-carrying capacity
than the planar-reinforced and unreinforced sand bases under cyclic loading. In
addition, compaction of a geocell-reinforced base course has a higher relative
density (Mhaiskar and Mandal 1992a).
Rajagopal et al. (2008) performed field tests to demonstrate an approximate
50% reduction of vertical stresses beneath the geocell layer as compared to the
unreinforced granular base under traffic loading. Finite element analysis was also
performed, which showed an increase of nearly 2.5 times in the bearing capacity of
the subgrade. Rajagopal et al. (2012) conducted model studies to examine the
improved performance of geocell-reinforced granular bases in flexible pavements.
In field tests, a novel polymeric alloy (NPA) geocell improved the elastic modulus
by a factor of 2.75. In laboratory tests, the NPA geocell improved the elastic
modulus by a factor of 2.84 in 5 cm and 10 cm thick sections, and by a factor of
2.92 in 15 cm thick sections. The reduction in thickness of the base layer leads to
faster construction and lower costs because fewer materials are transported
materials from quarries (Rajagopal et al. 2012). The overall cost of pavement
construction was observed to be lower with use of geocells as compared to that of
21
unreinforced pavement systems. The field and laboratory test results also
demonstrated that the use of geocells increases the structural stiffness and extends
the service life of pavement systems.
Pokharel et al. (2009c) conducted several static plate load tests to study the
behavior of geocell-reinforced bases. The static tests were conducted on both
unreinforced and reinforced sections by increasing the load in increments of 35 kPa.
Pressures of 345 kPa and 550 kPa were applied for the sand-and-quarry-waste-
reinforced sections, respectively. The tests were conducted on single geocell-
reinforced Kansas River sand, quarry waste (QW), and recycled asphalt pavement
aggregates (RAP) in a small testing box with dimensions of 60.5 cm × 60.5 cm.
Under static loading, the geocell reinforcement increased the bearing capacity and
stiffness of sand by factors of 1.75 and 1.5, respectively. The single geocell reduced
the permanent deformation of quarry waste by a factor of 1.5 when compared to the
unreinforced base. The geocell-reinforced quarry waste had higher elastic
deformation than the unreinforced base or geocell-reinforced sand. The static and
repeated load tests performed on single geocell bases proved that the NPA geocell
reinforcement increases the stress distribution angle, reduces the stress transferred
to the subgrade, and slows down the rate of deterioration of the base course
(Pokharel 2010).
22
The medium-scale cyclic plate load tests conducted by Pokharel et al.
(2010) concluded that elastic deformation is greater for geocell-reinforced infill
materials than for unreinforced bases. Three different materials, Kansas River sand
(KR), well-graded base course material (AB-3), and quarry waste (QW) were used
as infill materials. After ten cycles, the KR showed 80% elastic deformation; at the
end of 150 cycles, it approached 95%. The elastic deformation of AB-3 and QW
reached 95% at ten cycles and approached 99% after 150 cycles. All tests were
conducted on the NPA geocells.
Pokharel (2010) also conducted full-scale wheel loading tests to compare
the effects of geocells under three infill materials (AB-3, QW, and RAP). The NPA
geocell-reinforced recycled asphalt pavement (RAP) and well-graded AB-3
sections performed better than the quarry waste section. NPA geocell reinforcement
improved the life of the road sections, increased the stress distribution angle, and
reduced the vertical stress transferred to the subgrade as compared with
unreinforced road sections (Pokharel 2010).
Yang et al. (2010) conducted a series of static plate load tests and moving
wheel load tests on unreinforced and geocell-reinforced unpaved road sections to
characterize the performance of the geocell-reinforced soil. The static load tests
demonstrated that geocell reinforcement improves the bearing capacity and
stiffness of granular soil. The test results concluded that NPA geocells improve the
stability of unpaved sand base sections by reducing the permanent deformation.
23
Yang et al. (2010) observed that two unreinforced sections of AB-3 aggregate, one
15 cm thick and one of 7 cm thick, failed to resist a single pass of an 80-kN axle
load. However, the geocell-reinforced sections showed only 4.8 cm rut depth after
5000-wheel passes, which was comparable to the performance of a 23.8 cm thick
unreinforced aggregate base layer on the same subgrade. For the setup in this
particular study, the geocell-reinforced base experienced cell bursting failure due
to inadequate thickness. The failure indicated that the thickness of the geocell-
reinforced base layer plays an important role in improving the stability of unpaved
road sections under cyclic loading.
Biabani et al. (2016) performed a series of large-scale cyclic loading tests
and developed a numerical model to evaluate the behavior of a subballast reinforced
with a geocell mattress. In order to obtain a more realistic analysis of a subballast
under repeated loadings, experimental tests were conducted under true field
condition, where minor principal stresses differed from intermediate stress (σ2’ ≠
σ3’). The experimental tests were performed on an 80 cm × 60 cm specimen that
was placed in a small testing box. The numerical and experimental results
confirmed that the lateral deformation reduced as the confining pressure increased
at a given loading cycle. Thereby, the test results indicate that the performance of
the subballast with low compressive strength and stiffness was improved with the
inclusion of a geocell mattress.
24
2.3 Recycled Asphalt Pavement (RAP) aggregate
2.3.1 Current Production and Use of RAP
Over 90% of the transportation infrastructure in the United States is
constructed with hot mix asphalt (HMA) (Copeland and Audrey 2011). Repair,
maintenance, and reconstruction of roads and highways are performed frequently
to ensure quality performance. According to the Federal Highway Administration
(FHWA), 80% of RAP is reclaimed annually for repaving works (FHWA 1997).
According to Taha et al. (1999), “RAP is a bituminous pavement that has been
recovered, usually by milling, and is to be used in part or as whole in a new
pavement by mixing it with virgin aggregates or asphalt, cement or other
materials.” The reuse of recycled aggregates and other highway construction
materials for maintenance and rehabilitation is strongly promoted by the FHWA,
and as a result, HMA suppliers have begun using RAP as a replacement for virgin
aggregates (Copeland 2011). The use of RAP in transportation infrastructure
became a valuable approach for engineering, economical, and environmental
reasons (Kennedy et al. 1998, Wright et al. 2001). Many transportation departments
have reported significant cost savings when RAP is used (Page and Murphy 1987).
In Brawley, California, the use of RAP in road construction reduced the cost of
material from $40 to $16 per ton (Ayers 1992), and the use of RAP as a base course
resulted in considerable cost savings for a project in El Cajon, California
(Munzenmaier 1994).
25
According to the FHWA and a U.S. Environmental Protection Agency
(EPA) survey conducted in the 1990s, more than 90 million tons of RAP were
recycled every year, and over 80% of RAP was reused in asphalt paving, fill
materials, and bases or sub-bases for pavement construction (FHWA 1993). The
survey also reported that the recycling rate of RAP was much higher than that of
other solid waste products (FHWA 1993). Both the FHWA and the EPA identified
RAP as a highly used recycled material in the infrastructure industry (FHWA
1993). According to the 2015 National Asphalt Pavement Association (NAPA)
report, more than 74.2 million tons of RAP is estimated to have been reused in new
pavements in the United States (Kent and Copeland 2017).
The use of recycled materials in transportation infrastructure offers cost
effective and high quality roads (Copeland and Audrey 2011). The frequent use of
RAP in highway and infrastructure construction helps to: (1) reduce the quantity of
virgin aggregates required in road mixes, (2) decrease the amount of RAP disposed
of in landfills, (3) improve the sustainability of the asphalt mixture, and (4) stabilize
cost savings.
2.3.2 Characteristics of RAP
2.3.2.1 Physical Properties
The physical properties of RAP depend on its gradation, unit weight,
moisture content, and the type of asphalt mix reclaimed (either binder course or
wearing course) (Kasim et al. 2005). Milling and crushing of RAP results in
26
varying aggregate gradation. Milled RAP is finer, and therefore denser, than
crushed RAP and virgin aggregates (Chesner et al. 2008). The varying gradation of
milled and crushed RAP is a result of the differences in (1) the process of producing
RAP, (2) the type of materials used in road construction, and (3) the aggregate
mixing with other layer material while reclaiming it (Kallas 1984).
The unit weight of RAP mostly depends on its moisture content and type of
aggregate material reclaimed from old asphalt pavement construction. Although
there is limited literature available on the unit weight of RAP, it has been found that
the unit weight of milled or crushed RAP ranges from 120 to 140 lb. /ft.3, which is
slightly lower than that of virgin aggregates (Smith 1980, Kasim et al. 2005, Melton
and Kestler 2013). The moisture content of RAP depends primarily on the length
of storage time and amount of precipitation. When there is high precipitation during
storage, RAP has a maximum moisture content of 7% to 8%; however, the regular
storage RAP has a moisture content of up to 5%. (Smith 1980, Decker and Young
1996).
The asphalt cement content of RAP typically varies from 3% to 7% by
weight (Senior et al. 1994, Cosentino et al. 2012). Due to the process of oxidation,
the old asphalt cement content hardens during its use and exposure. The degree of
hardening also depends on other factors such as the properties of the asphalt
cement; mixing time and temperature; and degree of compaction, porosity, and age.
The pavement’s age primarily determines the viscosity and penetration values of
27
the recovered RAP. Generally, RAP has a viscosity of 4,000 to 25,000 poises at
60°F, and penetration values typically range from 10 to 80 at 77°F (Epps at al.
1977).
2.3.2.2 Chemical properties
The chemical composition of RAP consists of 93% to 97% of aggregate
and 3% to 7% of asphalt cement. Asphalt cement is a mixture of asphaltenes and
maltenes (resins and oils), which are mainly composed of aliphatic hydrocarbon
compounds and small concentrations of nitrogen, sulfur, and polycyclic
hydrocarbons. Oxidation of aged asphalt cement converts oils to resins and resins
to asphaltenes, which results in hardening with time, and increased viscosity
(Noureldin et al. 1989).
2.3.2.3 Mechanical Properties
The mechanical properties of RAP widely depend on the type of pavement,
the methods utilized for removal, and the method employed to process the RAP
material. The compacted unit weight of RAP decreases with an increase in
maximum dry density. The maximum dry density of reclaimed asphalt pavement
material varies from 100lb. /ft.3 to 125lb. /ft.3, and the CBR value ranges from 20%
to 25% (Hangs and Magni 1989, Senior et al. 1994).
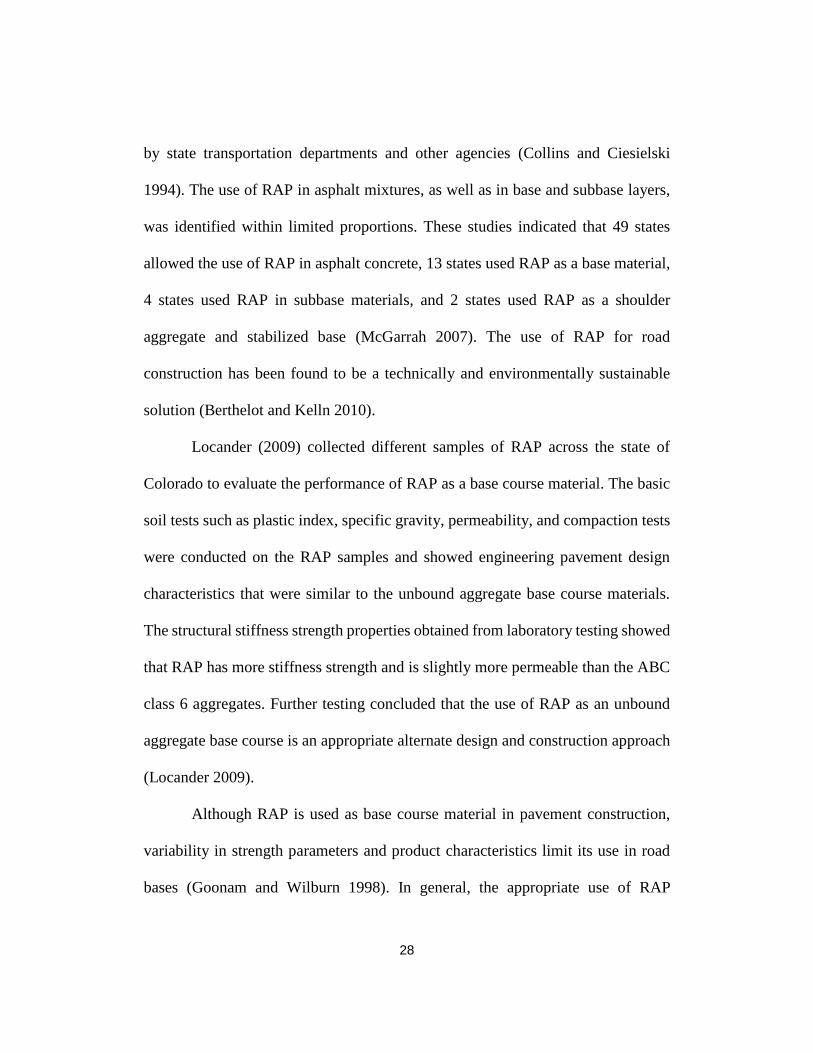
2.3.3 Performance of RAP as Base Course Materials
In the NCHRP Synthesis of Highway Practice, the RAP aggregates were
reported as the most frequently used recycled materials in pavement construction
28
by state transportation departments and other agencies (Collins and Ciesielski
1994). The use of RAP in asphalt mixtures, as well as in base and subbase layers,
was identified within limited proportions. These studies indicated that 49 states
allowed the use of RAP in asphalt concrete, 13 states used RAP as a base material,
4 states used RAP in subbase materials, and 2 states used RAP as a shoulder
aggregate and stabilized base (McGarrah 2007). The use of RAP for road
construction has been found to be a technically and environmentally sustainable
solution (Berthelot and Kelln 2010).
Locander (2009) collected different samples of RAP across the state of
Colorado to evaluate the performance of RAP as a base course material. The basic
soil tests such as plastic index, specific gravity, permeability, and compaction tests
were conducted on the RAP samples and showed engineering pavement design
characteristics that were similar to the unbound aggregate base course materials.
The structural stiffness strength properties obtained from laboratory testing showed
that RAP has more stiffness strength and is slightly more permeable than the ABC
class 6 aggregates. Further testing concluded that the use of RAP as an unbound
aggregate base course is an appropriate alternate design and construction approach
(Locander 2009).
Although RAP is used as base course material in pavement construction,
variability in strength parameters and product characteristics limit its use in road
bases (Goonam and Wilburn 1998). In general, the appropriate use of RAP
29
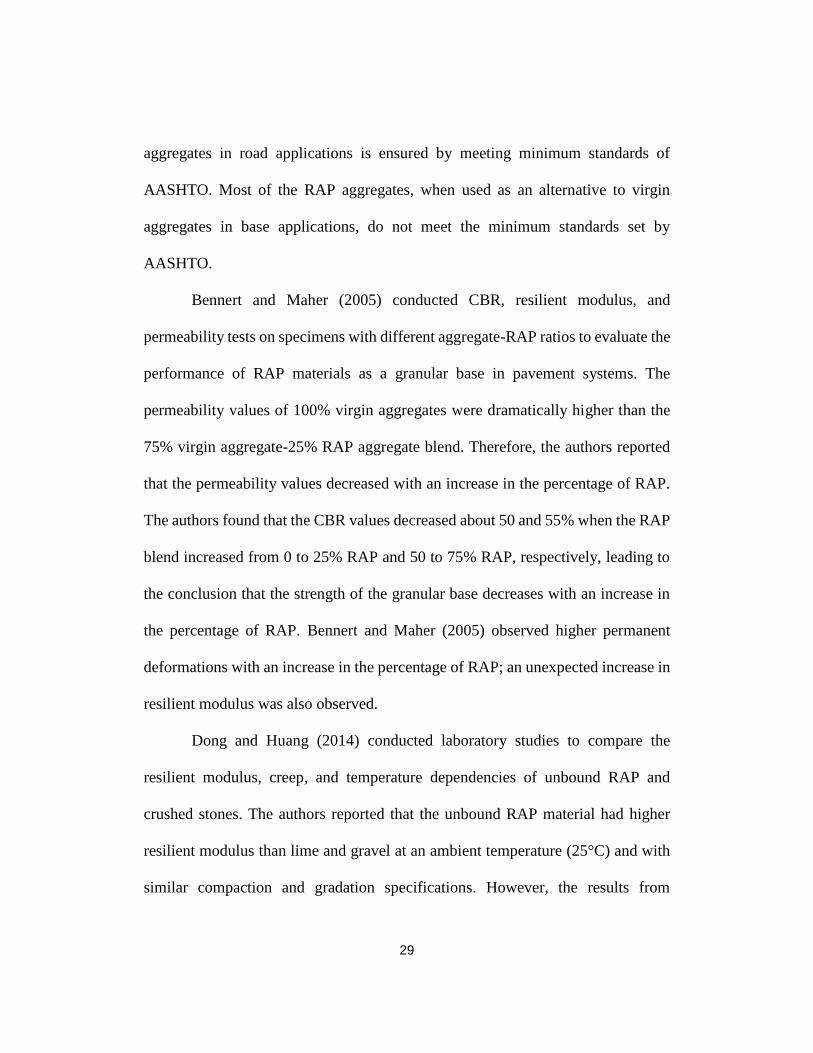
aggregates in road applications is ensured by meeting minimum standards of
AASHTO. Most of the RAP aggregates, when used as an alternative to virgin
aggregates in base applications, do not meet the minimum standards set by
AASHTO.
Bennert and Maher (2005) conducted CBR, resilient modulus, and
permeability tests on specimens with different aggregate-RAP ratios to evaluate the
performance of RAP materials as a granular base in pavement systems. The
permeability values of 100% virgin aggregates were dramatically higher than the
75% virgin aggregate-25% RAP aggregate blend. Therefore, the authors reported
that the permeability values decreased with an increase in the percentage of RAP.
The authors found that the CBR values decreased about 50 and 55% when the RAP
blend increased from 0 to 25% RAP and 50 to 75% RAP, respectively, leading to
the conclusion that the strength of the granular base decreases with an increase in
the percentage of RAP. Bennert and Maher (2005) observed higher permanent
deformations with an increase in the percentage of RAP; an unexpected increase in
resilient modulus was also observed.
Dong and Huang (2014) conducted laboratory studies to compare the
resilient modulus, creep, and temperature dependencies of unbound RAP and
crushed stones. The authors reported that the unbound RAP material had higher
resilient modulus than lime and gravel at an ambient temperature (25°C) and with
similar compaction and gradation specifications. However, the results from
30
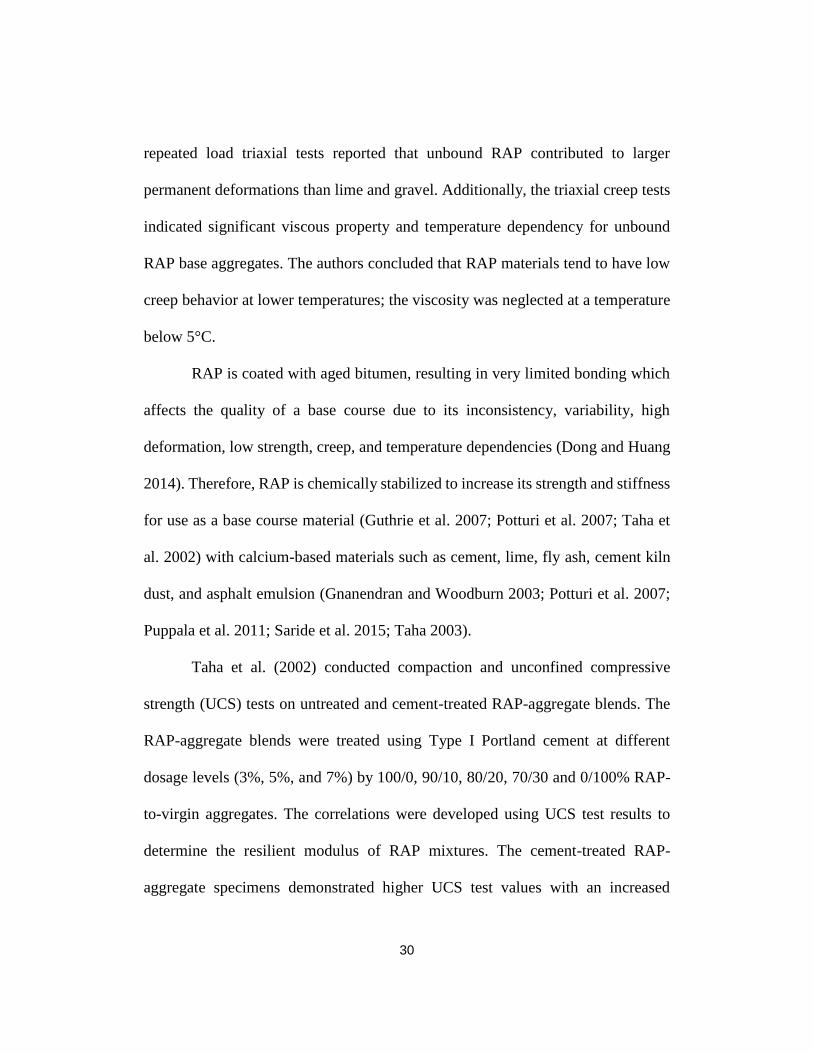
repeated load triaxial tests reported that unbound RAP contributed to larger
permanent deformations than lime and gravel. Additionally, the triaxial creep tests
indicated significant viscous property and temperature dependency for unbound
RAP base aggregates. The authors concluded that RAP materials tend to have low
creep behavior at lower temperatures; the viscosity was neglected at a temperature
below 5°C.
RAP is coated with aged bitumen, resulting in very limited bonding which
affects the quality of a base course due to its inconsistency, variability, high
deformation, low strength, creep, and temperature dependencies (Dong and Huang
2014). Therefore, RAP is chemically stabilized to increase its strength and stiffness
for use as a base course material (Guthrie et al. 2007; Potturi et al. 2007; Taha et
al. 2002) with calcium-based materials such as cement, lime, fly ash, cement kiln
dust, and asphalt emulsion (Gnanendran and Woodburn 2003; Potturi et al. 2007;
Puppala et al. 2011; Saride et al. 2015; Taha 2003).
Taha et al. (2002) conducted compaction and unconfined compressive
strength (UCS) tests on untreated and cement-treated RAP-aggregate blends. The
RAP-aggregate blends were treated using Type I Portland cement at different
dosage levels (3%, 5%, and 7%) by 100/0, 90/10, 80/20, 70/30 and 0/100% RAP-
to-virgin aggregates. The correlations were developed using UCS test results to
determine the resilient modulus of RAP mixtures. The cement-treated RAP-
aggregate specimens demonstrated higher UCS test values with an increased
31
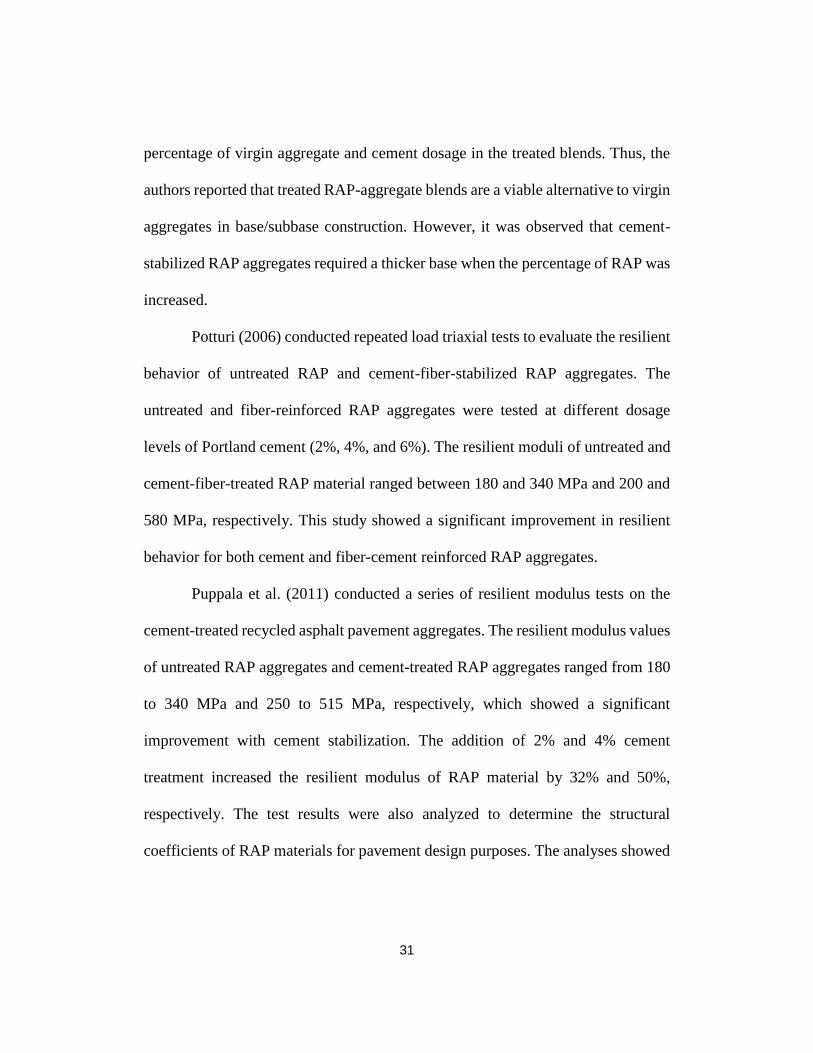
percentage of virgin aggregate and cement dosage in the treated blends. Thus, the
authors reported that treated RAP-aggregate blends are a viable alternative to virgin
aggregates in base/subbase construction. However, it was observed that cement-
stabilized RAP aggregates required a thicker base when the percentage of RAP was
increased.
Potturi (2006) conducted repeated load triaxial tests to evaluate the resilient
behavior of untreated RAP and cement-fiber-stabilized RAP aggregates. The
untreated and fiber-reinforced RAP aggregates were tested at different dosage
levels of Portland cement (2%, 4%, and 6%). The resilient moduli of untreated and
cement-fiber-treated RAP material ranged between 180 and 340 MPa and 200 and
580 MPa, respectively. This study showed a significant improvement in resilient
behavior for both cement and fiber-cement reinforced RAP aggregates.
Puppala et al. (2011) conducted a series of resilient modulus tests on the
cement-treated recycled asphalt pavement aggregates. The resilient modulus values
of untreated RAP aggregates and cement-treated RAP aggregates ranged from 180
to 340 MPa and 250 to 515 MPa, respectively, which showed a significant
improvement with cement stabilization. The addition of 2% and 4% cement
treatment increased the resilient modulus of RAP material by 32% and 50%,
respectively. The test results were also analyzed to determine the structural
coefficients of RAP materials for pavement design purposes. The analyses showed
32
that the structural coefficient increased with an increase in the percentage of cement
and confining pressure.
The resilient modulus of RAP was higher than the virgin aggregates and
usually increased with an increase in the percentage of RAP content in the blends
of RAP-aggregate base materials (Clary et al. 1997, Bennert et al. 2000, Cosentino
et al. 2003, Abdelrahman et al. 2010, Wu, 2011). However, the increase in the
percentage of RAP in the blends of RAP-aggregates induced high permanent
deformations, low strength, and low permeability values. Although, the chemically
treated RAP showed improved performance as base course materials, they required
a thicker base (Taha 2003). Most of the recent studies on geocell-reinforced RAP
bases concluded that they improved the pavement life, strength, and stiffness, and
reduced the thickness of the base layer (Cowland and Wong 1993; Giroud and Han
2004a; Mhaiskar and Mandal 1996). Geocell reinforcement has greatly increased
the bearing capacity, improved the resilient modulus, and reduced the plastic
deformations of the base layer in pavement construction (Chaney et al. 2000; Han
et al. 2011; Pokharel et al. 2011; Thakur et al. 2012; Xie and Yang 2009). However,
limited research has been performed on the behavior and performance of 100%
RAP with the inclusion of geocell reinforcement.
2.3.4 Geocell-Reinforced RAP Bases
Thakur (2010) conducted large-scale laboratory cyclic plate load tests to
investigate the performance of unreinforced and geocell-reinforced RAP bases. The
33
overall dimensions of the test box were 2.2 m × 2.0 m ×2.0 m. Milled RAP material
from City Street in Lawrence, Kansas was used as base material for testing. A
mixture of kaolin and Kansas river sand was used as a subgrade for all of the test
specimens. The Material Testing System (MTS) loading system consisted of a
loading frame, control unit, and hydraulic actuator. Cyclic loads were applied to the
steel loading plate with the hydraulic actuator at a rate of 245 kN on the road
sections in the test box. To represent the load acting on a single wheel, a maximum
load of 40 kN (tire contact pressure of 550 kPa) was used for the cyclic plate loading
test. Test results concluded that the amount of resilient deformation gradually
increased during the initial loading cycles, before reaching a constant value. The
geocell-reinforced RAP base section showed a higher percentage of elastic
deformation than the unreinforced RAP base section, due to the geocell
confinement.
These test results demonstrated that the geocell reinforcement increased the
percentage of resilient deformation and reduced the permanent deformation
compared to unreinforced test sections. The elastic rebound in geocell-reinforced
RAP layers and subgrades was observed to be very low when compared to the
HMA layer. Moreover, the strength of the base and subgrade increased with a
decrease in vertical stresses at the interface, by distributing the load to a wider area.
Han et al. (2011) conducted full-scale accelerated wheel load tests on
unreinforced and NPA-geocell-reinforced RAP bases. Two different types of RAP
34
materials were used in this study as base materials: RAP (reclaimed asphalt
pavement) and FRAP (fractioned reclaimed asphalt pavement). These test sections
showed that geocell reinforcement improved the mechanical properties and
behavior of FRAP in unpaved road construction. The authors revealed that the NPA
geocell reinforcement improved the pavement life of FRAP sections by a factor of
1.3 and 1.8 for reinforced sections with geocell thicknesses of 7 cm and 10 cm,
respectively, as compared to unreinforced test sections. Moreover, stress
distribution angles were increased by 7° and 10° for geocell-reinforced FRAP
sections when compared to those of the unreinforced sections. Therefore, the
authors concluded that vertical stress at the subgrade base interface reduced with
an increasing number of passes for geocell-reinforced FRAP sections, thereby
increasing its performance.
Acharya (2011) conducted a series of cyclic plate loads tests, using the MTS
loading system with a peak load of 40 kN. The NPA geocells of different
thicknesses (15 cm and 23 cm) were used to reinforce the RAP material in the test
sections. The study indicated that the geocell reinforcements showed similar
behaviors, regardless of the thickness. The inclusion of geocell reinforcement
reduced the permanent deformation and increased the life of the pavement by ten
times. Moreover, the applied load was distributed to a wider angle, which resulted
in low compression of the subgrade, RAP base, and HMA surface layers compared
35
to unreinforced sections. The geocell reinforcement acted as a semi-rigid mattress
foundation, thereby increasing the stiffness of the base layer.
2.4 Summary
This chapter presented a literature review on the use of geosynthetics and
recycled asphalt pavement materials in pavement design. Various applications and
functions of geosynthetics were studied in detail. A review of past studies of
geocell-reinforced reclaimed asphalt pavement (RAP) bases and their behavior
under repeated cyclic loading is also included. Major findings from this literature
review are summarized below:
1. Although the use of RAP for road construction is technically and
environmentally a sustainable solution, its use as a base layer in
pavement construction is limited due to the variability of the product
characteristics and strength parameters.
2. Recent studies found that the inclusion of geocell reinforcement in RAP
base layers enhances the strength and stiffness properties of both
unpaved and paved roads.
3. In some studies, the geocell-reinforced bases served as a slab/stiff
mattress foundation and reduced the lateral movement of the base layer.
4. Many studies proved that the inclusion of geocell reinforcement in a
pavement reduced the required base thickness, enhanced the bearing
capacity, and increased the life of the pavement.
36
Chapter 3
Material Properties and Experimental Setup
3.1 Introduction
This chapter presents information about the soils tested and experimental
setups used in this study to determine the resilient properties of geocell-reinforced
RAP base layers. It describes the engineering properties of the soils and how they
were determined, the types of laboratory tests performed, and a description of the
equipment and procedures adopted for the construction of large testing box.
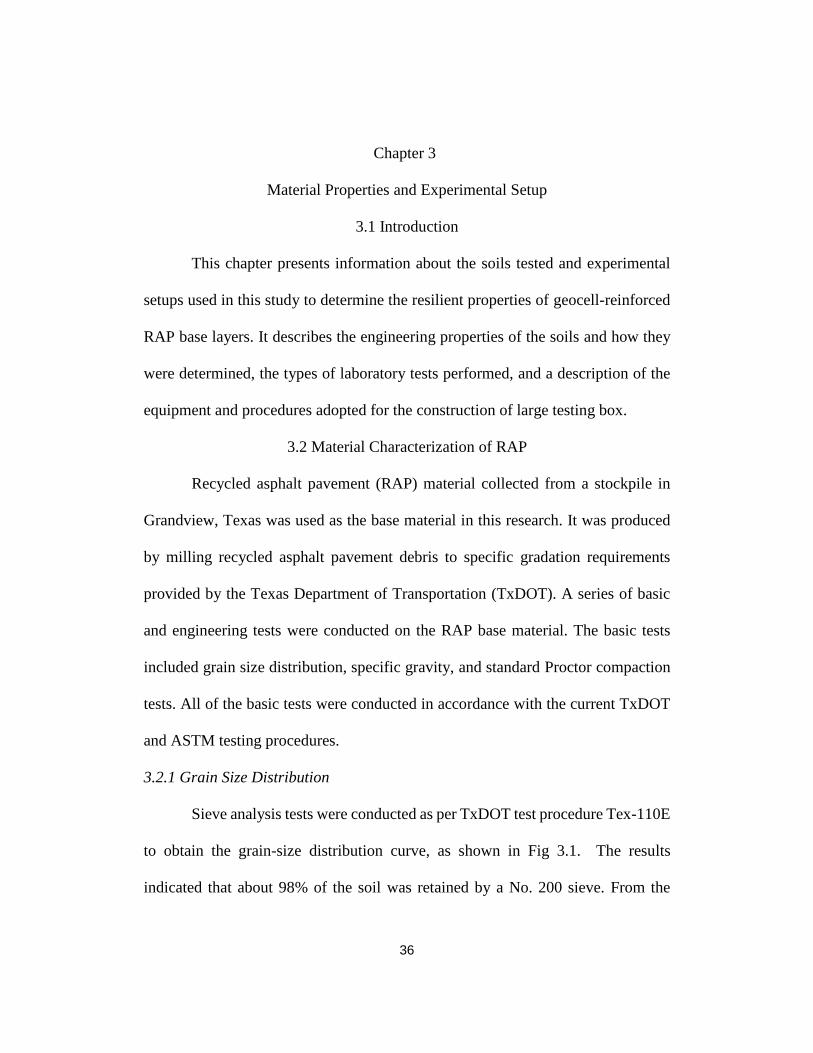
3.2 Material Characterization of RAP
Recycled asphalt pavement (RAP) material collected from a stockpile in
Grandview, Texas was used as the base material in this research. It was produced
by milling recycled asphalt pavement debris to specific gradation requirements
provided by the Texas Department of Transportation (TxDOT). A series of basic
and engineering tests were conducted on the RAP base material. The basic tests
included grain size distribution, specific gravity, and standard Proctor compaction
tests. All of the basic tests were conducted in accordance with the current TxDOT
and ASTM testing procedures.
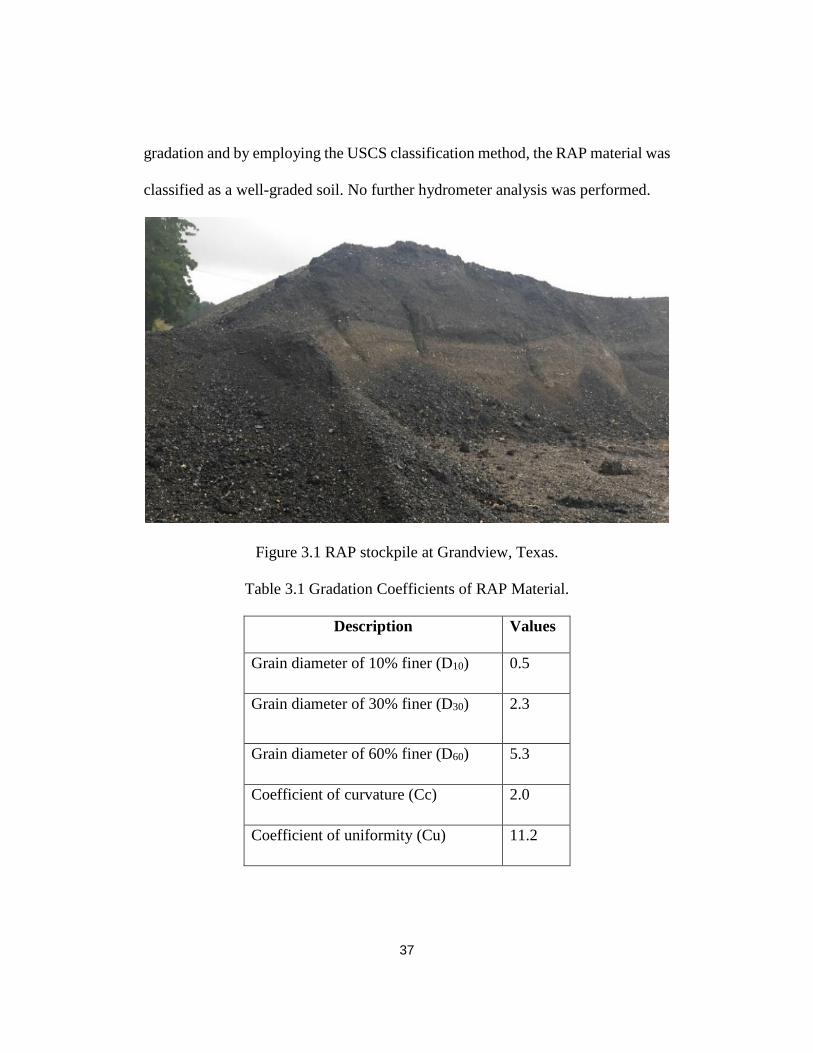
3.2.1 Grain Size Distribution
Sieve analysis tests were conducted as per TxDOT test procedure Tex-110E
to obtain the grain-size distribution curve, as shown in Fig 3.1. The results
indicated that about 98% of the soil was retained by a No. 200 sieve. From the
37
gradation and by employing the USCS classification method, the RAP material was
classified as a well-graded soil. No further hydrometer analysis was performed.
Figure 3.1 RAP stockpile at Grandview, Texas.
Table 3.1 Gradation Coefficients of RAP Material.
Description Values
Grain diameter of 10% finer (D10) 0.5
Grain diameter of 30% finer (D30) 2.3
Grain diameter of 60% finer (D60) 5.3
Coefficient of curvature (Cc) 2.0
Coefficient of uniformity (Cu) 11.2
38
Figure 3.2 Grain size distribution of RAP material
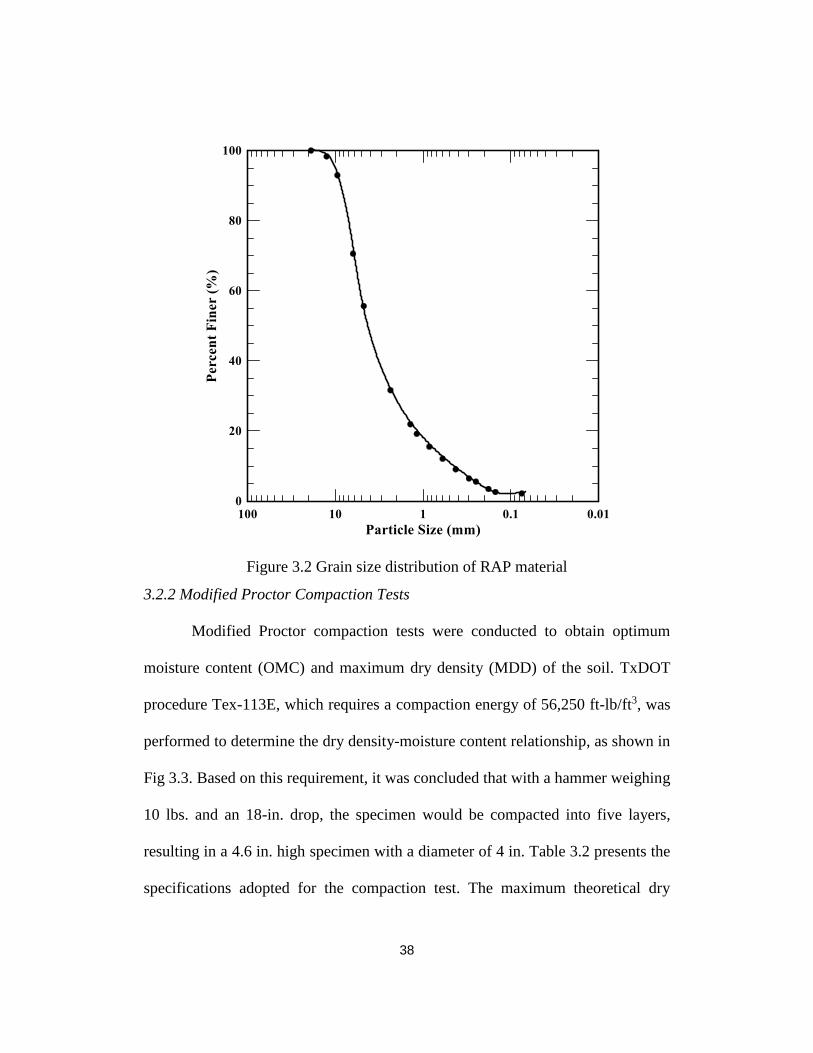
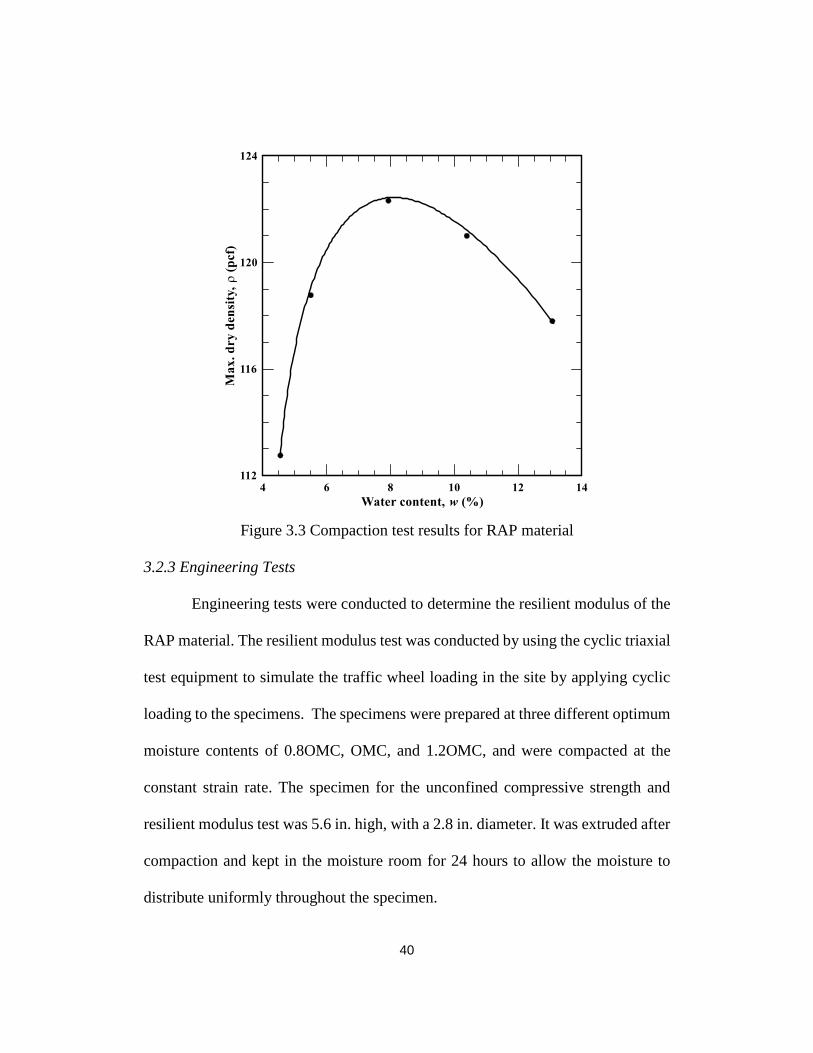
3.2.2 Modified Proctor Compaction Tests
Modified Proctor compaction tests were conducted to obtain optimum
moisture content (OMC) and maximum dry density (MDD) of the soil. TxDOT
procedure Tex-113E, which requires a compaction energy of 56,250 ft-lb/ft3, was
performed to determine the dry density-moisture content relationship, as shown in
Fig 3.3. Based on this requirement, it was concluded that with a hammer weighing
10 lbs. and an 18-in. drop, the specimen would be compacted into five layers,
resulting in a 4.6 in. high specimen with a diameter of 4 in. Table 3.2 presents the
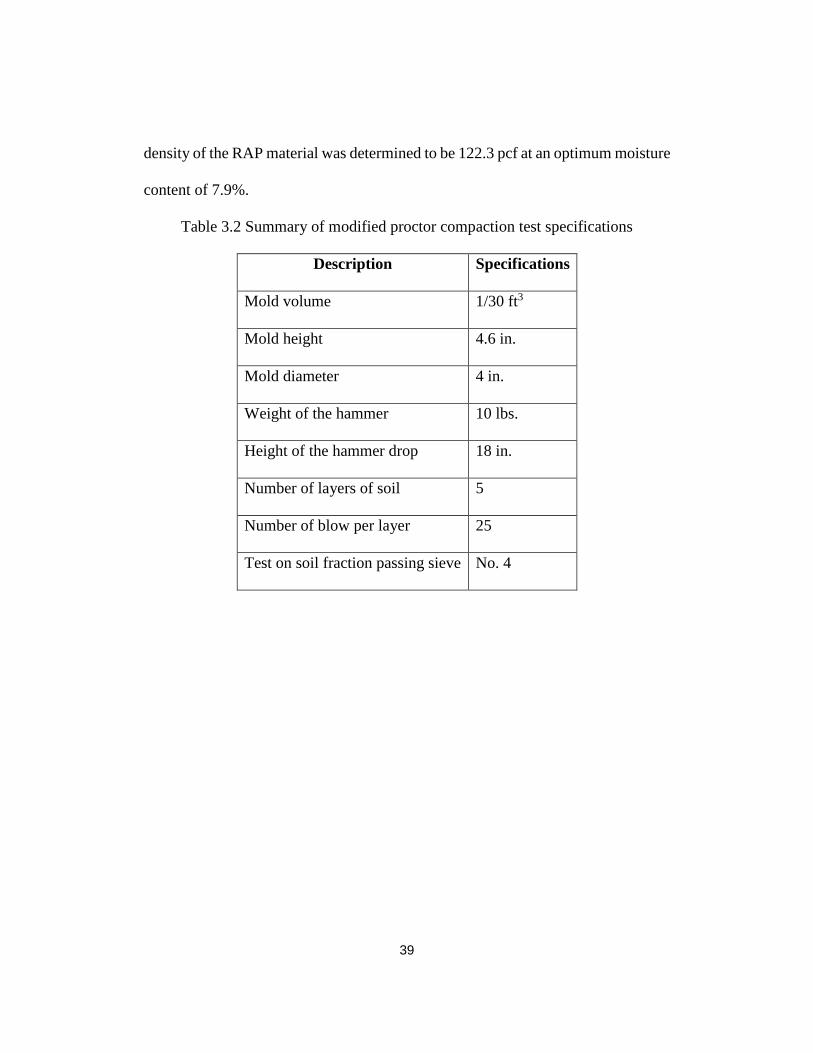
specifications adopted for the compaction test. The maximum theoretical dry
39
density of the RAP material was determined to be 122.3 pcf at an optimum moisture
content of 7.9%.
Table 3.2 Summary of modified proctor compaction test specifications
Description Specifications
Mold volume 1/30 ft3
Mold height 4.6 in.
Mold diameter 4 in.
Weight of the hammer 10 lbs.
Height of the hammer drop 18 in.
Number of layers of soil 5
Number of blow per layer 25
Test on soil fraction passing sieve No. 4
40
Figure 3.3 Compaction test results for RAP material
3.2.3 Engineering Tests
Engineering tests were conducted to determine the resilient modulus of the
RAP material. The resilient modulus test was conducted by using the cyclic triaxial
test equipment to simulate the traffic wheel loading in the site by applying cyclic
loading to the specimens. The specimens were prepared at three different optimum
moisture contents of 0.8OMC, OMC, and 1.2OMC, and were compacted at the
constant strain rate. The specimen for the unconfined compressive strength and
resilient modulus test was 5.6 in. high, with a 2.8 in. diameter. It was extruded after
compaction and kept in the moisture room for 24 hours to allow the moisture to
distribute uniformly throughout the specimen.
41
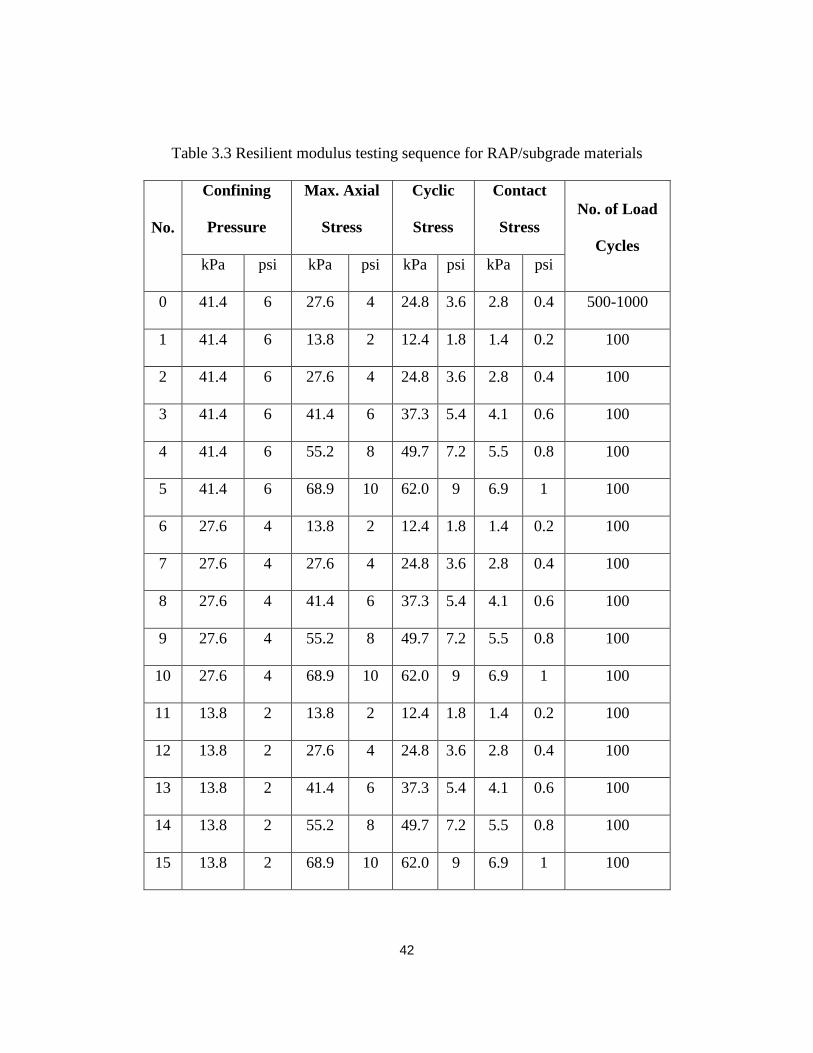
The resilient modulus tests were conducted using the cyclic triaxial test
equipment, which is designed to simulate the traffic wheel loading on in-situ soils
by applying a sequence of repeated cyclic loading on the soil specimens. The tests
were performed in accordance with AASHTO Designation T 307-99, the standard
method of testing for determining the resilient modulus of soils and aggregate
materials. The stress levels were based upon the location of the specimen within
the pavement structure, as standardized by AASHTO. The testing sequence for
subgrade soils shown in Table 3.3 was employed. The confining pressure typically
represents overburden pressure of the specimen location in subgrade. The axial
deviatoric stress has two components: cyclic stress, which is the applied deviatoric
stress, and a contact stress, which typically represents the seating load on the soil
specimen. The contact stress is typically equivalent to 10% of the overall maximum
axial stress.
42
Table 3.3 Resilient modulus testing sequence for RAP/subgrade materials
No.
Confining
Pressure
Max. Axial
Stress
Cyclic
Stress
Contact
Stress
No. of Load
Cycles
kPa psi kPa psi kPa psi kPa psi
0 41.4 6 27.6 4 24.8 3.6 2.8 0.4 500-1000
1 41.4 6 13.8 2 12.4 1.8 1.4 0.2 100
2 41.4 6 27.6 4 24.8 3.6 2.8 0.4 100
3 41.4 6 41.4 6 37.3 5.4 4.1 0.6 100
4 41.4 6 55.2 8 49.7 7.2 5.5 0.8 100
5 41.4 6 68.9 10 62.0 9 6.9 1 100
6 27.6 4 13.8 2 12.4 1.8 1.4 0.2 100
7 27.6 4 27.6 4 24.8 3.6 2.8 0.4 100
8 27.6 4 41.4 6 37.3 5.4 4.1 0.6 100
9 27.6 4 55.2 8 49.7 7.2 5.5 0.8 100
10 27.6 4 68.9 10 62.0 9 6.9 1 100
11 13.8 2 13.8 2 12.4 1.8 1.4 0.2 100
12 13.8 2 27.6 4 24.8 3.6 2.8 0.4 100
13 13.8 2 41.4 6 37.3 5.4 4.1 0.6 100
14 13.8 2 55.2 8 49.7 7.2 5.5 0.8 100
15 13.8 2 68.9 10 62.0 9 6.9 1 100
43
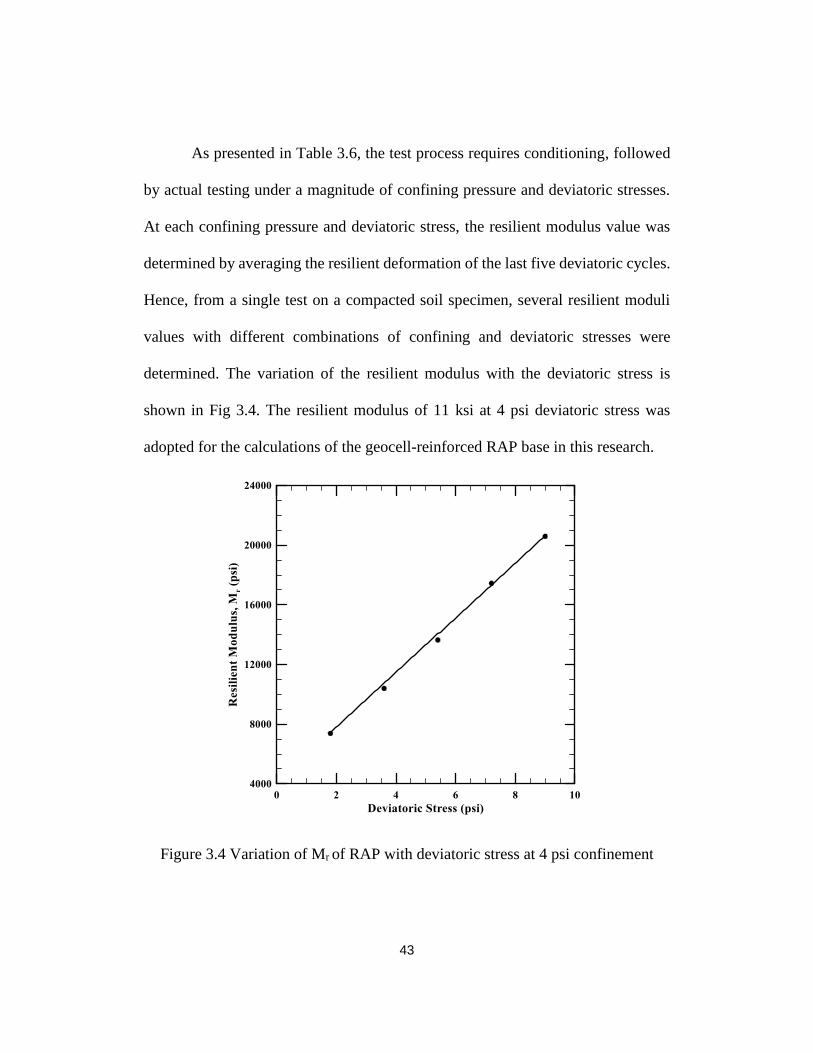
As presented in Table 3.6, the test process requires conditioning, followed
by actual testing under a magnitude of confining pressure and deviatoric stresses.
At each confining pressure and deviatoric stress, the resilient modulus value was
determined by averaging the resilient deformation of the last five deviatoric cycles.
Hence, from a single test on a compacted soil specimen, several resilient moduli
values with different combinations of confining and deviatoric stresses were
determined. The variation of the resilient modulus with the deviatoric stress is
shown in Fig 3.4. The resilient modulus of 11 ksi at 4 psi deviatoric stress was
adopted for the calculations of the geocell-reinforced RAP base in this research.
Figure 3.4 Variation of Mr of RAP with deviatoric stress at 4 psi confinement
44
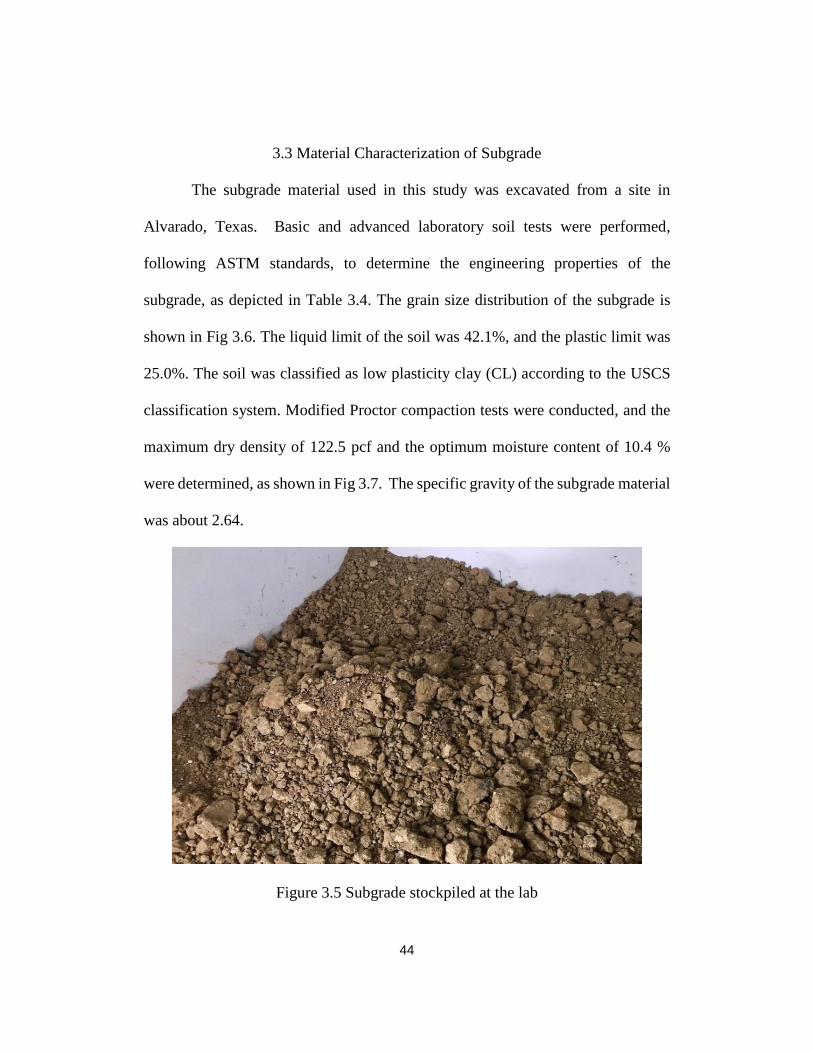
3.3 Material Characterization of Subgrade
The subgrade material used in this study was excavated from a site in
Alvarado, Texas. Basic and advanced laboratory soil tests were performed,
following ASTM standards, to determine the engineering properties of the
subgrade, as depicted in Table 3.4. The grain size distribution of the subgrade is
shown in Fig 3.6. The liquid limit of the soil was 42.1%, and the plastic limit was
25.0%. The soil was classified as low plasticity clay (CL) according to the USCS
classification system. Modified Proctor compaction tests were conducted, and the
maximum dry density of 122.5 pcf and the optimum moisture content of 10.4 %
were determined, as shown in Fig 3.7. The specific gravity of the subgrade material
was about 2.64.
Figure 3.5 Subgrade stockpiled at the lab
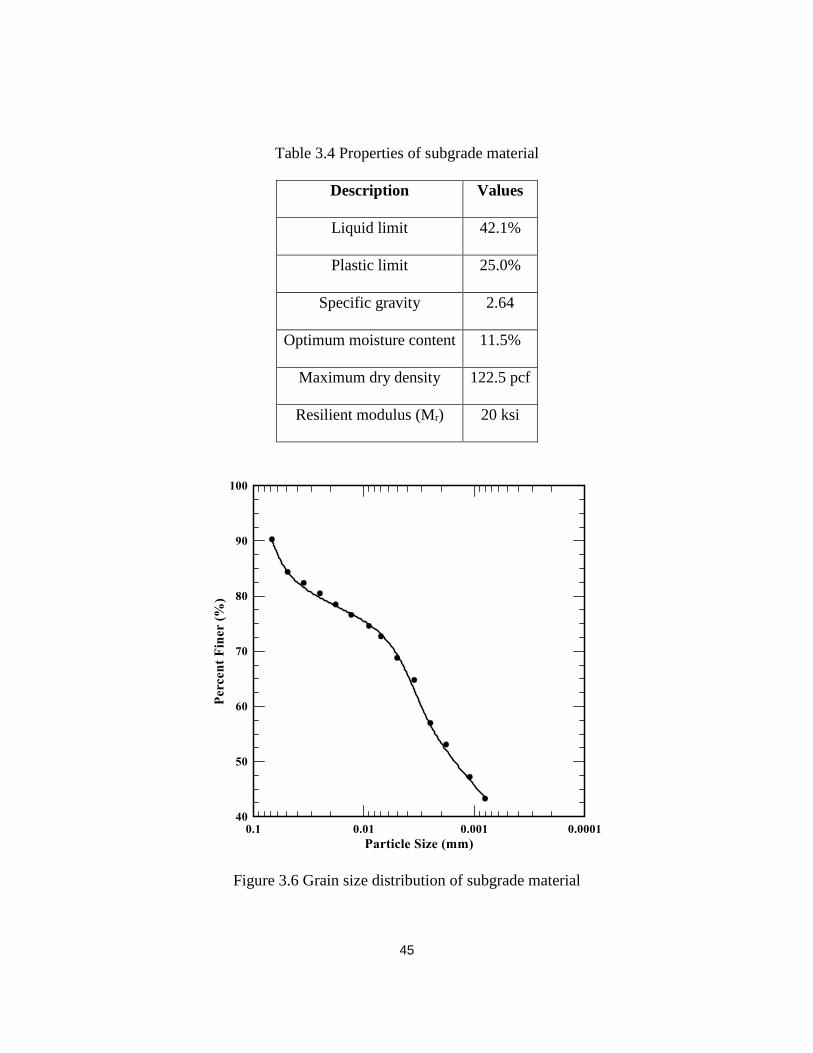
45
Table 3.4 Properties of subgrade material
Description Values
Liquid limit 42.1%
Plastic limit 25.0%
Specific gravity 2.64
Optimum moisture content 11.5%
Maximum dry density 122.5 pcf
Resilient modulus (Mr) 20 ksi
Figure 3.6 Grain size distribution of subgrade material
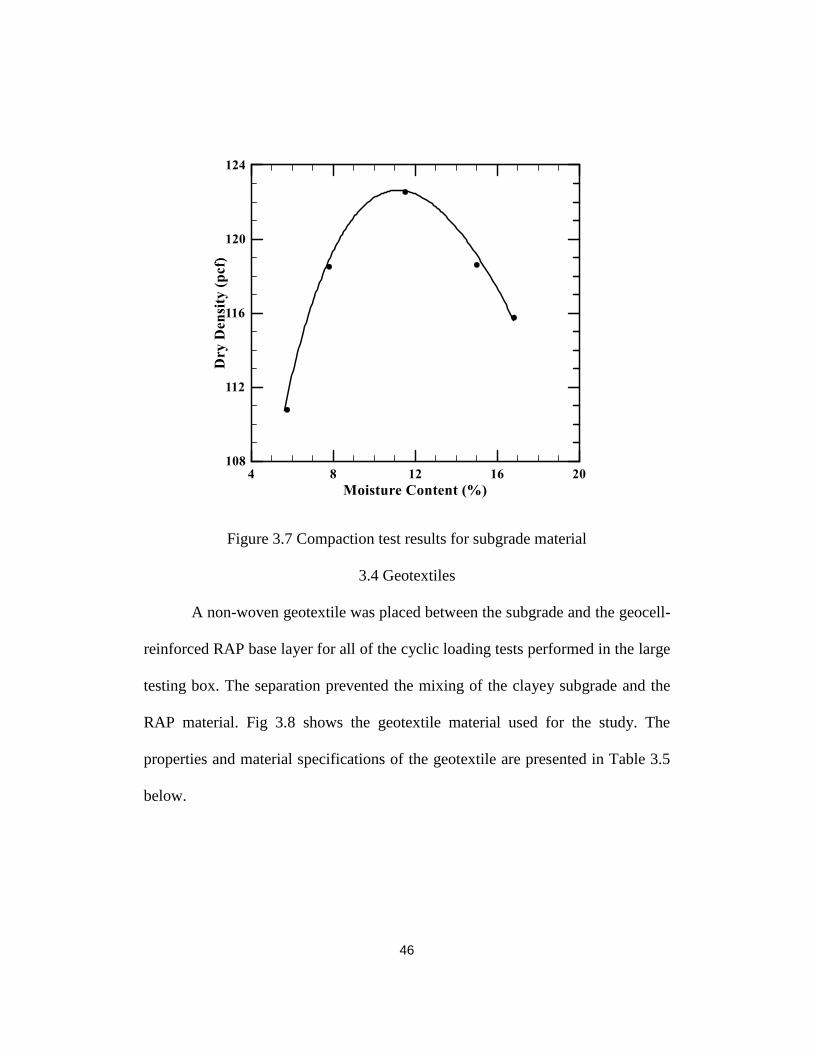
46
Figure 3.7 Compaction test results for subgrade material
3.4 Geotextiles
A non-woven geotextile was placed between the subgrade and the geocell-
reinforced RAP base layer for all of the cyclic loading tests performed in the large
testing box. The separation prevented the mixing of the clayey subgrade and the
RAP material. Fig 3.8 shows the geotextile material used for the study. The
properties and material specifications of the geotextile are presented in Table 3.5
below.
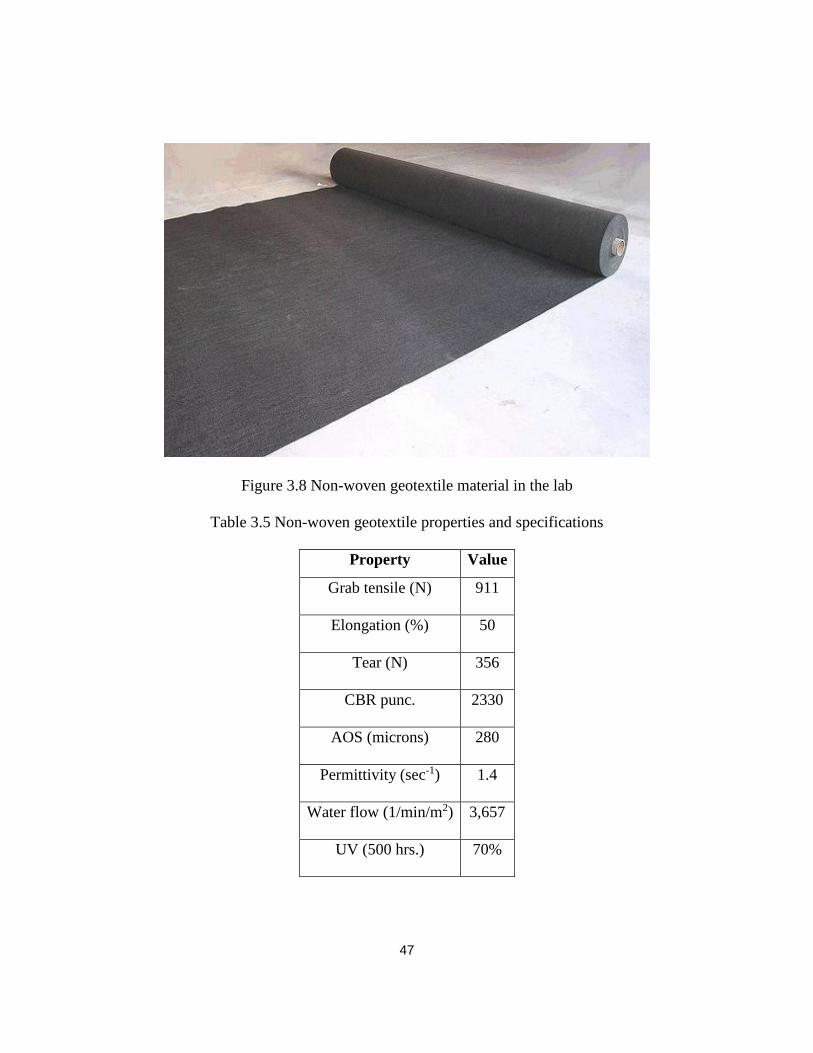
47
Figure 3.8 Non-woven geotextile material in the lab
Table 3.5 Non-woven geotextile properties and specifications
Property Value
Grab tensile (N) 911
Elongation (%) 50
Tear (N) 356
CBR punc. 2330
AOS (microns) 280
Permittivity (sec-1) 1.4
Water flow (1/min/m2) 3,657
UV (500 hrs.) 70%
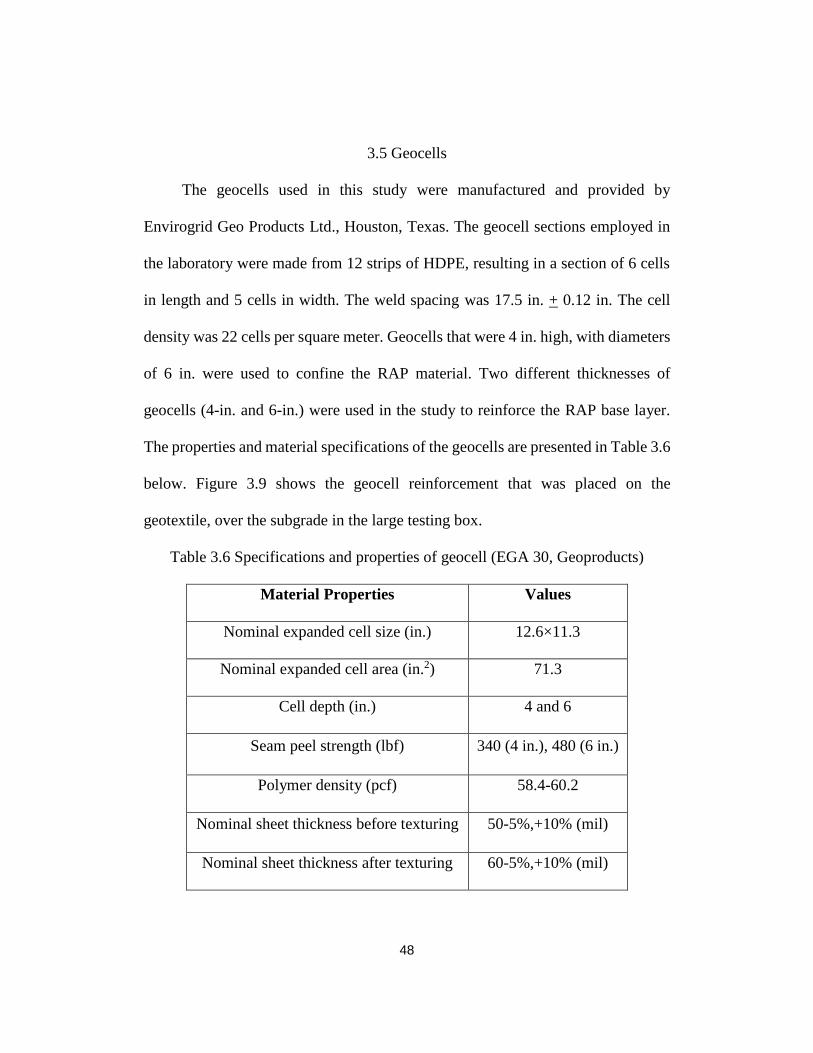
48
3.5 Geocells
The geocells used in this study were manufactured and provided by
Envirogrid Geo Products Ltd., Houston, Texas. The geocell sections employed in
the laboratory were made from 12 strips of HDPE, resulting in a section of 6 cells
in length and 5 cells in width. The weld spacing was 17.5 in. + 0.12 in. The cell
density was 22 cells per square meter. Geocells that were 4 in. high, with diameters
of 6 in. were used to confine the RAP material. Two different thicknesses of
geocells (4-in. and 6-in.) were used in the study to reinforce the RAP base layer.
The properties and material specifications of the geocells are presented in Table 3.6
below. Figure 3.9 shows the geocell reinforcement that was placed on the
geotextile, over the subgrade in the large testing box.
Table 3.6 Specifications and properties of geocell (EGA 30, Geoproducts)
Material Properties Values
Nominal expanded cell size (in.) 12.6×11.3
Nominal expanded cell area (in.2) 71.3
Cell depth (in.) 4 and 6
Seam peel strength (lbf) 340 (4 in.), 480 (6 in.)
Polymer density (pcf) 58.4-60.2
Nominal sheet thickness before texturing 50-5%,+10% (mil)
Nominal sheet thickness after texturing 60-5%,+10% (mil)
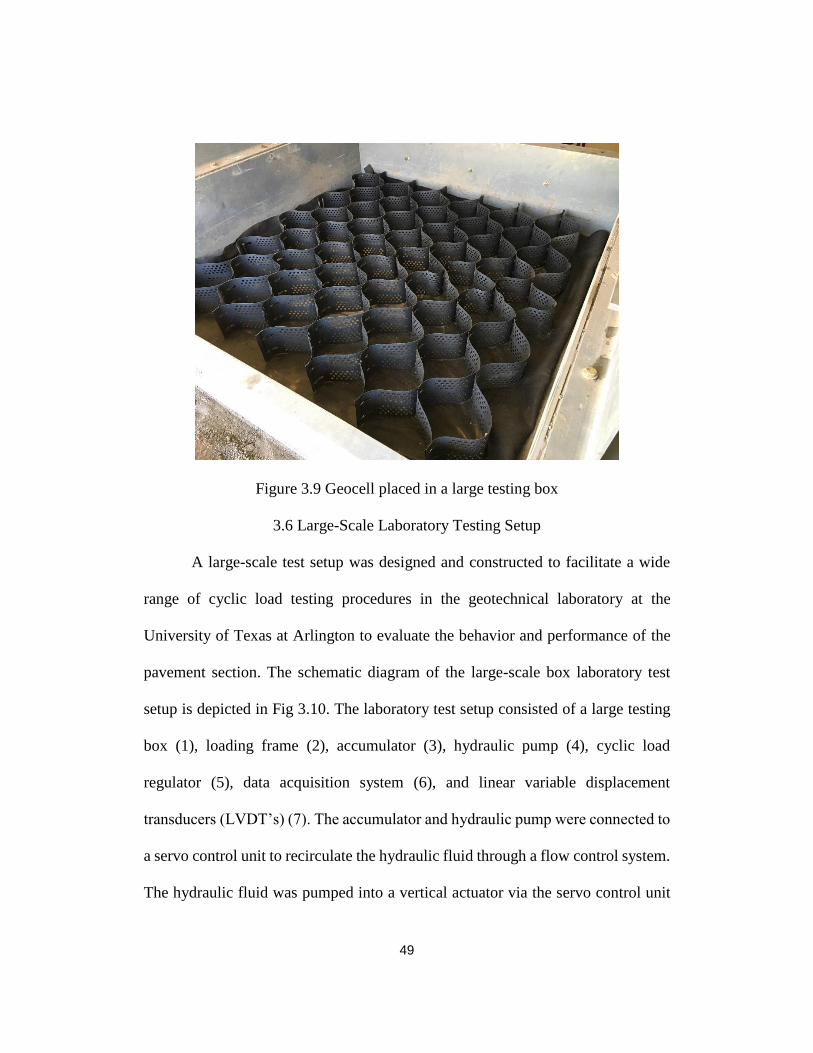
49
Figure 3.9 Geocell placed in a large testing box
3.6 Large-Scale Laboratory Testing Setup
A large-scale test setup was designed and constructed to facilitate a wide
range of cyclic load testing procedures in the geotechnical laboratory at the
University of Texas at Arlington to evaluate the behavior and performance of the
pavement section. The schematic diagram of the large-scale box laboratory test
setup is depicted in Fig 3.10. The laboratory test setup consisted of a large testing
box (1), loading frame (2), accumulator (3), hydraulic pump (4), cyclic load
regulator (5), data acquisition system (6), and linear variable displacement
transducers (LVDT’s) (7). The accumulator and hydraulic pump were connected to
a servo control unit to recirculate the hydraulic fluid through a flow control system.
The hydraulic fluid was pumped into a vertical actuator via the servo control unit
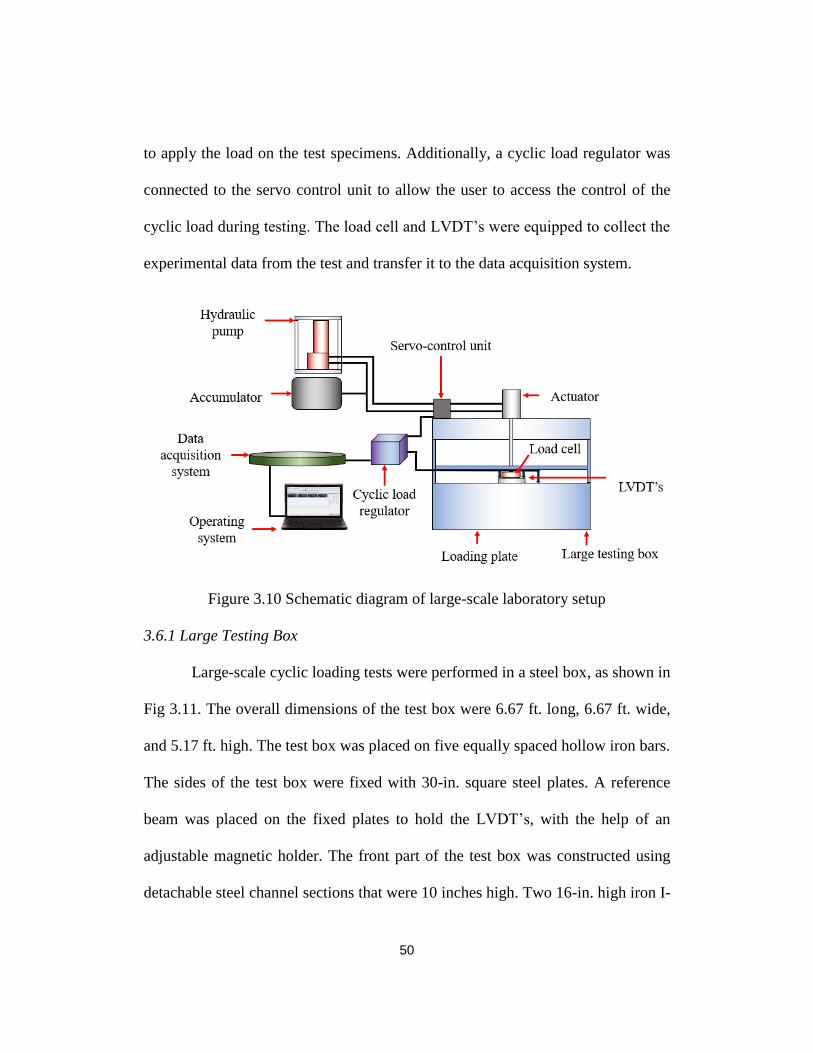
50
to apply the load on the test specimens. Additionally, a cyclic load regulator was
connected to the servo control unit to allow the user to access the control of the
cyclic load during testing. The load cell and LVDT’s were equipped to collect the
experimental data from the test and transfer it to the data acquisition system.
Figure 3.10 Schematic diagram of large-scale laboratory setup
3.6.1 Large Testing Box
Large-scale cyclic loading tests were performed in a steel box, as shown in
Fig 3.11. The overall dimensions of the test box were 6.67 ft. long, 6.67 ft. wide,
and 5.17 ft. high. The test box was placed on five equally spaced hollow iron bars.
The sides of the test box were fixed with 30-in. square steel plates. A reference
beam was placed on the fixed plates to hold the LVDT’s, with the help of an
adjustable magnetic holder. The front part of the test box was constructed using
detachable steel channel sections that were 10 inches high. Two 16-in. high iron I-
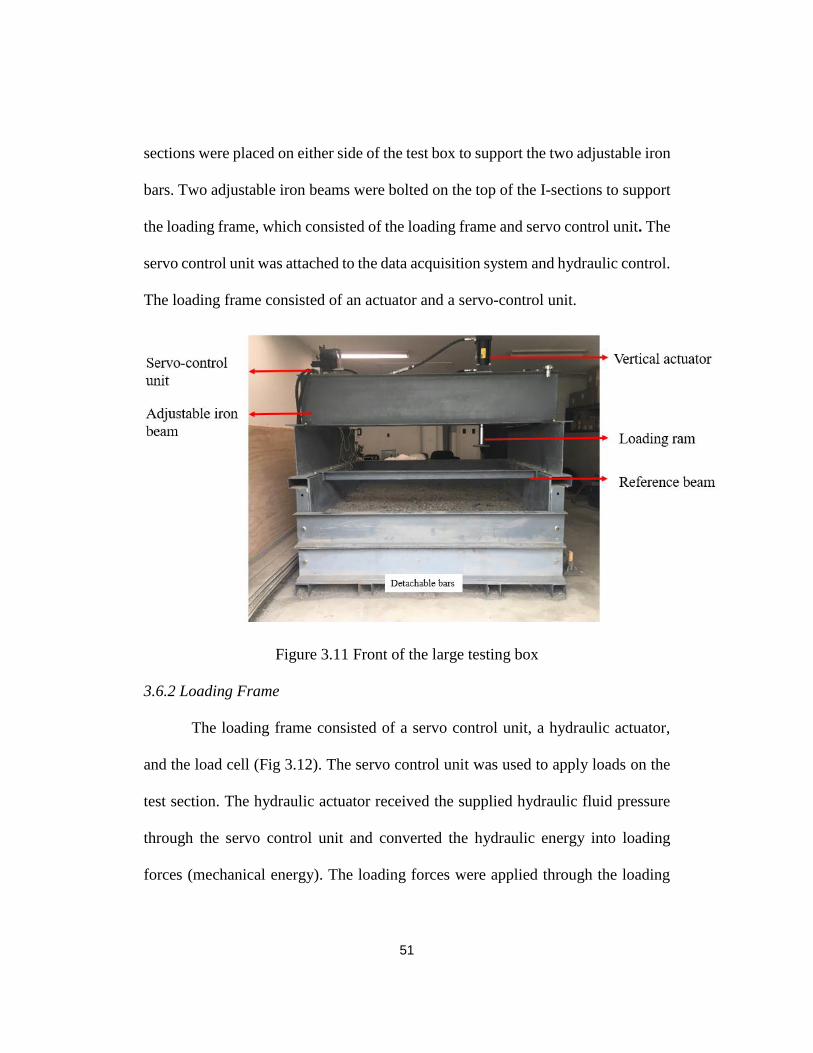
51
sections were placed on either side of the test box to support the two adjustable iron
bars. Two adjustable iron beams were bolted on the top of the I-sections to support
the loading frame, which consisted of the loading frame and servo control unit. The
servo control unit was attached to the data acquisition system and hydraulic control.
The loading frame consisted of an actuator and a servo-control unit.
Figure 3.11 Front of the large testing box
3.6.2 Loading Frame
The loading frame consisted of a servo control unit, a hydraulic actuator,
and the load cell (Fig 3.12). The servo control unit was used to apply loads on the
test section. The hydraulic actuator received the supplied hydraulic fluid pressure
through the servo control unit and converted the hydraulic energy into loading
forces (mechanical energy). The loading forces were applied through the loading
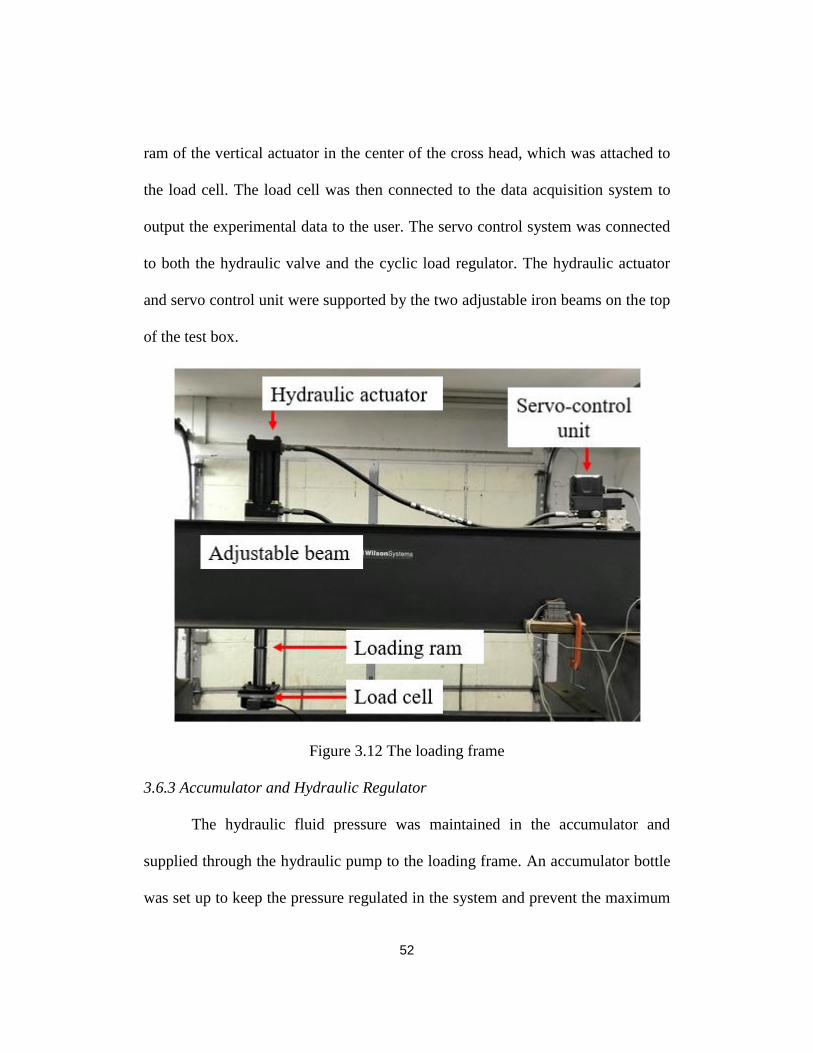
52
ram of the vertical actuator in the center of the cross head, which was attached to
the load cell. The load cell was then connected to the data acquisition system to
output the experimental data to the user. The servo control system was connected
to both the hydraulic valve and the cyclic load regulator. The hydraulic actuator
and servo control unit were supported by the two adjustable iron beams on the top
of the test box.
Figure 3.12 The loading frame
3.6.3 Accumulator and Hydraulic Regulator
The hydraulic fluid pressure was maintained in the accumulator and
supplied through the hydraulic pump to the loading frame. An accumulator bottle
was set up to keep the pressure regulated in the system and prevent the maximum
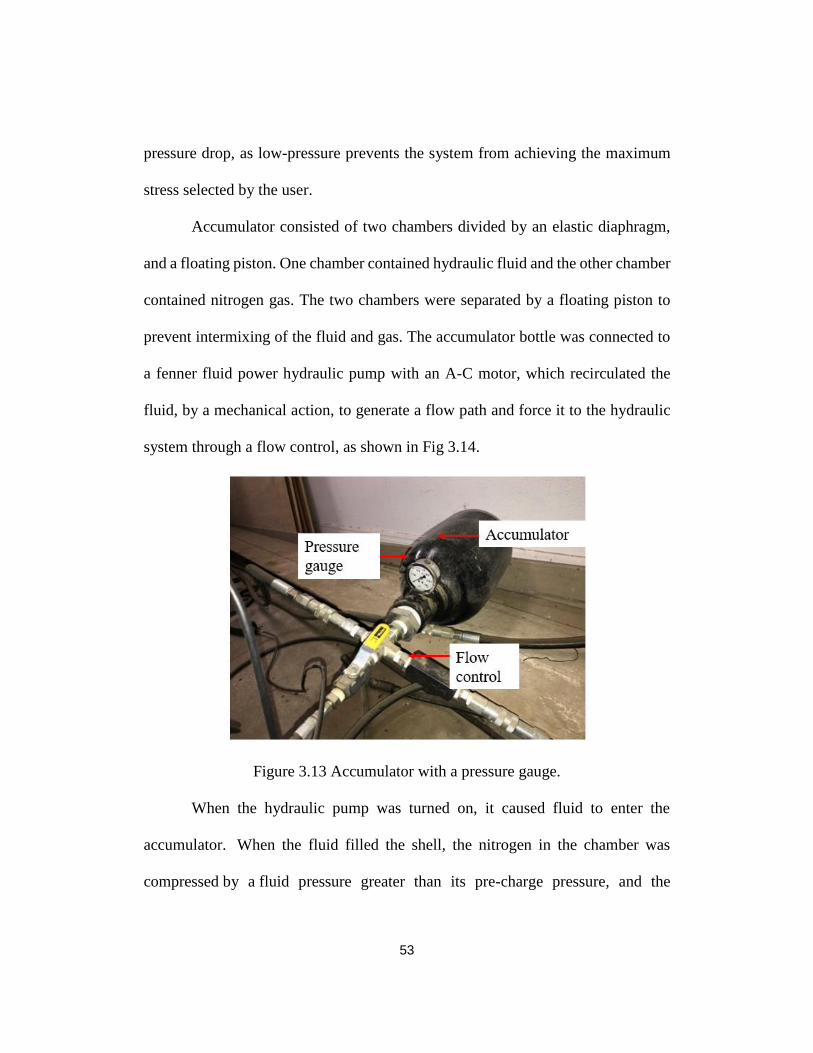
53
pressure drop, as low-pressure prevents the system from achieving the maximum
stress selected by the user.
Accumulator consisted of two chambers divided by an elastic diaphragm,
and a floating piston. One chamber contained hydraulic fluid and the other chamber
contained nitrogen gas. The two chambers were separated by a floating piston to
prevent intermixing of the fluid and gas. The accumulator bottle was connected to
a fenner fluid power hydraulic pump with an A-C motor, which recirculated the
fluid, by a mechanical action, to generate a flow path and force it to the hydraulic
system through a flow control, as shown in Fig 3.14.
Figure 3.13 Accumulator with a pressure gauge.
When the hydraulic pump was turned on, it caused fluid to enter the
accumulator. When the fluid filled the shell, the nitrogen in the chamber was
compressed by a fluid pressure greater than its pre-charge pressure, and the
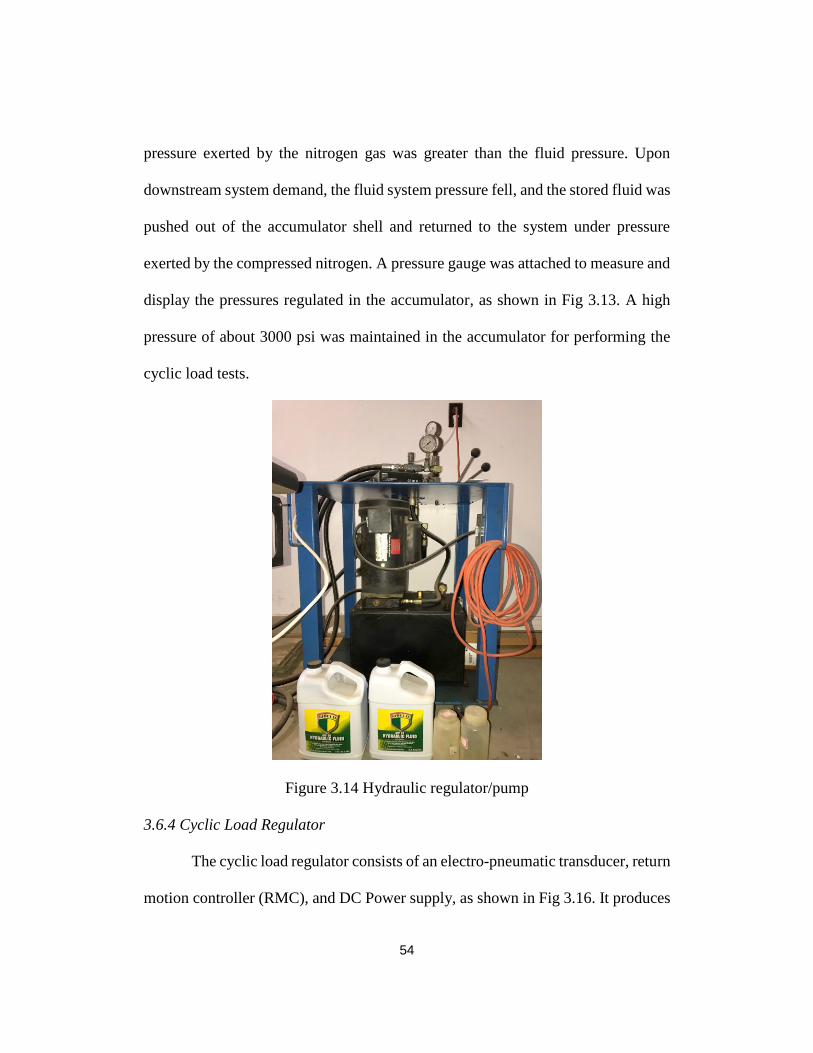
54
pressure exerted by the nitrogen gas was greater than the fluid pressure. Upon
downstream system demand, the fluid system pressure fell, and the stored fluid was
pushed out of the accumulator shell and returned to the system under pressure
exerted by the compressed nitrogen. A pressure gauge was attached to measure and
display the pressures regulated in the accumulator, as shown in Fig 3.13. A high
pressure of about 3000 psi was maintained in the accumulator for performing the
cyclic load tests.
Figure 3.14 Hydraulic regulator/pump
3.6.4 Cyclic Load Regulator
The cyclic load regulator consists of an electro-pneumatic transducer, return
motion controller (RMC), and DC Power supply, as shown in Fig 3.16. It produces
55
an electronic signal to the electro-pneumatic transducer, which helps to balance the
forces. The force produced by the output pressure over the area of the loading plate
balances the force developed on the input coil by the interaction of the
electromagnetic field and the input current. The increase in the input current causes
a downward thrust, increasing output pressure; thereby, the DC output is directly
proportional to the down thrust. The RMC70 series one-axis and two-axis motion
controllers regulate the frequency, the waveform, position, and magnitude of the
system. The RMC70 series is a command-based program with two power control
modes, including dual-loop-position-pressure algorithms and multiple feedback
types.
Feedback is often used for position and speed control. A cyclic load
regulator can support execution of multiple programs simultaneously and connects
directly to an Ethernet network, and force sensors. For this research, the cyclic
regulator was connected with RMC software installed in the Windows operating
system (OS) to allow the user to control the test. The RMC gives the operator the
option to start or stop the test at the same load. This was done with the motion
controllers and according to the feedback from the position and pressure sensors.
The RMC then controlled the servo proportional valve to eliminate banging and
bottoming out at the end of the cylinders. The cyclic load wave had an initial period
of 0.1 second, when the 200 lbf was maintained constant, followed by a load
increase from 200 lbf to 2250 lbf over a period of 3.9 seconds. Subsequently, the
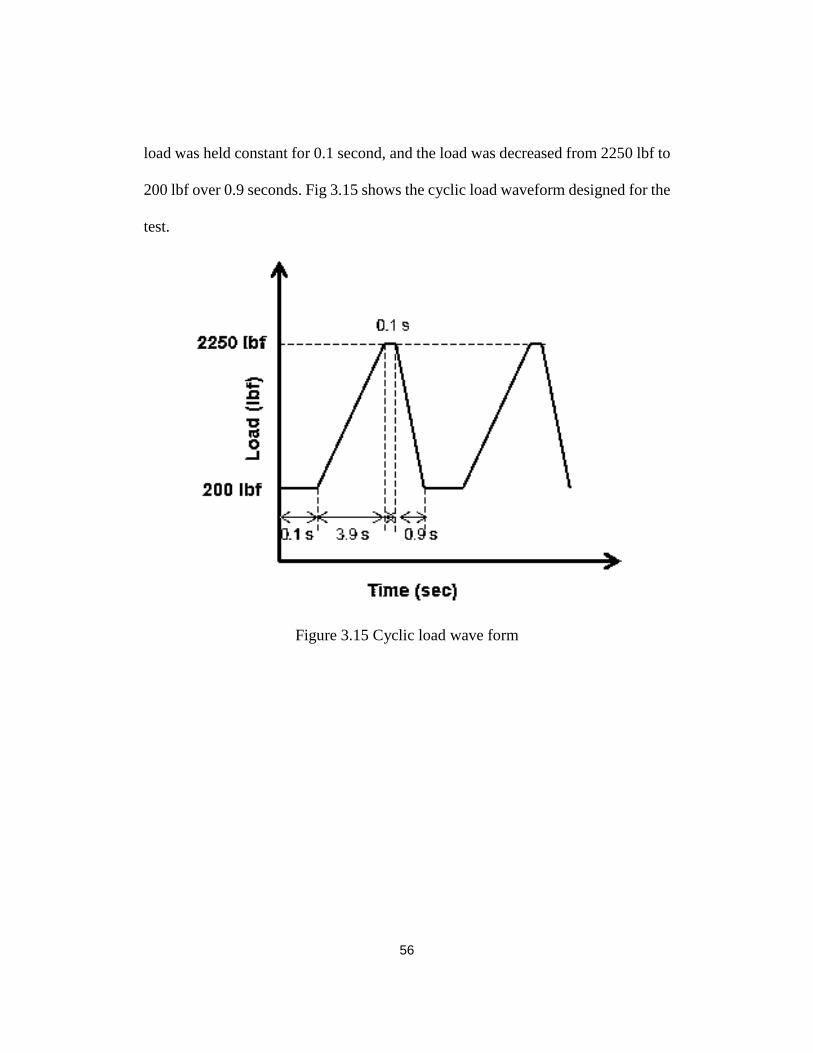
56
load was held constant for 0.1 second, and the load was decreased from 2250 lbf to
200 lbf over 0.9 seconds. Fig 3.15 shows the cyclic load waveform designed for the
test.
Figure 3.15 Cyclic load wave form
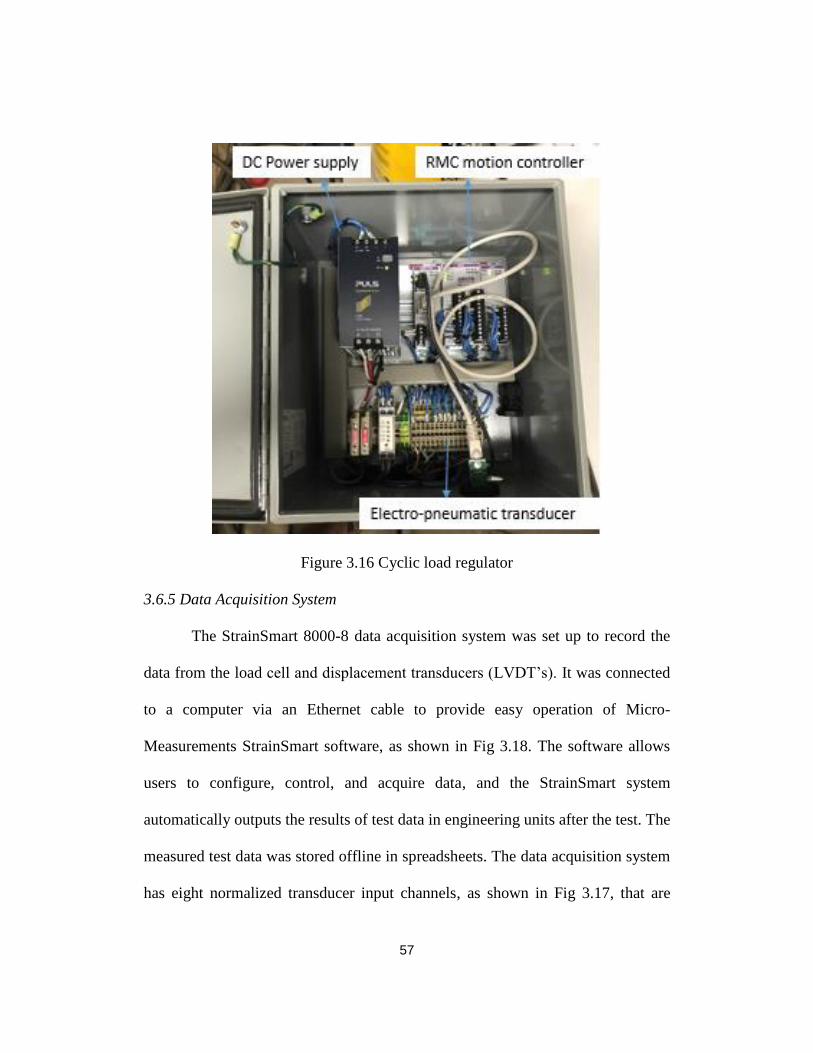
57
Figure 3.16 Cyclic load regulator
3.6.5 Data Acquisition System
The StrainSmart 8000-8 data acquisition system was set up to record the
data from the load cell and displacement transducers (LVDT’s). It was connected
to a computer via an Ethernet cable to provide easy operation of Micro-
Measurements StrainSmart software, as shown in Fig 3.18. The software allows
users to configure, control, and acquire data, and the StrainSmart system
automatically outputs the results of test data in engineering units after the test. The
measured test data was stored offline in spreadsheets. The data acquisition system
has eight normalized transducer input channels, as shown in Fig 3.17, that are
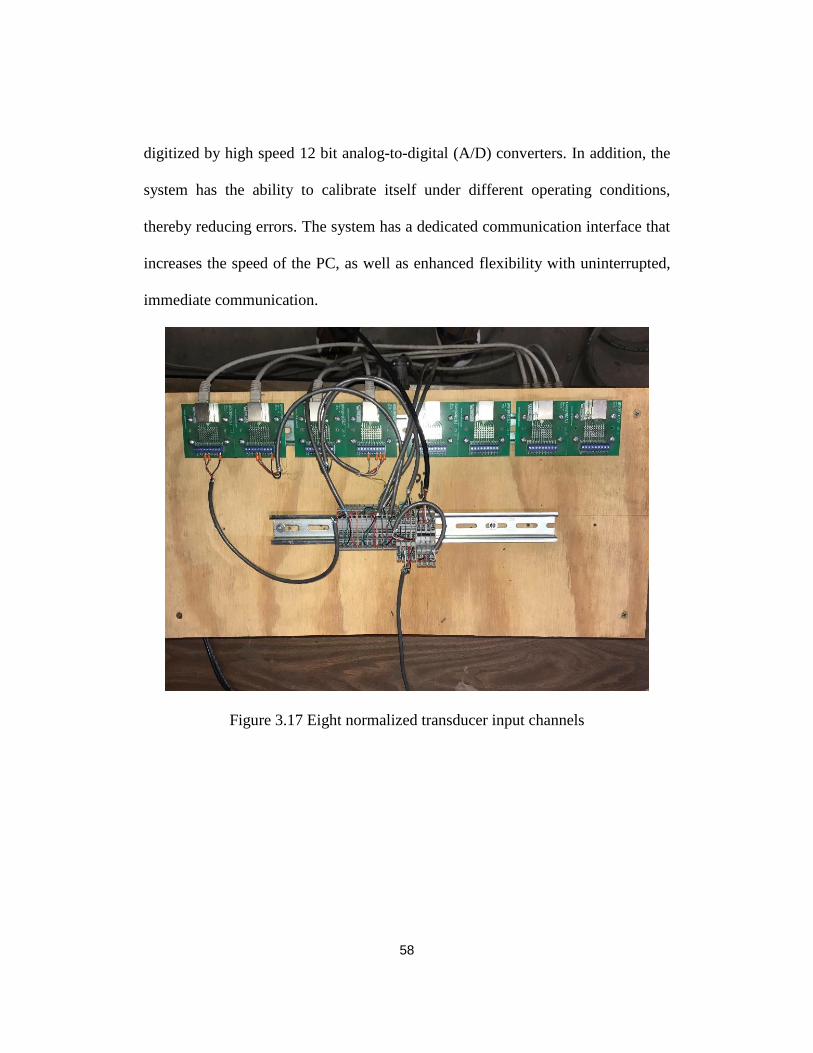
58
digitized by high speed 12 bit analog-to-digital (A/D) converters. In addition, the
system has the ability to calibrate itself under different operating conditions,
thereby reducing errors. The system has a dedicated communication interface that
increases the speed of the PC, as well as enhanced flexibility with uninterrupted,
immediate communication.
Figure 3.17 Eight normalized transducer input channels
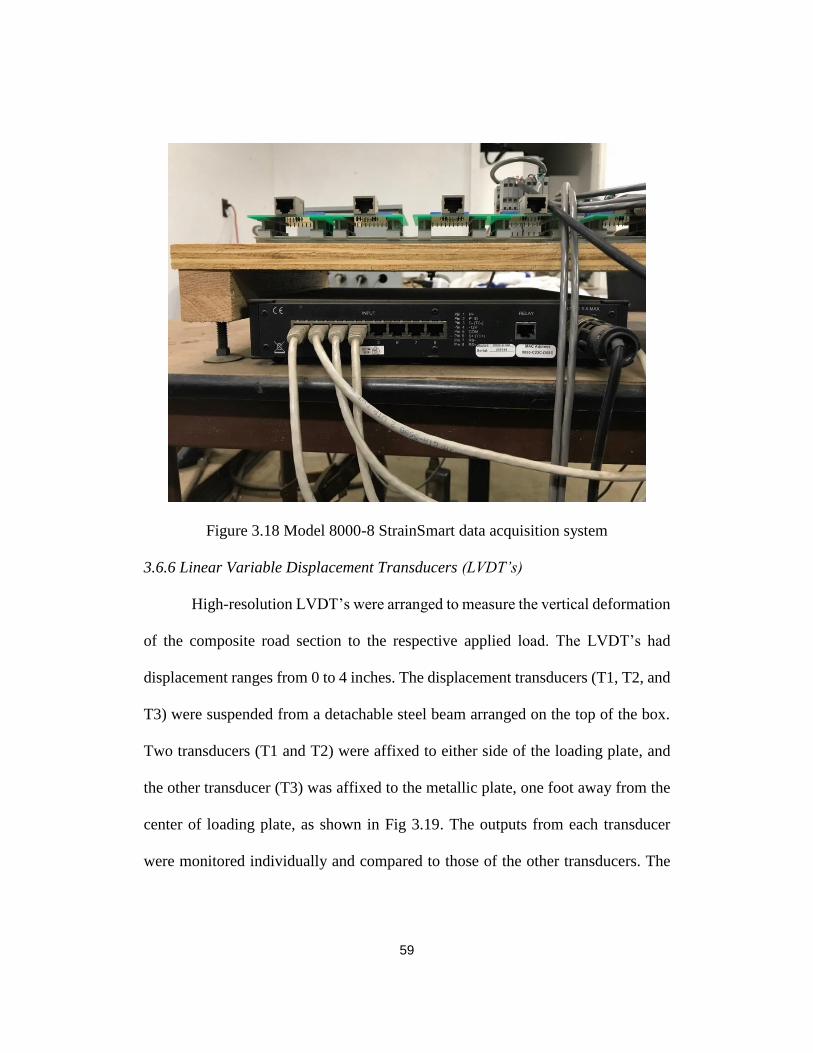
59
Figure 3.18 Model 8000-8 StrainSmart data acquisition system
3.6.6 Linear Variable Displacement Transducers (LVDT’s)
High-resolution LVDT’s were arranged to measure the vertical deformation
of the composite road section to the respective applied load. The LVDT’s had
displacement ranges from 0 to 4 inches. The displacement transducers (T1, T2, and
T3) were suspended from a detachable steel beam arranged on the top of the box.
Two transducers (T1 and T2) were affixed to either side of the loading plate, and
the other transducer (T3) was affixed to the metallic plate, one foot away from the
center of loading plate, as shown in Fig 3.19. The outputs from each transducer
were monitored individually and compared to those of the other transducers. The
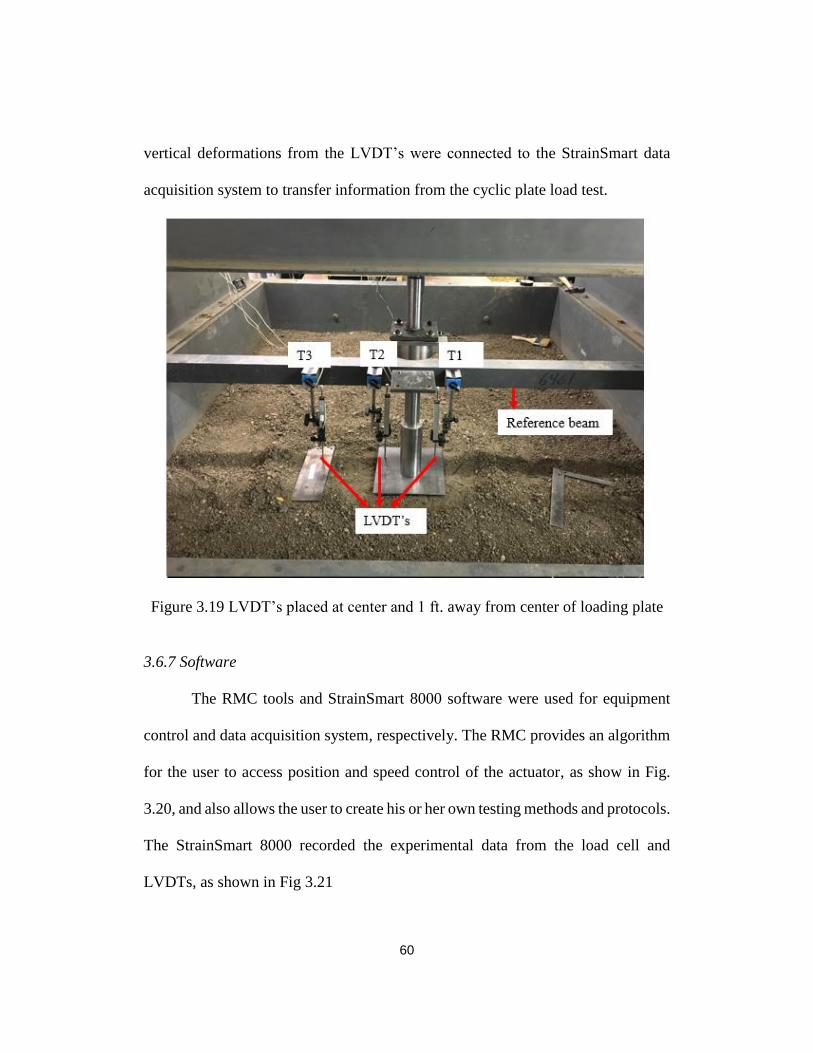
60
vertical deformations from the LVDT’s were connected to the StrainSmart data
acquisition system to transfer information from the cyclic plate load test.
Figure 3.19 LVDT’s placed at center and 1 ft. away from center of loading plate
3.6.7 Software
The RMC tools and StrainSmart 8000 software were used for equipment
control and data acquisition system, respectively. The RMC provides an algorithm
for the user to access position and speed control of the actuator, as show in Fig.
3.20, and also allows the user to create his or her own testing methods and protocols.
The StrainSmart 8000 recorded the experimental data from the load cell and
LVDTs, as shown in Fig 3.21
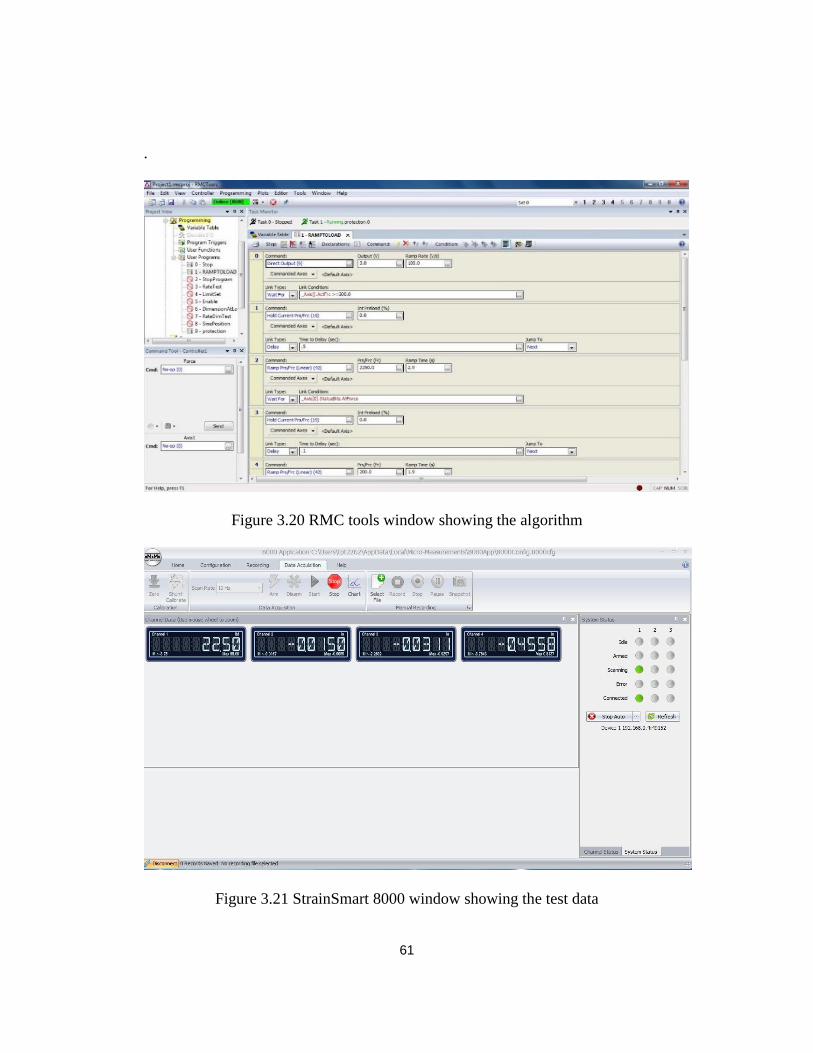
61
.
Figure 3.20 RMC tools window showing the algorithm
Figure 3.21 StrainSmart 8000 window showing the test data
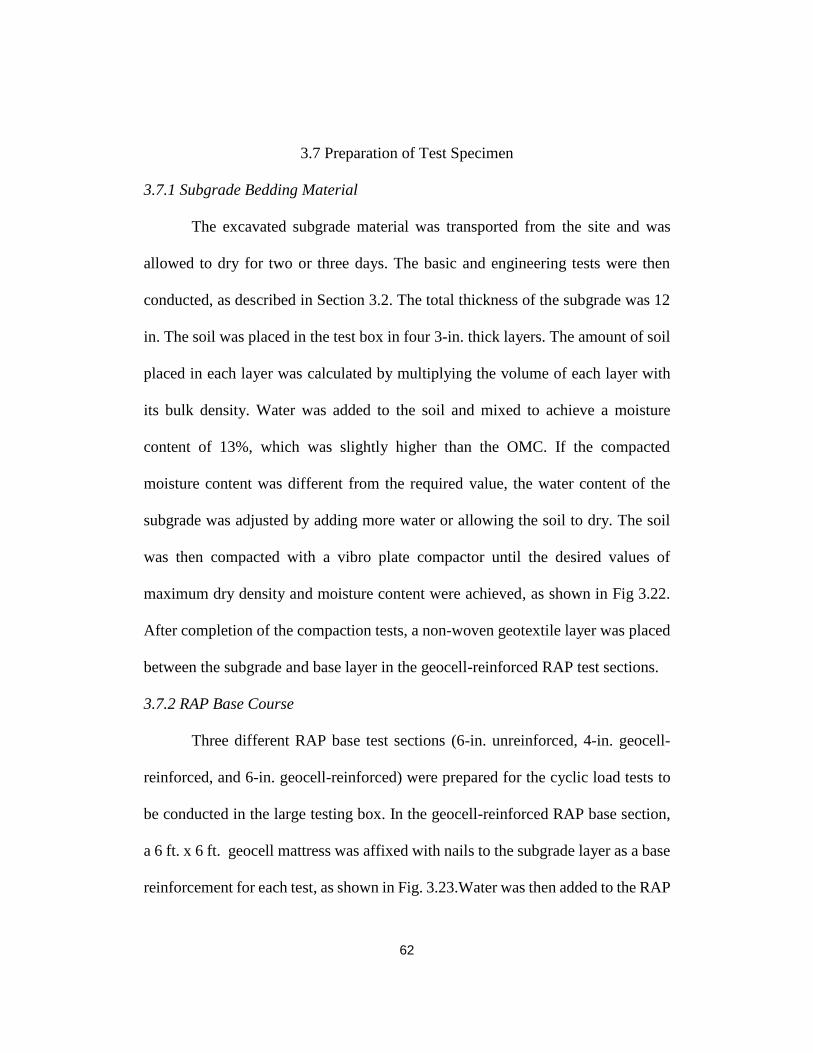
62
3.7 Preparation of Test Specimen
3.7.1 Subgrade Bedding Material
The excavated subgrade material was transported from the site and was
allowed to dry for two or three days. The basic and engineering tests were then
conducted, as described in Section 3.2. The total thickness of the subgrade was 12
in. The soil was placed in the test box in four 3-in. thick layers. The amount of soil
placed in each layer was calculated by multiplying the volume of each layer with
its bulk density. Water was added to the soil and mixed to achieve a moisture
content of 13%, which was slightly higher than the OMC. If the compacted
moisture content was different from the required value, the water content of the
subgrade was adjusted by adding more water or allowing the soil to dry. The soil
was then compacted with a vibro plate compactor until the desired values of
maximum dry density and moisture content were achieved, as shown in Fig 3.22.
After completion of the compaction tests, a non-woven geotextile layer was placed
between the subgrade and base layer in the geocell-reinforced RAP test sections.
3.7.2 RAP Base Course
Three different RAP base test sections (6-in. unreinforced, 4-in. geocell-
reinforced, and 6-in. geocell-reinforced) were prepared for the cyclic load tests to
be conducted in the large testing box. In the geocell-reinforced RAP base section,
a 6 ft. x 6 ft. geocell mattress was affixed with nails to the subgrade layer as a base
reinforcement for each test, as shown in Fig. 3.23.Water was then added to the RAP
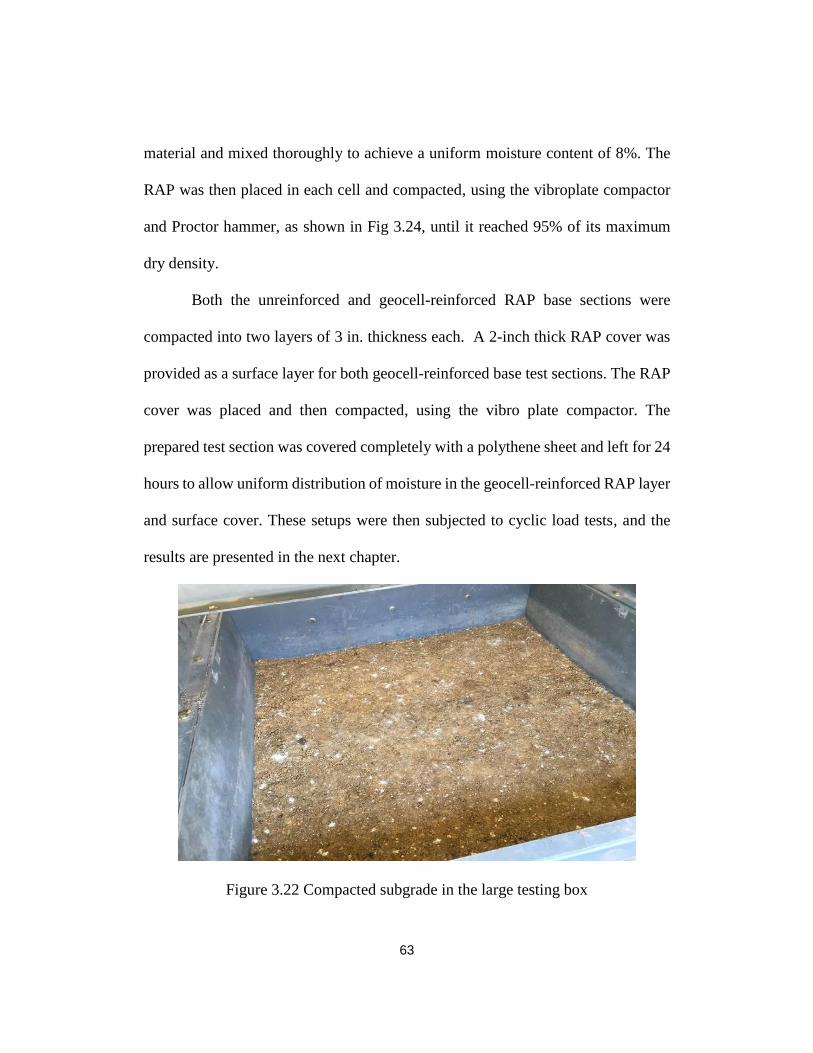
63
material and mixed thoroughly to achieve a uniform moisture content of 8%. The
RAP was then placed in each cell and compacted, using the vibroplate compactor
and Proctor hammer, as shown in Fig 3.24, until it reached 95% of its maximum
dry density.
Both the unreinforced and geocell-reinforced RAP base sections were
compacted into two layers of 3 in. thickness each. A 2-inch thick RAP cover was
provided as a surface layer for both geocell-reinforced base test sections. The RAP
cover was placed and then compacted, using the vibro plate compactor. The
prepared test section was covered completely with a polythene sheet and left for 24
hours to allow uniform distribution of moisture in the geocell-reinforced RAP layer
and surface cover. These setups were then subjected to cyclic load tests, and the
results are presented in the next chapter.
Figure 3.22 Compacted subgrade in the large testing box
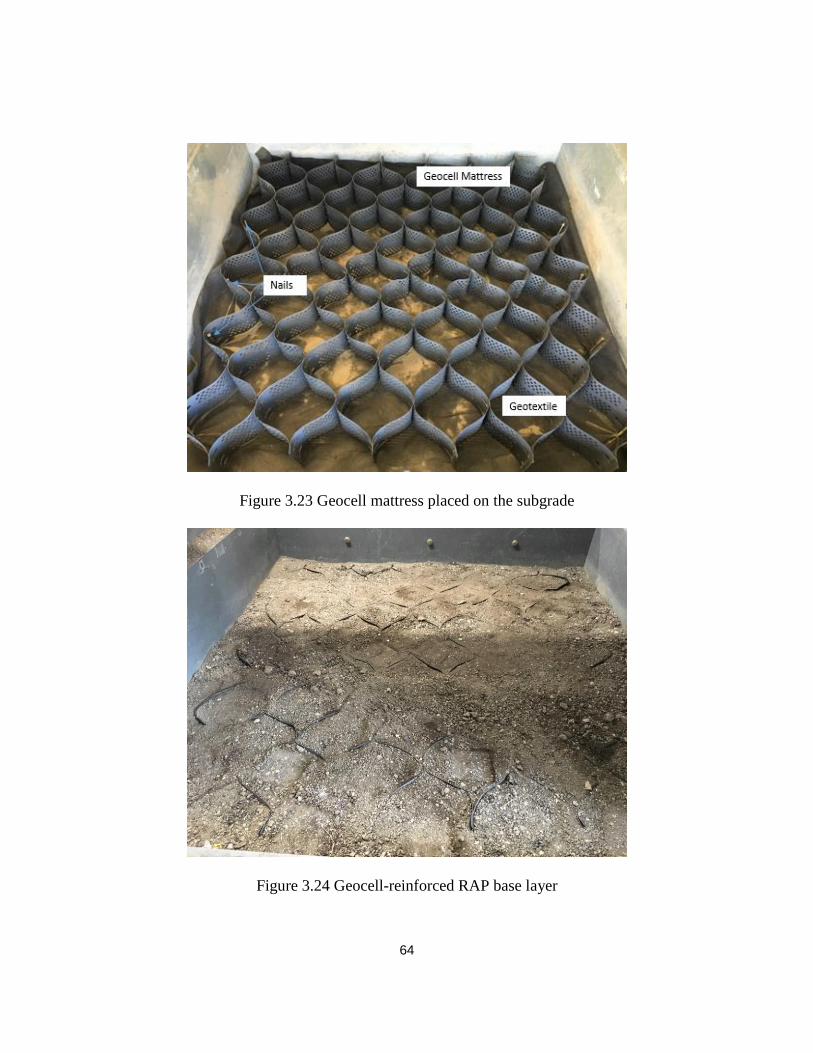
64
Figure 3.23 Geocell mattress placed on the subgrade
Figure 3.24 Geocell-reinforced RAP base layer
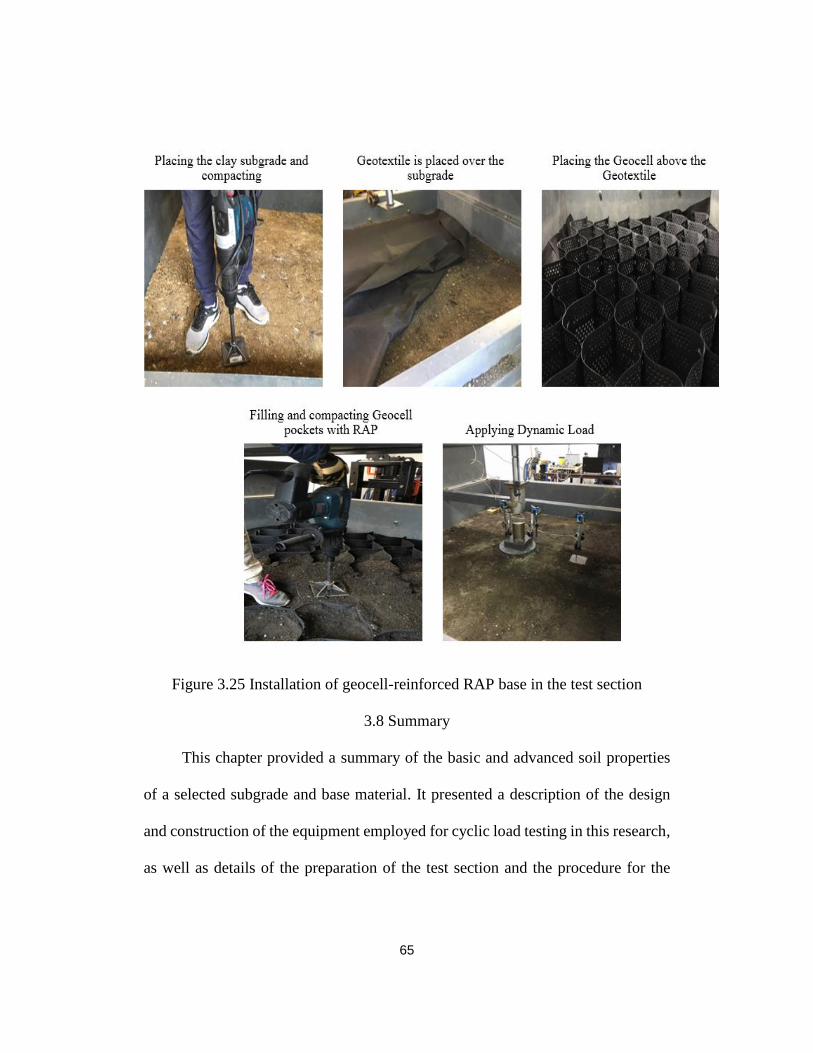
65
Figure 3.25 Installation of geocell-reinforced RAP base in the test section
3.8 Summary
This chapter provided a summary of the basic and advanced soil properties
of a selected subgrade and base material. It presented a description of the design
and construction of the equipment employed for cyclic load testing in this research,
as well as details of the preparation of the test section and the procedure for the

66
installing the geocell-reinforced RAP base layer. In the next chapter, the results
obtained from the cyclic plate load tests will be presented and analyzed.
67
Chapter 4
Results and discussions
4.1 Introduction
This chapter presents comprehensive analysis of experimental data obtained
from large-scale laboratory cyclic load tests. The experimental data obtained from
different test sections are presented. Additionally, the comparison of test results
from different test sections is presented.
Six cyclic plate load tests and two static load tests were carried out using
Return Motion Controller (RMC) software. The cyclic load started from 200 lbf to
the peak value of 2250 lbf. All the test results presented in this chapter are computed
by averaging the results of two duplicate tests conducted on different test sections
of respective base layers. The cyclic plate load tests were conducted on the
following RAP base sections:
1. 6-in. unreinforced RAP base section.
2. 4-in. Geocell-reinforced RAP base section.
3. 6-in. Geocell-reinforced RAP base section.
The schematic sectional view of all the test sections is shown in Fig 4.1.
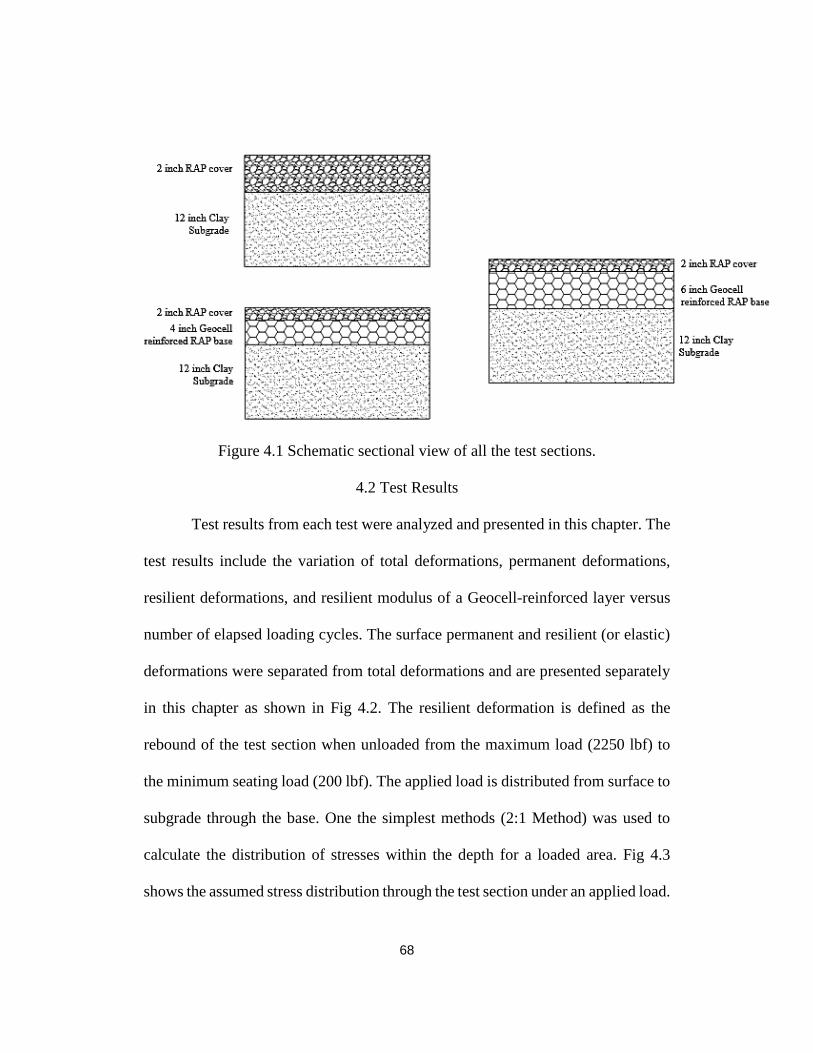
68
Figure 4.1 Schematic sectional view of all the test sections.
4.2 Test Results
Test results from each test were analyzed and presented in this chapter. The
test results include the variation of total deformations, permanent deformations,
resilient deformations, and resilient modulus of a Geocell-reinforced layer versus
number of elapsed loading cycles. The surface permanent and resilient (or elastic)
deformations were separated from total deformations and are presented separately
in this chapter as shown in Fig 4.2. The resilient deformation is defined as the
rebound of the test section when unloaded from the maximum load (2250 lbf) to
the minimum seating load (200 lbf). The applied load is distributed from surface to
subgrade through the base. One the simplest methods (2:1 Method) was used to
calculate the distribution of stresses within the depth for a loaded area. Fig 4.3
shows the assumed stress distribution through the test section under an applied load.
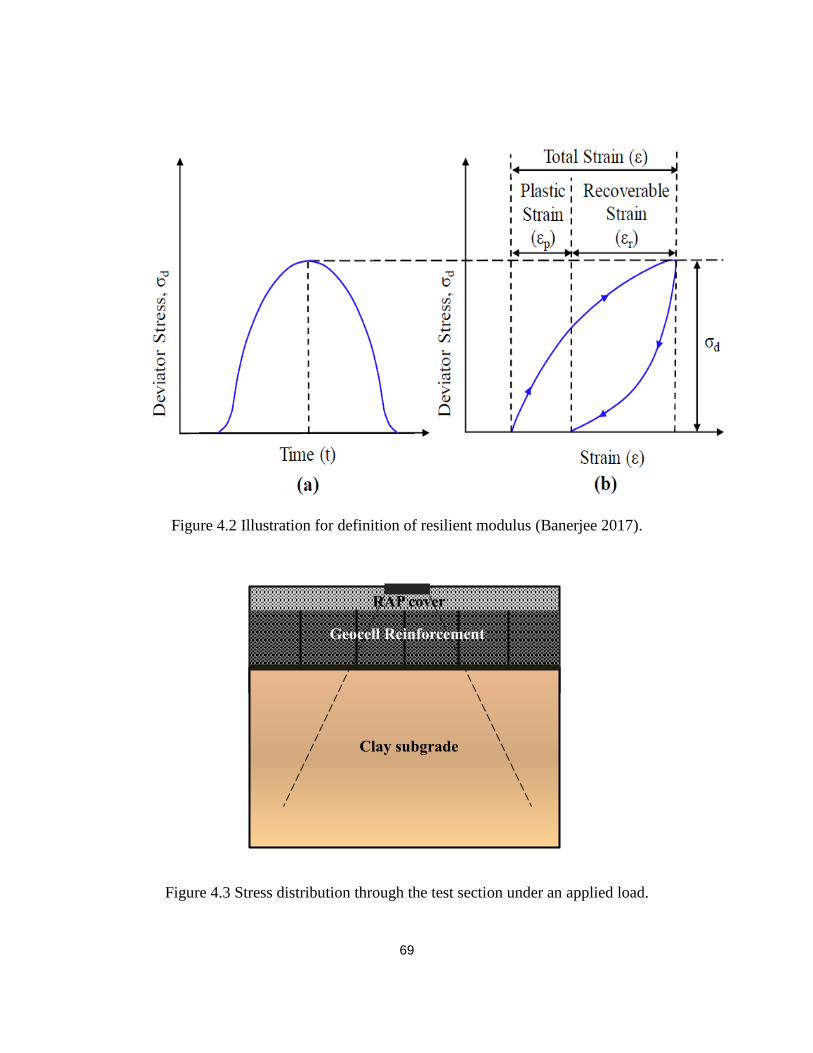
69
Figure 4.2 Illustration for definition of resilient modulus (Banerjee 2017).
Figure 4.3 Stress distribution through the test section under an applied load.
Clay subgrade
Geocell Reinforcement
RAP cover
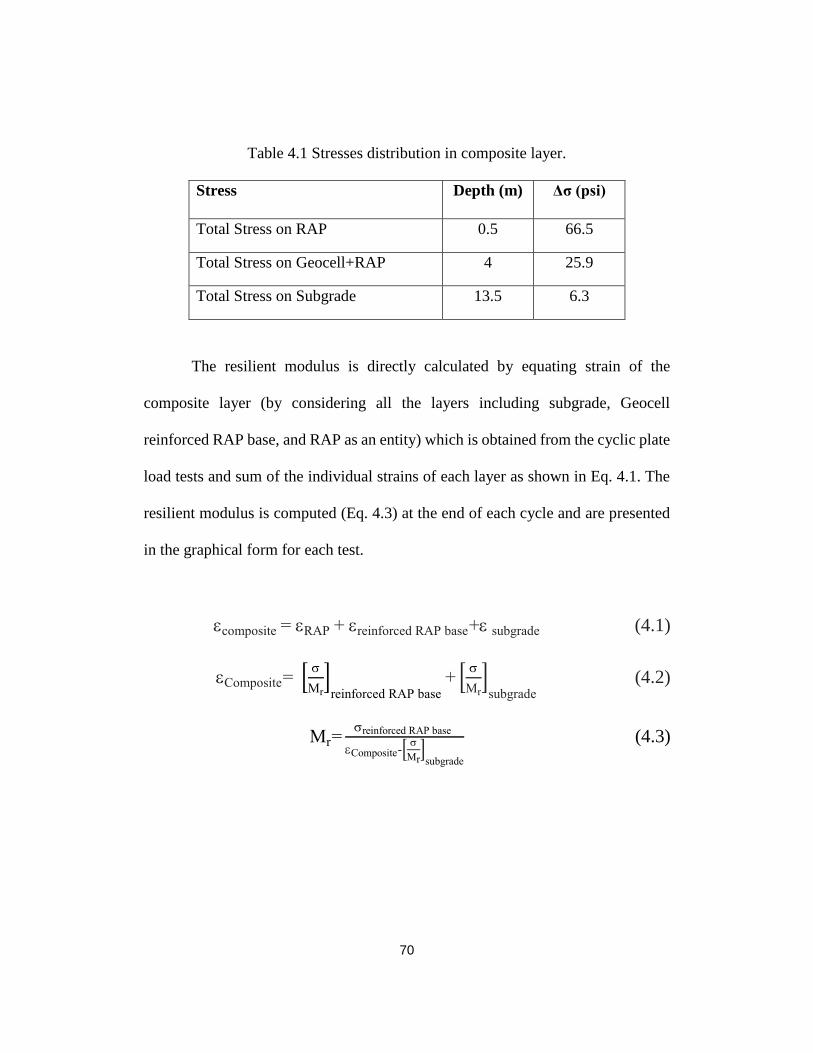
70
Table 4.1 Stresses distribution in composite layer.
Stress Depth (m) Δσ (psi)
Total Stress on RAP 0.5 66.5
Total Stress on Geocell+RAP 4 25.9
Total Stress on Subgrade 13.5 6.3
The resilient modulus is directly calculated by equating strain of the
composite layer (by considering all the layers including subgrade, Geocell
reinforced RAP base, and RAP as an entity) which is obtained from the cyclic plate
load tests and sum of the individual strains of each layer as shown in Eq. 4.1. The
resilient modulus is computed (Eq. 4.3) at the end of each cycle and are presented
in the graphical form for each test.
composite = RAP + reinforced RAP base+ subgrade (4.1)
Composite= [
Mr]
reinforced RAP base+ [
Mr]
subgrade (4.2)
Mr=reinforced RAP base
Composite-[
Mr]subgrade
(4.3)
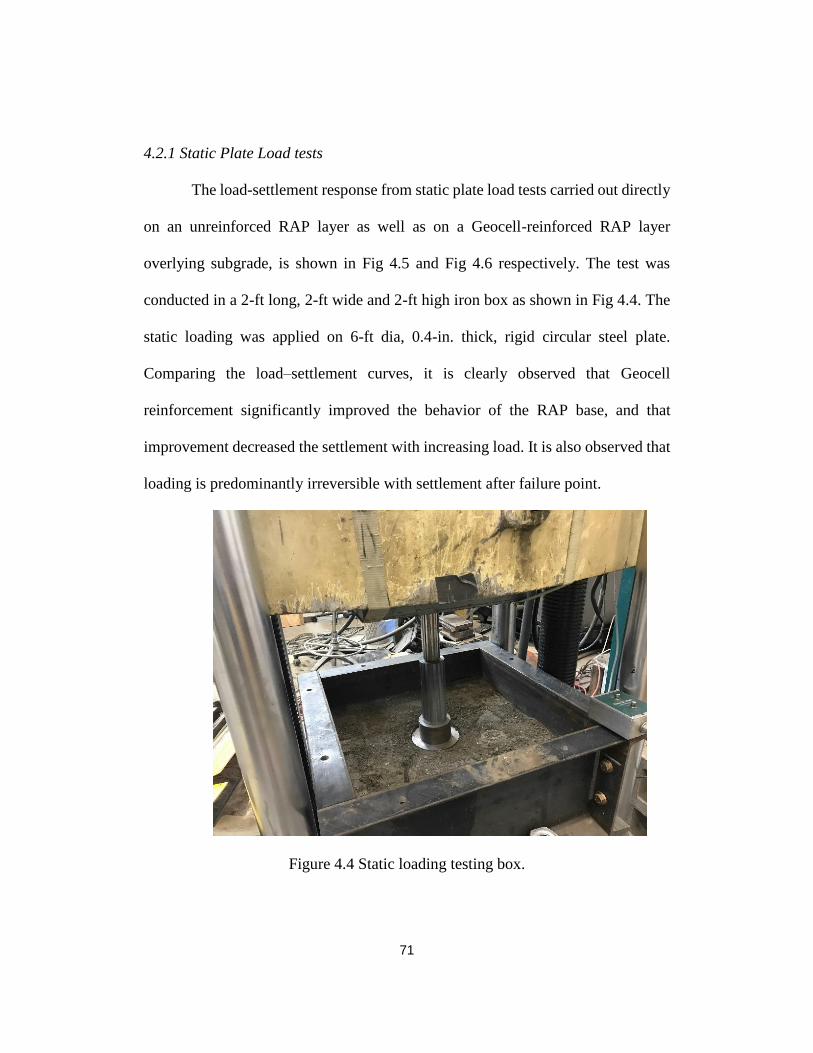
71
4.2.1 Static Plate Load tests
The load-settlement response from static plate load tests carried out directly
on an unreinforced RAP layer as well as on a Geocell-reinforced RAP layer
overlying subgrade, is shown in Fig 4.5 and Fig 4.6 respectively. The test was
conducted in a 2-ft long, 2-ft wide and 2-ft high iron box as shown in Fig 4.4. The
static loading was applied on 6-ft dia, 0.4-in. thick, rigid circular steel plate.
Comparing the load–settlement curves, it is clearly observed that Geocell
reinforcement significantly improved the behavior of the RAP base, and that
improvement decreased the settlement with increasing load. It is also observed that
loading is predominantly irreversible with settlement after failure point.
Figure 4.4 Static loading testing box.
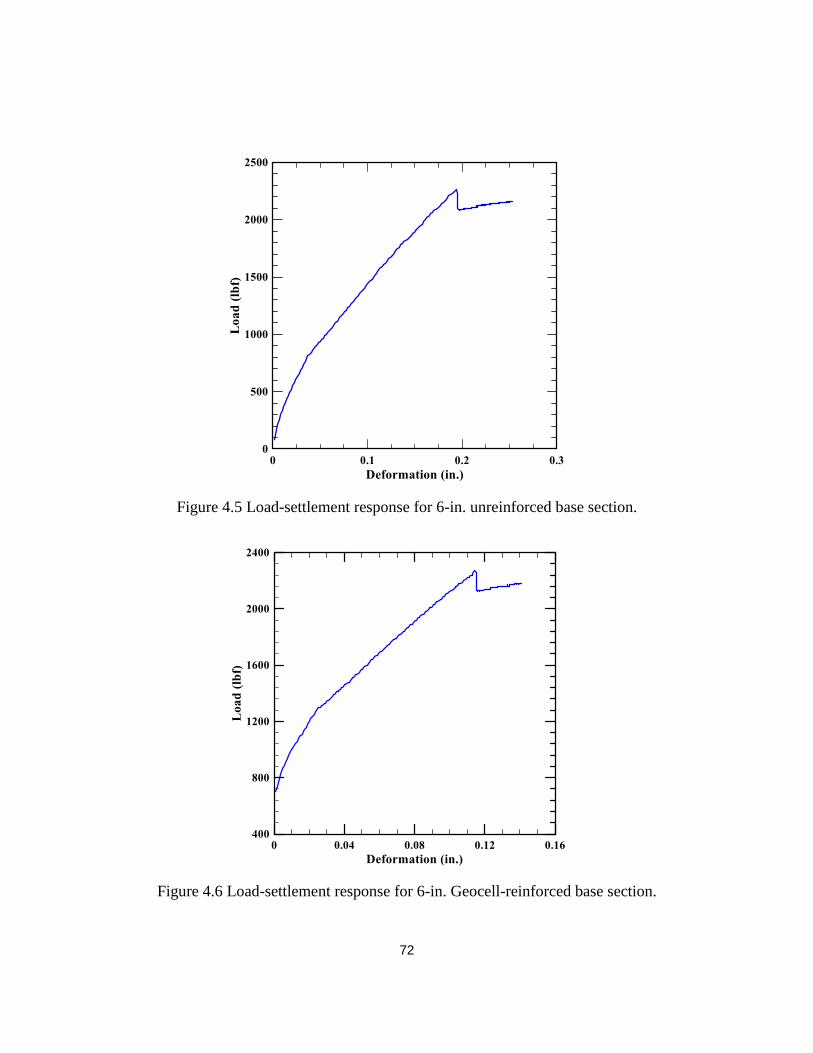
72
Figure 4.5 Load-settlement response for 6-in. unreinforced base section.
Figure 4.6 Load-settlement response for 6-in. Geocell-reinforced base section.
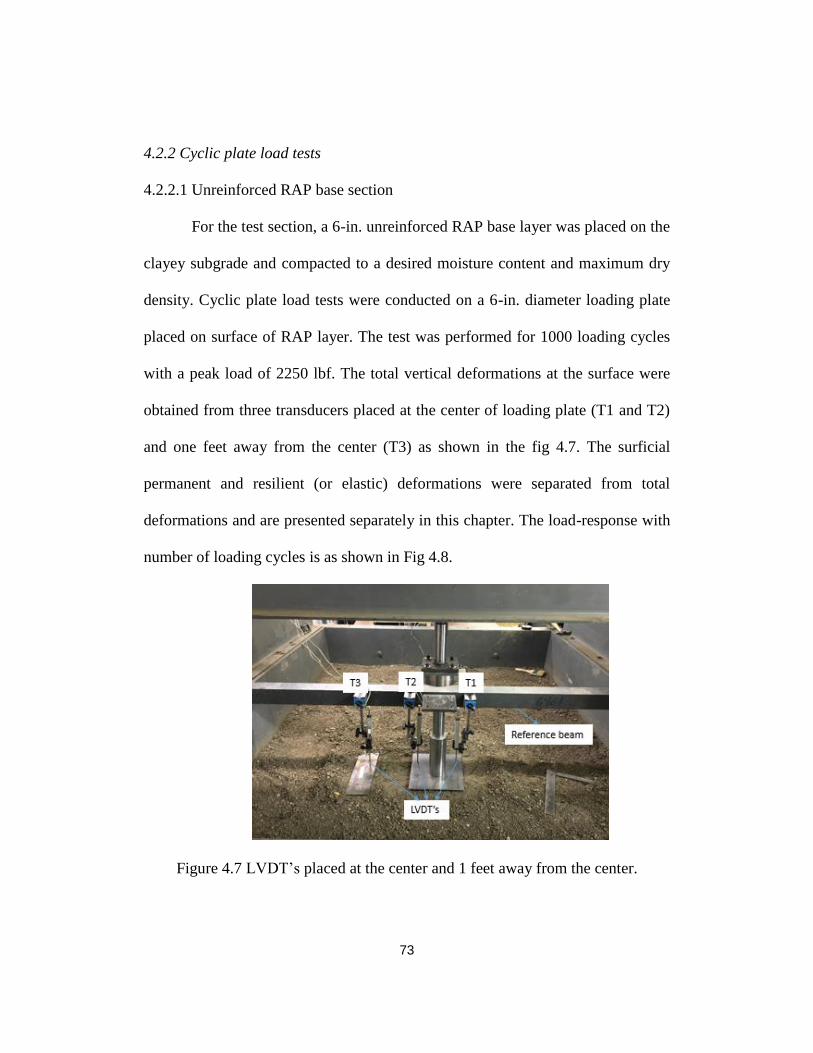
73
4.2.2 Cyclic plate load tests
4.2.2.1 Unreinforced RAP base section
For the test section, a 6-in. unreinforced RAP base layer was placed on the
clayey subgrade and compacted to a desired moisture content and maximum dry
density. Cyclic plate load tests were conducted on a 6-in. diameter loading plate
placed on surface of RAP layer. The test was performed for 1000 loading cycles
with a peak load of 2250 lbf. The total vertical deformations at the surface were
obtained from three transducers placed at the center of loading plate (T1 and T2)
and one feet away from the center (T3) as shown in the fig 4.7. The surficial
permanent and resilient (or elastic) deformations were separated from total
deformations and are presented separately in this chapter. The load-response with
number of loading cycles is as shown in Fig 4.8.
Figure 4.7 LVDT’s placed at the center and 1 feet away from the center.
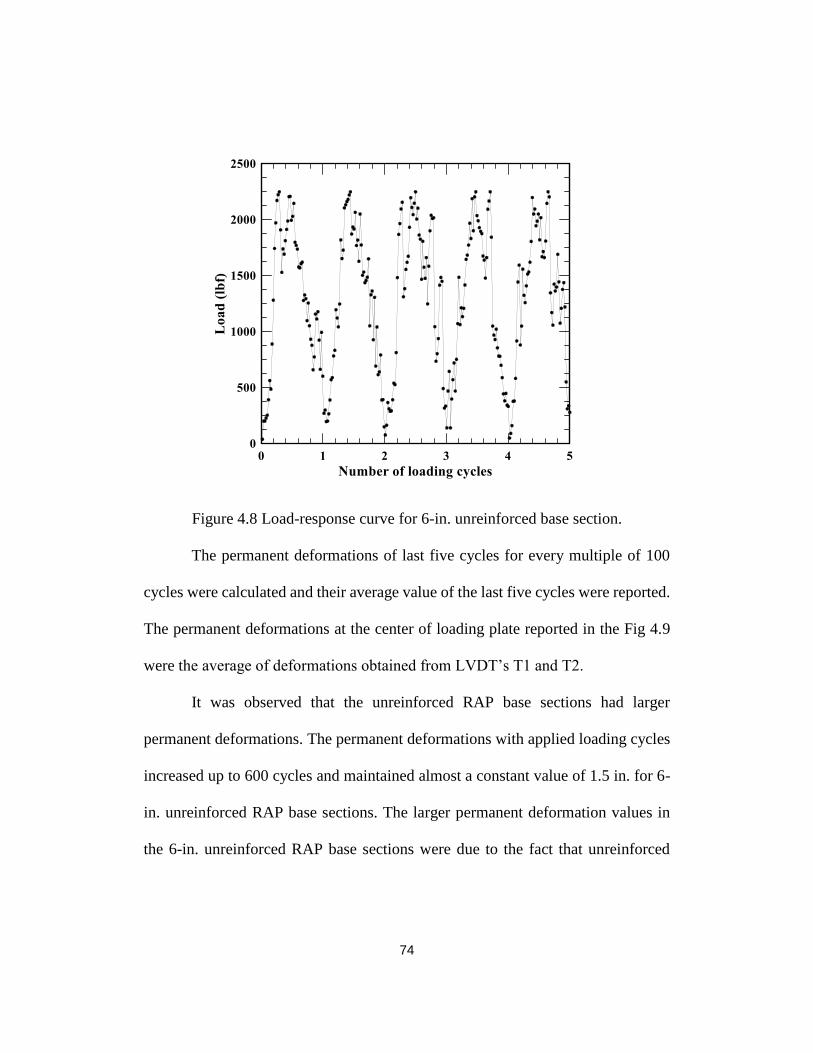
74
Figure 4.8 Load-response curve for 6-in. unreinforced base section.
The permanent deformations of last five cycles for every multiple of 100
cycles were calculated and their average value of the last five cycles were reported.
The permanent deformations at the center of loading plate reported in the Fig 4.9
were the average of deformations obtained from LVDT’s T1 and T2.
It was observed that the unreinforced RAP base sections had larger
permanent deformations. The permanent deformations with applied loading cycles
increased up to 600 cycles and maintained almost a constant value of 1.5 in. for 6-
in. unreinforced RAP base sections. The larger permanent deformation values in
the 6-in. unreinforced RAP base sections were due to the fact that unreinforced
75
RAP base layer had lower stiffness, and significant compression might have
occurred during the initial loading cycles.
The permanent deformations of unreinforced RAP base sections increased
with the increase in number of loading cycles. This may be due to more air void
contents and limited bonding between the particles of unreinforced RAP which
resulted in more compression of the unreinforced RAP base. Therefore, it is evident
that the unreinforced RAP base layer was less resistant to cyclic loading.
It is also shown that the permanent deformations were higher at the center
of loading plate and reduced drastically at the distance one feet away from the
center of loading plate. The permanent deformation was observed to be 1.57 in. at
the center of loading plate and 0.66 in. at a distance of 1 foot from the center at the
end of 1000 cycle for the 6-in. unreinforced RAP base section.
The variation of resilient (or elastic) deformation of 6-in. unreinforced RAP
base section with number of cycles is shown in Fig 4.10. The resilient deformation
was calculated by subtracting the total deformation from the permanent
deformation at the end of that cycle. The amount of resilient deformation rapidly
decreased upto 700 cycles and stabilized to reach a constant value of 0.04 in. for 6-
in. unreinforced bases. However, larger resilient deformation values of
unreinforced RAP base sections contributed to more elasticity thereby deteriorating
resilient behavior of pavement section. The resilient deformation was observed to
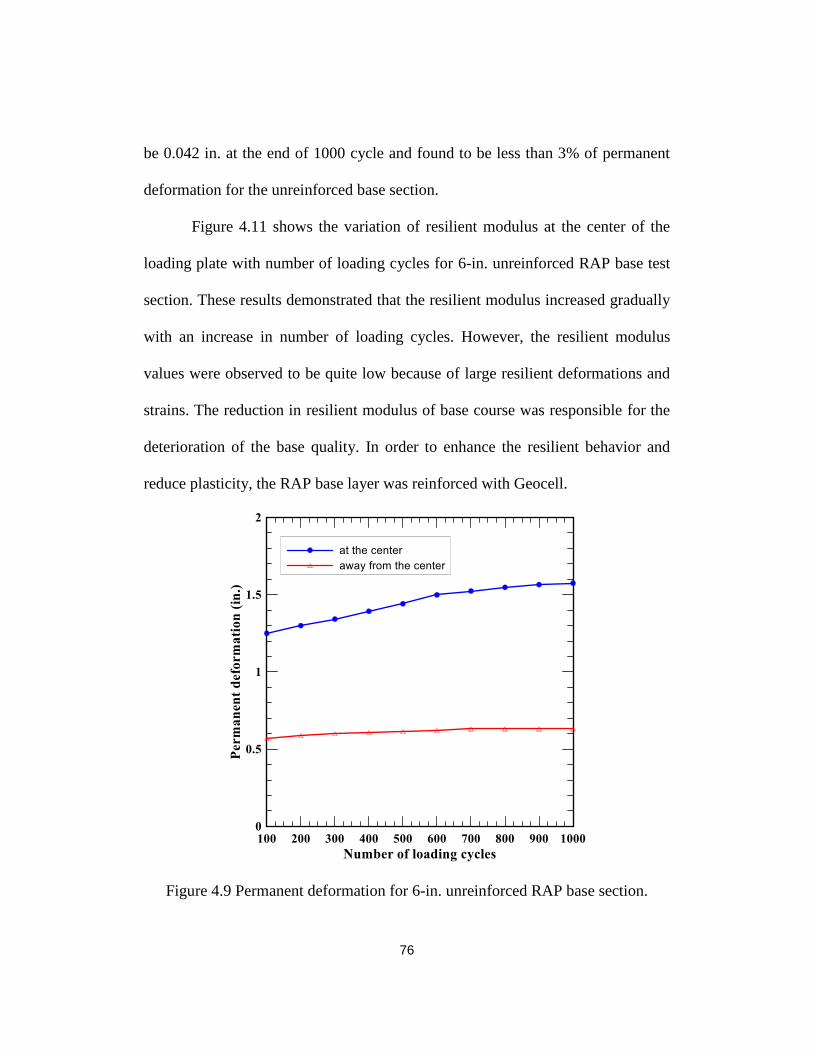
76
be 0.042 in. at the end of 1000 cycle and found to be less than 3% of permanent
deformation for the unreinforced base section.
Figure 4.11 shows the variation of resilient modulus at the center of the
loading plate with number of loading cycles for 6-in. unreinforced RAP base test
section. These results demonstrated that the resilient modulus increased gradually
with an increase in number of loading cycles. However, the resilient modulus
values were observed to be quite low because of large resilient deformations and
strains. The reduction in resilient modulus of base course was responsible for the
deterioration of the base quality. In order to enhance the resilient behavior and
reduce plasticity, the RAP base layer was reinforced with Geocell.
Figure 4.9 Permanent deformation for 6-in. unreinforced RAP base section.
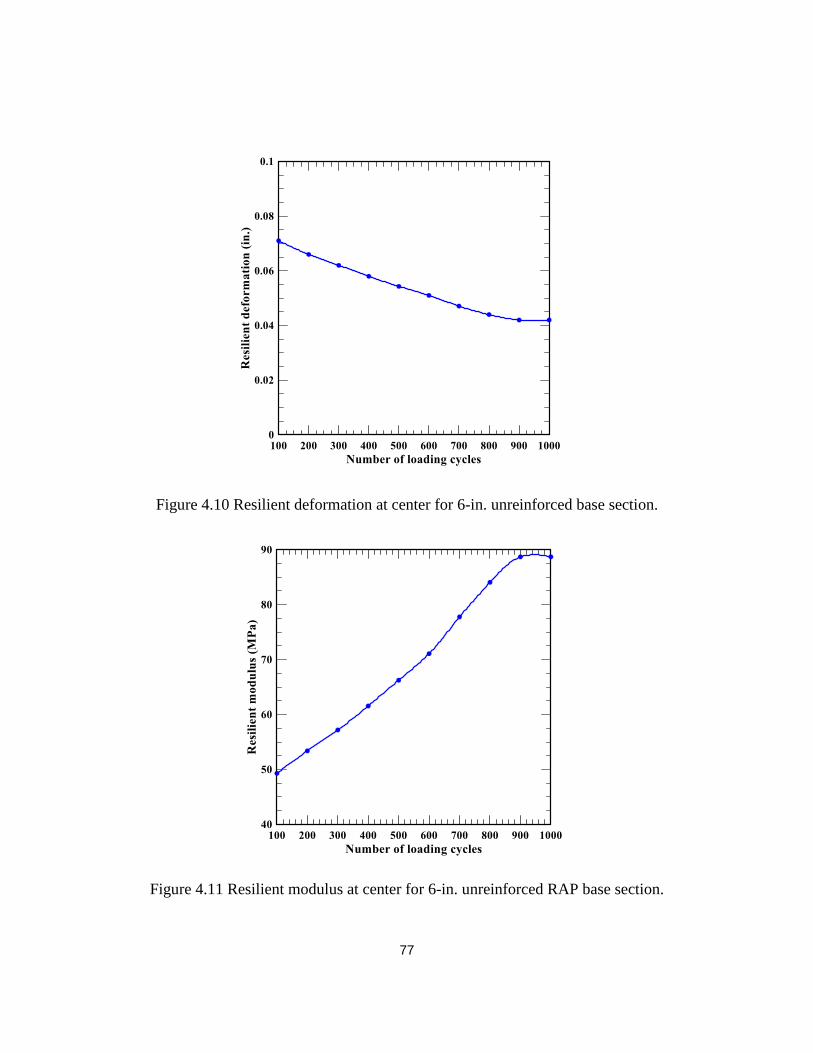
77
Figure 4.10 Resilient deformation at center for 6-in. unreinforced base section.
Figure 4.11 Resilient modulus at center for 6-in. unreinforced RAP base section.
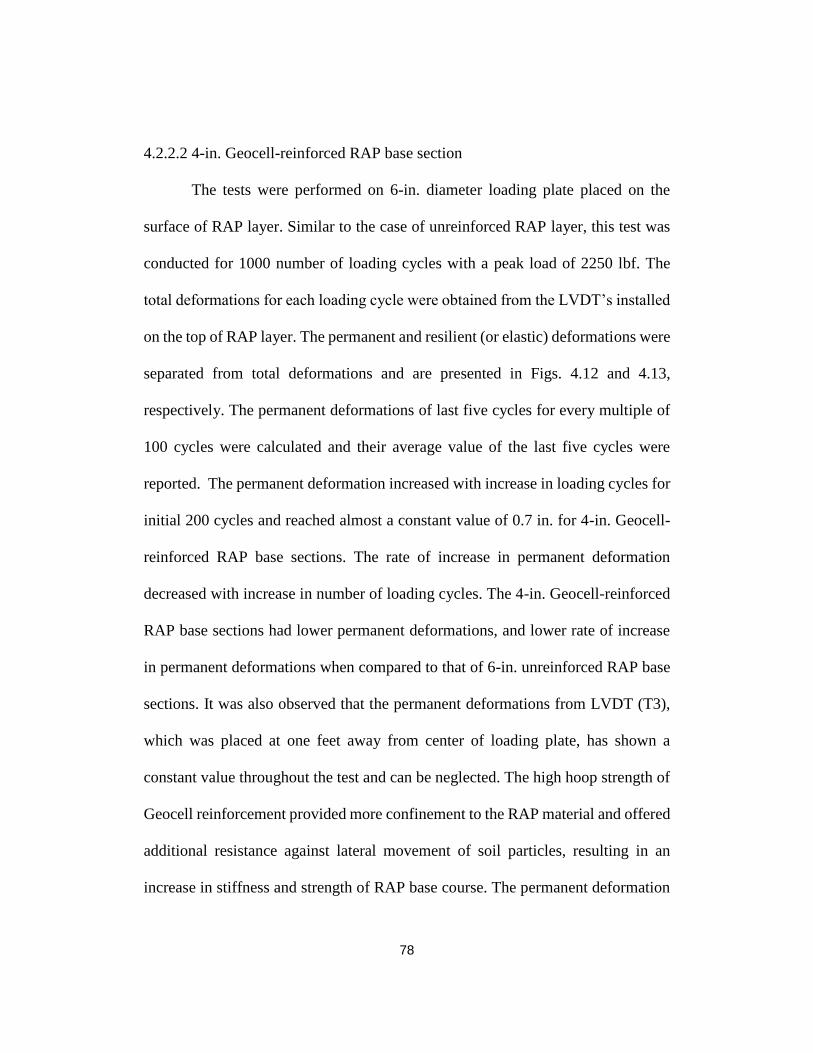
78
4.2.2.2 4-in. Geocell-reinforced RAP base section
The tests were performed on 6-in. diameter loading plate placed on the
surface of RAP layer. Similar to the case of unreinforced RAP layer, this test was
conducted for 1000 number of loading cycles with a peak load of 2250 lbf. The
total deformations for each loading cycle were obtained from the LVDT’s installed
on the top of RAP layer. The permanent and resilient (or elastic) deformations were
separated from total deformations and are presented in Figs. 4.12 and 4.13,
respectively. The permanent deformations of last five cycles for every multiple of
100 cycles were calculated and their average value of the last five cycles were
reported. The permanent deformation increased with increase in loading cycles for
initial 200 cycles and reached almost a constant value of 0.7 in. for 4-in. Geocell-
reinforced RAP base sections. The rate of increase in permanent deformation
decreased with increase in number of loading cycles. The 4-in. Geocell-reinforced
RAP base sections had lower permanent deformations, and lower rate of increase
in permanent deformations when compared to that of 6-in. unreinforced RAP base
sections. It was also observed that the permanent deformations from LVDT (T3),
which was placed at one feet away from center of loading plate, has shown a
constant value throughout the test and can be neglected. The high hoop strength of
Geocell reinforcement provided more confinement to the RAP material and offered
additional resistance against lateral movement of soil particles, resulting in an
increase in stiffness and strength of RAP base course. The permanent deformation
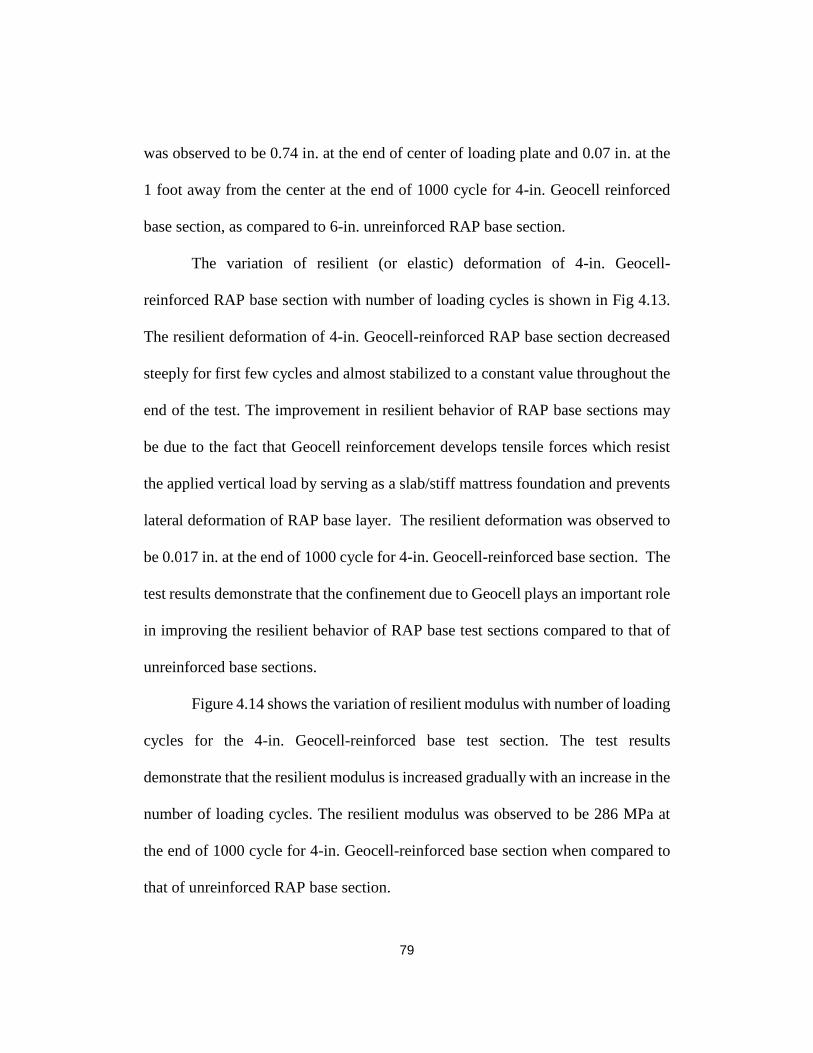
79
was observed to be 0.74 in. at the end of center of loading plate and 0.07 in. at the
1 foot away from the center at the end of 1000 cycle for 4-in. Geocell reinforced
base section, as compared to 6-in. unreinforced RAP base section.
The variation of resilient (or elastic) deformation of 4-in. Geocell-
reinforced RAP base section with number of loading cycles is shown in Fig 4.13.
The resilient deformation of 4-in. Geocell-reinforced RAP base section decreased
steeply for first few cycles and almost stabilized to a constant value throughout the
end of the test. The improvement in resilient behavior of RAP base sections may
be due to the fact that Geocell reinforcement develops tensile forces which resist
the applied vertical load by serving as a slab/stiff mattress foundation and prevents
lateral deformation of RAP base layer. The resilient deformation was observed to
be 0.017 in. at the end of 1000 cycle for 4-in. Geocell-reinforced base section. The
test results demonstrate that the confinement due to Geocell plays an important role
in improving the resilient behavior of RAP base test sections compared to that of
unreinforced base sections.
Figure 4.14 shows the variation of resilient modulus with number of loading
cycles for the 4-in. Geocell-reinforced base test section. The test results
demonstrate that the resilient modulus is increased gradually with an increase in the
number of loading cycles. The resilient modulus was observed to be 286 MPa at
the end of 1000 cycle for 4-in. Geocell-reinforced base section when compared to
that of unreinforced RAP base section.
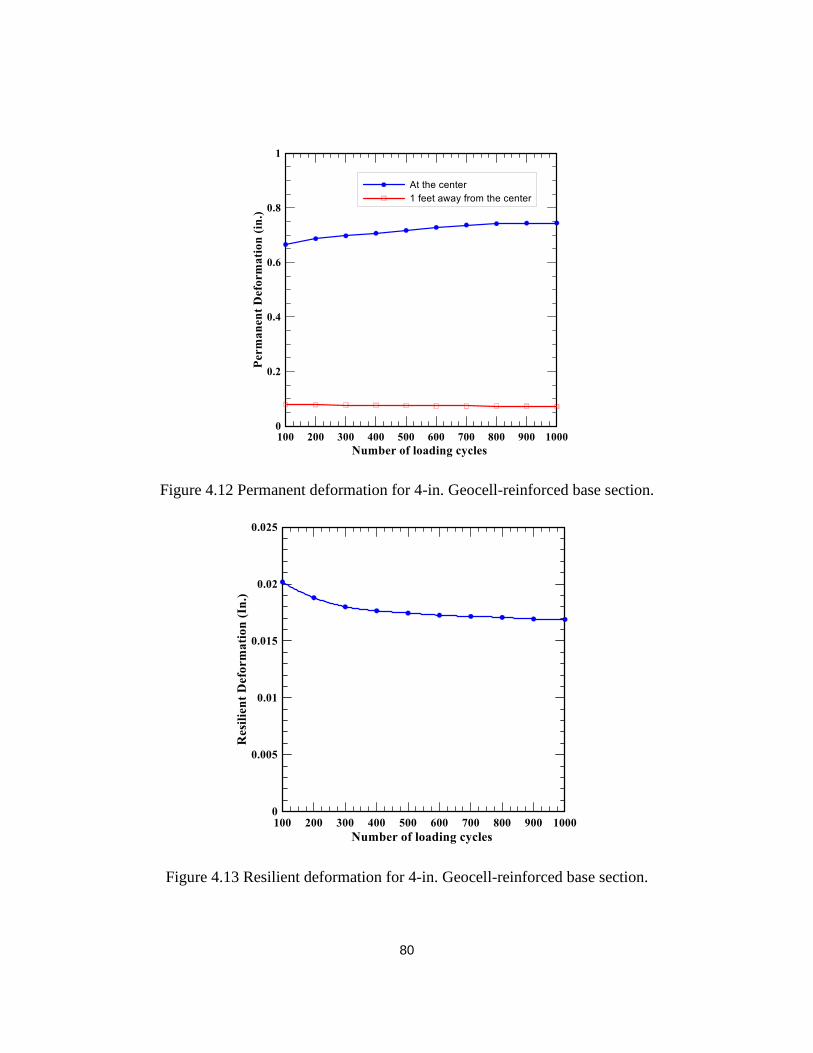
80
Figure 4.12 Permanent deformation for 4-in. Geocell-reinforced base section.
Figure 4.13 Resilient deformation for 4-in. Geocell-reinforced base section.
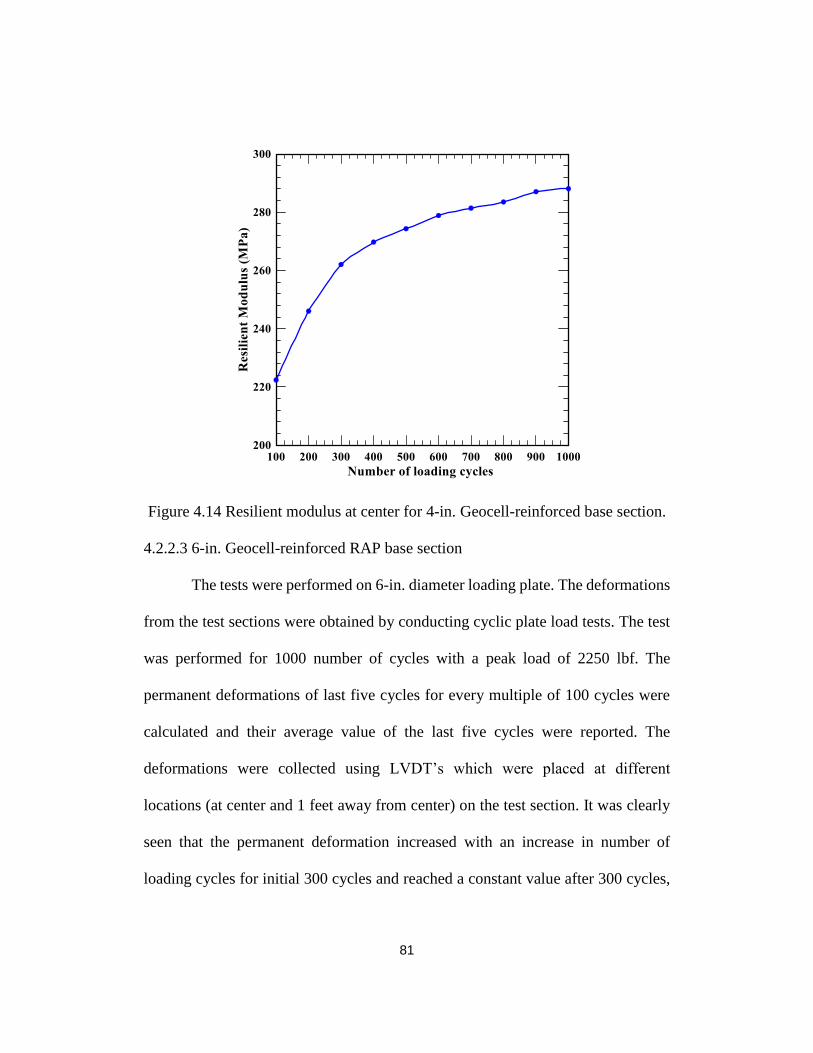
81
Figure 4.14 Resilient modulus at center for 4-in. Geocell-reinforced base section.
4.2.2.3 6-in. Geocell-reinforced RAP base section
The tests were performed on 6-in. diameter loading plate. The deformations
from the test sections were obtained by conducting cyclic plate load tests. The test
was performed for 1000 number of cycles with a peak load of 2250 lbf. The
permanent deformations of last five cycles for every multiple of 100 cycles were
calculated and their average value of the last five cycles were reported. The
deformations were collected using LVDT’s which were placed at different
locations (at center and 1 feet away from center) on the test section. It was clearly
seen that the permanent deformation increased with an increase in number of
loading cycles for initial 300 cycles and reached a constant value after 300 cycles,
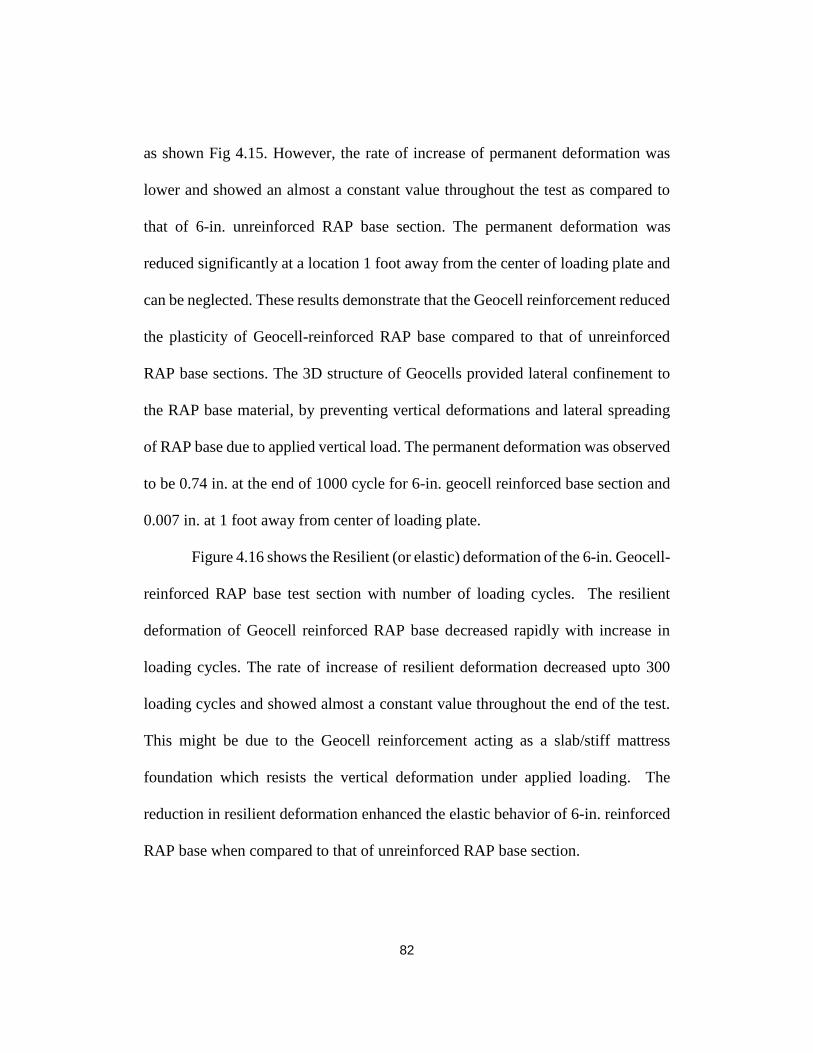
82
as shown Fig 4.15. However, the rate of increase of permanent deformation was
lower and showed an almost a constant value throughout the test as compared to
that of 6-in. unreinforced RAP base section. The permanent deformation was
reduced significantly at a location 1 foot away from the center of loading plate and
can be neglected. These results demonstrate that the Geocell reinforcement reduced
the plasticity of Geocell-reinforced RAP base compared to that of unreinforced
RAP base sections. The 3D structure of Geocells provided lateral confinement to
the RAP base material, by preventing vertical deformations and lateral spreading
of RAP base due to applied vertical load. The permanent deformation was observed
to be 0.74 in. at the end of 1000 cycle for 6-in. geocell reinforced base section and
0.007 in. at 1 foot away from center of loading plate.
Figure 4.16 shows the Resilient (or elastic) deformation of the 6-in. Geocell-
reinforced RAP base test section with number of loading cycles. The resilient
deformation of Geocell reinforced RAP base decreased rapidly with increase in
loading cycles. The rate of increase of resilient deformation decreased upto 300
loading cycles and showed almost a constant value throughout the end of the test.
This might be due to the Geocell reinforcement acting as a slab/stiff mattress
foundation which resists the vertical deformation under applied loading. The
reduction in resilient deformation enhanced the elastic behavior of 6-in. reinforced
RAP base when compared to that of unreinforced RAP base section.
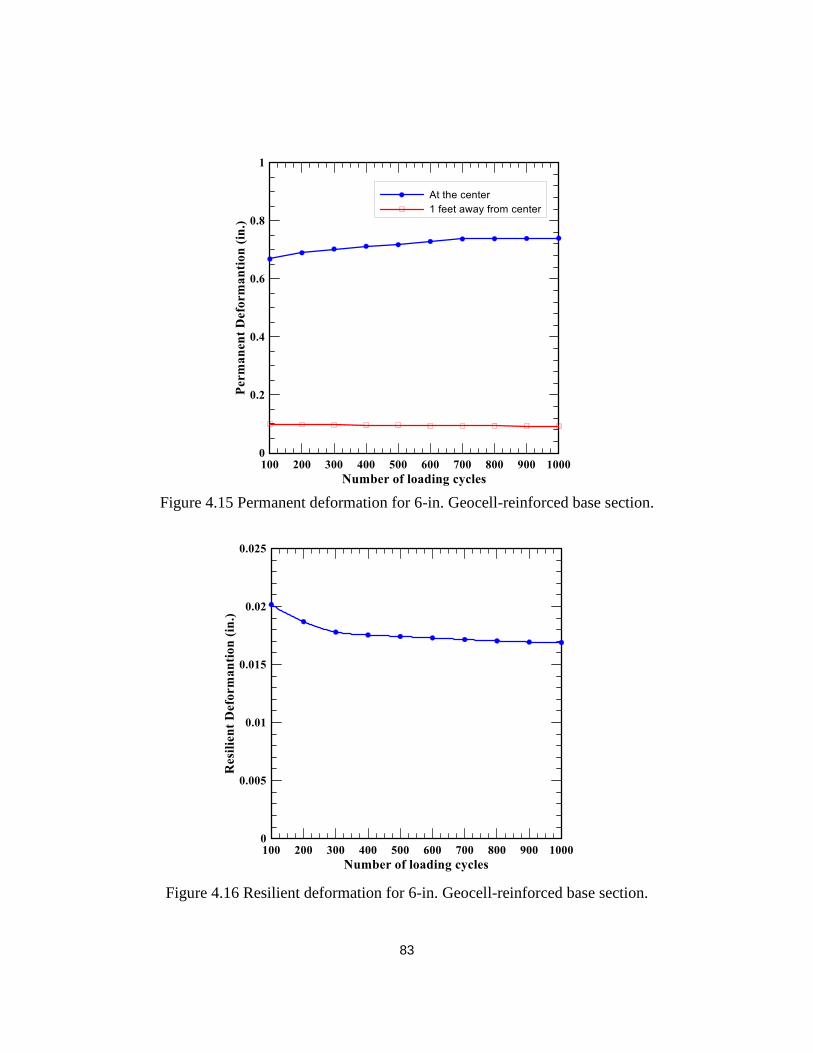
83
Figure 4.15 Permanent deformation for 6-in. Geocell-reinforced base section.
Figure 4.16 Resilient deformation for 6-in. Geocell-reinforced base section.
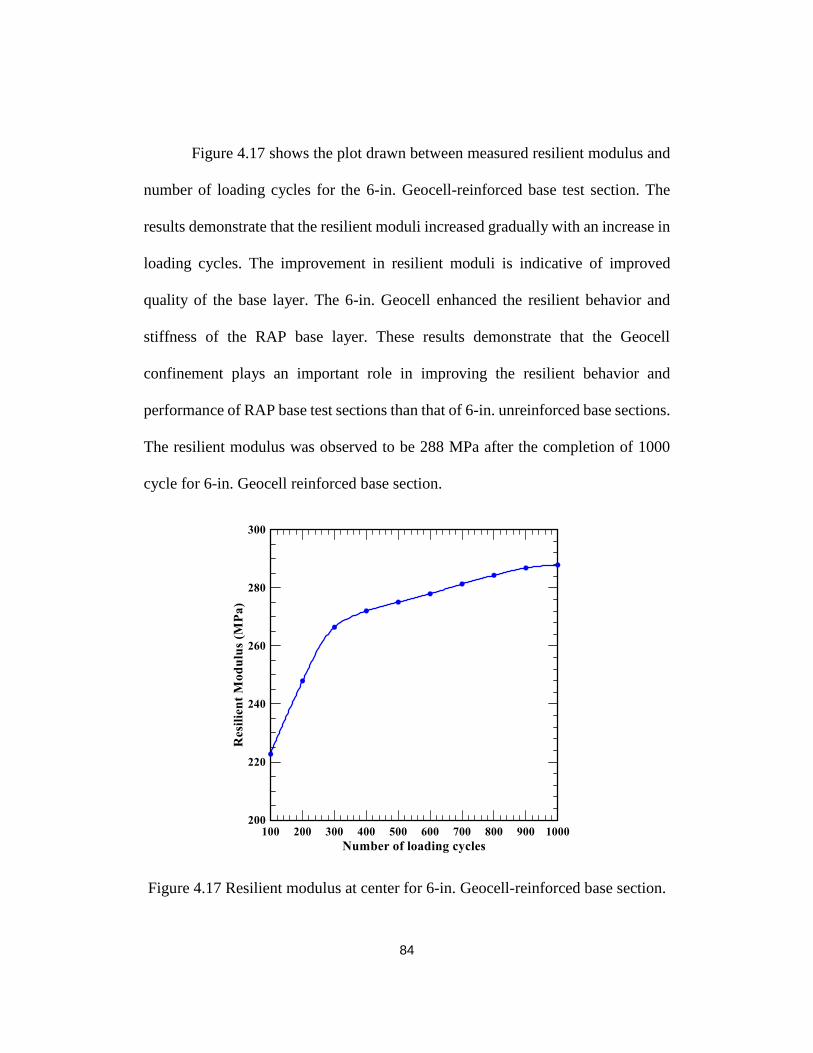
84
Figure 4.17 shows the plot drawn between measured resilient modulus and
number of loading cycles for the 6-in. Geocell-reinforced base test section. The
results demonstrate that the resilient moduli increased gradually with an increase in
loading cycles. The improvement in resilient moduli is indicative of improved
quality of the base layer. The 6-in. Geocell enhanced the resilient behavior and
stiffness of the RAP base layer. These results demonstrate that the Geocell
confinement plays an important role in improving the resilient behavior and
performance of RAP base test sections than that of 6-in. unreinforced base sections.
The resilient modulus was observed to be 288 MPa after the completion of 1000
cycle for 6-in. Geocell reinforced base section.
Figure 4.17 Resilient modulus at center for 6-in. Geocell-reinforced base section.
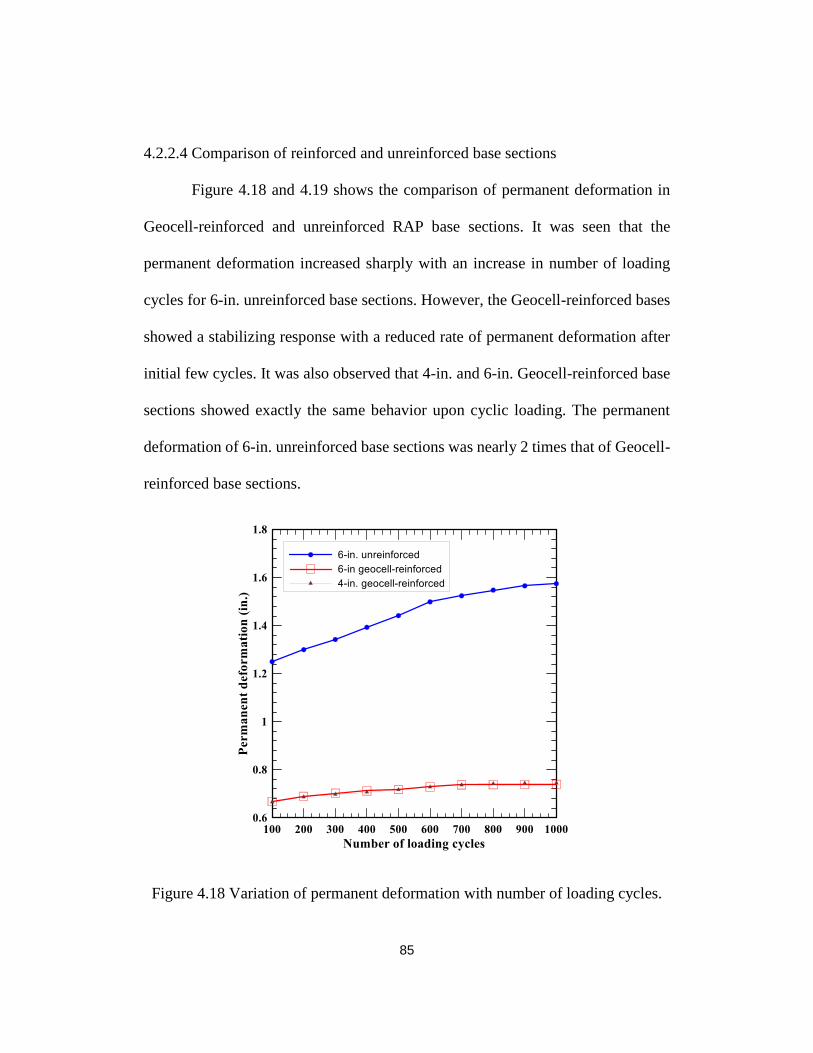
85
4.2.2.4 Comparison of reinforced and unreinforced base sections
Figure 4.18 and 4.19 shows the comparison of permanent deformation in
Geocell-reinforced and unreinforced RAP base sections. It was seen that the
permanent deformation increased sharply with an increase in number of loading
cycles for 6-in. unreinforced base sections. However, the Geocell-reinforced bases
showed a stabilizing response with a reduced rate of permanent deformation after
initial few cycles. It was also observed that 4-in. and 6-in. Geocell-reinforced base
sections showed exactly the same behavior upon cyclic loading. The permanent
deformation of 6-in. unreinforced base sections was nearly 2 times that of Geocell-
reinforced base sections.
Figure 4.18 Variation of permanent deformation with number of loading cycles.
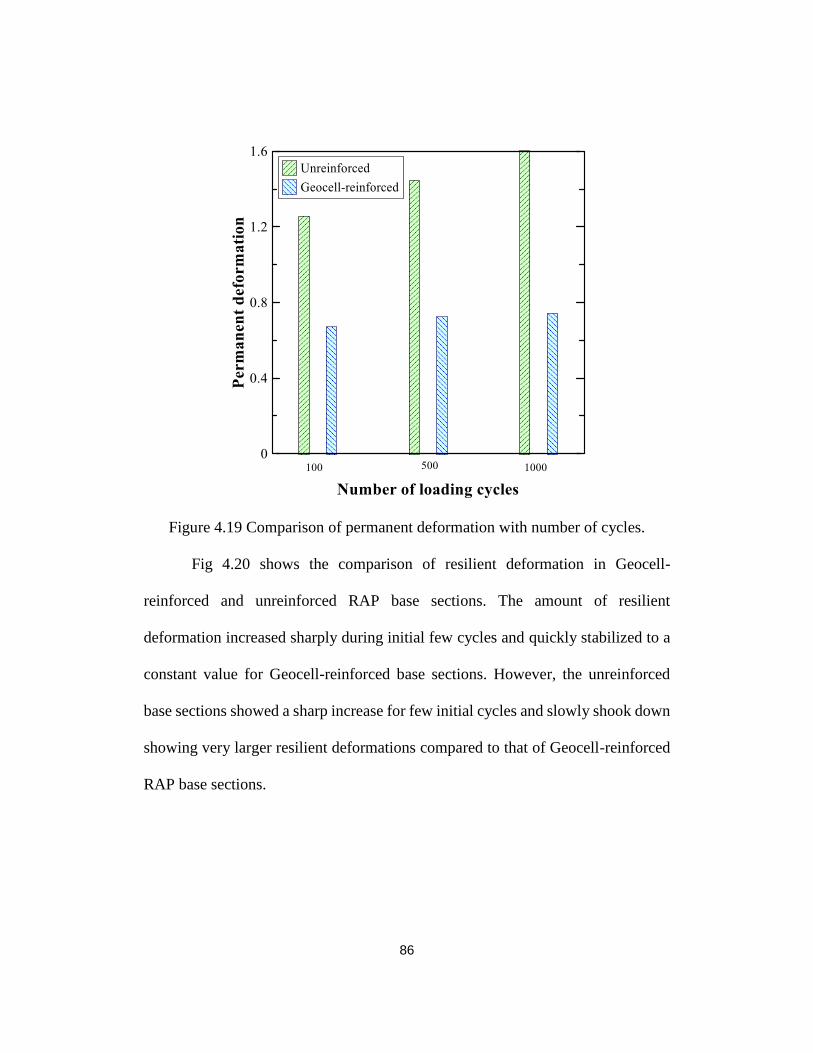
86
Figure 4.19 Comparison of permanent deformation with number of cycles.
Fig 4.20 shows the comparison of resilient deformation in Geocell-
reinforced and unreinforced RAP base sections. The amount of resilient
deformation increased sharply during initial few cycles and quickly stabilized to a
constant value for Geocell-reinforced base sections. However, the unreinforced
base sections showed a sharp increase for few initial cycles and slowly shook down
showing very larger resilient deformations compared to that of Geocell-reinforced
RAP base sections.
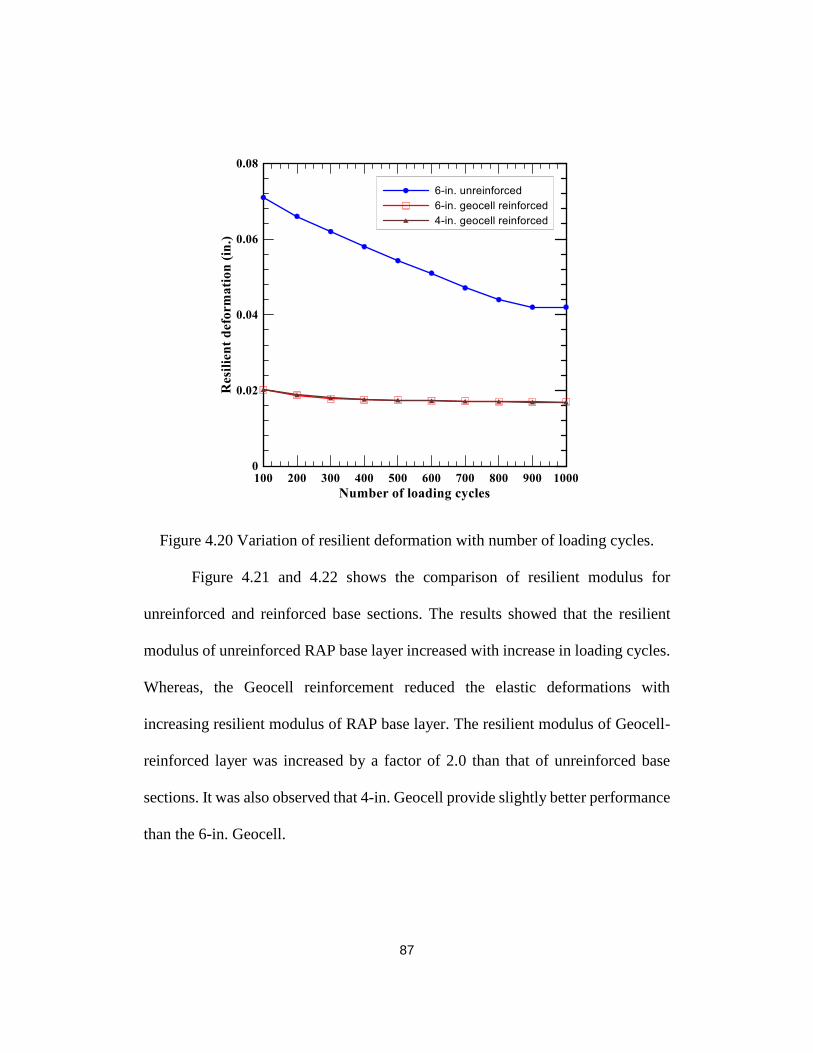
87
Figure 4.20 Variation of resilient deformation with number of loading cycles.
Figure 4.21 and 4.22 shows the comparison of resilient modulus for
unreinforced and reinforced base sections. The results showed that the resilient
modulus of unreinforced RAP base layer increased with increase in loading cycles.
Whereas, the Geocell reinforcement reduced the elastic deformations with
increasing resilient modulus of RAP base layer. The resilient modulus of Geocell-
reinforced layer was increased by a factor of 2.0 than that of unreinforced base
sections. It was also observed that 4-in. Geocell provide slightly better performance
than the 6-in. Geocell.
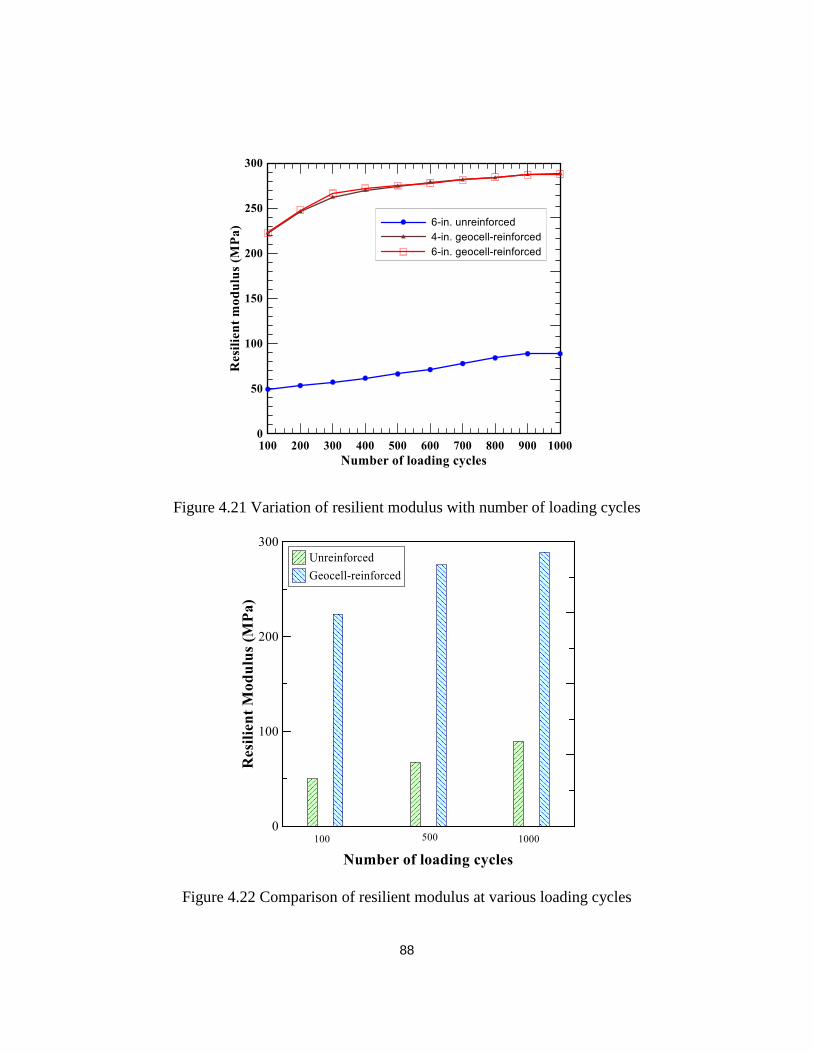
88
Figure 4.21 Variation of resilient modulus with number of loading cycles
Figure 4.22 Comparison of resilient modulus at various loading cycles
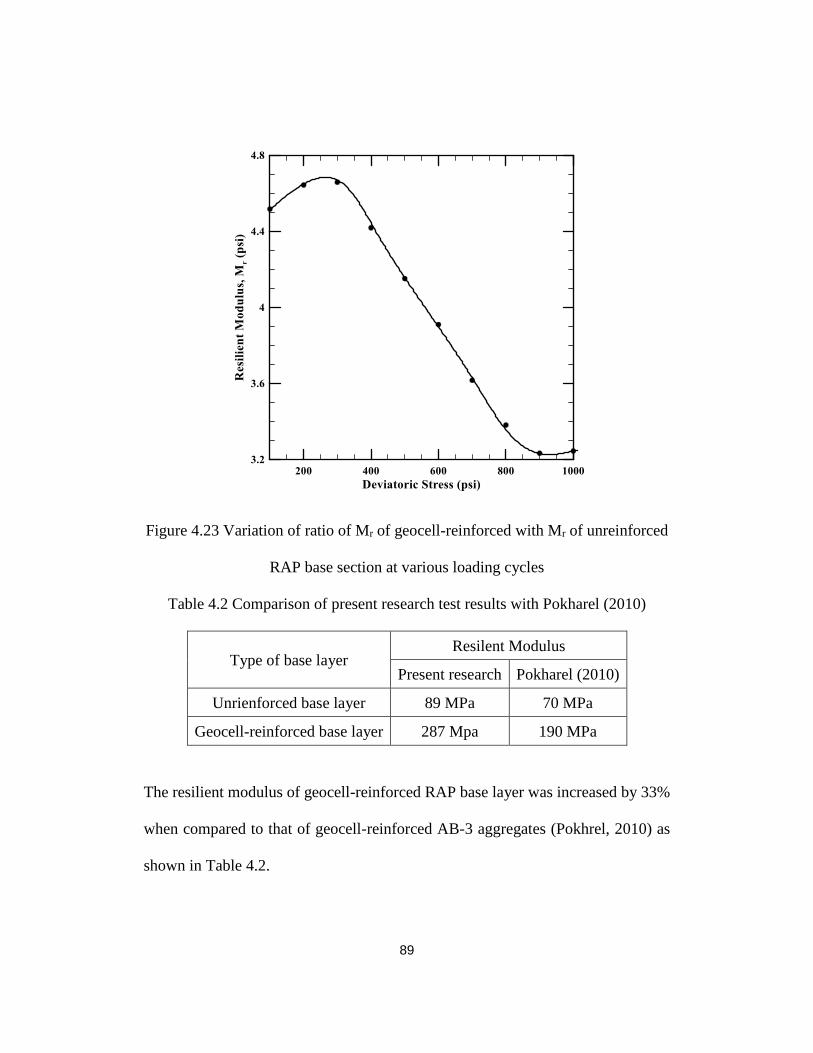
89
Figure 4.23 Variation of ratio of Mr of geocell-reinforced with Mr of unreinforced
RAP base section at various loading cycles
Table 4.2 Comparison of present research test results with Pokharel (2010)
Type of base layer Resilent Modulus
Present research Pokharel (2010)
Unrienforced base layer 89 MPa 70 MPa
Geocell-reinforced base layer 287 Mpa 190 MPa
The resilient modulus of geocell-reinforced RAP base layer was increased by 33%
when compared to that of geocell-reinforced AB-3 aggregates (Pokhrel, 2010) as
shown in Table 4.2.
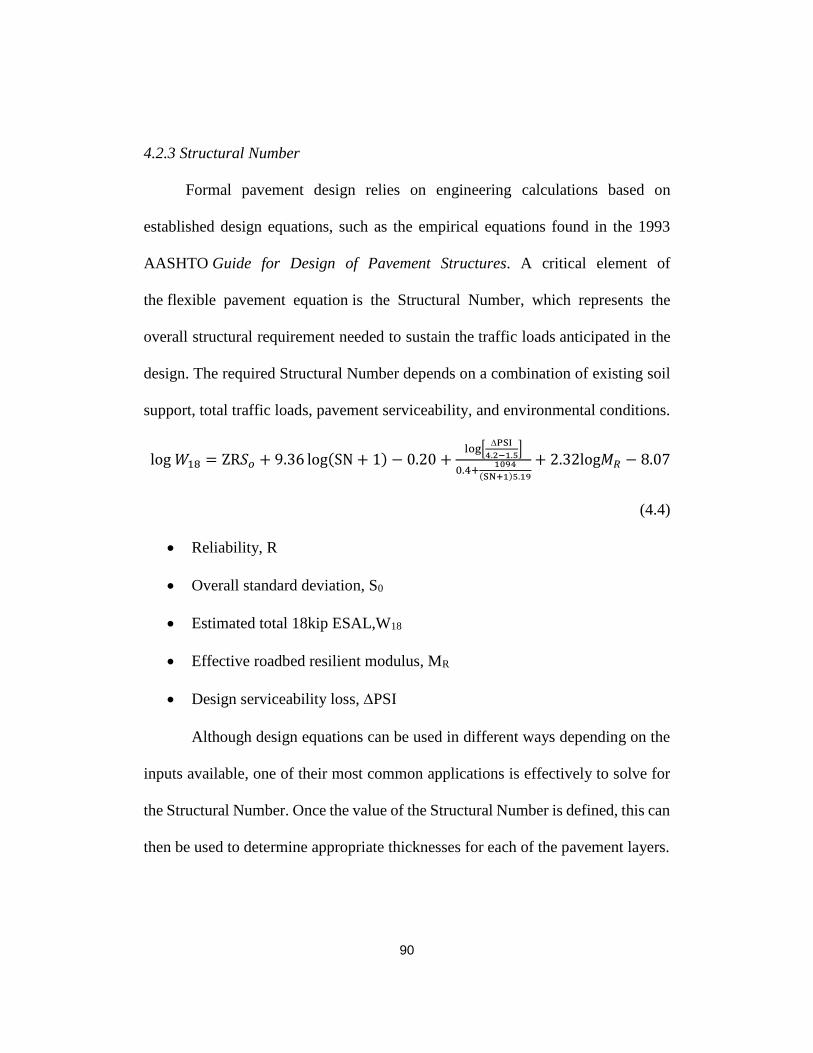
90
4.2.3 Structural Number
Formal pavement design relies on engineering calculations based on
established design equations, such as the empirical equations found in the 1993
AASHTO Guide for Design of Pavement Structures. A critical element of
the flexible pavement equation is the Structural Number, which represents the
overall structural requirement needed to sustain the traffic loads anticipated in the
design. The required Structural Number depends on a combination of existing soil
support, total traffic loads, pavement serviceability, and environmental conditions.
log 𝑊18 = ZR𝑆𝑜 + 9.36 log(SN + 1) − 0.20 +log[
PSI
4.2−1.5]
0.4+1094
(SN+1)5.19
+ 2.32log𝑀𝑅 − 8.07
(4.4)
• Reliability, R
• Overall standard deviation, S0
• Estimated total 18kip ESAL,W18
• Effective roadbed resilient modulus, MR
• Design serviceability loss, PSI
Although design equations can be used in different ways depending on the
inputs available, one of their most common applications is effectively to solve for
the Structural Number. Once the value of the Structural Number is defined, this can
then be used to determine appropriate thicknesses for each of the pavement layers.
91
The Structural Number is a value that applies to the overall pavement
structure, but to complete the design we still need to get from this value to the
individual layer thicknesses. This is handled using an equation of the type shown
below:
𝑆𝑁 = 𝑎1𝐷1 + 𝑎2𝐷2𝑀2 + 𝑎3𝐷3𝑀3 (4.5)
This formula can be adapted to any number of pavement layers, since each
expression (such as a2D2M2) in the formula corresponds to a single layer, so that
the variables in the expression correspond to the characteristics of that layer. The
subscript number used in the expression simply indicates which layer is meant, with
the numbering beginning at the top of the pavement structure. The variables
represent the following:
• ai = a layer coefficient that represents the relative strength of the material
• Di = layer thickness in inches
• Mi = a drainage coefficient
The layer and drainage coefficients are values that should reflect characteristics of
the material used to construct that pavement layer. The thicknesses of the individual
layers are effectively what you are using the design equation, and the Structural
Number, to figure out.
According Rada and Witczak (1982),
a1 = 0.44 (for HMA layer, E1= 650 ksi)
92
a2 = 0.249 log E2 – 0.977 = 0.193 (Flexible base, E2 = 50000psi)
a3 = 0.227 log E3 – 0.839 = 0.206 (6-in. Geocell-reinforced RAP sub-base, E3
=40000 psi)
= 0.095 (6-in. Unreinforced RAP base section, E= 13000 psi)
Assuming the thickness of Asphalt layer and flexible base layer to be 4 in. and 5 in.
respectively, and for most pavement designs, it is probably simplest and best to set
the drainage coefficient equal to one, which indicates normal drainage
characteristics.
From Eq. 4.5, it is computed that the structural number of 6-in. unreinforced RAP
base and 6-in. Geocell reinforced RAP base flexible pavements are 3.3 and 4.0
respectively.
4.4 Summary
In this chapter, the analysis of experimental data obtained from large-scale
laboratory cyclic plate load tests was presented. The analysis includes variation of
permanent deformation, resilient deformation, and resilient modulus with number
of loading cycles. Additionally, the results of unreinforced and Geocell-reinforced
RAP base sections were compared graphically. The inclusion of Geocell
reinforcement significantly reduced the permanent deformation of RAP base layer.
The Geocell reinforcement reduced the higher elastic deformations compared to

93
that of unreinforced base sections. The resilient modulus was increased by 2 times
compared with unreinforced RAP base sections.
94
Chapter 5
Conclusions and Recommendations
5.1 Introduction
The main objective of this thesis research was to develop and construct a
large-scale laboratory test setup which can perform a series of cyclic plate load tests
to identify and evaluate the resilient properties of a geocell-reinforced RAP base.
A series of six cyclic plate load tests were conducted on unreinforced and geocell-
reinforced RAP base sections with the peak load of 2250 lbf. Some of the salient
research findings of this research are summarized in the following section.
5.2 Conclusions
Several conclusions could be drawn from the thesis research, which are:
1. The geocell reinforcement significantly reduced the surface permanent
deformations of RAP base approximately by 50% when compared to that
of unreinforced RAP base.
2. The geocell-reinforced RAP base sections had lower resilient deformations
and a lower rate of increase in resilient deformations when compared to that
of unreinforced RAP base sections.
3. The geocell reinforcement had increased resilient modulus of RAP base
approximately by a factor 3.0, compared to that of unreinforced RAP base
sections. The improvement in resilient moduli is indicative of improved
quality of RAP base layer.
95
4. The high hoop strength of geocell reinforcement provided more
confinement and offered additional resistance against lateral movement of
RAP base.
5. The thicker geocell-reinforced RAP sections (6-in.) and thinner geocell-
reinforced RAP base sections (4-in.) had similar performance.
6. The geocell-reinforced RAP base layer acted as a slab/ stiff mattress
foundation and resulted in lower compression of RAP base and subgrade.
7. The compaction dry density of the large-scale test specimen was maintained
as almost same as theoretical maximum dry density value with a difference
of + 5 pcf.
5.3 Future recommendations for the study
The following areas have been identified as a potential recommendation
for the future scope of research:
1. All cyclic plate load tests were conducted under wheel load of 9000 psi. The
performance of geocell-reinforced RAP base layer under different wheel
loads must be investigated.
2. The experimental results from this research can be used for the development
of pavement design with geocell-reinforced RAP bases, and numerical
modelling.
3. Some essential instrumentation such as pressure cells, MEMS (Micro-
Electro-Mechanical-Systems), and strain gauges can be installed to examine
96
the performance of geocell-reinforced RAP bases such as stress distribution
in composite layer, deformation of individual layers, and strains on the
geocell respectively.
4. All the cyclic plate load tests were carried out for limited number of loading
cycles (1000 cycles). The behavior of geocell-reinforced RAP base layers
can be investigated for more number of loading cycles.
97
References
Al-Quadi I. L.; Hughes J. J. (2000): Field evaluation of GEOWEB use in flexible
pavements, Transportation Research Board 1709, S. 26 – 35, National
Research Council, Washington DC.
Asha, M. N., and Latha, G. M. (2014). “Model Studies on Geocell Reinforced
Granular Sub-Bases.” Ground Improvement and Geosynthetics, American
Society of Civil Engineers, Reston, VA, 322–332.
Bathurst, R. J. & Jarrett, P. M. 1988, “Large-Scale Model Tests of Geocomposite
Mattresses Over Peat Subgrades”, Transportation Research Record 1188 –
Effects of Geosynthetics on Soil Properties and of Environment on Pavement
Systems, Transportation Research Board, 1988, pp. 2836
Banerjee, A. (2017). “Response of Unsaturated Soils under Monotonic and
Dynamic Loading over moderate Suction States.” Doctoral Dissertation,
University of Texas at Arlington, Arlington, Texas.
Banerjee, A., Patil, U. D., Puppala, A. J., and Hoyos, L. R. (2017). “Evaluation of
Liquefaction Resistance in Silty Sand via Suction Controlled Triaxial Tests.”
PanAm-UNSAT 2017 GSP, Dallas.
Becham, W.K. and Mills, W.H. (1935). “Cotton-fabric reinforced roads.”
Engineering NewsRecord, Oct. 3, 453-455.
Bennert, T. and Maher, A. (2005). "The development of a performance
specification for granular base and subbase materials.” Dept. of Civil &
98
Environmental Engineering, Center for Advanced Infrastructure &
Transportation (CAIT), Rutgers, the State University, Piscatawav, NJ 08854-
8014.
Berthelot, C., and Kelln, R. (2010). “Crushed Reclaimed Asphalt Pavement (RAP)
and Portland Cement Concrete (PCC) Aggregate Material Stabilization.”
Transportation Research Record.
Berthelot, C., Haichert, R., Podborochynski, D., Wandzura, C., Taylor, B., and
Guenther, D. (2010). "Mechanistic laboratory evaluation and field
construction of recycled concrete materials for use in road substructures."
Journal of the Transportation Research Board, No. 2167, Transportation
Research Board of the National Academics, Washington, D. C., pp. 41-52.
Biabani, M. M., Indraratna, B., and Ngo, N. T. (2016). “Modelling of geocell-
reinforced subballast subjected to cyclic loading.” Geotextiles and
Geomembranes, 44(4), 489–503.
Chaney, R., Demars, K., Krishnaswamy, N., Rajagopal, K., and Madhavi Latha, G.
(2000). “Model Studies on Geocell Supported Embankments Constructed
Over a Soft Clay Foundation.” Geotechnical Testing Journal, 23(1), 45.
Collins, R. J., and Ciesielski, S. K. (1994). Recycling and use of waste materials
and by-products in highway construction.
Cowland, J. W., and Wong, S. C. K. (1993). “Performance of a road embankment
on soft clay supported on a Geocell mattress foundation.” Geotextiles and
99
Geomembranes, 12(8), 687–705.
Cowland, J. W.; Wong S.C.K. (1993): Performance of a road embankment on soft
clay supported on GEOWEB mattress foundation, Geotextiles and
Geomembranes Vol. 12, S. 687 – 705.
Crowe, R.E., Bathurst, R.J. & Alston, C. 1989, Design and Construction of a Road
Embankment Using Geosynthetics, Proceedings of the 42’nd Canadian
Geotechnical Conference, Canadian Geotechnical Society, Winnipeg,
Manitoba, October 1989, pp. 266–271
Dong, Q., and Huang, B. (2014). “Laboratory Evaluation on Resilient Modulus and
Rate Dependencies of RAP Used as Unbound Base Material.” Journal of
Materials in Civil Engineering, 26(2), 379–383.
Emersleben A., Meyer M. (2008c). “Bearing capacity improvement of asphalt
paved road construction due to the use of GEOWEB - falling weight deflector
and vertical stress measurements”. Geosynthetics Asia 2008 „Geosynthetics
in civil and environmental engineering, Proceedings of the 4th Asian
Regional Conference in Geosynthetics, S. 474-753, Shanghai, China 2008.
Singh, V. K., Prasad, A., and Arrawal, R.K. (2007). “Effect of soil confinement on
ultimate bearing capacity of square footing under eccentric-inclined load."
The Electronic Journal of Geotechnical Engineering, Vol. 12, Bund. E.
Giroud, J. P., and Han, J. (2004a). “Design method for geogrid-reinforced unpaved
roads. II. Calibration and applications.” Journal of Geotechnical and
100
Geoenvironmental Engineering, American Society of Civil Engineers, 130(8),
787–797.
Giroud, J. P., and Han, J. (2004b). “Design Method for Geogrid-Reinforced
Unpaved Roads. I. Development of Design Method.” Journal of Geotechnical
and Geoenvironmental Engineering, American Society of Civil Engineers,
130(8), 775–786.
Gnanendran, C. T., and Woodburn, L. J. (2003). “RECYCLED AGGREGATE
FOR PAVEMENT CONSTRUCTION AND THE INFLUENCE OF
STABILISATION.” Publication of: ARRB Transport Research, Limited.
Guthrie, W., Brown, A., and Eggett, D. (2007). “Cement Stabilization of Aggregate
Base Material Blended with Reclaimed Asphalt Pavement.” Transportation
Research Record: Journal of the Transportation Research Board, 2026, 47–
53.
Han, J., Yang, X.M., Leshchinsky, D., Parsons, R.L., (2008a). Behavior of geocell-
reinforced sand under a vertical load. Journal of Transportation Research
Board 2045, 95–101.
Han, J., Pokharel, S. K., Yang, X., Manandhar, C., Leshchinsky, D., Halahmi, I.,
and Parsons, R. L. (2011). “Performance of Geocell-Reinforced RAP Bases
over Weak Subgrade under Full-Scale Moving Wheel Loads.” Journal of
Materials in Civil Engineering, 23(11), 1525–1534.
101
Holtz. R. D. (1990). "Design and construction of geosynthetically reinforced
embankments on very soft soils." Performance of reinforced soil structure:
Proceedings of the International Reinforced Soil Conference Organized by
the British Geotechnical Society, Glasgow. Reclaiming Roads – Vol. 73. No.
5 – Public Roads (FHWA-HRT-10-001)
Hufenus, R., Rueegger, R., Banjac, R., Mayor, P., Springman, S., and Bronnimann,
R. (2006). “Full-scale field tests on geosynthetic reinforced unpaved roads on
soft subgrade.” Geotextiles and Geomembranes, 24(1), 21–37.
http://www.fhwa.dot.gov/publications/publicroads/10mar/06.cfm
http://www.fhwa.dot.gov/publications/research/infrastructure/pavements/11021/in
dex.cfm
Keif, O. and Rajagopal, K. (2008). "Three dimensional cellular confinement system
contribution to structural pavement reinforcement." Geosynthetics India '08
Seminar, Hyderabad, India.
Leshchinsky, B., and Ling, H. (2013). “Effects of Geocell Confinement on Strength
and Deformation Behavior of Gravel.” Journal of Geotechnical and
Geoenvironmental Engineering, 139(2), 340–352.
Ling, H. I., and Liu, Z. (2001). “Performance of geosynthetic-reinforced asphalt
pavements.” Journal of Geotechnical and Geoenvironmental Engineering,
American Society of Civil Engineers, 127(2), 177–184.
McGarrah, E. J. (2007). Evaluation of current practices of reclaimed asphalt
102
pavement/virgin aggregate as base course material.
Mhaiskar, S.Y., and Mandal, I.N., (1992), Soft clay subgrade stabilization using
geosynthetics, ASCE specialties conference on grouting soil improvement and
geosynthetics, New Orleans, vol. 2, no. 30, 25-28 February, pp. 1092-1103.
Mhaiskar, S. Y., and Mandal, J. N. (1996). “Investigations on soft clay subgrade
strengthening using geocells.” Construction and Building Materials, 10(4),
281–286.
Pokharel, S., Han, J., Manandhar, C., Yang, X., Leshchinsky, D., Halahmi, I., and
Parsons, R. (2011). “Accelerated Pavement Testing of Geocell-Reinforced
Unpaved Roads over Weak Subgrade.” Transportation Research Record:
Journal of the Transportation Research Board, 2204, 67–75.
Pokharel, S. K. (2010). "Experimental study on Geocell-Reinforced Bases under
Static and Dynamic loadings." PhD dissertation, CEAE Department, the
University of Kansas.
Pokharel, S. K., Han, J., Parsons, R. L., and Qian, Y., Leshchinsky, D., and
Halahmi, I. (2009a). "Experimental study on bearing capacity of geocell-
reinforced bases." Eight International Conference on Bearing Capacity of
Roads, Railways, and Airfields, University of Illinois at Urbana-Champaign,
Champaign, Illinois, USA.
Potturi, A. K. (2006). Evaluation of resilient modulus of cement and cement-fiber
treated reclaimed asphalt pavement (RAP) aggregates using repeated load
103
triaxial test. Citeseer.
Potturi, A. K., Puppala, A. J., and Hoyos, L. (2007). “Resilient Characteristics of
Cement-Treated Reclaimed Asphalt Pavement Aggregates.” Transportation
Research Board 86th Annual Meeting.
Puppala, A. J., Hoyos, L. R., and Potturi, A. K. (2011). “Resilient Moduli Response
of Moderately Cement-Treated Reclaimed Asphalt Pavement Aggregates.”
Journal of Materials in Civil Engineering, 23(7), 990–998.
Puppala, A. J., Pedarla, A., Chittoori, B., Ganne, V. K., and Nazarian, S. (2017).
“Long-Term Durability Studies on Chemically Treated Reclaimed Asphalt
Pavement Material as a Base Layer for Pavements.” Transportation Research
Record: Journal of the Transportation Research Board, 2657, 1–9.
Rahman, M. A., Arulrajah, A., Piratheepan, J., Bo, M. W., and Imteaz, M. A.
(2014). “Resilient Modulus and Permanent Deformation Responses of
Geogrid-Reinforced Construction and Demolition Materials.” Journal of
Materials in Civil Engineering, 26(3), 512–519.
“Reclaimed Asphalt pavement in Asphalt Mixtures: State of Practice”, (FHWA-
HRT-11-021)
Saride, S., Avirneni, D., Javvadi, S. C. P., Puppala, A. J., and Hoyos, L. R. (2015).
“Evaluation of Fly ash Treated Reclaimed Asphalt Pavement for
Base/Subbase Applications.” Indian Geotechnical Journal, 45(4), 401–411.
Taha, R. (2003). “Evaluation of Cement Kiln Dust-Stabilized Reclaimed Asphalt
104
Pavement Aggregate Systems in Road Bases.” Transportation Research
Record: Journal of the Transportation Research Board, 1819, 11–17.
Taha, R., Al-Harthy, A., Al-Shamsi, K., and Al-Zubeidi, M. (2002). “Cement
Stabilization of Reclaimed Asphalt Pavement Aggregate for Road Bases and
Subbases.” Journal of Materials in Civil Engineering, 14(3), 239–245.
Thakur, J. K. (2011). Experimental study on Geocell-Reinforced Recycled Asphalt
Pavement (RAP) Bases under Static and Cyclic Loadings. Master’s Thesis,
CEAE Department, The University of Kansas.
Thakur, J. K., Han, J., Pokharel, S. K., and Parsons, R. L. (2012). “A Large Test
Box Study on Geocell-Reinforced Recycled Asphalt Pavement (RAP) Bases
over Weak Subgrade under Cyclic Loading.” GeoCongress 2012, American
Society of Civil Engineers, Reston, VA, 1562–1571.
Webster, S.L. & Watkins J.E. 1977, Investigation of Construction Techniques for
Tactical Bridge Approach Roads Across Soft Ground. Soils and Pavements
Laboratory, US Army Corps of Engineers Waterways Experiment Station,
Vicksburg, MS, Technical Report S771, September 1977.
Webster, S.L. 1981, Investigation of Beach Sand Trafficability Enhancement Using
Sand-Grid Confinement and Membrane Reinforcement Concepts – Report
2, Geotechnical Laboratory, U.S. Army Corps of Engineers Waterways
105
Experiment Station, Vicksburg, MS, Technical Report GL7920(2),
February 1981
Webster, S.L. (1992). "Geogrid reinforced base courses for flexible pavements for
light aircraft: Test section construction, Behavior under traffic, Laboratory
tests, and Design criteria." Technical Report GL-93-6, ASAE Waterways
Experiment Station, Vicksburg, Mississippi, USA, 86 p.
Xie, Y., and Yang, X. (2009). “Characteristics of a New-Type Geocell Flexible
Retaining Wall.” Journal of Materials in Civil Engineering, 21(4), 171–175.
Yang, X.M. (2010). “Numerical Analysis of Geocell-reinforced Granular Soils
under Static and Repeated Loads”. Ph. D. Dissertation, the University of
Kansas.
Yoder, E. J., and Witczak, M. W. (1975). Principles of pavement design. John
Wiley & Sons.
Zhang, L. et.al. (2010a). Bearing capacity of geocell reinforcement in embankment
engineering. Geotextiles and Geomembranes, 28(5), 475–482.
Zhang, L. et.al. (2010b). Bearing capacity of geocell reinforcement in embankment
engineering. Geotextiles and Geomembranes, 28(5), 475–482.