Embed Size (px)
Citation preview
Experimental study and code predictions of fibre reinforced polymerreinforced concrete (FRP RC) tensile members
M. Baena ⇑, A. Turon, Ll. Torres, C. Miàs
Analysis and Advanced Materials for Structural Design (AMADE), Polytechnic School, University of Girona, Campus Montilivi s/n, 17071 Girona, Spain
a r t i c l e i n f o
Article history:
Available online 15 April 2011
Keywords:
Reinforced concrete
Fibre reinforced polymer bars
Tension stiffening
Tensile behaviour
Bond
a b s t r a c t
Due to their different mechanical properties, cracking and deformability behaviour of FRP reinforced con-
crete (FRP RC) members is quite different from traditional steel reinforced concrete (SRC) having great
incidence on their serviceability design. This paper presents and discusses the results of an experimental
programme concerning concrete tension members reinforced with glass fibre reinforced polymer (GFRP)
bars. The main aim of the study is to evaluate the response of GFRP reinforced concrete (GFRP RC) tension
members in terms of cracking and deformations. The results show the dependence of load-deformation
response and crack spacing on the reinforcement ratio. The experimental results are compared to predic-
tion models from codes and guidelines (ACI and Eurocode 2) and the suitability of the different
approaches for predicting the behaviour of tensile members is analysed and discussed.
Ó 2011 Elsevier Ltd. All rights reserved.
1. Introduction
Corrosion of steel reinforcement in aggressive environments
can cause considerable damage in reinforced concrete structures,
reducing their service life and increasing the costs of maintenance,
repair or replacement. The use of fibre reinforced polymer (FRP) as
reinforcement in concrete structures offers an alternative to over-
come the corrosion-related problems.
Due to their different mechanical properties, the behaviour of
FRP reinforced concrete (FRP RC) members is quite different from
traditional steel reinforced concrete (SRC). Because of the lower
stiffness of FRP bars compared to steel, deformations and crack
widths at service loads are usually larger for GFRP RC than for
SRC. Therefore, their prediction plays an important role in the
design of GFRP RC flexural elements, which is often governed by
the serviceability limit states [1]. In this sense, the study of the
interaction between FRP reinforcement and concrete is essential
for predicting deformations in FRP reinforced concrete [2].
Although the bond behaviour and the tension stiffening effect
(contribution to stiffness of tensioned concrete between cracks)
are quite well defined for traditional SRC structures, this is not
the case for innovative FRP RC structures, as the parameters
involved are numerous and their influence on the physical phe-
nomenon is not clear. Consequently, the direct extension of SRC
code formulations to FRP RC may not be straightforward.
A number of experimental programmes have been conducted to
assess the influence of the different mechanical properties of FRP
bars on the deformability and cracking (i.e. crack spacing, crack
width and deflections) of FRP RC flexural elements [3–8]. The
tension stiffening effect, which results from the bond interaction
between reinforcement and concrete, is also included in most of
the cited references. However, although the tension stiffening
effect is characteristic of tensioned concrete, fewer studies have
focussed on FRP RC tensile members [9–11].
This paper presents and discusses the results of a research
programme on GFRP RC members tested in tension. The tensile
members were reinforced with helically wrapped sand-coated
GFRP rebars. The rectangular specimens had different reinforce-
ment ratios combining different section sizes and reinforcement
diameters. Details of the tensile behaviour along with results of
the cracking analysis are presented. The experimental results of
load-deformation, crack width and crack spacing are compared
with guidelines and code predictions. Finally, the suitability of
the prediction models is analysed.
2. Experimental programme
2.1. Test programme
The experimental programme consisted of testing GFRP RC ele-
ments axially loaded in tension in order to investigate the post-
cracking response of reinforced concrete. All the GFRP RC ties were
1300 mm long, with 50 mm debonded length on either side giving
an effective bond length of 1200 mm. Three GFRP bar diameters
and two concrete square section sizes were used. One reinforcing
bar was placed in the centre of the cross section. Six specimens
were manufactured, each with different reinforcement ratios by
0263-8223/$ - see front matter Ó 2011 Elsevier Ltd. All rights reserved.
doi:10.1016/j.compstruct.2011.04.012
⇑ Corresponding author. Tel.: +34 972419517; fax: +34 972418098.
E-mail address: [email protected] (M. Baena).
Composite Structures 93 (2011) 2511–2520
Contents lists available at ScienceDirect
Composite Structures
journal homepage: www.elsevier .com/locate /compstruct
combining different diameters and sectional dimensions, as shown
in Table 1.
The specimens designated as 19-170-N and 16-170-3 N in Table
1 correspond to a second part of the programme focussed on
obtaining specific results for numerical simulation in which bars
were internally strain gauged and several notches were created
to induce cracking at specific locations. Therefore, the results
obtained from these two specimens are used for the load-
deformation response only and not for cracking behaviour.
A specially designed gripping system was used to apply the load
without damaging the rebar. It consisted of drilled-through
threaded-bars housing the rebar and an epoxy-based resin bonding
the rebar to the housing bar. Load was applied at the ends of the
protruding bars by means of a hydraulic jack at one end of each
specimen, and a rigid frame connected to the other end of the spec-
imen, as shown in Fig. 1. The load was applied in a displacement
control mode and an automatic data acquisition system was used
to collect the data. The tests were stopped whenever a new crack
appeared at the concrete surface; at each stop, the evolution of
cracks and strains was recorded. Crack widths were measured with
an optical magnifier to within an accuracy of 0.05 mm. A linear
variable differential transducer (LVDT) was used to measure the
member deformation. Additionally, member strains were mea-
sured at the height of reinforcement by means of a mechanical
extensometer with a gauge length of 150 mm between Demec
points; both the LVDT and the mechanical extensometer measured
and recorded deformations along the 1200 mm bond length.
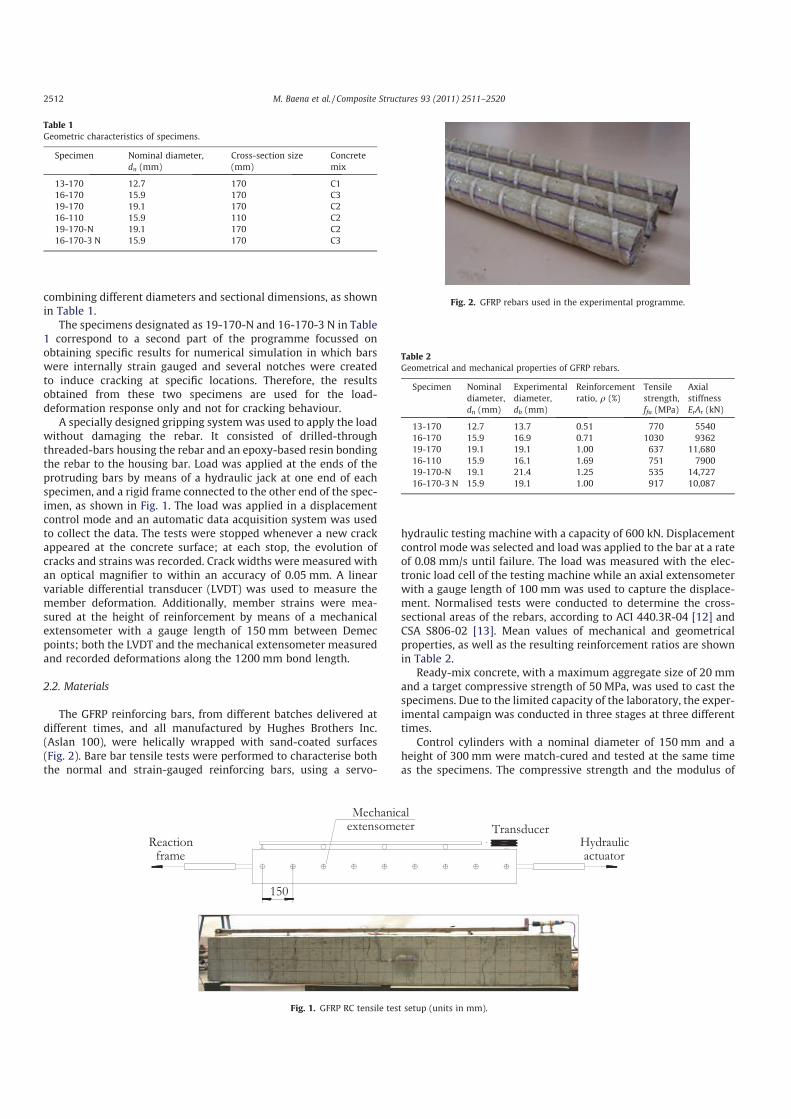
2.2. Materials
The GFRP reinforcing bars, from different batches delivered at
different times, and all manufactured by Hughes Brothers Inc.
(Aslan 100), were helically wrapped with sand-coated surfaces
(Fig. 2). Bare bar tensile tests were performed to characterise both
the normal and strain-gauged reinforcing bars, using a servo-
hydraulic testing machine with a capacity of 600 kN. Displacement
control mode was selected and load was applied to the bar at a rate
of 0.08 mm/s until failure. The load was measured with the elec-
tronic load cell of the testing machine while an axial extensometer
with a gauge length of 100 mm was used to capture the displace-
ment. Normalised tests were conducted to determine the cross-
sectional areas of the rebars, according to ACI 440.3R-04 [12] and
CSA S806-02 [13]. Mean values of mechanical and geometrical
properties, as well as the resulting reinforcement ratios are shown
in Table 2.
Ready-mix concrete, with a maximum aggregate size of 20 mm
and a target compressive strength of 50 MPa, was used to cast the
specimens. Due to the limited capacity of the laboratory, the exper-
imental campaign was conducted in three stages at three different
times.
Control cylinders with a nominal diameter of 150 mm and a
height of 300 mm were match-cured and tested at the same time
as the specimens. The compressive strength and the modulus of
Table 1
Geometric characteristics of specimens.
Specimen Nominal diameter,
dn (mm)
Cross-section size
(mm)
Concrete
mix
13-170 12.7 170 C1
16-170 15.9 170 C3
19-170 19.1 170 C2
16-110 15.9 110 C2
19-170-N 19.1 170 C2
16-170-3 N 15.9 170 C3
Fig. 1. GFRP RC tensile test setup (units in mm).
Fig. 2. GFRP rebars used in the experimental programme.
Table 2
Geometrical and mechanical properties of GFRP rebars.
Specimen Nominal
diameter,
dn (mm)
Experimental
diameter,
db (mm)
Reinforcement
ratio, q (%)
Tensile
strength,
ffu (MPa)
Axial
stiffness
ErAr (kN)
13-170 12.7 13.7 0.51 770 5540
16-170 15.9 16.9 0.71 1030 9362
19-170 19.1 19.1 1.00 637 11,680
16-110 15.9 16.1 1.69 751 7900
19-170-N 19.1 21.4 1.25 535 14,727
16-170-3 N 15.9 19.1 1.00 917 10,087
2512 M. Baena et al. / Composite Structures 93 (2011) 2511–2520
elasticity were tested according to UNE-EN 12390-3 [14] and ASTM
C 469 [15] standards, respectively. The composition and mechani-
cal properties of the concrete are summarised in Table 3.
3. Test results and data analysis
In this section the experimental results of the present study on
GFRP RC tensile tests are presented. Details on the tensile behav-
iour, along with results on the cracking analysis of concrete ele-
ments reinforced with GFRP rebars are given.
3.1. Tensile behaviour
3.1.1. Experimental response
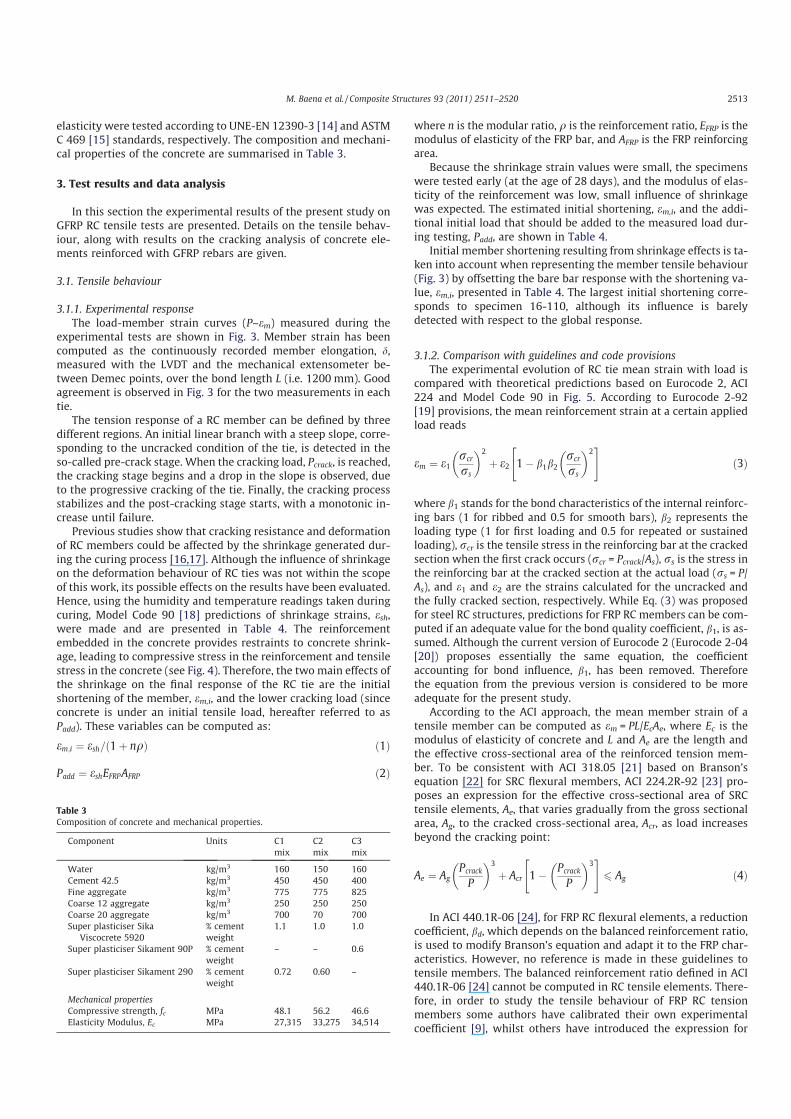
The load-member strain curves (P–em) measured during the
experimental tests are shown in Fig. 3. Member strain has been
computed as the continuously recorded member elongation, d,
measured with the LVDT and the mechanical extensometer be-
tween Demec points, over the bond length L (i.e. 1200 mm). Good
agreement is observed in Fig. 3 for the two measurements in each
tie.
The tension response of a RC member can be defined by three
different regions. An initial linear branch with a steep slope, corre-
sponding to the uncracked condition of the tie, is detected in the
so-called pre-crack stage. When the cracking load, Pcrack, is reached,
the cracking stage begins and a drop in the slope is observed, due
to the progressive cracking of the tie. Finally, the cracking process
stabilizes and the post-cracking stage starts, with a monotonic in-
crease until failure.
Previous studies show that cracking resistance and deformation
of RC members could be affected by the shrinkage generated dur-
ing the curing process [16,17]. Although the influence of shrinkage
on the deformation behaviour of RC ties was not within the scope
of this work, its possible effects on the results have been evaluated.
Hence, using the humidity and temperature readings taken during
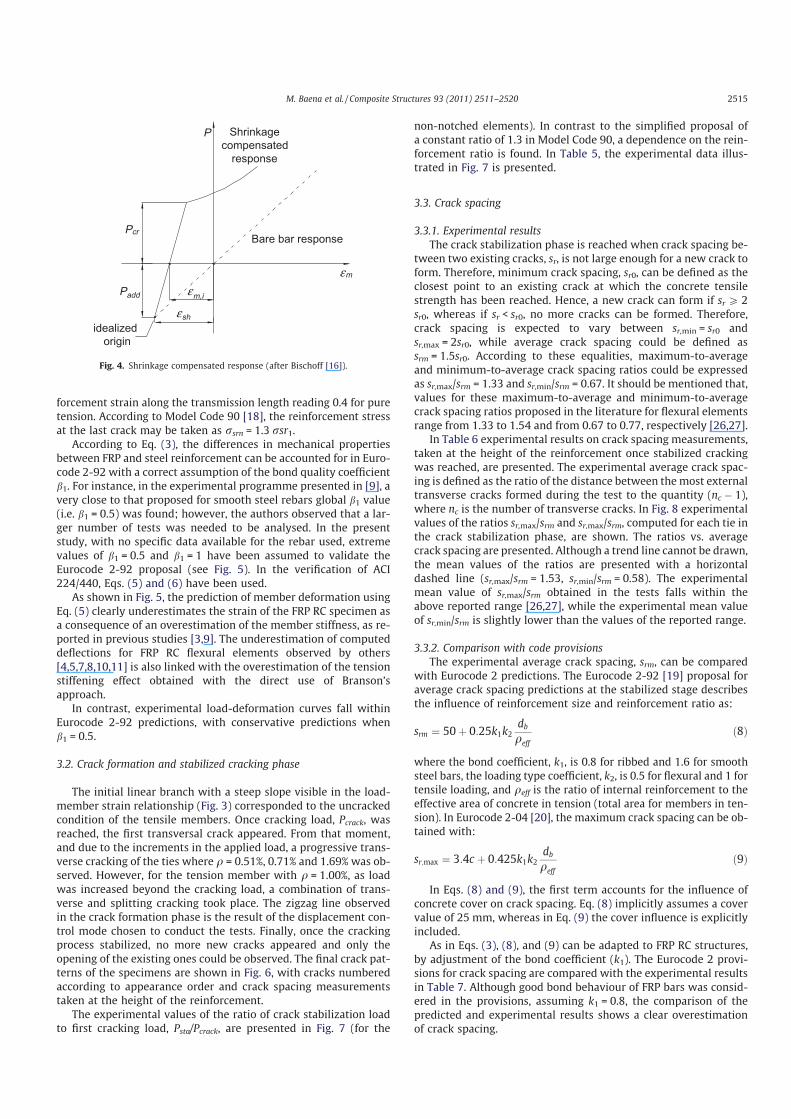
curing, Model Code 90 [18] predictions of shrinkage strains, esh,were made and are presented in Table 4. The reinforcement
embedded in the concrete provides restraints to concrete shrink-
age, leading to compressive stress in the reinforcement and tensile
stress in the concrete (see Fig. 4). Therefore, the two main effects of
the shrinkage on the final response of the RC tie are the initial
shortening of the member, em,i, and the lower cracking load (since
concrete is under an initial tensile load, hereafter referred to as
Padd). These variables can be computed as:
em;i ¼ esh=ð1þ nqÞ ð1Þ
Padd ¼ eshEFRPAFRP ð2Þ
where n is the modular ratio, q is the reinforcement ratio, EFRP is the
modulus of elasticity of the FRP bar, and AFRP is the FRP reinforcing
area.
Because the shrinkage strain values were small, the specimens
were tested early (at the age of 28 days), and the modulus of elas-
ticity of the reinforcement was low, small influence of shrinkage
was expected. The estimated initial shortening, em,i, and the addi-
tional initial load that should be added to the measured load dur-
ing testing, Padd, are shown in Table 4.
Initial member shortening resulting from shrinkage effects is ta-
ken into account when representing the member tensile behaviour
(Fig. 3) by offsetting the bare bar response with the shortening va-
lue, em,i, presented in Table 4. The largest initial shortening corre-
sponds to specimen 16-110, although its influence is barely
detected with respect to the global response.
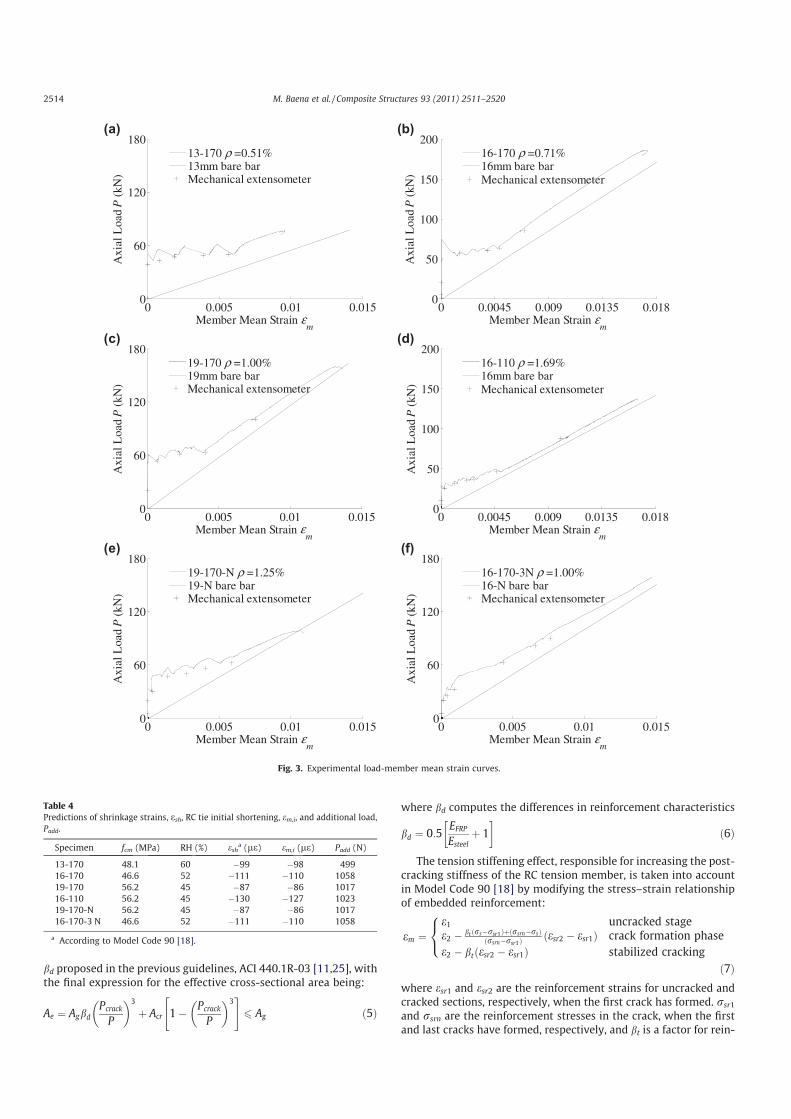
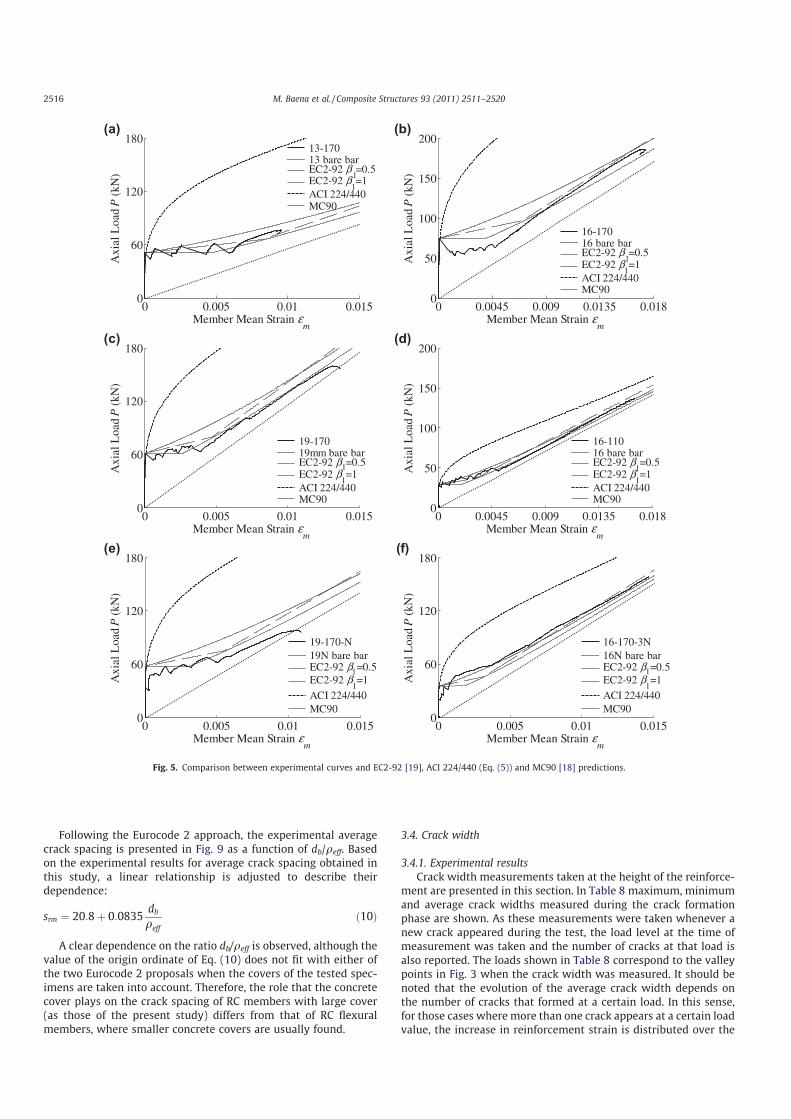
3.1.2. Comparison with guidelines and code provisions
The experimental evolution of RC tie mean strain with load is
compared with theoretical predictions based on Eurocode 2, ACI
224 and Model Code 90 in Fig. 5. According to Eurocode 2-92
[19] provisions, the mean reinforcement strain at a certain applied
load reads
em ¼ e1rcr
rs
� �2
þ e2 1ÿ b1b2
rcr
rs
� �2" #
ð3Þ
where b1 stands for the bond characteristics of the internal reinforc-
ing bars (1 for ribbed and 0.5 for smooth bars), b2 represents the
loading type (1 for first loading and 0.5 for repeated or sustained
loading), rcr is the tensile stress in the reinforcing bar at the cracked
section when the first crack occurs (rcr = Pcrack/As), rs is the stress in
the reinforcing bar at the cracked section at the actual load (rs = P/
As), and e1 and e2 are the strains calculated for the uncracked and
the fully cracked section, respectively. While Eq. (3) was proposed
for steel RC structures, predictions for FRP RC members can be com-
puted if an adequate value for the bond quality coefficient, b1, is as-
sumed. Although the current version of Eurocode 2 (Eurocode 2-04
[20]) proposes essentially the same equation, the coefficient
accounting for bond influence, b1, has been removed. Therefore
the equation from the previous version is considered to be more
adequate for the present study.
According to the ACI approach, the mean member strain of a
tensile member can be computed as em = PL/EcAe, where Ec is the
modulus of elasticity of concrete and L and Ae are the length and
the effective cross-sectional area of the reinforced tension mem-
ber. To be consistent with ACI 318.05 [21] based on Branson’s
equation [22] for SRC flexural members, ACI 224.2R-92 [23] pro-
poses an expression for the effective cross-sectional area of SRC
tensile elements, Ae, that varies gradually from the gross sectional
area, Ag, to the cracked cross-sectional area, Acr, as load increases
beyond the cracking point:
Ae ¼ Ag
Pcrack
P
� �3
þ Acr 1ÿPcrack
P
� �3" #
6 Ag ð4Þ
In ACI 440.1R-06 [24], for FRP RC flexural elements, a reduction
coefficient, bd, which depends on the balanced reinforcement ratio,
is used to modify Branson’s equation and adapt it to the FRP char-
acteristics. However, no reference is made in these guidelines to
tensile members. The balanced reinforcement ratio defined in ACI
440.1R-06 [24] cannot be computed in RC tensile elements. There-
fore, in order to study the tensile behaviour of FRP RC tension
members some authors have calibrated their own experimental
coefficient [9], whilst others have introduced the expression for
Table 3
Composition of concrete and mechanical properties.
Component Units C1
mix
C2
mix
C3
mix
Water kg/m3 160 150 160
Cement 42.5 kg/m3 450 450 400
Fine aggregate kg/m3 775 775 825
Coarse 12 aggregate kg/m3 250 250 250
Coarse 20 aggregate kg/m3 700 70 700
Super plasticiser Sika
Viscocrete 5920
% cement
weight
1.1 1.0 1.0
Super plasticiser Sikament 90P % cement
weight
– – 0.6
Super plasticiser Sikament 290 % cement
weight
0.72 0.60 –
Mechanical properties
Compressive strength, fc MPa 48.1 56.2 46.6
Elasticity Modulus, Ec MPa 27,315 33,275 34,514
M. Baena et al. / Composite Structures 93 (2011) 2511–2520 2513
bd proposed in the previous guidelines, ACI 440.1R-03 [11,25], with
the final expression for the effective cross-sectional area being:
Ae ¼ Agbd
Pcrack
P
� �3
þ Acr 1ÿPcrack
P
� �3" #
6 Ag ð5Þ
where bd computes the differences in reinforcement characteristics
bd ¼ 0:5EFRP
Esteel
þ 1
� �
ð6Þ
The tension stiffening effect, responsible for increasing the post-
cracking stiffness of the RC tension member, is taken into account
in Model Code 90 [18] by modifying the stress–strain relationship
of embedded reinforcement:
em ¼
e1 uncracked stagee2 ÿ
btðrsÿrsr1ÞþðrsrnÿrsÞ
ðrsrnÿrsr1Þðesr2 ÿ esr1Þ crack formation phase
e2 ÿ btðesr2 ÿ esr1Þ stabilized cracking
8
<
:
ð7Þ
where esr1 and esr2 are the reinforcement strains for uncracked and
cracked sections, respectively, when the first crack has formed. rsr1
and rsrn are the reinforcement stresses in the crack, when the first
and last cracks have formed, respectively, and bt is a factor for rein-
0 0.005 0.01 0.0150
60
120
180
Member Mean Strain εm
Ax
ial
Load P
(kN
)
13-170 ρ =0.51%13mm bare barMechanical extensometer
(a)
0 0.0045 0.009 0.0135 0.0180
50
100
150
200
Member Mean Strain εm
Ax
ial
Load P
(kN
)
16-170 ρ =0.71%16mm bare barMechanical extensometer
(b)
0 0.005 0.01 0.0150
60
120
180
Member Mean Strain εm
Ax
ial
Load
P (
kN
)
19-170 ρ =1.00%19mm bare barMechanical extensometer
(c)
0 0.0045 0.009 0.0135 0.0180
50
100
150
200
Member Mean Strain εm
Ax
ial
Load P
(kN
)
16-110 ρ =1.69%16mm bare barMechanical extensometer
(d)
0 0.005 0.01 0.0150
60
120
180
Member Mean Strain εm
Axia
l L
oad
P (
kN
)
19-170-N ρ =1.25%19-N bare barMechanical extensometer
(e)
0 0.005 0.01 0.0150
60
120
180
Member Mean Strain εm
Axia
l L
oad
P (
kN
)
16-170-3N ρ =1.00%16-N bare barMechanical extensometer
(f)
Fig. 3. Experimental load-member mean strain curves.
Table 4
Predictions of shrinkage strains, esh, RC tie initial shortening, em,i, and additional load,
Padd.
Specimen fcm (MPa) RH (%) esha (le) em,i (le) Padd (N)
13-170 48.1 60 ÿ99 ÿ98 499
16-170 46.6 52 ÿ111 ÿ110 1058
19-170 56.2 45 ÿ87 ÿ86 1017
16-110 56.2 45 ÿ130 ÿ127 1023
19-170-N 56.2 45 ÿ87 ÿ86 1017
16-170-3 N 46.6 52 ÿ111 ÿ110 1058
a According to Model Code 90 [18].
2514 M. Baena et al. / Composite Structures 93 (2011) 2511–2520
forcement strain along the transmission length reading 0.4 for pure
tension. According to Model Code 90 [18], the reinforcement stress
at the last crack may be taken as rsrn = 1.3 rsr1.According to Eq. (3), the differences in mechanical properties
between FRP and steel reinforcement can be accounted for in Euro-
code 2-92 with a correct assumption of the bond quality coefficient
b1. For instance, in the experimental programme presented in [9], a
very close to that proposed for smooth steel rebars global b1 value
(i.e. b1 = 0.5) was found; however, the authors observed that a lar-
ger number of tests was needed to be analysed. In the present
study, with no specific data available for the rebar used, extreme
values of b1 = 0.5 and b1 = 1 have been assumed to validate the
Eurocode 2-92 proposal (see Fig. 5). In the verification of ACI
224/440, Eqs. (5) and (6) have been used.
As shown in Fig. 5, the prediction of member deformation using
Eq. (5) clearly underestimates the strain of the FRP RC specimen as
a consequence of an overestimation of the member stiffness, as re-
ported in previous studies [3,9]. The underestimation of computed
deflections for FRP RC flexural elements observed by others
[4,5,7,8,10,11] is also linked with the overestimation of the tension
stiffening effect obtained with the direct use of Branson’s
approach.
In contrast, experimental load-deformation curves fall within
Eurocode 2-92 predictions, with conservative predictions when
b1 = 0.5.
3.2. Crack formation and stabilized cracking phase
The initial linear branch with a steep slope visible in the load-
member strain relationship (Fig. 3) corresponded to the uncracked
condition of the tensile members. Once cracking load, Pcrack, was
reached, the first transversal crack appeared. From that moment,
and due to the increments in the applied load, a progressive trans-
verse cracking of the ties where q = 0.51%, 0.71% and 1.69% was ob-
served. However, for the tension member with q = 1.00%, as load
was increased beyond the cracking load, a combination of trans-
verse and splitting cracking took place. The zigzag line observed
in the crack formation phase is the result of the displacement con-
trol mode chosen to conduct the tests. Finally, once the cracking
process stabilized, no more new cracks appeared and only the
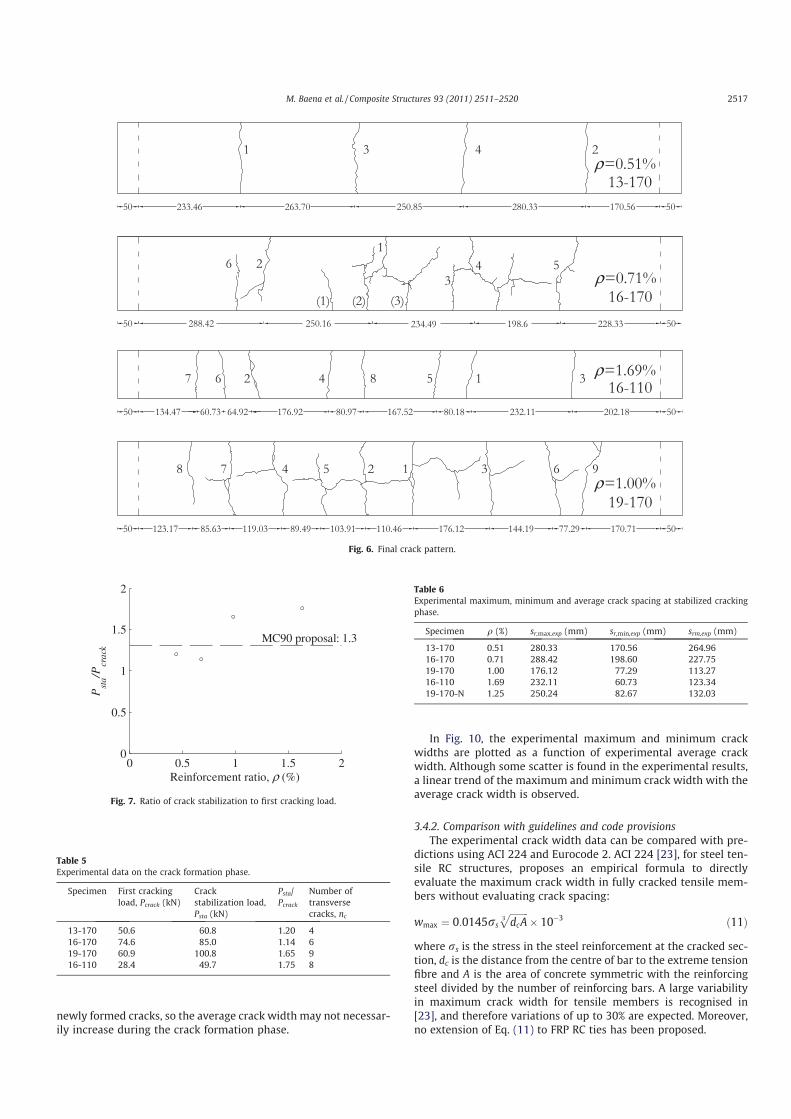
opening of the existing ones could be observed. The final crack pat-
terns of the specimens are shown in Fig. 6, with cracks numbered
according to appearance order and crack spacing measurements
taken at the height of the reinforcement.
The experimental values of the ratio of crack stabilization load
to first cracking load, Psta/Pcrack, are presented in Fig. 7 (for the
non-notched elements). In contrast to the simplified proposal of
a constant ratio of 1.3 in Model Code 90, a dependence on the rein-
forcement ratio is found. In Table 5, the experimental data illus-
trated in Fig. 7 is presented.
3.3. Crack spacing
3.3.1. Experimental results
The crack stabilization phase is reached when crack spacing be-
tween two existing cracks, sr, is not large enough for a new crack to
form. Therefore, minimum crack spacing, sr0, can be defined as the
closest point to an existing crack at which the concrete tensile
strength has been reached. Hence, a new crack can form if srP 2
sr0, whereas if sr < sr0, no more cracks can be formed. Therefore,
crack spacing is expected to vary between sr,min = sr0 and
sr,max = 2sr0, while average crack spacing could be defined as
srm = 1.5sr0. According to these equalities, maximum-to-average
and minimum-to-average crack spacing ratios could be expressed
as sr,max/srm = 1.33 and sr,min/srm = 0.67. It should be mentioned that,
values for these maximum-to-average and minimum-to-average
crack spacing ratios proposed in the literature for flexural elements
range from 1.33 to 1.54 and from 0.67 to 0.77, respectively [26,27].
In Table 6 experimental results on crack spacing measurements,
taken at the height of the reinforcement once stabilized cracking
was reached, are presented. The experimental average crack spac-
ing is defined as the ratio of the distance between the most external
transverse cracks formed during the test to the quantity (nc ÿ 1),
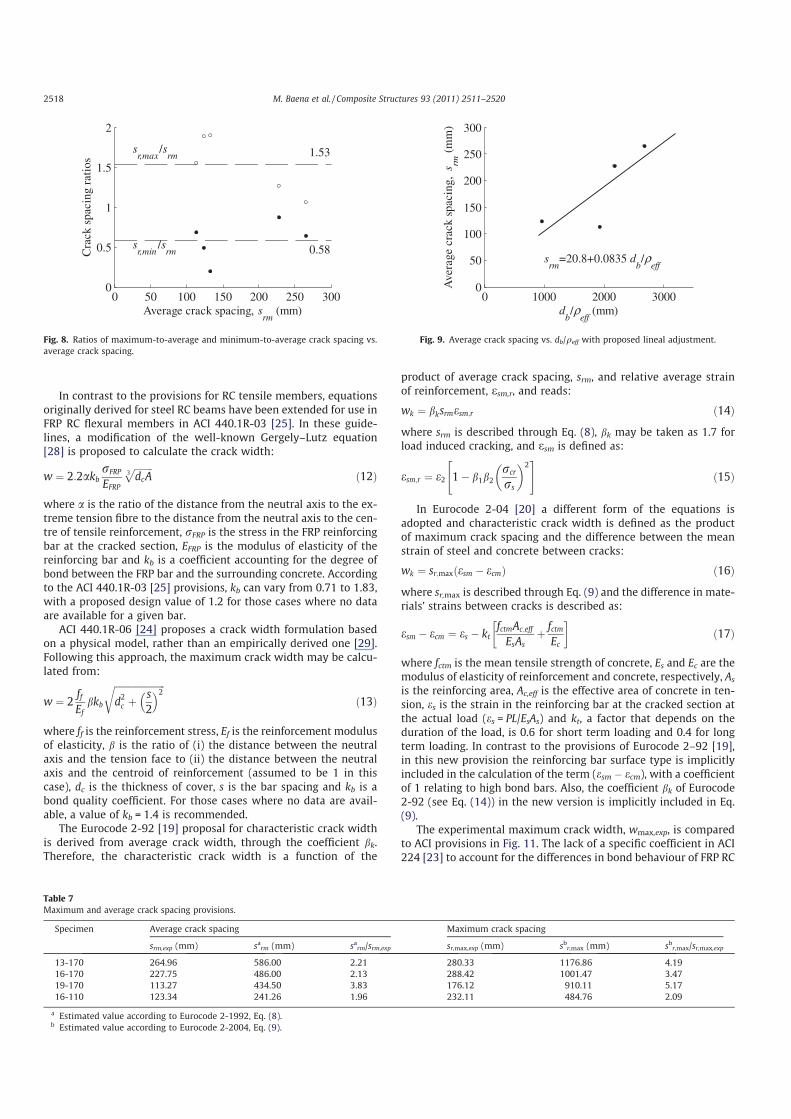
where nc is the number of transverse cracks. In Fig. 8 experimental
values of the ratios sr,max/srm and sr,max/srm, computed for each tie in
the crack stabilization phase, are shown. The ratios vs. average
crack spacing are presented. Although a trend line cannot be drawn,
the mean values of the ratios are presented with a horizontal
dashed line (sr,max/srm = 1.53, sr,min/srm = 0.58). The experimental
mean value of sr,max/srm obtained in the tests falls within the
above reported range [26,27], while the experimental mean value
of sr,min/srm is slightly lower than the values of the reported range.
3.3.2. Comparison with code provisions
The experimental average crack spacing, srm, can be compared
with Eurocode 2 predictions. The Eurocode 2-92 [19] proposal for
average crack spacing predictions at the stabilized stage describes
the influence of reinforcement size and reinforcement ratio as:
srm ¼ 50þ 0:25k1k2db
qeff
ð8Þ
where the bond coefficient, k1, is 0.8 for ribbed and 1.6 for smooth
steel bars, the loading type coefficient, k2, is 0.5 for flexural and 1 for
tensile loading, and qeff is the ratio of internal reinforcement to the
effective area of concrete in tension (total area for members in ten-
sion). In Eurocode 2-04 [20], the maximum crack spacing can be ob-
tained with:
sr;max ¼ 3:4c þ 0:425k1k2db
qeff
ð9Þ
In Eqs. (8) and (9), the first term accounts for the influence of
concrete cover on crack spacing. Eq. (8) implicitly assumes a cover
value of 25 mm, whereas in Eq. (9) the cover influence is explicitly
included.
As in Eqs. (3), (8), and (9) can be adapted to FRP RC structures,
by adjustment of the bond coefficient (k1). The Eurocode 2 provi-
sions for crack spacing are compared with the experimental results
in Table 7. Although good bond behaviour of FRP bars was consid-
ered in the provisions, assuming k1 = 0.8, the comparison of the
predicted and experimental results shows a clear overestimation
of crack spacing.
εsh
εm,iPadd
Shrinkage
compensated
response
P
εm
Pcr
idealized
origin
Bare bar response
Fig. 4. Shrinkage compensated response (after Bischoff [16]).
M. Baena et al. / Composite Structures 93 (2011) 2511–2520 2515
Following the Eurocode 2 approach, the experimental average
crack spacing is presented in Fig. 9 as a function of db/qeff. Based
on the experimental results for average crack spacing obtained in
this study, a linear relationship is adjusted to describe their
dependence:
srm ¼ 20:8þ 0:0835db
qeff
ð10Þ
A clear dependence on the ratio db/qeff is observed, although the
value of the origin ordinate of Eq. (10) does not fit with either of
the two Eurocode 2 proposals when the covers of the tested spec-
imens are taken into account. Therefore, the role that the concrete
cover plays on the crack spacing of RC members with large cover
(as those of the present study) differs from that of RC flexural
members, where smaller concrete covers are usually found.
3.4. Crack width
3.4.1. Experimental results
Crack width measurements taken at the height of the reinforce-
ment are presented in this section. In Table 8 maximum, minimum
and average crack widths measured during the crack formation
phase are shown. As these measurements were taken whenever a
new crack appeared during the test, the load level at the time of
measurement was taken and the number of cracks at that load is
also reported. The loads shown in Table 8 correspond to the valley
points in Fig. 3 when the crack width was measured. It should be
noted that the evolution of the average crack width depends on
the number of cracks that formed at a certain load. In this sense,
for those cases where more than one crack appears at a certain load
value, the increase in reinforcement strain is distributed over the
0 0.005 0.01 0.0150
60
120
180
Member Mean Strain εm
Ax
ial
Lo
ad
P (
kN
)
13-17013 bare barEC2-92 β
1=0.5
EC2-92 β1=1
ACI 224/440MC90
(a)
0 0.0045 0.009 0.0135 0.0180
50
100
150
200
Member Mean Strain εm
Axia
l L
oad
P (
kN
)
16-17016 bare barEC2-92 β
1=0.5
EC2-92 β1=1
ACI 224/440MC90
(b)
0 0.005 0.01 0.0150
60
120
180
Member Mean Strain εm
Ax
ial
Lo
ad
P (
kN
)
19-17019mm bare barEC2-92 β
1=0.5
EC2-92 β1=1
ACI 224/440MC90
(c)
0 0.0045 0.009 0.0135 0.0180
50
100
150
200
Member Mean Strain εm
Ax
ial
Load
P (
kN
)
16-11016 bare barEC2-92 β
1=0.5
EC2-92 β1=1
ACI 224/440MC90
(d)
0 0.005 0.01 0.0150
60
120
180
Member Mean Strain εm
Axia
l L
oad P
(kN
)
19-170-N
19N bare barEC2-92 β
1=0.5
EC2-92 β1=1
ACI 224/440
MC90
(e)
0 0.005 0.01 0.0150
60
120
180
Member Mean Strain εm
Axia
l L
oad P
(kN
)
16-170-3N
16N bare barEC2-92 β1=0.5
EC2-92 β1=1
ACI 224/440
MC90
(f)
Fig. 5. Comparison between experimental curves and EC2-92 [19], ACI 224/440 (Eq. (5)) and MC90 [18] predictions.
2516 M. Baena et al. / Composite Structures 93 (2011) 2511–2520
newly formed cracks, so the average crack width may not necessar-
ily increase during the crack formation phase.
In Fig. 10, the experimental maximum and minimum crack
widths are plotted as a function of experimental average crack
width. Although some scatter is found in the experimental results,
a linear trend of the maximum and minimum crack width with the
average crack width is observed.
3.4.2. Comparison with guidelines and code provisions
The experimental crack width data can be compared with pre-
dictions using ACI 224 and Eurocode 2. ACI 224 [23], for steel ten-
sile RC structures, proposes an empirical formula to directly
evaluate the maximum crack width in fully cracked tensile mem-
bers without evaluating crack spacing:
wmax ¼ 0:0145rs
ffiffiffiffiffiffiffiffi
dcA3p
� 10ÿ3 ð11Þ
where rs is the stress in the steel reinforcement at the cracked sec-
tion, dc is the distance from the centre of bar to the extreme tension
fibre and A is the area of concrete symmetric with the reinforcing
steel divided by the number of reinforcing bars. A large variability
in maximum crack width for tensile members is recognised in
[23], and therefore variations of up to 30% are expected. Moreover,
no extension of Eq. (11) to FRP RC ties has been proposed.
Fig. 6. Final crack pattern.
0 0.5 1 1.5 20
0.5
1
1.5
2
Reinforcement ratio, ρ (%)
Pst
a/P
cra
ck
MC90 proposal: 1.3
Fig. 7. Ratio of crack stabilization to first cracking load.
Table 5
Experimental data on the crack formation phase.
Specimen First cracking
load, Pcrack (kN)
Crack
stabilization load,
Psta (kN)
Psta/
Pcrack
Number of
transverse
cracks, nc
13-170 50.6 60.8 1.20 4
16-170 74.6 85.0 1.14 6
19-170 60.9 100.8 1.65 9
16-110 28.4 49.7 1.75 8
Table 6
Experimental maximum, minimum and average crack spacing at stabilized cracking
phase.
Specimen q (%) sr,max,exp (mm) sr,min,exp (mm) srm,exp (mm)
13-170 0.51 280.33 170.56 264.96
16-170 0.71 288.42 198.60 227.75
19-170 1.00 176.12 77.29 113.27
16-110 1.69 232.11 60.73 123.34
19-170-N 1.25 250.24 82.67 132.03
M. Baena et al. / Composite Structures 93 (2011) 2511–2520 2517
In contrast to the provisions for RC tensile members, equations
originally derived for steel RC beams have been extended for use in
FRP RC flexural members in ACI 440.1R-03 [25]. In these guide-
lines, a modification of the well-known Gergely–Lutz equation
[28] is proposed to calculate the crack width:
w ¼ 2:2akbrFRP
EFRP
ffiffiffiffiffiffiffiffi
dcA3p
ð12Þ
where a is the ratio of the distance from the neutral axis to the ex-
treme tension fibre to the distance from the neutral axis to the cen-
tre of tensile reinforcement, rFRP is the stress in the FRP reinforcing
bar at the cracked section, EFRP is the modulus of elasticity of the
reinforcing bar and kb is a coefficient accounting for the degree of
bond between the FRP bar and the surrounding concrete. According
to the ACI 440.1R-03 [25] provisions, kb can vary from 0.71 to 1.83,
with a proposed design value of 1.2 for those cases where no data
are available for a given bar.
ACI 440.1R-06 [24] proposes a crack width formulation based
on a physical model, rather than an empirically derived one [29].
Following this approach, the maximum crack width may be calcu-
lated from:
w ¼ 2ffEf
bkb
ffiffiffiffiffiffiffiffiffiffiffiffiffiffiffiffiffiffiffiffiffiffi
d2c þ
s
2
� �2r
ð13Þ
where ff is the reinforcement stress, Ef is the reinforcement modulus
of elasticity, b is the ratio of (i) the distance between the neutral
axis and the tension face to (ii) the distance between the neutral
axis and the centroid of reinforcement (assumed to be 1 in this
case), dc is the thickness of cover, s is the bar spacing and kb is a
bond quality coefficient. For those cases where no data are avail-
able, a value of kb = 1.4 is recommended.
The Eurocode 2-92 [19] proposal for characteristic crack width
is derived from average crack width, through the coefficient bk.
Therefore, the characteristic crack width is a function of the
product of average crack spacing, srm, and relative average strain
of reinforcement, esm,r, and reads:
wk ¼ bksrmesm;r ð14Þ
where srm is described through Eq. (8), bk may be taken as 1.7 for
load induced cracking, and esm is defined as:
esm;r ¼ e2 1ÿ b1b2
rcr
rs
� �2" #
ð15Þ
In Eurocode 2-04 [20] a different form of the equations is
adopted and characteristic crack width is defined as the product
of maximum crack spacing and the difference between the mean
strain of steel and concrete between cracks:
wk ¼ sr;maxðesm ÿ ecmÞ ð16Þ
where sr,max is described through Eq. (9) and the difference in mate-
rials’ strains between cracks is described as:
esm ÿ ecm ¼ es ÿ ktfctmAc;eff
EsAs
þfctmEc
� �
ð17Þ
where fctm is the mean tensile strength of concrete, Es and Ec are the
modulus of elasticity of reinforcement and concrete, respectively, As
is the reinforcing area, Ac,eff is the effective area of concrete in ten-
sion, es is the strain in the reinforcing bar at the cracked section at
the actual load (es = PL/EsAs) and kt, a factor that depends on the
duration of the load, is 0.6 for short term loading and 0.4 for long
term loading. In contrast to the provisions of Eurocode 2–92 [19],
in this new provision the reinforcing bar surface type is implicitly
included in the calculation of the term (esm ÿ ecm), with a coefficient
of 1 relating to high bond bars. Also, the coefficient bk of Eurocode
2-92 (see Eq. (14)) in the new version is implicitly included in Eq.
(9).
The experimental maximum crack width, wmax,exp, is compared
to ACI provisions in Fig. 11. The lack of a specific coefficient in ACI
224 [23] to account for the differences in bond behaviour of FRP RC
0 50 100 150 200 250 3000
0.5
1
1.5
2
Average crack spacing, srm
(mm)
Cra
ck s
pacin
g r
ati
os
sr,max
/srm
sr,min
/srm
1.53
0.58
Fig. 8. Ratios of maximum-to-average and minimum-to-average crack spacing vs.
average crack spacing.
Table 7
Maximum and average crack spacing provisions.
Specimen Average crack spacing Maximum crack spacing
srm,exp (mm) sarm (mm) sarm/srm,exp sr,max,exp (mm) sbr,max (mm) sbr,max/sr,max,exp
13-170 264.96 586.00 2.21 280.33 1176.86 4.19
16-170 227.75 486.00 2.13 288.42 1001.47 3.47
19-170 113.27 434.50 3.83 176.12 910.11 5.17
16-110 123.34 241.26 1.96 232.11 484.76 2.09
a Estimated value according to Eurocode 2-1992, Eq. (8).b Estimated value according to Eurocode 2-2004, Eq. (9).
0 1000 2000 30000
50
100
150
200
250
300
db/ρ
eff (mm)
Avera
ge c
rack
sp
acin
g, s
rm (
mm
)
srm
=20.8+0.0835 db/ρ
eff
Fig. 9. Average crack spacing vs. db/qeff with proposed lineal adjustment.
2518 M. Baena et al. / Composite Structures 93 (2011) 2511–2520
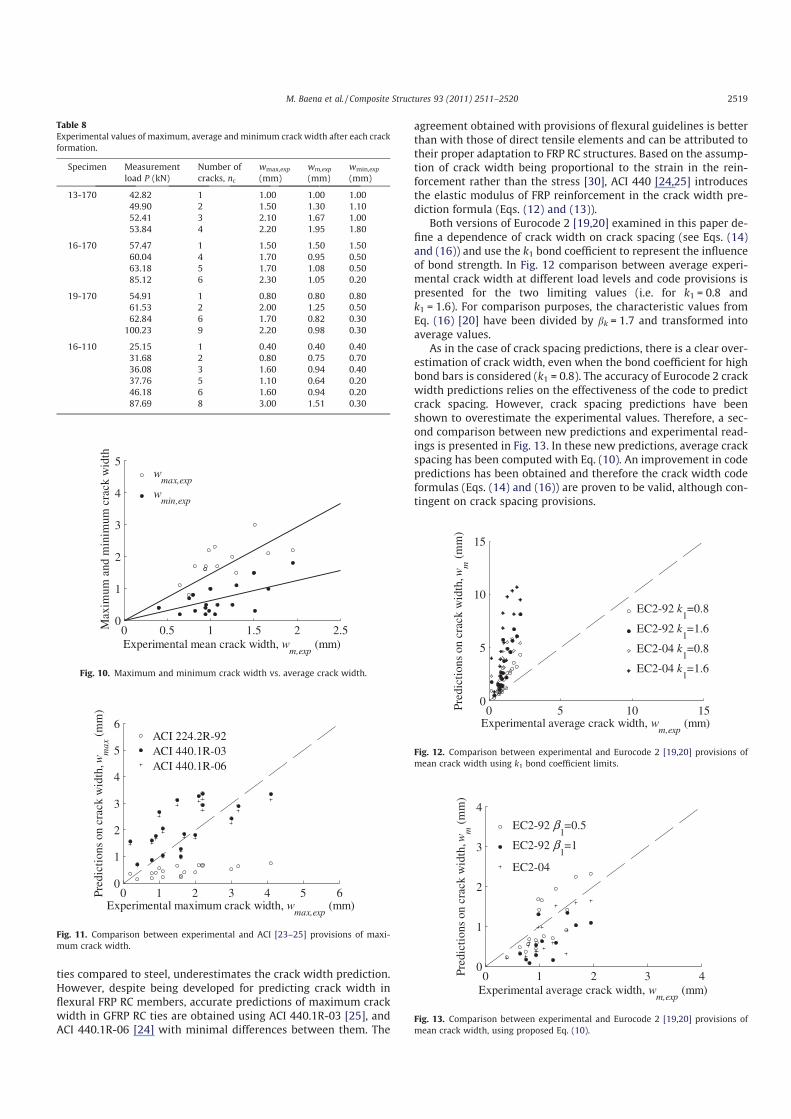
ties compared to steel, underestimates the crack width prediction.
However, despite being developed for predicting crack width in
flexural FRP RC members, accurate predictions of maximum crack
width in GFRP RC ties are obtained using ACI 440.1R-03 [25], and
ACI 440.1R-06 [24] with minimal differences between them. The
agreement obtained with provisions of flexural guidelines is better
than with those of direct tensile elements and can be attributed to
their proper adaptation to FRP RC structures. Based on the assump-
tion of crack width being proportional to the strain in the rein-
forcement rather than the stress [30], ACI 440 [24,25] introduces
the elastic modulus of FRP reinforcement in the crack width pre-
diction formula (Eqs. (12) and (13)).
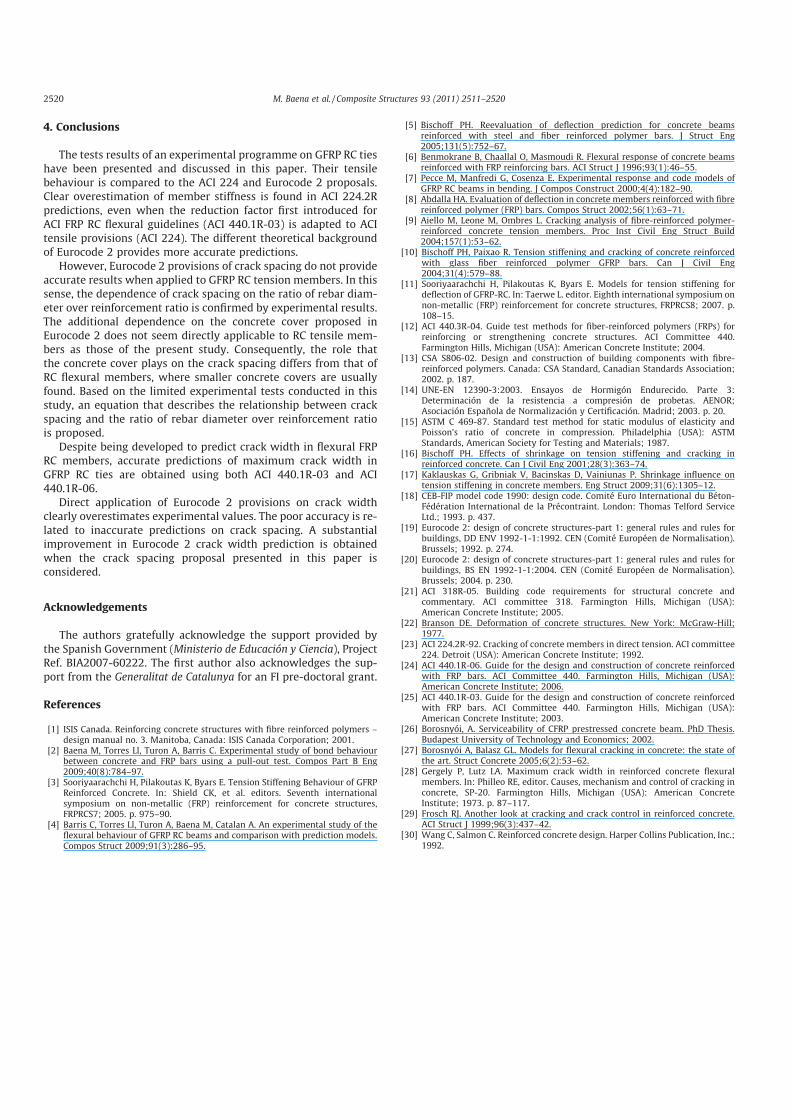
Both versions of Eurocode 2 [19,20] examined in this paper de-
fine a dependence of crack width on crack spacing (see Eqs. (14)
and (16)) and use the k1 bond coefficient to represent the influence
of bond strength. In Fig. 12 comparison between average experi-
mental crack width at different load levels and code provisions is
presented for the two limiting values (i.e. for k1 = 0.8 and
k1 = 1.6). For comparison purposes, the characteristic values from
Eq. (16) [20] have been divided by bk = 1.7 and transformed into
average values.
As in the case of crack spacing predictions, there is a clear over-
estimation of crack width, even when the bond coefficient for high
bond bars is considered (k1 = 0.8). The accuracy of Eurocode 2 crack
width predictions relies on the effectiveness of the code to predict
crack spacing. However, crack spacing predictions have been
shown to overestimate the experimental values. Therefore, a sec-
ond comparison between new predictions and experimental read-
ings is presented in Fig. 13. In these new predictions, average crack
spacing has been computed with Eq. (10). An improvement in code
predictions has been obtained and therefore the crack width code
formulas (Eqs. (14) and (16)) are proven to be valid, although con-
tingent on crack spacing provisions.
Table 8
Experimental values of maximum, average and minimum crack width after each crack
formation.
Specimen Measurement
load P (kN)
Number of
cracks, nc
wmax,exp
(mm)
wm,exp
(mm)
wmin,exp
(mm)
13-170 42.82 1 1.00 1.00 1.00
49.90 2 1.50 1.30 1.10
52.41 3 2.10 1.67 1.00
53.84 4 2.20 1.95 1.80
16-170 57.47 1 1.50 1.50 1.50
60.04 4 1.70 0.95 0.50
63.18 5 1.70 1.08 0.50
85.12 6 2.30 1.05 0.20
19-170 54.91 1 0.80 0.80 0.80
61.53 2 2.00 1.25 0.50
62.84 6 1.70 0.82 0.30
100.23 9 2.20 0.98 0.30
16-110 25.15 1 0.40 0.40 0.40
31.68 2 0.80 0.75 0.70
36.08 3 1.60 0.94 0.40
37.76 5 1.10 0.64 0.20
46.18 6 1.60 0.94 0.20
87.69 8 3.00 1.51 0.30
0 0.5 1 1.5 2 2.50
1
2
3
4
5
Experimental mean crack width, wm,exp
(mm)
Max
imum
and m
inim
um
cra
ck w
idth
wmax,exp
wmin,exp
Fig. 10. Maximum and minimum crack width vs. average crack width.
0 1 2 3 4 5 60
1
2
3
4
5
6
Experimental maximum crack width, wmax,exp
(mm)
Pre
dic
tion
s on
cra
ck w
idth
, wm
ax (
mm
)
ACI 224.2R-92
ACI 440.1R-03
ACI 440.1R-06
Fig. 11. Comparison between experimental and ACI [23–25] provisions of maxi-
mum crack width.
0 5 10 150
5
10
15
Experimental average crack width, wm,exp
(mm)
Pre
dic
tio
ns
on
cra
ck
wid
th, w
m (
mm
)
EC2-92 k1=0.8
EC2-92 k1=1.6
EC2-04 k1=0.8
EC2-04 k1=1.6
Fig. 12. Comparison between experimental and Eurocode 2 [19,20] provisions of
mean crack width using k1 bond coefficient limits.
0 1 2 3 40
1
2
3
4
Experimental average crack width, wm,exp
(mm)
Pre
dic
tio
ns
on
cra
ck
wid
th, w
m (
mm
)
EC2-92 β1=0.5
EC2-92 β1=1
EC2-04
Fig. 13. Comparison between experimental and Eurocode 2 [19,20] provisions of
mean crack width, using proposed Eq. (10).
M. Baena et al. / Composite Structures 93 (2011) 2511–2520 2519
4. Conclusions
The tests results of an experimental programme on GFRP RC ties
have been presented and discussed in this paper. Their tensile
behaviour is compared to the ACI 224 and Eurocode 2 proposals.
Clear overestimation of member stiffness is found in ACI 224.2R
predictions, even when the reduction factor first introduced for
ACI FRP RC flexural guidelines (ACI 440.1R-03) is adapted to ACI
tensile provisions (ACI 224). The different theoretical background
of Eurocode 2 provides more accurate predictions.
However, Eurocode 2 provisions of crack spacing do not provide
accurate results when applied to GFRP RC tension members. In this
sense, the dependence of crack spacing on the ratio of rebar diam-
eter over reinforcement ratio is confirmed by experimental results.
The additional dependence on the concrete cover proposed in
Eurocode 2 does not seem directly applicable to RC tensile mem-
bers as those of the present study. Consequently, the role that
the concrete cover plays on the crack spacing differs from that of
RC flexural members, where smaller concrete covers are usually
found. Based on the limited experimental tests conducted in this
study, an equation that describes the relationship between crack
spacing and the ratio of rebar diameter over reinforcement ratio
is proposed.
Despite being developed to predict crack width in flexural FRP
RC members, accurate predictions of maximum crack width in
GFRP RC ties are obtained using both ACI 440.1R-03 and ACI
440.1R-06.
Direct application of Eurocode 2 provisions on crack width
clearly overestimates experimental values. The poor accuracy is re-
lated to inaccurate predictions on crack spacing. A substantial
improvement in Eurocode 2 crack width prediction is obtained
when the crack spacing proposal presented in this paper is
considered.
Acknowledgements
The authors gratefully acknowledge the support provided by
the Spanish Government (Ministerio de Educación y Ciencia), Project
Ref. BIA2007-60222. The first author also acknowledges the sup-
port from the Generalitat de Catalunya for an FI pre-doctoral grant.
References
[1] ISIS Canada. Reinforcing concrete structures with fibre reinforced polymers –design manual no. 3. Manitoba, Canada: ISIS Canada Corporation; 2001.
[2] Baena M, Torres Ll, Turon A, Barris C. Experimental study of bond behaviourbetween concrete and FRP bars using a pull-out test. Compos Part B Eng2009;40(8):784–97.
[3] Sooriyaarachchi H, Pilakoutas K, Byars E. Tension Stiffening Behaviour of GFRPReinforced Concrete. In: Shield CK, et al. editors. Seventh internationalsymposium on non-metallic (FRP) reinforcement for concrete structures,FRPRCS7; 2005. p. 975–90.
[4] Barris C, Torres Ll, Turon A, Baena M, Catalan A. An experimental study of theflexural behaviour of GFRP RC beams and comparison with prediction models.Compos Struct 2009;91(3):286–95.
[5] Bischoff PH. Reevaluation of deflection prediction for concrete beamsreinforced with steel and fiber reinforced polymer bars. J Struct Eng2005;131(5):752–67.
[6] Benmokrane B, Chaallal O, Masmoudi R. Flexural response of concrete beamsreinforced with FRP reinforcing bars. ACI Struct J 1996;93(1):46–55.
[7] Pecce M, Manfredi G, Cosenza E. Experimental response and code models ofGFRP RC beams in bending. J Compos Construct 2000;4(4):182–90.
[8] Abdalla HA. Evaluation of deflection in concrete members reinforced with fibrereinforced polymer (FRP) bars. Compos Struct 2002;56(1):63–71.
[9] Aiello M, Leone M, Ombres L. Cracking analysis of fibre-reinforced polymer-reinforced concrete tension members. Proc Inst Civil Eng Struct Build2004;157(1):53–62.
[10] Bischoff PH, Paixao R. Tension stiffening and cracking of concrete reinforcedwith glass fiber reinforced polymer GFRP bars. Can J Civil Eng2004;31(4):579–88.
[11] Sooriyaarachchi H, Pilakoutas K, Byars E. Models for tension stiffening fordeflection of GFRP-RC. In: Taerwe L. editor. Eighth international symposium onnon-metallic (FRP) reinforcement for concrete structures, FRPRCS8; 2007. p.108–15.
[12] ACI 440.3R-04. Guide test methods for fiber-reinforced polymers (FRPs) forreinforcing or strengthening concrete structures. ACI Committee 440.Farmington Hills, Michigan (USA): American Concrete Institute; 2004.
[13] CSA S806-02. Design and construction of building components with fibre-reinforced polymers. Canada: CSA Standard, Canadian Standards Association;2002. p. 187.
[14] UNE-EN 12390-3:2003. Ensayos de Hormigón Endurecido. Parte 3:Determinación de la resistencia a compresión de probetas. AENOR;Asociación Española de Normalización y Certificación. Madrid; 2003. p. 20.
[15] ASTM C 469-87. Standard test method for static modulus of elasticity andPoisson’s ratio of concrete in compression. Philadelphia (USA): ASTMStandards, American Society for Testing and Materials; 1987.
[16] Bischoff PH. Effects of shrinkage on tension stiffening and cracking inreinforced concrete. Can J Civil Eng 2001;28(3):363–74.
[17] Kaklauskas G, Gribniak V, Bacinskas D, Vainiunas P. Shrinkage influence ontension stiffening in concrete members. Eng Struct 2009;31(6):1305–12.
[18] CEB-FIP model code 1990: design code. Comité Euro International du Béton-Fédération International de la Précontraint. London: Thomas Telford ServiceLtd.; 1993. p. 437.
[19] Eurocode 2: design of concrete structures-part 1: general rules and rules forbuildings, DD ENV 1992-1-1:1992. CEN (Comité Européen de Normalisation).Brussels; 1992. p. 274.
[20] Eurocode 2: design of concrete structures-part 1: general rules and rules forbuildings, BS EN 1992-1-1:2004. CEN (Comité Européen de Normalisation).Brussels; 2004. p. 230.
[21] ACI 318R-05. Building code requirements for structural concrete andcommentary. ACI committee 318. Farmington Hills, Michigan (USA):American Concrete Institute; 2005.
[22] Branson DE. Deformation of concrete structures. New York: McGraw-Hill;1977.
[23] ACI 224.2R-92. Cracking of concrete members in direct tension. ACI committee224. Detroit (USA): American Concrete Institute; 1992.
[24] ACI 440.1R-06. Guide for the design and construction of concrete reinforcedwith FRP bars. ACI Committee 440. Farmington Hills, Michigan (USA):American Concrete Institute; 2006.
[25] ACI 440.1R-03. Guide for the design and construction of concrete reinforcedwith FRP bars. ACI Committee 440. Farmington Hills, Michigan (USA):American Concrete Institute; 2003.
[26] Borosnyói, A. Serviceability of CFRP prestressed concrete beam. PhD Thesis.Budapest University of Technology and Economics; 2002.
[27] Borosnyói A, Balasz GL. Models for flexural cracking in concrete: the state ofthe art. Struct Concrete 2005;6(2):53–62.
[28] Gergely P, Lutz LA. Maximum crack width in reinforced concrete flexuralmembers. In: Philleo RE, editor. Causes, mechanism and control of cracking inconcrete, SP-20. Farmington Hills, Michigan (USA): American ConcreteInstitute; 1973. p. 87–117.
[29] Frosch RJ. Another look at cracking and crack control in reinforced concrete.ACI Struct J 1999;96(3):437–42.
[30] Wang C, Salmon C. Reinforced concrete design. Harper Collins Publication, Inc.;1992.
2520 M. Baena et al. / Composite Structures 93 (2011) 2511–2520


