Embed Size (px)
Citation preview
J . FZuid Mech. (1985). vol. 153, pp. 361-388
Printed in Oreat Britain 361
Experimental results in a physical model of the cochlea
By CLAUD10 CANCELLI, SALVO D’ANGELO, MARCELLO MASILI
Dipartimento ingegneria aeronautica e spaziale, Politecnico di Torino, C.so Duca degli Abruzzi 24, 10100, Torino
AND RICCARDO MALVANO Centro di studio per la dinamica dei fluidi (Consiglio nazionale delle ricerche),
C.so Duca degli Abruzzi 24, 10100, Torino
(Received 16 January 1984)
Previous contributions made by physical models to the understanding of cochlear mechanics suggested that a new cochlear model should be constructed. This paper illustrates the results obtained with a rectilinear, three-chamber model. The model was geometrically scaled 50: 1 and contained the constituent elements of the cochlear cross-section including the basilar membrane, Reissner’s membrane, the tectorial membrane and the organ of Corti. The basilar membrane was stretched crosswise in order to simulate real basilar membrane anisotropy. Two kinds (rigid and elastic) of tectorial membranes were used. The ductus and the sulcus were made visible and the model was also provided with displacement transducers to measure the axial and cross components of the oscillating fluid motion in the scala media. The adoption of a highly flexible membrane, simulating Reissner’s membrane, made it possible to vary the viscosity of the scala media compared to that of the other two scalae. The reasons why the simplifications of the previous models were partially rejected and the criteria adopted to assure dynamic similitude between the model and the real cochlea are described in the paper. The results of tests carried out to determine the partial distribution of the amplitude maximum, the phase velocity along the axis of the model and the dispersion curves are shown. The same tests were repeated with partially filled scala vestibuli. Lastly a typical nonlinear feature, that is a continuous flow in the scala media, is described.
1. Introduction Experiments on physical models of the cochlea have gone some way to further our
understanding of cochlear mechanics. It is more difficult to obtain results from physical than from mathematical or electrical models since the former require measurements of rather small displacements, particularly when the input signal level is low enough to maintain similarity with the real cochlea with respect to nonlinear phenomena. However, physical models do not require a great number of a priori simplifications and they permit us to analyse some peculiarities of the velocity field and its nonlinear aspects which cannot be detected by any other method. Physical models have thus drawn researchers’ attention to the appearance of eddies in the scala tympani and in the scala vestibuli (BBkBsy 1928), to possible hydrodynamic
362 C. Cancelli, S. D’Angelo, M. Masili and R. Malvano
distortions of the acoustic signal (Tonndorf 1970) and to a continuous motion of the fluid from the sulcus to the scala media (Helle 1974b). In addition, the experimental results which Cannel (1969) and Helle (1974a) obtained with physical models have been used by Steele & Taber (1979a, b) to prove that the asymptotic method, named WKB, is applicable to fully three-dimensional fluid motion.
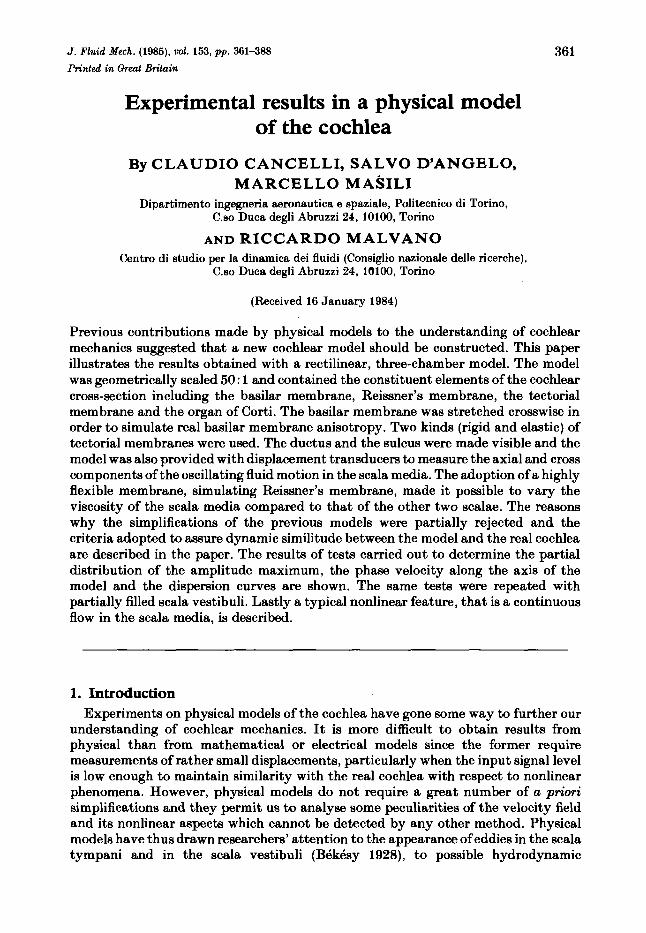
Obviously, the main problem in the design of physical models is to find adequate criteria to assure dynamic similitude between the model and the real cochlea. Although other authors had previously constructed hydromechanical models in order to obtain qualitative confirmation of their views about cochlear functioning (Meyer 1896; Ewald 1899,1903; both quoted in Tonndorf 1970), BBkBsy was the first (1928) to deal with this subject in depth. He conducted experimental measurements of many mechanical magnitudes of the real cochlea and tried to determine the necessary conditions for dynamic similitude through the method of dimensional analysis. Some empirical observations of cochlear motion and a set of experiments conducted on different models, one of which included the cochlear duct (scala media) (BBkBsy 1960, p. 423), led him to believe that reproduction of basilar membrane motion could be obtained with quite a simple model, like that shown in figure 1. The model consisted of just two rectilinear fluid ducts, coupled by means of an elastic partition with variable stiffness along the axis (the basilar membrane) ; these ducts communicated through a small passageway (helicotrema) placed at one end (cochlea apex) of the model. The remaining walls of the ducts, representing the scala vestibuli and scala tympani, were rigid except for two openings closed by elastic membranes. One of these received its oscillating motion from the outside, in this way simulating the coupling between the oval window and the stapes; the other membrane, clamped in bone and of negligible stiffness, made possible the motion of the incompressible fluid within both scalae, carrying out the function of the round window in the real cochlea. Subsequently, Tonndorf (1957, 1959), Cannel (1969), and Helle (1974a, b) with his K model, followed thia configuration. Helle also constructed two more complex models, simulating both the tectorial membrane and the organ of Corti. He observed an interesting nonlinear phenomenon in these : a continuous fluid motion whose cross component - coming out of the sulcus through the layer between the tectorial
Experimental results in a physical model of the cochlea 363
Sc. vestibuli i
Tectorial m.
I / SC. tympani
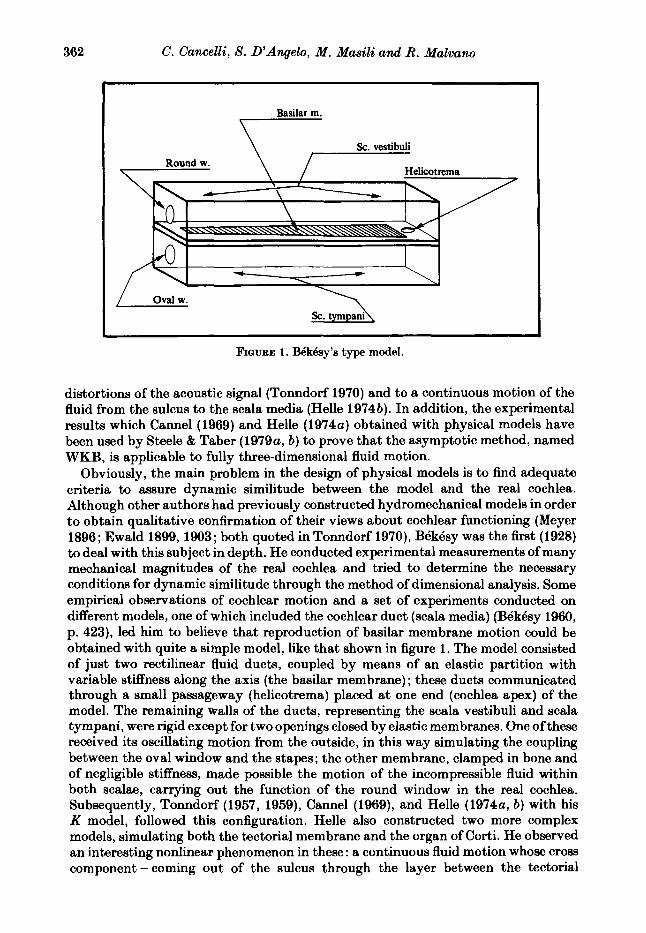
FIQURE 2. Authors’ model.
membrane and the Corti organ - was more sharply concentrated than the basilar membrane response.
In the present paper, experimental results obtained with a rectilinear axis, three-chamber model (figure 2) are described. The model is geometrically scaled 50/1 and contains the constituent elements of the cochlear cross-section, including the basilar membrane, Reissner’s membrane, the tectorial membrane and the organ of Corti. Various reasons induced us partially to reject BQkBsy ’s simplifications and adopt a more complex geometry than that used in previous models:
(1) We were interested in the oscillatory and continuous fluid motions of the scala media, which are still rather unknown. To this purpose, the ductus and the sulcus were made visible and the model was also provided with displacement transducers which measured the axial and the cross components of the oscillating fluid motion in the scala media.
(2) We thought that the inertia of the organ of Corti, of the tectorial membrane and of the fluid in motion between both organs was important if we were to obtain a realistic dynamical simulation of basilar membrane motion. BBkBsy’s dimensional analysis ignored the mass and the viscosity of the structures and of the liquid in the scala media. However, the mass of the basilar membrane and of the organ of Corti, or the mass of the whole scala media, is an essential element in the mathematical models, which, according to Lighthill (1981), give a higher degree of agreement with the most recent data on the oscillating motion in the real cochlea (Rhode 1971). If the physical implications of BQkBsy’s similarity conditions are analysed, it can be concluded that they merely ensure the similarity of the motion in a section of the model adjacent to the cochlear windows and of length depending on the input signal frequency. BBkBsy’s conditions are probably not sufficient for an accurate repro- duction of the fluid motion in the area around the site of the maximum response of the basilar membrane.
(3) Finally, the adoption of a highly flexible membrane to simulate Reissner’s membrane allowed us to vary the viscosity of the liquid in the scala media relative to the viscosity of the liquid in the scala tympani and in the scala vestibuli.
364 C. Cancelli, S . D’Angelo, M. Masili and R. Malvano
2. Similarity conditions 2.1. Geometric and dynamic similitude in BCke‘sy’s model
On the problem of the dynamic similitude between the model and the real cochlea, BBkBsy (1928) considered the perilymph viscosity and density, the basilar membrane compliance, the acoustic signal frequerlcy, and the characteristic length of the cochlea as the main physical magnitudes affecting the oscillating motion in the inner ear. Using these magnitudes, he formulated two independent and dimensionless parameters by the usual method of dimensional analysis. In our notation, the characteristic ratios adopted by BBkBsy were :
wL2 pv2z ’ L4 ’
- - V
where w is the radian signal frequency, v and p the kinematic viscosity and density of the perilymph, L the characteristic length of the cochlea and Z the basilar membrane comp1iance.t
If this set of physical magnitudes had been complete and the geometric similitude respected, the motion similitude would have been obtained by keeping in the model the values that these numbers have in the real cochlea.
BBkBsy’s set of magnitudes did not include the mass of the basilar membrane or the organ of Corti, nor the endolymph viscosity, nor anything to represent the input signal amplitude, as for instance the longitudinal velocity u of the oval window. The omission of the input-signal amplitude may be justified as long as the cochlea behaves as a linear system; so, such an omission seems to be acceptable, since mechanical nonlinearities begin a t signal amplitudes which are most likely beyond the physiological range of intensity (Steele 1979). It must, however, be observed that many aspects of the motion, highlighted and analysed by means of physical models, are typically nonlinear : (a) formation of eddies (BBkBsy 1928) ; (b) appearance of components whose frequencies are not included in the input-signal spectrum (Tonndorf 1958) ; ( c ) continuous motion of fluid; ( d ) changing with the motion of the time-averaged width of the gap between the organ of Corti and the tectorial membrane (Helle 1974). Therefore we can say that the models were certainly used out of the linear range.
The omission of the mass and the viscosity of the cochlear duct is more questionable. Due to the supposed high viscosity in the endolymph,$ BQkBsy assumed that the phase and the volume displacement of Reissner’s membrane were the same as those of the basilar membrane. He therefore considered Reissner’s membrane, whose elastic stiffness is negligible compared to the basilar membrane, and the whole cochlear duct as not essential to the perilymph motion. BQkBsy also constructed a model containing Reissner’s membrane and the duct ; and, comparing this model with others which did not include these parts, he obtained a qualitative confirmation of his opinion (BQkBsy 1960, p. 423). BBkBsy’s conclusion is, however, not correct: even if we assume that the duct moves as a whole, the substitution of the duct with only one membrane should not be acceptable. The substitution changes the dynamic coupling between the fluid motions of the scala tympani and of the scala vestibuli, drastically reducing
t Compliance Z is the ratio between the variation of the cross-sectional area in one scala, due to the static elastic deformation of the basilar membrane, and the difference of pressure evenly distributed in both scalae which produces such a variation.
$ BBk6sy described the endolymph as gelatinous fluid. According to more recent data (Robles, Rhode & Geisler 1976) i t is not as viscous as BBk6sy thought.
Experimental results in a physical model of the cochlea 365
the inertia and viscous forces resulting from the movement of the basilar membrane. The set of significant magnitudes of the phenomenon should have included the partition mass and the damping coefficient per unit of length, even if the researcher’s attention had been focused only on the basilar membrane and perilymph motion.
It can easily be seen that accordance with BBkBsy ’s dimensionless coefficients will ensure similitude only where the elastic component in the partition response is greater than the inertial and viscous component; this is, however, not true in the whole cochlea. It may reasonably be thought that the partition mass is important in determining where the basilar membrane response is at its maximum (Lighthill 1981), but even theories which deny importance to the mass, as does Zwislocki’s one- dimensional theory (1953), give particular emphasis to the viscosity. A more complete set of dimensionlea coefficients and some understanding of their role can be obtained through the normalization of the motion equations.
2.2. Analysis of the dimensionless coejicients of the normalized equations of the flow field in the cochlea
The motion in the cochlea is governed by the continuity and momentum equations of a divergenceless flow of a viscous liquid and by the boundary conditions of the flow field, one of which is represented by the dynamical equation of the cochlear partition. By normalizing the latter and the NavierStokes equation, a set of dimensionless coefficients is readily obtained. No more coefficients emerge from the normalization of the other boundary conditions ; Reiasner’s membrane can be ignored, due to its negligible stiffness and mass. The dimensionless coefficients are:
U v 02M pwZ Lo’ La,’ s , s ’ - - -
where L is the characteristic length of the cochlea, w and u are the radian frequency and the velocity amplitude of the input signal, v and p are the kinematic viscosity and the density of the perilymph, and S and M are the generalized stiffness and mass of the cochlear partition per unit of length. If a kinematic viscosity v, of the endolymph which is different from the kinematic viscosity of the perilymph is to be taken into account, the ratio v/v, must be added to the set of coefficients. The scales used for non-dimensionalization are as follows: length, L ; time, l/w; velocity, u ; pressure, p L w .
The generalized mass and stiffness of a strip of partition of unit length are defined by the relations (Lighthill 1981, p. 164):
where q is the generalized coordinate of the basilar membrane displacement and T and U are the kinetic and potential energy of the cochlear partition per unit of length. Following Lighthill (1981, p. 199), we choose as generalized coordinate q, the variation in the scala tympani cross-sectional area due to the basilar membrane displacement z = qt;(x,) across the width 0 < xa < b of the basilar membrane. In this way, the bending mode [(x,) satisfies the normalizing condition :
366 C. Caneelli, S. D’Angelo, M . Ma& and R. Malvano
and the generalized mass becomes :
rb
where h(x2) is the thickness of the partition structures, the density of which has been taken as indistinguishable from the density p of the perilymph. The stiffness S is essentially equal to the inverse of BBkBsy’s compliance, as long as the longitudinal curvature of the deformation of the basilar membrane is not very large.
As represented by the dimensionless variables, the flow field is not altered provided that geometric similitude and the dimensionless coefficients are maintained. Main- taining the real values of the coefficients v/L2w and pw2/S in the model is equivalent to respecting BBkBsy’s similitude conditions, as these coefficients are two independent dimensionless ratios in the same five magnitudes. The first coefficient represents the square of the ratio of the thickness ( v / w ) i of the viscous boundary layer, typically found in wave propagation, to the characteristic length of the cochlea. The second coefficient represents the ratio of the inertia of the liquid to the elastic reaction of the partition. Leaving aside the coefficient ulLw, which symbolizes the importance of the nonlinear terms relative to the linear terms in the liquid motion and has, in any case, a small influence on the membrane motion (Lesser & Berkley, 1972), and also the coefficient v / v , which is probably not very different from 1, we can say that BBkBsy’s conditions ensure similitude where the coefficient w2M/S is so small that it can be considered of no significance.
The radian frequency (SIM): is the natural frequency of a partition strip having unit length, on the assumption that any strip may be considered independent; the coefficient w2M/S is the ratio of the inertia to the elastic component of the partition response in an oscillating motion of radian frequency w . The partition mass does not change very much along the cochlear axis, while the stiffness S probably changes by three orders of magnitude, being higher near the stapes and decreasing rapidly from there ; the ratio w 2 M / S therefore changes correspondingly. In the cochlea, when the frequency of the input signal is included in the usual acoustic range (from about 0.1 to 16 kHz), a region certainly exists near the stapes where the ratio weMIS is very small and the inertia component of the partition response is negligible. Such a region, however, extends to the whole cochlea only when frequencies are lower than 1 kHz. In the case of higher frequencies, although some doubts exist about the effective value to be assigned to (SIMP, it can reasonably be considered that this region progressively reduces to disappearance in the highest frequencies of the acoustic range. Thus, in order to have satisfactory similarity in the whole model, it seems to be essential to maintain the real value of w 2 M / S . However, when BBkBsy’s conditions are fulfilled, this new condition is immediately satisfied if the shape of the internal structures of the scala media is kept, and the structures themselves are reproduced with a material whose density is equal, or very similar, to the density of the liquid around them. Nothing more than the reproduction in the model of the scala media is required for a closer approach to the similarity conditions. In fact, it is:
where the integral is a dimensionless quantity, and does not change provided that the geometric similitude is respected. Therefore, if pw2/S is kept constant, and if the
Experimental results in a physical model of the cochlea 367
displacement mode g of the model membrane is not very different from the displacement mode of the real membrane, the ratio w 2 M / S also is similar to its actual value.
Also, the problem of the dependence of the stiffness S on the basilar membrane longitudinal curvature is worth mentioning. Lighthill (1981) noticed that the theoretical models able to explain the high selectivity of the membrane and its functioning as a high-frequency cutoff all have one common feature : the energy flow in the cochlea from the base to the apex stops at the point of the basilar membrane where the natural frequency (SIM): coincides with the frequency w of the input signal. To ensure this condition, the stiffness S must depend weakly on the membrane longitudinal curvature. Therefore, if
c (x , ) ei(Ut-&)
represents the displacement wave of the basilar membrane, S should be nearly independent of the wavenumber k as long as possible. As the basilar membrane is actually a plate rather than a true membrane, the expression for S must include terms in (kb/n)2 and ( k b / ~ ) ~ (Steele & Taber 1979). These terms are negligible only for ( k b l x ) 4 1 , if the membrane is isotropic; as k increases they eventually become significant. But this can be delayed if the membrane elastic modulus in the longitudinal direction and in the cross direction are different, the former being obviously smaller than the latter. In this case, the contribution of the longitudinal curvature to the elastic energy decreases and the membrane behaviour is similar to a set of independent cross oscillators.
Anisotropy in the real membrane was suspected for a long time, due to cross arrangement of the fibres constituting its structure. But BBkBsy’s (1960, pp. 471472) experiments on static deflection seemed to deny this hypothesis. However, more recently Voldrich (1978), who repeated Bdkdsy’s experiments, demonstrated that the guinea pig membrane shows remarkable anisotropy, which rapidly disappears after death; this may explain the disagreement with the previous results. Both the experimental data and the theoretical considerations suggest that some degree of anisotropy is an important characteristic of the real membrane; such a characteristic should thus be included in a physical model of the membrane.
Finally, in order to maintain the ratio p / w L constant, the amplitude u / w of the input signal in the model must be multiplied by the same scale factor as that which multiplies the real size of the cochlea.
Although the model is greatly enlarged if compared to the real cochlea (50 times in the present model), the displacements to be measured remain very small, unless an extremely large acoustic signal is simulated.
2.3. Geometrical similitude The cochlea geometry is complex and can hardly be reproduced in a physical model. Two aspects of its geometry may, however, be dropped without greatly altering the representation of the phenomenon. The first is the spiral shape of the cochlea. BBk6sy (1928) also neglected the curvature of the spiral scalae, which scarcely exists in some animals.
This assumption is confirmed by Steele’s (1977) calculations about fluid impedance in a toroidal model, Viergever’s (1980, pp. 45-50) treatment of the motion equations in curvilinear coordinates, and Loh’s (1983) and Steele & Zais’ (1985) computations
368 C. Cancelli, 8. D’Angelo, M . Masili and R. Malvano
of the basilar membrane response.? Also, the irregular circular shape of the cochlea cross-section may be represented by a rectangular shape with the same area. Actually, in the basal area of the model, where the wavelength is greater than the depth of the scalae, the motion is nearly one-dimensional and only the cross-section area is important. In the apical area, where the wavelength is short, the fluid motions are progressively confined more and more to the neighbourhood of the cochlear partition where they cannot be significantly influenced by the shape of the rigid boundary (Lighthill 1981, p. 206).
In conclusion, a rectilinear model, like that shown in figure 2, seems to be accept- able. In such a model, the ratio between the areas of the two scalae is equal to the effective ratio in the basal area and the basilar membrane width changes along the axis in the model, as in the real cochlea.
3. Description of the model The model (figure 2) consists of three channels separated by two membranes. The
scala tympani and scala vestibuli communicate at one end through a small passageway which simulates the helicotrema. The upper membrane, simulating Reissner’s membrane, consists of a transparent nylon film 0.1 mm thick; this is flaccid and its only function is to separate the fluid in the scala media from the fluid in the scala tympani and in the scala vestibuli. The lower partition is a composite structure which can be seen in figure 3, where the model cross-section is represented. It consists of a 1 mm thick rubber latex membrane with a 1.8 N/mmz elastic modulus, a rubber rib (with a 4 x 4 mm square section) which has a 1.7 N/mm2 elastic modulus, and some silicone wax.
The membrane was stretched crosswise in order to simulate the anisotropy in the elastic stiffness of the real basilar membrane, the importance of which has already been mentioned. The maximum intensity of the transversal stress was near the stapes; from there it started to decrease until i t disappeared in the apical area. The membrane was closed in a brass frame fastened to the Plexiglas structure of the model. The frame is shaped in order to reproduce the basilar membrane variable width. The operation of closing the membrane in its frame changes the initial stress of the rubber and forces the material flow back towards the inside; the strength of the fastening bolts of the frame was therefore adjusted empirically until a smooth variation of the membrane compliance was obtained.
A square-section prism was attached to the membrane; this was provided with V-shaped cuts every 4-5 mm, so that it behaved, from the point of view of the elastic stiffness, as an independent sequence of elements. Finally, the whole was shaped with silicone wax until a rough reproduction of the organ of Corti was obtained. A soft rubber structure, simulating the tectorial membrane and made of elements 5 cm long,
t A different opinion about this subject was expressed by Huxley (1969) who estimated that the combination of longitudinal stiffness of the partition and spiral shape of the cochlea could cause a sharply tuned oscillation of the basilar membrane. Lieberstein (1971,1972) also considered coiling an essential feature of the cochlea. According to this author, curvatures of arc segments of the cochlea helical spiral and the corresponding span of the basilar membrane across the cochlea appear to be principally responsible for frequency discrimination. Lieberstein, however, disregarded the fluid motion and proposed a uniformly loaded plate, clamped on two lateral edges and on both ends, as a model of the basilar membrane. The authors who properly approached the matter as a fluid-mechanical problem with the dynamical behaviour of the basilar membrane as a boundary condition found that the response of the basilar membrane in cochlear models is not significantly affected by coiling.
Experimental results in a physical model of the cochlea 369
A ~~ ~
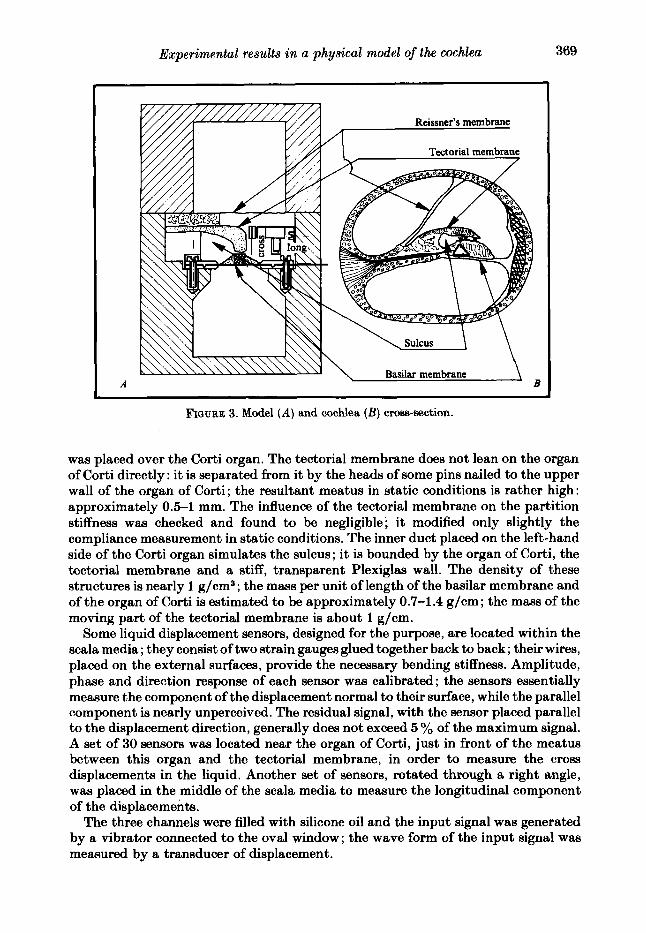
FIGURE 3. Model ( A ) and cochlea ( B ) cross-section.
was placed over the Corti organ. The tectorial membrane does not lean on the organ of Corti directly: it is separated from it by the heads of some pins nailed to the upper wall of the organ of Corti; the resultant meatus in static conditions is rather high: approximately 0.5-1 mm. The influence of the tectorial membrane on the partition stiffness was checked and found to be negligible'; it modified only slightly the compliance measurement in static conditions. The inner duct placed on the left-hand side of the Corti organ simulates the sulcus; it is bounded by the organ of Corti, the tectorial membrane and a stiff, transparent Plexiglas wall. The density of these structures is nearly 1 g/cm3 ; the mass per unit of length of the basilar membrane and of the organ of Corti is estimated to be approximately 0.7-1.4 g/cm ; the mass of the moving part of the tectorial membrane is about I g/cm.
Some liquid displacement sensors, designed for the purpose, are located within the scala media ; they consist of two strain gauges glued together back to back ; their wires, placed on the external surfaces, provide the necessary bending stiffness. Amplitude, phase and direction response of each sensor was calibrated; the sensors essentially measure the component of the displacement normal to their surface, while the parallel component is nearly unperceived. The residual signal, with the sensor placed parallel to the displacement direction, generally does not exceed 5 yo of the maximum signal. A set of 30 sensors was located near the organ of Corti, just in front of the meatus between this organ and the tectorial membrane, in order to measure the cross displacements in the liquid. Another set of sensors, rotated through a right angle, was placed in the middle of the scala media to measure the longitudinal component of the displacements.
The three channels were filled with silicone oil and the input signal was generated by a vibrator connected to the oval window; the wave form of the input signal was measured by a transducer of displacement.
370 C . Cancelli, S . D'AngeEo, M . Ma& and R. Malvano
4 C, C(mm4/N, r (cm) b (cm) (t lo2) ( - 10%) - 10%)
10 1.13 0.96 1.53 1.24 20 1.30 2.76 3.86 3.31 30 1.57 5.33 8.67 7.00 40 1.70 9.62 14.40 12.00 50 1.70 9.62 13.47 11.50 60 1.76 13.40 19.60 16.40 70 1.95 24.80 34.80 29.80 80 2.19 42.80 53.95 48.40 90 2.30 82.10 101.60 91.80
100 2.42 90.50 106.90 98.70 110 2.40 138.60 138.60 138.60 120 2.41 229.20 229.20 229.20 130 2.52 265.20 265.40 265.20 140 2.65 288.10 288.10 288.10 150 2.72 285.00 285.00 285.00 170
TABLE 1
- - - -
4. Experimental conditions Several tests were carried out in different conditions. However, most results, shown
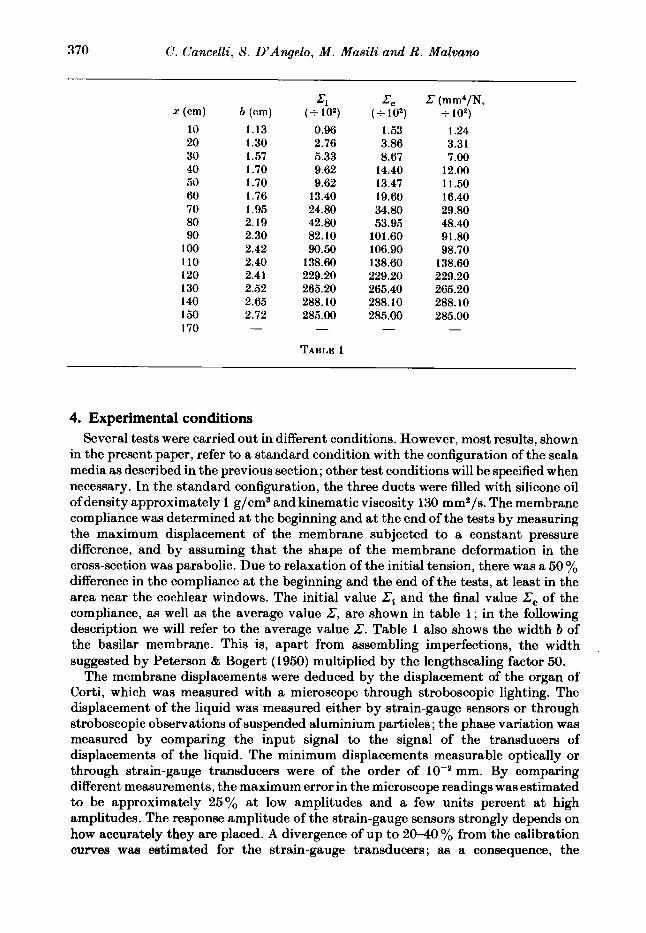
in the present paper, refer to a standard condition with the configuration of the scala media as described in the previous section; other test conditions will be specified when necessary. In the standard configuration, the three ducts were filled with silicone oil of density approximately 1 g/cm3 and kinematic viscosity 130 mm2/s. The membrane compliance was determined at the beginning and at the end of the tests by measuring the maximum displacement of the membrane subjected to a constant pressure difference, and by assuming that the shape of the membrane deformation in the cross-section was parabolic. Due to relaxation of the initial tension, there was a 50 yo difference in the compliance at the beginning and the end of the tests, at least in the area near the cochlear windows. The initial value Ci and the final value C, of the compliance, as well as the average value C, are shown in table 1 ; in the following description we will refer to the average value C. Table 1 also shows the width b of the basilar membrane. This is, apart from assembling imperfections, the width suggested by Peterson & Bogert (1950) multiplied by the lengthscaling factor 50.
The membrane displacements were deduced by the displacement of the organ of Corti, which was measured with a microscope through stroboscopic lighting. The displacement of the liquid was measured either by strain-gauge sensors or through stroboscopic observations of suspended aluminium particles ; the phase variation was measured by comparing the input signal to the signal of the transducers of displacements of the liquid. The minimum displacements measurable optically or through strain-gauge transducers were of the order of mm. By comparing different measurements, the maximum error in the microscope readings was estimated to be approximately 25% at low amplitudes and a few units percent at high amplitudes. The response amplitude of the strain-gauge sensors strongly depends on how accurately they are placed. A divergence of up to 20-40 % from the calibration curves was estimated for the strain-gauge transducers; as a consequence, the
Experimental results in a physical model of the cochlea 37 1
response curve measured at a fixed frequency is not very precise. On the other hand the phase measurements are more precise: possible errors may only be caused by errors in the reading of the distance between the maximum values of two signals on the oscilloscope display ; in fact the phase measurement is not particularly sensitive to slight errors in the location of the sensors. Absolute error may be estimated to be of the order of 0.2 rad.
5. Frequency-, viscosity- and amplitude-scaling ratios The frequency of the input signal in the model ranged from 20 to 400 Hz; the
corresponding cochlea frequency is (Cmod/Ccochlea)~ times greater, as can be deduced by the similarity condition
pw2C = const,
since the difference between the perilymph density in the model and in the real cochlea was negligible. However, the frequency scaling ratio remains somewhat uncertain due to the uncertain values to be assigned to the real basilar membrane compliance. BBkBsy (1960, p. 476) directly measured the volume displacement per unit length of the cochlea duct by applying a uniform difference of pressure between the peripheral scales.
Later, however, BQkBsy’s data were questioned for several reasons : his experimental method was considered unreliable and the data appeared plainly unsatisfactory for any theory of spatial discrimination of frequency based on resonance (Viergever 1980, p. 114; Lighthill 1981, p. 161). In fact, according to BBk6sy’s measurements, the basilar membrane compliance varied by just two orders of magnitude between the base and the apex. Thus, since the partition mass is almost constant, the characteristic frequency of the partition ought to vary by about a factor of ten along the cochlea length, i.e. much less than the acoustic frequency. The basilar membrane compliance may also be indirectly deduced from the other data of BBk6sy with some interpolation. He measured the basilar membrane static deflection in ‘three different points under concentrated loads (BBkBsy 1960; pp. 467,468) and Peterson t Bogart (1950) relied on these measurements to obtain a law of compliance variation which markedly disagrees with BQkBsy ’s direct measurements. The compliance estimated by Peterson & Bogert has a variation of three orders of magnitude and its value in the basal area is approximately 50 times smaller than BBkBsy’s value.
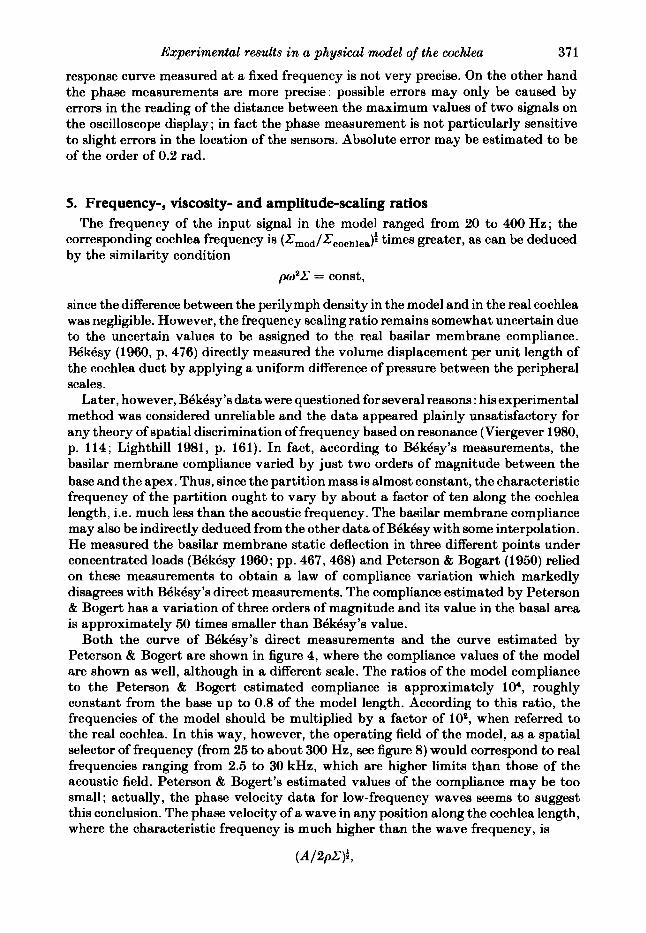
Both the curve of BQkBsy’s direct measurements and the curve estimated by Peterson & Bogert are shown in figure 4, where the compliance values of the model are shown as well, although in a different scale. The ratios of the model compliance to the Peterson & Bogert estimated compliance is approximately lo4, roughly constant from the base up to 0.8 of the model length. According to this ratio, the frequencies of the model should be multiplied by a factor of lo2, when referred to the real cochlea. In this way, however, the operating field of the model, as a spatial selector of frequency (from 25 to about 300 Hz, see figure 8 ) would correspond to real frequencies ranging from 2.5 to 30 kHz, which are higher limits than those of the acoustic field. Peterson & Bogert’s estimated values of the compliance may be too small; actually, the phase velocity data for low-frequency waves seems to suggest this conclusion. The phase velocity of a wave in any position along the cochlea length, where the characteristic frequency is much higher than the wave frequency, is
372 C. Cancelli, S . D'Angelo, M . Masili and R. Malvano
1 08
10'
I
H B v
; 108 - &
.- - a
u E 10'
10
I I I I
/ 0
* P
10'
10
I
2
$
3 E v
I 1.0 =
L
8 9 .- - a
u E 0.1
0.01 0.2 0.4 0.6 0.8 1.0
Distance x / L
FIQURE 4. Compliance of the basilar membrane versus distance: -, BBkBsy's mectsurements of the cochlear basilar membrane compliance (right-side axis) ; * * t, model basilar membrane compliance (left-side axis) ; - 0 - 0, Peterson & Bogert estimated compliance of the cochlear basilar membrane (right-side axis).
where A is the area of the cross-section of a scala. Peterson & Bogert's compliance data provided phase velocities ranging from 350 m/s at the base to approximately 5 m/s at the apex ; Zwislocki (1953) showed that these velocities, at least in the apical area, are two or three times greater than the velocities which could be obtained from the propagation times measured in the cochlea by BBkBsy (1949); one can hardly believe that these measures too were completely wrong.
Lighthill as well, who severely criticized BBkBsy 's compliance measurements for the case of a wider compliance range, estimated the phase velocity in the basal area to be approximately 100m/s (Lighthill 1981, p. 150). If this value is taken as a reference, the model frequencies correspond to approximately 50 times greater than the real frequencies, and the discrimination field of the model corresponds to the normal acoustic field. We therefore adopted 50 as the most probable scaling ratio of frequencies and in the description of our experimental results we shall refer to it. In this case from the similarity condition:
V -- L2w - const,
it can easily be inferred that the kinematic viscosity of the liquid in the model has to be 50 times greater than the perilymph viscosity, as the linear dimensions have
Experimental results in a physical model of the cochlea 373
been enlarged 50 times. The perilymph viscosity was approximately 2mm2/s in BBkBsy's measurements; viscosity of the silicone liquid in the model was 130 mmz/s in the described test conditions, thus being in reasonable agreement. Yet it must be remembered that a perilymph viscosity three times smaller than the value measured by BBk6sy was found in more recent measurements (Rauch 1964, p. 454). This fact - combined with the possibility that what we considered to be the most probable scaling ratio of frequency may have been halved - implies that the model might have been damped too much. Many interesting features of our results, however, proved independent of the model damping.
I1 Finally, the condition:
w _ - wL - const,
requires the ratio of the input signal amplitude u / w to the characteristic dimension L of the cochlea to be kept constant. The condition is useful in evaluating what the amplitude of the input signal has to be in the model if it is to produce hydrodynamical nonlinear effects equivalent to those in the real cochlea. The biggest displacements of the basilar membrane response, reported by BBkBsy, are of the order cm, and these were obtained through an acoustic signal of 140 dB, i.e. 0.0002 dyn/cm2; the corresponding displacement in the model is of order 10-l cm, since the length-scaling ratio is 50. Thus, in order to pick up the distribution of basilar membrane displacements caused in the model by a signal corresponding to a 140 dB real one, it was necessary to measure displacement amplitudes in the range from lo-' cm to a minimum of about cm. This was in fact the range of our measuring capability; the amplitude of the signals we simulated in the model were therefore rather large, around the threshold of pain, or just a little beneath that.
6. Experimental results 6.1. Oscillatory motion in the scala media
The pattern of the motion in the scala media of our model is rather complicated. The Corti motion, which we observed by microscope, is a three-dimensional vibration with a minor component in the direction of the model axis. The main component is normal to the basilar membrane plane; a cross component with a smaller amplitude was present as well. The tectorial membrane moved with the Corti organ in most places, but, where the gap between the Corti organ and the tectorial membrane was wider, the tectorial membrane oscillated with a slightly smaller amplitude than the Corti organ, although still with nearly the same phase.
The movements of the liquid within the layer between the Corti organ and the tectorial membrane were not visible in our standard case. In a different set of experiments, the tectorial membrane was rigid, motionless and diaphanous, with a gap between it and the organ of Corti about 1 mm wide at rest; in this case the liquid motion was made visible by means of aluminium powder dispersed in the liquid. The oscillation of the powder within the layer was essentially in the cross direction, and its amplitude was about ten times greater than any other visible oscillation. In both cases, the response of the cross sensors, which were placed at the exit of the meatus between the tectorial membrane and the organ of Corti, revealed a displacement towards the outside of the sulcus when the normal component of the Corti displacement was towards the inside of the scala media. The response of the sensor was proportional to the normal component of the Corti displacement, and had the same phase. In figure 5, which refers to the case of the elastic tectorial membrane, the normal
374
f 1.0 P 2 5
5 u
L
3 z
B f 1 il g o
2 0.5 L
C . Cancelli, S . D’Angelo, M . Masili and R. Malvano
Cochlea estimated frequency (kHz) 1.25 2.5 5.0 10.0 20.0 I I I I
D o Transducer response
L A BM response
25 50 100 200 0 Model frequency (Hz)
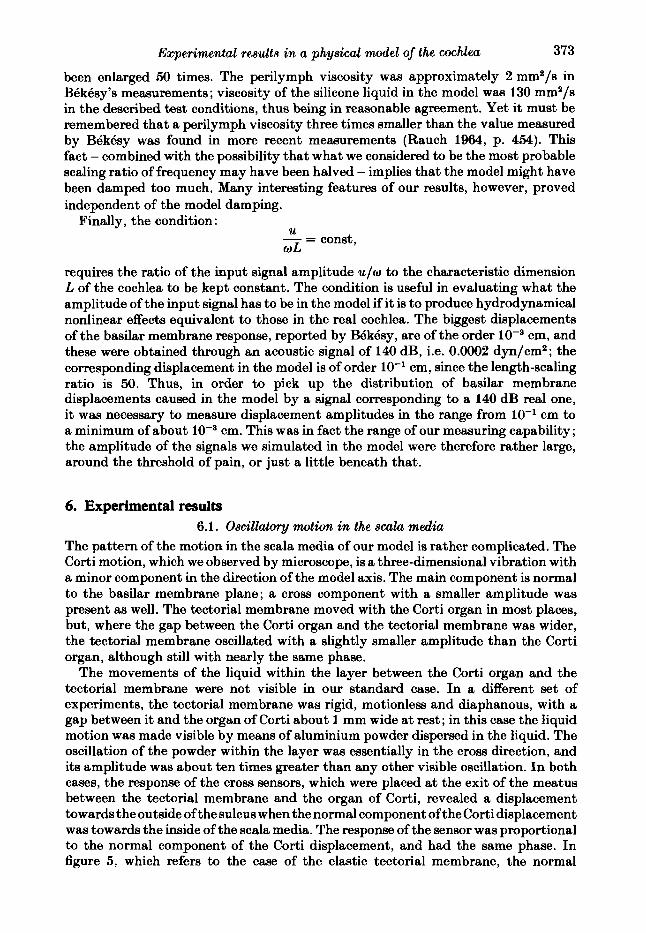
FIQURE 5. Comparison between the basilar membrane response and the cross displacement transducers’ response at fixed points (the amplitudes are in both cases normalized to their maximum value).
displacements of the Corti organ and the response of a cross sensor placed in the same point on the model axis are shown as a function of frequency, with their maximum amplitude normalized to 1 ; the two sets of points agree quite well. The responses of the same sensors in the case of the rigid tectorial membrane displayed the same pattern, and their absolute values are about 30 % bigger than those obtained with the elastic tectorial membrane, all the other conditions being the same. The few longitudinal sensors did not show anything surprising ; the amplitudes of the displacements they picked up were of the same magnitude as the normal displace- ments of the Corti organ in the vicinity of the place of the maximum response of the partition, while in the basal section of the model they were greater than the normal displacements of the Corti organ.
6.2. Amplitudes of basilar membrane displacements; phase lag of the cross semor signals ; spatial distribution of amplitude maximum along the axis of the model, as a function of frequency
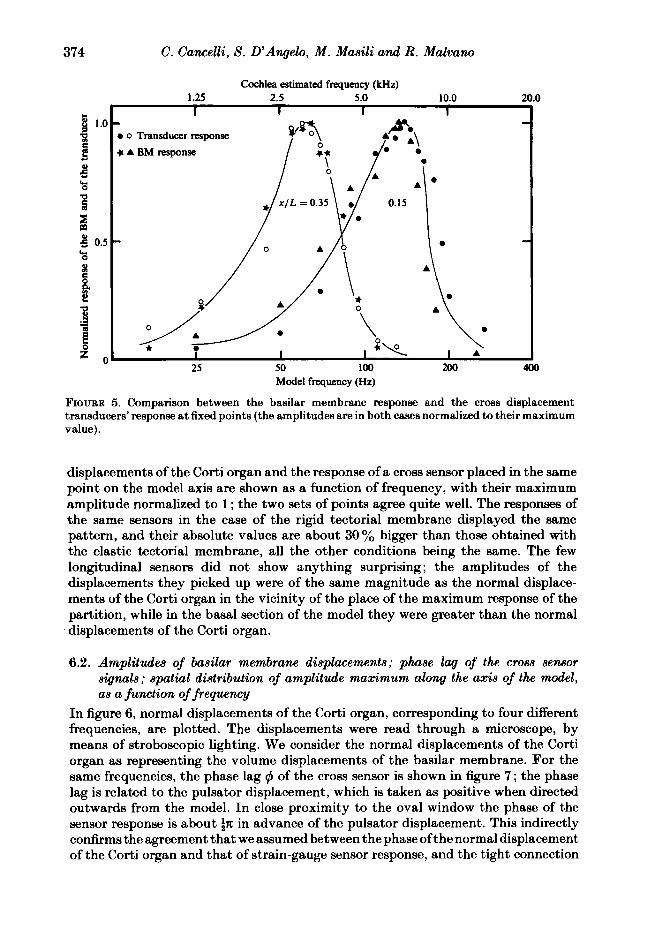
In figure 6, normal displacements of the Corti organ, corresponding to four different frequencies, are plotted. The displacements were read through a microscope, by means of stroboscopic lighting. We consider the normal displacements of the Corti organ as representing the volume displacements of the basilar membrane. For the same frequencies, the phase lag q5 of the cross sensor is shown in figure 7 ; the phase lag is related to the pulsator displacement, which is taken as positive when directed outwards from the model. In close proximity to the oval window the phase of the sensor response is about $t in advance of the pulsator displacement. This indirectly confirms the agreement that we assumed between the phase of the normal displacement of the Corti organ and that of strain-gauge sensor response, and the tight connection
Experimental results in a physical model of the cochlea
- A 25 Hz - o 45 Hz - 100Hz -
- -
A A
- - 5 - -
L v - +* 5 s
A -
- 0
- - 0 0 0
0 - -
- - - -
- - m m
\
c a
-10 -
- - - 1s I 1 I I I 1 I 1 1
0.2 0.4 0.6 0.8 1
375
.o
FIGURE 6. Distribution of displacement amplitude along the model partition for different frequencies.
1 .o
between the Corti normal displacement and the volume displacement of the basilar membrane. Actually, the volume displacement of the basilar membrane has to be in advance of the oval window displacement in the basal section of the model, where the elastic component of the bctsilar membrane impedance dominates the viscous and inertial components.
FIGURE 7. Phase between the input signal and the response of the cross displacement transducers versus distance.
376 C. Caneelli, S . D’Angelo, M . Masili and R. Malvano
I I I 1 I I I I I - 0 0 Authors’ measurements
* Characteristic frequency
- t b h
of model basilar membrane 6
B - 9 0.
- 4 8 .- 8 I
E 160 6 5
- v 1
m 3
- d
I I I 1 I 1 I 1 I 0 0.2 0.4 0.6 0.8 I .O
Distance x / L
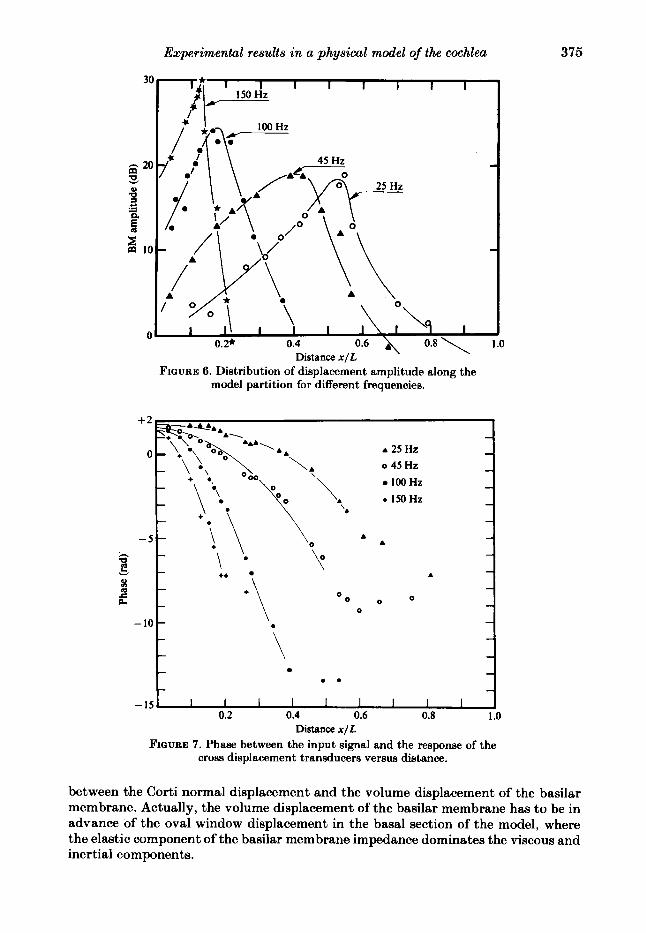
FIGURE 8. Distribution of amplitude maxima of the basilar membrane response along the longitudinal axis of the model as a function of frequency, 0-0 -0 ; distribution of the membrane response at 20 dB below the maximum value as a function of the frequency, 0 - 0 - 0 ; distribution of the characteristic frequency of the model basilar membrane, estimated through the expression f, = (1/2n) (ZM)-t , * * *.
The wavenumber k, where k = -a$/ax,, increases regularly from the’base to a point just after the maximum response of the basilar membrane; the curve flexes at this point and the wavenumber rapidly decreases. This inversion in the trend of k is due to the mean-pressure wave, the fast wave mentioned by Lighthill (1981, pp. 173-181); the importance of this wave, relative to the pressure-difference wave associated with the membrane displacement, was higher in our model than in the real cochlea, probably due to the large distensibility of the model cross-section. The sensors began to measure the influence of the fast wave and the apparent phase velocity began to increase when the membrane displacement reduced by one order of magnitude with respect to its maximum value.
As regards the curves of amplitudes of the basilar membrane displacement, their maximum values move as a function of the frequency in qualitative agreement with a resonance theory. Figure 8 shows the position of the maximum response against frequency, as well as the positions where the displacement, compared with the corresponding maximum value, reduces by 20 dB. The positions indicated in the figure represent the averaged values obtained during several measurements ; the spread in these measurements was maintained within 5 % in the case of the maximum values (excluding one case) and within 15 % in the case of the points at - 20 dB below the maximum. Both series of points are distributed along the model length in a similar manner, to a series deduced from a hypothesized characteristic frequency :
1 2 R
f, = - (ZM)-k
Values off, are shown in figure 8; they were calculated by assuming M = ph*/b, where h* is the distance between the basilar membrane and Reissner’s membrane and b is the membrane width; the calculated points lie between the two series of points
Experimental results i n a physical model of the cochlea
7 0 0 , A%,
\ 45 Hz
* A,' D A/
I I I I I I I I I
0.2 0.4 0.6 0.8
377
0 Distance x / L
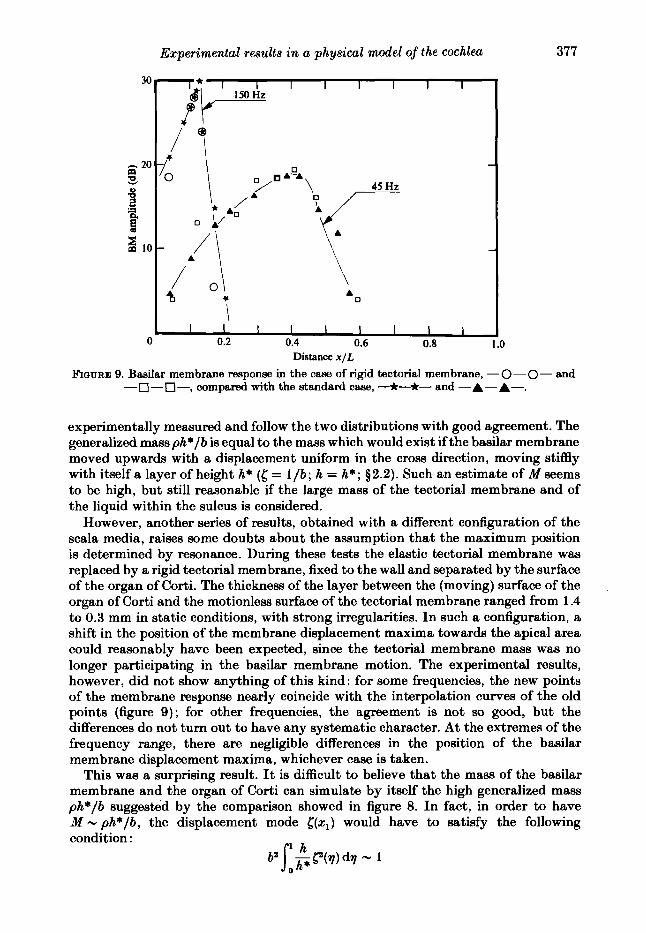
FIGURE 9. Baailar membrane response in the case of rigid tectorial membrane, -0-0- and -n--n-, compared with the standard case, -*-*- and -A-A-.
experimentally measured and follow the two distributions with good agreement. The generalized mass ph*/b is equal to the mass which would exist if the bmilar membrane moved upwards with a displacement uniform in the cross direction, moving stiffly with itself a layer of height h* (6 = l / b ; h = h*; $2.2). Such an estimate of M seems to be high, but still reasonable if the large mass of the tectorial membrane and of the liquid within the sulcus is considered.
However, another series of results, obtained with a different configuration of the scala media, raises some doubts about the assumption that the maximum position is determined by resonance. During these tests the elastic tectorial membrane was replaced by a rigid tectorial membrane, fixed to the wall and separated by the surface of the organ of Corti. The thickness of the layer between the (moving) surface of the organ of Corti and the motionless surface of the tectorial membrane ranged from 1.4 to 0.3 mm in static conditions, with strong irregularities. In such a configuration, a shift in the position of the membrane displacement maxima towards the apical area could reasonably have been expected, since the tectorial membrane mass was no longer participating in the basilar membrane motion. The experimental results, however, did not show anything of this kind: for some frequencies, the new points of the membrane response nearly coincide with the interpolation curves of the old points (figure 9); for other frequencies, the agreement is not so good, but the differences do not turn out to have any systematic character. At the extremes of the frequency range, there are negligible differences in the position of the basilar membrane displacement maxima, whichever case is taken.
This was a surprising result. It is difficult to believe that the mass of the basilar membrane and the organ of Corti can simulate by itself the high generalized mass ph*/b suggested by the comparison showed in figure 8. In fact, in order to have M - ph*/b, the displacement mode [ ( x l ) would have to satisfy the following condition :
378 C. Cancelli, S. D'Angelo, M. Maeili and R. Malvano
Reissner's membrane .
Basilar membrane
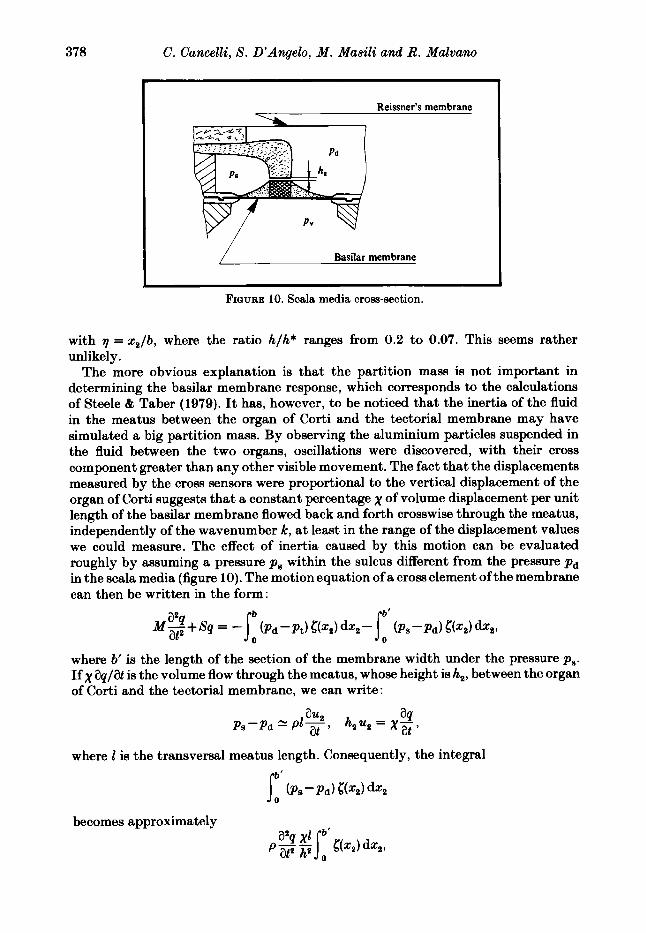
FIQURE 10. Scala media cross-section.
with 7 = x2/b, where the ratio h/h* ranges from 0.2 to 0.07. This seems rather unlikely.
The more obvious explanation is that the partition mass is not important in determining the basilar membrane response, which corresponds to the calculations of Steele & Taber (1979). It has, however, to be noticed that the inertia of the fluid in the meatus between the organ of Corti and the tectorial membrane may have simulated a big partition mass. By observing the aluminium particles suspended in the fluid between the two organs, oscillations were discovered, with their cross component greater than any other visible movement. The fact that the displacements measured by the cross sensors were proportional to the vertical displacement of the organ of Corti suggests that a constant percentage x of volume displacement per unit length of the basilar membrane flowed back and forth crosswise through the meatus, independently of the wavenumber k, at least in the range of the displacement values we could measure. The effect of inertia caused by this motion can be evaluated roughly by assuming a pressure p, within the sulcus different from the pressure pd in the scala media (figure 10). The motion equation of a cross element of the membrane can then be written in the form:
where b' is the length of the section of the membrane width under the pressure p,. If x aq/at is the volume flow through the meatus, whose height is h,, between the organ of Corti and the tectorial membrane, we can write:
where 1 is the transversal meatus length. Consequently, the integral
becomes approximately
Experimental results in a physical model of the cochlea
Cochlea estimated frequency (kHz)
I 50 I 1.25 2.5 5.0 10.0 20.0
I I I
- h m
B
. \
30 - ‘c)
P .C - 2 - 0.
z 0 x / L = 0.35
A 0.15 0.10
10 -
I 1 I I I 0 25 50 100 200 400
Model frequency (Hz)
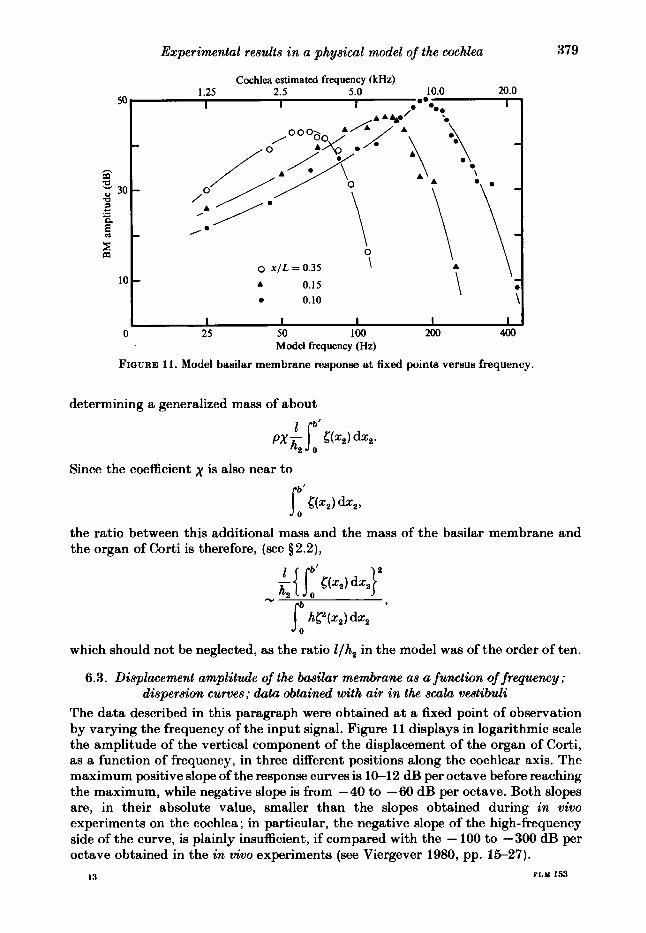
FIQURE 11. Model basilar membrane response at fixed points versus frequency.
379
determining a generalized mass of about
Since the coefficient x is also near to
the ratio between this additional mass and the mass of the basilar membrane and the organ of Corti is therefore, (see §2.2),
which should not be neglected, as the ratio l/h2 in the model was of the order of ten.
6.3. Displacement amplitude of the basilar membrane as a function of frequency; dispersion curves; data obtained with air in the scula vestibuli
The data described in this paragraph were obtained at a fixed point of observation by varying the frequency of the input signal. Figure 11 displays in logarithmic scale the amplitude of the vertical component of the displacement of the organ of Corti, as a function of frequency, in three different positions along the cochlear axis. The maximum positive slope of the response curves is 1W12 dB per octave before reaching the maximum, while negative slope is from -40 to -60 dB per octave. Both slopes are, in their absolute value, smaller than the slopes obtained during in vivo experiments on the cochlea ; in particular, the negative slope of the high-frequency side of the curve, is plainly insufficient, if compared with the - 100 to -300 dB per octave obtained in the in vivo experiments (see Viergever 1980, pp. 15-27).
I3 PLY 153
380 C . Cancelli, S . D'Angelo, M . Masili and R. Malvano
I I I I I I I I I I I I 1
kH
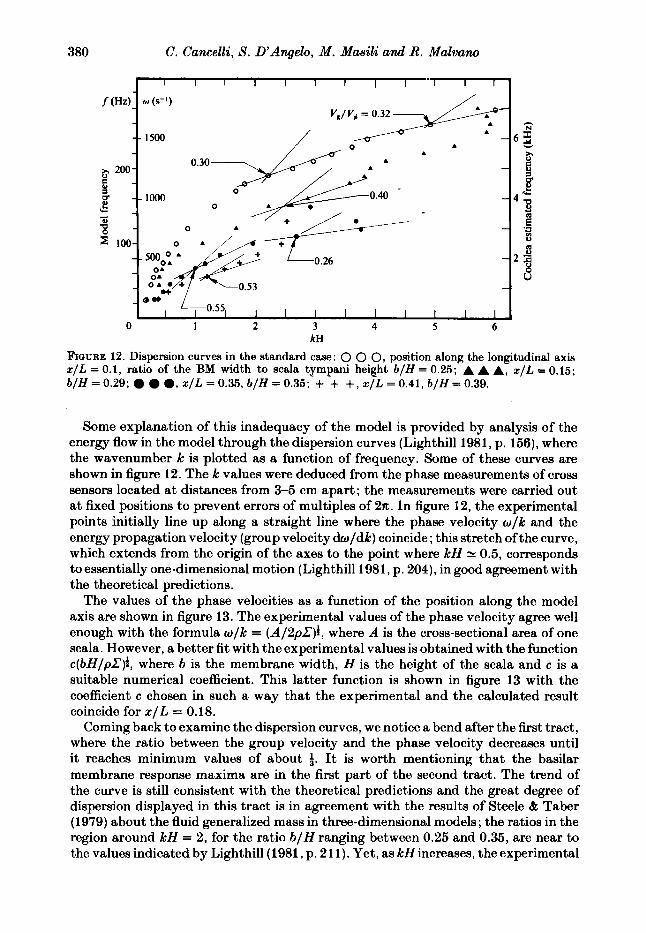
FIGURE 12. Dispersion curves in the standard case: 0 0 0, position along the longitudinal axis x / L = 0.1, ratio of the BM width to scala tympani height b / H = 0.25; A A A, x / L = 0.15; b / H = 0.29; a, x / L = 0.35, b / H = 0.35; + + +, x / L = 0.41, b / H = 0.39.
Some explanation of this inadequacy of the model is provided by analysis of the energy flow in the model through the dispersion curves (Lighthill 1981, p. 156), where the wavenumber k is plotted as a function of frequency. Some of these curves are shown in figure 12. The k values were deduced from the phase measurements of cross sensors located at distances from 3-5 cm apart; the measuremeiits were carried out at fixed positions to prevent errors of multiples of 2n. In figure 12, the experimental points initially line up along a straight line where the phase velocity w/k and the energy propagation velocity (group velocity dwldk) coincide ; this stretch of the curve, which extends from the origin of the axes to the point where k H N 0.5, corresponds to essentially one-dimensional motion (Lighthill 1981, p. 204), in good agreement with the theoretical predictions.
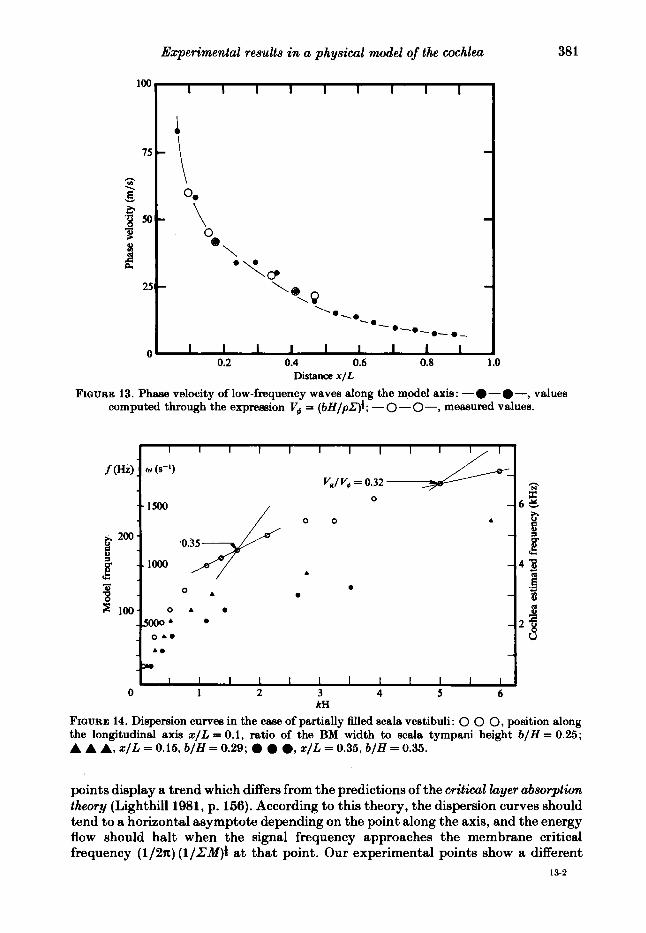
The values of the phase velocities as a function of the position along the model axis are shown in figure 13. The experimental values of the phase velocity agree well enough with the formula w/k = (A/2pZ):, where A is the cross-sectional area of one scala. However, a better fit with the experimental values is obtained with the function c(bH/pZ)i , where b is the membrane width, H is the height of the scala and c is a suitable numerical coefficient. This latter function is shown in figure 13 with the coefficient c chosen in such a way that the experimental and the calculated result coincide for x / L = 0.18.
Coming back to examine the dispersion curves, we notice a bend after the first tract, where the ratio between the group velocity and the phase velocity decreases until it reaches minimum values of about 4. It is worth mentioning that the basilar membrane response maxima are in the first part of the second tract. The trend of the curve is still consistent with the theoretical predictions and the great degree of dispersion displayed in this tract is in agreement with the results of Steele & Taber (1979) about the fluid generalized mass in three-dimensional models ; the ratios in the region around kH = 2, for the ratio b / H ranging between 0.25 and 0.35, are near to the values indicated by Lighthill (1981, p. 211). Yet, as kH increases, the experimental
Experimental results in a physical mde l of the cochlea
A
-
38 1
6 8
- f L
- 4 3 ." B c)
- B a
- 2 j
I I I I I I I I I
0.
0
\ 0
\
0.2 0.4 0.6 0.8 1 .o Distance x / L
FIQURE 13. Phase velocity of low-frequency waves along the model axis: -@-@-, values computed through the expression V, = (bH/pZ)f ; - 0 - 0 -, measured values.
r I I I I I I I I 1 I r I I I I I I
Vg/ V, = 0.32 $!
-.6 S
' A
A 0
0
0 0
A
0 0
I I I I 1 I 1 I 1 I I 1 I 0 1 2 3 4 5 6
kH FIQURE 14. Dispersion curves in the case of partially filled scala vestibuli: 0 0 0, position along the longitudinal axis x / L = 0.1, ratio of the BM width to scala tympani height b/H = 0.25; A A A, x ~ L = 0.15, b/H = 0.29; 0 0 0, x / L = 0.35, b/H = 0.35.
points display a trend which differs from the predictions of the critical layer absorption theory (Lighthill 1981, p. 156). According to this theory, the dispersion curves should tend to a horizontal asymptote depending on the point along the axis, and the energy flow should halt when the signal frequency approaches the membrane critical frequency (1/2n) ( l /L 'Mp at that point. Our experimental points show a different
13-2
382
1 .a
4 3
b 4 0.5
ii 0 c
z
0.0
C. Cancelli, S. D’Angelo, M . Masili and R. Malvano
Cochlea estimated frequency (kHz) 0
I I I 1 25 50 100 200 400
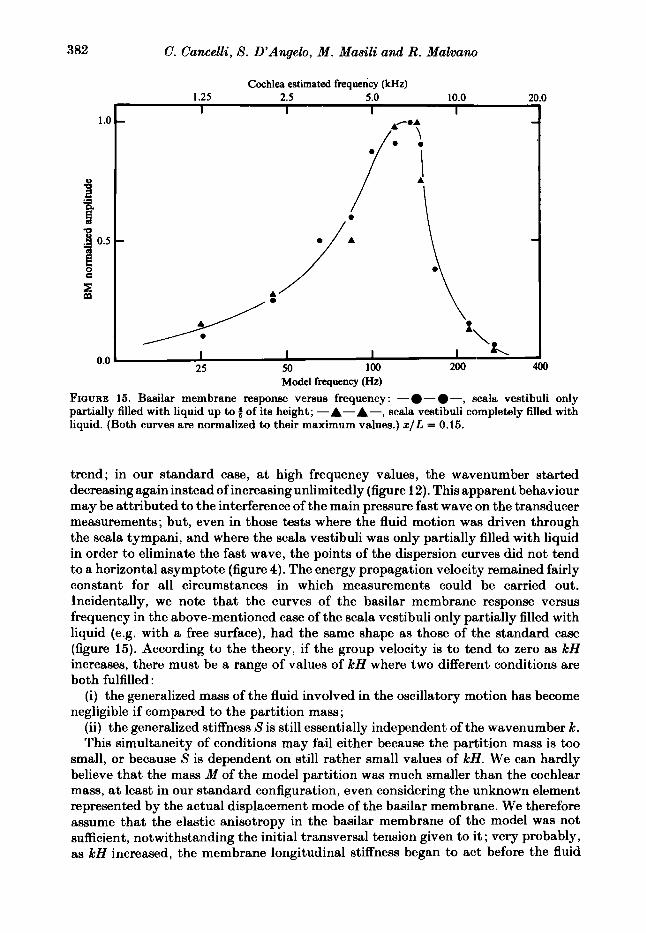
‘Model frequency (Hz) FIGURE 15. Basilar membrane response versus frequency : - - -, scala vestibuli only partially filled with liquid up to 2 of its height; -A-A-, scala vestibuli completely filled with liquid. (Both curves are normalized to their maximum values.) x / L = 0.15.
trend; in our standard case, at high frequency values, the wavenumber started decreasing again instead of increasing unlimitedly (figure 12). This apparent behaviour may be attributed to the interference of the main pressure fast wave on the transducer measurements; but, even in those tests where the fluid motion was driven through the scala tympani, and where the scala vestibuli was only partially filled with liquid in order to eliminate the fast wave, the points of the dispersion curves did not tend to a horizontal asymptote (figure 4). The energy propagation velocity remained fairly constant for all circumstances in which measurements could be carried out. Incidentally, we note that the curves of the basilar membrane response versus frequency in the above-mentioned case of the scala vestibuli only partially filled with liquid (e.g. with a free surface), had the same shape as those of the standard case (figure 15). According to the theory, if the group velocity is to tend to zero as kH increases, there must be a range of values of kH where two different conditions are both fulfilled :
(i) the generalized mass of the fluid involved in the oscillatory motion has become negligible if compared to the partition mass;
(ii) the generalized stiffness S is still essentially independent of the wavenumber k. This simultaneity of conditions may fail either because the partition mass is too
small, or because S is dependent on still rather small values of kH. We can hardly believe that the mass M of the model partition was much smaller than the cochlear mass, at least in our standard configuration, even considering the unknown element represented by the actual displacement mode of the basilar membrane. We therefore assume that the elastic anisotropy in the basilar membrane of the model was not sufficient, notwithstanding the initial transversal tension given to it ; very probably, as kH increased, the membrane longitudinal stiffness began to act before the fluid
Experimental results in a physical model of the cochlea 383
1.25 2.5 5.0 10.0 I I I I I
/or\ 1.0 - -
Endolymphatic viscosity:
0 w f w , = 1/1
A w/v, = 1/10 H c) .- z B -
0.5 - /
A
\ p H
I I I XA. OA- A -A - 0 / O
25 50 100 200 0-
Cochlea estimated frequency (kHz) 20.0
400 Model frequency (Hz)
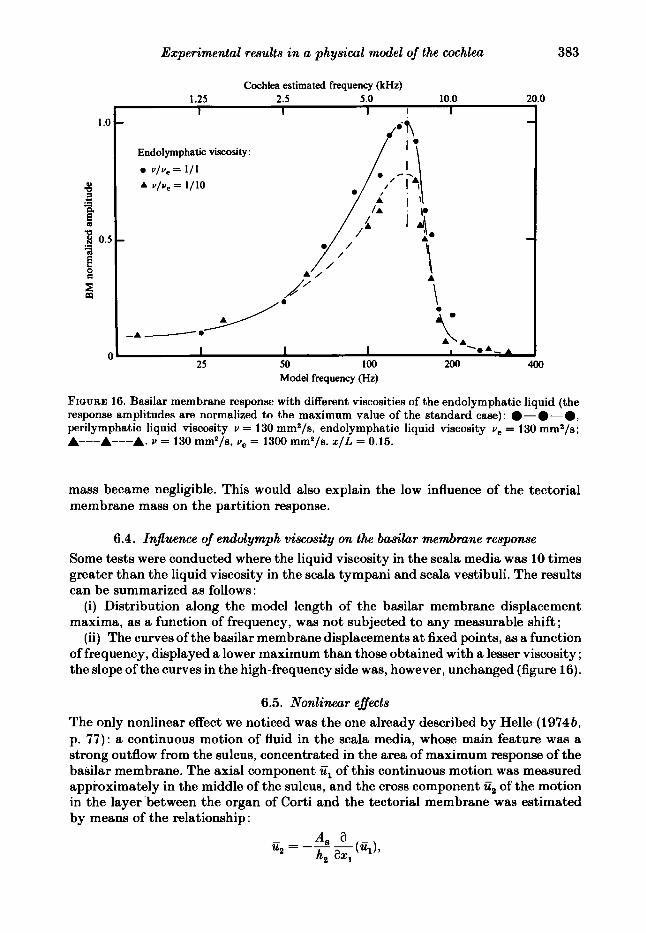
FIQURE 16. Basilar membrane response with different viscosities of the endolymphatic liquid (the response amplitudes are normalized to the maximum value of the standard case): .-.-*, perilymphatic liquid viscosity u = 130 mma/s, endolymphatic liquid viscosity u, = 130 mma/s; A---A---A. u = 130 mm*/s, u, = 1300 mm*/s. x / L = 0.15.
mass became negligible. This would also explain the low influence of the tectorial membrane mass on the partition response.
6.4. Injluence of endolymph viscosity on the basihr membrane response Some tests were conducted where the liquid viscosity in the scala media was 10 times greater than the liquid viscosity in the scala tympani and scala vestibuli. The results can be summarized as follows :
(i) Distribution along the model length of the basilar membrane displacement maxima, as a function of frequency, was not subjected to any measurable shift;
(ii) The curves of the basilar membrane displacements at fixed points, as a function of frequency, displayed a lower maximum than those obtained with a lesser viscosity ; the slope of the curves in the high-frequency side was, however, unchanged (figure 16).
6.5. Nonlinear effects The only nonlinear effect we noticed was the one already described by Helle (19743, p. 77): a continuous motion of fluid in the scala media, whose main feature was a strong outflow from the sulcus, concentrated in the area of maximum response of the basilar membrane. The axial component El of this continuous motion was measured approximately in the middle of the sulcus, and the cross component U2 of the motion in the layer between the organ of Corti and the tectorial membrane was estimated by means of the relationship:
384 C. Cancelli, S . D'Angelo, M . Masili and R. Malvano
1.2x10-'--
h - \
I? 8 x lo-*-- .!l 5 '8 4 x lo-*:-
$
B 2 - 4 ~ lo-'--
8
- - g 0 - v) - 5
.I c) -
- " - 8 x lo-'--
- 1.2 x 10⁻¹
f' 1.2 I \ p\ -
I a0 \
,b' \ \ 09.1 \ 0:
0.8 -
0.4 ', \\ - /
\ ,I \ '\. \, -
, I . I _-I ', /i \ - - - - - - - - - - -
\ 0- .-a- - ' , I \ -0.4 \ r
150 Hz
/ O r
' 0 \
-
I , \ I I , 'L,
-0.8
30
25 P s
20 8 2
15 f =
zi 10
5
0
Distance x / L
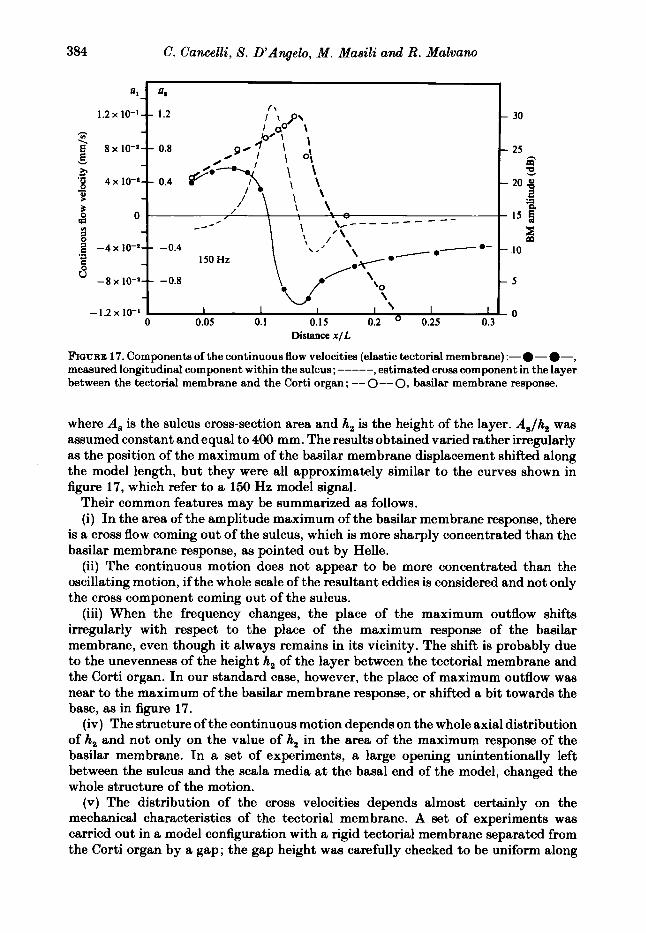
F'IGURE 17. Components of the continuous flow velocities (elastic tectorial membrane) :-a- 0-, measured longitudinal component within the sulcus; ----- , estimated cross component in the layer between the tectorial membrane and the Corti organ ; -- O--O, btlsilar membrane response.
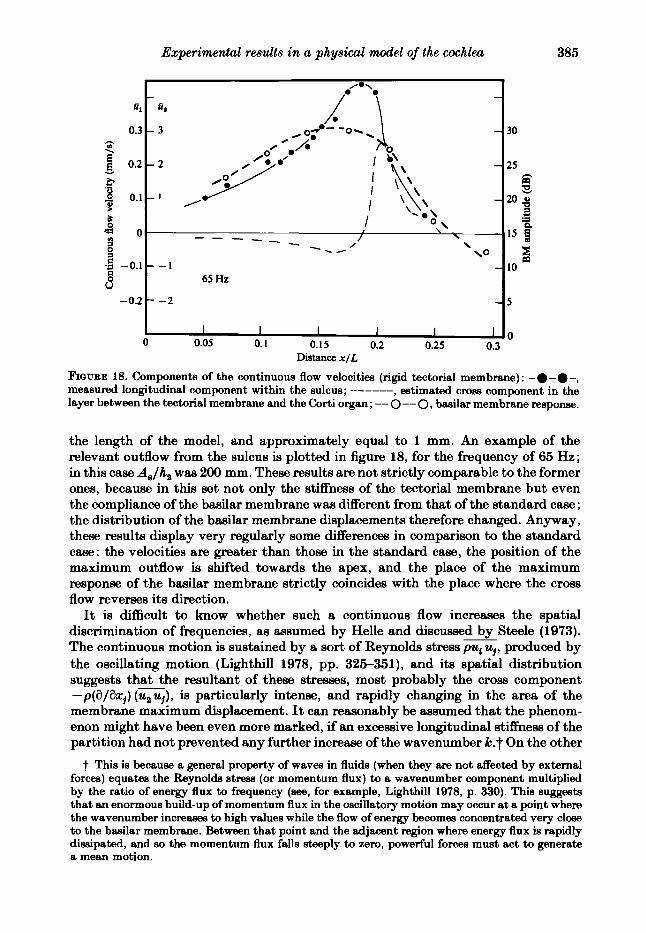
where A, is the sulcus cross-section area and h, is the height of the layer. AJh, was assumed constant and equal to 400 mm. The results obtained varied rather irregularly as the position of the maximum of the basilar membrane displacement shifted along the model length, but they were all approximately similar to the curves shown in figure 17, which refer to a 150 Hz model signal.
Their common features may be summarized as follows. (i) In the area of the amplitude maximum of the basilar membrane response, there
is a cross flow coming out of the sulcus, which is more sharply concentrated than the basilar membrane response, as pointed out by Helle.
(ii) The continuous motion does not appear to be more concentrated than the oscillating motion, if the whole scale of the resultant eddies is considered and not only the cross component coming out of the sulcus.
(iii) When the frequency changes, the place of the maximum outflow shifts irregularly with respect to the place of the maximum response of the basilar membrane, even though it always remains in its vicinity. The shift is probably due to the unevenness of the height h, of the layer between the tectorial membrane and the Corti organ. In our standard case, however, the place of maximum outflow was near to the maximum of the basilar membrane response, or shifted a bit towards the base, as in figure 17.
(iv) The structure of the continuous motion depends on the whole axial distribution of h, and not only on the value of h, in the area of the maximum response of the basilar membrane. In a set of experiments, a large opening unintentionally left between the sulcus and the scala media at the basal end of the model, changed the whole structure of the motion.
(v) The distribution of the cross velocities depends almost certainly on the mechanical characteristics of the tectorial membrane. A set of experiments was carried out in a model configuration with a rigid tectorial membrane separated from the Corti organ by a gap; the gap height was carefully checked to be uniform along
Experimental results in a physical model of the cochlea
L I I I 1 I 1 - 0.05 0.1 0.15 0.2 0.25 0.3 0
-o-2 t -2
layer Detween tne wcmnal membrane and the C;orti organ ; -- 0 -- 0, basilar membrane response.
the length of the model, and approximately equal to 1 mm. An example of the relevant outflow from the sulcus is plotted in figure 18, for the frequency of 65 Hz; in this case AJh, waa 200 mm. These results are not strictly comparable to the former ones, because in this set not only the stiffness of the tectorial membrane but even the compliance of the basilar membrane was different from that of the standard case ; the distribution of the brtsilar membrane displacements therefore changed. Anyway, these results display very regularly some differences in comparison to the standard case: the velocities are greater than those in the standard case, the position of the maximum outflow is shifted towards the apex, and the place of the maximum response of the baailar membrane strictly coincides with the place where the cross flow reverses its direction.
It is difficult to know whether such a continuous flow increases the spatial discrimination of frequencies, as assumed by Helle and discussed by Steele (1973). The continuous motion is sustained by a sort of Reynolds stress pug uj, produced by the oscillating motion (Lighthill 1978, pp. 325-351), and its spatial distribution suggests that the resultant of these stresses, most probably the cross component - p ( a / a z , ) ( G ) , is particularly intense, and rapidly changing in the area of the membrane maximum displacement. It can reasonably be assumed that the phenom- enon might have been even more marked, if an excessive longitudinal stiffness of the partition had not prevented any further increase of the wavenumber k.t On the other
t This is because a general property of waves in fluids (when they are not affected by external forces) equates the Reynolds stress (or momentum flux) to a wavenumber component multiplied by the ratio of energy flux to frequency (see, for example, Lighthill 1978, p. 330). This suggests that an enormous build-up of momentum flux in the oscillatory motion may occur at a point where the wavenumber increaaes to high values while the flow of energy becomes concentrated very close to the basilar membrane. Between that point and the adjacent region where energy flux is rapidly dissipated, and so the momentum flux falls steeply to zero, powerful forces must act to generate a mean motion.
385
30
25 6 9
2
I5 8 10
20 .g a
H
5
0
386 C. Cancelli, S. D’Angelo, M . Masili and R. Malvano
hand, the velocity values of this continuous motion are extremely low; the ratio between the continuous motion maximum velocity and the oscillating motion maximum velocity was in our standard case in the order of at the level of the model signals. This level corresponds to an acoustic signal of approximately 140 dB. As could easily be checked, the amplitude of the continuous motion decreases with the square of the amplitude of the input signal : this ratio must therefore be extremely small when acoustic signals have reduced intensity; for instance, approximately at 80 dB.
just because of its continuous character, it might have an inhibiting effect. We do not know whether this slow flow may excite the hair cells; it is possible that,
7. Conclusions We conclude by summarizing the main features of our experimental results. The
motion in the scala media of our three-duct model was complex. The Corti organ displayed a three-dimensional vibration with the main component normal to the basilar membrane plane, and the elastic tectorial membrane moving with essentially the same amplitude and the same phase as the Corti organ. The fluid motion had a large cross component in the layer between the Corti organ and the tectorial membrane; the signals of the transducers, which picked up the cross component of the fluid displacement just at the exit of the layer, were proportional to the normal displacement of the Corti organ, and had the same phase. This picture suggests that an approximately constant proportion of the volume displacement of the basilar membrane flowed through the gap between the Corti organ and the tectorial membrane, independently of the wavenumber at least within our measuring range. When the tectorial membrane was rigid and still, the amplitude of the cross movement of liquid increased by about 30 yo. In qualitative terms, the response of the model basilar membrane which we assumed as represented by the normal displacement of Corti, was similar to the real basilar membrane response. Depending on frequency, the place of the maximum response shifted along the axis of the model, getting nearer to the base when the frequency was higher. Spatially, the model was able to discriminate frequencies in the range of about 25-350 Hz. If we assume a frequency scale factor of 50, which we believe to be the most reasonable, this range corresponds rather well to the physiological one. The position of the amplitude maximum of the basilar membrane response proved independent of endolymph viscosity, and, most probably, it was independent of the partition mass too; only compliance appeared to affect it.
When curves of basilar membrane response at a fixed point a8 a function of frequency were plotted, they displayed a remarkable degree of asymmetry ; the curves fell sharply as the frequency increased beyond some critical value, while their rise in the low-frequency side was by far more gradual, and was also in qualitative agreement with the real cochlea. In quantitative terms, however, slopes on both low-frequency and high-frequency sides were smaller in their absolute values than the actual ones; in particular, the high-frequency side had a negative value of 40-60 dB per octave instead of the 100-300 dB per octave measured in vivo in the real cochlea. Since viscosity turned out to affect the peak of the basilar membrane response, the minor defect of the positive slope can be ascribed to some excess of damping; on the other hand the negative slope of the curve was largely unaffected by the viscosity of the endolymphatic liquid.
An understanding of the high-frequency slope defect can be achieved by observing
Experimental results in a physical model of the cochlea 387
the dispersion curves, which we deduced from the phase measurements of the cross sensors in scala media. As Lighthill (1981, p. 156) pointed out, the velocity of energy propagation can be analysed by means of these curves. Our curves conform to theoretical predictions for relatively small values of the number kH; they describe rather well the predicted slowing down of the energy flow, which occurs in passing from the long-wave to the short-wave condition, and the influence of the three- dimensional character of the motion on the group velocity at kH around 2 (Steele & Taber 1978; Lighthill 1981, p. 211). For kH greater than 2, however, the group velocity remains almost constant in our curves, and the final stage predicted by theory, in which the energy propagation should come to a halt, is missing. This can hardly be attributed to a lack of partition inertia; most likely, any further slowing down of the velocity of the energy propagation was prevented by the longitudinal bending stiffness of the partition. According to the theory of the critical layer absorption (Lighthill 1981, p. 158), both generalized stiffness and mass of the whole system must be independent of the wavenumber k if the energy propagation is to be halted. The generalized stiffness is independent of k for small values of the latter, and becomes more and more dependent as k increases, due to the longitudinal stiffness. The inertia of the whole system, in contrast, varies with k as long as its value is small, and tends to become constant as k increases, as the fluid inertia becomes negligible in comparison with the partition inertia. Both a large mass of the partition and a high degree of anisotropy, with the transversal stiffness dominant over the longitudinal one, favour the simultaneity of the two independence conditions required by the theory. In our model, however, the mass of the basilar membrane, of the Corti organ and of the tectorial membrane must be considered rather large, even allowing for the unknown factor of the displacement mode of the basilar membrane. The fact that there was no halt in the energy flow may be reasonably ascribed to an insufficient degree of stiffness anisotropy, which we tried to simulate through the transversal tension applied to the model basilar membrane. This conclusion is consistent with the fact that the mass of the tectorial membrane had hardly any influence on the basilar membrane response of our model.
It is worth noting a posteriori that all our results emphasize the importance of the basilar membrane stiffness; all the other physical magnitudes appear to play a minor role.
In regard to the nonlinear aspects of the fluid motion, we found a continuous flow similar to that described by Helle in 1974. The outstanding feature of this motion is a cross flow, coming out from the sulcus in the area of maximum response of the basilar membrane. The pattern of the continuous flow varied rather irregularly with frequency ; i t proved to be dependent on the shape of the whole gap between the Corti organ and the tectorial membrane, and on the stiffness of the tectorial membrane. The cross flow, however, was always more sharply concentrated than the basilar membrane response and in many cases it displayed an impressive peak. The amplitude of the velocities of the continuous motion increase with the square of the amplitude of the input signal, as expected; yet they are very much smaller than the oscillatory motion amplitudes, even when the input signal in the model is very large, corresponding to an acoustic signal in the neighbourhood of the threshold of pain.
This research was supported by Consiglio Nazionale delle Ricerche (CNR).
388 C. Cancelli, S . D’Angelo, M . Masili and R. Malvano
R E F E R E N C E S
B~KEsY, G. VON 1928 Zur Theorie des Horens. Die Schwingungsform der Basilarmembran.
B ~ K ~ s Y , G. VON 1960 Experiments in Hearing. McGraw-Hill. CANNELL, J. K. 1969 Cochlear models. Ph.D. thesis, University of Warwick. HELLE, R. 1974a Beobachtungen an hydromechanischenModellendes Innenohres mit Nachbildung
von Badarmembran, Corti-Organ und Deckmembran. Dissertation, Technische Universitiit Miinchen.
HELLE, R. 19748 Enlarged hydromechanical cochlea model with basilar membrane and tectorial membrane. In Facts and Models in Hearing (ed. Zwicker & Terhardt), pp. 77-85. Springer.
HUXLEY, A. F. 1969 Is resonance possible in the cochlea after all? Nature 221,935-940. LESSER, M. B. & BERKLEY, D. A. 1972 Fluid mechanics of the cochlea, part 1. J. Fluid Mech. 51,
LIEBERSTEIN, H. M. 1971 The basilar membrane aa a uniformly loaded plate clamped on two spiral boundaries in a plane or on two helical-spiral boundaries; discussion of the model. Math. Bioeci.
LIEBERSTEIN, H. M. 1971 The basilar membrane as a uniformly loaded plate clamped on two spiral boundaries in a plane or on two helical-spiral boundaries: relevance of the species record. Math. Biosci. 13, 134-148.
PhyeiWische zeitschr@ 29, 793-810.
497-5 12.
12,281-291.
LIQHTHILL, J. 1978 Waves in Fluide. Cambridge University Press. LIQHTHILL, J. 1981 Energy flow in the cochlea. J. Fluid Mech. 106, 149-213. PETERSON, L. C. & BOQERT, B. P. 1950 A dynamical theory of the cochlea. J. Acoust. Soc. Am.
RAUCH, S. 1964 Biochemie des Hororgans. Stuttgart : Thiemme. RRODE, W. S. 1971 Observations of the vibration of the basilar membrane in squirrel monkeys
using the Mossbauer technique. J. Awust. Soc. Am. 49, 1218-1231. ROBLES, L., RHODE, W. S. & GEISLER, C. D. 1976 Transient response of the basilar membrane
measure in squirrel monkeys using the Mossbauer effect. J. Acoust. Soc. Am. 59, 926-939. STEELE, C. R. 1973 A possibility for sub-tectorial membrane fluid motion. In B& Mechunim
in Hearing (ed. A. Msller). Academic. STEELE, C. R. 1977 Effects of three-dimensional fluid motion and cochlea curvature on basilar
membrane response. In Proc. 9th Inti Cong. Awust., Madrid, Spain. STEELE, C. R. & TABER, L. A. 1979a Comparison of WKB and finite difference calculations for
a two-dimensional cochlear model. J. Acoust. Soc. Am. 65, 1001-1006. STEELE, C. R. & TABER, L. A. 19798 Comparison of WKB calculations and experimental results
for three-dimensional cochlear models. J. Acoust. Soc. Am. 65, 1007-1018. STEELE, C. R. & ZAIS, J. G. 1985 Effects of opening and coiling in cochlear models. To be published
in J. Acoust. Soc. Am. TONNDORF, J. 1957 Fluid motion in cochlear models. J. Awust. Soc. Am. 29,558-568. TONNDORF, J. 1958a Harmonic distortion in cochlear models. J. Acoust. Soc. Am. 30,929-937. TONNDORF, J. 1958b Beats in cochlear models. J. A m s t . Soc. Am. 31, 608-619. TONNDORF, J. 1959 Dimensional analysis of cochlear models. J. Awuet. Soc. Am. 32,493-497. TONNDORF, J. 1970 Cochlear mechanics and hydrodynamics. Foundatione of modern auditory
VIERQEVER, M. 1980 Mechanics of the inner ear. Delft University Press. VOLDBICH, L. 1978 Mechanical properties of basilar membrane. Acta Otolaryngol. 86, 331-335. ZWISLOCKI, J. 1953 Review of recent mathematical theories of cochlear dynamics. J. Acoust. Soc.
22, 364-381.
theory, vol. 1, pp. 205-254. Academic.
Am. 25, 743-751.


