Embed Size (px)
Citation preview
Expanding the repertoire of microsatellite markersfor polymorphism studies in Indian accessions of mung bean(Vigna radiata L. Wilczek)
Divya Shrivastava • Priyanka Verma •
Sabhyata Bhatia
Received: 4 November 2013 / Accepted: 26 May 2014
� Springer Science+Business Media Dordrecht 2014
Abstract Limited availability of validated, polymorphic
microsatellite markers in mung bean (Vigna radiata), an
important food legume of India, has been a major hurdle
towards its improvement and higher yield. The present study
was undertaken in order to develop a new set of microsat-
ellite markers and utilize them for the analysis of genetic
diversity within mung bean accessions from India. A GA/CT
enriched library was constructed from V. radiata which
resulted in 1,250 putative recombinant clones of which 850
were sequenced. SSR motifs were identified and their
flanking sequences were utilized to design 328 SSR primer
pairs. Of these, 48 SSR markers were employed for assess-
ing genetic diversity among 76 mung bean accessions from
various geographical locations in India. Two hundred and
thirty four alleles with an average of 4.85 alleles per locus
were detected at 48 loci. The polymorphic information
content (PIC) per locus varied from 0.1 to 0.88 (average:
0.49 per locus). The observed and expected heterozygosities
ranged from 0.40 to 0.95 and 0.40 to 0.81 respectively.
Based on Jaccard’s similarity matrix, a dendrogram was
constructed using the unweighted pair-group method with
arithmetic averages (UPGMA) analysis which revealed that
one accession from Bundi, Rajasthan was clustered out
separately while remaining accessions were grouped into
two major clusters. The markers generated in this study will
help in expanding the repertoire of the available SSR
markers thereby facilitating analysis of genetic diversity,
molecular mapping and ultimately broadening the scope for
genetic improvement of this legume.
Keywords Microsatellites � Vigna radiata � SSRs �Enriched library � Genetic diversity
Introduction
Vigna radiata L. Wilczek, commonly known as mung bean
or green gram, is an important grain legume and is widely
cultivated in Asia. It is a self pollinated diploid (2n = 22)
pulse crop, with a genome size of 515 Mb/1C [1]. It is
grown for its rich dietary protein content and high nutri-
tional value and also consists of minerals, amino acids,
beneficial enzymes and phytochemicals. Mung bean seeds,
which are widely eaten as sprouts are a rich source of
antioxidants like flavanoids (Quercetin-3-O-glucoside),
vitamin C and phenolics [2]. The extract of germinated
seeds of V. radiata exhibit higher content of phenolics like
pyrocatechol and ascorbic acid [3]. It is a rich source of
lysine in comparison to cereals which have lower contents.
In addition to being nutritionally important, it is well
adapted to low water requirement, poor fertility of soil and
has short growth duration [4, 5]. Moreover, its biological
value is enhanced since it is used in intercropping systems
due to its capability of fixing atmospheric nitrogen.
Mung bean is mainly cultivated in India, China, Ban-
gladesh, Myannmar, Nepal and Pakistan [5] and India
contributes about 70 % of the total world’s mungbean
Electronic supplementary material The online version of thisarticle (doi:10.1007/s11033-014-3436-7) contains supplementarymaterial, which is available to authorized users.
D. Shrivastava � P. Verma � S. Bhatia (&)
National Institute of Plant Genome Research,
Post Box No. 10531, Aruna Asaf Ali Marg, New Delhi 110067,
India
e-mail: [email protected]
Present Address:
D. Shrivastava
School of Life Sciences, Jawaharlal Nehru University,
New Delhi 110067, India
123
Mol Biol Rep
DOI 10.1007/s11033-014-3436-7
production [6]. Currently, mung bean cultivation occupies
3.24 Mha of land in the country which leads to 1.56 million
tonnes of the crop annually [7]. It is most widely distributed
in the Western Ghats and Rajasthan [7], moreover Madhya
Pradesh and North-western Himalayas also cover a large
area under mung bean cultivation [8, 9]. Despite being a
nutritionally important crop, the genetic exploration leading
to yield enhancement is lacking in mung bean. The yield of
mungbean has been stagnant over years due to several
reasons and conventional breeding efforts have been going
on with the objective of increasing yields, disease resistance
(Mungbean Yellow Mosaic Virus), seed size and dryland
utilization. Moreover, attempts at interspecific hybridiza-
tion [10–14] have also been going on but have not yielded
significant success. Therefore, knowledge of genetic
diversity in this legume would help in development of
superior varieties by the thorough characterization of the
available germplasm [15]. The identification of diverse
germplasm for maximizing the scope of genetic improve-
ment of the crop may be attained with the help of molecular
markers which have been demonstrated to be highly effi-
cient for genetic diversity studies as they are inheritable,
extensively distributed across the genome and are not
affected by the environment [16]. Molecular markers such
as random amplification of polymorphic DNA (RAPD) and
amplified fragment length polymorphism (AFLP) have
been used to detect polymorphism in mung bean [17–19] as
well as for constructing genetic linkage maps [20, 21].
However microsatellites, commonly known as simple
sequence repeats (SSRs) have become the most popular
markers for population genetic studies due to their high
polymorphic potential. SSRs are stretches of 1–6 nucleotide
tandem repeats that are found ubiquitously in all genomes.
Their efficacy is based on the fact that they are highly
polymorphic, co-dominant in nature, highly reproducible,
have good genome coverage, high interspecific transfer-
ability [22, 23], high-throughput assay speed and are cost
effective. Therefore, SSR markers have proved to be rev-
olutionary in plant genetic analysis and they have been
applied to important crops like pea [24], barley [25], maize
[26], soybean [27], rice [28], common bean [29], peanut
[30], sugarcane [31], chickpea [32–34], Jatropha [35],
onion [36], guava [37] and tea [38]. The use of SSR markers
has been especially significant in exploring the diversity
amongst legumes due to their narrow genetic base [39].
Therefore, this study aimed at the development of genomic
SSR markers in mung bean and their utilization for the
analysis of genetic diversity, since at the time of its initia-
tion, genomic resources in mung bean were limited and
‘‘\350’’ SSRs were available [40–44]. More recently, with
the availability of ESTs and next generation based sequence
databases, more than 2,000 genic SSR loci have been
reported [45–49]. However only *5 % were validated for
use as functional markers [48, 49]. Moreover SNPs have
also been reported [47, 50] though the more polymorphic
genomic SSRs continue to be limited. Both SSR and SNP
marker systems have been extensively used in a variety of
genetic analysis. SSRs are preferred over other marker
systems including SNPs as they are more polymorphic with
high heterozygosity values [51–53] and are predominantly
used for evaluating genetic relatedness and species diver-
sity. Hence this study was initiated with the objective of
developing a robust set of SSR markers which would enrich
the existing set of microsatellite markers in mung bean.
In the present study, genomic SSR markers were
developed through construction of a microsatellite enriched
genomic library. Further, their polymorphic potential and
utility was demonstrated by assessing the genetic diversity
among mung bean accessions belonging to different geo-
graphical locations in India. This study would promote the
exploitation of diverse germplasm in mung bean breeding
programs aimed at development of improved varieties.
Materials and methods
Plant materials and DNA extraction
Seventy six accessions of V. radiata were used for the
analysis of genetic diversity in this study. Among the 76
accessions, 26 accessions from Delhi and adjoining areas
were provided by the National Bureau of Plant Genetic
Resources (NBPGR), New Delhi while 50 accessions from
Rajasthan and Gujarat were provided by the NBPGR centre
at Central Arid Zone Research Institute (CAZRI), Jodhpur.
All accessions were grown under natural conditions at the
institute (NIPGR) field site. Five seeds of each accession
were sown and leaf samples were pooled from each of
these. Genomic DNA was isolated from the leaves of each
accession using CTAB method [54] with modifications.
Leaf tissue samples were ground in liquid nitrogen and
suspended in about 3 ml of extraction buffer containing
100 mM Tris–Cl (pH 8.0), 25 mM EDTA, 1.5 M NaCl,
2.5 % CTAB, 0.2 % b-mercaptoethanol (v/v fresh) and
1 % PVP and incubated at 60 �C for 1 h. The homogenate
was extracted with chloroform–isoamylalcohol (24:1) and
an aqueous layer was separated. The DNA was precipitated
by adding 1.5 ml of 5 M NaCl and 0.6 volume of isopro-
panol and pelleted down at 10,000 rpm for 15 min fol-
lowed by washing with 80 % ethanol. The pellet was air
dried and dissolved in 500 ll TE buffer (1 M NaCl,
10 mM Tris–Cl, 1 mM EDTA). RNA contamination was
removed by incubating DNA at 37 �C for 30 min after
adding RNase A (a concentration of 10 lg/ml was used).
Further extraction was done by using equal amount of
chloroform–isoamylalcohol (24:1) and final precipitation
Mol Biol Rep
123
of the genomic DNA was done by adding ice-cold ethanol.
After washing and drying, the pellet was dissolved in
100 ll of water. The quality and quantity of DNA samples
of all the genotypes was determined on 0.8 % agarose gel
and using known concentration of uncut kDNA (25 ng/ll)
as standard. Additionally, nuclear DNA from the leaves of
mung bean accession IC326026 was isolated using the
protocol described by Malmberg et al. [55] and used in
genomic library preparation.
SSR enriched genomic library construction
A genomic library was constructed using a methodology
adapted from Kijas et al. [56]. Nuclear DNA (8 lg) of mung
bean accession IC326026 was isolated and digested with
RsaI restriction enzyme (NEB). The digested products were
ligated to two adaptors: BEPA; (CTCTTGCTTACGCGT
GGACTA) and BEPB (pTAGTCCACGCGTAAGCAAG
AGCACA) and were subjected to amplification with adap-
tor-specific primers. Biotinylated SSR oligo BO2 was used
to hybridize the purified DNA fragments at 50 �C (according
to the Tm of the oligo) for 20 min and streptavidin-coated
magnesphere beads (Promega, Streptavidin MagneSphere
paramagnetic particles) were used to capture the DNA
fragments hybridized with oligoprobe. The beads were first
washed three times with 0.59 SSC, then suspended in 0.59
SSC. To this, the hybridized biotinylated probe–DNA
mixture was added and incubated at room temperature for
10 min and supernatant was removed. The bead–probe–
DNA complex was then suspended in 0.19 SSC, washed
three times with 0.19 SSC and eluted in MQ water. The
eluted DNA–probe complex was amplified with BEPA
primer and amplified fragments were ligated with the
pGEMT vector using the pGEMT easy T/A cloning system
(Promega, Madison, USA) according to the manufacturer’s
instructions and transformation was carried out using
chemically competent cells (NEB). The transformed cells
were screened first on IXA [isopropyl-b-D-thiogalactopy-
ranoside (IPTG), X-gal and ampicillin] plates and further by
colony PCR. The amplified products were size selected by
resolving on 1.2 % agarose gels to identify recombinants
with inserts C250 bp in size.
Microsatellite identification and primer designing
The white recombinant colonies were selected and colony
PCR was performed to confirm the presence of inserts. The
alkaline lysis method [57] was employed for isolation of
plasmid DNA followed by PEG precipitation and
sequenced on the ABI 3700 automated sequencer (Applied
Biosystems, USA). Vecscreen was used to identify and
remove the vector sequences which were then subjected to
CAP3 Program (http://pbil.univ-lyon1.fr/cap3.php) [58] to
remove redundancy. The assembled sequences were ana-
lyzed for the presence of microsatellites which were
identified using the tandem repeat occurrence locator
(TROLL) program [59] where the parameters C4 for di-,
C3 for tri-, tetra- and pentanucleotides was used. The
unique microsatellite enriched sequences were submitted to
the NCBI database and accession numbers were procured
and are mentioned in Supplementary Table S1. Primer 3
(http://frodo.wi.mit.edu/primer3/) [60] software was used
to design primers based on the criteria mentioned in Cho-
udhary et al. [61]. The designed primers were designated as
VrSSR and were synthesized by Bioneer, Korea.
PCR amplification
PCR amplification was carried out in the BIORAD thermal
cycler in a 20 ll reaction mix, each containing 25 ng of
genomic DNA, 19 PCR buffer (50 mM KCl, 20 mM Tris–
Cl pH 8.0), 0.125 mM of each dNTPs, 0.5 lM of primer,
4 % DMSO and 2.5 units of Taq DNA polymerase (New
England Biolabs, USA). A touchdown amplification profile
was used which consisted of an initial denaturation at
95 �C for 2 min followed by 15 cycles: denaturation at
95 �C for 20 s, annealing at 65 �C for 50 s and extension at
72 �C for 50 s. During these 15 cycles the annealing
temperature was set to decrease by 1 �C after every cycle
till it reached the temperature of 55 �C. Another 25 cycles
was performed which consisted of denaturation for 20 s at
95 �C, annealing for 50 s at 55 �C and extension for 50 s at
72 �C followed by a final extension of 7 min at 72 �C. The
amplified products were resolved on 6 % polyacrylamide
gels and analyzed on Typhoon 9210 multi imaging system
(Amersham Biosciences, GE Healthcare, Singapore).
Data analysis
The PCR amplified alleles were visualized by the multi
imaging system and scored manually on a binary matrix,
where the presence and absence of band was designated as
‘1’ and ‘0’ respectively. By using the binary matrix data in
POPGENE version 1.32 [62] genetic diversity parameters
like observed heterozygosity (HO), expected heterozygosity
(HE), Shannon’s information index (I) and fixation index
(FIS) were evaluated. Polymorphic information content
(PIC) was calculated at each locus [63]. The allelic data
obtained across all accessions were used to analyze the
genetic relationships among the 76 mung bean accessions.
The data matrix generated was further used to calculate
Jaccard’s similarity coefficient [64]. After scoring and
computing the allelic data, a dendrogram based on UP-
GMA (Unweighted Pair Group Method with Arithmetic
Averages) algorithm was constructed on NTSYS-pc
Mol Biol Rep
123
version 2.1software [65] and was evaluated with 1,000
bootstraps using the WinBoot software [66].
Results and discussion
Construction of a microsatellite enriched genomic
library for SSR identification and primer design
A microsatellite enriched genomic library was constructed
from nuclear DNA of V. radiata IC326026. Blue-white
selection on IXA plates yielded 1,250 recombinant clones.
Screening through colony PCR resulted in the identifica-
tion of 850 (68 %) recombinant clones with insert size of
C250 bp. Plasmids were isolated from all the recombinant
clones and were sequenced. Of these, 396 sequences were
found to have microsatellite motifs C4 repeats, 345 con-
tained SSRs with \4 repeats, while no repeats were found
in 109 sequences. The observed enrichment rate in this
study was 59.3 % which was significantly higher
(10–20 %) to other plants like sugarcane [31], sorghum
[67] and maize [68] as well as in a previous report of mung
bean where the rate of enrichment was reported to be only
32.04 % [43]. There has been a noteworthy (40–60 %)
increase in the efficiency of enriched libraries over con-
ventional libraries and has resulted in great progress
towards plant genetic studies [69, 70] as conventional
protocols are laborious, time consuming, costly and
microsatellite isolation rate is also low ranging from 5 to
12 % [70]. The 396 sequences with repeat motifs C4 were
assembled into 318 sequences. About 19.7 % sequences
were found to be redundant. The flanking sequences of the
microsatellites which are conserved DNA sequences were
used to design the primers. More than one primer pairs
could be designed from longer sequences having more than
one SSR locus placed *200 bp apart, while in some cases
primers could not be designed due to presence of micro-
satellite motifs at the terminal ends. As a result 328 primer
pairs were designed from 318 consensus sequences (Sup-
plementary Table S1). Earlier studies in mung bean have
utilized different approaches to design genomic SSR
primers where the numbers ranged from a minimum of 7
[40] to a maximum of 210 [71] using conventional
approaches and some of these have been utilized for the
analysis of genetic diversity [40–43] and for linkage
mapping [72, 73]. Moreover, *2,000 genic SSRs were
identified recently [49] of which only about 100 were
validated. Therefore, the 328 genomic SSR primer pairs
reported here would contribute largely to the existing
repertoire of genomic SSR primers for utilization by the
mung bean community in map saturation. Primer devel-
opment may be governed by several factors, such as
insufficient length of flanking region and failure of
sequencing past the microsatellite motif [70, 74]. Primer
design from enriched genomic clones has been observed to
range from 25 to 91 % in many crops like sugarcane [31],
wheat [75], ryegrass [76, 77], Zoysia grass [78], tall fescue
[79], foxtail millet [80] and switchgrass [81]. All the 328
sequences were subjected to BLASTX homology search
(NCBI). Only 86 sequences showed significant hits. Some
sequences showed significant homologies to many impor-
tant and interesting proteins such as micronuclear-linker
histone polyprotein, to bHLH and bZIP transcription factor,
pectinesterase-1 precursor etc.
Sequence analysis of the microsatellite containing
sequences showed the abundance of the targeted GA/CT
motifs in 58.3 % sequences. In addition to the GA/CT
motifs, different non-targeted SSR motifs were also
obtained (4 % GT/CA; 1 % AT/TA; 11 % GAA/CTT;
1.5 % GAT/CTA; 1 % GTT/CAA; 0.4 % each of GGA/
CCT and ACA/TGT; 0.2 % each of GTG/CAC; TGC/
ACG; TCA/AGT; AGC/TCG and others) along with 6 %
tetranucleotide repeats and 12 % pentanucleotide repeats
motifs. Various types of microsatellites are found to occur
ubiquitously in plant genomes. However, they differ
greatly based on their repeat motif number, repeat motif
type, length, composition of repeat motif and distribution
throughout the genome. The GT/CA dinucleotide repeat is
one of the most common microsatellites in humans and
other mammals [82] while AT/TA is the most common
dinucleotide repeat in plants followed by GA/CT and CA/
GT [83]. The self-complimentary nature of AT/TA restricts
its use in SSR-enrichment procedures [84]. Therefore, the
GA/CT motif—the second highest in abundance was used
in this study of microsatellite isolation. The same has also
been used to efficiently isolate microsatellites in different
plant species such as chickpea [32], foxtail millet [80],
wheat [85], rice [86], lentil [87] and Catharanthus [88].
Occurrence of non-targeted motifs in enriched libraries has
been observed in other plants also [88–90] and the most
likely reason may be hybridization of the probe to partially
homologous repeat motif loci. On the basis of the
arrangement of the microsatellites, they were categorized
as perfect (69.2 %), interrupted (2.2 %) and compound
(8.6 %) repeats. In case of the perfect GA/CT, the number
of repeats varied from 4 to 35 (VsSSR52) whereas in case
of perfect GAA/CTT, the number ranged from 4 to 28
(VrSSR326). (Supplementary Table S1).
Polymorphism detection for analysis of genetic
diversity
Three hundred and twenty eight primers could be designed
from the microsatellite containing sequences (Supplemen-
tary Table S1). Validation of a set of 96 primer pairs was
done by PCR amplification of genomic DNA of mung bean
Mol Biol Rep
123
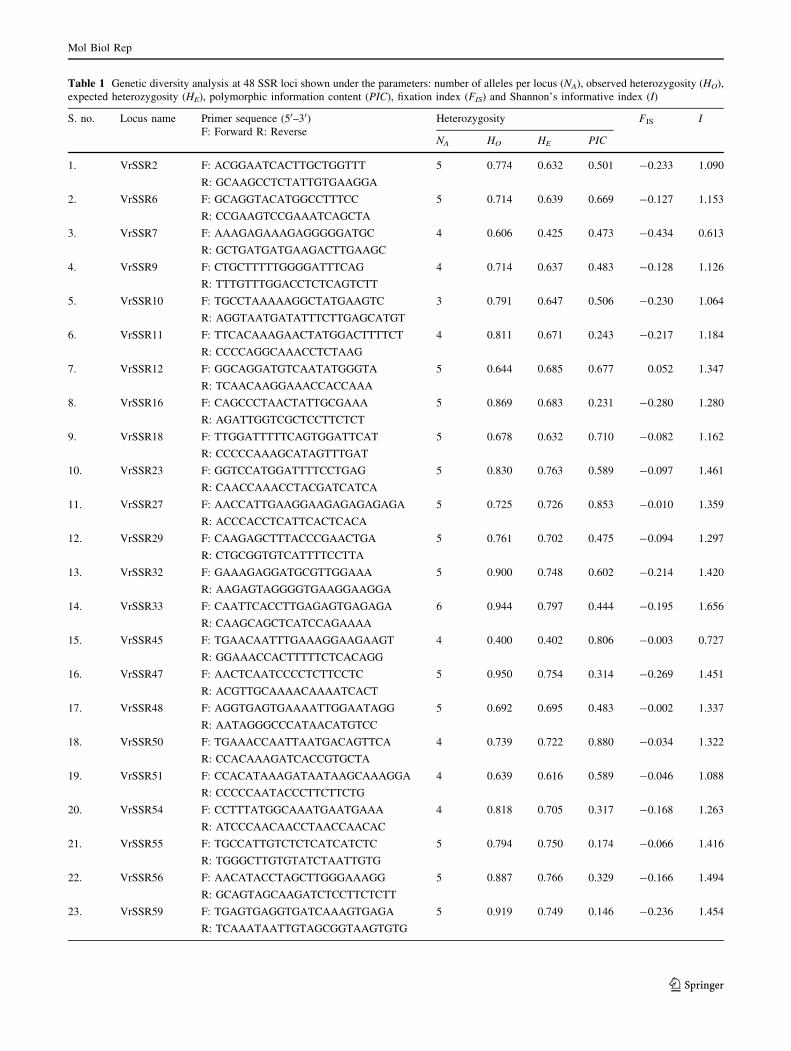
Table 1 Genetic diversity analysis at 48 SSR loci shown under the parameters: number of alleles per locus (NA), observed heterozygosity (HO),
expected heterozygosity (HE), polymorphic information content (PIC), fixation index (FIS) and Shannon’s informative index (I)
S. no. Locus name Primer sequence (50–30)F: Forward R: Reverse
Heterozygosity FIS I
NA HO HE PIC
1. VrSSR2 F: ACGGAATCACTTGCTGGTTT 5 0.774 0.632 0.501 -0.233 1.090
R: GCAAGCCTCTATTGTGAAGGA
2. VrSSR6 F: GCAGGTACATGGCCTTTCC 5 0.714 0.639 0.669 -0.127 1.153
R: CCGAAGTCCGAAATCAGCTA
3. VrSSR7 F: AAAGAGAAAGAGGGGGATGC 4 0.606 0.425 0.473 -0.434 0.613
R: GCTGATGATGAAGACTTGAAGC
4. VrSSR9 F: CTGCTTTTTGGGGATTTCAG 4 0.714 0.637 0.483 -0.128 1.126
R: TTTGTTTGGACCTCTCAGTCTT
5. VrSSR10 F: TGCCTAAAAAGGCTATGAAGTC 3 0.791 0.647 0.506 -0.230 1.064
R: AGGTAATGATATTTCTTGAGCATGT
6. VrSSR11 F: TTCACAAAGAACTATGGACTTTTCT 4 0.811 0.671 0.243 -0.217 1.184
R: CCCCAGGCAAACCTCTAAG
7. VrSSR12 F: GGCAGGATGTCAATATGGGTA 5 0.644 0.685 0.677 0.052 1.347
R: TCAACAAGGAAACCACCAAA
8. VrSSR16 F: CAGCCCTAACTATTGCGAAA 5 0.869 0.683 0.231 -0.280 1.280
R: AGATTGGTCGCTCCTTCTCT
9. VrSSR18 F: TTGGATTTTTCAGTGGATTCAT 5 0.678 0.632 0.710 -0.082 1.162
R: CCCCCAAAGCATAGTTTGAT
10. VrSSR23 F: GGTCCATGGATTTTCCTGAG 5 0.830 0.763 0.589 -0.097 1.461
R: CAACCAAACCTACGATCATCA
11. VrSSR27 F: AACCATTGAAGGAAGAGAGAGAGA 5 0.725 0.726 0.853 -0.010 1.359
R: ACCCACCTCATTCACTCACA
12. VrSSR29 F: CAAGAGCTTTACCCGAACTGA 5 0.761 0.702 0.475 -0.094 1.297
R: CTGCGGTGTCATTTTCCTTA
13. VrSSR32 F: GAAAGAGGATGCGTTGGAAA 5 0.900 0.748 0.602 -0.214 1.420
R: AAGAGTAGGGGTGAAGGAAGGA
14. VrSSR33 F: CAATTCACCTTGAGAGTGAGAGA 6 0.944 0.797 0.444 -0.195 1.656
R: CAAGCAGCTCATCCAGAAAA
15. VrSSR45 F: TGAACAATTTGAAAGGAAGAAGT 4 0.400 0.402 0.806 -0.003 0.727
R: GGAAACCACTTTTTCTCACAGG
16. VrSSR47 F: AACTCAATCCCCTCTTCCTC 5 0.950 0.754 0.314 -0.269 1.451
R: ACGTTGCAAAACAAAATCACT
17. VrSSR48 F: AGGTGAGTGAAAATTGGAATAGG 5 0.692 0.695 0.483 -0.002 1.337
R: AATAGGGCCCATAACATGTCC
18. VrSSR50 F: TGAAACCAATTAATGACAGTTCA 4 0.739 0.722 0.880 -0.034 1.322
R: CCACAAAGATCACCGTGCTA
19. VrSSR51 F: CCACATAAAGATAATAAGCAAAGGA 4 0.639 0.616 0.589 -0.046 1.088
R: CCCCCAATACCCTTCTTCTG
20. VrSSR54 F: CCTTTATGGCAAATGAATGAAA 4 0.818 0.705 0.317 -0.168 1.263
R: ATCCCAACAACCTAACCAACAC
21. VrSSR55 F: TGCCATTGTCTCTCATCATCTC 5 0.794 0.750 0.174 -0.066 1.416
R: TGGGCTTGTGTATCTAATTGTG
22. VrSSR56 F: AACATACCTAGCTTGGGAAAGG 5 0.887 0.766 0.329 -0.166 1.494
R: GCAGTAGCAAGATCTCCTTCTCTT
23. VrSSR59 F: TGAGTGAGGTGATCAAAGTGAGA 5 0.919 0.749 0.146 -0.236 1.454
R: TCAAATAATTGTAGCGGTAAGTGTG
Mol Biol Rep
123
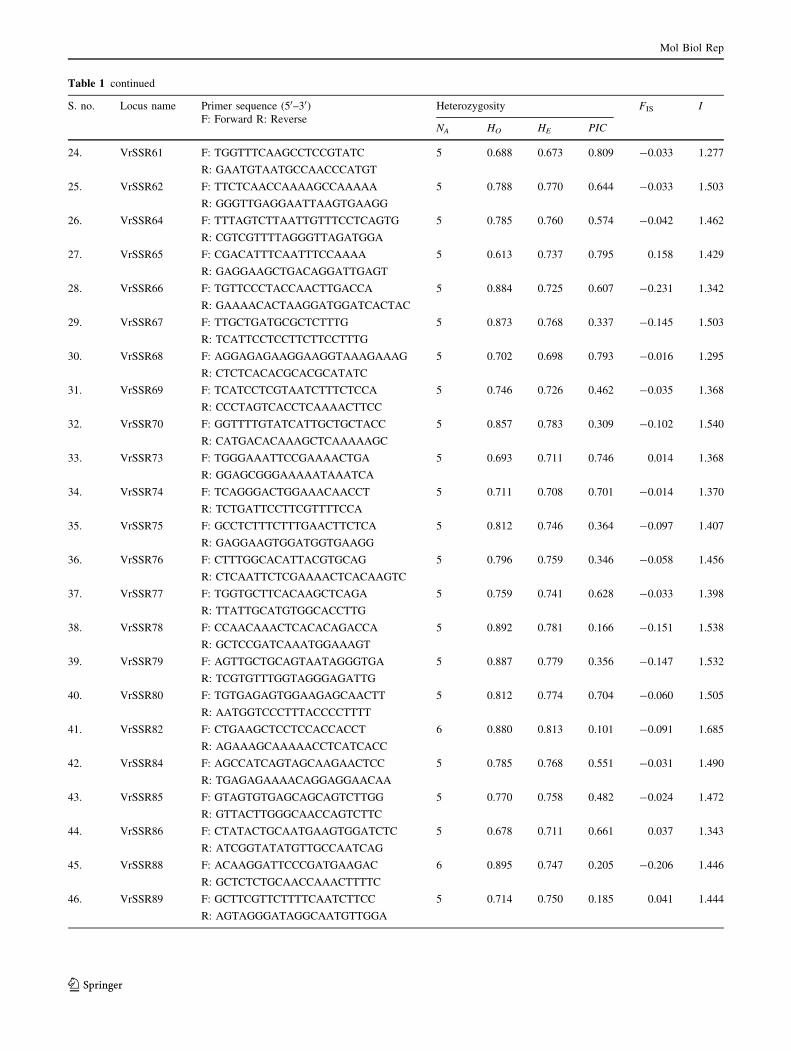
Table 1 continued
S. no. Locus name Primer sequence (50–30)F: Forward R: Reverse
Heterozygosity FIS I
NA HO HE PIC
24. VrSSR61 F: TGGTTTCAAGCCTCCGTATC 5 0.688 0.673 0.809 -0.033 1.277
R: GAATGTAATGCCAACCCATGT
25. VrSSR62 F: TTCTCAACCAAAAGCCAAAAA 5 0.788 0.770 0.644 -0.033 1.503
R: GGGTTGAGGAATTAAGTGAAGG
26. VrSSR64 F: TTTAGTCTTAATTGTTTCCTCAGTG 5 0.785 0.760 0.574 -0.042 1.462
R: CGTCGTTTTAGGGTTAGATGGA
27. VrSSR65 F: CGACATTTCAATTTCCAAAA 5 0.613 0.737 0.795 0.158 1.429
R: GAGGAAGCTGACAGGATTGAGT
28. VrSSR66 F: TGTTCCCTACCAACTTGACCA 5 0.884 0.725 0.607 -0.231 1.342
R: GAAAACACTAAGGATGGATCACTAC
29. VrSSR67 F: TTGCTGATGCGCTCTTTG 5 0.873 0.768 0.337 -0.145 1.503
R: TCATTCCTCCTTCTTCCTTTG
30. VrSSR68 F: AGGAGAGAAGGAAGGTAAAGAAAG 5 0.702 0.698 0.793 -0.016 1.295
R: CTCTCACACGCACGCATATC
31. VrSSR69 F: TCATCCTCGTAATCTTTCTCCA 5 0.746 0.726 0.462 -0.035 1.368
R: CCCTAGTCACCTCAAAACTTCC
32. VrSSR70 F: GGTTTTGTATCATTGCTGCTACC 5 0.857 0.783 0.309 -0.102 1.540
R: CATGACACAAAGCTCAAAAAGC
33. VrSSR73 F: TGGGAAATTCCGAAAACTGA 5 0.693 0.711 0.746 0.014 1.368
R: GGAGCGGGAAAAATAAATCA
34. VrSSR74 F: TCAGGGACTGGAAACAACCT 5 0.711 0.708 0.701 -0.014 1.370
R: TCTGATTCCTTCGTTTTCCA
35. VrSSR75 F: GCCTCTTTCTTTGAACTTCTCA 5 0.812 0.746 0.364 -0.097 1.407
R: GAGGAAGTGGATGGTGAAGG
36. VrSSR76 F: CTTTGGCACATTACGTGCAG 5 0.796 0.759 0.346 -0.058 1.456
R: CTCAATTCTCGAAAACTCACAAGTC
37. VrSSR77 F: TGGTGCTTCACAAGCTCAGA 5 0.759 0.741 0.628 -0.033 1.398
R: TTATTGCATGTGGCACCTTG
38. VrSSR78 F: CCAACAAACTCACACAGACCA 5 0.892 0.781 0.166 -0.151 1.538
R: GCTCCGATCAAATGGAAAGT
39. VrSSR79 F: AGTTGCTGCAGTAATAGGGTGA 5 0.887 0.779 0.356 -0.147 1.532
R: TCGTGTTTGGTAGGGAGATTG
40. VrSSR80 F: TGTGAGAGTGGAAGAGCAACTT 5 0.812 0.774 0.704 -0.060 1.505
R: AATGGTCCCTTTACCCCTTTT
41. VrSSR82 F: CTGAAGCTCCTCCACCACCT 6 0.880 0.813 0.101 -0.091 1.685
R: AGAAAGCAAAAACCTCATCACC
42. VrSSR84 F: AGCCATCAGTAGCAAGAACTCC 5 0.785 0.768 0.551 -0.031 1.490
R: TGAGAGAAAACAGGAGGAACAA
43. VrSSR85 F: GTAGTGTGAGCAGCAGTCTTGG 5 0.770 0.758 0.482 -0.024 1.472
R: GTTACTTGGGCAACCAGTCTTC
44. VrSSR86 F: CTATACTGCAATGAAGTGGATCTC 5 0.678 0.711 0.661 0.037 1.343
R: ATCGGTATATGTTGCCAATCAG
45. VrSSR88 F: ACAAGGATTCCCGATGAAGAC 6 0.895 0.747 0.205 -0.206 1.446
R: GCTCTCTGCAACCAAACTTTTC
46. VrSSR89 F: GCTTCGTTCTTTTCAATCTTCC 5 0.714 0.750 0.185 0.041 1.444
R: AGTAGGGATAGGCAATGTTGGA
Mol Biol Rep
123
accession IC326026. Of these, 57 primer pairs produced
bands of the expected amplifiable size (functional primers),
26 primers failed to amplify, while 13 produced a complex
pattern (multiple unspecific bands) or faint smears. Of the
57 functional primers, 48 primer pairs were employed for
the assessment of genetic diversity in 76 mung bean
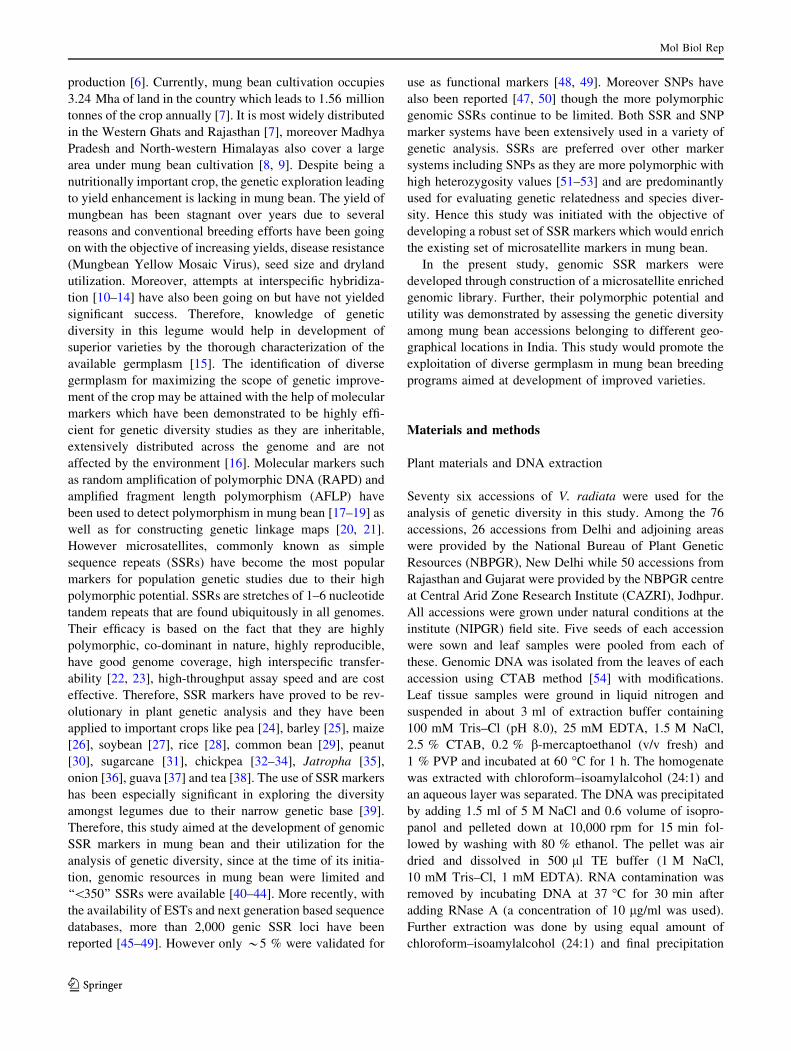
accessions (Table 1). A representative set of mung bean
accessions amplified using primer pair VrSSR54 is shown
in Fig. 1. An average of 4.87 alleles per locus was obtained
from 234 total alleles, amplified at 48 loci which varied
from 3 (VrSSR10) to 6 (VrSSR82, VrSSR88 and
VrSSR33) (Table 1) and were comparable to other plants
such as groundnut (2.44; [89]), Catharanthus (4.75; [91])
and foxtail millet (2.2; [92]). In earlier studies, genetic
diversity in large collections of mung bean using SSR
markers have been done where variable number of alleles
has been reported (3.57; [40], 3; [43], 2.25; [44]), 2.08;
[71]. The PIC value for 48 loci ranged from 0.101
(VrSSR82) to 0.880 (VrSSR50) with an average of 0.49
which was higher than the previous studies on mung bean
(0.34; [5], 0.26; [45], 0.24; [44], 0.26; [71]) thereby justi-
fying their robustness as a potential tool for analysis of
genetic diversity. However, the PIC values were lower than
those obtained in other plants such as soybean (0.60; [84]),
maize (0.72; [93]) and wheat (0.79; [94]). In the present
work, it was observed that a correlation was observed
between length of the repeat motif and PIC value of the
loci. Among the 48 loci used for the genetic diversity
analysis, maximum number of dinucleotide repeat motifs
was present in VrSSR27 (GA18), having fairly high PIC
value of 0.85. Similarly higher PIC value of 0.81 was also
observed for locus VrSSR61 (GA17). The PIC values for
the trinucleotide repeat motifs at loci VrSSR6 (CTT9) and
VrSSR66 (GAA11) were 0.67 and 0.61 respectively.
The observed heterozygosity for individual loci ranged
from 0.4 (VrSSR45) to 0.95 (VrSSR47) with an average of
0.78. The expected heterozygosity ranged from 0.4
(VrSSR45) to 0.81 (VrSSR82) with an average of 0.71
(Table 1) which was comparable to previous reports where
SSR markers in mung bean showed a wide range of het-
erozygosity values of 0.90, 0.56, 0.09, 0.13 and 0.2 [40, 41,
43, 44, 71]. However, the number of accessions used in
these studies was lower (45 in [40, 41], 34 in [43], 22 in
[44] and 17 in [71]). In earlier studies, levels of polymor-
phism have been found to be associated with the occur-
rence of dinucleotide repeats [95, 96]. In the present study
also, high PIC values (average 0.49) were obtained for the
loci with dinucleotide motifs (Table 1) and thus justify
Table 1 continued
S. no. Locus name Primer sequence (50–30)F: Forward R: Reverse
Heterozygosity FIS I
NA HO HE PIC
47. VrSSR91 F: ACATATGTATCTGTCTGTGTGCCTA 5 0.938 0.773 0.243 -0.223 1.521
R: TGGAGATGCAGGACTAAGAAGAG
48. VrSSR96 F: ACCCTAGCTGGTTCAGCAAA 5 0.876 0.749 0.190 -0.178 1.431
R: TGCAGACTGAAGACAGTGCAA
Avg. 4.875 0.780 0.714 0.488 -0.104 1.352
400bp
300bp
200bp
M M1 2 3 4 5 6 7 8 9 10 11 12 13 14 15 16 17 18 19 20 21 22 23 24 25 26 27 28 29 30 31 32 33 34
Fig. 1 PCR amplification profiles of 34 V. radiata accessions
obtained using primer pair VrSSR 54 The PCR amplified products
were resolved on 6 % polyacrylamide gel. M indicated size ladders.
Lanes 1–34 represent V. radiata accessions. 1-IC326026, 2-IC39294,
3-IC39303, 4-IC370489, 5-IC285161,6-IC311426, 7-IC311408,
8-IC370714, 9-IC323998, 10-IC39344, 11-IC324012, 12-IC324025,
13-IC39381, 14-IC325774, 15-IC329067, 16-IC369790,
17-IC369819, 18-IC370467, 19-IC39320, 20-IC370515,
21-IC311437, 22-IC370731, 23-IC415117, 24-IC415144,
25-IC39323, 26-IC324005, 27-IC39368, 28-IC39372, 29-IC328756,
30-IC285192, 31-IC325817, 32-IC39360, 33-IC370743, 34-IC373426
Mol Biol Rep
123
their efficacy for genetic diversity analysis. Fixation index
was tested on all the loci and the values were found to be
negative for 43 loci indicating excess number of hetero-
zygotes (Table 1). The values of Shannon’s informative
index (I) varied from 0.61 (VrSSR7) to 1.68 (VrSSR82),
averaging at 1.35 per locus.
In this study, deviation from the Hardy–Weinberg
equilibrium (HWE) with P \ 0.05 was observed for all the
loci which is in concurrence with earlier studies on diver-
sity analysis in mung bean using SSR markers [5, 43, 45].
The higher observed heterozygosity along with the nega-
tive values of fixation index for majority of loci [97]
observed in our study indicates the heterozygous nature of
the accessions compared to other studies carried out in
mung bean [41, 43, 44, 71]. Lower heterozygosity values
were observed for markers VrSSR12, VrSSR65, VrSSR73,
VrSSR89 and VrSSR96. These findings are further sup-
ported by the fact that the center of diversity of mung bean
lies in India [98] and hence the accessions analyzed in this
study are quite diverse [99]. Further, in a study carried out
on elite parental lines of V. radiata by AVRDC-World
vegetable center [5] and in another study carried out by
Sangiri et al. [100], it was observed that lines which were
of Indian origin were quite diverse. These findings are
further supported by the fact that the center of diversity of
mung bean lies in India where it is believed that the
domestication might have been started [98] and hence the
accessions analyzed in this study are quite diverse. Overall,
the high PIC and heterozygosity values obtained in this
study indicated the potential usefulness of the mung bean
markers for population genetic studies.
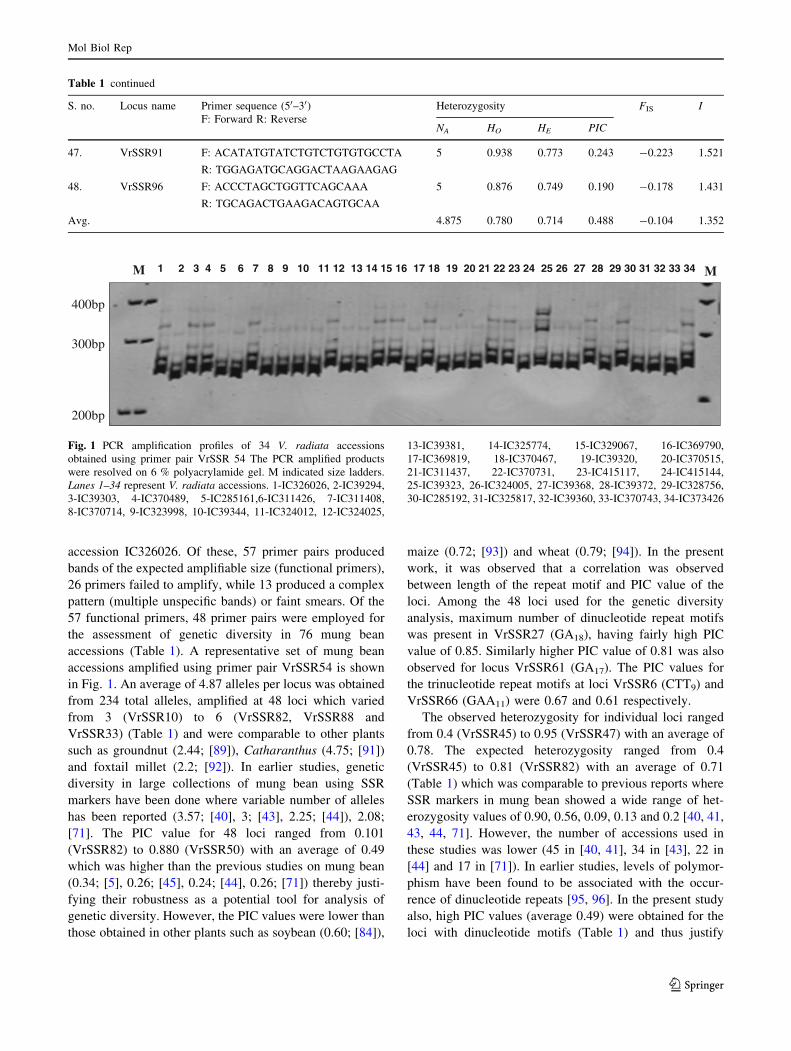
Genetic relationships among mung bean accessions
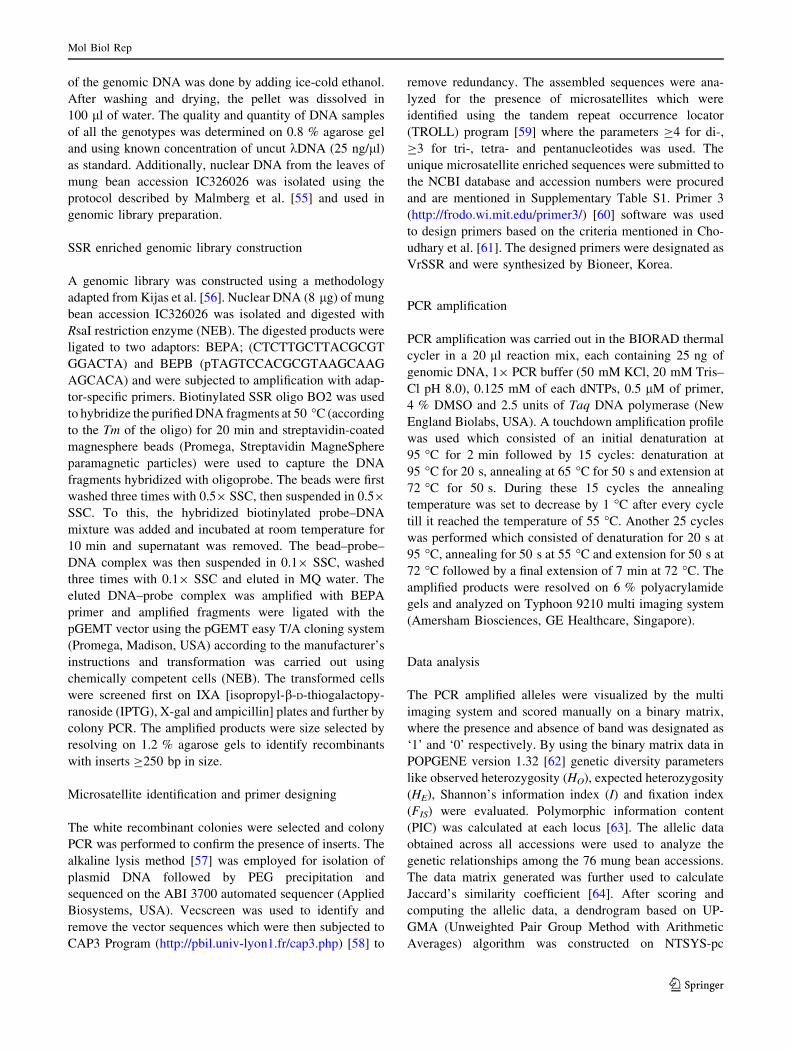
A dendrogram was constructed using the allelic informa-
tion obtained from 48 polymorphic loci across 76 acces-
sions of mung bean (Fig. 2). Genetic similarity was
calculated between all pairs of accessions using Jaccard’s
similarity coefficient which varied from 0.54 to 0.92. The
dendrogram clearly distinguished all the accessions used in
NBPGR,New DelhiNBPGR,New DelhiPali, Raj.Pali, Raj.Jodhpur, Raj.Kutchh, Guj.Kutchh, Guj.Jalore, Raj. Sirohi, Raj.Barmer, Raj.Kutchh, Guj.Sikar, Raj.Jalore, Raj.NBPGR,New DelhiPatan, Guj.NBPGR,New DelhiNBPGR,New DelhiNBPGR,New DelhiJaiselmer, Raj.Jhunjhunu, Raj.Jodhpur, Raj.Baran, Raj.Pali, Raj.Jaiselmer, Raj.Pali, Raj.Bikaner, Raj.Pali, Raj.NBPGR,New DelhiNBPGR,New DelhiNBPGR,New DelhiNBPGR,New DelhiNBPGR,New DelhiKutchh, Guj.Ahmedabad, Guj.Ahmedabad, Guj.Barmer, Raj.Kutchh, Guj.Kutchh, Guj.Kutchh, Guj.Kutchh, Guj.NBPGR,New DelhiNBPGR,New DelhiNBPGR,New DelhiNBPGR,New DelhiNBPGR,New DelhiPali, Raj.NBPGR,New DelhiNBPGR,New DelhiNBPGR,New DelhiNBPGR,New DelhiNBPGR,New DelhiBarmer, Raj.Pali, Raj.Sirohi, Raj.Pali, Raj.Jalore, Raj.Pali, Raj.Pali, Raj.NBPGR,New DelhiKutchh, Raj.Kutchh, Raj.NBPGR,New DelhiKutchh, Raj.Kutchh, Raj.NBPGR,New DelhiNBPGR,New DelhiAhmedabad, Guj.Pali, Raj.Jalore, Raj.NBPGR,New DelhiJalore, Raj.Pali, Raj.Pali, Raj.Pali, Raj.Pali, Raj.Bundi, Raj.
5238 87
53
64
47
71
70
3032
3550
59
59
40
4967
67
8491
48
I
II
IA
IB
IIB
IIA
IIC
Fig. 2 Dendrogram showing genetic relationships among mung bean accessions from different geographical locations constructed using
UPGMA cluster analysis
Mol Biol Rep
123
this study except for two accessions, IC39321 and
IC323998 obtained from NBPGR (New Delhi) and Kutch
(Gujarat), respectively, which showed maximum similarity
(0.92). The dendrogarm revealed that one accession
IC369819 from Bundi, Rajasthan clustered out separately
as an outlier. The remaining accessions were clustered into
two major clusters (I and II) in which the accessions were
randomly distributed and showed no correlation with the
geographical location from which they were obtained.
However, both the major clusters: Cluster I and II were
further divided into sub-clusters, Cluster I in sub-cluster IA
and sub-cluster IB while Cluster II into three sub-clusters
(IIA, IIB and IIC). Sub-cluster IIA was the largest sub-
cluster and most of the accessions from New Delhi were
clustered in this sub-cluster. Since all the accessions could
be successfully distinguished in this study using 48 SSRs, it
established the robustness and utility of the marker set
developed for mung bean.
The current investigation reports the development of
new microsatellite markers for mung bean that were iso-
lated using an SSR enriched genomic library. Marker
potential was evaluated by analysis of genetic diversity
among mung bean accessions obtained from various geo-
graphical locations in India. Overall a set of 328 SSR
primer pairs were designed and 48 of them were used for
the genetic diversity analysis within 76 mung bean acces-
sions. These markers possessed high PIC values and
exhibited high heterozygosity levels and therefore consti-
tute a valuable addition to the genomic microsatellite
marker repository of mung bean and may in future facili-
tate genetic mapping and germplasm characterization for
use in molecular breeding programmes.
Acknowledgments This research work was supported by the
National Institute of Plant Genome Research (NIPGR), New Delhi,
India. Financial assistance provided by the Department of Biotech-
nology (DBT), India through the Project Grant (DBT-PDF Program,
IISc, Bangalore) to DS is thankfully acknowledged. We are thankful to
Dr. Arjun Lal (NBPGR, New Delhi) and Dr. Rakesh Aggarwal (CA-
ZRI, Jodhpur) for providing the accessions of V. radiata for the study.
References
1. Parida A, Raina SN, Narayan RKJ (1990) Quantitative DNA
variation between and within chromosome complements of
Vigna species (Fabaceae). Genetica 82(2):125–133
2. Guo X, Li T, Tang K, Liu RH (2012) Effect of germination on
phytochemical profiles and antioxidant activity of mung bean
sprouts (Vigna radiata). J Agric Food Chem 60(44):11050–11055
3. Ramesh CK, Rehman A, Prabhakar BT, Vijay ABR, Aditya RSJ
(2011) Antioxidant potentials in sprouts vs. seeds of Vigna rad-
iata and Macrotyloma uniflorum. J Appl Pharm Sci 1(7):99–110
4. Lavanya RG, Srivastava J, Ranade SA (2008) Molecular
assessment of genetic diversity in mung bean germplasm.
J Genet 87(1):65–74
5. Somta P, Seehalak W, Srinives P (2009) Molecular diversity
assessment of AVRDC—World vegetable center elite-parental
mungbeans. Breed Sci 59:149–157
6. Raturi A, Singh SK, Sharma V, Pathak R (2012) Stability and
environmental indices analyses for yield attributing traits in
Indian Vigna radiata genotypes under arid conditions. Asian J
Agric Sci 4:126–133
7. Ali M, Gupta S (2012) Carrying capacity of Indian agriculture:
pulse crops. Curr Sci 102(6):874–881
8. Arora RK, Nayar ER (1984) Wild relatives of crop plants in
India. NBPGR Scientific monograph No. 7. National Bureau of
Plant Genetic Resources, New Delhi
9. Bisht IS, Bhatl KV, Lakhanpaul S, Latha M, Jayan PK, Biswas
BK, Singh AK (2005) Diversity and genetic resources of wild
Vigna species in India. Genet Res Crop Evol 52:53–68
10. Chen NC, Parrot JF, Jacobs T, Baker LR, Carlson PS (1977)
Interspecific hybridization of food legumes by unconventional
methods of plant breeding. In: Proceedings first international
mungbean symposium: Asian Vegetable Research and Devel-
opment Centre. Shanhnua, pp 247–252
11. Chowdhury RK, Chowdhury JB (1977) Intergeneric hybridiza-
tion between Vigna mungo L. Hepper and Phaseolus calcaratus
RoxB. Indian J Agric Sci 47:117–121
12. Ahn CS, Hartmann RW (1977) Interspecific hybridization
among four species of the genus Vigna. In: Proceedings of first
international mungbean symposium. Asian vegetable Research
and Development Centre, Shanhua, pp 240–246
13. Gosal SS, Bajaj YPS (1983) Interspecific hybridization between
Vigna mungo and Vigna radiata through embryo culture. Eu-
phytica 32:129–137
14. Bharathi A, VijaySelvaraj KS, Veerabadhiran P, Subba Lakshmi
B (2006) Advances in winter pulse pathology research in Aus-
tralia. Australas Plant Pathol 1(2):120–124
15. Salam MU, Davidson JA, Thomas GJ, Ford R, Jones RAC,
Lindbeck KD, MacLeod WJ, Kimber RBE, Galloway J, Mantri
N, Leur JAG, Coutts BA, Freeman AJ, Richardson H, Aftab M,
Moore KJ, Knights EJ, Nash P, Verrell A (2011) Advances in
winter pulse pathology research in Australia. Australas Plant
Pathol 40(6):549–567
16. Mantri N, Pang E, Ford R (2010) Molecular biology for stress
management. In: Yadav SS, McNeil DN, Weeden N, Patil SS
(eds) Climate change and management of cool season grain
legume crops. Springer, Dordrecht, pp 377–408
17. Santalla M, Power JB, Davery MR (1998) Genetic diversity in
mungbean germplasm revealed by RAPD markers. Plant Breed
117(5):473–478
18. Lakhanpaul S, Chadha S, Bhat KV (2000) Random amplified
polymorphic DNA (RAPD) analysis in Indian mungbean (Vigna
radiata L. Wilczek) cultivars. Genetica 109(3):227–234
19. Bhat KV, Lakhanpaul S, Chadha S (2005) Amplified fragment
length polymorphism (AFLP) analysis of genetic diversity in
Indian mungbean (Vigna radiata (L.) Wilczek) cultivars. Indian
J Biotech 4:56–64
20. Lambridges CL, Lawn RL (2000) Two genetic linkage maps of
mungbean using RFLP and RAPD markers. Aust J Agric Res
51(4):415–425
21. Humphry ME, Konduri V, Lambrides CJ, Magner T, McIntyre
CL, Aitken EAB, Liu CJ (2002) Development of a mungbean
(Vigna radiata) RFLP linkage map and its comparison with
lablab (Lablab purpureus) reveals a high level of colinearity
between the two genomes. Theor Appl Genet 105(1):160–166
22. Eujayl I, Sledge MK, Wang L, May GD, Chekhovskiy K,
Zwonitzer JC, Mian MAR (2004) Medicago truncatula EST-
SSRs reveal cross species genetic markers for Medicago spp.
Theor Appl Genet 108(3):414–422
Mol Biol Rep
123
23. Gautami B, Ravi K, Narasu ML, Hoisington DA, Varshney RK
(2009) Novel set of groundnut SSR markers for germplasm
analysis and interspecific transferability. Int J Integr Biol (IJIB)
7(2):100–106
24. Burstin J, Deniot G, Potier J, Weinachter C, Aubert G, Baranger
A (2001) Microsatellite polymorphism in Pisum sativum. Plant
Breed 120(4):311–317
25. Koebner RMD, Donini R, Reeves JC, Cooke RJ, Law JR (2003)
Temporal flux in the morphological and molecular diversity of
UK barley. Theor Appl Genet 106(3):550–558
26. Taller JM, Bernardo R (2004) Diverse adapted populations for
improving northern maize inbreds. Crop Sci 44(4):1444–1449
27. Wang L, Guan Y, Guan R, Li Y, Ma Y, Dong Z, Liu X, Zhang H,
Zhang Y, Liu Z, Chang R, Xu H, Li L, Lin F, Luan W, Yan Z, Ning
X, Zhu L, Cui Y, Piao R, Liu Y, Chen P, Qiu L (2006) Estab-
lishment of Chinese soybean Glycine max core collections with
agronomic traits and SSR markers. Euphytica 151(2):215–223
28. Cao QJ, Lu BR, Xia H, Rong J, Sala F, Spada A, Grassi F (2006)
Genetic diversity and origin of weedy rice (Oryza sativa f. spon-
tanea) populations found in North-eastern China revealed by
simple sequence repeat (SSR) markers. Ann Bot 98(6):1241–1252
29. Blair MW, Giraldo MC, Buendia HFE, Duque MC, Beebe SE
(2006) Microsatellite marker diversity in common bean
(Phaseolus vulgaris L.). Theor Appl Genet 113(1):100–109
30. Gimenes MA, Hoshino AA, Barbosa AV, Palmieri DA, Lopes
CR (2007) Characterization and transferability of microsatellite
markers of the cultivated peanut (Arachis hypogaea L.). BMC
Plant Biol 7:9
31. Parida SK, Kalia SK, Kaul S, Dalal V, Hemaprabha G, Selvi A,
Pandit A, Singh A, Gaikwad K, Sharma TR, Srivastava PS,
Singh NK, Mohapatra T (2009) Informative genomic micro-
satellite markers for efficient genotyping applications in sugar-
cane. Theor Appl Genet 118(2):327–338
32. Sethy NK, Shokeen B, Edwards KJ, Bhatia S (2006) Develop-
ment of microsatellite markers and analysis of intra-specific
genetic variability in chickpea (Cicer arietinum L.). Theor Appl
Genet 112(8):1416–1428
33. Gaur R, Sethy NK, Choudhary S, Shokeen B, Gupta V, Bhatia S
(2011) Advancing the STMS genomic resources for defining
new locations on the intraspecific genetic linkage map of
chickpea (Cicer arietinum L.). BMC Genomics 12:117
34. Choudhary S, Gaur R, Gupta S, Bhatia S (2012) EST-derived
genic molecular markers: development and utilization for gen-
erating an advanced transcript map of chickpea. Theor Appl
Genet 124(8):1449–1462
35. Mastan SG, Sudheer PDVN, Rahman H, Ghosh A, Rathore MS,
Prakash CR, Chikara J (2012) Molecular characterization of
intra-population variability of Jatropha curcas L. using DNA
based molecular markers. Mol Biol Rep 39(4):4383–4390
36. Baldwin S, Pither-Joyce M, Wright K, Chen L, McCallum J
(2012) Development of robust genomic simple sequence repeat
markers for estimation of genetic diversity within and among
bulb onion (Allium cepa L.) populations. Mol Breed
30(3):1401–1411
37. Rai MK, Phulwaria M, Shekhawat NS (2013) Transferability of
simple sequence repeat (SSR) markers developed in guava
(Psidium guajava L.) to four Myrtaceae species. Mol Biol Rep
40(8):5067–5071
38. Bali S, Raina SN, Bhat V, Aggarwal RK, Goel S (2013)
Development of a set of genomic microsatellite markers in tea
(Camellia L.) (Camelliaceae). Mol Breed 32(3):735–741
39. Varshney RK, Kudapa H, Roorkiwal M, Thudi M, Pandey MK,
Saxena RK, Chamarthi SK, Mohan SM, Mallikarjuna N, Up-
adhyaya H, Gaur PM, Krishnamurthy L, Saxena KB, Nigam SN,
Pande S (2012) Advances in genetics and molecular breeding of
three legume crops of semi-arid tropics using next-generation
sequencing and high-throughput genotyping technologies.
J Biosci 37(5):811–820
40. Kumar SV, Tan SG, Quah SC, Yusoff K (2002) Isolation of
microsatellite markers in mungbean, Vigna radiata. Mol Ecol
Notes 2(2):96–98
41. Kumar SV, Tan SG, Quah SC, Yusoff K (2002) Isolation and
characterization of seven tetranucleotide microsatellite loci in
mung bean, Vigna radiata. Mol Ecol Notes 2:293–295
42. Miyagi M, Humphry M, Ma ZY, Lambrides CJ, Bateson M, Liu
CJ (2004) Construction of bacterial artificial chromosome
libraries and their application in developing PCR-based markers
closely linked to a major locus conditioning bruchid resistance
in mungbean (Vigna radiata L. Wilczek). Theor Appl Genet
110(1):151–156
43. Gwag JG, Chung WK, Chung HK, Lee JH, Ma KH, Dixit A,
Park YJ, Cho EG, Kim TS, Lee SH (2006) Characterization of
new microsatellite markers in mungbean, Vigna radiata (L.).
Mol Ecol Notes 6(4):1132–1134
44. Seehalak W, Somta P, Sommanas W, Srinives P (2009)Microsatellite markers for mungbean developed from sequence
database. Mol Ecol Res 9(3):862–864
45. Tangphatsornruang S, Somta P, Uthaipaisanwong P, Chanpra-
sert J, Sangsrakru D, Seehalak W, Sommanas W, Tragoonrung
S, Srinives P (2009) Characterization of microsatellites and gene
contents from genome shotgun sequences of mungbean (Vigna
radiata (L.)Wilczek). BMC Plant Biol 9:137
46. Somta P, Seehalak W, Srinives P (2009) Development, character-
ization and cross-species amplification of mungbean (Vigna radi-
ata) genic microsatellite markers. Conserv Genet 10(6):1939–1943
47. Moe KT, Chung J-W, Cho Y-I, Moon J-K, Ku J-H, Jung J-K,
Lee J, Park Y-J (2011) Sequence information on simple
sequence repeats and single nucleotide polymorphisms through
transcriptome analysis of mungbean. J Integr Plant Biol
53(1):63–73
48. Singh N, Singh H, Nagarajan P (2013) Development of SSR
markers in mung bean, Vigna radiata (L.) Wilczek using in
silico methods. J Crop Weed 9(1):69–74
49. Gupta SK, Bansal R, Gopalakrishna T (2014) Genome-wide
SNP discovery in mungbean by Illumina HiSeq. Theor Appl
Genet 195:245–258
50. Van K, Kang YJ, Han KS, Lee YH, Gwag JG, Moon JK, Lee SH
(2013) Genome-wide SNP discovery in mungbean by Illumina
HiSeq. Theor Appl Genet 126(8):2017–2027
51. Hamblin MT, Warburton ML, Buckler ES (2007) Empirical
comparison of simple sequence repeats and single nucleotide
polymorphisms in assessment of maize diversity and related-
ness. PLoS One 2(12):e1367
52. Yang X, Xu Y, Shah T, Li H, Han Z, Li J, Yan J (2011)
Comparison of SSRs and SNPs in assessment of genetic relat-
edness in maize. Genetica 139(8):1045–1054
53. Emanuelli F, Lorenzi S, Grzeskowiak L, Catalano V, Stefanini
M, Troggio M, Myles S, Martinez-Zapater JM, Zyprian E,
Moreira FM, Grando MS (2013) Genetic diversity and popula-
tion structure assessed by SSR and SNP markers in a large
germplasm collection of grape. BMC Plant Biol 13:39
54. Khanuja SPS, Shasany AK, Darokar MP, Kumar S (1999) Rapid
isolation of DNA from dry and fresh samples of plant producing
large amounts of secondary metabolites and essential oils. Plant
Mol Biol Rep 17(1):74
55. Malmberg R, Messing J, Sussex I (1985) Molecular biology of
plants: a laboratory course manual. Cold Spring Harbor, New
York
56. Kijas JMH, Fowler JCS, Garbett CA, Thomas MR (1994)
Enrichment of microsatellites from the citrus genome using
biotinylated oligonucleotide sequences bound to streptavidin-
coated magnetic particles. Biotechniques 16(4):656–662
Mol Biol Rep
123
57. Sambrook J, Fritsch EF, Maniatis T (1989) Molecular cloning: a
laboratory Manual, 2nd edn. Cold Spring Harbor Laboratory
Press, New York
58. Huang X, Madan A (1999) CAP3: a DNA sequence assembly
program. Genome Res 9(9):868–877
59. Castelo AT, Martins W, Gao GR (2002) TROLL-tandem repeat
occurrence locator. Bioinformatics 18(4):634–636
60. Rozen S, Skaletsky HJ (1997) PRIMER 3. Code available at, http://
www.genome.wi.mit.edu/genome_software/other/primer3.html
61. Choudhary S, Sethy NK, Shokeen B, Bhatia S (2009) Develop-
ment of chickpea EST-SSR markers and analysis of allelic vari-
ation across related species. Theor Appl Genet 118(3):591–608
62. Yeh FC, Boyle TJB (1997) Population genetic analysis of co-
dominant and dominant markers and quantitative traits. Belg J
Bot 129:157
63. Anderson JA, Churchill GA, Autrique JE, Tanksley SD, Sorrells
ME (1993) Optimizing parental selection for genetic linkage
maps. Genome 36(1):181–186
64. Jaccard P (1908) Nouvelles recherches sur la distribution florale
Bulletin de la societe vauodoise des sciences. Naturelles
44:223–270
65. Rohlf FJ (1998) NTSYS-pc: numerical taxonomy and multi-
variate analysis system, in: Version 2. 1. Exeter Software,
Applied Biostatistics Setauket, NewYork
66. Yap IV, Nelson RJ (1996) WinBoot: a program for performing
bootstrap analysis of binary data to determine the confidence
limits of UPGMA-based dendrograms. IRRI, Philippines
67. Bhattramakki D, Dong J, Chhabra K, Hart GE (2000) An inte-
grated SSR and RFLP linkage map of Sorghum bicolor (L.)
Moench. Genome 43(6):988–1002
68. Sharopova N, McMullen MD, Schultz L, Schroeder S, Sanchez-
Villeda H, Gardiner J, Bergstrom D, Houchins K, Melia-Han-
cock S, Musket T, Duru N, Polacco M, Edwards K, Ruff T,
Register JC, Brouwer C, Thompson R, Velasco R, Chin E, Lee
M, Woodman-Clikeman W, Long MJ, Liscum E, Cone K, Davis
G, Coe EH (2002) Development and mapping of SSR markers
for maize. Plant Mol Biol 48:463–481
69. Gupta P, Varshney R (2000) The development and use of
microsatellite markers for genetic analysis and plant breeding
with emphasis on bread wheat. Euphytica 113(3):163–185
70. Zane L, Bargelloni L, Patarnello T (2002) Strategies for
microsatellite isolation: a review. Mol Ecol 11(1):1–16
71. Somta P, Musch W, Kongsamai B, Chanprame S, Nakasathien
S, Toojinda T, Sorajjapinun W, Seehalak W, Tragoonrung S,
Srinives P (2008) New microsatellite markers isolated from
mungbean (Vigna radiata (L.) Wilczek). Mol Ecol Res
8(5):1155–1157
72. Isemura T, Kaga A, Tabata S, Somta P, Srinives P, Shimizu T, Jo
U, Vaughan DA, Tomooka N (2012) Construction of a genetic
linkage map and genetic analysis of domestication related traits in
mungbean (Vigna radiata). PLoS One 7(8):e41304
73. Dan Z, Xu-Zhen C, Li-Xia W, Su-Hua W, Yan-Ling M (2010)
Construction of mungbean genetic linkage map. Acta Agron Sin
36(6):932–939
74. Squirrell J, Hollingsworth PM, Woodhead M, Russell J, Lowe AJ,
Gibby M, Powell W (2003) How much effort is required to isolate
nuclear microsatellites from plants? Mol Ecol 12(6):1339–1348
75. Pestova F, Ganal MW, Roder MS (2000) Isolation and mapping
of microstallite markers specific for the D-genome of bread
wheat. Genome 43(4):689–697
76. Jones ES, Dupal MP, Kolliker R, Drayton MC, Forster JW
(2001) Development and characterization of simple sequence
repeat (SSR) markers for perennial ryegrass (Lolium perenne
L.). Theor Appl Genet 102:405–415
77. Hirata M, Cai HW, Inoue M, Yuyama N, Miura Y, Komatsu T,
Takamizo T, Fujimori M (2006) Development of simple
sequence repeat (SSR) markers and construction of an SSR
based linkage map in Italian ryegrass (Lolium multiflorum
Lam.). Theor Appl Genet 113(2):270–279
78. Tsuruta SI, Hashiguchi M, Ebina M, Matsuo T, Yamamoto T,
Kobayashi M, Takahara M, Nakagawa H, Akashi R (2005)
Development and characterization of simple sequence repeat
markers in Zoysia japonica Steud. Grassl Sci 51(3):249–257
79. Saha MC, Cooper JD, Rouf Mian MA, Chekhovskiy K, May GD
(2006) Tall fescue genomic SSR markers: development and
transferability across multiple grass species. Theor Appl Genet
113(8):1449–1458
80. Jia X, Zhang Z, Liu Y, Zhang C, Shi Y, Song Y, Wang T, Li Y
(2009) Development and genetic mapping of SSR markers in
foxtail millet [Setaria italica (L.) P. Beauv.]. Theor Appl Genet
118(4):821–829
81. Wang YW, Samuels TD, Wu YQ (2011) Development of 1,030
genomic SSR markers in switchgrass. Theor Appl Genet
122(4):677–686
82. Toth G, Gaspari Z, Jurka J (2000) Microsatellites in different
eukaryotic genomes survey and analysis. Genome Res 10(7):967–981
83. Cardle L, Ramsay L, Milbourne D, Macaulay M, Marshall D,
Waugh R (2000) Computational and experimental character-
ization of physically clustered simple sequence repeats in plants.
Genetics 156:847–854
84. Powell W, Machray GC, Provan J (1996) Polymorphism revealed
by simple sequence repeats. Trends Plant Sci 1(7):215–222
85. Varshney RK, Kumar A, Balyan HS, Roy JK, Prasad M, Gupta
PK (2000) Characterization of microsatellites and development
of chromosome specific STMS markers in bread wheat. Plant
Mol Biol Rep 18(1):5–16
86. Rajendrakumar P, Biswal AK, Balachandran SM, Srinivasarao
K, Sundaram RM (2007) Simple sequence repeats in organellar
genomes of rice: frequency and distribution in genic and inter-
coding regions. Bioinformatics 23(1):1–4
87. Hamwieh A, Udupa SM, Sarker A, Jung C, Baum M (2009)
Development of new microsatellite markers and their applica-
tion in the analysis of genetic diversity in lentils. Breed Sci
59:77–86
88. Shokeen B, Choudhary S, Sethy NK, Bhatia S (2011) Devel-
opment of SSR and gene-targeted markers for construction of a
framework linkage map of Catharanthus roseus. Ann Bot
(Lond) 108(2):321–336
89. Cuc LM, Mace ES, Crouch JH, Quang VD, Long TD, Varshney
RK (2008) Isolation and characterization of novel microsatellite
markers and their application for diversity assessment in culti-
vated groundnut (Arachis hypogaea). BMC Plant Biol 8:55
90. Jena SN, Srivastava A, Rai KM, Ranjan A, Singh SK, Nisar T,
Srivastava M, Bag SK, Mantri S, Asif MH, Yadav HK, Tuli R,
Sawant SV (2012) Development and characterization of geno-
mic and expressed SSRs for levant cotton (Gossypium herba-
ceum L.). Theor Appl Genet 124(3):565–576
91. Shokeen B, Sethy NK, Kumar S, Bhatia S (2007) Isolation and
characterization of microsatellite markers for analysis of
molecular variation in the medicinal plant Madagascar peri-
winkle (Catharanthus roseus (L.) G. Don). Plant Sci
172(3):441–451
92. Gupta S, Kumari K, Sahu PP, Vidapu S, Prasad M (2012)
Sequence-based novel genomic microsatellite markers for robust
genotyping purposes in foxtail millet [Setaria italic L.) P.
Beauv.]. Plant Cell Rep 31(2):323–337
93. Pejic I, Ajmone-Marsan P, Morgante M, Kozumplick V, Cas-
tiglioni P, Taramino G, Motto M (1998) Comparative analysis of
genetic similarity among maize inbred lines detected by RFLPs,
RAPDs, SSRs, and AFLPs. Theor Appl Genet 97:1248–1255
94. Prasad M, Varshney RK, Roy JK, Balyan HS, Gupta PK (2000)
The use of microsatellites for detecting DNA polymorphism,
Mol Biol Rep
123
genotype identification and genetic diversity in wheat. Theor
Appl Genet 100:584–592
95. Morgante M, Olivieri AM (1993) PCR amplified microsatellites
as markers in plant genetics. Plant J 3(1):175–182
96. Lagercrantz U, Ellegren H, Andersson L (1993) The abundance
of various polymorphic microsatellite motifs differs between
plants and vertebrates. Nucleic Acids Res 21(5):1111–1115
97. Wright S (1978) Evolution and the genetics of populations.
Variability within and among natural populations, vol 4. Uni-
versity of Chicago Press, Chicago
98. Smartt J (1990) Grain legumes: evolution and genetic resources.
Cambridge University Press, Cambridge
99. Tomooka N, Lairungreang C, Nakeeraks P, Egawa Y, Thav-
arasook C (1991) Center of genetic diversity, dissemination
pathways and landrace differentiation in mung bean. In: Tha-
vasarook C (ed) Proceedings of mung bean meeting 90, Tropical
agricultural Research Center, Japan, Thailand office, Bangkok,
pp 47–71
100. Sangiri C, Kaga A, Tomooka N, Vaughan D, Srinives P (2007)
Genetic diversity of the mungbean (Vigna radiata, Legumino-
sae) genepool on the basis of microsatellite analysis. Aust J Bot
55:837–847
Mol Biol Rep
123


![Non-symbiotic hemoglobin and nitrate reductase constitute an alternative to fermentation in waterlogging tolerance of mung bean [Vigna radiata (L.) Wilczek]](https://img.dokumen.tips/doc/110x75/63319564b6829c19b80b903b/non-symbiotic-hemoglobin-and-nitrate-reductase-constitute-an-alternative-to-fermentation.jpg)


