Embed Size (px)
Citation preview

MECHANISMS OF EXOCYTOSIS
Exocytosis of Insulin
In Vivo Maturation of Mouse Endocrine Pancreas
Aldo Rozzo,a,b Tiziana Meneghel-Rozzo,a
Sasa Lipovsek Delakorda,c Shi-Bing Yang,a,d
and Marjan Rupnika,c
aEuropean Neuroscience Institute Gottingen, Gottingen, GermanybDepartment of Medicine, Children’s Hospital Boston,Harvard Medical School, Boston, Massachusetts, USA
cFaculty of Medicine University of Maribor, Maribor, SloveniadHoward Hughes Medical Institute, San Francisco, California, USA
The aim of this study was to define when an insulin-positive cell becomes functionalin vivo and starts to exocytose insulin in a regulated nutrient-dependent manner. Insulin-positive cells appear in embryonic life (midgestation) and complete their maturation,presumably around birth. In order to work with embryonic and newborn endocrinepancreas, we used organotypic slices. The mouse embryonic pancreas slices show highbasal insulin release that is not further elevated by high glucose levels. Despite thepresence of functional voltage-activated ion channels, the cells are not electrically activein the presence of secretagogues. At birth, the high basal insulin release drops and,after postnatal day 2, the insulin-positive cells show both adult-like bursting electricalactivity and hormone release induced by high glucose levels. These properties allowedus to define them as beta cells. Despite the apparent stability of the transcription factorprofile reported in insulin-positive cells during late-embryonic life, functional beta cellsappear only 2 days after birth.
Key words: insulin release; embryo; newborn; beta-cell maturation; developingpancreas
Introduction
In mouse embryos, endocrine pancreaticprecursor cells first appear in the pancreaticbud at the 14-somite stage [about embry-onic day (E8.5), midgestation1,2]. At E10.5,these precursor cells further differentiate intoinsulin-positive cells in the ductal epithelium.3
The processes of cell proliferation, migration,and maturation4 persist throughout the em-bryonic stage, and, just before birth, theseprecursor cells form the islets of Langerhans
Address for correspondence: Dr. Marjan Rupnik, Institute of Physio-logy, Faculty of Medicine, University of Maribor, Slomskov trg 15, 2000Maribor, Slovenia. Voice: +386 2 330 5854; fax: +386 2 330 [email protected]
and still maintain a high proliferation rate forabout 2 weeks after birth.3,5,6 Mammalian em-bryos have relatively higher plasma insulin lev-els compared to postnatal stages.7 Right afterbirth, the neonates lose maternal energy sup-plies and the whole body, including the pan-creas, has to adapt quickly to gain the controlof energy homeostasis.
However, in contrast to the morphogenesis ofislets of Langerhans, functional development ofthe pancreatic beta cell is still largely unknown.A mature pancreatic beta cell is defined as aninsulin-secreting cell, and the secretion is tightlyregulated upon stimulation (primarily glucose).The glucose responsiveness in rat beta cells ma-tures progressively in postnatal life8 as a conse-quence of increasing glucokinase activity, but a
Mechanisms of Exocytosis: Ann. N.Y. Acad. Sci. 1152: 53–62 (2009).doi: 10.1111/j.1749-6632.2008.04003.x C© 2009 New York Academy of Sciences.
53

54 Annals of the New York Academy of Sciences
detailed functional analysis of the developmentof excitability and secretory competence in themouse is lacking.
In this study, we used organotypic culturedslices from mouse pancreas, a novel prepara-tion, to study the functional development ofpancreatic beta cells.9 The main reason forusing this approach is the high yield of en-docrine tissue from young animals when thepancreatic tissue is scarce and fragile. In fact,the insulin-positive cell clusters appear as smallelongated shapes close to the ducts in late-embryonic life.9 We found that embryonic betacells have a higher basal insulin secretion ratebut very little glucose responsiveness. This factcan be at least explained by its depolarizedmembrane potential. At postnatal day 2, thebasal insulin secretion is significantly reducedto the adult level, coinciding with the gradu-ally hyperpolarized membrane potentials. Thischange is primarily a result of delayed ex-pression of ATP-sensitive potassium channels(KATP).
Materials and Methods
Experimental Animals
Naval Medical Research Institute (NMRI)mice were provided by Gottingen University(ZTE) and used between embryonic day 17(E17) and postnatal day 7 (P7). The adults(pregnant) were killed by cervical dislocationand decapitation and embryos and newbornsby decapitation. All animal procedures wereconducted according to the National Institutesof Health guidelines and approved by the localanimal care authorities. Blood samples werecollected immediately after decapitation fromthe carotid artery to measure glucose (One-Touch Ultra, LifeScan, Milpitas, CA) and to ex-tract plasma for insulin measurement (EDTA-prepared microtubes, Sarstedt, Nuernbrecht,Germany; ultrasensitive mouse insulin ELISA,Mercodia, Uppsala, Sweden) according to themanufacturer’s instructions.
Slices
Whole pancreas slices were prepared as pre-viously reported.9 Briefly, low-melting pointagarose (1.9% in extracellular solution at 37◦C;Cambrex Corporation, East Rutherford, NJ)was injected under the organ capsule to sta-bilize the tissue. Blown-up pancreas was em-bedded in the same agarose and cut into 100-μm thick slices, using a vibratome (VT1000S,Leica Microsystems AG, Wetzlar, Germany)in ice-cold solution bubbled with 95% O2
and 5% CO2. To wash out the pharmaco-logically active compounds released by thecutting procedure, the slices were stored incold, bubbled, extracellular solution for atleast 1 h and then used for experiments. Be-tween E17 and P3 both the animals andpancreata increased their weight more than300%10 and, accordingly, the number of slicesprepared from each animal increased frommore than 10 to about 20, with five to 15insulin-positive cell clusters or islets each. Thisgave us the possibility of using tissue from thesame animal for electrophysiological hormone-release and immunostaining experiments.
Immunostaining
The slices were used fresh or after overnightculture in a humid incubator (37◦C with 5%CO2). For overnight culture, slices were placedin 24-well plates, free floating in about 1 mLof incubation medium. Both fresh and culturedslices were fixed with 4% paraformaldehyde inPBS (pH 7.4) for 1 h. The slices were than in-cubated in the blocking solution (reducing un-specific binding and increasing the penetrationof antibodies) for 1 h at room temperature orovernight at 4◦C with two primary antibodies:anti-insulin (prepared in mouse, 1:1000 dilu-tion, Sigma, St Louis, MO) and anti-S100 (inrabbit, 1:200, DAKO, Carpinteria, CA). Afterwashing, the slices were incubated with sec-ondary antibodies anti-mouse Alexa 488 andanti-rabbit Alexa 647 (in goat, 1:500; Molecu-lar Probes, Carlsbad, CA) for 1 h in blocking
Rozzo et al.: Perinatal Exocytosis of Insulin 55
solution. All the incubations were at room tem-perature unless otherwise indicated. Finally,slices were mounted using a solution of 95%glycerol in PBS, and fluorescence immunos-taining was acquired using a confocal micro-scope (Leica TCS SP2 AOBS; Leica Microsys-tems, Mannheim, Germany) using 488 nm (Ar)and 633 nm (He-Ne) lasers for sequential ex-citation. The images were processed by Leicaconfocal software.
Transmission Electron Microscopy
For the electron microscopy, the tissue wasembedded in epoxy resin (Agar Scientific Ltd.,Essex, UK). The tissue was then dissectedand fixed in 2.45% glutaraldehyde and 2.45%paraformaldehyde in 0.1 mol/L sodium ca-codylate buffer (pH 7.4) at room temperaturefor 3 h and at 4◦C overnight. Small fragmentsof tissue were washed in 0.1 mol/L sodium ca-codylate buffer at room temperature for 3 hand postfixed in 2% OsO4 at room tempera-ture for 2 h. Then, the tissue was washed in0.1 mol/L sodium cacodylate buffer (pH 7.4)at room temperature for 3 h and dehydratedusing a graded ethanol series and embedded inepoxy resin. The samples were sectioned on anUltracut E Ultramikrotom (Reichert, Depew,NY). Semithin sections were stained with 0.5%toluidine blue in aqueous solution. For electronmicroscopy, ultrathin sections (70 nm) wereobtained and transferred to copper grids(300 mesh). Ultrathin sections were stainedwith uranyl acetate and lead citrate and exam-ined in a Zeiss EM 902 transmission electronmicroscope.
Insulin Release
After a washing step, the slices were incu-bated at 37◦C in culture medium for at least10 min. Single slices were incubated sequen-tially in low (5 mmol/L) and high (15 mmol/L)glucose in 0.2 mL solution in a humid incu-bator (37◦C, 5% CO2) and the media pre-warmed. After 30 min of incubation a sampleof medium was collected to measure the in-
sulin released and the remaining medium wasdiscarded. Each slice was then homogenizedand the insulin content extracted by sonicationin acid ethanol (25 min, 200 μL11) to normalizethe release to the hormone cellular content inthe slice.
Electrophysiology
The slices were superfused (1.5 mL/min)with warm, bubbled, extracellular solution(35◦C; 95% O2, 5% CO2; pH 7.4) in a record-ing chamber (400 μL). A platinum frame withnylon fibers kept the slices flat on the bottom ofthe recording chamber. An upright microscope(Eclipse E600FN, Nikon, Tokyo, Japan) with a60× water objective was used. Borosilicate cap-illaries (GC150F-15; Harvard Apparatus Ltd,Edenbridge, UK) were pulled to resistances of3–6 M� by a horizontal puller (P-97 SutterInstruments, Novato, CA).
Recordings were performed in whole-cellconfiguration with a standard patch-clamp am-plifier (SWAM IIC, Celica, Ljubljana, Slovenia;or EPC9/10, HEKA Electronik, Lambrecht,Germany). Data were acquired with WinWCP3.2.9 software (John Dempster, Universityof Strathclyde, Glasgow, UK) via an A/Dconverter (PCI-6035E, National Instruments,Austin, TX). The same software was used toanalyze data and export them to Sigmaplot(version 7.0, SPSS Inc., Chicago, IL). Putativebeta cells were identified by the characteris-tic voltage-activated Na+ current inactivationproperties.9,12 ATP concentration inside thepipette was 0, 2, or 5 mmol/L as indicated.
Solutions and Chemicals
Extracellular solution (in mmol/L) was asfollows: NaCl 125, KCl 2.5, MgCl2 1, CaCl22 or 10, NaH2PO4 1.25, NaHCO3 26, Na-pyruvate 2, ascorbic acid 0.25, myo-inositol 3,lactic acid 6, and glucose between 3 and 15,pH 7.4 (with carbogen at 35◦C). K-intracellular(in mmol/L) solution was as follows: KCl 150,HEPES 10, MgCl2 2, EGTA 0.05, Na2-ATP asindicated, pH 7.2 (with KOH). Cs-intracellular

56 Annals of the New York Academy of Sciences
Figure 1. Relation between insulin-positive cells and ducts in postnatal day 0 (P0) mice.(A) Confocal image of double staining of 100-μm thick pancreas slice from P0 with anti-insulin (green) and anti-S-100 (Schwann cells and ducts, red) antibodies. Many S-100 positivecells are evident in the lower part of the picture and can be identified as Schwann cells(arrowheads) along fibers, around the ganglion (arrows), and the islets (asterisks). The solitaryinsulin-positive cell in the ganglion seems to be part of a neuroinsular complex. The islet inthe upper left area of the picture is located at the bifurcation of a duct and is magnified andrendered in three dimension in (B). The anatomical relation between ducts and beta cellsappears strict at P0 with numerous, isolated, insulin-positive cells along the ducts, the putativesource of endocrine precursors. At higher magnification (C) the two cell populations appearmixed and focal insulin accumulations in the cytoplasm are visible. (D) Insulin-positive cell(green) embedded in the pancreatic duct (S-100, red). (E) Transmission electromicrograpyshowing the dilatations of the extracellular space and absence of docked insulin granules inP0 beta cells. Scale bars: (A) 250 μm; (B) 100 μm; (C) 50 μm; (D) 25 μm; (E) 500 nm.
(in mmol/L): CsCl 140, HEPES 10, MgCl2 2,EGTA 10, ATP-Na2 2 or 5, TEA-Cl 20, pH 7.2[with tetraethylammonium (TEA)-OH]. Incu-bation medium was CMRL-1066 (InvitrogenCo., Paisley, UK) without L-glutamine and sup-plemented with 10% fetal bovine serum, peni-cillin 100 U/mL, streptomycin 100 μg/mL,and ciprofloxacin 4 μg/mL. Blocking solutionconsisted of 3% normal goat serum, 3% BSA,and 0.3% Triton in PBS buffer. Extraction so-lution consisted of 71% EtOH and 0.5% HClin water (acid/ethanol11). All chemicals werefrom Sigma unless otherwise indicated.
Statistics
Statistics are given as means ± SEM. Thestatistical significance for the comparison wasassessed using paired or unpaired Student’st-test.
Results
Morphology
We first used immunostaining to determinethe morphological development of pancreaticbeta cells in organotypic slices. Double stain-ing of anti-insulin and anti-S-100 antibodiesduring the first postnatal days showed thepresence of many insulin-positive cells associ-ated with ducts in the terminal region of thepancreatic ductal system (Fig. 1B). In embry-onic and newborn pancreata, Schwann cellswere found around islets, ganglia, and neu-ronal fibers (Fig. 1A). Unexpectedly ductalstructures with typical morphology were alsostained.
As already reported, the insulin signal dis-tribution in embryo and P0 beta cells iscondensed to a perinuclear area (Fig. 1C).

Rozzo et al.: Perinatal Exocytosis of Insulin 57
More rarely, the anti-GluT2 (Fig. 1D) stainedapical parts of the ductal tree, which har-bored a small number of isolated insulin-positive cells, confirming the ongoing neoge-nesis of endocrine cells from precursors duringthe first few postnatal days.13,14 Larger dilata-tions of extracellular space observed betweenendocrine cells at P0 may represent discon-nections from cell replication (Fig. 1E; SusanBonner-Weir, Joslin Diabetes Center, personalcommunication).
Insulin versus Glucose Levels
The plasma glucose and insulin levels areshown in Figure 2A. Before birth (E17–18) theplasma level of insulin was high. In contrast,the plasma glucose level in embryos was rel-atively low, although it was largely controlledby the mother. The plasma glucose levels in-creased just before birth (E19), despite an ele-vated insulin level (Fig. 2A). After birth, the glu-cose level rose above 4 mmol/L (Fig. 2A) andthen progressively reached a plateau after P2.In the same period, the insulin level decreased.This result indicated the establishment of anadult-like regulatory mechanism for insulinrelease.
Hormone Release from Slices
Insulin release was tested using static in-cubation (Fig. 2B) in basal (5 mmol/L,black hatched) and stimulatory (15 mmol/L,hatched) glucose concentrations. The basalinsulin release was high in embryonic lifeand dropped after birth from 6.7 ± 0.9 to2.6 ± 0.7% of its cellular content (E19 vs. P0).Despite this difference, the response to highglucose levels was negligible in both ages. Thishigh basal release in the embryo was stablefor hours and was inhibited when incubated atroom temperature (data not shown).15,16 FromP2 onward, 15 mmol/L glucose resulted in anadditional insulin release of 2.3 ± 0.8% on topof its basal release (3.4 ± 0.5%).
Figure 2. Plasma insulin and glucose levels andinsulin release in embryo and newborn mice. (A) Ageprofile of the glucose level in plasma (diamonds) andthe insulin level in plasma (squares) in 141 (mini-mum 10 animals/age) and 59 (minimum five ani-mals/age) mice, respectively. The glucose level startsto rise just before birth and reaches a plateau 3 daysafter birth. Insulin, on the other hand, is high be-fore birth and starts to decline after; it reaches aplateau in about 3 days. The insulin drop betweenP0 and P2 is statistically relevant (P < 0.03); glucoselevels rise the day before birth [P < 0.01, embry-onic day (E)18 vs. E19]. (B) Insulin release in organ-otypic pancreas slices induced by low (5 mmol/L,basal release, black hatched bars) and high glu-cose (15 mmol/L, stimulated release, grey hatchedbars) levels via sequential static incubation of 23slices (minimum seven slices/age). The basal releasedropped immediately after birth; responsiveness toglucose started only at P2. Values in boxes aremeans ± SEM; (∗∗P < 0.02, ∗P < 0.05; pairedt-test comparing the responses of each slice, unpairedbetween ages).
Electrical Activity
Electrical activity was recorded in whole-cell mode in pancreas slices. Until P0 the cellswere depolarized (−47 ± 5 mV, n = 13) and
58 Annals of the New York Academy of Sciences
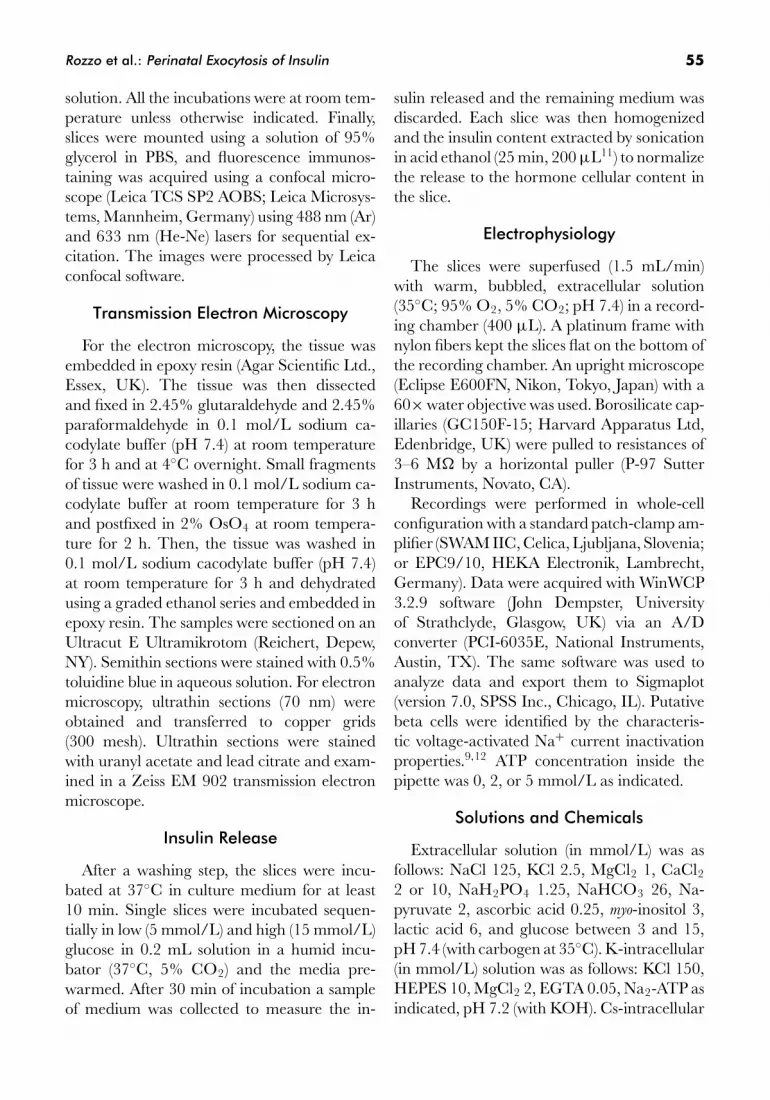
Figure 3. Electrical activity induced by applica-tion of tolbutamide. Three representative traces of theresponses induced by tolbutamide (100 μmol/L, thearrows mark the start of application) in newborn betacells at different ages. (A) At P0 (top trace), betacells have a relatively depolarized resting membranepotential and tolbutamide only slightly depolarizesthe membrane. After P1 (middle and bottom trace)the resting membrane potential was more hyperpo-larized and the tolbutamide elicited much strongerdepolarization, and from P3 onward, even burstingactivity can be observed sometimes upon tolbutamideapplication. Right panels show expanded traces. (B)Electrical activity after the injection of different cur-rent pulses in E20 (left trace) and P3 (right trace)beta cells.
application of the KATP modulator, tolbu-tamide (100 μmol/L), induced only a mild de-polarization (Fig. 3A). At P2, the cells showedmore hyperpolarized potential (−83 ± 7 mV,n = 6) and the KATP block induced a sus-tained depolarization and firing activity. How-ever, only from P3 did the cells start to showadult-like bursting activity with plateau phasesbetween clusters of Ca2+ firing.17 The injectionof a current (+10 pA steps) also showed ab-sence of firing in insulin-positive cells in animalsyounger than P0; however, similar current in-jection induced action potential-like electricalactivity in insulin-positive cells of older animals(>P2; Fig. 3B).
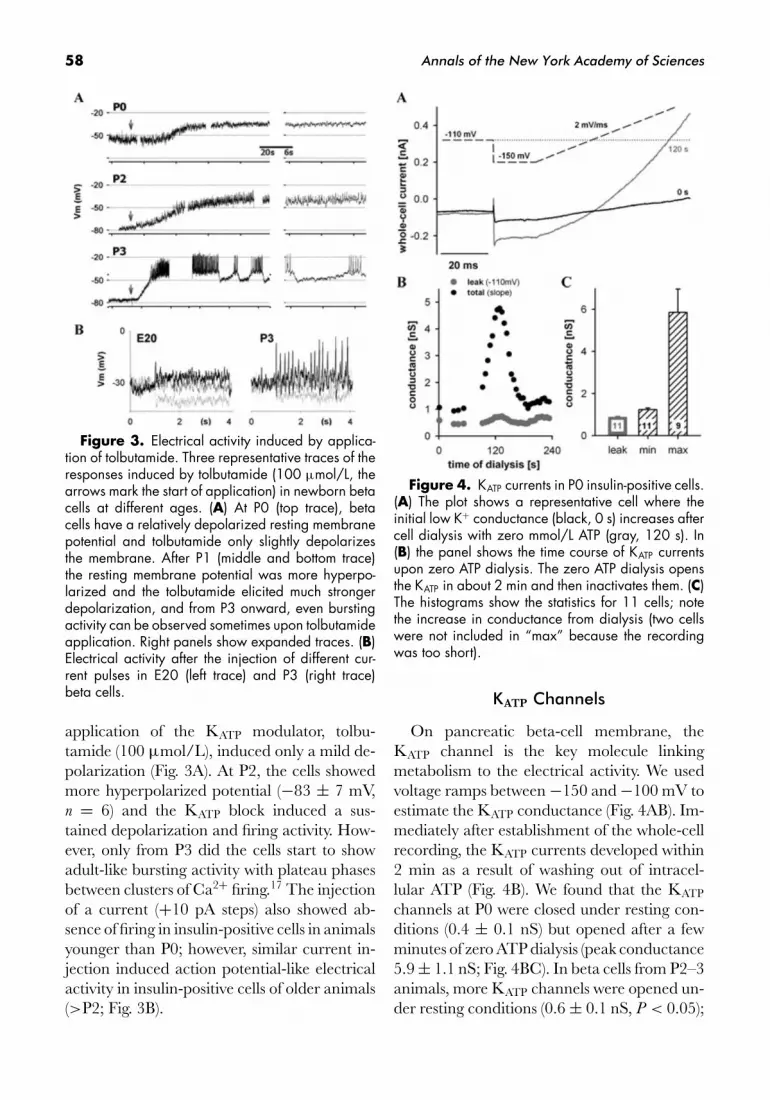
Figure 4. KATP currents in P0 insulin-positive cells.(A) The plot shows a representative cell where theinitial low K+ conductance (black, 0 s) increases aftercell dialysis with zero mmol/L ATP (gray, 120 s). In(B) the panel shows the time course of KATP currentsupon zero ATP dialysis. The zero ATP dialysis opensthe KATP in about 2 min and then inactivates them. (C)The histograms show the statistics for 11 cells; notethe increase in conductance from dialysis (two cellswere not included in “max” because the recordingwas too short).
KATP Channels
On pancreatic beta-cell membrane, theKATP channel is the key molecule linkingmetabolism to the electrical activity. We usedvoltage ramps between −150 and −100 mV toestimate the KATP conductance (Fig. 4AB). Im-mediately after establishment of the whole-cellrecording, the KATP currents developed within2 min as a result of washing out of intracel-lular ATP (Fig. 4B). We found that the KATP
channels at P0 were closed under resting con-ditions (0.4 ± 0.1 nS) but opened after a fewminutes of zero ATP dialysis (peak conductance5.9 ± 1.1 nS; Fig. 4BC). In beta cells from P2–3animals, more KATP channels were opened un-der resting conditions (0.6 ± 0.1 nS, P < 0.05);

Rozzo et al.: Perinatal Exocytosis of Insulin 59
Figure 5. Development of Ca2+ currents ininsulin-positive cells. (A) Two representative tracesof Ca2+ currents induced in embryo (E, gray) andnewborn (P0, black) applying a ramp from −110to +60 mV with a slope of 0.5 mV/ms. Note thatthe P0 cell has not only a smaller current but alsoa larger surface (+0.7 pF) according to its increasein cell size. The dialysis effect on current amplitudeis shown in the insert. (B) The Ca2+ current density iscompared between different ages. Numbers on barsindicate the number of cells tested.
peak conductance after zero ATP washout wasnot significantly different from P0 (not shown).
Ca2+ Channels
The pancreatic beta cell has calciumchannel-mediated action potentials.17 The dif-ference in membrane activity between E19 andP2 could be partially a result of different cal-cium channel expression on the membrane. Weused Cs+-based solution to record the Ca2+
currents from both embryonic and newbornbeta cells (Fig. 5A). We found the normalizedCa2+ peak current amplitudes were higher inembryonic cells and dropped significantly atbirth (from −57.6 ± 6.4 to −30.6 ± 4.4 pA/pF,respectively; Fig. 5B).
In E20, a relatively rare condition (approxi-mately 1%) of delayed birth from a small litter
Figure 6. Increase in capacitance triggered byactivation of voltage-activated Ca2+ channels. A trainof depolarizations from −60 to +10 mV was ap-plied (10 Hz, 40 ms per pulse). (A) Two representa-tive traces in P0 (gray) and P3 (black) insulin-positivecells. (B) Statistically significant difference in capaci-tance change (P < 0.002) and responsiveness of theinsulin-positive cells. At P0 12/21 cells responded toa depolarization train (>20 fF), while 12/14 cellsresponded at P2. The ATP concentration inside thepipette was 5 mmol/L to exclude any response limi-tation from ATP washout.
size (four or five pups vs. 14 and 18 pups) wasobserved; the weight of these embryos (2.09 ±0.03 g) was comparable to P2 (2.03 ± 0.15 g)and was 58% higher than E19 (1.32 ± 0.05 g).Despite the increased body size, the insulin-positive cells maintained their embryonic fea-tures, suggesting a critical role for deliveryor the start of independent life in triggeringthe functional maturation of beta cells (notshown).
Single Cell Exocytotic Activity
The application of a train of 100 depo-larizing pulses from a holding potential at−60 mV to +10 mV (40-ms duration, 10 Hz)was used to open voltage-activated Ca2+ chan-nels and test the secretory capacity in asingle beta cell (Fig. 6A). This protocol wasapplied between 20 and 30 s after the estab-lishment of the whole-cell patch-clamp mode.The number of responsive cells increasedfrom 57 to 86% between E18–P0 and P2–P3, and the capacitance change amplitude in-creased from less than 100 fF to about 300 fF(Fig. 6B).
60 Annals of the New York Academy of Sciences
Discussion
Insulin-positive cells at birth are not respon-sive to stimulatory levels of glucose but showa high basal insulin release (Fig. 2). This ob-servation can account for both low levels ofinsulin immunostaining close to the plasmamembrane9 and the minuscule capacitancechange induced by the depolarization train(Fig. 6). This suggests that insulin takes overthe glycemic control only postnatally.
At birth, basal insulin release drops, and thisevent seems to be correlated to the drop involtage-activated Ca2+ conductance. Two daysafter birth, the insulin and glucose levels arecomparable with those in adult animals, sug-gesting that the glucose levels take over the con-trol of insulin release. At this age, the cells ap-pear similar to adult beta cells, considering boththe secretory capacity and excitability. This lasttransition may be associated with an increasein resting KATP conductance that reduces theresting membrane potential.
The idea of nonmature hormonal releaseat birth is not surprising as insulin does notseem to be vital during the first days afterbirth. Recently, a number of knockout (KO)animals were produced eliminating genes in-volved in islet-cell differentiation. Some ofthese KOs, such as Nkx2.2,18 Nkx6.1,19 Pax4,20
and Arx-Pax421 almost completely lack insulin-producing cells, but despite this they survivethrough gestation and at birth are almost in-distinguishable (or slightly smaller) from theirwild-type and heterozygous littermates. By thesecond day postpartum all of these KOs havesevere problems related to glucose homeosta-sis. The phenotype of the aforementioned mu-tants and the high insulin plasma level observedand reported in wild-type embryos7 wouldsuggest a predominant trophic and hemody-namic action for insulin during embryoniclife.
The interruption of the glucose supply forcesthe animal to maintain glycemia compatiblewith the active behavior of feeding. The factthat the Ca2+ current density does not in-
crease significantly between nonresponsive P0and mature-like beta cells at P2–3 (Fig. 5) sug-gests that the insensitivity of P0 to high glu-cose is not a result of Ca2+ channel propertiesand the redundant Ca2+ conductance in em-bryos is apparently causing the high basal re-lease. It would be possible to speculate aboutthe nonresponsiveness to high glucose levels inembryos, assuming saturation of the system al-ready at basal glucose concentration (close to7% in 30 min compared to less than 3% inadults). This would also explain the depletionof insulin-positive granules from the cell periph-ery (Fig. 1E). Furthermore, the lower responsein capacitance suggests a rapid exhaustion ofsecretory vesicles in embryonic and P0 betacells, reaching a plateau phase in a few sec-onds, blunting the glucose-stimulated insulinrelease.
S-100 has not yet been reported as a duc-tal marker in pancreas. This might stem fromthe fact that this feature seems to be absent inanimals older than 3 weeks (data not shown).The high expression of this protein family inpancreatic ductal adenocarcinomas22 suggestsa correlation between S-100 and the high pro-liferation rate present in embryo and newbornducts as in tumors.
The strict anatomical relationship betweeninsulin-positive cells and ductal cells has al-ready been shown with citokeratin-209 andwith GluT2.13,14 Using thicker slices allowedus to reconstruct larger portions of the tis-sue and obtain evidence that many insulin-positive cells are still not aggregated at birth andare putative precursor cells that are destinedto migrate and/or aggregate into new islets(Fig. 1B).
In adults the KATP activity is known to becrucial to maintain the resting membrane po-tential,23 and the total KATP conductance wasestimated to be about two times higher than inP0–P3. In beta cells, both perinatal and adult,dialysis with 2 mmol/L ATP slightly hyperpo-larizes the cell, suggesting that, in P0, the rest-ing ATP is higher than 2 mmol/L. Until P0, theresting KATP conductance is close to 6% of the
Rozzo et al.: Perinatal Exocytosis of Insulin 61
maximum; in P3 it reaches 12%, and in adultsit was reported to be close to 20%.24 We donot have enough evidence to explain whatcauses the difference between these two differ-ent stages, but putative cytosolic factor(s) con-trolling ATP sensitivity may still be identified.
The knowledge on the maturation of func-tional beta cells in wild-type animals is vitalfor understanding the basic physiology of theseimportant cells. This information is also key forevaluating the results of the numerous manip-ulations devoted to producing new or modifiedinsulin-releasing cells that could improve cellreplacement therapy in diabetic patients. Theprocess of beta-cell neogenesis, naturally oc-curring between the late-embryonic and theearly postnatal stages, appears to be a rele-vant model for studying regeneration. A de-tailed characterization of beta-cell physiologyduring the early postnatal period will also pro-vide a solid base to evaluate the insulin-positivecells in many model mice with perinatal lethalphenotype (KO of Pax6, Pax4, Arx genes) andnewly differentiated insulin-positive cells fromembryonic25 or adult stem cells or from trans-differentiated cells both in vitro and in vivo. Inaddition, further studies are required to assessthe epigenetic influence on the maturation ofinsulin-positive cells.
Acknowledgments
We thank Marion Niebeling, Heiko Rohse,and Rudi Mlakar for excellent technical sup-port. Part of the work was financed bythe Growbeta European Union grant (5thframework, No. QLG1-CT-2001-02233). TheEuropean Neuroscience Institute Gottingen(ENI-G) is jointly funded by the GottingenUniversity Medical School, the Max-Planck-Society, and Schering AG. MR is supportedfrom the Slovenian Research Agency (J3-7186-2334).
Conflicts of Interest
The authors declare no conflicts of interest.
References
1. Edlund, H. 2002. Pancreatic organogenesis–developmental mechanisms and implications fortherapy. Nat. Rev. Genet. 3: 524–32.
2. Lammert, E., O. Cleaver & D. Melton. 2003. Role ofendothelial cells in early pancreas and liver develop-ment. Mech. Dev. 120: 59–64.
3. Habener, J.F., D.M. Kemp & M.K. Thomas. 2005.Minireview: transcriptional regulation in pancreaticdevelopment. Endocrinology 146: 1025–1034.
4. Bonner-Weir, S. et al. 2004. The pancreatic ductalepithelium serves as a potential pool of progenitorcells. Pediatr. Diabetes 5(Suppl 2): 16–22.
5. Murtaugh, L.C. & D.A. Melton. 2003. Genes, signals,and lineages in pancreas development. Annu. Rev. Cell
Dev. Biol. 19: 71–89.6. Georgia, S. & A. Bhushan. 2004. Beta cell replication
is the primary mechanism for maintaining postnatalbeta cell mass. J. Clin. Invest. 114: 963–968.
7. Alvarez, C. et al. 1997. Contrasted impact of maternalrat food restriction on the fetal endocrine pancreas.Endocrinology 138: 2267–2273.
8. Taniguchi, S., K. Tanigawa & I. Miwa. 2000. Imma-turity of glucose-induced insulin secretion in fetal ratislets is due to low glucokinase activity. Horm. Metab.
Res. 32: 97–102.9. Meneghel-Rozzo, T. et al. 2004. In vivo and in vitro
development of mouse pancreatic beta-cells in organ-otypic slices. Cell Tissue Res. 316: 295–303.
10. Montanya, E. et al. 2000. Linear correlation betweenbeta-cell mass and body weight throughout the lifes-pan in Lewis rats: role of beta-cell hyperplasia andhypertrophy. Diabetes 49: 1341–1346.
11. Detimary, P., J.C. Jonas & J.C. Henquin. 1995. Pos-sible links between glucose-induced changes in theenergy state of pancreatic B cells and insulin release.Unmasking by decreasing a stable pool of adeninenucleotides in mouse islets. J. Clin. Invest. 96: 1738–1745.
12. Gopel, S. et al. 1999. Voltage-gated and resting mem-brane currents recorded from B-cells in intact mousepancreatic islets. J. Physiol. 521(Pt 3): 717–728.
13. Pang, K., C. Mukonoweshuro & G.G. Wong. 1994.Beta cells arise from glucose transporter type 2(Glut2)-expressing epithelial cells of the developingrat pancreas. Proc. Natl. Acad. Sci. USA 91: 9559–9563.
14. Bonner-Weir, S. & A. Sharma. 2002. Pancreatic stemcells. J. Pathol. 197: 519–526.
15. Henquin, J.C. et al. 1975. Quinine-induced modifi-cations of insulin release and glucose metabolism byisolated pancreatic islets. FEBS Lett. 57: 280–284.
16. Atwater, I. et al. 1984. Cooling dissociates glucose-induced insulin release from electrical activity and

62 Annals of the New York Academy of Sciences
cation fluxes in rodent pancreatic islets. J. Physiol.
348: 615–627.17. Dean, P.M. & E.K. Matthews. 1970. Glucose-
induced electrical activity in pancreatic islet cells. J.
Physiol. 210: 255–264.18. Sussel, L. et al. 1998. Mice lacking the homeodomain
transcription factor Nkx2.2 have diabetes due to ar-rested differentiation of pancreatic beta cells. Devel-
opment 125: 2213–2221.19. Naya, F.J. et al. 1997. Diabetes, defective pancreatic
morphogenesis, and abnormal enteroendocrine dif-ferentiation in BETA2/neuroD-deficient mice. Genes
Dev. 11: 2323–2334.20. Sosa-Pineda, B. et al. 1997. The Pax4 gene is essential
for differentiation of insulin-producing beta cells inthe mammalian pancreas. Nature 386: 399–402.
21. Collombat, P. et al. 2005. The simultaneous lossof Arx and Pax4 genes promotes a somatostatin-producing cell fate specification at the expense of
the {alpha}- and {beta}-cell lineages in the mouseendocrine pancreas. Development 132: 2969–2980.
22. Nakamura, T. et al. 2004. Genome-wide cDNA mi-croarray analysis of gene expression profiles in pan-creatic cancers using populations of tumor cells andnormal ductal epithelial cells selected for purity bylaser microdissection. Oncogene 23: 2385–2400.
23. Smith, P.A., F.M. Ashcroft & P. Rorsman. 1990. Si-multaneous recordings of glucose dependent electri-cal activity and ATP-regulated K(+)-currents in iso-lated mouse pancreatic beta-cells. FEBS Lett. 261:187–190.
24. Speier, S. et al. 2005. KATP-channels in beta-cellsin tissue slices are directly modulated by millimolarATP. Mol Cell Endocrinol. 230: 51–58.
25. Blyszczuk, P. et al. 2004. Embryonic stem cells differ-entiate into insulin-producing cells without selectionof nestin-expressing cells. Int. J. Dev. Biol. 48: 1095–1104.


