Embed Size (px)
Citation preview
ORIGINAL ARTICLE
Evaluation of stakeholder participation in monitoringregional sustainable development
Frans L. P. Hermans • Wim M. F. Haarmann •
John F. L. M. M. Dagevos
Received: 15 September 2010 / Accepted: 11 March 2011 / Published online: 29 March 2011
� The Author(s) 2011. This article is published with open access at Springerlink.com
Abstract This paper presents a theoretical framework
that can be used to discuss the question of how context,
time and different participatory process designs influence
the results of participatory monitoring projects in terms of
concrete outputs (such as sustainability indicators) and the
more intangible social outcomes (such as learning and
stakeholder relations). We will discuss and compare four
different cases of participatory monitoring of provincial
sustainable development in the Netherlands. The results
show sustainability issues selected by the stakeholders
reflect the socio-economic and ecological structural char-
acteristics of their region. In a different context, stake-
holders not only assign different weights to the same set of
issues, but more importantly they select a completely dif-
ferent set of regional aims altogether. Since these regional
structural characteristics only change slowly over time, the
influence of time on stakeholder preferences is shown to be
only of minor importance. However, the dissipation of
learning effects is shown to be a fundamental challenge for
the cyclical nature of participatory monitoring, especially
when its goal is shared agenda building. Another important
conclusion is that, in the design of participatory processes,
more attention should be devoted to providing stakehold-
ers with the opportunity to comment on an ‘intermediate’
product.
Keywords Stakeholders � Participatory monitoring �Participatory integrated assessment �Regional sustainable development
Introduction
A shift is occurring in traditional regional development
strategies away from a top-down approach towards more
bottom-up approaches characterised by a decentralised
style of policy making that also stimulates the horizontal
ties between private and public bodies. At the same time,
attention for the potential of each region to stimulate sus-
tainable development is increasing (Pike et al. 2007).
Adaptive co-management (Armitage et al. 2008), collabo-
rative resources management (Danielsen et al. 2009) and
the sustainable rural livelihoods approach (Chambers and
Conway 1992; Scoones 2009) are just some examples of
various bottom-up approaches that share a commitment to
the participation of stakeholders, alongside concepts of
social learning and sustainable development (Stringer et al.
2006; Ridder and Pahl-Wostl 2005). A second element that
these approaches have in common is their emphasis on the
importance of monitoring and evaluation (Guijt 2008; Reed
et al. 2006).
In this paper, we will focus on participatory monitoring
of sustainable development at the provincial level, which
we will define as the systematic collection and analysis of
information involving both scientists and regional stake-
holders on issues related to regional sustainable develop-
ment. The collected information consists of a set of
indicators, which measures the state of the regional socio-
economic and ecological system. However, when we talk
about monitoring regional sustainable development, we are
not so much interested in the assessment of how proposed
F. L. P. Hermans (&) � W. M. F. Haarmann �J. F. L. M. M. Dagevos
Telos, Brabant Centre for Sustainable Development, Tilburg
University, PO Box 90153, 5000 LE Tilburg, The Netherlands
e-mail: [email protected]
F. L. P. Hermans
Communication and Innovation Studies, Wageningen
University, Wageningen, The Netherlands
123
Reg Environ Change (2011) 11:805–815
DOI 10.1007/s10113-011-0216-y
policies are expected to influence the future state of the
region. Rather, our interest focuses on identifying the most
important characteristics that underlie the regional socio-
economic and ecological system, determining the weak-
nesses that need to be improved upon, and the strengths
that are deemed valuable and thus need to be conserved.
According to Cundill and Fabricius (2009), participatory
monitoring can be used for two main purposes. The first
purpose aims for a greater understanding of the regional
system. It focuses on the integration of different types of
variables and aims to create more awareness about possible
future trajectories. This type of participatory monitoring is
therefore closely related to the concept of participatory
integrated assessment (Kasemir et al. 2003; Van Asselt and
Rijkens-Klomp 2002). The second type focuses on the
promotion of social learning and stakeholder empower-
ment (Weaver and Rotmans 2006; Leys and Vanclay 2011;
Bohunovsky et al. 2010). In the latter case, participatory
monitoring is part of a wider process of shared strategic
agenda building and starts from the question: where are we
now and where would we like to go in the future?
Participatory monitoring can be used for one or both
purposes at the same time. However, regional stakeholders
can participate in different ways, and these different forms
of involvement also influence the set-up of the monitor.
The main question this paper addresses is: how can the
participation of stakeholders in monitoring processes be
evaluated and how do issues such as context, time and
different designs of the participation process influence the
outputs (the selection of sustainability indicators) and
outcomes (learning and stakeholder relations)?
The paper starts with a discussion of the concepts of
stakeholder participation and monitoring. Subsequently, we
will present a framework to systematically evaluate
stakeholder participation in monitoring. This framework
will be applied to four different cases of participatory
monitoring of regional sustainable development in the
Netherlands. The four cases will be compared, and we will
explain how different contexts, purposes and participatory
designs have led to different outputs and outcomes. The
paper ends with a discussion of the main findings and the
conclusions.
Stakeholder participation in monitoring sustainable
development
The need for stakeholder participation in monitoring stems
directly from the subject we wish to monitor: (regional)
sustainable development. Since sustainable development is
a contested concept, it is by nature normative, subjective
and ambiguous and its content cannot be determined by
scientists alone (Grosskurth and Rotmans 2005), there are
no universal rules that govern all possible trade-offs in all
possible circumstances. Monitoring sustainable develop-
ment is therefore a political undertaking in which the
meaning of the desired development itself has to be
adapted with the help of participatory integrated assess-
ments to specific regional circumstances (Hermans and
Knippenberg 2006).
Usually, a stakeholder is defined as a person, organisa-
tion or group, which is either affected by or may influence
a problem or its solution. Stakeholders may perform two
different roles in monitoring. First of all, since it is
impossible to reach the whole regional population (who all
have a stake in the sustainable development of the region),
stakeholders can be chosen to represent a certain interest or
segment of the population and thus help to identify the
political issues that need monitoring. The second role of
stakeholders is that of local or regional expert. This type of
stakeholder possesses unique insights into the functioning
of certain parts of the regional system due to their pro-
fession or experiences. It is important to note that we also
include scientists in this last category. They may be asked
to provide their specific expertise on the functioning of a
certain (sub)system.
The use of stakeholders in assessments is not undis-
puted, however. Some authors question how far stake-
holders can be trusted to correctly assess the complex
environment in which they are immersed, to reach con-
sensus, and how tendencies towards self interest can be
tackled (Hacking and Guthrie 2006; Coglianese 1999). A
general problem concerning stakeholder participation pro-
cesses is that these tend to quickly lead to a ‘unique’
solution to a complex problem that is difficult to scale-up
or apply in other contexts. By definition, given the sub-
jective and normative nature of sustainability issues, the
problem itself and its boundaries are unclear (Van de
Kerkhof and Wieczorek 2005). The generated outputs are
only applicable to that specific moment in time, to the
specific region and its characteristics and to the stakeholder
groups that were involved. Applied to participatory moni-
toring, these issues raise questions in how far the partici-
pation of stakeholders in monitoring leads to differences in
the results of participatory monitoring? To answer this
question, a systematic framework is needed to evaluate the
participation of stakeholders in monitoring in the first
place. In the next section, we will introduce such a
framework.
Evaluation of participatory monitoring processes
To evaluate stakeholder participation processes occurring
in the participatory monitoring of regional sustainable
development, we have adapted the framework proposed by
806 F. Hermans et al.
123
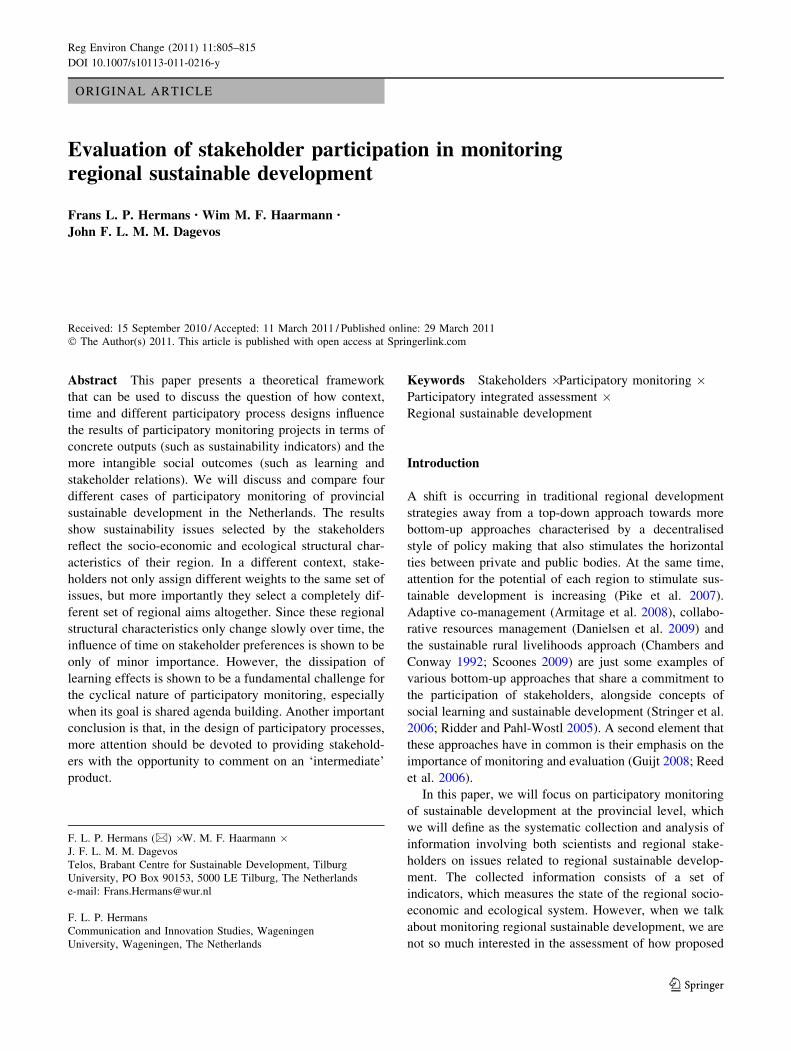
Burgess and Chilvers (2006). In this framework, stake-
holder participation processes are looked upon as having a
series of inputs, outputs and outcomes within a certain
context. These four basic elements are connected to each
other both directly and indirectly (see Fig. 1). We will
discuss the different elements and how they apply to a
participatory monitoring process below.
The context level
The participation process is embedded in the contextual
level and governance structure. This means that the par-
ticipatory process is influenced by the context in which it
takes place while it aims to bring about changes in this
context at the same time (Pahl-Wostl et al. 2007). The
context includes the biophysical and ecological circum-
stances and the slowly changing socio-economic charac-
teristics of the region: its economic structure, its population
and the cultural environment. As Pike et al. (2007) argue,
regions are socially constructed spatial scales, where the
political, social, cultural, ecological and economic pro-
cesses relevant for regional development work across each
other and between spatial scales. The existing social rela-
tions of the agents working within and across the regional
scale and their previous experiences with participatory
projects can be an important variable of the context (Innes
and Booher 2004). As context factors differ from region to
region, the same participatory process may yield different
results (Enserink et al. 2007).
Purpose and goal
The role and importance of stakeholder input vary
according to the purpose of the monitor and its end users
(Cundill and Fabricius 2009; Danielsen et al. 2009).
Participatory monitoring aimed at performance evaluation
of the regional system will focus on obtaining insights into
the relevant elements and their relationship to the regional
system. Participation will be aimed at getting the right
information into the process through consultation with the
relevant stakeholders, while afterwards the stakeholders
will be informed about the results of the monitor. However,
in a monitoring process that aims for the creation of a
shared vision in a process of social learning, the active
involvement of stakeholders from the start is indispensable.
Typically, people are brought together in workshops in
order to discuss and jointly decide on the long-term
requirements and development objectives.
Engagement process
Rowe and Frewer (2005) use the flow of communication as
a basis for classifying different forms of participation. The
flow of information might be one way: from sponsor to
stakeholder (informing), or the other way around from
stakeholder to sponsor (consultation), or two way (active
involvement). Key elements for successful interactive
workshops are the quality of the participatory process and
independence of the facilitators (Mayer 1997; Mostert et al.
2007). The specific monitoring objectives influence the
design of the stakeholder participation process but also the
kind of stakeholder that needs to be involved. Using
stakeholder analysis (Lindahl and Soderqvist 2004) or actor
analysis (Hermans and Thissen 2009), relevant persons and
organisations can be identified for each purpose.
During the engagement process, stakeholders’ opinions
are elicited and debated in a structured way. In this section,
we will introduce the framework we have developed to
structure stakeholder involvement and operationalise sus-
tainable regional development at the same time. This
framework is summarised in Fig. 2. We will limit our
discussion of this monitoring framework to its most
important elements and how the input of stakeholders can
be used to fill this framework. We refer interested readers
to the more extensive discussion of this framework by
Knippenberg et al. (2007).
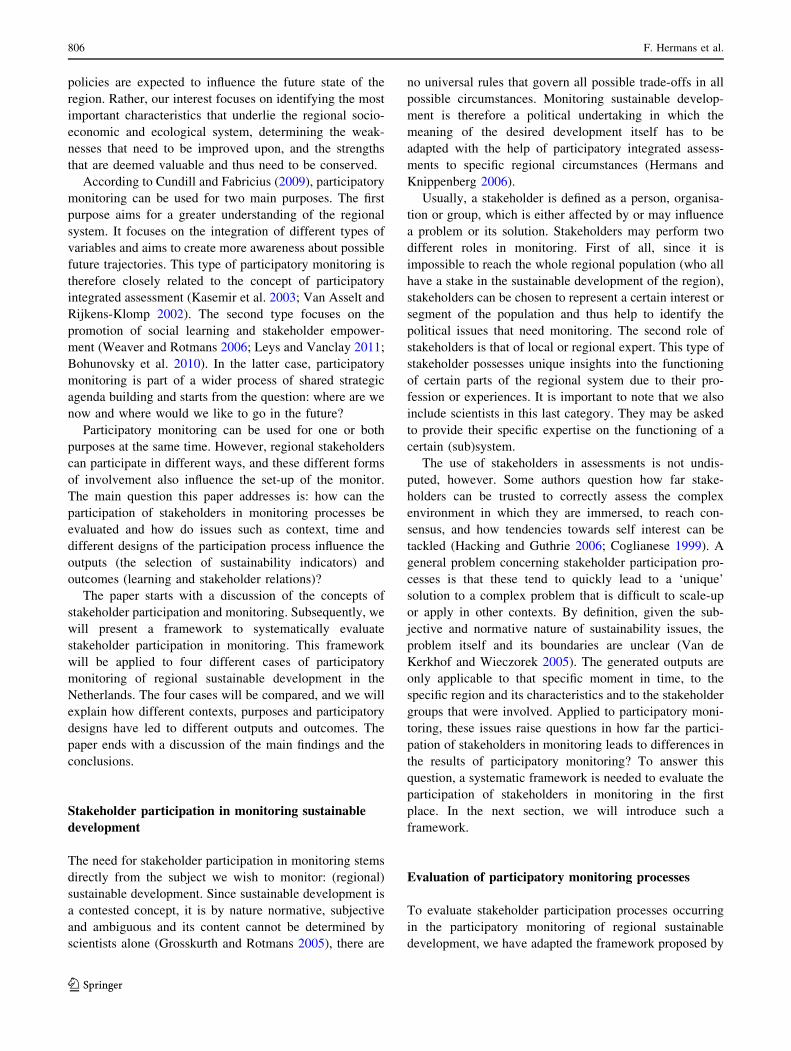
Figure 2 shows the different elements of the sustain-
ability monitor called the sustainability balance sheet
(or ‘Duurzaamheidbalans’ in Dutch). Its set-up was
••
Fig. 1 Contextual model of participatory monitoring processes
(adapted from Burgess and Chilvers 2006)
Relevant issues
stock
stock
Requirem
ents&
targets
stock
stock
indicator
indicator
indicator
indicator
economic, socio-cultural, or ecological capital
Fig. 2 Monitoring framework to derive regional indicators
Evaluation of stakeholder participation in monitoring regional sustainable development 807
123
inspired by the ScEnes model (Grosskurth and Rotmans
2005) and the indicator system developed by Bossel
(1996). We define sustainable regional development as a
balanced growth of the three capitals of sustainability:
ecological capital, economic capital and socio-cultural
capital (Serageldin 1996; Hodge 1997). In our view, sus-
tainable development can be conceived as a development
process aimed at fostering balanced growth in the resil-
ience and quality of nature (the ecological capital), in the
physical and spiritual wellbeing of people (the socio-cul-
tural capital) and healthy economic development (the
economic capital). By adopting this integrated approach,
we explicitly choose to take a broad perspective on sus-
tainable development. The concept, as we use it, has both a
strategic dimension (the longer term) and a normative
dimension (responsibilities devolving on various tiers of
government, geographical regions and future generations).
Each of the three capitals consists of a set of ‘stocks’.1
Using soft systems modelling (Checkland and Scholes
1990), these stocks are defined as subsystems that are
important for the state and development of each capital as a
whole. In order for the stocks to develop sustainably, they
need to develop in a certain direction, towards a (some-
times utopian) target. Defining the long-term requirements
and targets is the most important step in developing the
monitoring system. They form the heart of the monitoring
system. One or more indicators may be used to measure
each requirement. The development of the indicators over
time gives an insight into the direction of the development
and the degree to which the requirements are met.
Stakeholder input can be used at all levels of the
framework. First of all, stakeholder input can be used to
define the relevant stocks of the regional socio-economic
and ecological system that need to be optimised. Secondly,
stakeholders can also be used to formulate the requirements
and targets for each stock. By doing so the contours of a
desirable future, the common shared dreams are defined.
As this is a subjective and normative step, stakeholder
input is indispensable. Not all requirements can be satisfied
at short notice, and sometimes stakeholders are necessary
to weigh the different requirements, indicators and stocks
within the framework. Finally, stakeholders can be used to
choose the indicators directly, or their opinions can be used
as input at the indicator level. Examples of the latter are
indicators that measure stakeholder satisfaction with the
quality of the regional landscape or their perception of their
influence on regional politics.
Outputs and outcomes
The effectiveness of a participatory process can be evalu-
ated according to two criteria: outputs and outcomes. The
reports, (computer) models and indicators that are included
in the monitor form the outputs of the process. The process
products such as the improved relationship between par-
ticipants through social learning and the development of
trust between participants form the outcomes. These
intangible relational qualities are also referred to as social
capital (Coleman 1988; Putnam 2000). Outcomes and
outputs are not completely independent of each other. For
instance, the perception of the quality of outputs can affect
stakeholders’ acceptance of and satisfaction with the end
result.
Unfortunately, the outcomes of participatory projects
such as the changing relational bonds between stakeholders
are very difficult to measure. First of all, the outcomes of
participation processes may take several years to materi-
alise, long after the project itself has ended. More impor-
tantly, these participatory processes do not take place under
laboratory conditions, and therefore, it is very difficult to
disentangle the interdependent causal factors that may
contribute to changing stakeholder relationship and the
development of trust in a process of social learning.
Evaluations of the outcomes, therefore, often focus on what
has been learned by the different participants, frequently
using the concepts of organisational learning developed by
Argyris and Schon (1978). Depending on the objectives of
the monitoring exercise (performance monitoring or shared
agenda building), the expected learning will change
accordingly. Performance monitoring will most likely
result in first loop learning by stakeholders about the
regional system they are immersed in, while we would
expect that monitoring with a focus on shared agenda
building is more likely to result in a social learning process
among those stakeholders that will involve second loop
learning effects where people will develop mutual under-
standing and a shared language with which to speak.
Case descriptions
We selected four different cases in which stakeholders
were involved in constructing a sustainability monitor.
These cases involve five different provinces in the Neth-
erlands: Brabant, Zeeland, Limburg, Flevoland and
Utrecht. The structure of the framework discussed above
allows us to systematically describe these cases in terms of
their outputs and outcomes. We have subsequently ana-
lysed the outputs in each case by comparing the collection
of stocks, requirements and indicators that made up that
particular sustainability balance sheet. The outcomes were
1 The concepts in the framework have a distinct economic flavour:
‘capitals’, ‘stocks’ and ‘balance sheet’. However, it is important to
note that we do not express the indicators in a single economic value.
Each indicator is measured in the units that are best suited to that
particular indicator.
808 F. Hermans et al.
123
more difficult to assess, however. The description of the
outcomes in all cases is based on our personal observations.
Each of the three authors has been part of the technical
team conducting the assessments of at least three of the
four cases described, and therefore, we can compare these
cases to each other on their outcomes and the effects of the
learning processes taking place. In order to gain an indi-
cation as to the use of the monitor and its effects on
regional policy (at the context level), we have investigated
the follow-up projects carried out and examined references
to the original monitoring project in other provincial doc-
uments and policies.
The first case, Noord-Brabant 2001–2002, will be
described extensively, not only in terms of its participatory
process but also in terms of its outputs and outcomes. The
other cases are more or less variations on the original
process design, so for these we will highlight only the most
important differences in the process design. The different
outputs and outcomes of the cases will be discussed as part
of the cross-case comparison in ‘Cross-case analysis’
section.
Sustainability balance sheet for the Province
of Noord-Brabant (2001–2002)
Context and purpose
The idea for a provincial sustainability monitor in the
Province of Noord-Brabant was conceived during an
extensive strategic participatory project, initiated by the
regional authorities of the Province of Noord-Brabant and
aimed at defining what Brabant should look like in 2050.
The result of this participation process was a long-term
vision that was formalised with the signing of a declaration
by regional administrators, dignitaries and stakeholder
representatives called the ‘Brabant Manifesto 2050’. Sub-
sequently, an independent organisation was founded,
tasked with developing a provincial sustainability index
that could monitor the progress towards this sustainability
vision (Grijzen-Schreurs 2005).
Input
A multidisciplinary group of researchers started to work on
this assignment. After a year of intensive debates, the three
capital approach was chosen as the basis for the monitoring
system, and a first draft of stocks and requirements was
made. The researchers decided that stakeholder involve-
ment in the further development of the monitoring system
was a ‘conditio sine qua non’. Not only because of the
nature of the concept of sustainability, intrinsic normative
and subjective on the one hand and strategic on the other,
but also because the forgoing process of developing the
Brabant manifesto had shown the importance of getting the
public involved in formulating a common strategy. Stake-
holders were thus selected based on their knowledge of
Brabant and their representativeness for segments of
Brabant society. The group of stakeholders was completed
by professionals from knowledge institutes and think tanks.
Engagement process
Two workshops were organised in which this group of
approximately 40 stakeholders was asked to reflect criti-
cally on the framework and to determine whether all the
relevant issues relating to the sustainable development of
Brabant had been covered. During the workshop, stake-
holders were divided into three subgroups each covering
one of the capitals: ecological, economic and socio-cul-
tural. The criteria used for grouping the people into the
subgroups were their stake, expertise and background. In
order to prevent stakeholders only talking about issues they
were familiar with, a so-called carousel method was used.
The workshop was set up in four rounds. In the first round,
the stakeholders talked about their ‘own capital’, the issues
they were most familiar with. In the second and the third
round, the subgroups were rotated and now they had to talk
about the non-familiar issues in the other two capitals. In a
plenary session, the results of the carousel discussions were
presented and evaluated. The result of the first stakeholder
meeting was a confirmation of the general framework,
while some issues were added, rearranged or renamed.
In a second workshop, a start was made on the more
technical aspects of indicator selection, data gathering,
developing norms for the indicators and aggregation. The
same stakeholders were invited to this second meeting. In
this second workshop, stakeholders were also asked to
weight the different stocks, requirements and indicators
using a prioritising method. Stakeholders were also used to
define the norms for indicators. They were asked to assign
the ranges of indicator scores that represent a ‘good’ or a
‘bad’ situation. It was not possible to discuss all the indi-
cators, but a number of general ideas were investigated.
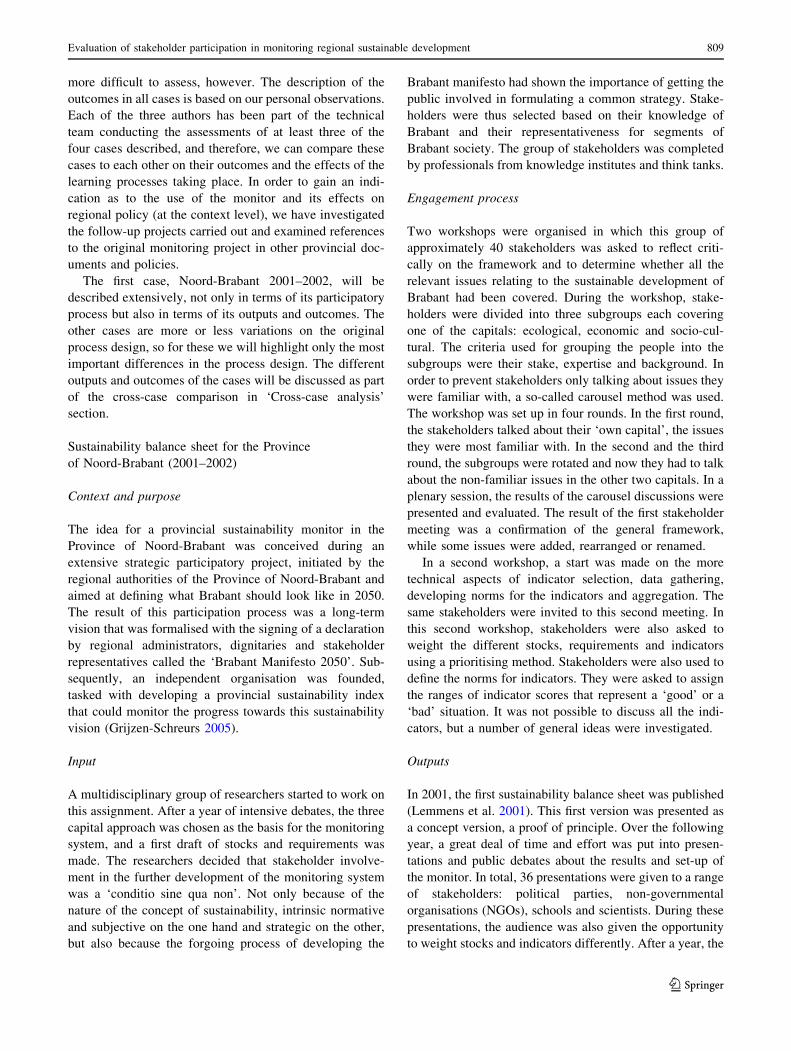
Outputs
In 2001, the first sustainability balance sheet was published
(Lemmens et al. 2001). This first version was presented as
a concept version, a proof of principle. Over the following
year, a great deal of time and effort was put into presen-
tations and public debates about the results and set-up of
the monitor. In total, 36 presentations were given to a range
of stakeholders: political parties, non-governmental
organisations (NGOs), schools and scientists. During these
presentations, the audience was also given the opportunity
to weight stocks and indicators differently. After a year, the
Evaluation of stakeholder participation in monitoring regional sustainable development 809
123
results of this consultation round were evaluated, the
framework adapted and a new round of data gathering
started. One of the interesting findings of this round of
consultation in which the audience was given the oppor-
tunity to weight the stocks, requirements and indicators
was that ultimately there were no differences in the end
results. In 2002, the new and improved monitor was pub-
lished (Lemmens and Haarmann 2002).
Outcomes
The first two sustainability balance sheets were generally
considered to be very successful examples of provincial
monitoring of sustainable development. This meant that
there was a strong commitment to participate among the
various stakeholder groups right from the start. The two
workshops that were used to engage the stakeholders and fill
in the indicator framework resulted in commitment and buy-
in, not only within the provincial administration (govern-
ment and civil servants) but also among participating
regional NGOs. The workshops and the intensive commu-
nication both prior to and following the publication of the
first draft of the sustainability balance sheet meant that the
monitor and its trademark ‘sustainability triangle’ (a visual
representation of the three capital approach) became a
by-word in discussions on sustainable development in the
Province of Noord-Brabant. One of the most important
outcomes of the process of developing the monitor was the
creation of a shared, common language, which provided
discussions on sustainable development with a neutral
starting point that the diverse interests could all agree on
(Dagevos and Te Poel 2004). In the years following the
publication of the sustainability balance sheet, several major
provincial policy plans referred directly to the monitoring
approach: the reconstruction plans for the intensive live-
stock sector (Provincie Noord-Brabant 2001), the regional
coalition agreement ‘bestuursakkoord’ (Provincie Noord-
Brabant 2003) and the regional spatial development plan
‘streekplan’ (Provincie Noord-Brabant 2002).
Provinces of Zeeland, Limburg and Flevoland (2004)
The aim of the project was to investigate the possibilities
offered by the SBS approach for comparing and bench-
marking Dutch provinces with regard to issues of sustain-
able regional development. In each province, a project
team was formed comprising civil servants and a group of
researchers.
The civil servants were responsible for selecting and
inviting regional stakeholders to the workshops. Stake-
holders were invited for their regional expertise and their
position within the regional networks. The design of the
engagement process was copied from the successful
workshops previously held in Brabant. Two separate
interactive workshops were organised in each of the three
provinces. The first workshop was for civil servants from
different provincial departments, covering more or less all
the issues that the sustainability balance sheet addresses. In
the second workshop, some 15–20 external provincial
stakeholders were invited to reflect on the framework, thus
developed and add further important issues. In the next
step, civil servants were responsible for gathering provin-
cial data together with the project researchers who were
also responsible for quality control and maintaining com-
parability of the frameworks between the provinces.
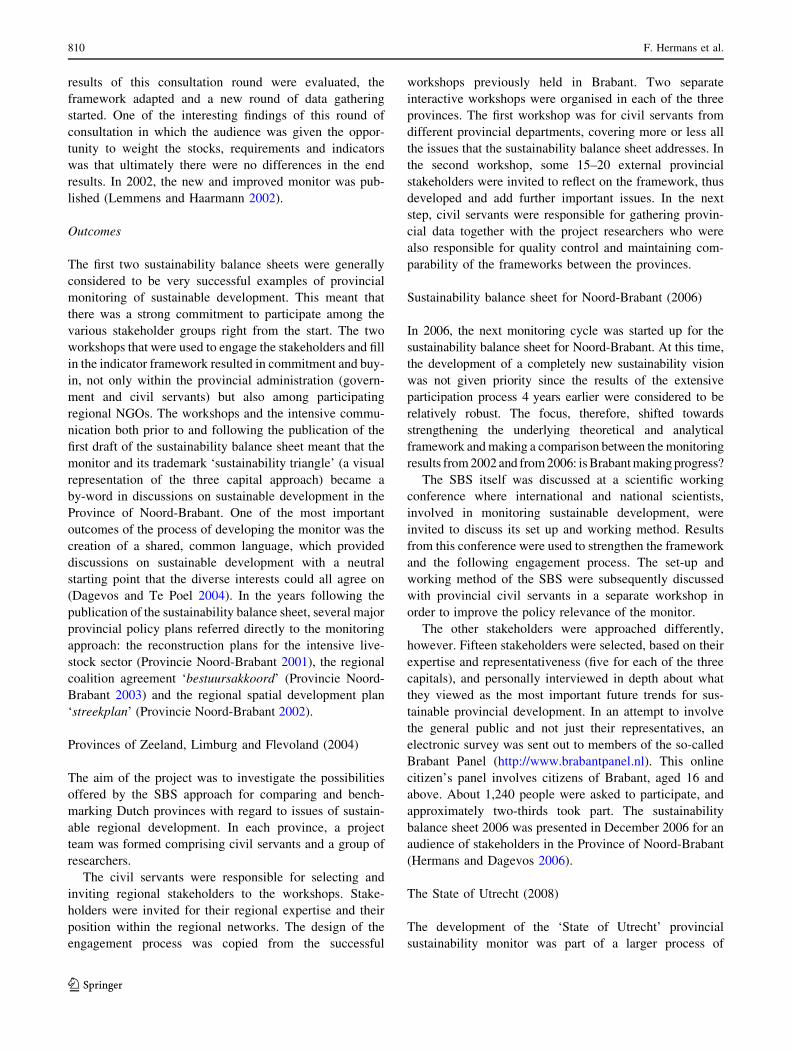
Sustainability balance sheet for Noord-Brabant (2006)
In 2006, the next monitoring cycle was started up for the
sustainability balance sheet for Noord-Brabant. At this time,
the development of a completely new sustainability vision
was not given priority since the results of the extensive
participation process 4 years earlier were considered to be
relatively robust. The focus, therefore, shifted towards
strengthening the underlying theoretical and analytical
framework and making a comparison between the monitoring
results from 2002 and from 2006: is Brabant making progress?
The SBS itself was discussed at a scientific working
conference where international and national scientists,
involved in monitoring sustainable development, were
invited to discuss its set up and working method. Results
from this conference were used to strengthen the framework
and the following engagement process. The set-up and
working method of the SBS were subsequently discussed
with provincial civil servants in a separate workshop in
order to improve the policy relevance of the monitor.
The other stakeholders were approached differently,
however. Fifteen stakeholders were selected, based on their
expertise and representativeness (five for each of the three
capitals), and personally interviewed in depth about what
they viewed as the most important future trends for sus-
tainable provincial development. In an attempt to involve
the general public and not just their representatives, an
electronic survey was sent out to members of the so-called
Brabant Panel (http://www.brabantpanel.nl). This online
citizen’s panel involves citizens of Brabant, aged 16 and
above. About 1,240 people were asked to participate, and
approximately two-thirds took part. The sustainability
balance sheet 2006 was presented in December 2006 for an
audience of stakeholders in the Province of Noord-Brabant
(Hermans and Dagevos 2006).
The State of Utrecht (2008)
The development of the ‘State of Utrecht’ provincial
sustainability monitor was part of a larger process of
810 F. Hermans et al.
123
long-term vision development that the province of Utrecht
started in 2008. The engagement process in this case
included an initial stakeholder workshop, consultancy of
the population of the Province of Utrecht through an
online survey and a series of debates and presentations on
the initial results. The participatory monitoring process
was mainly organised by the Province of Utrecht itself. At
the end of October 2008, a two-day conference was
organised under the name ‘On the way towards 2040
together’ during which the first results of the sustain-
ability monitor were presented as a so-called pre-pilot.
The sustainability monitor was presented as a possible
guiding framework for discussions on sustainable regional
development and as an indication of the present ‘state of
the province’ with regard to socio-cultural, ecological and
economic issues. The discussion surrounding the publi-
cation of the pre-pilot was instrumental in achieving
acceptance of the final result. Both quality and public
acceptance were enhanced in this process. Based on these
discussions, the monitor was adapted slightly and filled
with new data. Six months after the conference, the final
version of the ‘State of Utrecht’ was published (Lukkenaer
et al. 2009).
Cross-case analysis
The four cases are summarised in Table 1. They differ in
their geographical context, monitoring purpose and the
period during which the participatory monitoring process
was conducted. In this section, the outputs and the out-
comes will be discussed in more detail in a cross-case
comparison of the cases. We have analysed the indicator
frameworks for the provinces of Brabant, Zeeland, Flevo-
land and Limburg to investigate the extent to which the
differences in geographical context affect the outputs of the
monitor. The effect of time will be analysed by making a
comparison between the outputs generated by the monitor
for Brabant 2002 with that for 2006. Finally, we will
discuss how the communication strategy surrounding the
introduction of the monitor influences both the outputs and
the outcomes.
The effect of geographical context on outputs
and outcomes
The question how different geographical contexts influence
the outputs of different participatory processes is difficult
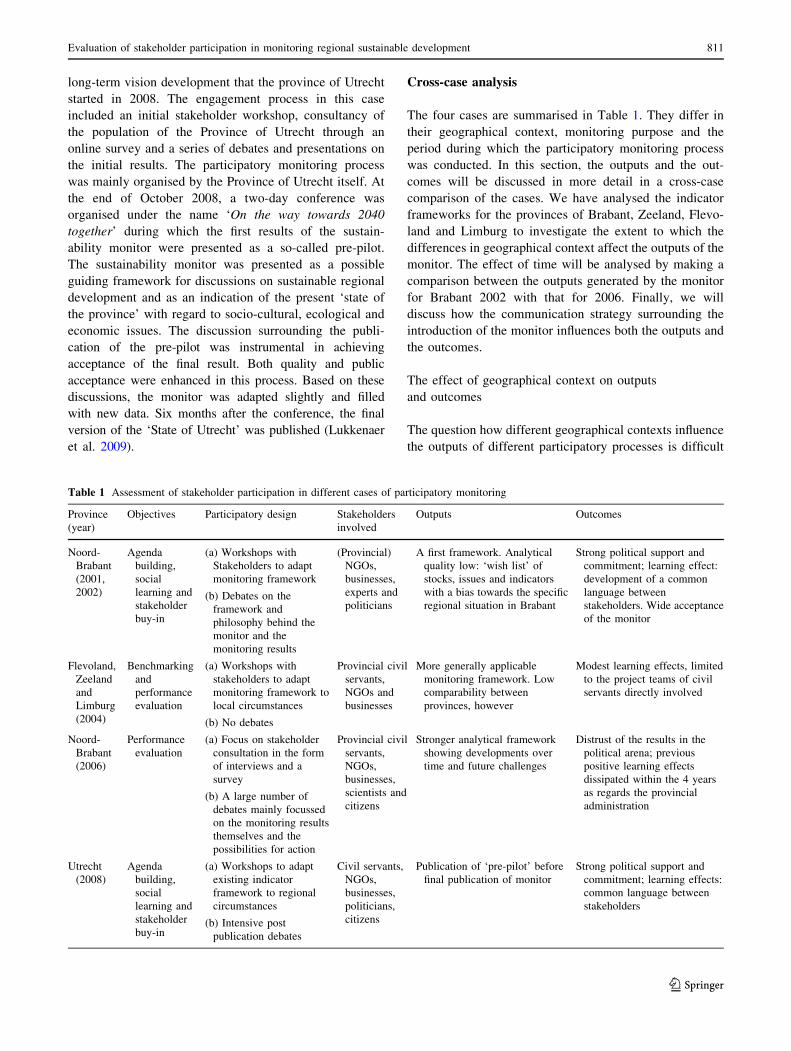
Table 1 Assessment of stakeholder participation in different cases of participatory monitoring
Province
(year)
Objectives Participatory design Stakeholders
involved
Outputs Outcomes
Noord-
Brabant
(2001,
2002)
Agenda
building,
social
learning and
stakeholder
buy-in
(a) Workshops with
Stakeholders to adapt
monitoring framework
(Provincial)
NGOs,
businesses,
experts and
politicians
A first framework. Analytical
quality low: ‘wish list’ of
stocks, issues and indicators
with a bias towards the specific
regional situation in Brabant
Strong political support and
commitment; learning effect:
development of a common
language between
stakeholders. Wide acceptance
of the monitor
(b) Debates on the
framework and
philosophy behind the
monitor and the
monitoring results
Flevoland,
Zeeland
and
Limburg
(2004)
Benchmarking
and
performance
evaluation
(a) Workshops with
stakeholders to adapt
monitoring framework to
local circumstances
Provincial civil
servants,
NGOs and
businesses
More generally applicable
monitoring framework. Low
comparability between
provinces, however
Modest learning effects, limited
to the project teams of civil
servants directly involved
(b) No debates
Noord-
Brabant
(2006)
Performance
evaluation
(a) Focus on stakeholder
consultation in the form
of interviews and a
survey
Provincial civil
servants,
NGOs,
businesses,
scientists and
citizens
Stronger analytical framework
showing developments over
time and future challenges
Distrust of the results in the
political arena; previous
positive learning effects
dissipated within the 4 years
as regards the provincial
administration(b) A large number of
debates mainly focussed
on the monitoring results
themselves and the
possibilities for action
Utrecht
(2008)
Agenda
building,
social
learning and
stakeholder
buy-in
(a) Workshops to adapt
existing indicator
framework to regional
circumstances
Civil servants,
NGOs,
businesses,
politicians,
citizens
Publication of ‘pre-pilot’ before
final publication of monitor
Strong political support and
commitment; learning effects:common language between
stakeholders
(b) Intensive post
publication debates
Evaluation of stakeholder participation in monitoring regional sustainable development 811
123
to answer. However, since the design of the engagement
processes was essentially the same for the cases of
Limburg, Flevoland and Zeeland and Brabant 2001, the
assumption can be made that differences in indicator sets
are the result of the differences in the regional contexts and
not in differences in the participation method, or selection
of stakeholders.
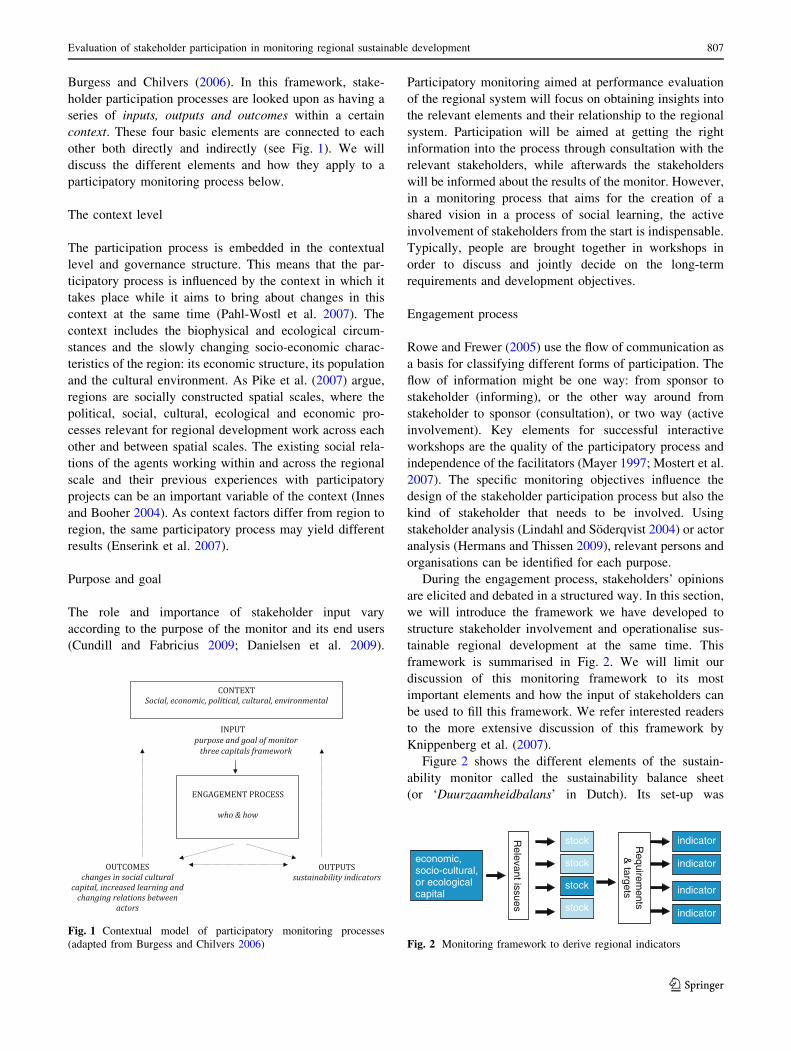
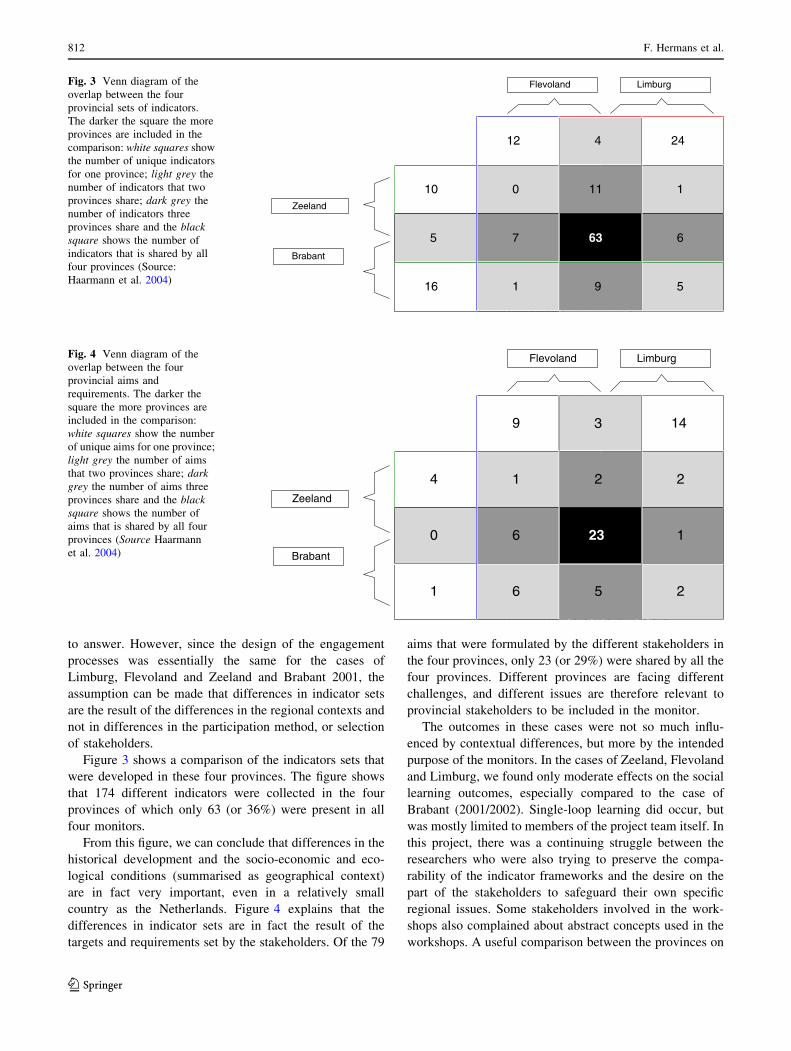
Figure 3 shows a comparison of the indicators sets that
were developed in these four provinces. The figure shows
that 174 different indicators were collected in the four
provinces of which only 63 (or 36%) were present in all
four monitors.
From this figure, we can conclude that differences in the
historical development and the socio-economic and eco-
logical conditions (summarised as geographical context)
are in fact very important, even in a relatively small
country as the Netherlands. Figure 4 explains that the
differences in indicator sets are in fact the result of the
targets and requirements set by the stakeholders. Of the 79
aims that were formulated by the different stakeholders in
the four provinces, only 23 (or 29%) were shared by all the
four provinces. Different provinces are facing different
challenges, and different issues are therefore relevant to
provincial stakeholders to be included in the monitor.
The outcomes in these cases were not so much influ-
enced by contextual differences, but more by the intended
purpose of the monitors. In the cases of Zeeland, Flevoland
and Limburg, we found only moderate effects on the social
learning outcomes, especially compared to the case of
Brabant (2001/2002). Single-loop learning did occur, but
was mostly limited to members of the project team itself. In
this project, there was a continuing struggle between the
researchers who were also trying to preserve the compa-
rability of the indicator frameworks and the desire on the
part of the stakeholders to safeguard their own specific
regional issues. Some stakeholders involved in the work-
shops also complained about abstract concepts used in the
workshops. A useful comparison between the provinces on
12 4 24
111010
5
16
7
1
63
9
6
5
Zeeland
Brabant
Flevoland LimburgFig. 3 Venn diagram of the
overlap between the four
provincial sets of indicators.
The darker the square the more
provinces are included in the
comparison: white squares show
the number of unique indicators
for one province; light grey the
number of indicators that two
provinces share; dark grey the
number of indicators three
provinces share and the blacksquare shows the number of
indicators that is shared by all
four provinces (Source:
Haarmann et al. 2004)
9 3 14
2214
0
1
6
6
23
5
1
2
Zeeland
Brabant
Flevoland LimburgFig. 4 Venn diagram of the
overlap between the four
provincial aims and
requirements. The darker the
square the more provinces are
included in the comparison:
white squares show the number
of unique aims for one province;
light grey the number of aims
that two provinces share; darkgrey the number of aims three
provinces share and the blacksquare shows the number of
aims that is shared by all four
provinces (Source Haarmann
et al. 2004)
812 F. Hermans et al.
123
an overarching sustainability index, the main purpose of
the project, turned out to be impossible as the comparisons
discussed earlier in Figs. 3 and 4 showed.
The effect of time on outputs and outcomes
The question is whether time will affect the output of the
monitor in the same way. As time goes on, some issues
relating to the sustainable development of a region are
resolved and disappear while others gain importance on the
political agenda so that some influence on the output might
be expected. A comparison between the sustainability
balance sheets for Brabant in 2002 and in 2006 showed that
although stakeholder preferences did change over 4 years,
they did not change very significantly. The change in
stakeholder preferences was reflected in certain issues
being allocated a more prominent place in the framework
and subsequently being allotted a higher weight. However,
the rest of the regional structure remained largely the same;
there was little change in their choices of other relevant
issues.
We explain this result as the effect time has on the given
socio-economic and ecological structure of a region. Par-
ticularly when the time period between two monitoring
moments is short, the influence of time can be expected to
remain small. Regional structures change slowly except
when major socio-economic and ecological crises take
place. For instance in the period reviewed, as a result of a
number of high profile accidents in the Netherlands toge-
ther with the attention devoted to the threat of terrorism,
attention for issues of public safety increased. These issues
were thus deemed to be more important than 4 years earlier
and were given a higher weight. Major external events
were reflected in the way stakeholders weight different
issues, but it did not change their preferences as to the
choice of sustainability issues to be included.
The effect time has on the outcomes is far more
important as the results of the Brabant 2006 monitor
showed. The enthusiasm and learning effects that were
achieved during the first extensive participatory processes
in 2001 and 2002 had dissipated far more quickly than
anticipated. Many people were now switching jobs, which
meant the positive outcomes of the first monitoring cycle
partly disappeared with them. This was most visible within
the provincial organisation in general and among the pro-
vincial governors in particular. This problem was aggra-
vated by the departure within the provincial government of
two of the main advocates of the monitor and its underlying
philosophy. After all the work that had been carried out on
the methodology of the SBS, there was now a certain irony
in discovering that, particularly at the political level, the
monitor was being perceived as an unwanted legacy and a
distrust of its results was being publicly shown.
The dissipating effects of social learning over the years
prove to be a fundamental challenge for the cyclical nature
of adaptive monitoring and the involvement of stakehold-
ers, especially when its main goal is shared agenda build-
ing. As time goes on, participants leave the network, and
this leads to a fragmented group of ‘old’ and ‘new’
stakeholders in the network for the next cycle of the
monitoring process. It is difficult to do justice to the needs
of the new stakeholders while at the same time trying not to
completely ignore the existing visions already agreed on by
the older participating stakeholders.
It is interesting in this context to review the experiences
in Utrecht. Utrecht has organised a continuing stakeholder
dialogue, by organising an annual conference on an aspect
of sustainable development. This way not the whole vision
is discussed again, but only an aspect of the existing vision
that engages old and new stakeholders alike. It is too early
to tell whether this will be a successful strategy and whe-
ther this approach can survive a change at the political
level. However, we think this might prove to be an inter-
esting option that could at least alleviate the problem.
The effect of communication on outcomes and outputs
Table 1 shows that the cases with the best outcomes
(Brabant 2001/2002 and Utrecht 2008) formed part of a
larger process of strategic agenda building. These cases
were considered to be a success not only by the regional
politicians but also by other stakeholder involved in the
process. In a process of regional agenda building, the rel-
evant issues were discussed as well as the desired path of
development, which issues should be monitored, how to
weight them and what norms to use. These processes led to
consensus over the way the shared vision could and should
be measured. Later discussions on policy measures thus
had a starting point that all participants had agreed on
earlier.
The discussion above might lead one to conclude that
participatory monitoring of sustainable development
should always be made part of a larger process of agenda
building. However, these two cases shared another simi-
larity and that was the number of debates organised to
communicate the monitoring results. In both cases, exten-
sive rounds of debates were organised around the publi-
cation of a ‘draft’ version (Brabant 2001) or a ‘pre-pilot’
(in Utrecht). This communication strategy proved to be
very effective in improving the quality of the final product.
Small mistakes were easily identified and sometimes better
data were made available. At the same time, stakeholder
commitment and identification with the final end product
were enhanced. Regional sustainable development can
easily turn into confusing debates about relatively abstract
principles. When some provisional results can be shown, it
Evaluation of stakeholder participation in monitoring regional sustainable development 813
123
becomes easier to involve stakeholders, and discussions
can be structured with the help of the provisional results.
Discussion and conclusions
In this paper, we have looked at the effects different forms
of stakeholder participation have on the monitor itself, its
outputs (indicator sets) and the more intangible outcomes.
We have found that significant improvements in both
outputs and outcomes can be generated by debating an
intermediate version of the monitor; this increases quality
and at the same time enhances stakeholder commitment
and acceptance of the end product.
We have found that contextual factors have a greater
influence on the outputs of the sustainability monitor than
time. The results show that when sustainability issues are
selected by the stakeholders these then reflect the socio-
economic and ecological structural characteristics of their
region. In a different context, stakeholders not only assign
different weights to the same set of issues, but more
importantly they select a completely different set of
regional aims altogether. In the same way as the structural
characteristics of a region only change slowly, stakeholder
preferences also change slowly. An important exception is
the influence of external disturbances. A crisis does not
necessarily lead to a completely new selection of sustain-
ability issues by stakeholders, but it does at least influence
how they weight those issues.
Time does have a negative effect on the outcomes,
however. The dissipating effects of social learning over the
years prove to be a fundamental challenge for the cyclical
nature of adaptive monitoring and the involvement of
stakeholders, especially when its goal is shared agenda
building. A continuing stakeholder dialogue on aspects of
the existing vision that engages old and new stakeholders
alike might be an interesting option to alleviate this
problem.
Finally, our own role in the monitoring process has
changed. Over the years, our independent status as
researchers slowly dissolved and in all the cases we did
outside Brabant, the provincial principals often had the
final say in the organisation of the process and sometimes
even in the publication of the end product. Even though our
independent status was lost, in return we gained more
political commitment to the monitoring process as politi-
cians did not run the risk of being embarrassed by the
reported results. This political commitment also increases
the commitment of other provincial actors and civil
servants to the process and since the openness of the pro-
cess of constructing a monitor with stakeholders made it
difficult for the political principals to interfere too signifi-
cantly with the final end product, we found that the overall
effect to be more positive than expected. In our opinion, a
bottom-up approach therefore cannot succeed without
proper support from the highest political level.
Acknowledgments The development and application of the
sustainability balance sheet involved many different people, and we
would like to thank our colleagues at Telos, past and present, who
contributed to its development. Furthermore, we would like to thank
Kasper Kok and the two reviewers for their valuable comments that
helped us to improve this paper.
Open Access This article is distributed under the terms of the
Creative Commons Attribution Noncommercial License which
permits any noncommercial use, distribution, and reproduction in any
medium, provided the original author(s) and source are credited.
References
Argyris C, Schon DA (1978) Organisational learning: a theory of
action perspective. Addison-Wesley, Reading
Armitage D, Marschke M, Plummer R (2008) Adaptive co-manage-
ment and the paradox of learning. Global Environ Change
18(1):86–98
Bohunovsky L, Jager J, Omann I (2010) Participatory scenario
development for integrated sustainability assessment. Reg Envi-
ron Change pp 1–14
Bossel H (1996) Deriving indicators of sustainable development.
Environ Model Assess 1:193–218
Burgess J, Chilvers J (2006) Upping the ante: a conceptual framework
for designing and evaluating participatory technology assess-
ments. Sci Public Policy 33(10):713–728
Chambers R, Conway G (1992) Sustainable rural livelyhoods:
practical concepts for the 21st century. IDS discussion paper
296, Institute of Development Studies, Brighton
Checkland P, Scholes J (1990) Soft systems methodology in action.
Wiley, Chichester
Coglianese C (1999) Limits to consensus. Environment 41:28–33
Coleman JS (1988) Social capital in the creation of human capital.
Am J Sociol 94(Suppl: Organizations and Institutions: Socio-
logical and Economic Approaches to the Analysis of Social
Structure):S95–S120
Cundill G, Fabricius C (2009) Monitoring in adaptive co-manage-
ment: toward a learning based approach. J Environ Manage
90:3205–3211
Dagevos J, Te Poel Y (2004) Balans, kwaliteit en competentie-
ontwikkeling. Oratie bij het lectoraat duurzame stad en streekont-
wikkeling. Kenniscentrum Duurzame Stad & Streekontwikkeling,
Eindhoven
Danielsen F, Burgess ND, Balmford A, Donald PF, Funder M, Jones
JPG, Alviola P, Balete DS, Blomley T, Brashares J, Child B,
Enghoff M, Fjeldsa J, Holt S, Hubertz H, Jensen AE, Jensen PM,
Massao J, Mendoza MM, Ngaga Y, Poulsen MK, Rueda R, Sam
M, Skielboe T, Stuart-Hill G, Topp-Jorgensen E, Yonten D
(2009) Local participation in natural resource monitoring: a
characterization of approaches. Conserv Biol 23(1):31–42
Enserink B, Patel M, Kranz N, Maestu J (2007) Cultural factors as co-
determinants of participation in river basin management. Ecol
Soc 12(2)
Grijzen-Schreurs CAMJ (2005) Bestuurskunst als ‘blik’opener?
Procesgang rond het manifest Brabant 2050; een onderzoek
naar de interactie tussen overheid en samenleving in Brabant.
Tilburg University, Tilburg
814 F. Hermans et al.
123
Grosskurth J, Rotmans J (2005) The scene model: getting a grip on
sustainable development in policy making. Environ Dev Sustain
7:135–151
Guijt I (2008) Seeking surprise: rethinking monitoring for collective
learning in the rural resource management. Wageningen Uni-
versity, Wageningen
Haarmann W, Hermans F, Overeem I (2004) Monitoring van
provinciale duurzame ontwikkeling, de duurzaamheidbalans
getoetst in vier provincies. Telos, Tilburg
Hacking T, Guthrie P (2006) Sustainable development objectives in
impact assessment: why are they needed and where do they
come from? J Environ Assess Policy Manage 8(3):341–371
Hermans F, Dagevos J (2006) De duurzaamheidbalans van Brabant
2006. Telos, Tilburg
Hermans F, Knippenberg L (2006) A principle-based approach for the
evaluation of sustainable development. J Environ Assess Policy
Manage 8(3):299–320
Hermans LM, Thissen WAH (2009) Actor analysis methods and their
use for public policy analysts. Eur J Oper Res 196(2):808–818
Hodge T (1997) Toward a conceptual framework for assessing
progress toward sustainability. Soc Indic Rev 40:5–98
Innes JE, Booher DE (2004) Reframing public participation strategies
for the 21st century. Plan Theor Pract 5(4):419–436
Kasemir B, Jager J, Jaeger CC, Gardner MT (2003) Public
participation in sustainability science. Cambridge University
Press, Cambridge
Knippenberg L, Haarmann W, Hermans FLP, Beckers TAM,
Dagevos J, Overeem I (2007) Developing tools for the assess-
ment of sustainable development in the province of Brabant, the
Netherlands. In: Hak T, Moldan B, Lyon Dahl A (eds)
Sustainability indicators: a scientific assessment, Scope, vol 67.
Island Press, Washington, DC
Lemmens L, Haarmann W (2002) De duurzaamheidbalans van
Brabant 2002. Telos, Tilburg
Lemmens L, Ten Caten H, Tabibian N (2001) De duurzaamheidba-
lans van Noord-Brabant 2001. Telos, Tilburg
Leys A, Vanclay J (2011) Stakeholder engagement in social learning
to resolve controversies over land-use change to plantation
forestry. Reg Environ Change 11(1):175–190
Lindahl T, Soderqvist T (2004) Building a catchment-based environ-
mental programme: a stakeholder analysis of wetland creation in
Scania, Sweden. Reg Environ Change 4:132–144
Lukkenaer D, Dagevos J, Smeets R (2009) Staat van Utrecht:
Duurzaamheidmeting 2008. Provincie Utrecht, Utrecht
Mayer IS (1997) Debating technologies: a methodological contribu-
tion to the design and evaluation of participatory policy analysis.
Tilburg University Press, Tilburg
Mostert E, Pahl-Wostl C, Rees Y, Searle B, Tabara D, Tippett J
(2007) Social learning in European river-basin management:
barriers and fostering mechanisms from 10 river basins. Ecol Soc
12(1):19
Pahl-Wostl C, Craps M, Dewulf A, Mostert E, Tabara D, Taillieu T
(2007) Social learning and water resources management. Ecol
Soc 12(2)
Pike A, Rodrıguez-Pose A, Tomaney J (2007) What kind of local and
regional development and for whom? Reg Stud 41(9):1253–1269
Provincie Noord-Brabant (2001) Koepelplan revitalisering landelijk
gebied. Reconstructie aan zet. Provincie Noord-Brabant, ‘s-
Hertogenbosch
Provincie Noord-Brabant (2002) Brabant in balans, streekplan Noord-
Brabant. Provincie Noord-Brabant, ‘s-Hertogenbosch
Provincie Noord-Brabant (2003) Bestuursakkoord 2003–2007;
samenwerken aan uitvoering. Provincie Noord-Brabant, ‘s-
Hertogenbosch
Putnam RD (2000) Bowling alone: the collapse and revival of
American community. Simon & Schuster, New York
Reed M, Fraser ED, Dougill AJ (2006) An adaptive learning process
for developing and applying sustainability indicators with local
communities. Ecol Econ 59:406–418
Ridder D, Pahl-Wostl C (2005) Participatory integrated assessment in
local level planning. Reg Environ Change 5(4):188–196
Rowe G, Frewer LJ (2005) A typology of public engagement
mechanisms. Sci Technol Hum Values 30(2):251–290
Scoones I (2009) Livelihoods perspectives and rural development.
J Peasant Stud 36(1):171–196
Serageldin I (1996) Sustainability and the wealth of nations, first steps
in an ongoing journey. Environmentally sustainable develop-
ment studies and monographs, vol 5. The World Bank,
Washington DC
Stringer LC, Dougill AJ, Fraser E, Hubreck K, Prell C, Reed MS
(2006) Unpacking ‘‘Participation’’ in the adaptive management
of social-ecological systems: a critical review. Ecol Soc 11(2)
Van Asselt MBA, Rijkens-Klomp N (2002) A look in the mirror:
reflection on participation in integrated assessment from a
methodological perspective. Global Environ Change 12:167–184
Van de Kerkhof M, Wieczorek A (2005) Learning and stakeholder
participation in transition processes towards sustainability:
methodological considerations. Technol Forecast Soc Change
72:733–747
Weaver PM, Rotmans J (2006) Integrated sustainability assessment:
what is it, why do it and how? Int J Innov Sustain Dev 4:284–303
Evaluation of stakeholder participation in monitoring regional sustainable development 815
123


![Stakeholder Mapping.ppt [Kompatibilitätsmodus] - EURAMET](https://img.dokumen.tips/doc/110x75/631f44fb85e2495e15104cb0/stakeholder-mappingppt-kompatibilitaetsmodus-euramet.jpg)


