Embed Size (px)
Citation preview
Developed by ZaVita d.o.o.
for the City of Ljubljana
Ljubljana
30.04.2019
URBforDAN Key Stakeholder Profiles Overall stakeholder analysis on the level of the
URBforDAN partnership
Programme co-funded by the European Union (ERDF, IPA, ENI) page 2
2 URBforDAN Key Stakeholder Profiles
Table of content Table of content ................................................................................................................................................ 2
1. Introduction ............................................................................................................................................... 3
1.1. About the URBforDAN Project ........................................................................................................... 3
1.2. About URBforDAN Key Stakeholder Profiles ..................................................................................... 3
2. Brief description of the data collection and analysis process ................................................................... 4
3. Overview of identified types of stakeholders ........................................................................................... 5
4. Key Stakeholder group profile – HIKERS .................................................................................................... 6
5. Key Stakeholder group profile – CYCLISTS ................................................................................................. 8
6. Key Stakeholder group profile – DOWNHILL CYCLISTS ............................................................................ 10
7. Key Stakeholder group profile – JOGGERS .............................................................................................. 12
8. Key Stakeholder group profile – PET WALKERS ....................................................................................... 14
9. Key Stakeholder group profile – FAMILIES WITH CHILDREN ................................................................... 16
10. Key Stakeholder group profile – TEACHERS WITH PUPILS .................................................................. 18
11. Conclusions .......................................................................................................................................... 20
12. Lessons learned about the process ..................................................................................................... 22
Programme co-funded by the European Union (ERDF, IPA, ENI) page 3
3 URBforDAN Key Stakeholder Profiles
1. Introduction
1.1. About the URBforDAN Project
Management and Utilization of Urban Forests as Natural Heritage in Danube Cities (with acronym
URBforDAN) is an EU co-financed project, which was designed to deliver a change in urban forest
management and utilization of ecosystem services. URBforDAN project is being implemented in 7 Danube
Cities – Ljubljana (SLO), Vienna (AT), Budapest (HUN), Zagreb (CRO), Cluj-Napoca (ROM), Belgrade (SRB) and
Ivano-Frankivsk (UA). Its’ implementation is closely observed by 3 associated partner cities – Prague (CZE),
Sarajevo (BIH) and Podgorica (MNE), as well as by Food and Agriculture Organization of the United Nations.
Urban and Peri-urban Forests (UPF) in Danube Cities play an extremely important role as “green city lungs” -
preserving the rich biodiversity of Europe and its vivid landscape. They also deliver many
economically/socially important ecosystem services – UPFs are key areas for experiencing natural/cultural
heritage within cities, important tourist attractions, areas for recreation and high quality of living.
All URBforDAN Cities face similar challenges – all manage substantial NH areas (mostly UPF) within their city
limits. Due to their characteristics, they attract many users (citizens, tourists…), but also have many
stakeholders (managers, owners, interest groups…) trying to manage those activities. Today, this is usually
done without proper coordination of all stated key actors. UPF also lack appropriate infrastructure and
equipment to cope with the ever-increasing number of users. Thus, UPF are under increasing pressure from
a diverse set of activities, arising conflicts and unsustainable use of resources – all leading to the poor state
of NH. Management of UPF in some cities is further challenged by the extreme fragmentation of the
ownership (which is often mostly private).
This is why URBforDAN takes on the challenge of mobilization of key actors in URBforDAN Cities to ensure
their active participation in integrated planning/management. Protection regimes, mapping/valuation of
ecosystem services and development ideas will be combined through a participatory process to deliver
Integrated multi-use Management Plans for UPF on a strategic and operational level. UPF Danube Network
will be established to strengthen the cooperation between key actors, ensure timely knowledge/best-
practice sharing, dissemination/transferability of project outputs and enable further capitalization. UPF
managers, owners, and users will be equipped with management tools supporting multi-purpose use of UPF
and exploiting new opportunities for sustainable development. Participatory Planning & UPF Management
Guidelines will be developed, based on lessons learned and best practices used.
1.2. About URBforDAN Key Stakeholder Profiles
The overall aim of Key Stakeholder Profiles developed by each project partner of the URBforDAN project was
to ensure “in-depth understanding” of their key stakeholder groups on the city level, as well as to channel all
relevant information gathered by questionnaires for urban forest users and owners into the planning process
of Integrated Multi-use Management Plans.
It was designed and developed by a team of external experts from the company ZaVita d.o.o., tasked to
provide expert support to the City of Ljubljana (Lead Partner) and the URBforDAN Partnership.
It is the aim of this report to gather all relevant information on the level of URBforDAN partnership – thus
providing a bigger picture, applicable to the level of whole Danube Programme area, as well as allowing
URBforDAN partnership opportunity to draw key conclusions, record the partnership learning process and
formulate lessons learned.
Programme co-funded by the European Union (ERDF, IPA, ENI) page 4
4 URBforDAN Key Stakeholder Profiles
2. Brief description of the data collection and analysis process Key Stakeholder Profiles were developed on the basis of data gathered through questionnaires for users and
owners of urban forests, first workshops with users and owners of urban forests, as well as additional
individual meetings carried out by URBforDAN project partners. All such data was analyzed, interpreted and
compiled in city-level reports.
Key Stakeholder Profiles were jointly developed by all project partners coming from the same City. The main
reason lies in the necessity to construct and agree upon a joint and unanimous understanding of all project
partners from the same city about who key stakeholders are and how partners from the same city understand
their needs and expectations.
To further guide this process, a uniform template questionnaire was developed. However, project partners
were encouraged to translate questionnaires into their national languages in order to remove language
barriers and add additional topics, if they found them necessary to create the “in-depth understanding” of
their key stakeholders. This is important as profiles represent a tool for designing further steps of the
participatory process and used as input information for the Integrated Multi-use Management Plans.
URBforDAN project partners used different survey techniques to disseminate the questionnaires amongst
stakeholders and collect data – for example, an on-line survey, conducting the survey during workshops, on-
site surveys, etc. Some of them even combined techniques, prolonged their execution or even repeated the
survey – all with one aim to get the best possible results and an appropriate number of stakeholders. Surveys
were carried out from October 2018 – January 2019
Forest managers and forest owners were already at the stage of the design of the URBforDAN project idea
recognized as key stakeholders. As they are in vast majority known institutions (with exception of private
forest owners which are presented only in Ljubljana and to a smaller extent in Belgrade and Zagreb) with
already determined legal responsibilities, authority and clearly defined goals and assignments. This is why
URBforDAN understood from the start of the project that their profiles are already known on the city level,
while their comparison on URBforDAN project level brings no added value. For this reason, such key
stakeholders received a key stakeholder profile exclusively on the city level – if project partners from that
city considered such stakeholder profile useful and necessary for their work on the city level.
An URBforDAN level key stakeholder profile (presented in the next chapters) was created only for those user
stakeholder groups, which were selected as key stakeholders from at least 4 project partners. Of course,
other stakeholder groups were not disregarded but were taken into account only on the individual city level.
Answers presented in the following chapters represent average values aggregated from UPF user
questionnaire answers – thus creating a profile of a typical representative of the specific stakeholder group
in each city. For each answer we also provide a percentage of the most common answer – the percentage is
provided in brackets and is rounded up or down on the basis of 5% accuracy, thus allowing transnational
comparison and needed a level of generalization.
Programme co-funded by the European Union (ERDF, IPA, ENI) page 5
5 URBforDAN Key Stakeholder Profiles
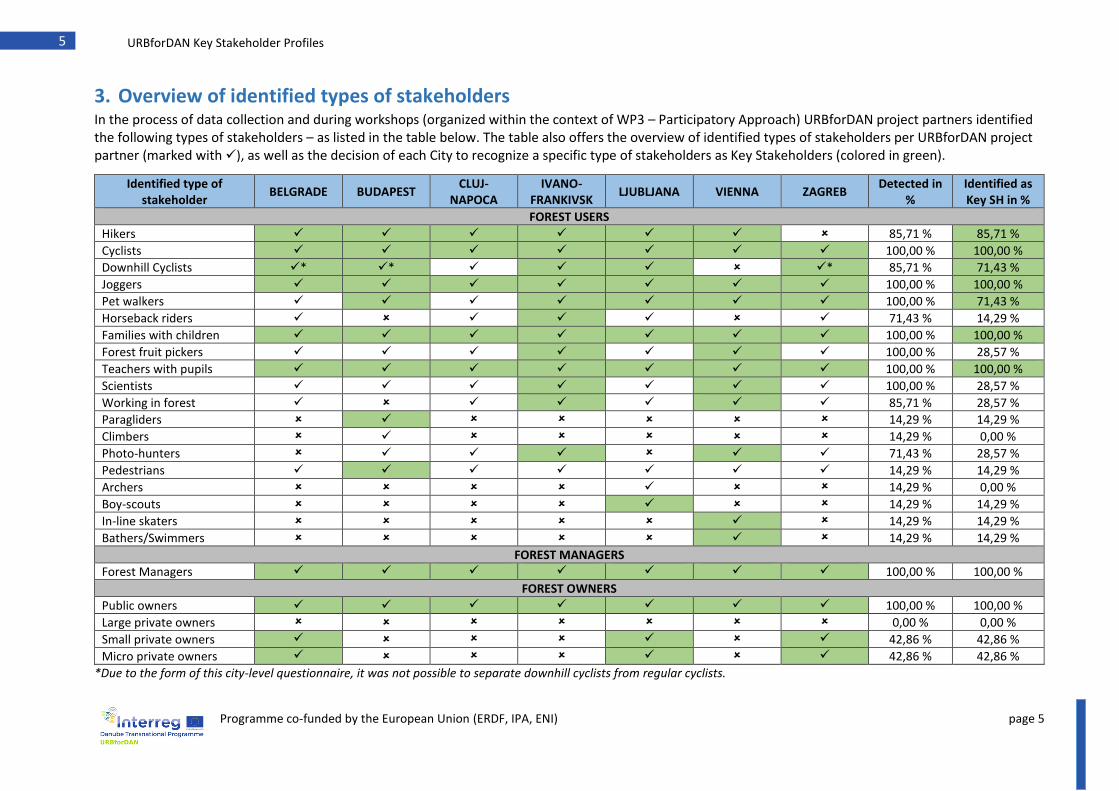
3. Overview of identified types of stakeholders In the process of data collection and during workshops (organized within the context of WP3 – Participatory Approach) URBforDAN project partners identified the following types of stakeholders – as listed in the table below. The table also offers the overview of identified types of stakeholders per URBforDAN project partner (marked with ✓), as well as the decision of each City to recognize a specific type of stakeholders as Key Stakeholders (colored in green).
Identified type of stakeholder
BELGRADE BUDAPEST CLUJ-
NAPOCA IVANO-
FRANKIVSK LJUBLJANA VIENNA ZAGREB
Detected in %
Identified as Key SH in %
FOREST USERS
Hikers ✓ ✓ ✓ ✓ ✓ ✓ 85,71 % 85,71 %
Cyclists ✓ ✓ ✓ ✓ ✓ ✓ ✓ 100,00 % 100,00 %
Downhill Cyclists ✓* ✓* ✓ ✓ ✓ ✓* 85,71 % 71,43 %
Joggers ✓ ✓ ✓ ✓ ✓ ✓ ✓ 100,00 % 100,00 %
Pet walkers ✓ ✓ ✓ ✓ ✓ ✓ ✓ 100,00 % 71,43 %
Horseback riders ✓ ✓ ✓ ✓ ✓ 71,43 % 14,29 %
Families with children ✓ ✓ ✓ ✓ ✓ ✓ ✓ 100,00 % 100,00 %
Forest fruit pickers ✓ ✓ ✓ ✓ ✓ ✓ ✓ 100,00 % 28,57 %
Teachers with pupils ✓ ✓ ✓ ✓ ✓ ✓ ✓ 100,00 % 100,00 %
Scientists ✓ ✓ ✓ ✓ ✓ ✓ ✓ 100,00 % 28,57 %
Working in forest ✓ ✓ ✓ ✓ ✓ ✓ 85,71 % 28,57 %
Paragliders ✓ 14,29 % 14,29 %
Climbers ✓ 14,29 % 0,00 %
Photo-hunters ✓ ✓ ✓ ✓ ✓ 71,43 % 28,57 %
Pedestrians ✓ ✓ ✓ ✓ ✓ ✓ ✓ 14,29 % 14,29 %
Archers ✓ 14,29 % 0,00 %
Boy-scouts ✓ 14,29 % 14,29 %
In-line skaters ✓ 14,29 % 14,29 %
Bathers/Swimmers ✓ 14,29 % 14,29 %
FOREST MANAGERS
Forest Managers ✓ ✓ ✓ ✓ ✓ ✓ ✓ 100,00 % 100,00 %
FOREST OWNERS
Public owners ✓ ✓ ✓ ✓ ✓ ✓ ✓ 100,00 % 100,00 %
Large private owners 0,00 % 0,00 %
Small private owners ✓ ✓ ✓ 42,86 % 42,86 %
Micro private owners ✓ ✓ ✓ 42,86 % 42,86 %
*Due to the form of this city-level questionnaire, it was not possible to separate downhill cyclists from regular cyclists.
Programme co-funded by the European Union (ERDF, IPA, ENI) page 6
6 URBforDAN Key Stakeholder Profiles
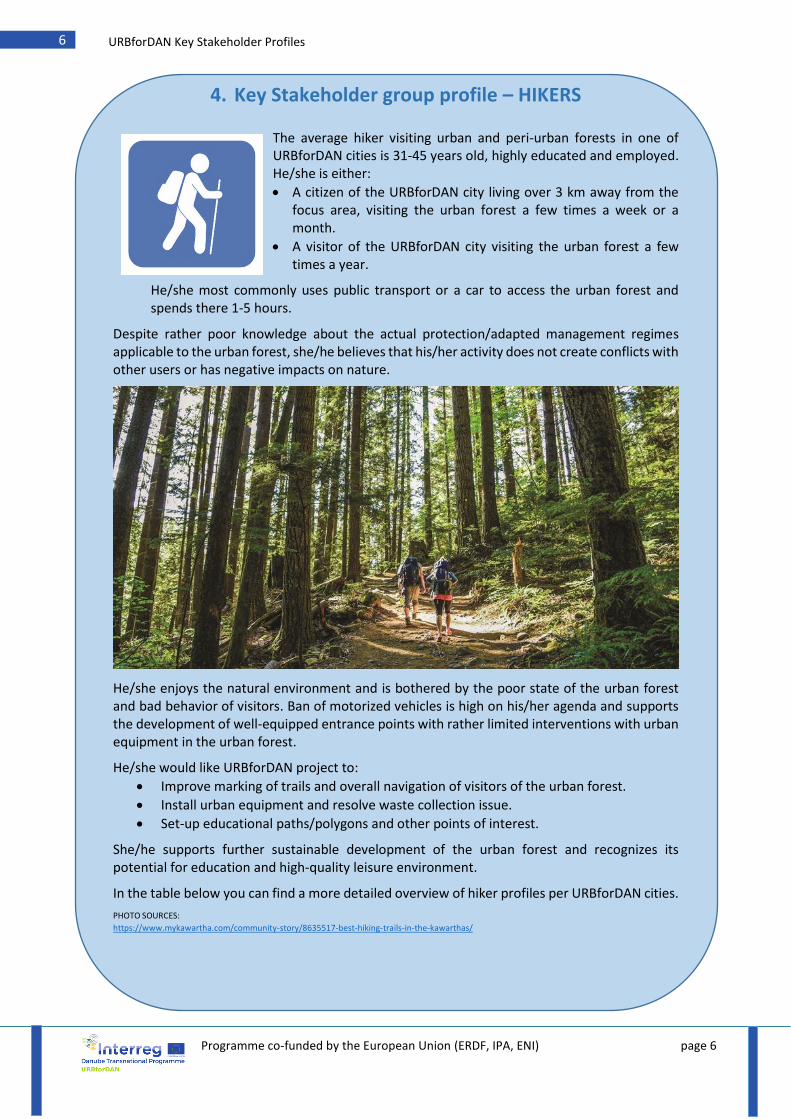
4. Key Stakeholder group profile – HIKERS
The average hiker visiting urban and peri-urban forests in one of URBforDAN cities is 31-45 years old, highly educated and employed. He/she is either:
• A citizen of the URBforDAN city living over 3 km away from the focus area, visiting the urban forest a few times a week or a month.
• A visitor of the URBforDAN city visiting the urban forest a few times a year.
He/she most commonly uses public transport or a car to access the urban forest and spends there 1-5 hours.
Despite rather poor knowledge about the actual protection/adapted management regimes applicable to the urban forest, she/he believes that his/her activity does not create conflicts with other users or has negative impacts on nature.
He/she enjoys the natural environment and is bothered by the poor state of the urban forest and bad behavior of visitors. Ban of motorized vehicles is high on his/her agenda and supports the development of well-equipped entrance points with rather limited interventions with urban equipment in the urban forest.
He/she would like URBforDAN project to:
• Improve marking of trails and overall navigation of visitors of the urban forest.
• Install urban equipment and resolve waste collection issue.
• Set-up educational paths/polygons and other points of interest.
She/he supports further sustainable development of the urban forest and recognizes its potential for education and high-quality leisure environment.
In the table below you can find a more detailed overview of hiker profiles per URBforDAN cities.
PHOTO SOURCES:
https://www.mykawartha.com/community-story/8635517-best-hiking-trails-in-the-kawarthas/
Programme co-funded by the European Union (ERDF, IPA, ENI) page 7
7 URBforDAN Key Stakeholder Profiles
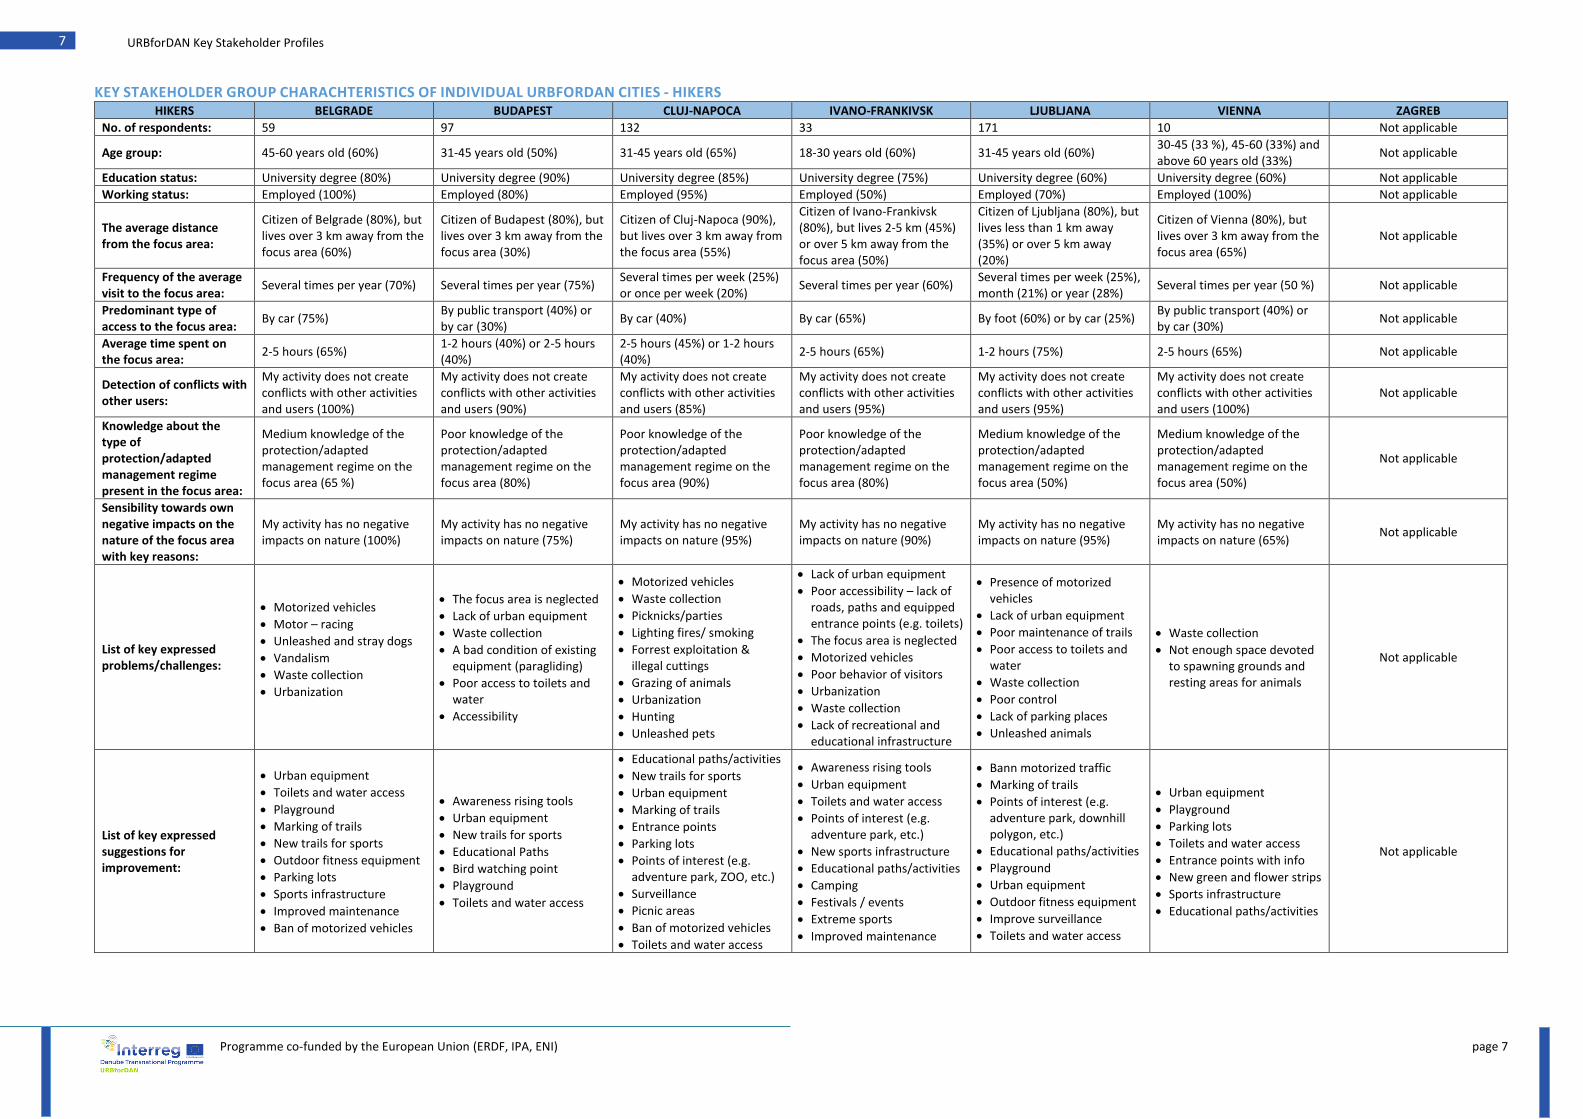
KEY STAKEHOLDER GROUP CHARACHTERISTICS OF INDIVIDUAL URBFORDAN CITIES - HIKERS HIKERS BELGRADE BUDAPEST CLUJ-NAPOCA IVANO-FRANKIVSK LJUBLJANA VIENNA ZAGREB
No. of respondents: 59 97 132 33 171 10 Not applicable
Age group: 45-60 years old (60%) 31-45 years old (50%) 31-45 years old (65%) 18-30 years old (60%) 31-45 years old (60%) 30-45 (33 %), 45-60 (33%) and above 60 years old (33%)
Not applicable
Education status: University degree (80%) University degree (90%) University degree (85%) University degree (75%) University degree (60%) University degree (60%) Not applicable
Working status: Employed (100%) Employed (80%) Employed (95%) Employed (50%) Employed (70%) Employed (100%) Not applicable
The average distance from the focus area:
Citizen of Belgrade (80%), but lives over 3 km away from the focus area (60%)
Citizen of Budapest (80%), but lives over 3 km away from the focus area (30%)
Citizen of Cluj-Napoca (90%), but lives over 3 km away from the focus area (55%)
Citizen of Ivano-Frankivsk (80%), but lives 2-5 km (45%) or over 5 km away from the focus area (50%)
Citizen of Ljubljana (80%), but lives less than 1 km away (35%) or over 5 km away (20%)
Citizen of Vienna (80%), but lives over 3 km away from the focus area (65%)
Not applicable
Frequency of the average visit to the focus area:
Several times per year (70%) Several times per year (75%) Several times per week (25%) or once per week (20%)
Several times per year (60%) Several times per week (25%), month (21%) or year (28%)
Several times per year (50 %) Not applicable
Predominant type of access to the focus area:
By car (75%) By public transport (40%) or by car (30%)
By car (40%) By car (65%) By foot (60%) or by car (25%) By public transport (40%) or by car (30%)
Not applicable
Average time spent on the focus area:
2-5 hours (65%) 1-2 hours (40%) or 2-5 hours (40%)
2-5 hours (45%) or 1-2 hours (40%)
2-5 hours (65%) 1-2 hours (75%) 2-5 hours (65%) Not applicable
Detection of conflicts with other users:
My activity does not create conflicts with other activities and users (100%)
My activity does not create conflicts with other activities and users (90%)
My activity does not create conflicts with other activities and users (85%)
My activity does not create conflicts with other activities and users (95%)
My activity does not create conflicts with other activities and users (95%)
My activity does not create conflicts with other activities and users (100%)
Not applicable
Knowledge about the type of protection/adapted management regime present in the focus area:
Medium knowledge of the protection/adapted management regime on the focus area (65 %)
Poor knowledge of the protection/adapted management regime on the focus area (80%)
Poor knowledge of the protection/adapted management regime on the focus area (90%)
Poor knowledge of the protection/adapted management regime on the focus area (80%)
Medium knowledge of the protection/adapted management regime on the focus area (50%)
Medium knowledge of the protection/adapted management regime on the focus area (50%)
Not applicable
Sensibility towards own negative impacts on the nature of the focus area with key reasons:
My activity has no negative impacts on nature (100%)
My activity has no negative impacts on nature (75%)
My activity has no negative impacts on nature (95%)
My activity has no negative impacts on nature (90%)
My activity has no negative impacts on nature (95%)
My activity has no negative impacts on nature (65%)
Not applicable
List of key expressed problems/challenges:
• Motorized vehicles
• Motor – racing
• Unleashed and stray dogs
• Vandalism
• Waste collection
• Urbanization
• The focus area is neglected
• Lack of urban equipment
• Waste collection
• A bad condition of existing equipment (paragliding)
• Poor access to toilets and water
• Accessibility
• Motorized vehicles
• Waste collection
• Picknicks/parties
• Lighting fires/ smoking
• Forrest exploitation & illegal cuttings
• Grazing of animals
• Urbanization
• Hunting
• Unleashed pets
• Lack of urban equipment
• Poor accessibility – lack of roads, paths and equipped entrance points (e.g. toilets)
• The focus area is neglected
• Motorized vehicles
• Poor behavior of visitors
• Urbanization
• Waste collection
• Lack of recreational and educational infrastructure
• Presence of motorized vehicles
• Lack of urban equipment
• Poor maintenance of trails
• Poor access to toilets and water
• Waste collection
• Poor control
• Lack of parking places
• Unleashed animals
• Waste collection
• Not enough space devoted to spawning grounds and resting areas for animals
Not applicable
List of key expressed suggestions for improvement:
• Urban equipment
• Toilets and water access
• Playground
• Marking of trails
• New trails for sports
• Outdoor fitness equipment
• Parking lots
• Sports infrastructure
• Improved maintenance
• Ban of motorized vehicles
• Awareness rising tools
• Urban equipment
• New trails for sports
• Educational Paths
• Bird watching point
• Playground
• Toilets and water access
• Educational paths/activities
• New trails for sports
• Urban equipment
• Marking of trails
• Entrance points
• Parking lots
• Points of interest (e.g. adventure park, ZOO, etc.)
• Surveillance
• Picnic areas
• Ban of motorized vehicles
• Toilets and water access
• Awareness rising tools
• Urban equipment
• Toilets and water access
• Points of interest (e.g. adventure park, etc.)
• New sports infrastructure
• Educational paths/activities
• Camping
• Festivals / events
• Extreme sports
• Improved maintenance
• Bann motorized traffic
• Marking of trails
• Points of interest (e.g. adventure park, downhill polygon, etc.)
• Educational paths/activities
• Playground
• Urban equipment
• Outdoor fitness equipment
• Improve surveillance
• Toilets and water access
• Urban equipment
• Playground
• Parking lots
• Toilets and water access
• Entrance points with info
• New green and flower strips
• Sports infrastructure
• Educational paths/activities
Not applicable
Programme co-funded by the European Union (ERDF, IPA, ENI) page 8
8 URBforDAN Key Stakeholder Profiles
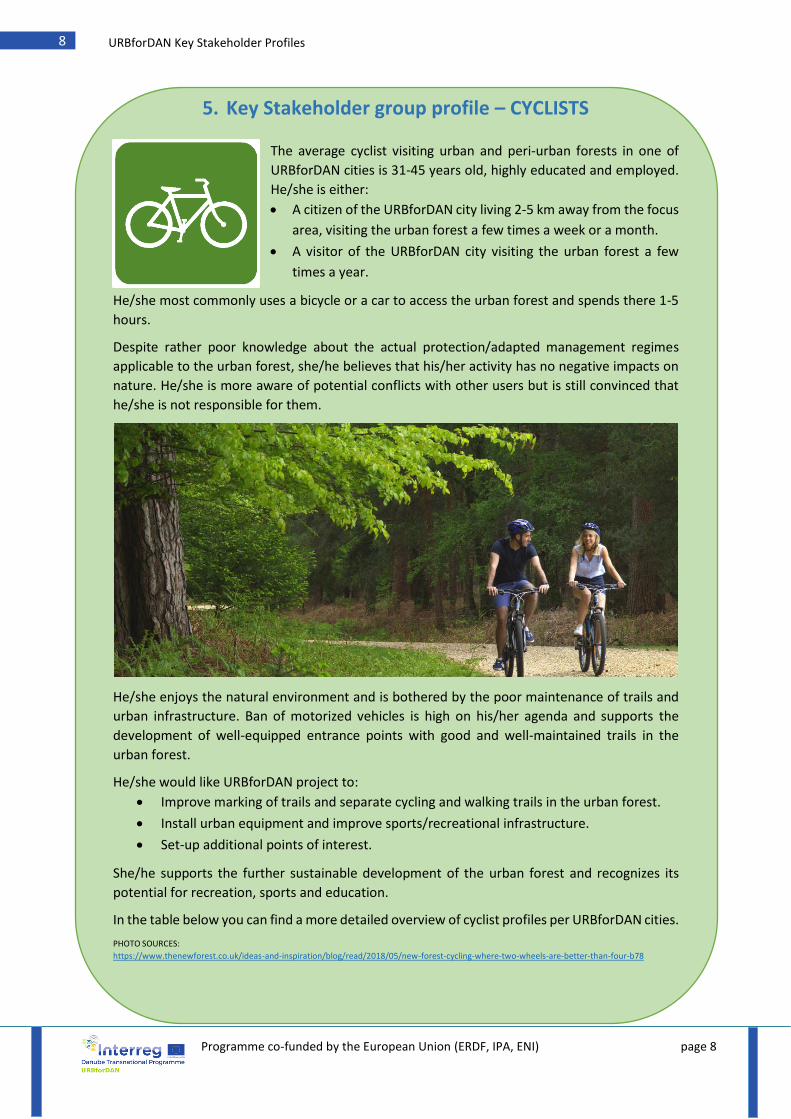
5. Key Stakeholder group profile – CYCLISTS
The average cyclist visiting urban and peri-urban forests in one of
URBforDAN cities is 31-45 years old, highly educated and employed.
He/she is either:
• A citizen of the URBforDAN city living 2-5 km away from the focus
area, visiting the urban forest a few times a week or a month.
• A visitor of the URBforDAN city visiting the urban forest a few
times a year.
He/she most commonly uses a bicycle or a car to access the urban forest and spends there 1-5
hours.
Despite rather poor knowledge about the actual protection/adapted management regimes
applicable to the urban forest, she/he believes that his/her activity has no negative impacts on
nature. He/she is more aware of potential conflicts with other users but is still convinced that
he/she is not responsible for them.
He/she enjoys the natural environment and is bothered by the poor maintenance of trails and
urban infrastructure. Ban of motorized vehicles is high on his/her agenda and supports the
development of well-equipped entrance points with good and well-maintained trails in the
urban forest.
He/she would like URBforDAN project to:
• Improve marking of trails and separate cycling and walking trails in the urban forest.
• Install urban equipment and improve sports/recreational infrastructure.
• Set-up additional points of interest.
She/he supports the further sustainable development of the urban forest and recognizes its
potential for recreation, sports and education.
In the table below you can find a more detailed overview of cyclist profiles per URBforDAN cities.
PHOTO SOURCES:
https://www.thenewforest.co.uk/ideas-and-inspiration/blog/read/2018/05/new-forest-cycling-where-two-wheels-are-better-than-four-b78
Programme co-funded by the European Union (ERDF, IPA, ENI) page 9
9 URBforDAN Key Stakeholder Profiles
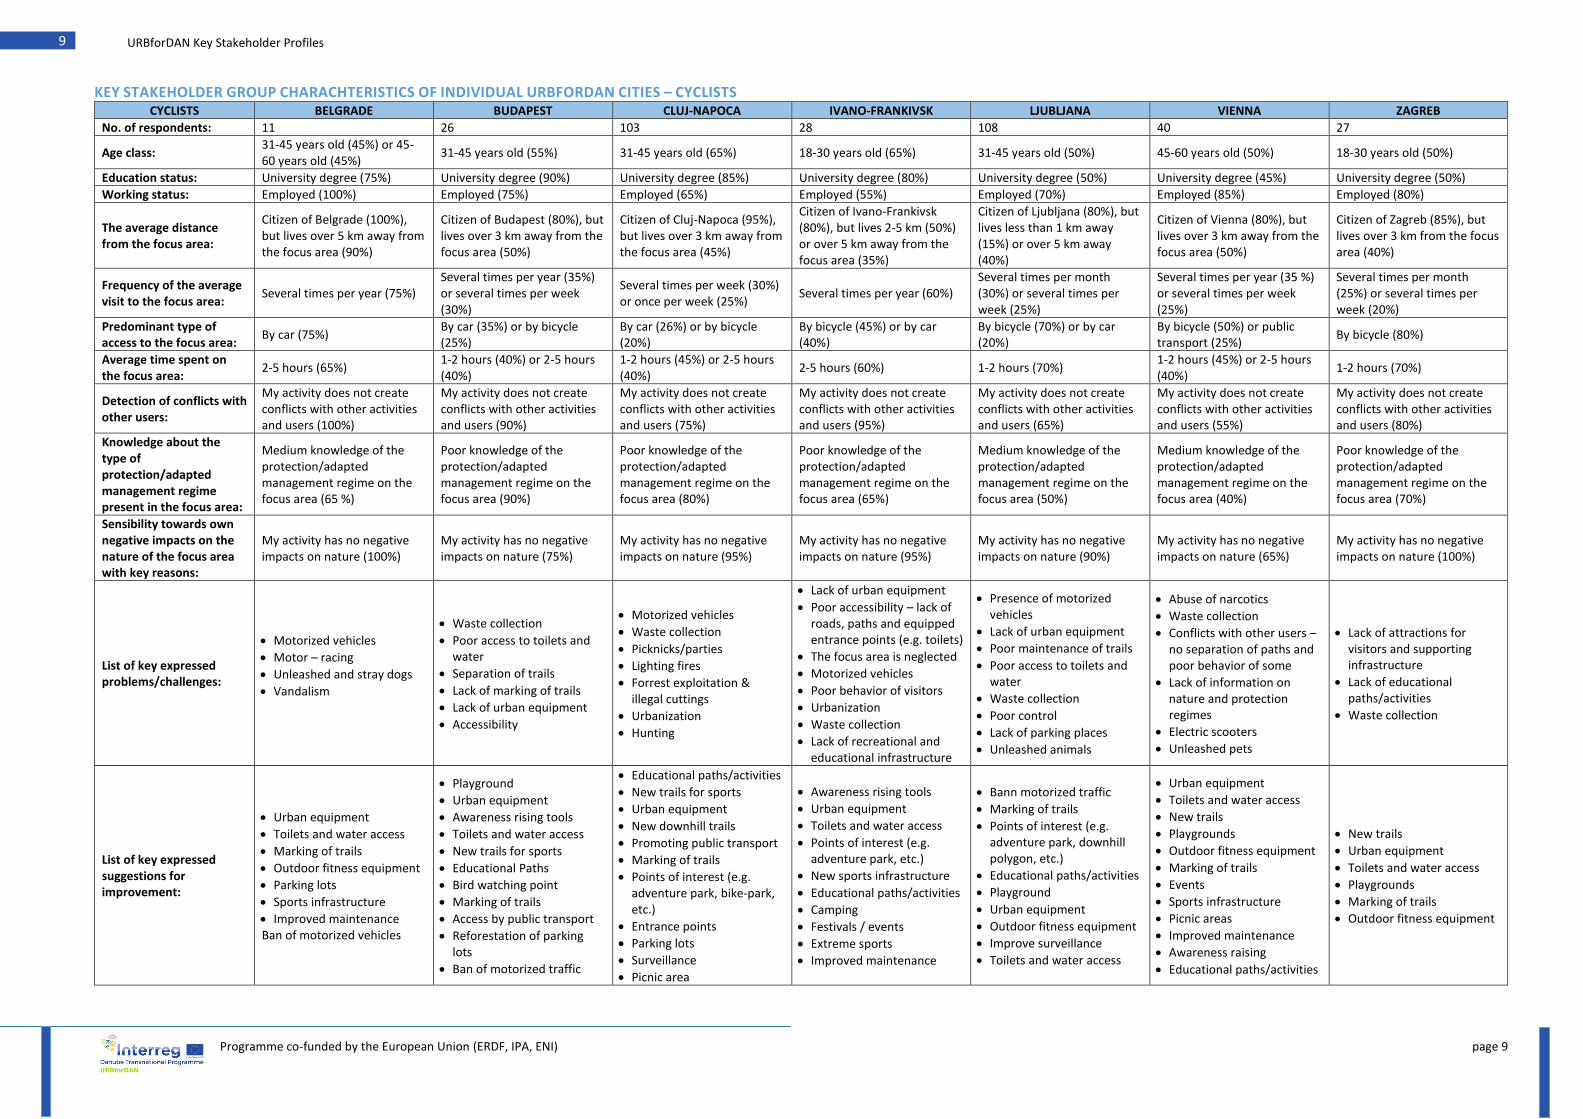
KEY STAKEHOLDER GROUP CHARACHTERISTICS OF INDIVIDUAL URBFORDAN CITIES – CYCLISTS CYCLISTS BELGRADE BUDAPEST CLUJ-NAPOCA IVANO-FRANKIVSK LJUBLJANA VIENNA ZAGREB
No. of respondents: 11 26 103 28 108 40 27
Age class: 31-45 years old (45%) or 45-60 years old (45%)
31-45 years old (55%) 31-45 years old (65%) 18-30 years old (65%) 31-45 years old (50%) 45-60 years old (50%) 18-30 years old (50%)
Education status: University degree (75%) University degree (90%) University degree (85%) University degree (80%) University degree (50%) University degree (45%) University degree (50%)
Working status: Employed (100%) Employed (75%) Employed (65%) Employed (55%) Employed (70%) Employed (85%) Employed (80%)
The average distance from the focus area:
Citizen of Belgrade (100%), but lives over 5 km away from the focus area (90%)
Citizen of Budapest (80%), but lives over 3 km away from the focus area (50%)
Citizen of Cluj-Napoca (95%), but lives over 3 km away from the focus area (45%)
Citizen of Ivano-Frankivsk (80%), but lives 2-5 km (50%) or over 5 km away from the focus area (35%)
Citizen of Ljubljana (80%), but lives less than 1 km away (15%) or over 5 km away (40%)
Citizen of Vienna (80%), but lives over 3 km away from the focus area (50%)
Citizen of Zagreb (85%), but lives over 3 km from the focus area (40%)
Frequency of the average visit to the focus area:
Several times per year (75%) Several times per year (35%) or several times per week (30%)
Several times per week (30%) or once per week (25%)
Several times per year (60%) Several times per month (30%) or several times per week (25%)
Several times per year (35 %) or several times per week (25%)
Several times per month (25%) or several times per week (20%)
Predominant type of access to the focus area:
By car (75%) By car (35%) or by bicycle (25%)
By car (26%) or by bicycle (20%)
By bicycle (45%) or by car (40%)
By bicycle (70%) or by car (20%)
By bicycle (50%) or public transport (25%)
By bicycle (80%)
Average time spent on the focus area:
2-5 hours (65%) 1-2 hours (40%) or 2-5 hours (40%)
1-2 hours (45%) or 2-5 hours (40%)
2-5 hours (60%) 1-2 hours (70%) 1-2 hours (45%) or 2-5 hours (40%)
1-2 hours (70%)
Detection of conflicts with other users:
My activity does not create conflicts with other activities and users (100%)
My activity does not create conflicts with other activities and users (90%)
My activity does not create conflicts with other activities and users (75%)
My activity does not create conflicts with other activities and users (95%)
My activity does not create conflicts with other activities and users (65%)
My activity does not create conflicts with other activities and users (55%)
My activity does not create conflicts with other activities and users (80%)
Knowledge about the type of protection/adapted management regime present in the focus area:
Medium knowledge of the protection/adapted management regime on the focus area (65 %)
Poor knowledge of the protection/adapted management regime on the focus area (90%)
Poor knowledge of the protection/adapted management regime on the focus area (80%)
Poor knowledge of the protection/adapted management regime on the focus area (65%)
Medium knowledge of the protection/adapted management regime on the focus area (50%)
Medium knowledge of the protection/adapted management regime on the focus area (40%)
Poor knowledge of the protection/adapted management regime on the focus area (70%)
Sensibility towards own negative impacts on the nature of the focus area with key reasons:
My activity has no negative impacts on nature (100%)
My activity has no negative impacts on nature (75%)
My activity has no negative impacts on nature (95%)
My activity has no negative impacts on nature (95%)
My activity has no negative impacts on nature (90%)
My activity has no negative impacts on nature (65%)
My activity has no negative impacts on nature (100%)
List of key expressed problems/challenges:
• Motorized vehicles
• Motor – racing
• Unleashed and stray dogs
• Vandalism
• Waste collection
• Poor access to toilets and water
• Separation of trails
• Lack of marking of trails
• Lack of urban equipment
• Accessibility
• Motorized vehicles
• Waste collection
• Picknicks/parties
• Lighting fires
• Forrest exploitation & illegal cuttings
• Urbanization
• Hunting
• Lack of urban equipment
• Poor accessibility – lack of roads, paths and equipped entrance points (e.g. toilets)
• The focus area is neglected
• Motorized vehicles
• Poor behavior of visitors
• Urbanization
• Waste collection
• Lack of recreational and educational infrastructure
• Presence of motorized vehicles
• Lack of urban equipment
• Poor maintenance of trails
• Poor access to toilets and water
• Waste collection
• Poor control
• Lack of parking places
• Unleashed animals
• Abuse of narcotics
• Waste collection
• Conflicts with other users – no separation of paths and poor behavior of some
• Lack of information on nature and protection regimes
• Electric scooters
• Unleashed pets
• Lack of attractions for visitors and supporting infrastructure
• Lack of educational paths/activities
• Waste collection
List of key expressed suggestions for improvement:
• Urban equipment
• Toilets and water access
• Marking of trails
• Outdoor fitness equipment
• Parking lots
• Sports infrastructure
• Improved maintenance Ban of motorized vehicles
• Playground
• Urban equipment
• Awareness rising tools
• Toilets and water access
• New trails for sports
• Educational Paths
• Bird watching point
• Marking of trails
• Access by public transport
• Reforestation of parking lots
• Ban of motorized traffic
• Educational paths/activities
• New trails for sports
• Urban equipment
• New downhill trails
• Promoting public transport
• Marking of trails
• Points of interest (e.g. adventure park, bike-park, etc.)
• Entrance points
• Parking lots
• Surveillance
• Picnic area
• Awareness rising tools
• Urban equipment
• Toilets and water access
• Points of interest (e.g. adventure park, etc.)
• New sports infrastructure
• Educational paths/activities
• Camping
• Festivals / events
• Extreme sports
• Improved maintenance
• Bann motorized traffic
• Marking of trails
• Points of interest (e.g. adventure park, downhill polygon, etc.)
• Educational paths/activities
• Playground
• Urban equipment
• Outdoor fitness equipment
• Improve surveillance
• Toilets and water access
• Urban equipment
• Toilets and water access
• New trails
• Playgrounds
• Outdoor fitness equipment
• Marking of trails
• Events
• Sports infrastructure
• Picnic areas
• Improved maintenance
• Awareness raising
• Educational paths/activities
• New trails
• Urban equipment
• Toilets and water access
• Playgrounds
• Marking of trails
• Outdoor fitness equipment
Programme co-funded by the European Union (ERDF, IPA, ENI) page 10
10 URBforDAN Key Stakeholder Profiles
6. Key Stakeholder group profile – DOWNHILL CYCLISTS
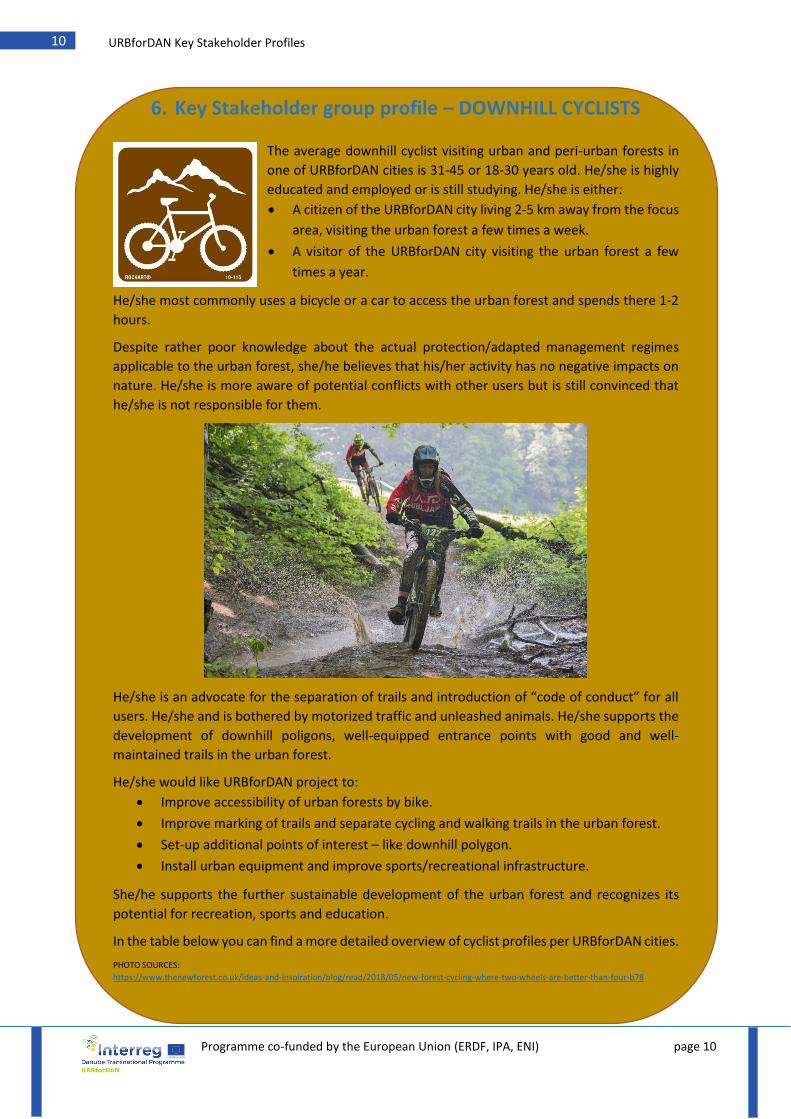
The average downhill cyclist visiting urban and peri-urban forests in
one of URBforDAN cities is 31-45 or 18-30 years old. He/she is highly
educated and employed or is still studying. He/she is either:
• A citizen of the URBforDAN city living 2-5 km away from the focus
area, visiting the urban forest a few times a week.
• A visitor of the URBforDAN city visiting the urban forest a few
times a year.
He/she most commonly uses a bicycle or a car to access the urban forest and spends there 1-2
hours.
Despite rather poor knowledge about the actual protection/adapted management regimes
applicable to the urban forest, she/he believes that his/her activity has no negative impacts on
nature. He/she is more aware of potential conflicts with other users but is still convinced that
he/she is not responsible for them.
He/she is an advocate for the separation of trails and introduction of “code of conduct” for all
users. He/she and is bothered by motorized traffic and unleashed animals. He/she supports the
development of downhill poligons, well-equipped entrance points with good and well-
maintained trails in the urban forest.
He/she would like URBforDAN project to:
• Improve accessibility of urban forests by bike.
• Improve marking of trails and separate cycling and walking trails in the urban forest.
• Set-up additional points of interest – like downhill polygon.
• Install urban equipment and improve sports/recreational infrastructure.
She/he supports the further sustainable development of the urban forest and recognizes its
potential for recreation, sports and education.
In the table below you can find a more detailed overview of cyclist profiles per URBforDAN cities.
PHOTO SOURCES:
https://www.thenewforest.co.uk/ideas-and-inspiration/blog/read/2018/05/new-forest-cycling-where-two-wheels-are-better-than-four-b78
Programme co-funded by the European Union (ERDF, IPA, ENI) page 11
11 URBforDAN Key Stakeholder Profiles
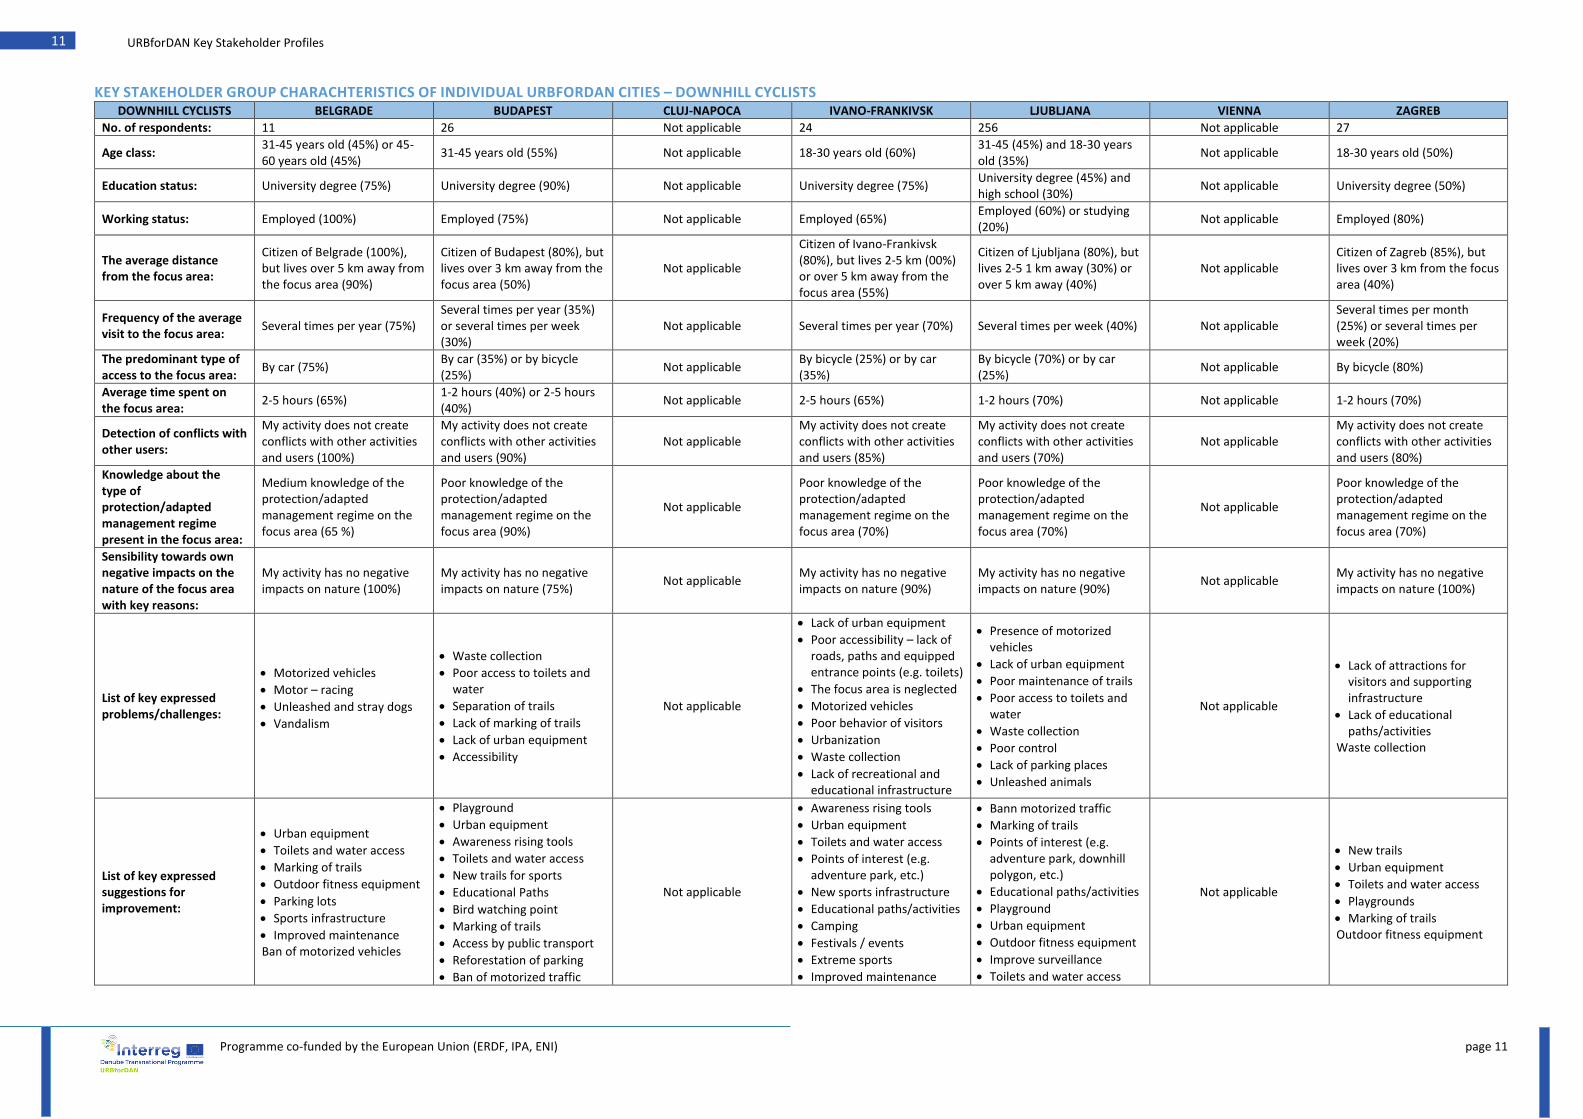
KEY STAKEHOLDER GROUP CHARACHTERISTICS OF INDIVIDUAL URBFORDAN CITIES – DOWNHILL CYCLISTS DOWNHILL CYCLISTS BELGRADE BUDAPEST CLUJ-NAPOCA IVANO-FRANKIVSK LJUBLJANA VIENNA ZAGREB
No. of respondents: 11 26 Not applicable 24 256 Not applicable 27
Age class: 31-45 years old (45%) or 45-60 years old (45%)
31-45 years old (55%) Not applicable 18-30 years old (60%) 31-45 (45%) and 18-30 years old (35%)
Not applicable 18-30 years old (50%)
Education status: University degree (75%) University degree (90%) Not applicable University degree (75%) University degree (45%) and high school (30%)
Not applicable University degree (50%)
Working status: Employed (100%) Employed (75%) Not applicable Employed (65%) Employed (60%) or studying (20%)
Not applicable Employed (80%)
The average distance from the focus area:
Citizen of Belgrade (100%), but lives over 5 km away from the focus area (90%)
Citizen of Budapest (80%), but lives over 3 km away from the focus area (50%)
Not applicable
Citizen of Ivano-Frankivsk (80%), but lives 2-5 km (00%) or over 5 km away from the focus area (55%)
Citizen of Ljubljana (80%), but lives 2-5 1 km away (30%) or over 5 km away (40%)
Not applicable Citizen of Zagreb (85%), but lives over 3 km from the focus area (40%)
Frequency of the average visit to the focus area:
Several times per year (75%) Several times per year (35%) or several times per week (30%)
Not applicable Several times per year (70%) Several times per week (40%) Not applicable Several times per month (25%) or several times per week (20%)
The predominant type of access to the focus area:
By car (75%) By car (35%) or by bicycle (25%)
Not applicable By bicycle (25%) or by car (35%)
By bicycle (70%) or by car (25%)
Not applicable By bicycle (80%)
Average time spent on the focus area:
2-5 hours (65%) 1-2 hours (40%) or 2-5 hours (40%)
Not applicable 2-5 hours (65%) 1-2 hours (70%) Not applicable 1-2 hours (70%)
Detection of conflicts with other users:
My activity does not create conflicts with other activities and users (100%)
My activity does not create conflicts with other activities and users (90%)
Not applicable My activity does not create conflicts with other activities and users (85%)
My activity does not create conflicts with other activities and users (70%)
Not applicable My activity does not create conflicts with other activities and users (80%)
Knowledge about the type of protection/adapted management regime present in the focus area:
Medium knowledge of the protection/adapted management regime on the focus area (65 %)
Poor knowledge of the protection/adapted management regime on the focus area (90%)
Not applicable
Poor knowledge of the protection/adapted management regime on the focus area (70%)
Poor knowledge of the protection/adapted management regime on the focus area (70%)
Not applicable
Poor knowledge of the protection/adapted management regime on the focus area (70%)
Sensibility towards own negative impacts on the nature of the focus area with key reasons:
My activity has no negative impacts on nature (100%)
My activity has no negative impacts on nature (75%)
Not applicable My activity has no negative impacts on nature (90%)
My activity has no negative impacts on nature (90%)
Not applicable My activity has no negative impacts on nature (100%)
List of key expressed problems/challenges:
• Motorized vehicles
• Motor – racing
• Unleashed and stray dogs
• Vandalism
• Waste collection
• Poor access to toilets and water
• Separation of trails
• Lack of marking of trails
• Lack of urban equipment
• Accessibility
Not applicable
• Lack of urban equipment
• Poor accessibility – lack of roads, paths and equipped entrance points (e.g. toilets)
• The focus area is neglected
• Motorized vehicles
• Poor behavior of visitors
• Urbanization
• Waste collection
• Lack of recreational and educational infrastructure
• Presence of motorized vehicles
• Lack of urban equipment
• Poor maintenance of trails
• Poor access to toilets and water
• Waste collection
• Poor control
• Lack of parking places
• Unleashed animals
Not applicable
• Lack of attractions for visitors and supporting infrastructure
• Lack of educational paths/activities
Waste collection
List of key expressed suggestions for improvement:
• Urban equipment
• Toilets and water access
• Marking of trails
• Outdoor fitness equipment
• Parking lots
• Sports infrastructure
• Improved maintenance Ban of motorized vehicles
• Playground
• Urban equipment
• Awareness rising tools
• Toilets and water access
• New trails for sports
• Educational Paths
• Bird watching point
• Marking of trails
• Access by public transport
• Reforestation of parking
• Ban of motorized traffic
Not applicable
• Awareness rising tools
• Urban equipment
• Toilets and water access
• Points of interest (e.g. adventure park, etc.)
• New sports infrastructure
• Educational paths/activities
• Camping
• Festivals / events
• Extreme sports
• Improved maintenance
• Bann motorized traffic
• Marking of trails
• Points of interest (e.g. adventure park, downhill polygon, etc.)
• Educational paths/activities
• Playground
• Urban equipment
• Outdoor fitness equipment
• Improve surveillance
• Toilets and water access
Not applicable
• New trails
• Urban equipment
• Toilets and water access
• Playgrounds
• Marking of trails Outdoor fitness equipment
Programme co-funded by the European Union (ERDF, IPA, ENI) page 12
12 URBforDAN Key Stakeholder Profiles
7. Key Stakeholder group profile – JOGGERS
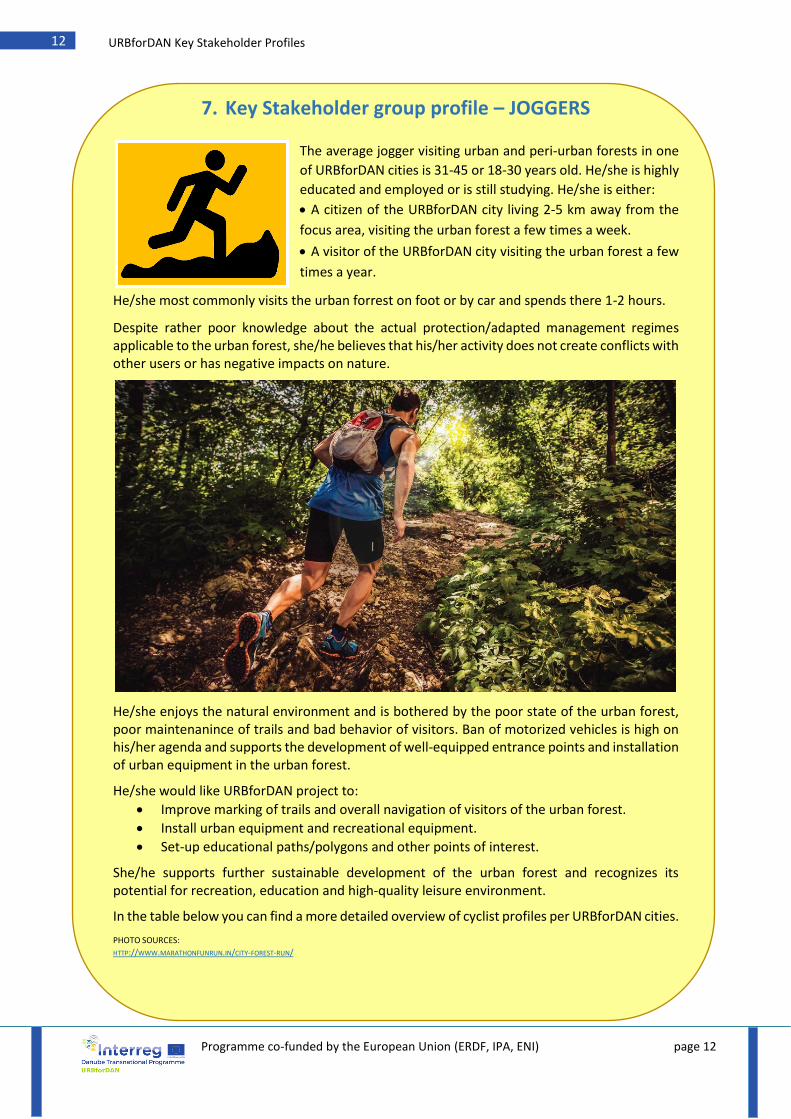
The average jogger visiting urban and peri-urban forests in one
of URBforDAN cities is 31-45 or 18-30 years old. He/she is highly
educated and employed or is still studying. He/she is either:
• A citizen of the URBforDAN city living 2-5 km away from the
focus area, visiting the urban forest a few times a week.
• A visitor of the URBforDAN city visiting the urban forest a few
times a year.
He/she most commonly visits the urban forrest on foot or by car and spends there 1-2 hours.
Despite rather poor knowledge about the actual protection/adapted management regimes applicable to the urban forest, she/he believes that his/her activity does not create conflicts with other users or has negative impacts on nature.
He/she enjoys the natural environment and is bothered by the poor state of the urban forest, poor maintenanince of trails and bad behavior of visitors. Ban of motorized vehicles is high on his/her agenda and supports the development of well-equipped entrance points and installation of urban equipment in the urban forest.
He/she would like URBforDAN project to:
• Improve marking of trails and overall navigation of visitors of the urban forest.
• Install urban equipment and recreational equipment.
• Set-up educational paths/polygons and other points of interest.
She/he supports further sustainable development of the urban forest and recognizes its potential for recreation, education and high-quality leisure environment.
In the table below you can find a more detailed overview of cyclist profiles per URBforDAN cities.
PHOTO SOURCES:
HTTP://WWW.MARATHONFUNRUN.IN/CITY-FOREST-RUN/
Programme co-funded by the European Union (ERDF, IPA, ENI) page 13
13 URBforDAN Key Stakeholder Profiles
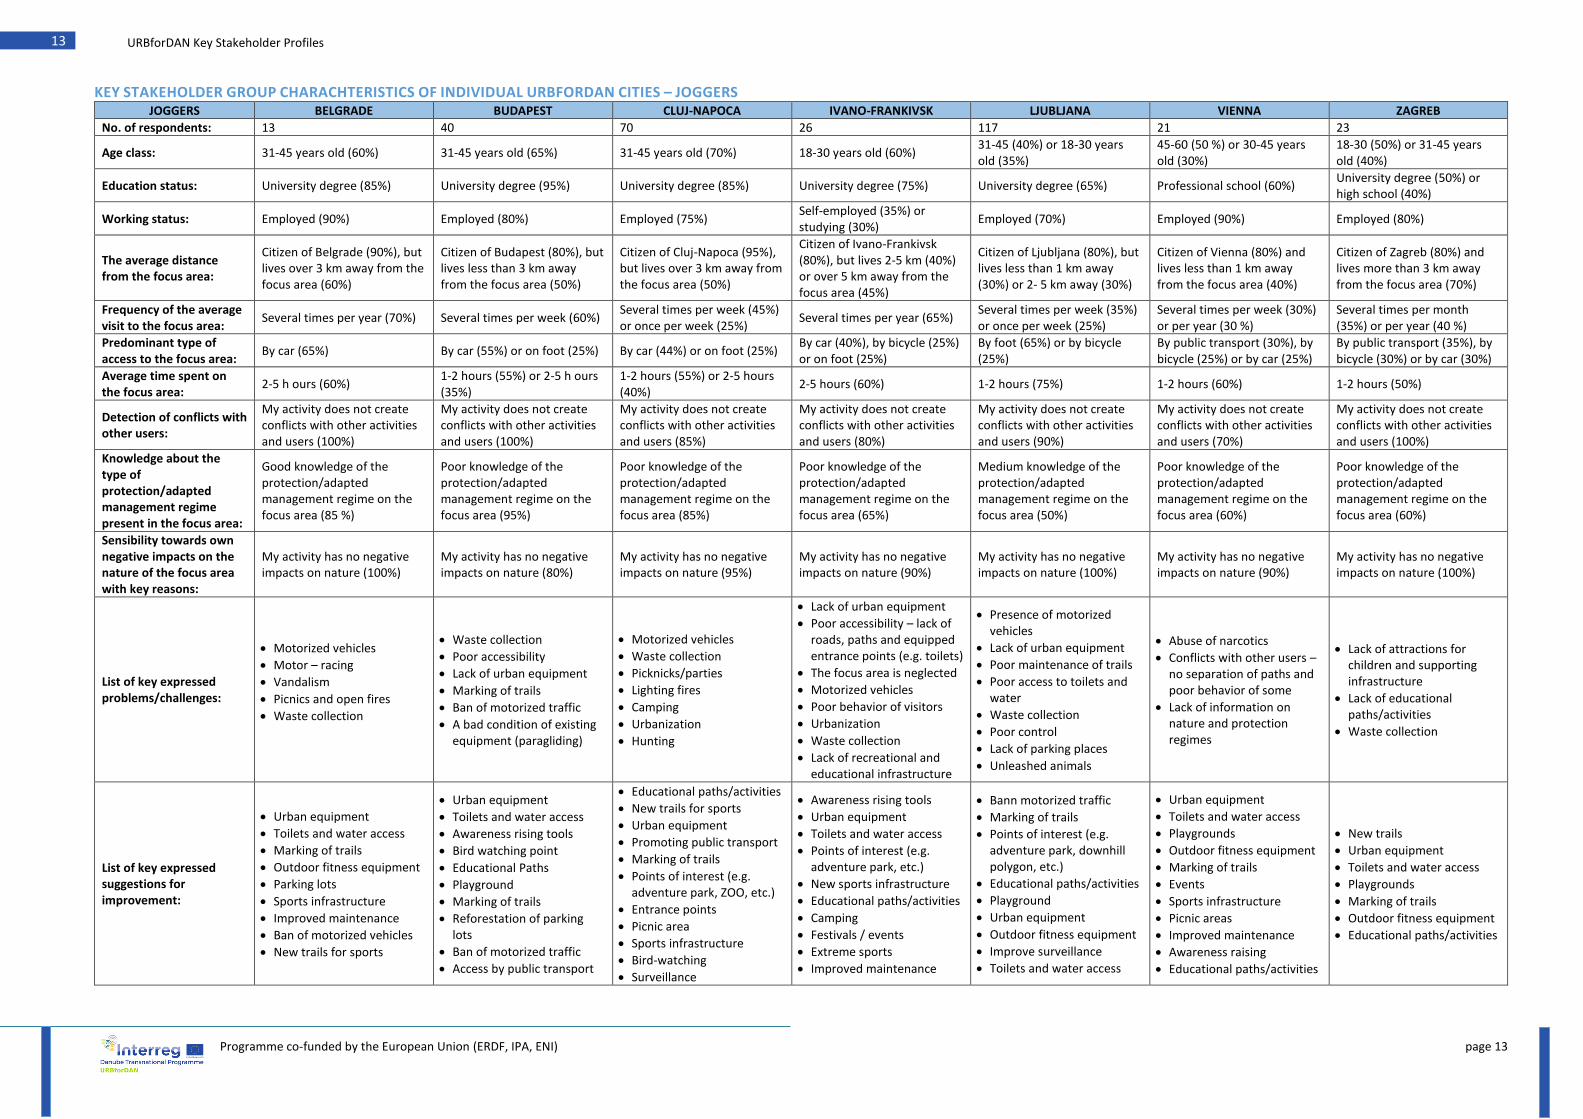
KEY STAKEHOLDER GROUP CHARACHTERISTICS OF INDIVIDUAL URBFORDAN CITIES – JOGGERS JOGGERS BELGRADE BUDAPEST CLUJ-NAPOCA IVANO-FRANKIVSK LJUBLJANA VIENNA ZAGREB
No. of respondents: 13 40 70 26 117 21 23
Age class: 31-45 years old (60%) 31-45 years old (65%) 31-45 years old (70%) 18-30 years old (60%) 31-45 (40%) or 18-30 years old (35%)
45-60 (50 %) or 30-45 years old (30%)
18-30 (50%) or 31-45 years old (40%)
Education status: University degree (85%) University degree (95%) University degree (85%) University degree (75%) University degree (65%) Professional school (60%) University degree (50%) or high school (40%)
Working status: Employed (90%) Employed (80%) Employed (75%) Self-employed (35%) or studying (30%)
Employed (70%) Employed (90%) Employed (80%)
The average distance from the focus area:
Citizen of Belgrade (90%), but lives over 3 km away from the focus area (60%)
Citizen of Budapest (80%), but lives less than 3 km away from the focus area (50%)
Citizen of Cluj-Napoca (95%), but lives over 3 km away from the focus area (50%)
Citizen of Ivano-Frankivsk (80%), but lives 2-5 km (40%) or over 5 km away from the focus area (45%)
Citizen of Ljubljana (80%), but lives less than 1 km away (30%) or 2- 5 km away (30%)
Citizen of Vienna (80%) and lives less than 1 km away from the focus area (40%)
Citizen of Zagreb (80%) and lives more than 3 km away from the focus area (70%)
Frequency of the average visit to the focus area:
Several times per year (70%) Several times per week (60%) Several times per week (45%) or once per week (25%)
Several times per year (65%) Several times per week (35%) or once per week (25%)
Several times per week (30%) or per year (30 %)
Several times per month (35%) or per year (40 %)
Predominant type of access to the focus area:
By car (65%) By car (55%) or on foot (25%) By car (44%) or on foot (25%) By car (40%), by bicycle (25%) or on foot (25%)
By foot (65%) or by bicycle (25%)
By public transport (30%), by bicycle (25%) or by car (25%)
By public transport (35%), by bicycle (30%) or by car (30%)
Average time spent on the focus area:
2-5 h ours (60%) 1-2 hours (55%) or 2-5 h ours (35%)
1-2 hours (55%) or 2-5 hours (40%)
2-5 hours (60%) 1-2 hours (75%) 1-2 hours (60%) 1-2 hours (50%)
Detection of conflicts with other users:
My activity does not create conflicts with other activities and users (100%)
My activity does not create conflicts with other activities and users (100%)
My activity does not create conflicts with other activities and users (85%)
My activity does not create conflicts with other activities and users (80%)
My activity does not create conflicts with other activities and users (90%)
My activity does not create conflicts with other activities and users (70%)
My activity does not create conflicts with other activities and users (100%)
Knowledge about the type of protection/adapted management regime present in the focus area:
Good knowledge of the protection/adapted management regime on the focus area (85 %)
Poor knowledge of the protection/adapted management regime on the focus area (95%)
Poor knowledge of the protection/adapted management regime on the focus area (85%)
Poor knowledge of the protection/adapted management regime on the focus area (65%)
Medium knowledge of the protection/adapted management regime on the focus area (50%)
Poor knowledge of the protection/adapted management regime on the focus area (60%)
Poor knowledge of the protection/adapted management regime on the focus area (60%)
Sensibility towards own negative impacts on the nature of the focus area with key reasons:
My activity has no negative impacts on nature (100%)
My activity has no negative impacts on nature (80%)
My activity has no negative impacts on nature (95%)
My activity has no negative impacts on nature (90%)
My activity has no negative impacts on nature (100%)
My activity has no negative impacts on nature (90%)
My activity has no negative impacts on nature (100%)
List of key expressed problems/challenges:
• Motorized vehicles
• Motor – racing
• Vandalism
• Picnics and open fires
• Waste collection
• Waste collection
• Poor accessibility
• Lack of urban equipment
• Marking of trails
• Ban of motorized traffic
• A bad condition of existing equipment (paragliding)
• Motorized vehicles
• Waste collection
• Picknicks/parties
• Lighting fires
• Camping
• Urbanization
• Hunting
• Lack of urban equipment
• Poor accessibility – lack of roads, paths and equipped entrance points (e.g. toilets)
• The focus area is neglected
• Motorized vehicles
• Poor behavior of visitors
• Urbanization
• Waste collection
• Lack of recreational and educational infrastructure
• Presence of motorized vehicles
• Lack of urban equipment
• Poor maintenance of trails
• Poor access to toilets and water
• Waste collection
• Poor control
• Lack of parking places
• Unleashed animals
• Abuse of narcotics
• Conflicts with other users – no separation of paths and poor behavior of some
• Lack of information on nature and protection regimes
• Lack of attractions for children and supporting infrastructure
• Lack of educational paths/activities
• Waste collection
List of key expressed suggestions for improvement:
• Urban equipment
• Toilets and water access
• Marking of trails
• Outdoor fitness equipment
• Parking lots
• Sports infrastructure
• Improved maintenance
• Ban of motorized vehicles
• New trails for sports
• Urban equipment
• Toilets and water access
• Awareness rising tools
• Bird watching point
• Educational Paths
• Playground
• Marking of trails
• Reforestation of parking lots
• Ban of motorized traffic
• Access by public transport
• Educational paths/activities
• New trails for sports
• Urban equipment
• Promoting public transport
• Marking of trails
• Points of interest (e.g. adventure park, ZOO, etc.)
• Entrance points
• Picnic area
• Sports infrastructure
• Bird-watching
• Surveillance
• Awareness rising tools
• Urban equipment
• Toilets and water access
• Points of interest (e.g. adventure park, etc.)
• New sports infrastructure
• Educational paths/activities
• Camping
• Festivals / events
• Extreme sports
• Improved maintenance
• Bann motorized traffic
• Marking of trails
• Points of interest (e.g. adventure park, downhill polygon, etc.)
• Educational paths/activities
• Playground
• Urban equipment
• Outdoor fitness equipment
• Improve surveillance
• Toilets and water access
• Urban equipment
• Toilets and water access
• Playgrounds
• Outdoor fitness equipment
• Marking of trails
• Events
• Sports infrastructure
• Picnic areas
• Improved maintenance
• Awareness raising
• Educational paths/activities
• New trails
• Urban equipment
• Toilets and water access
• Playgrounds
• Marking of trails
• Outdoor fitness equipment
• Educational paths/activities
Programme co-funded by the European Union (ERDF, IPA, ENI) page 14
14 URBforDAN Key Stakeholder Profiles
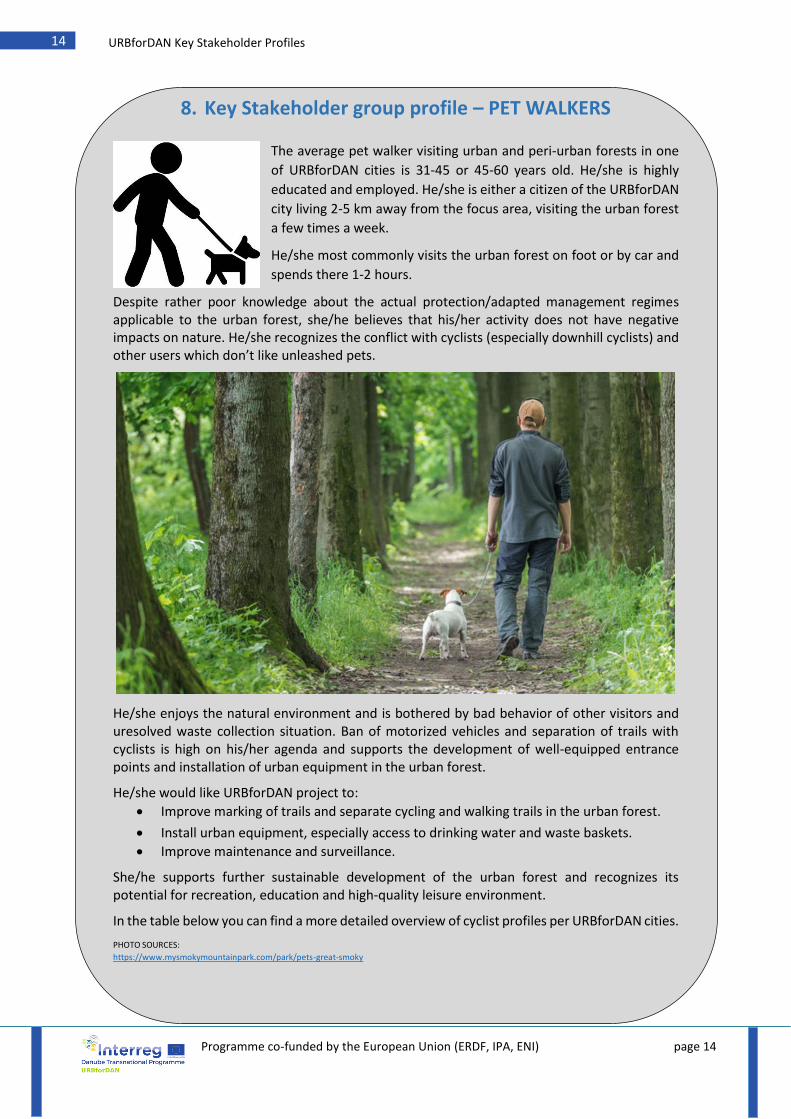
8. Key Stakeholder group profile – PET WALKERS
The average pet walker visiting urban and peri-urban forests in one
of URBforDAN cities is 31-45 or 45-60 years old. He/she is highly
educated and employed. He/she is either a citizen of the URBforDAN
city living 2-5 km away from the focus area, visiting the urban forest
a few times a week.
He/she most commonly visits the urban forest on foot or by car and
spends there 1-2 hours.
Despite rather poor knowledge about the actual protection/adapted management regimes applicable to the urban forest, she/he believes that his/her activity does not have negative impacts on nature. He/she recognizes the conflict with cyclists (especially downhill cyclists) and other users which don’t like unleashed pets.
He/she enjoys the natural environment and is bothered by bad behavior of other visitors and uresolved waste collection situation. Ban of motorized vehicles and separation of trails with cyclists is high on his/her agenda and supports the development of well-equipped entrance points and installation of urban equipment in the urban forest.
He/she would like URBforDAN project to:
• Improve marking of trails and separate cycling and walking trails in the urban forest.
• Install urban equipment, especially access to drinking water and waste baskets.
• Improve maintenance and surveillance.
She/he supports further sustainable development of the urban forest and recognizes its potential for recreation, education and high-quality leisure environment.
In the table below you can find a more detailed overview of cyclist profiles per URBforDAN cities.
PHOTO SOURCES:
https://www.mysmokymountainpark.com/park/pets-great-smoky
Programme co-funded by the European Union (ERDF, IPA, ENI) page 15
15 URBforDAN Key Stakeholder Profiles
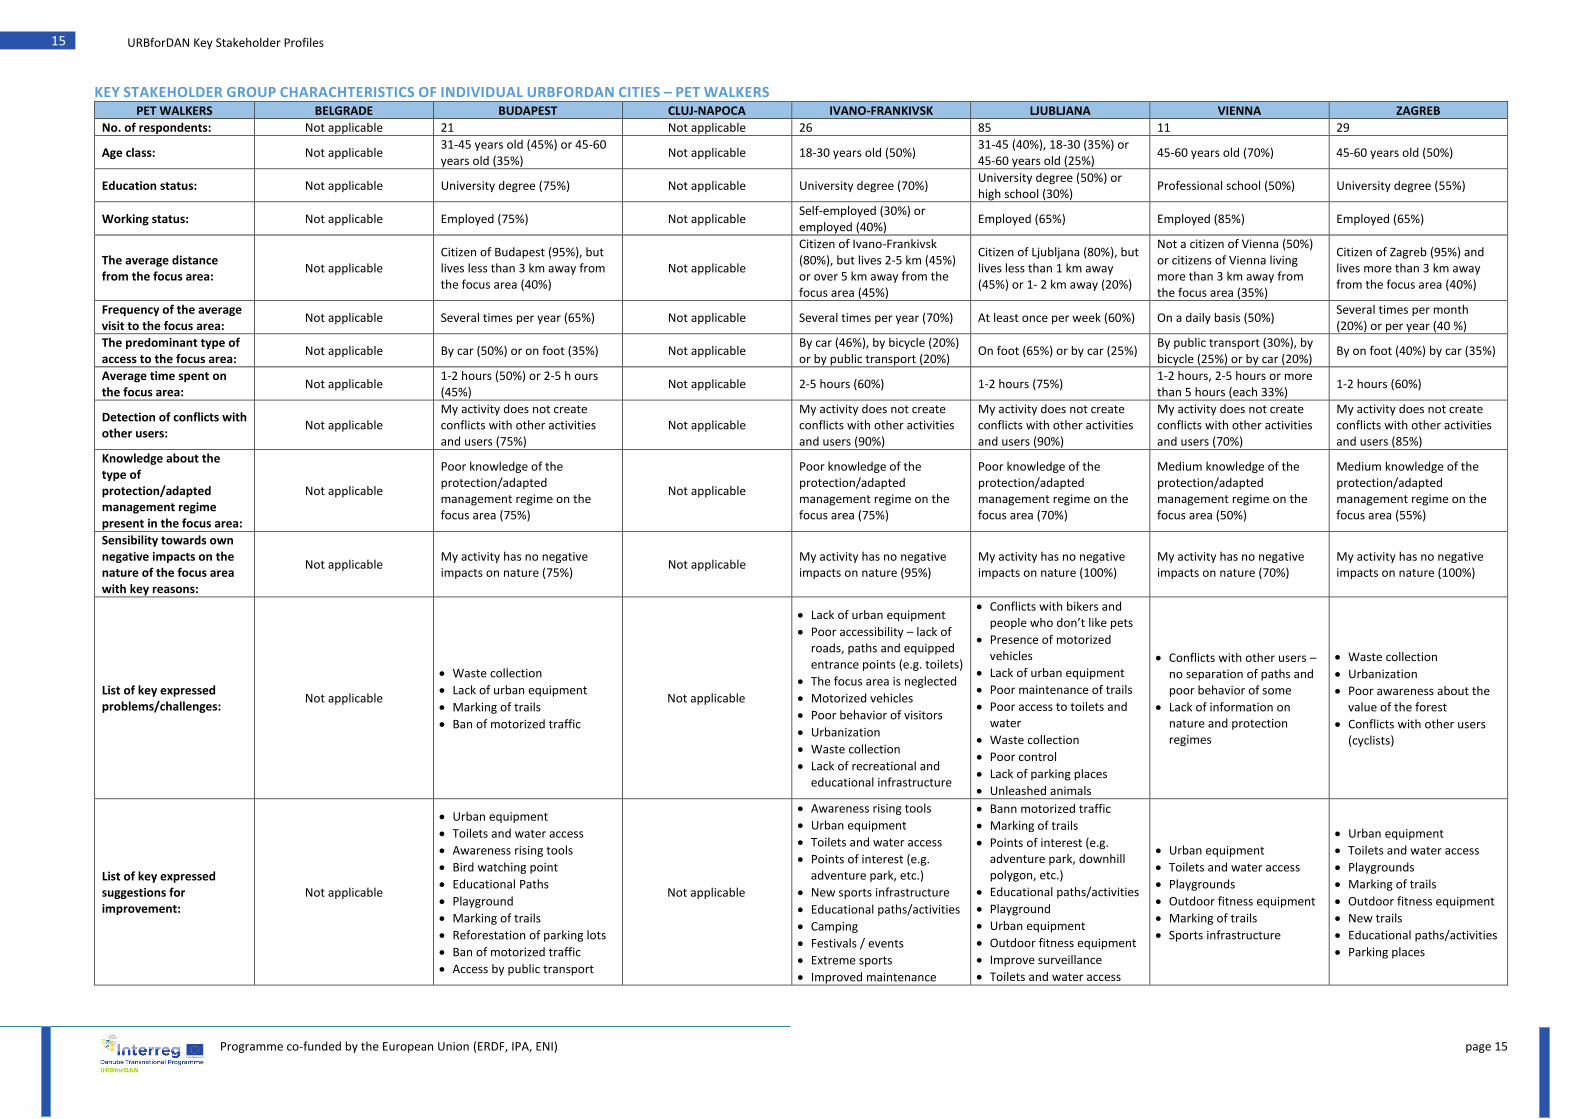
KEY STAKEHOLDER GROUP CHARACHTERISTICS OF INDIVIDUAL URBFORDAN CITIES – PET WALKERS PET WALKERS BELGRADE BUDAPEST CLUJ-NAPOCA IVANO-FRANKIVSK LJUBLJANA VIENNA ZAGREB
No. of respondents: Not applicable 21 Not applicable 26 85 11 29
Age class: Not applicable 31-45 years old (45%) or 45-60 years old (35%)
Not applicable 18-30 years old (50%) 31-45 (40%), 18-30 (35%) or 45-60 years old (25%)
45-60 years old (70%) 45-60 years old (50%)
Education status: Not applicable University degree (75%) Not applicable University degree (70%) University degree (50%) or high school (30%)
Professional school (50%) University degree (55%)
Working status: Not applicable Employed (75%) Not applicable Self-employed (30%) or employed (40%)
Employed (65%) Employed (85%) Employed (65%)
The average distance from the focus area:
Not applicable Citizen of Budapest (95%), but lives less than 3 km away from the focus area (40%)
Not applicable
Citizen of Ivano-Frankivsk (80%), but lives 2-5 km (45%) or over 5 km away from the focus area (45%)
Citizen of Ljubljana (80%), but lives less than 1 km away (45%) or 1- 2 km away (20%)
Not a citizen of Vienna (50%) or citizens of Vienna living more than 3 km away from the focus area (35%)
Citizen of Zagreb (95%) and lives more than 3 km away from the focus area (40%)
Frequency of the average visit to the focus area:
Not applicable Several times per year (65%) Not applicable Several times per year (70%) At least once per week (60%) On a daily basis (50%) Several times per month (20%) or per year (40 %)
The predominant type of access to the focus area:
Not applicable By car (50%) or on foot (35%) Not applicable By car (46%), by bicycle (20%) or by public transport (20%)
On foot (65%) or by car (25%) By public transport (30%), by bicycle (25%) or by car (20%)
By on foot (40%) by car (35%)
Average time spent on the focus area:
Not applicable 1-2 hours (50%) or 2-5 h ours (45%)
Not applicable 2-5 hours (60%) 1-2 hours (75%) 1-2 hours, 2-5 hours or more than 5 hours (each 33%)
1-2 hours (60%)
Detection of conflicts with other users:
Not applicable My activity does not create conflicts with other activities and users (75%)
Not applicable My activity does not create conflicts with other activities and users (90%)
My activity does not create conflicts with other activities and users (90%)
My activity does not create conflicts with other activities and users (70%)
My activity does not create conflicts with other activities and users (85%)
Knowledge about the type of protection/adapted management regime present in the focus area:
Not applicable
Poor knowledge of the protection/adapted management regime on the focus area (75%)
Not applicable
Poor knowledge of the protection/adapted management regime on the focus area (75%)
Poor knowledge of the protection/adapted management regime on the focus area (70%)
Medium knowledge of the protection/adapted management regime on the focus area (50%)
Medium knowledge of the protection/adapted management regime on the focus area (55%)
Sensibility towards own negative impacts on the nature of the focus area with key reasons:
Not applicable My activity has no negative impacts on nature (75%)
Not applicable My activity has no negative impacts on nature (95%)
My activity has no negative impacts on nature (100%)
My activity has no negative impacts on nature (70%)
My activity has no negative impacts on nature (100%)
List of key expressed problems/challenges:
Not applicable
• Waste collection
• Lack of urban equipment
• Marking of trails
• Ban of motorized traffic
Not applicable
• Lack of urban equipment
• Poor accessibility – lack of roads, paths and equipped entrance points (e.g. toilets)
• The focus area is neglected
• Motorized vehicles
• Poor behavior of visitors
• Urbanization
• Waste collection
• Lack of recreational and educational infrastructure
• Conflicts with bikers and people who don’t like pets
• Presence of motorized vehicles
• Lack of urban equipment
• Poor maintenance of trails
• Poor access to toilets and water
• Waste collection
• Poor control
• Lack of parking places
• Unleashed animals
• Conflicts with other users – no separation of paths and poor behavior of some
• Lack of information on nature and protection regimes
• Waste collection
• Urbanization
• Poor awareness about the value of the forest
• Conflicts with other users (cyclists)
List of key expressed suggestions for improvement:
Not applicable
• Urban equipment
• Toilets and water access
• Awareness rising tools
• Bird watching point
• Educational Paths
• Playground
• Marking of trails
• Reforestation of parking lots
• Ban of motorized traffic
• Access by public transport
Not applicable
• Awareness rising tools
• Urban equipment
• Toilets and water access
• Points of interest (e.g. adventure park, etc.)
• New sports infrastructure
• Educational paths/activities
• Camping
• Festivals / events
• Extreme sports
• Improved maintenance
• Bann motorized traffic
• Marking of trails
• Points of interest (e.g. adventure park, downhill polygon, etc.)
• Educational paths/activities
• Playground
• Urban equipment
• Outdoor fitness equipment
• Improve surveillance
• Toilets and water access
• Urban equipment
• Toilets and water access
• Playgrounds
• Outdoor fitness equipment
• Marking of trails
• Sports infrastructure
• Urban equipment
• Toilets and water access
• Playgrounds
• Marking of trails
• Outdoor fitness equipment
• New trails
• Educational paths/activities
• Parking places
Programme co-funded by the European Union (ERDF, IPA, ENI) page 16
16 URBforDAN Key Stakeholder Profiles
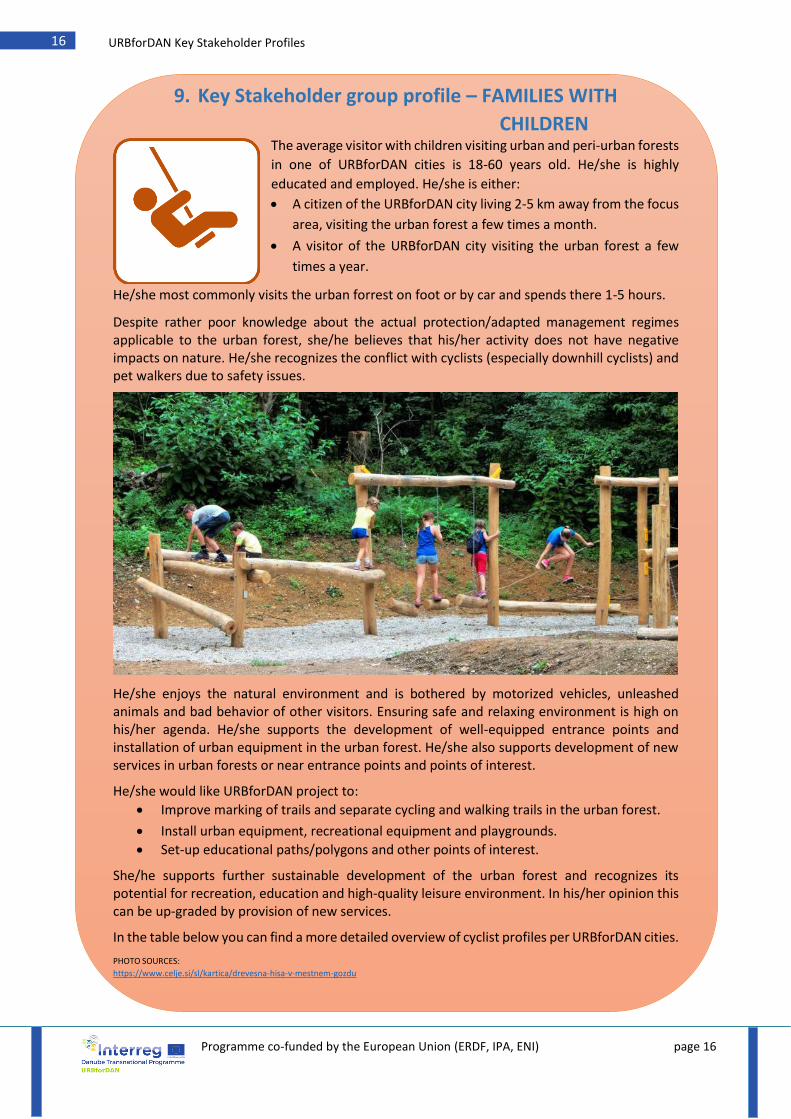
9. Key Stakeholder group profile – FAMILIES WITH
CHILDREN The average visitor with children visiting urban and peri-urban forests
in one of URBforDAN cities is 18-60 years old. He/she is highly
educated and employed. He/she is either:
• A citizen of the URBforDAN city living 2-5 km away from the focus
area, visiting the urban forest a few times a month.
• A visitor of the URBforDAN city visiting the urban forest a few
times a year.
He/she most commonly visits the urban forrest on foot or by car and spends there 1-5 hours.
Despite rather poor knowledge about the actual protection/adapted management regimes applicable to the urban forest, she/he believes that his/her activity does not have negative impacts on nature. He/she recognizes the conflict with cyclists (especially downhill cyclists) and pet walkers due to safety issues.
He/she enjoys the natural environment and is bothered by motorized vehicles, unleashed animals and bad behavior of other visitors. Ensuring safe and relaxing environment is high on his/her agenda. He/she supports the development of well-equipped entrance points and installation of urban equipment in the urban forest. He/she also supports development of new services in urban forests or near entrance points and points of interest.
He/she would like URBforDAN project to:
• Improve marking of trails and separate cycling and walking trails in the urban forest.
• Install urban equipment, recreational equipment and playgrounds.
• Set-up educational paths/polygons and other points of interest.
She/he supports further sustainable development of the urban forest and recognizes its potential for recreation, education and high-quality leisure environment. In his/her opinion this can be up-graded by provision of new services.
In the table below you can find a more detailed overview of cyclist profiles per URBforDAN cities.
PHOTO SOURCES:
https://www.celje.si/sl/kartica/drevesna-hisa-v-mestnem-gozdu
Programme co-funded by the European Union (ERDF, IPA, ENI) page 17
17 URBforDAN Key Stakeholder Profiles
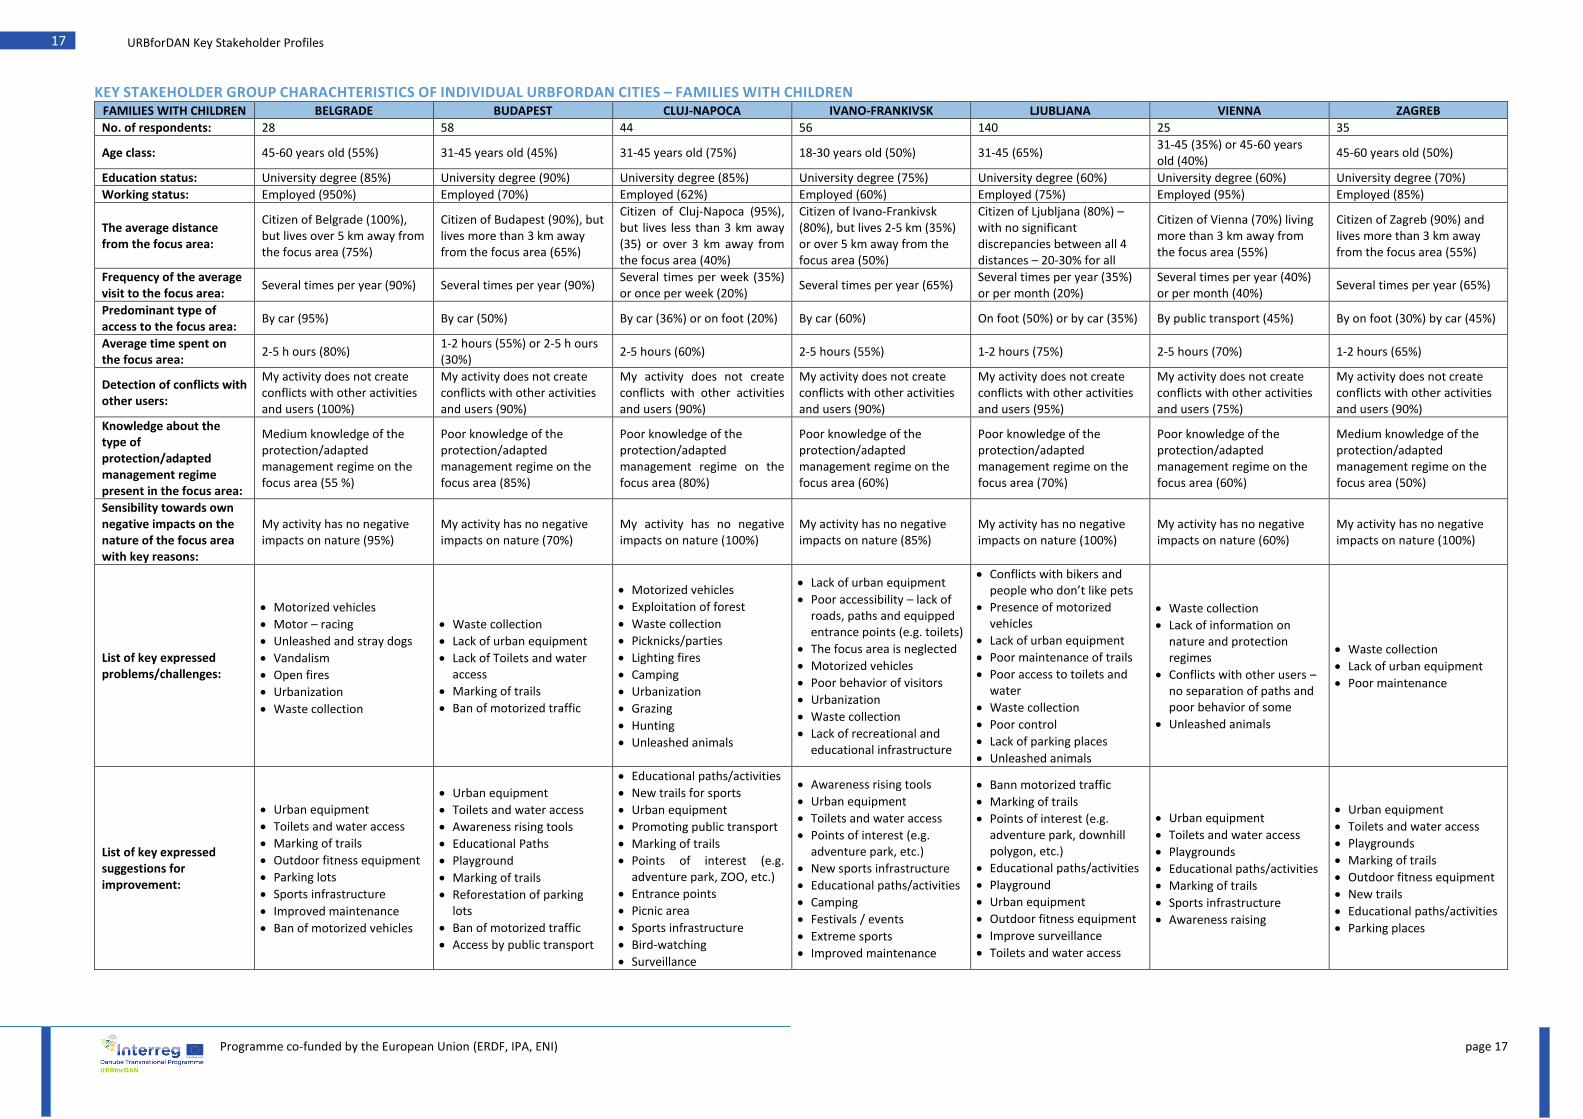
KEY STAKEHOLDER GROUP CHARACHTERISTICS OF INDIVIDUAL URBFORDAN CITIES – FAMILIES WITH CHILDREN FAMILIES WITH CHILDREN BELGRADE BUDAPEST CLUJ-NAPOCA IVANO-FRANKIVSK LJUBLJANA VIENNA ZAGREB
No. of respondents: 28 58 44 56 140 25 35
Age class: 45-60 years old (55%) 31-45 years old (45%) 31-45 years old (75%) 18-30 years old (50%) 31-45 (65%) 31-45 (35%) or 45-60 years old (40%)
45-60 years old (50%)
Education status: University degree (85%) University degree (90%) University degree (85%) University degree (75%) University degree (60%) University degree (60%) University degree (70%)
Working status: Employed (950%) Employed (70%) Employed (62%) Employed (60%) Employed (75%) Employed (95%) Employed (85%)
The average distance from the focus area:
Citizen of Belgrade (100%), but lives over 5 km away from the focus area (75%)
Citizen of Budapest (90%), but lives more than 3 km away from the focus area (65%)
Citizen of Cluj-Napoca (95%), but lives less than 3 km away (35) or over 3 km away from the focus area (40%)
Citizen of Ivano-Frankivsk (80%), but lives 2-5 km (35%) or over 5 km away from the focus area (50%)
Citizen of Ljubljana (80%) – with no significant discrepancies between all 4 distances – 20-30% for all
Citizen of Vienna (70%) living more than 3 km away from the focus area (55%)
Citizen of Zagreb (90%) and lives more than 3 km away from the focus area (55%)
Frequency of the average visit to the focus area:
Several times per year (90%) Several times per year (90%) Several times per week (35%) or once per week (20%)
Several times per year (65%) Several times per year (35%) or per month (20%)
Several times per year (40%) or per month (40%)
Several times per year (65%)
Predominant type of access to the focus area:
By car (95%) By car (50%) By car (36%) or on foot (20%) By car (60%) On foot (50%) or by car (35%) By public transport (45%) By on foot (30%) by car (45%)
Average time spent on the focus area:
2-5 h ours (80%) 1-2 hours (55%) or 2-5 h ours (30%)
2-5 hours (60%) 2-5 hours (55%) 1-2 hours (75%) 2-5 hours (70%) 1-2 hours (65%)
Detection of conflicts with other users:
My activity does not create conflicts with other activities and users (100%)
My activity does not create conflicts with other activities and users (90%)
My activity does not create conflicts with other activities and users (90%)
My activity does not create conflicts with other activities and users (90%)
My activity does not create conflicts with other activities and users (95%)
My activity does not create conflicts with other activities and users (75%)
My activity does not create conflicts with other activities and users (90%)
Knowledge about the type of protection/adapted management regime present in the focus area:
Medium knowledge of the protection/adapted management regime on the focus area (55 %)
Poor knowledge of the protection/adapted management regime on the focus area (85%)
Poor knowledge of the protection/adapted management regime on the focus area (80%)
Poor knowledge of the protection/adapted management regime on the focus area (60%)
Poor knowledge of the protection/adapted management regime on the focus area (70%)
Poor knowledge of the protection/adapted management regime on the focus area (60%)
Medium knowledge of the protection/adapted management regime on the focus area (50%)
Sensibility towards own negative impacts on the nature of the focus area with key reasons:
My activity has no negative impacts on nature (95%)
My activity has no negative impacts on nature (70%)
My activity has no negative impacts on nature (100%)
My activity has no negative impacts on nature (85%)
My activity has no negative impacts on nature (100%)
My activity has no negative impacts on nature (60%)
My activity has no negative impacts on nature (100%)
List of key expressed problems/challenges:
• Motorized vehicles
• Motor – racing
• Unleashed and stray dogs
• Vandalism
• Open fires
• Urbanization
• Waste collection
• Waste collection
• Lack of urban equipment
• Lack of Toilets and water access
• Marking of trails
• Ban of motorized traffic
• Motorized vehicles
• Exploitation of forest
• Waste collection
• Picknicks/parties
• Lighting fires
• Camping
• Urbanization
• Grazing
• Hunting
• Unleashed animals
• Lack of urban equipment
• Poor accessibility – lack of roads, paths and equipped entrance points (e.g. toilets)
• The focus area is neglected
• Motorized vehicles
• Poor behavior of visitors
• Urbanization
• Waste collection
• Lack of recreational and educational infrastructure
• Conflicts with bikers and people who don’t like pets
• Presence of motorized vehicles
• Lack of urban equipment
• Poor maintenance of trails
• Poor access to toilets and water
• Waste collection
• Poor control
• Lack of parking places
• Unleashed animals
• Waste collection
• Lack of information on nature and protection regimes
• Conflicts with other users – no separation of paths and poor behavior of some
• Unleashed animals
• Waste collection
• Lack of urban equipment
• Poor maintenance
List of key expressed suggestions for improvement:
• Urban equipment
• Toilets and water access
• Marking of trails
• Outdoor fitness equipment
• Parking lots
• Sports infrastructure
• Improved maintenance
• Ban of motorized vehicles
• Urban equipment
• Toilets and water access
• Awareness rising tools
• Educational Paths
• Playground
• Marking of trails
• Reforestation of parking lots
• Ban of motorized traffic
• Access by public transport
• Educational paths/activities
• New trails for sports
• Urban equipment
• Promoting public transport
• Marking of trails
• Points of interest (e.g. adventure park, ZOO, etc.)
• Entrance points
• Picnic area
• Sports infrastructure
• Bird-watching
• Surveillance
• Awareness rising tools
• Urban equipment
• Toilets and water access
• Points of interest (e.g. adventure park, etc.)
• New sports infrastructure
• Educational paths/activities
• Camping
• Festivals / events
• Extreme sports
• Improved maintenance
• Bann motorized traffic
• Marking of trails
• Points of interest (e.g. adventure park, downhill polygon, etc.)
• Educational paths/activities
• Playground
• Urban equipment
• Outdoor fitness equipment
• Improve surveillance
• Toilets and water access
• Urban equipment
• Toilets and water access
• Playgrounds
• Educational paths/activities
• Marking of trails
• Sports infrastructure
• Awareness raising
• Urban equipment
• Toilets and water access
• Playgrounds
• Marking of trails
• Outdoor fitness equipment
• New trails
• Educational paths/activities
• Parking places
Programme co-funded by the European Union (ERDF, IPA, ENI) page 18
18 URBforDAN Key Stakeholder Profiles
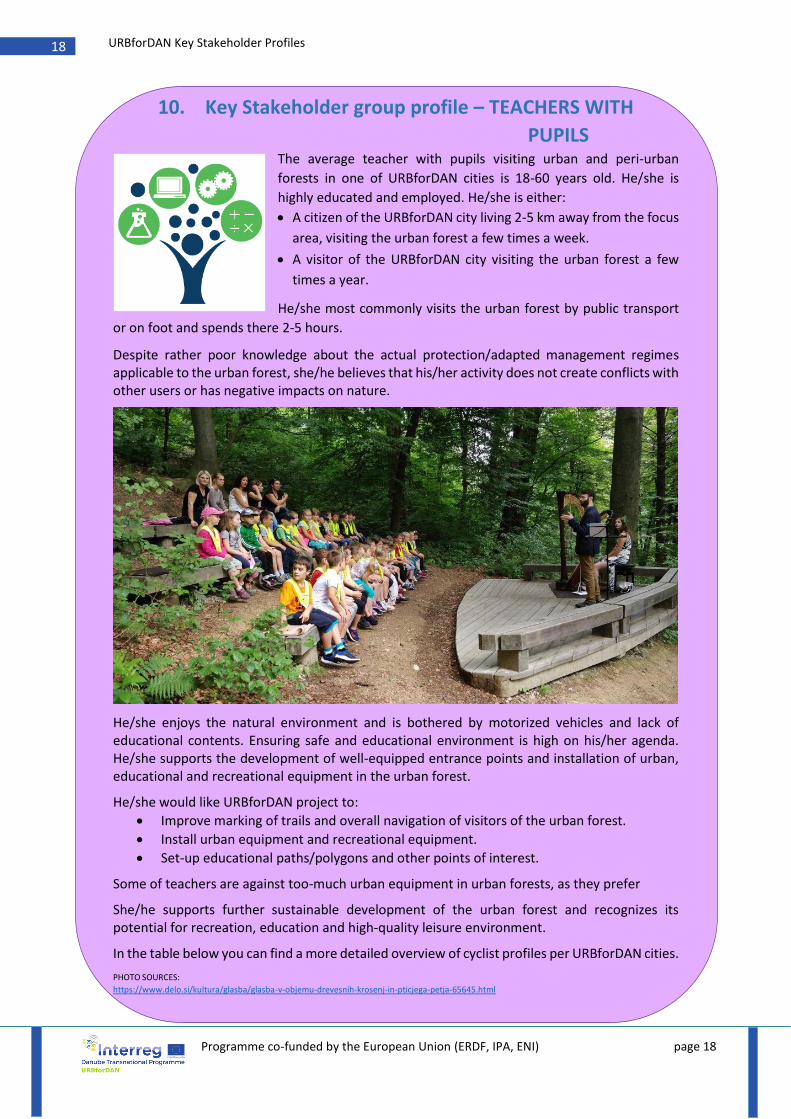
10. Key Stakeholder group profile – TEACHERS WITH
PUPILS The average teacher with pupils visiting urban and peri-urban
forests in one of URBforDAN cities is 18-60 years old. He/she is
highly educated and employed. He/she is either:
• A citizen of the URBforDAN city living 2-5 km away from the focus
area, visiting the urban forest a few times a week.
• A visitor of the URBforDAN city visiting the urban forest a few
times a year.
He/she most commonly visits the urban forest by public transport
or on foot and spends there 2-5 hours.
Despite rather poor knowledge about the actual protection/adapted management regimes applicable to the urban forest, she/he believes that his/her activity does not create conflicts with other users or has negative impacts on nature.
He/she enjoys the natural environment and is bothered by motorized vehicles and lack of educational contents. Ensuring safe and educational environment is high on his/her agenda. He/she supports the development of well-equipped entrance points and installation of urban, educational and recreational equipment in the urban forest.
He/she would like URBforDAN project to:
• Improve marking of trails and overall navigation of visitors of the urban forest.
• Install urban equipment and recreational equipment.
• Set-up educational paths/polygons and other points of interest.
Some of teachers are against too-much urban equipment in urban forests, as they prefer
She/he supports further sustainable development of the urban forest and recognizes its potential for recreation, education and high-quality leisure environment.
In the table below you can find a more detailed overview of cyclist profiles per URBforDAN cities.
PHOTO SOURCES:
https://www.delo.si/kultura/glasba/glasba-v-objemu-drevesnih-krosenj-in-pticjega-petja-65645.html
Programme co-funded by the European Union (ERDF, IPA, ENI) page 19
19 URBforDAN Key Stakeholder Profiles
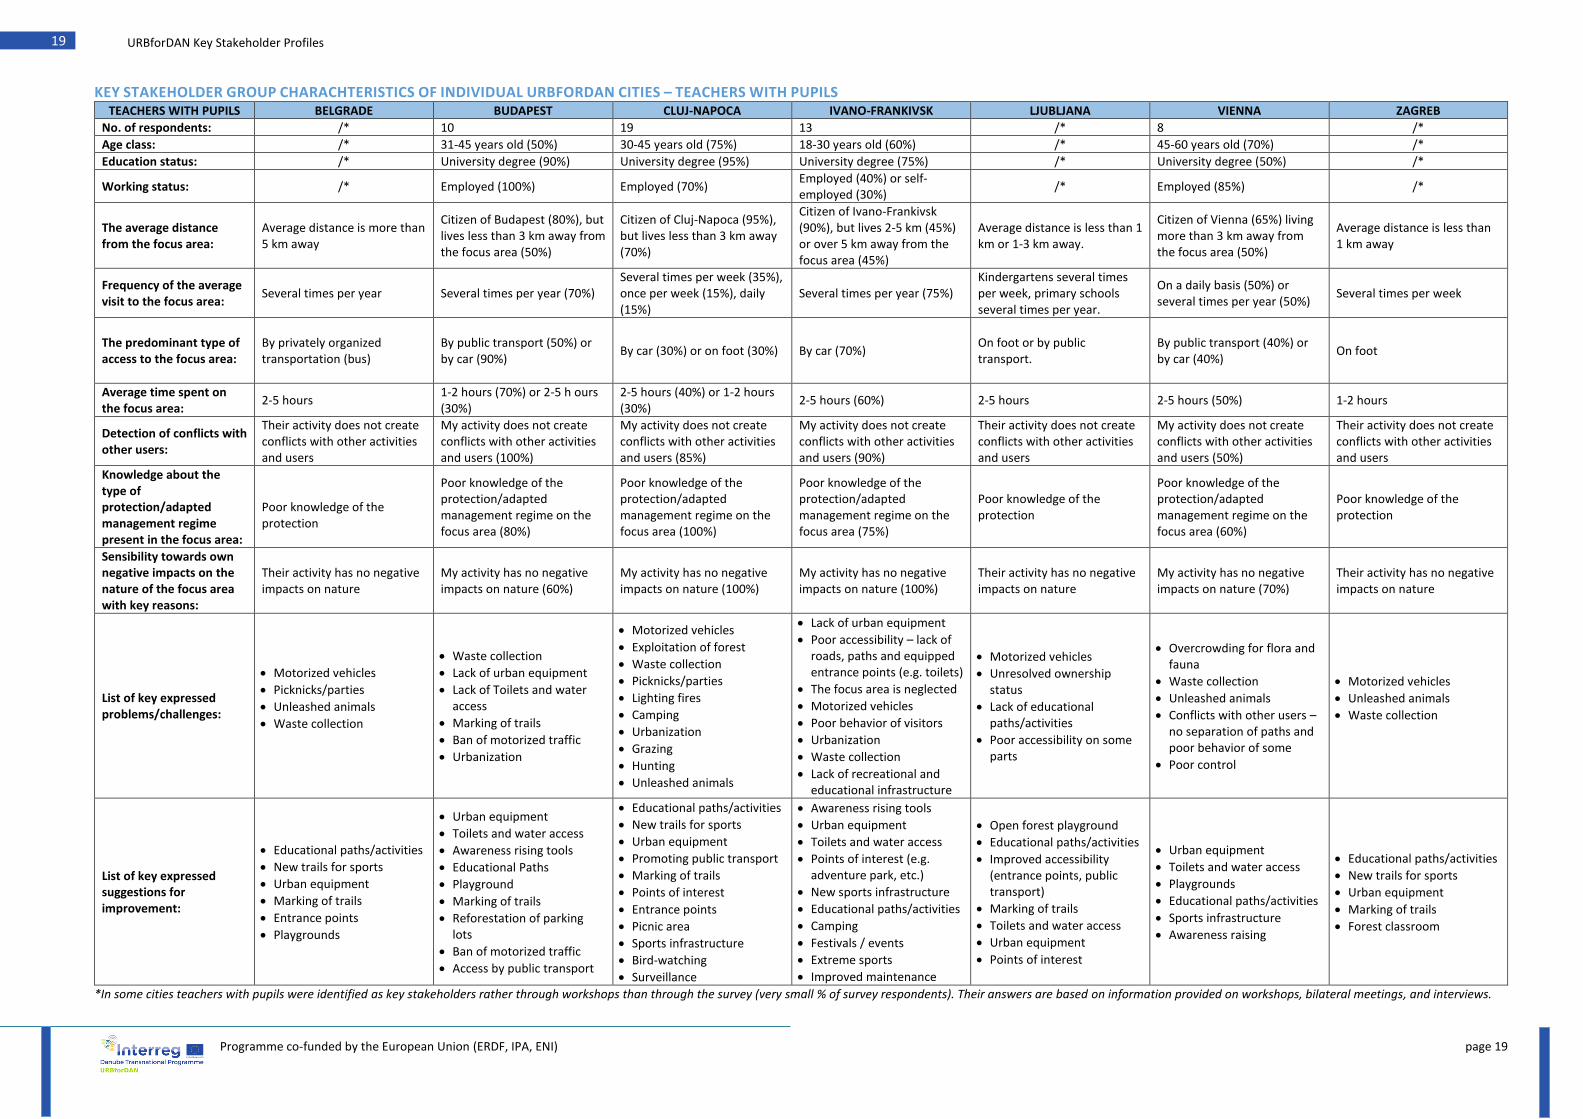
KEY STAKEHOLDER GROUP CHARACHTERISTICS OF INDIVIDUAL URBFORDAN CITIES – TEACHERS WITH PUPILS TEACHERS WITH PUPILS BELGRADE BUDAPEST CLUJ-NAPOCA IVANO-FRANKIVSK LJUBLJANA VIENNA ZAGREB
No. of respondents: /* 10 19 13 /* 8 /*
Age class: /* 31-45 years old (50%) 30-45 years old (75%) 18-30 years old (60%) /* 45-60 years old (70%) /*
Education status: /* University degree (90%) University degree (95%) University degree (75%) /* University degree (50%) /*
Working status: /* Employed (100%) Employed (70%) Employed (40%) or self-employed (30%)
/* Employed (85%) /*
The average distance from the focus area:
Average distance is more than 5 km away
Citizen of Budapest (80%), but lives less than 3 km away from the focus area (50%)
Citizen of Cluj-Napoca (95%), but lives less than 3 km away (70%)
Citizen of Ivano-Frankivsk (90%), but lives 2-5 km (45%) or over 5 km away from the focus area (45%)
Average distance is less than 1 km or 1-3 km away.
Citizen of Vienna (65%) living more than 3 km away from the focus area (50%)
Average distance is less than 1 km away
Frequency of the average visit to the focus area:
Several times per year Several times per year (70%) Several times per week (35%), once per week (15%), daily (15%)
Several times per year (75%) Kindergartens several times per week, primary schools several times per year.
On a daily basis (50%) or several times per year (50%)
Several times per week
The predominant type of access to the focus area:
By privately organized transportation (bus)
By public transport (50%) or by car (90%)
By car (30%) or on foot (30%) By car (70%) On foot or by public transport.
By public transport (40%) or by car (40%)
On foot
Average time spent on the focus area:
2-5 hours 1-2 hours (70%) or 2-5 h ours (30%)
2-5 hours (40%) or 1-2 hours (30%)
2-5 hours (60%) 2-5 hours 2-5 hours (50%) 1-2 hours
Detection of conflicts with other users:
Their activity does not create conflicts with other activities and users
My activity does not create conflicts with other activities and users (100%)
My activity does not create conflicts with other activities and users (85%)
My activity does not create conflicts with other activities and users (90%)
Their activity does not create conflicts with other activities and users
My activity does not create conflicts with other activities and users (50%)
Their activity does not create conflicts with other activities and users
Knowledge about the type of protection/adapted management regime present in the focus area:
Poor knowledge of the protection
Poor knowledge of the protection/adapted management regime on the focus area (80%)
Poor knowledge of the protection/adapted management regime on the focus area (100%)
Poor knowledge of the protection/adapted management regime on the focus area (75%)
Poor knowledge of the protection
Poor knowledge of the protection/adapted management regime on the focus area (60%)
Poor knowledge of the protection
Sensibility towards own negative impacts on the nature of the focus area with key reasons:
Their activity has no negative impacts on nature
My activity has no negative impacts on nature (60%)
My activity has no negative impacts on nature (100%)
My activity has no negative impacts on nature (100%)
Their activity has no negative impacts on nature
My activity has no negative impacts on nature (70%)
Their activity has no negative impacts on nature
List of key expressed problems/challenges:
• Motorized vehicles
• Picknicks/parties
• Unleashed animals
• Waste collection
• Waste collection
• Lack of urban equipment
• Lack of Toilets and water access
• Marking of trails
• Ban of motorized traffic
• Urbanization
• Motorized vehicles
• Exploitation of forest
• Waste collection
• Picknicks/parties
• Lighting fires
• Camping
• Urbanization
• Grazing
• Hunting
• Unleashed animals
• Lack of urban equipment
• Poor accessibility – lack of roads, paths and equipped entrance points (e.g. toilets)
• The focus area is neglected
• Motorized vehicles
• Poor behavior of visitors
• Urbanization
• Waste collection
• Lack of recreational and educational infrastructure
• Motorized vehicles
• Unresolved ownership status
• Lack of educational paths/activities
• Poor accessibility on some parts
• Overcrowding for flora and fauna
• Waste collection
• Unleashed animals
• Conflicts with other users – no separation of paths and poor behavior of some
• Poor control
• Motorized vehicles
• Unleashed animals
• Waste collection
List of key expressed suggestions for improvement:
• Educational paths/activities
• New trails for sports
• Urban equipment
• Marking of trails
• Entrance points
• Playgrounds
• Urban equipment
• Toilets and water access
• Awareness rising tools
• Educational Paths
• Playground
• Marking of trails
• Reforestation of parking lots
• Ban of motorized traffic
• Access by public transport
• Educational paths/activities
• New trails for sports
• Urban equipment
• Promoting public transport
• Marking of trails
• Points of interest
• Entrance points
• Picnic area
• Sports infrastructure
• Bird-watching
• Surveillance
• Awareness rising tools
• Urban equipment
• Toilets and water access
• Points of interest (e.g. adventure park, etc.)
• New sports infrastructure
• Educational paths/activities
• Camping
• Festivals / events
• Extreme sports
• Improved maintenance
• Open forest playground
• Educational paths/activities
• Improved accessibility (entrance points, public transport)
• Marking of trails
• Toilets and water access
• Urban equipment
• Points of interest
• Urban equipment
• Toilets and water access
• Playgrounds
• Educational paths/activities
• Sports infrastructure
• Awareness raising
• Educational paths/activities
• New trails for sports
• Urban equipment
• Marking of trails
• Forest classroom
*In some cities teachers with pupils were identified as key stakeholders rather through workshops than through the survey (very small % of survey respondents). Their answers are based on information provided on workshops, bilateral meetings, and interviews.
Programme co-funded by the European Union (ERDF, IPA, ENI) page 20
20 URBforDAN Key Stakeholder Profiles
11. Conclusions Project cities were free to decide amongst various approaches how to implement the survey – for example on-site questioners, on-line survey, questioners sent by mail, questioners filed out by workshop participants, etc. Almost all cities decided to conduct a combination of at least 2 methods in order to get better response. Two combinations were most common – on-site & on-workshop questioners and on-line survey & on-workshop questioners.
While on-workshop questionnaires were usually well responded to, other two methods were conducted with mixed results. As surveys were carried out from October 2018 to January 2019 – not an ideal time to carry out on-site surveys, as many of stakeholders were no-longer present in urban forest. This resulted in a rather low number of respondents in those cities which opted for on-site survey approach. On the other hand, on-line surveys proved to be a much more successful approach, in case of Ljubljana leading to an unexpectedly high response.
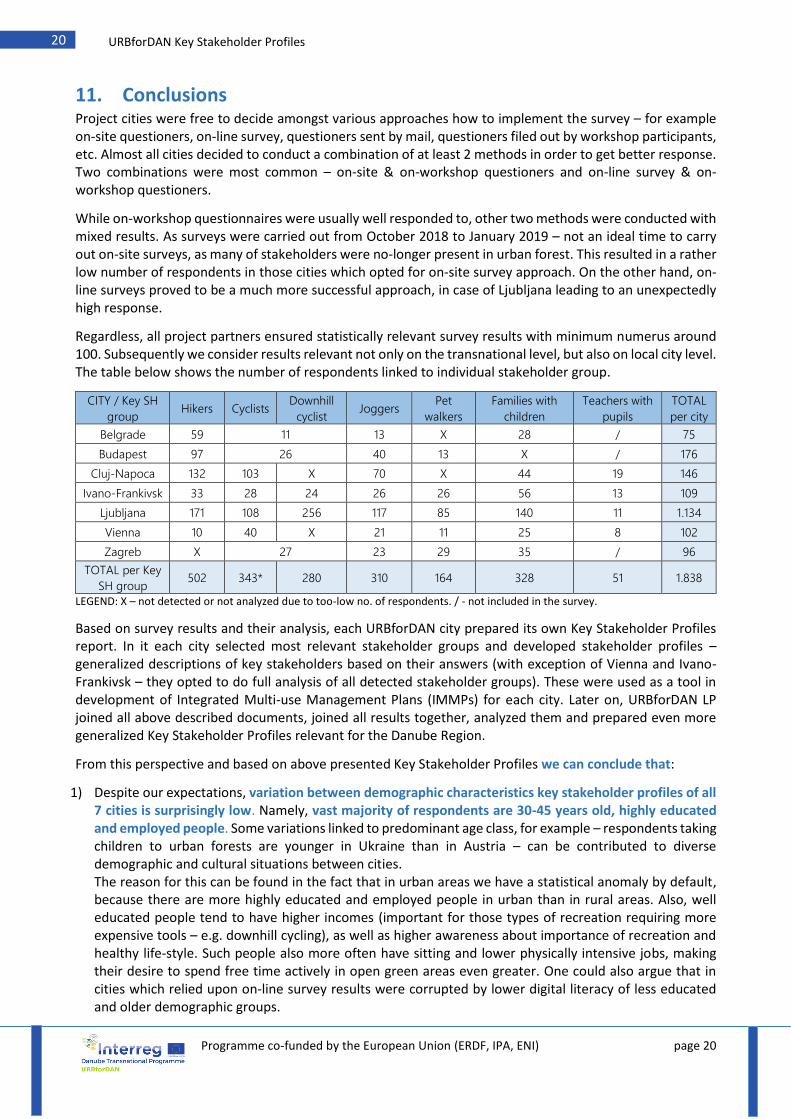
Regardless, all project partners ensured statistically relevant survey results with minimum numerus around 100. Subsequently we consider results relevant not only on the transnational level, but also on local city level. The table below shows the number of respondents linked to individual stakeholder group.
CITY / Key SH
group Hikers Cyclists
Downhill
cyclist Joggers
Pet
walkers
Families with
children
Teachers with
pupils
TOTAL
per city
Belgrade 59 11 13 X 28 / 75
Budapest 97 26 40 13 X / 176
Cluj-Napoca 132 103 X 70 X 44 19 146
Ivano-Frankivsk 33 28 24 26 26 56 13 109
Ljubljana 171 108 256 117 85 140 11 1.134
Vienna 10 40 X 21 11 25 8 102
Zagreb X 27 23 29 35 / 96
TOTAL per Key
SH group 502 343* 280 310 164 328 51 1.838
LEGEND: X – not detected or not analyzed due to too-low no. of respondents. / - not included in the survey.
Based on survey results and their analysis, each URBforDAN city prepared its own Key Stakeholder Profiles report. In it each city selected most relevant stakeholder groups and developed stakeholder profiles – generalized descriptions of key stakeholders based on their answers (with exception of Vienna and Ivano-Frankivsk – they opted to do full analysis of all detected stakeholder groups). These were used as a tool in development of Integrated Multi-use Management Plans (IMMPs) for each city. Later on, URBforDAN LP joined all above described documents, joined all results together, analyzed them and prepared even more generalized Key Stakeholder Profiles relevant for the Danube Region.
From this perspective and based on above presented Key Stakeholder Profiles we can conclude that:
1) Despite our expectations, variation between demographic characteristics key stakeholder profiles of all 7 cities is surprisingly low. Namely, vast majority of respondents are 30-45 years old, highly educated and employed people. Some variations linked to predominant age class, for example – respondents taking children to urban forests are younger in Ukraine than in Austria – can be contributed to diverse demographic and cultural situations between cities. The reason for this can be found in the fact that in urban areas we have a statistical anomaly by default, because there are more highly educated and employed people in urban than in rural areas. Also, well educated people tend to have higher incomes (important for those types of recreation requiring more expensive tools – e.g. downhill cycling), as well as higher awareness about importance of recreation and healthy life-style. Such people also more often have sitting and lower physically intensive jobs, making their desire to spend free time actively in open green areas even greater. One could also argue that in cities which relied upon on-line survey results were corrupted by lower digital literacy of less educated and older demographic groups.
Programme co-funded by the European Union (ERDF, IPA, ENI) page 21
21 URBforDAN Key Stakeholder Profiles
But all stated does not mean that other demographic groups do not use urban forests – they are just represented in smaller percentage. Also, urban and peri-urban forests in some cities today still present rather unexplored terrains and are not as popular as in Ljubljana or Vienna – yet! This might quickly change through promotion and popularization of recreation in urban forests, as well as with improved urban/recreational/educational equipment, new attractions and services and improved maintenance.
2) Almost all URBforDAN cities selected hikers, cyclist, joggers, pet walkers, families with children and teachers with pupils as most important types of users of urban forests. Of course, each city has different type of urban or peri-urban forest that attracts different types of users. However, stated types of users represent most common and numerous types.
3) The distance between location of living and urban forest is not a limiting factor for users of urban and peri-urban forests as, in almost all cities and almost all key stakeholder profiles, users seem to travel with ease up to 5 km several times a week or a month. On the other hand, vast majority of urban and peri-urban forests is also visited by visitors living outside the city or in its outskirts, of course in lower intensity, but still several times a year.
4) In cities with good public transport access to urban and peri-urban forests, this option of access is often exploited, while request for improvement of public transport are common in those cities without it. For citizens living closer to focus areas access on foot or by bicycle is the preferred option, however more distanced visitors and specific users (e.g. families with children, downhill cyclists, etc.) are still relying on access by car. This is resulting in increasing need for parking spaces near entrance points, subsequently adding pressure on urban and peri-urban forests.
5) Vast majority of users spends 1-2 or 2-5 hours in urban forests. This is important information for URBforDAN cities, as they plan to equip pilot areas with appropriate urban equipment.
6) Surprisingly high number of users knows very little about characteristics and nature protection/management regimes of focus areas they are visiting. This is also recognized by themselves (to an extent), as almost all users are asking for more educational and awareness rising contents.
7) Also, surprisingly high number of users recognizes their own activities as problematic from nature protection and conflict creation point of view. Or in other words – vast majority of UPF users believes that they create very little pressure on nature and are not responsible for conflicts between various user groups or with managers and/or owners. On the other hand, they are able to recognize most common conflicts and actually complain about them. However, conflicts are usually corelated with improper behavior of few representatives of various user types, rather than with behavior patterns of selected user groups. This is also why vast majority supports introduction of “code of behavior” for all users, as well as separation of cyclist and walking trails and improved marking of trails.
8) Expectations towards URBforDAN projects are quite high and diverse – but still in line with predominant needs of individual key stakeholder profiles. Of course, exposed challenges and needs are closely interlinked with specific characteristics of the individual focus area. However, they are again quite universal when it comes to specific user types.
Based on all above findings we can conclude that performed “in-depth” stakeholder analysis provided high-quality understanding of key stakeholder groups, as well as mobilized them for active participation in URBforDAN project. All findings can and will be easily used in the process of preparation of Integrated Multi-use Management Plans (IMMPs) and are expected to be vital for adaptation of final solutions to the actual needs of key UPF user types in URBforDAN cities.
Programme co-funded by the European Union (ERDF, IPA, ENI) page 22
22 URBforDAN Key Stakeholder Profiles
12. Lessons learned Activities of the URBforDAN project linked to identification, analysis and mobilization of key stakeholders occupied the URBforDAN partnership in first 2 reporting periods. Time invested in these activities proved to be well spent, as all project partners recognized its value for further steps. However, activities proved our expectations that this is a “learning by doing” project. This is why in this chapter we want to emphasize lessons learned, thus contributing to documented learning interaction process, which is embedded in the core of the URBforDAN project.
Key lessons learned are:
1) The winter period is not the best time to conduct on-site surveys, as many UPF user groups are not present in the area.
2) On the other hand, on-line surveys proved to be a very successful tool, but it is imperative that they are well publicized and announced/promoted on several channels – in Ljubljana we used workshops, official web-page, local media and social media as key communication channels.
3) Workshops also proved to be extremely successful communication and mobilization tool, especially if they are announced and implemented as an interconnected series. They also enabled us to test and verify conclusions from the survey analysis, significantly improving the relevance of provided answers.
4) It is smart to use the same questioner for all cites, as this enables us to compare results and draw conclusions on regional level. However, some flexibility (in the form of allowed additional questions or deleting non-relevant ones) must be allowed. This allows cities to obtain specific information on their pilot sites and does not hinter joint efforts of the partnership.
5) On the other hand, this makes already broad or long questionnaires (questioner had to be very broad, as we didn’t know what types of stakeholders we will identify) even longer and makes them less attractive to respondents, for example – in Ljubljana over 1.700 respondents started answering the survey, but only little over 1.100 answered all questions. Also, some questions were not well defined or specific enough, subsequently some answers (usually the ones where respondents had to provide own ideas) were not well understood and we got back similar answers. This means that any time spent on design of questions is well spent time.
6) Questioners must be always translated in local languages.
7) The majority of project partners underestimated the time and effort needed to carry out and analyze such a survey. In combination with preferred on-site questionnaire apporoach this resulted in lower number of respondents and prolonged period of the survey, as well as additional interviews and meetings with representatives of key stakeholder groups.
8) The method of analysis of questions is just as important as pre-agreement on the content and used approach of questioners. One of the problems we faced was the methodological misunderstanding which respondents to take into analysis of individual stakeholder groups – for example, all respondents had to select their primary reason for visiting UPF, but were of course allowed to also select secondary, third, etc. reason. During overall partnership analysis we noticed that some cities draw their conclusions from selection no. 1 (this was anticipated), while others draw conclusions from all respondents marking certain activity, regardless of the chosen priority. This situation was most common for those cities with lower number of respondents, which is to some point understandable, as they wanted to get best possible info from available data. But in reality, this actually contributed to unified answers from all key stakeholder groups – reducing diversity of opinions from various key stakeholder groups.
9) Despite all efforts from the lead partner, some project partners realized the value of the survey only after it was already finalized. This brings out questions of in-depth understanding of the project from all project partners and ownership of the project idea. This can be to some extent contributed to slow process of hiring of staff responsible for project implementation and their rather late involvement in initial activities (not the same people were involved in project development and its implementation). It

Programme co-funded by the European Union (ERDF, IPA, ENI) page 23
23 URBforDAN Key Stakeholder Profiles
can also be contributed to overall lower lever of experience in previous use of such tools or skepticism about its success.
10) However, as already said, URBforDAN is to a great extent “learning by doing” project. All previous lessons learned enabled project partnership to improve the understanding of the project and learn from them. Communication between partners was improved, overall understanding of the project concept and subsequently its ownership was greatly improved and we expect this to be visible from following deliverables and outputs.


![Stakeholder Mapping.ppt [Kompatibilitätsmodus] - EURAMET](https://img.dokumen.tips/doc/110x75/631f44fb85e2495e15104cb0/stakeholder-mappingppt-kompatibilitaetsmodus-euramet.jpg)


