Embed Size (px)
Citation preview

1 23
European Journal of AppliedPhysiology ISSN 1439-6319 Eur J Appl PhysiolDOI 10.1007/s00421-015-3165-1
Evaluation of force–velocity and power–velocity relationship of arm muscles
Sreten Sreckovic, Ivan Cuk, Sasa Djuric,Aleksandar Nedeljkovic, Dragan Mirkov& Slobodan Jaric

1 23
Your article is protected by copyright and
all rights are held exclusively by Springer-
Verlag Berlin Heidelberg. This e-offprint is
for personal use only and shall not be self-
archived in electronic repositories. If you wish
to self-archive your article, please use the
accepted manuscript version for posting on
your own website. You may further deposit
the accepted manuscript version in any
repository, provided it is only made publicly
available 12 months after official publication
or later and provided acknowledgement is
given to the original source of publication
and a link is inserted to the published article
on Springer's website. The link must be
accompanied by the following text: "The final
publication is available at link.springer.com”.
1 3
Eur J Appl PhysiolDOI 10.1007/s00421-015-3165-1
ORIGINAL ARTICLE
Evaluation of force–velocity and power–velocity relationship of arm muscles
Sreten Sreckovic1 · Ivan Cuk1 · Sasa Djuric1 · Aleksandar Nedeljkovic1 · Dragan Mirkov1 · Slobodan Jaric2,3
Received: 4 November 2014 / Accepted: 25 March 2015 © Springer-Verlag Berlin Heidelberg 2015
obtained from the linear F–V regressions proved to be mainly high (ICC > 0.80), while their concurrent valid-ity regarding directly measured F, P, and V ranged from high (for maximum F) to medium-to-low (for maximum P and V).Conclusions The findings add to the evidence that the lin-ear F–V and, consequently, parabolic P–V models could be used to study the mechanical properties of muscular sys-tems, as well as to design a relatively simple, reliable, and ecologically valid routine test of the muscle ability of force, power, and velocity production.
Keywords Regression · Bench press throw · Strength · Reliability · Validity · Testing
AbbreviationsA Slope of linear F–V regressionCV % Coefficient of variationF ForceF0 Force intercept obtained from linear F–V
regressionICC Intraclass correlation coefficientP PowerPmax Maximum power obtained from medicine ball
throwP0 Maximum power obtained from linear F–V
regressionSEM Standard error of measurementV VelocityVmax Maximum velocity obtained from medicine ball
throwV0 Velocity intercept obtained from linear F–V
regression1RM One repetition maximum bench press95 % CI 95 % confidence interval
Abstract Purpose A number of recent studies have revealed an approximately linear force–velocity (F–V) and, conse-quently, a parabolic power–velocity (P–V) relationship of multi-joint tasks. However, the measurement characteristics of their parameters have been neglected, particularly those regarding arm muscles, which could be a problem for using the linear F–V model in both research and routine testing. Therefore, the aims of the present study were to evaluate the strength, shape, reliability, and concurrent validity of the F–V relationship of arm muscles.Methods Twelve healthy participants performed maxi-mum bench press throws against loads ranging from 20 to 70 % of their maximum strength, and linear regression model was applied on the obtained range of F and V data. One-repetition maximum bench press and medicine ball throw tests were also conducted.Results The observed individual F–V relation-ships were exceptionally strong (r = 0.96–0.99; all P < 0.05) and fairly linear, although it remains unre-solved whether a polynomial fit could provide even stronger relationships. The reliability of parameters
Communicated by William J. Kraemer.
* Slobodan Jaric [email protected]
1 The Research Center, Faculty of Sports and Physical Education, University of Belgrade, Belgrade, Serbia
2 Department of Kinesiology and Applied Physiology, University of Delaware, 541 South College Avenue, Newark, DE 19716, USA
3 Biomechanics and Movement Science Graduate Program, University of Delaware, Newark, USA
Author's personal copy

Eur J Appl Physiol
1 3
Introduction
Among the most important properties are arguably the dependence of muscle force (F) and the power (P) on the velocity (V) of either muscle shortening or gross body movements (McMahon 1984). These properties have been typically referred to as the force–velocity (F–V) and power–velocity (P–V) relationship. Note that since P is a product of F and V, the pattern of the observed F–V relationship directly determines the pattern of the P–V relationship.
Since the seminal studies conducted during the first half of the previous century, it has been known that F of individual muscles and muscle groups decreases with V in a non-linear (i.e., approximately hyperbolic) fashion (Hill 1938; Wilkie 1950; Fenn and Marsh 1935). The hyperbolic F–V relationship inevitably reveals a com-plex P–V relationship where external load has to be well below 50 % of maximum F to maximize muscle power. These relationships have been routinely presented in standard textbooks of biomechanics, muscle physiol-ogy, or motor control [c.f., (McMahon 1984)]. However, more recent studies have suggested that the F–V relation-ship of maximum performance multi-joint tasks could be approximately linear, such as when obtained from leg extensions where leg muscles act through closed kinetic chains (Samozino et al. 2012, 2014b; Yamauchi et al. 2009), cycling (Driss and Vandewalle 2013; Nikolaidis 2012; Ravier et al. 2004), vertical jumps (Cuk et al. 2014; Rahmani et al. 2001; Samozino et al. 2014a; Sheppard et al. 2008; Vandewalle et al. 1987), or upper body move-ments (Nikolaidis 2012; van der Tillar 2004; Hintzy et al. 2003; Sprague et al. 2007; Cronin et al. 2003). Note that the results have been obtained from either the maximum (Vandewalle et al. 1987; Rahmani et al. 2001; Hintzy et al. 2003) or mean F and V data (Samozino et al. 2012, 2014a; Ravier et al. 2004), or both (Cuk et al. 2014; Sprague et al. 2007). Nevertheless, note that the stand-ard methodological approach [c.f., (Vandewalle et al. 1987; Samozino et al. 2012; Cuk et al. 2014)] of the cited studies has been based on the manipulation of external loads providing a range of F and V data that allows for applying the linear regression model (see “Methods” for details).
Although the findings regarding the shape of the F–V relationship have been fairly consistent (see previous text for details), it still remains questionable whether and to what extent both the linear F–V and the associated para-bolic P–V relationship could be used in future research. Namely, to use these models either to study the funda-mental properties of the human musculoskeletal system [c.f., (Bobbert 2012; Samozino et al. 2012; Jaric and
Markovic 2013)] or to develop routine tests for physi-cal abilities (Cronin et al. 2003; Nikolaidis 2012; Ravier et al. 2004), the linearity of the F–V relationship needs to be evaluated, while its parameters need to be both reliable and valid. However, although the applied linear models usually revealed a strong relationship (Cuk et al. 2014; Hintzy et al. 2003; Ravier et al. 2004; Yamauchi and Ishii 2007; Samozino et al. 2014a), only one study has directly compared the linear and polynomial models applied on the recorded F and V data (Cuk et al. 2014). To our knowledge, the same study is also the only one that evaluated the reliability of the relationship parameters. The results obtained from various vertical jumps revealed high reliability (i.e., ICC > 0.80) of all four parameters obtained from both the maximum and mean F and V val-ues, although F0 and P0 appeared to be somewhat more reliable than V0 (Cuk et al. 2014). To our best knowl-edge, neither the shape of the F–V relationship of arm muscles nor the reliability of the relationship parameters has yet been evaluated. Finally, although several stud-ies have explored the concurrent validity of parameters of the linear F–V relationship, the findings proved to be rather inconclusive. For example, the concurrent valid-ity of F0 regarding the directly measured muscle strength could be moderate-to-high (Driss et al. 2002; Cuk et al. 2014; Vandewalle et al. 1987), low, and even insignificant (Ravier et al. 2004; Yamauchi and Ishii 2007; Rahmani et al. 2001). The concurrent validity of V0 could also be either moderate (Yamauchi and Ishii 2007) or low (Cuk et al. 2014). Finally, some studies compared the concur-rent validity of different parameters and found that it could be higher for P0 than for F0 (Cuk et al. 2014), as well as higher for both P0 and V0 than for F0 (Yamauchi and Ishii 2007; Ravier et al. 2004). Therefore, the valid-ity of the F–V relationship parameters with respect to the corresponding directly measured variables still remains a problem.
To address the problems discussed above, we tested a relatively homogeneous group of subjects on loaded bench press throws that provided a range of both maximum and mean F and V values. These data allowed applying vari-ous regression models to the F–V and, consequently, P–V relationships. The aims were (1) to evaluate the linearity and strength of F–V, as well as the strength of the associ-ated P–V relationship, (2) to assess the reliability of the F–V relationship parameters, and (3) to obtain their con-current validity with respect to the directly measured F, P, and V. The expected results could be of importance for both understanding the mechanical properties of muscles exe-cuting maximum performance multi-joint tasks, as well as for developing routine tests of muscle mechanical proper-ties based on loaded multi-joint movements.
Author's personal copy

Eur J Appl Physiol
1 3
Methods
Participants
We conducted a sample size estimate based on the effects of similar range of the same type of load on force (F), veloc-ity (V), and power (P) output observed from bench press throws (Leontijevic et al. 2013). For an alpha level 0.05 and power 0.80, sample sizes from 3 to 4 (for F and V) to 9 (for P) appeared to be necessary to detect the significant loading effects (Cohen 1988). Therefore, we conservatively recruited 12 male sport and physical education students (age 21.4 ± 2.9; data shown as mean ± SD). Their body mass (78.0 ± 7.6 kg) and body height (183.4 ± 7.4 cm) were assessed with a digital scale and a standard anthro-pometer, respectively. Their percent body fat (7.5 ± 3.0 %) was assessed using a bioelectric impedance method (In Body 720; USA). To simplify the loading procedure (see further text for details), we selected only those with one repetition maximum bench press (1RM) between 85 and 115 kg. As a result, their 1RM was 100.3 ± 10.4 kg. The participants were physically active through their standard academic curriculum, which included six to eight activity classes per week, with both low- and high-intensity exer-cises. They reported no chronic diseases, heart problems, or recent injuries to their musculoskeletal apparatus. The participants were instructed to avoid any strenuous exercise over the course of the study. They were informed regard-ing the potential risks associated with the applied testing protocol. All participants gave written informed consent to the experiments, which was in accordance with the Decla-ration of Helsinki and approved by the Institutional Review Board.
Experimental protocol
Each participant completed four sessions separated by a rest period of 5–7 days. The first testing session included anthropometric measurements and the assessment of the 1RM bench press. The second session included a medicine ball throw test and, thereafter, familiarization with loaded bench press throws. The third and fourth sessions were identical. They consisted of loaded bench press throws. In total, the participants completed 36 bench press throws (6 loads × 3 trials × 2 sessions). The sequence of loads was randomized. Each session was preceded by a standard warmup procedure consisting of 5 min of arm and shoul-der mobilization exercises, 2 × 6 repetitions at 40 % of the 1RM, and 5 min of pectoral and triceps brachii static stretching (Leontijevic et al. 2013). Data from the third and fourth session were used for the reliability analysis, while only the data from the fourth session were used for the rest of the analysis.
Experimental procedures
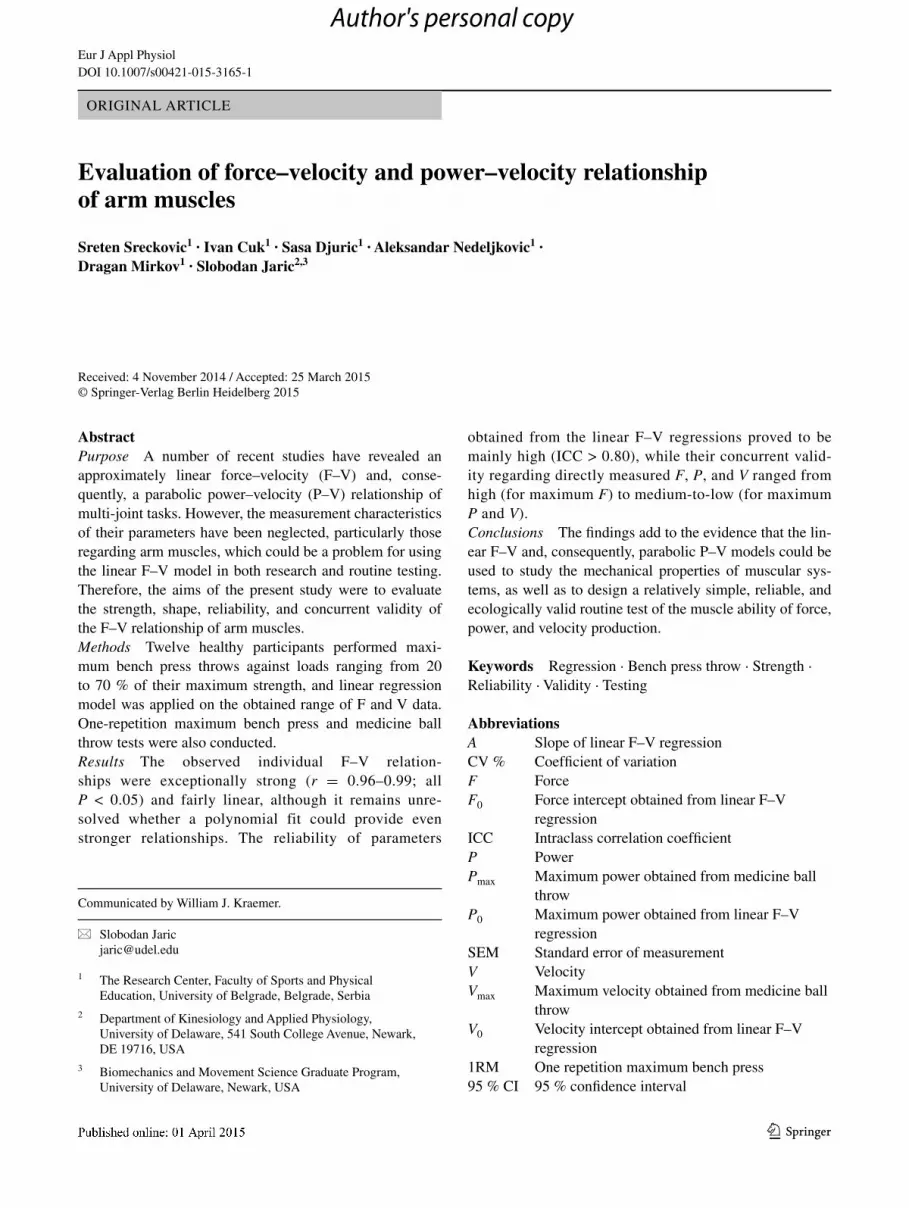
Standard procedure to assess the maximum strength of arm muscles through the 1RM bench press was employed (Leontijevic et al. 2013; Newton et al. 1997). The proce-dure was conducted on the same Smith machine that was later used for testing bench press throws (see Fig. 1a for illustration). The bar was positioned 1 cm above the par-ticipant’s chest and supported by the bottom stops of the measurement device. The participants were instructed to perform the bench press while maintaining shoulders at 90° of abduction to ensure consistency of the shoulder and elbow joints throughout the tested movement. No bouncing or arching of the back was allowed. The feet had to remain in contact with the floor while the pelvis remained in con-tact with the bench.
Both the one-hand and two-hand seated medicine ball throw tests have been validated (Stockbrugger and Haen-nel 2001) and used as a test of the P output of arm mus-cles (Chmielewski et al. 2014; Nedeljkovic et al. 2009). For the present study, we selected the 2-hand test because it more closely resembled the movement pattern of the bench press throws. We also used two different balls, since the lighter (i.e., 0.45 kg) and heavier one (3 kg) were expected, respectively, to predominantly reveal the V and P produc-ing capacity of the arm muscles. Participants were sitting on the floor and resting their head, shoulders, and lower back on the wall behind them. They were instructed to hori-zontally throw the balls with both hands from their chests as fast as possible. They were not allowed to move any part of their body besides their arms. The maximum V and P output were assessed from the movement of a reflective marker (Qualisys AB, Gothenburg, Sweden) positioned on the radial styloid process. Participants performed three tri-als with each ball in a randomized sequence. The first trial served for practice, while the second and third trials were recorded. The trial with the higher maximum V was taken for further analysis. The rest period between trials was 1 min, and 3 min between series of trials performed with the same ball.
The loaded bench press throws aimed to provide the F and V data for the assessment of F–V and, thereafter, P–V relationship. They were performed on a Smith machine (see Fig. 1 for illustration). The participants were instructed ‘to throw the bar as high as possible’. Although the mechanical stops prevented contact of the bar with the chest, two stop-pers caught the bar during its descending trajectory. The applied mass of external loads was 20, 30, 40, 50, 60, and 70 kg. The lowest load of 20 kg corresponded to the mass of the bar and arm segments of an ‘averaged subject’ [see (Leontijevic et al. 2013) for details]. Note that these loads approximately corresponded to the interval of 20–70 % of the average subject’s 1RM (i.e., from 20.0 ± 2.1 to
Author's personal copy
Eur J Appl Physiol
1 3
70.2 ± 7.7 % of 1RM). The subjects performed three trials under each loading condition, where the first trial served for practice, while the second and third trials were recorded. The trial with the higher maximum V was selected for fur-ther analysis. The rest periods among the three consecutive bench press throws were 45 s, while the rest between differ-ent loading conditions was about 3 min. According to both the participants’ reports and previous studies (Leontijevic et al. 2013; Cuk et al. 2014), fatigue was never an issue.
Data processing and analyses
A linear transducer (Vivis Sport Med, Belgrade, Serbia) was mounted and calibrated according to the manufactur-er’s specifications. Bar displacement was recorded with an accuracy of 0.01 cm and linearity higher than 99 %. Data were sampled at a rate of 200 Hz and low-pass filtered using the Buterworth filter with a cutoff frequency of 5 Hz. Custom-made software (National Instruments LabVIEW 2010, Austin, TX, USA) was used to record the vertical bar displacement, while two consecutive derivations of the same data provided the bar velocity (V) and acceleration. F was calculated as the sum of weight and inertia of the entire system consisting of arm limbs, bar, and weight plates. The product of F and V provided the P output. Note that F, V, and P were separately calculated from their maximum val-ues within the lifting phase [i.e., the time interval from the initiation of bar moment until acceleration of the bar drops to −9.81 m/s; (Cronin et al. 2003)], as well as from their mean values obtained from the same phase. Regarding the medicine ball throws, the data were sampled at 200 Hz and low-pass filtered (cutoff frequency 10 Hz). In addition to recording the maximum V (Vmax), the maximum P output (Pmax) was calculated as a product of the inertial F (i.e., the product of ball’s mass and acceleration) and V.
The F–V and P–V relationships were assessed from individual F, V, and P data obtained under six loading mag-nitudes, separately for their maximum and mean values.
where F0 represents the F-intercept which corresponds to the maximum isometric F (i.e., F at zero V), while a is the slope that corresponds to F0/V0 and V0 is the V-intercept (maximum V at zero F). Finally, since P is a product of F and V, Eq. 1 gives a parabolic shape of the P–V relationship
with maximum P observed at one-half of F0 and V0 [P0 = (F0 V0)/4]. As a consequence, the fitted linear F–V relationship not only directly reveals two parameters (i.e., F0 and a), but also enables the calculation of two other parameters of apparent functional importance (V0
(1)F(V) = F0 − aV ,
(2)P(V) = F(V)V = F0V − a V2,
Fig. 1 a Illustration of the task and apparatus. The remaining panels illustrate the time series of F (b), V (c), and P (d) obtained from three loading conditions of a representative subject
Author's personal copy

Eur J Appl Physiol
1 3
and P0) and determines the pattern of the associated P–V relationship.
Regarding the first aim, both the linear (Eq. 1) and sec-ond-order polynomial regression models were applied to obtain the F–V relationship. Note that higher-order poly-nomial models were not used since they would provide the patterns characterized with multiple peaks that would not have a meaningful physiological interpretation. The P–V relationship was assessed by solely applying the para-bolic model (see Eq. 2) presuming that the F–V relation-ship is linear. The corresponding correlation coefficients (r) and their 95 % confidence intervals (95 % CI) were also calculated. The linear regressions (Eq. 1) directly revealed the maximum F (F-intercept; F0) and regressions slopes (a). They enabled the calculation of the maximum V (V-intercept; V0 = F0/a) and the maximum P outputs [P0 = (F0V0)/4].
Statistical analyses
To assess the reliability of the linear regressions obtained from the two consecutive testing sessions (the second aim), the coefficient of variation (CV %), standard error of measurement (SEM), intraclass correlation coefficients (ICC), and the difference (paired samples t test) were cal-culated for F0, V0, a, and P0. t tests for paired samples were applied on the same parameters to assess whether they dif-fered when obtained from the maximum and mean F and V. To assess the effect size, eta-squared (ŋ2) was calcu-lated for paired variables, where the values of 0.01, 0.06, and above 0.14 were considered small, medium, and large, respectively (Cohen 1988). The Pearson correlation coeffi-cients were used to assess the concurrent validity of F0, V0, and P0 regarding the directly recorded strength (1RM), and
the maximum velocity (Vmax) and power (Pmax) obtained from the medicine ball throws (the third aim). Prior to the statistical analyses, initial testing revealed that none of the dependent variables significantly deviated from their nor-mal distribution (Kolmogorov–Smirnov test). The level of statistical significance was set to P < 0.05. All statistical tests were performed using SPSS 19 (IBM, Armonk, NY).
Results
Lower panels of Fig. 1 illustrate the typical profiles of F, V, and P, observed from the bench press throws performed against the minimum, intermediate, and the maximum load applied on a representative subject. The time series reveal that an increase in the applied load from 20 to 70 kg of mass was associated with an overall increase in F and movement duration, as well as with a decrease in V and P.
Figure 2 depicts F and V (left hand panel) and P and V data (right hand panel) averaged across the subjects for each particular load and calculated as both their maximum and mean values, as well as the outcomes of the applied linear and parabolic regression models. Despite having only 4 degrees of freedom, all correlation coefficients were significant at the level P < 0.05. Note that while the F–V relationship obtained from the maximum F and V showed no significant differences between the two regression mod-els, the correlation coefficient of the polynomial regression obtained from the mean F and V was above 95 % CI of the corresponding linear regression.
Table 1 shows the individual parameters of the lin-ear F–V regressions averaged across the subjects that were observed from two consecutive sessions. Regard-ing the indices of their reliability, note that all ICC values
Fig. 2 Linear (solid lines) and polynomial regressions (dashed lines) obtained from the data averaged across the subjects F and V (left hand panel), and P and V (right hand panel) calculated as both their maximum (filled squares) and mean values (open squares). The data were obtained from concentric phase of bench press throws per-
formed under six different loads. The regression equations are shown with the corresponding correlation coefficients and 95 % CI, while vertical arrows in the right hand panel indicate V that corresponds to maximum P. The averaged across the subject 1RM recorded is indi-cated in the left panel
Author's personal copy

Eur J Appl Physiol
1 3
suggested either high (0.80 < ICC < 1.00) or medium reli-ability (0.60 < ICC < 0.80). However, in seven out of eight comparisons, the ICC values were lower for V0 and a than for the corresponding F0 and Pmax. The same parameters also revealed a somewhat higher both CV % and SEM (rel-ative to their absolute values). Finally, there were no signif-icant differences between the outcomes of the two sessions.
The following figures represent the outcomes of indi-vidual F–V and P–V relationships. Figure 3 depicts the correlation coefficients obtained from the individual F–V (left hand panel) and P–V regressions (right hand panel). T tests for the paired samples applied on their Z-trans-formed values showed no significant differences between the maximum and mean F and V regarding both the lin-ear F–V regressions (t(11) = 0.550; ŋ2 = 0.03; p = 0.593) and parabolic P–V regressions (t(11) = −0.902; ŋ2 = 0.07; p = 0.386).
The parameters calculated from the individual F–V lin-ear regressions averaged across the subjects are depicted in Fig. 4. t tests for paired samples revealed significant differ-ences (all P < 0.01) between the parameters obtained from
the maximum and mean F and V values: F0 (t(11) = 16.5; ŋ2 = 0.961), V0 (t(11) = 25.7; ŋ2 = 0.984), a (t(11) = −11.8; ŋ2 = 0.979), and Pmax (t(11) = 22.9; ŋ2 = 0.927). As expected, F0, V0 and, consequently, P0 were higher when obtained from the maximum, while a was higher when obtained from mean F and V data.
Figure 5 shows the concurrent validity of the individ-ual values of F0, V0, and P0 with respect to the directly assessed strength, velocity, and power. In general, only F0 revealed high and significant correlations with 1RM for both the maximum and mean F and V. Regarding both V0 and P0, note that their correlation coefficients with Vmax and Pmax, respectively, for the heavier ball were at the medium level (i.e., about 0.50) and close to the level of significance, while the strength of the same correla-tions obtained from the lighter ball were not meaningful. Finally, of importance for the concurrent validity could be that 1RM closely corresponds to the values of F0 shown in Fig. 2.
Discussion
To evaluate the F–V relationship of arm muscles, we tested loaded bench press throws and obtained a range of both the maximum and mean F and V data. Specifically regard-ing our first aim, we observed exceptionally strong and approximately linear F–V relationships from the individual F and V data calculated as both their maximum and mean values. Consequently, the P–V relationships were strong and parabolic. Regarding our second aim, most of the F–V relationship parameters revealed high reliability. Regarding our third aim, the concurrent validity of the same param-eters ranged from high (for F0) to medium-to-low (for V0 and P0). Finally, excluding the differences in magnitude of the observed parameters, the data generally revealed simi-lar shape of F–V and P–V patterns when observed from the maximum and mean F and V variables.
Table 1 Reliability of the parameters of linear F–V regressions obtained from maximum and averaged F and V data
F0 force intercept, V0 velocity intercept, a slope, P0 maximum power, CV % coefficient of variation, SEM standard error of measurement, ICC intraclass correlation coefficient shown with the corresponding 95 % CI, t t value, p p value
Variable type Variable Session 1 Session 2 CV % SEM ICC t P
Maximum F0 1060 ± 106 1069 ± 97 2.4 25 0.95 (0.86, 0.98) −0.85 0.42
V0 5.88 ± 0.64 5.64 ± 0.53 4.9 0.29 0.77 (0.47, 0.90) 2.09 0.06
a 182 ± 22 191 ± 23 6.9 12 0.73 (0.38, 0.88) −1.91 0.08
P0 1562 ± 244 1509 ± 221 3.5 56 0.95 (0.87, 0.98) 2.33 0.04
Averaged F0 858 ± 69 859 ± 64 2.8 22 0.90 (0.75, 0.96) −0.74 0.94
V0 3.51 ± 0.43 3.44 ± 0.33 4.0 0.14 0.88 (0.71, 0.95) 1.17 0.27
a 248 ± 32 251 ± 25 6.6 15 0.74 (0.41, 0.88) −0.58 0.58
P0 754 ± 116 741 ± 108 2.3 17 0.98 (0.94, 0.99) 1.76 0.11
Fig. 3 Median correlation coefficients and their ranges obtained from the individual linear F–V regressions (left panel) and polyno-mial P–V regressions (right panel)
Author's personal copy

Eur J Appl Physiol
1 3
Note that excluding our recent study performed on various vertical jumps (Cuk et al. 2014), none of the vast number of studies aimed to explore the F–V properties of various multi-joint tasks (see “Introduction” for details) evaluated either the linearity of the F–V relationship or the reliability of its patterns. From the purely methodologi-cal perspective, it should preclude using the studied rela-tionship in both the basic research of the musculoskeletal
system and in developing standard tests of physical abili-ties. Therefore, the present study reveals a novel set of data that could be of importance for future assessments of mechanical properties of arm muscles and, potentially, other muscular systems.
Regarding the observed F–V patterns, our findings revealed that both the averaged across the subjects (see Fig. 2) and individual F–V relationships (Fig. 3) obtained from both the maximum and mean F and V data could be exceptionally strong. Consequently, the fitted parabolic P–V relationships were also strong. Finally, their maximum power (P0) also appeared to be close to 50 % of both F0 and V0, which is in line with the parabolic P–V model (Cuk et al. 2014; Markovic and Jaric 2007; Rahmani et al. 2001; Suzovic et al. 2013). Therefore, the strength of the evalu-ated relationships generally supports the application of lin-ear models for the assessment of the F–V relationship of maximum performance multi-joint movements. Regarding the mechanisms involved, the linearity of the multi-joint F–V relationship could originate from the inter-segmental dynamics (Bobbert 2012), rather than from neural control mechanisms (Yamauchi and Ishii 2007; Yamauchi et al. 2009). However, also note that both polynomial regressions fitted through the presented F and V data (see Fig. 2) were concave and, moreover, the one fitted through the mean F and V data was significantly stronger than the correspond-ing linear regression. Therefore, the observed F–V pat-terns to some extent resemble the hyperbolic pattern of the F–V relationship of individual muscles and muscle groups [(Hill 1938; Wilkie 1950), see also (McMahon 1984) for review]. Note also that the tested task allowed obtaining a much wider range of F and V values than that obtained in
Fig. 4 Parameters of F–V lin-ear regressions averaged across the subjects obtained from the maximum and mean F and V variables (means with SD error bars). The individual panels show force intercept (F0; panel a), velocity intercept (V0; panel b), regression slope (a; panel c) and maximum power output (P0; panel d). All differences are significant at P < 0.01
Fig. 5 Concurrent validity of the linear F–V regression parameters with respect to directly measured variables. The data present the Pearson’s correlations and the corresponding 95 % CI of the linear F–V regression parameters F0, V0, and P0 (obtained from either maxi-mum and mean F and V) with the directly tested strength (1RM), and the velocity (Vmax) and power (Pmax) obtained from the throwing of the lighter and heavier medicine ball (*P < 0.05; **P < 0.01; N = 12)
Author's personal copy

Eur J Appl Physiol
1 3
a number of other studies [c.f., (Cuk et al. 2014; van der Tillar 2004; Vandewalle et al. 1987; Ravier et al. 2004)]. Therefore, although the applied linear regression model generally reveals a strong F–V relationship, future studies should explore whether the linearity observed from a num-ber of tasks (see “Introduction” for review), including the present one, is a consequence of a typically narrow range of obtained F and V data, rather than being an intrinsic property of the tested muscles. Finally, note that the joint angles at which maximum F was observed also deserve further exploration since the optimum muscle length (and, consequently, joint angle) for maximizing strength could differ for different shortening regimens (Haan et al. 2003) and, therefore, affect the obtained F–V pattern.
The reliability of the observed F–V pattern as assessed through the ICC of its parameters appears to be high. How-ever, ICC proved to be typically lower in both V0 and a, than in either F0 or P0. Not surprisingly, the same param-eters also revealed higher values of SEM (relative to their magnitudes) and CV. However, the observed reliability of the F–V parameters appear to be somewhat lower than for the corresponding parameters observed from loaded ver-tical jumps (Cuk et al. 2014), although the present study was based on a much wider interval of F and V data rela-tive to F0 and V0 values. We do not have the data to explore whether the observed phenomenon originates from the tested task, from the subjects’ skill, or from something else. Nevertheless, the discussed findings generally suggest that the linear F–V relationship observed from loaded bench press throws could provide reliable indices of the maxi-mum F, V, and P of arm muscles.
We selected two already evaluated standard tests of strength (i.e., 1RM), and power and speed (medi-cine ball throw) to establish the concurrent validity of the corresponding F–V relationship parameters with respect to the directly measured outcomes of the two tests. However, our data revealed inconsistent findings. Namely, the concurrent validity of F0 with respect to 1RM proved to be high, while the concurrent validity of P0 and V0 with respect to Pmax and Vmax, respectively, observed from the medicine ball throws appeared to be on average moderate-to-low and non-significant. These data contradict some earlier studies that revealed a lower concurrent validity of F0 than of either Fmax (Cuk et al. 2014) or V0 (Yamauchi and Ishii 2007; Ravier et al. 2004). Note also that one could expect that the lighter ball throw could reveal V, while the heavier one could predominantly reveal P output properties of arm muscles. However, no differences were found between the concurrent validity of P0 and V0 regarding the out-comes of two medicine ball throws. Although further research is apparently needed, one could explain the high concurrent validity of F0 by face validity of the
criterion variable (i.e., 1RM), since it directly assesses muscle strength. Conversely, despite their frequent use in testing (Chmielewski et al. 2014; Nedeljkovic et al. 2009; Stockbrugger and Haennel 2001), the validity of throwing medicine balls per se could be limited which could inevitably reduce the obtained indices of the related concurrent validity.
A comparison of the outcomes observed from the max-imum and mean F and V variables could be of potential importance for both future research and development of routine tests. In line with our previous findings observed from a variety of loaded vertical jumps (Cuk et al. 2014), the strength of the observed F–V and P–V relationships, the reliability of their parameters, and their concurrent validity appear to be similar when obtained from the max-imum and mean F and V. The only important difference could be in the magnitude of their parameters. Approxi-mately, a twofold higher P0 and almost an equally lower a revealed from the maximum F and V are mainly the con-sequence of a higher V0, rather than a higher F0. There-fore, although both the maximum and mean values of F and V could be used for the assessment of F–V and P–V relationships from loaded multi-joint tasks, the expected differences in their shape should be strictly kept in mind when either comparing different studies or creating future standards.
To conclude, the present findings revealed a strong and approximately linear F–V and, consequently, parabolic P–V relationship of arm muscles tested through loaded bench press throws. The reliability of their patterns as assessed through their parameters proved to be high on average, while the parameters’ concurrent validity could range from high (for F0) to medium-to-low (for P0 and V0). Future studies could focus upon the shape of F–V relationship of other tasks and the measurement proper-ties of the obtained parameters. They could also explore whether the presumed linearity of the studied F–V rela-tionship predominantly originates from a typically nar-row range of obtained F and V data, rather than from the intrinsic properties of the tested multi-joint muscular sys-tems. Future modeling studies could reveal to what extent the parameters of presumably linear F–V relationship observed from multi-joint tasks are related to hyperbolic relationships of individual muscles [c.f., (Bobbert 2012)]. Generalization of the observed findings to other multi-joint tasks is also needed. Nevertheless, the present find-ings add to the evidence that the muscle mechanical prop-erties could be studied through loaded multi-joint tasks that provide relatively simple linear F–V and parabolic P–V relationships, as well as that the same tasks could be developed into a relatively simple and ecologically valid test of strength-, power-, and velocity-producing capaci-ties of the muscular system.
Author's personal copy

Eur J Appl Physiol
1 3
Acknowledgments The study was supported in part by NIH grant (R21AR06065) and a grant from the Serbian Research Council (#175037).
Ethical Statement All procedures performed in studies involving human participants were in accordance with the ethical standards of the Institutional and/or National Research Committee and with the 1964 Helsinki Declaration and its later amendments or comparable ethical standards.
References
Bobbert MF (2012) Why is the force–velocity relationship in leg press tasks quasi-linear rather than hyperbolic? J Appl Physiol 112(12):1975–1983
Chmielewski TL, Martin C, Lentz TA, Tillman SM, Moser MW, Farmer KW, Jaric S (2014) Normalization considerations for using the unilateral seated shot put test in rehabilitation. J Orthop Sports Phys Ther 44(7):518–524
Cohen J (1988) Statistical power analysis for the behavioral sciences, 2nd edn. Lawrence Erlbaum Associates, Hillsdale, NJ
Cronin JB, McNair PJ, Marshall RN (2003) Force–velocity analysis of strength-training techniques and load: implications for train-ing strategy and research. J Strength Cond Res 17(1):148–155
Cuk I, Markovic M, Nedeljkovic A, Ugarkovic D, Kukolj M, Jaric S (2014) Force–velocity relationship of leg extensors obtained from loaded and unloaded vertical jumps. Eur J Appl Physiol 114(8):1703–1714
Driss T, Vandewalle H (2013) The measurement of maximal (anaero-bic) power output on a cycle ergometer: a critical review. Biomed Res Int 2013:589361
Driss T, Vandewalle H, Le Chevalier JM, Monod H (2002) Force–velocity relationship on a cycle ergometer and knee-extensor strength indices. Can J Appl Physiol 27(3):250–262
Fenn WO, Marsh BS (1935) Muscular force at different speeds of shortening. J Physiol 85:277–297
Haan A, Huijing PA, Vliet MR (2003) Rat medial gastrocnemius mus-cles produce maximal power at a length lower than the isometric optimum length. Pflugers Arch 445(6):728–733
Hill AV (1938) The heat of shortening and the dynamic constants of muscle. Proc Roy Soc (Lond) 126(843):136–195
Hintzy F, Tordi N, Predine E, Rouillon JD, Belli A (2003) Force–velocity characteristics of upper limb extension during maximal wheelchair sprinting performed by healthy able-bodied females. J Sports Sci 21(11):921–926
Jaric S, Markovic G (2013) Body mass maximizes power output in human jumping: a strength-independent optimum loading behav-ior. Eur J Appl Physiol 113(12):2913–2923
Leontijevic B, Pazin N, Kukolj M, Ugarkovic D, Jaric S (2013) Selective effects of weight and inertia on maximum lifting. Int J Sports Med 34(3):232–238
Markovic G, Jaric S (2007) Positive and negative loading and mechanical output in maximum vertical jumping. Med Sci Sports Exerc 39(10):1757–1764
McMahon TA (1984) Muscles, reflexes, and locomotion. Princeton University Press, Princeton
Nedeljkovic A, Mirkov DM, Markovic S, Jaric S (2009) Tests of mus-cle power output assess rapid movement performance when nor-malized for body size. J Strength Cond Res 23(5):1593–1605
Newton RU, Murphy AJ, Humphries BJ, Wilson GJ, Kraemer WJ, Hakkinen K (1997) Influence of load and stretch shortening cycle on the kinematics, kinetics and muscle activation that occurs during explosive upper-body movements. Eur J Appl Physiol Occup Physiol 75(4):333–342
Nikolaidis PT (2012) Age- and sex-related differences in force–veloc-ity characteristics of upper and lower limbs of competitive ado-lescent swimmers. J Hum Kinet 32:87–95
Rahmani A, Viale F, Dalleau G, Lacour JR (2001) Force/velocity and power/velocity relationships in squat exercise. Eur J Appl Phys-iol 84(3):227–232
Ravier G, Grappe F, Rouillon JD (2004) Application of force-veloc-ity cycle ergometer test and vertical jump tests in the functional assessment of karate competitor. J Sports Med Phys Fitness 44(4):349–355
Samozino P, Rejc E, Di Prampero PE, Belli A, Morin JB (2012) Opti-mal force–velocity profile in ballistic movements–altius: citius or fortius? Med Sci Sports Exerc 44(2):313–322
Samozino P, Edouard P, Sangnier S, Brughelli M, Gimenez P, Morin JB (2014a) Force–velocity profile: imbalance determination and effect on lower limb ballistic performance. Int J Sports Med 35(6):505–510
Samozino P, Rejc E, di Prampero PE, Belli A, Morin JB (2014b) Force–velocity properties’ contribution to bilateral deficit during ballistic push-off. Med Sci Sports Exerc 46(1):107–114
Sheppard JM, Cormack S, Taylor KL, McGuigan MR, Newton RU (2008) Assessing the force–velocity characteristics of the leg extensors in well-trained athletes: the incremental load power profile. J Strength Cond Res 22(4):1320–1326
Sprague RCT, Martin JC, Davidson CJ, Farrar RP (2007) Force–velocity and power–velocity relationships during maximal short-term rowing ergometry. Med Sci Sports Exerc 39(2):358–364
Stockbrugger BA, Haennel RG (2001) Validity and reliability of a medicine ball explosive power test. J Strength Cond Res 15(4):431–438
Suzovic D, Markovic G, Pasic M, Jaric S (2013) Optimum load in various vertical jumps support the maximum dynamic output hypothesis. Int J Sports Med 34(11):1007–1014
van der Tillar R, Ettema G (2004) A force–velocity relationship and coordination patterns in overarm throwing. J Sports Sci Med 3:211–219
Vandewalle H, Peres G, Heller J, Panel J, Monod H (1987) Force–velocity relationship and maximal power on a cycle ergometer correlation with the height of a vertical jump. Eur J Appl Physiol 56(6):650–656
Wilkie DR (1950) The relationship between force and velocity in human muscle. J Physiol 110:249–280
Yamauchi J, Ishii N (2007) Relations between force–velocity charac-teristics of the knee–hip extension movement and vertical jump performance. J Strength Cond Res 21(3):703–709
Yamauchi J, Mishima C, Nakayama S, Ishii N (2009) Force–veloc-ity, force–power relationships of bilateral and unilateral leg multi-joint movements in young and elderly women. J Biomech 42(13):2151–2157
Author's personal copy


