Embed Size (px)
Citation preview

Evaluation of 12-Year-Old PV Power Plant in Hot-Dry Desert Climate:
Potential Use of Field Failure Metrics for Financial Risk Calculation
J. Mallineni, B. Knisely, K. Yedidi, S. Tatapudi, J. Kuitche and G. TamizhMani
Arizona State University, Photovoltaic Reliability Laboratory (ASU-PRL)
ABSTRACT
This paper provides a metric definition for the safety
failures, reliability failures and degradation loss for the PV modules.
These metrics are then used in real power plant evaluations to
calculate the distribution among these three metrics which in turn
could objectively be used to perform financial risk calculations. The
results obtained on 2352 and 1280 modules in two of the evaluated
power plants, aged 12 and 4 years, in a hot-dry desert climate are
analyzed using these defined metrics. The results indicate that the
mean and median degradations, respectively, are 0.95 and 0.96
%/year for the 12-year old, and 0.96%/year and 1%/year for the 4-
year old power plants. The distribution between safety failures,
reliability failures and durability loss is determined to be 7%, 42%
and 51%, respectively for the 12 year old power plant.
Index Terms – reliability metrics, degradation rate, O&M, hot dry
desert, durability
I. INTRODUCTION
Higher safety failure, reliability failure and
performance degradation rates of PV modules in power plants
will have serious financial impacts due to reduced energy
production than expected, increased O&M costs, safety risks and
increased warranty claim rates. These failure and performance
degradation rates are dependent on the climatic condition of the
site where the power plant is located. An extensive literature
review and analysis performed by NREL on nearly 2000
publications indicates that the module degradation rate can be as
high as 4%/year, but the median and average degradation rates are
calculated to be 0.5%/year and 0.8%/year, respectively [1]. These
degradation rates have been reported for a wide and highly
diversified range of global climatic conditions. Arizona State
University Photovoltaic Reliability Laboratory (ASU-PRL) has
been investigating a large number of power plants with several
thousands of modules for a single climatic condition: hot-dry
desert climate. In our previous investigation on about 1,900
modules installed in Tempe, Arizona (a hot-dry desert climate) we
reported a degradation rate ranging between 0.6%/year and
2.5%/year depending on the module model/manufacturer, design
and number of years operating in the field [2]. The major
degradation modes experienced in “hot-dry” climates have been
determined to be solder bond deterioration and encapsulant
discoloration [3].
Standard of measurement by which quality of a product
can be assessed is called the “Definition of Metrics.” This paper
provides a metric definition for the safety failures, reliability
failures and degradation loss for the PV modules. These metrics
are then used in real power plant evaluations to calculate the
distribution among these three metrics which in turn could
objectively be used to perform financial risk calculations. The
results obtained on two PV power plants, aged 4 and 12 years, in a
hot-dry desert climate are analyzed using these defined metrics.
II. METHODOLOGY
Metric definition for the terms safety failures,
reliability failures or durability loss for PV modules is
currently not consistent within the industry and even the
minor/cosmetic visual defects are often considered/confused
as/with the term failures. The metrics for the definition of
safety failures, reliability failures and durability loss need to be
clearly established so a consistent industry wide financial
model can be developed and established. All visual defects are
not necessarily failures, and all the failures may not be
detected through visual inspection. Figure 1 (see the last page)
provides metrics for these terms and Figure 2 (see the last
page) shows how these terms and metrics are applied in the
streamlined power plant evaluation approach developed and
executed at ASU-PRL. Assuming the conventional 20/20
warranty (20% degradation over 20 years), as per the metric
definition shown in Figure 1, all the modules which are
degrading at a rate higher than 1%/year, excluding any safety
failed modules, are considered as reliability failed modules.
Similarly, as per the metric definition shown in Figure 1, all the
modules which are degrading at a rate lower than 1%/year,
excluding safety failed modules, are considered to have
durability issues. These metric definitions have been applied on
the results obtained from the experiments shown in Figure 2.
All I-V measurements were taken at an irradiance of
above 850W/m2. These measured curves were normalized to
STC using the temperature co-efficients obtained from the
baseline I-V curves. Each and every module was inspected for
defects using visual, IR and diode checking tools. A diode
checker instrument was used to detect failed diodes and broken
interconnects on a PV module. The diode checker has two
parts, a transmitter and a receiver. The transmitter is connected
to the string terminals at the combiner box and the receiver
was placed on the module busbars to detect the signal
transmitted. The STC power outputs of all the individual
strings in the power plant were first determined. Then, 2 Best,
2 Median and 2 Worst strings were selected. The I-V curves of
all the individual modules in each of these six strings were
then obtained. Again, from these 6 selected strings 3 Best, 3
Median and 3 Worst modules were selected for an in depth
analysis. The degradation rate (%/year) for the five
performance parameters (Isc, Imax, Voc, Vmax, FF and Pmax)
were calculated for the corresponding modules. In the case of
2 best strings, 6 best, 6 median and 6 worst modules were
analyzed using the box plots of Minitab software. The primary
parameter responsible for the cause of power degradation is
identified from the graph by choosing the median of the five
parameters (%/year) aligning close to the median of the Pmax
degradation (%/year). This paper presents results obtained
from two PV power plants having the following characteristics:
12 years old plant (site 3): Glass/polymer frameless
modules (Model G), 1-axis tracking, 2352 modules and
located in Glendale/Arizona (site condition: hot-dry
climate)
4 years old plant (site 4c): Glass/polymer framed
modules (Model H), 1-axis tracking, 1280 modules and
located in Mesa/Arizona (site condition: hot-dry
climate)
III. RESULTS AND DISCUSSION
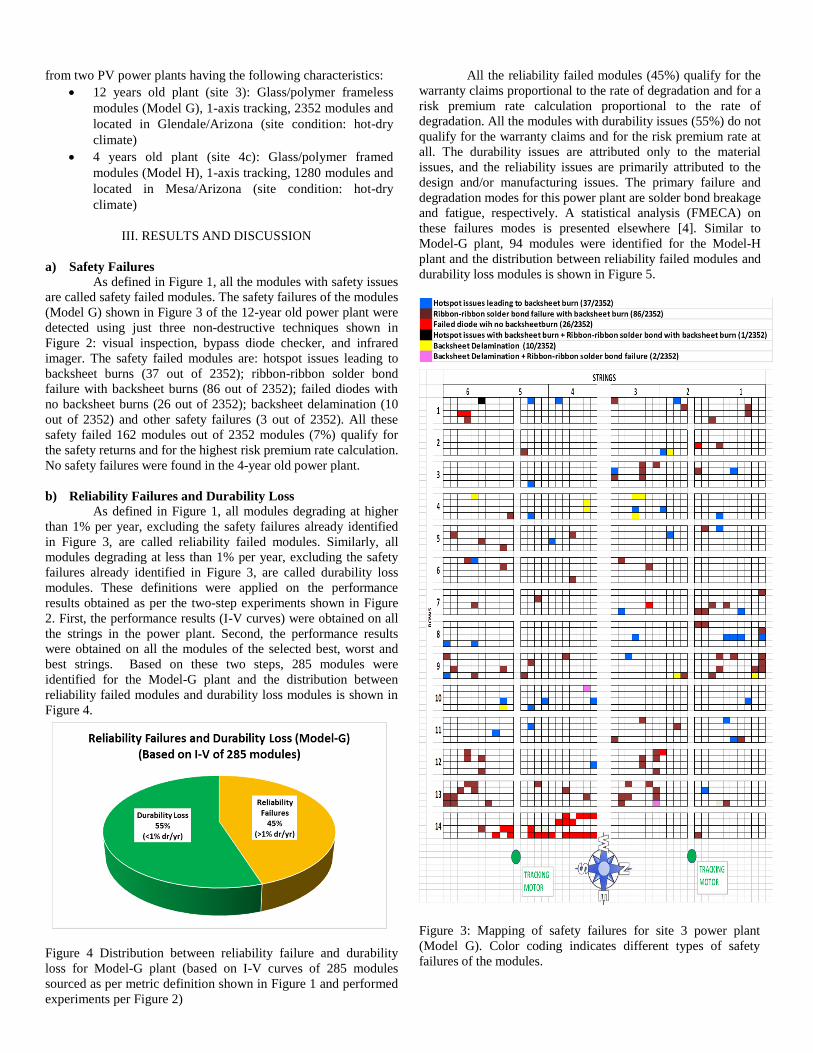
a) Safety Failures As defined in Figure 1, all the modules with safety issues
are called safety failed modules. The safety failures of the modules
(Model G) shown in Figure 3 of the 12-year old power plant were
detected using just three non-destructive techniques shown in
Figure 2: visual inspection, bypass diode checker, and infrared
imager. The safety failed modules are: hotspot issues leading to
backsheet burns (37 out of 2352); ribbon-ribbon solder bond
failure with backsheet burns (86 out of 2352); failed diodes with
no backsheet burns (26 out of 2352); backsheet delamination (10
out of 2352) and other safety failures (3 out of 2352). All these
safety failed 162 modules out of 2352 modules (7%) qualify for
the safety returns and for the highest risk premium rate calculation.
No safety failures were found in the 4-year old power plant.
b) Reliability Failures and Durability Loss As defined in Figure 1, all modules degrading at higher
than 1% per year, excluding the safety failures already identified
in Figure 3, are called reliability failed modules. Similarly, all
modules degrading at less than 1% per year, excluding the safety
failures already identified in Figure 3, are called durability loss
modules. These definitions were applied on the performance
results obtained as per the two-step experiments shown in Figure
2. First, the performance results (I-V curves) were obtained on all
the strings in the power plant. Second, the performance results
were obtained on all the modules of the selected best, worst and
best strings. Based on these two steps, 285 modules were
identified for the Model-G plant and the distribution between
reliability failed modules and durability loss modules is shown in
Figure 4.
Figure 4 Distribution between reliability failure and durability
loss for Model-G plant (based on I-V curves of 285 modules
sourced as per metric definition shown in Figure 1 and performed
experiments per Figure 2)
All the reliability failed modules (45%) qualify for the
warranty claims proportional to the rate of degradation and for a
risk premium rate calculation proportional to the rate of
degradation. All the modules with durability issues (55%) do not
qualify for the warranty claims and for the risk premium rate at
all. The durability issues are attributed only to the material
issues, and the reliability issues are primarily attributed to the
design and/or manufacturing issues. The primary failure and
degradation modes for this power plant are solder bond breakage
and fatigue, respectively. A statistical analysis (FMECA) on
these failures modes is presented elsewhere [4]. Similar to
Model-G plant, 94 modules were identified for the Model-H
plant and the distribution between reliability failed modules and
durability loss modules is shown in Figure 5.
Figure 3: Mapping of safety failures for site 3 power plant
(Model G). Color coding indicates different types of safety
failures of the modules.
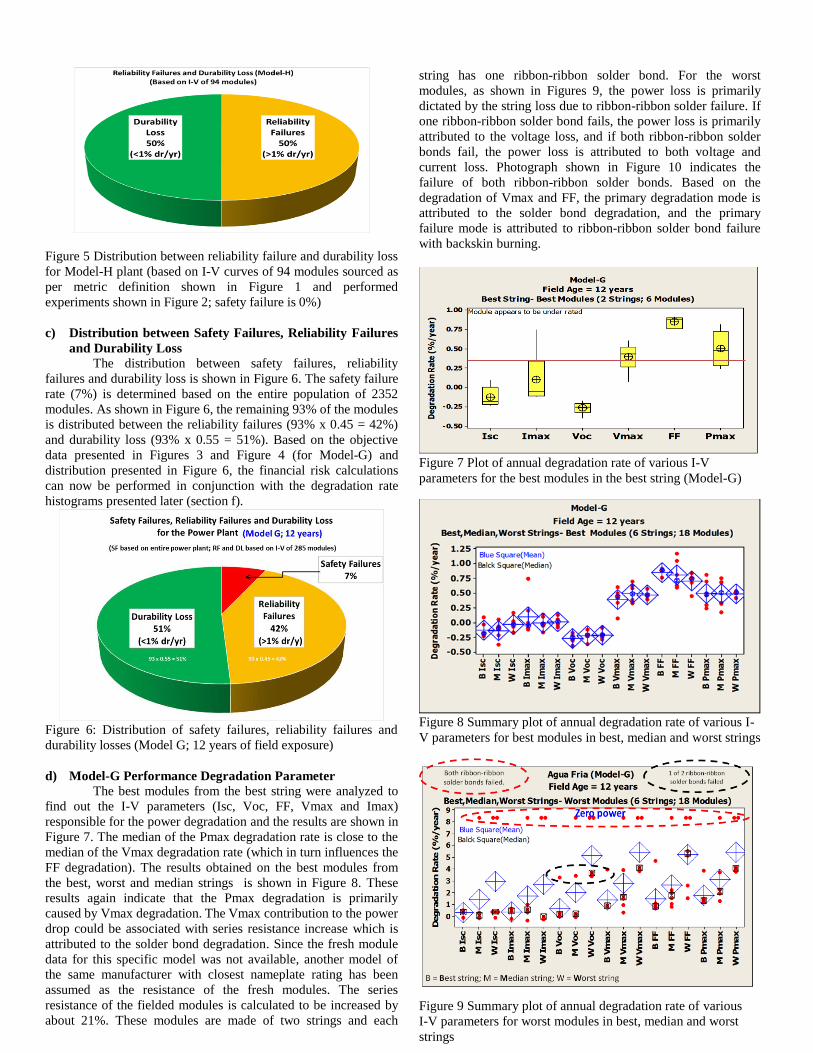
Figure 5 Distribution between reliability failure and durability loss
for Model-H plant (based on I-V curves of 94 modules sourced as
per metric definition shown in Figure 1 and performed
experiments shown in Figure 2; safety failure is 0%)
c) Distribution between Safety Failures, Reliability Failures
and Durability Loss The distribution between safety failures, reliability
failures and durability loss is shown in Figure 6. The safety failure
rate (7%) is determined based on the entire population of 2352
modules. As shown in Figure 6, the remaining 93% of the modules
is distributed between the reliability failures (93% x 0.45 = 42%)
and durability loss (93% x 0.55 = 51%). Based on the objective
data presented in Figures 3 and Figure 4 (for Model-G) and
distribution presented in Figure 6, the financial risk calculations
can now be performed in conjunction with the degradation rate
histograms presented later (section f).
Figure 6: Distribution of safety failures, reliability failures and
durability losses (Model G; 12 years of field exposure)
d) Model-G Performance Degradation Parameter The best modules from the best string were analyzed to
find out the I-V parameters (Isc, Voc, FF, Vmax and Imax)
responsible for the power degradation and the results are shown in
Figure 7. The median of the Pmax degradation rate is close to the
median of the Vmax degradation rate (which in turn influences the
FF degradation). The results obtained on the best modules from
the best, worst and median strings is shown in Figure 8. These
results again indicate that the Pmax degradation is primarily
caused by Vmax degradation. The Vmax contribution to the power
drop could be associated with series resistance increase which is
attributed to the solder bond degradation. Since the fresh module
data for this specific model was not available, another model of
the same manufacturer with closest nameplate rating has been
assumed as the resistance of the fresh modules. The series
resistance of the fielded modules is calculated to be increased by
about 21%. These modules are made of two strings and each
string has one ribbon-ribbon solder bond. For the worst
modules, as shown in Figures 9, the power loss is primarily
dictated by the string loss due to ribbon-ribbon solder failure. If
one ribbon-ribbon solder bond fails, the power loss is primarily
attributed to the voltage loss, and if both ribbon-ribbon solder
bonds fail, the power loss is attributed to both voltage and
current loss. Photograph shown in Figure 10 indicates the
failure of both ribbon-ribbon solder bonds. Based on the
degradation of Vmax and FF, the primary degradation mode is
attributed to the solder bond degradation, and the primary
failure mode is attributed to ribbon-ribbon solder bond failure
with backskin burning.
Figure 7 Plot of annual degradation rate of various I-V
parameters for the best modules in the best string (Model-G)
Figure 8 Summary plot of annual degradation rate of various I-
V parameters for best modules in best, median and worst strings
Figure 9 Summary plot of annual degradation rate of various
I-V parameters for worst modules in best, median and worst
strings
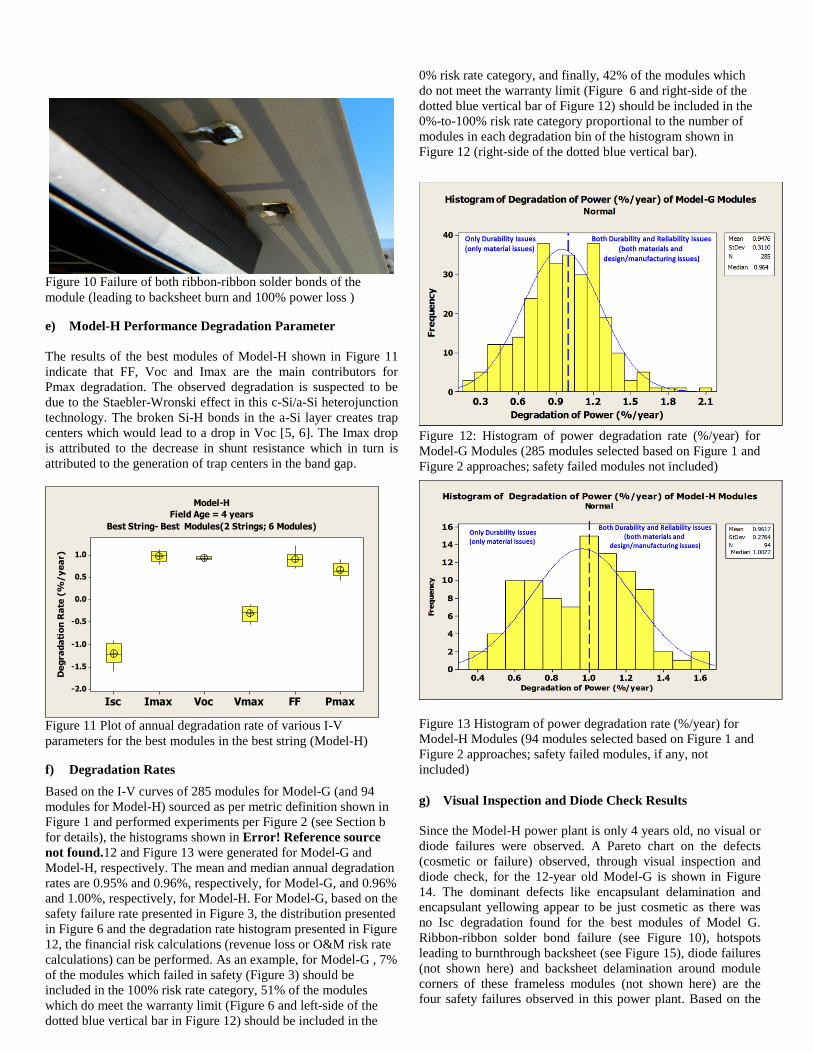
Figure 10 Failure of both ribbon-ribbon solder bonds of the
module (leading to backsheet burn and 100% power loss )
e) Model-H Performance Degradation Parameter
The results of the best modules of Model-H shown in Figure 11
indicate that FF, Voc and Imax are the main contributors for
Pmax degradation. The observed degradation is suspected to be
due to the Staebler-Wronski effect in this c-Si/a-Si heterojunction
technology. The broken Si-H bonds in the a-Si layer creates trap
centers which would lead to a drop in Voc [5, 6]. The Imax drop
is attributed to the decrease in shunt resistance which in turn is
attributed to the generation of trap centers in the band gap.
Figure 11 Plot of annual degradation rate of various I-V
parameters for the best modules in the best string (Model-H)
f) Degradation Rates
Based on the I-V curves of 285 modules for Model-G (and 94
modules for Model-H) sourced as per metric definition shown in
Figure 1 and performed experiments per Figure 2 (see Section b
for details), the histograms shown in Error! Reference source
not found.12 and Figure 13 were generated for Model-G and
Model-H, respectively. The mean and median annual degradation
rates are 0.95% and 0.96%, respectively, for Model-G, and 0.96%
and 1.00%, respectively, for Model-H. For Model-G, based on the
safety failure rate presented in Figure 3, the distribution presented
in Figure 6 and the degradation rate histogram presented in Figure
12, the financial risk calculations (revenue loss or O&M risk rate
calculations) can be performed. As an example, for Model-G , 7%
of the modules which failed in safety (Figure 3) should be
included in the 100% risk rate category, 51% of the modules
which do meet the warranty limit (Figure 6 and left-side of the
dotted blue vertical bar in Figure 12) should be included in the
0% risk rate category, and finally, 42% of the modules which
do not meet the warranty limit (Figure 6 and right-side of the
dotted blue vertical bar of Figure 12) should be included in the
0%-to-100% risk rate category proportional to the number of
modules in each degradation bin of the histogram shown in
Figure 12 (right-side of the dotted blue vertical bar).
Figure 12: Histogram of power degradation rate (%/year) for
Model-G Modules (285 modules selected based on Figure 1 and
Figure 2 approaches; safety failed modules not included)
Figure 13 Histogram of power degradation rate (%/year) for
Model-H Modules (94 modules selected based on Figure 1 and
Figure 2 approaches; safety failed modules, if any, not
included)
g) Visual Inspection and Diode Check Results
Since the Model-H power plant is only 4 years old, no visual or
diode failures were observed. A Pareto chart on the defects
(cosmetic or failure) observed, through visual inspection and
diode check, for the 12-year old Model-G is shown in Figure
14. The dominant defects like encapsulant delamination and
encapsulant yellowing appear to be just cosmetic as there was
no Isc degradation found for the best modules of Model G.
Ribbon-ribbon solder bond failure (see Figure 10), hotspots
leading to burnthrough backsheet (see Figure 15), diode failures
(not shown here) and backsheet delamination around module
corners of these frameless modules (not shown here) are the
four safety failures observed in this power plant. Based on the
PmaxFFVmaxVocImaxIsc
1.0
0.5
0.0
-0.5
-1.0
-1.5
-2.0
De
gra
da
tio
n R
ate
(%
/y
ea
r)
Model-H
Field Age = 4 years
Best String- Best Modules(2 Strings; 6 Modules)

degradation of Vmax and FF, the primary degradation mode is
attributed to the solder bond degradation.
Figure 14 Pareto chart of the defects of Model-G (12-year old)
In the entire power plant, 26 diodes were found to be failed (open
circuited). Out of these failed diodes, only 19% of them failed
randomly throughout the power plant and the other 81% of them
failed in just two strings, 14-4 and 14-5 in Figure 3 (red squares).
As shown in Figure 3, strings 14-4 and 14-5 are located next to
one of the array’s single-axis tracking motors. The reasons for
these concentrated diode failures only in these two strings are not
known. It is known that the moving shadows can cause diode
failures [7]. The possible reasons for these concentrated failures
which occurred only in two strings near the tracking motor may
be speculated as follows: The repair or other maintenance
personnel of the power plant could have parked and moved their
vehicles at that particular location. This could cause a moving
shadow issue. During shaded state the diodes were forward biased
and triggered, and will reach a high temperature. After a shading
occurrence and while the diode is still at a high temperature, the
diode goes into a normal mode where it sees an operating voltage
of 18 cells or roughly 10V. This induces a reverse leakage current
that can exceed the diode reverse current rating at that temperature
(thermal runaway) with the destruction of the diode most likely in
the open circuit mode (8).
Figure 15 Backskin burning of hotspot cell along the cell
interconnect
IV. CONCLUSION A metric definition for the safety failures, reliability failures and degradation loss for the PV modules is provided. These metrics are then used in real power plant evaluations to calculate the distribution among these three metrics. For the 12-year old plant, the results indicate that the mean and median degradations are 0.95 and 0.96 %/year, respectively. The distribution between safety failures, reliability failures and durability loss is determined to be 7%, 42% and 51%, respectively. These metric based field results could potentially be used for the financial risk calculation.
ACKNOWLEDGEMENT The funding and technical support of Salt River Project (SRP) is gratefully acknowledged. This work was partly funded by the DOE/SERIIUS project.
REFERENCES
1. D. Jordan and S. Kurtz, "Photovoltaic Degradation
Rates — An Analytical Review," Progress in
Photovoltaics: Research and Applications, Jan 2013.
2. J. Singh, J. Belmont and G. TamizhMani, "Degradation
Analysis of 1900 PV modules in a Hot-Dry Climate:
Results after 12 to 18 years of field exposure," IEEE
PVSC, 2013.
3. S.V. Janakeeraman et al., “A Statistical Analysis on the
Cell Parameters Responsible for Power Degradation of
Fielded PV Modules in a Hot-Dry Climate,” IEEE
PVSC 2014.
4. S. Shrestha, J. Mallineni, K. Yedidi, B. Knisely, S.
Tatapudi, J. Kuitche and G. TamizhMani, FMECA on
Field Deployed c-Si Modules under Hot-Dry Desert
Climate for Determining Dominant Failure Modes, IEEE
PVSC 2014.
5. D. Staebler and C. Wronski, "Reversible conductivity
changes in dischargeproduced amorphous Si," Applied
Physics Letters, pp. 1-4, 1977.
6. L. Jiang, J. H. Lyou, S. Rane, E. A. Schiff, Q. Wang, Q.
Yuan, "Open-Circuit Voltage Physics in Amorphous
Silicon Solar Cells," Mat. Res. Soc. Symp. Proc., vol. 69,
A18.13.1 2000.
7. J. Posbic, E. Rhee and D. Amin, “High Temperature
Reverse By-Pass Diodes Bias and Failures,” NREL
PVMRW, 2013
8. “How to choose a bypass diode for a silicon panel
junction box,” STMicroelectronics, 2011.
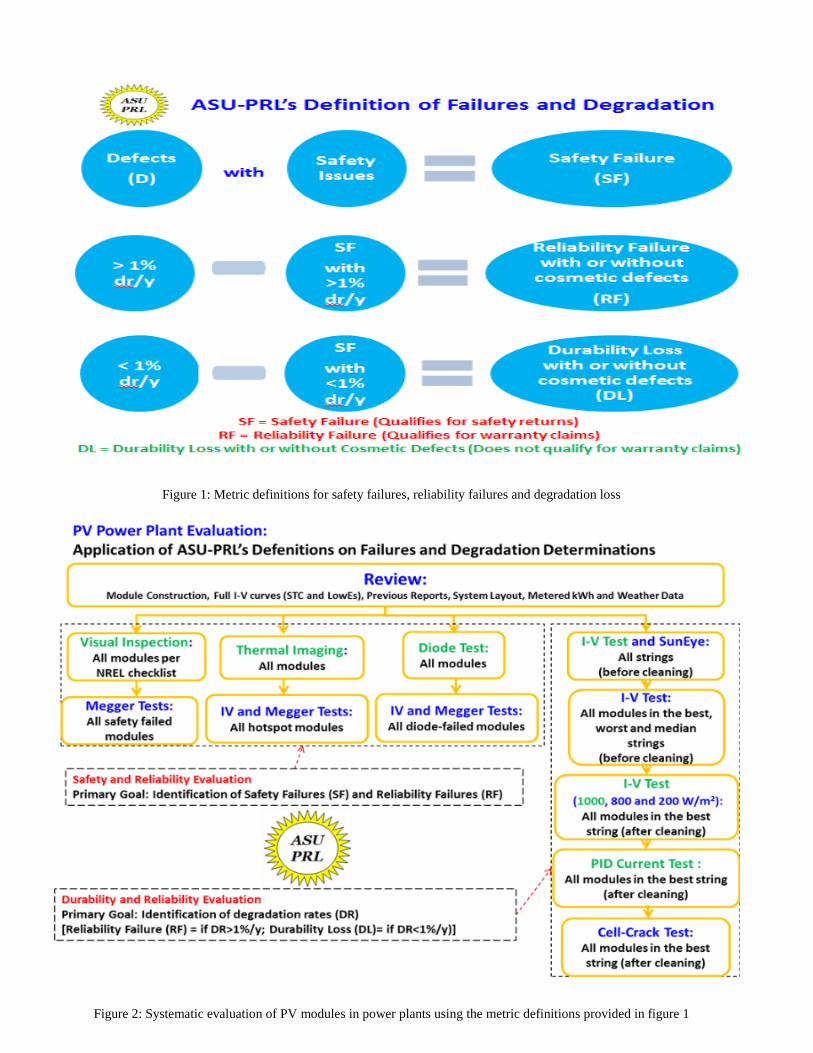
Figure 1: Metric definitions for safety failures, reliability failures and degradation loss
Figure 2: Systematic evaluation of PV modules in power plants using the metric definitions provided in figure 1