Embed Size (px)
Citation preview
European Data Supplement January 2009
OPP Ltd Elsfield Hall
15–17 Elsfield Way Oxford OX2 8EP
UK t: +44 (0)845 603 9958 f: +44 (0)1865 557483
MBTI® Step II instrument
MBTI Step II European Data Supplement
2
Contents
Introduction and overview ............................................................3 What is included in this supplement ...............................................4 Overview of findings ....................................................................5
Facet scale score distributions ...................................................5 Facet scale intercorrelations ......................................................5 Correlations of Step II facet scales with Step I scales....................5 Out-of-preference scores ..........................................................5 Reliability ...............................................................................6 Group differences ....................................................................6
Chapter 2: English (European) data ...............................................7 Chapter 3: Danish data ..............................................................37 Chapter 4: Dutch data ...............................................................61 Chapter 5: French data ..............................................................87 Chapter 6: German data........................................................... 113 Chapter 7: Italian data............................................................. 139 Chapter 8: Norwegian data ....................................................... 161 Chapter 9: Spanish data........................................................... 183 Chapter 10: Swedish data ........................................................ 201 Chapter 11: Bibliography.......................................................... 223
© Copyright 2009 OPP Ltd. All rights reserved.
No portion of this publication may be translated or reproduced in whole or in part, stored in a retrieval system, or transmitted in any form or by any means (electronic, mechanical, photocopying, recording or otherwise) without the prior written permission of the copyright owner. No part of this publication is reproducible under any photocopying licence scheme. OPP Ltd grants the downloader a personal, non-transferable, perpetual, irrevocable right to use the Supplement. The European Data Supplement (‘the Supplement’) is for personal use only and may not be sold on or circulated to third parties.
® MBTI, Myers-Briggs and the Myers-Briggs Type Indicator are registered trade marks of the Myers-Briggs Type Indicator Trust. OPP is licensed to use the trade marks in Europe.
® OPP is a registered trade mark of OPP Ltd in the European Community.
Chapter 1: Introduction and overview
3
Introduction and overview
OPP Ltd is the exclusive European distributor of the MBTI® Step II instrument, and approximately six years ago embarked on a programme to develop and launch a new version of the questionnaire to succeed the existing Form K questionnaire. The Form K questionnaire had been available from OPP in only European English up until that time. This programme led to the launch of a new European MBTI Step II instrument in nine European languages in 2003.
This European data supplement has been written to provide European MBTI Step II users with a single source of information containing a summary of the research data gathered for European language versions of the MBTI Step II questionnaire. It summarises all of the data that have been gathered since the launch of the instrument in 2003. The aim has been to produce a single, easily accessible resource that will better serve multilingual use of the instrument, written in a format that will allow it to be easily updated as additional data become available.
The supplement has been split into discrete chapters, with each language version of the questionnaire having its own dedicated chapter. The aim is that each chapter can be read as a stand-alone document, and hence there is some duplication of text across chapters. The structure of the supplement will allow existing chapters to be updated as more data become available, and new chapters to be added as further language versions of the questionnaire are launched.
MBTI Step II European Data Supplement
4
What is included in this supplement
The supplement contains updated psychometric information gathered for the European Step II instrument since its launch in 2003. As such, it is intended to supplement the data presented in the MBTI Step II (European Edition) Manual (Quenk, Hammer and Majors, 2004), and should be read in conjunction with the manual.
Information is provided on Step II facet score distributions, facet intercorrelations, correlations with Step I dimensions, out-of-preference score frequencies, reliability and group differences data for the following language versions:
• Danish
• Dutch
• English (European)
• French
• German
• Italian
• Norwegian
• Spanish
• Swedish.
Chapter 1: Introduction and overview
5
Overview of findings
What follows is a short summary of several of the key findings. These and other findings are presented in more detail in the relevant language chapters of this supplement. The data described within this supplement show there to be a high degree of consistency across the various European language versions of the Step II questionnaire, and that the psychometric properties of the instrument are highly credible.
Facet scale score distributions
Facet scale descriptive statistics are presented within the supplement for each language version of the questionnaire. In most cases, the means centre quite close to the midpoint of each scale. However, a clear pattern does emerge. The mean scores tend towards the E, S, T and J directions, which is consistent with the most common four-letter type preference amongst the samples of people who have completed the European Step II questionnaire.
Facet scale intercorrelations
Correlations among the Step II facet scales are shown for each language version. Facet scales within each dichotomy consistently correlate more highly (usually substantially more so) with the other scales of the same dichotomy than they do with scales in the other three dichotomies. For example, every E–I facet scale correlates more highly with the other four E–I scales than with any of the S–N, T–F or J–P facet scales. There are, however, a few exceptions to this, for example the T–F scale Questioning–Accommodating which correlates with many scales across dichotomies. These patterns are similar to those found when the European Step II instrument was originally developed.
Correlations of Step II facet scales with Step I scales
Correlations between Step II facet scales and the continuous scores from the MBTI Step I instrument show that in almost all cases the facet scales correlate highly with the corresponding Step I dimension, and considerably lower with the other three dimensions. Again, these correlations are very similar to those found during the original development of the European Step II questionnaire. These correlations, and the consistency with which they have been observed, provide compelling evidence for the theoretical hierarchical structure of the Step II facet scales in relation to the Step I scales.
Out-of-preference scores
It is recognised that the five facet scales relating to each type dimension do not describe the dimension in its entirety; there will not
MBTI Step II European Data Supplement
6
be a precise and exact overlap between, for example, an individual’s score on E–I and their total score across the five facet scales that relate to this dimension. For example, it is not uncommon to see an Enthusiastic Introvert or an Intimate Extravert. Such apparent inconsistencies are usually known as ‘out-of-preference scores’ (OOPS).
Although it is usual to have a number of OOPS in any one profile, it should be unusual to find that OOPS make up more than half of the facet scores relating to any one type dichotomy. Data are presented for all the language versions showing that although this can be found, it is indeed a very infrequent occurrence.
Reliability
The reliability of a test or questionnaire relates to how consistent and precise it is. Internal consistency reliability addresses the question of whether all the questions in a scale measure the same construct. For example, are the Step II facet scales consistent within themselves, and do they hold together well as scales? A common measure of internal consistency reliability, and which is used in this supplement, is coefficient alpha (Cronbach, 1951).
Data presented within this supplement show that, on the whole, the internal consistency reliability is good, especially considering the relatively small number of items in each scale. The three facet scales which do seem to be characterised by lower internal consistency are Practical–Conceptual, Questioning–Accommodating and Critical–Accepting. This pattern is consistent with what was found during the development of the Step II instrument, and is also consistent across language versions.
Group differences
Analyses were conducted to explore links between facet scale scores and various demographic variables. The latter included gender, age, age at which the person left full-time education, occupational level, work area, nationality and employment status. There were many interesting findings but the results were too numerous to summarise in this introduction. The reader is therefore invited to refer to the individual chapters for further details.

Chapter 2: English (European)
7
European Data Supplement English (European)
January 2009
OPP Ltd Elsfield Hall
15–17 Elsfield Way Oxford OX2 8EP
UK t: +44 (0)845 603 9958 f: +44 (0)1865 557483
MBTI® Step II instrument

MBTI Step II European Data Supplement
8
Contents
Introduction ...............................................................................9 Type distribution .......................................................................10
OPPassessment data (representative European English-speaking professional and managerial sample) ....................................11
Properties of the Step II facet scales ............................................12 Facet scale score distribution...................................................12 Facet scale intercorrelations ....................................................14 Correlations of Step II facet scales with Step I scales..................16 Out-of-preference scores ........................................................17 Reliability .............................................................................18 Group differences ..................................................................19
Appendix 1: Sample Description ..................................................34 Sample 1: Data from OPPassessment (representative European
English-speaking professional and managerial sample) ............34
© Copyright 2009 OPP Ltd. All rights reserved.
No portion of this publication may be translated or reproduced in whole or in part, stored in a retrieval system, or transmitted in any form or by any means (electronic, mechanical, photocopying, recording or otherwise) without the prior written permission of the copyright owner. No part of this publication is reproducible under any photocopying licence scheme. OPP Ltd grants the downloader a personal, non-transferable, perpetual, irrevocable right to use the Supplement. The European Data Supplement (‘the Supplement’) is for personal use only and may not be sold on or circulated to third parties.
® MBTI, Myers-Briggs and the Myers-Briggs Type Indicator are registered trade marks of the Myers-Briggs Type Indicator Trust. OPP is licensed to use the trade marks in Europe.
® OPP is a registered trade mark of OPP Ltd in the European Community.
Chapter 2: English (European)
9
Introduction
Data collected for the European MBTI Step II instrument were analysed to produce the findings in this supplement. This is the first data supplement produced for this instrument, and contains all the data gathered to date since the launch of the instrument in 2003. A brief description of the sample is given below. Further details of the sample are provided in Appendix 1.
• The sample consisted of 36,935 individuals who completed the MBTI Step II instrument in European English via the OPPassessment system between 2003 and mid-2008.1 This sample is considered to be representative of the groups of people with whom the European English MBTI Step II instrument has been and will be used for applications such as management development, coaching, counselling and teambuilding. As such, it is likely to represent a cross-section of the European English-speaking professional and managerial population.
The results of the analyses are outlined below.
1 OPPassessment allows personality questionnaires such as the MBTI instrument to be administered via email and/or completed online.
MBTI Step II European Data Supplement
10
Type distribution
Type tables are a way of illustrating the proportion of each type within a particular group. Below is a type table taken from the sample described on the previous page.
For each of the 16 different types, the number of cases, the percentage of the total that this represents and the self-selection ratio (SSR) are shown. The SSR (Myers et al., 1998) is a way of demonstrating whether a given type appears more or less often in a particular group than would be expected given its frequency in a reference group. The UK general population is used as the reference group when calculating the SSRs in this chapter.
An SSR of greater than 1 indicates that a type is over-represented, and an SSR of less than 1 denotes that it is under-represented. Asterisks are used to denote whether the over- or under-representations are statistically significant, based on the results of chi-square analysis.2
2 Chi-square analysis (often abbreviated to χ2) is a technique used to explore whether observed frequency distributions differ significantly from other, predefined, distributions. In this case, the UK general population group is used as the reference group, and the chi-square analysis indicates whether the proportion of people of each type within a particular sample differs significantly from the proportion of people reporting the same type within the reference group.
Chapter 2: English (European)
11
OPPassessment data (representative European English-speaking professional and managerial sample)
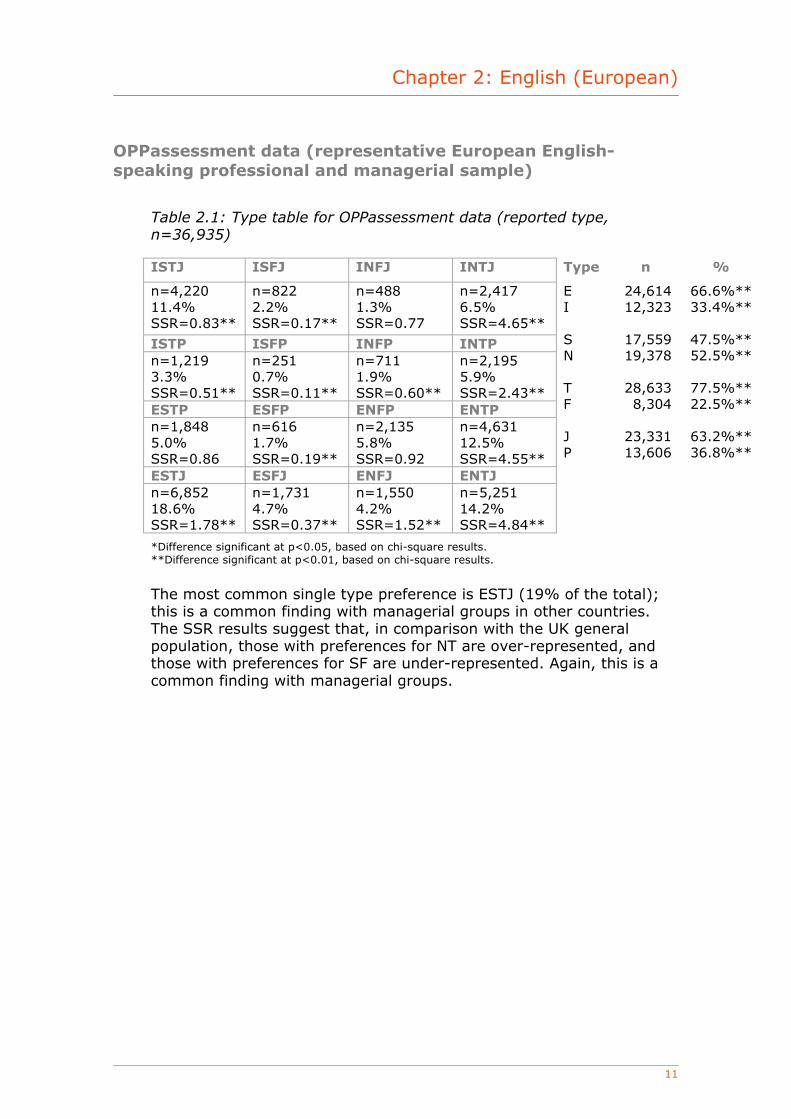
Table 2.1: Type table for OPPassessment data (reported type, n=36,935)
ISTJ ISFJ INFJ INTJ Type n %
n=4,220 11.4% SSR=0.83**
n=822 2.2% SSR=0.17**
n=488 1.3% SSR=0.77
n=2,417 6.5% SSR=4.65**
ISTP ISFP INFP INTP n=1,219 3.3% SSR=0.51**
n=251 0.7% SSR=0.11**
n=711 1.9% SSR=0.60**
n=2,195 5.9% SSR=2.43**
ESTP ESFP ENFP ENTP n=1,848 5.0% SSR=0.86
n=616 1.7% SSR=0.19**
n=2,135 5.8% SSR=0.92
n=4,631 12.5% SSR=4.55**
ESTJ ESFJ ENFJ ENTJ n=6,852 18.6% SSR=1.78**
n=1,731 4.7% SSR=0.37**
n=1,550 4.2% SSR=1.52**
n=5,251 14.2% SSR=4.84**
E I S N T F J P
24,614 12,323
17,559 19,378
28,633 8,304
23,331 13,606
66.6%** 33.4%**
47.5%** 52.5%**
77.5%** 22.5%**
63.2%** 36.8%**
*Difference significant at p<0.05, based on chi-square results. **Difference significant at p<0.01, based on chi-square results.
The most common single type preference is ESTJ (19% of the total); this is a common finding with managerial groups in other countries. The SSR results suggest that, in comparison with the UK general population, those with preferences for NT are over-represented, and those with preferences for SF are under-represented. Again, this is a common finding with managerial groups.

MBTI Step II European Data Supplement
12
Properties of the Step II facet scales
Facet scale score distribution
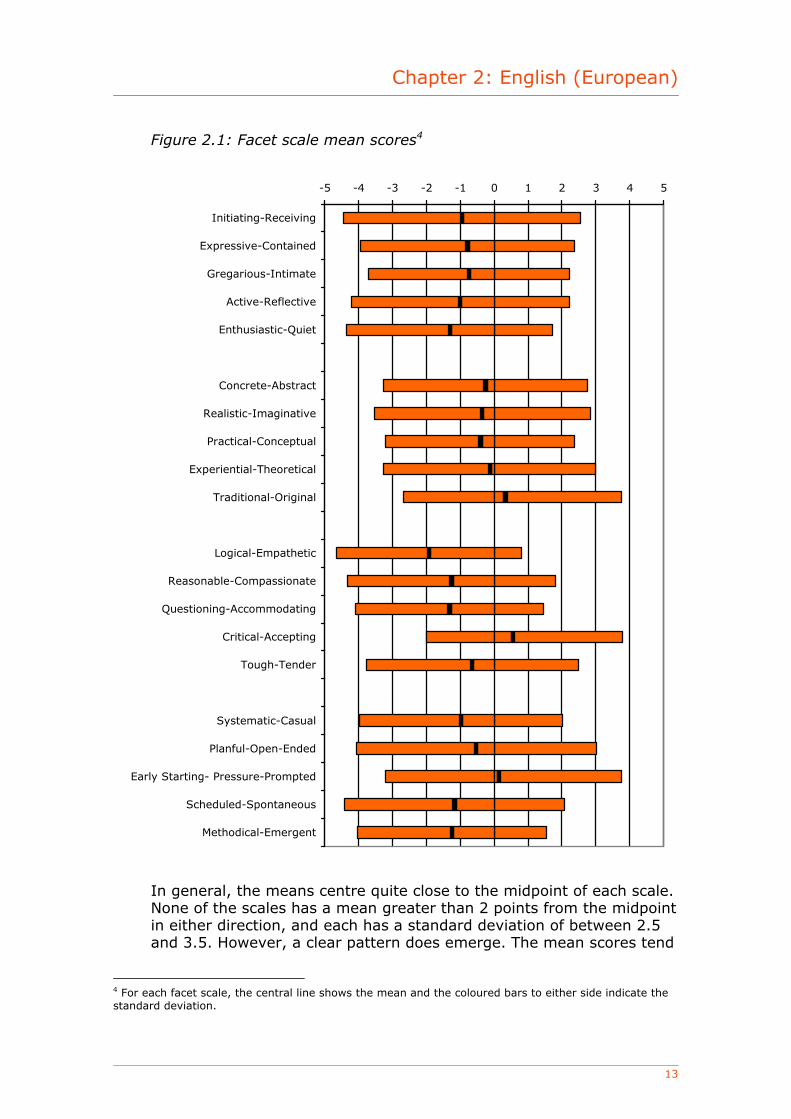
The means and standard deviations of the Step II facets are shown in Table 2.2, and are illustrated graphically in Figure 2.1. The mean score for a scale is calculated by adding together the scores for each individual in the sample and then dividing the sum by the number of individuals. Note that negative values indicate that mean scores are nearer the left-hand pole of the facet and positive values indicate that the mean scores are nearer the right-hand pole. The standard deviation (SD) is a statistical measure describing the degree to which the scores from the sample either bunch up close to or are scattered widely around the mean for the sample.
Table 2.2: Means and standard deviations of the facet scales
Step II facet scale Mean3 SD E–I facet scales Initiating–Receiving –0.95 3.49 Expressive–Contained –0.79 3.16 Gregarious–Intimate –0.75 2.97 Active–Reflective –1.00 3.21 Enthusiastic–Quiet –1.31 3.04 S–N facet scales Concrete–Abstract –0.26 3.02 Realistic–Imaginative –0.36 3.19 Practical–Conceptual –0.41 2.79 Experiential–Theoretical –0.13 3.13 Traditional–Original 0.33 3.01 T–F facet scales Logical–Empathetic –1.92 2.72 Reasonable–Compassionate –1.26 3.08 Questioning–Accommodating –1.32 2.78 Critical–Accepting 0.56 2.57 Tough–Tender –0.65 3.13 J–P facet scales Systematic–Casual –0.98 2.99 Planful–Open-Ended –0.53 3.54 Early Starting–Pressure-Prompted 0.15 3.35 Scheduled–Spontaneous –1.17 3.25 Methodical–Emergent –1.25 2.79
3 Scale means: in Step II reports, scores are given from 5 on one pole, through 0, to 5 on the opposite pole. In compiling statistical information, however, one pole needs to be clearly distinguished from the other. Throughout this data supplement, therefore, a convention has been adopted of scores 5, 4, 3, 2 or 1 on the left-hand pole being assigned values of –5, –4, –3, –2 or –1 and scores on the right-hand pole being assigned positive scores. This does not, of course, imply any suggestion that positive scores are ‘better’ than negative scores.
Chapter 2: English (European)
13
Figure 2.1: Facet scale mean scores4
-5 -4 -3 -2 -1 0 1 2 3 4 5
Initiating-Receiving
Expressive-Contained
Gregarious-Intimate
Active-Reflective
Enthusiastic-Quiet
Concrete-Abstract
Realistic-Imaginative
Practical-Conceptual
Experiential-Theoretical
Traditional-Original
Logical-Empathetic
Reasonable-Compassionate
Questioning-Accommodating
Critical-Accepting
Tough-Tender
Systematic-Casual
Planful-Open-Ended
Early Starting- Pressure-Prompted
Scheduled-Spontaneous
Methodical-Emergent
In general, the means centre quite close to the midpoint of each scale. None of the scales has a mean greater than 2 points from the midpoint in either direction, and each has a standard deviation of between 2.5 and 3.5. However, a clear pattern does emerge. The mean scores tend
4 For each facet scale, the central line shows the mean and the coloured bars to either side indicate the standard deviation.
MBTI Step II European Data Supplement
14
towards the E, S, T and J direction, which is consistent with the most common four-letter type preference amongst this sample. Amongst the group as a whole, there are more individuals with a preference for E, T and J, and the distribution on S–N is nearly equal.
Facet scale intercorrelations
Correlations among the Step II facet scales are shown in Table 2.3. Facet scales within each dichotomy consistently correlate more highly (usually substantially so) with the other scales of the same dichotomy than they do with scales in the other three dichotomies. For example, every E–I facet scale correlates more highly with the other four E–I scales than with any of the S–N, T–F or J–P facet scales.
There is only one scale that correlates significantly more highly with scales in other dichotomies. The T–F scale Questioning–Accommodating correlates with many scales, across dichotomies. For example, it correlates at a level of 0.17 with Enthusiastic–Quiet, at 0.13 with Active–Reflective and at 0.13 with Initiating–Receiving, all of which are on the E–I dichotomy. It correlates negatively at between –0.19 and –0.38 with all of the S–N scales, and at –0.31 with Systematic–Casual on the J–P dichotomy. By way of comparison, Accommodating correlates at between 0.15 and 0.20 with the other four scales on the same dichotomy as itself (T–F). The negative correlations between Questioning–Accommodating and the S–N scales are consistent with findings in the US version of the instrument, and suggests that a questioning approach to differences of opinion seems to be related to a range of Intuitive (N) facets. These patterns are similar to those found when the European Step II instrument was developed.
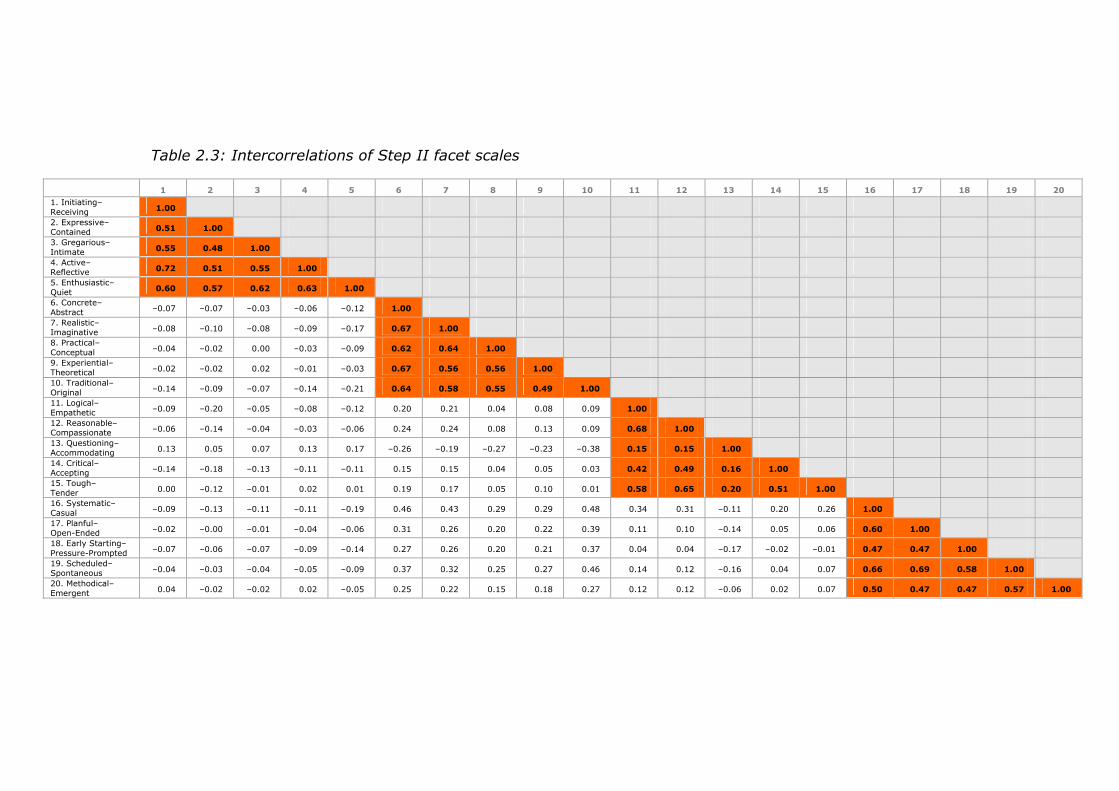
Table 2.3: Intercorrelations of Step II facet scales
1 2 3 4 5 6 7 8 9 10 11 12 13 14 15 16 17 18 19 20
1. Initiating– Receiving 1.00
2. Expressive– Contained 0.51 1.00
3. Gregarious– Intimate 0.55 0.48 1.00
4. Active– Reflective 0.72 0.51 0.55 1.00
5. Enthusiastic– Quiet 0.60 0.57 0.62 0.63 1.00
6. Concrete– Abstract –0.07 –0.07 –0.03 –0.06 –0.12 1.00
7. Realistic– Imaginative –0.08 –0.10 –0.08 –0.09 –0.17 0.67 1.00
8. Practical– Conceptual –0.04 –0.02 0.00 –0.03 –0.09 0.62 0.64 1.00
9. Experiential– Theoretical –0.02 –0.02 0.02 –0.01 –0.03 0.67 0.56 0.56 1.00
10. Traditional– Original –0.14 –0.09 –0.07 –0.14 –0.21 0.64 0.58 0.55 0.49 1.00
11. Logical– Empathetic –0.09 –0.20 –0.05 –0.08 –0.12 0.20 0.21 0.04 0.08 0.09 1.00
12. Reasonable– Compassionate –0.06 –0.14 –0.04 –0.03 –0.06 0.24 0.24 0.08 0.13 0.09 0.68 1.00
13. Questioning– Accommodating 0.13 0.05 0.07 0.13 0.17 –0.26 –0.19 –0.27 –0.23 –0.38 0.15 0.15 1.00
14. Critical– Accepting –0.14 –0.18 –0.13 –0.11 –0.11 0.15 0.15 0.04 0.05 0.03 0.42 0.49 0.16 1.00
15. Tough– Tender 0.00 –0.12 –0.01 0.02 0.01 0.19 0.17 0.05 0.10 0.01 0.58 0.65 0.20 0.51 1.00
16. Systematic– Casual –0.09 –0.13 –0.11 –0.11 –0.19 0.46 0.43 0.29 0.29 0.48 0.34 0.31 –0.11 0.20 0.26 1.00
17. Planful– Open-Ended –0.02 –0.00 –0.01 –0.04 –0.06 0.31 0.26 0.20 0.22 0.39 0.11 0.10 –0.14 0.05 0.06 0.60 1.00
18. Early Starting– Pressure-Prompted –0.07 –0.06 –0.07 –0.09 –0.14 0.27 0.26 0.20 0.21 0.37 0.04 0.04 –0.17 –0.02 –0.01 0.47 0.47 1.00
19. Scheduled– Spontaneous –0.04 –0.03 –0.04 –0.05 –0.09 0.37 0.32 0.25 0.27 0.46 0.14 0.12 –0.16 0.04 0.07 0.66 0.69 0.58 1.00
20. Methodical– Emergent 0.04 –0.02 –0.02 0.02 –0.05 0.25 0.22 0.15 0.18 0.27 0.12 0.12 –0.06 0.02 0.07 0.50 0.47 0.47 0.57 1.00
MBTI Step II European Data Supplement
16
Correlations of Step II facet scales with Step I scales
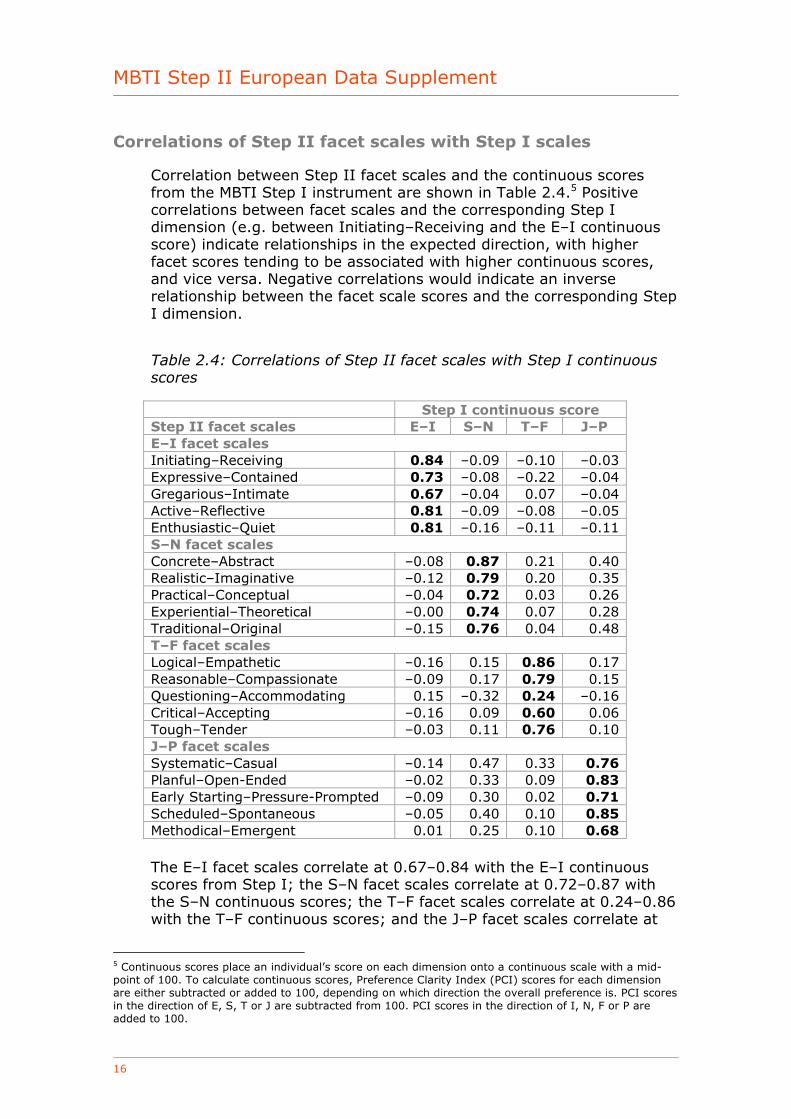
Correlation between Step II facet scales and the continuous scores from the MBTI Step I instrument are shown in Table 2.4.5 Positive correlations between facet scales and the corresponding Step I dimension (e.g. between Initiating–Receiving and the E–I continuous score) indicate relationships in the expected direction, with higher facet scores tending to be associated with higher continuous scores, and vice versa. Negative correlations would indicate an inverse relationship between the facet scale scores and the corresponding Step I dimension.
Table 2.4: Correlations of Step II facet scales with Step I continuous scores
Step I continuous score Step II facet scales E–I S–N T–F J–P E–I facet scales Initiating–Receiving 0.84 –0.09 –0.10 –0.03 Expressive–Contained 0.73 –0.08 –0.22 –0.04 Gregarious–Intimate 0.67 –0.04 0.07 –0.04 Active–Reflective 0.81 –0.09 –0.08 –0.05 Enthusiastic–Quiet 0.81 –0.16 –0.11 –0.11 S–N facet scales Concrete–Abstract –0.08 0.87 0.21 0.40 Realistic–Imaginative –0.12 0.79 0.20 0.35 Practical–Conceptual –0.04 0.72 0.03 0.26 Experiential–Theoretical –0.00 0.74 0.07 0.28 Traditional–Original –0.15 0.76 0.04 0.48 T–F facet scales Logical–Empathetic –0.16 0.15 0.86 0.17 Reasonable–Compassionate –0.09 0.17 0.79 0.15 Questioning–Accommodating 0.15 –0.32 0.24 –0.16 Critical–Accepting –0.16 0.09 0.60 0.06 Tough–Tender –0.03 0.11 0.76 0.10 J–P facet scales Systematic–Casual –0.14 0.47 0.33 0.76 Planful–Open-Ended –0.02 0.33 0.09 0.83 Early Starting–Pressure-Prompted –0.09 0.30 0.02 0.71 Scheduled–Spontaneous –0.05 0.40 0.10 0.85 Methodical–Emergent 0.01 0.25 0.10 0.68
The E–I facet scales correlate at 0.67–0.84 with the E–I continuous scores from Step I; the S–N facet scales correlate at 0.72–0.87 with the S–N continuous scores; the T–F facet scales correlate at 0.24–0.86 with the T–F continuous scores; and the J–P facet scales correlate at
5 Continuous scores place an individual’s score on each dimension onto a continuous scale with a mid-point of 100. To calculate continuous scores, Preference Clarity Index (PCI) scores for each dimension are either subtracted or added to 100, depending on which direction the overall preference is. PCI scores in the direction of E, S, T or J are subtracted from 100. PCI scores in the direction of I, N, F or P are added to 100.
Chapter 2: English (European)
17
0.68–0.83 with the J–P continuous scores. The scale that showed the lowest correlation with its associated Step I continuous score was Questioning–Accommodating at 0.24. This scale is also lowest on internal consistency (see page 18), and has been previously found to have the lowest test–retest reliability (Quenk, Hammer and Majors, 2004), which would result in the true correlations being underestimated.
These correlations are very similar to those found during the development of the Step II questionnaire. This consistency, alongside the fact that the correlations between Step II facet scales and Step I continuous scores associated with their own dimension are substantially higher than correlations with the other three dimensions, provides compelling evidence for the theoretical hierarchical structure of the Step II facet scales in relation to the Step I scales.
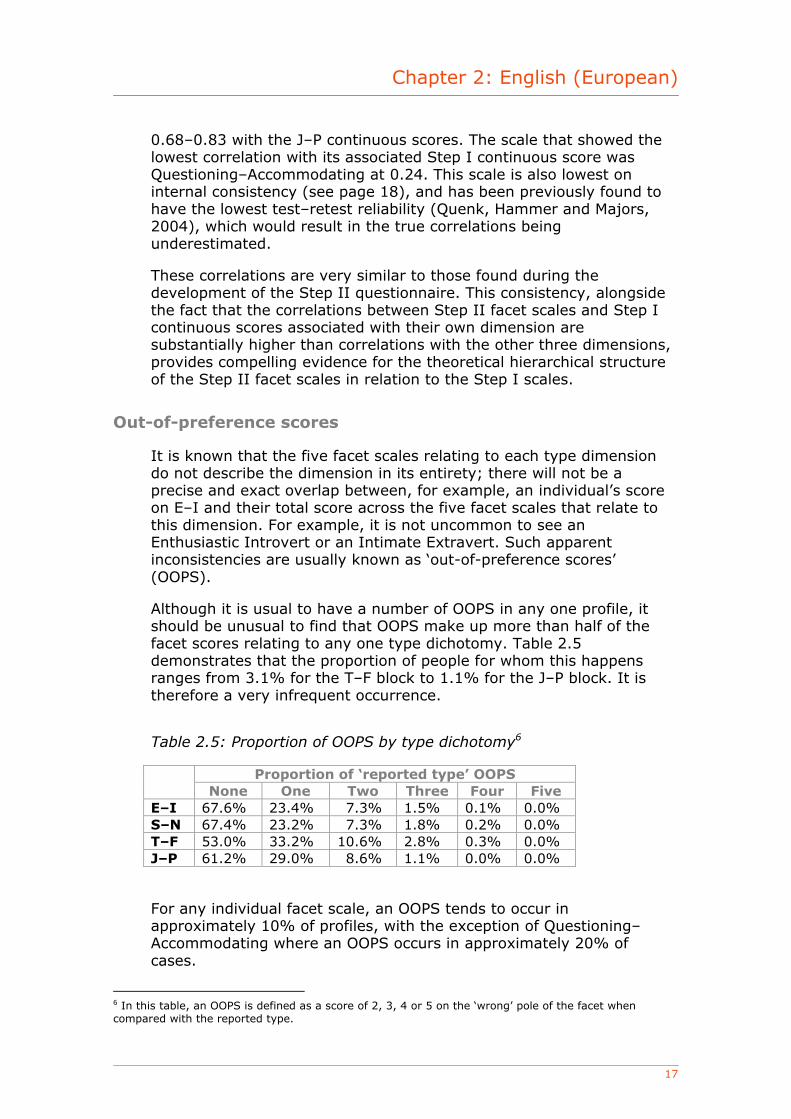
Out-of-preference scores
It is known that the five facet scales relating to each type dimension do not describe the dimension in its entirety; there will not be a precise and exact overlap between, for example, an individual’s score on E–I and their total score across the five facet scales that relate to this dimension. For example, it is not uncommon to see an Enthusiastic Introvert or an Intimate Extravert. Such apparent inconsistencies are usually known as ‘out-of-preference scores’ (OOPS).
Although it is usual to have a number of OOPS in any one profile, it should be unusual to find that OOPS make up more than half of the facet scores relating to any one type dichotomy. Table 2.5 demonstrates that the proportion of people for whom this happens ranges from 3.1% for the T–F block to 1.1% for the J–P block. It is therefore a very infrequent occurrence.
Table 2.5: Proportion of OOPS by type dichotomy6
Proportion of ‘reported type’ OOPS None One Two Three Four Five
E–I 67.6% 23.4% 7.3% 1.5% 0.1% 0.0% S–N 67.4% 23.2% 7.3% 1.8% 0.2% 0.0% T–F 53.0% 33.2% 10.6% 2.8% 0.3% 0.0% J–P 61.2% 29.0% 8.6% 1.1% 0.0% 0.0%
For any individual facet scale, an OOPS tends to occur in approximately 10% of profiles, with the exception of Questioning–Accommodating where an OOPS occurs in approximately 20% of cases.
6 In this table, an OOPS is defined as a score of 2, 3, 4 or 5 on the ‘wrong’ pole of the facet when compared with the reported type.
MBTI Step II European Data Supplement
18
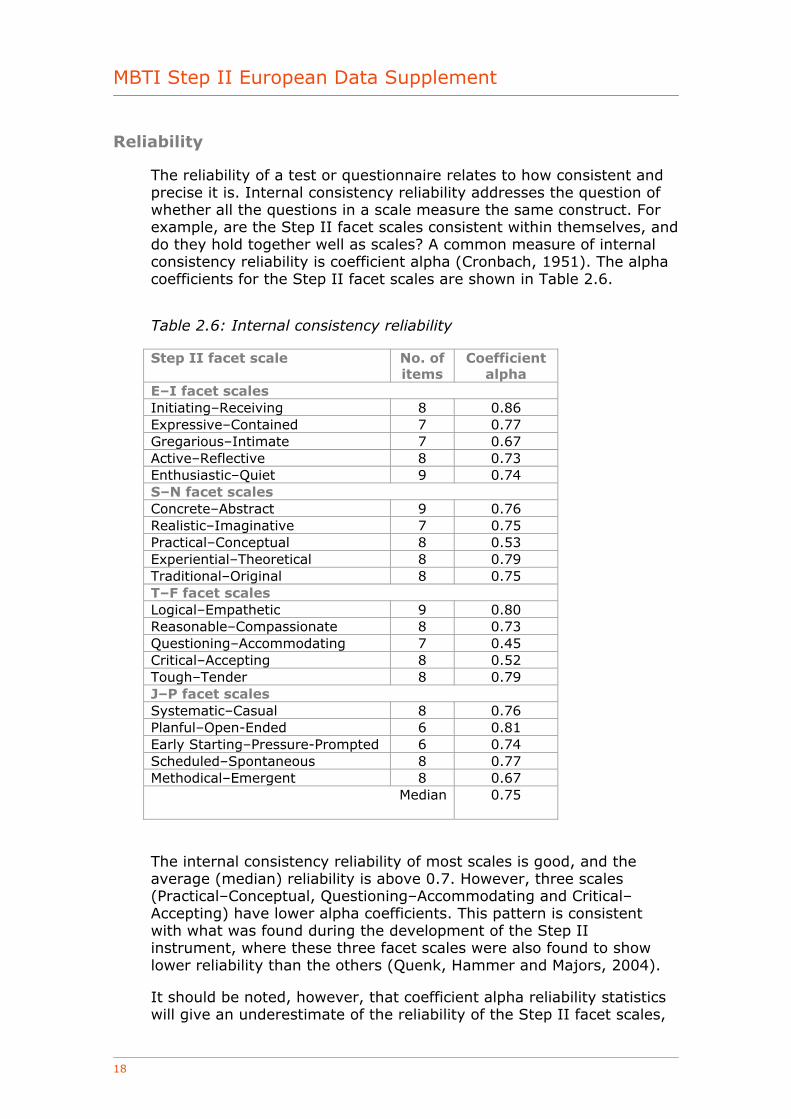
Reliability
The reliability of a test or questionnaire relates to how consistent and precise it is. Internal consistency reliability addresses the question of whether all the questions in a scale measure the same construct. For example, are the Step II facet scales consistent within themselves, and do they hold together well as scales? A common measure of internal consistency reliability is coefficient alpha (Cronbach, 1951). The alpha coefficients for the Step II facet scales are shown in Table 2.6.
Table 2.6: Internal consistency reliability
Step II facet scale No. of items
Coefficient alpha
E–I facet scales Initiating–Receiving 8 0.86 Expressive–Contained 7 0.77 Gregarious–Intimate 7 0.67 Active–Reflective 8 0.73 Enthusiastic–Quiet 9 0.74 S–N facet scales Concrete–Abstract 9 0.76 Realistic–Imaginative 7 0.75 Practical–Conceptual 8 0.53 Experiential–Theoretical 8 0.79 Traditional–Original 8 0.75 T–F facet scales Logical–Empathetic 9 0.80 Reasonable–Compassionate 8 0.73 Questioning–Accommodating 7 0.45 Critical–Accepting 8 0.52 Tough–Tender 8 0.79 J–P facet scales Systematic–Casual 8 0.76 Planful–Open-Ended 6 0.81 Early Starting–Pressure-Prompted 6 0.74 Scheduled–Spontaneous 8 0.77 Methodical–Emergent 8 0.67
Median 0.75
The internal consistency reliability of most scales is good, and the average (median) reliability is above 0.7. However, three scales (Practical–Conceptual, Questioning–Accommodating and Critical–Accepting) have lower alpha coefficients. This pattern is consistent with what was found during the development of the Step II instrument, where these three facet scales were also found to show lower reliability than the others (Quenk, Hammer and Majors, 2004).
It should be noted, however, that coefficient alpha reliability statistics will give an underestimate of the reliability of the Step II facet scales,
Chapter 2: English (European)
19
given the use of item response theory (IRT) methods in the actual scoring process.7
Group differences
This section looks at the way in which people from different groups responded to the European English version of the European Step II questionnaire.
Gender
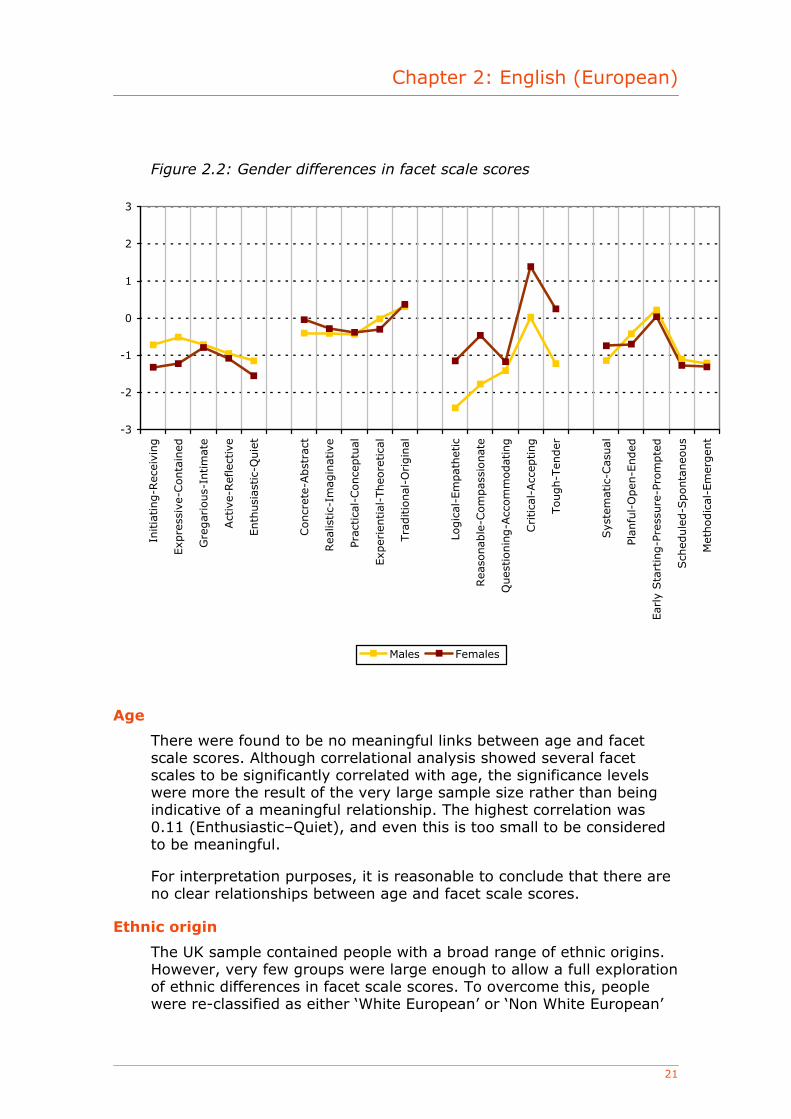
The means and standard deviations of the Step II facet scales are shown separately for males and females in Table 2.7, along with the difference in mean scores. This is represented graphically in Figure 2.2. Statistically significant differences were found between male and female mean scores for 18 of the 20 facet scales, with some consistent patterns emerging.
• On the E–I facet scales, all five mean scores tended slightly toward the E pole for both males and females. For each facet, the mean score was significantly further toward the E pole for females than for males.
• On the S–N facet scales, four of the five mean scores tended slightly toward the S pole for both males and females. The only statistically significant gender differences were for Concrete–Abstract and Realistic–Imaginative, where male mean scores tended more towards the S pole than those for females, and Experiential–Theoretical where female mean scores tended more towards the S pole than those for males.
• On the T–F facet scales, three mean scores tended toward the T pole for both males and females, and one toward the F pole. The other facet (Tough–Tender) tended towards the T pole for males and slightly towards the F pole for females. For all five facets, the mean score was slightly further toward the T pole for males than for females.
• On the J–P facet scales, four of the five mean scores tended toward the J pole for both males and females. For each facet except Systematic–Casual, the mean score was slightly further toward the J pole for females than for males. The opposite was the case for Systematic–Casual.
7 Item response theory (IRT) is an approach to measurement that is concerned with modelling the relationship between item responses and the underlying characteristic assessed by the scale or test the item is designed to measure. IRT can be used to select items for a test and/or to score the items.
MBTI Step II European Data Supplement
20
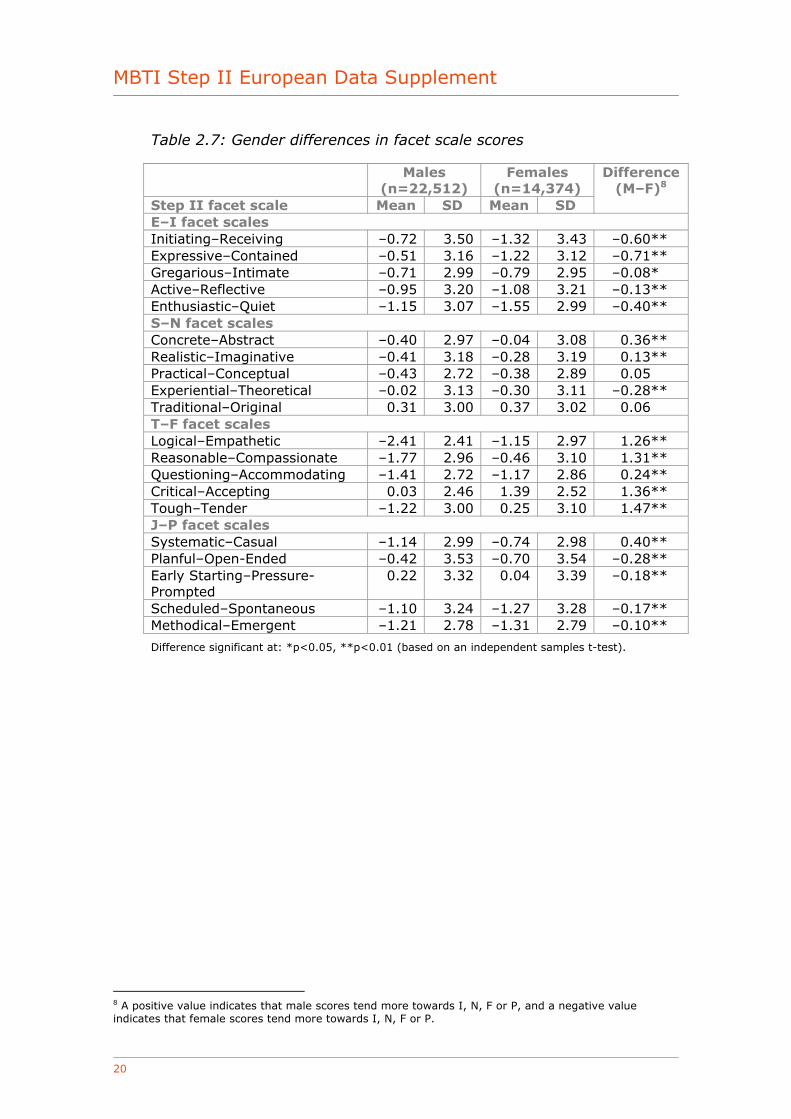
Table 2.7: Gender differences in facet scale scores
Males (n=22,512)
Females (n=14,374)
Step II facet scale Mean SD Mean SD
Difference (M–F)8
E–I facet scales Initiating–Receiving –0.72 3.50 –1.32 3.43 –0.60** Expressive–Contained –0.51 3.16 –1.22 3.12 –0.71** Gregarious–Intimate –0.71 2.99 –0.79 2.95 –0.08* Active–Reflective –0.95 3.20 –1.08 3.21 –0.13** Enthusiastic–Quiet –1.15 3.07 –1.55 2.99 –0.40** S–N facet scales Concrete–Abstract –0.40 2.97 –0.04 3.08 0.36** Realistic–Imaginative –0.41 3.18 –0.28 3.19 0.13** Practical–Conceptual –0.43 2.72 –0.38 2.89 0.05 Experiential–Theoretical –0.02 3.13 –0.30 3.11 –0.28** Traditional–Original 0.31 3.00 0.37 3.02 0.06 T–F facet scales Logical–Empathetic –2.41 2.41 –1.15 2.97 1.26** Reasonable–Compassionate –1.77 2.96 –0.46 3.10 1.31** Questioning–Accommodating –1.41 2.72 –1.17 2.86 0.24** Critical–Accepting 0.03 2.46 1.39 2.52 1.36** Tough–Tender –1.22 3.00 0.25 3.10 1.47** J–P facet scales Systematic–Casual –1.14 2.99 –0.74 2.98 0.40** Planful–Open-Ended –0.42 3.53 –0.70 3.54 –0.28** Early Starting–Pressure-Prompted
0.22 3.32 0.04 3.39 –0.18**
Scheduled–Spontaneous –1.10 3.24 –1.27 3.28 –0.17** Methodical–Emergent –1.21 2.78 –1.31 2.79 –0.10**
Difference significant at: *p<0.05, **p<0.01 (based on an independent samples t-test).
8 A positive value indicates that male scores tend more towards I, N, F or P, and a negative value indicates that female scores tend more towards I, N, F or P.
Chapter 2: English (European)
21
Figure 2.2: Gender differences in facet scale scores
-3
-2
-1
0
1
2
3
Initia
ting-R
ecei
ving
Exp
ress
ive-
Conta
ined
Gre
gar
ious-
Intim
ate
Act
ive-
Ref
lect
ive
Enth
usi
astic-
Quie
t
Concr
ete-
Abst
ract
Rea
listic-
Imag
inat
ive
Prac
tica
l-Conce
ptu
al
Exp
erie
ntial
-Theo
retica
l
Tra
ditio
nal
-Origin
al
Logic
al-E
mpat
het
ic
Rea
sonab
le-C
om
pas
sionat
e
Ques
tionin
g-A
ccom
modat
ing
Critica
l-Acc
epting
Tough-T
ender
Sys
tem
atic
-Cas
ual
Plan
ful-
Open
-Ended
Ear
ly S
tart
ing-P
ress
ure
-Pro
mpte
d
Sch
edule
d-S
ponta
neo
us
Met
hodic
al-E
mer
gen
t
Males Females
Age
There were found to be no meaningful links between age and facet scale scores. Although correlational analysis showed several facet scales to be significantly correlated with age, the significance levels were more the result of the very large sample size rather than being indicative of a meaningful relationship. The highest correlation was 0.11 (Enthusiastic–Quiet), and even this is too small to be considered to be meaningful.
For interpretation purposes, it is reasonable to conclude that there are no clear relationships between age and facet scale scores.
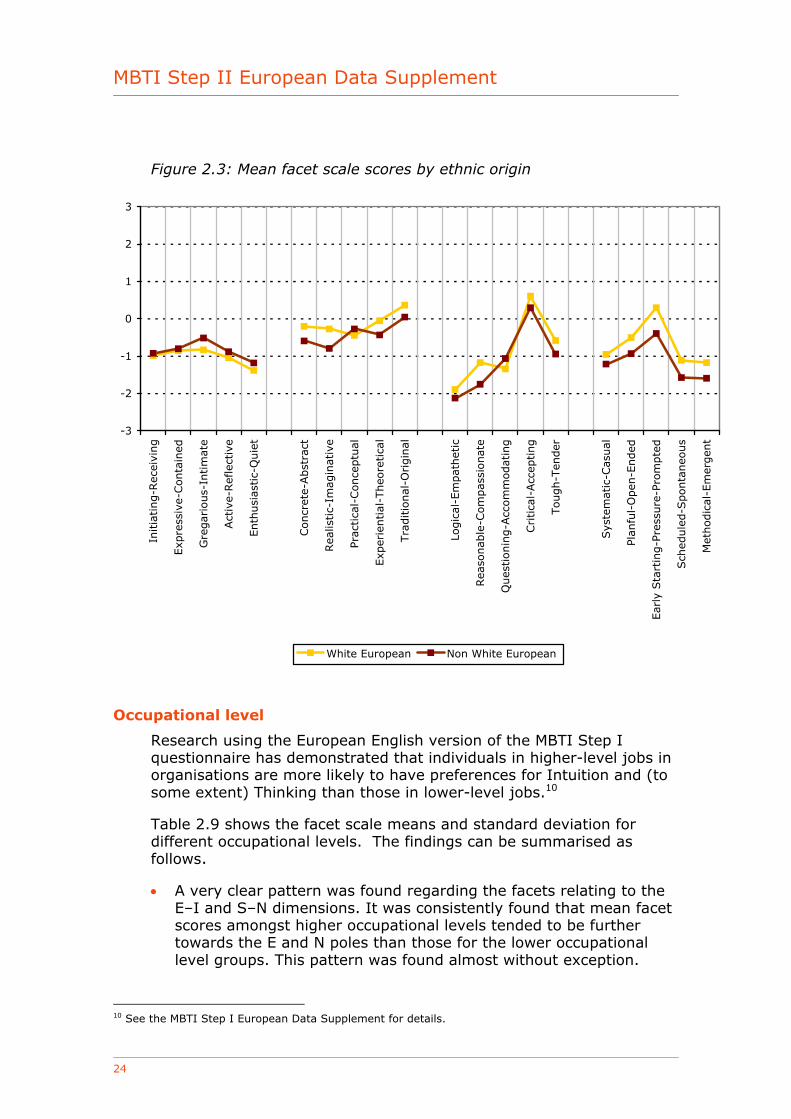
Ethnic origin
The UK sample contained people with a broad range of ethnic origins. However, very few groups were large enough to allow a full exploration of ethnic differences in facet scale scores. To overcome this, people were re-classified as either ‘White European’ or ‘Non White European’
MBTI Step II European Data Supplement
22
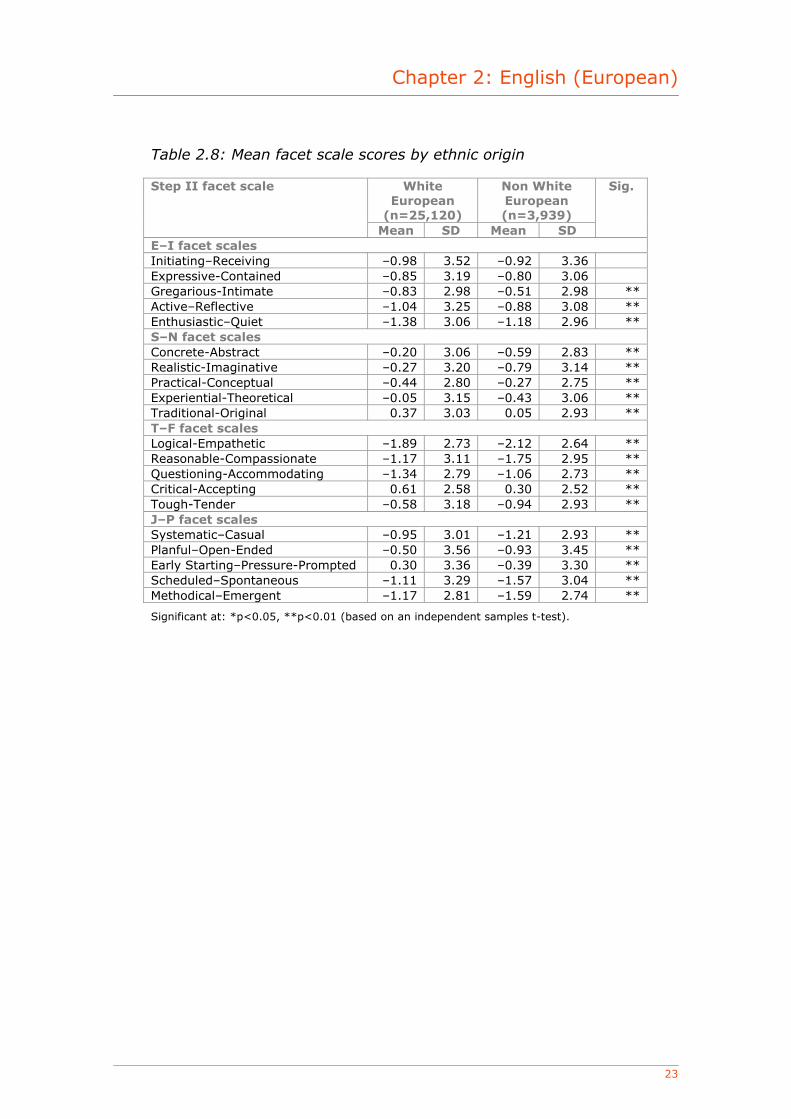
for the purposes of analysis. A comparison of mean facet scales across the two groups highlighted some interesting differences, and is shown in Table 2.8 and Figure 2.3. It is worth noting that although the differences below were statistically significant,9 none of the differences in mean scores was more than 0.7 points. In real terms this is actually quite small.
• On three of the five facet scales linked to the E–I dimension (Gregarious–Intimate, Active–Reflective, Enthusiastic–Quiet), the White European group mean scores were significantly further towards the E pole than those for the Non White European group. There were no significant differences between groups for the other two facet scales (Initiating–Receiving, Expressive–Contained).
• On four of the five facet scales linked to the S–N dimension (Concrete–Abstract, Realistic–Imaginative, Experiential–Theoretical, Traditional–Original), the Non White European group mean scores were significantly further towards the S pole than those for the White European group. On the remaining facet scale (Practical–Conceptual), the White European group mean scores were significantly further towards the S pole.
• On four of the five facet scales linked to the T–F dimension (Logical–Empathetic, Reasonable–Compassionate, Critical–Accepting, Tough–Tender), the Non White European group mean scores were significantly further towards the T pole than those for the White European group. On the remaining facet scale (Questioning–Accommodating), the White European group mean scores were significantly further towards the T pole.
• On all five of the facet scales linked to the J–P dimension (Systematic–Casual, Planful–Open-Ended, Early Starting–Pressure-Prompted, Scheduled–Spontaneous, Methodical–Emergent), the Non White European group mean scores were significantly further towards the J pole than those for the White European group.
9 p<0.01, based on a one-way analysis of variance.
Chapter 2: English (European)
23
Table 2.8: Mean facet scale scores by ethnic origin
White European
(n=25,120)
Non White European (n=3,939)
Step II facet scale
Mean SD Mean SD
Sig.
E–I facet scales Initiating–Receiving –0.98 3.52 –0.92 3.36 Expressive-Contained –0.85 3.19 –0.80 3.06 Gregarious-Intimate –0.83 2.98 –0.51 2.98 ** Active–Reflective –1.04 3.25 –0.88 3.08 ** Enthusiastic–Quiet –1.38 3.06 –1.18 2.96 ** S–N facet scales Concrete-Abstract –0.20 3.06 –0.59 2.83 ** Realistic-Imaginative –0.27 3.20 –0.79 3.14 ** Practical-Conceptual –0.44 2.80 –0.27 2.75 ** Experiential-Theoretical –0.05 3.15 –0.43 3.06 ** Traditional-Original 0.37 3.03 0.05 2.93 ** T–F facet scales Logical-Empathetic –1.89 2.73 –2.12 2.64 ** Reasonable-Compassionate –1.17 3.11 –1.75 2.95 ** Questioning-Accommodating –1.34 2.79 –1.06 2.73 ** Critical-Accepting 0.61 2.58 0.30 2.52 ** Tough-Tender –0.58 3.18 –0.94 2.93 ** J–P facet scales Systematic–Casual –0.95 3.01 –1.21 2.93 ** Planful–Open-Ended –0.50 3.56 –0.93 3.45 ** Early Starting–Pressure-Prompted 0.30 3.36 –0.39 3.30 ** Scheduled–Spontaneous –1.11 3.29 –1.57 3.04 ** Methodical–Emergent –1.17 2.81 –1.59 2.74 **
Significant at: *p<0.05, **p<0.01 (based on an independent samples t-test).
MBTI Step II European Data Supplement
24
Figure 2.3: Mean facet scale scores by ethnic origin
-3
-2
-1
0
1
2
3
Initia
ting-R
ecei
ving
Exp
ress
ive-
Conta
ined
Gre
gar
ious-
Intim
ate
Act
ive-
Ref
lect
ive
Enth
usi
astic-
Quie
t
Concr
ete-
Abst
ract
Rea
listic-
Imag
inat
ive
Prac
tica
l-Conce
ptu
al
Exp
erie
ntial
-Theo
retica
l
Tra
ditio
nal
-Ori
gin
al
Logic
al-E
mpat
het
ic
Rea
sonab
le-C
om
pas
sionat
e
Ques
tionin
g-A
ccom
modat
ing
Cri
tica
l-Acc
epting
Tough-T
ender
Sys
tem
atic
-Cas
ual
Plan
ful-
Open
-Ended
Ear
ly S
tart
ing-P
ress
ure
-Pro
mpte
d
Sch
edule
d-S
ponta
neo
us
Met
hodic
al-E
mer
gen
t
White European Non White European
Occupational level
Research using the European English version of the MBTI Step I questionnaire has demonstrated that individuals in higher-level jobs in organisations are more likely to have preferences for Intuition and (to some extent) Thinking than those in lower-level jobs.10
Table 2.9 shows the facet scale means and standard deviation for different occupational levels. The findings can be summarised as follows.
• A very clear pattern was found regarding the facets relating to the E–I and S–N dimensions. It was consistently found that mean facet scores amongst higher occupational levels tended to be further towards the E and N poles than those for the lower occupational level groups. This pattern was found almost without exception.
10 See the MBTI Step I European Data Supplement for details.
Chapter 2: English (European)
25
• A reasonably consistent pattern was found regarding the facets relating to the T–F dimension. Mean facet scores amongst higher occupational levels tended to be further towards the T pole than those for the lower occupational level groups. The employee group mean scores were consistently considerably further towards the F pole (or less towards the T pole) than any other groups. This could be a reflection of the fact that females formed a considerably higher proportion of the employee group than they did of other groups.
• There were no clear overall patterns regarding the facets in the J–P preference block. The only consistent finding was that mean facet scores amongst higher occupational levels tended to be further towards the P pole of Early Starting–Pressure-Prompted than those for the lower occupational level groups.
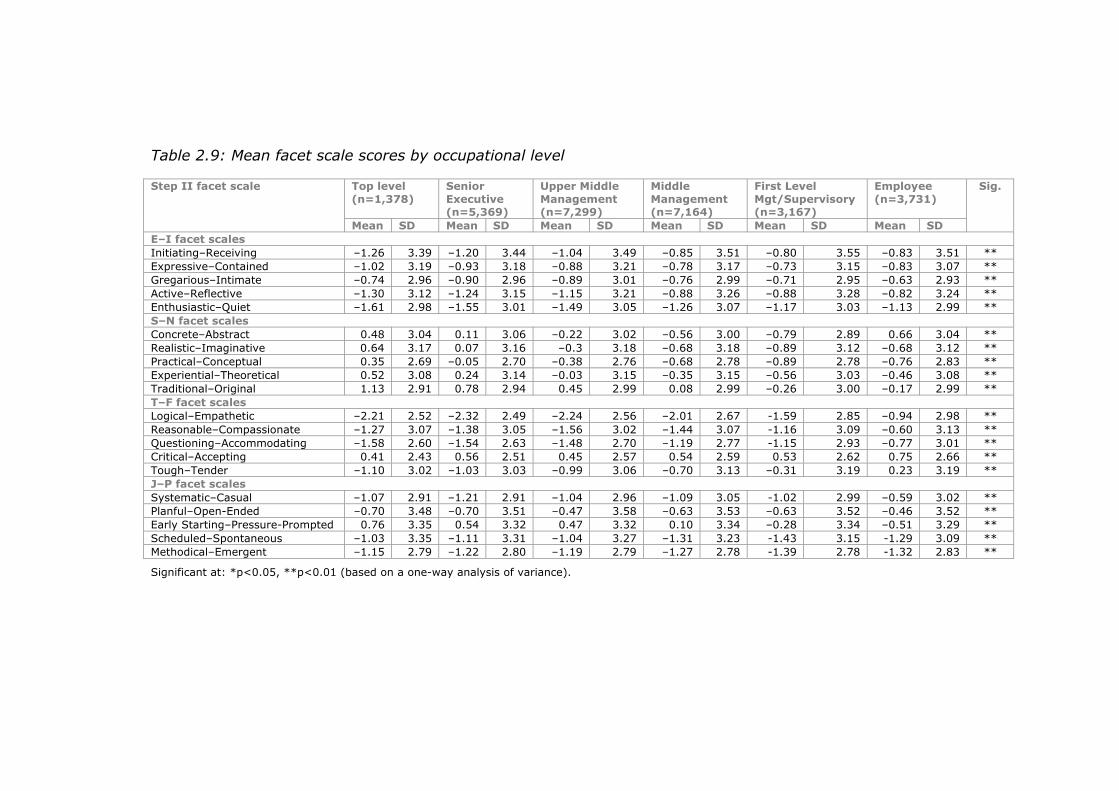
Table 2.9: Mean facet scale scores by occupational level
Top level (n=1,378)
Senior Executive (n=5,369)
Upper Middle Management (n=7,299)
Middle Management (n=7,164)
First Level Mgt/Supervisory (n=3,167)
Employee (n=3,731)
Step II facet scale
Mean SD Mean SD Mean SD Mean SD Mean SD Mean SD
Sig.
E–I facet scales Initiating–Receiving –1.26 3.39 –1.20 3.44 –1.04 3.49 –0.85 3.51 –0.80 3.55 –0.83 3.51 ** Expressive–Contained –1.02 3.19 –0.93 3.18 –0.88 3.21 –0.78 3.17 –0.73 3.15 –0.83 3.07 ** Gregarious–Intimate –0.74 2.96 –0.90 2.96 –0.89 3.01 –0.76 2.99 –0.71 2.95 –0.63 2.93 ** Active–Reflective –1.30 3.12 –1.24 3.15 –1.15 3.21 –0.88 3.26 –0.88 3.28 –0.82 3.24 ** Enthusiastic–Quiet –1.61 2.98 –1.55 3.01 –1.49 3.05 –1.26 3.07 –1.17 3.03 –1.13 2.99 ** S–N facet scales Concrete–Abstract 0.48 3.04 0.11 3.06 –0.22 3.02 –0.56 3.00 –0.79 2.89 0.66 3.04 ** Realistic–Imaginative 0.64 3.17 0.07 3.16 –0.3 3.18 –0.68 3.18 –0.89 3.12 –0.68 3.12 ** Practical–Conceptual 0.35 2.69 –0.05 2.70 –0.38 2.76 –0.68 2.78 –0.89 2.78 –0.76 2.83 ** Experiential–Theoretical 0.52 3.08 0.24 3.14 –0.03 3.15 –0.35 3.15 –0.56 3.03 –0.46 3.08 ** Traditional–Original 1.13 2.91 0.78 2.94 0.45 2.99 0.08 2.99 –0.26 3.00 –0.17 2.99 ** T–F facet scales Logical–Empathetic –2.21 2.52 –2.32 2.49 –2.24 2.56 –2.01 2.67 -1.59 2.85 –0.94 2.98 ** Reasonable–Compassionate –1.27 3.07 –1.38 3.05 –1.56 3.02 –1.44 3.07 -1.16 3.09 –0.60 3.13 ** Questioning–Accommodating –1.58 2.60 –1.54 2.63 –1.48 2.70 –1.19 2.77 -1.15 2.93 –0.77 3.01 ** Critical–Accepting 0.41 2.43 0.56 2.51 0.45 2.57 0.54 2.59 0.53 2.62 0.75 2.66 ** Tough–Tender –1.10 3.02 –1.03 3.03 –0.99 3.06 –0.70 3.13 –0.31 3.19 0.23 3.19 ** J–P facet scales Systematic–Casual –1.07 2.91 –1.21 2.91 –1.04 2.96 –1.09 3.05 -1.02 2.99 –0.59 3.02 ** Planful–Open-Ended –0.70 3.48 –0.70 3.51 –0.47 3.58 –0.63 3.53 –0.63 3.52 –0.46 3.52 ** Early Starting–Pressure-Prompted 0.76 3.35 0.54 3.32 0.47 3.32 0.10 3.34 –0.28 3.34 –0.51 3.29 ** Scheduled–Spontaneous –1.03 3.35 –1.11 3.31 –1.04 3.27 –1.31 3.23 -1.43 3.15 -1.29 3.09 ** Methodical–Emergent –1.15 2.79 –1.22 2.80 –1.19 2.79 –1.27 2.78 -1.39 2.78 -1.32 2.83 **
Significant at: *p<0.05, **p<0.01 (based on a one-way analysis of variance).
Chapter 2: English (European)
27
Education
Specific educational qualifications were not collected for the OPPassessment sample; however, the age at which individuals left full-time education was. No significant and meaningful correlations were found between the age at which people left full-time education and their facet scale scores. All the correlations were less than 0.1, except for the correlation with Practical–Conceptual, which was 0.14. This suggests that those who left education at a later age are more likely to score towards the N pole on this facet scale.
Work area
Information regarding the area of work people engage in was collected for the group. Many different categories were used, but for the purposes of analysis the focus was on the five most commonly occurring. These were as follows:
• Finance
• HR, training, guidance
• Sales, customer service
• Business services
• IT.
Table 2.10 shows the facet scale means and standard deviation for these five work areas. The findings can be summarised as follows.
• An interesting pattern was found regarding the facets relating to the E–I dimension. Although mean scores for all groups tended towards the E pole for each facet scale, scores were considerably further towards the E pole for the ‘Sales, customer service’ and ‘HR, training, guidance’ groups than for the ‘Finance’ and ‘IT’ groups. Mean scores for the ‘Business services’ group fell somewhere in between.
• On facets relating to the S–N dimension, mean scores generally tended towards the S pole for all groups except ‘HR, training, guidance’, scores for which all tended towards the N pole.
• The most noticeable pattern regarding the facets in the T–F preference block was that although means scores for all groups tended towards the T pole on four out of the five facet scales, scores for all groups tended towards the F pole for the Critical–Accepting facet scale. This is a common finding with this scale. It was also observed that the mean scores across facet scales fell less towards the T pole for the ‘HR, training, guidance’ groups than for the other groups.
• There were no clear overall patterns regarding the facets in the J–P preference block.
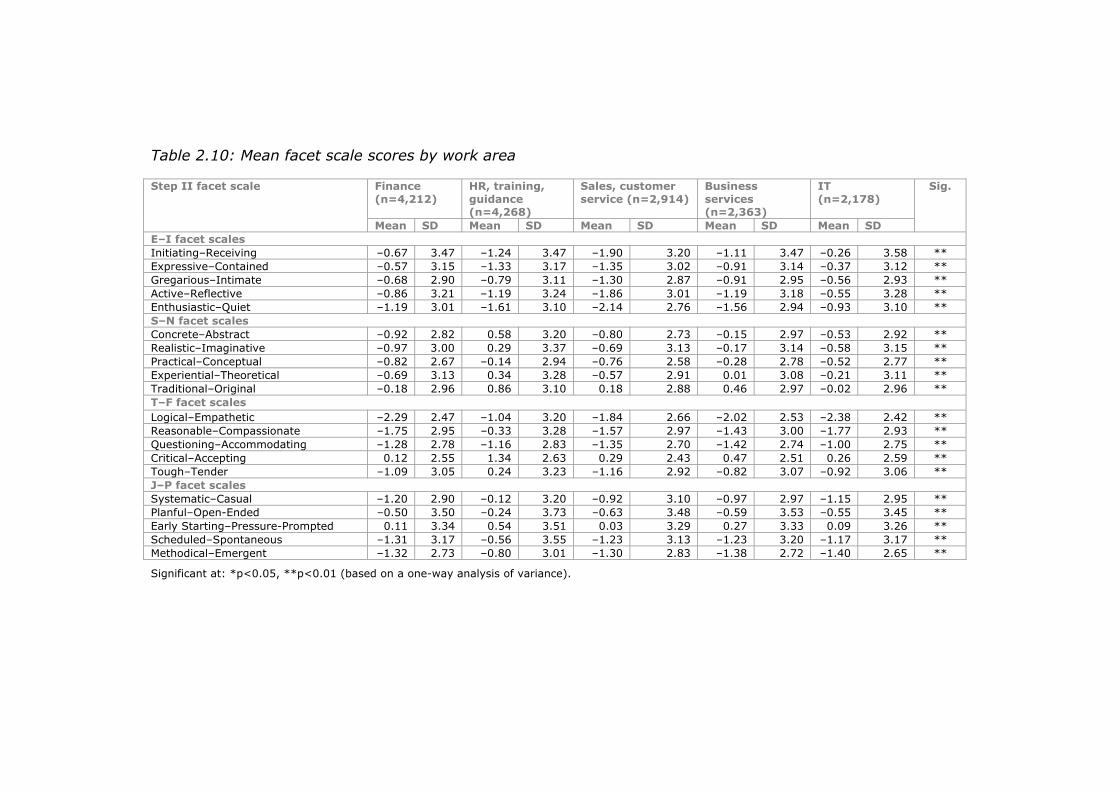
Table 2.10: Mean facet scale scores by work area
Finance (n=4,212)
HR, training, guidance (n=4,268)
Sales, customer service (n=2,914)
Business services (n=2,363)
IT (n=2,178)
Step II facet scale
Mean SD Mean SD Mean SD Mean SD Mean SD
Sig.
E–I facet scales Initiating–Receiving –0.67 3.47 –1.24 3.47 –1.90 3.20 –1.11 3.47 –0.26 3.58 ** Expressive–Contained –0.57 3.15 –1.33 3.17 –1.35 3.02 –0.91 3.14 –0.37 3.12 ** Gregarious–Intimate –0.68 2.90 –0.79 3.11 –1.30 2.87 –0.91 2.95 –0.56 2.93 ** Active–Reflective –0.86 3.21 –1.19 3.24 –1.86 3.01 –1.19 3.18 –0.55 3.28 ** Enthusiastic–Quiet –1.19 3.01 –1.61 3.10 –2.14 2.76 –1.56 2.94 –0.93 3.10 ** S–N facet scales Concrete–Abstract –0.92 2.82 0.58 3.20 –0.80 2.73 –0.15 2.97 –0.53 2.92 ** Realistic–Imaginative –0.97 3.00 0.29 3.37 –0.69 3.13 –0.17 3.14 –0.58 3.15 ** Practical–Conceptual –0.82 2.67 –0.14 2.94 –0.76 2.58 –0.28 2.78 –0.52 2.77 ** Experiential–Theoretical –0.69 3.13 0.34 3.28 –0.57 2.91 0.01 3.08 –0.21 3.11 ** Traditional–Original –0.18 2.96 0.86 3.10 0.18 2.88 0.46 2.97 –0.02 2.96 ** T–F facet scales Logical–Empathetic –2.29 2.47 –1.04 3.20 –1.84 2.66 –2.02 2.53 –2.38 2.42 ** Reasonable–Compassionate –1.75 2.95 –0.33 3.28 –1.57 2.97 –1.43 3.00 –1.77 2.93 ** Questioning–Accommodating –1.28 2.78 –1.16 2.83 –1.35 2.70 –1.42 2.74 –1.00 2.75 ** Critical–Accepting 0.12 2.55 1.34 2.63 0.29 2.43 0.47 2.51 0.26 2.59 ** Tough–Tender –1.09 3.05 0.24 3.23 –1.16 2.92 –0.82 3.07 –0.92 3.06 ** J–P facet scales Systematic–Casual –1.20 2.90 –0.12 3.20 –0.92 3.10 –0.97 2.97 –1.15 2.95 ** Planful–Open-Ended –0.50 3.50 –0.24 3.73 –0.63 3.48 –0.59 3.53 –0.55 3.45 ** Early Starting–Pressure-Prompted 0.11 3.34 0.54 3.51 0.03 3.29 0.27 3.33 0.09 3.26 ** Scheduled–Spontaneous –1.31 3.17 –0.56 3.55 –1.23 3.13 –1.23 3.20 –1.17 3.17 ** Methodical–Emergent –1.32 2.73 –0.80 3.01 –1.30 2.83 –1.38 2.72 –1.40 2.65 **
Significant at: *p<0.05, **p<0.01 (based on a one-way analysis of variance).
Chapter 2: English (European)
29
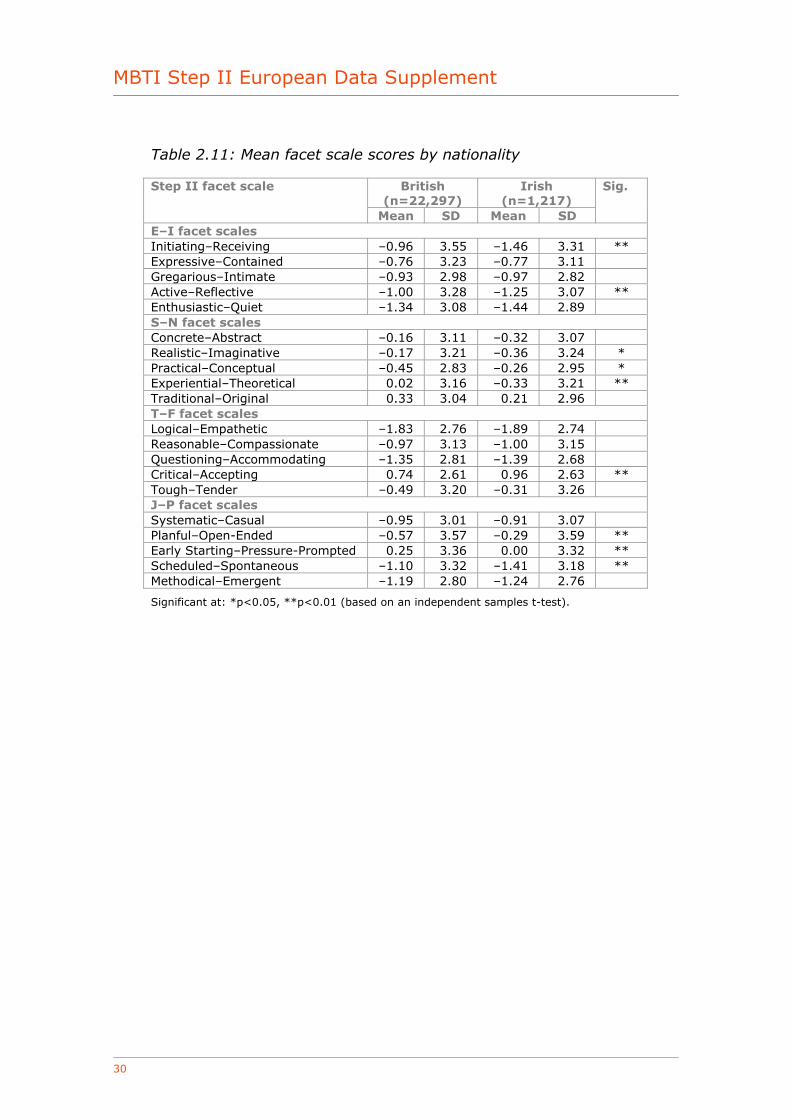
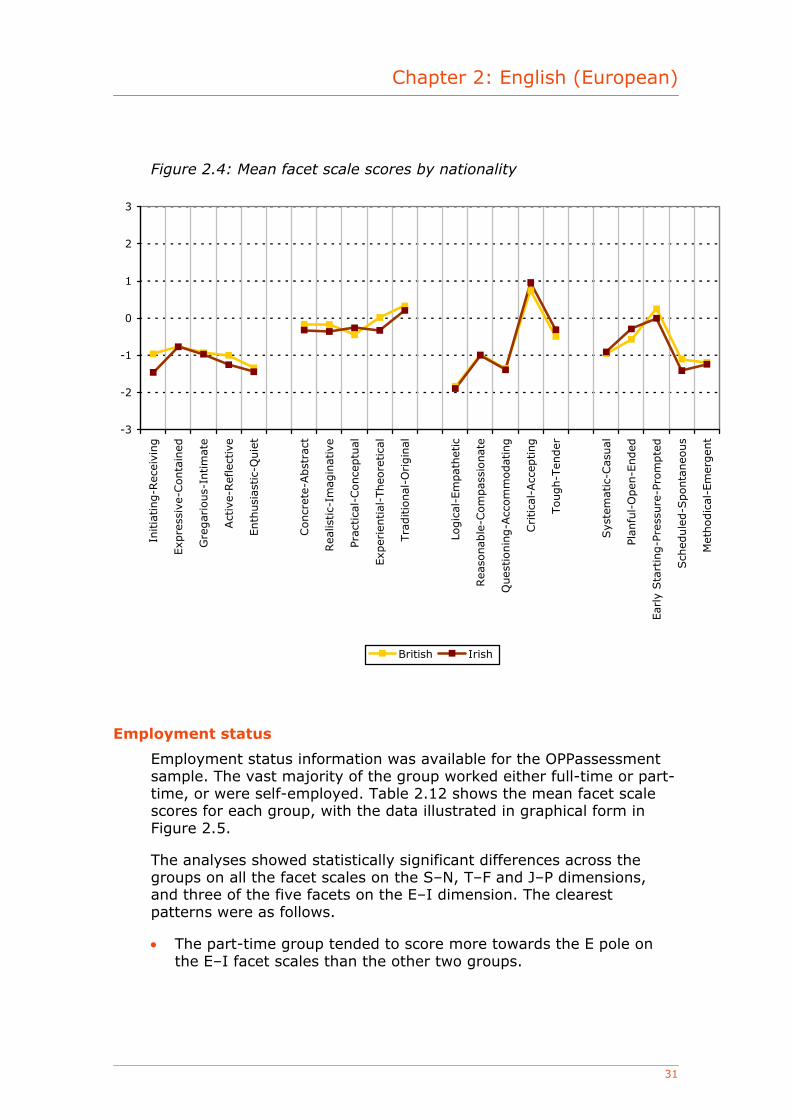
Nationality
Information on nationality was available for the group. Seventy per cent of the group were British. Although a number of other European nationalities were represented in fairly large numbers, we would normally expect these individuals to complete the questionnaire in their own first language. Therefore, we have not explored national differences using the European English version of the instrument. The exception to this is individuals who described themselves as Irish. These formed approximately 4% of the group.
A comparison of mean facet scales across the British and Irish groups highlighted some interesting differences, as shown in Table 2.11 and Figure 2.4. It is worth noting that although the differences below were statistically significant, none of the differences in mean scores was more than 0.5 points. In real terms this is actually quite small.
• On two of the five facet scales linked to the E–I dimension (Initiating–Receiving, Active–Reflective), the Irish group mean scores were significantly further towards the E pole than those for the British group.
• On two of the five facet scales linked to the S–N dimension (Realistic–Imaginative, Experiential–Theoretical), the Irish group mean scores were significantly further towards the S pole than those for the British group. On one facet scale (Practical–Conceptual), the British group mean scores were significantly further towards the S pole.
• On one of the five facet scales linked to the T–F dimension (Critical–Accepting), the British group mean scores were significantly further towards the T pole than those for the Irish group.
• On two of the five facet scales linked to the J–P dimension (Early Starting–Pressure-Prompted, Scheduled–Spontaneous), the Irish group mean scores were significantly further towards the J pole than those for the British group. On one facet scale (Planful–Open-Ended), the British group mean scores were significantly further towards the J pole.
MBTI Step II European Data Supplement
30
Table 2.11: Mean facet scale scores by nationality
British (n=22,297)
Irish (n=1,217)
Step II facet scale
Mean SD Mean SD
Sig.
E–I facet scales Initiating–Receiving –0.96 3.55 –1.46 3.31 ** Expressive–Contained –0.76 3.23 –0.77 3.11 Gregarious–Intimate –0.93 2.98 –0.97 2.82 Active–Reflective –1.00 3.28 –1.25 3.07 ** Enthusiastic–Quiet –1.34 3.08 –1.44 2.89 S–N facet scales Concrete–Abstract –0.16 3.11 –0.32 3.07 Realistic–Imaginative –0.17 3.21 –0.36 3.24 * Practical–Conceptual –0.45 2.83 –0.26 2.95 * Experiential–Theoretical 0.02 3.16 –0.33 3.21 ** Traditional–Original 0.33 3.04 0.21 2.96 T–F facet scales Logical–Empathetic –1.83 2.76 –1.89 2.74 Reasonable–Compassionate –0.97 3.13 –1.00 3.15 Questioning–Accommodating –1.35 2.81 –1.39 2.68 Critical–Accepting 0.74 2.61 0.96 2.63 ** Tough–Tender –0.49 3.20 –0.31 3.26 J–P facet scales Systematic–Casual –0.95 3.01 –0.91 3.07 Planful–Open-Ended –0.57 3.57 –0.29 3.59 ** Early Starting–Pressure-Prompted 0.25 3.36 0.00 3.32 ** Scheduled–Spontaneous –1.10 3.32 –1.41 3.18 ** Methodical–Emergent –1.19 2.80 –1.24 2.76
Significant at: *p<0.05, **p<0.01 (based on an independent samples t-test).
Chapter 2: English (European)
31
Figure 2.4: Mean facet scale scores by nationality
-3
-2
-1
0
1
2
3
Initia
ting-R
ecei
ving
Exp
ress
ive-
Conta
ined
Gre
gar
ious-
Intim
ate
Act
ive-
Ref
lect
ive
Enth
usi
astic-
Quie
t
Concr
ete-
Abst
ract
Rea
listic-
Imag
inat
ive
Prac
tica
l-Conce
ptu
al
Exp
erie
ntial
-Theo
retica
l
Tra
ditio
nal
-Origin
al
Logic
al-E
mpat
het
ic
Rea
sonab
le-C
om
pas
sionat
e
Ques
tionin
g-A
ccom
modat
ing
Critica
l-Acc
epting
Tough-T
ender
Sys
tem
atic
-Cas
ual
Plan
ful-
Open
-Ended
Ear
ly S
tart
ing-P
ress
ure
-Pro
mpte
d
Sch
edule
d-S
ponta
neo
us
Met
hodic
al-E
mer
gen
t
British Irish
Employment status
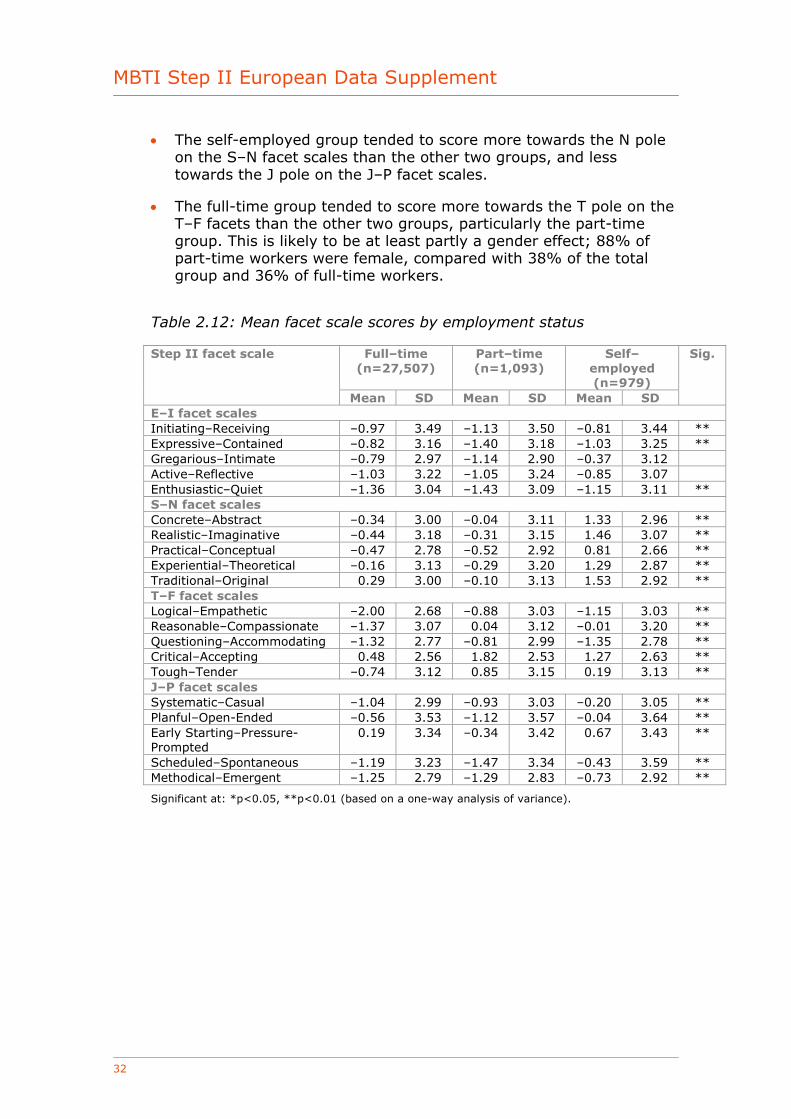
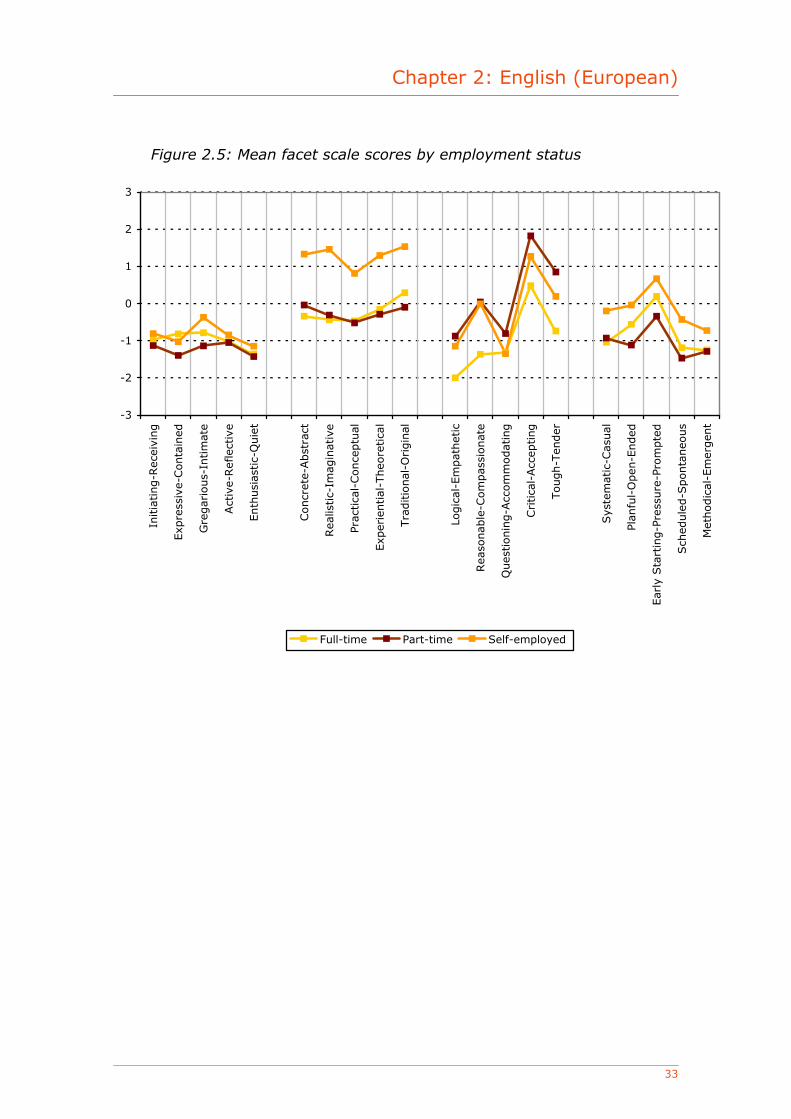
Employment status information was available for the OPPassessment sample. The vast majority of the group worked either full-time or part-time, or were self-employed. Table 2.12 shows the mean facet scale scores for each group, with the data illustrated in graphical form in Figure 2.5.
The analyses showed statistically significant differences across the groups on all the facet scales on the S–N, T–F and J–P dimensions, and three of the five facets on the E–I dimension. The clearest patterns were as follows.
• The part-time group tended to score more towards the E pole on the E–I facet scales than the other two groups.
MBTI Step II European Data Supplement
32
• The self-employed group tended to score more towards the N pole on the S–N facet scales than the other two groups, and less towards the J pole on the J–P facet scales.
• The full-time group tended to score more towards the T pole on the T–F facets than the other two groups, particularly the part-time group. This is likely to be at least partly a gender effect; 88% of part-time workers were female, compared with 38% of the total group and 36% of full-time workers.
Table 2.12: Mean facet scale scores by employment status
Full–time (n=27,507)
Part–time (n=1,093)
Self–employed (n=979)
Step II facet scale
Mean SD Mean SD Mean SD
Sig.
E–I facet scales Initiating–Receiving –0.97 3.49 –1.13 3.50 –0.81 3.44 ** Expressive–Contained –0.82 3.16 –1.40 3.18 –1.03 3.25 ** Gregarious–Intimate –0.79 2.97 –1.14 2.90 –0.37 3.12 Active–Reflective –1.03 3.22 –1.05 3.24 –0.85 3.07 Enthusiastic–Quiet –1.36 3.04 –1.43 3.09 –1.15 3.11 ** S–N facet scales Concrete–Abstract –0.34 3.00 –0.04 3.11 1.33 2.96 ** Realistic–Imaginative –0.44 3.18 –0.31 3.15 1.46 3.07 ** Practical–Conceptual –0.47 2.78 –0.52 2.92 0.81 2.66 ** Experiential–Theoretical –0.16 3.13 –0.29 3.20 1.29 2.87 ** Traditional–Original 0.29 3.00 –0.10 3.13 1.53 2.92 ** T–F facet scales Logical–Empathetic –2.00 2.68 –0.88 3.03 –1.15 3.03 ** Reasonable–Compassionate –1.37 3.07 0.04 3.12 –0.01 3.20 ** Questioning–Accommodating –1.32 2.77 –0.81 2.99 –1.35 2.78 ** Critical–Accepting 0.48 2.56 1.82 2.53 1.27 2.63 ** Tough–Tender –0.74 3.12 0.85 3.15 0.19 3.13 ** J–P facet scales Systematic–Casual –1.04 2.99 –0.93 3.03 –0.20 3.05 ** Planful–Open-Ended –0.56 3.53 –1.12 3.57 –0.04 3.64 ** Early Starting–Pressure-Prompted
0.19 3.34 –0.34 3.42 0.67 3.43 **
Scheduled–Spontaneous –1.19 3.23 –1.47 3.34 –0.43 3.59 ** Methodical–Emergent –1.25 2.79 –1.29 2.83 –0.73 2.92 **
Significant at: *p<0.05, **p<0.01 (based on a one-way analysis of variance).
Chapter 2: English (European)
33
Figure 2.5: Mean facet scale scores by employment status
-3
-2
-1
0
1
2
3
Initia
ting-R
ecei
ving
Exp
ress
ive-
Conta
ined
Gre
gar
ious-
Intim
ate
Act
ive-
Ref
lect
ive
Enth
usi
astic-
Quie
t
Concr
ete-
Abst
ract
Rea
listic-
Imag
inat
ive
Prac
tica
l-Conce
ptu
al
Exp
erie
ntial
-Theo
retica
l
Tra
ditio
nal
-Origin
al
Logic
al-E
mpat
het
ic
Rea
sonab
le-C
om
pas
sionat
e
Ques
tionin
g-A
ccom
modat
ing
Critica
l-Acc
epting
Tough-T
ender
Sys
tem
atic
-Cas
ual
Plan
ful-
Open
-Ended
Ear
ly S
tart
ing-P
ress
ure
-Pro
mpte
d
Sch
edule
d-S
ponta
neo
us
Met
hodic
al-E
mer
gen
t
Full-time Part-time Self-employed
MBTI Step II European Data Supplement
34
Appendix 1: Sample description
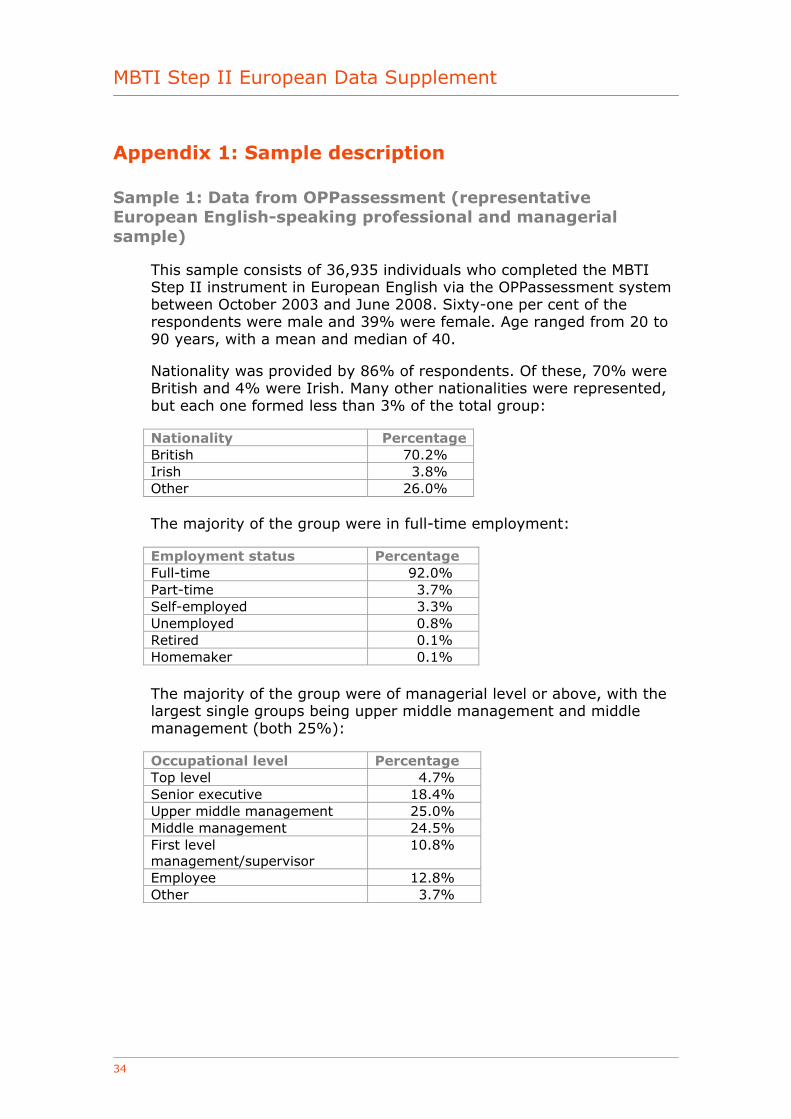
Sample 1: Data from OPPassessment (representative European English-speaking professional and managerial sample)
This sample consists of 36,935 individuals who completed the MBTI Step II instrument in European English via the OPPassessment system between October 2003 and June 2008. Sixty-one per cent of the respondents were male and 39% were female. Age ranged from 20 to 90 years, with a mean and median of 40.
Nationality was provided by 86% of respondents. Of these, 70% were British and 4% were Irish. Many other nationalities were represented, but each one formed less than 3% of the total group:
Nationality Percentage British 70.2% Irish 3.8% Other 26.0%
The majority of the group were in full-time employment:
Employment status Percentage Full-time 92.0% Part-time 3.7% Self-employed 3.3% Unemployed 0.8% Retired 0.1% Homemaker 0.1%
The majority of the group were of managerial level or above, with the largest single groups being upper middle management and middle management (both 25%):
Occupational level Percentage Top level 4.7% Senior executive 18.4% Upper middle management 25.0% Middle management 24.5% First level management/supervisor
10.8%
Employee 12.8% Other 3.7%
Chapter 2: English (European)
35
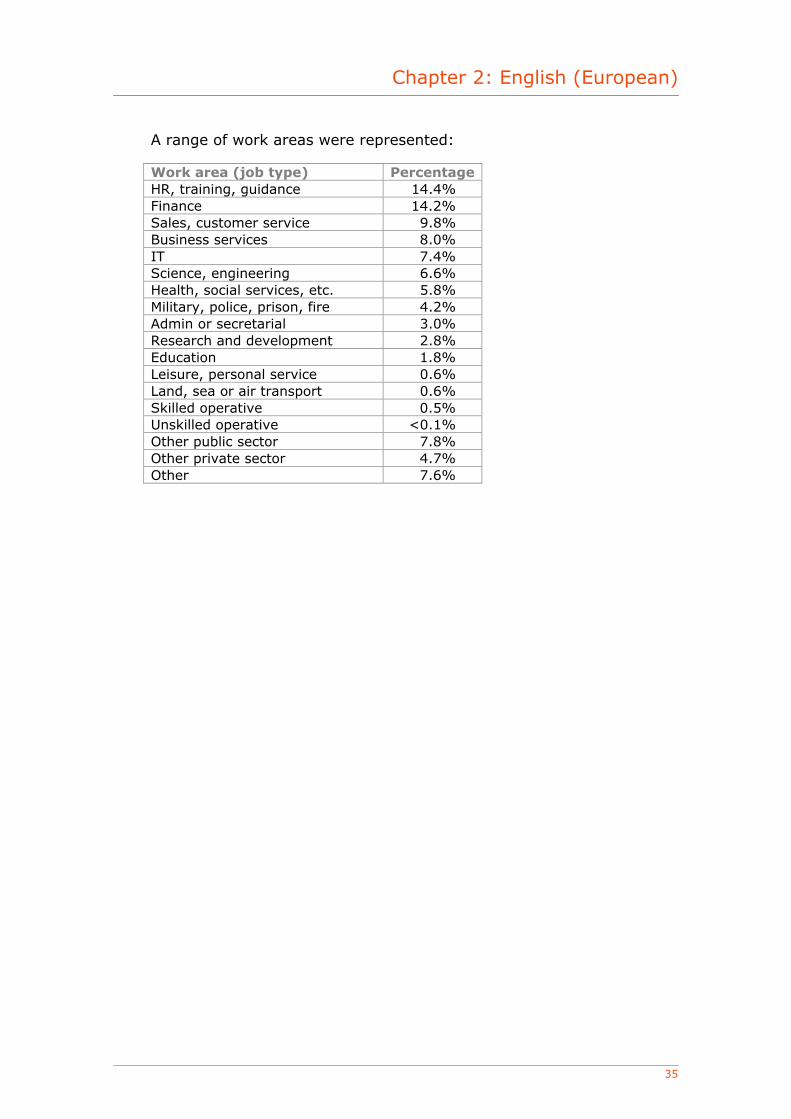
A range of work areas were represented:
Work area (job type) Percentage HR, training, guidance 14.4% Finance 14.2% Sales, customer service 9.8% Business services 8.0% IT 7.4% Science, engineering 6.6% Health, social services, etc. 5.8% Military, police, prison, fire 4.2% Admin or secretarial 3.0% Research and development 2.8% Education 1.8% Leisure, personal service 0.6% Land, sea or air transport 0.6% Skilled operative 0.5% Unskilled operative <0.1% Other public sector 7.8% Other private sector 4.7% Other 7.6%

MBTI Step II European Data Supplement
36

Chapter 3: Danish
37
European Data Supplement Danish
January 2009
OPP Ltd Elsfield Hall
15–17 Elsfield Way Oxford OX2 8EP
UK t: +44 (0)845 603 9958 f: +44 (0)1865 557483
MBTI® Step II instrument
MBTI Step II European Data Supplement
38
Contents
Introduction .............................................................................39 Type distribution .......................................................................40
OPPassessment data (representative Danish-speaking professional and managerial sample)......................................................41
Properties of the Step II facet scales ............................................42 Facet scale score distribution...................................................42 Facet scale intercorrelations ....................................................44 Correlations of Step II facet scales with Step I scales..................46 Out-of-preference scores ........................................................47 Reliability .............................................................................48 Group differences ..................................................................49 Sample 1: Data from OPPassessment (representative Danish-
speaking professional and managerial sample) .......................59
© Copyright 2009 OPP Ltd. All rights reserved.
No portion of this publication may be translated or reproduced in whole or in part, stored in a retrieval system, or transmitted in any form or by any means (electronic, mechanical, photocopying, recording or otherwise) without the prior written permission of the copyright owner. No part of this publication is reproducible under any photocopying licence scheme. OPP Ltd grants the downloader a personal, non-transferable, perpetual, irrevocable right to use the Supplement. The European Data Supplement (‘the Supplement’) is for personal use only and may not be sold on or circulated to third parties.
® MBTI, Myers-Briggs and the Myers-Briggs Type Indicator are registered trade marks of the Myers-Briggs Type Indicator Trust. OPP is licensed to use the trade marks in Europe.
® OPP is a registered trade mark of OPP Ltd in the European Community.

Chapter 3: Danish
39
Introduction
Data collected for the European MBTI Step II instrument were analysed to produce the findings in this supplement. This is the first data supplement produced for this instrument, and contains all the data gathered to date since the launch of the instrument in 2003. A brief description of the sample is given below. Further details of the sample are provided in Appendix 1.
• The sample consisted of 4,254 individuals who completed the MBTI Step II questionnaire in Danish via the OPPassessment system between 2003 and mid-2008.1 This sample is considered to be representative of the groups of people with whom the Danish MBTI Step II instrument has been and will be used for applications such as management development, coaching, counselling and teambuilding. As such, it is likely to represent a cross-section of the Danish-speaking professional and managerial population.
The results of the analyses are outlined below.
1 OPPassessment allows personality questionnaires such as the MBTI instrument to be administered via email and/or completed online.

MBTI Step II European Data Supplement
40
Type distribution
Type tables are a way of illustrating the proportion of each type within a particular group. Below is a type table taken from the sample described on the previous page.
For each of the 16 different types, the number of cases, the percentage of the total that this represents and the self-selection ratio (SSR) are shown. The SSR (Myers et al., 1998) is a way of demonstrating whether a given type appears more or less often in a particular group than would be expected given its frequency in a reference group. Ideally, the type distribution from a large representative sample of the Danish population would be used to calculate SSRs in this data supplement. However, such a sample does not currently exist. In its place, SSRs have been calculated using type data from the UK general population (Kendall, 1998), which can be justified by the fact that type distributions for comparable Danish and British groups, such as managers and professionals, are similar. Evidence (eg Hackston and Kendall, 2004; Quenk et al., 2004) does suggest that although type-related behaviours vary a good deal from country to country and from culture to culture, the frequencies of underlying MBTI types do not.
An SSR of greater than 1 indicates that a type is over-represented, and an SSR of less than 1 denotes that it is under-represented. Asterisks are used to denote whether the over- or under-representations are statistically significant, based on the results of chi-square analysis.2
2 Chi-square analysis (often abbreviated to χ2) is a technique used to explore whether observed frequency distributions differ significantly from other, predefined, distributions. In this case, the UK general population group is used as the reference group, and the chi-square analysis indicates whether the proportion of people of each type within a particular sample differs significantly from the proportion of people reporting the same type within the reference group.
Chapter 3: Danish
41
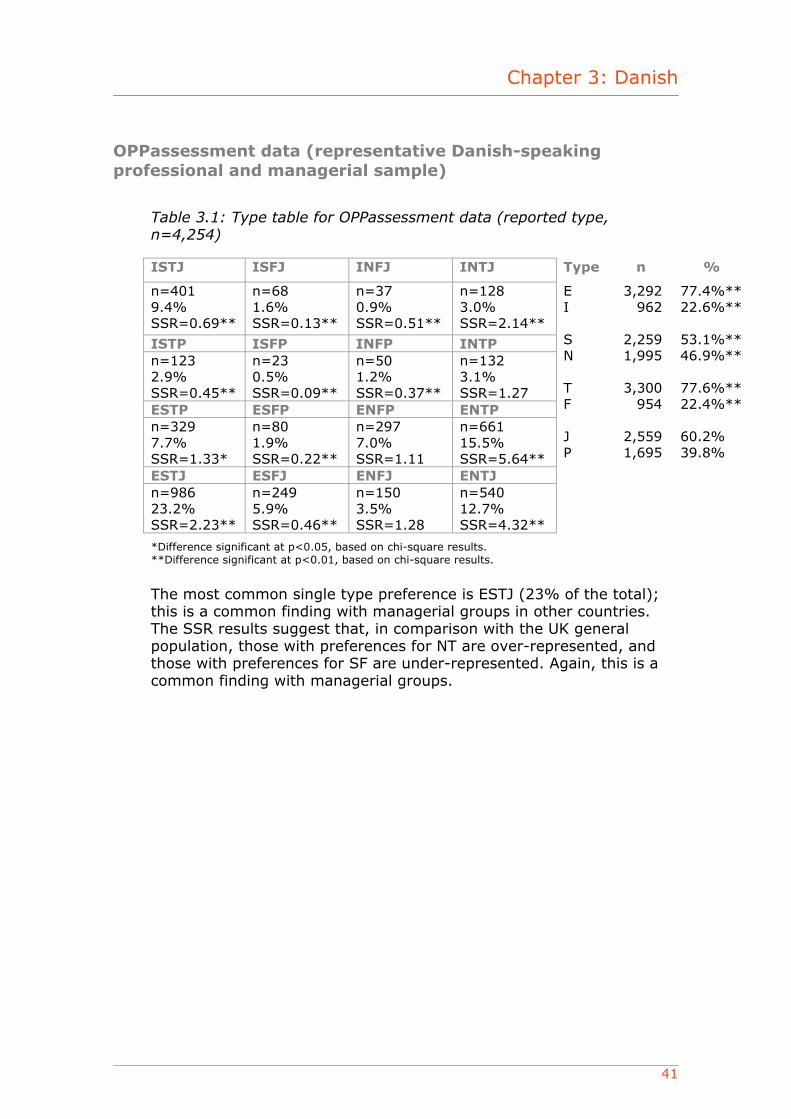
OPPassessment data (representative Danish-speaking professional and managerial sample)
Table 3.1: Type table for OPPassessment data (reported type, n=4,254)
ISTJ ISFJ INFJ INTJ Type n %
n=401 9.4% SSR=0.69**
n=68 1.6% SSR=0.13**
n=37 0.9% SSR=0.51**
n=128 3.0% SSR=2.14**
ISTP ISFP INFP INTP n=123 2.9% SSR=0.45**
n=23 0.5% SSR=0.09**
n=50 1.2% SSR=0.37**
n=132 3.1% SSR=1.27
ESTP ESFP ENFP ENTP n=329 7.7% SSR=1.33*
n=80 1.9% SSR=0.22**
n=297 7.0% SSR=1.11
n=661 15.5% SSR=5.64**
ESTJ ESFJ ENFJ ENTJ n=986 23.2% SSR=2.23**
n=249 5.9% SSR=0.46**
n=150 3.5% SSR=1.28
n=540 12.7% SSR=4.32**
E I S N T F J P
3,292 962
2,259 1,995
3,300
954
2,559 1,695
77.4%** 22.6%** 53.1%** 46.9%** 77.6%** 22.4%** 60.2% 39.8%
*Difference significant at p<0.05, based on chi-square results. **Difference significant at p<0.01, based on chi-square results.
The most common single type preference is ESTJ (23% of the total); this is a common finding with managerial groups in other countries. The SSR results suggest that, in comparison with the UK general population, those with preferences for NT are over-represented, and those with preferences for SF are under-represented. Again, this is a common finding with managerial groups.

MBTI Step II European Data Supplement
42
Properties of the Step II facet scales
Facet scale score distribution
The means and standard deviations of the Step II facets are shown in Table 3.2, and are illustrated graphically in Figure 2.1. The mean score for a scale is calculated by adding together the scores of each individual in the sample and then dividing the sum by the number of individuals. Note that negative values indicate that mean scores are nearer the left-hand pole of the facet and positive values indicate that the mean scores are nearer the right-hand pole. The standard deviation (SD) is a statistical measure describing the degree to which the scores from the sample either bunch up close to, or are scattered widely around, the mean for the sample.
Table 3.2: Means and standard deviations of the facet scales
Step II facet scale Mean3 SD E–I facet scales Initiating–Receiving –1.82 3.09 Expressive–Contained –1.45 2.84 Gregarious–Intimate –1.02 2.75 Active–Reflective –1.91 2.75 Enthusiastic–Quiet –2.00 2.66 S–N facet scales Concrete–Abstract –0.02 2.80 Realistic–Imaginative –0.42 3.19 Practical–Conceptual –0.10 2.49 Experiential–Theoretical –1.11 2.77 Traditional–Original 0.16 2.77 T–F facet scales Logical–Empathetic –1.30 2.60 Reasonable–Compassionate –1.73 2.75 Questioning–Accommodating –0.05 3.01 Critical–Accepting 0.76 2.03 Tough–Tender –0.41 2.61 J–P facet scales Systematic–Casual –0.69 2.92 Planful–Open-Ended 0.02 3.33 Early Starting–Pressure-Prompted 0.04 3.17 Scheduled–Spontaneous –0.98 3.00 Methodical–Emergent –0.38 2.90
3 Scale means: in Step II reports, scores are given from 5 on one pole, through 0, to 5 on the opposite pole. In compiling statistical information, however, one pole needs to be clearly distinguished from the other. Throughout this data supplement, therefore, a convention has been adopted of scores 5, 4, 3, 2 or 1 on the left-hand pole being assigned values of –5, –4, –3, –2, or –1 and scores on the right-hand pole being assigned positive scores. This does not, of course, imply any suggestion that positive scores are ‘better’ than negative scores.
Chapter 3: Danish
43
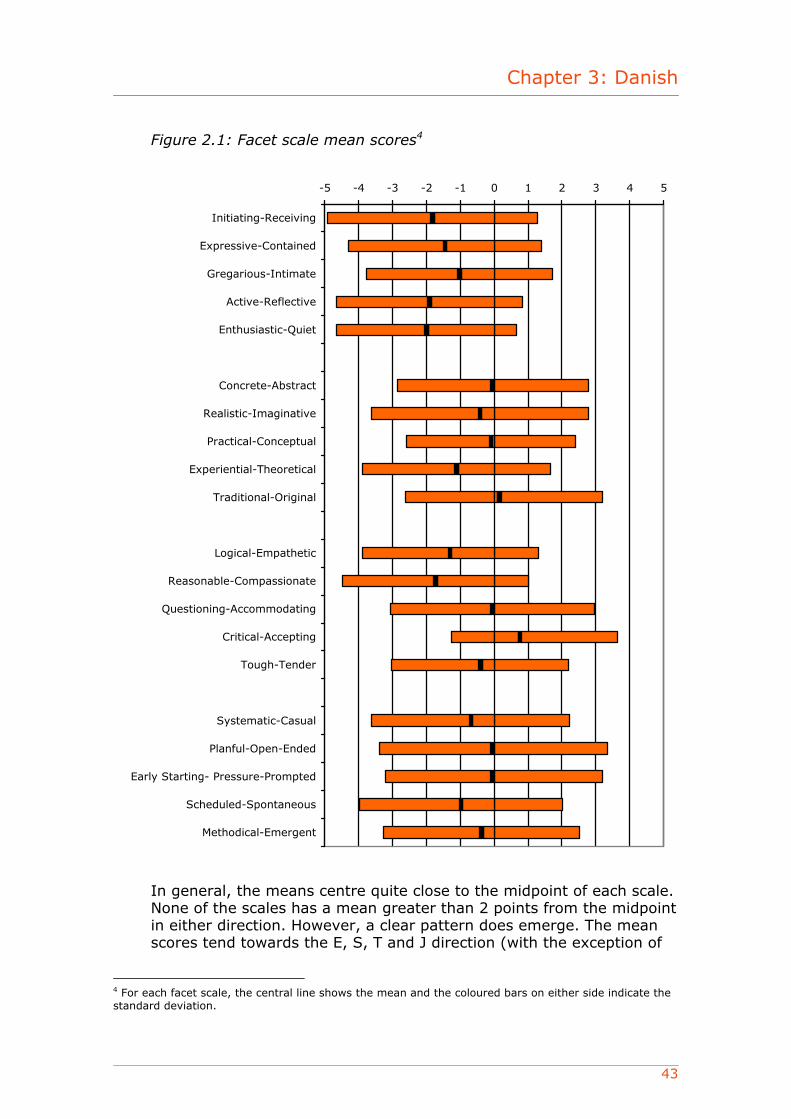
Figure 2.1: Facet scale mean scores4
-5 -4 -3 -2 -1 0 1 2 3 4 5
Initiating-Receiving
Expressive-Contained
Gregarious-Intimate
Active-Reflective
Enthusiastic-Quiet
Concrete-Abstract
Realistic-Imaginative
Practical-Conceptual
Experiential-Theoretical
Traditional-Original
Logical-Empathetic
Reasonable-Compassionate
Questioning-Accommodating
Critical-Accepting
Tough-Tender
Systematic-Casual
Planful-Open-Ended
Early Starting- Pressure-Prompted
Scheduled-Spontaneous
Methodical-Emergent
In general, the means centre quite close to the midpoint of each scale. None of the scales has a mean greater than 2 points from the midpoint in either direction. However, a clear pattern does emerge. The mean scores tend towards the E, S, T and J direction (with the exception of
4 For each facet scale, the central line shows the mean and the coloured bars on either side indicate the standard deviation.
MBTI Step II European Data Supplement
44
Traditional–Original, Critical–Accepting, Planful–Open-Ended and Early Starting–Pressure-Prompted), which is consistent with the most common four-letter type preference amongst this sample. Amongst the group as a whole, there are more individuals with a preference for E, S, T and J.
Facet scale intercorrelations
Correlations among the Step II facet scales are shown in Table 3.3. Facet scales within each dichotomy consistently correlate more highly (usually substantially so) with the other scales of the same dichotomy than they do with scales in the other three dichotomies. For example, every E–I facet scale correlates more highly with the other four E–I scales than with any of the S–N, T–F or J–P facet scales.
There is only one scale that correlates significantly more highly with scales in other dichotomies. The T–F scale Questioning–Accommodating correlates with many scales, across dichotomies. For example, it correlates at a level of 0.20 with Enthusiastic–Quiet, and at 0.19 with Active–Reflective and Initiating–Receiving, all of which are on the E–I dichotomy. It correlates negatively at between –0.26 and –0.38 with all of the S–N scales, and at –0.21 with Early Starting–Pressure-Prompted on the J–P dichotomy. By way of comparison, it correlates at between 0.13 and 0.26 with the other four scales on the same dichotomy as itself (T–F). The negative correlations between Questioning–Accommodating and the S–N scales are consistent with findings in the US version of the Step II instrument, and suggest that a questioning approach to differences of opinion seems to be related to a range of Intuitive (N) facets. These patterns are similar to those found when the European Step II instrument was developed.
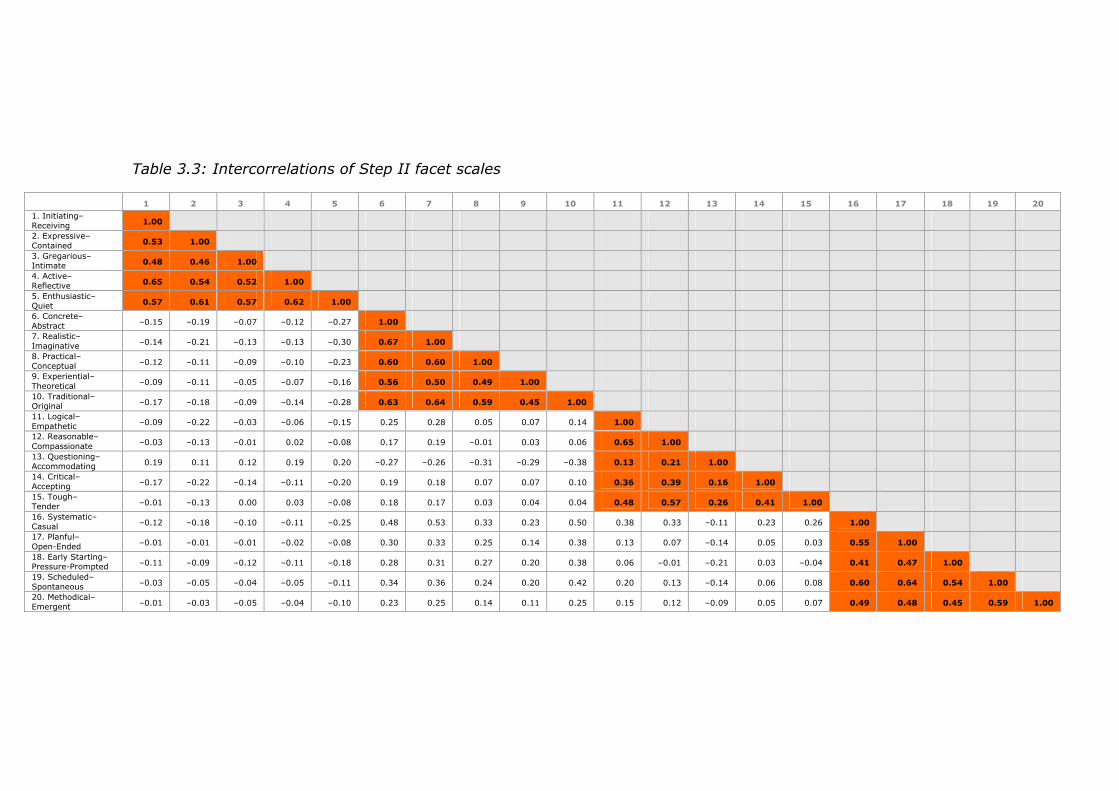
Table 3.3: Intercorrelations of Step II facet scales
1 2 3 4 5 6 7 8 9 10 11 12 13 14 15 16 17 18 19 20
1. Initiating– Receiving 1.00
2. Expressive– Contained 0.53 1.00
3. Gregarious– Intimate 0.48 0.46 1.00
4. Active– Reflective 0.65 0.54 0.52 1.00
5. Enthusiastic– Quiet 0.57 0.61 0.57 0.62 1.00
6. Concrete– Abstract –0.15 –0.19 –0.07 –0.12 –0.27 1.00
7. Realistic– Imaginative –0.14 –0.21 –0.13 –0.13 –0.30 0.67 1.00
8. Practical– Conceptual –0.12 –0.11 –0.09 –0.10 –0.23 0.60 0.60 1.00
9. Experiential– Theoretical –0.09 –0.11 –0.05 –0.07 –0.16 0.56 0.50 0.49 1.00
10. Traditional– Original –0.17 –0.18 –0.09 –0.14 –0.28 0.63 0.64 0.59 0.45 1.00
11. Logical– Empathetic –0.09 –0.22 –0.03 –0.06 –0.15 0.25 0.28 0.05 0.07 0.14 1.00
12. Reasonable– Compassionate –0.03 –0.13 –0.01 0.02 –0.08 0.17 0.19 –0.01 0.03 0.06 0.65 1.00
13. Questioning– Accommodating 0.19 0.11 0.12 0.19 0.20 –0.27 –0.26 –0.31 –0.29 –0.38 0.13 0.21 1.00
14. Critical– Accepting –0.17 –0.22 –0.14 –0.11 –0.20 0.19 0.18 0.07 0.07 0.10 0.36 0.39 0.16 1.00
15. Tough– Tender –0.01 –0.13 0.00 0.03 –0.08 0.18 0.17 0.03 0.04 0.04 0.48 0.57 0.26 0.41 1.00
16. Systematic– Casual –0.12 –0.18 –0.10 –0.11 –0.25 0.48 0.53 0.33 0.23 0.50 0.38 0.33 –0.11 0.23 0.26 1.00
17. Planful– Open-Ended –0.01 –0.01 –0.01 –0.02 –0.08 0.30 0.33 0.25 0.14 0.38 0.13 0.07 –0.14 0.05 0.03 0.55 1.00
18. Early Starting– Pressure-Prompted –0.11 –0.09 –0.12 –0.11 –0.18 0.28 0.31 0.27 0.20 0.38 0.06 –0.01 –0.21 0.03 –0.04 0.41 0.47 1.00
19. Scheduled– Spontaneous –0.03 –0.05 –0.04 –0.05 –0.11 0.34 0.36 0.24 0.20 0.42 0.20 0.13 –0.14 0.06 0.08 0.60 0.64 0.54 1.00
20. Methodical– Emergent –0.01 –0.03 –0.05 –0.04 –0.10 0.23 0.25 0.14 0.11 0.25 0.15 0.12 –0.09 0.05 0.07 0.49 0.48 0.45 0.59 1.00
MBTI Step II European Data Supplement
46
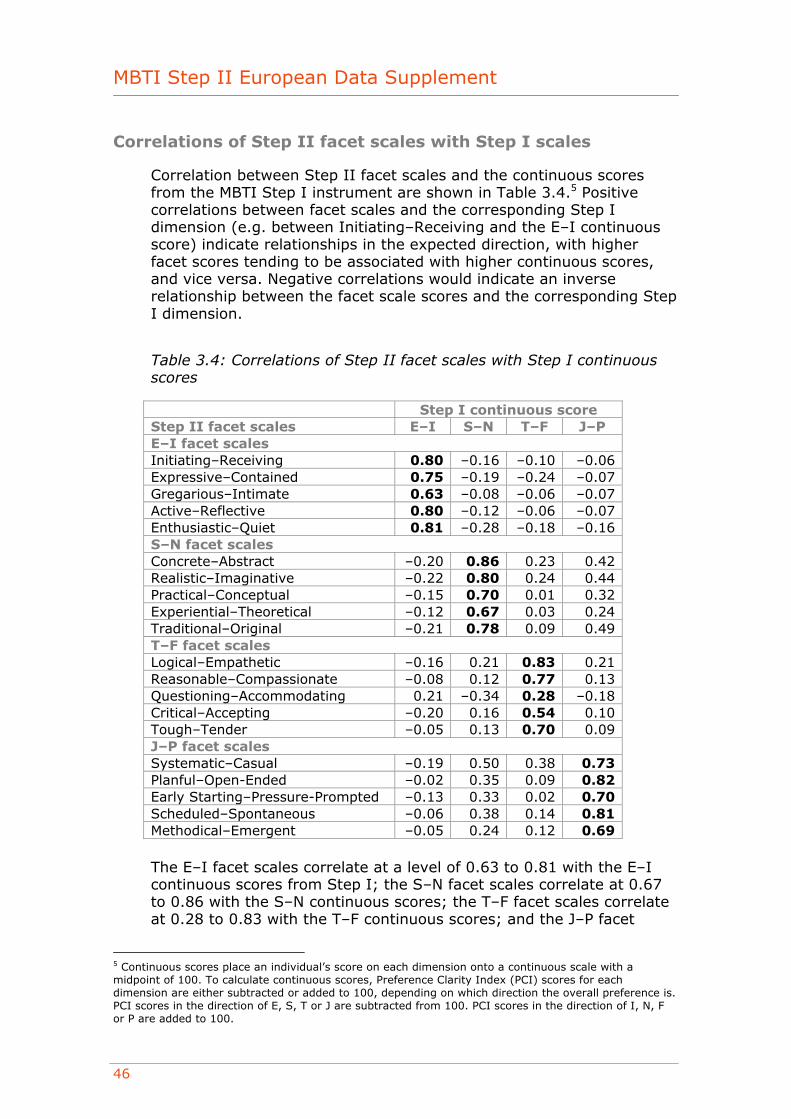
Correlations of Step II facet scales with Step I scales
Correlation between Step II facet scales and the continuous scores from the MBTI Step I instrument are shown in Table 3.4.5 Positive correlations between facet scales and the corresponding Step I dimension (e.g. between Initiating–Receiving and the E–I continuous score) indicate relationships in the expected direction, with higher facet scores tending to be associated with higher continuous scores, and vice versa. Negative correlations would indicate an inverse relationship between the facet scale scores and the corresponding Step I dimension.
Table 3.4: Correlations of Step II facet scales with Step I continuous scores
Step I continuous score Step II facet scales E–I S–N T–F J–P E–I facet scales Initiating–Receiving 0.80 –0.16 –0.10 –0.06 Expressive–Contained 0.75 –0.19 –0.24 –0.07 Gregarious–Intimate 0.63 –0.08 –0.06 –0.07 Active–Reflective 0.80 –0.12 –0.06 –0.07 Enthusiastic–Quiet 0.81 –0.28 –0.18 –0.16 S–N facet scales Concrete–Abstract –0.20 0.86 0.23 0.42 Realistic–Imaginative –0.22 0.80 0.24 0.44 Practical–Conceptual –0.15 0.70 0.01 0.32 Experiential–Theoretical –0.12 0.67 0.03 0.24 Traditional–Original –0.21 0.78 0.09 0.49 T–F facet scales Logical–Empathetic –0.16 0.21 0.83 0.21 Reasonable–Compassionate –0.08 0.12 0.77 0.13 Questioning–Accommodating 0.21 –0.34 0.28 –0.18 Critical–Accepting –0.20 0.16 0.54 0.10 Tough–Tender –0.05 0.13 0.70 0.09 J–P facet scales Systematic–Casual –0.19 0.50 0.38 0.73 Planful–Open-Ended –0.02 0.35 0.09 0.82 Early Starting–Pressure-Prompted –0.13 0.33 0.02 0.70 Scheduled–Spontaneous –0.06 0.38 0.14 0.81 Methodical–Emergent –0.05 0.24 0.12 0.69
The E–I facet scales correlate at a level of 0.63 to 0.81 with the E–I continuous scores from Step I; the S–N facet scales correlate at 0.67 to 0.86 with the S–N continuous scores; the T–F facet scales correlate at 0.28 to 0.83 with the T–F continuous scores; and the J–P facet
5 Continuous scores place an individual’s score on each dimension onto a continuous scale with a midpoint of 100. To calculate continuous scores, Preference Clarity Index (PCI) scores for each dimension are either subtracted or added to 100, depending on which direction the overall preference is. PCI scores in the direction of E, S, T or J are subtracted from 100. PCI scores in the direction of I, N, F or P are added to 100.
Chapter 3: Danish
47
scales correlate at 0.69 to 0.82 with the J–P continuous scores. The scale that showed the lowest correlation with its associated Step I continuous score was Questioning–Accommodating at 0.28. This scale is also amongst the lowest on internal consistency (see page 46), and has been previously found to have the lowest test–retest reliability (Quenk, Hammer and Majors, 2004), which would result in the true correlations being underestimated.
These correlations are very similar to those found during the development of the Step II questionnaire. This consistency, alongside the fact that the correlations between Step II facet scales and Step I continuous scores associated with their own dimension are substantially higher than correlations with the other three dimensions, provides compelling evidence for the theoretical hierarchical structure of the Step II facet scales in relation to the Step I scales.
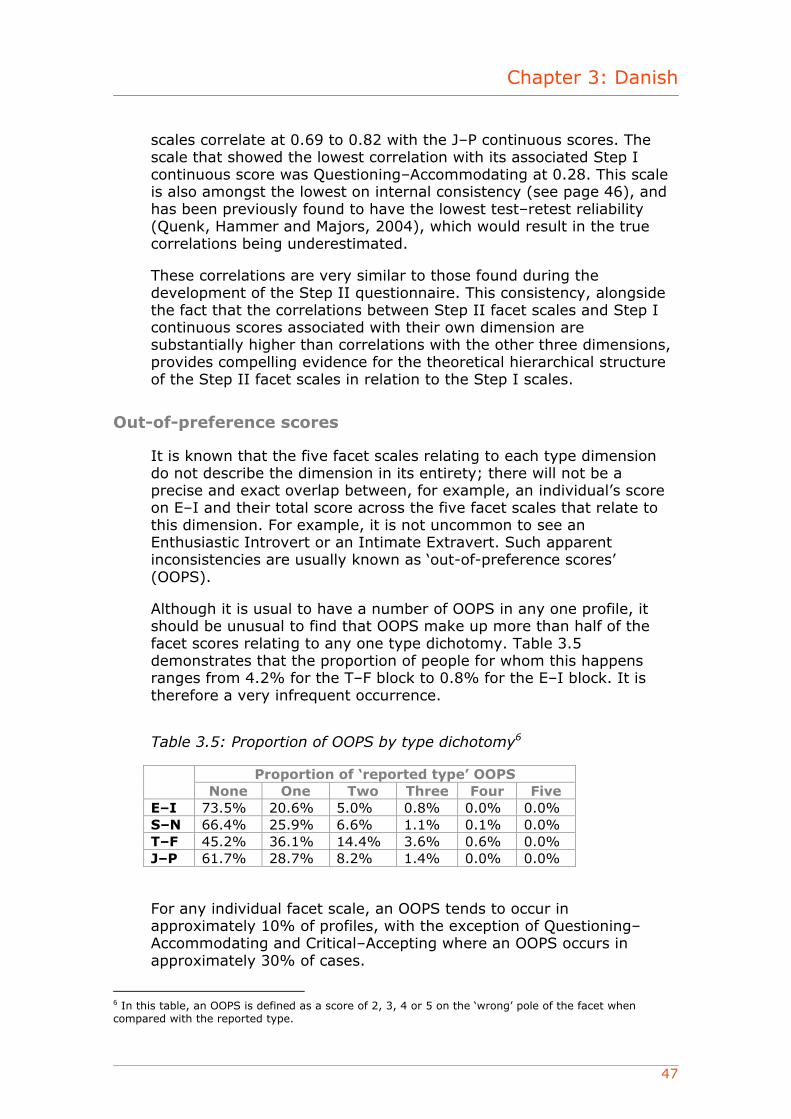
Out-of-preference scores
It is known that the five facet scales relating to each type dimension do not describe the dimension in its entirety; there will not be a precise and exact overlap between, for example, an individual’s score on E–I and their total score across the five facet scales that relate to this dimension. For example, it is not uncommon to see an Enthusiastic Introvert or an Intimate Extravert. Such apparent inconsistencies are usually known as ‘out-of-preference scores’ (OOPS).
Although it is usual to have a number of OOPS in any one profile, it should be unusual to find that OOPS make up more than half of the facet scores relating to any one type dichotomy. Table 3.5 demonstrates that the proportion of people for whom this happens ranges from 4.2% for the T–F block to 0.8% for the E–I block. It is therefore a very infrequent occurrence.
Table 3.5: Proportion of OOPS by type dichotomy6
Proportion of ‘reported type’ OOPS None One Two Three Four Five
E–I 73.5% 20.6% 5.0% 0.8% 0.0% 0.0% S–N 66.4% 25.9% 6.6% 1.1% 0.1% 0.0% T–F 45.2% 36.1% 14.4% 3.6% 0.6% 0.0% J–P 61.7% 28.7% 8.2% 1.4% 0.0% 0.0%
For any individual facet scale, an OOPS tends to occur in approximately 10% of profiles, with the exception of Questioning–Accommodating and Critical–Accepting where an OOPS occurs in approximately 30% of cases.
6 In this table, an OOPS is defined as a score of 2, 3, 4 or 5 on the ‘wrong’ pole of the facet when compared with the reported type.
MBTI Step II European Data Supplement
48
Reliability
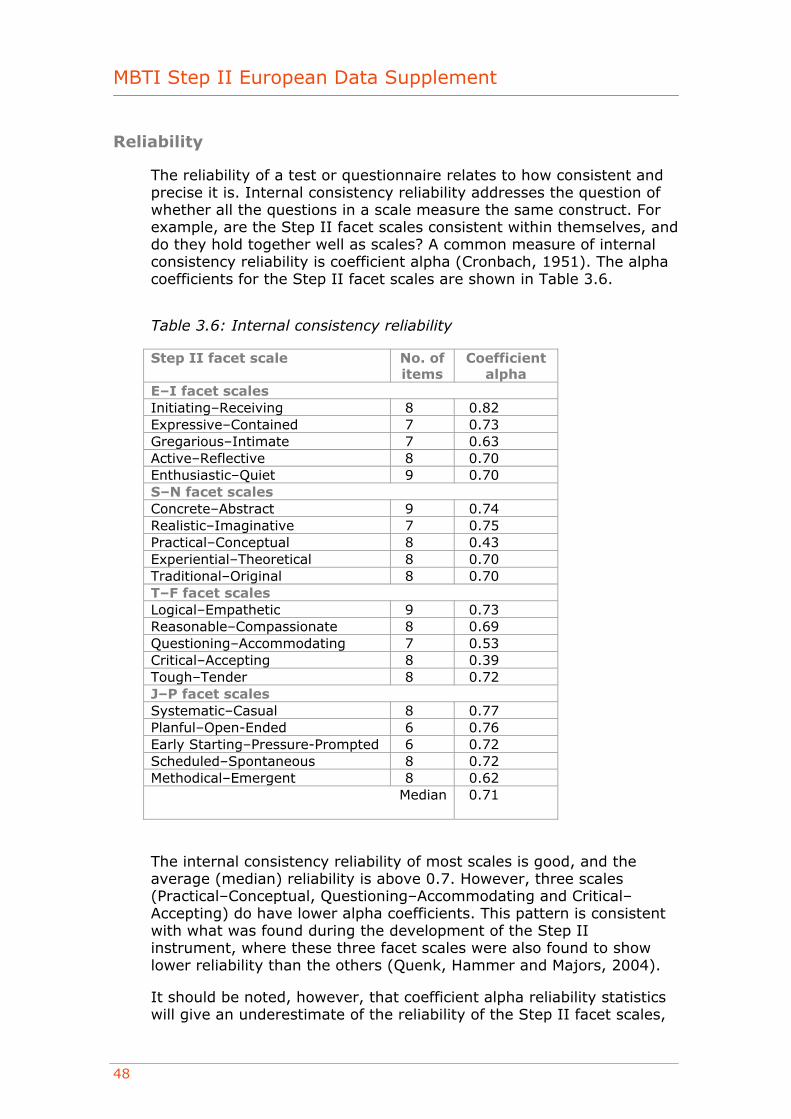
The reliability of a test or questionnaire relates to how consistent and precise it is. Internal consistency reliability addresses the question of whether all the questions in a scale measure the same construct. For example, are the Step II facet scales consistent within themselves, and do they hold together well as scales? A common measure of internal consistency reliability is coefficient alpha (Cronbach, 1951). The alpha coefficients for the Step II facet scales are shown in Table 3.6.
Table 3.6: Internal consistency reliability
Step II facet scale No. of items
Coefficient alpha
E–I facet scales Initiating–Receiving 8 0.82 Expressive–Contained 7 0.73 Gregarious–Intimate 7 0.63 Active–Reflective 8 0.70 Enthusiastic–Quiet 9 0.70 S–N facet scales Concrete–Abstract 9 0.74 Realistic–Imaginative 7 0.75 Practical–Conceptual 8 0.43 Experiential–Theoretical 8 0.70 Traditional–Original 8 0.70 T–F facet scales Logical–Empathetic 9 0.73 Reasonable–Compassionate 8 0.69 Questioning–Accommodating 7 0.53 Critical–Accepting 8 0.39 Tough–Tender 8 0.72 J–P facet scales Systematic–Casual 8 0.77 Planful–Open-Ended 6 0.76 Early Starting–Pressure-Prompted 6 0.72 Scheduled–Spontaneous 8 0.72 Methodical–Emergent 8 0.62
Median 0.71
The internal consistency reliability of most scales is good, and the average (median) reliability is above 0.7. However, three scales (Practical–Conceptual, Questioning–Accommodating and Critical–Accepting) do have lower alpha coefficients. This pattern is consistent with what was found during the development of the Step II instrument, where these three facet scales were also found to show lower reliability than the others (Quenk, Hammer and Majors, 2004).
It should be noted, however, that coefficient alpha reliability statistics will give an underestimate of the reliability of the Step II facet scales,
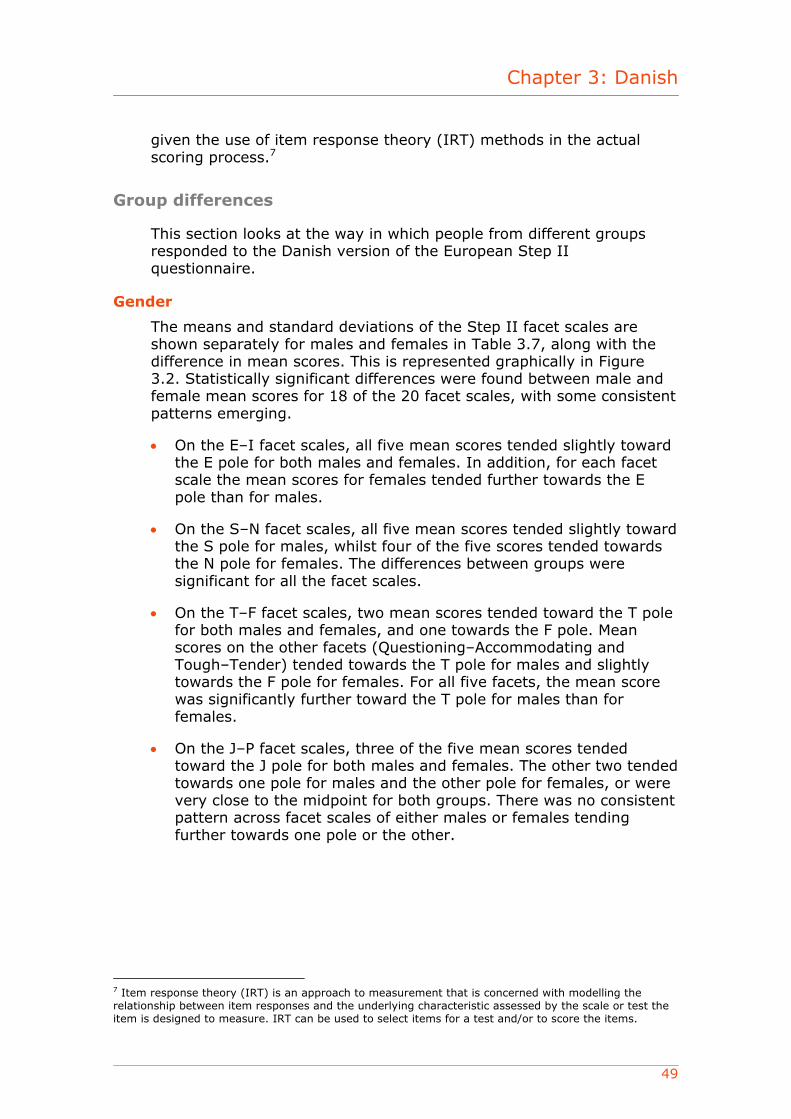
Chapter 3: Danish
49
given the use of item response theory (IRT) methods in the actual scoring process.7
Group differences
This section looks at the way in which people from different groups responded to the Danish version of the European Step II questionnaire.
Gender
The means and standard deviations of the Step II facet scales are shown separately for males and females in Table 3.7, along with the difference in mean scores. This is represented graphically in Figure 3.2. Statistically significant differences were found between male and female mean scores for 18 of the 20 facet scales, with some consistent patterns emerging.
• On the E–I facet scales, all five mean scores tended slightly toward the E pole for both males and females. In addition, for each facet scale the mean scores for females tended further towards the E pole than for males.
• On the S–N facet scales, all five mean scores tended slightly toward the S pole for males, whilst four of the five scores tended towards the N pole for females. The differences between groups were significant for all the facet scales.
• On the T–F facet scales, two mean scores tended toward the T pole for both males and females, and one towards the F pole. Mean scores on the other facets (Questioning–Accommodating and Tough–Tender) tended towards the T pole for males and slightly towards the F pole for females. For all five facets, the mean score was significantly further toward the T pole for males than for females.
• On the J–P facet scales, three of the five mean scores tended toward the J pole for both males and females. The other two tended towards one pole for males and the other pole for females, or were very close to the midpoint for both groups. There was no consistent pattern across facet scales of either males or females tending further towards one pole or the other.
7 Item response theory (IRT) is an approach to measurement that is concerned with modelling the relationship between item responses and the underlying characteristic assessed by the scale or test the item is designed to measure. IRT can be used to select items for a test and/or to score the items.
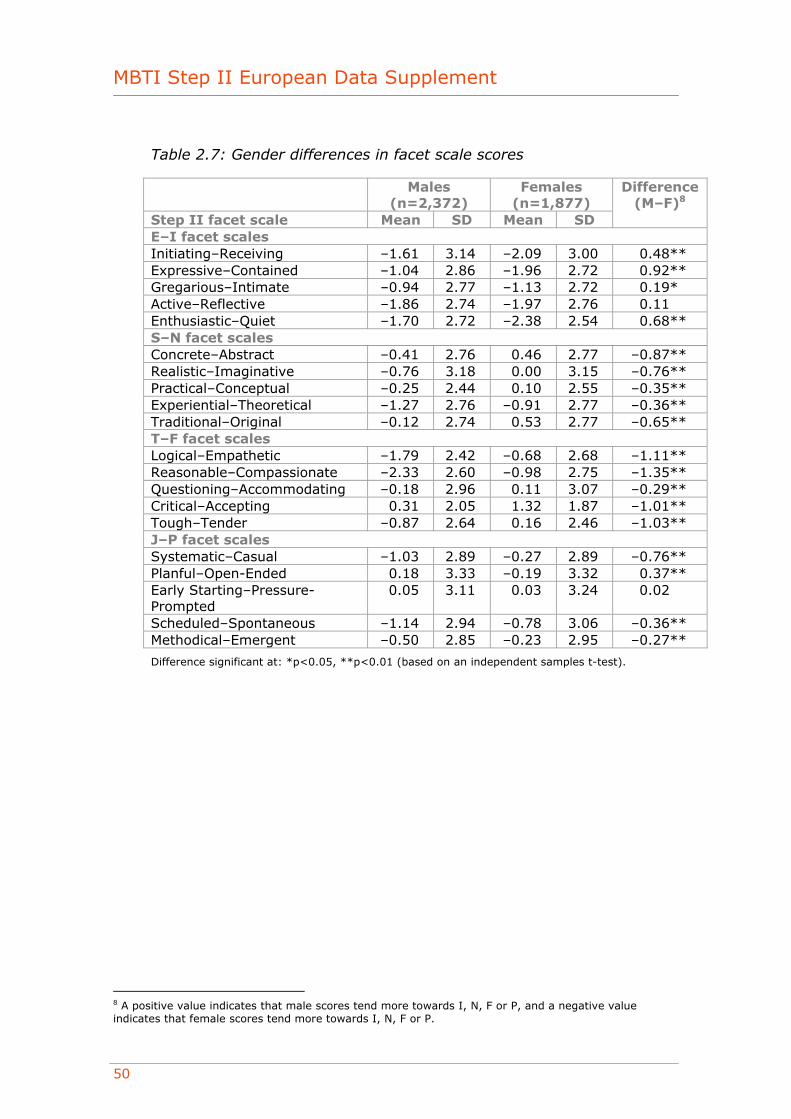
MBTI Step II European Data Supplement
50
Table 2.7: Gender differences in facet scale scores
Males (n=2,372)
Females (n=1,877)
Step II facet scale Mean SD Mean SD
Difference (M–F)8
E–I facet scales Initiating–Receiving –1.61 3.14 –2.09 3.00 0.48** Expressive–Contained –1.04 2.86 –1.96 2.72 0.92** Gregarious–Intimate –0.94 2.77 –1.13 2.72 0.19* Active–Reflective –1.86 2.74 –1.97 2.76 0.11 Enthusiastic–Quiet –1.70 2.72 –2.38 2.54 0.68** S–N facet scales Concrete–Abstract –0.41 2.76 0.46 2.77 –0.87** Realistic–Imaginative –0.76 3.18 0.00 3.15 –0.76** Practical–Conceptual –0.25 2.44 0.10 2.55 –0.35** Experiential–Theoretical –1.27 2.76 –0.91 2.77 –0.36** Traditional–Original –0.12 2.74 0.53 2.77 –0.65** T–F facet scales Logical–Empathetic –1.79 2.42 –0.68 2.68 –1.11** Reasonable–Compassionate –2.33 2.60 –0.98 2.75 –1.35** Questioning–Accommodating –0.18 2.96 0.11 3.07 –0.29** Critical–Accepting 0.31 2.05 1.32 1.87 –1.01** Tough–Tender –0.87 2.64 0.16 2.46 –1.03** J–P facet scales Systematic–Casual –1.03 2.89 –0.27 2.89 –0.76** Planful–Open-Ended 0.18 3.33 –0.19 3.32 0.37** Early Starting–Pressure-Prompted
0.05 3.11 0.03 3.24 0.02
Scheduled–Spontaneous –1.14 2.94 –0.78 3.06 –0.36** Methodical–Emergent –0.50 2.85 –0.23 2.95 –0.27**
Difference significant at: *p<0.05, **p<0.01 (based on an independent samples t-test).
8 A positive value indicates that male scores tend more towards I, N, F or P, and a negative value indicates that female scores tend more towards I, N, F or P.
Chapter 3: Danish
51
Figure 3.2: Gender differences in facet scale scores
-3
-2
-1
0
1
2
3
Initia
ting-R
ecei
ving
Exp
ress
ive-
Conta
ined
Gre
gar
ious-
Intim
ate
Act
ive-
Ref
lect
ive
Enth
usi
astic-
Quie
t
Concr
ete-
Abst
ract
Rea
listic-
Imag
inat
ive
Prac
tica
l-Conce
ptu
al
Exp
erie
ntial
-Theo
retica
l
Tra
ditio
nal
-Origin
al
Logic
al-E
mpat
het
ic
Rea
sonab
le-C
om
pas
sionat
e
Ques
tionin
g-A
ccom
modat
ing
Critica
l-Acc
epting
Tough-T
ender
Sys
tem
atic
-Cas
ual
Plan
ful-
Open
-Ended
Ear
ly S
tart
ing-P
ress
ure
-Pro
mpte
d
Sch
edule
d-S
ponta
neo
us
Met
hodic
al-E
mer
gen
t
Males Females
Age
There were found to be no meaningful links between age and facet scale scores. Although correlational analysis showed several facet scales to be significantly correlated with age, the significance levels were more the result of the very large sample size rather than being indicative of a meaningful relationship. The highest correlation was 0.11 (Concrete–Abstract), and even this is too small to be considered to be meaningful.
For interpretation purposes, it is reasonable to conclude that there are no clear relationships between age and facet scale scores.
Ethnic origin
Ethnic origin information was not captured for people who completed the Danish language version of the questionnaire, so no analyses were conducted.
MBTI Step II European Data Supplement
52
Occupational level
Research using the Danish version of the MBTI Step I questionnaire has demonstrated that individuals in higher-level jobs in organisations are more likely to have preferences for Extraversion, Intuition, Perceiving and (to some extent) Thinking than those in lower-level jobs.9
Table 3.8 shows the facet scale means and standard deviation for different occupational levels. The findings can be summarised as follows.
• There were no clear overall patterns regarding the facets in the E–I and J–P preference blocks.
• A pattern was found regarding the facets relating to the S–N dimensions, with mean scores of those at the top and senior executive levels tending to be further towards the N pole than those for the lower occupational level groups. No clear patterns were found between groups below the top and senior executive levels.
• A pattern was found regarding the facets relating to the T–F dimension, with the employee group mean scores tending further towards the F pole (or less towards the T pole) than other groups. No clear patterns were found between groups above employee level. This could be a reflection of the fact that females formed a considerably higher proportion of the employee group than they did of other groups.
9 See the MBTI Step I European Data Supplement for details.
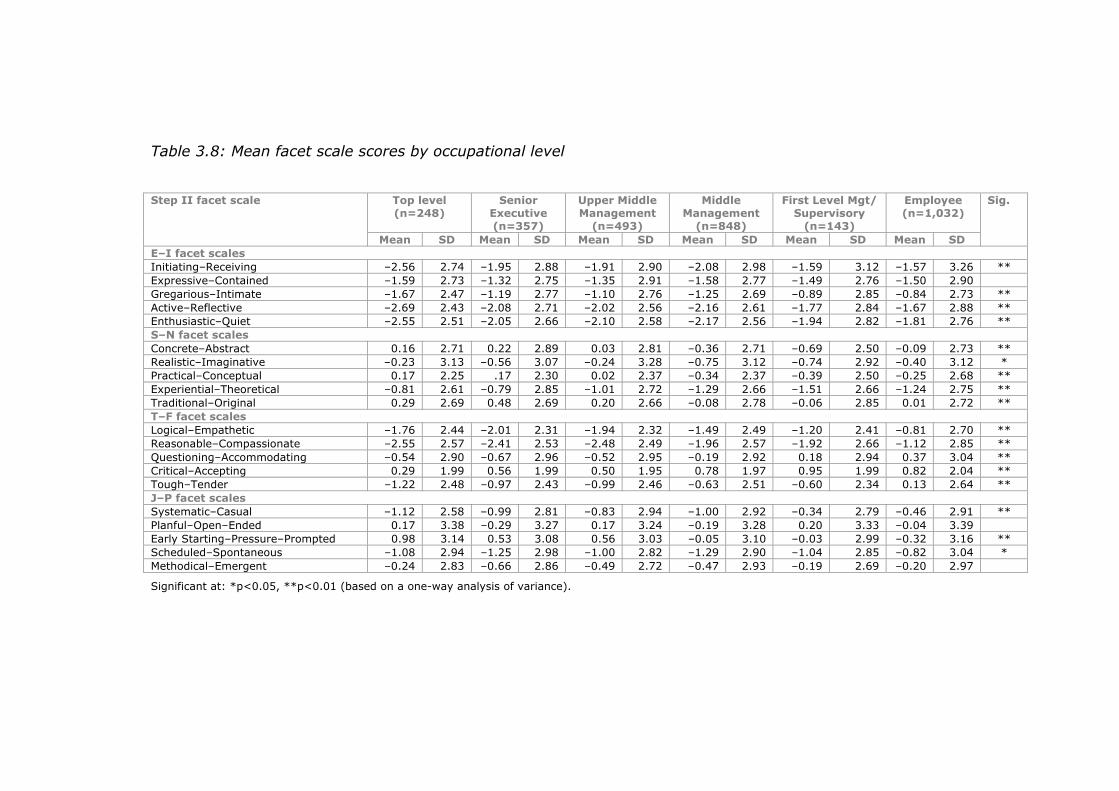
Table 3.8: Mean facet scale scores by occupational level
Top level (n=248)
Senior Executive (n=357)
Upper Middle Management
(n=493)
Middle Management
(n=848)
First Level Mgt/ Supervisory
(n=143)
Employee (n=1,032)
Step II facet scale
Mean SD Mean SD Mean SD Mean SD Mean SD Mean SD
Sig.
E–I facet scales Initiating–Receiving –2.56 2.74 –1.95 2.88 –1.91 2.90 –2.08 2.98 –1.59 3.12 –1.57 3.26 ** Expressive–Contained –1.59 2.73 –1.32 2.75 –1.35 2.91 –1.58 2.77 –1.49 2.76 –1.50 2.90 Gregarious–Intimate –1.67 2.47 –1.19 2.77 –1.10 2.76 –1.25 2.69 –0.89 2.85 –0.84 2.73 ** Active–Reflective –2.69 2.43 –2.08 2.71 –2.02 2.56 –2.16 2.61 –1.77 2.84 –1.67 2.88 ** Enthusiastic–Quiet –2.55 2.51 –2.05 2.66 –2.10 2.58 –2.17 2.56 –1.94 2.82 –1.81 2.76 ** S–N facet scales Concrete–Abstract 0.16 2.71 0.22 2.89 0.03 2.81 –0.36 2.71 –0.69 2.50 –0.09 2.73 ** Realistic–Imaginative –0.23 3.13 –0.56 3.07 –0.24 3.28 –0.75 3.12 –0.74 2.92 –0.40 3.12 * Practical–Conceptual 0.17 2.25 .17 2.30 0.02 2.37 –0.34 2.37 –0.39 2.50 –0.25 2.68 ** Experiential–Theoretical –0.81 2.61 –0.79 2.85 –1.01 2.72 –1.29 2.66 –1.51 2.66 –1.24 2.75 ** Traditional–Original 0.29 2.69 0.48 2.69 0.20 2.66 –0.08 2.78 –0.06 2.85 0.01 2.72 ** T–F facet scales Logical–Empathetic –1.76 2.44 –2.01 2.31 –1.94 2.32 –1.49 2.49 –1.20 2.41 –0.81 2.70 ** Reasonable–Compassionate –2.55 2.57 –2.41 2.53 –2.48 2.49 –1.96 2.57 –1.92 2.66 –1.12 2.85 ** Questioning–Accommodating –0.54 2.90 –0.67 2.96 –0.52 2.95 –0.19 2.92 0.18 2.94 0.37 3.04 ** Critical–Accepting 0.29 1.99 0.56 1.99 0.50 1.95 0.78 1.97 0.95 1.99 0.82 2.04 ** Tough–Tender –1.22 2.48 –0.97 2.43 –0.99 2.46 –0.63 2.51 –0.60 2.34 0.13 2.64 ** J–P facet scales Systematic–Casual –1.12 2.58 –0.99 2.81 –0.83 2.94 –1.00 2.92 –0.34 2.79 –0.46 2.91 ** Planful–Open–Ended 0.17 3.38 –0.29 3.27 0.17 3.24 –0.19 3.28 0.20 3.33 –0.04 3.39 Early Starting–Pressure–Prompted 0.98 3.14 0.53 3.08 0.56 3.03 –0.05 3.10 –0.03 2.99 –0.32 3.16 ** Scheduled–Spontaneous –1.08 2.94 –1.25 2.98 –1.00 2.82 –1.29 2.90 –1.04 2.85 –0.82 3.04 * Methodical–Emergent –0.24 2.83 –0.66 2.86 –0.49 2.72 –0.47 2.93 –0.19 2.69 –0.20 2.97
Significant at: *p<0.05, **p<0.01 (based on a one-way analysis of variance).
MBTI Step II European Data Supplement
54
Education
Specific educational qualifications were not collected for the OPPassessment sample; however, the age at which individuals left full-time education was. Few significant and meaningful correlations were found between the age at which people left full-time education and their facet scale scores. The most notable finding was that all the S–N facet scales correlated with age at which people left full-time education at between 0.13 and 0.17. Although these correlations are not high, they do suggest that people who left education at a later age were more likely to score towards the N pole on these facet scales.
Work area
Information regarding the area of work people engage in was collected for the group. Many different categories were used, but for the purposes of analysis the focus was on the five most commonly occurring. These were as follows:
• HR, training, guidance
• Sales, customer service
• Science, engineering
• Health, social services
• Administrative, secretarial.
Table 3.9 shows the facet scale means and standard deviation for these five work areas. The findings can be summarised as follows:
• An interesting pattern was found regarding the facets relating to the E–I dimensions. Although mean scores for all groups tended towards the E pole for each facet scale, scores were considerably further towards the E pole for the ‘Sales, customer service’ and ‘HR, training, guidance’ groups than for the ‘Administrative, secretarial’ group. Mean scores for the ‘Science, engineering’ and ‘Health, social services’ groups fell somewhere in between.
• On the facets relating to the S–N and J–P dimensions, mean scores for all groups tended towards the S and J poles for all groups except ‘HR, training, guidance’ and ‘Health, social services’. All the mean scores for the ‘HR, training, guidance’ group tended towards the N and P poles, whereas the scores for the ‘Health, social services’ group were more mixed on both dimensions.
• The most noticeable pattern regarding the facets in the T–F preference block was that although means scores for all groups tended towards the T pole (or the mid-point) on three out of the five facet scales, scores for all five work area groups tended towards the F pole for the Critical–Accepting facet scale. This is a common finding with this scale.
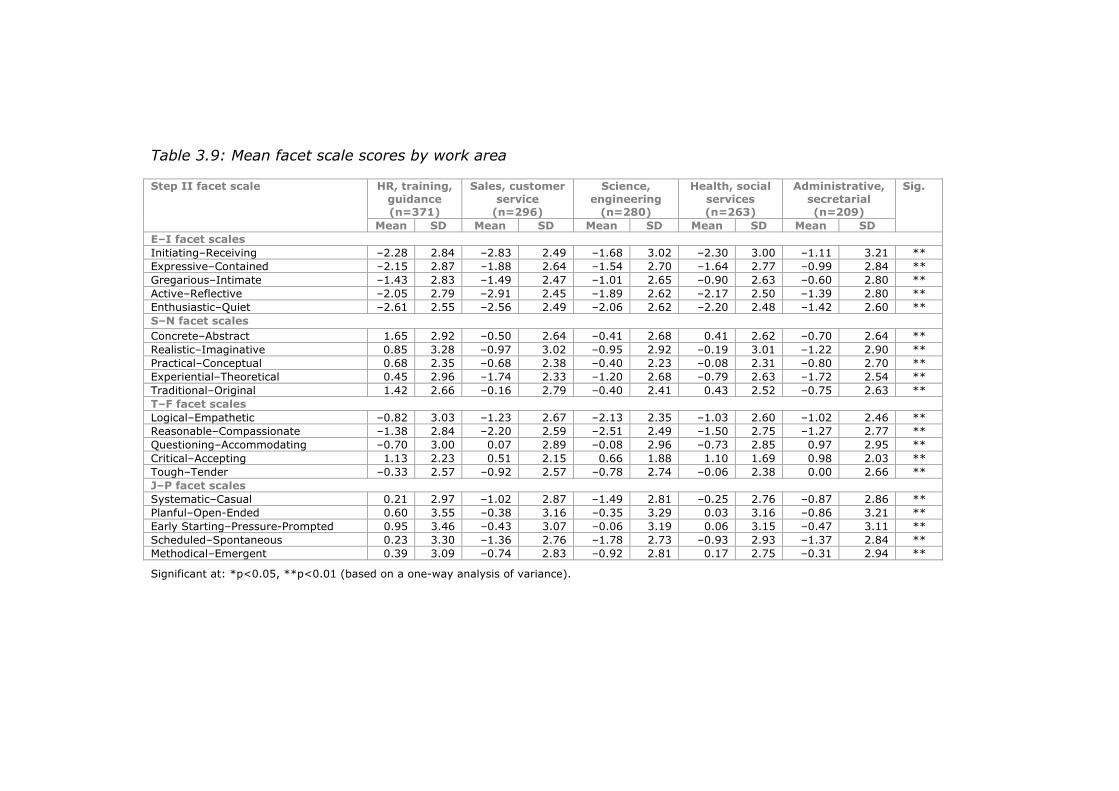
Table 3.9: Mean facet scale scores by work area
HR, training, guidance (n=371)
Sales, customer service
(n=296)
Science, engineering
(n=280)
Health, social services (n=263)
Administrative, secretarial (n=209)
Step II facet scale
Mean SD Mean SD Mean SD Mean SD Mean SD
Sig.
E–I facet scales Initiating–Receiving –2.28 2.84 –2.83 2.49 –1.68 3.02 –2.30 3.00 –1.11 3.21 ** Expressive–Contained –2.15 2.87 –1.88 2.64 –1.54 2.70 –1.64 2.77 –0.99 2.84 ** Gregarious–Intimate –1.43 2.83 –1.49 2.47 –1.01 2.65 –0.90 2.63 –0.60 2.80 ** Active–Reflective –2.05 2.79 –2.91 2.45 –1.89 2.62 –2.17 2.50 –1.39 2.80 ** Enthusiastic–Quiet –2.61 2.55 –2.56 2.49 –2.06 2.62 –2.20 2.48 –1.42 2.60 ** S–N facet scales Concrete–Abstract 1.65 2.92 –0.50 2.64 –0.41 2.68 0.41 2.62 –0.70 2.64 ** Realistic–Imaginative 0.85 3.28 –0.97 3.02 –0.95 2.92 –0.19 3.01 –1.22 2.90 ** Practical–Conceptual 0.68 2.35 –0.68 2.38 –0.40 2.23 –0.08 2.31 –0.80 2.70 ** Experiential–Theoretical 0.45 2.96 –1.74 2.33 –1.20 2.68 –0.79 2.63 –1.72 2.54 ** Traditional–Original 1.42 2.66 –0.16 2.79 –0.40 2.41 0.43 2.52 –0.75 2.63 ** T–F facet scales Logical–Empathetic –0.82 3.03 –1.23 2.67 –2.13 2.35 –1.03 2.60 –1.02 2.46 ** Reasonable–Compassionate –1.38 2.84 –2.20 2.59 –2.51 2.49 –1.50 2.75 –1.27 2.77 ** Questioning–Accommodating –0.70 3.00 0.07 2.89 –0.08 2.96 –0.73 2.85 0.97 2.95 ** Critical–Accepting 1.13 2.23 0.51 2.15 0.66 1.88 1.10 1.69 0.98 2.03 ** Tough–Tender –0.33 2.57 –0.92 2.57 –0.78 2.74 –0.06 2.38 0.00 2.66 ** J–P facet scales Systematic–Casual 0.21 2.97 –1.02 2.87 –1.49 2.81 –0.25 2.76 –0.87 2.86 ** Planful–Open-Ended 0.60 3.55 –0.38 3.16 –0.35 3.29 0.03 3.16 –0.86 3.21 ** Early Starting–Pressure-Prompted 0.95 3.46 –0.43 3.07 –0.06 3.19 0.06 3.15 –0.47 3.11 ** Scheduled–Spontaneous 0.23 3.30 –1.36 2.76 –1.78 2.73 –0.93 2.93 –1.37 2.84 ** Methodical–Emergent 0.39 3.09 –0.74 2.83 –0.92 2.81 0.17 2.75 –0.31 2.94 **
Significant at: *p<0.05, **p<0.01 (based on a one-way analysis of variance).
MBTI Step II European Data Supplement
56
Nationality
Information on nationality was available for the group. Ninety-seven per cent of the group were Danish, and no other nationality was represented in large numbers. Therefore, no analyses of national differences were conducted.
Employment status
Employment status information was available for the OPPassessment sample. The vast majority of the group worked either full-time or part-time, or were self-employed. Table 3.10 shows the mean facet scale scores for each group, with the data illustrated in graphical form in Figure 3.3.
The analyses showed statistically significant differences across the groups on several of the facet scales on the S–N, T–F and J–P dimensions, but none of the five facets on the E–I dimension. The clearest patterns were as follows:
• The self-employed group tended to score more towards the N pole on the S–N facet scales than the other two groups, and less towards the J pole on the J–P facet scales.
• The full-time group tended to score more towards the T pole on the T–F facet scales than the other two groups, particularly the part-time group. This is likely to be at least partly a gender effect; 76% of part-time workers were female, compared with 43% of the total group and 42% of full-time workers.
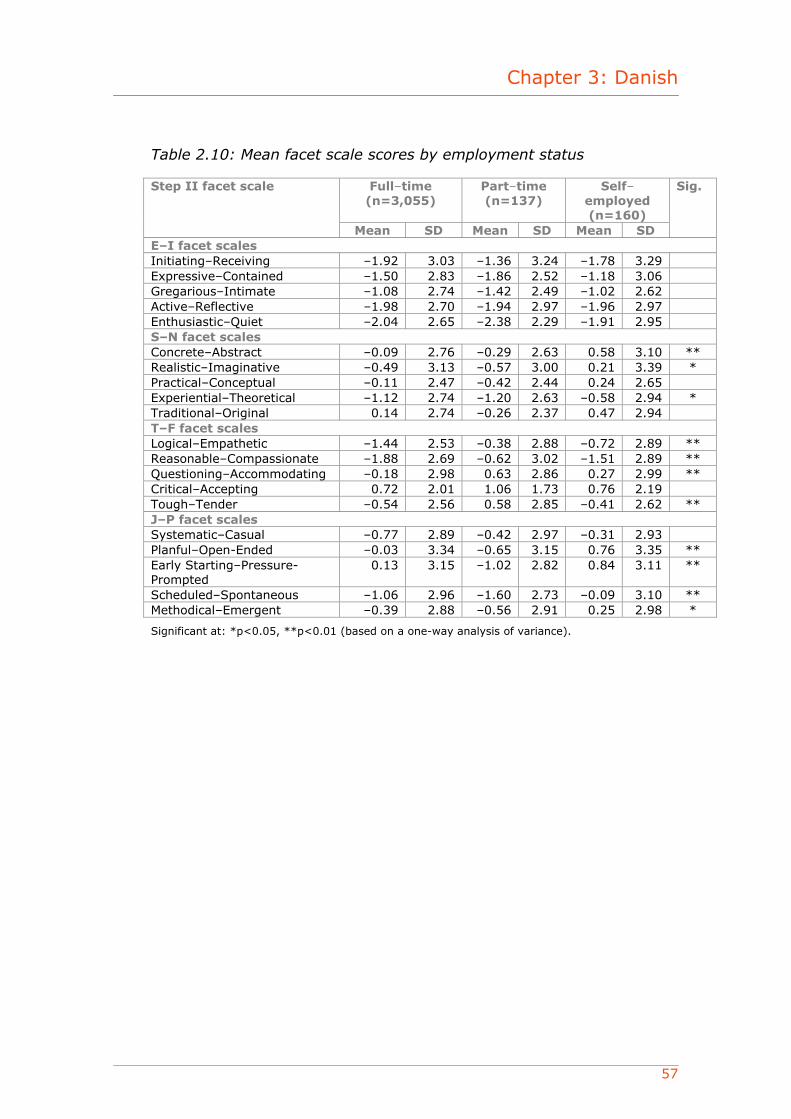
Chapter 3: Danish
57
Table 2.10: Mean facet scale scores by employment status
Full–time (n=3,055)
Part–time (n=137)
Self–employed (n=160)
Step II facet scale
Mean SD Mean SD Mean SD
Sig.
E–I facet scales Initiating–Receiving –1.92 3.03 –1.36 3.24 –1.78 3.29 Expressive–Contained –1.50 2.83 –1.86 2.52 –1.18 3.06 Gregarious–Intimate –1.08 2.74 –1.42 2.49 –1.02 2.62 Active–Reflective –1.98 2.70 –1.94 2.97 –1.96 2.97 Enthusiastic–Quiet –2.04 2.65 –2.38 2.29 –1.91 2.95 S–N facet scales Concrete–Abstract –0.09 2.76 –0.29 2.63 0.58 3.10 ** Realistic–Imaginative –0.49 3.13 –0.57 3.00 0.21 3.39 * Practical–Conceptual –0.11 2.47 –0.42 2.44 0.24 2.65 Experiential–Theoretical –1.12 2.74 –1.20 2.63 –0.58 2.94 * Traditional–Original 0.14 2.74 –0.26 2.37 0.47 2.94 T–F facet scales Logical–Empathetic –1.44 2.53 –0.38 2.88 –0.72 2.89 ** Reasonable–Compassionate –1.88 2.69 –0.62 3.02 –1.51 2.89 ** Questioning–Accommodating –0.18 2.98 0.63 2.86 0.27 2.99 ** Critical–Accepting 0.72 2.01 1.06 1.73 0.76 2.19 Tough–Tender –0.54 2.56 0.58 2.85 –0.41 2.62 ** J–P facet scales Systematic–Casual –0.77 2.89 –0.42 2.97 –0.31 2.93 Planful–Open-Ended –0.03 3.34 –0.65 3.15 0.76 3.35 ** Early Starting–Pressure-Prompted
0.13 3.15 –1.02 2.82 0.84 3.11 **
Scheduled–Spontaneous –1.06 2.96 –1.60 2.73 –0.09 3.10 ** Methodical–Emergent –0.39 2.88 –0.56 2.91 0.25 2.98 *
Significant at: *p<0.05, **p<0.01 (based on a one-way analysis of variance).
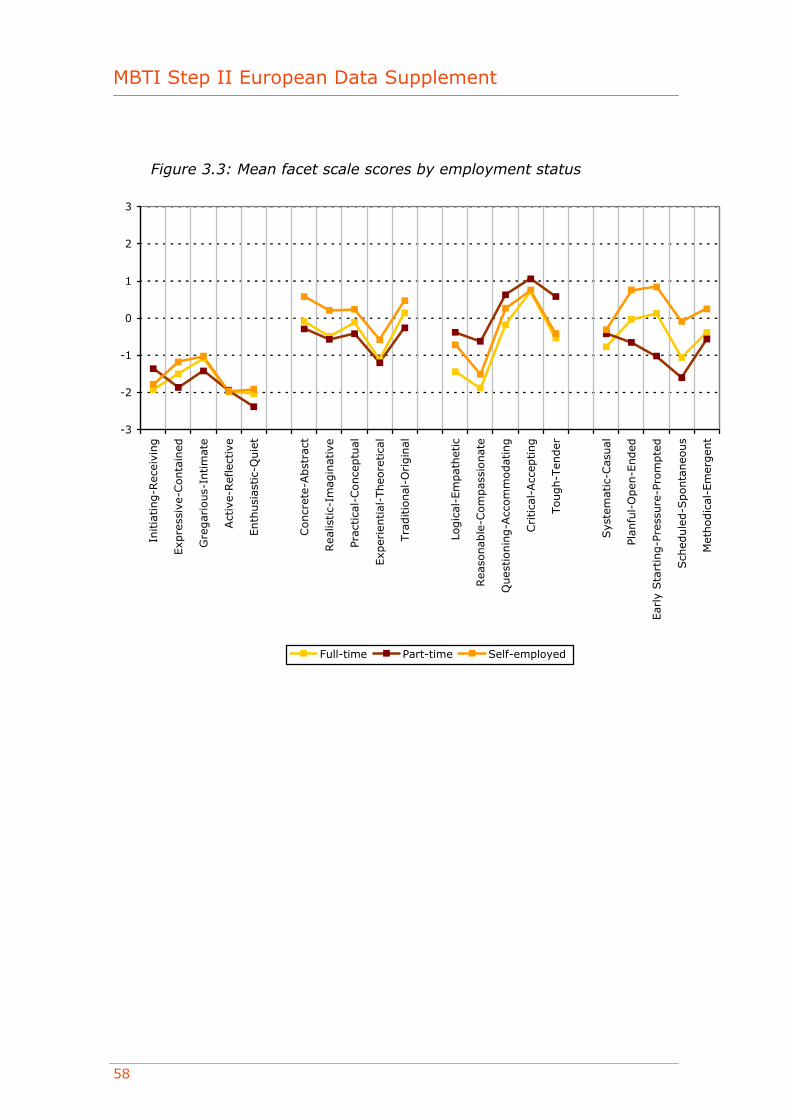
MBTI Step II European Data Supplement
58
Figure 3.3: Mean facet scale scores by employment status
-3
-2
-1
0
1
2
3
Initia
ting-R
ecei
ving
Exp
ress
ive-
Conta
ined
Gre
gar
ious-
Intim
ate
Act
ive-
Ref
lect
ive
Enth
usi
astic-
Quie
t
Concr
ete-
Abst
ract
Rea
listic-
Imag
inat
ive
Prac
tica
l-Conce
ptu
al
Exp
erie
ntial
-Theo
retica
l
Tra
ditio
nal
-Origin
al
Logic
al-E
mpat
het
ic
Rea
sonab
le-C
om
pas
sionat
e
Ques
tionin
g-A
ccom
modat
ing
Critica
l-Acc
epting
Tough-T
ender
Sys
tem
atic
-Cas
ual
Plan
ful-
Open
-Ended
Ear
ly S
tart
ing-P
ress
ure
-Pro
mpte
d
Sch
edule
d-S
ponta
neo
us
Met
hodic
al-E
mer
gen
t
Full-time Part-time Self-employed
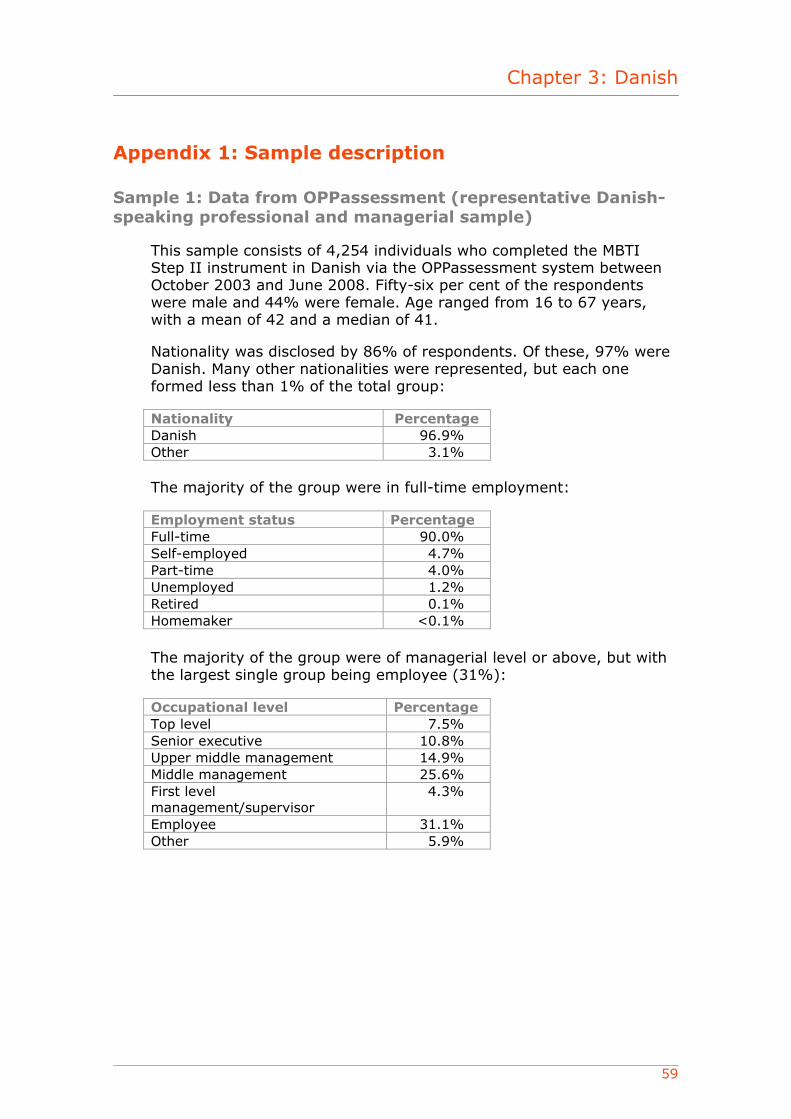
Chapter 3: Danish
59
Appendix 1: Sample description
Sample 1: Data from OPPassessment (representative Danish-speaking professional and managerial sample)
This sample consists of 4,254 individuals who completed the MBTI Step II instrument in Danish via the OPPassessment system between October 2003 and June 2008. Fifty-six per cent of the respondents were male and 44% were female. Age ranged from 16 to 67 years, with a mean of 42 and a median of 41.
Nationality was disclosed by 86% of respondents. Of these, 97% were Danish. Many other nationalities were represented, but each one formed less than 1% of the total group:
Nationality Percentage Danish 96.9% Other 3.1%
The majority of the group were in full-time employment:
Employment status Percentage Full-time 90.0% Self-employed 4.7% Part-time 4.0% Unemployed 1.2% Retired 0.1% Homemaker <0.1%
The majority of the group were of managerial level or above, but with the largest single group being employee (31%):
Occupational level Percentage Top level 7.5% Senior executive 10.8% Upper middle management 14.9% Middle management 25.6% First level management/supervisor
4.3%
Employee 31.1% Other 5.9%
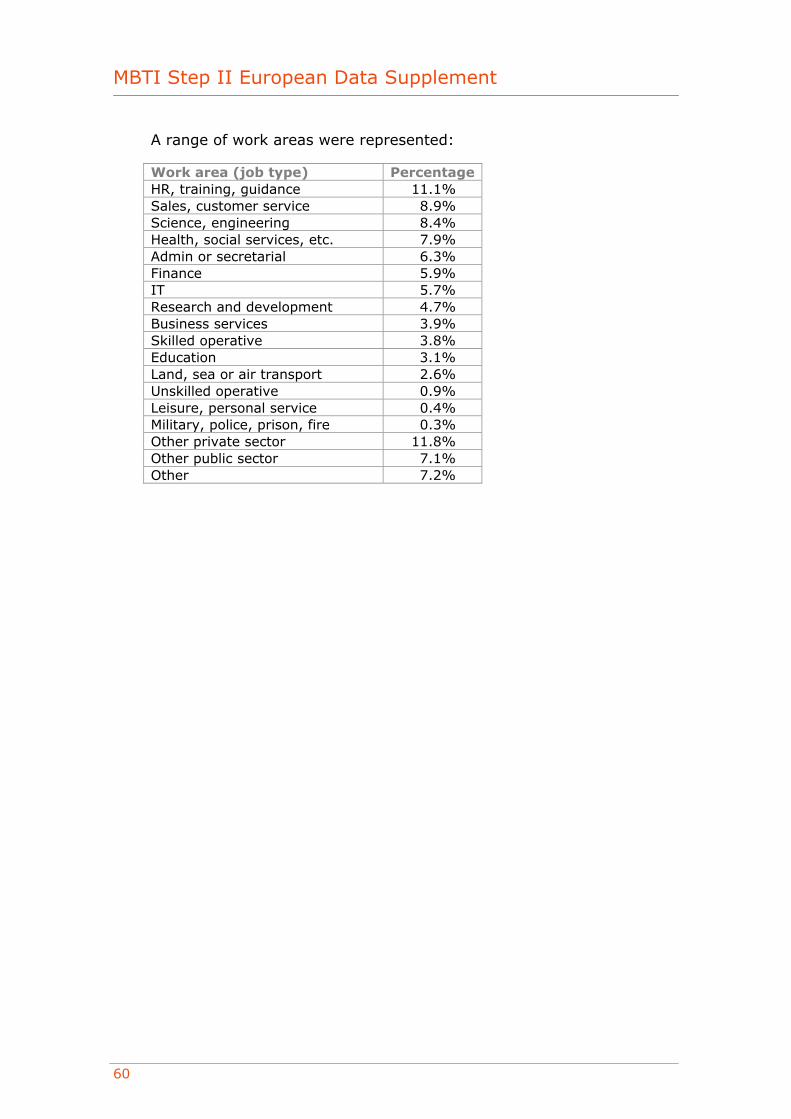
MBTI Step II European Data Supplement
60
A range of work areas were represented:
Work area (job type) Percentage HR, training, guidance 11.1% Sales, customer service 8.9% Science, engineering 8.4% Health, social services, etc. 7.9% Admin or secretarial 6.3% Finance 5.9% IT 5.7% Research and development 4.7% Business services 3.9% Skilled operative 3.8% Education 3.1% Land, sea or air transport 2.6% Unskilled operative 0.9% Leisure, personal service 0.4% Military, police, prison, fire 0.3% Other private sector 11.8% Other public sector 7.1% Other 7.2%

Chapter 4: Dutch
61
European Data Supplement Dutch
January 2009
OPP Ltd Elsfield Hall
15–17 Elsfield Way Oxford OX2 8EP
UK t: +44 (0)845 603 9958 f: +44 (0)1865 557483
MBTI® Step II instrument
MBTI Step II European Data Supplement
62
Contents
Introduction .............................................................................63 Type distribution .......................................................................64
OPPassessment data (representative Dutch-speaking professional and managerial sample)......................................................65
Properties of the Step II facet scales ............................................66 Facet scale score distribution...................................................66 Facet scale intercorrelations ....................................................68 Correlations of Step II facet scales with Step I scales..................70 Out-of-preference scores ........................................................71 Reliability .............................................................................72 Group differences ..................................................................73
Appendix 1: Sample description ..................................................85 Sample 1: Data from OPPassessment (representative Dutch-
speaking professional and managerial sample) .......................85
© Copyright 2009 OPP Ltd. All rights reserved.
No portion of this publication may be translated or reproduced in whole or in part, stored in a retrieval system, or transmitted in any form or by any means (electronic, mechanical, photocopying, recording or otherwise) without the prior written permission of the copyright owner. No part of this publication is reproducible under any photocopying licence scheme. OPP Ltd grants the downloader a personal, non-transferable, perpetual, irrevocable right to use the Supplement. The European Data Supplement (‘the Supplement’) is for personal use only and may not be sold on or circulated to third parties.
® MBTI, Myers-Briggs and the Myers-Briggs Type Indicator are registered trade marks of the Myers-Briggs Type Indicator Trust. OPP is licensed to use the trade marks in Europe.
® OPP is a registered trade mark of OPP Ltd in the European Community.
Chapter 4: Dutch
63
Introduction
Data collected for the European MBTI Step II instrument were analysed to produce the findings in this supplement. This is the first data supplement produced for this instrument, and contains all the data gathered to date since the launch of the instrument in 2003. A brief description of the sample is given below. Further details of the sample are provided in Appendix 1.
• The sample consisted of 5,779 individuals who completed the MBTI Step II instrument in Dutch via the OPPassessment system between 2003 and mid-2008.1 This sample is considered to be representative of the groups of people with whom the Dutch MBTI Step II instrument has been and will be used for applications such as management development, coaching, counselling and teambuilding. As such, it is likely to represent a cross-section of the Dutch-speaking professional and managerial population.
The results of the analyses are outlined below.
1 OPPassessment allows personality questionnaires such as the MBTI instrument to be administered via email and/or completed online.
MBTI Step II European Data Supplement
64
Type distribution
Type tables are a way of illustrating the proportion of each type within a particular group. Below is a type table taken from the sample described on the previous page.
For each of the 16 different types, the number of cases, the percentage of the total that this represents and the self-selection ratio (SSR) are shown. The SSR (Myers et al., 1998) is a way of demonstrating whether a given type appears more or less often in a particular group than would be expected given its frequency in a reference group. Ideally, the type distribution from a large representative sample of the Dutch and/or Belgian population would be used to calculate SSRs in this data supplement. However, such a sample does not currently exist. In its place, SSRs have been calculated using type data from the UK general population (Kendall, 1998), which can be justified by the fact that type distributions for comparable Dutch/Belgian and British groups, such as managers and professionals, are similar. Evidence (eg Hackston and Kendall, 2004; Quenk et al., 2004) does suggest that although type-related behaviours vary a good deal from country to country and from culture to culture, the frequencies of underlying MBTI types do not.
An SSR of greater than 1 indicates that a type is over-represented, and an SSR of less than 1 denotes that it is under-represented. Asterisks are used to denote whether the over- or under-representations are statistically significant, based on the results of chi-square analysis.2
2 Chi-square analysis (often abbreviated to χ2) is a technique used to explore whether observed frequency distributions differ significantly from other, predefined, distributions. In this case, the UK general population group is used as the reference group, and the chi-square analysis indicates whether the proportion of people of each type within a particular sample differs significantly from the proportion of people reporting the same type within the reference group.
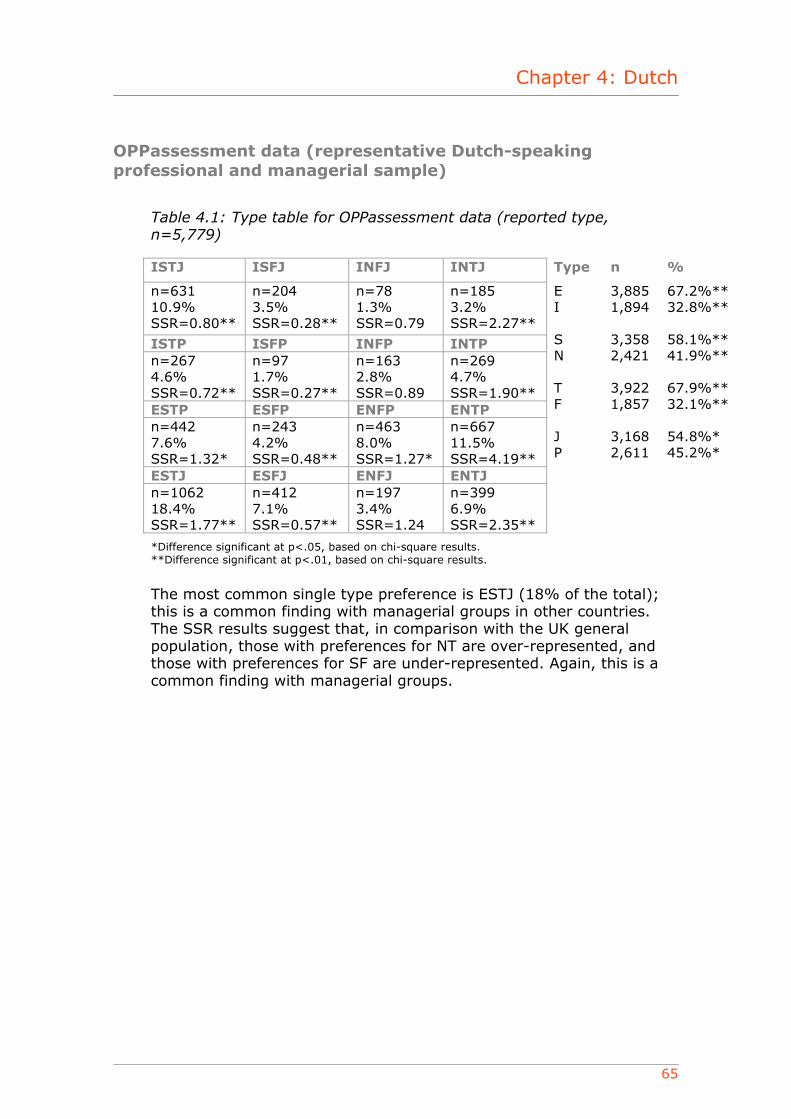
Chapter 4: Dutch
65
OPPassessment data (representative Dutch-speaking professional and managerial sample)
Table 4.1: Type table for OPPassessment data (reported type, n=5,779)
ISTJ ISFJ INFJ INTJ Type n %
n=631 10.9% SSR=0.80**
n=204 3.5% SSR=0.28**
n=78 1.3% SSR=0.79
n=185 3.2% SSR=2.27**
ISTP ISFP INFP INTP n=267 4.6% SSR=0.72**
n=97 1.7% SSR=0.27**
n=163 2.8% SSR=0.89
n=269 4.7% SSR=1.90**
ESTP ESFP ENFP ENTP n=442 7.6% SSR=1.32*
n=243 4.2% SSR=0.48**
n=463 8.0% SSR=1.27*
n=667 11.5% SSR=4.19**
ESTJ ESFJ ENFJ ENTJ n=1062 18.4% SSR=1.77**
n=412 7.1% SSR=0.57**
n=197 3.4% SSR=1.24
n=399 6.9% SSR=2.35**
E I S N T F J P
3,885 1,894 3,358 2,421 3,922 1,857 3,168 2,611
67.2%** 32.8%** 58.1%** 41.9%** 67.9%** 32.1%** 54.8%* 45.2%*
*Difference significant at p<.05, based on chi-square results. **Difference significant at p<.01, based on chi-square results.
The most common single type preference is ESTJ (18% of the total); this is a common finding with managerial groups in other countries. The SSR results suggest that, in comparison with the UK general population, those with preferences for NT are over-represented, and those with preferences for SF are under-represented. Again, this is a common finding with managerial groups.

MBTI Step II European Data Supplement
66
Properties of the Step II facet scales
Facet scale score distribution
The means and standard deviations of the Step II facets are shown in Table 4.2, and illustrated graphically in Figure 4.1. The mean score for a scale is calculated by adding together the scores of each individual in the sample and then dividing the sum by the number of individuals. Note that negative values indicate that mean scores are nearer the left-hand pole of the facet and positive values indicate that the mean scores are nearer the right-hand pole. The standard deviation (SD) is a statistical measure describing the degree to which the scores from the sample either bunch up close to, or are scattered widely around, the mean for the sample.
Table 4.2: Means and standard deviations of the facet scales
Step II facet scale Mean3 SD E–I facet scales Initiating–Receiving –1.52 3.17 Expressive–Contained –0.80 3.08 Gregarious–Intimate –0.75 2.74 Active–Reflective –1.61 2.94 Enthusiastic–Quiet –1.05 3.09 S–N facet scales Concrete–Abstract –0.82 2.67 Realistic–Imaginative –0.82 3.09 Practical–Conceptual –1.18 2.69 Experiential–Theoretical –1.20 2.57 Traditional–Original –0.10 3.21 T–F facet scales Logical–Empathetic –0.98 2.91 Reasonable–Compassionate –1.15 2.88 Questioning–Accommodating –0.08 2.61 Critical–Accepting 0.59 2.76 Tough–Tender –1.04 2.65 J–P facet scales Systematic–Casual –0.28 2.93 Planful–Open-Ended –0.09 3.44 Early Starting–Pressure-Prompted 0.03 3.63 Scheduled–Spontaneous –0.64 3.17 Methodical–Emergent –1.22 2.94
3 Scale means: in Step II reports, scores are given from 5 on one pole, through 0, to 5 on the opposite pole. In compiling statistical information, however, one pole needs to be clearly distinguished from the other. Throughout this data supplement, therefore, a convention has been adopted of scores 5, 4, 3, 2 or 1 on the left-hand pole being assigned values of –5, –4, –3, –2, or –1 and scores on the right-hand pole being assigned positive scores. This does not, of course, imply any suggestion that positive scores are ‘better’ than negative scores.
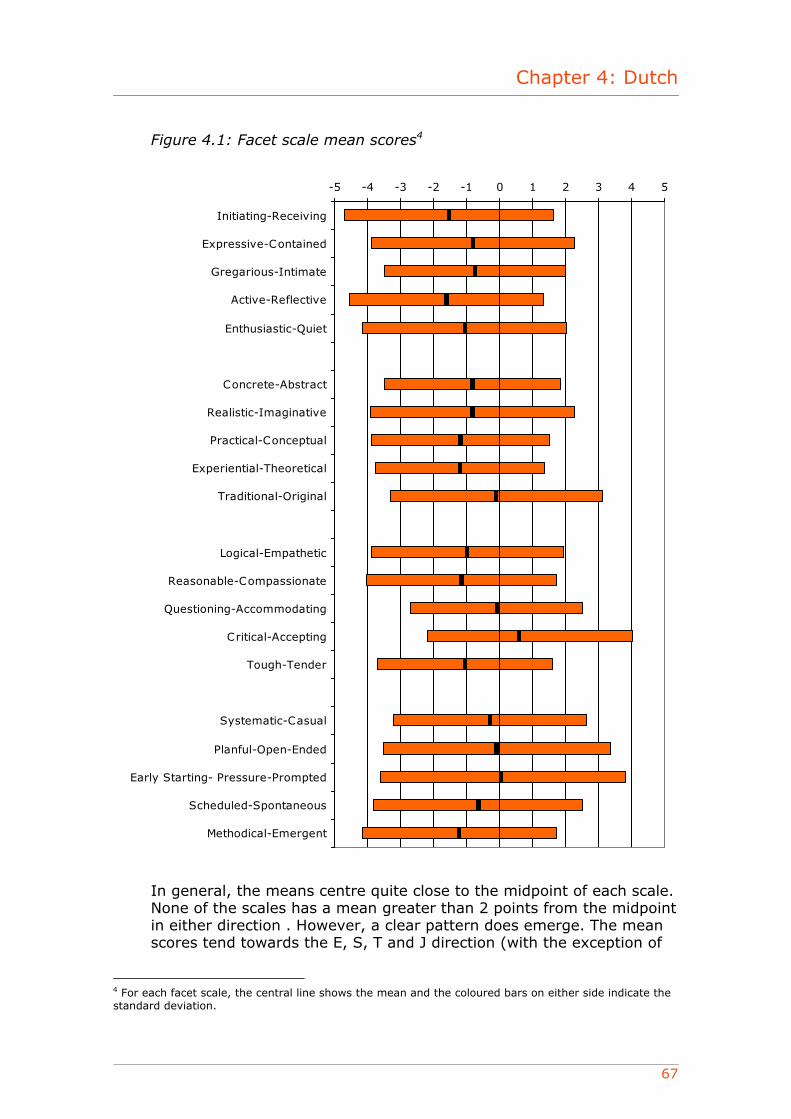
Chapter 4: Dutch
67
Figure 4.1: Facet scale mean scores4
-5 -4 -3 -2 -1 0 1 2 3 4 5
Initiating-Receiving
Expressive-Contained
Gregarious-Intimate
Active-Reflective
Enthusiastic-Quiet
Concrete-Abstract
Realistic-Imaginative
Practical-Conceptual
Experiential-Theoretical
Traditional-Original
Logical-Empathetic
Reasonable-Compassionate
Questioning-Accommodating
Critical-Accepting
Tough-Tender
Systematic-Casual
Planful-Open-Ended
Early Starting- Pressure-Prompted
Scheduled-Spontaneous
Methodical-Emergent
In general, the means centre quite close to the midpoint of each scale. None of the scales has a mean greater than 2 points from the midpoint in either direction . However, a clear pattern does emerge. The mean scores tend towards the E, S, T and J direction (with the exception of
4 For each facet scale, the central line shows the mean and the coloured bars on either side indicate the standard deviation.
MBTI Step II European Data Supplement
68
Critical–Accepting and Early Starting–Pressure-Prompted), which is consistent with the most common four-letter type preference amongst this sample. Amongst the group as a whole, there are more individuals with a preference for E, S, T and J.
Facet scale intercorrelations
Correlations among the Step II facet scales are shown in Table 4.3. Facet scales within each dichotomy consistently correlate more highly (usually substantially so) with the other scales of the same dichotomy than they do with scales in the other three dichotomies. For example, every E–I facet scale correlates higher with the other four E–I scales than with any of the S–N, T–F or J–P facet scales.
There is only one scale that correlates significantly more highly with scales in other dichotomies. The T–F scale Questioning–Accommodating correlates with many scales, across dichotomies. For example, it correlates at a level of 0.20 with Enthusiastic–Quiet, at 0.18 with Active–Reflective and at 0.15 with Initiating–Receiving, all of which are on the E–I dichotomy. It correlates negatively at between –0.22 and –0.38 with all of the S–N scales, and at –0.22 with Early Starting–Pressure-Prompted on the J–P dichotomy. By way of comparison, it correlates at between 0.19 and 0.28 with the other four scales on the same dichotomy as itself (T–F). The negative correlations between Questioning–Accommodating and the S–N scales are consistent with findings from the US version of the Step II instrument, and suggest that a questioning approach to differences of opinion seems to be related to a range of Intuitive (N) facets. These patterns are similar to those found when the European Step II instrument was developed.
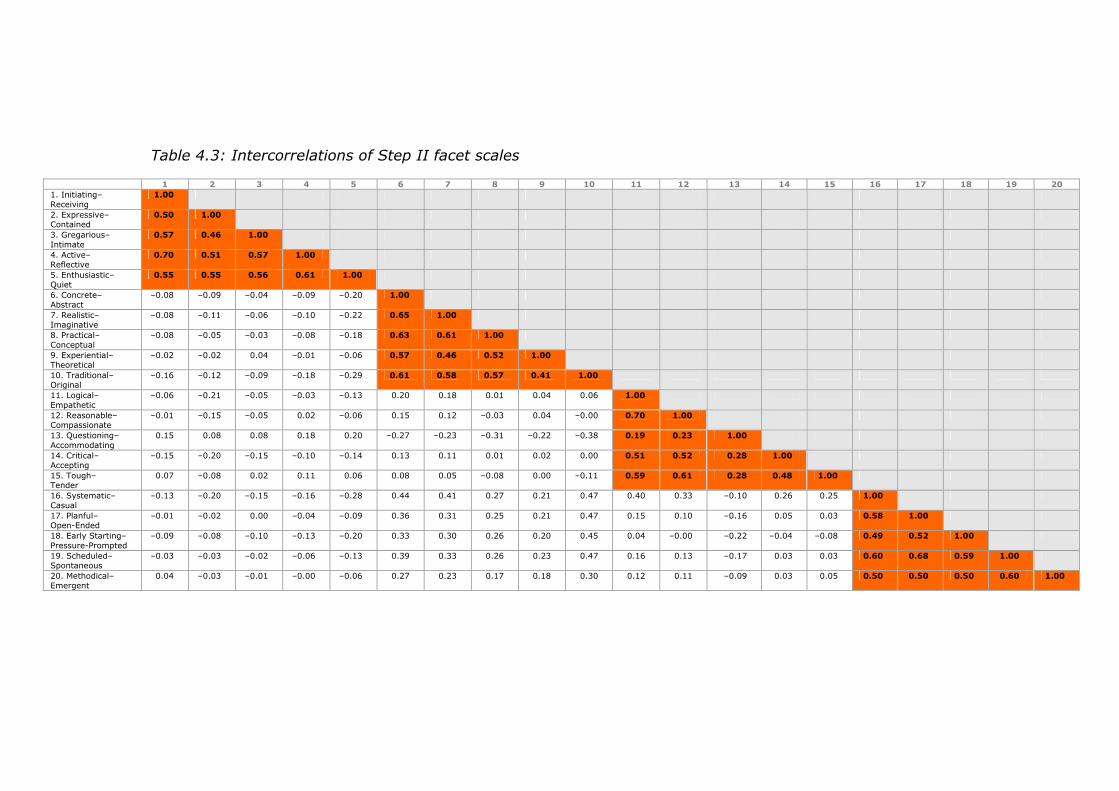
Table 4.3: Intercorrelations of Step II facet scales
1 2 3 4 5 6 7 8 9 10 11 12 13 14 15 16 17 18 19 20 1. Initiating– Receiving
1.00
2. Expressive– Contained
0.50 1.00
3. Gregarious– Intimate
0.57 0.46 1.00
4. Active– Reflective
0.70 0.51 0.57 1.00
5. Enthusiastic– Quiet
0.55 0.55 0.56 0.61 1.00
6. Concrete– Abstract
–0.08 –0.09 –0.04 –0.09 –0.20 1.00
7. Realistic– Imaginative
–0.08 –0.11 –0.06 –0.10 –0.22 0.65 1.00
8. Practical– Conceptual
–0.08 –0.05 –0.03 –0.08 –0.18 0.63 0.61 1.00
9. Experiential– Theoretical
–0.02 –0.02 0.04 –0.01 –0.06 0.57 0.46 0.52 1.00
10. Traditional– Original
–0.16 –0.12 –0.09 –0.18 –0.29 0.61 0.58 0.57 0.41 1.00
11. Logical– Empathetic
–0.06 –0.21 –0.05 –0.03 –0.13 0.20 0.18 0.01 0.04 0.06 1.00
12. Reasonable– Compassionate
–0.01 –0.15 –0.05 0.02 –0.06 0.15 0.12 –0.03 0.04 –0.00 0.70 1.00
13. Questioning– Accommodating
0.15 0.08 0.08 0.18 0.20 –0.27 –0.23 –0.31 –0.22 –0.38 0.19 0.23 1.00
14. Critical– Accepting
–0.15 –0.20 –0.15 –0.10 –0.14 0.13 0.11 0.01 0.02 0.00 0.51 0.52 0.28 1.00
15. Tough– Tender
0.07 –0.08 0.02 0.11 0.06 0.08 0.05 –0.08 0.00 –0.11 0.59 0.61 0.28 0.48 1.00
16. Systematic– Casual
–0.13 –0.20 –0.15 –0.16 –0.28 0.44 0.41 0.27 0.21 0.47 0.40 0.33 –0.10 0.26 0.25 1.00
17. Planful– Open-Ended
–0.01 –0.02 0.00 –0.04 –0.09 0.36 0.31 0.25 0.21 0.47 0.15 0.10 –0.16 0.05 0.03 0.58 1.00
18. Early Starting– Pressure-Prompted
–0.09 –0.08 –0.10 –0.13 –0.20 0.33 0.30 0.26 0.20 0.45 0.04 –0.00 –0.22 –0.04 –0.08 0.49 0.52 1.00
19. Scheduled– Spontaneous
–0.03 –0.03 –0.02 –0.06 –0.13 0.39 0.33 0.26 0.23 0.47 0.16 0.13 –0.17 0.03 0.03 0.60 0.68 0.59 1.00
20. Methodical– Emergent
0.04 –0.03 –0.01 –0.00 –0.06 0.27 0.23 0.17 0.18 0.30 0.12 0.11 –0.09 0.03 0.05 0.50 0.50 0.50 0.60 1.00

MBTI Step II European Data Supplement
70
Correlations of Step II facet scales with Step I scales
Correlation between Step II facet scales and the continuous scores from the MBTI Step I instrument are shown in Table 4.4.5 Positive correlations between facet scales and the corresponding Step I dimension (e.g. between Initiating–Receiving and the E–I continuous score) indicate relationships in the expected direction, with higher facet scores tending to be associated with higher continuous scores, and vice versa. Negative correlations would indicate an inverse relationship between the facet scale scores and the corresponding Step I dimension.
Table 4.4: Correlations of Step II facet scales with Step I continuous scores
Step I continuous score Step II facet scales E–I S–N T–F J–P E–I facet scales Initiating–Receiving 0.82 –0.09 –0.06 –0.03 Expressive–Contained 0.71 –0.09 –0.22 –0.05 Gregarious–Intimate 0.68 –0.04 –0.07 –0.04 Active–Reflective 0.83 –0.11 –0.03 –0.07 Enthusiastic–Quiet 0.79 –0.23 –0.12 –0.16 S–N facet scales Concrete–Abstract –0.11 0.84 0.20 0.45 Realistic–Imaginative –0.13 0.78 0.18 0.39 Practical–Conceptual –0.09 0.72 0.00 0.33 Experiential–Theoretical –0.01 0.64 0.04 0.26 Traditional–Original –0.20 0.74 0.03 0.55 T–F facet scales Logical–Empathetic –0.12 0.14 0.88 0.17 Reasonable–Compassionate –0.05 0.09 0.79 0.12 Questioning–Accommodating 0.19 –0.33 0.30 –0.20 Critical–Accepting –0.15 0.07 0.65 0.04 Tough–Tender 0.06 0.01 0.73 0.03 J–P facet scales Systematic–Casual –0.21 0.43 0.41 0.72 Planful–Open-Ended –0.04 0.38 0.13 0.85 Early Starting–Pressure-Prompted –0.14 0.36 0.02 0.75 Scheduled–Spontaneous –0.06 0.40 0.13 0.83 Methodical–Emergent 0.00 0.26 0.11 0.68
The E–I facet scales correlate at a level of 0.68 to 0.83 with the E–I continuous scores from Step I; the S–N facet scales correlate at 0.64 to 0.84 with the S–N continuous scores; the T–F facet scales correlate at 0.30 to 0.88 with the T–F continuous scores; and the J–P facet
5 Continuous scores place an individual’s score on each dimension onto a continuous scale with a midpoint of 100. To calculate continuous scores, Preference Clarity Index (PCI) scores for each dimension are either subtracted or added to 100, depending on which direction the overall preference is. PCI scores in the direction of E, S, T or J are subtracted from 100. PCI scores in the direction of I, N, F or P are added to 100.
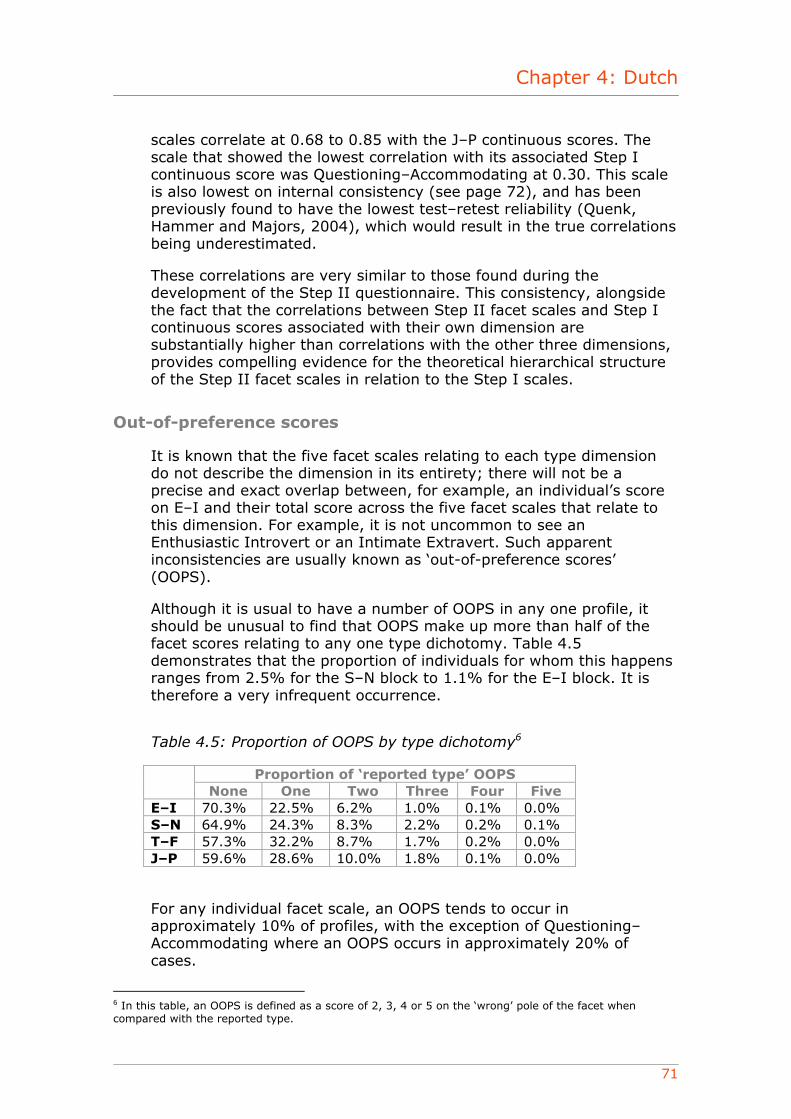
Chapter 4: Dutch
71
scales correlate at 0.68 to 0.85 with the J–P continuous scores. The scale that showed the lowest correlation with its associated Step I continuous score was Questioning–Accommodating at 0.30. This scale is also lowest on internal consistency (see page 72), and has been previously found to have the lowest test–retest reliability (Quenk, Hammer and Majors, 2004), which would result in the true correlations being underestimated.
These correlations are very similar to those found during the development of the Step II questionnaire. This consistency, alongside the fact that the correlations between Step II facet scales and Step I continuous scores associated with their own dimension are substantially higher than correlations with the other three dimensions, provides compelling evidence for the theoretical hierarchical structure of the Step II facet scales in relation to the Step I scales.
Out-of-preference scores
It is known that the five facet scales relating to each type dimension do not describe the dimension in its entirety; there will not be a precise and exact overlap between, for example, an individual’s score on E–I and their total score across the five facet scales that relate to this dimension. For example, it is not uncommon to see an Enthusiastic Introvert or an Intimate Extravert. Such apparent inconsistencies are usually known as ‘out-of-preference scores’ (OOPS).
Although it is usual to have a number of OOPS in any one profile, it should be unusual to find that OOPS make up more than half of the facet scores relating to any one type dichotomy. Table 4.5 demonstrates that the proportion of individuals for whom this happens ranges from 2.5% for the S–N block to 1.1% for the E–I block. It is therefore a very infrequent occurrence.
Table 4.5: Proportion of OOPS by type dichotomy6
Proportion of ‘reported type’ OOPS None One Two Three Four Five
E–I 70.3% 22.5% 6.2% 1.0% 0.1% 0.0% S–N 64.9% 24.3% 8.3% 2.2% 0.2% 0.1% T–F 57.3% 32.2% 8.7% 1.7% 0.2% 0.0% J–P 59.6% 28.6% 10.0% 1.8% 0.1% 0.0%
For any individual facet scale, an OOPS tends to occur in approximately 10% of profiles, with the exception of Questioning–Accommodating where an OOPS occurs in approximately 20% of cases.
6 In this table, an OOPS is defined as a score of 2, 3, 4 or 5 on the ‘wrong’ pole of the facet when compared with the reported type.
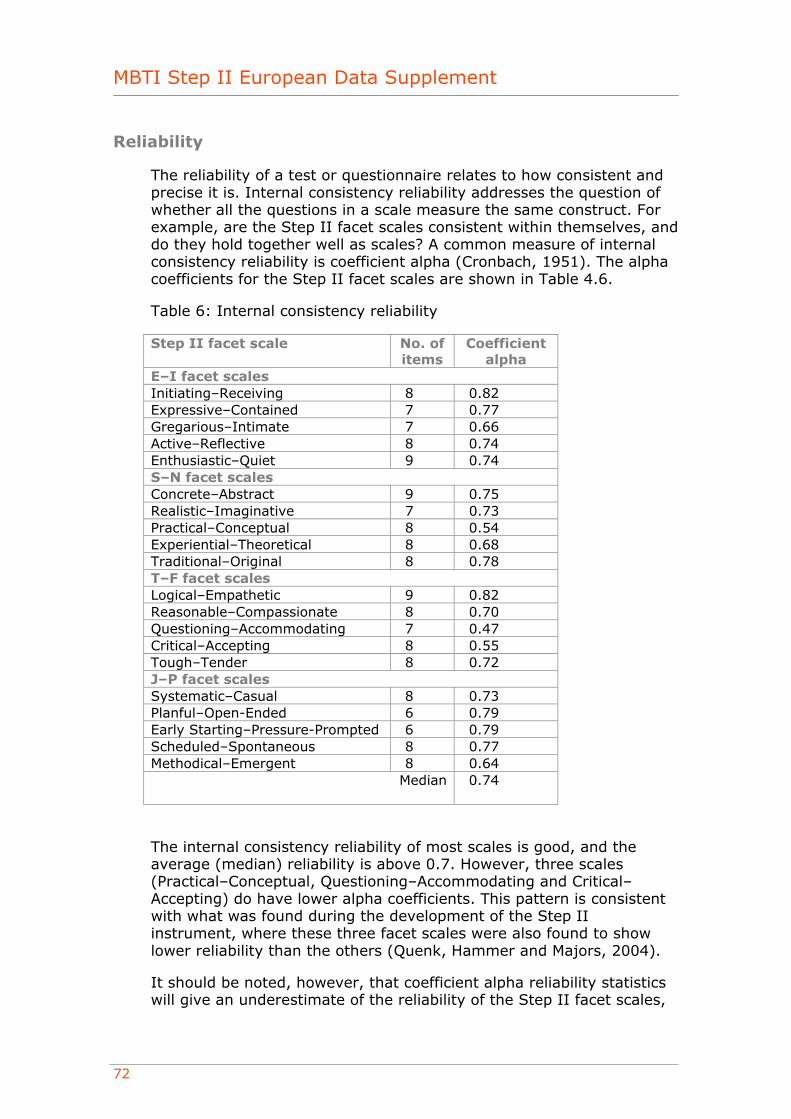
MBTI Step II European Data Supplement
72
Reliability
The reliability of a test or questionnaire relates to how consistent and precise it is. Internal consistency reliability addresses the question of whether all the questions in a scale measure the same construct. For example, are the Step II facet scales consistent within themselves, and do they hold together well as scales? A common measure of internal consistency reliability is coefficient alpha (Cronbach, 1951). The alpha coefficients for the Step II facet scales are shown in Table 4.6.
Table 6: Internal consistency reliability
Step II facet scale No. of items
Coefficient alpha
E–I facet scales Initiating–Receiving 8 0.82 Expressive–Contained 7 0.77 Gregarious–Intimate 7 0.66 Active–Reflective 8 0.74 Enthusiastic–Quiet 9 0.74 S–N facet scales Concrete–Abstract 9 0.75 Realistic–Imaginative 7 0.73 Practical–Conceptual 8 0.54 Experiential–Theoretical 8 0.68 Traditional–Original 8 0.78 T–F facet scales Logical–Empathetic 9 0.82 Reasonable–Compassionate 8 0.70 Questioning–Accommodating 7 0.47 Critical–Accepting 8 0.55 Tough–Tender 8 0.72 J–P facet scales Systematic–Casual 8 0.73 Planful–Open-Ended 6 0.79 Early Starting–Pressure-Prompted 6 0.79 Scheduled–Spontaneous 8 0.77 Methodical–Emergent 8 0.64
Median 0.74
The internal consistency reliability of most scales is good, and the average (median) reliability is above 0.7. However, three scales (Practical–Conceptual, Questioning–Accommodating and Critical–Accepting) do have lower alpha coefficients. This pattern is consistent with what was found during the development of the Step II instrument, where these three facet scales were also found to show lower reliability than the others (Quenk, Hammer and Majors, 2004).
It should be noted, however, that coefficient alpha reliability statistics will give an underestimate of the reliability of the Step II facet scales,
Chapter 4: Dutch
73
given the use of item response theory (IRT) methods in the actual scoring process.7
Group differences
This section looks at the way in which people from different groups responded to the Dutch version of the European Step II questionnaire.
Gender
The means and standard deviations of the Step II facet scales are shown separately for males and females in Table 4.7, along with the difference in mean scores. This is represented graphically in Figure 4.2. Statistically significant differences were found between male and female mean scores for 13 of the 20 facet scales, with some consistent patterns emerging.
• On the E–I facet scales, all five mean scores tended slightly toward the E pole for both males and females. There was no consistent pattern across facet scales of either males or females tending further towards the E pole.
• On the S–N facet scales, all five mean scores tended slightly toward the S pole for both males and females. The only statistically significant gender differences were for Practical–Conceptual and Experiential–Theoretical, where female mean scores tended more towards the S pole than those for males. Although statistically significant, the differences on both scales were very small in real terms.
• On the T–F facet scales, three mean scores tended toward the T pole for both males and females, and one towards the F pole. Mean scores on the other facet (Questioning–Accommodating) tended towards the T pole for males and slightly towards the F pole for females. For all five facets, the mean score was significantly further toward the T pole for males than for females.
• On the J–P facet scales, three of the five mean scores tended toward the J pole for both males and females. The other two tended towards one pole for males and the other for females. There was no consistent pattern across facet scales of either males or females tending further towards one pole or the other.
7 Item response theory (IRT) is an approach to measurement that is concerned with modelling the relationship between item responses and the underlying characteristic assessed by the scale or test the item is designed to measure. IRT can be used to select items for a test and/or to score the items.
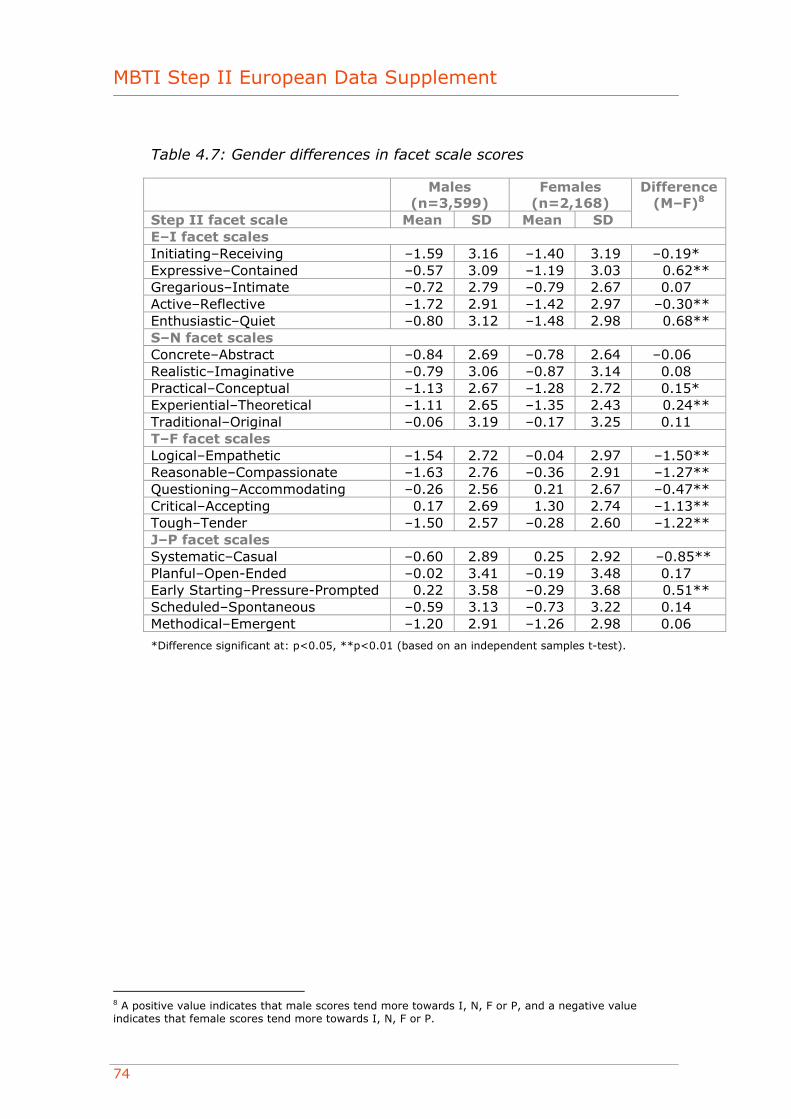
MBTI Step II European Data Supplement
74
Table 4.7: Gender differences in facet scale scores
Males (n=3,599)
Females (n=2,168)
Step II facet scale Mean SD Mean SD
Difference (M–F)8
E–I facet scales Initiating–Receiving –1.59 3.16 –1.40 3.19 –0.19* Expressive–Contained –0.57 3.09 –1.19 3.03 0.62** Gregarious–Intimate –0.72 2.79 –0.79 2.67 0.07 Active–Reflective –1.72 2.91 –1.42 2.97 –0.30** Enthusiastic–Quiet –0.80 3.12 –1.48 2.98 0.68** S–N facet scales Concrete–Abstract –0.84 2.69 –0.78 2.64 –0.06 Realistic–Imaginative –0.79 3.06 –0.87 3.14 0.08 Practical–Conceptual –1.13 2.67 –1.28 2.72 0.15* Experiential–Theoretical –1.11 2.65 –1.35 2.43 0.24** Traditional–Original –0.06 3.19 –0.17 3.25 0.11 T–F facet scales Logical–Empathetic –1.54 2.72 –0.04 2.97 –1.50** Reasonable–Compassionate –1.63 2.76 –0.36 2.91 –1.27** Questioning–Accommodating –0.26 2.56 0.21 2.67 –0.47** Critical–Accepting 0.17 2.69 1.30 2.74 –1.13** Tough–Tender –1.50 2.57 –0.28 2.60 –1.22** J–P facet scales Systematic–Casual –0.60 2.89 0.25 2.92 –0.85** Planful–Open-Ended –0.02 3.41 –0.19 3.48 0.17 Early Starting–Pressure-Prompted 0.22 3.58 –0.29 3.68 0.51** Scheduled–Spontaneous –0.59 3.13 –0.73 3.22 0.14 Methodical–Emergent –1.20 2.91 –1.26 2.98 0.06
*Difference significant at: p<0.05, **p<0.01 (based on an independent samples t-test).
8 A positive value indicates that male scores tend more towards I, N, F or P, and a negative value indicates that female scores tend more towards I, N, F or P.
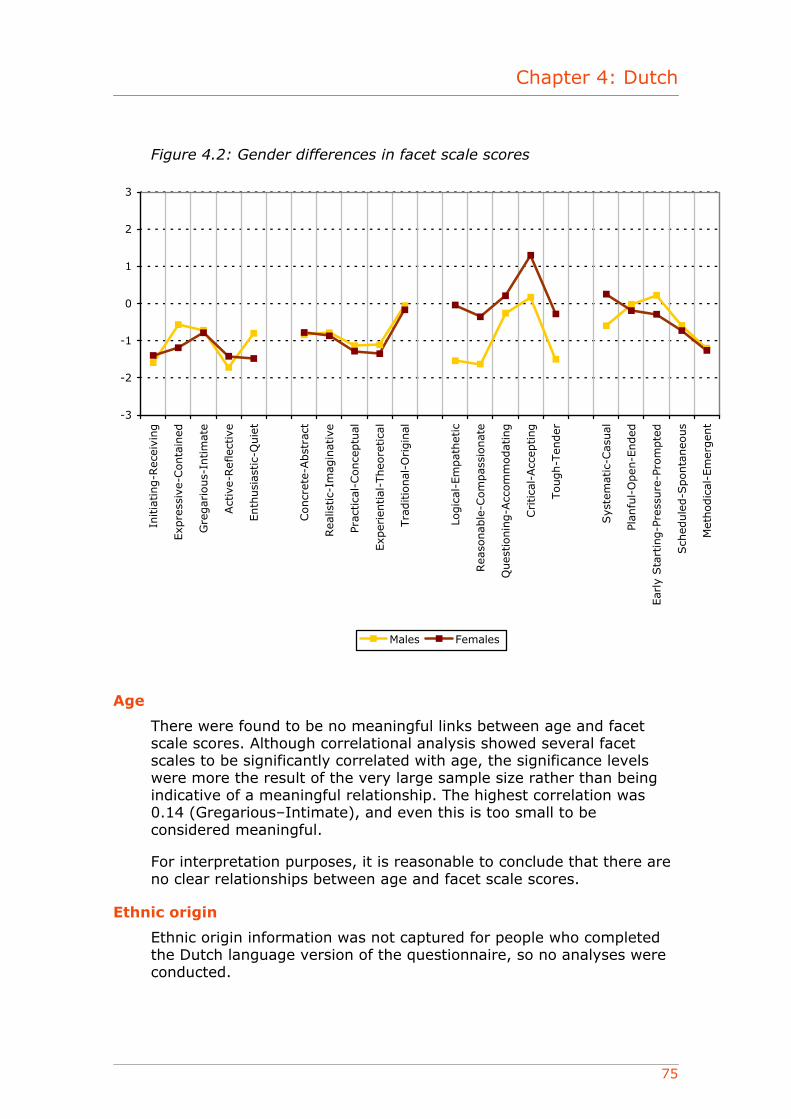
Chapter 4: Dutch
75
Figure 4.2: Gender differences in facet scale scores
-3
-2
-1
0
1
2
3
Initia
ting-R
ecei
ving
Exp
ress
ive-
Conta
ined
Gre
gar
ious-
Intim
ate
Act
ive-
Ref
lect
ive
Enth
usi
astic-
Quie
t
Concr
ete-
Abst
ract
Rea
listic-
Imag
inat
ive
Prac
tica
l-Conce
ptu
al
Exp
erie
ntial
-Theo
retica
l
Tra
ditio
nal
-Origin
al
Logic
al-E
mpat
het
ic
Rea
sonab
le-C
om
pas
sionat
e
Ques
tionin
g-A
ccom
modat
ing
Critica
l-Acc
epting
Tough-T
ender
Sys
tem
atic
-Cas
ual
Plan
ful-
Open
-Ended
Ear
ly S
tart
ing-P
ress
ure
-Pro
mpte
d
Sch
edule
d-S
ponta
neo
us
Met
hodic
al-E
mer
gen
t
Males Females
Age
There were found to be no meaningful links between age and facet scale scores. Although correlational analysis showed several facet scales to be significantly correlated with age, the significance levels were more the result of the very large sample size rather than being indicative of a meaningful relationship. The highest correlation was 0.14 (Gregarious–Intimate), and even this is too small to be considered meaningful.
For interpretation purposes, it is reasonable to conclude that there are no clear relationships between age and facet scale scores.
Ethnic origin
Ethnic origin information was not captured for people who completed the Dutch language version of the questionnaire, so no analyses were conducted.
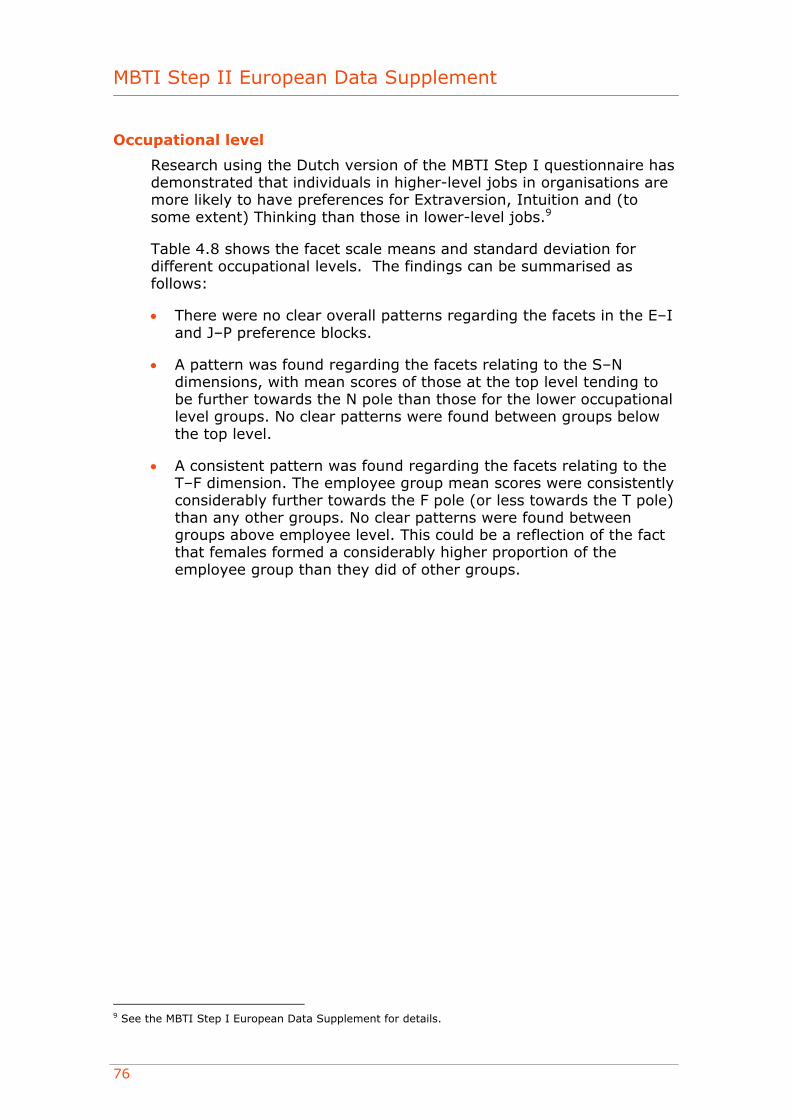
MBTI Step II European Data Supplement
76
Occupational level
Research using the Dutch version of the MBTI Step I questionnaire has demonstrated that individuals in higher-level jobs in organisations are more likely to have preferences for Extraversion, Intuition and (to some extent) Thinking than those in lower-level jobs.9
Table 4.8 shows the facet scale means and standard deviation for different occupational levels. The findings can be summarised as follows:
• There were no clear overall patterns regarding the facets in the E–I and J–P preference blocks.
• A pattern was found regarding the facets relating to the S–N dimensions, with mean scores of those at the top level tending to be further towards the N pole than those for the lower occupational level groups. No clear patterns were found between groups below the top level.
• A consistent pattern was found regarding the facets relating to the T–F dimension. The employee group mean scores were consistently considerably further towards the F pole (or less towards the T pole) than any other groups. No clear patterns were found between groups above employee level. This could be a reflection of the fact that females formed a considerably higher proportion of the employee group than they did of other groups.
9 See the MBTI Step I European Data Supplement for details.
Table 4.8: Mean facet scale scores by occupational level
Top level (n=244)
Senior Executive (n=1,063)
Upper Middle Management
(n=388)
Middle Management
(n=627)
First Level Mgt/
Supervisory (n=290)
Employee (n=1,417)
Step II facet scale
Mean SD Mean SD Mean SD Mean SD Mean SD Mean SD
Sig.
E–I facet scales Initiating–Receiving –1.99 3.12 –1.82 3.07 –1.99 2.95 –1.70 3.07 –1.50 3.21 –1.25 3.30 ** Expressive–Contained –0.98 3.09 –0.96 3.17 –1.11 2.99 –0.97 3.03 –0.83 2.99 –0.70 3.08 Gregarious–Intimate –0.89 2.90 –0.86 2.69 –0.93 2.71 –0.85 2.74 –0.88 2.74 –0.73 2.78 Active–Reflective –1.97 2.92 –1.96 2.85 –2.09 2.73 –1.80 2.80 –1.69 3.02 –1.22 3.10 ** Enthusiastic–Quiet –1.65 2.92 –1.23 3.14 –1.48 3.00 –1.13 3.05 –0.81 3.01 –0.83 3.12 ** S–N facet scales Concrete–Abstract 0.02 2.79 –0.93 2.64 –0.55 2.50 –1.11 2.59 –1.27 2.50 –0.94 2.62 ** Realistic–Imaginative 0.23 3.22 –1.05 2.99 –0.48 2.97 –1.23 2.88 –1.25 2.98 –1.00 3.01 ** Practical–Conceptual –0.16 2.69 –1.15 2.62 –0.74 2.51 –1.46 2.60 –1.41 2.54 –1.53 2.70 ** Experiential–Theoretical –0.41 2.76 –1.21 2.58 –1.05 2.51 –1.18 2.57 –1.62 2.41 –1.46 2.40 ** Traditional–Original 0.84 3.24 –0.05 3.19 0.26 2.92 –0.20 3.04 –0.48 3.31 –0.58 3.14 ** T–F facet scales Logical–Empathetic –1.36 2.82 –1.57 2.73 –1.56 2.66 –1.57 2.67 –1.40 2.90 –0.20 3.03 ** Reasonable–Compassionate –1.42 2.78 –1.67 2.73 –2.06 2.59 –1.69 2.67 –1.61 2.84 –0.41 2.99 ** Questioning–Accommodating –0.35 2.37 –0.23 2.40 –0.23 2.37 –0.04 2.55 –0.20 2.61 0.22 2.82 ** Critical–Accepting 0.50 2.72 0.47 2.79 0.34 2.69 0.31 2.64 0.21 2.66 0.91 2.84 ** Tough–Tender –1.60 2.42 –1.45 2.50 –1.71 2.36 –1.41 2.56 –1.33 2.64 –0.34 2.83 ** J–P facet scales Systematic–Casual –0.51 2.94 –0.76 2.79 –0.41 2.78 –0.67 2.88 –0.91 2.83 0.11 3.00 ** Planful–Open–Ended –0.48 3.54 –0.40 3.39 –0.24 3.27 –0.17 3.43 –0.51 3.44 –0.02 3.52 ** Early Starting–Pressure–Prompted 0.64 3.71 0.23 3.54 0.88 3.42 0.04 3.55 –0.27 3.52 –0.42 3.66 ** Scheduled–Spontaneous –0.71 3.22 –0.89 3.10 –0.76 2.88 –0.91 3.03 –0.97 3.01 –0.85 3.25 ** Methodical–Emergent –1.28 2.95 –1.43 2.79 –1.11 2.86 –1.38 2.88 –1.49 2.85 –1.17 3.01 **
Significant at: *p<0.05, **p<0.01 (based on a one-way analysis of variance).
MBTI Step II European Data Supplement
78
Education
Specific educational qualifications were not collected for the OPPassessment sample; however, the age at which individuals left full-time education was. No significant and meaningful correlations were found between the age at which people left full-time education and their facet scale scores. All the correlations were less than 0.1.
Work area
Information regarding the area of work people engage in was collected for the group. Many different categories were used, but for the purposes of analysis the focus was on the five most commonly occurring. These were as follows:
• Finance
• HR, training, guidance
• Sales, customer service
• Business services
• IT.
Table 4.9 shows the facet scale means and standard deviation for these five work areas. The findings can be summarised as follows:
• An interesting pattern was found regarding the facets relating to the E–I dimensions. Although mean scores for all groups tended towards the E pole for each facet scale, scores were considerably further towards the E pole for the ‘Sales, customer service’ group than for the ‘Finance’ and ‘IT’ groups. Mean scores for the ‘HR, training, guidance’ and ‘Business services’ groups fell in between.
• On the facets relating to the S–N dimension, mean scores for all groups generally tended towards the S pole except ‘HR, training, guidance’. Mean scores for this group were more mixed, with two tending towards each pole and one very close to the midpoint. Even the two scores for this group that did tend towards the S pole were less far towards this pole than the scores of the other groups.
• The most noticeable pattern regarding the facets in the T–F preference block was that although means scores for all groups tended towards the T pole on three out of the five facet scales, scores for four of the work area groups tended towards the F pole for the Critical–Accepting facet scale (the exception to this was ‘IT’). This is a common finding with this scale. It was also observed that the mean scores across facet scales fell less towards the T pole for the ‘HR, training, guidance’ groups than for the other groups.
• There were fewer clear overall patterns regarding the facets in the J–P preference block, although the ‘Finance’ group was the only group where all the mean scores tended towards the J pole.
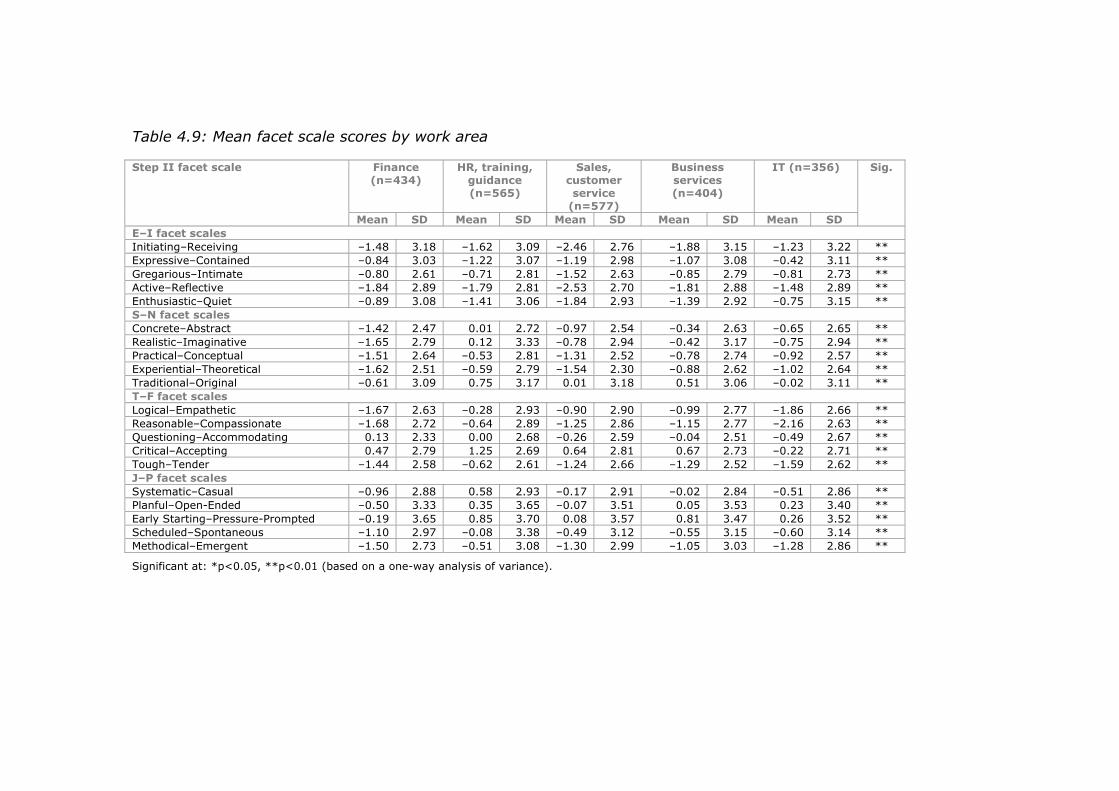
Table 4.9: Mean facet scale scores by work area
Finance (n=434)
HR, training, guidance (n=565)
Sales, customer service
(n=577)
Business services (n=404)
IT (n=356) Step II facet scale
Mean SD Mean SD Mean SD Mean SD Mean SD
Sig.
E–I facet scales Initiating–Receiving –1.48 3.18 –1.62 3.09 –2.46 2.76 –1.88 3.15 –1.23 3.22 ** Expressive–Contained –0.84 3.03 –1.22 3.07 –1.19 2.98 –1.07 3.08 –0.42 3.11 ** Gregarious–Intimate –0.80 2.61 –0.71 2.81 –1.52 2.63 –0.85 2.79 –0.81 2.73 ** Active–Reflective –1.84 2.89 –1.79 2.81 –2.53 2.70 –1.81 2.88 –1.48 2.89 ** Enthusiastic–Quiet –0.89 3.08 –1.41 3.06 –1.84 2.93 –1.39 2.92 –0.75 3.15 ** S–N facet scales Concrete–Abstract –1.42 2.47 0.01 2.72 –0.97 2.54 –0.34 2.63 –0.65 2.65 ** Realistic–Imaginative –1.65 2.79 0.12 3.33 –0.78 2.94 –0.42 3.17 –0.75 2.94 ** Practical–Conceptual –1.51 2.64 –0.53 2.81 –1.31 2.52 –0.78 2.74 –0.92 2.57 ** Experiential–Theoretical –1.62 2.51 –0.59 2.79 –1.54 2.30 –0.88 2.62 –1.02 2.64 ** Traditional–Original –0.61 3.09 0.75 3.17 0.01 3.18 0.51 3.06 –0.02 3.11 ** T–F facet scales Logical–Empathetic –1.67 2.63 –0.28 2.93 –0.90 2.90 –0.99 2.77 –1.86 2.66 ** Reasonable–Compassionate –1.68 2.72 –0.64 2.89 –1.25 2.86 –1.15 2.77 –2.16 2.63 ** Questioning–Accommodating 0.13 2.33 0.00 2.68 –0.26 2.59 –0.04 2.51 –0.49 2.67 ** Critical–Accepting 0.47 2.79 1.25 2.69 0.64 2.81 0.67 2.73 –0.22 2.71 ** Tough–Tender –1.44 2.58 –0.62 2.61 –1.24 2.66 –1.29 2.52 –1.59 2.62 ** J–P facet scales Systematic–Casual –0.96 2.88 0.58 2.93 –0.17 2.91 –0.02 2.84 –0.51 2.86 ** Planful–Open-Ended –0.50 3.33 0.35 3.65 –0.07 3.51 0.05 3.53 0.23 3.40 ** Early Starting–Pressure-Prompted –0.19 3.65 0.85 3.70 0.08 3.57 0.81 3.47 0.26 3.52 ** Scheduled–Spontaneous –1.10 2.97 –0.08 3.38 –0.49 3.12 –0.55 3.15 –0.60 3.14 ** Methodical–Emergent –1.50 2.73 –0.51 3.08 –1.30 2.99 –1.05 3.03 –1.28 2.86 **
Significant at: *p<0.05, **p<0.01 (based on a one-way analysis of variance).
MBTI Step II European Data Supplement
80
Nationality
Information on nationality was available for the group. Fifty-one per cent of the group were Belgian and 47% were Dutch.
A comparison of mean facet scales across the Dutch and Belgian groups highlighted some interesting differences, as shown in Table 4.10 and Figure 4.3. It is worth noting that although the differences below were statistically significant, none of the differences in mean scores was more than 1 point. In real terms this is actually quite small.
• On four of the five facet scales linked to the E–I dimension, the Dutch group mean scores were significantly further towards the E pole than those for the Belgian group. No significant group difference was found on the remaining scale (Gregarious–Intimate).
• On all five of the facet scales linked to the S–N dimension, the Belgian group mean scores were significantly further towards the S pole than those for the Dutch group.
• On four of the five facet scales linked to the T–F dimension, the Belgian group mean scores were significantly further towards the T pole than those for the Dutch group. The exception to this was the Tough–Tender facet scale, where the Dutch group mean score tended more towards the T pole.
• On all five of the facet scales linked to the J–P dimension, the Belgian group mean scores were significantly further towards the J pole than those for the Dutch group.
These differences are consistent with the patterns found when the MBTI Step I data were analysed, which showed the Dutch group to be significantly more likely to have preferences for Extraversion, Intuition, Feeling and Perceiving than the Belgian group.10
10 See the MBTI Step I European Data Supplement for details.
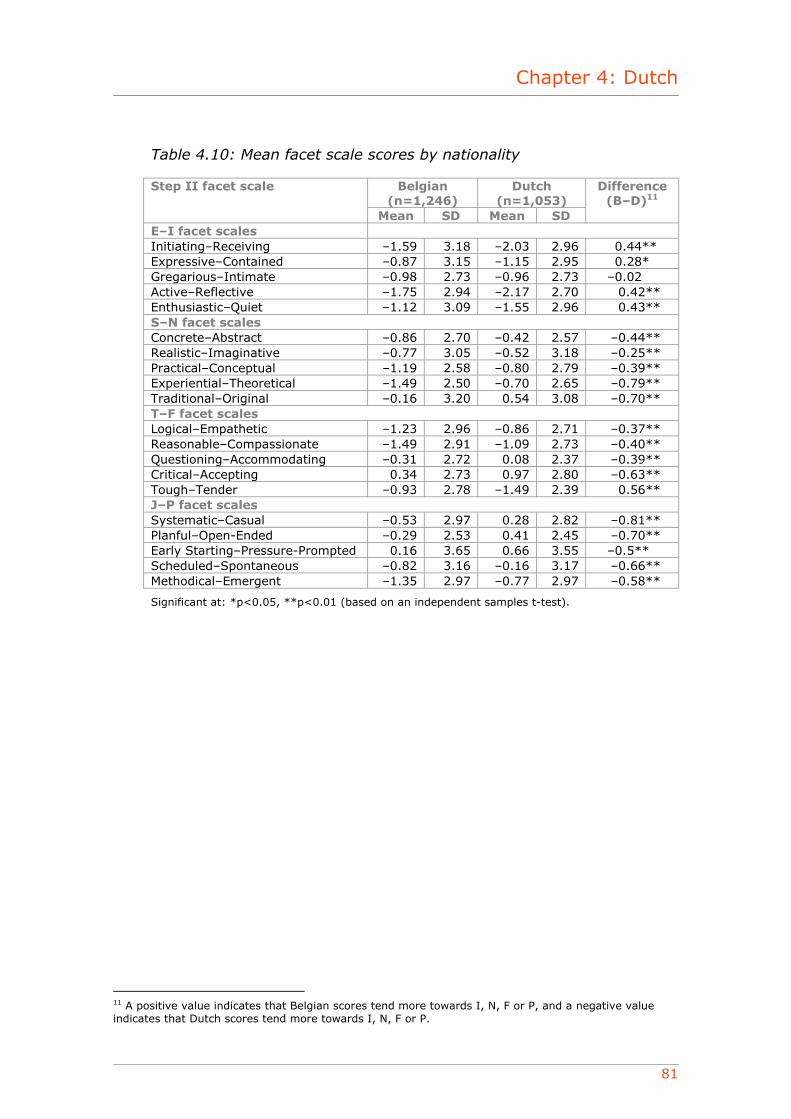
Chapter 4: Dutch
81
Table 4.10: Mean facet scale scores by nationality
Belgian (n=1,246)
Dutch (n=1,053)
Step II facet scale
Mean SD Mean SD
Difference (B–D)11
E–I facet scales Initiating–Receiving –1.59 3.18 –2.03 2.96 0.44** Expressive–Contained –0.87 3.15 –1.15 2.95 0.28* Gregarious–Intimate –0.98 2.73 –0.96 2.73 –0.02 Active–Reflective –1.75 2.94 –2.17 2.70 0.42** Enthusiastic–Quiet –1.12 3.09 –1.55 2.96 0.43** S–N facet scales Concrete–Abstract –0.86 2.70 –0.42 2.57 –0.44** Realistic–Imaginative –0.77 3.05 –0.52 3.18 –0.25** Practical–Conceptual –1.19 2.58 –0.80 2.79 –0.39** Experiential–Theoretical –1.49 2.50 –0.70 2.65 –0.79** Traditional–Original –0.16 3.20 0.54 3.08 –0.70** T–F facet scales Logical–Empathetic –1.23 2.96 –0.86 2.71 –0.37** Reasonable–Compassionate –1.49 2.91 –1.09 2.73 –0.40** Questioning–Accommodating –0.31 2.72 0.08 2.37 –0.39** Critical–Accepting 0.34 2.73 0.97 2.80 –0.63** Tough–Tender –0.93 2.78 –1.49 2.39 0.56** J–P facet scales Systematic–Casual –0.53 2.97 0.28 2.82 –0.81** Planful–Open-Ended –0.29 2.53 0.41 2.45 –0.70** Early Starting–Pressure-Prompted 0.16 3.65 0.66 3.55 –0.5** Scheduled–Spontaneous –0.82 3.16 –0.16 3.17 –0.66** Methodical–Emergent –1.35 2.97 –0.77 2.97 –0.58**
Significant at: *p<0.05, **p<0.01 (based on an independent samples t-test).
11 A positive value indicates that Belgian scores tend more towards I, N, F or P, and a negative value indicates that Dutch scores tend more towards I, N, F or P.
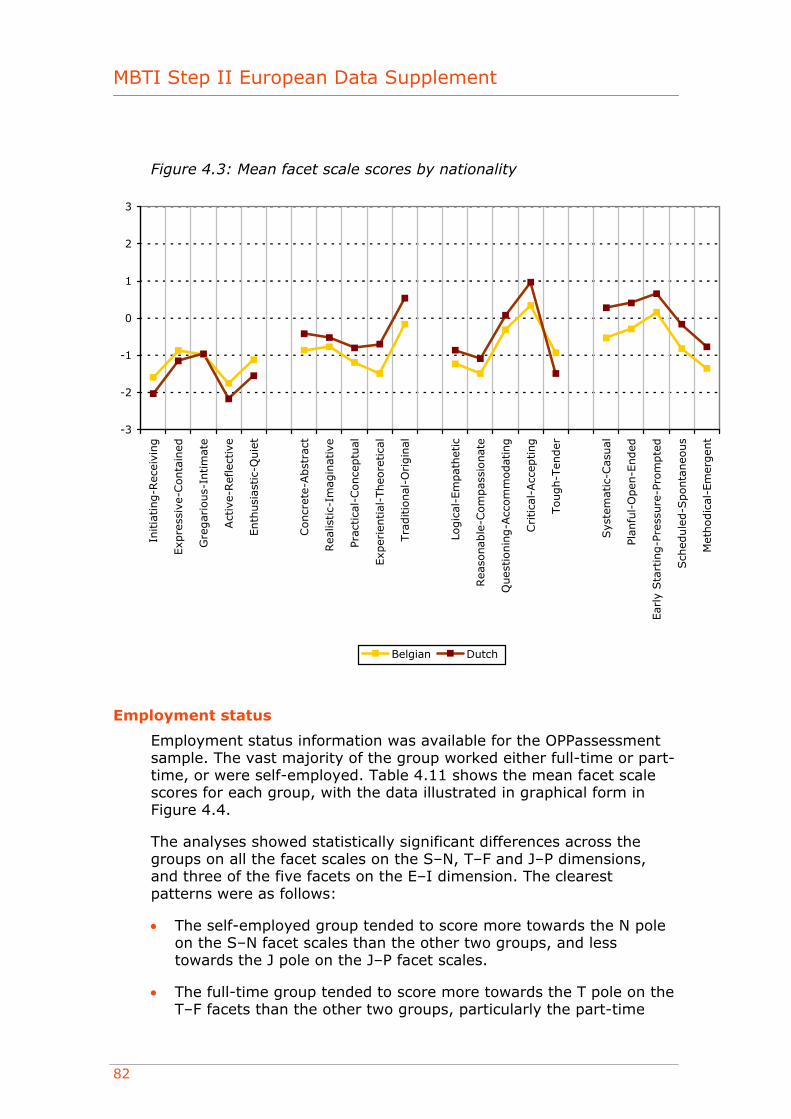
MBTI Step II European Data Supplement
82
Figure 4.3: Mean facet scale scores by nationality
-3
-2
-1
0
1
2
3
Initia
ting-R
ecei
ving
Exp
ress
ive-
Conta
ined
Gre
gar
ious-
Intim
ate
Act
ive-
Ref
lect
ive
Enth
usi
astic-
Quie
t
Concr
ete-
Abst
ract
Rea
listic-
Imag
inat
ive
Prac
tica
l-Conce
ptu
al
Exp
erie
ntial
-Theo
retica
l
Tra
ditio
nal
-Origin
al
Logic
al-E
mpat
het
ic
Rea
sonab
le-C
om
pas
sionat
e
Ques
tionin
g-A
ccom
modat
ing
Critica
l-Acc
epting
Tough-T
ender
Sys
tem
atic
-Cas
ual
Plan
ful-
Open
-Ended
Ear
ly S
tart
ing-P
ress
ure
-Pro
mpte
d
Sch
edule
d-S
ponta
neo
us
Met
hodic
al-E
mer
gen
t
Belgian Dutch
Employment status
Employment status information was available for the OPPassessment sample. The vast majority of the group worked either full-time or part-time, or were self-employed. Table 4.11 shows the mean facet scale scores for each group, with the data illustrated in graphical form in Figure 4.4.
The analyses showed statistically significant differences across the groups on all the facet scales on the S–N, T–F and J–P dimensions, and three of the five facets on the E–I dimension. The clearest patterns were as follows:
• The self-employed group tended to score more towards the N pole on the S–N facet scales than the other two groups, and less towards the J pole on the J–P facet scales.
• The full-time group tended to score more towards the T pole on the T–F facets than the other two groups, particularly the part-time
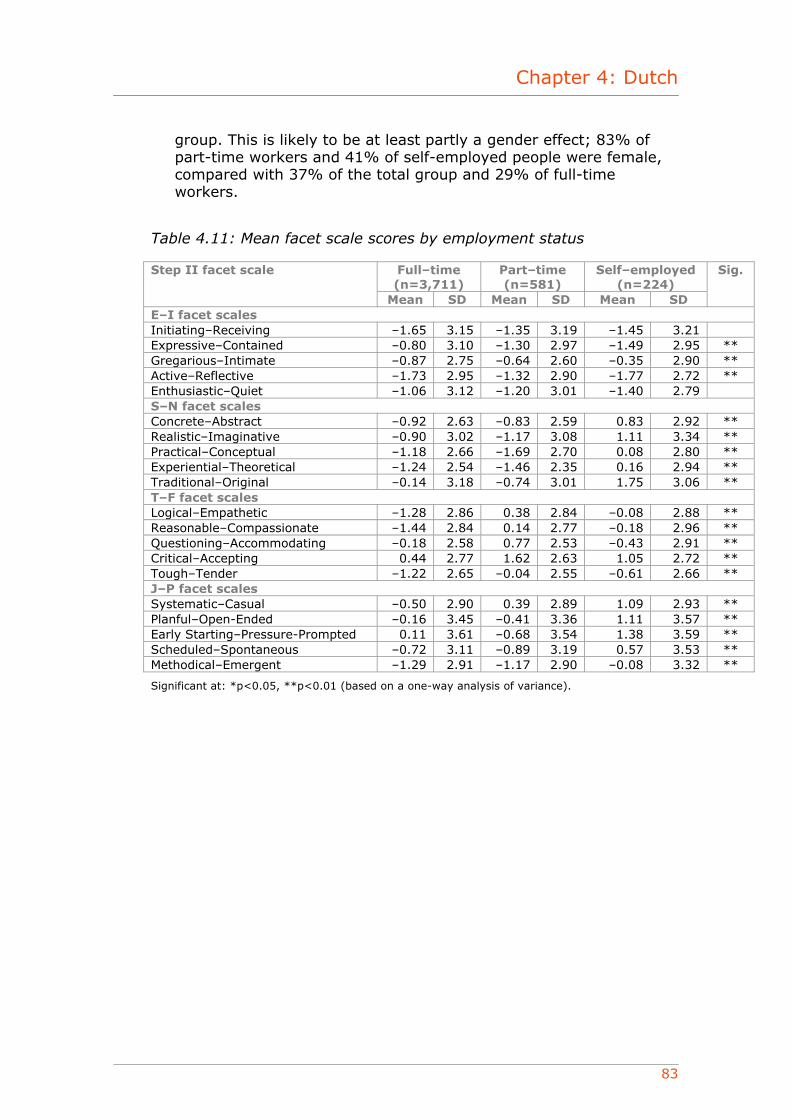
Chapter 4: Dutch
83
group. This is likely to be at least partly a gender effect; 83% of part-time workers and 41% of self-employed people were female, compared with 37% of the total group and 29% of full-time workers.
Table 4.11: Mean facet scale scores by employment status
Full–time (n=3,711)
Part–time (n=581)
Self–employed (n=224)
Step II facet scale
Mean SD Mean SD Mean SD
Sig.
E–I facet scales Initiating–Receiving –1.65 3.15 –1.35 3.19 –1.45 3.21 Expressive–Contained –0.80 3.10 –1.30 2.97 –1.49 2.95 ** Gregarious–Intimate –0.87 2.75 –0.64 2.60 –0.35 2.90 ** Active–Reflective –1.73 2.95 –1.32 2.90 –1.77 2.72 ** Enthusiastic–Quiet –1.06 3.12 –1.20 3.01 –1.40 2.79 S–N facet scales Concrete–Abstract –0.92 2.63 –0.83 2.59 0.83 2.92 ** Realistic–Imaginative –0.90 3.02 –1.17 3.08 1.11 3.34 ** Practical–Conceptual –1.18 2.66 –1.69 2.70 0.08 2.80 ** Experiential–Theoretical –1.24 2.54 –1.46 2.35 0.16 2.94 ** Traditional–Original –0.14 3.18 –0.74 3.01 1.75 3.06 ** T–F facet scales Logical–Empathetic –1.28 2.86 0.38 2.84 –0.08 2.88 ** Reasonable–Compassionate –1.44 2.84 0.14 2.77 –0.18 2.96 ** Questioning–Accommodating –0.18 2.58 0.77 2.53 –0.43 2.91 ** Critical–Accepting 0.44 2.77 1.62 2.63 1.05 2.72 ** Tough–Tender –1.22 2.65 –0.04 2.55 –0.61 2.66 ** J–P facet scales Systematic–Casual –0.50 2.90 0.39 2.89 1.09 2.93 ** Planful–Open-Ended –0.16 3.45 –0.41 3.36 1.11 3.57 ** Early Starting–Pressure-Prompted 0.11 3.61 –0.68 3.54 1.38 3.59 ** Scheduled–Spontaneous –0.72 3.11 –0.89 3.19 0.57 3.53 ** Methodical–Emergent –1.29 2.91 –1.17 2.90 –0.08 3.32 **
Significant at: *p<0.05, **p<0.01 (based on a one-way analysis of variance).
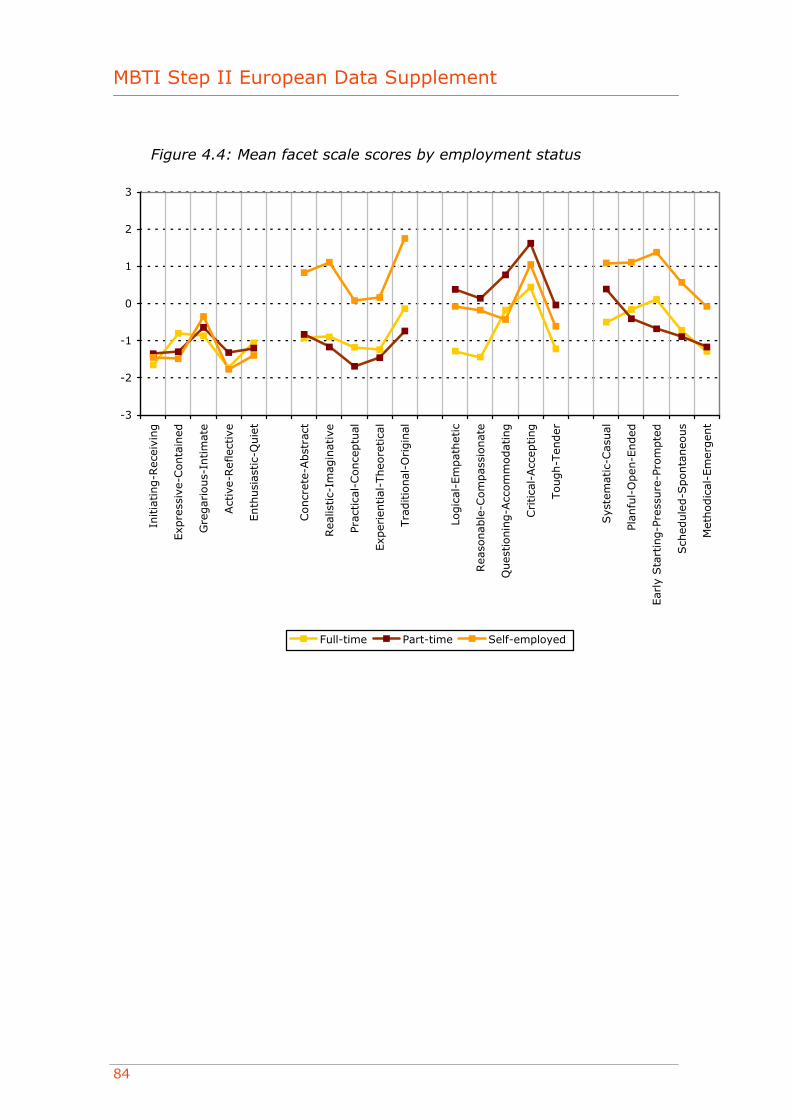
MBTI Step II European Data Supplement
84
Figure 4.4: Mean facet scale scores by employment status
-3
-2
-1
0
1
2
3
Initia
ting-R
ecei
ving
Exp
ress
ive-
Conta
ined
Gre
gar
ious-
Intim
ate
Act
ive-
Ref
lect
ive
Enth
usi
astic-
Quie
t
Concr
ete-
Abst
ract
Rea
listic-
Imag
inat
ive
Prac
tica
l-Conce
ptu
al
Exp
erie
ntial
-Theo
retica
l
Tra
ditio
nal
-Origin
al
Logic
al-E
mpat
het
ic
Rea
sonab
le-C
om
pas
sionat
e
Ques
tionin
g-A
ccom
modat
ing
Critica
l-Acc
epting
Tough-T
ender
Sys
tem
atic
-Cas
ual
Plan
ful-
Open
-Ended
Ear
ly S
tart
ing-P
ress
ure
-Pro
mpte
d
Sch
edule
d-S
ponta
neo
us
Met
hodic
al-E
mer
gen
t
Full-time Part-time Self-employed
Chapter 4: Dutch
85
Appendix 1: Sample description
Sample 1: Data from OPPassessment (representative Dutch-speaking professional and managerial sample)
This sample consists of 5,779 individuals who completed the MBTI Step II instrument in Dutch via the OPPassessment system between October 2003 and June 2008. Sixty-two per cent of the respondents were male and 38% were female. Age ranged from 16 to 68 years, with a mean of 39 and a median of 38.
Nationality was disclosed by 88% of respondents. Of these, 51% were Belgian and 47% were Dutch. Many other nationalities were represented, but each one formed less than 1% of the total group:
Nationality Percentage Belgian 51.2% Dutch 47.3% Other 1.5%
The majority of the group were in full-time employment:
Employment status Percentage Full-time 81.5% Part-time 12.8% Self-employed 4.9% Unemployed 0.4% Homemaker 0.3% Retired 0.2%
The majority of the group were of managerial level or above, but with the largest single group being employee (32%):
Occupational level Percentage Top level 5.6% Senior executive 24.2% Upper middle management 8.8% Middle management 14.3% First level management/supervisor
6.6%
Employee 32.3% Other 8.2%
MBTI Step II European Data Supplement
86
A range of work areas were represented:
Work area (job type) Percentage Sales, customer service 13.0% HR, training, guidance 12.8% Finance 9.8% Business services 9.1% IT 8.0% Research and development 7.9% Admin or secretarial 7.7% Science, engineering 6.7% Health, social services, etc. 2.6% Education 1.8% Military, police, prison, fire 1.7% Land, sea or air transport 1.0% Skilled operative 0.5% Leisure, personal service 0.2% Unskilled operative 0.1% Other public sector 3.5% Other private sector 2.4% Other 11.0%

Chapter 5: French
87
European Data Supplement French
January 2009
OPP Ltd Elsfield Hall
15–17 Elsfield Way Oxford OX2 8EP
UK t: +44 (0)845 603 9958 f: +44 (0)1865 557483
MBTI® Step II instrument
MBTI Step II European Data Supplement
88
Contents
Introduction .............................................................................89 Type distribution .......................................................................90
OPPassessment data (representative European French-speaking professional and managerial sample) ....................................91
Properties of the Step II facet scales ............................................92 Facet scale score distribution...................................................92 Facet scale intercorrelations ....................................................94 Correlations of Step II facet scales with Step I scales..................96 Out-of-preference scores ........................................................97 Reliability .............................................................................98 Group differences ..................................................................99
Appendix 1: Sample description ................................................ 111 Sample 1: Data from OPPassessment (representative European
French-speaking professional and managerial sample)........... 111
© Copyright 2009 OPP Ltd. All rights reserved.
No portion of this publication may be translated or reproduced in whole or in part, stored in a retrieval system, or transmitted in any form or by any means (electronic, mechanical, photocopying, recording or otherwise) without the prior written permission of the copyright owner. No part of this publication is reproducible under any photocopying licence scheme. OPP Ltd grants the downloader a personal, non-transferable, perpetual, irrevocable right to use the Supplement. The European Data Supplement (‘the Supplement’) is for personal use only and may not be sold on or circulated to third parties.
® MBTI, Myers-Briggs and the Myers-Briggs Type Indicator are registered trade marks of the Myers-Briggs Type Indicator Trust. OPP is licensed to use the trade marks in Europe.
® OPP is a registered trade mark of OPP Ltd in the European Community.
Chapter 5: French
89
Introduction
Data collected for the European MBTI Step II instrument were analysed to produce the findings in this supplement. This is the first data supplement produced for this instrument, and contains all the data gathered to date since the launch of the instrument in 2003. A brief description of the sample is given below. Further details of the sample are provided in Appendix 1.
• The sample consisted of 4,254 individuals who completed the MBTI Step II instrument in French via the OPPassessment system between 2003 and mid-2008.1 This sample is considered to be representative of the groups of people with whom the French MBTI Step II instrument has been and will be used for applications such as management development, coaching, counselling and teambuilding. As such, it is likely to represent a cross-section of the European French-speaking professional and managerial population.
The results of the analyses are outlined below.
1 OPPassessment allows personality questionnaires such as the MBTI instrument to be administered via email and/or completed online.

MBTI Step II European Data Supplement
90
Type distribution
Type tables are a way of illustrating the proportion of each type within a particular group. Below is a type table taken from the sample described on the previous page.
For each of the 16 different types, the number of cases, the percentage of the total that this represents and the self-selection ratio (SSR) are shown. The SSR (Myers et al., 1998) is a way of demonstrating whether a given type appears more or less often in a particular group than would be expected given its frequency in a reference group. Ideally, the type distribution from a large representative sample of the French population would be used to calculate SSRs in this data supplement. However, such a sample does not currently exist. In its place, SSRs have been calculated using type data from the UK general population (Kendall, 1998), which can be justified by the fact that type distributions for comparable French and British groups, such as managers and professionals, are similar. Evidence (eg Hackston and Kendall, 2004; Quenk et al., 2004) does suggest that although type-related behaviours vary a good deal from country to country and from culture to culture, the frequencies of underlying MBTI types do not.
An SSR of greater than 1 indicates that a type is over-represented, and an SSR of less than 1 denotes that it is under-represented. Asterisks are used to denote whether the over- or under-representations are statistically significant, based on the results of chi-square analysis.2
2 Chi-square analysis (often abbreviated to χ2) is a technique used to explore whether observed frequency distributions differ significantly from other, predefined, distributions. In this case, the UK general population group is used as the reference group, and the chi-square analysis indicates whether the proportion of people of each type within a particular sample differs significantly from the proportion of people reporting the same type within the reference group.
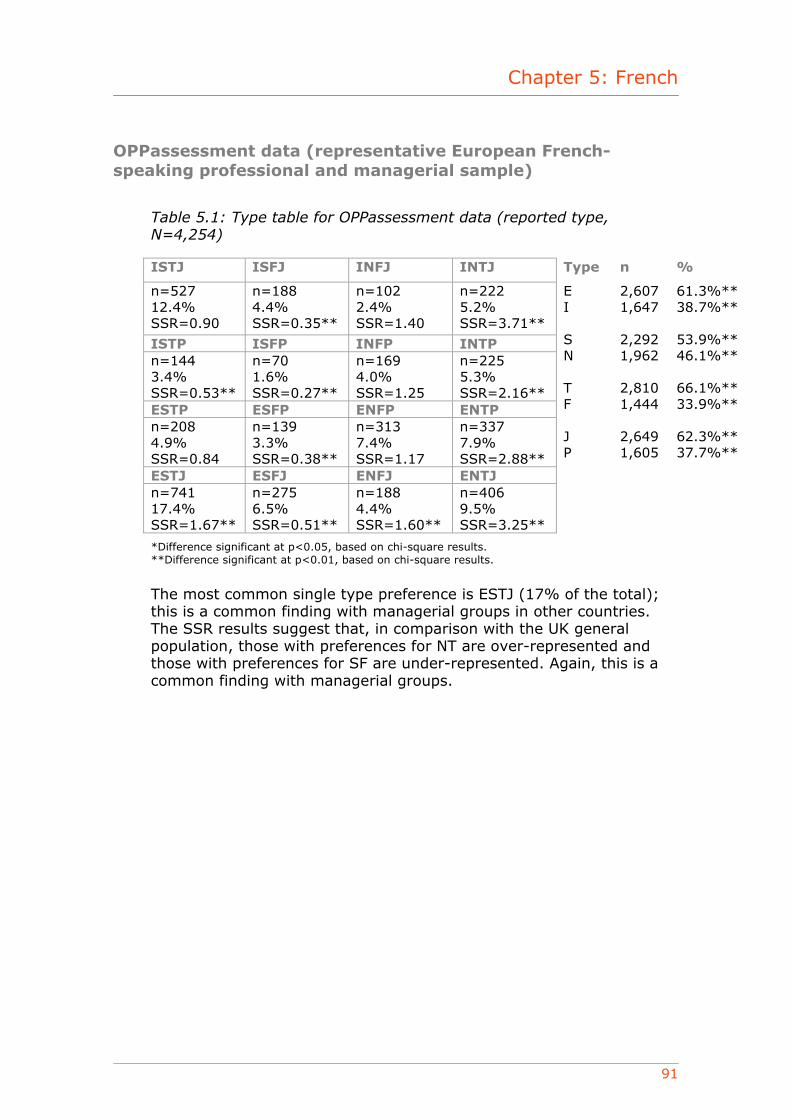
Chapter 5: French
91
OPPassessment data (representative European French-speaking professional and managerial sample)
Table 5.1: Type table for OPPassessment data (reported type, N=4,254)
ISTJ ISFJ INFJ INTJ Type n %
n=527 12.4% SSR=0.90
n=188 4.4% SSR=0.35**
n=102 2.4% SSR=1.40
n=222 5.2% SSR=3.71**
ISTP ISFP INFP INTP n=144 3.4% SSR=0.53**
n=70 1.6% SSR=0.27**
n=169 4.0% SSR=1.25
n=225 5.3% SSR=2.16**
ESTP ESFP ENFP ENTP n=208 4.9% SSR=0.84
n=139 3.3% SSR=0.38**
n=313 7.4% SSR=1.17
n=337 7.9% SSR=2.88**
ESTJ ESFJ ENFJ ENTJ n=741 17.4% SSR=1.67**
n=275 6.5% SSR=0.51**
n=188 4.4% SSR=1.60**
n=406 9.5% SSR=3.25**
E I S N T F J P
2,607 1,647 2,292 1,962 2,810 1,444 2,649 1,605
61.3%** 38.7%** 53.9%** 46.1%** 66.1%** 33.9%** 62.3%** 37.7%**
*Difference significant at p<0.05, based on chi-square results. **Difference significant at p<0.01, based on chi-square results.
The most common single type preference is ESTJ (17% of the total); this is a common finding with managerial groups in other countries. The SSR results suggest that, in comparison with the UK general population, those with preferences for NT are over-represented and those with preferences for SF are under-represented. Again, this is a common finding with managerial groups.

MBTI Step II European Data Supplement
92
Properties of the Step II facet scales
Facet scale score distribution
The means and standard deviations of the Step II facets are shown in Table 5.2 and illustrated graphically in Figure 5.2. The mean score for a scale is calculated by adding together the scores of each individual in the sample and then dividing the sum by the number of individuals. Note that negative values indicate that mean scores are nearer the left-hand pole of the facet and positive values indicate that the mean scores are nearer the right-hand pole. The standard deviation (SD) is a statistical measure describing the degree to which the scores from the sample either bunch up close to, or are scattered widely around, the mean for the sample.
Table 5.2: Means and standard deviations of the facet scales
Step II facet scale Mean3 SD E–I facet scales Initiating–Receiving –0.91 3.15 Expressive–Contained 0.21 3.20 Gregarious–Intimate –0.10 2.62 Active–Reflective –1.02 2.86 Enthusiastic–Quiet –0.04 2.82 S–N facet scales Concrete–Abstract –1.22 2.43 Realistic–Imaginative –0.26 3.18 Practical–Conceptual –0.21 2.61 Experiential–Theoretical –1.66 2.90 Traditional–Original –0.12 2.95 T–F facet scales Logical–Empathetic –0.19 2.91 Reasonable–Compassionate –1.02 2.73 Questioning–Accommodating –1.00 2.57 Critical–Accepting –0.17 1.89 Tough–Tender –0.21 2.86 J–P facet scales Systematic–Casual –0.65 2.79 Planful–Open-Ended –0.39 3.30 Early Starting–Pressure-Prompted –0.76 3.63 Scheduled–Spontaneous –1.01 2.94 Methodical–Emergent –1.04 2.84
3 Scale means: in Step II reports, scores are given from 5 on one pole, through 0, to 5 on the opposite pole. In compiling statistical information, however, one pole needs to be clearly distinguished from the other. Throughout this data supplement, therefore, a convention has been adopted of scores 5, 4, 3, 2 or 1 on the left-hand pole being assigned values of –5, –4, –3, –2, or –1 and scores on the right-hand pole being assigned positive scores. This does not, of course, imply any suggestion that positive scores are ‘better’ than negative scores.
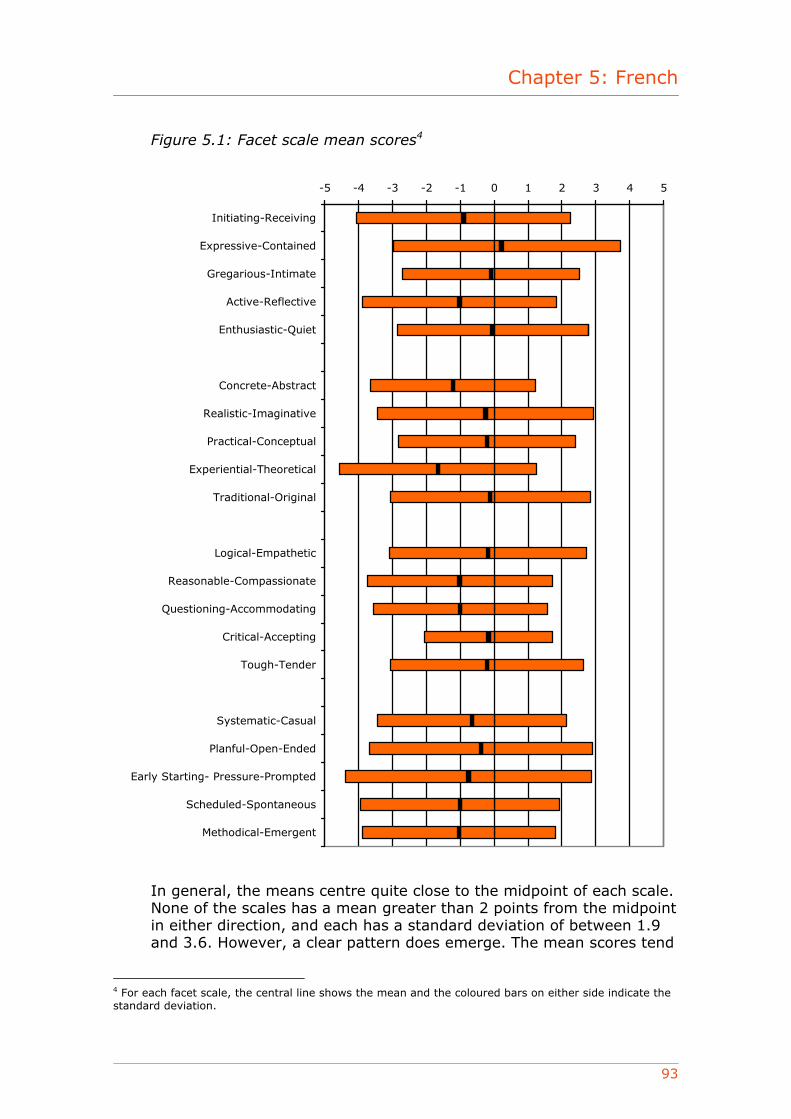
Chapter 5: French
93
Figure 5.1: Facet scale mean scores4
-5 -4 -3 -2 -1 0 1 2 3 4 5
Initiating-Receiving
Expressive-Contained
Gregarious-Intimate
Active-Reflective
Enthusiastic-Quiet
Concrete-Abstract
Realistic-Imaginative
Practical-Conceptual
Experiential-Theoretical
Traditional-Original
Logical-Empathetic
Reasonable-Compassionate
Questioning-Accommodating
Critical-Accepting
Tough-Tender
Systematic-Casual
Planful-Open-Ended
Early Starting- Pressure-Prompted
Scheduled-Spontaneous
Methodical-Emergent
In general, the means centre quite close to the midpoint of each scale. None of the scales has a mean greater than 2 points from the midpoint in either direction, and each has a standard deviation of between 1.9 and 3.6. However, a clear pattern does emerge. The mean scores tend
4 For each facet scale, the central line shows the mean and the coloured bars on either side indicate the standard deviation.
MBTI Step II European Data Supplement
94
towards the E, S, T and J direction (with the exception of Expressive–Contained), which is consistent with the most common four-letter type preference amongst this sample. Amongst the group as a whole, there are more individuals with a preference for E, S, T and J.
Facet scale intercorrelations
Correlations among the Step II facet scales are shown in Table 5.3. Facet scales within each dichotomy usually correlate more highly (often substantially so) with the other scales of the same dichotomy than they do with scales in the other three dichotomies. For example, every E–I facet scale correlates higher with the other four E–I scales than with any of the S–N, T–F or J–P facet scales.
There is only one scale that correlates significantly more highly with scales in other dichotomies. The T–F scale Questioning–Accommodating correlates with many scales, across dichotomies. For example, it correlates at a level of 0.16 with both Initiating–Receiving and Enthusiastic–Quiet, whilst correlating negatively at between –0.12 and –0.29 with all of the S–N scales. By way of comparison, it correlates at between 0.08 and 0.22 with the other four scales on the same dichotomy as itself (T–F). The negative correlations between Questioning–Accommodating and the S–N scales are consistent with findings in the US version of the Step II instrument, and suggest that a questioning approach to differences of opinion seems to be related to a range of Intuitive (N) facets. These patterns are similar to those found when the European Step II instrument was developed.
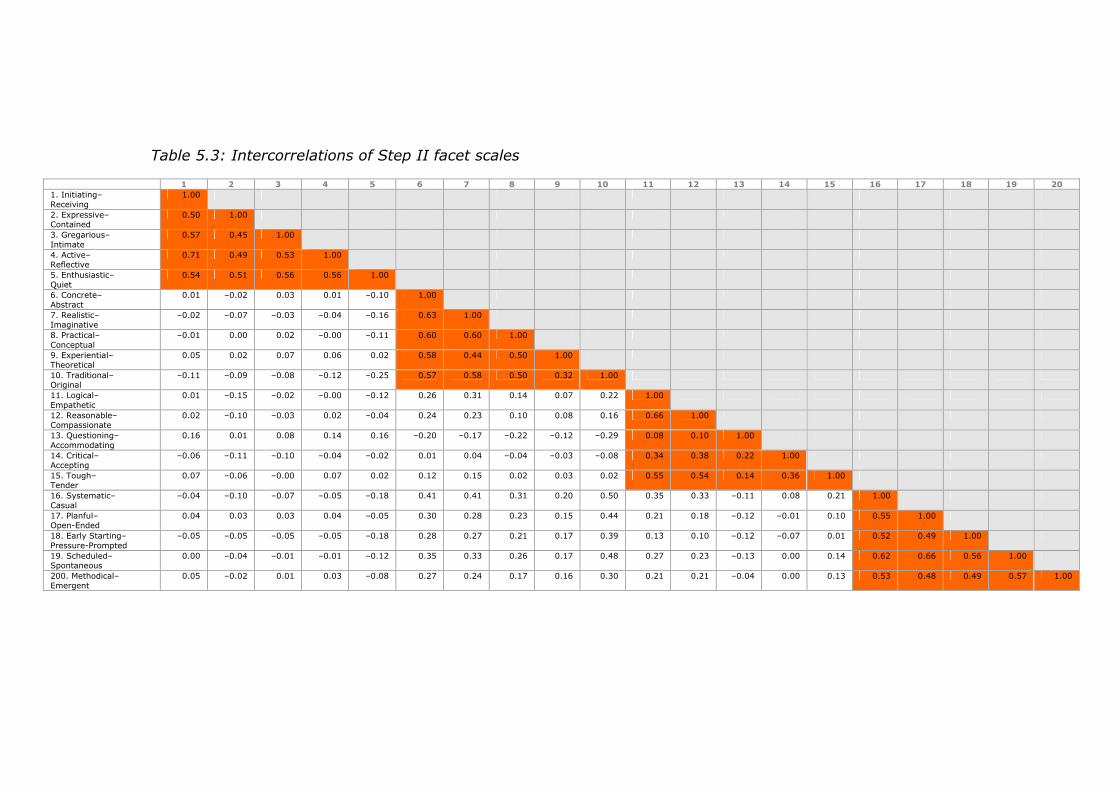
Table 5.3: Intercorrelations of Step II facet scales
1 2 3 4 5 6 7 8 9 10 11 12 13 14 15 16 17 18 19 20 1. Initiating– Receiving
1.00
2. Expressive– Contained
0.50 1.00
3. Gregarious– Intimate
0.57 0.45 1.00
4. Active– Reflective
0.71 0.49 0.53 1.00
5. Enthusiastic– Quiet
0.54 0.51 0.56 0.56 1.00
6. Concrete– Abstract
0.01 –0.02 0.03 0.01 –0.10 1.00
7. Realistic– Imaginative
–0.02 –0.07 –0.03 –0.04 –0.16 0.63 1.00
8. Practical– Conceptual
–0.01 0.00 0.02 –0.00 –0.11 0.60 0.60 1.00
9. Experiential– Theoretical
0.05 0.02 0.07 0.06 0.02 0.58 0.44 0.50 1.00
10. Traditional– Original
–0.11 –0.09 –0.08 –0.12 –0.25 0.57 0.58 0.50 0.32 1.00
11. Logical– Empathetic
0.01 –0.15 –0.02 –0.00 –0.12 0.26 0.31 0.14 0.07 0.22 1.00
12. Reasonable– Compassionate
0.02 –0.10 –0.03 0.02 –0.04 0.24 0.23 0.10 0.08 0.16 0.66 1.00
13. Questioning– Accommodating
0.16 0.01 0.08 0.14 0.16 –0.20 –0.17 –0.22 –0.12 –0.29 0.08 0.10 1.00
14. Critical– Accepting
–0.06 –0.11 –0.10 –0.04 –0.02 0.01 0.04 –0.04 –0.03 –0.08 0.34 0.38 0.22 1.00
15. Tough– Tender
0.07 –0.06 –0.00 0.07 0.02 0.12 0.15 0.02 0.03 0.02 0.55 0.54 0.14 0.36 1.00
16. Systematic– Casual
–0.04 –0.10 –0.07 –0.05 –0.18 0.41 0.41 0.31 0.20 0.50 0.35 0.33 –0.11 0.08 0.21 1.00
17. Planful– Open-Ended
0.04 0.03 0.03 0.04 –0.05 0.30 0.28 0.23 0.15 0.44 0.21 0.18 –0.12 –0.01 0.10 0.55 1.00
18. Early Starting– Pressure-Prompted
–0.05 –0.05 –0.05 –0.05 –0.18 0.28 0.27 0.21 0.17 0.39 0.13 0.10 –0.12 –0.07 0.01 0.52 0.49 1.00
19. Scheduled– Spontaneous
0.00 –0.04 –0.01 –0.01 –0.12 0.35 0.33 0.26 0.17 0.48 0.27 0.23 –0.13 0.00 0.14 0.62 0.66 0.56 1.00
200. Methodical– Emergent
0.05 –0.02 0.01 0.03 –0.08 0.27 0.24 0.17 0.16 0.30 0.21 0.21 –0.04 0.00 0.13 0.53 0.48 0.49 0.57 1.00
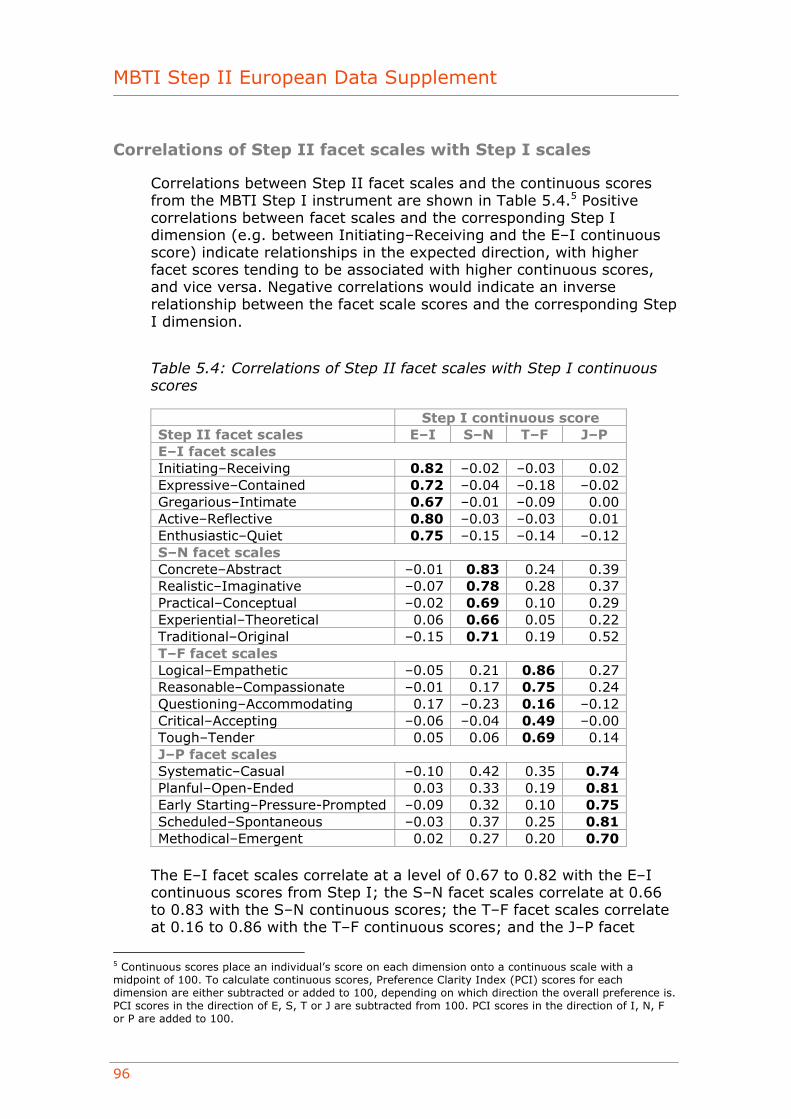
MBTI Step II European Data Supplement
96
Correlations of Step II facet scales with Step I scales
Correlations between Step II facet scales and the continuous scores from the MBTI Step I instrument are shown in Table 5.4.5 Positive correlations between facet scales and the corresponding Step I dimension (e.g. between Initiating–Receiving and the E–I continuous score) indicate relationships in the expected direction, with higher facet scores tending to be associated with higher continuous scores, and vice versa. Negative correlations would indicate an inverse relationship between the facet scale scores and the corresponding Step I dimension.
Table 5.4: Correlations of Step II facet scales with Step I continuous scores
Step I continuous score Step II facet scales E–I S–N T–F J–P E–I facet scales Initiating–Receiving 0.82 –0.02 –0.03 0.02 Expressive–Contained 0.72 –0.04 –0.18 –0.02 Gregarious–Intimate 0.67 –0.01 –0.09 0.00 Active–Reflective 0.80 –0.03 –0.03 0.01 Enthusiastic–Quiet 0.75 –0.15 –0.14 –0.12 S–N facet scales Concrete–Abstract –0.01 0.83 0.24 0.39 Realistic–Imaginative –0.07 0.78 0.28 0.37 Practical–Conceptual –0.02 0.69 0.10 0.29 Experiential–Theoretical 0.06 0.66 0.05 0.22 Traditional–Original –0.15 0.71 0.19 0.52 T–F facet scales Logical–Empathetic –0.05 0.21 0.86 0.27 Reasonable–Compassionate –0.01 0.17 0.75 0.24 Questioning–Accommodating 0.17 –0.23 0.16 –0.12 Critical–Accepting –0.06 –0.04 0.49 –0.00 Tough–Tender 0.05 0.06 0.69 0.14 J–P facet scales Systematic–Casual –0.10 0.42 0.35 0.74 Planful–Open-Ended 0.03 0.33 0.19 0.81 Early Starting–Pressure-Prompted –0.09 0.32 0.10 0.75 Scheduled–Spontaneous –0.03 0.37 0.25 0.81 Methodical–Emergent 0.02 0.27 0.20 0.70
The E–I facet scales correlate at a level of 0.67 to 0.82 with the E–I continuous scores from Step I; the S–N facet scales correlate at 0.66 to 0.83 with the S–N continuous scores; the T–F facet scales correlate at 0.16 to 0.86 with the T–F continuous scores; and the J–P facet
5 Continuous scores place an individual’s score on each dimension onto a continuous scale with a midpoint of 100. To calculate continuous scores, Preference Clarity Index (PCI) scores for each dimension are either subtracted or added to 100, depending on which direction the overall preference is. PCI scores in the direction of E, S, T or J are subtracted from 100. PCI scores in the direction of I, N, F or P are added to 100.
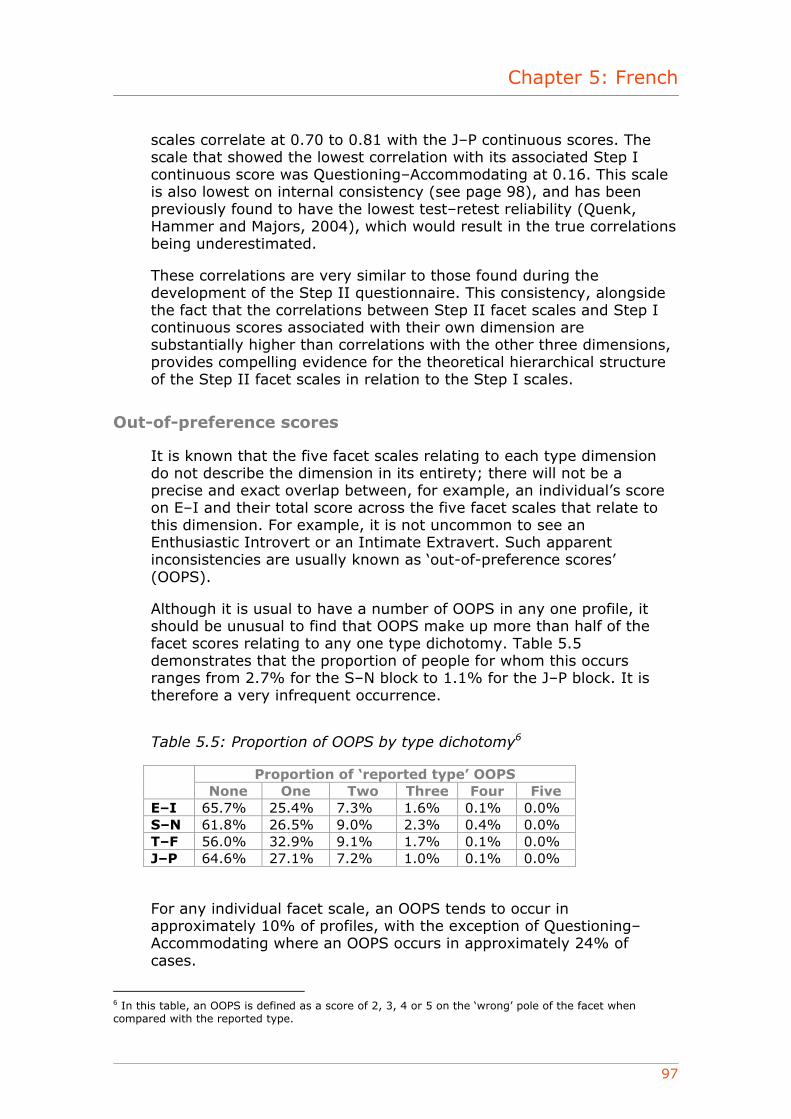
Chapter 5: French
97
scales correlate at 0.70 to 0.81 with the J–P continuous scores. The scale that showed the lowest correlation with its associated Step I continuous score was Questioning–Accommodating at 0.16. This scale is also lowest on internal consistency (see page 98), and has been previously found to have the lowest test–retest reliability (Quenk, Hammer and Majors, 2004), which would result in the true correlations being underestimated.
These correlations are very similar to those found during the development of the Step II questionnaire. This consistency, alongside the fact that the correlations between Step II facet scales and Step I continuous scores associated with their own dimension are substantially higher than correlations with the other three dimensions, provides compelling evidence for the theoretical hierarchical structure of the Step II facet scales in relation to the Step I scales.
Out-of-preference scores
It is known that the five facet scales relating to each type dimension do not describe the dimension in its entirety; there will not be a precise and exact overlap between, for example, an individual’s score on E–I and their total score across the five facet scales that relate to this dimension. For example, it is not uncommon to see an Enthusiastic Introvert or an Intimate Extravert. Such apparent inconsistencies are usually known as ‘out-of-preference scores’ (OOPS).
Although it is usual to have a number of OOPS in any one profile, it should be unusual to find that OOPS make up more than half of the facet scores relating to any one type dichotomy. Table 5.5 demonstrates that the proportion of people for whom this occurs ranges from 2.7% for the S–N block to 1.1% for the J–P block. It is therefore a very infrequent occurrence.
Table 5.5: Proportion of OOPS by type dichotomy6
Proportion of ‘reported type’ OOPS None One Two Three Four Five
E–I 65.7% 25.4% 7.3% 1.6% 0.1% 0.0% S–N 61.8% 26.5% 9.0% 2.3% 0.4% 0.0% T–F 56.0% 32.9% 9.1% 1.7% 0.1% 0.0% J–P 64.6% 27.1% 7.2% 1.0% 0.1% 0.0%
For any individual facet scale, an OOPS tends to occur in approximately 10% of profiles, with the exception of Questioning–Accommodating where an OOPS occurs in approximately 24% of cases.
6 In this table, an OOPS is defined as a score of 2, 3, 4 or 5 on the ‘wrong’ pole of the facet when compared with the reported type.
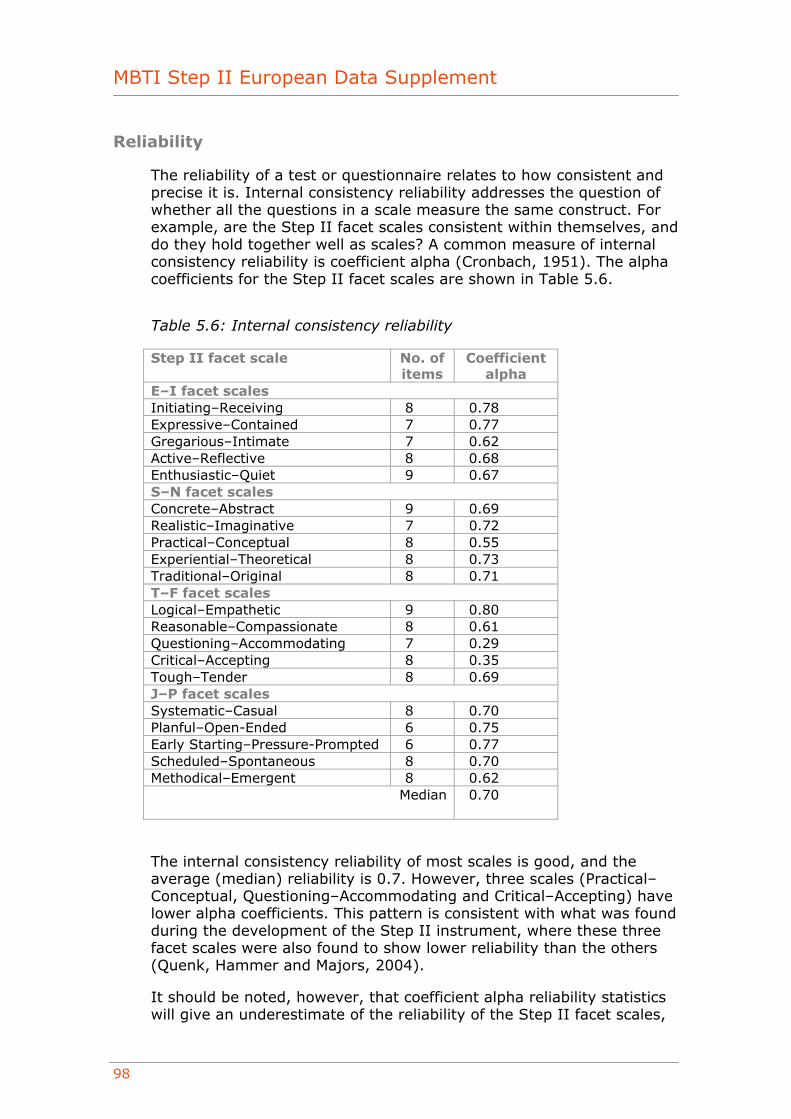
MBTI Step II European Data Supplement
98
Reliability
The reliability of a test or questionnaire relates to how consistent and precise it is. Internal consistency reliability addresses the question of whether all the questions in a scale measure the same construct. For example, are the Step II facet scales consistent within themselves, and do they hold together well as scales? A common measure of internal consistency reliability is coefficient alpha (Cronbach, 1951). The alpha coefficients for the Step II facet scales are shown in Table 5.6.
Table 5.6: Internal consistency reliability
Step II facet scale No. of items
Coefficient alpha
E–I facet scales Initiating–Receiving 8 0.78 Expressive–Contained 7 0.77 Gregarious–Intimate 7 0.62 Active–Reflective 8 0.68 Enthusiastic–Quiet 9 0.67 S–N facet scales Concrete–Abstract 9 0.69 Realistic–Imaginative 7 0.72 Practical–Conceptual 8 0.55 Experiential–Theoretical 8 0.73 Traditional–Original 8 0.71 T–F facet scales Logical–Empathetic 9 0.80 Reasonable–Compassionate 8 0.61 Questioning–Accommodating 7 0.29 Critical–Accepting 8 0.35 Tough–Tender 8 0.69 J–P facet scales Systematic–Casual 8 0.70 Planful–Open-Ended 6 0.75 Early Starting–Pressure-Prompted 6 0.77 Scheduled–Spontaneous 8 0.70 Methodical–Emergent 8 0.62
Median 0.70
The internal consistency reliability of most scales is good, and the average (median) reliability is 0.7. However, three scales (Practical–Conceptual, Questioning–Accommodating and Critical–Accepting) have lower alpha coefficients. This pattern is consistent with what was found during the development of the Step II instrument, where these three facet scales were also found to show lower reliability than the others (Quenk, Hammer and Majors, 2004).
It should be noted, however, that coefficient alpha reliability statistics will give an underestimate of the reliability of the Step II facet scales,
Chapter 5: French
99
given the use of item response theory (IRT) methods in the actual scoring process.7
Group differences
This section looks at the way in which people from different groups responded to the French version of the European Step II questionnaire.
Gender
The means and standard deviations of the Step II facet scales are shown separately for males and females in Table 5.7, along with the difference in mean scores. This is represented graphically in Figure 5.2. Statistically significant differences were found between male and female mean scores for 16 of the 20 facet scales, with some consistent patterns emerging.
• On the E–I facet scales, four of the five mean scores tended slightly toward the E pole for both males and females. Only the mean Expressive–Contained score for males tended towards the I pole. There was no consistent gender difference across the dimension, with males tending further towards the E pole than females on two facet scales, and females tending more towards the E pole than males on two facet scales.
• On the S–N facet scales, all five mean scores tended slightly toward the S pole for males, whilst two did so for females. There were statistically significant gender differences on four of the five facet scales, with male mean scores tending more towards the S pole than females.
• On the T–F facet scales, all five mean scores tended slightly toward the T pole for males, whilst two did so for females. There were statistically significant gender differences on four of the five facet scales, with male mean scores tending more towards the T pole than females.
• On the J–P facet scales, four of the five mean scores tended slightly toward the J pole for both males and females. The only exception was the mean Planful–Open-Ended score for females, which was exactly at the midpoint. There were statistically significant gender differences on four of the five facet scales, with male mean scores tending more towards the J pole than females.
7 Item response theory (IRT) is an approach to measurement that is concerned with modelling the relationship between item responses and the underlying characteristic assessed by the scale or test the item is designed to measure. IRT can be used to select items for a test and/or to score the items.

MBTI Step II European Data Supplement
100
Table 5.7: Gender differences in facet scale scores
Males (n=2,570)
Females (n=1,682)
Step II facet scale Mean SD Mean SD
Difference (M–F)8
E–I facet scales Initiating–Receiving –0.99 3.18 –0.79 3.11 –0.20* Expressive–Contained 0.43 3.16 –0.14 3.22 0.57** Gregarious–Intimate –0.15 2.68 –0.02 2.53 –0.13 Active–Reflective –1.15 2.84 –0.82 2.87 –0.33** Enthusiastic–Quiet 0.13 2.78 –0.32 2.85 0.45** S–N facet scales Concrete–Abstract –1.39 2.40 –0.95 2.46 –0.44** Realistic–Imaginative –0.51 3.15 0.12 3.20 –0.63** Practical–Conceptual –0.39 2.61 0.08 2.58 –0.47** Experiential–Theoretical –1.61 2.94 –1.74 2.85 0.13 Traditional–Original –0.36 2.89 0.24 2.99 –0.60** T–F facet scales Logical–Empathetic –0.93 2.70 0.95 2.86 –1.88** Reasonable–Compassionate –1.53 2.65 –0.25 2.67 –1.28** Questioning–Accommodating –1.01 2.59 –0.97 2.55 –0.04 Critical–Accepting –0.45 1.80 0.26 1.95 –0.71** Tough–Tender –0.66 2.76 0.48 2.88 –1.14** J–P facet scales Systematic–Casual –0.93 2.77 –0.23 2.77 –0.70** Planful–Open-Ended –0.64 3.27 0.00 3.32 –0.64** Early Starting–Pressure-Prompted –0.72 3.61 –0.80 3.65 0.08 Scheduled–Spontaneous –1.23 2.94 –0.66 2.91 –0.57** Methodical–Emergent –1.15 2.83 –0.87 2.84 –0.28**
Difference significant at: *p<0.05, **p<0.01 (based on an independent samples t-test).
8 A positive value indicates that male scores tend more towards I, N, F or P, and a negative value indicates that female scores tend more towards I, N, F or P.
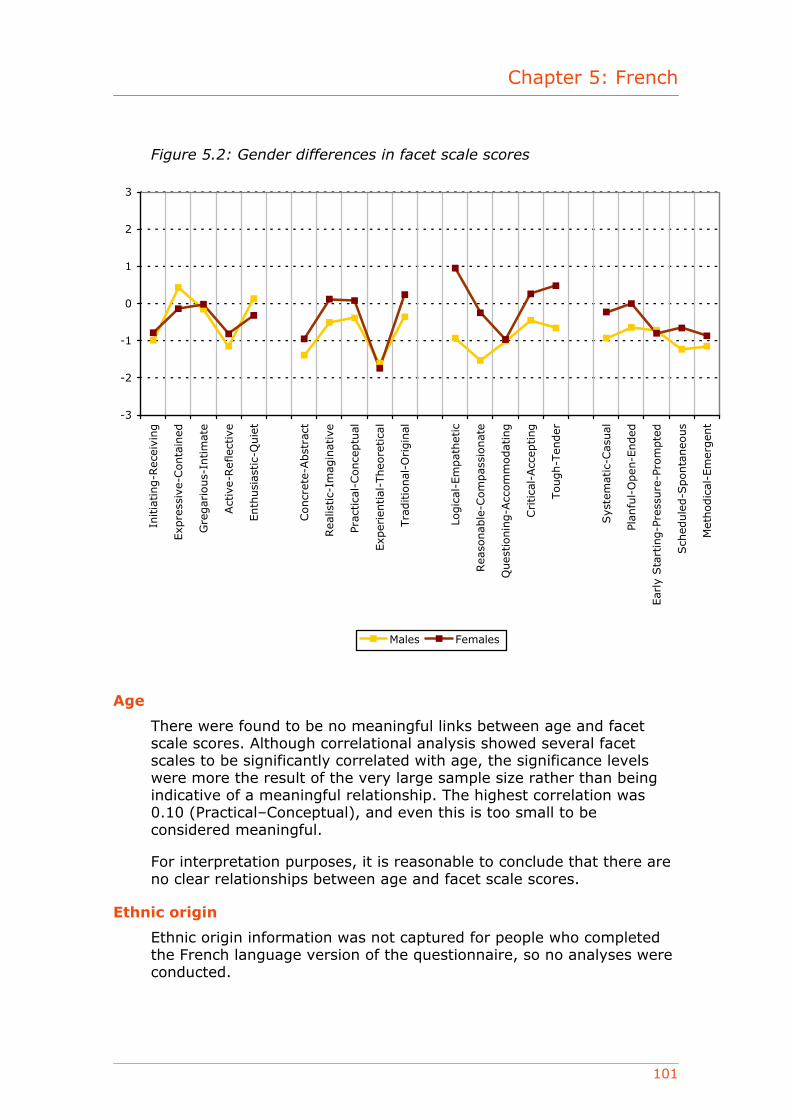
Chapter 5: French
101
Figure 5.2: Gender differences in facet scale scores
-3
-2
-1
0
1
2
3
Initia
ting-R
ecei
ving
Exp
ress
ive-
Conta
ined
Gre
gar
ious-
Intim
ate
Act
ive-
Ref
lect
ive
Enth
usi
astic-
Quie
t
Concr
ete-
Abst
ract
Rea
listic-
Imag
inat
ive
Prac
tica
l-Conce
ptu
al
Exp
erie
ntial
-Theo
retica
l
Tra
ditio
nal
-Origin
al
Logic
al-E
mpat
het
ic
Rea
sonab
le-C
om
pas
sionat
e
Ques
tionin
g-A
ccom
modat
ing
Critica
l-Acc
epting
Tough-T
ender
Sys
tem
atic
-Cas
ual
Plan
ful-
Open
-Ended
Ear
ly S
tart
ing-P
ress
ure
-Pro
mpte
d
Sch
edule
d-S
ponta
neo
us
Met
hodic
al-E
mer
gen
t
Males Females
Age
There were found to be no meaningful links between age and facet scale scores. Although correlational analysis showed several facet scales to be significantly correlated with age, the significance levels were more the result of the very large sample size rather than being indicative of a meaningful relationship. The highest correlation was 0.10 (Practical–Conceptual), and even this is too small to be considered meaningful.
For interpretation purposes, it is reasonable to conclude that there are no clear relationships between age and facet scale scores.
Ethnic origin
Ethnic origin information was not captured for people who completed the French language version of the questionnaire, so no analyses were conducted.
MBTI Step II European Data Supplement
102
Occupational level
Research using the French version of the MBTI Step I questionnaire has demonstrated that individuals in higher-level jobs in organisations are more likely to have preferences for Intuition and (to some extent) Thinking than those in lower-level jobs.9.
Table 5.8 shows the facet scale means and standard deviation for different occupational levels. The findings can be summarised as follows:
• No clear pattern was found regarding the facets relating to the E–I dimension.
• A pattern was found regarding the facets relating to the S–N dimension. Mean facet scores amongst higher occupational levels tended to be further towards the N pole than those for the lower occupational level groups.
• A reasonably consistent pattern was found regarding the facets relating to the T–F dimension. Mean facet scores amongst higher occupational levels tended to be further towards the T pole than those for the lower occupational level groups. The employee group mean scores were consistently considerably further towards the F pole (or less towards the T pole) than any other groups. This could be a reflection of the fact that females formed a considerably higher proportion of the employee group than they did of other groups.
• There were no clear overall patterns regarding the facets in the J–P preference block. The only consistent finding was that mean facet scores amongst higher occupational levels tended to be further towards the P pole of Early Starting–Pressure-Prompted than those for the lower occupational level groups.
9 See the MBTI Step I European Data Supplement for details.
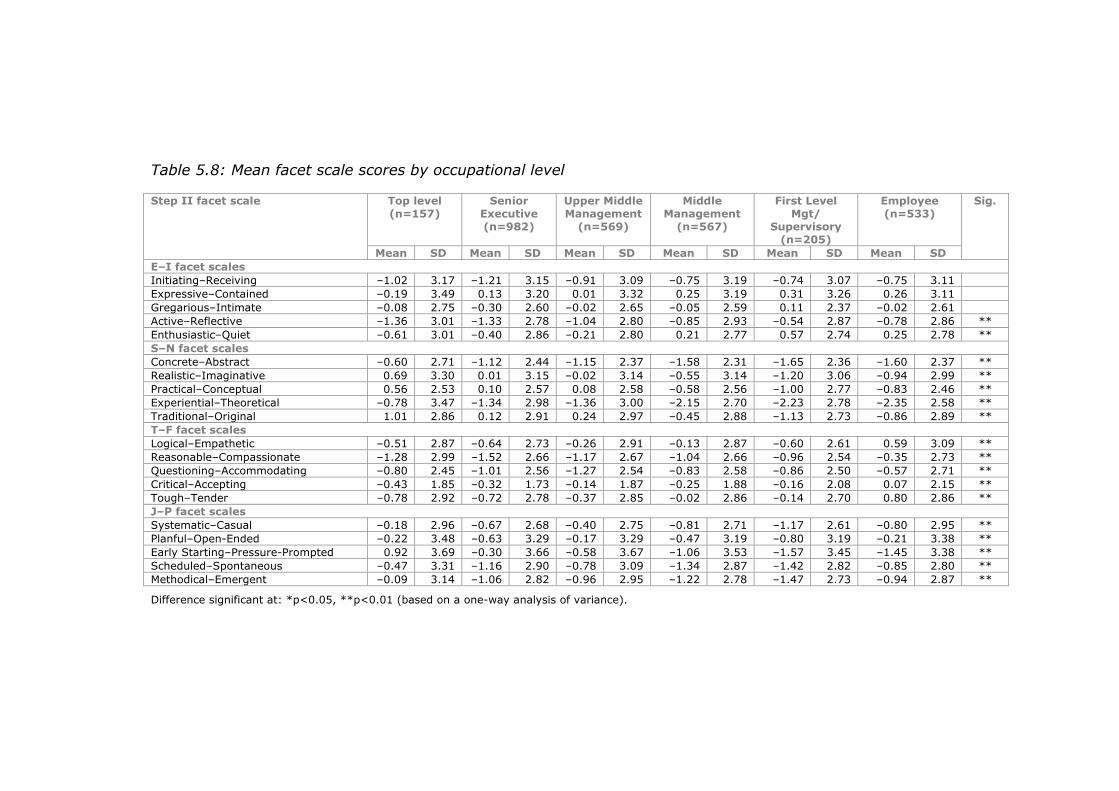
Table 5.8: Mean facet scale scores by occupational level
Top level (n=157)
Senior Executive (n=982)
Upper Middle Management
(n=569)
Middle Management
(n=567)
First Level Mgt/
Supervisory (n=205)
Employee (n=533)
Step II facet scale
Mean SD Mean SD Mean SD Mean SD Mean SD Mean SD
Sig.
E–I facet scales Initiating–Receiving –1.02 3.17 –1.21 3.15 –0.91 3.09 –0.75 3.19 –0.74 3.07 –0.75 3.11 Expressive–Contained –0.19 3.49 0.13 3.20 0.01 3.32 0.25 3.19 0.31 3.26 0.26 3.11 Gregarious–Intimate –0.08 2.75 –0.30 2.60 –0.02 2.65 –0.05 2.59 0.11 2.37 –0.02 2.61 Active–Reflective –1.36 3.01 –1.33 2.78 –1.04 2.80 –0.85 2.93 –0.54 2.87 –0.78 2.86 ** Enthusiastic–Quiet –0.61 3.01 –0.40 2.86 –0.21 2.80 0.21 2.77 0.57 2.74 0.25 2.78 ** S–N facet scales Concrete–Abstract –0.60 2.71 –1.12 2.44 –1.15 2.37 –1.58 2.31 –1.65 2.36 –1.60 2.37 ** Realistic–Imaginative 0.69 3.30 0.01 3.15 –0.02 3.14 –0.55 3.14 –1.20 3.06 –0.94 2.99 ** Practical–Conceptual 0.56 2.53 0.10 2.57 0.08 2.58 –0.58 2.56 –1.00 2.77 –0.83 2.46 ** Experiential–Theoretical –0.78 3.47 –1.34 2.98 –1.36 3.00 –2.15 2.70 –2.23 2.78 –2.35 2.58 ** Traditional–Original 1.01 2.86 0.12 2.91 0.24 2.97 –0.45 2.88 –1.13 2.73 –0.86 2.89 ** T–F facet scales Logical–Empathetic –0.51 2.87 –0.64 2.73 –0.26 2.91 –0.13 2.87 –0.60 2.61 0.59 3.09 ** Reasonable–Compassionate –1.28 2.99 –1.52 2.66 –1.17 2.67 –1.04 2.66 –0.96 2.54 –0.35 2.73 ** Questioning–Accommodating –0.80 2.45 –1.01 2.56 –1.27 2.54 –0.83 2.58 –0.86 2.50 –0.57 2.71 ** Critical–Accepting –0.43 1.85 –0.32 1.73 –0.14 1.87 –0.25 1.88 –0.16 2.08 0.07 2.15 ** Tough–Tender –0.78 2.92 –0.72 2.78 –0.37 2.85 –0.02 2.86 –0.14 2.70 0.80 2.86 ** J–P facet scales Systematic–Casual –0.18 2.96 –0.67 2.68 –0.40 2.75 –0.81 2.71 –1.17 2.61 –0.80 2.95 ** Planful–Open-Ended –0.22 3.48 –0.63 3.29 –0.17 3.29 –0.47 3.19 –0.80 3.19 –0.21 3.38 ** Early Starting–Pressure-Prompted 0.92 3.69 –0.30 3.66 –0.58 3.67 –1.06 3.53 –1.57 3.45 –1.45 3.38 ** Scheduled–Spontaneous –0.47 3.31 –1.16 2.90 –0.78 3.09 –1.34 2.87 –1.42 2.82 –0.85 2.80 ** Methodical–Emergent –0.09 3.14 –1.06 2.82 –0.96 2.95 –1.22 2.78 –1.47 2.73 –0.94 2.87 **
Difference significant at: *p<0.05, **p<0.01 (based on a one-way analysis of variance).
MBTI Step II European Data Supplement
104
Education
Specific educational qualifications were not collected for the OPPassessment sample; however, the age at which individuals left full-time education was. No significant and meaningful correlations were found between the age at which people left full-time education and their facet scale scores. All the correlations were less than 0.1, which, in real terms, is very small.
Work area
Information regarding the area of work people engage in was collected for the group. Many different categories were used, but for the purposes of analysis the focus was on the five most commonly occurring. These were as follows:
• Finance
• HR, training, guidance
• Sales, customer service
• Science, engineering
• IT.
Table 5.8 shows the facet scale means and standard deviation for these five work areas. The findings can be summarised as follows:
• There were no clear overall patterns regarding the facets in the E–I preference block.
• The most noticeable pattern regarding the facets in the S–N, T–F and J–P preference blocks was that whereas means scores for all groups tended towards the S, T and J poles on the facet scales (or were close to the mid-point), the scores for the ‘HR, training, guidance’ were less far towards the S, T and J poles than for the other groups.
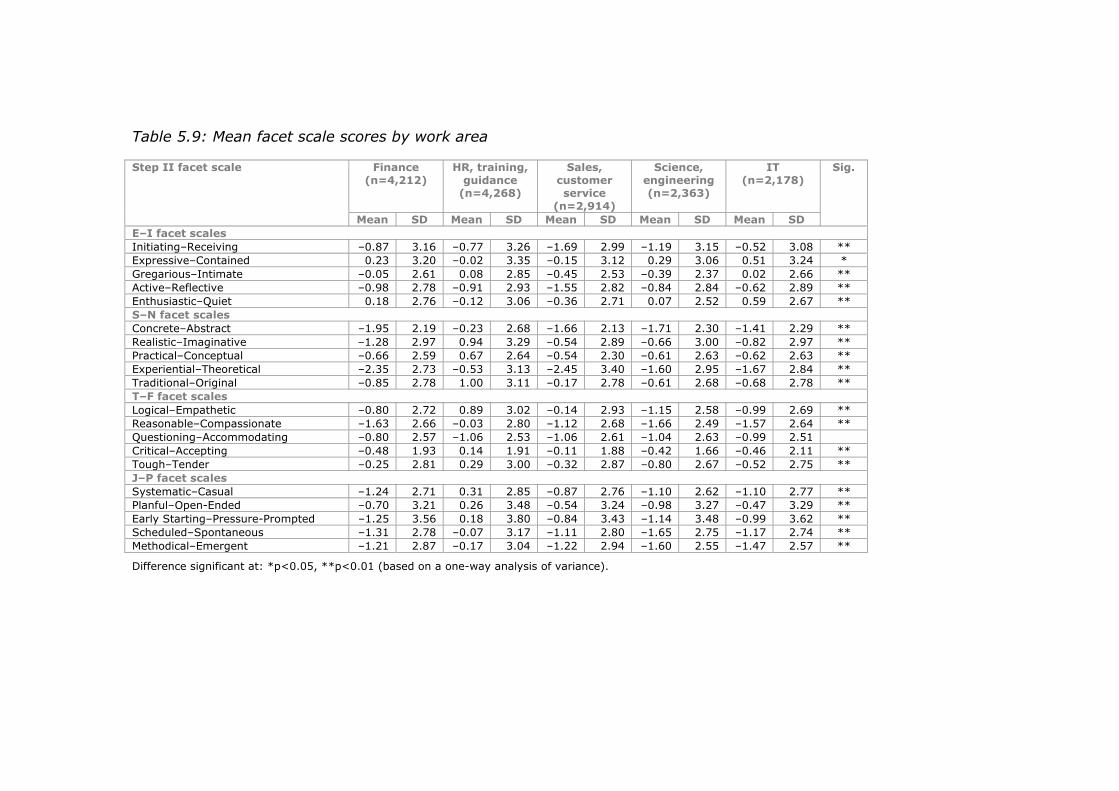
Table 5.9: Mean facet scale scores by work area
Finance (n=4,212)
HR, training, guidance
(n=4,268)
Sales, customer service
(n=2,914)
Science, engineering (n=2,363)
IT (n=2,178)
Step II facet scale
Mean SD Mean SD Mean SD Mean SD Mean SD
Sig.
E–I facet scales Initiating–Receiving –0.87 3.16 –0.77 3.26 –1.69 2.99 –1.19 3.15 –0.52 3.08 ** Expressive–Contained 0.23 3.20 –0.02 3.35 –0.15 3.12 0.29 3.06 0.51 3.24 * Gregarious–Intimate –0.05 2.61 0.08 2.85 –0.45 2.53 –0.39 2.37 0.02 2.66 ** Active–Reflective –0.98 2.78 –0.91 2.93 –1.55 2.82 –0.84 2.84 –0.62 2.89 ** Enthusiastic–Quiet 0.18 2.76 –0.12 3.06 –0.36 2.71 0.07 2.52 0.59 2.67 ** S–N facet scales Concrete–Abstract –1.95 2.19 –0.23 2.68 –1.66 2.13 –1.71 2.30 –1.41 2.29 ** Realistic–Imaginative –1.28 2.97 0.94 3.29 –0.54 2.89 –0.66 3.00 –0.82 2.97 ** Practical–Conceptual –0.66 2.59 0.67 2.64 –0.54 2.30 –0.61 2.63 –0.62 2.63 ** Experiential–Theoretical –2.35 2.73 –0.53 3.13 –2.45 3.40 –1.60 2.95 –1.67 2.84 ** Traditional–Original –0.85 2.78 1.00 3.11 –0.17 2.78 –0.61 2.68 –0.68 2.78 ** T–F facet scales Logical–Empathetic –0.80 2.72 0.89 3.02 –0.14 2.93 –1.15 2.58 –0.99 2.69 ** Reasonable–Compassionate –1.63 2.66 –0.03 2.80 –1.12 2.68 –1.66 2.49 –1.57 2.64 ** Questioning–Accommodating –0.80 2.57 –1.06 2.53 –1.06 2.61 –1.04 2.63 –0.99 2.51 Critical–Accepting –0.48 1.93 0.14 1.91 –0.11 1.88 –0.42 1.66 –0.46 2.11 ** Tough–Tender –0.25 2.81 0.29 3.00 –0.32 2.87 –0.80 2.67 –0.52 2.75 ** J–P facet scales Systematic–Casual –1.24 2.71 0.31 2.85 –0.87 2.76 –1.10 2.62 –1.10 2.77 ** Planful–Open-Ended –0.70 3.21 0.26 3.48 –0.54 3.24 –0.98 3.27 –0.47 3.29 ** Early Starting–Pressure-Prompted –1.25 3.56 0.18 3.80 –0.84 3.43 –1.14 3.48 –0.99 3.62 ** Scheduled–Spontaneous –1.31 2.78 –0.07 3.17 –1.11 2.80 –1.65 2.75 –1.17 2.74 ** Methodical–Emergent –1.21 2.87 –0.17 3.04 –1.22 2.94 –1.60 2.55 –1.47 2.57 **
Difference significant at: *p<0.05, **p<0.01 (based on a one-way analysis of variance).
MBTI Step II European Data Supplement
106
Nationality
Information on nationality was available for the group. Fifty-four per cent of the group were French, 27% were Belgian and 6% were Swiss.
A comparison of mean facet scales across the three main nationality groups highlighted a few interesting differences, as shown in Table 5.10 and Figure 5.3. It is worth noting that although many of the differences in the table were statistically significant, almost without exception the differences in mean scores were less than 1 point. In real terms this is actually quite small.
• On the facet scales linked to the S–N dimension, the French group mean scores tended further towards the N pole than those for the Belgian and Swiss groups.
• On the facet scales linked to the T–F dimension, the Swiss group mean scores tended further towards the F pole than those for the French and Belgian groups.
Broadly speaking, these results correspond with the patterns found when the MBTI Step I data were analysed. The analysis suggested that the Belgian group was significantly more likely to have a Sensing preference than the French group, and that the French group were significantly more likely to have a Thinking preference than the Belgian and Swiss groups.10
10 See the MBTI Step I European Data Supplement for details.
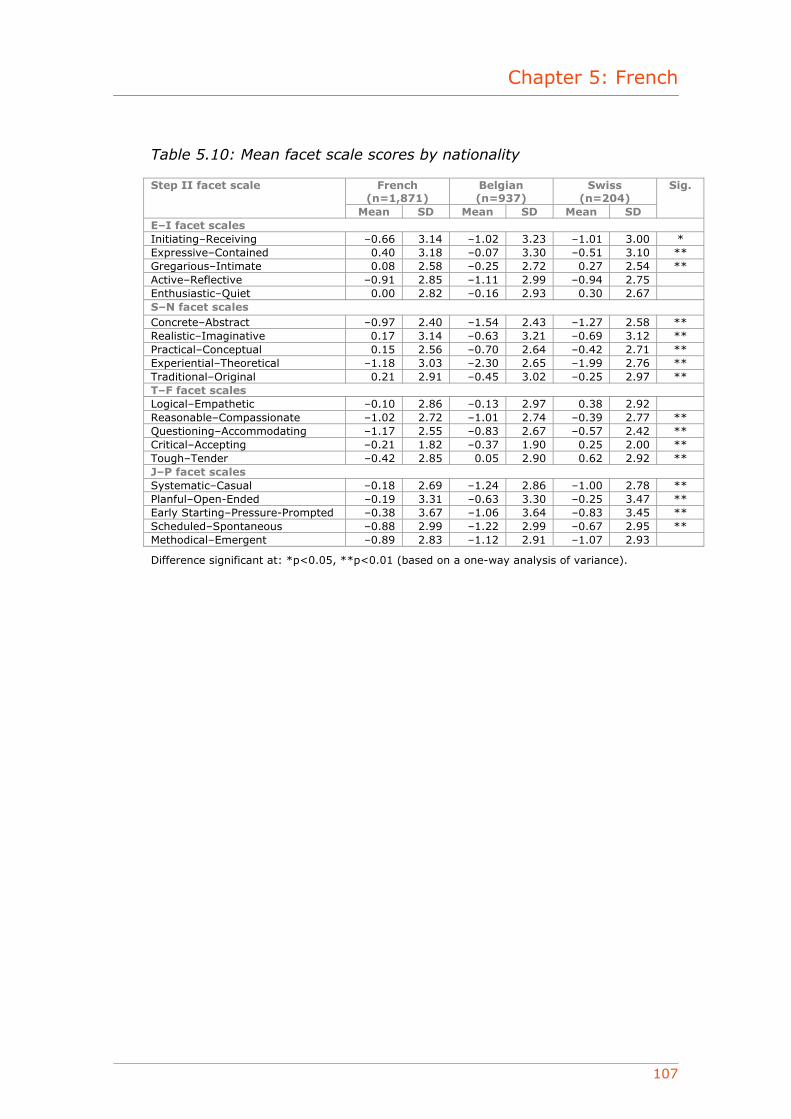
Chapter 5: French
107
Table 5.10: Mean facet scale scores by nationality
French (n=1,871)
Belgian (n=937)
Swiss (n=204)
Step II facet scale
Mean SD Mean SD Mean SD
Sig.
E–I facet scales Initiating–Receiving –0.66 3.14 –1.02 3.23 –1.01 3.00 * Expressive–Contained 0.40 3.18 –0.07 3.30 –0.51 3.10 ** Gregarious–Intimate 0.08 2.58 –0.25 2.72 0.27 2.54 ** Active–Reflective –0.91 2.85 –1.11 2.99 –0.94 2.75 Enthusiastic–Quiet 0.00 2.82 –0.16 2.93 0.30 2.67 S–N facet scales Concrete–Abstract –0.97 2.40 –1.54 2.43 –1.27 2.58 ** Realistic–Imaginative 0.17 3.14 –0.63 3.21 –0.69 3.12 ** Practical–Conceptual 0.15 2.56 –0.70 2.64 –0.42 2.71 ** Experiential–Theoretical –1.18 3.03 –2.30 2.65 –1.99 2.76 ** Traditional–Original 0.21 2.91 –0.45 3.02 –0.25 2.97 ** T–F facet scales Logical–Empathetic –0.10 2.86 –0.13 2.97 0.38 2.92 Reasonable–Compassionate –1.02 2.72 –1.01 2.74 –0.39 2.77 ** Questioning–Accommodating –1.17 2.55 –0.83 2.67 –0.57 2.42 ** Critical–Accepting –0.21 1.82 –0.37 1.90 0.25 2.00 ** Tough–Tender –0.42 2.85 0.05 2.90 0.62 2.92 ** J–P facet scales Systematic–Casual –0.18 2.69 –1.24 2.86 –1.00 2.78 ** Planful–Open-Ended –0.19 3.31 –0.63 3.30 –0.25 3.47 ** Early Starting–Pressure-Prompted –0.38 3.67 –1.06 3.64 –0.83 3.45 ** Scheduled–Spontaneous –0.88 2.99 –1.22 2.99 –0.67 2.95 ** Methodical–Emergent –0.89 2.83 –1.12 2.91 –1.07 2.93
Difference significant at: *p<0.05, **p<0.01 (based on a one-way analysis of variance).
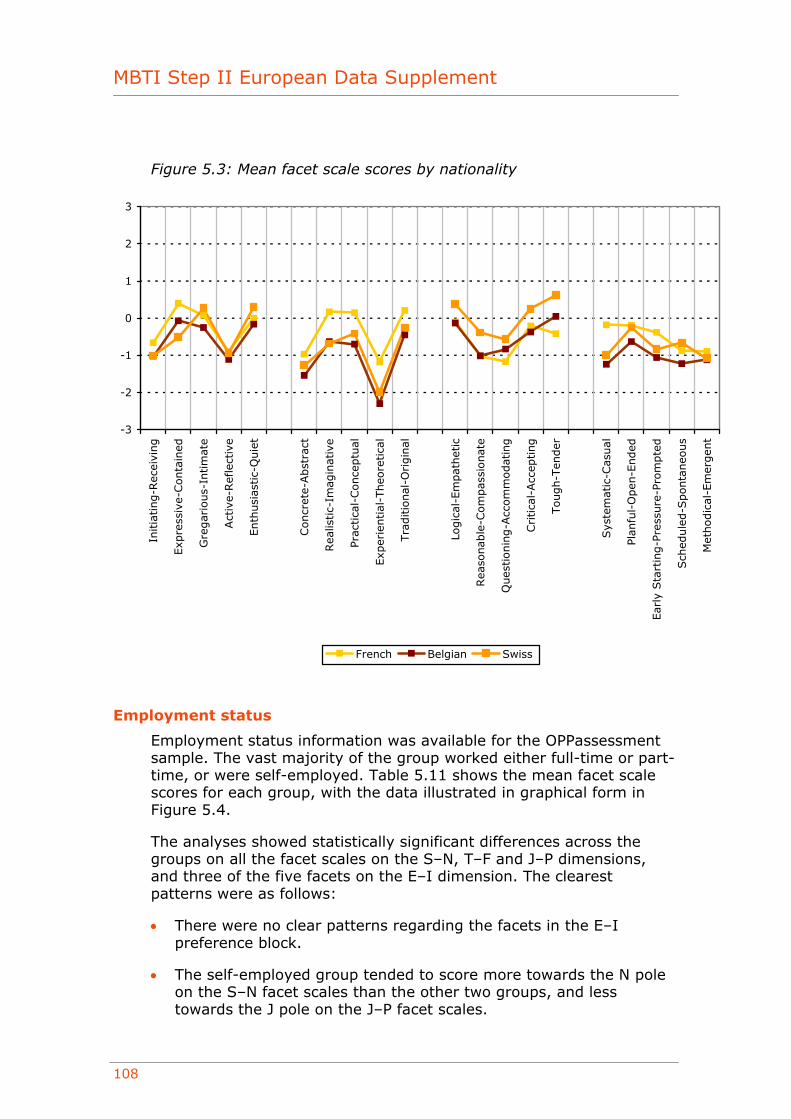
MBTI Step II European Data Supplement
108
Figure 5.3: Mean facet scale scores by nationality
-3
-2
-1
0
1
2
3
Initia
ting-R
ecei
ving
Exp
ress
ive-
Conta
ined
Gre
gar
ious-
Intim
ate
Act
ive-
Ref
lect
ive
Enth
usi
astic-
Quie
t
Concr
ete-
Abst
ract
Rea
listic-
Imag
inat
ive
Prac
tica
l-Conce
ptu
al
Exp
erie
ntial
-Theo
retica
l
Tra
ditio
nal
-Origin
al
Logic
al-E
mpat
het
ic
Rea
sonab
le-C
om
pas
sionat
e
Ques
tionin
g-A
ccom
modat
ing
Critica
l-Acc
epting
Tough-T
ender
Sys
tem
atic
-Cas
ual
Plan
ful-
Open
-Ended
Ear
ly S
tart
ing-P
ress
ure
-Pro
mpte
d
Sch
edule
d-S
ponta
neo
us
Met
hodic
al-E
mer
gen
t
French Belgian Swiss
Employment status
Employment status information was available for the OPPassessment sample. The vast majority of the group worked either full-time or part-time, or were self-employed. Table 5.11 shows the mean facet scale scores for each group, with the data illustrated in graphical form in Figure 5.4.
The analyses showed statistically significant differences across the groups on all the facet scales on the S–N, T–F and J–P dimensions, and three of the five facets on the E–I dimension. The clearest patterns were as follows:
• There were no clear patterns regarding the facets in the E–I preference block.
• The self-employed group tended to score more towards the N pole on the S–N facet scales than the other two groups, and less towards the J pole on the J–P facet scales.
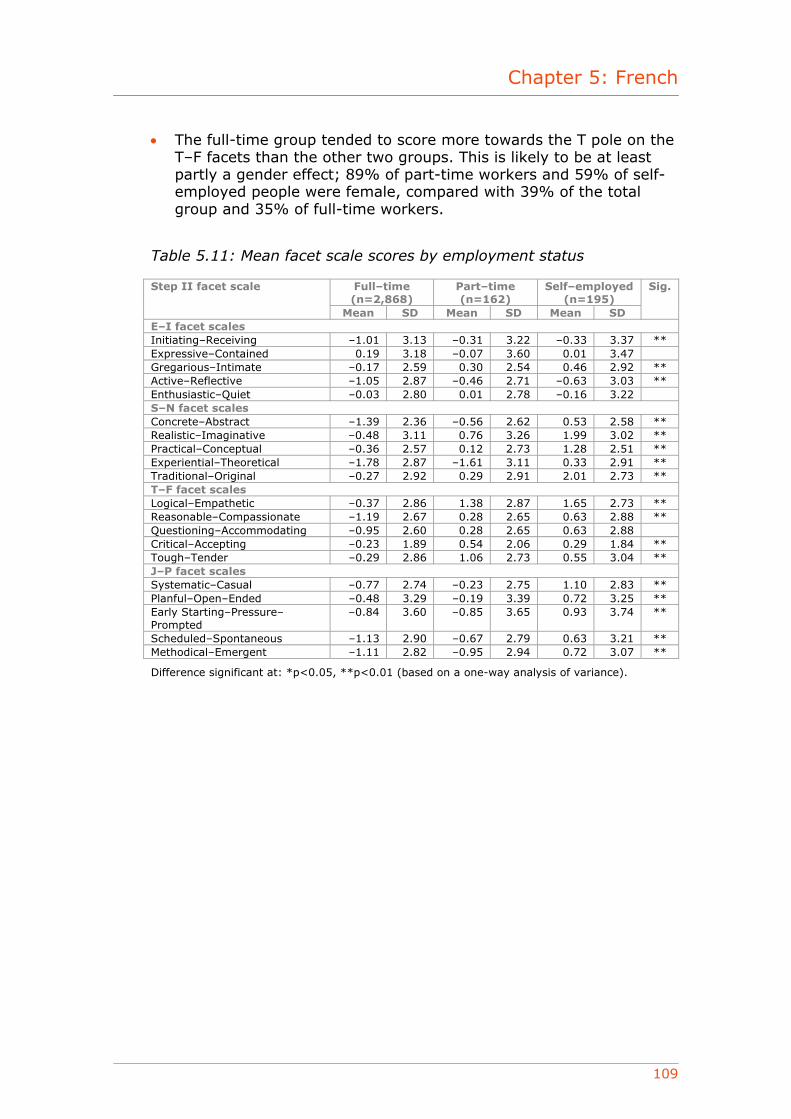
Chapter 5: French
109
• The full-time group tended to score more towards the T pole on the T–F facets than the other two groups. This is likely to be at least partly a gender effect; 89% of part-time workers and 59% of self-employed people were female, compared with 39% of the total group and 35% of full-time workers.
Table 5.11: Mean facet scale scores by employment status
Full–time (n=2,868)
Part–time (n=162)
Self–employed (n=195)
Step II facet scale
Mean SD Mean SD Mean SD
Sig.
E–I facet scales Initiating–Receiving –1.01 3.13 –0.31 3.22 –0.33 3.37 ** Expressive–Contained 0.19 3.18 –0.07 3.60 0.01 3.47 Gregarious–Intimate –0.17 2.59 0.30 2.54 0.46 2.92 ** Active–Reflective –1.05 2.87 –0.46 2.71 –0.63 3.03 ** Enthusiastic–Quiet –0.03 2.80 0.01 2.78 –0.16 3.22 S–N facet scales Concrete–Abstract –1.39 2.36 –0.56 2.62 0.53 2.58 ** Realistic–Imaginative –0.48 3.11 0.76 3.26 1.99 3.02 ** Practical–Conceptual –0.36 2.57 0.12 2.73 1.28 2.51 ** Experiential–Theoretical –1.78 2.87 –1.61 3.11 0.33 2.91 ** Traditional–Original –0.27 2.92 0.29 2.91 2.01 2.73 ** T–F facet scales Logical–Empathetic –0.37 2.86 1.38 2.87 1.65 2.73 ** Reasonable–Compassionate –1.19 2.67 0.28 2.65 0.63 2.88 ** Questioning–Accommodating –0.95 2.60 0.28 2.65 0.63 2.88 Critical–Accepting –0.23 1.89 0.54 2.06 0.29 1.84 ** Tough–Tender –0.29 2.86 1.06 2.73 0.55 3.04 ** J–P facet scales Systematic–Casual –0.77 2.74 –0.23 2.75 1.10 2.83 ** Planful–Open–Ended –0.48 3.29 –0.19 3.39 0.72 3.25 ** Early Starting–Pressure–Prompted
–0.84 3.60 –0.85 3.65 0.93 3.74 **
Scheduled–Spontaneous –1.13 2.90 –0.67 2.79 0.63 3.21 ** Methodical–Emergent –1.11 2.82 –0.95 2.94 0.72 3.07 **
Difference significant at: *p<0.05, **p<0.01 (based on a one-way analysis of variance).
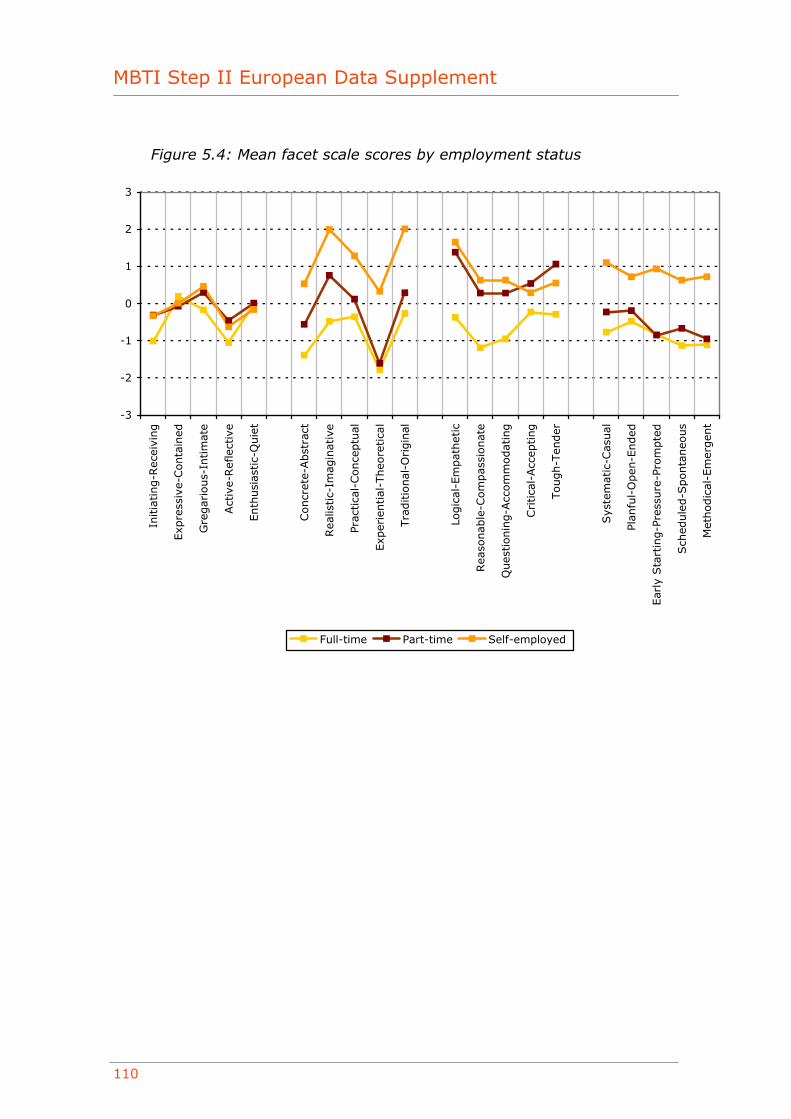
MBTI Step II European Data Supplement
110
Figure 5.4: Mean facet scale scores by employment status
-3
-2
-1
0
1
2
3
Initia
ting-R
ecei
ving
Exp
ress
ive-
Conta
ined
Gre
gar
ious-
Intim
ate
Act
ive-
Ref
lect
ive
Enth
usi
astic-
Quie
t
Concr
ete-
Abst
ract
Rea
listic-
Imag
inat
ive
Prac
tica
l-Conce
ptu
al
Exp
erie
ntial
-Theo
retica
l
Tra
ditio
nal
-Origin
al
Logic
al-E
mpat
het
ic
Rea
sonab
le-C
om
pas
sionat
e
Ques
tionin
g-A
ccom
modat
ing
Critica
l-Acc
epting
Tough-T
ender
Sys
tem
atic
-Cas
ual
Plan
ful-
Open
-Ended
Ear
ly S
tart
ing-P
ress
ure
-Pro
mpte
d
Sch
edule
d-S
ponta
neo
us
Met
hodic
al-E
mer
gen
t
Full-time Part-time Self-employed
Chapter 5: French
111
Appendix 1: Sample description
Sample 1: Data from OPPassessment (representative European French-speaking professional and managerial sample)
This sample consists of 4,254 individuals who completed the MBTI Step II instrument in French via the OPPassessment system between October 2003 and June 2008. Sixty per cent of the respondents were male and 40% were female. Age ranged from 16 to 71 years, with a mean of 40 and a median of 39.
Nationality was disclosed by 81% of respondents. Of these, 54% were French, 27% were Belgian and 6% were Swiss. Many other nationalities were represented, but each one formed less than 1% of the total group:
Nationality Percentage French 54.3% Belgian 27.1% Swiss 5.9% Other 12.7%
The majority of the group were in full-time employment:
Employment status Percentage Full-time 87.1% Self-employed 5.9% Part-time 4.9% Unemployed 1.8% Retired 0.2% Homemaker 0.1%
The majority of the group were of managerial level or above, with the largest single group being senior executive (31%):
Occupational level Percentage Top level 4.9% Senior executive 30.9% Upper middle management 17.9% Middle management 17.8% First level management/supervisor
6.4%
Employee 16.7% Other 5.3%

MBTI Step II European Data Supplement
112
A range of work areas were represented:
Work area (job type) Percentage HR, training, guidance 22.6% Finance 15.0% Sales, customer service 14.1% Science, engineering 8.9% IT 8.4% Business services 4.4% Research and development 3.7% Admin or secretarial 3.4% Health, social services, etc. 1.1% Education 0.6% Leisure, personal service 0.5% Land, sea or air transport 0.4% Military, police, prison, fire 0.1% Skilled operative 0.1% Unskilled operative 0.0% Other private sector 6.5% Other public sector 1.4% Other 8.8%

Chapter 6: German
113
European Data Supplement German
January 2009
OPP Ltd Elsfield Hall
15–17 Elsfield Way Oxford OX2 8EP
UK t: +44 (0)845 603 9958 f: +44 (0)1865 557483
MBTI® Step II instrument

MBTI Step II European Data Supplement
114
Contents
Introduction ........................................................................... 115 Type distribution ..................................................................... 116
OPPassessment data (representative German-speaking professional and managerial sample).................................................... 117
Properties of the Step II facet scales .......................................... 118 Facet scale score distribution................................................. 118 Facet scale intercorrelations .................................................. 120 Correlations of Step II facet scales with Step I scales................ 122 Out-of-preference scores ...................................................... 123 Reliability ........................................................................... 124 Group differences ................................................................ 125
Appendix 1: Sample description ................................................ 136 Sample 1: Data from OPPassessment (representative German-
speaking professional and managerial sample) ..................... 136
© Copyright 2009 OPP Ltd. All rights reserved.
No portion of this publication may be translated or reproduced in whole or in part, stored in a retrieval system, or transmitted in any form or by any means (electronic, mechanical, photocopying, recording or otherwise) without the prior written permission of the copyright owner. No part of this publication is reproducible under any photocopying licence scheme. OPP Ltd grants the downloader a personal, non-transferable, perpetual, irrevocable right to use the Supplement. The European Data Supplement (‘the Supplement’) is for personal use only and may not be sold on or circulated to third parties.
® MBTI, Myers-Briggs and the Myers-Briggs Type Indicator are registered trade marks of the Myers-Briggs Type Indicator Trust. OPP is licensed to use the trade marks in Europe.
® OPP is a registered trade mark of OPP Ltd in the European Community.

Chapter 6: German
115
Introduction
Data collected for the European MBTI Step II instrument were analysed to produce the findings in this supplement. This is the first data supplement produced for this instrument, and contains all the data gathered to date since the launch of the instrument in 2003. A brief description of the sample is given below. Further details of the sample are provided in Appendix 1.
• The sample consisted of 3,792 individuals who completed the MBTI Step II questionnaire in German via the OPPassessment system between 2003 and mid-2008.1 This sample is considered to be representative of the groups of people with whom the German MBTI Step II instrument has been and will be used for applications such as management development, coaching, counselling and teambuilding. As such, it is likely to represent a cross-section of the German-speaking professional and managerial population.
The results of the analyses are outlined below.
1 OPPassessment allows personality questionnaires such as the MBTI instrument to be administered via email and/or completed online.
MBTI Step II European Data Supplement
116
Type distribution
Type tables are a way of illustrating the proportion of each type within a particular group. Below is a type table taken from the sample described on the previous page.
For each of the 16 different types, the number of cases, the percentage of the total that this represents and the self-selection ratio (SSR) are shown. The SSR (Myers et al., 1998) is a way of demonstrating whether a given type appears more or less often in a particular group than would be expected given its frequency in a reference group. Ideally, the type distribution from a large representative sample of the German population would be used to calculate SSRs in this data supplement. However, such a sample does not currently exist. In its place, SSRs have been calculated using type data from the UK general population (Kendall, 1998), which can be justified by the fact that type distributions for comparable German and British groups, such as managers and professionals, are similar. Evidence (eg Hackston and Kendall, 2004; Quenk et al., 2004) does suggest that although type-related behaviours vary a good deal from country to country and from culture to culture, the frequencies of underlying MBTI types do not.
An SSR of greater than 1 indicates that a type is over-represented, and an SSR of less than 1 denotes that it is under-represented. Asterisks are used to denote whether the over- or under-representations are statistically significant, based on the results of chi-square analysis.2
2 Chi-square analysis (often abbreviated to χ2) is a technique used to explore whether observed frequency distributions differ significantly from other, predefined, distributions. In this case, the UK general population group is used as the reference group, and the chi-square analysis indicates whether the proportion of people of each type within a particular sample differs significantly from the proportion of people reporting the same type within the reference group.
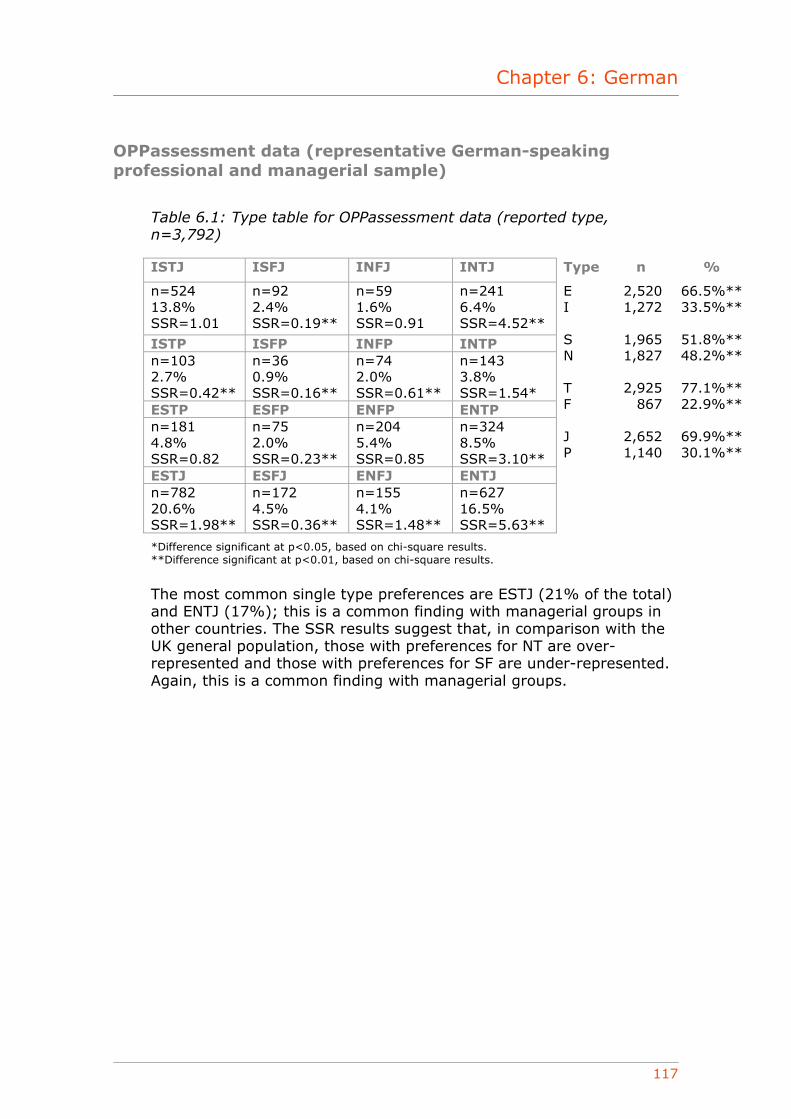
Chapter 6: German
117
OPPassessment data (representative German-speaking professional and managerial sample)
Table 6.1: Type table for OPPassessment data (reported type, n=3,792)
ISTJ ISFJ INFJ INTJ Type n %
n=524 13.8% SSR=1.01
n=92 2.4% SSR=0.19**
n=59 1.6% SSR=0.91
n=241 6.4% SSR=4.52**
ISTP ISFP INFP INTP n=103 2.7% SSR=0.42**
n=36 0.9% SSR=0.16**
n=74 2.0% SSR=0.61**
n=143 3.8% SSR=1.54*
ESTP ESFP ENFP ENTP n=181 4.8% SSR=0.82
n=75 2.0% SSR=0.23**
n=204 5.4% SSR=0.85
n=324 8.5% SSR=3.10**
ESTJ ESFJ ENFJ ENTJ n=782 20.6% SSR=1.98**
n=172 4.5% SSR=0.36**
n=155 4.1% SSR=1.48**
n=627 16.5% SSR=5.63**
E I S N T F J P
2,520 1,272
1,965 1,827
2,925
867
2,652 1,140
66.5%** 33.5%**
51.8%** 48.2%**
77.1%** 22.9%**
69.9%** 30.1%**
*Difference significant at p<0.05, based on chi-square results. **Difference significant at p<0.01, based on chi-square results.
The most common single type preferences are ESTJ (21% of the total) and ENTJ (17%); this is a common finding with managerial groups in other countries. The SSR results suggest that, in comparison with the UK general population, those with preferences for NT are over-represented and those with preferences for SF are under-represented. Again, this is a common finding with managerial groups.

MBTI Step II European Data Supplement
118
Properties of the Step II facet scales
Facet scale score distribution
The means and standard deviations of the Step II facets are shown in Table 6.2, and illustrated graphically in Figure 6.1. The mean score for a scale is calculated by adding together the scores of each individual in the sample and then dividing the sum by the number of individuals. Note that negative values indicate that mean scores are nearer the left-hand pole of the facet and positive values indicate that the mean scores are nearer the right-hand pole. The standard deviation (SD) is a statistical measure describing the degree to which the scores from the sample either bunch up close to, or are scattered widely around, the mean for the sample.
Table 6.2: Means and standard deviations of the facet scales
Step II facet scale Mean3 SD E–I facet scales Initiating–Receiving –0.78 3.27 Expressive–Contained –1.07 2.72 Gregarious–Intimate –0.36 2.59 Active–Reflective –1.22 2.94 Enthusiastic–Quiet –1.66 2.63 S–N facet scales Concrete–Abstract –0.28 2.41 Realistic–Imaginative –0.83 3.00 Practical–Conceptual –0.89 2.55 Experiential–Theoretical –0.50 2.52 Traditional–Original –0.14 2.97 T–F facet scales Logical–Empathetic –0.82 2.90 Reasonable–Compassionate –2.25 2.76 Questioning–Accommodating –1.74 2.72 Critical–Accepting –0.69 2.07 Tough–Tender –0.68 3.03 J–P facet scales Systematic–Casual –1.76 2.51 Planful–Open-Ended –0.67 3.15 Early Starting–Pressure-Prompted –0.28 3.34 Scheduled–Spontaneous –1.74 2.62 Methodical–Emergent –1.11 2.64
3 Scale means: in Step II reports, scores are given from 5 on one pole, through 0, to 5 on the opposite pole. In compiling statistical information, however, one pole needs to be clearly distinguished from the other. Throughout this data supplement, therefore, a convention has been adopted of scores 5, 4, 3, 2 or 1 on the left-hand pole being assigned values of –5, –4, –3, –2, or –1 and scores on the right-hand pole being assigned positive scores. This does not, of course, imply any suggestion that positive scores are ‘better’ than negative scores.
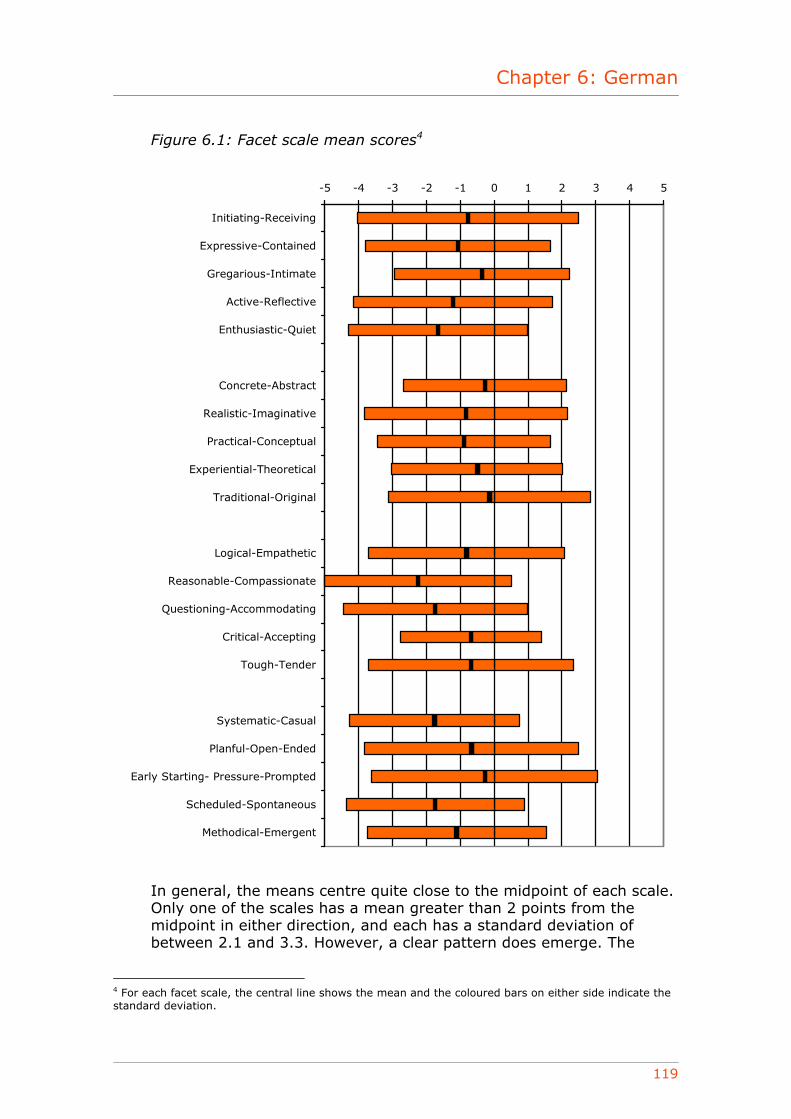
Chapter 6: German
119
Figure 6.1: Facet scale mean scores4
-5 -4 -3 -2 -1 0 1 2 3 4 5
Initiating-Receiving
Expressive-Contained
Gregarious-Intimate
Active-Reflective
Enthusiastic-Quiet
Concrete-Abstract
Realistic-Imaginative
Practical-Conceptual
Experiential-Theoretical
Traditional-Original
Logical-Empathetic
Reasonable-Compassionate
Questioning-Accommodating
Critical-Accepting
Tough-Tender
Systematic-Casual
Planful-Open-Ended
Early Starting- Pressure-Prompted
Scheduled-Spontaneous
Methodical-Emergent
In general, the means centre quite close to the midpoint of each scale. Only one of the scales has a mean greater than 2 points from the midpoint in either direction, and each has a standard deviation of between 2.1 and 3.3. However, a clear pattern does emerge. The
4 For each facet scale, the central line shows the mean and the coloured bars on either side indicate the standard deviation.
MBTI Step II European Data Supplement
120
mean scores all tend towards the E, S, T and J direction, which is consistent with the most common four-letter type preference amongst this sample. Amongst the group as a whole, there are more individuals with a preference for E, S, T and J.
Facet scale intercorrelations
Correlations among the Step II facet scales are shown in Table 6.3. Facet scales within each dichotomy usually correlate more highly (often substantially so) with the other scales of the same dichotomy than they do with scales in the other three dichotomies. For example, every E–I facet scale correlates more highly with the other four E–I scales than with any of the S–N, T–F or J–P facet scales.
There is only one scale that correlates significantly more highly with scales in other dichotomies. The T–F scale Questioning–Accommodating correlates with many scales, across dichotomies. For example, it correlates at a level of 0.23 with Enthusiastic–Quiet and at 0.19 with both Initiating–Receiving and Active–Reflective, whilst correlating negatively at between –0.10 and –0.36 with all of the S–N scales. By way of comparison, it correlates at between 0.12 and 0.21 with the other four scales on the same dichotomy as itself (T–F). The negative correlations between Questioning–Accommodating and the S–N scales are consistent with findings from the US version of the Step II instrument, and suggest that a questioning approach to differences of opinion seems to be related to a range of Intuitive (N) facets. These patterns are similar to those found when the European Step II instrument was developed.

Table 6.3: Intercorrelations of Step II facet scales
1 2 3 4 5 6 7 8 9 10 11 12 13 14 15 16 17 18 19 20 1. Initiating– Receiving
1.00
2. Expressive– Contained
0.48 1.00
3. Gregarious– Intimate
0.50 0.45 1.00
4. Active– Reflective
0.67 0.50 0.51 1.00
5. Enthusiastic– Quiet
0.57 0.56 0.58 0.63 1.00
6. Concrete– Abstract
–0.12 –0.13 –0.13 –0.13 –0.22 1.00
7. Realistic– Imaginative
–0.10 –0.16 –0.15 –0.12 –0.22 0.58 1.00
8. Practical– Conceptual
–0.10 –0.07 –0.04 –0.09 –0.14 0.49 0.46 1.00
9. Experiential– Theoretical
–0.06 –0.06 –0.06 –0.04 –0.07 0.49 0.39 0.47 1.00
10. Traditional– Original
–0.22 –0.15 –0.14 –0.22 –0.27 0.58 0.49 0.49 0.34 1.00
11. Logical– Empathetic
–0.07 –0.22 –0.06 –0.07 –0.15 0.21 0.34 –0.03 0.05 0.08 1.00
12. Reasonable– Compassionate
–0.01 –0.14 –0.05 0.00 –0.06 0.13 0.23 –0.09 0.04 0.00 0.70 1.00
13. Questioning– Accommodating
0.19 0.11 0.11 0.19 0.23 –0.24 –0.10 –0.31 –0.19 –0.36 0.12 0.20 1.00
14. Critical– Accepting
–0.09 –0.15 –0.09 –0.06 –0.09 0.10 0.21 –0.02 0.05 –0.05 0.46 0.47 0.21 1.00
15. Tough– Tender
0.05 –0.11 –0.02 0.05 –0.04 0.17 0.29 –0.01 0.09 –0.01 0.58 0.61 0.17 0.51 1.00
16. Systematic– Casual
–0.10 –0.17 –0.12 –0.12 –0.20 0.42 0.46 0.17 0.16 0.38 0.42 0.34 –0.03 0.27 0.32 1.00
17. Planful– Open-Ended
–0.05 –0.05 –0.03 –0.07 –0.08 0.31 0.27 0.16 0.12 0.36 0.21 0.16 –0.11 0.11 0.15 0.59 1.00
18. Early Starting– Pressure–Prompted
–0.10 –0.11 –0.11 –0.13 –0.17 0.26 0.21 0.14 0.12 0.29 0.07 0.02 –0.13 –0.02 0.01 0.42 0.41 1.00
19. Scheduled– Spontaneous
–0.02 –0.07 –0.05 –0.05 –0.09 0.32 0.32 0.17 0.14 0.33 0.23 0.20 –0.04 0.11 0.19 0.60 0.60 0.48 1.00
20. Methodical– Emergent
0.01 –0.06 –0.05 –0.01 –0.07 0.23 0.23 0.11 0.11 0.22 0.18 0.15 –0.00 0.09 0.15 0.50 0.44 0.42 0.53 1.00
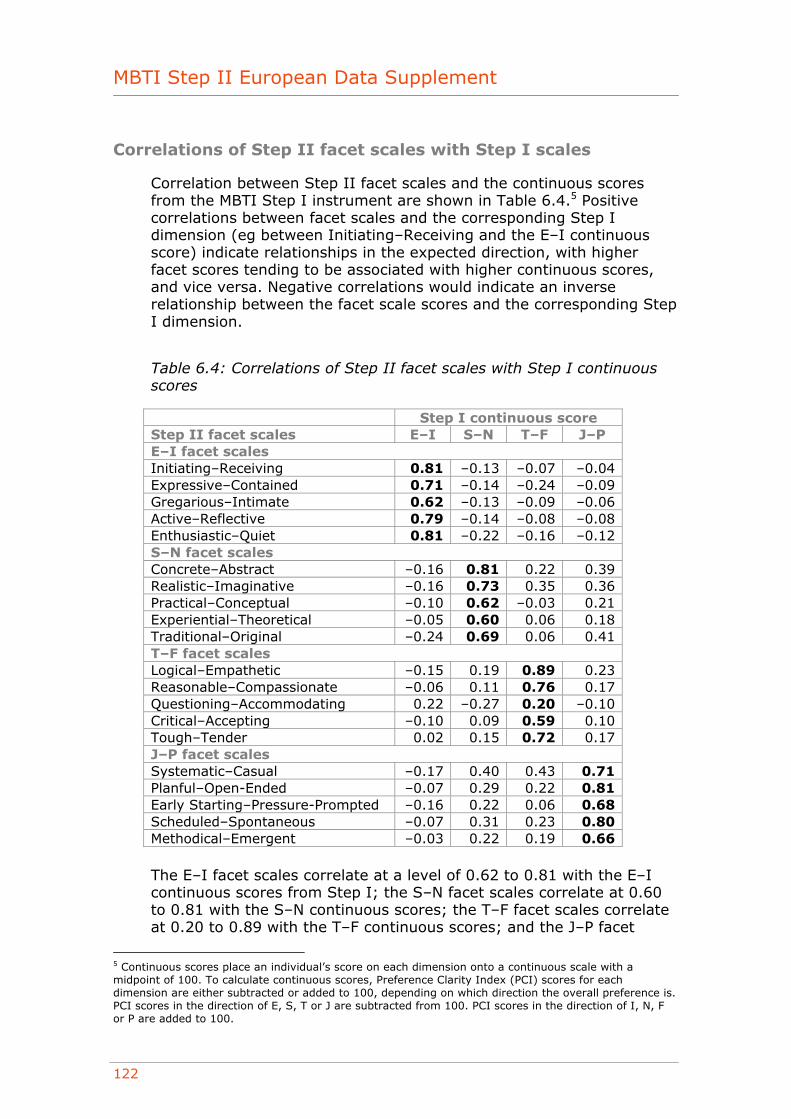
MBTI Step II European Data Supplement
122
Correlations of Step II facet scales with Step I scales
Correlation between Step II facet scales and the continuous scores from the MBTI Step I instrument are shown in Table 6.4.5 Positive correlations between facet scales and the corresponding Step I dimension (eg between Initiating–Receiving and the E–I continuous score) indicate relationships in the expected direction, with higher facet scores tending to be associated with higher continuous scores, and vice versa. Negative correlations would indicate an inverse relationship between the facet scale scores and the corresponding Step I dimension.
Table 6.4: Correlations of Step II facet scales with Step I continuous scores
Step I continuous score Step II facet scales E–I S–N T–F J–P E–I facet scales Initiating–Receiving 0.81 –0.13 –0.07 –0.04 Expressive–Contained 0.71 –0.14 –0.24 –0.09 Gregarious–Intimate 0.62 –0.13 –0.09 –0.06 Active–Reflective 0.79 –0.14 –0.08 –0.08 Enthusiastic–Quiet 0.81 –0.22 –0.16 –0.12 S–N facet scales Concrete–Abstract –0.16 0.81 0.22 0.39 Realistic–Imaginative –0.16 0.73 0.35 0.36 Practical–Conceptual –0.10 0.62 –0.03 0.21 Experiential–Theoretical –0.05 0.60 0.06 0.18 Traditional–Original –0.24 0.69 0.06 0.41 T–F facet scales Logical–Empathetic –0.15 0.19 0.89 0.23 Reasonable–Compassionate –0.06 0.11 0.76 0.17 Questioning–Accommodating 0.22 –0.27 0.20 –0.10 Critical–Accepting –0.10 0.09 0.59 0.10 Tough–Tender 0.02 0.15 0.72 0.17 J–P facet scales Systematic–Casual –0.17 0.40 0.43 0.71 Planful–Open-Ended –0.07 0.29 0.22 0.81 Early Starting–Pressure-Prompted –0.16 0.22 0.06 0.68 Scheduled–Spontaneous –0.07 0.31 0.23 0.80 Methodical–Emergent –0.03 0.22 0.19 0.66
The E–I facet scales correlate at a level of 0.62 to 0.81 with the E–I continuous scores from Step I; the S–N facet scales correlate at 0.60 to 0.81 with the S–N continuous scores; the T–F facet scales correlate at 0.20 to 0.89 with the T–F continuous scores; and the J–P facet
5 Continuous scores place an individual’s score on each dimension onto a continuous scale with a midpoint of 100. To calculate continuous scores, Preference Clarity Index (PCI) scores for each dimension are either subtracted or added to 100, depending on which direction the overall preference is. PCI scores in the direction of E, S, T or J are subtracted from 100. PCI scores in the direction of I, N, F or P are added to 100.
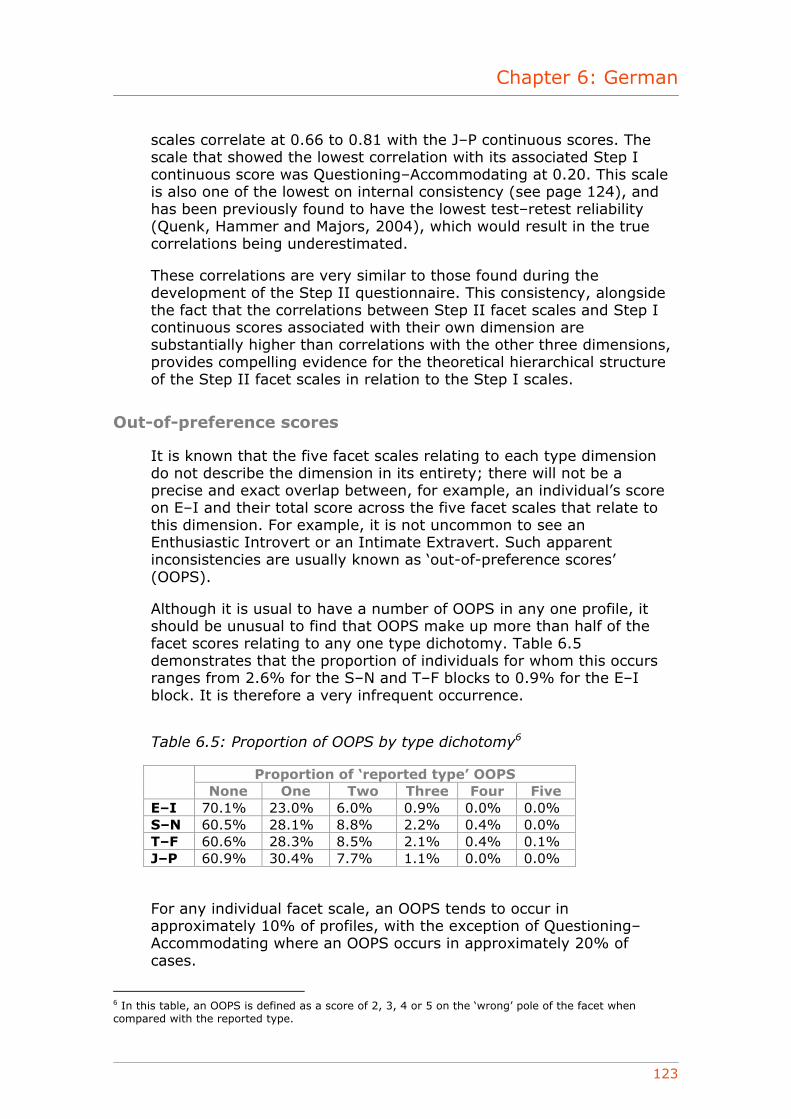
Chapter 6: German
123
scales correlate at 0.66 to 0.81 with the J–P continuous scores. The scale that showed the lowest correlation with its associated Step I continuous score was Questioning–Accommodating at 0.20. This scale is also one of the lowest on internal consistency (see page 124), and has been previously found to have the lowest test–retest reliability (Quenk, Hammer and Majors, 2004), which would result in the true correlations being underestimated.
These correlations are very similar to those found during the development of the Step II questionnaire. This consistency, alongside the fact that the correlations between Step II facet scales and Step I continuous scores associated with their own dimension are substantially higher than correlations with the other three dimensions, provides compelling evidence for the theoretical hierarchical structure of the Step II facet scales in relation to the Step I scales.
Out-of-preference scores
It is known that the five facet scales relating to each type dimension do not describe the dimension in its entirety; there will not be a precise and exact overlap between, for example, an individual’s score on E–I and their total score across the five facet scales that relate to this dimension. For example, it is not uncommon to see an Enthusiastic Introvert or an Intimate Extravert. Such apparent inconsistencies are usually known as ‘out-of-preference scores’ (OOPS).
Although it is usual to have a number of OOPS in any one profile, it should be unusual to find that OOPS make up more than half of the facet scores relating to any one type dichotomy. Table 6.5 demonstrates that the proportion of individuals for whom this occurs ranges from 2.6% for the S–N and T–F blocks to 0.9% for the E–I block. It is therefore a very infrequent occurrence.
Table 6.5: Proportion of OOPS by type dichotomy6
Proportion of ‘reported type’ OOPS None One Two Three Four Five
E–I 70.1% 23.0% 6.0% 0.9% 0.0% 0.0% S–N 60.5% 28.1% 8.8% 2.2% 0.4% 0.0% T–F 60.6% 28.3% 8.5% 2.1% 0.4% 0.1% J–P 60.9% 30.4% 7.7% 1.1% 0.0% 0.0%
For any individual facet scale, an OOPS tends to occur in approximately 10% of profiles, with the exception of Questioning–Accommodating where an OOPS occurs in approximately 20% of cases.
6 In this table, an OOPS is defined as a score of 2, 3, 4 or 5 on the ‘wrong’ pole of the facet when compared with the reported type.
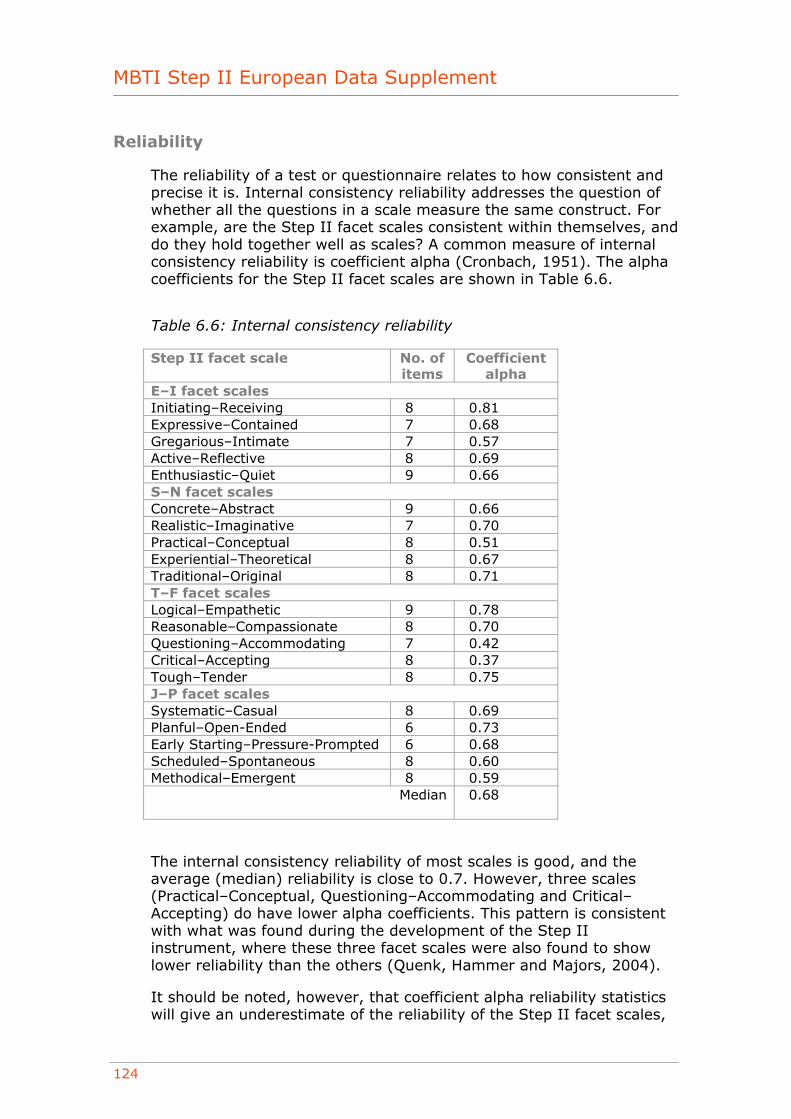
MBTI Step II European Data Supplement
124
Reliability
The reliability of a test or questionnaire relates to how consistent and precise it is. Internal consistency reliability addresses the question of whether all the questions in a scale measure the same construct. For example, are the Step II facet scales consistent within themselves, and do they hold together well as scales? A common measure of internal consistency reliability is coefficient alpha (Cronbach, 1951). The alpha coefficients for the Step II facet scales are shown in Table 6.6.
Table 6.6: Internal consistency reliability
Step II facet scale No. of items
Coefficient alpha
E–I facet scales Initiating–Receiving 8 0.81 Expressive–Contained 7 0.68 Gregarious–Intimate 7 0.57 Active–Reflective 8 0.69 Enthusiastic–Quiet 9 0.66 S–N facet scales Concrete–Abstract 9 0.66 Realistic–Imaginative 7 0.70 Practical–Conceptual 8 0.51 Experiential–Theoretical 8 0.67 Traditional–Original 8 0.71 T–F facet scales Logical–Empathetic 9 0.78 Reasonable–Compassionate 8 0.70 Questioning–Accommodating 7 0.42 Critical–Accepting 8 0.37 Tough–Tender 8 0.75 J–P facet scales Systematic–Casual 8 0.69 Planful–Open-Ended 6 0.73 Early Starting–Pressure-Prompted 6 0.68 Scheduled–Spontaneous 8 0.60 Methodical–Emergent 8 0.59
Median 0.68
The internal consistency reliability of most scales is good, and the average (median) reliability is close to 0.7. However, three scales (Practical–Conceptual, Questioning–Accommodating and Critical–Accepting) do have lower alpha coefficients. This pattern is consistent with what was found during the development of the Step II instrument, where these three facet scales were also found to show lower reliability than the others (Quenk, Hammer and Majors, 2004).
It should be noted, however, that coefficient alpha reliability statistics will give an underestimate of the reliability of the Step II facet scales,
Chapter 6: German
125
given the use of item response theory (IRT) methods in the actual scoring process.7
Group differences
This section looks at the way in which people from different groups responded to the German version of the European Step II questionnaire.
Gender
The means and standard deviations of the Step II facet scales are shown separately for males and females in Table 6.7, along with the difference in mean scores. This is represented graphically in Figure 6.2. Statistically significant differences were found between male and female mean scores for 14 of the 20 facet scales, with some consistent patterns emerging.
• On the E–I facet scales, all five mean scores tended slightly toward the E pole for both males and females. There was no consistent gender difference across the dimension, with females tending further towards the E pole than males on three facet scales, and males tending more towards the E pole than females on one facet scales. There was no significant difference between gender on the remaining facet scale.
• On the S–N facet scales, all five mean scores tended slightly toward the S pole for both males and females. There were statistically significant gender differences on two of the five facet scales, with male mean scores tending more towards the S pole than females.
• On the T–F facet scales, all five mean scores tended slightly toward the T pole for males, whereas three did so for females. There were statistically significant gender differences on four of the five facet scales, with male mean scores tending more towards the T pole than females.
• On the J–P facet scales, all five mean scores tended slightly toward the J pole for both males and females. There were statistically significant gender differences on four of the five facet scales, with male mean scores tending more towards the J pole than females.
7 Item response theory (IRT) is an approach to measurement that is concerned with modelling the relationship between item responses and the underlying characteristic assessed by the scale or test the item is designed to measure. IRT can be used to select items for a test and/or to score the items.
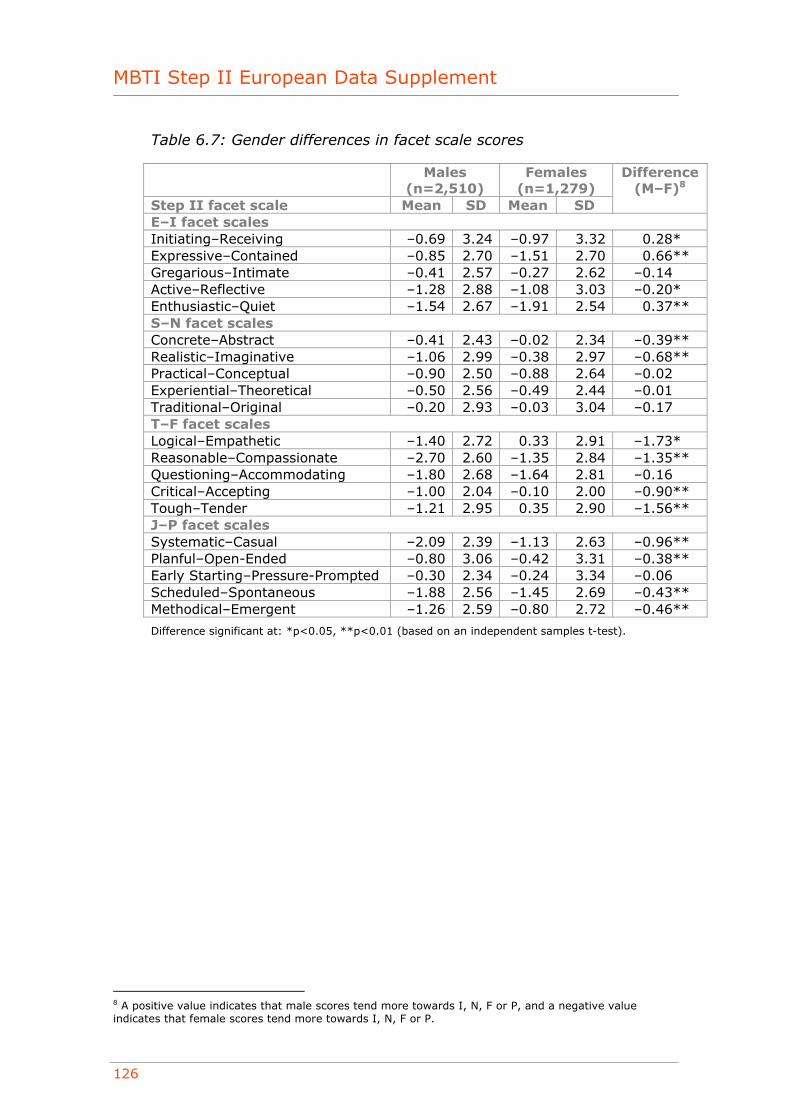
MBTI Step II European Data Supplement
126
Table 6.7: Gender differences in facet scale scores
Males (n=2,510)
Females (n=1,279)
Step II facet scale Mean SD Mean SD
Difference (M–F)8
E–I facet scales Initiating–Receiving –0.69 3.24 –0.97 3.32 0.28* Expressive–Contained –0.85 2.70 –1.51 2.70 0.66** Gregarious–Intimate –0.41 2.57 –0.27 2.62 –0.14 Active–Reflective –1.28 2.88 –1.08 3.03 –0.20* Enthusiastic–Quiet –1.54 2.67 –1.91 2.54 0.37** S–N facet scales Concrete–Abstract –0.41 2.43 –0.02 2.34 –0.39** Realistic–Imaginative –1.06 2.99 –0.38 2.97 –0.68** Practical–Conceptual –0.90 2.50 –0.88 2.64 –0.02 Experiential–Theoretical –0.50 2.56 –0.49 2.44 –0.01 Traditional–Original –0.20 2.93 –0.03 3.04 –0.17 T–F facet scales Logical–Empathetic –1.40 2.72 0.33 2.91 –1.73* Reasonable–Compassionate –2.70 2.60 –1.35 2.84 –1.35** Questioning–Accommodating –1.80 2.68 –1.64 2.81 –0.16 Critical–Accepting –1.00 2.04 –0.10 2.00 –0.90** Tough–Tender –1.21 2.95 0.35 2.90 –1.56** J–P facet scales Systematic–Casual –2.09 2.39 –1.13 2.63 –0.96** Planful–Open-Ended –0.80 3.06 –0.42 3.31 –0.38** Early Starting–Pressure-Prompted –0.30 2.34 –0.24 3.34 –0.06 Scheduled–Spontaneous –1.88 2.56 –1.45 2.69 –0.43** Methodical–Emergent –1.26 2.59 –0.80 2.72 –0.46**
Difference significant at: *p<0.05, **p<0.01 (based on an independent samples t-test).
8 A positive value indicates that male scores tend more towards I, N, F or P, and a negative value indicates that female scores tend more towards I, N, F or P.
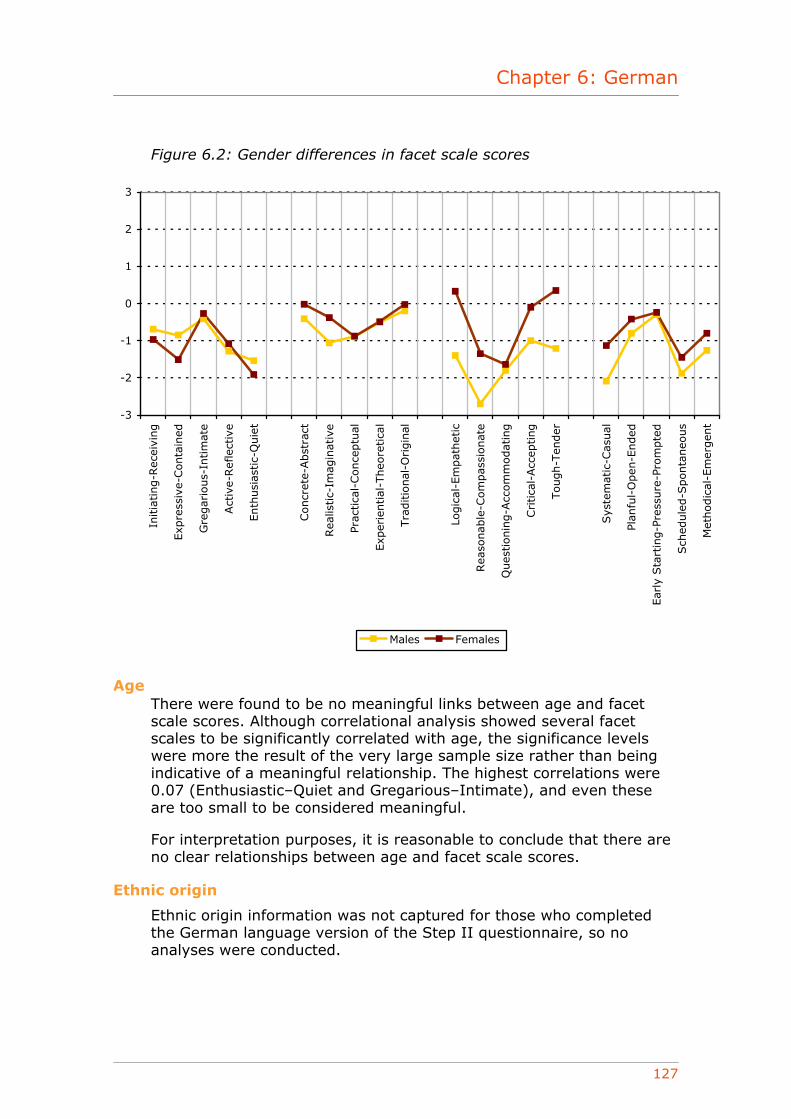
Chapter 6: German
127
Figure 6.2: Gender differences in facet scale scores
-3
-2
-1
0
1
2
3
Initia
ting-R
ecei
ving
Exp
ress
ive-
Conta
ined
Gre
gar
ious-
Intim
ate
Act
ive-
Ref
lect
ive
Enth
usi
astic-
Quie
t
Concr
ete-
Abst
ract
Rea
listic-
Imag
inat
ive
Prac
tica
l-Conce
ptu
al
Exp
erie
ntial
-Theo
retica
l
Tra
ditio
nal
-Origin
al
Logic
al-E
mpat
het
ic
Rea
sonab
le-C
om
pas
sionat
e
Ques
tionin
g-A
ccom
modat
ing
Critica
l-Acc
epting
Tough-T
ender
Sys
tem
atic
-Cas
ual
Plan
ful-
Open
-Ended
Ear
ly S
tart
ing-P
ress
ure
-Pro
mpte
d
Sch
edule
d-S
ponta
neo
us
Met
hodic
al-E
mer
gen
t
Males Females
Age
There were found to be no meaningful links between age and facet scale scores. Although correlational analysis showed several facet scales to be significantly correlated with age, the significance levels were more the result of the very large sample size rather than being indicative of a meaningful relationship. The highest correlations were 0.07 (Enthusiastic–Quiet and Gregarious–Intimate), and even these are too small to be considered meaningful.
For interpretation purposes, it is reasonable to conclude that there are no clear relationships between age and facet scale scores.
Ethnic origin
Ethnic origin information was not captured for those who completed the German language version of the Step II questionnaire, so no analyses were conducted.
MBTI Step II European Data Supplement
128
Occupational level
Research using the German version of the MBTI Step I questionnaire has demonstrated that individuals in higher-level jobs in organisations are more likely to have preferences for Extraversion and Thinking than those in lower-level jobs.9
Table 6.8 shows the facet scale means and standard deviation for different occupational levels. The findings can be summarised as follows:
• No clear pattern was found regarding the facets relating to the E–I dimension.
• A pattern was found regarding the facets relating to the S–N dimension. Mean facet scores amongst people at the top level tended to be further towards the N pole than those for the lower occupational level groups.
• A reasonably consistent pattern was found regarding the facets relating to the T–F dimension. Mean facet scores amongst the employee group mean scores were consistently further towards the F pole (or less towards the T pole) than any other groups. This could be a reflection of the fact that females formed a considerably higher proportion of the employee group than they did of other groups.
• There were no clear overall patterns regarding the facets in the J–P preference block.
9 See the MBTI Step I European Data Supplement for details.
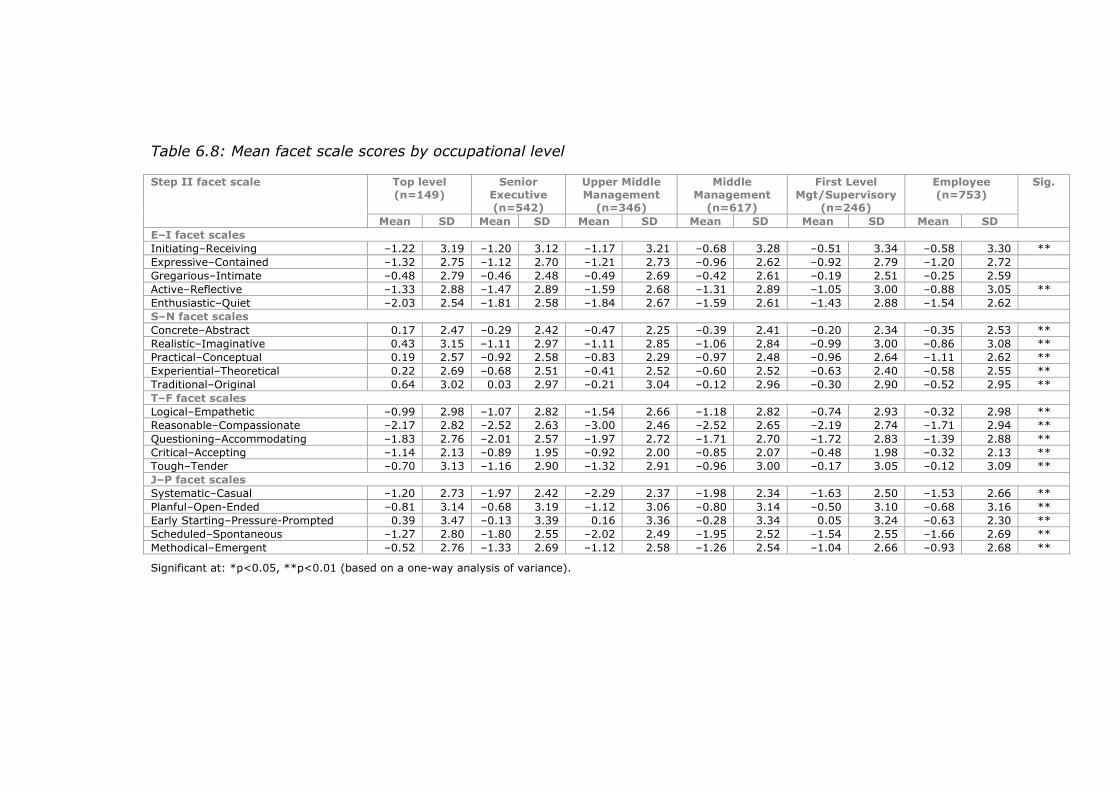
Table 6.8: Mean facet scale scores by occupational level
Top level (n=149)
Senior Executive (n=542)
Upper Middle Management
(n=346)
Middle Management
(n=617)
First Level Mgt/Supervisory
(n=246)
Employee (n=753)
Step II facet scale
Mean SD Mean SD Mean SD Mean SD Mean SD Mean SD
Sig.
E–I facet scales Initiating–Receiving –1.22 3.19 –1.20 3.12 –1.17 3.21 –0.68 3.28 –0.51 3.34 –0.58 3.30 ** Expressive–Contained –1.32 2.75 –1.12 2.70 –1.21 2.73 –0.96 2.62 –0.92 2.79 –1.20 2.72 Gregarious–Intimate –0.48 2.79 –0.46 2.48 –0.49 2.69 –0.42 2.61 –0.19 2.51 –0.25 2.59 Active–Reflective –1.33 2.88 –1.47 2.89 –1.59 2.68 –1.31 2.89 –1.05 3.00 –0.88 3.05 ** Enthusiastic–Quiet –2.03 2.54 –1.81 2.58 –1.84 2.67 –1.59 2.61 –1.43 2.88 –1.54 2.62 S–N facet scales Concrete–Abstract 0.17 2.47 –0.29 2.42 –0.47 2.25 –0.39 2.41 –0.20 2.34 –0.35 2.53 ** Realistic–Imaginative 0.43 3.15 –1.11 2.97 –1.11 2.85 –1.06 2.84 –0.99 3.00 –0.86 3.08 ** Practical–Conceptual 0.19 2.57 –0.92 2.58 –0.83 2.29 –0.97 2.48 –0.96 2.64 –1.11 2.62 ** Experiential–Theoretical 0.22 2.69 –0.68 2.51 –0.41 2.52 –0.60 2.52 –0.63 2.40 –0.58 2.55 ** Traditional–Original 0.64 3.02 0.03 2.97 –0.21 3.04 –0.12 2.96 –0.30 2.90 –0.52 2.95 ** T–F facet scales Logical–Empathetic –0.99 2.98 –1.07 2.82 –1.54 2.66 –1.18 2.82 –0.74 2.93 –0.32 2.98 ** Reasonable–Compassionate –2.17 2.82 –2.52 2.63 –3.00 2.46 –2.52 2.65 –2.19 2.74 –1.71 2.94 ** Questioning–Accommodating –1.83 2.76 –2.01 2.57 –1.97 2.72 –1.71 2.70 –1.72 2.83 –1.39 2.88 ** Critical–Accepting –1.14 2.13 –0.89 1.95 –0.92 2.00 –0.85 2.07 –0.48 1.98 –0.32 2.13 ** Tough–Tender –0.70 3.13 –1.16 2.90 –1.32 2.91 –0.96 3.00 –0.17 3.05 –0.12 3.09 ** J–P facet scales Systematic–Casual –1.20 2.73 –1.97 2.42 –2.29 2.37 –1.98 2.34 –1.63 2.50 –1.53 2.66 ** Planful–Open-Ended –0.81 3.14 –0.68 3.19 –1.12 3.06 –0.80 3.14 –0.50 3.10 –0.68 3.16 ** Early Starting–Pressure-Prompted 0.39 3.47 –0.13 3.39 0.16 3.36 –0.28 3.34 0.05 3.24 –0.63 2.30 ** Scheduled–Spontaneous –1.27 2.80 –1.80 2.55 –2.02 2.49 –1.95 2.52 –1.54 2.55 –1.66 2.69 ** Methodical–Emergent –0.52 2.76 –1.33 2.69 –1.12 2.58 –1.26 2.54 –1.04 2.66 –0.93 2.68 **
Significant at: *p<0.05, **p<0.01 (based on a one-way analysis of variance).
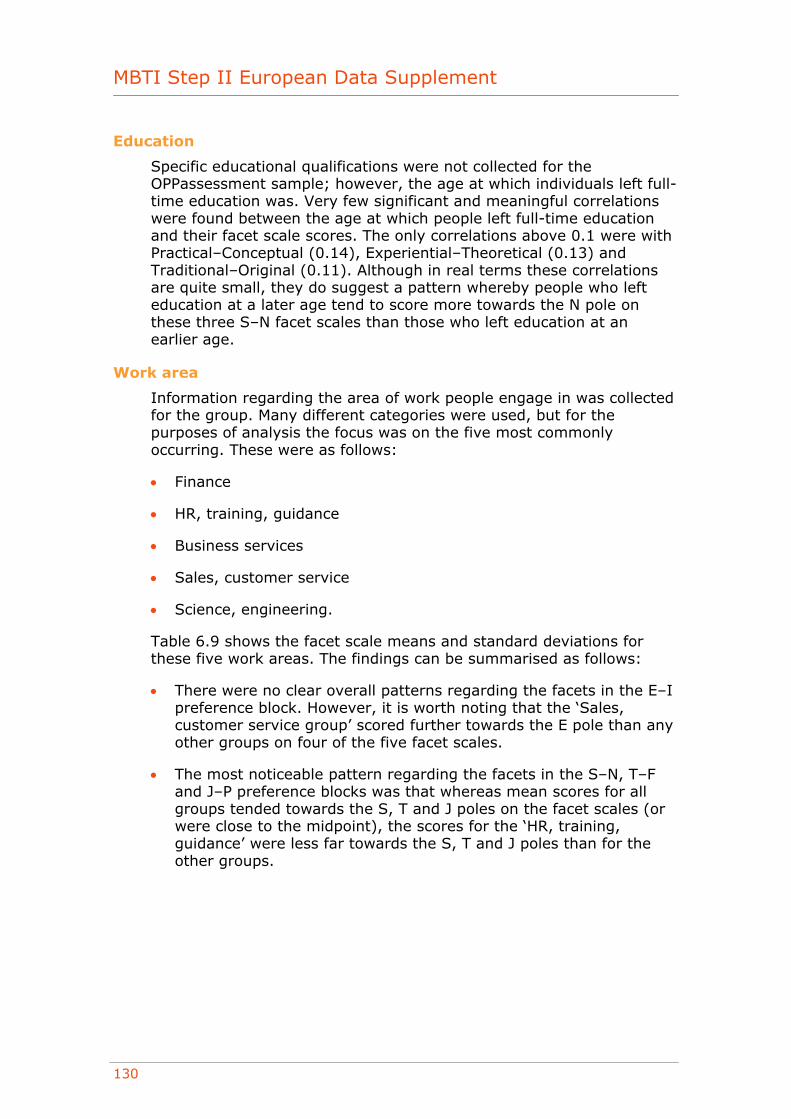
MBTI Step II European Data Supplement
130
Education
Specific educational qualifications were not collected for the OPPassessment sample; however, the age at which individuals left full-time education was. Very few significant and meaningful correlations were found between the age at which people left full-time education and their facet scale scores. The only correlations above 0.1 were with Practical–Conceptual (0.14), Experiential–Theoretical (0.13) and Traditional–Original (0.11). Although in real terms these correlations are quite small, they do suggest a pattern whereby people who left education at a later age tend to score more towards the N pole on these three S–N facet scales than those who left education at an earlier age.
Work area
Information regarding the area of work people engage in was collected for the group. Many different categories were used, but for the purposes of analysis the focus was on the five most commonly occurring. These were as follows:
• Finance
• HR, training, guidance
• Business services
• Sales, customer service
• Science, engineering.
Table 6.9 shows the facet scale means and standard deviations for these five work areas. The findings can be summarised as follows:
• There were no clear overall patterns regarding the facets in the E–I preference block. However, it is worth noting that the ‘Sales, customer service group’ scored further towards the E pole than any other groups on four of the five facet scales.
• The most noticeable pattern regarding the facets in the S–N, T–F and J–P preference blocks was that whereas mean scores for all groups tended towards the S, T and J poles on the facet scales (or were close to the midpoint), the scores for the ‘HR, training, guidance’ were less far towards the S, T and J poles than for the other groups.
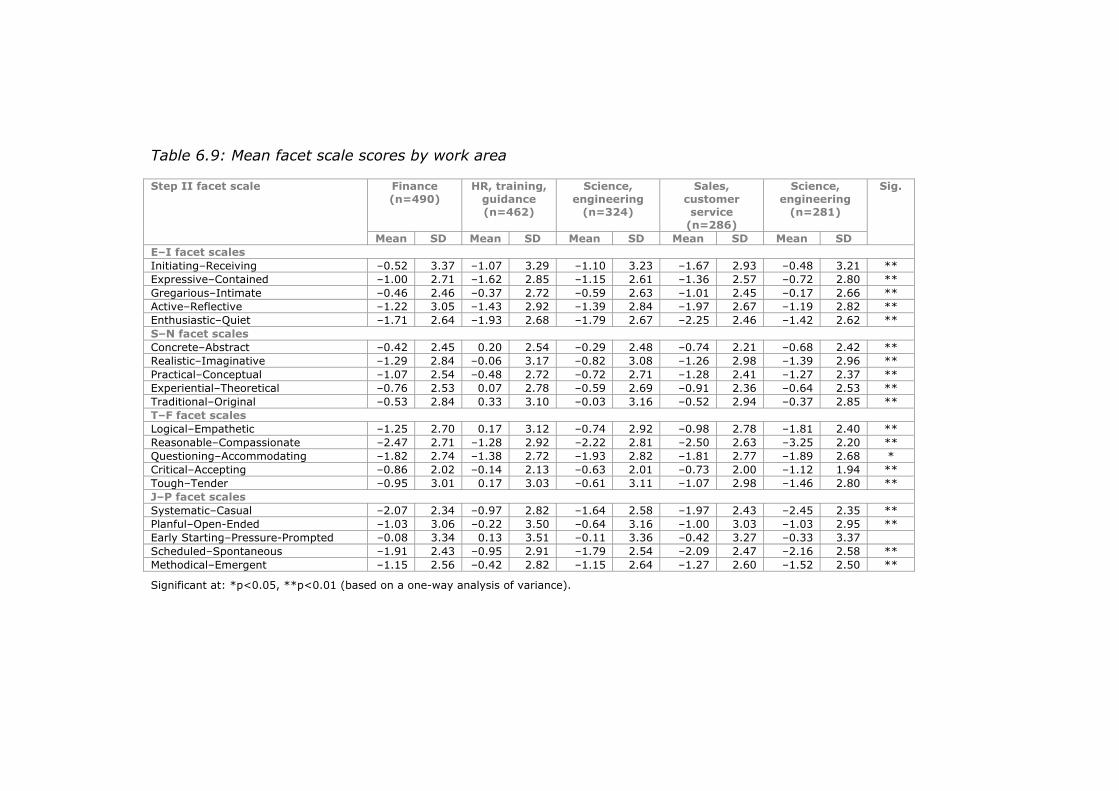
Table 6.9: Mean facet scale scores by work area
Finance (n=490)
HR, training, guidance (n=462)
Science, engineering
(n=324)
Sales, customer service
(n=286)
Science, engineering
(n=281)
Step II facet scale
Mean SD Mean SD Mean SD Mean SD Mean SD
Sig.
E–I facet scales Initiating–Receiving –0.52 3.37 –1.07 3.29 –1.10 3.23 –1.67 2.93 –0.48 3.21 ** Expressive–Contained –1.00 2.71 –1.62 2.85 –1.15 2.61 –1.36 2.57 –0.72 2.80 ** Gregarious–Intimate –0.46 2.46 –0.37 2.72 –0.59 2.63 –1.01 2.45 –0.17 2.66 ** Active–Reflective –1.22 3.05 –1.43 2.92 –1.39 2.84 –1.97 2.67 –1.19 2.82 ** Enthusiastic–Quiet –1.71 2.64 –1.93 2.68 –1.79 2.67 –2.25 2.46 –1.42 2.62 ** S–N facet scales Concrete–Abstract –0.42 2.45 0.20 2.54 –0.29 2.48 –0.74 2.21 –0.68 2.42 ** Realistic–Imaginative –1.29 2.84 –0.06 3.17 –0.82 3.08 –1.26 2.98 –1.39 2.96 ** Practical–Conceptual –1.07 2.54 –0.48 2.72 –0.72 2.71 –1.28 2.41 –1.27 2.37 ** Experiential–Theoretical –0.76 2.53 0.07 2.78 –0.59 2.69 –0.91 2.36 –0.64 2.53 ** Traditional–Original –0.53 2.84 0.33 3.10 –0.03 3.16 –0.52 2.94 –0.37 2.85 ** T–F facet scales Logical–Empathetic –1.25 2.70 0.17 3.12 –0.74 2.92 –0.98 2.78 –1.81 2.40 ** Reasonable–Compassionate –2.47 2.71 –1.28 2.92 –2.22 2.81 –2.50 2.63 –3.25 2.20 ** Questioning–Accommodating –1.82 2.74 –1.38 2.72 –1.93 2.82 –1.81 2.77 –1.89 2.68 * Critical–Accepting –0.86 2.02 –0.14 2.13 –0.63 2.01 –0.73 2.00 –1.12 1.94 ** Tough–Tender –0.95 3.01 0.17 3.03 –0.61 3.11 –1.07 2.98 –1.46 2.80 ** J–P facet scales Systematic–Casual –2.07 2.34 –0.97 2.82 –1.64 2.58 –1.97 2.43 –2.45 2.35 ** Planful–Open-Ended –1.03 3.06 –0.22 3.50 –0.64 3.16 –1.00 3.03 –1.03 2.95 ** Early Starting–Pressure-Prompted –0.08 3.34 0.13 3.51 –0.11 3.36 –0.42 3.27 –0.33 3.37 Scheduled–Spontaneous –1.91 2.43 –0.95 2.91 –1.79 2.54 –2.09 2.47 –2.16 2.58 ** Methodical–Emergent –1.15 2.56 –0.42 2.82 –1.15 2.64 –1.27 2.60 –1.52 2.50 **
Significant at: *p<0.05, **p<0.01 (based on a one-way analysis of variance).
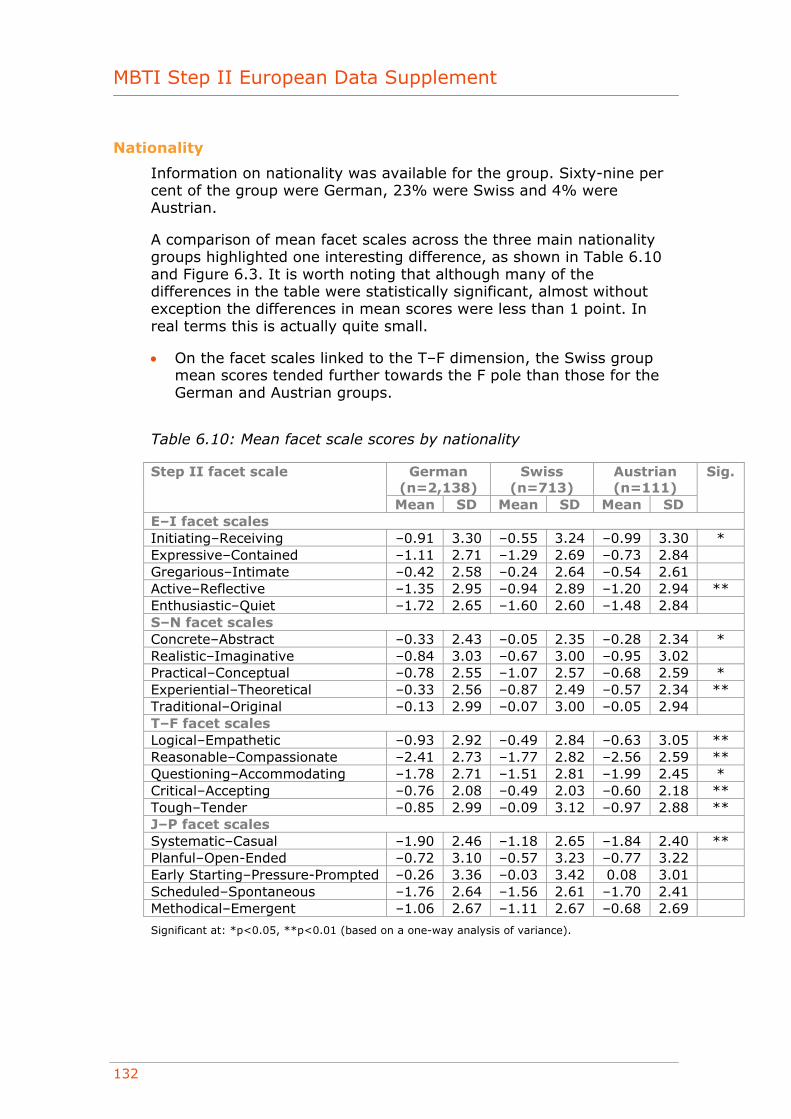
MBTI Step II European Data Supplement
132
Nationality
Information on nationality was available for the group. Sixty-nine per cent of the group were German, 23% were Swiss and 4% were Austrian.
A comparison of mean facet scales across the three main nationality groups highlighted one interesting difference, as shown in Table 6.10 and Figure 6.3. It is worth noting that although many of the differences in the table were statistically significant, almost without exception the differences in mean scores were less than 1 point. In real terms this is actually quite small.
• On the facet scales linked to the T–F dimension, the Swiss group mean scores tended further towards the F pole than those for the German and Austrian groups.
Table 6.10: Mean facet scale scores by nationality
German (n=2,138)
Swiss (n=713)
Austrian (n=111)
Step II facet scale
Mean SD Mean SD Mean SD
Sig.
E–I facet scales Initiating–Receiving –0.91 3.30 –0.55 3.24 –0.99 3.30 * Expressive–Contained –1.11 2.71 –1.29 2.69 –0.73 2.84 Gregarious–Intimate –0.42 2.58 –0.24 2.64 –0.54 2.61 Active–Reflective –1.35 2.95 –0.94 2.89 –1.20 2.94 ** Enthusiastic–Quiet –1.72 2.65 –1.60 2.60 –1.48 2.84 S–N facet scales Concrete–Abstract –0.33 2.43 –0.05 2.35 –0.28 2.34 * Realistic–Imaginative –0.84 3.03 –0.67 3.00 –0.95 3.02 Practical–Conceptual –0.78 2.55 –1.07 2.57 –0.68 2.59 * Experiential–Theoretical –0.33 2.56 –0.87 2.49 –0.57 2.34 ** Traditional–Original –0.13 2.99 –0.07 3.00 –0.05 2.94 T–F facet scales Logical–Empathetic –0.93 2.92 –0.49 2.84 –0.63 3.05 ** Reasonable–Compassionate –2.41 2.73 –1.77 2.82 –2.56 2.59 ** Questioning–Accommodating –1.78 2.71 –1.51 2.81 –1.99 2.45 * Critical–Accepting –0.76 2.08 –0.49 2.03 –0.60 2.18 ** Tough–Tender –0.85 2.99 –0.09 3.12 –0.97 2.88 ** J–P facet scales Systematic–Casual –1.90 2.46 –1.18 2.65 –1.84 2.40 ** Planful–Open-Ended –0.72 3.10 –0.57 3.23 –0.77 3.22 Early Starting–Pressure-Prompted –0.26 3.36 –0.03 3.42 0.08 3.01 Scheduled–Spontaneous –1.76 2.64 –1.56 2.61 –1.70 2.41 Methodical–Emergent –1.06 2.67 –1.11 2.67 –0.68 2.69
Significant at: *p<0.05, **p<0.01 (based on a one-way analysis of variance).
Chapter 6: German
133
Figure 6.3: Mean facet scale scores by nationality
-3
-2
-1
0
1
2
3
Initia
ting-R
ecei
ving
Exp
ress
ive-
Conta
ined
Gre
gar
ious-
Intim
ate
Act
ive-
Ref
lect
ive
Enth
usi
astic-
Quie
t
Concr
ete-
Abst
ract
Rea
listic-
Imag
inat
ive
Prac
tica
l-Conce
ptu
al
Exp
erie
ntial
-Theo
retica
l
Tra
ditio
nal
-Origin
al
Logic
al-E
mpat
het
ic
Rea
sonab
le-C
om
pas
sionat
e
Ques
tionin
g-A
ccom
modat
ing
Critica
l-Acc
epting
Tough-T
ender
Sys
tem
atic
-Cas
ual
Plan
ful-
Open
-Ended
Ear
ly S
tart
ing-P
ress
ure
-Pro
mpte
d
Sch
edule
d-S
ponta
neo
us
Met
hodic
al-E
mer
gen
t
German Swiss Austrian
Employment status
Employment status information was available for the OPPassessment sample. The vast majority of the group worked either full-time or part-time, or were self-employed. Table 6.11 shows the mean facet scale scores for each group, with the data illustrated in graphical form in Figure 6.4.
The analyses revealed statistically significant differences across the groups on all the facet scales on the S–N and J–P dimensions, four facets on the T–F dimension and one facet on the E–I dimension. The clearest patterns were as follows:
• There were no clear patterns regarding the facets in the E–I preference block.
• The self-employed group tended to score more towards the N pole on the S–N facet scales than the other two groups, and less towards the J pole on the J–P facet scales.
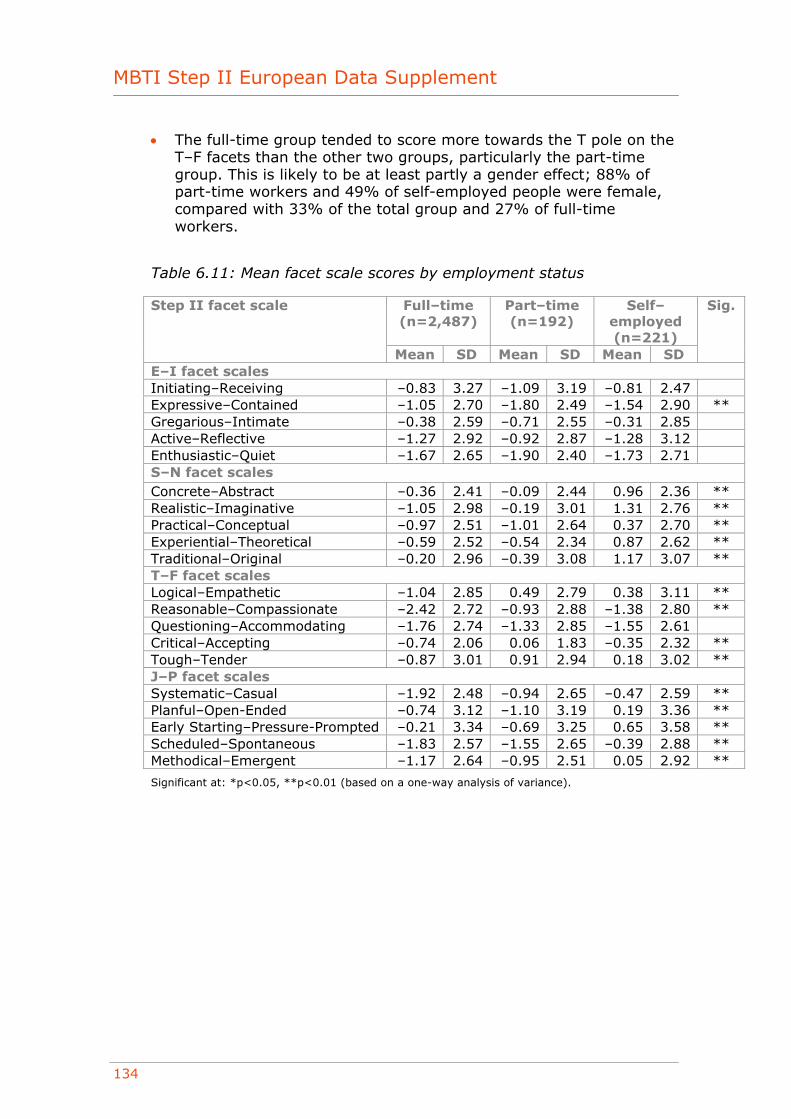
MBTI Step II European Data Supplement
134
• The full-time group tended to score more towards the T pole on the T–F facets than the other two groups, particularly the part-time group. This is likely to be at least partly a gender effect; 88% of part-time workers and 49% of self-employed people were female, compared with 33% of the total group and 27% of full-time workers.
Table 6.11: Mean facet scale scores by employment status
Full–time (n=2,487)
Part–time (n=192)
Self–employed (n=221)
Step II facet scale
Mean SD Mean SD Mean SD
Sig.
E–I facet scales Initiating–Receiving –0.83 3.27 –1.09 3.19 –0.81 2.47 Expressive–Contained –1.05 2.70 –1.80 2.49 –1.54 2.90 ** Gregarious–Intimate –0.38 2.59 –0.71 2.55 –0.31 2.85 Active–Reflective –1.27 2.92 –0.92 2.87 –1.28 3.12 Enthusiastic–Quiet –1.67 2.65 –1.90 2.40 –1.73 2.71 S–N facet scales Concrete–Abstract –0.36 2.41 –0.09 2.44 0.96 2.36 ** Realistic–Imaginative –1.05 2.98 –0.19 3.01 1.31 2.76 ** Practical–Conceptual –0.97 2.51 –1.01 2.64 0.37 2.70 ** Experiential–Theoretical –0.59 2.52 –0.54 2.34 0.87 2.62 ** Traditional–Original –0.20 2.96 –0.39 3.08 1.17 3.07 ** T–F facet scales Logical–Empathetic –1.04 2.85 0.49 2.79 0.38 3.11 ** Reasonable–Compassionate –2.42 2.72 –0.93 2.88 –1.38 2.80 ** Questioning–Accommodating –1.76 2.74 –1.33 2.85 –1.55 2.61 Critical–Accepting –0.74 2.06 0.06 1.83 –0.35 2.32 ** Tough–Tender –0.87 3.01 0.91 2.94 0.18 3.02 ** J–P facet scales Systematic–Casual –1.92 2.48 –0.94 2.65 –0.47 2.59 ** Planful–Open-Ended –0.74 3.12 –1.10 3.19 0.19 3.36 ** Early Starting–Pressure-Prompted –0.21 3.34 –0.69 3.25 0.65 3.58 ** Scheduled–Spontaneous –1.83 2.57 –1.55 2.65 –0.39 2.88 ** Methodical–Emergent –1.17 2.64 –0.95 2.51 0.05 2.92 **
Significant at: *p<0.05, **p<0.01 (based on a one-way analysis of variance).
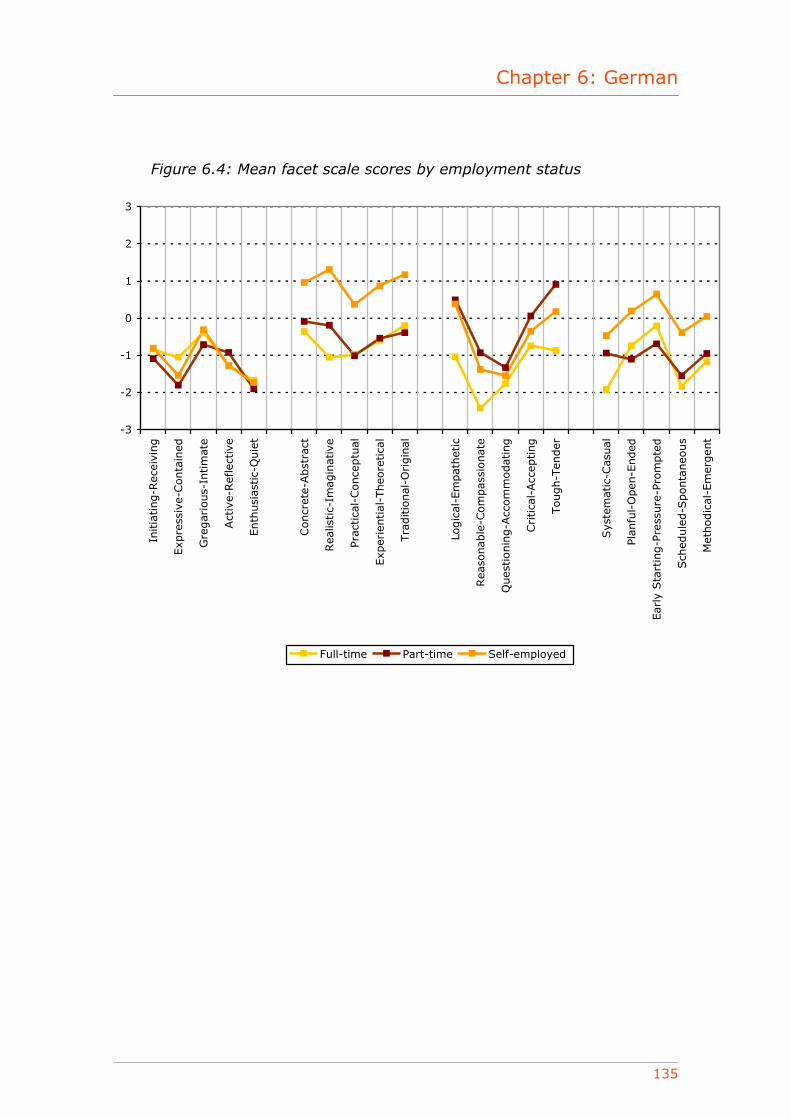
Chapter 6: German
135
Figure 6.4: Mean facet scale scores by employment status
-3
-2
-1
0
1
2
3
Initia
ting-R
ecei
ving
Exp
ress
ive-
Conta
ined
Gre
gar
ious-
Intim
ate
Act
ive-
Ref
lect
ive
Enth
usi
astic-
Quie
t
Concr
ete-
Abst
ract
Rea
listic-
Imag
inat
ive
Prac
tica
l-Conce
ptu
al
Exp
erie
ntial
-Theo
retica
l
Tra
ditio
nal
-Origin
al
Logic
al-E
mpat
het
ic
Rea
sonab
le-C
om
pas
sionat
e
Ques
tionin
g-A
ccom
modat
ing
Critica
l-Acc
epting
Tough-T
ender
Sys
tem
atic
-Cas
ual
Plan
ful-
Open
-Ended
Ear
ly S
tart
ing-P
ress
ure
-Pro
mpte
d
Sch
edule
d-S
ponta
neo
us
Met
hodic
al-E
mer
gen
t
Full-time Part-time Self-employed
MBTI Step II European Data Supplement
136
Appendix 1: Sample description
Sample 1: Data from OPPassessment (representative German-speaking professional and managerial sample)
This sample consists of 3,792 individuals who completed the MBTI Step II instrument in German via the OPPassessment system between October 2003 and June 2008. Sixty-six per cent of the respondents were male and 34% were female. Age ranged from 16 to 67 years, with a mean and median of 40.
Nationality was disclosed by 81% of respondents. Of these, 69% were German, 23% were Swiss and 4% were Austrian. Many other nationalities were represented, but each one formed less than 1% of the total group:
Nationality Percentage German 68.8% Swiss 22.9% Austrian 3.6% Other 4.7%
The majority of the group were in full-time employment:
Employment status Percentage Full-time 85.3% Self-employed 7.6% Part-time 6.6% Unemployed 0.2% Retired 0.2% Homemaker 0.1%
The majority of the group were of managerial level or above, although the largest single group was employee (27%):
Occupational level Percentage Top level 5.4% Senior executive 19.5% Upper middle management 12.5% Middle management 22.3% First level management/supervisor
8.9%
Employee 27.2% Other 4.3%
Chapter 6: German
137
A range of work areas were represented:
Work area (job type) Percentage Finance 17.5% HR, training, guidance 16.5% Business services 11.6% Sales, customer service 10.2% Science, engineering 10.0% IT 7.4% Research and development 4.9% Education 3.4% Health, social services, etc. 2.5% Admin or secretarial 2.4% Land, sea or air transport 0.4% Skilled operative 0.2% Leisure, personal service 0.1% Other private sector 1.0% Other public sector 0.3% Other 11.5%

MBTI Step II European Data Supplement
138

Chapter 7: Italian
139
European Data Supplement Italian
January 2009
OPP Ltd Elsfield Hall
15–17 Elsfield Way Oxford OX2 8EP
UK t: +44 (0)845 603 9958 f: +44 (0)1865 557483
MBTI® Step II instrument

MBTI Step II European Data Supplement
140
Contents
Introduction ........................................................................... 141 Type distribution ..................................................................... 142
OPPassessment data (representative Italian-speaking professional and managerial sample).................................................... 143
Properties of the Step II facet scales .......................................... 144 Facet scale score distribution................................................. 144 Facet scale intercorrelations .................................................. 146 Correlations of Step II facet scales with Step I scales................ 148 Out-of-preference scores ...................................................... 149 Reliability ........................................................................... 150 Group differences ................................................................ 151
Appendix 1: Sample description ................................................ 158 Sample 1: Data from OPPassessment (representative Italian-
speaking professional and managerial sample) ..................... 158
© Copyright 2009 OPP Ltd. All rights reserved.
No portion of this publication may be translated or reproduced in whole or in part, stored in a retrieval system, or transmitted in any form or by any means (electronic, mechanical, photocopying, recording or otherwise) without the prior written permission of the copyright owner. No part of this publication is reproducible under any photocopying licence scheme. OPP Ltd grants the downloader a personal, non-transferable, perpetual, irrevocable right to use the Supplement. The European Data Supplement (‘the Supplement’) is for personal use only and may not be sold on or circulated to third parties.
® MBTI, Myers-Briggs, the Myers-Briggs Type Indicator and the MBTI logo are registered trade marks of the Myers-Briggs Type Indicator Trust. OPP is licensed to use the trade marks in Europe.
® OPP is a registered trade mark of OPP Ltd in the European Community.
Chapter 7: Italian
141
Introduction
Data collected for the European MBTI Step II instrument were analysed to produce the findings in this supplement. This is the first data supplement produced for this instrument, and contains all the data gathered to date since the launch of the instrument in 2003. A brief description of the sample is given below. Further details of the sample are provided in Appendix 1.
• The sample consisted of 149 individuals who completed the MBTI Step II questionnaire in Italian via the OPPassessment system between 2003 and mid-2008.1 This sample is considered to be representative of the groups of people with whom the Italian MBTI Step II instrument has been and will be used for applications such as management development, coaching, counselling and teambuilding. As such, it is likely to represent a cross-section of the Italian-speaking professional and managerial population.
The results of the analyses are outlined below.
1 OPPassessment allows personality questionnaires such as the MBTI instrument to be administered via email and/or completed online.
MBTI Step II European Data Supplement
142
Type distribution
Type tables are a way of illustrating the proportion of each type within a particular group. Below is a type table taken from the sample described on the previous page.
For each of the 16 different types, the number of cases, the percentage of the total that this represents and the self-selection ratio (SSR) are shown. The SSR (Myers et al., 1998) is a way of demonstrating whether a given type appears more or less often in a particular group than would be expected given its frequency in a reference group. Ideally, the type distribution from a large representative sample of the Italian population would be used to calculate SSRs in this data supplement. However, such a sample does not currently exist. In its place, SSRs have been calculated using type data from the UK general population (Kendall, 1998), which can be justified by the fact that type distributions for comparable Italian and British groups, such as managers and professionals, are similar. Evidence (eg Hackston and Kendall, 2004; Quenk et al, 2004) does suggest that although type-related behaviours vary a good deal from country to country and from culture to culture, the frequencies of underlying MBTI types do not.
An SSR of greater than 1 indicates that a type is over-represented, and an SSR of less than 1 denotes that it is under-represented. Asterisks are used to denote whether the over- or under-representations are statistically significant, based on the results of chi-square analysis.2
2 Chi-square analysis (often abbreviated to χ2) is a technique used to explore whether observed frequency distributions differ significantly from other, predefined, distributions. In this case, the UK general population group is used as the reference group, and the chi-square analysis indicates whether the proportion of people of each type within a particular sample differs significantly from the proportion of people reporting the same type within the reference group.
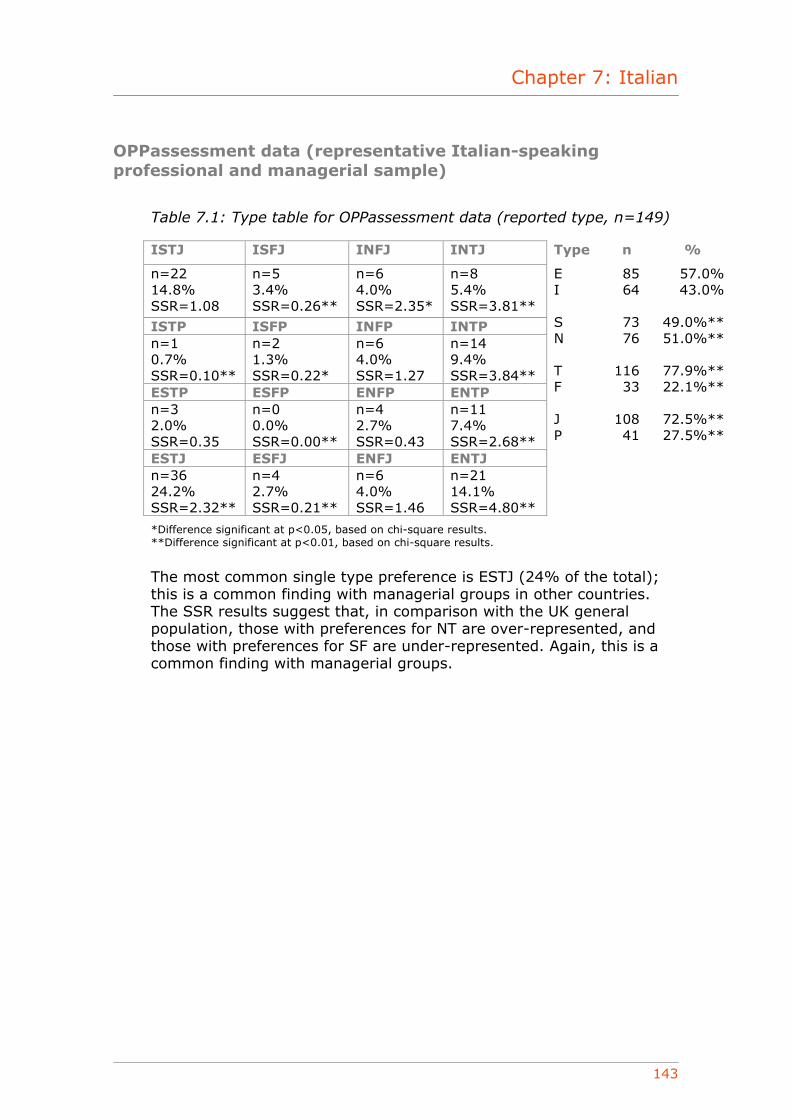
Chapter 7: Italian
143
OPPassessment data (representative Italian-speaking professional and managerial sample)
Table 7.1: Type table for OPPassessment data (reported type, n=149)
ISTJ ISFJ INFJ INTJ Type n %
n=22 14.8% SSR=1.08
n=5 3.4% SSR=0.26**
n=6 4.0% SSR=2.35*
n=8 5.4% SSR=3.81**
ISTP ISFP INFP INTP n=1 0.7% SSR=0.10**
n=2 1.3% SSR=0.22*
n=6 4.0% SSR=1.27
n=14 9.4% SSR=3.84**
ESTP ESFP ENFP ENTP n=3 2.0% SSR=0.35
n=0 0.0% SSR=0.00**
n=4 2.7% SSR=0.43
n=11 7.4% SSR=2.68**
ESTJ ESFJ ENFJ ENTJ n=36 24.2% SSR=2.32**
n=4 2.7% SSR=0.21**
n=6 4.0% SSR=1.46
n=21 14.1% SSR=4.80**
E I S N T F J P
85 64
73 76
116 33
108 41
57.0% 43.0%
49.0%** 51.0%**
77.9%** 22.1%**
72.5%** 27.5%**
*Difference significant at p<0.05, based on chi-square results. **Difference significant at p<0.01, based on chi-square results.
The most common single type preference is ESTJ (24% of the total); this is a common finding with managerial groups in other countries. The SSR results suggest that, in comparison with the UK general population, those with preferences for NT are over-represented, and those with preferences for SF are under-represented. Again, this is a common finding with managerial groups.
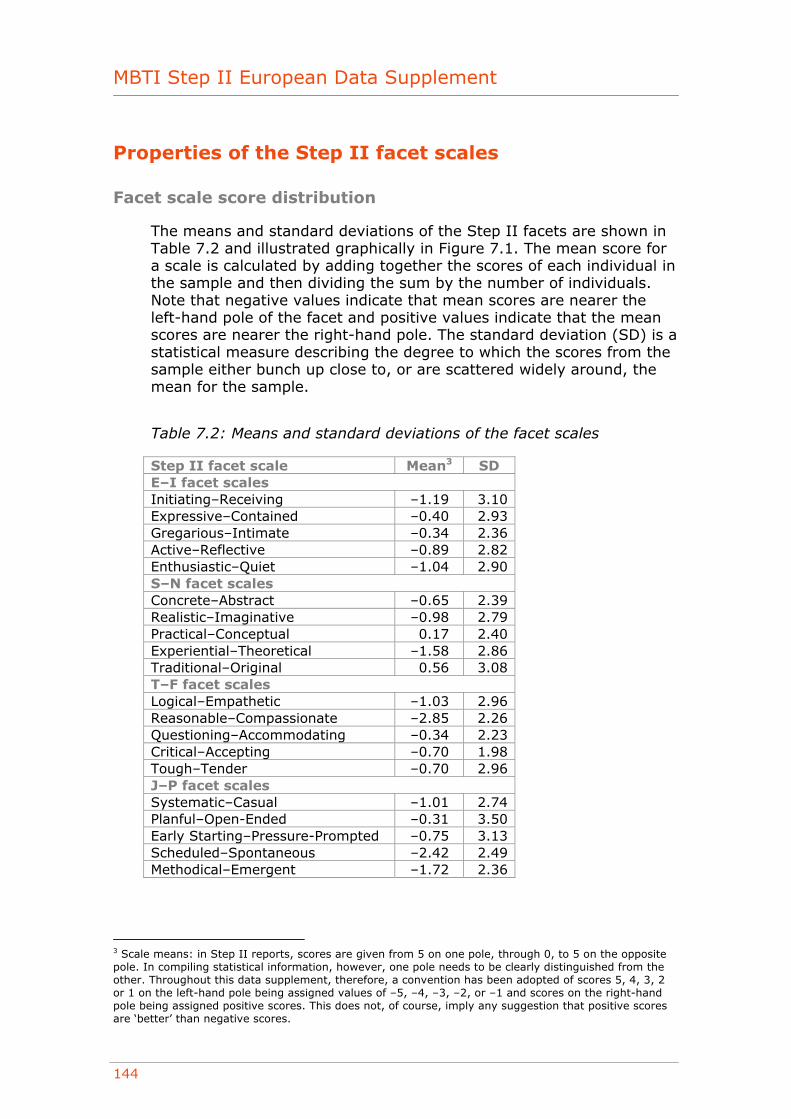
MBTI Step II European Data Supplement
144
Properties of the Step II facet scales
Facet scale score distribution
The means and standard deviations of the Step II facets are shown in Table 7.2 and illustrated graphically in Figure 7.1. The mean score for a scale is calculated by adding together the scores of each individual in the sample and then dividing the sum by the number of individuals. Note that negative values indicate that mean scores are nearer the left-hand pole of the facet and positive values indicate that the mean scores are nearer the right-hand pole. The standard deviation (SD) is a statistical measure describing the degree to which the scores from the sample either bunch up close to, or are scattered widely around, the mean for the sample.
Table 7.2: Means and standard deviations of the facet scales
Step II facet scale Mean3 SD E–I facet scales Initiating–Receiving –1.19 3.10 Expressive–Contained –0.40 2.93 Gregarious–Intimate –0.34 2.36 Active–Reflective –0.89 2.82 Enthusiastic–Quiet –1.04 2.90 S–N facet scales Concrete–Abstract –0.65 2.39 Realistic–Imaginative –0.98 2.79 Practical–Conceptual 0.17 2.40 Experiential–Theoretical –1.58 2.86 Traditional–Original 0.56 3.08 T–F facet scales Logical–Empathetic –1.03 2.96 Reasonable–Compassionate –2.85 2.26 Questioning–Accommodating –0.34 2.23 Critical–Accepting –0.70 1.98 Tough–Tender –0.70 2.96 J–P facet scales Systematic–Casual –1.01 2.74 Planful–Open-Ended –0.31 3.50 Early Starting–Pressure-Prompted –0.75 3.13 Scheduled–Spontaneous –2.42 2.49 Methodical–Emergent –1.72 2.36
3 Scale means: in Step II reports, scores are given from 5 on one pole, through 0, to 5 on the opposite pole. In compiling statistical information, however, one pole needs to be clearly distinguished from the other. Throughout this data supplement, therefore, a convention has been adopted of scores 5, 4, 3, 2 or 1 on the left-hand pole being assigned values of –5, –4, –3, –2, or –1 and scores on the right-hand pole being assigned positive scores. This does not, of course, imply any suggestion that positive scores are ‘better’ than negative scores.
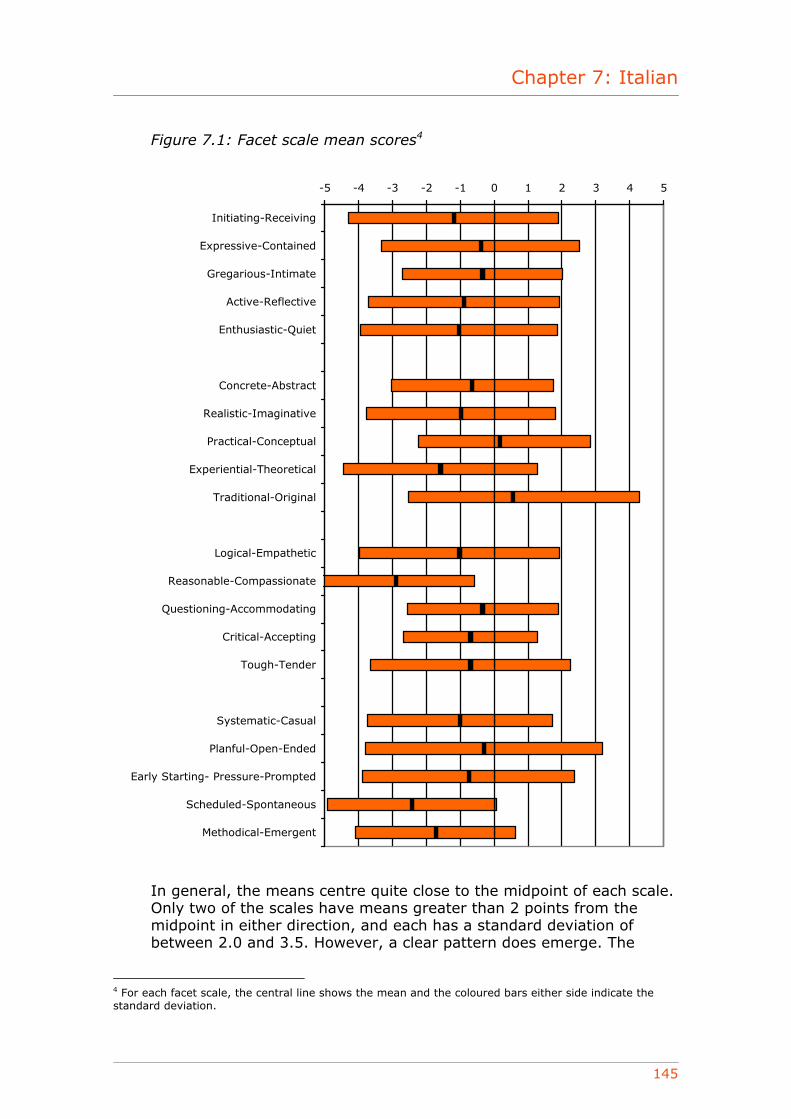
Chapter 7: Italian
145
Figure 7.1: Facet scale mean scores4
-5 -4 -3 -2 -1 0 1 2 3 4 5
Initiating-Receiving
Expressive-Contained
Gregarious-Intimate
Active-Reflective
Enthusiastic-Quiet
Concrete-Abstract
Realistic-Imaginative
Practical-Conceptual
Experiential-Theoretical
Traditional-Original
Logical-Empathetic
Reasonable-Compassionate
Questioning-Accommodating
Critical-Accepting
Tough-Tender
Systematic-Casual
Planful-Open-Ended
Early Starting- Pressure-Prompted
Scheduled-Spontaneous
Methodical-Emergent
In general, the means centre quite close to the midpoint of each scale. Only two of the scales have means greater than 2 points from the midpoint in either direction, and each has a standard deviation of between 2.0 and 3.5. However, a clear pattern does emerge. The
4 For each facet scale, the central line shows the mean and the coloured bars either side indicate the standard deviation.
MBTI Step II European Data Supplement
146
mean scores tend towards the E, S, T and J direction, which is consistent with the most common four-letter type preference amongst this sample. Amongst the group as a whole, there are more individuals with a preference for E, T and J, and the distribution on S–N is nearly equal.
Facet scale intercorrelations
Correlations among the Step II facet scales are shown in Table 7.3. Facet scales within each dichotomy usually correlate more highly (often substantially so) with the other scales of the same dichotomy than they do with scales in the other three dichotomies. For example, every E–I facet scale correlates more highly with the other four E–I scales than with any of the S–N, T–F or J–P facet scales.
There is only one scale that correlates significantly more highly with scales in other dichotomies. The T–F scale Questioning–Accommodating correlates with many scales, across dichotomies. For example, it correlates at a level of –0.17 with Early Starting–Pressure-Prompted, at 0.14 with Gregarious–Intimate and Enthusiastic–Quiet, and at between –0.14 and –0.24 with all of the S–N scales. By way of comparison, it correlates at between –0.06 and 0.14 with the other four scales on the same dichotomy as itself (T–F). The negative correlations between Questioning–Accommodating and the S–N scales are consistent with findings with the US version of the Step II instrument, and suggest that a questioning approach to differences of opinion seems to be related to a range of Intuitive (N) facets. These patterns are similar to those found when the European Step II instrument was developed.

Table 7.3: Intercorrelations of Step II facet scales
1 2 3 4 5 6 7 8 9 10 11 12 13 14 15 16 17 18 19 20 1. Initiating– Receiving
1.00
2. Expressive– Contained
0.48 1.00
3. Gregarious– Intimate
0.50 0.36 1.00
4. Active– Reflective
0.70 0.35 0.39 1.00
5. Enthusiastic– Quiet
0.58 0.42 0.53 0.57 1.00
6. Concrete– Abstract
0.02 –0.00 0.07 0.05 –0.06 1.00
7. Realistic– Imaginative
–0.09 –0.20 –0.12 –0.15 –0.27 0.61 1.00
8. Practical– Conceptual
–0.02 –0.06 –0.12 –0.07 –0.18 0.61 0.59 1.00
9. Experiential– Theoretical
0.10 0.11 0.08 0.08 0.09 0.55 0.44 0.45 1.00
10. Traditional– Original
–0.14 –0.12 –0.12 –0.19 –0.27 0.50 0.64 0.55 0.31 1.00
11. Logical– Empathetic
0.05 –0.15 0.02 0.19 0.07 0.22 0.33 0.24 0.19 0.22 1.00
12. Reasonable– Compassionate
0.12 –0.11 0.08 0.14 0.02 0.30 0.32 0.23 0.29 0.22 0.54 1.00
13. Questioning– Accommodating
0.12 0.03 0.14 0.10 0.14 –0.22 –0.14 –0.20 –0.21 –0.24 0.04 –0.06 1.00
14. Critical– Accepting
–0.03 –0.12 0.01 0.09 0.09 0.22 0.09 –0.01 0.01 0.07 0.38 0.31 0.08 1.00
15. Tough– Tender
0.12 –0.10 0.09 0.21 0.07 0.31 0.30 0.11 0.21 0.12 0.51 0.52 0.14 0.42 1.00
16. Systematic– Casual
0.02 –0.07 0.03 0.01 –0.04 0.51 0.53 0.44 0.27 0.60 0.41 0.32 –0.08 0.20 0.28 1.00
17. Planful– Open-Ended
0.21 0.06 0.11 0.07 0.09 0.45 0.35 0.39 0.29 0.50 0.16 0.19 –0.08 0.05 0.08 0.58 1.00
18. Early Starting– Pressure-Prompted
0.18 0.11 0.05 –0.02 –0.02 0.27 0.34 0.39 0.23 0.36 0.00 0.13 –0.17 –0.19 –0.00 0.39 0.46 1.00
19. Scheduled– Spontaneous
0.16 0.05 0.07 0.05 –0.00 0.42 0.47 0.42 0.24 0.53 0.19 0.20 –0.06 0.04 0.09 0.59 0.64 0.49 1.00
20. Methodical– Emergent
0.17 0.10 0.00 0.15 0.08 0.25 0.20 0.24 0.07 0.18 0.22 0.16 0.07 –0.02 0.10 0.48 0.53 0.44 0.48 1.00
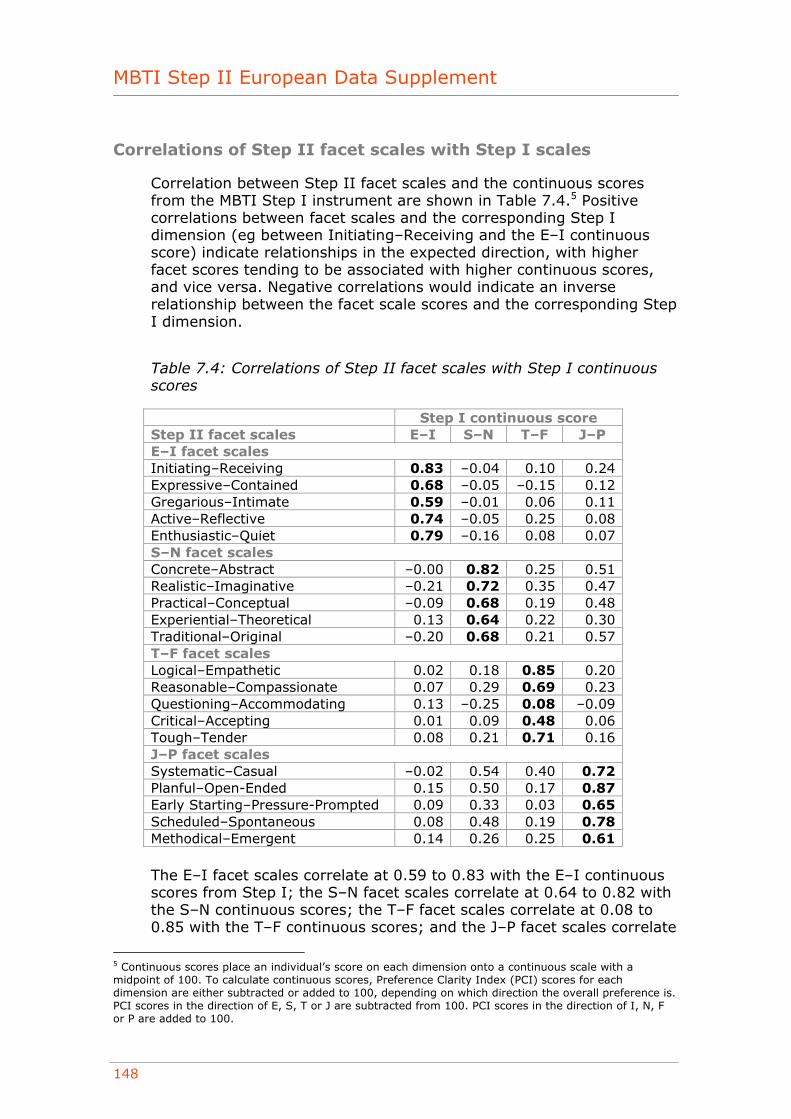
MBTI Step II European Data Supplement
148
Correlations of Step II facet scales with Step I scales
Correlation between Step II facet scales and the continuous scores from the MBTI Step I instrument are shown in Table 7.4.5 Positive correlations between facet scales and the corresponding Step I dimension (eg between Initiating–Receiving and the E–I continuous score) indicate relationships in the expected direction, with higher facet scores tending to be associated with higher continuous scores, and vice versa. Negative correlations would indicate an inverse relationship between the facet scale scores and the corresponding Step I dimension.
Table 7.4: Correlations of Step II facet scales with Step I continuous scores
Step I continuous score Step II facet scales E–I S–N T–F J–P E–I facet scales Initiating–Receiving 0.83 –0.04 0.10 0.24 Expressive–Contained 0.68 –0.05 –0.15 0.12 Gregarious–Intimate 0.59 –0.01 0.06 0.11 Active–Reflective 0.74 –0.05 0.25 0.08 Enthusiastic–Quiet 0.79 –0.16 0.08 0.07 S–N facet scales Concrete–Abstract –0.00 0.82 0.25 0.51 Realistic–Imaginative –0.21 0.72 0.35 0.47 Practical–Conceptual –0.09 0.68 0.19 0.48 Experiential–Theoretical 0.13 0.64 0.22 0.30 Traditional–Original –0.20 0.68 0.21 0.57 T–F facet scales Logical–Empathetic 0.02 0.18 0.85 0.20 Reasonable–Compassionate 0.07 0.29 0.69 0.23 Questioning–Accommodating 0.13 –0.25 0.08 –0.09 Critical–Accepting 0.01 0.09 0.48 0.06 Tough–Tender 0.08 0.21 0.71 0.16 J–P facet scales Systematic–Casual –0.02 0.54 0.40 0.72 Planful–Open-Ended 0.15 0.50 0.17 0.87 Early Starting–Pressure-Prompted 0.09 0.33 0.03 0.65 Scheduled–Spontaneous 0.08 0.48 0.19 0.78 Methodical–Emergent 0.14 0.26 0.25 0.61
The E–I facet scales correlate at 0.59 to 0.83 with the E–I continuous scores from Step I; the S–N facet scales correlate at 0.64 to 0.82 with the S–N continuous scores; the T–F facet scales correlate at 0.08 to 0.85 with the T–F continuous scores; and the J–P facet scales correlate
5 Continuous scores place an individual’s score on each dimension onto a continuous scale with a midpoint of 100. To calculate continuous scores, Preference Clarity Index (PCI) scores for each dimension are either subtracted or added to 100, depending on which direction the overall preference is. PCI scores in the direction of E, S, T or J are subtracted from 100. PCI scores in the direction of I, N, F or P are added to 100.
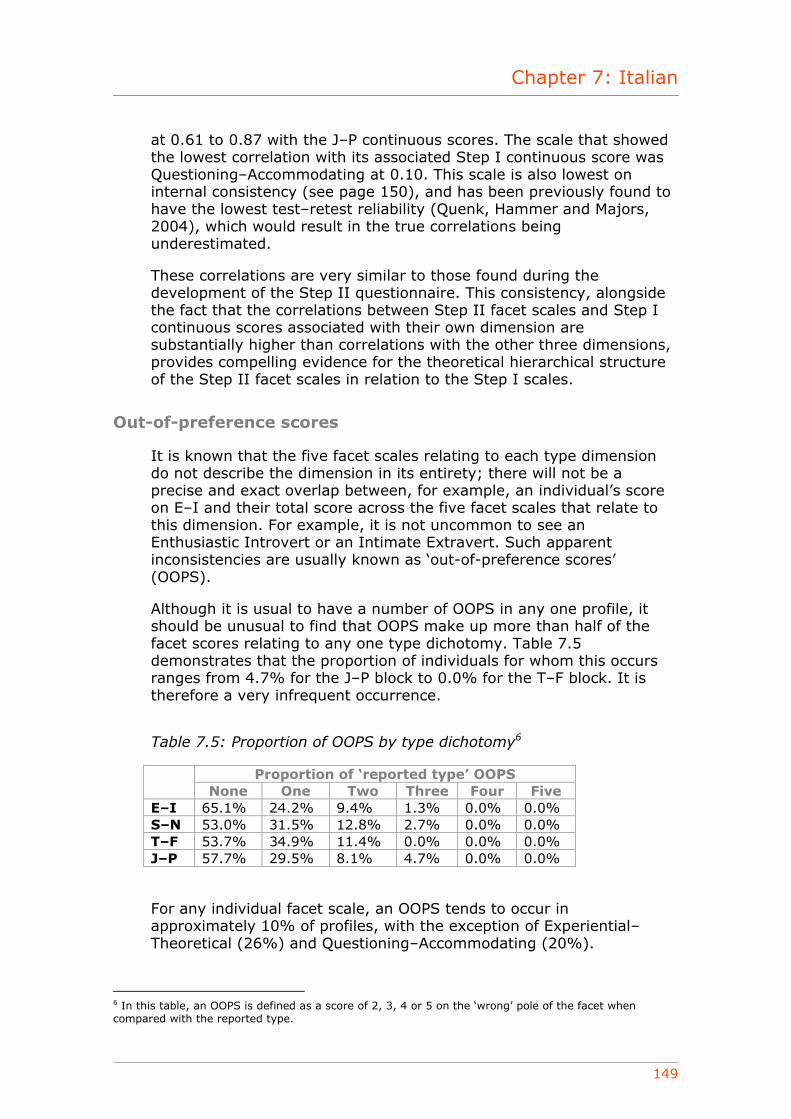
Chapter 7: Italian
149
at 0.61 to 0.87 with the J–P continuous scores. The scale that showed the lowest correlation with its associated Step I continuous score was Questioning–Accommodating at 0.10. This scale is also lowest on internal consistency (see page 150), and has been previously found to have the lowest test–retest reliability (Quenk, Hammer and Majors, 2004), which would result in the true correlations being underestimated.
These correlations are very similar to those found during the development of the Step II questionnaire. This consistency, alongside the fact that the correlations between Step II facet scales and Step I continuous scores associated with their own dimension are substantially higher than correlations with the other three dimensions, provides compelling evidence for the theoretical hierarchical structure of the Step II facet scales in relation to the Step I scales.
Out-of-preference scores
It is known that the five facet scales relating to each type dimension do not describe the dimension in its entirety; there will not be a precise and exact overlap between, for example, an individual’s score on E–I and their total score across the five facet scales that relate to this dimension. For example, it is not uncommon to see an Enthusiastic Introvert or an Intimate Extravert. Such apparent inconsistencies are usually known as ‘out-of-preference scores’ (OOPS).
Although it is usual to have a number of OOPS in any one profile, it should be unusual to find that OOPS make up more than half of the facet scores relating to any one type dichotomy. Table 7.5 demonstrates that the proportion of individuals for whom this occurs ranges from 4.7% for the J–P block to 0.0% for the T–F block. It is therefore a very infrequent occurrence.
Table 7.5: Proportion of OOPS by type dichotomy6
Proportion of ‘reported type’ OOPS None One Two Three Four Five
E–I 65.1% 24.2% 9.4% 1.3% 0.0% 0.0% S–N 53.0% 31.5% 12.8% 2.7% 0.0% 0.0% T–F 53.7% 34.9% 11.4% 0.0% 0.0% 0.0% J–P 57.7% 29.5% 8.1% 4.7% 0.0% 0.0%
For any individual facet scale, an OOPS tends to occur in approximately 10% of profiles, with the exception of Experiential–Theoretical (26%) and Questioning–Accommodating (20%).
6 In this table, an OOPS is defined as a score of 2, 3, 4 or 5 on the ‘wrong’ pole of the facet when compared with the reported type.
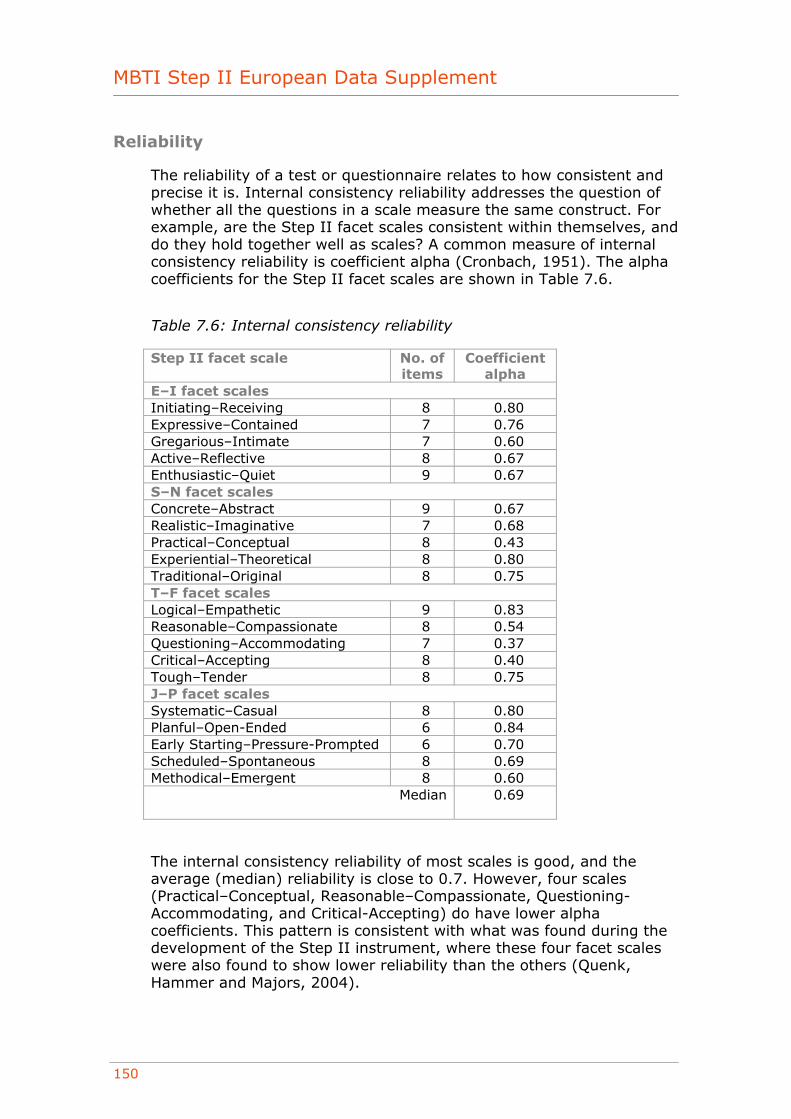
MBTI Step II European Data Supplement
150
Reliability
The reliability of a test or questionnaire relates to how consistent and precise it is. Internal consistency reliability addresses the question of whether all the questions in a scale measure the same construct. For example, are the Step II facet scales consistent within themselves, and do they hold together well as scales? A common measure of internal consistency reliability is coefficient alpha (Cronbach, 1951). The alpha coefficients for the Step II facet scales are shown in Table 7.6.
Table 7.6: Internal consistency reliability
Step II facet scale No. of items
Coefficient alpha
E–I facet scales Initiating–Receiving 8 0.80 Expressive–Contained 7 0.76 Gregarious–Intimate 7 0.60 Active–Reflective 8 0.67 Enthusiastic–Quiet 9 0.67 S–N facet scales Concrete–Abstract 9 0.67 Realistic–Imaginative 7 0.68 Practical–Conceptual 8 0.43 Experiential–Theoretical 8 0.80 Traditional–Original 8 0.75 T–F facet scales Logical–Empathetic 9 0.83 Reasonable–Compassionate 8 0.54 Questioning–Accommodating 7 0.37 Critical–Accepting 8 0.40 Tough–Tender 8 0.75 J–P facet scales Systematic–Casual 8 0.80 Planful–Open-Ended 6 0.84 Early Starting–Pressure-Prompted 6 0.70 Scheduled–Spontaneous 8 0.69 Methodical–Emergent 8 0.60
Median 0.69
The internal consistency reliability of most scales is good, and the average (median) reliability is close to 0.7. However, four scales (Practical–Conceptual, Reasonable–Compassionate, Questioning-Accommodating, and Critical-Accepting) do have lower alpha coefficients. This pattern is consistent with what was found during the development of the Step II instrument, where these four facet scales were also found to show lower reliability than the others (Quenk, Hammer and Majors, 2004).
Chapter 7: Italian
151
It should be noted, however, that coefficient alpha reliability statistics will give an underestimate of the reliability of the Step II facet scales, given the use of item response theory (IRT) methods in the actual scoring process.7
Group differences
This section looks at the way in which people from different groups responded to the Italian version of the European Step II questionnaire. Unfortunately, the total number of respondents is too small for the full range of analyses to be conducted. Further research will be conducted when additional data become available.
Gender
The means and standard deviations of the Step II facet scales are shown separately for males and females in Table 7.7, along with the difference in mean scores. This is represented graphically in Figure 7.2. Statistically significant differences were found between male and female mean scores for five of the 20 facet scales, with a consistent pattern emerging.
• Male mean scores tended more towards the I, S, T and J poles than female mean scores in most cases. The differences were often not statistically significant, but there was a consistent pattern that emerged.
It should be noted that the number of people in both groups was very small, so these findings should be treated with caution at this stage.
7 Item response theory (IRT) is an approach to measurement that is concerned with modelling the relationship between item responses and the underlying characteristic assessed by the scale or test the item is designed to measure. IRT can be used to select items for a test and/or to score the items.
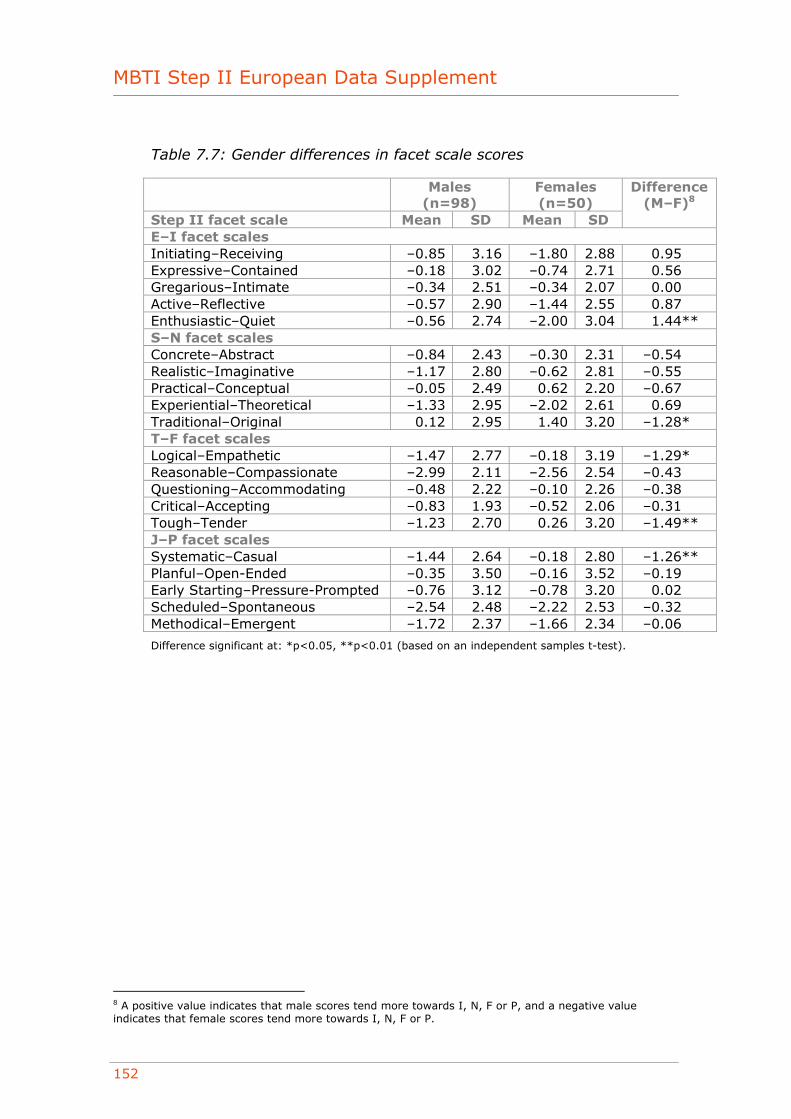
MBTI Step II European Data Supplement
152
Table 7.7: Gender differences in facet scale scores
Males (n=98)
Females (n=50)
Step II facet scale Mean SD Mean SD
Difference (M–F)8
E–I facet scales Initiating–Receiving –0.85 3.16 –1.80 2.88 0.95 Expressive–Contained –0.18 3.02 –0.74 2.71 0.56 Gregarious–Intimate –0.34 2.51 –0.34 2.07 0.00 Active–Reflective –0.57 2.90 –1.44 2.55 0.87 Enthusiastic–Quiet –0.56 2.74 –2.00 3.04 1.44** S–N facet scales Concrete–Abstract –0.84 2.43 –0.30 2.31 –0.54 Realistic–Imaginative –1.17 2.80 –0.62 2.81 –0.55 Practical–Conceptual –0.05 2.49 0.62 2.20 –0.67 Experiential–Theoretical –1.33 2.95 –2.02 2.61 0.69 Traditional–Original 0.12 2.95 1.40 3.20 –1.28* T–F facet scales Logical–Empathetic –1.47 2.77 –0.18 3.19 –1.29* Reasonable–Compassionate –2.99 2.11 –2.56 2.54 –0.43 Questioning–Accommodating –0.48 2.22 –0.10 2.26 –0.38 Critical–Accepting –0.83 1.93 –0.52 2.06 –0.31 Tough–Tender –1.23 2.70 0.26 3.20 –1.49** J–P facet scales Systematic–Casual –1.44 2.64 –0.18 2.80 –1.26** Planful–Open-Ended –0.35 3.50 –0.16 3.52 –0.19 Early Starting–Pressure-Prompted –0.76 3.12 –0.78 3.20 0.02 Scheduled–Spontaneous –2.54 2.48 –2.22 2.53 –0.32 Methodical–Emergent –1.72 2.37 –1.66 2.34 –0.06
Difference significant at: *p<0.05, **p<0.01 (based on an independent samples t-test).
8 A positive value indicates that male scores tend more towards I, N, F or P, and a negative value indicates that female scores tend more towards I, N, F or P.
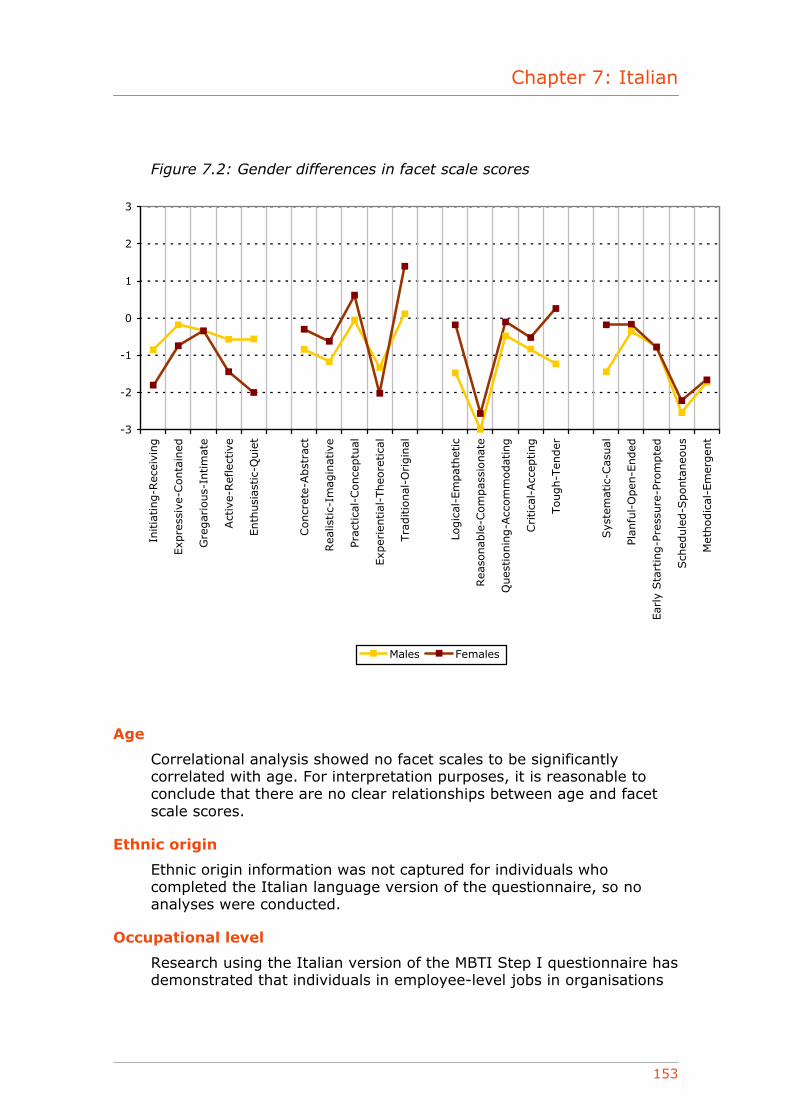
Chapter 7: Italian
153
Figure 7.2: Gender differences in facet scale scores
-3
-2
-1
0
1
2
3
Initia
ting-R
ecei
ving
Exp
ress
ive-
Conta
ined
Gre
gar
ious-
Intim
ate
Act
ive-
Ref
lect
ive
Enth
usi
astic-
Quie
t
Concr
ete-
Abst
ract
Rea
listic-
Imag
inat
ive
Prac
tica
l-Conce
ptu
al
Exp
erie
ntial
-Theo
retica
l
Tra
ditio
nal
-Origin
al
Logic
al-E
mpat
het
ic
Rea
sonab
le-C
om
pas
sionat
e
Ques
tionin
g-A
ccom
modat
ing
Critica
l-Acc
epting
Tough-T
ender
Sys
tem
atic
-Cas
ual
Plan
ful-
Open
-Ended
Ear
ly S
tart
ing-P
ress
ure
-Pro
mpte
d
Sch
edule
d-S
ponta
neo
us
Met
hodic
al-E
mer
gen
t
Males Females
Age
Correlational analysis showed no facet scales to be significantly correlated with age. For interpretation purposes, it is reasonable to conclude that there are no clear relationships between age and facet scale scores.
Ethnic origin
Ethnic origin information was not captured for individuals who completed the Italian language version of the questionnaire, so no analyses were conducted.
Occupational level
Research using the Italian version of the MBTI Step I questionnaire has demonstrated that individuals in employee-level jobs in organisations
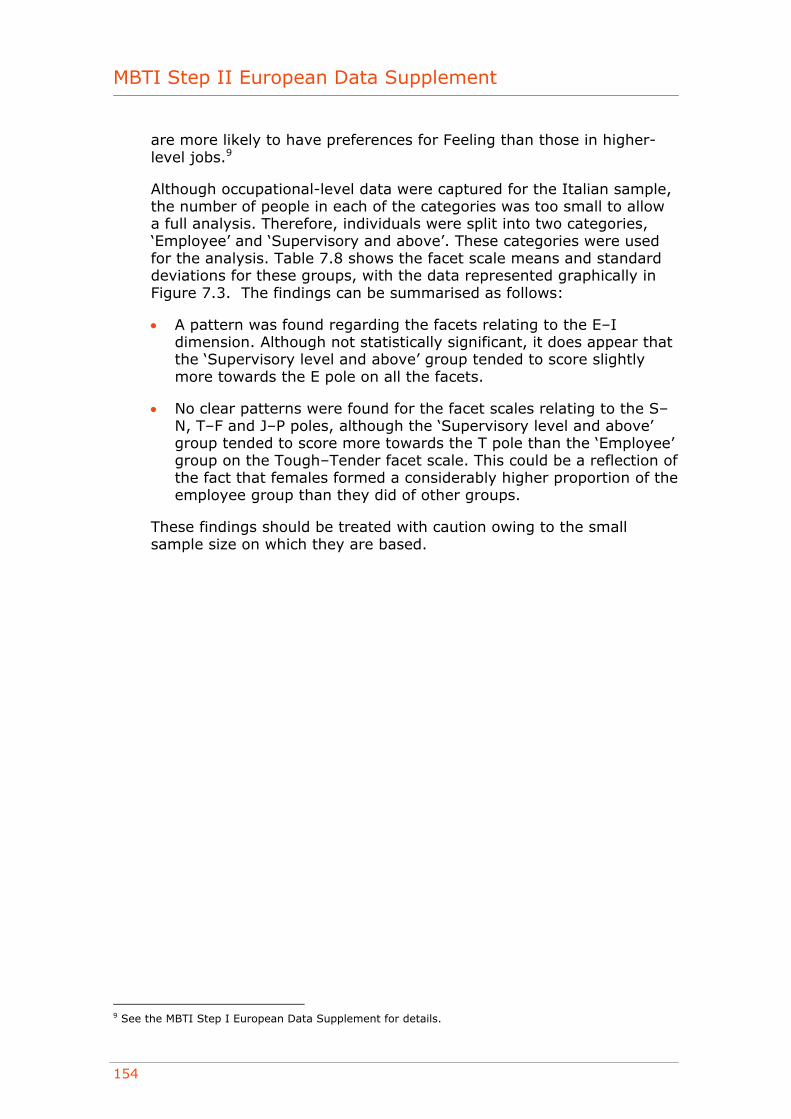
MBTI Step II European Data Supplement
154
are more likely to have preferences for Feeling than those in higher-level jobs.9
Although occupational-level data were captured for the Italian sample, the number of people in each of the categories was too small to allow a full analysis. Therefore, individuals were split into two categories, ‘Employee’ and ‘Supervisory and above’. These categories were used for the analysis. Table 7.8 shows the facet scale means and standard deviations for these groups, with the data represented graphically in Figure 7.3. The findings can be summarised as follows:
• A pattern was found regarding the facets relating to the E–I dimension. Although not statistically significant, it does appear that the ‘Supervisory level and above’ group tended to score slightly more towards the E pole on all the facets.
• No clear patterns were found for the facet scales relating to the S–N, T–F and J–P poles, although the ‘Supervisory level and above’ group tended to score more towards the T pole than the ‘Employee’ group on the Tough–Tender facet scale. This could be a reflection of the fact that females formed a considerably higher proportion of the employee group than they did of other groups.
These findings should be treated with caution owing to the small sample size on which they are based.
9 See the MBTI Step I European Data Supplement for details.
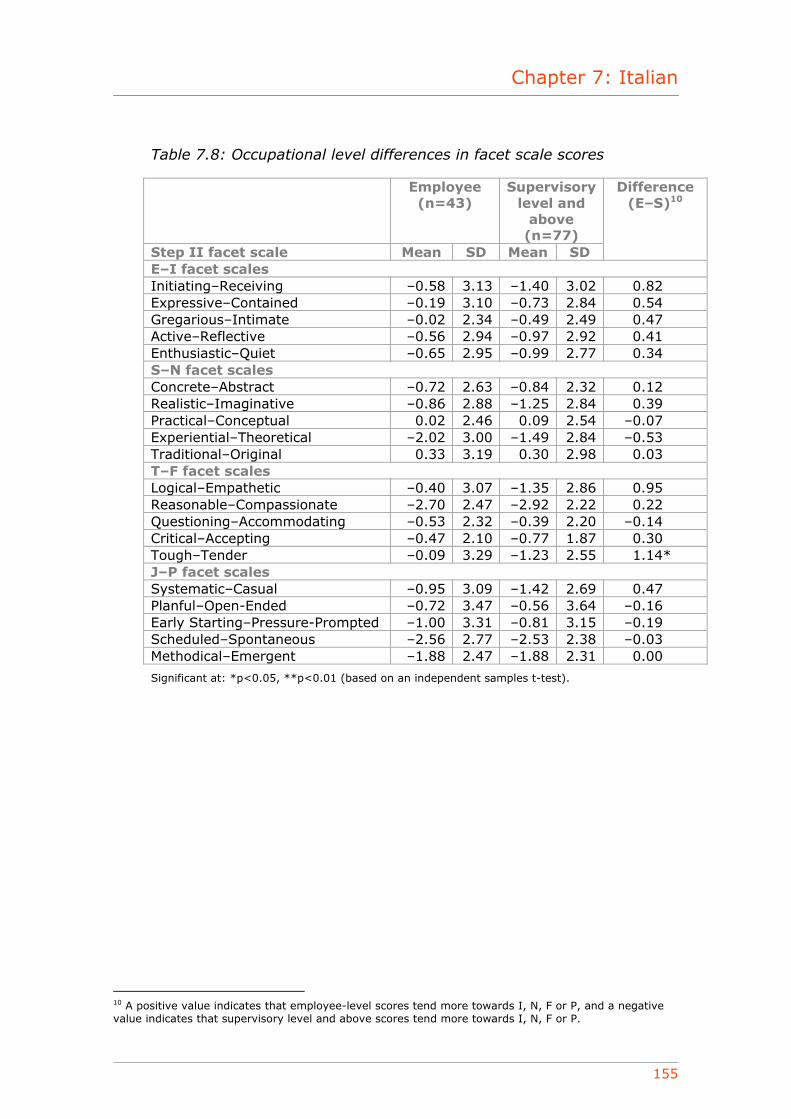
Chapter 7: Italian
155
Table 7.8: Occupational level differences in facet scale scores
Employee (n=43)
Supervisory level and
above (n=77)
Step II facet scale Mean SD Mean SD
Difference (E–S)10
E–I facet scales Initiating–Receiving –0.58 3.13 –1.40 3.02 0.82 Expressive–Contained –0.19 3.10 –0.73 2.84 0.54 Gregarious–Intimate –0.02 2.34 –0.49 2.49 0.47 Active–Reflective –0.56 2.94 –0.97 2.92 0.41 Enthusiastic–Quiet –0.65 2.95 –0.99 2.77 0.34 S–N facet scales Concrete–Abstract –0.72 2.63 –0.84 2.32 0.12 Realistic–Imaginative –0.86 2.88 –1.25 2.84 0.39 Practical–Conceptual 0.02 2.46 0.09 2.54 –0.07 Experiential–Theoretical –2.02 3.00 –1.49 2.84 –0.53 Traditional–Original 0.33 3.19 0.30 2.98 0.03 T–F facet scales Logical–Empathetic –0.40 3.07 –1.35 2.86 0.95 Reasonable–Compassionate –2.70 2.47 –2.92 2.22 0.22 Questioning–Accommodating –0.53 2.32 –0.39 2.20 –0.14 Critical–Accepting –0.47 2.10 –0.77 1.87 0.30 Tough–Tender –0.09 3.29 –1.23 2.55 1.14* J–P facet scales Systematic–Casual –0.95 3.09 –1.42 2.69 0.47 Planful–Open-Ended –0.72 3.47 –0.56 3.64 –0.16 Early Starting–Pressure-Prompted –1.00 3.31 –0.81 3.15 –0.19 Scheduled–Spontaneous –2.56 2.77 –2.53 2.38 –0.03 Methodical–Emergent –1.88 2.47 –1.88 2.31 0.00
Significant at: *p<0.05, **p<0.01 (based on an independent samples t-test).
10 A positive value indicates that employee-level scores tend more towards I, N, F or P, and a negative value indicates that supervisory level and above scores tend more towards I, N, F or P.
MBTI Step II European Data Supplement
156
Figure 7.3: Occupational-level differences in facet scale scores
-3
-2
-1
0
1
2
3
Initia
ting-R
ecei
ving
Exp
ress
ive-
Conta
ined
Gre
gar
ious-
Intim
ate
Act
ive-
Ref
lect
ive
Enth
usi
astic-
Quie
t
Concr
ete-
Abst
ract
Rea
listic-
Imag
inat
ive
Prac
tica
l-Conce
ptu
al
Exp
erie
ntial
-Theo
retica
l
Tra
ditio
nal
-Origin
al
Logic
al-E
mpat
het
ic
Rea
sonab
le-C
om
pas
sionat
e
Ques
tionin
g-A
ccom
modat
ing
Critica
l-Acc
epting
Tough-T
ender
Sys
tem
atic
-Cas
ual
Plan
ful-
Open
-Ended
Ear
ly S
tart
ing-P
ress
ure
-Pro
mpte
d
Sch
edule
d-S
ponta
neo
us
Met
hodic
al-E
mer
gen
t
Employee level Supervisory level and above
Education
Specific educational qualifications were not collected for the OPPassessment sample; however, the age at which individuals left full-time education was. Only two significant correlations were found between the age at which people left full-time education and their facet scale scores. The correlation with Realistic–Imaginative was 0.24, and with Questioning–Accommodating was –0.18. This means that individuals who were older when they left full-time education were likely to be more Imaginative and Questioning than others. Further data will need to be gathered before it is possible to tell whether these correlations are meaningful.
Work area
Information regarding the area of work people engage in was collected for the group. Many different categories were used, but the numbers of people in each category were too small for the purposes of analysis.
Chapter 7: Italian
157
No groups contained more than 25 people. These analyses will be conducted once additional data become available.
Nationality
Information on nationality was gathered for 93% of the group. Of these, 96% were Italian. There were insufficient people of other nationalities for it to be possible to conduct any analyses across groups.
Employment status
Employment status information was gathered for 83% of the group. Of these, 98% worked full-time. There were insufficient people who did not work full-time for it to be possible to conduct any analyses across groups.
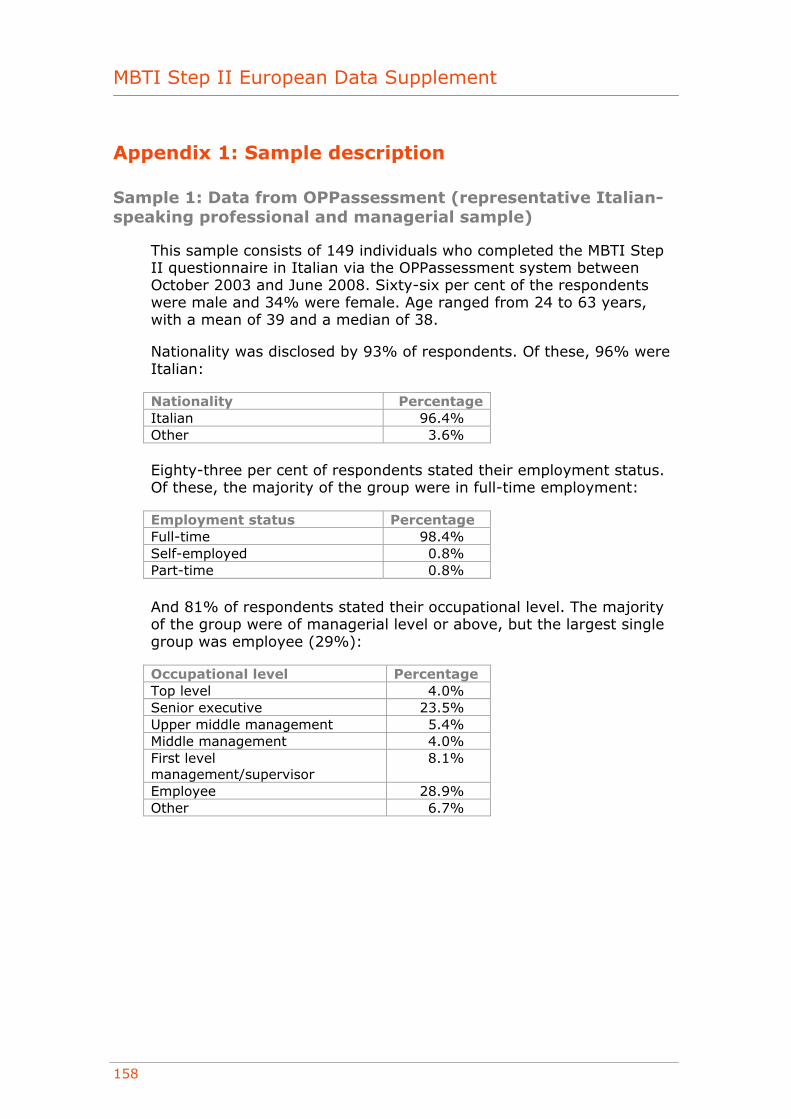
MBTI Step II European Data Supplement
158
Appendix 1: Sample description
Sample 1: Data from OPPassessment (representative Italian-speaking professional and managerial sample)
This sample consists of 149 individuals who completed the MBTI Step II questionnaire in Italian via the OPPassessment system between October 2003 and June 2008. Sixty-six per cent of the respondents were male and 34% were female. Age ranged from 24 to 63 years, with a mean of 39 and a median of 38.
Nationality was disclosed by 93% of respondents. Of these, 96% were Italian:
Nationality Percentage Italian 96.4% Other 3.6%
Eighty-three per cent of respondents stated their employment status. Of these, the majority of the group were in full-time employment:
Employment status Percentage Full-time 98.4% Self-employed 0.8% Part-time 0.8%
And 81% of respondents stated their occupational level. The majority of the group were of managerial level or above, but the largest single group was employee (29%):
Occupational level Percentage Top level 4.0% Senior executive 23.5% Upper middle management 5.4% Middle management 4.0% First level management/supervisor
8.1%
Employee 28.9% Other 6.7%
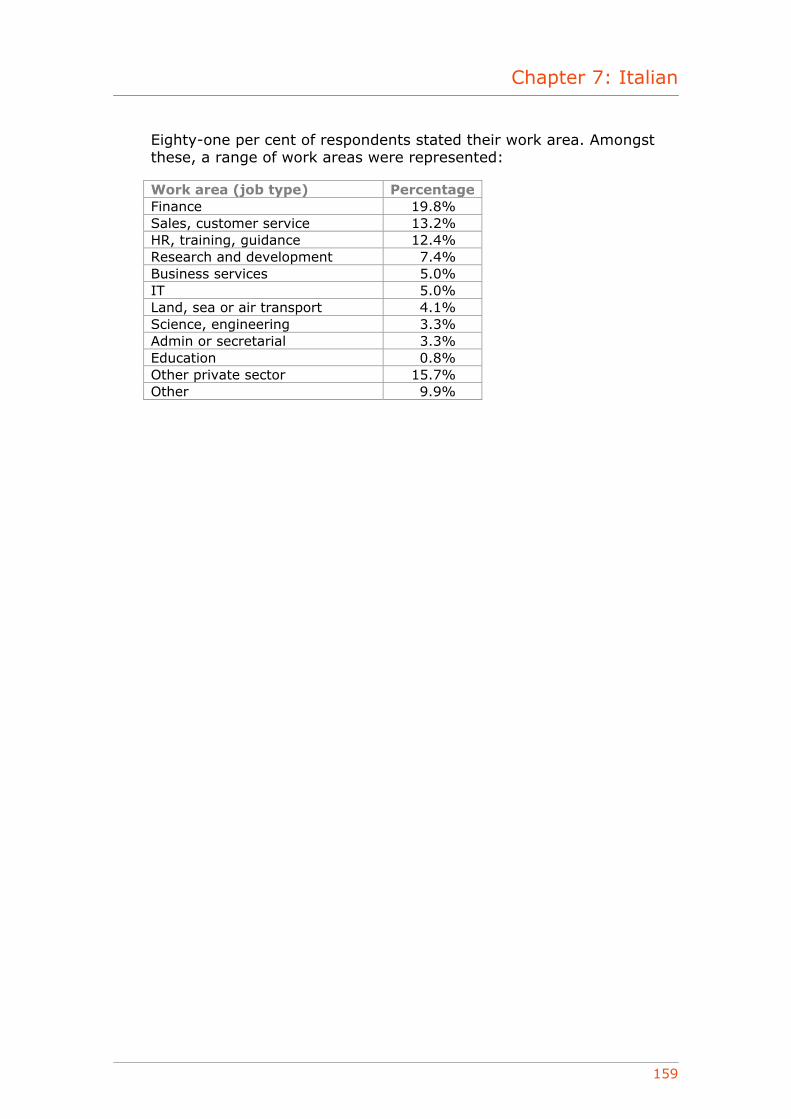
Chapter 7: Italian
159
Eighty-one per cent of respondents stated their work area. Amongst these, a range of work areas were represented:
Work area (job type) Percentage Finance 19.8% Sales, customer service 13.2% HR, training, guidance 12.4% Research and development 7.4% Business services 5.0% IT 5.0% Land, sea or air transport 4.1% Science, engineering 3.3% Admin or secretarial 3.3% Education 0.8% Other private sector 15.7% Other 9.9%

MBTI Step II European Data Supplement
160

Chapter 8: Norwegian
161
European Data Supplement Norwegian
January 2009
OPP Ltd Elsfield Hall
15–17 Elsfield Way Oxford OX2 8EP
UK t: +44 (0)845 603 9958 f: +44 (0)1865 557483
MBTI® Step II instrument
MBTI Step II European Data Supplement
162
Contents
Introduction ........................................................................... 163 Type distribution ..................................................................... 164
OPPassessment data (representative Norwegian-speaking professional and managerial sample) .................................. 165
Properties of the Step II facet scales .......................................... 166 Facet scale score distribution................................................. 166 Facet scale intercorrelations .................................................. 168 Correlations of Step II facet scales with Step I scales................ 170 Out-of-preference scores ...................................................... 171 Reliability ........................................................................... 172 Group differences ................................................................ 173
Appendix 1: Sample description ................................................ 180 Sample 1: Data from OPPassessment (representative Norwegian-
speaking professional and managerial sample) ..................... 180
© Copyright 2009 OPP Ltd. All rights reserved.
No portion of this publication may be translated or reproduced in whole or in part, stored in a retrieval system, or transmitted in any form or by any means (electronic, mechanical, photocopying, recording or otherwise) without the prior written permission of the copyright owner. No part of this publication is reproducible under any photocopying licence scheme. OPP Ltd grants the downloader a personal, non-transferable, perpetual, irrevocable right to use the Supplement. The European Data Supplement (‘the Supplement’) is for personal use only and may not be sold on or circulated to third parties.
® MBTI, Myers-Briggs, the Myers-Briggs Type Indicator and the MBTI logo are registered trade marks of the Myers-Briggs Type Indicator Trust. OPP is licensed to use the trade marks in Europe.
® OPP is a registered trade mark of OPP Ltd in the European Community.
Chapter 8: Norwegian
163
Introduction
Data collected for the European MBTI Step II instrument were analysed to produce the findings in this supplement. This is the first data supplement produced for this instrument, and contains all the data gathered to date since the launch of the instrument in 2003. A brief description of the sample is given below. Further details of the sample are provided in Appendix 1.
• The sample consisted of 317 individuals who completed the MBTI Step II questionnaire in Norwegian via the OPPassessment system between 2003 and mid-2008.1 This sample is considered to be representative of the groups of people with whom the Norwegian MBTI Step II instrument has been and will be used for applications such as management development, coaching, counselling and teambuilding. As such, it is likely to represent a cross-section of the Norwegian-speaking professional and managerial population.
The results of the analyses are outlined below.
1 OPPassessment allows personality questionnaires such as the MBTI instrument to be administered via email and/or completed online.
MBTI Step II European Data Supplement
164
Type distribution
Type tables are a way of illustrating the proportion of each type within a particular group. Below is a type table taken from the sample described on the previous page.
For each of the 16 different types, the number of cases, the percentage of the total that this represents and the self-selection ratio (SSR) are shown. The SSR (Myers et al., 1998) is a way of demonstrating whether a given type appears more or less often in a particular group than would be expected given its frequency in a reference group. Ideally, the type distribution from a large representative sample of the Norwegian population would be used to calculate SSRs in this data supplement. However, such a sample does not currently exist. In its place, SSRs have been calculated using type data from the UK general population (Kendall, 1998), which can be justified by the fact that type distributions for comparable Norwegian and British groups, such as managers and professionals, are similar. Evidence (eg Hackston and Kendall, 2004; Quenk et al., 2004) does suggest that although type-related behaviours vary a good deal from country to country and from culture to culture, the frequencies of underlying MBTI types do not.
An SSR of greater than 1 indicates that a type is over-represented, and an SSR of less than 1 denotes that it is under-represented. Asterisks are used to denote whether the over- or under-representations are statistically significant, based on the results of chi-square analysis.2
2 Chi-square analysis (often abbreviated to χ2) is a technique used to explore whether observed frequency distributions differ significantly from other, predefined, distributions. In this case, the UK general population group is used as the reference group, and the chi-square analysis indicates whether the proportion of people of each type within a particular sample differs significantly from the proportion of people reporting the same type within the reference group.
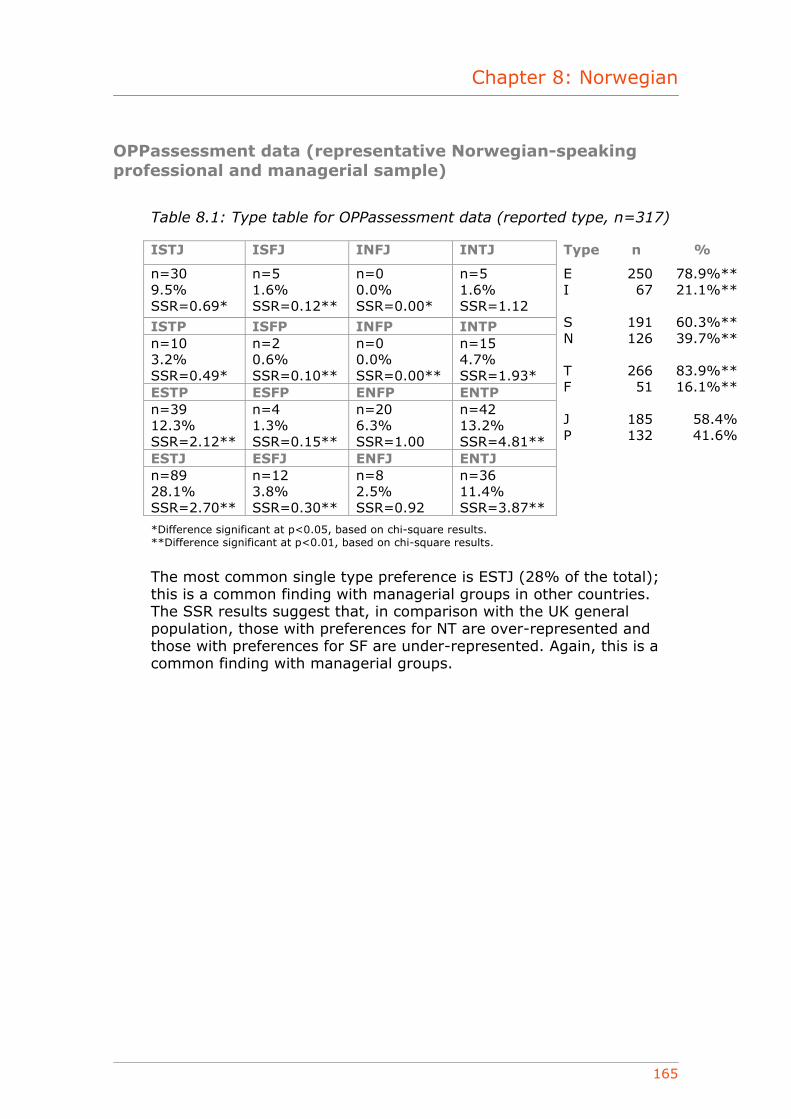
Chapter 8: Norwegian
165
OPPassessment data (representative Norwegian-speaking professional and managerial sample)
Table 8.1: Type table for OPPassessment data (reported type, n=317)
ISTJ ISFJ INFJ INTJ Type n %
n=30 9.5% SSR=0.69*
n=5 1.6% SSR=0.12**
n=0 0.0% SSR=0.00*
n=5 1.6% SSR=1.12
ISTP ISFP INFP INTP n=10 3.2% SSR=0.49*
n=2 0.6% SSR=0.10**
n=0 0.0% SSR=0.00**
n=15 4.7% SSR=1.93*
ESTP ESFP ENFP ENTP n=39 12.3% SSR=2.12**
n=4 1.3% SSR=0.15**
n=20 6.3% SSR=1.00
n=42 13.2% SSR=4.81**
ESTJ ESFJ ENFJ ENTJ n=89 28.1% SSR=2.70**
n=12 3.8% SSR=0.30**
n=8 2.5% SSR=0.92
n=36 11.4% SSR=3.87**
E I S N T F J P
250 67
191 126
266 51
185 132
78.9%** 21.1%**
60.3%** 39.7%**
83.9%** 16.1%**
58.4% 41.6%
*Difference significant at p<0.05, based on chi-square results. **Difference significant at p<0.01, based on chi-square results.
The most common single type preference is ESTJ (28% of the total); this is a common finding with managerial groups in other countries. The SSR results suggest that, in comparison with the UK general population, those with preferences for NT are over-represented and those with preferences for SF are under-represented. Again, this is a common finding with managerial groups.

MBTI Step II European Data Supplement
166
Properties of the Step II facet scales
Facet scale score distribution
The means and standard deviations of the Step II facets are shown in Table 8.2 and illustrated graphically in Figure 8.1. The mean score for a scale is calculated by adding together the scores of each individual in the sample and then dividing the sum by the number of individuals. Note that negative values indicate that mean scores are nearer the left-hand pole of the facet and positive values indicate that the mean scores are nearer the right-hand pole. The standard deviation (SD) is a statistical measure describing the degree to which the scores from the sample either bunch up close to, or are scattered widely around, the mean for the sample.
Table 8.2: Means and standard deviations of the facet scales
Step II facet scale Mean3 SD E–I facet scales Initiating–Receiving –2.49 2.61 Expressive–Contained –1.32 2.91 Gregarious–Intimate –1.67 2.68 Active–Reflective –1.79 3.04 Enthusiastic–Quiet –2.45 2.55 S–N facet scales Concrete–Abstract –0.48 2.76 Realistic–Imaginative –1.00 3.41 Practical–Conceptual –0.55 2.42 Experiential–Theoretical –0.82 2.90 Traditional–Original –1.17 3.08 T–F facet scales Logical–Empathetic –1.84 2.34 Reasonable–Compassionate –2.06 2.80 Questioning–Accommodating –1.05 2.72 Critical–Accepting –0.16 1.92 Tough–Tender –1.08 2.61 J–P facet scales Systematic–Casual –1.89 2.60 Planful–Open-Ended 0.00 3.14 Early Starting–Pressure-Prompted 0.93 3.20 Scheduled–Spontaneous –1.74 2.95 Methodical–Emergent 0.38 2.82
3 Scale means: in Step II reports, scores are given from 5 on one pole, through 0, to 5 on the opposite pole. In compiling statistical information, however, one pole needs to be clearly distinguished from the other. Throughout this data supplement, therefore, a convention has been adopted of scores 5, 4, 3, 2 or 1 on the left-hand pole being assigned values of –5, –4, –3, –2, or –1 and scores on the right-hand pole being assigned positive scores. This does not, of course, imply any suggestion that positive scores are ‘better’ than negative scores.
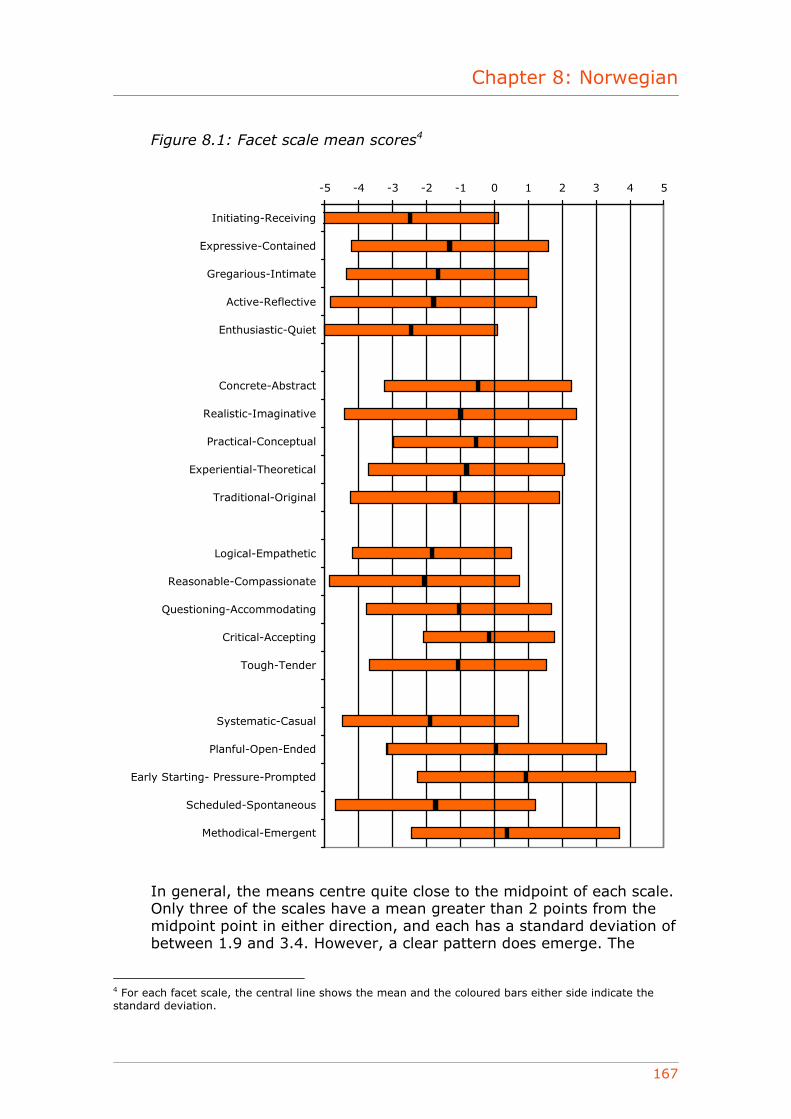
Chapter 8: Norwegian
167
Figure 8.1: Facet scale mean scores4
-5 -4 -3 -2 -1 0 1 2 3 4 5
Initiating-Receiving
Expressive-Contained
Gregarious-Intimate
Active-Reflective
Enthusiastic-Quiet
Concrete-Abstract
Realistic-Imaginative
Practical-Conceptual
Experiential-Theoretical
Traditional-Original
Logical-Empathetic
Reasonable-Compassionate
Questioning-Accommodating
Critical-Accepting
Tough-Tender
Systematic-Casual
Planful-Open-Ended
Early Starting- Pressure-Prompted
Scheduled-Spontaneous
Methodical-Emergent
In general, the means centre quite close to the midpoint of each scale. Only three of the scales have a mean greater than 2 points from the midpoint point in either direction, and each has a standard deviation of between 1.9 and 3.4. However, a clear pattern does emerge. The
4 For each facet scale, the central line shows the mean and the coloured bars either side indicate the standard deviation.
MBTI Step II European Data Supplement
168
mean scores generally tend towards the E, S, T and J direction, which is consistent with the most common four-letter type preference amongst this sample. Amongst the group as a whole, there are more individuals with a preference for E, S, T and J.
Facet scale intercorrelations
Correlations among the Step II facet scales are shown in Table 8.3. Facet scales within each dichotomy usually correlate more highly (often substantially so) with the other scales of the same dichotomy than they do with scales in the other three dichotomies. For example, every E–I facet scale correlates more highly with the other four E–I scales than with any of the S–N, T–F or J–P facet scales.
There is only one scale that correlates significantly more highly with scales in other dichotomies. The T–F scale Questioning–Accommodating correlates with many scales, across dichotomies. For example, it correlates at a level of 0.25 with Enthusiastic–Quiet, at 0.24 with Active–Reflective, at between –0.30 and –0.46 with all of the S–N scales, and at between –0.14 and –0.27 with all of the J–P scales. By way of comparison, it correlates at between 0.05 and 0.20 with the other four scales on the same dichotomy as itself (T–F). The negative correlations between Questioning–Accommodating and the S–N scales are consistent with findings with the US version of the Step II instrument, and suggest that a questioning approach to differences of opinion seems to be related to a range of Intuitive (N) facets. These patterns are similar to those found when the European Step II instrument was developed.

Table 8.3: Intercorrelations of Step II facet scales
1 2 3 4 5 6 7 8 9 10 11 12 13 14 15 16 17 18 19 20 1. Initiating– Receiving
1.00
2. Expressive– Contained
0.57 1.00
3. Gregarious– Intimate
0.52 0.54 1.00
4. Active– Reflective
0.67 0.55 0.52 1.00
5. Enthusiastic– Quiet
0.56 0.61 0.56 0.58 1.00
6. Concrete– Abstract
–0.02 –0.08 0.03 –0.01 –0.13 1.00
7. Realistic– Imaginative
–0.05 –0.12 –0.04 –0.13 –0.19 0.68 1.00
8. Practical– Conceptual
–0.01 –0.02 0.00 –0.06 –0.13 0.64 0.61 1.00
9. Experiential– Theoretical
–0.02 –0.08 –0.03 –0.05 –0.13 0.62 0.54 0.58 1.00
10. Traditional– Original
–0.08 –0.16 0.02 –0.16 –0.18 0.66 0.68 0.58 0.53 1.00
11. Logical– Empathetic
–0.14 –0.28 –0.02 –0.14 –0.16 0.22 0.25 0.04 0.02 0.06 1.00
12. Reasonable– Compassionate
–0.05 –0.14 –0.01 –0.04 –0.02 0.05 0.09 –0.12 –0.06 –0.08 0.65 1.00
13. Questioning– Accommodating
0.16 0.18 0.10 0.24 0.25 –0.32 –0.30 –0.37 –0.33 –0.46 0.11 0.20 1.00
14. Critical– Accepting
–0.27 –0.22 –0.20 –0.18 –0.26 0.15 0.16 0.02 0.01 0.05 0.38 0.37 0.05 1.00
15. Tough– Tender
–0.04 –0.10 0.03 0.02 –0.04 0.16 0.19 0.08 0.07 –0.06 0.52 0.57 0.12 0.47 1.00
16. Systematic– Casual
–0.02 –0.08 –0.02 –0.13 –0.12 0.49 0.59 0.40 0.34 0.49 0.37 0.21 –0.18 0.17 0.21 1.00
17. Planful– Open-Ended
–0.01 –0.01 0.01 –0.03 –0.05 0.33 0.30 0.22 0.27 0.35 0.12 0.06 –0.21 0.06 0.05 0.50 1.00
18. Early Starting– Pressure-Prompted
–0.04 0.06 0.01 –0.06 –0.10 0.36 0.37 0.31 0.26 0.39 –0.11 –0.13 –0.27 –0.06 –0.10 0.37 0.37 1.00
19. Scheduled– Spontaneous
0.03 0.00 0.01 0.01 –0.04 0.44 0.43 0.33 0.33 0.44 0.10 –0.02 –0.16 0.06 0.04 0.57 0.56 0.46 1.00
20. Methodical– Emergent
0.12 0.05 0.06 0.07 0.02 0.31 0.30 0.21 0.22 0.28 0.06 0.04 –0.14 –0.05 –0.01 0.43 0.53 0.45 0.57 1.00

MBTI Step II European Data Supplement
170
Correlations of Step II facet scales with Step I scales
Correlation between Step II facet scales and the continuous scores from the MBTI Step I instrument are shown in Table 8.4.5 Positive correlations between facet scales and the corresponding Step I dimension (e.g. between Initiating–Receiving and the E–I continuous score) indicate relationships in the expected direction, with higher facet scores tending to be associated with higher continuous scores, and vice versa. Negative correlations would indicate an inverse relationship between the facet scale scores and the corresponding Step I dimension.
Table 8.4: Correlations of Step II facet scales with Step I continuous scores
Step I continuous score Step II facet scales E–I S–N T–F J–P E–I facet scales Initiating–Receiving 0.80 –0.05 –0.18 0.07 Expressive–Contained 0.77 –0.14 –0.27 0.06 Gregarious–Intimate 0.65 0.01 –0.06 0.07 Active–Reflective 0.77 –0.12 –0.16 0.02 Enthusiastic–Quiet 0.84 –0.20 –0.19 –0.02 S–N facet scales Concrete–Abstract –0.08 0.87 0.15 0.47 Realistic–Imaginative –0.16 0.80 0.18 0.46 Practical–Conceptual –0.08 0.70 –0.02 0.36 Experiential–Theoretical –0.07 0.72 –0.01 0.35 Traditional–Original –0.18 0.82 –0.04 0.48 T–F facet scales Logical–Empathetic –0.23 0.16 0.88 0.12 Reasonable–Compassionate –0.09 –0.02 0.74 0.03 Questioning–Accommodating 0.24 –0.39 0.20 –0.25 Critical–Accepting –0.27 0.11 0.52 0.04 Tough–Tender –0.03 0.09 0.66 0.05 J–P facet scales Systematic–Casual –0.11 0.53 0.28 0.66 Planful–Open-Ended –0.02 0.33 0.06 0.81 Early Starting–Pressure-Prompted –0.05 0.40 –0.14 0.66 Scheduled–Spontaneous 0.00 0.46 0.03 0.76 Methodical–Emergent 0.09 0.32 –0.01 0.71
The E–I facet scales correlate at 0.65 to 0.84 with the E–I continuous scores from Step I; the S–N facet scales correlate at 0.70 to 0.87 with the S–N continuous scores; the T–F facet scales correlate at 0.20 to 0.88 with the T–F continuous scores; and the J–P facet scales correlate
5 Continuous scores place an individual’s score on each dimension onto a continuous scale with a midpoint of 100. To calculate continuous scores, Preference Clarity Index (PCI) scores for each dimension are either subtracted or added to 100, depending on which direction the overall preference is. PCI scores in the direction of E, S, T or J are subtracted from 100. PCI scores in the direction of I, N, F or P are added to 100.
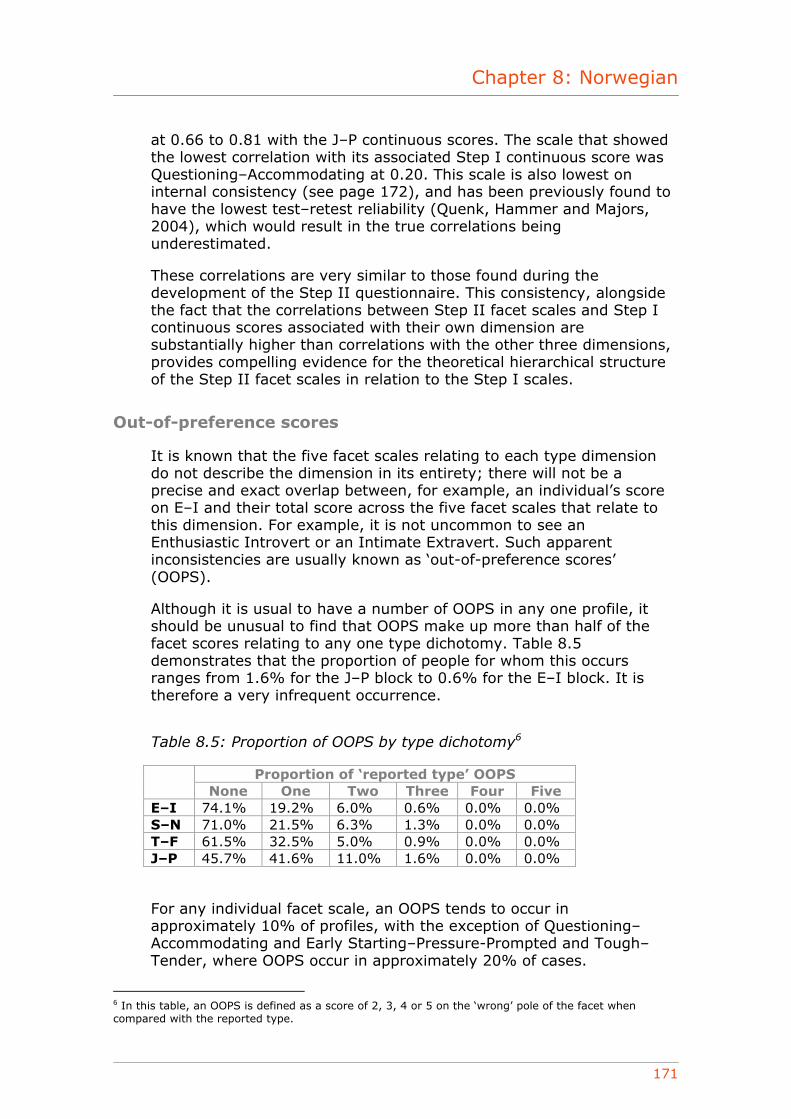
Chapter 8: Norwegian
171
at 0.66 to 0.81 with the J–P continuous scores. The scale that showed the lowest correlation with its associated Step I continuous score was Questioning–Accommodating at 0.20. This scale is also lowest on internal consistency (see page 172), and has been previously found to have the lowest test–retest reliability (Quenk, Hammer and Majors, 2004), which would result in the true correlations being underestimated.
These correlations are very similar to those found during the development of the Step II questionnaire. This consistency, alongside the fact that the correlations between Step II facet scales and Step I continuous scores associated with their own dimension are substantially higher than correlations with the other three dimensions, provides compelling evidence for the theoretical hierarchical structure of the Step II facet scales in relation to the Step I scales.
Out-of-preference scores
It is known that the five facet scales relating to each type dimension do not describe the dimension in its entirety; there will not be a precise and exact overlap between, for example, an individual’s score on E–I and their total score across the five facet scales that relate to this dimension. For example, it is not uncommon to see an Enthusiastic Introvert or an Intimate Extravert. Such apparent inconsistencies are usually known as ‘out-of-preference scores’ (OOPS).
Although it is usual to have a number of OOPS in any one profile, it should be unusual to find that OOPS make up more than half of the facet scores relating to any one type dichotomy. Table 8.5 demonstrates that the proportion of people for whom this occurs ranges from 1.6% for the J–P block to 0.6% for the E–I block. It is therefore a very infrequent occurrence.
Table 8.5: Proportion of OOPS by type dichotomy6
Proportion of ‘reported type’ OOPS None One Two Three Four Five
E–I 74.1% 19.2% 6.0% 0.6% 0.0% 0.0% S–N 71.0% 21.5% 6.3% 1.3% 0.0% 0.0% T–F 61.5% 32.5% 5.0% 0.9% 0.0% 0.0% J–P 45.7% 41.6% 11.0% 1.6% 0.0% 0.0%
For any individual facet scale, an OOPS tends to occur in approximately 10% of profiles, with the exception of Questioning–Accommodating and Early Starting–Pressure-Prompted and Tough–Tender, where OOPS occur in approximately 20% of cases.
6 In this table, an OOPS is defined as a score of 2, 3, 4 or 5 on the ‘wrong’ pole of the facet when compared with the reported type.
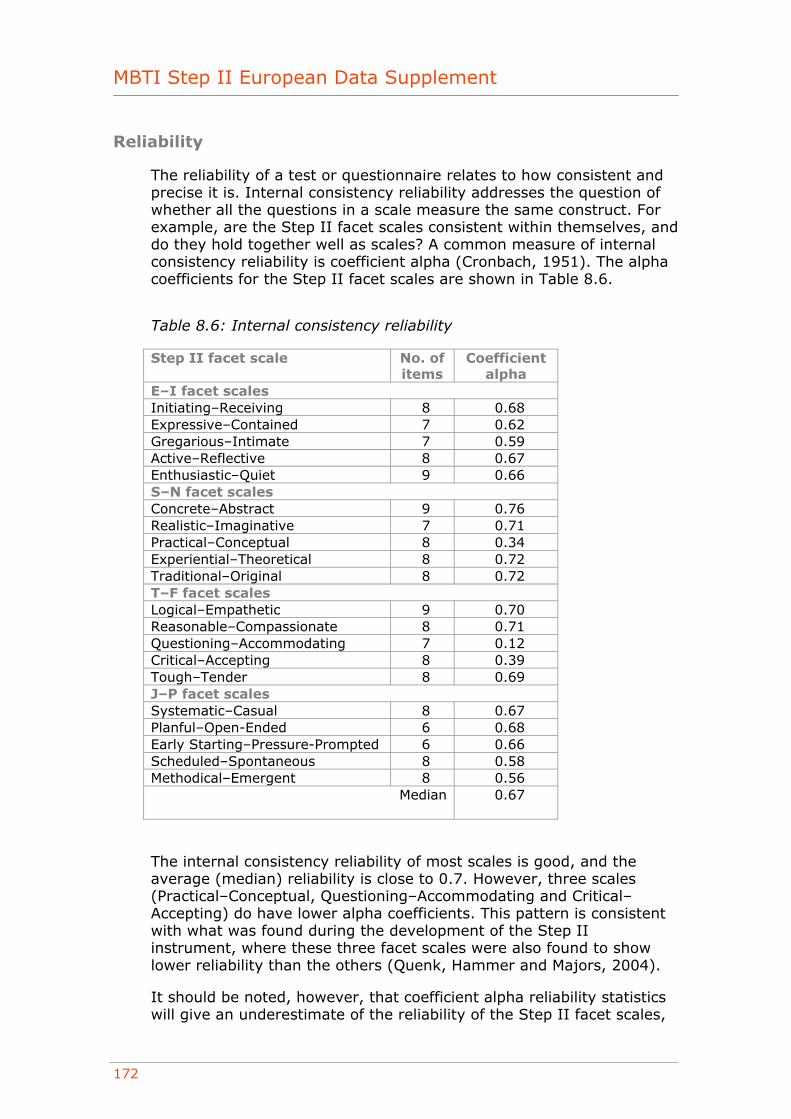
MBTI Step II European Data Supplement
172
Reliability
The reliability of a test or questionnaire relates to how consistent and precise it is. Internal consistency reliability addresses the question of whether all the questions in a scale measure the same construct. For example, are the Step II facet scales consistent within themselves, and do they hold together well as scales? A common measure of internal consistency reliability is coefficient alpha (Cronbach, 1951). The alpha coefficients for the Step II facet scales are shown in Table 8.6.
Table 8.6: Internal consistency reliability
Step II facet scale No. of items
Coefficient alpha
E–I facet scales Initiating–Receiving 8 0.68 Expressive–Contained 7 0.62 Gregarious–Intimate 7 0.59 Active–Reflective 8 0.67 Enthusiastic–Quiet 9 0.66 S–N facet scales Concrete–Abstract 9 0.76 Realistic–Imaginative 7 0.71 Practical–Conceptual 8 0.34 Experiential–Theoretical 8 0.72 Traditional–Original 8 0.72 T–F facet scales Logical–Empathetic 9 0.70 Reasonable–Compassionate 8 0.71 Questioning–Accommodating 7 0.12 Critical–Accepting 8 0.39 Tough–Tender 8 0.69 J–P facet scales Systematic–Casual 8 0.67 Planful–Open-Ended 6 0.68 Early Starting–Pressure-Prompted 6 0.66 Scheduled–Spontaneous 8 0.58 Methodical–Emergent 8 0.56
Median 0.67
The internal consistency reliability of most scales is good, and the average (median) reliability is close to 0.7. However, three scales (Practical–Conceptual, Questioning–Accommodating and Critical–Accepting) do have lower alpha coefficients. This pattern is consistent with what was found during the development of the Step II instrument, where these three facet scales were also found to show lower reliability than the others (Quenk, Hammer and Majors, 2004).
It should be noted, however, that coefficient alpha reliability statistics will give an underestimate of the reliability of the Step II facet scales,
Chapter 8: Norwegian
173
given the use of item response theory (IRT) methods in the actual scoring process.7
Group differences
This section looks at the way in which people from different groups responded to the Norwegian version of the European Step II questionnaire. Unfortunately, the majority of the respondents did not fill in any demographic data, so the variables available for analysis were very limited. Further research will be conducted when additional data become available.
Gender
The means and standard deviations of the Step II facet scales are shown separately for males and females in Table 8.7, along with the difference in mean scores. This is represented graphically in Figure 8.2. Statistically significant differences were found between male and female mean scores for 14 of the 20 facet scales, with some consistent patterns emerging.
• On the E–I facet scales, all five mean scores tended slightly toward the E pole for both males and females. Female mean scores tended further towards the E pole than males on three of the facet scales, and there was no significant difference between genders on the remaining two facet scales.
• On the S–N facet scales, all five mean scores tended slightly toward the S pole for both males and females. There were statistically significant gender differences on one of the five facet scales, with male mean scores tending more towards the S pole than females.
• On the T–F facet scales, four of the five mean scores tended slightly toward the T pole for both males and females. On the Critical–Accepting facet male mean scores tended towards the T pole whereas female mean scores tended towards the F pole. There were statistically significant gender differences on four of the five facet scales, with male mean scores tending more towards the T pole than females.
• On the J–P facet scales, two of the five mean scores tended toward the J pole for both males and females. There were no statistically significant gender differences on any of the five facet scales.
7 Item response theory (IRT) is an approach to measurement that is concerned with modelling the relationship between item responses and the underlying characteristic assessed by the scale or test the item is designed to measure. IRT can be used to select items for a test and/or to score the items.
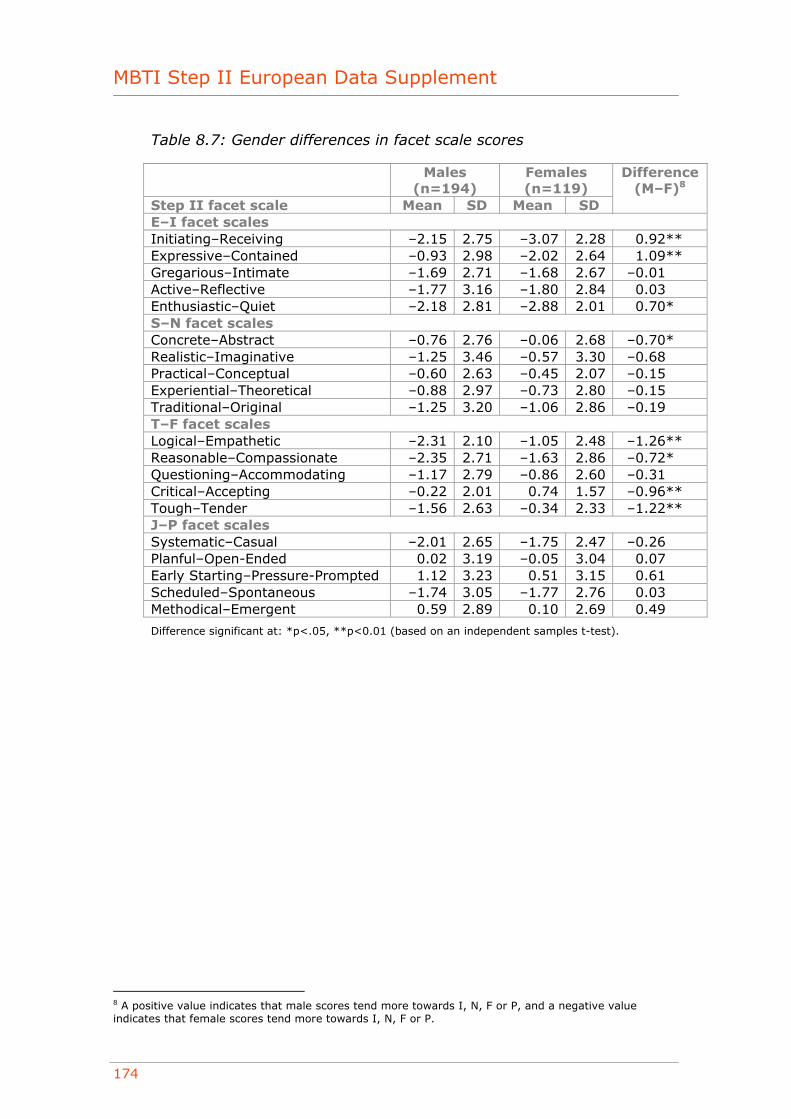
MBTI Step II European Data Supplement
174
Table 8.7: Gender differences in facet scale scores
Males (n=194)
Females (n=119)
Step II facet scale Mean SD Mean SD
Difference (M–F)8
E–I facet scales Initiating–Receiving –2.15 2.75 –3.07 2.28 0.92** Expressive–Contained –0.93 2.98 –2.02 2.64 1.09** Gregarious–Intimate –1.69 2.71 –1.68 2.67 –0.01 Active–Reflective –1.77 3.16 –1.80 2.84 0.03 Enthusiastic–Quiet –2.18 2.81 –2.88 2.01 0.70* S–N facet scales Concrete–Abstract –0.76 2.76 –0.06 2.68 –0.70* Realistic–Imaginative –1.25 3.46 –0.57 3.30 –0.68 Practical–Conceptual –0.60 2.63 –0.45 2.07 –0.15 Experiential–Theoretical –0.88 2.97 –0.73 2.80 –0.15 Traditional–Original –1.25 3.20 –1.06 2.86 –0.19 T–F facet scales Logical–Empathetic –2.31 2.10 –1.05 2.48 –1.26** Reasonable–Compassionate –2.35 2.71 –1.63 2.86 –0.72* Questioning–Accommodating –1.17 2.79 –0.86 2.60 –0.31 Critical–Accepting –0.22 2.01 0.74 1.57 –0.96** Tough–Tender –1.56 2.63 –0.34 2.33 –1.22** J–P facet scales Systematic–Casual –2.01 2.65 –1.75 2.47 –0.26 Planful–Open-Ended 0.02 3.19 –0.05 3.04 0.07 Early Starting–Pressure-Prompted 1.12 3.23 0.51 3.15 0.61 Scheduled–Spontaneous –1.74 3.05 –1.77 2.76 0.03 Methodical–Emergent 0.59 2.89 0.10 2.69 0.49
Difference significant at: *p<.05, **p<0.01 (based on an independent samples t-test).
8 A positive value indicates that male scores tend more towards I, N, F or P, and a negative value indicates that female scores tend more towards I, N, F or P.
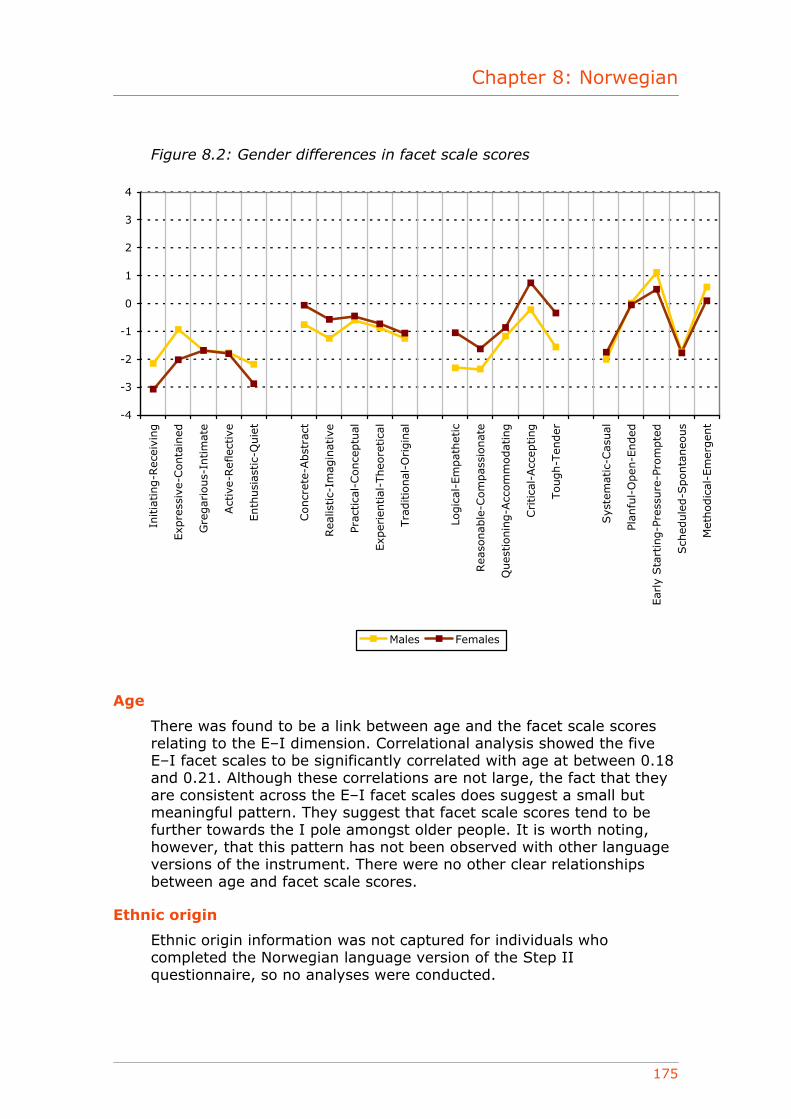
Chapter 8: Norwegian
175
Figure 8.2: Gender differences in facet scale scores
-4
-3
-2
-1
0
1
2
3
4
Initia
ting-R
ecei
ving
Exp
ress
ive-
Conta
ined
Gre
gar
ious-
Intim
ate
Act
ive-
Ref
lect
ive
Enth
usi
astic-
Quie
t
Concr
ete-
Abst
ract
Rea
listic-
Imag
inat
ive
Prac
tica
l-Conce
ptu
al
Exp
erie
ntial
-Theo
retica
l
Tra
ditio
nal
-Origin
al
Logic
al-E
mpat
het
ic
Rea
sonab
le-C
om
pas
sionat
e
Ques
tionin
g-A
ccom
modat
ing
Critica
l-Acc
epting
Tough-T
ender
Sys
tem
atic
-Cas
ual
Plan
ful-
Open
-Ended
Ear
ly S
tart
ing-P
ress
ure
-Pro
mpte
d
Sch
edule
d-S
ponta
neo
us
Met
hodic
al-E
mer
gen
t
Males Females
Age
There was found to be a link between age and the facet scale scores relating to the E–I dimension. Correlational analysis showed the five E–I facet scales to be significantly correlated with age at between 0.18 and 0.21. Although these correlations are not large, the fact that they are consistent across the E–I facet scales does suggest a small but meaningful pattern. They suggest that facet scale scores tend to be further towards the I pole amongst older people. It is worth noting, however, that this pattern has not been observed with other language versions of the instrument. There were no other clear relationships between age and facet scale scores.
Ethnic origin
Ethnic origin information was not captured for individuals who completed the Norwegian language version of the Step II questionnaire, so no analyses were conducted.
MBTI Step II European Data Supplement
176
Occupational level
Research using the Norwegian version of the MBTI Step I questionnaire has demonstrated that individuals in higher-level jobs in organisations are more likely to have preferences for Thinking than those in lower-level jobs.9
Although occupational level data were captured for the Norwegian sample, the number of people in each of the categories was too small to allow a full analysis. Therefore, individuals were split into three categories, ‘Employee’, ‘Supervisory and management’ and ‘Top level’. These categories were used for the analysis. Table 8.8 shows the facet scale means and standard deviations for these groups, with the data represented graphically in Figure 8.3.
No consistently significant patterns were found regarding the facets relating to each of the dimensions. This may, in part, be due to the relatively small sample sizes. However, there is a tendency for the ‘Employee’ groups to score more towards the I, S, F and J poles than the other two groups.
These findings should be treated with caution owing to the small sample sizes on which they are based.
9 See the MBTI Step I European Data Supplement for details.
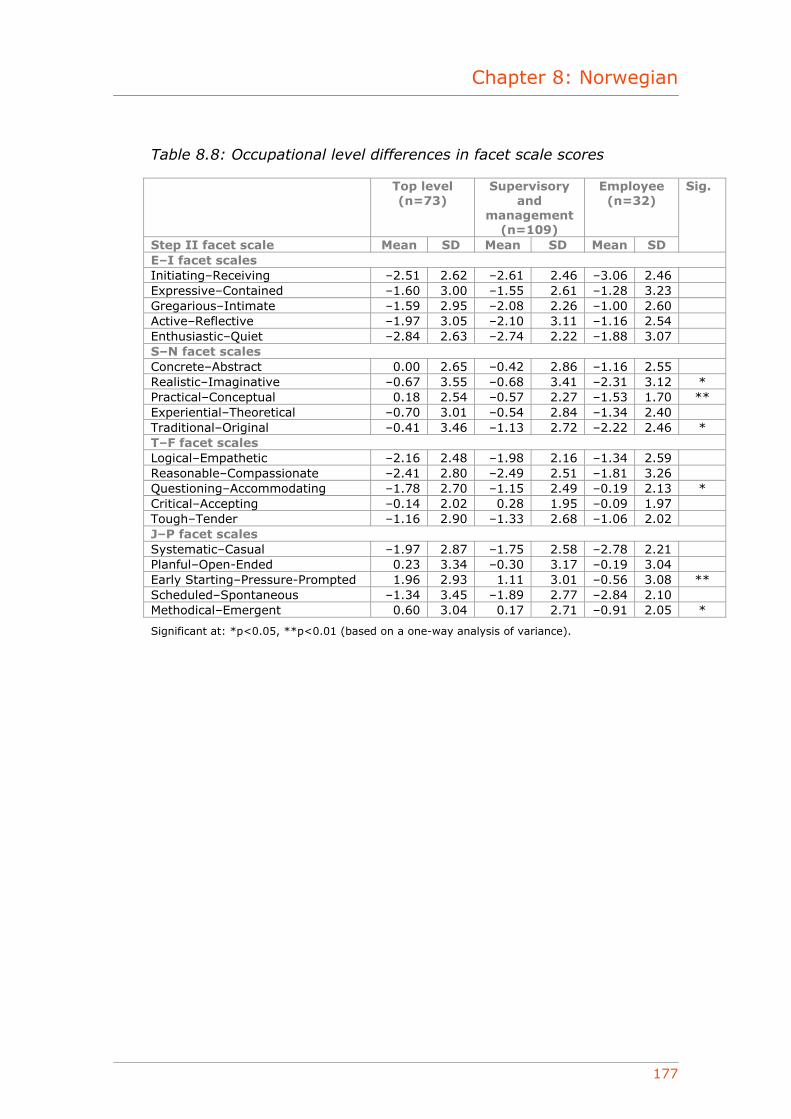
Chapter 8: Norwegian
177
Table 8.8: Occupational level differences in facet scale scores
Top level (n=73)
Supervisory and
management (n=109)
Employee (n=32)
Step II facet scale Mean SD Mean SD Mean SD
Sig.
E–I facet scales Initiating–Receiving –2.51 2.62 –2.61 2.46 –3.06 2.46 Expressive–Contained –1.60 3.00 –1.55 2.61 –1.28 3.23 Gregarious–Intimate –1.59 2.95 –2.08 2.26 –1.00 2.60 Active–Reflective –1.97 3.05 –2.10 3.11 –1.16 2.54 Enthusiastic–Quiet –2.84 2.63 –2.74 2.22 –1.88 3.07 S–N facet scales Concrete–Abstract 0.00 2.65 –0.42 2.86 –1.16 2.55 Realistic–Imaginative –0.67 3.55 –0.68 3.41 –2.31 3.12 * Practical–Conceptual 0.18 2.54 –0.57 2.27 –1.53 1.70 ** Experiential–Theoretical –0.70 3.01 –0.54 2.84 –1.34 2.40 Traditional–Original –0.41 3.46 –1.13 2.72 –2.22 2.46 * T–F facet scales Logical–Empathetic –2.16 2.48 –1.98 2.16 –1.34 2.59 Reasonable–Compassionate –2.41 2.80 –2.49 2.51 –1.81 3.26 Questioning–Accommodating –1.78 2.70 –1.15 2.49 –0.19 2.13 * Critical–Accepting –0.14 2.02 0.28 1.95 –0.09 1.97 Tough–Tender –1.16 2.90 –1.33 2.68 –1.06 2.02 J–P facet scales Systematic–Casual –1.97 2.87 –1.75 2.58 –2.78 2.21 Planful–Open-Ended 0.23 3.34 –0.30 3.17 –0.19 3.04 Early Starting–Pressure-Prompted 1.96 2.93 1.11 3.01 –0.56 3.08 ** Scheduled–Spontaneous –1.34 3.45 –1.89 2.77 –2.84 2.10 Methodical–Emergent 0.60 3.04 0.17 2.71 –0.91 2.05 *
Significant at: *p<0.05, **p<0.01 (based on a one-way analysis of variance).
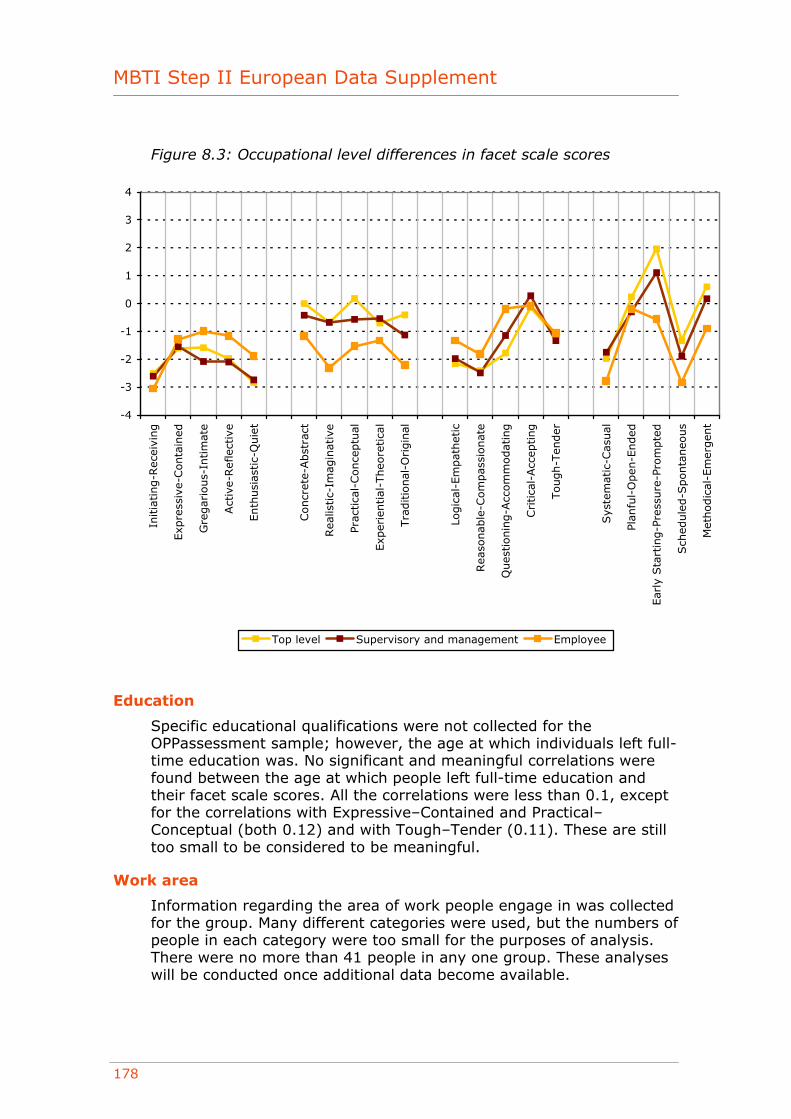
MBTI Step II European Data Supplement
178
Figure 8.3: Occupational level differences in facet scale scores
-4
-3
-2
-1
0
1
2
3
4
Initia
ting-R
ecei
ving
Exp
ress
ive-
Conta
ined
Gre
gar
ious-
Intim
ate
Act
ive-
Ref
lect
ive
Enth
usi
astic-
Quie
t
Concr
ete-
Abst
ract
Rea
listic-
Imag
inat
ive
Prac
tica
l-Conce
ptu
al
Exp
erie
ntial
-Theo
retica
l
Tra
ditio
nal
-Origin
al
Logic
al-E
mpat
het
ic
Rea
sonab
le-C
om
pas
sionat
e
Ques
tionin
g-A
ccom
modat
ing
Critica
l-Acc
epting
Tough-T
ender
Sys
tem
atic
-Cas
ual
Plan
ful-
Open
-Ended
Ear
ly S
tart
ing-P
ress
ure
-Pro
mpte
d
Sch
edule
d-S
ponta
neo
us
Met
hodic
al-E
mer
gen
t
Top level Supervisory and management Employee
Education
Specific educational qualifications were not collected for the OPPassessment sample; however, the age at which individuals left full-time education was. No significant and meaningful correlations were found between the age at which people left full-time education and their facet scale scores. All the correlations were less than 0.1, except for the correlations with Expressive–Contained and Practical–Conceptual (both 0.12) and with Tough–Tender (0.11). These are still too small to be considered to be meaningful.
Work area
Information regarding the area of work people engage in was collected for the group. Many different categories were used, but the numbers of people in each category were too small for the purposes of analysis. There were no more than 41 people in any one group. These analyses will be conducted once additional data become available.
Chapter 8: Norwegian
179
Nationality
Information on nationality was gathered for 76% of the group. Of these, 98% were Norwegian. There were insufficient people of other nationalities for it to be possible to conduct any analyses across groups.
Employment status
Employment status information was gathered for 71% of the group. Of these, 96% worked full-time. There were insufficient people who did not work full-time for it to be possible to conduct any analyses across groups.
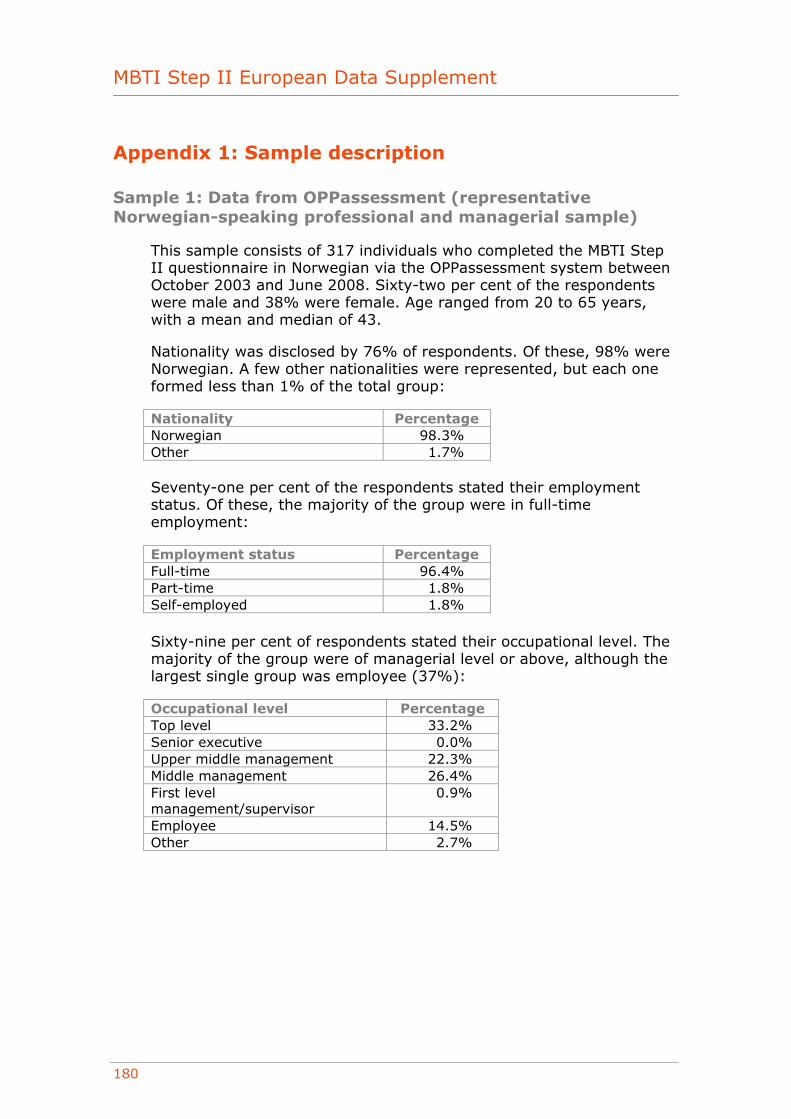
MBTI Step II European Data Supplement
180
Appendix 1: Sample description
Sample 1: Data from OPPassessment (representative Norwegian-speaking professional and managerial sample)
This sample consists of 317 individuals who completed the MBTI Step II questionnaire in Norwegian via the OPPassessment system between October 2003 and June 2008. Sixty-two per cent of the respondents were male and 38% were female. Age ranged from 20 to 65 years, with a mean and median of 43.
Nationality was disclosed by 76% of respondents. Of these, 98% were Norwegian. A few other nationalities were represented, but each one formed less than 1% of the total group:
Nationality Percentage Norwegian 98.3% Other 1.7%
Seventy-one per cent of the respondents stated their employment status. Of these, the majority of the group were in full-time employment:
Employment status Percentage Full-time 96.4% Part-time 1.8% Self-employed 1.8%
Sixty-nine per cent of respondents stated their occupational level. The majority of the group were of managerial level or above, although the largest single group was employee (37%):
Occupational level Percentage Top level 33.2% Senior executive 0.0% Upper middle management 22.3% Middle management 26.4% First level management/supervisor
0.9%
Employee 14.5% Other 2.7%
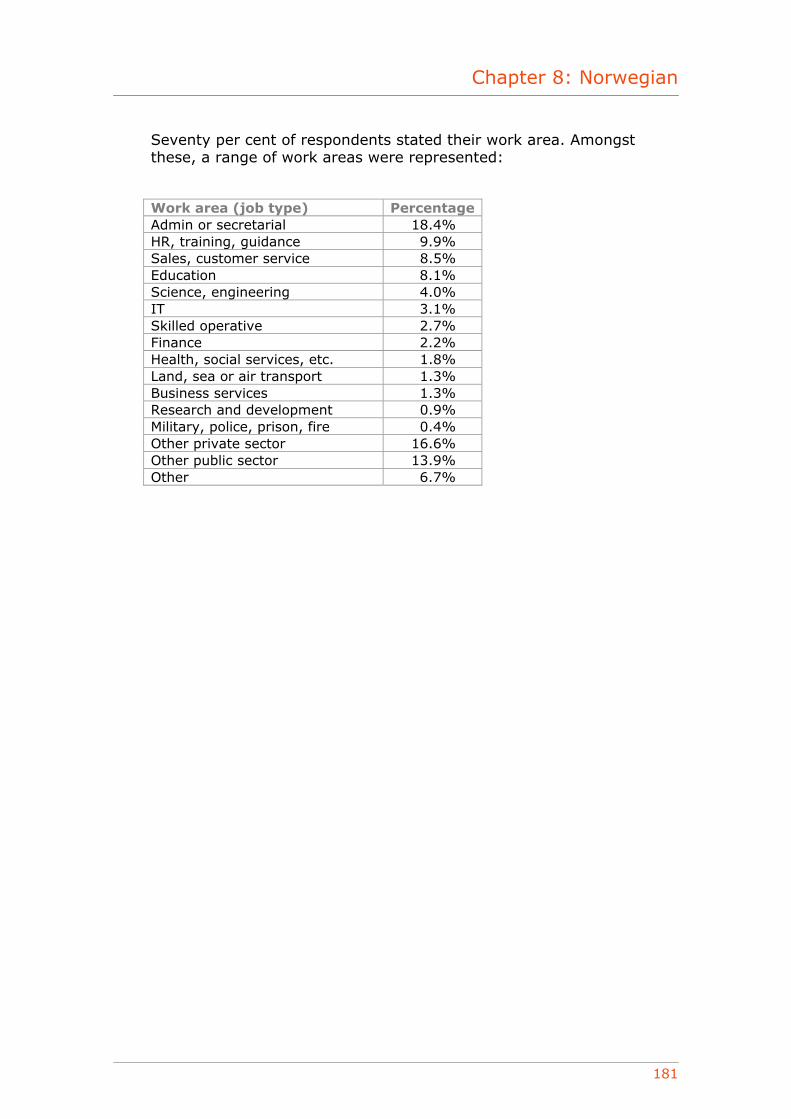
Chapter 8: Norwegian
181
Seventy per cent of respondents stated their work area. Amongst these, a range of work areas were represented:
Work area (job type) Percentage Admin or secretarial 18.4% HR, training, guidance 9.9% Sales, customer service 8.5% Education 8.1% Science, engineering 4.0% IT 3.1% Skilled operative 2.7% Finance 2.2% Health, social services, etc. 1.8% Land, sea or air transport 1.3% Business services 1.3% Research and development 0.9% Military, police, prison, fire 0.4% Other private sector 16.6% Other public sector 13.9% Other 6.7%

MBTI Step II European Data Supplement
182

Chapter 9: Spanish
183
European Data Supplement Spanish
January 2009
OPP Ltd Elsfield Hall
15–17 Elsfield Way Oxford OX2 8EP
UK t: +44 (0)845 603 9958 f: +44 (0)1865 557483
MBTI® Step II instrument
MBTI Step II European Data Supplement
184
Contents
Introduction ........................................................................... 185 Type distribution ..................................................................... 186
OPPassessment data (representative Spanish-speaking professional and managerial sample).................................................... 187
Properties of the Step II facet scales .......................................... 188 Facet scale score distribution................................................. 188 Facet scale intercorrelations .................................................. 190 Correlations of Step II facet scales with Step I scales................ 192 Out-of-preference scores ...................................................... 193 Reliability ........................................................................... 194 Group differences ................................................................ 195
Appendix 1: Sample description ................................................ 199 Sample 1: Data from OPPassessment (representative Spanish-
speaking professional and managerial sample) ..................... 199
© Copyright 2009 OPP Ltd. All rights reserved.
No portion of this publication may be translated or reproduced in whole or in part, stored in a retrieval system, or transmitted in any form or by any means (electronic, mechanical, photocopying, recording or otherwise) without the prior written permission of the copyright owner. No part of this publication is reproducible under any photocopying licence scheme. OPP Ltd grants the downloader a personal, non-transferable, perpetual, irrevocable right to use the Supplement. The European Data Supplement (‘the Supplement’) is for personal use only and may not be sold on or circulated to third parties.
® MBTI, Myers-Briggs, the Myers-Briggs Type Indicator and the MBTI logo are registered trade marks of the Myers-Briggs Type Indicator Trust. OPP is licensed to use the trade marks in Europe.
® OPP is a registered trade mark of OPP Ltd in the European Community.
Chapter 9: Spanish
185
Introduction
Data collected for the European MBTI Step II instrument were analysed to produce the findings in this supplement. This is the first data supplement produced for this instrument, and contains all the data gathered to date since the launch of the instrument in 2003. A brief description of the sample is given below. Further details of the sample are provided in Appendix 1.
• The sample consisted of 242 individuals who completed the MBTI Step II instrument in Spanish via the OPPassessment system between 2003 and mid-2008.1 This sample is considered to be representative of the groups of people with whom the Spanish MBTI Step II instrument has been and will be used for applications such as management development, coaching, counselling and teambuilding. As such, it is likely to represent a cross-section of the Spanish-speaking professional and managerial population.
The results of the analyses are outlined below.
1 OPPassessment allows personality questionnaires such as the MBTI instrument to be administered via email and/or completed online.

MBTI Step II European Data Supplement
186
Type distribution
Type tables are a way of illustrating the proportion of each type within a particular group. Below is a type table taken from the sample described on the previous page.
For each of the 16 different types, the number of cases, the percentage of the total that this represents and the self-selection ratio (SSR) are shown. The SSR (Myers et al., 1998) is a way of demonstrating whether a given type appears more or less often in a particular group than would be expected given its frequency in a reference group. Ideally, the type distribution from a large representative sample of the Spanish population would be used to calculate SSRs in this data supplement. However, such a sample does not currently exist. In its place, SSRs have been calculated using type data from the UK general population (Kendall, 1998), which can be justified by the fact that type distributions for comparable Spanish and British groups, such as managers and professionals, are similar. Evidence (eg Hackston and Kendall, 2004; Quenk et al., 2004) does suggest that although type-related behaviours vary a good deal from country to country and from culture to culture, the frequencies of underlying MBTI types do not.
An SSR of greater than 1 indicates that a type is over-represented, and an SSR of less than 1 denotes that it is under-represented. Asterisks are used to denote whether the over- or under-representations are statistically significant, based on the results of chi-square analysis.2
2 Chi-square analysis (often abbreviated to χ2) is a technique used to explore whether observed frequency distributions differ significantly from other, predefined, distributions. In this case, the UK general population group is used as the reference group, and the chi-square analysis indicates whether the proportion of people of each type within a particular sample differs significantly from the proportion of people reporting the same type within the reference group.
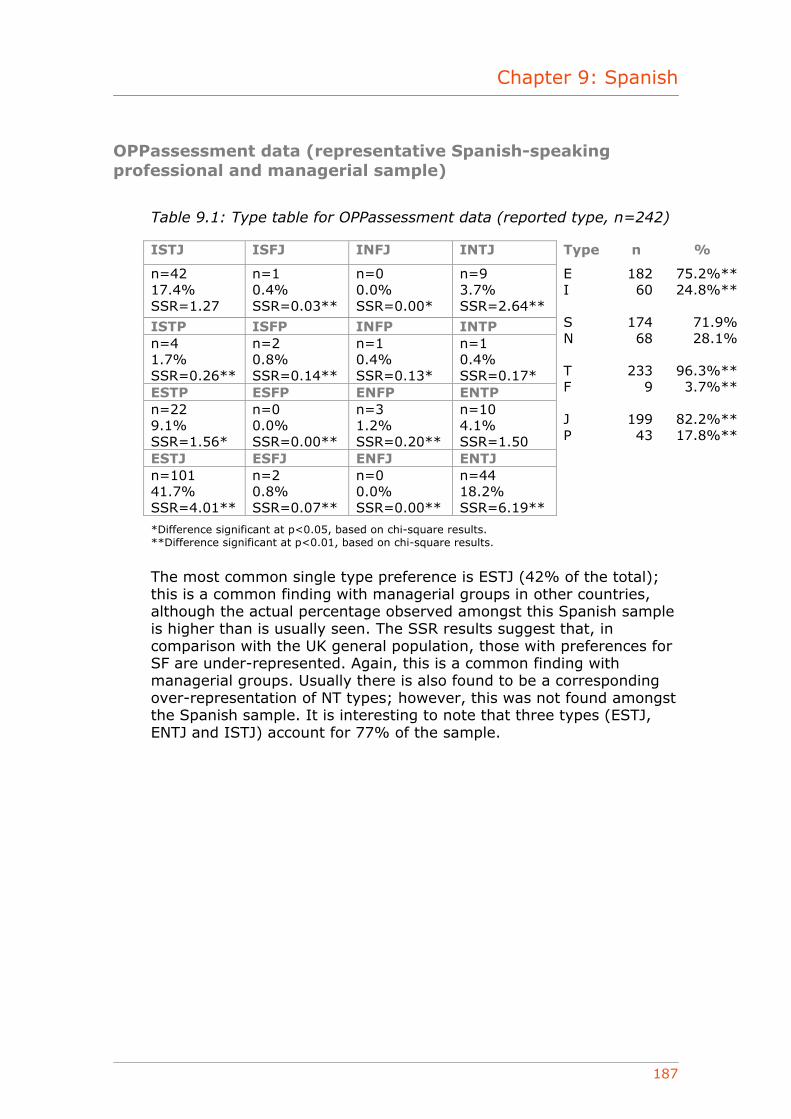
Chapter 9: Spanish
187
OPPassessment data (representative Spanish-speaking professional and managerial sample)
Table 9.1: Type table for OPPassessment data (reported type, n=242)
ISTJ ISFJ INFJ INTJ Type n %
n=42 17.4% SSR=1.27
n=1 0.4% SSR=0.03**
n=0 0.0% SSR=0.00*
n=9 3.7% SSR=2.64**
ISTP ISFP INFP INTP n=4 1.7% SSR=0.26**
n=2 0.8% SSR=0.14**
n=1 0.4% SSR=0.13*
n=1 0.4% SSR=0.17*
ESTP ESFP ENFP ENTP n=22 9.1% SSR=1.56*
n=0 0.0% SSR=0.00**
n=3 1.2% SSR=0.20**
n=10 4.1% SSR=1.50
ESTJ ESFJ ENFJ ENTJ n=101 41.7% SSR=4.01**
n=2 0.8% SSR=0.07**
n=0 0.0% SSR=0.00**
n=44 18.2% SSR=6.19**
E I S N T F J P
182 60
174 68
233
9
199 43
75.2%** 24.8%**
71.9% 28.1%
96.3%** 3.7%**
82.2%** 17.8%**
*Difference significant at p<0.05, based on chi-square results. **Difference significant at p<0.01, based on chi-square results.
The most common single type preference is ESTJ (42% of the total); this is a common finding with managerial groups in other countries, although the actual percentage observed amongst this Spanish sample is higher than is usually seen. The SSR results suggest that, in comparison with the UK general population, those with preferences for SF are under-represented. Again, this is a common finding with managerial groups. Usually there is also found to be a corresponding over-representation of NT types; however, this was not found amongst the Spanish sample. It is interesting to note that three types (ESTJ, ENTJ and ISTJ) account for 77% of the sample.

MBTI Step II European Data Supplement
188
Properties of the Step II facet scales
Facet scale score distribution
The means and standard deviations of the Step II facets are shown in Table 9.2 and illustrated graphically in Figure 9.1. The mean score for a scale is calculated by adding together the scores of each individual in the sample and then dividing the sum by the number of individuals. Note that negative values indicate that mean scores are nearer the left-hand pole of the facet and positive values indicate that the mean scores are nearer the right-hand pole. The standard deviation (SD) is a statistical measure describing the degree to which the scores from the sample either bunch up close to, or are scattered widely around, the mean for the sample.
Table 9.2: Means and standard deviations of the facet scales
Step II facet scale Mean3 SD E–I facet scales Initiating–Receiving –1.89 3.02 Expressive–Contained –1.45 2.73 Gregarious–Intimate –1.40 2.61 Active–Reflective –1.46 2.76 Enthusiastic–Quiet –0.73 2.73 S–N facet scales Concrete–Abstract –2.27 2.34 Realistic–Imaginative –2.10 2.87 Practical–Conceptual –0.93 2.63 Experiential–Theoretical –2.30 2.44 Traditional–Original –0.82 2.78 T–F facet scales Logical–Empathetic –2.81 2.47 Reasonable–Compassionate –3.76 2.00 Questioning–Accommodating –0.28 2.32 Critical–Accepting –0.08 1.89 Tough–Tender –1.56 2.78 J–P facet scales Systematic–Casual –2.88 2.23 Planful–Open-Ended –1.36 3.39 Early Starting–Pressure-Prompted –2.16 2.83 Scheduled–Spontaneous –2.71 2.15 Methodical–Emergent –2.39 2.45
3 Scale means: in Step II reports, scores are given from 5 on one pole, through 0, to 5 on the opposite pole. In compiling statistical information, however, one pole needs to be clearly distinguished from the other. Throughout this data supplement, therefore, a convention has been adopted of scores 5, 4, 3, 2 or 1 on the left-hand pole being assigned values of –5, –4, –3, –2, or –1 and scores on the right-hand pole being assigned positive scores. This does not, of course, imply any suggestion that positive scores are ‘better’ than negative scores.
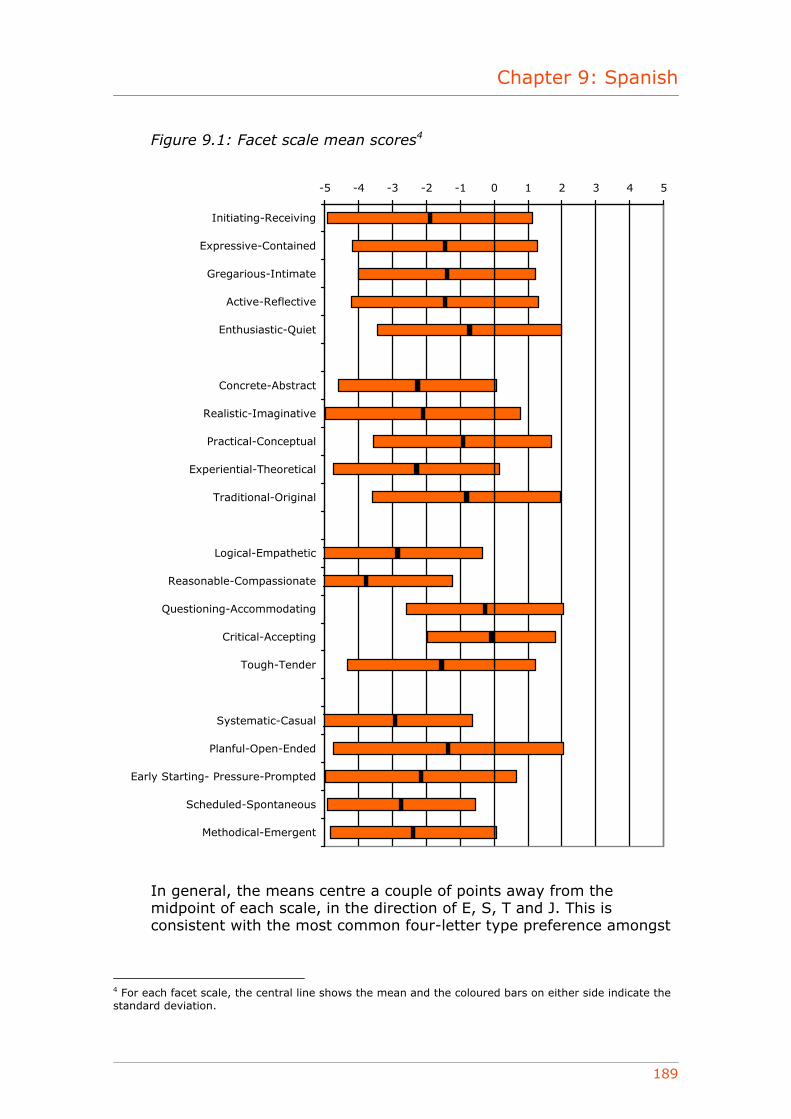
Chapter 9: Spanish
189
Figure 9.1: Facet scale mean scores4
-5 -4 -3 -2 -1 0 1 2 3 4 5
Initiating-Receiving
Expressive-Contained
Gregarious-Intimate
Active-Reflective
Enthusiastic-Quiet
Concrete-Abstract
Realistic-Imaginative
Practical-Conceptual
Experiential-Theoretical
Traditional-Original
Logical-Empathetic
Reasonable-Compassionate
Questioning-Accommodating
Critical-Accepting
Tough-Tender
Systematic-Casual
Planful-Open-Ended
Early Starting- Pressure-Prompted
Scheduled-Spontaneous
Methodical-Emergent
In general, the means centre a couple of points away from the midpoint of each scale, in the direction of E, S, T and J. This is consistent with the most common four-letter type preference amongst
4 For each facet scale, the central line shows the mean and the coloured bars on either side indicate the standard deviation.
MBTI Step II European Data Supplement
190
this sample. Amongst the group as a whole, there are more individuals with a preference for E, S, T and J.
Facet scale intercorrelations
Correlations among the Step II facet scales are shown in Table 9.3. Facet scales within each dichotomy usually correlate more highly (often substantially so) with the other scales of the same dichotomy than they do with scales in the other three dichotomies. For example, every E–I facet scale correlates more highly with the other four E–I scales than with any of the S–N, T–F or J–P facet scales.
There is only one scale that correlates significantly more highly with scales in other dichotomies. The T–F scale Questioning–Accommodating correlates with many scales, across dichotomies. For example, it correlates at a level of between 0.14 and 0.21 with all of the E–I facet scales, and at between –0.09 and –0.35 with all of the S–N scales. By way of comparison, it correlates at between 0.02 and 0.10 with the other four scales on the same dichotomy as itself (T–F). The negative correlations between Questioning–Accommodating and the S–N scales are consistent with findings with the US version of the Step II instrument, and suggest that a questioning approach to differences of opinion seems to be related to a range of Intuitive (N) facets. These patterns are similar to those found when the European Step II instrument was developed.
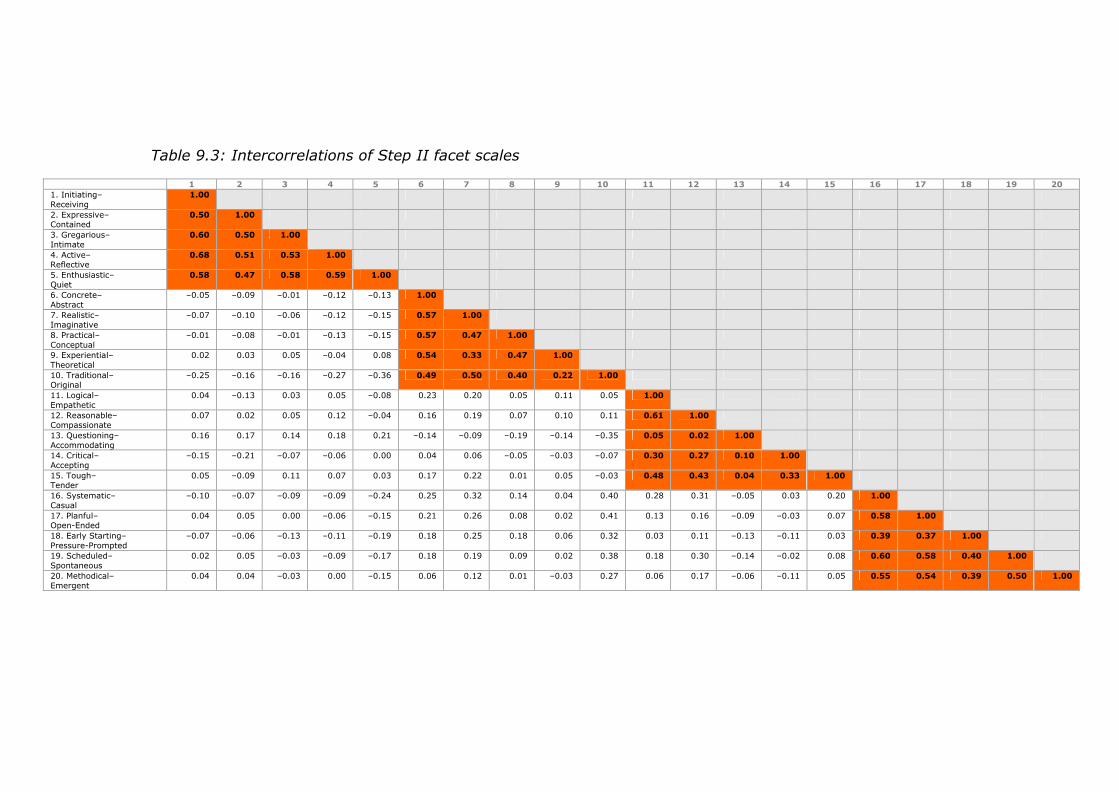
Table 9.3: Intercorrelations of Step II facet scales
1 2 3 4 5 6 7 8 9 10 11 12 13 14 15 16 17 18 19 20 1. Initiating– Receiving
1.00
2. Expressive– Contained
0.50 1.00
3. Gregarious– Intimate
0.60 0.50 1.00
4. Active– Reflective
0.68 0.51 0.53 1.00
5. Enthusiastic– Quiet
0.58 0.47 0.58 0.59 1.00
6. Concrete– Abstract
–0.05 –0.09 –0.01 –0.12 –0.13 1.00
7. Realistic– Imaginative
–0.07 –0.10 –0.06 –0.12 –0.15 0.57 1.00
8. Practical– Conceptual
–0.01 –0.08 –0.01 –0.13 –0.15 0.57 0.47 1.00
9. Experiential– Theoretical
0.02 0.03 0.05 –0.04 0.08 0.54 0.33 0.47 1.00
10. Traditional– Original
–0.25 –0.16 –0.16 –0.27 –0.36 0.49 0.50 0.40 0.22 1.00
11. Logical– Empathetic
0.04 –0.13 0.03 0.05 –0.08 0.23 0.20 0.05 0.11 0.05 1.00
12. Reasonable– Compassionate
0.07 0.02 0.05 0.12 –0.04 0.16 0.19 0.07 0.10 0.11 0.61 1.00
13. Questioning– Accommodating
0.16 0.17 0.14 0.18 0.21 –0.14 –0.09 –0.19 –0.14 –0.35 0.05 0.02 1.00
14. Critical– Accepting
–0.15 –0.21 –0.07 –0.06 0.00 0.04 0.06 –0.05 –0.03 –0.07 0.30 0.27 0.10 1.00
15. Tough– Tender
0.05 –0.09 0.11 0.07 0.03 0.17 0.22 0.01 0.05 –0.03 0.48 0.43 0.04 0.33 1.00
16. Systematic– Casual
–0.10 –0.07 –0.09 –0.09 –0.24 0.25 0.32 0.14 0.04 0.40 0.28 0.31 –0.05 0.03 0.20 1.00
17. Planful– Open-Ended
0.04 0.05 0.00 –0.06 –0.15 0.21 0.26 0.08 0.02 0.41 0.13 0.16 –0.09 –0.03 0.07 0.58 1.00
18. Early Starting– Pressure-Prompted
–0.07 –0.06 –0.13 –0.11 –0.19 0.18 0.25 0.18 0.06 0.32 0.03 0.11 –0.13 –0.11 0.03 0.39 0.37 1.00
19. Scheduled– Spontaneous
0.02 0.05 –0.03 –0.09 –0.17 0.18 0.19 0.09 0.02 0.38 0.18 0.30 –0.14 –0.02 0.08 0.60 0.58 0.40 1.00
20. Methodical– Emergent
0.04 0.04 –0.03 0.00 –0.15 0.06 0.12 0.01 –0.03 0.27 0.06 0.17 –0.06 –0.11 0.05 0.55 0.54 0.39 0.50 1.00
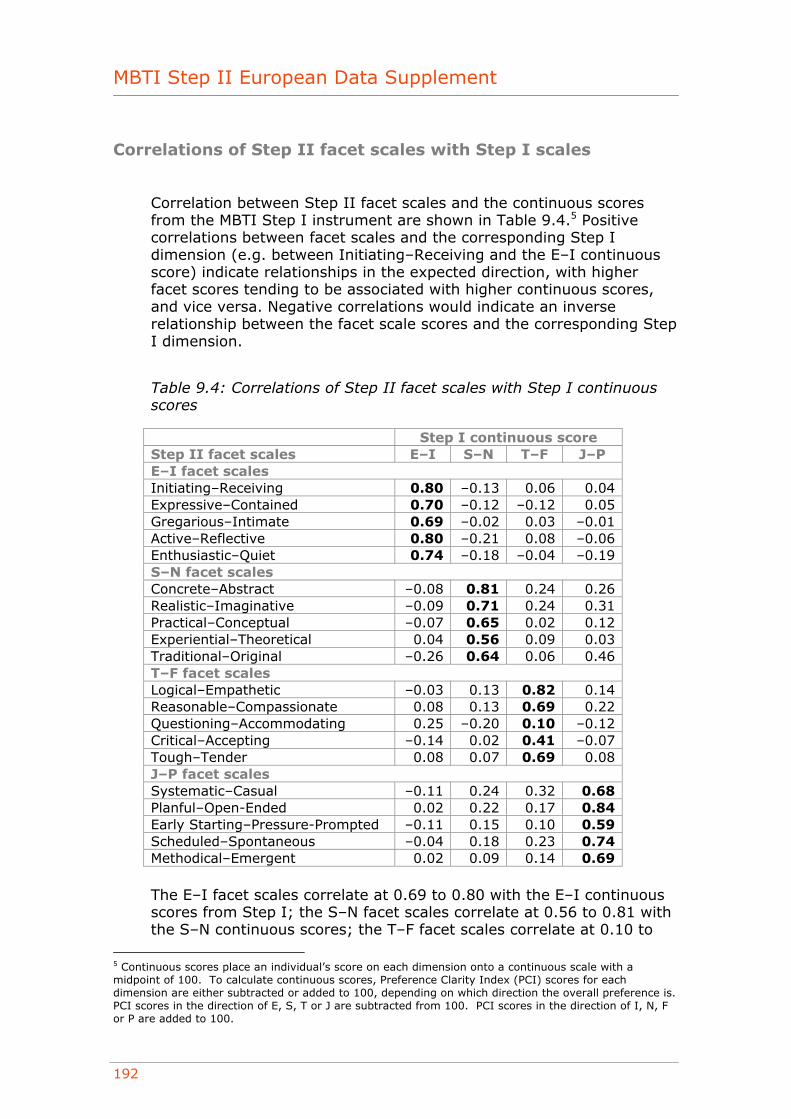
MBTI Step II European Data Supplement
192
Correlations of Step II facet scales with Step I scales
Correlation between Step II facet scales and the continuous scores from the MBTI Step I instrument are shown in Table 9.4.5 Positive correlations between facet scales and the corresponding Step I dimension (e.g. between Initiating–Receiving and the E–I continuous score) indicate relationships in the expected direction, with higher facet scores tending to be associated with higher continuous scores, and vice versa. Negative correlations would indicate an inverse relationship between the facet scale scores and the corresponding Step I dimension.
Table 9.4: Correlations of Step II facet scales with Step I continuous scores
Step I continuous score Step II facet scales E–I S–N T–F J–P E–I facet scales Initiating–Receiving 0.80 –0.13 0.06 0.04 Expressive–Contained 0.70 –0.12 –0.12 0.05 Gregarious–Intimate 0.69 –0.02 0.03 –0.01 Active–Reflective 0.80 –0.21 0.08 –0.06 Enthusiastic–Quiet 0.74 –0.18 –0.04 –0.19 S–N facet scales Concrete–Abstract –0.08 0.81 0.24 0.26 Realistic–Imaginative –0.09 0.71 0.24 0.31 Practical–Conceptual –0.07 0.65 0.02 0.12 Experiential–Theoretical 0.04 0.56 0.09 0.03 Traditional–Original –0.26 0.64 0.06 0.46 T–F facet scales Logical–Empathetic –0.03 0.13 0.82 0.14 Reasonable–Compassionate 0.08 0.13 0.69 0.22 Questioning–Accommodating 0.25 –0.20 0.10 –0.12 Critical–Accepting –0.14 0.02 0.41 –0.07 Tough–Tender 0.08 0.07 0.69 0.08 J–P facet scales Systematic–Casual –0.11 0.24 0.32 0.68 Planful–Open-Ended 0.02 0.22 0.17 0.84 Early Starting–Pressure-Prompted –0.11 0.15 0.10 0.59 Scheduled–Spontaneous –0.04 0.18 0.23 0.74 Methodical–Emergent 0.02 0.09 0.14 0.69
The E–I facet scales correlate at 0.69 to 0.80 with the E–I continuous scores from Step I; the S–N facet scales correlate at 0.56 to 0.81 with the S–N continuous scores; the T–F facet scales correlate at 0.10 to
5 Continuous scores place an individual’s score on each dimension onto a continuous scale with a midpoint of 100. To calculate continuous scores, Preference Clarity Index (PCI) scores for each dimension are either subtracted or added to 100, depending on which direction the overall preference is. PCI scores in the direction of E, S, T or J are subtracted from 100. PCI scores in the direction of I, N, F or P are added to 100.
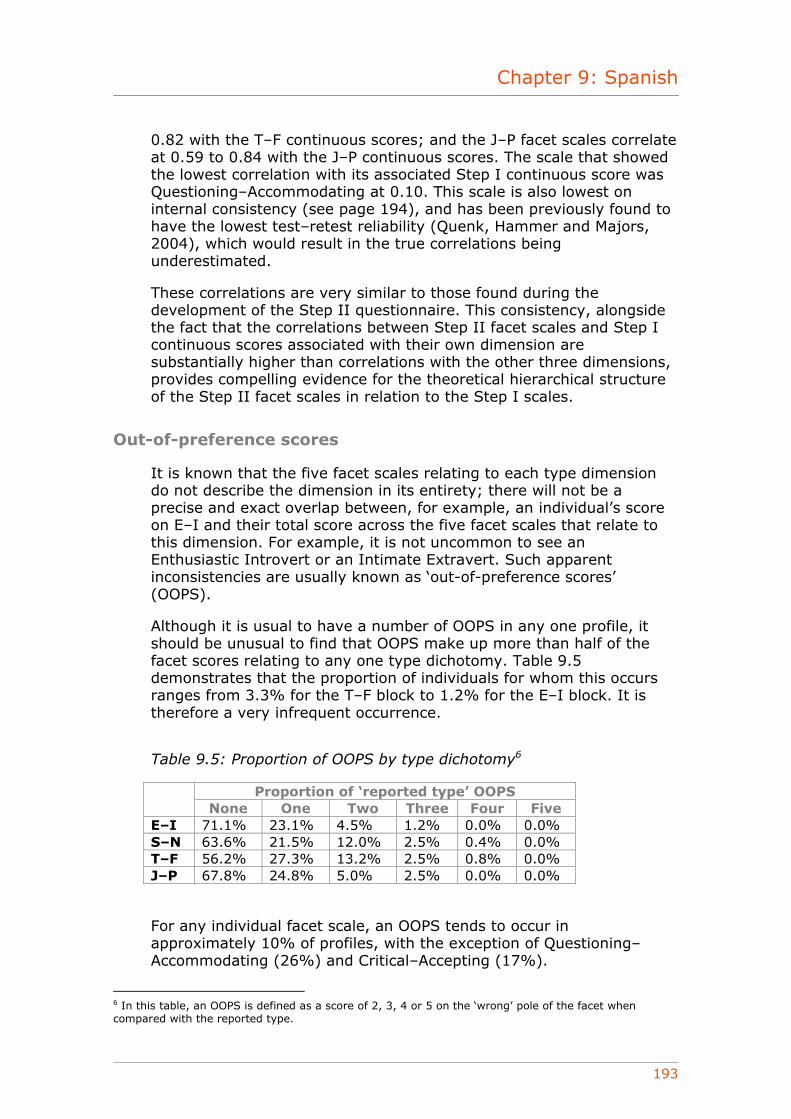
Chapter 9: Spanish
193
0.82 with the T–F continuous scores; and the J–P facet scales correlate at 0.59 to 0.84 with the J–P continuous scores. The scale that showed the lowest correlation with its associated Step I continuous score was Questioning–Accommodating at 0.10. This scale is also lowest on internal consistency (see page 194), and has been previously found to have the lowest test–retest reliability (Quenk, Hammer and Majors, 2004), which would result in the true correlations being underestimated.
These correlations are very similar to those found during the development of the Step II questionnaire. This consistency, alongside the fact that the correlations between Step II facet scales and Step I continuous scores associated with their own dimension are substantially higher than correlations with the other three dimensions, provides compelling evidence for the theoretical hierarchical structure of the Step II facet scales in relation to the Step I scales.
Out-of-preference scores
It is known that the five facet scales relating to each type dimension do not describe the dimension in its entirety; there will not be a precise and exact overlap between, for example, an individual’s score on E–I and their total score across the five facet scales that relate to this dimension. For example, it is not uncommon to see an Enthusiastic Introvert or an Intimate Extravert. Such apparent inconsistencies are usually known as ‘out-of-preference scores’ (OOPS).
Although it is usual to have a number of OOPS in any one profile, it should be unusual to find that OOPS make up more than half of the facet scores relating to any one type dichotomy. Table 9.5 demonstrates that the proportion of individuals for whom this occurs ranges from 3.3% for the T–F block to 1.2% for the E–I block. It is therefore a very infrequent occurrence.
Table 9.5: Proportion of OOPS by type dichotomy6
Proportion of ‘reported type’ OOPS None One Two Three Four Five
E–I 71.1% 23.1% 4.5% 1.2% 0.0% 0.0% S–N 63.6% 21.5% 12.0% 2.5% 0.4% 0.0% T–F 56.2% 27.3% 13.2% 2.5% 0.8% 0.0% J–P 67.8% 24.8% 5.0% 2.5% 0.0% 0.0%
For any individual facet scale, an OOPS tends to occur in approximately 10% of profiles, with the exception of Questioning–Accommodating (26%) and Critical–Accepting (17%).
6 In this table, an OOPS is defined as a score of 2, 3, 4 or 5 on the ‘wrong’ pole of the facet when compared with the reported type.
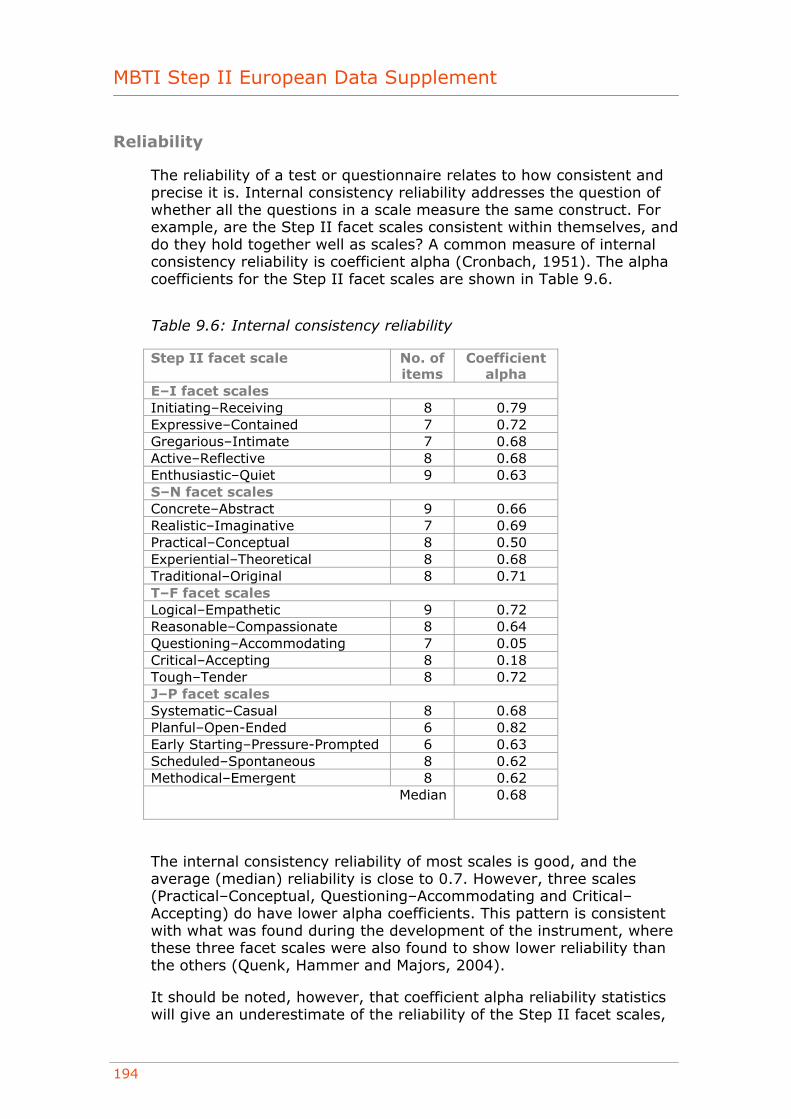
MBTI Step II European Data Supplement
194
Reliability
The reliability of a test or questionnaire relates to how consistent and precise it is. Internal consistency reliability addresses the question of whether all the questions in a scale measure the same construct. For example, are the Step II facet scales consistent within themselves, and do they hold together well as scales? A common measure of internal consistency reliability is coefficient alpha (Cronbach, 1951). The alpha coefficients for the Step II facet scales are shown in Table 9.6.
Table 9.6: Internal consistency reliability
Step II facet scale No. of items
Coefficient alpha
E–I facet scales Initiating–Receiving 8 0.79 Expressive–Contained 7 0.72 Gregarious–Intimate 7 0.68 Active–Reflective 8 0.68 Enthusiastic–Quiet 9 0.63 S–N facet scales Concrete–Abstract 9 0.66 Realistic–Imaginative 7 0.69 Practical–Conceptual 8 0.50 Experiential–Theoretical 8 0.68 Traditional–Original 8 0.71 T–F facet scales Logical–Empathetic 9 0.72 Reasonable–Compassionate 8 0.64 Questioning–Accommodating 7 0.05 Critical–Accepting 8 0.18 Tough–Tender 8 0.72 J–P facet scales Systematic–Casual 8 0.68 Planful–Open-Ended 6 0.82 Early Starting–Pressure-Prompted 6 0.63 Scheduled–Spontaneous 8 0.62 Methodical–Emergent 8 0.62
Median 0.68
The internal consistency reliability of most scales is good, and the average (median) reliability is close to 0.7. However, three scales (Practical–Conceptual, Questioning–Accommodating and Critical–Accepting) do have lower alpha coefficients. This pattern is consistent with what was found during the development of the instrument, where these three facet scales were also found to show lower reliability than the others (Quenk, Hammer and Majors, 2004).
It should be noted, however, that coefficient alpha reliability statistics will give an underestimate of the reliability of the Step II facet scales,
Chapter 9: Spanish
195
given the use of item response theory (IRT) methods in the actual scoring process.7
Group differences
This section looks at the way in which people from different groups responded to the Spanish version of the European Step II questionnaire. Unfortunately, the total number of respondents is too small for the full range of analyses to be conducted. Further research will be conducted when additional data become available.
Gender
The means and standard deviations of the Step II facet scales are shown separately for males and females in Table 9.7, along with the difference in mean scores. This is represented graphically in Figure 9.2. Statistically significant differences were found between male and female mean scores for five of the 20 facet scales, with one consistent pattern emerging.
• On the T–F facet scales, three of the five mean scores tended slightly toward the T pole for both males and females. There were statistically significant gender differences on four of the five facet scales, with male mean scores tending more towards the T pole than females.
It should be noted that the number of females in the group was very small, so these findings should be treated with caution at this stage.
7 Item response theory (IRT) is an approach to measurement that is concerned with modelling the relationship between item responses and the underlying characteristic assessed by the scale or test the item is designed to measure. IRT can be used to select items for a test and/or to score the items.
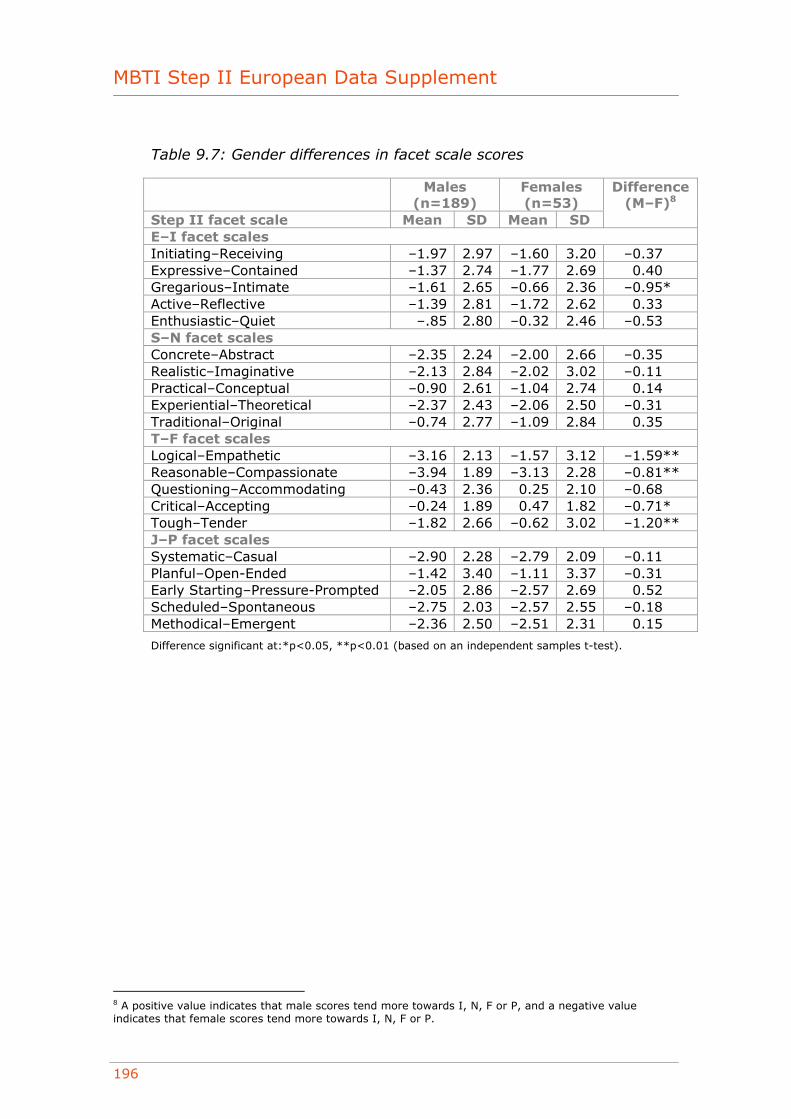
MBTI Step II European Data Supplement
196
Table 9.7: Gender differences in facet scale scores
Males (n=189)
Females (n=53)
Step II facet scale Mean SD Mean SD
Difference (M–F)8
E–I facet scales Initiating–Receiving –1.97 2.97 –1.60 3.20 –0.37 Expressive–Contained –1.37 2.74 –1.77 2.69 0.40 Gregarious–Intimate –1.61 2.65 –0.66 2.36 –0.95* Active–Reflective –1.39 2.81 –1.72 2.62 0.33 Enthusiastic–Quiet –.85 2.80 –0.32 2.46 –0.53 S–N facet scales Concrete–Abstract –2.35 2.24 –2.00 2.66 –0.35 Realistic–Imaginative –2.13 2.84 –2.02 3.02 –0.11 Practical–Conceptual –0.90 2.61 –1.04 2.74 0.14 Experiential–Theoretical –2.37 2.43 –2.06 2.50 –0.31 Traditional–Original –0.74 2.77 –1.09 2.84 0.35 T–F facet scales Logical–Empathetic –3.16 2.13 –1.57 3.12 –1.59** Reasonable–Compassionate –3.94 1.89 –3.13 2.28 –0.81** Questioning–Accommodating –0.43 2.36 0.25 2.10 –0.68 Critical–Accepting –0.24 1.89 0.47 1.82 –0.71* Tough–Tender –1.82 2.66 –0.62 3.02 –1.20** J–P facet scales Systematic–Casual –2.90 2.28 –2.79 2.09 –0.11 Planful–Open-Ended –1.42 3.40 –1.11 3.37 –0.31 Early Starting–Pressure-Prompted –2.05 2.86 –2.57 2.69 0.52 Scheduled–Spontaneous –2.75 2.03 –2.57 2.55 –0.18 Methodical–Emergent –2.36 2.50 –2.51 2.31 0.15
Difference significant at:*p<0.05, **p<0.01 (based on an independent samples t-test).
8 A positive value indicates that male scores tend more towards I, N, F or P, and a negative value indicates that female scores tend more towards I, N, F or P.
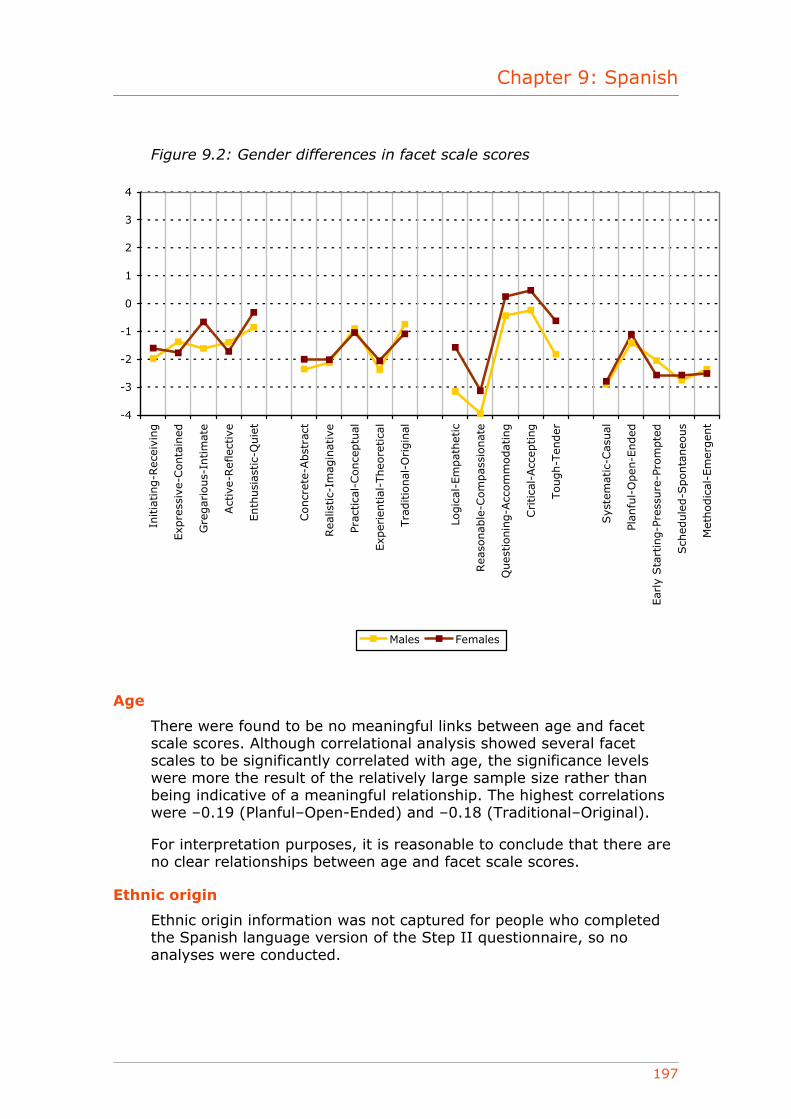
Chapter 9: Spanish
197
Figure 9.2: Gender differences in facet scale scores
-4
-3
-2
-1
0
1
2
3
4
Initia
ting-R
ecei
ving
Exp
ress
ive-
Conta
ined
Gre
gar
ious-
Intim
ate
Act
ive-
Ref
lect
ive
Enth
usi
astic-
Quie
t
Concr
ete-
Abst
ract
Rea
listic-
Imag
inat
ive
Prac
tica
l-Conce
ptu
al
Exp
erie
ntial
-Theo
retica
l
Tra
ditio
nal
-Origin
al
Logic
al-E
mpat
het
ic
Rea
sonab
le-C
om
pas
sionat
e
Ques
tionin
g-A
ccom
modat
ing
Critica
l-Acc
epting
Tough-T
ender
Sys
tem
atic
-Cas
ual
Plan
ful-
Open
-Ended
Ear
ly S
tart
ing-P
ress
ure
-Pro
mpte
d
Sch
edule
d-S
ponta
neo
us
Met
hodic
al-E
mer
gen
t
Males Females
Age
There were found to be no meaningful links between age and facet scale scores. Although correlational analysis showed several facet scales to be significantly correlated with age, the significance levels were more the result of the relatively large sample size rather than being indicative of a meaningful relationship. The highest correlations were –0.19 (Planful–Open-Ended) and –0.18 (Traditional–Original).
For interpretation purposes, it is reasonable to conclude that there are no clear relationships between age and facet scale scores.
Ethnic origin
Ethnic origin information was not captured for people who completed the Spanish language version of the Step II questionnaire, so no analyses were conducted.
MBTI Step II European Data Supplement
198
Occupational level
Research using the Spanish version of the MBTI Step I questionnaire has found there to be no significant differences between occupational level on any of the dimensions.9
Although occupational level data were captured for the Spanish sample, the number of people in each of the categories was very small, and the majority of the group described themselves as working at quite senior levels. For this reason, it was not possible to conduct analyses to look at differences in facet scale scores across occupational levels.
Education
Specific educational qualifications were not collected for the OPPassessment sample; however, the age at which individuals left full-time education was. No significant and meaningful correlations were found between the age at which people left full-time education and their facet scale scores. All the correlations were less than 0.1, except for the correlations with Initiating–Receiving (–0.16), Realistic–Imaginative and Traditional–Original (both 0.14), and Early Starting–Pressure-Prompted (0.12). These are still too small to be considered meaningful.
Work area
Information regarding the area of work people engage in was collected for the group. Many different categories were used, but the numbers of people in each category were too small for the purposes of analysis. Only one group contained more than 30 people. These analyses will be conducted once additional data become available.
Nationality
Information on nationality was gathered for 89% of the group. Of these, 63% were Spanish, and 33% described themselves as being one of several Central and South American nationalities. There were insufficient people of other individual nationalities for it to be possible to conduct any analyses across groups.
Employment status
Employment status information was gathered for 74% of the group. Of these, 96% worked full-time. There were insufficient people who did not work full-time for it to be possible to conduct any analyses across groups.
9 See the MBTI Step I European Data Supplement for details.
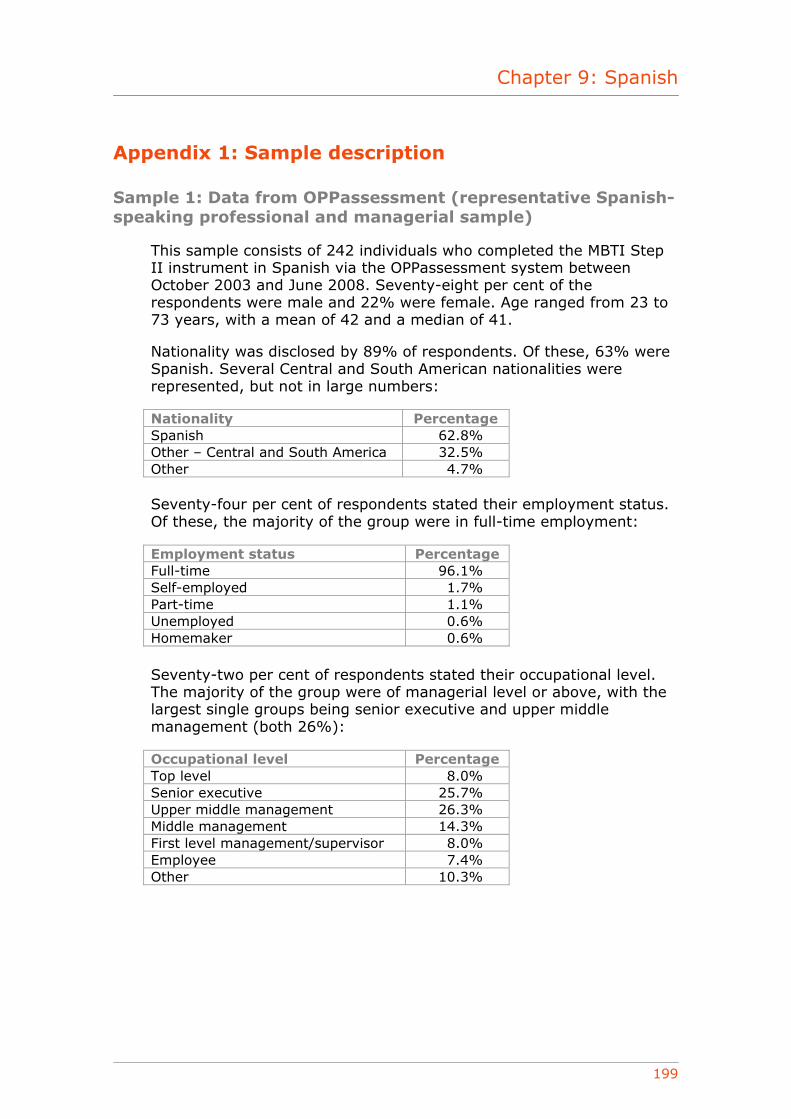
Chapter 9: Spanish
199
Appendix 1: Sample description
Sample 1: Data from OPPassessment (representative Spanish-speaking professional and managerial sample)
This sample consists of 242 individuals who completed the MBTI Step II instrument in Spanish via the OPPassessment system between October 2003 and June 2008. Seventy-eight per cent of the respondents were male and 22% were female. Age ranged from 23 to 73 years, with a mean of 42 and a median of 41.
Nationality was disclosed by 89% of respondents. Of these, 63% were Spanish. Several Central and South American nationalities were represented, but not in large numbers:
Nationality Percentage Spanish 62.8% Other – Central and South America 32.5% Other 4.7%
Seventy-four per cent of respondents stated their employment status. Of these, the majority of the group were in full-time employment:
Employment status Percentage Full-time 96.1% Self-employed 1.7% Part-time 1.1% Unemployed 0.6% Homemaker 0.6%
Seventy-two per cent of respondents stated their occupational level. The majority of the group were of managerial level or above, with the largest single groups being senior executive and upper middle management (both 26%):
Occupational level Percentage Top level 8.0% Senior executive 25.7% Upper middle management 26.3% Middle management 14.3% First level management/supervisor 8.0% Employee 7.4% Other 10.3%
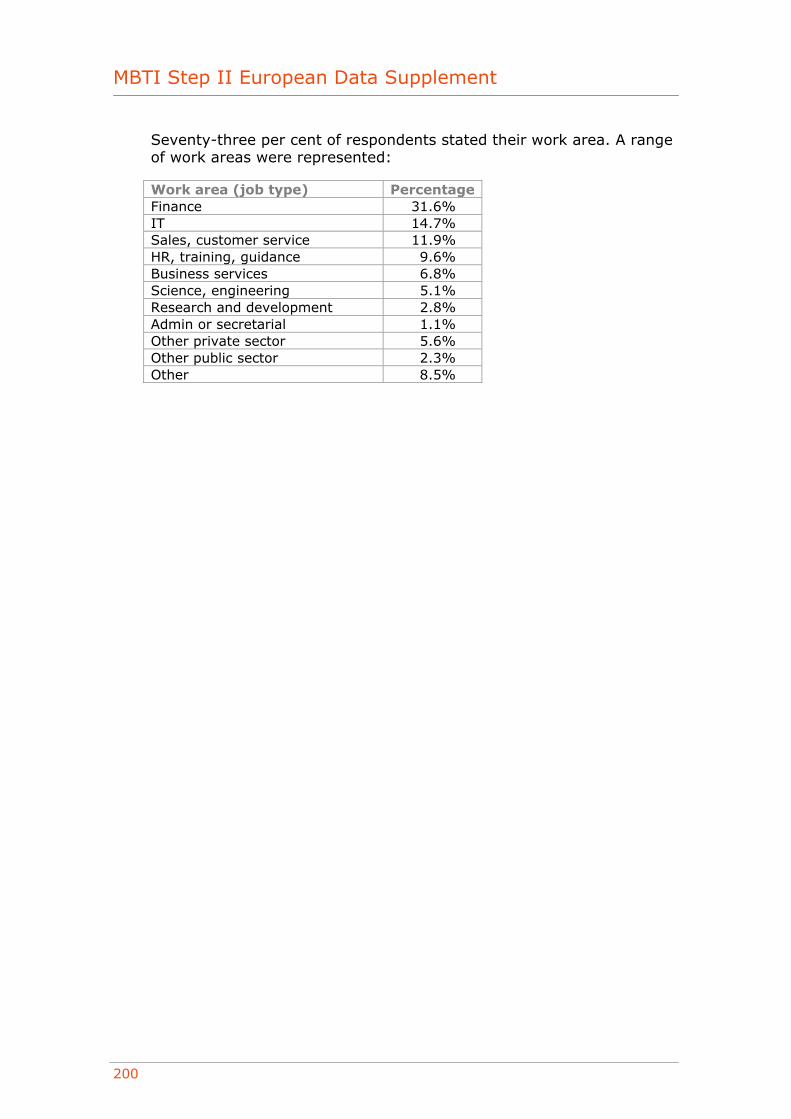
MBTI Step II European Data Supplement
200
Seventy-three per cent of respondents stated their work area. A range of work areas were represented:
Work area (job type) Percentage Finance 31.6% IT 14.7% Sales, customer service 11.9% HR, training, guidance 9.6% Business services 6.8% Science, engineering 5.1% Research and development 2.8% Admin or secretarial 1.1% Other private sector 5.6% Other public sector 2.3% Other 8.5%

Chapter 10: Swedish
201
European Data Supplement Swedish
January 2009
OPP Ltd Elsfield Hall
15–17 Elsfield Way Oxford OX2 8EP
UK t: +44 (0)845 603 9958 f: +44 (0)1865 557483
MBTI® Step II instrument

MBTI Step II European Data Supplement
202
Contents
Introduction ........................................................................... 203 Type distribution ..................................................................... 204
OPPassessment data (representative Swedish-speaking professional and managerial sample).................................................... 205
Properties of the Step II facet scales .......................................... 206 Facet scale score distribution................................................. 206 Facet scale intercorrelations .................................................. 208 Correlations of Step II facet scales with Step I scales................ 210 Out-of-preference scores ...................................................... 211 Reliability ........................................................................... 212 Group differences ................................................................ 213
Appendix 1: Sample description ................................................ 220 Sample 1: Data from OPPassessment (representative Swedish-
speaking professional and managerial sample) ..................... 220
© Copyright 2009 OPP Ltd. All rights reserved.
No portion of this publication may be translated or reproduced in whole or in part, stored in a retrieval system, or transmitted in any form or by any means (electronic, mechanical, photocopying, recording or otherwise) without the prior written permission of the copyright owner. No part of this publication is reproducible under any photocopying licence scheme. OPP Ltd grants the downloader a personal, non-transferable, perpetual, irrevocable right to use the Supplement. The European Data Supplement (‘the Supplement’) is for personal use only and may not be sold on or circulated to third parties.
® MBTI, Myers-Briggs, the Myers-Briggs Type Indicator and the MBTI logo are registered trade marks of the Myers-Briggs Type Indicator Trust. OPP is licensed to use the trade marks in Europe.
® OPP is a registered trade mark of OPP Ltd in the European Community.

Chapter 10: Swedish
203
Introduction
Data collected for the European MBTI Step II instrument were analysed to produce the findings in this supplement. This is the first data supplement produced for this instrument, and contains all the data gathered to date since the launch of the instrument in 2003. A brief description of the sample is given below. Further details of the sample are provided in Appendix 1.
• The sample consisted of 676 individuals who completed the MBTI Step II instrument in Swedish via the OPPassessment system between 2003 and mid-2008.1 This sample is considered to be representative of the groups of people with whom the Swedish MBTI Step II instrument has been and will be used for applications such as management development, coaching, counselling and teambuilding. As such, it is likely to represent a cross-section of the Swedish-speaking professional and managerial population.
The results of the analyses are outlined below.
1 OPPassessment allows personality questionnaires such as the MBTI instrument to be administered via email and/or completed online.
MBTI Step II European Data Supplement
204
Type distribution
Type tables are a way of illustrating the proportion of each type within a particular group. Below is a type table taken from the sample described on the previous page.
For each of the 16 different types, the number of cases, the percentage of the total that this represents and the self-selection ratio (SSR) are shown. The SSR (Myers et al., 1998) is a way of demonstrating whether a given type appears more or less often in a particular group than would be expected given its frequency in a reference group.
A separate data set consisting of the 565 individuals who responded to a random sampling of the Swedish general population plus 349 research study participants is used as the reference group when calculating the SSRs in this chapter. These respondents completed the Step I questionnaire, and this is the nearest thing we have to a type distribution from a large representative sample of the Swedish population.
An SSR of greater than 1 indicates that a type is over-represented, and an SSR of less than 1 denotes that it is under-represented. Asterisks are used to denote whether the over- or under-representations are statistically significant, based on the results of chi-square analysis.2
2 Chi-square analysis (often abbreviated to χ2) is a technique used to explore whether observed frequency distributions differ significantly from other, predefined, distributions. In this case, the UK general population group is used as the reference group, and the chi-square analysis indicates whether the proportion of people of each type within a particular sample differs significantly from the proportion of people reporting the same type within the reference group.
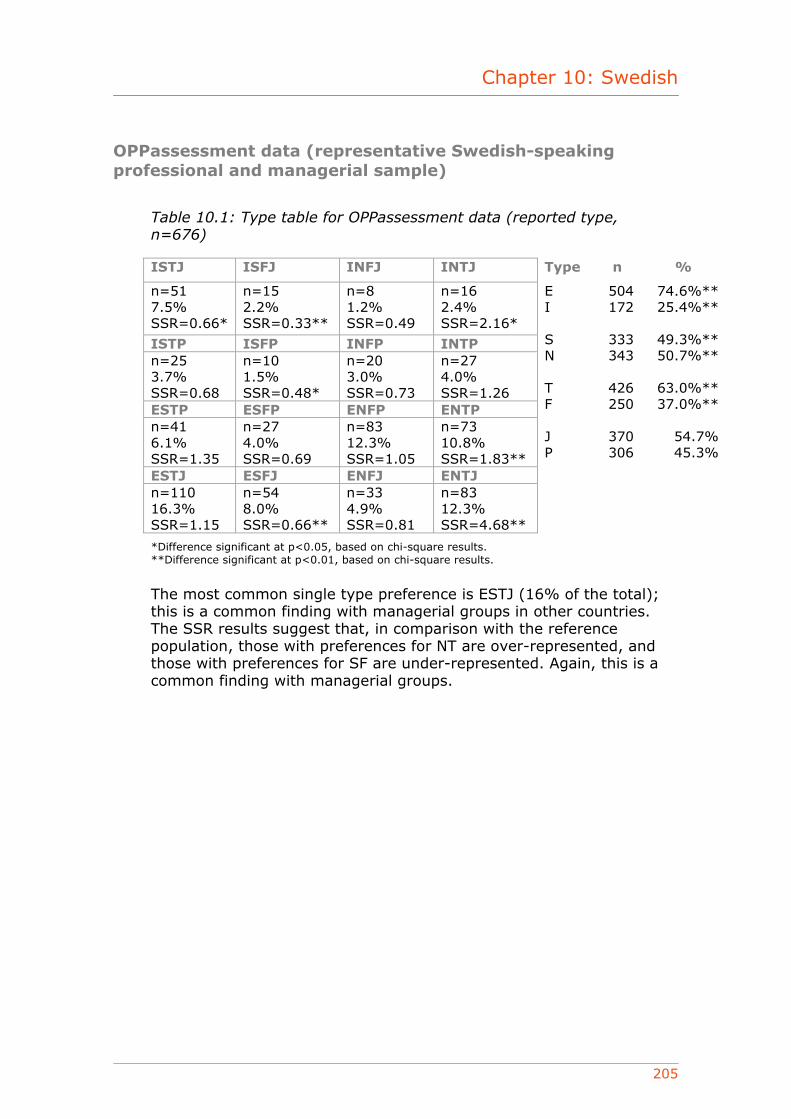
Chapter 10: Swedish
205
OPPassessment data (representative Swedish-speaking professional and managerial sample)
Table 10.1: Type table for OPPassessment data (reported type, n=676)
ISTJ ISFJ INFJ INTJ Type n %
n=51 7.5% SSR=0.66*
n=15 2.2% SSR=0.33**
n=8 1.2% SSR=0.49
n=16 2.4% SSR=2.16*
ISTP ISFP INFP INTP n=25 3.7% SSR=0.68
n=10 1.5% SSR=0.48*
n=20 3.0% SSR=0.73
n=27 4.0% SSR=1.26
ESTP ESFP ENFP ENTP n=41 6.1% SSR=1.35
n=27 4.0% SSR=0.69
n=83 12.3% SSR=1.05
n=73 10.8% SSR=1.83**
ESTJ ESFJ ENFJ ENTJ n=110 16.3% SSR=1.15
n=54 8.0% SSR=0.66**
n=33 4.9% SSR=0.81
n=83 12.3% SSR=4.68**
E I S N T F J P
504 172
333 343
426 250
370 306
74.6%** 25.4%**
49.3%** 50.7%**
63.0%** 37.0%**
54.7% 45.3%
*Difference significant at p<0.05, based on chi-square results. **Difference significant at p<0.01, based on chi-square results.
The most common single type preference is ESTJ (16% of the total); this is a common finding with managerial groups in other countries. The SSR results suggest that, in comparison with the reference population, those with preferences for NT are over-represented, and those with preferences for SF are under-represented. Again, this is a common finding with managerial groups.
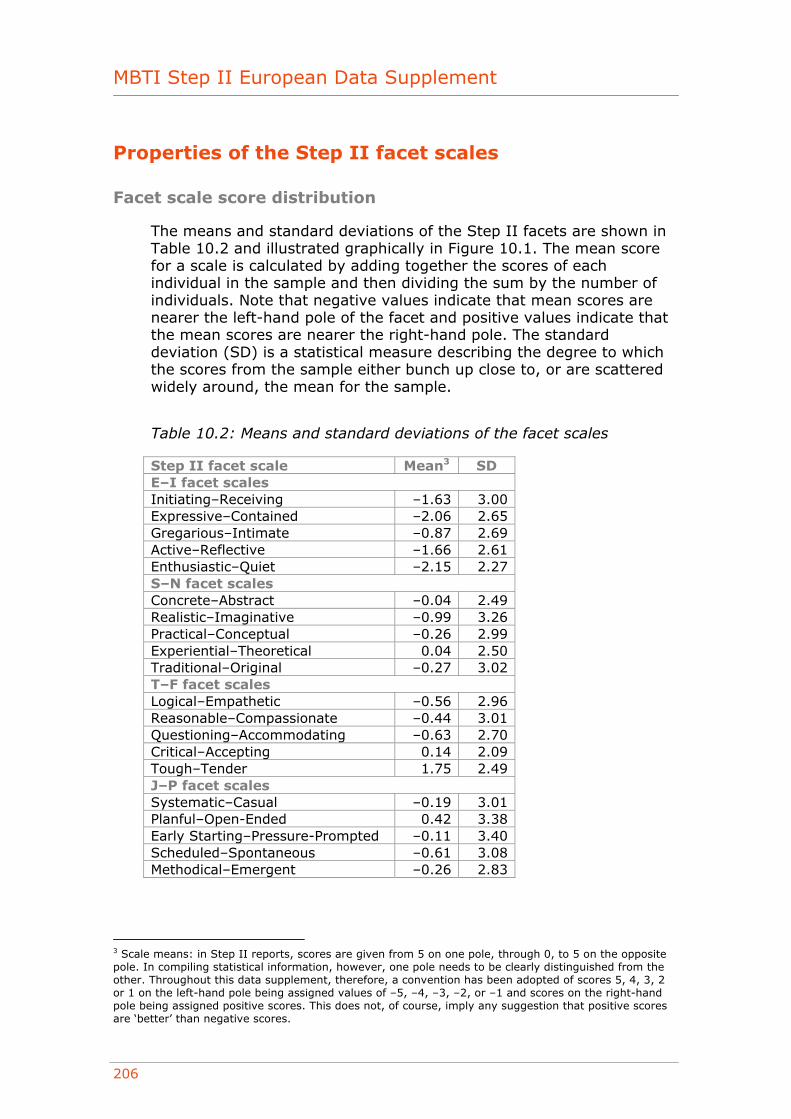
MBTI Step II European Data Supplement
206
Properties of the Step II facet scales
Facet scale score distribution
The means and standard deviations of the Step II facets are shown in Table 10.2 and illustrated graphically in Figure 10.1. The mean score for a scale is calculated by adding together the scores of each individual in the sample and then dividing the sum by the number of individuals. Note that negative values indicate that mean scores are nearer the left-hand pole of the facet and positive values indicate that the mean scores are nearer the right-hand pole. The standard deviation (SD) is a statistical measure describing the degree to which the scores from the sample either bunch up close to, or are scattered widely around, the mean for the sample.
Table 10.2: Means and standard deviations of the facet scales
Step II facet scale Mean3 SD E–I facet scales Initiating–Receiving –1.63 3.00 Expressive–Contained –2.06 2.65 Gregarious–Intimate –0.87 2.69 Active–Reflective –1.66 2.61 Enthusiastic–Quiet –2.15 2.27 S–N facet scales Concrete–Abstract –0.04 2.49 Realistic–Imaginative –0.99 3.26 Practical–Conceptual –0.26 2.99 Experiential–Theoretical 0.04 2.50 Traditional–Original –0.27 3.02 T–F facet scales Logical–Empathetic –0.56 2.96 Reasonable–Compassionate –0.44 3.01 Questioning–Accommodating –0.63 2.70 Critical–Accepting 0.14 2.09 Tough–Tender 1.75 2.49 J–P facet scales Systematic–Casual –0.19 3.01 Planful–Open-Ended 0.42 3.38 Early Starting–Pressure-Prompted –0.11 3.40 Scheduled–Spontaneous –0.61 3.08 Methodical–Emergent –0.26 2.83
3 Scale means: in Step II reports, scores are given from 5 on one pole, through 0, to 5 on the opposite pole. In compiling statistical information, however, one pole needs to be clearly distinguished from the other. Throughout this data supplement, therefore, a convention has been adopted of scores 5, 4, 3, 2 or 1 on the left-hand pole being assigned values of –5, –4, –3, –2, or –1 and scores on the right-hand pole being assigned positive scores. This does not, of course, imply any suggestion that positive scores are ‘better’ than negative scores.
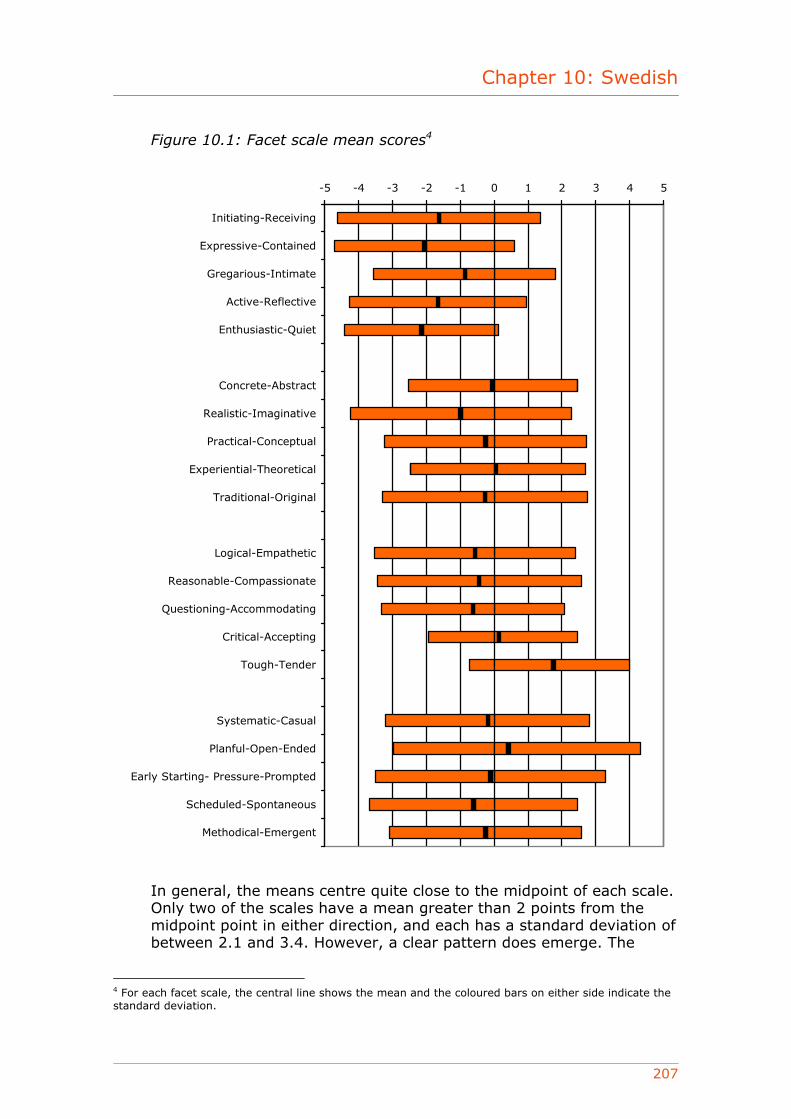
Chapter 10: Swedish
207
Figure 10.1: Facet scale mean scores4
-5 -4 -3 -2 -1 0 1 2 3 4 5
Initiating-Receiving
Expressive-Contained
Gregarious-Intimate
Active-Reflective
Enthusiastic-Quiet
Concrete-Abstract
Realistic-Imaginative
Practical-Conceptual
Experiential-Theoretical
Traditional-Original
Logical-Empathetic
Reasonable-Compassionate
Questioning-Accommodating
Critical-Accepting
Tough-Tender
Systematic-Casual
Planful-Open-Ended
Early Starting- Pressure-Prompted
Scheduled-Spontaneous
Methodical-Emergent
In general, the means centre quite close to the midpoint of each scale. Only two of the scales have a mean greater than 2 points from the midpoint point in either direction, and each has a standard deviation of between 2.1 and 3.4. However, a clear pattern does emerge. The
4 For each facet scale, the central line shows the mean and the coloured bars on either side indicate the standard deviation.
MBTI Step II European Data Supplement
208
mean scores generally tend towards the E, S, T and J direction, which is consistent with the most common four-letter type preference amongst this sample. Amongst the group as a whole, there are more individuals with a preference for E, T and J. The proportion of individuals with preferences with S and N are very similar.
Facet scale intercorrelations
Correlations among the Step II facet scales are shown in Table 10.3. Facet scales within each dichotomy usually correlate more highly (often substantially so) with the other scales of the same dichotomy than they do with scales in the other three dichotomies. For example, every E–I facet scale correlates higher with the other four E–I scales than with any of the S–N, T–F or J–P facet scales.
There is only one scale that correlates significantly more highly with scales in other dichotomies. The T–F scale Questioning–Accommodating correlates with many scales, across dichotomies. For example, it correlates at a level of –0.21 with Early Starting–Pressure-Prompted and Scheduled–Spontaneous, and at 0.15 with Enthusiastic–Quiet. It also correlates negatively at between –0.10 and –0.35 with all of the S–N scales. By way of comparison, it correlates at between 0.20 and 0.35 with the other four scales on the same dichotomy as itself (T–F). The negative correlations between Questioning–Accommodating and the S–N scales are consistent with findings with the US version of the Step II instrument, and suggest that a questioning approach to differences of opinion seems to be related to a range of Intuitive (N) facets. These patterns are similar to those found when the European Step II instrument was developed.

Table 10.3: Intercorrelations of Step II facet scales
1 2 3 4 5 6 7 8 9 10 11 12 13 14 15 16 17 18 19 20 1. Initiating– Receiving
1.00
2. Expressive– Contained
0.54 1.00
3. Gregarious– Intimate
0.46 0.44 1.00
4. Active– Reflective
0.65 0.55 0.44 1.00
5. Enthusiastic– Quiet
0.53 0.55 0.46 0.58 1.00
6. Concrete– Abstract
–0.13 –0.03 0.06 –0.05 –0.15 1.00
7. Realistic– Imaginative
–0.14 –0.11 –0.04 –0.06 –0.23 0.66 1.00
8. Practical– Conceptual
–0.14 0.02 0.07 –0.06 –0.15 0.67 0.60 1.00
9. Experiential– Theoretical
–0.08 0.00 0.03 –0.05 –0.07 0.64 0.56 0.57 1.00
10. Traditional– Original
–0.14 –0.03 0.05 –0.09 –0.18 0.63 0.59 0.63 0.56 1.00
11. Logical– Empathetic
–0.12 –0.29 –0.13 –0.08 –0.14 0.16 0.26 –0.04 0.04 0.06 1.00
12. Reasonable– Compassionate
–0.08 –0.22 –0.04 –0.07 –0.06 0.16 0.23 –0.02 0.07 0.07 0.72 1.00
13. Questioning– Accommodating
0.12 –0.03 –0.01 0.13 0.15 –0.21 –0.10 –0.30 –0.24 –0.35 0.22 0.27 1.00
14. Critical– Accepting
–0.19 –0.29 –0.20 –0.15 –0.17 0.06 0.17 –0.09 –0.04 –0.01 0.54 0.50 0.35 1.00
15. Tough– Tender
–0.09 –0.21 –0.01 –0.10 –0.13 0.19 0.23 0.07 0.11 0.16 0.45 0.51 0.20 0.43 1.00
16. Systematic– Casual
–0.13 –0.15 –0.08 –0.10 –0.21 0.43 0.52 0.33 0.28 0.45 0.42 0.36 –0.03 0.31 0.32 1.00
17. Planful– Open-Ended
0.08 0.07 0.04 0.04 –0.01 0.24 0.25 0.22 0.17 0.34 0.17 0.09 –0.11 0.04 0.14 0.53 1.00
18. Early Starting– Pressure-Prompted
–0.07 0.00 –0.07 –0.10 –0.15 0.23 0.26 0.24 0.21 0.34 0.06 –0.05 –0.21 –0.02 –0.01 0.40 0.43 1.00
19. Scheduled– Spontaneous
–0.02 0.00 –0.04 –0.06 –0.11 0.37 0.40 0.33 0.28 0.48 0.23 0.12 –0.21 0.06 0.16 0.62 0.67 0.54 1.00
20. Methodical– Emergent
0.05 0.06 0.02 0.03 –0.02 0.25 0.26 0.24 0.25 0.29 0.13 0.10 –0.11 –0.01 0.06 0.46 0.47 0.46 0.55 1.00
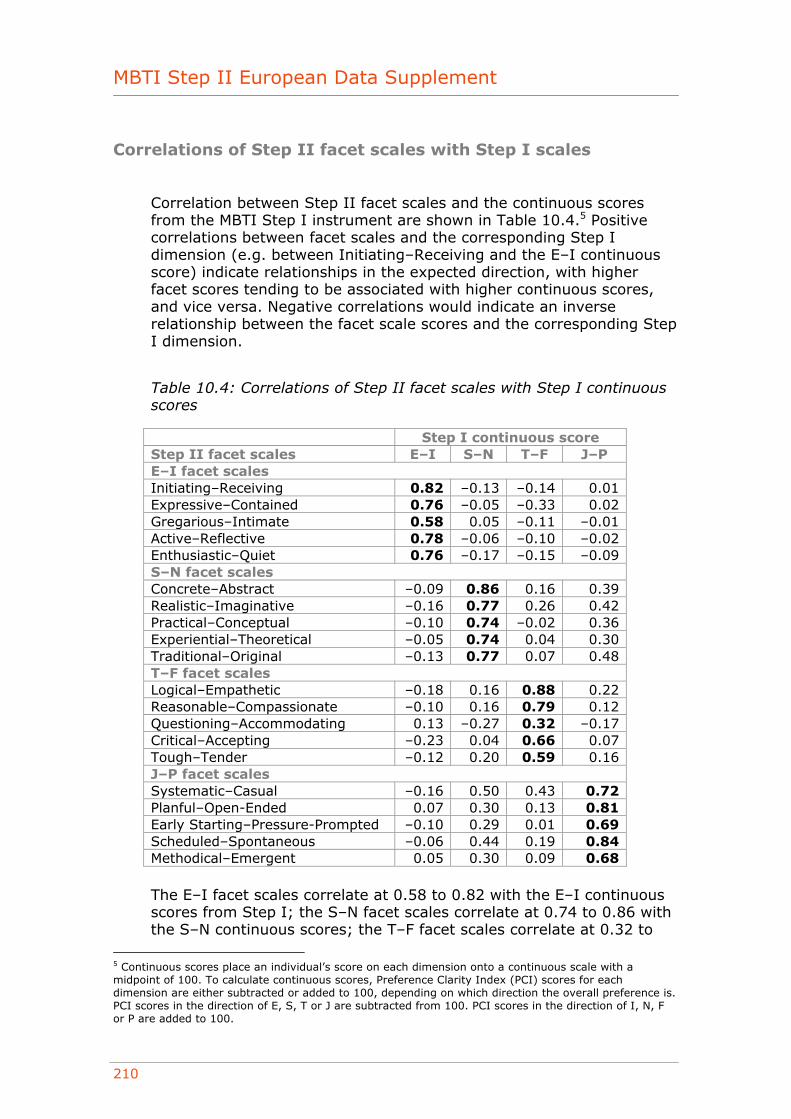
MBTI Step II European Data Supplement
210
Correlations of Step II facet scales with Step I scales
Correlation between Step II facet scales and the continuous scores from the MBTI Step I instrument are shown in Table 10.4.5 Positive correlations between facet scales and the corresponding Step I dimension (e.g. between Initiating–Receiving and the E–I continuous score) indicate relationships in the expected direction, with higher facet scores tending to be associated with higher continuous scores, and vice versa. Negative correlations would indicate an inverse relationship between the facet scale scores and the corresponding Step I dimension.
Table 10.4: Correlations of Step II facet scales with Step I continuous scores
Step I continuous score Step II facet scales E–I S–N T–F J–P E–I facet scales Initiating–Receiving 0.82 –0.13 –0.14 0.01 Expressive–Contained 0.76 –0.05 –0.33 0.02 Gregarious–Intimate 0.58 0.05 –0.11 –0.01 Active–Reflective 0.78 –0.06 –0.10 –0.02 Enthusiastic–Quiet 0.76 –0.17 –0.15 –0.09 S–N facet scales Concrete–Abstract –0.09 0.86 0.16 0.39 Realistic–Imaginative –0.16 0.77 0.26 0.42 Practical–Conceptual –0.10 0.74 –0.02 0.36 Experiential–Theoretical –0.05 0.74 0.04 0.30 Traditional–Original –0.13 0.77 0.07 0.48 T–F facet scales Logical–Empathetic –0.18 0.16 0.88 0.22 Reasonable–Compassionate –0.10 0.16 0.79 0.12 Questioning–Accommodating 0.13 –0.27 0.32 –0.17 Critical–Accepting –0.23 0.04 0.66 0.07 Tough–Tender –0.12 0.20 0.59 0.16 J–P facet scales Systematic–Casual –0.16 0.50 0.43 0.72 Planful–Open-Ended 0.07 0.30 0.13 0.81 Early Starting–Pressure-Prompted –0.10 0.29 0.01 0.69 Scheduled–Spontaneous –0.06 0.44 0.19 0.84 Methodical–Emergent 0.05 0.30 0.09 0.68
The E–I facet scales correlate at 0.58 to 0.82 with the E–I continuous scores from Step I; the S–N facet scales correlate at 0.74 to 0.86 with the S–N continuous scores; the T–F facet scales correlate at 0.32 to
5 Continuous scores place an individual’s score on each dimension onto a continuous scale with a midpoint of 100. To calculate continuous scores, Preference Clarity Index (PCI) scores for each dimension are either subtracted or added to 100, depending on which direction the overall preference is. PCI scores in the direction of E, S, T or J are subtracted from 100. PCI scores in the direction of I, N, F or P are added to 100.
Chapter 10: Swedish
211
0.88 with the T–F continuous scores; and the J–P facet scales correlate at 0.68 to 0.84 with the J–P continuous scores. The scale that showed the lowest correlation with its associated Step I continuous score was Questioning–Accommodating at 0.32. This scale is also lowest on internal consistency (see page 212), and has been previously found to have the lowest test–retest reliability (Quenk, Hammer and Majors, 2004), which would result in the true correlations being underestimated.
These correlations are very similar to those found during the development of the Step II questionnaire. This consistency, alongside the fact that the correlations between Step II facet scales and Step I continuous scores associated with their own dimension are substantially higher than correlations with the other three dimensions, provides compelling evidence for the theoretical hierarchical structure of the Step II facet scales in relation to the Step I scales.
Out-of-preference scores
It is known that the five facet scales relating to each type dimension do not describe the dimension in its entirety; there will not be a precise and exact overlap between, for example, an individual’s score on E–I and their total score across the five facet scales that relate to this dimension. For example, it is not uncommon to see an Enthusiastic Introvert or an Intimate Extravert. Such apparent inconsistencies are usually known as ‘out-of-preference scores’ (OOPS).
Although it is usual to have a number of OOPS in any one profile, it should be unusual to find that OOPS make up more than half of the facet scores relating to any one type dichotomy. Table 10.5 demonstrates that the proportion of individuals for whom this occurs ranges from 2.5% for the T–F block to 1.2% for the E–I block. It is therefore a very infrequent occurrence.
Table 10.5: Proportion of OOPS by type dichotomy6
Proportion of ‘reported type’ OOPS None One Two Three Four Five
E–I 73.5% 21.0% 4.3% 1.2% 0.0% 0.0% S–N 70.4% 20.0% 8.1% 1.5% 0.0% 0.0% T–F 52.8% 35.4% 9.3% 2.4% 0.1% 0.0% J–P 57.8% 32.0% 8.7% 1.3% 0.1% 0.0%
For any individual facet scale, an OOPS tends to occur in approximately 10% of profiles, with the exception of Tough–Tender
6 In this table, an OOPS is defined as a score of 2, 3, 4 or 5 on the ‘wrong’ pole of the facet when compared with the reported type.
MBTI Step II European Data Supplement
212
where an OOPS occurs in approximately 25% of cases, and Questioning–Accommodating (18% of cases).
Reliability
The reliability of a test or questionnaire relates to how consistent and precise it is. Internal consistency reliability addresses the question of whether all the questions in a scale measure the same construct. For example, are the Step II facet scales consistent within themselves, and do they hold together well as scales? A common measure of internal consistency reliability is coefficient alpha (Cronbach, 1951). The alpha coefficients for the Step II facet scales are shown in Table 10.6.
Table 10.6: Internal consistency reliability
Step II facet scale No. of items
Coefficient alpha
E–I facet scales Initiating–Receiving 8 0.81 Expressive–Contained 7 0.73 Gregarious–Intimate 7 0.64 Active–Reflective 8 0.66 Enthusiastic–Quiet 9 0.57 S–N facet scales Concrete–Abstract 9 0.72 Realistic–Imaginative 7 0.77 Practical–Conceptual 8 0.60 Experiential–Theoretical 8 0.63 Traditional–Original 8 0.73 T–F facet scales Logical–Empathetic 9 0.81 Reasonable–Compassionate 8 0.73 Questioning–Accommodating 7 0.41 Critical–Accepting 8 0.49 Tough–Tender 8 0.58 J–P facet scales Systematic–Casual 8 0.74 Planful–Open-Ended 6 0.77 Early Starting–Pressure-Prompted 6 0.75 Scheduled–Spontaneous 8 0.75 Methodical–Emergent 8 0.62
Median 0.73
The internal consistency reliability of most scales is good, and the average (median) reliability is above 0.7. However, two scales (Questioning–Accommodating and Critical–Accepting) do have lower alpha coefficients. This pattern is consistent with what was found during the development of the Step II instrument, where these two
Chapter 10: Swedish
213
facet scales were also found to show lower reliability than the others (Quenk, Hammer and Majors, 2004).
It should be noted, however, that coefficient alpha reliability statistics will give an underestimate of the reliability of the Step II facet scales, given the use of item response theory (IRT) methods in the actual scoring process.7
Group differences
This section looks at the way in which people from different groups responded to the Swedish version of the European Step II questionnaire. Unfortunately, many of the respondents did not provide any demographic data, so the variables available for analysis were rather limited and the sample sizes were smaller than we would like. Further research will be conducted when additional data become available.
Gender
The means and standard deviations of the Step II facet scales are shown separately for males and females in Table 10.7, along with the difference in mean scores. This is represented graphically in Figure 10.2. Statistically significant differences were found between male and female mean scores for 14 of the 20 facet scales, with some consistent patterns emerging.
• On the E–I facet scales, all five mean scores tended slightly toward the E pole for both males and females. There was no consistent gender difference across the dimension, with females tending further towards the E pole than males on two facet scales, and males tending more towards the E pole than females on one facet scale. There was no significant difference between genders on the remaining two facet scales.
• On the S–N facet scales, three of the five mean scores tended slightly toward the S pole for both males and females. There were statistically significant gender differences on two of the five facet scales, with male mean scores tending more towards the S pole than females.
• On the T–F facet scales, four of the five mean scores tended slightly toward the T pole for males, whereas two did so for females. The Tough–Tender facet stands out because both males and females tended to score towards the F pole. There were statistically significant gender differences on four of the five facet scales, with male mean scores tending more towards the T pole (or less towards the F pole) than females.
7 Item response theory (IRT) is an approach to measurement that is concerned with modelling the relationship between item responses and the underlying characteristic assessed by the scale or test the item is designed to measure. IRT can be used to select items for a test and/or to score the items.
MBTI Step II European Data Supplement
214
• On the J–P facet scales, two of the five mean scores tended toward the J pole for both males and females. There were statistically significant gender differences on two of the five facet scales, with male mean scores tending more towards the J pole than females on one facet (Systematic–Casual) and females tending more towards the J pole on the other (Planful–Open-Ended).
Table 10.7: Gender differences in facet scale scores
Males (n=343)
Females (n=331)
Step II facet scale Mean SD Mean SD
Difference (M–F)8
E–I facet scales Initiating–Receiving –1.41 3.17 –1.86 2.81 0.45* Expressive–Contained –1.78 2.80 –2.36 2.47 0.58** Gregarious–Intimate –1.08 2.80 –0.66 2.56 –0.42* Active–Reflective –1.65 2.75 –1.68 2.48 0.03 Enthusiastic–Quiet –1.99 2.35 –2.31 2.19 0.32 S–N facet scales Concrete–Abstract –0.24 2.48 0.19 2.48 –0.43* Realistic–Imaginative –1.26 3.24 –0.69 3.26 –0.57* Practical–Conceptual –0.40 2.90 –0.09 3.07 –0.31 Experiential–Theoretical 0.03 2.53 0.07 2.47 –0.04 Traditional–Original –0.32 3.10 –0.20 2.94 –0.12 T–F facet scales Logical–Empathetic –1.11 2.83 0.00 2.99 –1.11** Reasonable–Compassionate –0.84 3.00 –0.03 2.96 –0.81** Questioning–Accommodating –0.78 2.76 –0.50 2.63 –0.28 Critical–Accepting –0.18 2.06 0.47 2.05 –0.65** Tough–Tender 1.27 2.58 2.26 2.29 –0.99** J–P facet scales Systematic–Casual –0.52 3.08 0.15 2.89 –0.67** Planful–Open-Ended 0.71 3.21 0.11 3.53 0.60* Early Starting–Pressure-Prompted 0.08 3.37 –0.27 3.42 0.35 Scheduled–Spontaneous –0.52 3.01 –0.67 3.15 0.15 Methodical–Emergent –0.16 2.87 –0.36 2.79 0.45
Difference significant at: *p<0.05, **p<0.01 (based on an independent samples t-test).
8 A positive value indicates that male scores tend more towards I, N, F or P, and a negative value indicates that female scores tend more towards I, N, F or P.
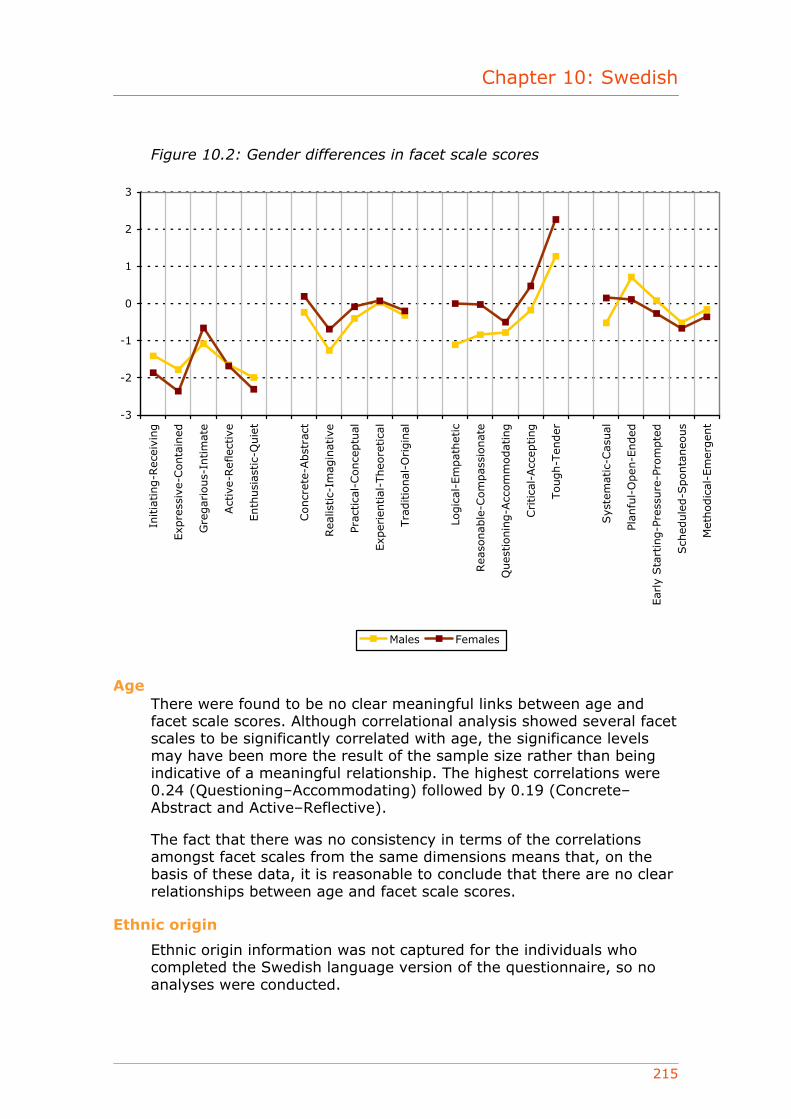
Chapter 10: Swedish
215
Figure 10.2: Gender differences in facet scale scores
-3
-2
-1
0
1
2
3
Initia
ting-R
ecei
ving
Exp
ress
ive-
Conta
ined
Gre
gar
ious-
Intim
ate
Act
ive-
Ref
lect
ive
Enth
usi
astic-
Quie
t
Concr
ete-
Abst
ract
Rea
listic-
Imag
inat
ive
Prac
tica
l-Conce
ptu
al
Exp
erie
ntial
-Theo
retica
l
Tra
ditio
nal
-Origin
al
Logic
al-E
mpat
het
ic
Rea
sonab
le-C
om
pas
sionat
e
Ques
tionin
g-A
ccom
modat
ing
Critica
l-Acc
epting
Tough-T
ender
Sys
tem
atic
-Cas
ual
Plan
ful-
Open
-Ended
Ear
ly S
tart
ing-P
ress
ure
-Pro
mpte
d
Sch
edule
d-S
ponta
neo
us
Met
hodic
al-E
mer
gen
t
Males Females
Age
There were found to be no clear meaningful links between age and facet scale scores. Although correlational analysis showed several facet scales to be significantly correlated with age, the significance levels may have been more the result of the sample size rather than being indicative of a meaningful relationship. The highest correlations were 0.24 (Questioning–Accommodating) followed by 0.19 (Concrete–Abstract and Active–Reflective).
The fact that there was no consistency in terms of the correlations amongst facet scales from the same dimensions means that, on the basis of these data, it is reasonable to conclude that there are no clear relationships between age and facet scale scores.
Ethnic origin
Ethnic origin information was not captured for the individuals who completed the Swedish language version of the questionnaire, so no analyses were conducted.
MBTI Step II European Data Supplement
216
Occupational level
Research using the Swedish version of the MBTI Step I questionnaire has demonstrated that individuals in higher-level jobs in organisations are more likely to have preferences for Extraversion, Intuition and (to some extent) Thinking than those in lower-level jobs.9
Although occupational level data were captured for the Swedish sample, the number of people in each of the categories was too small to allow a full analysis. Therefore, individuals were split into two categories, ‘Employee’ and ‘Supervisory and above’. These categories were used for the analysis. Table 10.8 shows the facet scale means and standard deviations for these groups, with the data represented graphically in Figure 10.3. The findings can be summarised as follows:
• A pattern was found regarding the facets relating to all the dimensions. Although not statistically significant, it does appear that the ‘Supervisory level and above’ group tended to score more towards the E, S, T and J poles on almost all the facet scales than the ‘Employee’ group. The only two exceptions to this were Questioning–Accommodating and Early Starting–Pressure-Prompted, where the ‘Employee’ group tended to score slightly more towards the T and J pole. The pattern relating to the T–F facets could be a reflection of the fact that females formed a considerably higher proportion of the employee group than they did of other groups.
These findings should be treated with caution owing to the small sample sizes on which they are based.
9 See the MBTI Step I European Data Supplement for details.
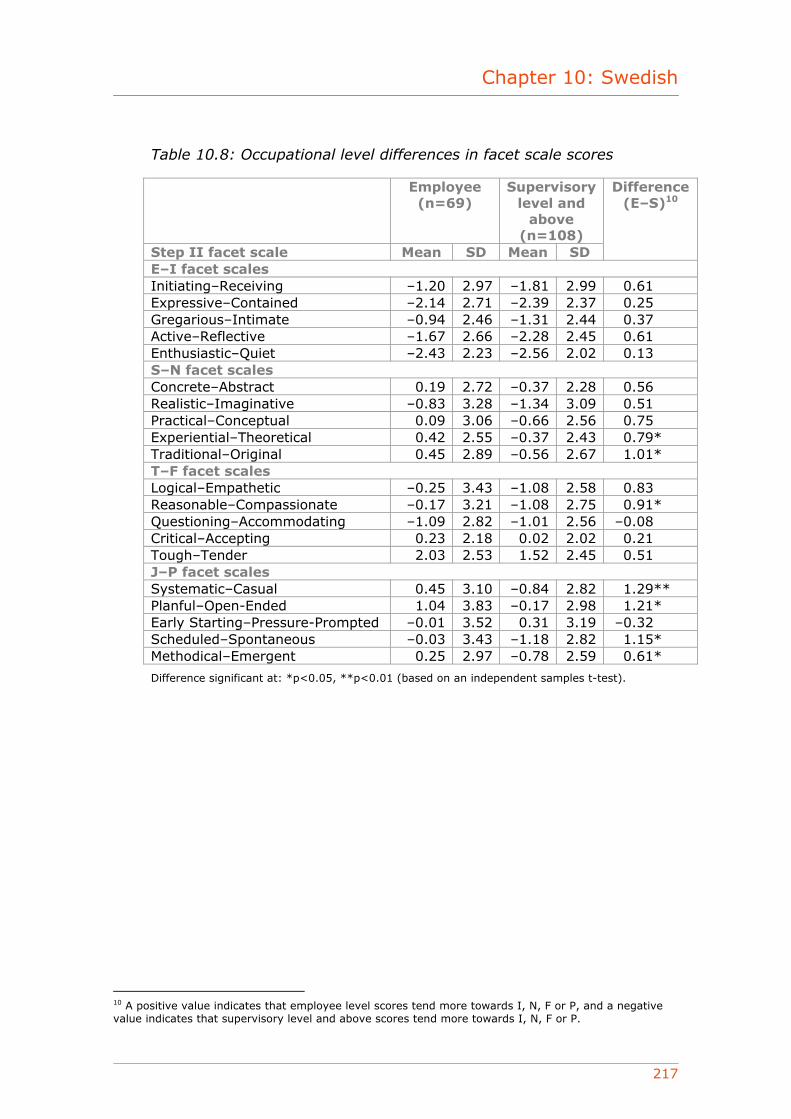
Chapter 10: Swedish
217
Table 10.8: Occupational level differences in facet scale scores
Employee (n=69)
Supervisory level and
above (n=108)
Step II facet scale Mean SD Mean SD
Difference (E–S)10
E–I facet scales Initiating–Receiving –1.20 2.97 –1.81 2.99 0.61 Expressive–Contained –2.14 2.71 –2.39 2.37 0.25 Gregarious–Intimate –0.94 2.46 –1.31 2.44 0.37 Active–Reflective –1.67 2.66 –2.28 2.45 0.61 Enthusiastic–Quiet –2.43 2.23 –2.56 2.02 0.13 S–N facet scales Concrete–Abstract 0.19 2.72 –0.37 2.28 0.56 Realistic–Imaginative –0.83 3.28 –1.34 3.09 0.51 Practical–Conceptual 0.09 3.06 –0.66 2.56 0.75 Experiential–Theoretical 0.42 2.55 –0.37 2.43 0.79* Traditional–Original 0.45 2.89 –0.56 2.67 1.01* T–F facet scales Logical–Empathetic –0.25 3.43 –1.08 2.58 0.83 Reasonable–Compassionate –0.17 3.21 –1.08 2.75 0.91* Questioning–Accommodating –1.09 2.82 –1.01 2.56 –0.08 Critical–Accepting 0.23 2.18 0.02 2.02 0.21 Tough–Tender 2.03 2.53 1.52 2.45 0.51 J–P facet scales Systematic–Casual 0.45 3.10 –0.84 2.82 1.29** Planful–Open-Ended 1.04 3.83 –0.17 2.98 1.21* Early Starting–Pressure-Prompted –0.01 3.52 0.31 3.19 –0.32 Scheduled–Spontaneous –0.03 3.43 –1.18 2.82 1.15* Methodical–Emergent 0.25 2.97 –0.78 2.59 0.61*
Difference significant at: *p<0.05, **p<0.01 (based on an independent samples t-test).
10 A positive value indicates that employee level scores tend more towards I, N, F or P, and a negative value indicates that supervisory level and above scores tend more towards I, N, F or P.
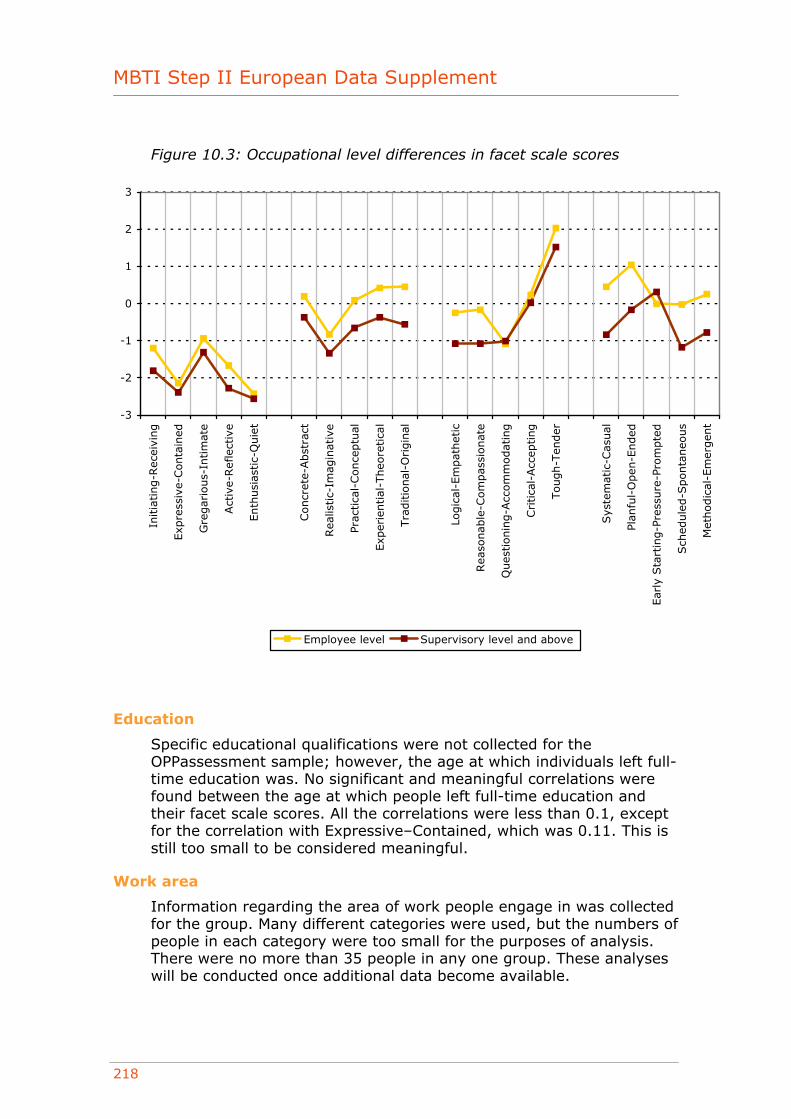
MBTI Step II European Data Supplement
218
Figure 10.3: Occupational level differences in facet scale scores
-3
-2
-1
0
1
2
3
Initia
ting-R
ecei
ving
Exp
ress
ive-
Conta
ined
Gre
gar
ious-
Intim
ate
Act
ive-
Ref
lect
ive
Enth
usi
astic-
Quie
t
Concr
ete-
Abst
ract
Rea
listic-
Imag
inat
ive
Prac
tica
l-Conce
ptu
al
Exp
erie
ntial
-Theo
retica
l
Tra
ditio
nal
-Origin
al
Logic
al-E
mpat
het
ic
Rea
sonab
le-C
om
pas
sionat
e
Ques
tionin
g-A
ccom
modat
ing
Critica
l-Acc
epting
Tough-T
ender
Sys
tem
atic
-Cas
ual
Plan
ful-
Open
-Ended
Ear
ly S
tart
ing-P
ress
ure
-Pro
mpte
d
Sch
edule
d-S
ponta
neo
us
Met
hodic
al-E
mer
gen
t
Employee level Supervisory level and above
Education
Specific educational qualifications were not collected for the OPPassessment sample; however, the age at which individuals left full-time education was. No significant and meaningful correlations were found between the age at which people left full-time education and their facet scale scores. All the correlations were less than 0.1, except for the correlation with Expressive–Contained, which was 0.11. This is still too small to be considered meaningful.
Work area
Information regarding the area of work people engage in was collected for the group. Many different categories were used, but the numbers of people in each category were too small for the purposes of analysis. There were no more than 35 people in any one group. These analyses will be conducted once additional data become available.
Chapter 10: Swedish
219
Nationality
Information on nationality was gathered for 33% of the group. Of these, 94% were Swedish. There were insufficient people of other nationalities for it to be possible to conduct any analyses across groups.
Employment status
Employment status information was gathered for 28% of the group. Of these, 95% worked full-time. There were insufficient people who did not work full-time for it to be possible to conduct any analyses across groups.
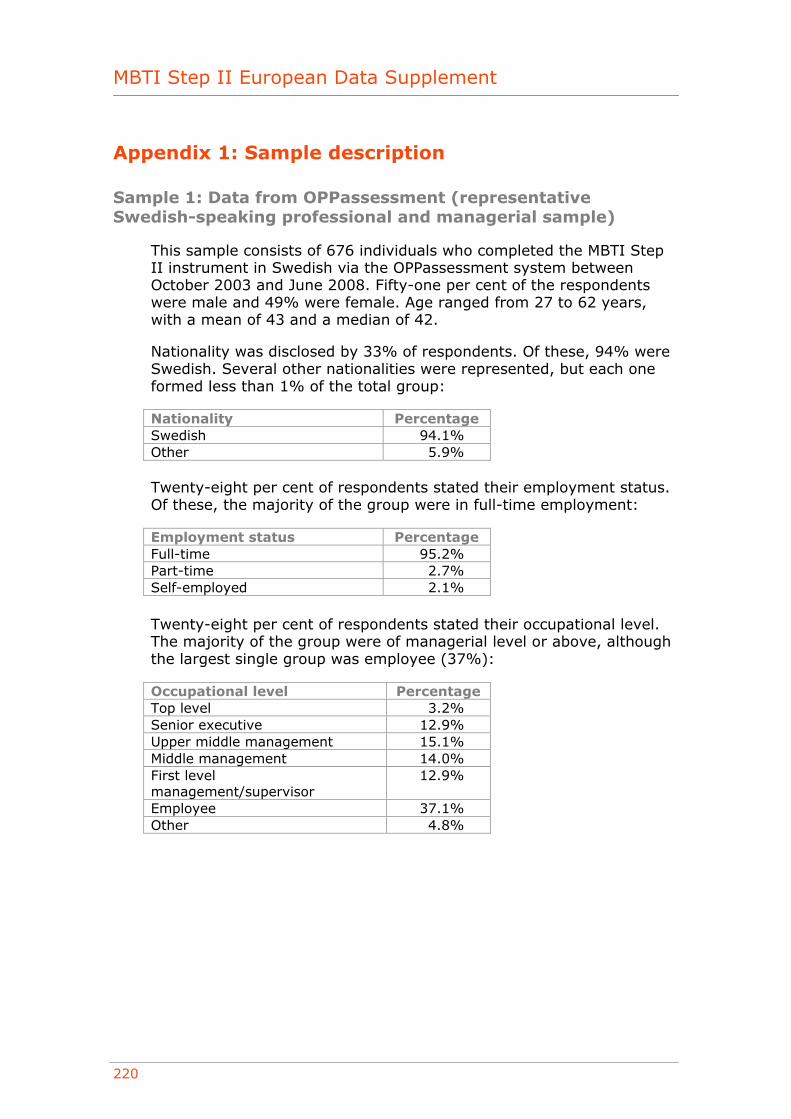
MBTI Step II European Data Supplement
220
Appendix 1: Sample description
Sample 1: Data from OPPassessment (representative Swedish-speaking professional and managerial sample)
This sample consists of 676 individuals who completed the MBTI Step II instrument in Swedish via the OPPassessment system between October 2003 and June 2008. Fifty-one per cent of the respondents were male and 49% were female. Age ranged from 27 to 62 years, with a mean of 43 and a median of 42.
Nationality was disclosed by 33% of respondents. Of these, 94% were Swedish. Several other nationalities were represented, but each one formed less than 1% of the total group:
Nationality Percentage Swedish 94.1% Other 5.9%
Twenty-eight per cent of respondents stated their employment status. Of these, the majority of the group were in full-time employment:
Employment status Percentage Full-time 95.2% Part-time 2.7% Self-employed 2.1%
Twenty-eight per cent of respondents stated their occupational level. The majority of the group were of managerial level or above, although the largest single group was employee (37%):
Occupational level Percentage Top level 3.2% Senior executive 12.9% Upper middle management 15.1% Middle management 14.0% First level management/supervisor
12.9%
Employee 37.1% Other 4.8%
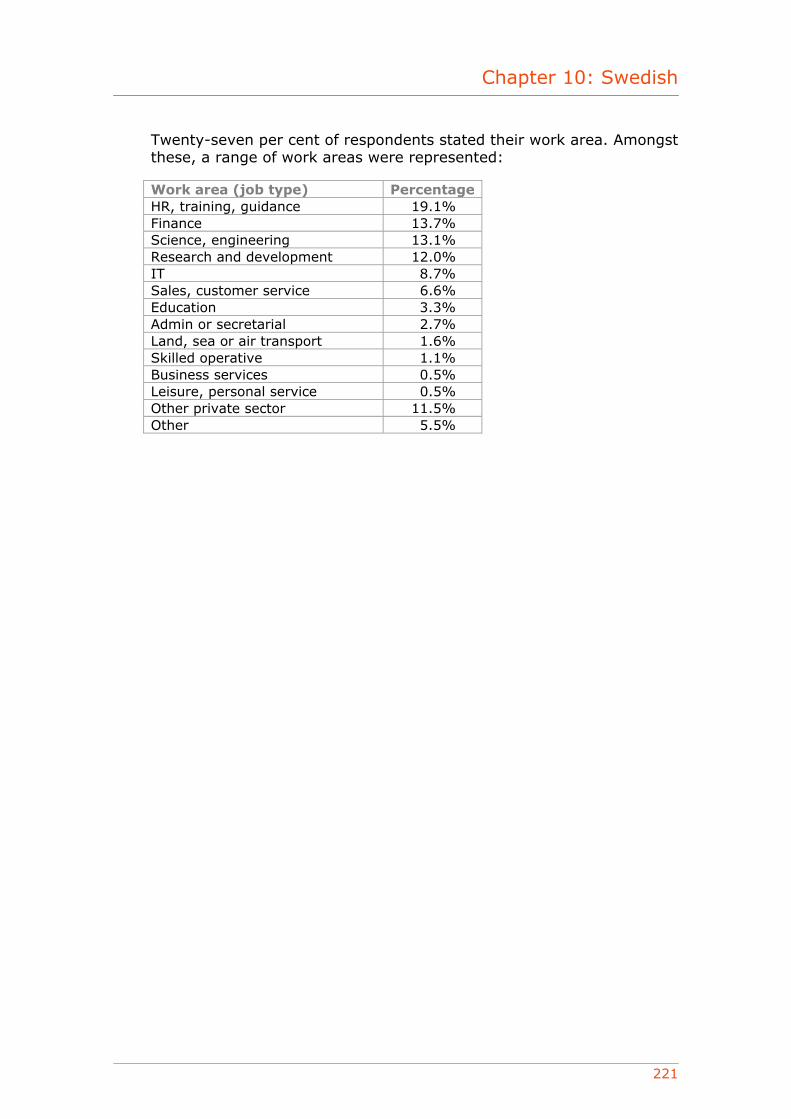
Chapter 10: Swedish
221
Twenty-seven per cent of respondents stated their work area. Amongst these, a range of work areas were represented:
Work area (job type) Percentage HR, training, guidance 19.1% Finance 13.7% Science, engineering 13.1% Research and development 12.0% IT 8.7% Sales, customer service 6.6% Education 3.3% Admin or secretarial 2.7% Land, sea or air transport 1.6% Skilled operative 1.1% Business services 0.5% Leisure, personal service 0.5% Other private sector 11.5% Other 5.5%

MBTI Step II European Data Supplement
222

Chapter 11: Bibliography
223
European Data Supplement Bibliography
January 2009
OPP Ltd Elsfield Hall
15–17 Elsfield Way Oxford OX2 8EP
UK t: +44 (0)845 603 9958 f: +44 (0)1865 557483
MBTI® Step II instrument
MBTI Step II European Data Supplement
224
© Copyright 2009 OPP Ltd. All rights reserved.
No portion of this publication may be translated or reproduced in whole or in part, stored in a retrieval system, or transmitted in any form or by any means (electronic, mechanical, photocopying, recording or otherwise) without the prior written permission of the copyright owner. No part of this publication is reproducible under any photocopying licence scheme. OPP Ltd grants the downloader a personal, non-transferable, perpetual, irrevocable right to use the Supplement. The European Data Supplement (‘the Supplement’) is for personal use only and may not be sold on or circulated to third parties.
® MBTI, Myers-Briggs, the Myers-Briggs Type Indicator and the MBTI logo are registered trade marks of the Myers-Briggs Type Indicator Trust. OPP is licensed to use the trade marks in Europe.
® OPP is a registered trade mark of OPP Ltd in the European Community.
Chapter 11: Bibliography
225
Bibliography
Cronbach LJ. Coefficient alpha and the internal structure of tests. Psychometrika, 16(3), 297–334, 1951.
Hackston J and Kendall E. Step II and Culture. Paper presented at the APT international conference, Toronto, July 2004.
Kendall E. Myers-Briggs Type Indicator European English Edition Step I Manual Supplement. Mountain View, CA: CPP, Inc., 1998.
Myers IB, McCaulley MH, Quenk NL and Hammer AL. MBTI Manual: A Guide to the Development and Use of the Myers-Briggs Type Indicator. Mountain View, CA: CPP Inc., 1998.
Quenk NL, Hammer AL and Majors MS. MBTI Step II Manual: Exploring the Next Level of Type, European Edition. Mountain View, CA: CPP, Inc., 2004.


