Embed Size (px)
Citation preview
INSIGHTS | PERSPECTIVES
1090 6 JUNE 2014 • VOL 344 ISSUE 6188 sciencemag.org SCIENCE
EU agricultural reform fails on biodiversityExtra steps by Member States are needed to protect farmed and grassland ecosystems
AGRICULTURE POLICY
In December 2013, the European Union
(EU) enacted the reformed Common
Agricultural Policy (CAP) for 2014–
2020, allocating almost 40% of the EU’s
budget and influencing management
of half of its terrestrial area. Many EU
politicians are announcing the new CAP as
“greener,” but the new environmental pre-
scriptions are so diluted
that they are unlikely to
benefit biodiversity. Indi-
vidual Member States (MSs), however, can
still use flexibility granted by the new CAP
to design national plans to protect farm-
land habitats and species and to ensure
long-term provision of ecosystem services.
Agricultural expansion and intensifica-
tion are important global drivers of bio-
diversity loss and ecosystem degradation
( 1). In Europe, habitats associated with ag-
riculture, such as grasslands, heathlands,
and peatlands, support threatened and
declining species and provide important
ecosystem services, yet have the worst con-
servation status among all ecosystems ( 2).
Declines in species richness seem to have
slowed for a few taxa in parts of north-
western Europe ( 3), albeit at a biodiversity-
impoverished status quo.
Expansion of the EU and its common
market continue driving agricultural in-
tensification in Europe ( 1, 3). Aided by CAP
subsidies, the scale of agricultural opera-
tions is increasing throughout the EU [e.g.,
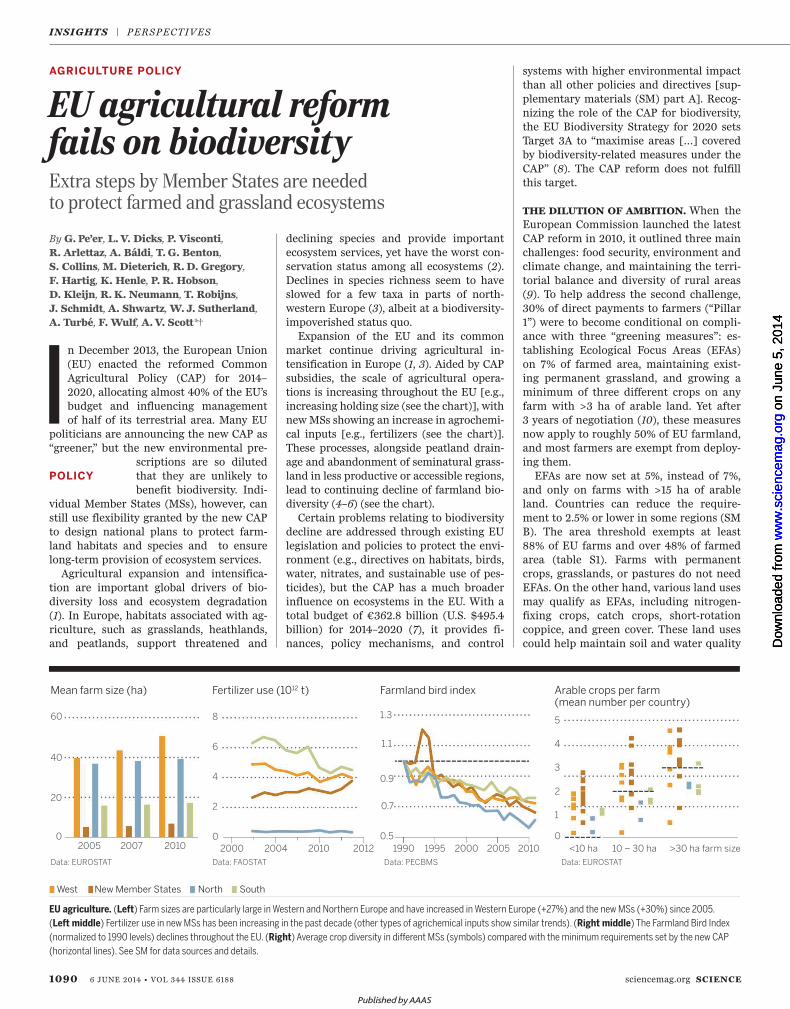
increasing holding size (see the chart)], with
new MSs showing an increase in agrochemi-
cal inputs [e.g., fertilizers (see the chart)].
These processes, alongside peatland drain-
age and abandonment of seminatural grass-
land in less productive or accessible regions,
lead to continuing decline of farmland bio-
diversity ( 4– 6) (see the chart).
Certain problems relating to biodiversity
decline are addressed through existing EU
legislation and policies to protect the envi-
ronment (e.g., directives on habitats, birds,
water, nitrates, and sustainable use of pes-
ticides), but the CAP has a much broader
influence on ecosystems in the EU. With a
total budget of €362.8 billion (U.S. $495.4
billion) for 2014–2020 ( 7), it provides fi-
nances, policy mechanisms, and control
systems with higher environmental impact
than all other policies and directives [sup-
plementary materials (SM) part A]. Recog-
nizing the role of the CAP for biodiversity,
the EU Biodiversity Strategy for 2020 sets
Target 3A to “maximise areas […] covered
by biodiversity-related measures under the
CAP” ( 8). The CAP reform does not fulfill
this target.
THE DILUTION OF AMBITION. When the
European Commission launched the latest
CAP reform in 2010, it outlined three main
challenges: food security, environment and
climate change, and maintaining the terri-
torial balance and diversity of rural areas
( 9). To help address the second challenge,
30% of direct payments to farmers (“Pillar
1”) were to become conditional on compli-
ance with three “greening measures”: es-
tablishing Ecological Focus Areas (EFAs)
on 7% of farmed area, maintaining exist-
ing permanent grassland, and growing a
minimum of three different crops on any
farm with >3 ha of arable land. Yet after
3 years of negotiation ( 10), these measures
now apply to roughly 50% of EU farmland,
and most farmers are exempt from deploy-
ing them.
EFAs are now set at 5%, instead of 7%,
and only on farms with >15 ha of arable
land. Countries can reduce the require-
ment to 2.5% or lower in some regions (SM
B). The area threshold exempts at least
88% of EU farms and over 48% of farmed
area (table S1). Farms with permanent
crops, grasslands, or pastures do not need
EFAs. On the other hand, various land uses
may qualify as EFAs, including nitrogen-
fixing crops, catch crops, short-rotation
coppice, and green cover. These land uses
could help maintain soil and water quality
POLICY
By G. Pe’er, L. V. Dicks, P. Visconti,
R. Arlettaz, A. Báldi, T. G. Benton,
S. Collins, M. Dieterich, R. D. Gregory,
F. Hartig, K. Henle, P. R. Hobson,
D. Kleijn, R. K. Neumann, T. Robijns,
J. Schmidt, A. Shwartz, W. J. Sutherland,
A. Turbé, F. Wulf, A. V. Scott* †
60
40
20
0
2007 20102005
8
6
4
2
0
2004 2010 20122000
1.3
1.1
0.9
0.7
0.5
5
4
3
2
1
0
1990 1995 2000 2005 2010 <10 ha
Data: EUROSTATData: PECBMSData: FAOSTATData: EUROSTAT
West New Member States North South
>30 ha farm size10 – 30 ha
Mean farm size (ha) Fertilizer use (1012 t) Farmland bird index Arable crops per farm (mean number per country)
EU agriculture. (Left) Farm sizes are particularly large in Western and Northern Europe and have increased in Western Europe (+27%) and the new MSs (+30%) since 2005.
(Left middle) Fertilizer use in new MSs has been increasing in the past decade (other types of agrichemical inputs show similar trends). (Right middle) The Farmland Bird Index
(normalized to 1990 levels) declines throughout the EU. (Right) Average crop diversity in different MSs (symbols) compared with the minimum requirements set by the new CAP
(horizontal lines). See SM for data sources and details.
Published by AAAS
on
June
5, 2
014
ww
w.s
cien
cem
ag.o
rgD
ownl
oade
d fr
om
on
June
5, 2
014
ww
w.s
cien
cem
ag.o
rgD
ownl
oade
d fr
om
on
June
5, 2
014
ww
w.s
cien
cem
ag.o
rgD
ownl
oade
d fr
om
6 JUNE 2014 • VOL 344 ISSUE 6188 1091SCIENCE sciencemag.org
but are not known to deliver benefits for
biodiversity ( 11). In such a diluted form,
and without specific management guide-
lines, EFAs will likely contribute little to
biodiversity.
Permanent grasslands have decreased in
cover by 6.4% between 1993 and 2011 in the
EU and by 11.8% in new MSs (SM C). The
new CAP aims to halt this decline, thereby
reducing biodiversity loss and greenhouse
gas emissions. But rather than maintaining
all permanent grasslands, the reformed CAP
allows a reduction of up to 5% in the net
area of permanent grasslands at national
or regional scales. Further degradation is
permitted by the lack of habitat quality and
management criteria. MSs are required to
identify and protect ecologically valuable
grassland within protected sites (“Natura
2000”), but outside these sites, farmers will
continue receiving subsidies while con-
verting low-input, extensively managed,
species-rich grassland ( 3) to highly intensi-
fied, uniform, species-poor swards ( 6). The
potential to maintain grassland biodiversity
is further undermined by incomplete map-
ping, lack of differentiation among regions
and grassland types, and a focus on net area
without consideration of continuity and
connectivity of existing seminatural grass-
land parcels.
The crop diversification measure obliges
medium (10 to 30 ha) to large (>30 ha)
farms to cultivate at least two or three
crops, respectively (SM D). Farms with <10
ha of arable area (instead of 3
ha as originally proposed) are
exempt, accounting for 92%
of arable holdings in new MSs
and 13% of arable area across
the EU (table S4). Cultivating
three crops on large, intensively
managed farms is unlikely to
enhance biodiversity ( 11). More-
over, in many MSs these targets
are lower than current average crop diver-
sity at the farm scale (see the chart). Com-
bined with the absence of requirements
regarding eligible crop types or rotation,
this measure is unlikely to deliver benefits
to biodiversity or soil quality, or to prevent
further landscape homogenization.
Beyond those compulsory measures, the
new CAP gives insufficient attention and
financial support to sustainable farming
in marginal, small-scale, and biodiversity-
rich farms. Measures deployed within the
framework of the Rural Development Regu-
lation (Pillar 2), especially agri-environment-
climate schemes (AESs) that farmers could
take up voluntarily, can improve habitat
quality and maintain biodiversity when they
are well-designed, targeted, and financed
( 12). Yet funding for Pillar 2 will decrease
in absolute terms by 18% from 2013 to 2020
[from €13.9 to 11.4 billion (~U.S. $19) an-
nually, in 2011 prices] compared to a 13%
reduction in Pillar 1 budget ( 7). Although the
proportion of Pillar 2 funding earmarked
for environmental measures has increased
from 25% in the previous CAP period to 30%
now, the budget needs to cover other activi-
ties, including climate change mitigation,
organic farming, and so-called climate and
environment investment measures—with
potential for both positive and negative
impacts on biodiversity (SM E).
MSs have the flexibility to move some
budgets from Pillar 1 to 2 (“modulation”)
but also vice versa (“reverse modulation”).
The latter is already occurring in some MSs
(SM E). Moreover, MSs still have to match
Pillar 2 payments with national cofunding.
Although the requirements for national co-
funding were reduced in certain cases com-
pared with the previous funding period,
MSs may still lack the budgets required to
unlock these resources or may prefer to al-
locate Pillar 2 funds to measures that are less
beneficial for biodiversity. Too few develop-
ments in the new Pillar 2 regulations focus
on improving cost-effectiveness in terms of
uptake and biodiversity outcomes. One im-
portant advancement in some MSs, however,
is encouraging farmers to act jointly toward
achieving landscape-scale targets (see SM E).
Agricultural intensification clearly pro-
vides some short-term economic gains for
farmers and the food industry. But these
have to be weighed against the loss of pub-
lic goods, such as climate stability ( 13),
landscape quality, and biodiversity ( 13, 14)
with associated environmental, health,
and societal costs that are largely external-
ized from the farming economy. The EU
acknowledges the importance of biodiver-
sity through its 2020 biodiversity targets,
as well as by endorsing the Aichi targets
of the Convention on Biological Diversity,
including strategic targets on sustainable
agricultural production and consumption
(goal 1, targets 4 and 7) and elimination of
incentives harmful to biodiversity (target
3) (SM F). These strategic goals, developed
from the evidence for the various costs of
losing biodiversity and ecosystem services
( 15), would be undermined if MSs adopt
the minimum requirements as set by the
reformed CAP.
THE WAY FORWARD. The EU has lost an
opportunity to design better guidelines
to improve agricultural sustainability. Yet
the increased devolution of responsibili-
ties to individual MSs offers flexibility for
promoting biodiversity and farmland eco-
systems. We provide six recommendations
for immediate action by MSs within the
CAP implementation (see box) (SM G). In
addition, we identify five actions for the
EU to consider in its deliberations over
the next CAP reform (details in SM H): (i)
publish an evidence-based assessment of
the CAP’s impacts on farmland habitats,
species, and ecosystem services, drawing
on national-level monitoring as a base for
improvements; (ii) increase the EU-wide
AES budget, direct it to more effective in-
centives, and shift to outcome—rather than
area-based targets; (iii) improve EFA ef-
fectiveness by reducing exemptions, refin-
1. Maintain or enhance the AES budget in Pillar 2 through budget modulation, prioritizing context-specifc measures shown to support biodiversity and ecosystem services. Set clear and measurable targets that are coherent with the EU Biodiversity Strategy.
2. Use AESs to allow specifc target groups (e.g., small holdings in marginal areas, young farmers, cooperating farmer groups) to proft from environmentally friendly practices or jointly provide landscape-scale benefts.
3. Ensure that eligible land uses for EFAs prioritize elements that beneft biodiversity and ecosystem services, including management prescriptions when necessary.
4. Complete identifcation and mapping of grasslands, with diferentiation into types, qualities, and required management.
5. Allocate sufcient funding and efort within the Farm Advisory System to deliver ecological expertise to farmers as required.
6. Institute comprehensive provisions for monitoring biodiversity outcomes to evaluate the efectiveness of the agricultural policy against the targets set in the EU.
Recommended immediate actions by Member States
*Author af liations can be found in supplementary material (SM) on Science Online. †Corresponding author. [email protected]
Many EU politicians are announcing the new CAP as “greener,” but the new environmental prescriptions are so diluted that they are unlikely to benefit biodiversity.
Published by AAAS
INSIGHTS | PERSPECTIVES
1092 6 JUNE 2014 • VOL 344 ISSUE 6188 sciencemag.org SCIENCE
Energy-releasing chemical reactions are
at the core of the living process of all
organisms. These bioenergetic reac-
tions have myriad substrates and prod-
ucts, but their main by-product today
is adenosine triphosphate (ATP), life’s
primary currency of metabolic energy. Bioen-
ergetic reactions have been running in a se-
quence of uninterrupted continuity since the
first prokaryotes arose on Earth more than
3.5 billion years ago, long before there was
oxygen to breathe ( 1). Under what conditions
did these bioenergetic processes first evolve?
Many ingenious ideas about energy at
life’s origins have nothing in common with
modern life. It is conceivable that early life
harnessed energy from volcanic pyrite syn-
thesis ( 2), zinc sulfide–based photosynthesis
( 3), ultraviolet radiation, or lightning, yet
none of these processes powers known mi-
crobial life forms. For biologists, the origin of
energy-harnessing mechanisms used by real
microbes is the issue. Recent studies point to
parallels between the energy-harnessing sys-
tems of ancient microbes and the geochem-
istry of alkaline hydrothermal vents (see the
figure), suggesting that natural ion gradients
in such vents ignited life’s ongoing chemical
reaction.
How did the first cells harness energy? Be-
cause life arose in a world without molecu-
lar oxygen, some anaerobes are likely to be
ancient, and anaerobic environments should
harbor primitive bioenergetic reactions ( 4,
5). Ancient anaerobic niches deep in Earth’s
crust often contain acetogens (bacteria) and
methanogens (archaea), groups that biolo-
gists have long thought to be ancient ( 4).
However, anaerobic environments harbor
very little energy to harness ( 6, 7). In the an-
aerobic environments of submarine hydro-
thermal vents, geochemically generated H2
is the main source of chemical energy.
In addition to being strict anaerobes, ace-
togens and methanogens live from H2, us-
ing the simplest and arguably most ancient
forms of energy metabolism ( 8). Both syn-
thesize ATP by reducing CO2 with electrons
from H2 to make acetate and methane, re-
spectively. They use a chemical mechanism
called flavin-based electron bifurcation ( 6)
to generate highly reactive ferredoxins—
small, ancient iron-sulfur proteins ( 5) that
are as central to their energy conservation
as is ATP ( 6). The shared backbone of their
energy metabolism is the acetyl–coenzyme
A pathway, the most primitive CO2-fixing
pathway ( 8) and the one typical of sub-
surface microbes ( 9). Metabolism in these
anaerobes is furthermore replete with reac-
tions catalyzed by transition metals such
as iron, nickel, molybdenum, or tungsten,
another ancient trait ( 2, 5– 8).
All known life forms, including methano-
gens and acetogens, use two basic mecha-
nisms to tap environmentally available
energy and harness it as ATP. The first is
substrate-level phosphorylation, in which
highly reactive phosphate-containing com-
pounds phosphorylate adenosine diphos-
phate (ADP) to make ATP ( 6, 10). The energy
conserved in ATP is released in a subsequent
reaction that does chemical work for the
cell or allows more sluggish reactions to go
forward. The highly reactive phosphate com-
pounds are generated during conversions of
carbon compounds. Their synthesis is driven
by environmental sources of chemical en-
ergy such as H2 plus CO
2 that are harnessed
during conversion to more thermodynami-
cally stable compounds such as methane
and acetate.
The second mechanism that cells use to
harness energy involves ion gradients and
is called chemiosmotic coupling. Here, an
energy-releasing reaction is coupled to the
pumping of ions across a membrane from
inside the cell to the outside. The most com-
mon ions used for this purpose are protons,
By William F. Martin ,1
Filipa L. Sousa ,1 Nick Lane 2
1Institute of Molecular Evolution, Heinrich-Heine-Universität, Universitätsstrasse 1, 40225 Düsseldorf, Germany. 2Research Department of Genetics, Evolution and Environment, University College London, London WC1E 6BT, UK. E-mail: [email protected]
… the primordial ATPase could have harnessed geochemically generated gradients at an alkaline hydrothermal vent.
Energy at life’s originAnalysis of the bioenergetics of primitive organisms suggests that life began at hydrothermal vents
EVOLUTIONing management criteria for qualification,
and expanding their total area, building
on country-level evidence and experience
(recommendations 3 and 6 to MSs); (iv) de-
velop longer-term perspectives for more ef-
fective and comprehensive protection and
restoration of grasslands and peatland; (v)
reevaluate the usefulness of the crop diver-
sity measure.
Our recommendations should encourage
MSs and the EU to start moving toward
more sustainable agriculture, securing
food provision alongside biodiversity and
ecosystem services for current and future
generations. ■
REFERENCES AND NOTES
1. K. Henle et al., Agric. Ecosyst. Environ. 124, 60 (2008).
2. European Environment Agency, EU 2010 Biodiversity
Baseline (Tech. Rep. No. 12/2010, EEA, Copenhagen,
2010).
3. L. G. Carvalheiro et al., Ecol. Lett. 16, 870 (2013).
4. T. G. Benton, J. A. Vickery, J. D. Wilson, Trends Ecol. Evol.
18, 182 (2003).
5. R. D. Gregory, A. van Strien, Ornitholog. Sci. 9, 3 (2010).
6. European Environment Agency, The European Grassland
Butterfly Indicator: 1990–2011 (Tech. Rep. No. 11/2013,
EEA, Luxembourg, 2013).
7. Directorate-General for Internal Policies, Policy
Department B, Note: European Council Conclusions on
the Multiannual Financial Framework 2014–2020 and the
CAP (European Parliament, Brussels, 2013).
8. European Commission, Our life insurance, our natural
capital: an EU biodiversity strategy to 2020 (European
Commission, Brussels, 2011).
9. European Commission, The CAP towards 2020: Meeting
the food, natural resources and territorial challenges of
the future (European Commission, Brussels, 2010).
10. C. Rutz, J. Dwyer, J. Schramek, Sociol. Rural. (2013),
doi: 10.1111/soru.12033.
11. L. V. Dicks et al., Conserv. Lett. 7, 119 (2014).
12. R. F. Pywell et al., Biol. Lett. 8, 772 (2012).
13. Millennium Ecosystem Assessment, Ecosystems and
Human Well-Being: Biodiversity Synthesis (World
Resources Institute, Washington, DC, 2005).
14. R. Bommarco, D. Kleijn, S. G. Potts, Trends Ecol. Evol. 28,
230 (2013).
15. TEEB, The Economics of Ecosystems and Biodiversity:
Ecological and Economic Foundations (Earthscan,
London, 2010).
ACKNOWLEDGMENTS
We thank P. Ibisch, T. Vandermaesen, A. Barnett, E. Ellis, L.
Podmaniczky, T. Hartel, J. Y. Humbert, M. Liebman, S. Becheva,
G. Beaufoy, S. Boldogh, J. Tzanopoulos, J. Hegarty, T. Lancaster,
and P. Vorisek for valuable inputs. G.P., K.H., and A.V.S.
acknowledge EC FP7 projects SCALES (contract 226852),
R.A. was supported by the Swiss National Science Foundation
(31003A-120152) and the Swiss Government; A.A.B. and D.K.
acknowledge EC FP7 project LIBERATION (311781); A.A.B.
acknowledges MTA Lendület; W.J.S. acknowledges Arcadia;
L.V.D. is funded by the Natural Environment Research Council
(NE/K015419/1); The Pan-European Common Bird Monitoring
Scheme is a joint initiative of the European Bird Census Council
and the BirdLife International, funded by the EC and the Royal
Society for the Protection of Birds.
SUPPLEMENTARY MATERIALS
www.sciencemag.org/content/344/6188/1090/suppl/DC
10.1126/science.1253425
Published by AAAS
www.sciencemag.org/content/344/6188/1090/suppl/DC1
Supplementary Materials for
EU agricultural reform fails on biodiversity
G. Pe’er,* L. V. Dicks, P. Visconti, R. Arlettaz, A. Báldi, T. G. Benton, S. Collins, M. Dieterich, R. D. Gregory, F. Hartig, K. Henle, P. R. Hobson, D. Kleijn,
R. K. Neumann, T. Robijns, J. Schmidt, A. Shwartz, W. J. Sutherland, A. Turbe, F. Wulf, A. V. Scott
*Corresponding author. E-mail: [email protected]
Published 6 June 2014, Science 344, 1090 (2014) DOI: 10.1126/science.1252254
This PDF file includes
Materials and Methods Supplementary Text Figs. S1 to S4 Tables S1 to S4 References
1
Supplementary Materials Outline of Supplementary Materials
Methods Introduction ..................................................................................................................................... 1 A: Why Is the CAP Crucial to Biodiversity Recovery? ..................................................................... 2 B: Ecological Focus Areas (EFA) ....................................................................................................... 3 C: Permanent Grasslands .................................................................................................................... 6 D: Crop Diversification ....................................................................................................................... 8 E: Rural Development Regulation (‘Pillar 2’) .................................................................................. 10 F: Overall Summary of the CAP’s Weaknesses from a Biodiversity Perspective ............................ 13 G: Guidelines for Immediate Action by MS ..................................................................................... 16 H: Recommendations for the Next Review of the CAP ................................................................... 19 I: Details of Methodologies and Data Sources Underpinning Figure in the Policy Forum .............. 22 Supplementary Text: Affiliations……. ......................................................................................... 25 References ........................................................................................................................................ 26
Introduction. This supplementary material offers a thorough evaluation of the Common Agricultural Policy (CAP) and the likely overall effects of the CAP reform on biodiversity. We first examine each of the three compulsory ‘greening’ measures within Pillar 1 (sections B–D), followed by the Rural Development Regulation (Pillar 2) in terms of both budget and potential cost-effectiveness (Section E). Following a synthesis of our evaluation on the CAP as a whole (Section F), we offer guidelines for immediate action by Member States (section G), as well as recommendations for the next review of the CAP (section H). We support all guidelines and recommendations with scientific evidence where available. Section I sets out the methods underlying the figures in the main published text.
Main sources of evidence supporting this appendix are Dicks et al. (11), Polakova et al. (16), and analyses performed by the EU Working Group on Biodiversity and Agriculture (17). As these support various assessments and recommendations, we do not refer to them specifically within the text. Figures and tables are based on data from Eurostat (http://epp.eurostat.ec.europa.eu/portal/page/portal/eurostat/home) and FAOSTAT (http://faostat3.fao.org/faostat-gateway/go/to/home/E), as elaborated in section I.
2
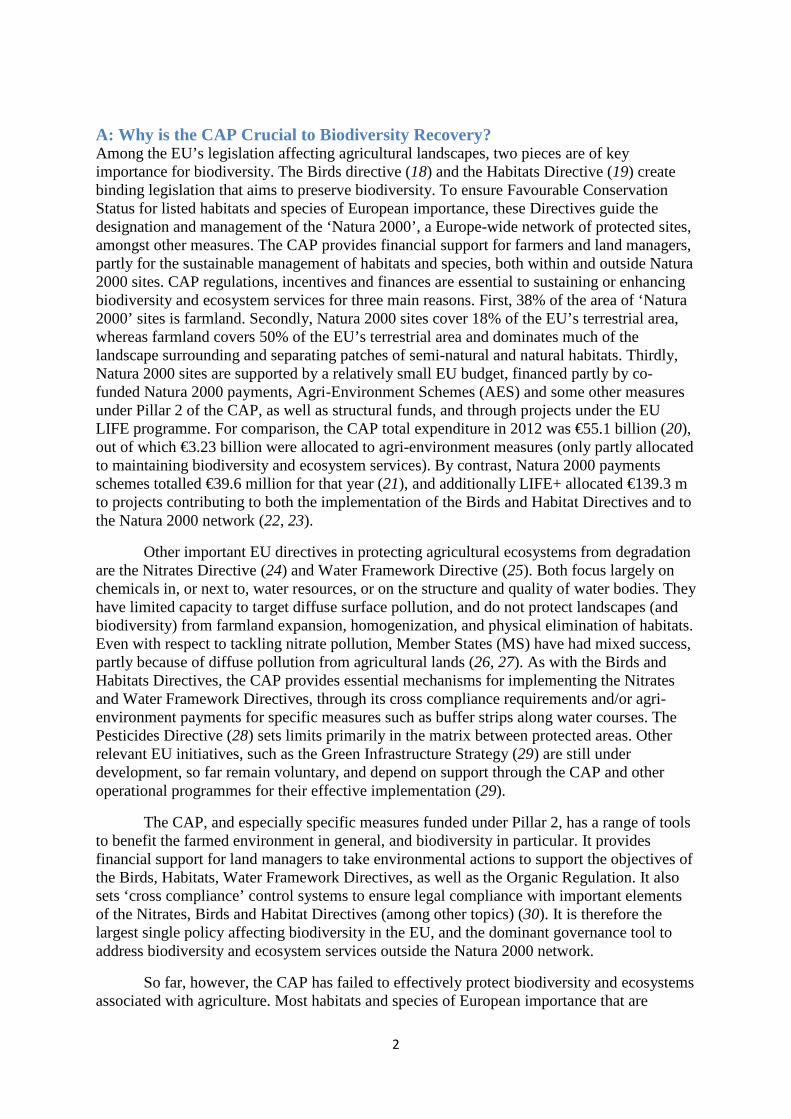
A: Why is the CAP Crucial to Biodiversity Recovery? Among the EU’s legislation affecting agricultural landscapes, two pieces are of key importance for biodiversity. The Birds directive (18) and the Habitats Directive (19) create binding legislation that aims to preserve biodiversity. To ensure Favourable Conservation Status for listed habitats and species of European importance, these Directives guide the designation and management of the ‘Natura 2000’, a Europe-wide network of protected sites, amongst other measures. The CAP provides financial support for farmers and land managers, partly for the sustainable management of habitats and species, both within and outside Natura 2000 sites. CAP regulations, incentives and finances are essential to sustaining or enhancing biodiversity and ecosystem services for three main reasons. First, 38% of the area of ‘Natura 2000’ sites is farmland. Secondly, Natura 2000 sites cover 18% of the EU’s terrestrial area, whereas farmland covers 50% of the EU’s terrestrial area and dominates much of the landscape surrounding and separating patches of semi-natural and natural habitats. Thirdly, Natura 2000 sites are supported by a relatively small EU budget, financed partly by co-funded Natura 2000 payments, Agri-Environment Schemes (AES) and some other measures under Pillar 2 of the CAP, as well as structural funds, and through projects under the EU LIFE programme. For comparison, the CAP total expenditure in 2012 was €55.1 billion (20), out of which €3.23 billion were allocated to agri-environment measures (only partly allocated to maintaining biodiversity and ecosystem services). By contrast, Natura 2000 payments schemes totalled €39.6 million for that year (21), and additionally LIFE+ allocated €139.3 m to projects contributing to both the implementation of the Birds and Habitat Directives and to the Natura 2000 network (22, 23).
Other important EU directives in protecting agricultural ecosystems from degradation are the Nitrates Directive (24) and Water Framework Directive (25). Both focus largely on chemicals in, or next to, water resources, or on the structure and quality of water bodies. They have limited capacity to target diffuse surface pollution, and do not protect landscapes (and biodiversity) from farmland expansion, homogenization, and physical elimination of habitats. Even with respect to tackling nitrate pollution, Member States (MS) have had mixed success, partly because of diffuse pollution from agricultural lands (26, 27). As with the Birds and Habitats Directives, the CAP provides essential mechanisms for implementing the Nitrates and Water Framework Directives, through its cross compliance requirements and/or agri-environment payments for specific measures such as buffer strips along water courses. The Pesticides Directive (28) sets limits primarily in the matrix between protected areas. Other relevant EU initiatives, such as the Green Infrastructure Strategy (29) are still under development, so far remain voluntary, and depend on support through the CAP and other operational programmes for their effective implementation (29).
The CAP, and especially specific measures funded under Pillar 2, has a range of tools to benefit the farmed environment in general, and biodiversity in particular. It provides financial support for land managers to take environmental actions to support the objectives of the Birds, Habitats, Water Framework Directives, as well as the Organic Regulation. It also sets ‘cross compliance’ control systems to ensure legal compliance with important elements of the Nitrates, Birds and Habitat Directives (among other topics) (30). It is therefore the largest single policy affecting biodiversity in the EU, and the dominant governance tool to address biodiversity and ecosystem services outside the Natura 2000 network.
So far, however, the CAP has failed to effectively protect biodiversity and ecosystems associated with agriculture. Most habitats and species of European importance that are
3
dependent on agriculture have been reported by MS as being in “Unfavourable—inadequate” or “Unfavourable—bad” Conservation Status (2, 31), whereas the Habitats Directive sets the target to achieve a “Favourable Conservation Status”. Beyond reports from MS, monitoring schemes, such as of farmland birds and butterflies, show continuous declines (6, 32). Evidence of the recovery of some taxa is scanty and mostly relates to limited improvements in areas of North Western Europe (2), measured against an impoverished biodiversity baseline where a range of species have already shown substantial declines or gone extinct. Agri-environment schemes (AES) have had only partial success in counteracting the effects of other CAP incentives (33–35). AES that have been well designed, targeted and supported have been important in maintaining or restoring biodiversity. Other AES have suffered from low uptake and lack of spatial aggregation of efforts. In some cases, over-simplistic design, application and control of AES has even yielded adverse effects on species [e.g., (36)].
In the following we examine the new CAP against the current status quo, which requires effective greening of the CAP to reverse the long decline in the state of biodiversity in the intensified agricultural landscapes of Western Europe, and to halt the on-going loss of biodiversity in most other regions in Europe. We further examine the CAP in relation to target 3A of the EU’s Biodiversity Strategy for 2020, which sets the requirement to maximise the area allocated to biodiversity conservation in farmland areas and so to increase the contribution of agriculture to the recovery of habitats and species of European importance as required by the EU Biodiversity Strategy (8).
B: Ecological Focus Areas (EFAs)
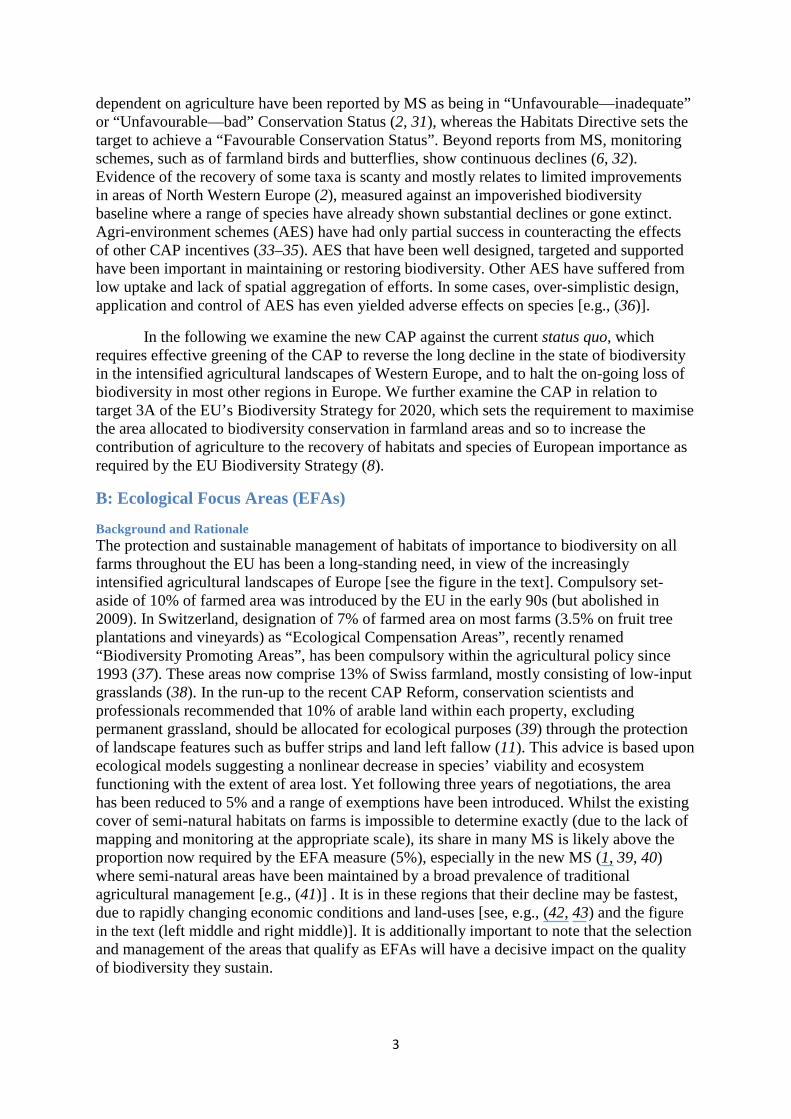
Background and Rationale The protection and sustainable management of habitats of importance to biodiversity on all farms throughout the EU has been a long-standing need, in view of the increasingly intensified agricultural landscapes of Europe [see the figure in the text]. Compulsory set-aside of 10% of farmed area was introduced by the EU in the early 90s (but abolished in 2009). In Switzerland, designation of 7% of farmed area on most farms (3.5% on fruit tree plantations and vineyards) as “Ecological Compensation Areas”, recently renamed “Biodiversity Promoting Areas”, has been compulsory within the agricultural policy since 1993 (37). These areas now comprise 13% of Swiss farmland, mostly consisting of low-input grasslands (38). In the run-up to the recent CAP Reform, conservation scientists and professionals recommended that 10% of arable land within each property, excluding permanent grassland, should be allocated for ecological purposes (39) through the protection of landscape features such as buffer strips and land left fallow (11). This advice is based upon ecological models suggesting a nonlinear decrease in species’ viability and ecosystem functioning with the extent of area lost. Yet following three years of negotiations, the area has been reduced to 5% and a range of exemptions have been introduced. Whilst the existing cover of semi-natural habitats on farms is impossible to determine exactly (due to the lack of mapping and monitoring at the appropriate scale), its share in many MS is likely above the proportion now required by the EFA measure (5%), especially in the new MS (1, 39, 40) where semi-natural areas have been maintained by a broad prevalence of traditional agricultural management [e.g., (41)] . It is in these regions that their decline may be fastest, due to rapidly changing economic conditions and land-uses [see, e.g., (42, 43) and the figure in the text (left middle and right middle)]. It is additionally important to note that the selection and management of the areas that qualify as EFAs will have a decisive impact on the quality of biodiversity they sustain.
4
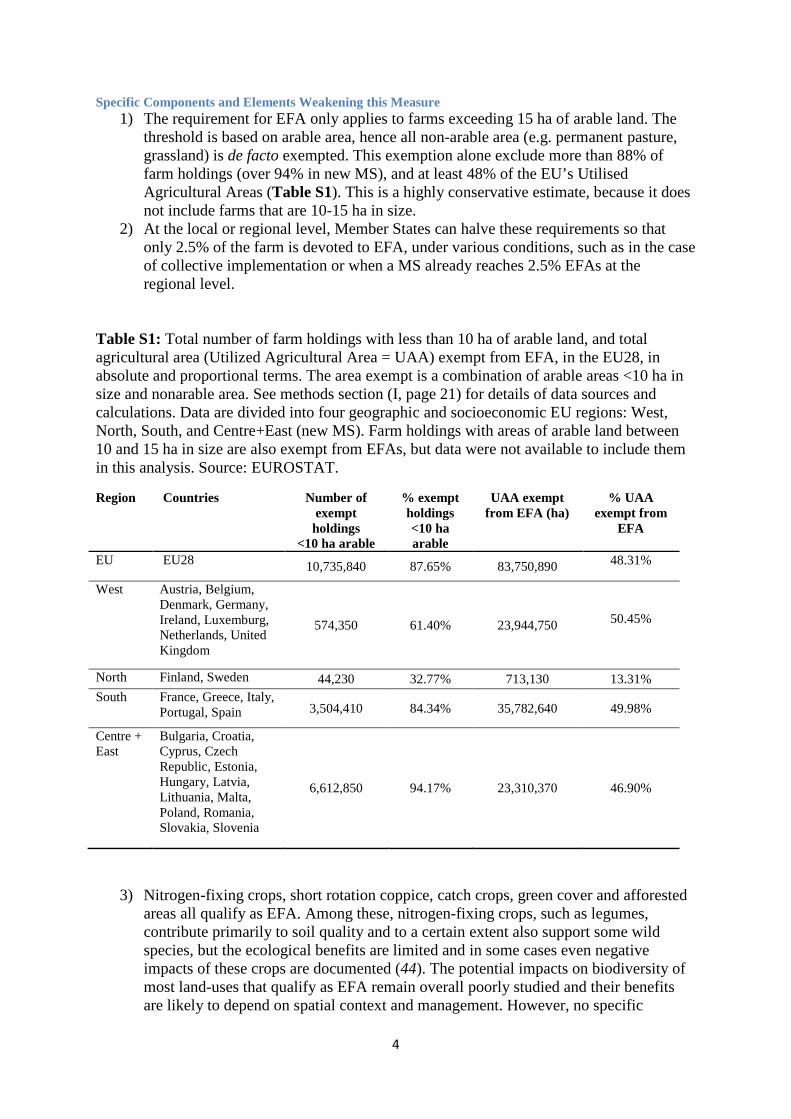
Specific Components and Elements Weakening this Measure 1) The requirement for EFA only applies to farms exceeding 15 ha of arable land. The
threshold is based on arable area, hence all non-arable area (e.g. permanent pasture, grassland) is de facto exempted. This exemption alone exclude more than 88% of farm holdings (over 94% in new MS), and at least 48% of the EU’s Utilised Agricultural Areas (Table S1). This is a highly conservative estimate, because it does not include farms that are 10-15 ha in size.
2) At the local or regional level, Member States can halve these requirements so that only 2.5% of the farm is devoted to EFA, under various conditions, such as in the case of collective implementation or when a MS already reaches 2.5% EFAs at the regional level.
Table S1: Total number of farm holdings with less than 10 ha of arable land, and total agricultural area (Utilized Agricultural Area = UAA) exempt from EFA, in the EU28, in absolute and proportional terms. The area exempt is a combination of arable areas <10 ha in size and nonarable area. See methods section (I, page 21) for details of data sources and calculations. Data are divided into four geographic and socioeconomic EU regions: West, North, South, and Centre+East (new MS). Farm holdings with areas of arable land between 10 and 15 ha in size are also exempt from EFAs, but data were not available to include them in this analysis. Source: EUROSTAT.
Region Countries Number of exempt
holdings <10 ha arable
% exempt holdings <10 ha arable
UAA exempt from EFA (ha)
% UAA exempt from
EFA
EU EU28 10,735,840 87.65% 83,750,890 48.31%
West Austria, Belgium, Denmark, Germany, Ireland, Luxemburg, Netherlands, United Kingdom
574,350 61.40% 23,944,750 50.45%
North Finland, Sweden 44,230 32.77% 713,130 13.31% South France, Greece, Italy,
Portugal, Spain 3,504,410 84.34% 35,782,640 49.98%
Centre + East
Bulgaria, Croatia, Cyprus, Czech Republic, Estonia, Hungary, Latvia, Lithuania, Malta, Poland, Romania, Slovakia, Slovenia
6,612,850 94.17% 23,310,370 46.90%
3) Nitrogen-fixing crops, short rotation coppice, catch crops, green cover and afforested areas all qualify as EFA. Among these, nitrogen-fixing crops, such as legumes, contribute primarily to soil quality and to a certain extent also support some wild species, but the ecological benefits are limited and in some cases even negative impacts of these crops are documented (44). The potential impacts on biodiversity of most land-uses that qualify as EFA remain overall poorly studied and their benefits are likely to depend on spatial context and management. However, no specific
5
management guidelines are currently required on most of these crops in order to qualify as EFA. This presents an obstacle to effectively support biodiversity. For instance, no restrictions were set on the use of pesticides and fertilizers on nitrogen fixing crops.
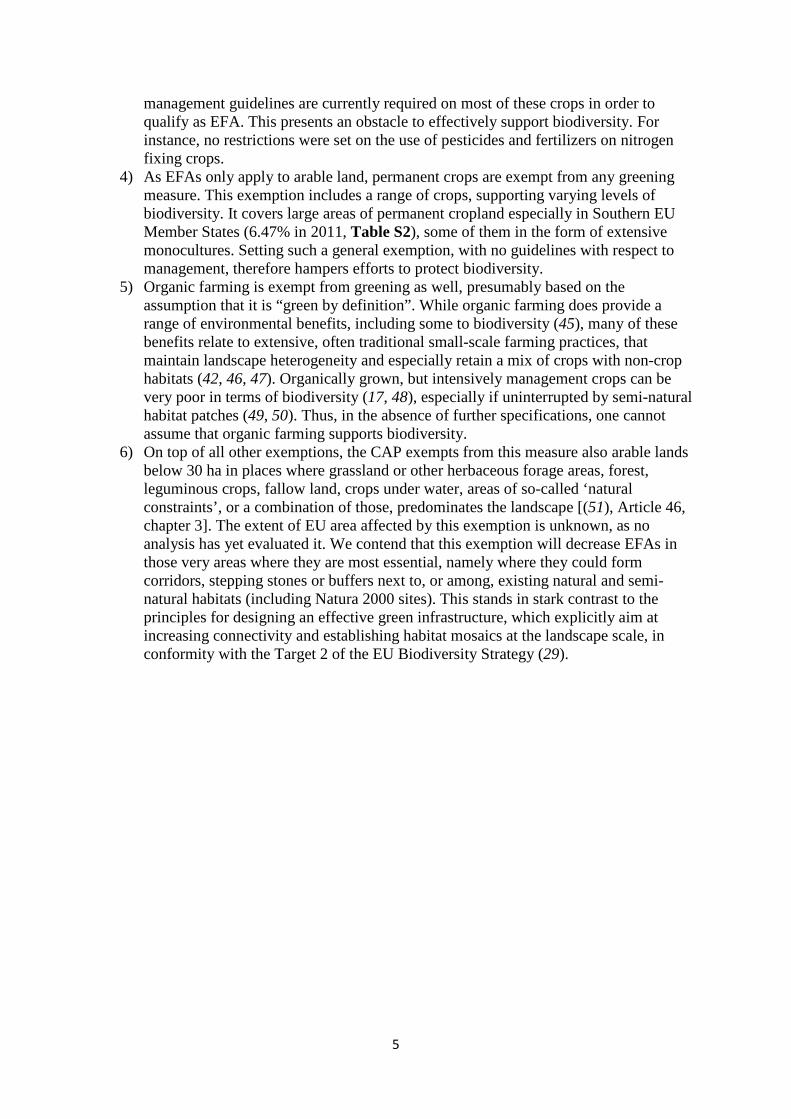
4) As EFAs only apply to arable land, permanent crops are exempt from any greening measure. This exemption includes a range of crops, supporting varying levels of biodiversity. It covers large areas of permanent cropland especially in Southern EU Member States (6.47% in 2011, Table S2), some of them in the form of extensive monocultures. Setting such a general exemption, with no guidelines with respect to management, therefore hampers efforts to protect biodiversity.
5) Organic farming is exempt from greening as well, presumably based on the assumption that it is “green by definition”. While organic farming does provide a range of environmental benefits, including some to biodiversity (45), many of these benefits relate to extensive, often traditional small-scale farming practices, that maintain landscape heterogeneity and especially retain a mix of crops with non-crop habitats (42, 46, 47). Organically grown, but intensively management crops can be very poor in terms of biodiversity (17, 48), especially if uninterrupted by semi-natural habitat patches (49, 50). Thus, in the absence of further specifications, one cannot assume that organic farming supports biodiversity.
6) On top of all other exemptions, the CAP exempts from this measure also arable lands below 30 ha in places where grassland or other herbaceous forage areas, forest, leguminous crops, fallow land, crops under water, areas of so-called ‘natural constraints’, or a combination of those, predominates the landscape [(51), Article 46, chapter 3]. The extent of EU area affected by this exemption is unknown, as no analysis has yet evaluated it. We contend that this exemption will decrease EFAs in those very areas where they are most essential, namely where they could form corridors, stepping stones or buffers next to, or among, existing natural and semi-natural habitats (including Natura 2000 sites). This stands in stark contrast to the principles for designing an effective green infrastructure, which explicitly aim at increasing connectivity and establishing habitat mosaics at the landscape scale, in conformity with the Target 2 of the EU Biodiversity Strategy (29).
6
Table S2: Percentage coverage of total agricultural area, arable land, permanent crops and meadows in EU MS as per 2011, divided into four geographic and socio-economic EU regions: West, North, South, and Centre+East (new MS). Source: FAOSTAT.
% of total EU land area which is… Region Countries Agricultural Arable Permanent
crops Permanent meadows
EU EU27 44.61 25.70 2.84 16.08 West Austria, Belgium, Denmark,
Germany, Ireland, Luxemburg, Netherlands, United Kingdom
55.66 29.14 0.44 16.00
North Finland, Sweden 7.49 6.80 0.02 15.53 South France, Greece, Italy, Portugal,
Spain 52.75 26.44 6.47 15.25
Central + East Bulgaria, Cyprus, Czech Republic, Estonia, Hungary, Latvia, Lithuania, Malta, Poland, Romania, Slovakia, Slovenia
48.78 34.60 1.31 17.74
To summarize, a substantial proportion of EU’s farmers and farmland area will either be exempt from the EFA greening requirement or entitled to receive subsidies under this measure without implementing any specific management prescription that could provide benefits to biodiversity (11, 52). This measure is therefore unlikely to contribute to improving the status of farmland biodiversity given that the majority of farmers would not be required to perform any changes of current farming practices to comply with it.
C: Permanent Grasslands
Background and Rationale
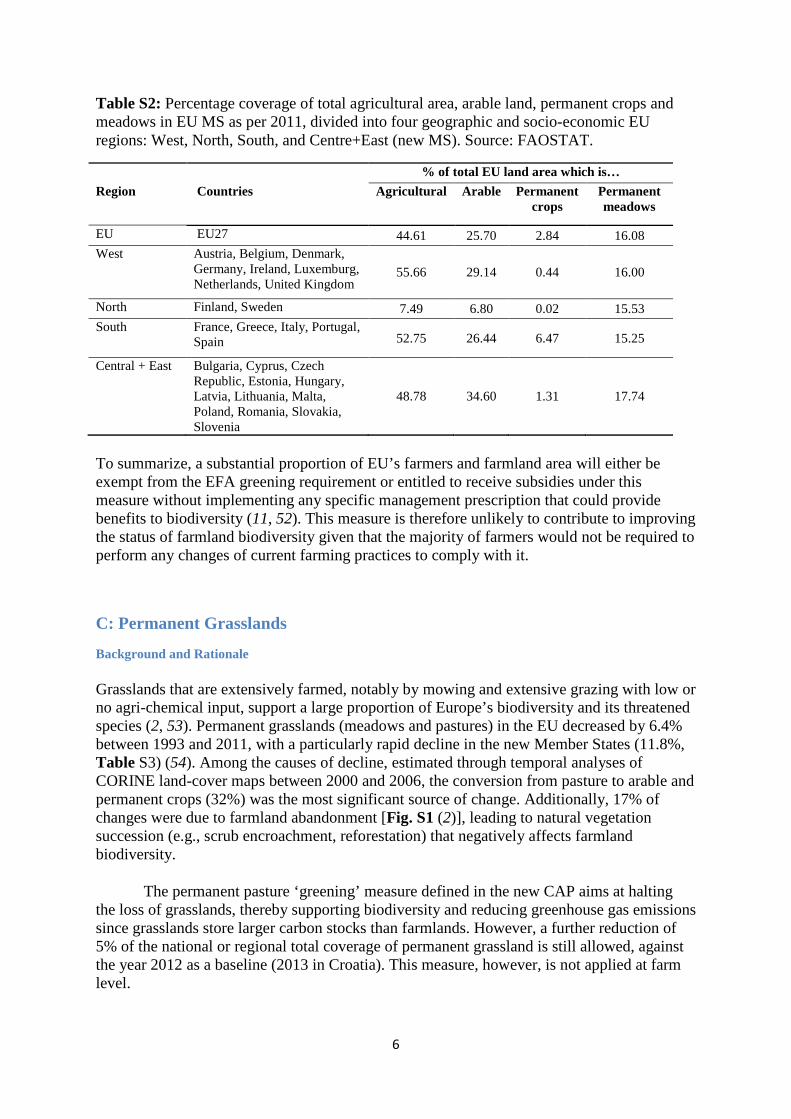
Grasslands that are extensively farmed, notably by mowing and extensive grazing with low or no agri-chemical input, support a large proportion of Europe’s biodiversity and its threatened species (2, 53). Permanent grasslands (meadows and pastures) in the EU decreased by 6.4% between 1993 and 2011, with a particularly rapid decline in the new Member States (11.8%, Table S3) (54). Among the causes of decline, estimated through temporal analyses of CORINE land-cover maps between 2000 and 2006, the conversion from pasture to arable and permanent crops (32%) was the most significant source of change. Additionally, 17% of changes were due to farmland abandonment [Fig. S1 (2)], leading to natural vegetation succession (e.g., scrub encroachment, reforestation) that negatively affects farmland biodiversity.
The permanent pasture ‘greening’ measure defined in the new CAP aims at halting the loss of grasslands, thereby supporting biodiversity and reducing greenhouse gas emissions since grasslands store larger carbon stocks than farmlands. However, a further reduction of 5% of the national or regional total coverage of permanent grassland is still allowed, against the year 2012 as a baseline (2013 in Croatia). This measure, however, is not applied at farm level.
7
Table S3: Changes in the total area of permanent meadows and pastures between 1993 and 2011, divided to four EU regions: West, North, South, and Centre+East (new MS). Source: FAOSTAT.
Regions Countries Change in area (1000 ha)
Change in %
EU EU27 -4,582.9 -6.38 West Austria, Belgium, Denmark,
Germany, Ireland, Luxemburg, Netherlands, United Kingdom
-1,656.4 -6.95
North Finland, Sweden -203 -29.77 South France, Greece, Italy, Portugal,
Spain -904 -2.84
Centre + East
Bulgaria, Cyprus, Czech Republic, Estonia, Hungary, Latvia, Lithuania, Malta, Poland, Romania, Slovakia, Slovenia
-1,819.5 -11.81
Fig. S1: Causes of grassland loss across the EU in 2000-2006. Copyright holder: European Environment Agency (EEA), Copenhagen.
Specific Components and Elements Weakening this Measure 1) The definition of permanent grassland for the purposes of ‘greening’ Pillar 1 payments
combines all grasslands. This includes reseeded grassland and grassland monocultures that have little value for biodiversity, together with semi-natural (‘unimproved’) grasslands, which are valuable for biodiversity, support many rare and endangered species, and provide a range of ecosystem services. Outside Natura 2000 sites, this greening measure can thus be fulfilled by farms with valuable, often ancient grasslands, even if converting them into highly intensified, uniform and species-poor swards (6). Notably, stricter rules apply within Natura 2000 areas, where Member States will have to designate areas of “environmentally sensitive permanent grassland” (including peatlands and wetlands), which may not be converted or ploughed. Member States may decide to
8
extend these requirements beyond protected areas, to cover all High Nature Value (HNV) grasslands. If they do not, valuable permanent grasslands that are not designated under the Habitats Directive will remain at a very high risk of degradation or loss.
2) While many MS are putting intensive efforts into mapping grassland, many still lack appropriate grassland inventories (e.g., Greece, Slovenia, Spain, Finland, Portugal) (55) and thus the necessary reference baseline to enable their effective protection. “Appropriate”, in this context, entails spatial and thematic resolutions that are detailed enough to enable farm-level regulation, and evaluation of habitat type and quality. Deficiencies in mapping and resulting misclassifications can have significant consequences for biodiversity. For example, between 2003 and 2009, such deficiencies have led to the loss of 35% of lowland hay meadows in Natura 2000 sites in South-western Germany, although these should be strictly protected under the Habitat Directive (56).
3) The CAP refers to the year 2012 as a reference baseline for permanent grassland coverage estimates (2013 in Croatia). Yet there are no clear requirements as to grassland quality criteria. This enables various forms of intensification or degradation of semi-natural, biodiversity-rich grassland.
4) The measure only requires maintaining overall area, but not the maintenance of existing parcels of semi-natural grassland. Thus, there is no means to prevent farmers from ploughing and replanting, or relocating, grassland within their land (except within Natura 2000 sites), thereby losing the species characterizing permanent semi-natural grasslands (57).
5) While allowing up to 5% loss of grasslands at the regional or national level, it is noteworthy that this threshold is above current annual rates of loss in some regions (Table S3). Additionally, this measure will be hard to control because it does not apply at the farm level.
To summarise, this greening measure allows both direct losses of valuable semi-natural grasslands and indirect losses by setting too few requirements regarding their quality, management and continuity.
D: Crop Diversification
Background and Rationale Landscape heterogeneity is a key factor in maintaining biodiversity. Mosaic landscapes, with a range of different habitats, can better support the needs of a diverse collection of different species (4, 58). There are growing concerns about the loss of such heterogeneity due to the increase in monocultures covering large areas. A well-designed crop diversification measure could potentially help in maintaining some level of heterogeneity (4, 53), but in its current form it falls far short of what is required.
Specific Components and Elements Weakening the Measure 1. The new CAP crop diversification ‘greening’ measure requires farm holdings with arable
land of 10-30 ha to cultivate at least two crops, and farms exceeding 30 ha must have at least three crops, with no more than 75% of the farmed area assigned to one crop. With merely 3 crops, or, in fact, only two when considering that winter and spring plantings of the same crop count as two different crops, this requirement sets a threshold that differs only marginally from complete homogenization. This measure is furthermore based on
9
virtually no evidence that such a limited number of crops on large, intensively-managed farmed areas could enhance biodiversity (11).
2. Farms below 10 ha are exempt from this measure. This accounts for 81% of holdings, or 13% of EU Utilised Agricultural Area that have an arable area <10 ha, with a particularly high share of exempted farmers in new Member States (Table S4). This means that a vast proportion of farmers can receive Pillar 1 payments for a monoculture or even for converting their farm into one.
3. A comparison of the set targets to current crop diversity at the farm level indicates that the targets are lower than the current average (country level) diversity in 50% of the MS in Western EU MS and as many as 81% of the new MS. This means that the measure leaves ample room for onward reduction in crop diversity, especially in the new Member States.
4. Crop rotation is not required. This is in stark contrast to original proposals for this measure to focus primarily on crop rotation, due to the potential benefits of temporal heterogeneity to soil quality and biodiversity [e.g., bird assemblages (58)]. Furthermore, no requirements are set with respect to the nature of the crops contributing to crop diversity, e.g., by consideration of the potential contribution of legumes for nitrogen-fixing.
5. MS can define a range of practices as being ‘equivalent’ to one of the greening measures, either through a certification scheme or an AES (paid through Pillar 2), and hence replacing it. In the context of this measure, crop rotation can be deemed equivalent to crop diversification, but so do winter soil cover or catch crops [(51), Annex IX]. The latter two entail that monocultures can obtain certification under this greening measure, or receive AES subsidies. This enables exempting monocultures from a measure that was originally designated for them.
10
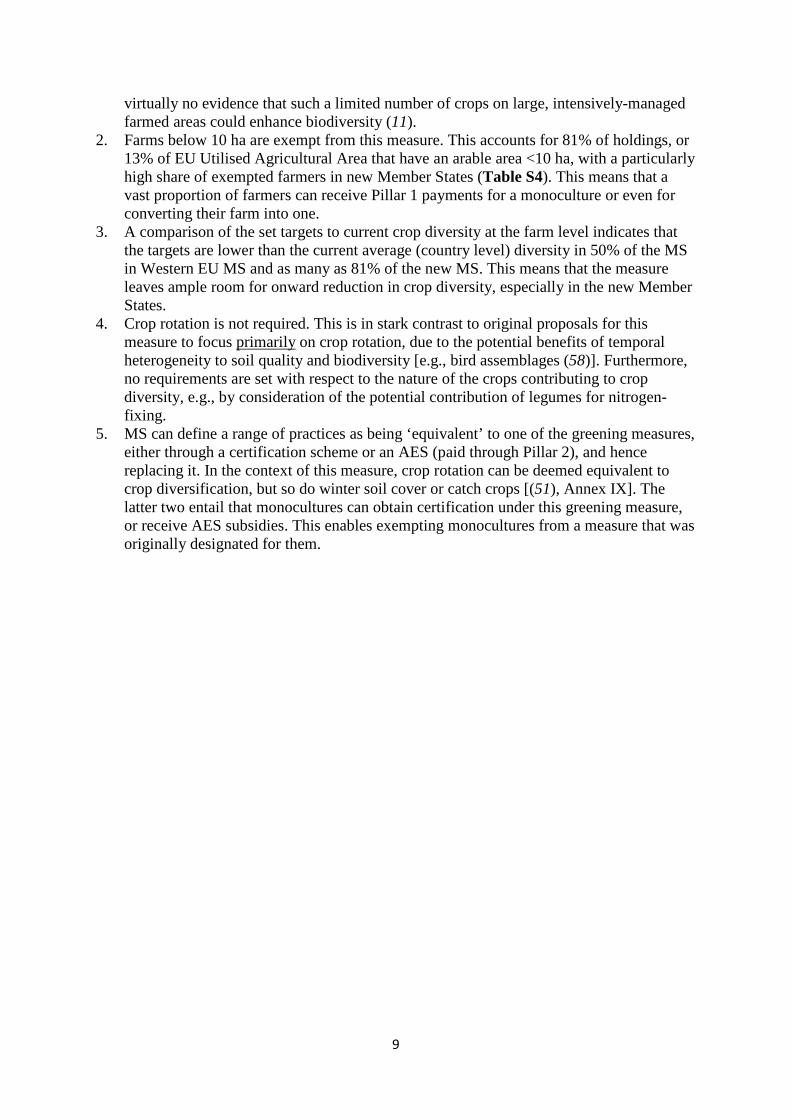
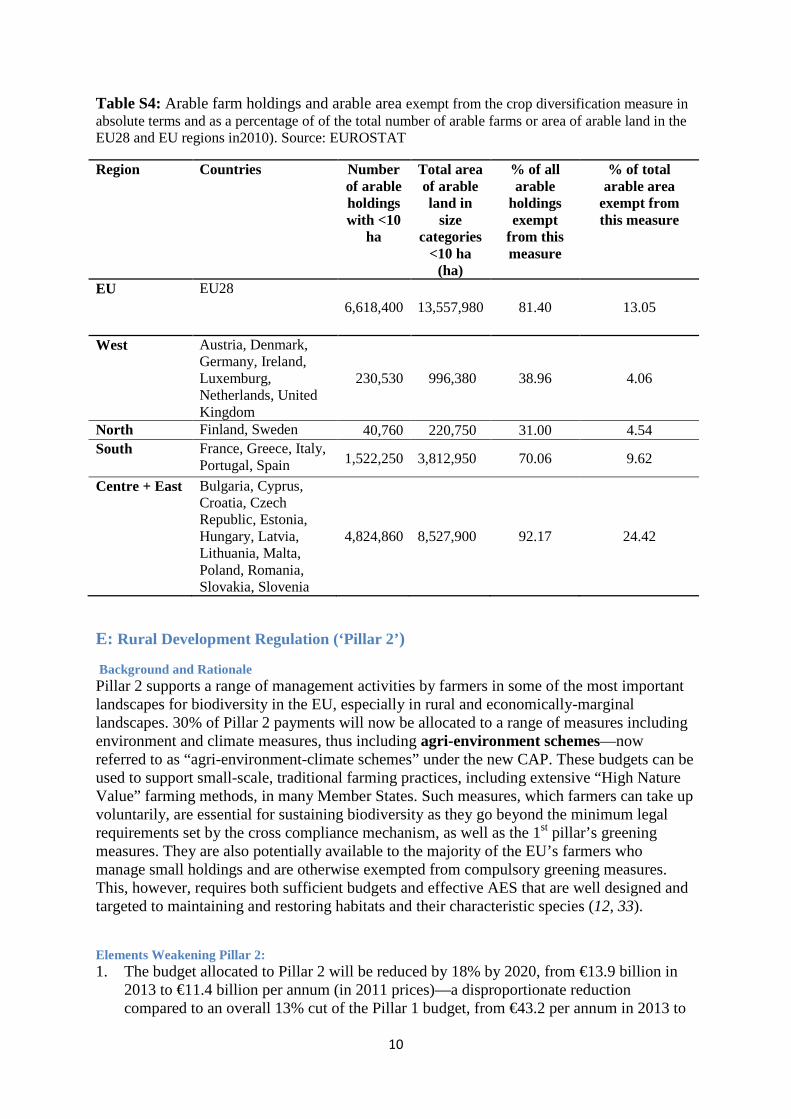
Table S4: Arable farm holdings and arable area exempt from the crop diversification measure in absolute terms and as a percentage of of the total number of arable farms or area of arable land in the EU28 and EU regions in2010). Source: EUROSTAT
Region Countries Number of arable holdings with <10
ha
Total area of arable land in
size categories
<10 ha (ha)
% of all arable
holdings exempt
from this measure
% of total arable area
exempt from this measure
EU EU28 6,618,400 13,557,980 81.40 13.05
West Austria, Denmark, Germany, Ireland, Luxemburg, Netherlands, United Kingdom
230,530 996,380 38.96 4.06
North Finland, Sweden 40,760 220,750 31.00 4.54 South France, Greece, Italy,
Portugal, Spain 1,522,250 3,812,950 70.06 9.62
Centre + East Bulgaria, Cyprus, Croatia, Czech Republic, Estonia, Hungary, Latvia, Lithuania, Malta, Poland, Romania, Slovakia, Slovenia
4,824,860 8,527,900 92.17 24.42
E: Rural Development Regulation (‘Pillar 2’)
Background and Rationale Pillar 2 supports a range of management activities by farmers in some of the most important landscapes for biodiversity in the EU, especially in rural and economically-marginal landscapes. 30% of Pillar 2 payments will now be allocated to a range of measures including environment and climate measures, thus including agri-environment schemes—now referred to as “agri-environment-climate schemes” under the new CAP. These budgets can be used to support small-scale, traditional farming practices, including extensive “High Nature Value” farming methods, in many Member States. Such measures, which farmers can take up voluntarily, are essential for sustaining biodiversity as they go beyond the minimum legal requirements set by the cross compliance mechanism, as well as the 1st pillar’s greening measures. They are also potentially available to the majority of the EU’s farmers who manage small holdings and are otherwise exempted from compulsory greening measures. This, however, requires both sufficient budgets and effective AES that are well designed and targeted to maintaining and restoring habitats and their characteristic species (12, 33).
Elements Weakening Pillar 2: 1. The budget allocated to Pillar 2 will be reduced by 18% by 2020, from €13.9 billion in
2013 to €11.4 billion per annum (in 2011 prices)—a disproportionate reduction compared to an overall 13% cut of the Pillar 1 budget, from €43.2 per annum in 2013 to
11
€37.6 billion by 2020 (7). Although 30% of Pillar 2 is now earmarked for environmental measures (compared to 25% in the previous CAP), this funding needs to cover not only biodiversity and support for farming in least favoured areas but also climate change mitigation, support for organic farming, and so-called environment and climate-related investments – with potentially both positive and negative impacts on biodiversity.
2. Few new or improved measures have been added to Pillar 2 to rectify and enhance the protection of biodiversity through voluntary schemes, although there are good examples of the benefits this approach can deliver for biodiversity (33, 59). In particular, no focus was given to developing target-oriented measures. One important advancement in some MS, however, is to allow for support to groups of farmers who collectively implement complementary measures in concert at the landscape scale; an approach which can enhance biodiversity if adopted sufficiently by MS and farmers and implemented at an appropriate spatial scale (60).
3. Member States have the flexibility to shift budgets from the first to the second pillar (“Modulation”) or vice versa (“Reverse Modulation”). This flexibility does not imply “greening”, as it allows substantial erosion of Pillar 2 through reverse modulation – as already approved in some MS (e.g., Poland, Slovakia, Croatia). Essentially, this transfer of political responsibility from the European Commission to Member States risks weakening the delivery of the environmental objectives of the CAP even further, especially in MS with less ambitious biodiversity goals (10).
4. Furthermore, MS may decide to shift budgets to elements in Pillar 2 that benefit intensification in rural areas rather than supporting environmental public goods, with risks of particularly damaging outcomes for biodiversity. Combined with reduced budget availability for biodiversity support, this exacerbates the risk of reducing the overall coherence of the CAP with the EU Biodiversity Strategy.
5. Member States must co-finance the second pillar to an extent ranging from 15% to 47%. Alterations of the co-financing rules from the previous CAP could improve the finances for Pillar 2 in some countries where the national co-financing requirement has been reduced compared to the previous CAP, as this would enable them to allocate more funds to Pillar 2 than the minimum required (as some MS have done in the past). However, the risk remains that many MS may still lack the budgets required to unlock EU AES co-financing. Furthermore, for some MS, increased EU co-financing, within a declining overall budget, eventually translates into less area that can receive Pillar 2 support. Consequently, the uptake and overall area supported by AES is likely to remain insufficient for maintaining and restoring biodiversity or may even decline under the reformed CAP.
Additional deficiencies in the overall structure of the CAP voluntary measures, some of which remain from the previous CAP, include: 6. Preference for short term contracts, which are counterproductive both in terms of uptake
(due to lack of reliability of the funding source for a given management) and from an ecological perspective, since habitat stability enhances a range of ecological processes supporting biodiversity, such as colonization, species viability, or soil building processes (57).
7. Lack of guidelines regarding the targeting of regions or habitats, to enhance the benefits for biodiversity. For instance, maintenance or enhancement of habitat connectivity should be an explicit target.
8. Lack of sufficient financial support for labour-intensive measures, or incentives for improved planning and coordination of activities across spatial scales (61).
9. The goals of decentralization and policy simplification need to be complemented by mechanisms that ensure the maintenance of landscape heterogeneity at larger scales. One
12
cannot assume that transferring decisions to lower levels would create more diversity: under homogenous financial incentives, as well as pressures from global markets, independent actors may favour the same land-uses and apply similar management practices. This retains the risk that homogenization of agricultural practices would continue threatening biodiversity [see, e.g., (62)].
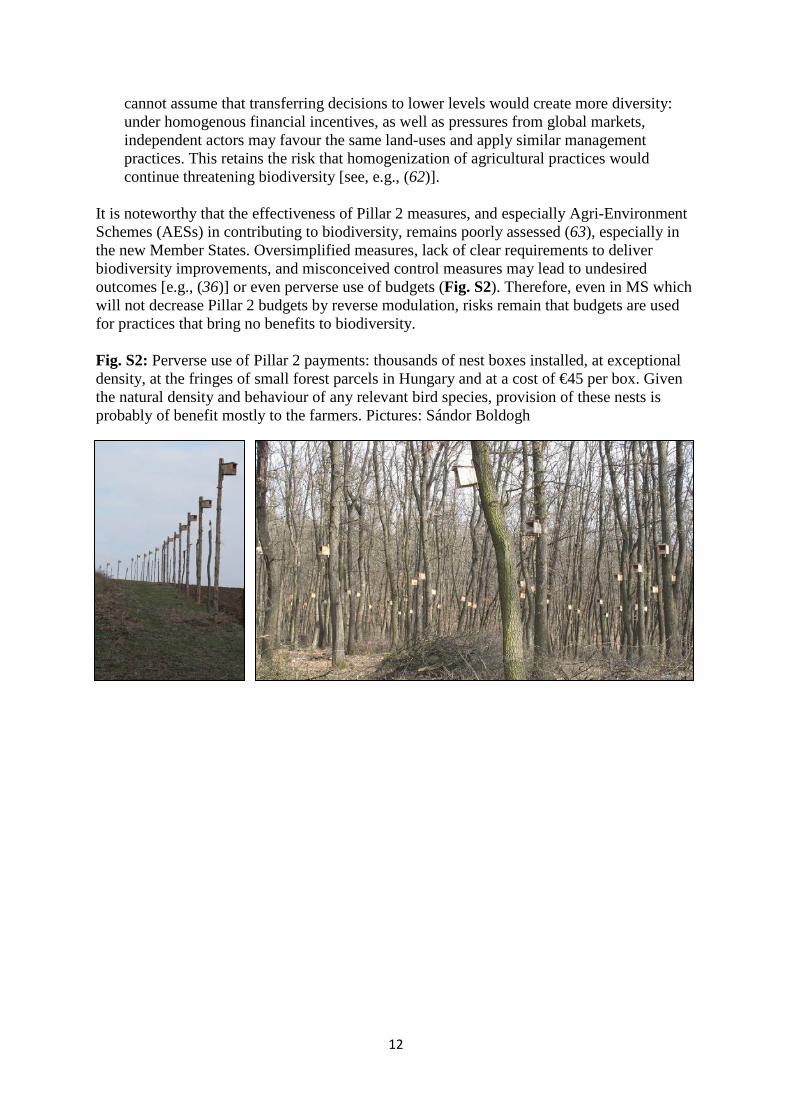
It is noteworthy that the effectiveness of Pillar 2 measures, and especially Agri-Environment Schemes (AESs) in contributing to biodiversity, remains poorly assessed (63), especially in the new Member States. Oversimplified measures, lack of clear requirements to deliver biodiversity improvements, and misconceived control measures may lead to undesired outcomes [e.g., (36)] or even perverse use of budgets (Fig. S2). Therefore, even in MS which will not decrease Pillar 2 budgets by reverse modulation, risks remain that budgets are used for practices that bring no benefits to biodiversity. Fig. S2: Perverse use of Pillar 2 payments: thousands of nest boxes installed, at exceptional density, at the fringes of small forest parcels in Hungary and at a cost of €45 per box. Given the natural density and behaviour of any relevant bird species, provision of these nests is probably of benefit mostly to the farmers. Pictures: Sándor Boldogh
13
F: Overall Summary of the CAP’s Weaknesses from a Biodiversity Perspective
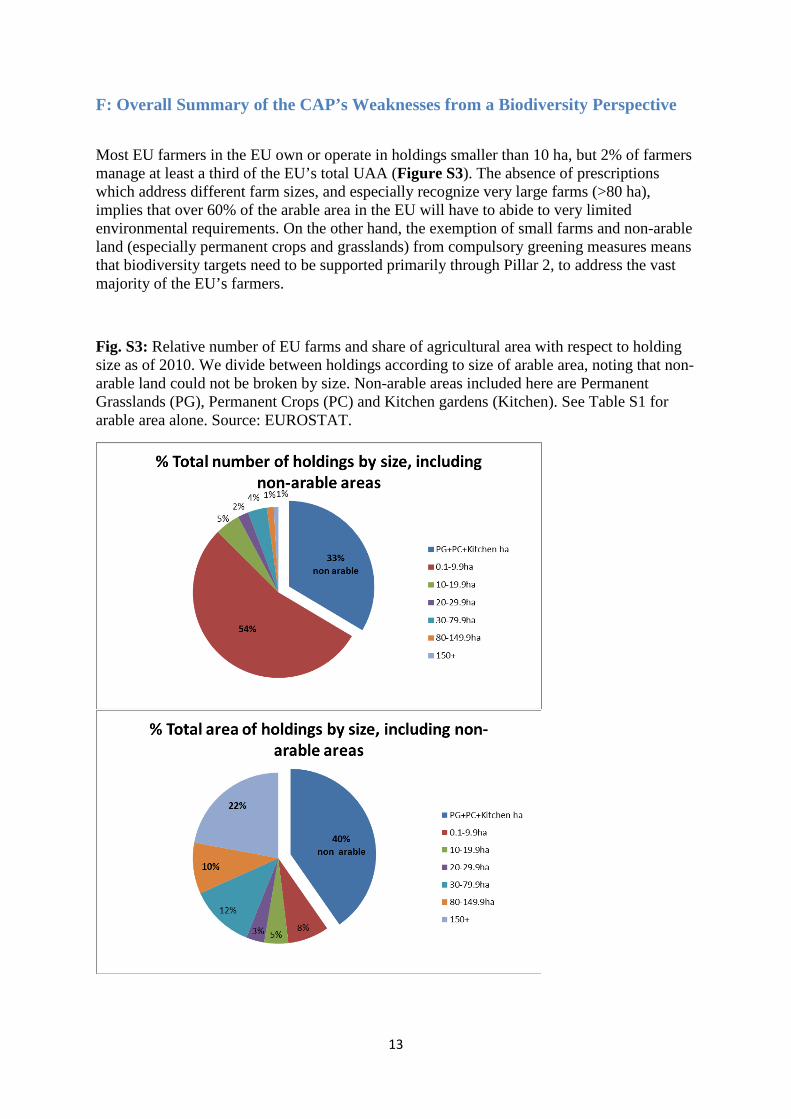
Most EU farmers in the EU own or operate in holdings smaller than 10 ha, but 2% of farmers manage at least a third of the EU’s total UAA (Figure S3). The absence of prescriptions which address different farm sizes, and especially recognize very large farms (>80 ha), implies that over 60% of the arable area in the EU will have to abide to very limited environmental requirements. On the other hand, the exemption of small farms and non-arable land (especially permanent crops and grasslands) from compulsory greening measures means that biodiversity targets need to be supported primarily through Pillar 2, to address the vast majority of the EU’s farmers.
Fig. S3: Relative number of EU farms and share of agricultural area with respect to holding size as of 2010. We divide between holdings according to size of arable area, noting that non-arable land could not be broken by size. Non-arable areas included here are Permanent Grasslands (PG), Permanent Crops (PC) and Kitchen gardens (Kitchen). See Table S1 for arable area alone. Source: EUROSTAT.
14
Against this background, the compulsory greening measures of the CAP share the following weaknesses:
1. Most compulsory measures are uniform throughout the European Union. This sometimes imposes limitations on farmers in places where this may not be beneficial while exempting others in areas where the protection of biodiversity may be essential (64, 65). This is counterproductive not only due to a lack of consideration for geographic variability but also because the efficacy of biodiversity measures is highly context-specific, depending on climate, species pool, landscape configuration, and land-use intensity (64, 66, 67).
2. Measures are oversimplified also in terms of lumping together habitat types, or large land-use categories. This includes grouping together extensive, biodiversity-friendly practices with highly intensive ones.
3. The large number of exemptions made to the compulsory measures, especially on the basis of farm size, exempts most farmers in the EU or requires no change in management toward a more biodiversity-friendly direction.
4. An equivalence mechanism, either through ‘national certification schemes’ or AES, enables Member States to approve alternatives for the greening measures (see also Section D). Even if payments must be adjusted to avoid double-funding, Pillar 2 funds (AES) can be used to fund measures that should be compulsory ‘greening’ measures under Pillar 1.
5. A Farm Advisory System (FAS) was proposed in the previous CAP period and became mandatory in the new CAP, to “help farmers to assess the performance of their agricultural holding and to identify the necessary improvements as regards cross compliance and greening requirements for direct payments”, as well as potential improvements with respect to the Water Framework Directive (2000/60/EC), the Pesticide Directive (2009/128/EC) and Regulation (1107/2009), and some measures financed under Pillar 2, e.g., for farm modernization, innovation etc. (51). A Farm Advisory System can potentially support effective implementation of greening measures and protecting biodiversity, especially if financed under Pillar 2 and designated to support these targets. However, it is up to the MS to what extent the FAS will be implemented and what proportion of it will be allocated to environmental issues in general, and biodiversity in particular. A risk therefore remains that the Farm Advisory System can become a missed opportunity for improvements from a biodiversity perspective.
Beyond the compulsory measures, weaknesses of Pillar 2 identified during the previous funding period have been largely maintained in the new CAP (see above, section E). There are also no clear guidelines on how to maximise coherence between Pillar 1 and 2, especially given that small holdings are exempt from any compulsory greening measures. The absence of appropriate guidelines for prioritization and regulation may lead to low uptake of Pillar 2 payments, also in areas where AES may be both desirable and beneficial.
To summarize, funding and measures under the CAP have so far failed to halt the
decline in farmland biodiversity in the EU (2, 6, 68), with only limited ameliorations (3) in biodiversity-impoverished areas where flora and fauna have already severely declined or even disappeared. AES have shown only partial, limited or mixed success (33–35), partly due to a low uptake by farmers and a lack of spatial aggregation of efforts; some have even harmed species due to over-simplistic regulations (36). The new CAP seems to offer only limited improvements to this status quo, requiring very little change in farming practice
15
towards greening. It also sets thresholds for greening measures that are below levels of existing practices or habitat availability. In total, the new CAP therefore fails to meet the basic requirement of target 3A of the EU’s Biodiversity Strategy for 2020, namely to maximise the area allocated to biodiversity in EU’s farmland.
If adopted by Member States in its minimum form, the CAP will also not support targets of the 2011–2020 global Strategy Plan for Biodiversity (Aichi Targets; http://www.cbd.int/doc/strategic-plan/2011-2020/Aichi-Targets-EN.pdf), which include strategic targets on sustainable agricultural production and consumption (goal A). In particular, targets 3, 4, and 7 will not be met:
Target 3: “By 2020, at the latest, incentives, including subsidies, harmful to biodiversity are eliminated, phased out or reformed in order to minimize or avoid negative impacts, and positive incentives for the conservation and sustainable use of biodiversity are developed and applied”.
Target 4: “By 2020, at the latest, Governments, business and stakeholders at all levels have taken steps to achieve or have implemented plans for sustainable production and consumption and have kept the impacts of use of natural resources well within safe ecological limits. “
Target 7: “By 2020 areas under agriculture, aquaculture and forestry are managed sustainably, ensuring conservation of biodiversity.
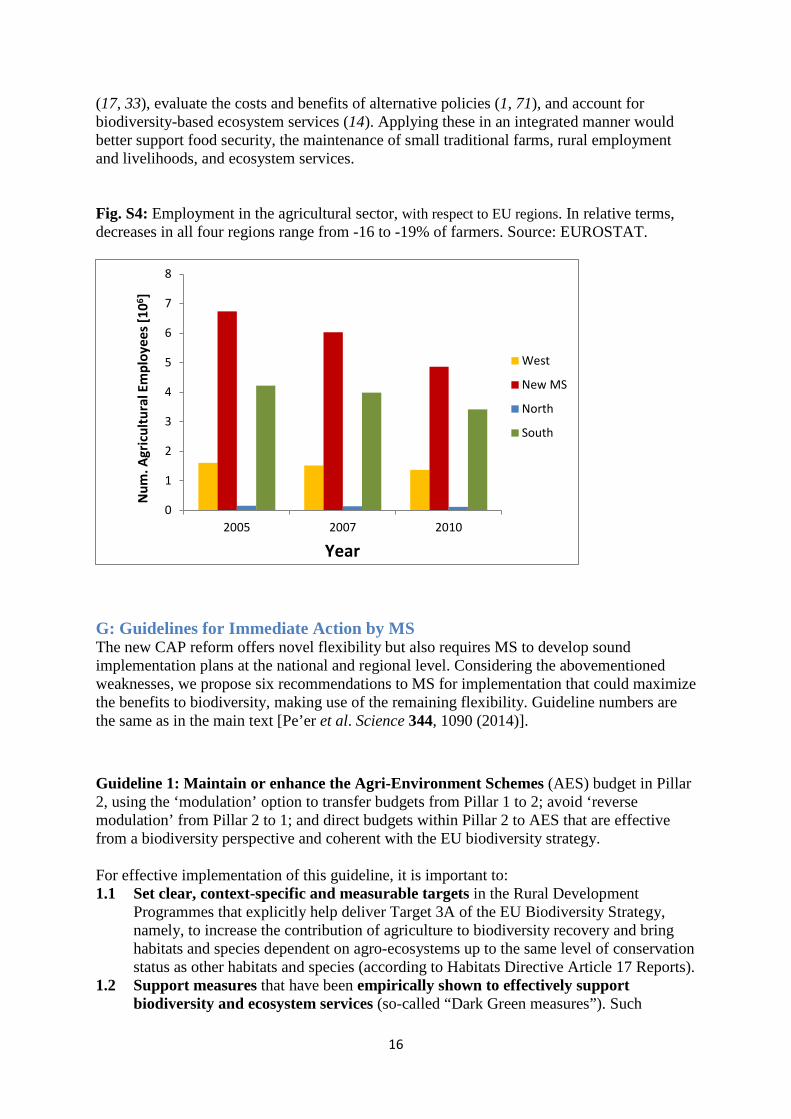
An Unnecessary Compromise The CAP reform reflects the outcomes of a complex political process across a diversity of nations, balancing a range of societal, economic and environmental values (10). Its negotiation was influenced by arguments stressing global uncertainty in providing sufficient, affordable food for a steadily growing European and global population. Clearly, there are short-term economic gains for farmers and the food industry by intensifying agricultural productivity. But these private benefits have to be weighed against the loss of public goods such as biodiversity, climate stability, landscape quality and ecosystem services, whose long-term provision is negatively affected by agricultural intensification. Also other environmental, health and societal costs are largely externalised from the farming economy. They include the degradation of ecosystem services within farmland (13, 14), erosion of culturally and recreationally important landscapes, and cascading effects on human health and climate regulation (13). Creating jobs in the farming sector, and ensuring the life quality of farmers, are legitimate societal and political interests, especially in light of the steady decline in agricultural employment (Fig. S4). But instead of reaching these goals by supporting agricultural intensification, these objectives could be achieved with more side-benefits by supporting labour employed on farms, or supporting existing extensive farm enterprises in rural, often economically weaker areas.
Finally, rather than by promoting food production (9, 69), food security should ideally be addressed through a package of measures including optimizing supply chains, reducing food-waste, stimulating changes in consumption behaviour (70), and applying targeted policies to maintain both the production capacity of the agricultural sector and the resilience of agro-ecosystems (15).
We therefore argue that CAP subsidies could be used much more effectively by
seeking measures that optimise both public and private goods, building on the evidence that benefits accrued from maintaining biodiversity, ecosystem functionality and resilience exceed the inclusive, long-term costs of losing them (15). A range of recently-developed decision-support tools and recommendations are available to maximize the cost-effectiveness of AES
16
(17, 33), evaluate the costs and benefits of alternative policies (1, 71), and account for biodiversity-based ecosystem services (14). Applying these in an integrated manner would better support food security, the maintenance of small traditional farms, rural employment and livelihoods, and ecosystem services.
Fig. S4: Employment in the agricultural sector, with respect to EU regions. In relative terms, decreases in all four regions range from -16 to -19% of farmers. Source: EUROSTAT.
G: Guidelines for Immediate Action by MS The new CAP reform offers novel flexibility but also requires MS to develop sound implementation plans at the national and regional level. Considering the abovementioned weaknesses, we propose six recommendations to MS for implementation that could maximize the benefits to biodiversity, making use of the remaining flexibility. Guideline numbers are the same as in the main text [Pe’er et al. Science 344, 1090 (2014)].
Guideline 1: Maintain or enhance the Agri-Environment Schemes (AES) budget in Pillar 2, using the ‘modulation’ option to transfer budgets from Pillar 1 to 2; avoid ‘reverse modulation’ from Pillar 2 to 1; and direct budgets within Pillar 2 to AES that are effective from a biodiversity perspective and coherent with the EU biodiversity strategy. For effective implementation of this guideline, it is important to: 1.1 Set clear, context-specific and measurable targets in the Rural Development
Programmes that explicitly help deliver Target 3A of the EU Biodiversity Strategy, namely, to increase the contribution of agriculture to biodiversity recovery and bring habitats and species dependent on agro-ecosystems up to the same level of conservation status as other habitats and species (according to Habitats Directive Article 17 Reports).
1.2 Support measures that have been empirically shown to effectively support biodiversity and ecosystem services (so-called “Dark Green measures”). Such
0
1
2
3
4
5
6
7
8
2005 2007 2010
West
New MS
North
South
Year
Num
. Agr
icul
tura
l Em
ploy
ees [
106 ]
17
measures have been well-characterized, especially for grassland management, but so far have received merely 0.2% of CAP expenditure (17).
1.3 Financing should particularly support conservation measures within Natura 2000 sites and aim at improving their quality and connectivity. It should also contribute to sustainable management of High Nature Value grasslands.
1.4 Measures should be as spatially targeted as possible, aiming to improve overall habitat quality and connectivity at the landscape level. They can thus contribute more effectively to developing a multi-functional Green Infrastructure across Europe (29). Appropriate targets should be set at the different spatial and governance levels, considering that drivers of biodiversity change are strongly space- and scale-sensitive (61): 1.4.1 At the EU level, support farms contributing to large-scale connectivity. 1.4.2 At the National level, one approach could be to focus on mosaic landscapes and regions with medium or high cover of semi-natural, sensitive habitats. 1.4.3 At the landscape level, seek to maintain spatial heterogeneity and/or landscape mosaics; maintain semi-natural habitats at a size that meets the minimum area requirements of relevant species (72); enhance connectivity between them; and target buffer areas next to or between existing protected areas or other sensitive areas, so as to reduce spill-over effects and maximise ecosystem service provision.
1.5 Explore the options for outcome-based payments that are contingent on achieving a certain ecological outcome or the persistence of certain species that are typical for relevant habitats.
Guideline 2: Use AES to allow specific target groups (e.g., small holdings in marginal areas, young farmers, co-operating farmer groups) to offer, and profit from, environmentally-friendly practices or jointly provide landscape-scale benefits. For effective implementation of this guideline, it is important to: 2.1 Ensure AES help economically vulnerable enterprises to operate extensive and
sustainable farmland management, especially in High Nature Value land, by fitting them to existing farming activities, and allowing flexibility in scheme commitments (73). This should help to reduce the adverse effects of intensification and abandonment.
2.2 Ensure that AES are attractive in terms of the overall benefits for farmers taking them up, e.g., by reducing transaction costs or fully covering implementation costs. This is particularly important for complex measures (74).
2.3 Provide additional incentives to groups of farmers to jointly provide landscape-scale benefits to biodiversity and ecosystem services, through improving habitat connectivity and diverse habitat mosaics at the landscape scale. Some guidance on how to do this effectively is provided by (75, 76).
Guideline 3: Ensure that eligible land uses for EFAs include, or even prioritize, elements that enhance benefits to biodiversity and ecosystem services [e.g., (11)] alongside other environmental objectives. Additionally, introduce or refine the management prescriptions for eligible land uses and crops, with particular focus on those that may otherwise not benefit biodiversity. This should be done this year, as MS must still define what types of land uses and crops qualify as EFA. For effective implementation of this guideline, it is important to:
18
3.1 Collaborate with experts to reconsider what elements can qualify as EFA in a given ecological context typical of each MS.
3.2 For land uses that contribute primarily to overall environment protection (air, water, soil) but not directly to biodiversity or ecosystem services, ensure the addition of specific management criteria to ensure comprehensive environmental benefits including biodiversity. This particularly concerns green cover, which offers no biodiversity benefits and is already part of the requirements for cross-compliance (77).
3.3 MS will need to decide this year whether to use equivalent practices and, if so, how to design them within the boundaries imposed by Annex 9 of the Direct Payment Regulation (78). We recommend either avoiding them in order to prevent further weakening of the compulsory greening measures, or using them only to seek additional benefits, especially with respect to strengthening Ecological Focus Areas.
Guideline 4: Complete the identification and mapping of grasslands, with clear differentiation into types, qualities, and required management to ensure effective protection and sustainable management of environmentally sensitive grasslands beyond protected sites.
For effective implementation of this guideline, it is important that MS: 4.1 Continue and complete the mapping of semi-natural grasslands at the regional
level, using a spatial resolution that is sufficient for assessing both extent and quality of relevant grasslands.
4.2 Provide management guidelines that are specific enough to maintain extensive management and prevent intensification of species rich, semi-natural grasslands, or their abandonment.
4.3 Extend the designation of “environmentally sensitive permanent grasslands” beyond Natura 2000 sites, to include habitats that are at risk from abandonment or widespread conversion to more intensive use, including habitats that are not necessarily listed in the Habitats Directive, such as the “Calthion grasslands” (wet grassland) in central and eastern Europe.
4.4 Introduce a High Nature Value (HNV) grassland or an “environmentally sensitive permanent grasslands” category into the Land Parcel Identification System (LPIS) (79). This category could be derived from maps of grassland habitats of High Nature Value (80).
4.5 Provide support for the integration of hay from species-rich grasslands into regular farming operations, including by agri-environment payments that cover the full cost of hay use (equipment, storage facilities and feeding operations), to halt the degradation of semi-natural grasslands.
Guideline 5: Allocate sufficient funding and efforts within the now-compulsory Farm Advisory System to increase the availability of ecological expertise to farmers, in order to improve the implementation of measures that maximize benefits for biodiversity. For effective implementation of this guideline, it is important to: 5.1 Strengthen the ecological expertise of the advisors within the Farm Advisory
System, notably via a systematic reliance on the best available evidence and knowledge, in order to implement the most profitable measures for biodiversity and ecosystem services. The European Agricultural Fund for Rural Development (EAFRD)
19
offers an excellent platform to do so, thereby bridging the well-recognized knowledge-implementation gap (81).
5.2 Make this knowledge and expertise easily available to relevant farmers in a way that is adapted to context-specific biodiversity and farming conditions, as done for instance in the Austria, the UK, and Switzerland.
Guideline 6: Institute comprehensive provisions for monitoring biodiversity outcomes as soon as possible, in order to enable evaluating the effectiveness of the agricultural policy against the targets set in the EU Biodiversity Strategy, and establish an important baseline for the future. For effective implementation of this guideline, it is important that MS support and fund cost-effective biodiversity monitoring schemes, in collaboration with expert voluntary nature conservation networks and relying upon state-of-the-art methodologies that fully support policy targets and needs, including for instance the obligations set by EU the Habitats and Bird Directives (82).
H: Recommendations for the Next Review of the CAP Some of the weaknesses of the new CAP may be buffered by the decisions made by individual MS, but many aspects call for a more substantial review at the nearest possible point. Currently, it is suggested that in 2017 the area allocated to EFAs should be re-discussed, with the potential to extend the requirements to 7% of farm area. We recommend the EU to extend these discussions into a mid-term review of the CAP. Such a review, as well as the next reform of the CAP, should consider the following elements:
Recommendation i: Publish an evidence-based assessment of the CAP’s impacts on farmland habitats, species, and ecosystem services, drawing on national-level monitoring as a base for improvement.
To that endeavor, the EU should constitute a panel of internationally recognized agro-ecologists and biodiversity experts that sets a realistic research agenda, defines the appropriate analytical methodology, identifies priorities and expected scientific outcomes, and delivers a synthesis of the available evidence in a format that is readily available to policy-makers. Note that this approach should identify and list best practices, as well as gaps in knowledge that would set the stage for further research, monitoring and action (see also Recommendation vi). This could be done in close cooperation with the Standing Committee on Agricultural Research (SCAR) and the European Innovation Partnership (EIP).
Recommendation ii: Strengthen AES further by increasing the EU-wide budget and directing it to more effective incentives, based on targets that are outcome—rather than area—based, and tied to promoting biodiversity at the farm and landscape scales (83). More specifically, we recommend to: ii.1 Increase the finances to enable attracting more farmers to take up voluntary measures
under Pillar 2 to support biodiversity and ecosystem services. ii.2 Shift toward outcome-based AES measures, making payments contingent on
achieving a certain ecological outcome or the persistence of certain species that are typical for relevant habitats. The objective should be to seek a measurable enhancement of conditions for biodiversity to the level defined in targets 1 and 3 of the EU Biodiversity strategy. It would be important to give full consideration, in addition to
20
species richness and population abundances, to habitat complementarity and integral ecosystem functionalities. This requests a focus on the protection of a sufficient area of the various species-specific habitat types (72) relevant to a region and on the availability of a heterogeneous habitat matrix at both farm and landscape scale (66, 84).
ii.3 Develop an EU overarching strategy to enhance AES uptake with clearly formulated quantitative targets as regards implementation per region and/or country, in line with the biodiversity recovery targets of the EU Biodiversity Strategy. The effectiveness of longer management contracts should be considered, as these could enhance AES uptake and support the continuity and stability of valuable habitats and appropriate management practices (73).
ii.4 Sustain or extend the effort for supporting extensive management in small farms, especially young farmers and/or those operating in difficult, marginal terrain. The idea is to combat both land abandonment and farming intensification aimed at maintaining economic viability despite adverse circumstances, two land-use changes that generate highly detrimental cascading effects upon farmland biodiversity.
ii.5 Continue promoting landscape scale delivery (see recommendation 2) ii.6 Ensure the use of control measures that do not inadvertently lead to biodiversity losses
due to deficiencies in coordination, transaction costs, or ineffective implementation of knowledge.
Recommendation iii: Improve the effectiveness of EFAs by reducing or excluding exemptions, refining management criteria for qualification, and expanding their total area, building on country-level evidence and experience (see recommendations 3 and 6 to MS).
More specifically, there is a need to: iii.1 Develop overarching, context-specific and cost-effective guidelines for local, regional
and national-scale decision-making about qualification and exemptions. Particular attention should be given to the broad exemption of permanent crops, nitrogen-fixing crops, green cover, organic farming and grasslands, which are unjustified from a biodiversity perspective unless tied to specific management criteria.
iii.2 Increase the total area of high quality EFAs to support the broad range of environmental objectives that this greening measure aims to fulfil, while complying with target 3A of the EU Biodiversity Strategy for 2020 that explicitly requires maximising the area allocated to biodiversity conservation within farmland.
Recommendation iv: Develop longer-term perspectives for more effective and comprehensive protection and restoration of grasslands and peatlands. This recommendation at the EU complements Guideline 4 to MS, and more specifically includes: iv.1 Protecting extent parcels of High Nature Value semi-natural grassland and its
characteristic species from loss in extent and quality due to excessive fertilisation, over-grazing, ploughing and re-seeding, and conversion into arable land.
iv.2 Support, potentially through long term contracts in the Rural Development Programmes, sustainable management of biodiversity-rich grasslands through hay making (instead of silo grass), extensive grazing, and/or an appropriate combination of both, depending on locally prevailing environmental and socio-economic conditions, to prevent both land-use abandonment and resulting vegetation succession, as well as grassland over-intensification.
iv.3 Support the continuation of existing, extensive grazing enterprises and the recreation of such enterprises and relevant local infrastructure to improve the viability
21
of extensive farming. Concomitantly, improve consideration of the socio-economic and environmental aspects of livestock farming, whose extent and management affect large proportions of EU’s grasslands.
iv.4 Allocate specific resources to restoration of former biodiversity-rich semi-natural grasslands where sustainable management has ceased, to bring them back into good condition. Thereafter, support their long-term sustainable management.
Recommendation v: Re-evaluate the usefulness of the crop diversity measure. This measure was originally proposed by some NGOs and agro-ecologists to focus on crop rotation as a key element which can promote soil conditions, and under certain conditions also farmland biodiversity. Evidence is lacking to determine whether, even in a revised form, this measure could yield substantial benefits to biodiversity. Potential options for improvement may be: v.1 Identify and promote the inclusion of crops that contribute positively for maintaining
biodiversity within this measure, and promote crop rotation, especially those including legumes (for effective contribution to soil quality), with clear management guidelines.
v.2 Provide targets also for very large farms (>100 ha), potentially building on land-sparing approaches, and very small farms (<10) based on land-sharing principles (85).
v.3 Consider spatial guidelines for compliance or exemptions based on the potential effectiveness of this measure within their landscape context.
v.4 Consider setting guidelines against current, real baselines within the farm level where possible.
Recommendation vi: Sustain the effort toward closing important knowledge gaps by practice-oriented research— including controlled experiments, monitoring and exploratory (adaptive) management—in close collaboration with scientists, farmers, and other citizens. Among other things, there is a need to: vi.1 Extend monitoring efforts among farmland, to cover a broader range of habitats and
taxonomic groups, with two main objectives: to assess the appropriateness/suitability of the CAP to promote both biodiversity and ecosystem services (63, 82); and to evaluate the cost-effectiveness of all measures.
vi.2 Continue mapping grasslands and peatlands, at the farm level, using in a standardized approach across the EU, and with appropriate differentiation into habitat types, qualities, and optimal management criteria.
vi.3 Carry out practice-oriented research on pragmatic solutions to optimize the outcomes of agri-environment measures for biodiversity and the delivery of ecosystem services, both from a purely ecological perspective and a cost-benefit perspective [see, e.g., (86, 87)], within the current CAP (see recommendation i) as well as into the next reform beyond 2020.
vi.4 Allow experimental management within the current schemes, testing for alternative management options at the farm and landscape levels, accepting a learning-by-doing where possible, to increase the cost-efficiency and efficacy of measures and contribute to capacity building.
22
To conclude, the EU should strive to design the CAP as a long-term policy that addresses both environmental and societal issues. Beyond food security, biodiversity and ecosystem resilience, higher emphasis should be put on ameliorating losses along the food chain production and supply, reducing food-waste, and eliciting changes in consumption behaviour and patterns (14). Thereby, the CAP can support a shift toward maintaining both the production capacity of the agricultural sector and the sustainability and resilience of agro-ecosystems into the future.
I: Details of Methodologies and Data Sources Underpinning Figure in the Policy Forum
Fertiliser Use [Figure in main text (middle-left)] Fertiliser use was downloaded from FAOSTAT for the years 2002 to 2011, as these years contained the best coverage of data. Data were separated into the following European regions: West: Austria, Denmark, Germany, Ireland, Luxemburg, Netherlands, United Kingdom; South: France, Greece, Italy, Portugal, Spain; North: Finland, Sweden; New Member States: Bulgaria, Cyprus, Czech Republic, Estonia, Hungary, Latvia, Lithuania, Malta, Poland, Romania, Slovakia, Slovenia.
For each country, we summarized fertilizer use in terms of phosphate and nitrogen (million tons). Presented results sum the total fertilizer use for all countries in a region.
Land Uses (Table S2) Land use data (agricultural area, permanent crops and meadows, and permanent grassland) were downloaded from FAOSTAT for the years 1993 to 2011, as these years contained the best coverage of data. Data were separated into the following European regions: West: Austria, Belgium, Denmark, Germany, Ireland, Luxemburg, Netherlands, United Kingdom; South: France, Greece, Italy, Portugal, Spain; North: Finland, Sweden; New Member States: Bulgaria, Cyprus, Czech Republic, Estonia, Hungary, Latvia, Lithuania, Malta, Poland, Romania, Slovakia, Slovenia. Total percentage coverage for agriculture land, permanent crops, and meadows for each of these regions was calculated (Table S2), and changes in total permanent grassland were calculated for these areas between 1993 and 2011.
Agricultural Indicators [figure in the text (leftmost and rightmost), Table S3 and Fig. S3] To measure the mean number of crops per agricultural holding, mean farm size, agricultural employees, and proportion of agricultural holdings (= farms) by size, we used the Eurostat database: http://epp.eurostat.ec.europa.eu/portal/page/portal/agriculture/data/database. Data were extracted for the following countries: West: Austria, Belgium, Denmark, Germany, Ireland, Luxembourg, Netherlands, United Kingdom; South: France, Greece, Italy, Portugal, Spain; North: Finland, Sweden; Centre and East: Bulgaria, Cyprus, Czech Republic, Estonia, Hungary, Latvia, Lithuania, Malta, Poland, Romania, Slovakia, Slovenia, and Croatia where possible and relevant.
Exemptions from EFA (Table S1) To estimate the number of holdings affected by the exemption of farms with <15 ha arable land from the EFA measure, we used Eurostat data for the EU 28 countries in 2010 from the following data set, entitled “Arable crops: number of farms and areas of different arable crops by agricultural size of farm (UAA) and size of arable area” (http://epp.eurostat.ec.europa.eu/portal/page/portal/product_details/dataset?p_product_code=EF_ALARABLEAA).
23
Using INDIC-EF and ARABLE variables, we extracted the total numbers of farm holdings (INDIC_EF = Total number of holdings) in size categories 0 (no arable land, e.g., farms with permanent pasture or grassland only), <1, 1 to 1.9, 2 to 4.9, 5 to 9.9 ha arable land. We summed up the small size categories (0 to 10 ha) together and divided it by the overall number of holdings. This estimation excludes farms with between 10 and 15 ha of arable land, because Eurostat only offers a size category of 10 to 20 ha. It also excludes further exemptions mentioned in section B. To estimate how much of the Utilized Agricultural Area (UAA) in Europe is exempt from the EFA measure, we extracted the total areas of arable land in farms with < 10 ha (0, <1, 1 to 1.9, 2 to 4.9, and 5 to 9.9 ha arable land) from the Eurostat “Arable crops” data set mentioned above, for 2010 and the EU28 countries (INDIC_EF = ha: Arable land). For the non-arable land, we used the Eurostat data set entitled “Land use: number of farms and areas of different crops by type of farming” (http://epp.eurostat.ec.europa.eu/portal/page/portal/product_details/dataset?p_product_code=ef_oluft).
Under the INDIC_EF variable, for 2010 and the EU28, we extracted the total areas in hectares of total Utilized Agricultural Area, and each of the following land use types: kitchen gardens (B2), permanent grasslands and meadows (B3) and permanent crops (B4). We added the sum of the major nonarable land use types to the total arable area in small size categories, and divided it by the total Utilized Agricultural Area, for each Member State, and for the EU28. This gives us the proportion of Utilized Agricultural Area that is exempt from EFAs, because it is either not arable land, or it is arable land in parcels smaller than <10 ha. These calculations do not include farms with areas of arable land between 10 and 15 ha in size, or the areas under the categories energy crops, short rotation coppice, mushroom cultivation and other land use categories (categories B5 and B6 in the INDIC_EF variable of the Eurostat Land Use data set).
Mean farm size [figure in the text (leftmost)] Data for the total Utilised Agricultural Area and the total number of agricultural holdings for each EU MS by size class, were extracted from Eurostat (as above) for 2005, 2007 and 2010. The data were categorized into North, South, Centre+East and West EU (as above), and mean farm size for each region was calculated by dividing the Utilised Agricultural Area by the number of holdings. These data were used to calculate farm sizes as presented in the text figure.
Exemptions from Crop Diversification Measure (Table S4) To estimate the number and proportion of arable holdings and arable area exempt from the crop diversification measure, we used Eurostat data for the EU 28 countries in 2010, from the data set entitled “Arable crops: number of farms and areas of different arable crops by agricultural size of farm (UAA) and size of arable area” (link provided above). The number of arable holdings exempt is the sum of the numbers of farm holdings (INDIC_EF = Total number of holdings) in size categories <1, 1 to 1.9, 2 to 4.9 and 5 to 9.9 ha under the ARABLE variable. This is presented as a proportion of the total number of arable holdings (the sum of all the size categories apart from 0 ha). The area of arable land exempt is the sum of areas of arable land in size categories <1, 1 to 1.9, 2 to 4.9 and 5 to 9.9 ha, under the ARABLE variable (INDIC_EF = ha: Arable land). This is presented as a proportion of the total area of arable land (ARABLE = TOTAL).
24
Crop Diversity [figure in the text (rightmost)] Data were extracted from the Eurostat data (as above) for 2007. The following crops were included in the analysis: ‘Common wheat and spelt’, ‘Durum wheat’, ‘Rye’, ‘Barley’, ‘Oats’, ‘Grain maize’, ‘Rice’, ‘Other cereals’, ‘Potatoes’, ‘Sugar beet’, ‘Fodder roots and brassicas’, ‘Tobacco’, ‘Hops’, ‘Cotton’, ‘Rape and turnip: Other oil-seed or fibre plants’, ‘Sunflower: Other oil-seed or fibre plants’, ‘Soya: Other oil-seed or fibre plants’, ‘Others: Other oil-seed or fibre plants’, ‘Aromatic-, medicinal and culinary plants’, ‘Industrial plants – Others’, ‘Outdoor: Fresh vegetables, melons, strawberries’, ‘Outdoor: Flowers and ornamental plants’, ‘Green maize: Other green fodder: Forage plants’, and ‘Other crops’.
Data for the number of holdings containing each crop were obtained along with the total number of arable holdings. The mean average number of crops per arable holding was calculated for North, Centre+East, South, and Western EU. Finally, the average number of crops per arable holding was calculated by the size of the holding and split into holdings <10 ha, 10 to 30 ha, and >30 ha.
We plotted the average crop diversity for each of the Member States as a point along the 3 types of holding sizes. On the same figure we plotted the values proposed by the “crop diversification” greening measure (horizontal lines). We note that this comparison is highly conservative, as the values obtained from the Eurostats database do not separate winter and summer crops as the greening measure does.
Agricultural Employment (Fig. S4) Data were derived from Eurostats for the years 2005, 2007, and 2010 as described above. This was combined with data on farm size from the same source to calculate the number of agricultural employees on agricultural holdings less than 10 ha in size.
Analyzing Farmland Bird Trends in Europe [figure in the text (right middle)] The Farmland bird indicators originate from the European Bird Census Council’s Pan-European Common Bird Monitoring Scheme (PECBMS; http://www.ebcc.info/pecbm.html). The scheme aims to deliver policy-relevant biodiversity indicators in Europe using information on bird population trends. It comprises twenty seven countries with land bird monitoring schemes for common and widespread bird species. Field methods and sampling strategies vary among schemes, but all involve standardized surveys of the breeding bird assemblage. National coordinators assess all-site totals per species across their national sample of count squares (from hundreds to thousands of sites) using a Poisson-regression based technique to impute missing values in count data (88), as implemented in the TRIM software [TRends and Indices for Monitoring data (89, 90)].
To produce supranational indices, we combined the national all-sites totals per species as assessed in the national monitoring schemes (5, 89). The national European monitoring schemes started in different years, leading to missing national all-sites totals. Again, we used TRIM to estimate the missing country totals, in the same way we imputed missing counts for particular sites. We combined the all-sites totals in five regional groupings (West: Ireland , United Kingdom, Netherlands, Denmark, Austria, Switzerland, former West Germany, Belgium, Luxembourg; North: Sweden, Finland, Norway; South: France, Spain, Portugal, Italy; New Member States: former East Germany, Estonia, Latvia, Poland, Czech Republic, Hungary, Slovakia). Any missing year totals were estimated from other countries in the same region on the assumption that those countries shared similar population changes and were subject to similar environmental pressures. In addition, the all-sites totals were weighted to allow for the fact that different countries hold different proportions of the European population. The yearly scheme totals were first converted into yearly national population
25
sizes, using the latest information on national population sizes from BirdLife International (91). These population sizes were assumed to reflect the situation in or around the year 2000. A weighting factor was calculated as the national population size divided by the average of the estimated yearly scheme total for 1999–2001. This weighting factor was applied to all other years of the scheme in order to obtain yearly national population sizes for each year. This means a change in a larger national population has greater impact on the overall trend than a change in a smaller population.
We used a slightly adapted version of TRIM tailored to combine all-sites totals per country and their standard errors instead of raw counts per site. Instead of deriving the standard errors in the usual statistical way from count data and model fit, we applied the standard errors (and the year-year covariances) that resulted from the calculation of the all-sites totals per country. Van Strien et al. (92) demonstrated that the procedure to combine country all-sites totals yields similar mean and standard errors of the index when aggregating country-data figures compared with using site-based figures.
At a European scale, wild bird indicators for particular species groups are calculated as the geometric mean of the supranational species’ indices and species are weighted equally (5, 89). We defined habitat specialists through consultation with bird experts across Europe against agreed criteria (http://www.ebcc.info/index.php?ID=301). Thirty nine species were classified as characteristic farmland bird species and included in the farmland bird indicators: Alauda arvensis, Alectoris rufa, Anthus campestris, Anthus pratensis, Bubulcus ibis, Burhinus oedicnemus, Calandrella brachydactyla, Carduelis cannabina, Ciconia ciconia, Corvus frugilegus, Emberiza cirlus, Emberiza citronella, Emberiza hortulana, Emberiza melanocephala, Falco tinnunculus, Galerida cristata, Galerida theklae, Hirundo rustica, Lanius collurio, Lanius minor, Lanius senator, Limosa limosa, Melanocorypha calandra, Miliaria calandra, Motacilla flava, Oenanthe hispanica, Passer montanus, Perdix perdix, Petronia petronia, Saxicola rubetra, Saxicola torquata, Serinus serinus, Streptopelia turtur, Sturnus unicolor, Sturnus vulgaris, Sylvia communis, Tetrax tetrax, Upupa epops, and Vanellus vanellus.
Supplementary Text: Affiliations Guy Pe’er,1,2,* Lynn V. Dicks,3 Piero Visconti,4,2 Raphaël Arlettaz,5,2 Adrás Báldi,6,2 Tim G. Benton,7 Sue Collins,8 Martin Dieterich,9,2 Richard D. Gregory,10 Florian Hartig,11 Klaus Henle,1 Peter R. Hobson,12 David Kleijn,13,14 Rosmarie K. Neumann,1 Trees Robijns,15 Jenny A. Schmidt,16 Assaf Shwartz,17,18 William J. Sutherland,3 Anne Turbé,19 Friedrich Wulf,20 Anna V. Scott21
*Corresponding author. E-mail: [email protected]
Author affiliations: 1UFZ—Helmholtz Centre for Environmental Research, Department of Conservation Biology, 04318 Leipzig, Germany. 2Society for Conservation Biology—Europe Section, 1017 O St. NW, 20001 Washington D.C., USA. 3University of Cambridge, Department of Zoology, CB2 3EJ Cambridge, UK. 4Microsoft Research—Computational Science Laboratory Cambridge, Cambridge CB12FB UK. 5University of Bern, Institute of Ecology and Evolution, Department of Conservation Biology, Bern, Switzerland. 6MTA Centre for Ecological Research, 2163 Vácrátót, Hungary. 7University of Leeds, School of Biology, Leeds LS29JT UK. 8Butterfly Conservation Europe, Wageningen, NL. 9University of Hohenheim, Institute for Landscape and Plant Ecology, 70599 Stuttgart, Germany. 10RSPB Centre for Conservation Science, The Lodge, Sandy, Bedfordshire SG19 2DL, UK. 11University of Freiburg, Department of Biometry and Environmental System Analysis, 79085 Freiburg, Germany. 12Eberswalde University for Sustainable Development, Centre for Econics and Ecosystem Management, 16225 Eberswalde, Germany. 13Wageningen University, Resource Ecology Group, 6708 PB Wageningen, The Netherlands. 14Alterra, Animal Ecology Team, 6700 AA, Wageningen, The Netherlands. 15Stichting BirdLife Europe, 1060 Brussels, Belgium. 16UFZ—Helmholtz Centre for
26
Environmental Research, Department of Environmental Politics, 04318 Leipzig, Germany. 17Technion Israel Institute of Technology, Faculty of Architecture and Town Planning, 32000 Haifa, Israel. 18University of Kent, Durrell Institute Conservation and Ecology, CT2 7NZ Canterbury, UK. 19BIO Intelligence Service, 9200 Neuilly-sur-Seine, France. 20Pro Natura—Friends of the Earth Switzerland, 4018 Basel, Switzerland. 21The University of Reading, School of Agriculture, policy and development, Centre for Agri-Environmental Research (CAER), RG6 6AR Reading, UK.
27
References 1. K. Henle, D. Alard, J. Clitherow, P. Cobb, L. Firbank, T. Kull, D. McCracken, R. F. A.
Moritz, J. Niemelä, M. Rebane, D. Wascher, A. Watt, J. Young, Identifying and managing the conflicts between agriculture and biodiversity conservation in Europe–A review. Agric. Ecosyst. Environ. 124, 60–71 (2008). doi:10.1016/j.agee.2007.09.005
2. European Environment Agency, EU 2010 Biodiversity Baseline (EEA Tech. Rep. No. 12/2010, Copenhagen, 2010).
3. L. G. Carvalheiro, W. E. Kunin, P. Keil, J. Aguirre-Gutiérrez, W. N. Ellis, R. Fox, Q. Groom, S. Hennekens, W. Van Landuyt, D. Maes, F. Van de Meutter, D. Michez, P. Rasmont, B. Ode, S. G. Potts, M. Reemer, S. P. Roberts, J. Schaminée, M. F. WallisDeVries, J. C. Biesmeijer, Species richness declines and biotic homogenisation have slowed down for NW-European pollinators and plants. Ecol. Lett. 16, 870–878 (2013). Medline doi:10.1111/ele.12121
4. T. G. Benton, J. A. Vickery, J. D. Wilson, Farmland biodiversity: Is habitat heterogeneity the key? Trends Ecol. Evol. 18, 182–188 (2003). doi:10.1016/S0169-5347(03)00011-9
5. R. D. Gregory, A. van Strien, Wild bird indicators: Using composite population trends of birds as measures of environmental health. Ornithol. Sci. 9, 3–22 (2010). doi:10.2326/osj.9.3
6. European Environment Agency, The European Grassland Butterfly Indicator: 1990–2011 (EEA Tech. Rep. No. 11/2013, EEA, Luxembourg, 2013).
7. Directorate-General for Internal Policies, Policy Department B, Note: European Council Conclusions on the Multiannual Financial Framework 2014-2020 and the CAP (European Parliament, Brussels, 2013).
8. European Commission, Our life insurance, our natural capital: an EU biodiversity strategy to 2020 (European Commission, Brussels, 2011).
9. European Commission, The CAP towards 2020: Meeting the food, natural resources and territorial challenges of the future (European Commission, Brussels, 2010).
10. C. Rutz, J. Dwyer, J. Schramek, Sociol. Rural. 10.1111/soru.12033 (2013), doi: 10.1111/soru.12033.
11. L. V. Dicks, I. Hodge, N. P. Randall, J. P. W. Scharlemann, G. M. Siriwardena, H. G. Smith, R. K. Smith, W. J. Sutherland, A transparent process for “evidence-informed” policy making. Conserv. Lett. 7, 119–125 (2014). doi:10.1111/conl.12046
12. R. F. Pywell, M. S. Heard, R. B. Bradbury, S. Hinsley, M. Nowakowski, K. J. Walker, J. M. Bullock, Wildlife-friendly farming benefits rare birds, bees and plants. Biol. Lett. 8, 772–775 (2012). Medline doi:10.1098/rsbl.2012.0367
13. Millennium Ecosystem Assessment, Ecosystems and Human Well-Being: Biodiversity Synthesis (World Resources Institute, Washington, DC, 2005).
14. R. Bommarco, D. Kleijn, S. G. Potts, Ecological intensification: Harnessing ecosystem services for food security. Trends Ecol. Evol. 28, 230–238 (2013). Medline doi:10.1016/j.tree.2012.10.012
15. TEEB, The Economics of Ecosystems and Biodiversity: Ecological and Economic Foundations (Earthscan, London, 2010).
28
16. J. Polakova, G. Tucker, K. Hart, J. Dwyer, M. Rayment, Addressing biodiversity and habitat preservation through measures applied under the Common Agricultural Policy, Report prepared for DG Agriculture and Rural Development (Institute for European Environmental Policy, London, 2011).
17. R. Oppermann et al., Common Agricultural Policy from 2014—Perspectives for more Biodiversity and Environmental Benefits of Farming? (IFAB, ZALF, HFR, and BfN, 2012).
18. European Commission, Directive 2009/147/EC of the European Parliament and of the Council of 30 November 2009 on the conservation of wild birds (European Commission, Brussels, 2009).
19. European Commission, Council Directive 92/43/EEC of 21 May 1992 on the conservation of natural habitats and of wild fauna and flora (European Commission, Brussels, 1992).
20. European Commission, EU Budget 2012 for 500 Million Europeans, For Growth and Employment (European Commission, Brussels, 2012).
21. European Commission, Sixth financial report from the Commission to the European Parliament and the Council on the European Agricultural Fund for Rural Development (EAFRD), 2012 financial year (European Commission, Brussels, 2013).
22. IEEP, GHK, TEPR, Background study towards biodiversity proofing of the EU budget: Report to the European Commission (Institute for European Environmental Policy, London, 2012).
23. European Commission, Nature & Biodiversity: LIFE Projects 2012 (European Commission, Brussels, 2012).
24. European Commission, Council Directive of 12 December 1991 concerning the protection of waters against pollution caused by nitrates from agricultural sources (91/676/EEC) (European Commission, Brussels, 1991).
25. European Commission, Directive 2000/60/EC of the European Parliament and of the Council of 23 October 2000 establishing a framework for community action in the field of water policy (European Commission, Brussels, 2000).
26. European Environmental Agency, EEA Signals 2004: A European Environmental Agency update on selected issues (EEA, Copenhagen, 2004)
27. European Commission, Report from the Commission to the Council and the European Parliament on implementation of Council Directive 91/676/EEC concerning the protection of waters against pollution caused by nitrates from agricultural sources based on Member State reports for the period 2008–2011 (European Commission, Brussels, 2013).
28. European Commission, Directive 2009/128/EC of the European Parliament and of the Council of 21 October 2009 establishing a framework for Community action to achieve the sustainable use of pesticides (European Commission, Brussels, 2009).
29. European Parliament, European Parliament resolution of 12 December 2013 on Green Infrastructure—Enhancing Europe’s Natural Capital (2013/2663(RSP)) (European Parliament, Brussels, 2013).
29
30. European Commission, Regulation (EU) No 1306/2013 of the European Parliament and of the Council of 17 December 2013 on the financing, management and monitoring of the common agricultural policy and repealing Council Regulations (EEC) No 352/78, (EC) No 165/94, (EC) No 2799/98, (EC) No 814/2000, (EC) No 1290/2005 and (EC) No 485/2008 (European Commission, Brussels, 2013).
31. European Commission, Composite report on the conservation status of habitat types and species as required under Article 17 of the Habitats Directive (European Commission, Brussels, 2009).
32. S. J. Butler, L. Boccaccio, R. D. Gregory, P. Vorisek, K. Norris, Quantifying the impact of land-use change to European farmland bird populations. Agric. Ecosyst. Environ. 137, 348–357 (2010). doi:10.1016/j.agee.2010.03.005
33. D. Kleijn, R. A. Baquero, Y. Clough, M. Díaz, J. De Esteban, F. Fernández, D. Gabriel, F. Herzog, A. Holzschuh, R. Jöhl, E. Knop, A. Kruess, E. J. Marshall, I. Steffan-Dewenter, T. Tscharntke, J. Verhulst, T. M. West, J. L. Yela, Mixed biodiversity benefits of agri-environment schemes in five European countries. Ecol. Lett. 9, 243–254 (2006). Medline doi:10.1111/j.1461-0248.2005.00869.x
34. D. Kleijn, F. Berendse, R. Smit, N. Gilissen, Agri-environment schemes do not effectively protect biodiversity in Dutch agricultural landscapes. Nature 413, 723–725 (2001). Medline doi:10.1038/35099540
35. D. J. Baker, S. N. Freeman, P. V. Grice, G. M. Siriwardena, Landscape-scale responses of birds to agri-environment management: A test of the English Environmental Stewardship scheme. J. Appl. Ecol. 49, 871–882 (2012). doi:10.1111/j.1365-2664.2012.02161.x
36. M. Konvicka, J. Benes, O. Cizek, F. Kopecek, O. Konvicka, L. Vitaz, How too much care kills species: Grassland reserves, agri-environmental schemes and extinction of Colias myrmidone (Lepidoptera: Pieridae) from its former stronghold. J. Insect Conserv. 12, 519–525 (2008). doi:10.1007/s10841-007-9092-7
37. S. Aviron et al., Evaluation der Ökomassnahmen: Bereich Biodiversität (Agroscope, 2005).
38. Bundesamt für Landwirtschaft, 2013 Agrarbericht (Federal Office for Agriculture (BLW), Bern, 2013).
39. L. Ribbe et al., Für eine ökologisierte Erste und eine effiziente Zweite Säule, Stellungnahme der KLU zur Reform der gemeinsamen Agrarpolitik (Umweltbundesamt, Germany, 2011).
40. P. H. Feindt, F. Begemann, B. Gerowitt, Wissenschaftlicher Beirat für Biodiversität und Genetische Ressourcen beim BMELV, Chancen für die biologische Vielfalt in der Landwirtschaft nutzen: 10 Schlüsselthemen für die Agrobiodiversität in der Agrarpolitik (Bundesanstalt für Landwirtschaft und Ernährung, Bonn, 2011).
41. F. Mikulcak, J. Newig, A. I. Milcu, T. Hartel, J. Fischer, Integrating rural development and biodiversity conservation in Central Romania. Environ. Conserv. 40, 129–137 (2013). doi:10.1017/S0376892912000392
42. J. Fischer, T. Hartel, T. Kuemmerle, Conservation policy in traditional farming landscapes. Conserv. Lett. 5, 167–175 (2012). doi:10.1111/j.1755-263X.2012.00227.x
30
43. T. Hartel, I. Dorresteijn, C. Klein, O. Máthé, C. I. Moga, K. Öllerer, M. Roellig, H. von Wehrden, J. Fischer, Wood-pastures in a traditional rural region of Eastern Europe: Characteristics, management and status. Biol. Conserv. 166, 267–275 (2013). doi:10.1016/j.biocon.2013.06.020
44. J. J. Gilroy, G. Q. A. Anderson, J. A. Vickery, P. V. Grice, W. J. Sutherland, Identifying mismatches between habitat selection and habitat quality in a ground-nesting farmland bird. Anim. Conserv. 14, 620–629 (2011). doi:10.1111/j.1469-1795.2011.00480.x
45. S. L. Tuck et al., J. Appl. Ecol. 10.1111/1365-2664.12219 (2014).
46. C. Winqvist, J. Bengtsson, T. Aavik, F. Berendse, L. W. Clement, S. Eggers, C. Fischer, A. Flohre, F. Geiger, J. Liira, T. Pärt, C. Thies, T. Tscharntke, W. W. Weisser, R. Bommarco, Mixed effects of organic farming and landscape complexity on farmland biodiversity and biological control potential across Europe. J. Appl. Ecol. 48, 570–579 (2011). doi:10.1111/j.1365-2664.2010.01950.x
47. D. Babai, Z. Molnar, Small-scale traditional management of highly species-rich grasslands in the Carpathians. Agric. Ecosyst. Environ. 182, 123–130 (2014). doi:10.1016/j.agee.2013.08.018
48. N. Halberg, Assessment of the environmental sustainability of organic farming: Definitions, indicators and the major challenges. Can. J. Plant Sci. 92, 981–996 (2012). doi:10.4141/cjps2012-035
49. G. Pe’er, C. van Maanen, A. Turbé, Y. G. Matsinos, S. Kark, Butterfly diversity at the ecotone between agricultural and semi-natural habitats across a climatic gradient. Divers. Distrib. 17, 1186–1197 (2011). doi:10.1111/j.1472-4642.2011.00795.x
50. D. G. Hole, A. J. Perkins, J. D. Wilson, I. H. Alexander, P. V. Grice, A. D. Evans, Does organic farming benefit biodiversity? Biol. Conserv. 122, 113–130 (2005). doi:10.1016/j.biocon.2004.07.018
51. European Commission, Regulation (EU) No 1307/2013 of the European Parliament and of the Council of 17 December 2013 establishing rules for direct payments to farmers under support schemes within the framework of the common agricultural policy and repealing Council Regulation (EC) No 637/2008 and Council Regulation (EC) No 73/2009 (European Commission, Brussels, 2013).
52. L. V. Dicks, A. Abrahams, J. Atkinson, J. Biesmeijer, N. Bourn, C. Brown, M. J. F. Brown, C. Carvell, C. Connolly, J. E. Cresswell, P. Croft, B. Darvill, P. De Zylva, P. Effingham, M. Fountain, A. Goggin, D. Harding, T. Harding, C. Hartfield, M. S. Heard, R. Heathcote, D. Heaver, J. Holland, M. Howe, B. Hughes, T. Huxley, W. E. Kunin, J. Little, C. Mason, J. Memmott, J. Osborne, T. Pankhurst, R. J. Paxton, M. J. O. Pocock, S. G. Potts, E. F. Power, N. E. Raine, E. Ranelagh, S. Roberts, R. Saunders, K. Smith, R. M. Smith, P. Sutton, L. A. N. Tilley, A. Tinsley, A. Tonhasca, A. J. Vanbergen, S. Webster, A. Wilson, W. J. Sutherland, Identifying key knowledge needs for evidence-based conservation of wild insect pollinators: A collaborative cross-sectoral exercise. Insect Conserv. Divers. 6, 435–446 (2013). doi:10.1111/j.1752-4598.2012.00221.x
53. C. Stoate, A. Báldi, P. Beja, N. D. Boatman, I. Herzon, A. van Doorn, G. R. de Snoo, L. Rakosy, C. Ramwell, Ecological impacts of early 21st century agricultural change in Europe—a review. J. Environ. Manage. 91, 22–46 (2009). Medline doi:10.1016/j.jenvman.2009.07.005
31
54. Food and Agriculture Organization of the United Nations, FAO statistical yearbook 2013 (FAO, 2013).
55. Society for Conservation Biology—Europe Section, Evidence on grassland mappings in Member States supports inclusion of high nature value grasslands into EU agricultural policies [Letter to EC Committee on Agriculture and Rural Development] (SCB-ES, Vácrátót, Hungary, 2013); http://euroconbio.blogspot.de/2013/05/evidence-on-grassland-mappings-to.html
56. M. Dieterich, N. Kannenwischer, Defizitanalyse Natura 2000: Situation von artenreichem Grünland im süddeutschen Raum (NABU-Bundesverband, Berlin, Germany, 2012).
57. T. Tscharntke, P. Batary, C. F. Dormann, Set-aside management: How do succession, sowing patterns and landscape context affect biodiversity? Agric. Ecosyst. Environ. 143, 37–44 (2011). doi:10.1016/j.agee.2010.11.025
58. J. Vickery, R. Arlettaz, in Birds and Habitat: Relationships in Changing Landscapes, R. J. Fuller, Ed. (Cambridge Univ. Press, Cambridge, 2012), pp. 177–204.
59. J. W. Dover, S. Spencer, S. Collins, I. Hadjigeorgiou, A. Rescia, Grassland butterflies and low intensity farming in Europe. J. Insect Conserv. 15, 129–137 (2011). doi:10.1007/s10841-010-9332-0
60. European Union, Regulation (EU) No 1305/2013 of the European Parliament and of the Council of 17 December 2013 on Support for Rural Development by the European Agricultural Fund for Rural Development (EAFRD) and Repealing Council Regulation (EC) No 1698/2005. Official J. Eur. Union 347 (2013).
61. J. Tzanopoulos, R. Mouttet, A. Letourneau, I. N. Vogiatzakis, S. G. Potts, K. Henle, R. Mathevet, P. Marty, Scale sensitivity of drivers of environmental change across Europe. Glob. Environ. Change 23, 167–178 (2013). doi:10.1016/j.gloenvcha.2012.09.002
62. O. Cizek, J. Zamecnik, R. Tropek, P. Kocarek, M. Konvicka, Diversification of mowing regime increases arthropods diversity in species-poor cultural hay meadows. J. Insect Conserv. 16, 215–226 (2012). doi:10.1007/s10841-011-9407-6
63. D. Kleijn, M. Rundlöf, J. Scheper, H. G. Smith, T. Tscharntke, Does conservation on farmland contribute to halting the biodiversity decline? Trends Ecol. Evol. 26, 474–481 (2011). Medline doi:10.1016/j.tree.2011.05.009
64. T. Tscharntke, J. M. Tylianakis, T. A. Rand, R. K. Didham, L. Fahrig, P. Batáry, J. Bengtsson, Y. Clough, T. O. Crist, C. F. Dormann, R. M. Ewers, J. Fründ, R. D. Holt, A. Holzschuh, A. M. Klein, D. Kleijn, C. Kremen, D. A. Landis, W. Laurance, D. Lindenmayer, C. Scherber, N. Sodhi, I. Steffan-Dewenter, C. Thies, W. H. van der Putten, C. Westphal, Landscape moderation of biodiversity patterns and processes—eight hypotheses. Biol. Rev. Camb. Philos. Soc. 87, 661–685 (2012). Medline doi:10.1111/j.1469-185X.2011.00216.x
65. P. Batary, B. Andras, D. Kleijn, T. Tscharntke, Proc. R. Soc. Ser. B Biol. Sci. 278, 1894 (2011).
66. T. Merckx, R. E. Feber, P. Riordan, M. C. Townsend, N. A. D. Bourn, M. S. Parsons, D. W. Macdonald, Optimizing the biodiversity gain from agri-environment schemes. Agric. Ecosyst. Environ. 130, 177–182 (2009). doi:10.1016/j.agee.2009.01.006
32
67. T. Tscharntke, A. M. Klein, A. Kruess, I. Steffan-Dewenter, C. Thies, Landscape perspectives on agricultural intensification and biodiversity – ecosystem service management. Ecol. Lett. 8, 857–874 (2005). doi:10.1111/j.1461-0248.2005.00782.x
68. British trust for Ornithology, Bird Indicators: Indicator update—October 2013 (BTO, Thetford, UK, 2013).
69. European Commission, Proposal for a regulation of the European Parlament and of the Council amending Council Regulation (EC) No 1234/2007 as regards the regime of the single payment scheme and support to vine-growers (European Commission, Brussels, 2011).
70. H. C. J. Godfray, J. R. Beddington, I. R. Crute, L. Haddad, D. Lawrence, J. F. Muir, J. Pretty, S. Robinson, S. M. Thomas, C. Toulmin, Food security: The challenge of feeding 9 billion people. Science 327, 812–818 (2010). Medline doi:10.1126/science.1185383
71. IEEP, Alterra, Ecologic, PBL, UNEP-WCMC, Scenarios and models for exploring future trends of biodiversity and ecosystem services changes. Final report to the European Commission, DG Environment on Contract ENV.G.1/ETU/2008/0090r (Institute for European Environmental Policy, Alterra Wageningen UR, Ecologic, Netherlands Environmental Assessment Agency, United Nations Environment Programme World Conservation Monitoring Centre, 2009).
72. G. Pe'er, M. A. Tsianou, K. W. Franz, Y. G. Matsinos, A. D. Mazaris, D. Storch, L. Kopsova, J. Verboom, M. Baguette, V. M. Stevens, K. Henle, Toward better application of minimum area requirements in conservation planning. Biol. Conserv. 170, 92–102 (2014). doi:10.1016/j.biocon.2013.12.011
73. L. A. Sutherland, Environmental grants and regulations in strategic farm business decision-making: A case study of attitudinal behaviour in Scotland. Land Use Policy 27, 415–423 (2010). doi:10.1016/j.landusepol.2009.06.003
74. A. Van Herzele, A. Gobin, P. Van Gossum, L. Acosta, T. Waas, N. Dendoncker, B. Henry de Frahan, Effort for money? Farmers’ rationale for participation in agri-environment measures with different implementation complexity. J. Environ. Manage. 131, 110–120 (2013). Medline doi:10.1016/j.jenvman.2013.09.030
75. S. B. Emery, J. R. Franks, The potential for collaborative agri-environment schemes in England: Can a well-designed collaborative approach address farmers’ concerns with current schemes? J. Rural Stud. 28, 218–231 (2012). doi:10.1016/j.jrurstud.2012.02.004
76. L. A. Sutherland, D. Gabriel, L. Hathaway-Jenkins, U. Pascual, U. Schmutz, D. Rigby, R. Godwin, S. M. Sait, R. Sakrabani, W. E. Kunin, T. G. Benton, S. Stagl, The ‘Neighbourhood Effect’: A multidisciplinary assessment of the case for farmer co-ordination in agri-environmental programmes. Land Use Policy 29, 502–512 (2012). doi:10.1016/j.landusepol.2011.09.003
77. Bundesamt für Naturschutz, Ökologische Vorrangflächen—unverzichtbar für die biologische Vielfalt in der Agrarlandschaft! (UBA, BfN, Bonn/Dessau, 2014).
78. European Union, Council Regulation (EC) No 73/2009 of 19 January 2009 establishing common rules for direct support schemes for farmers under the common agricultural policy and establishing certain support schemes for farmers, amending Regulations (EC) No 1290/2005, (EC) No 247/2006, (EC) No 378/2007 and repealing Regulation (EC) No 1782/2003. Off. J. Eur. Union L 30, (2009).
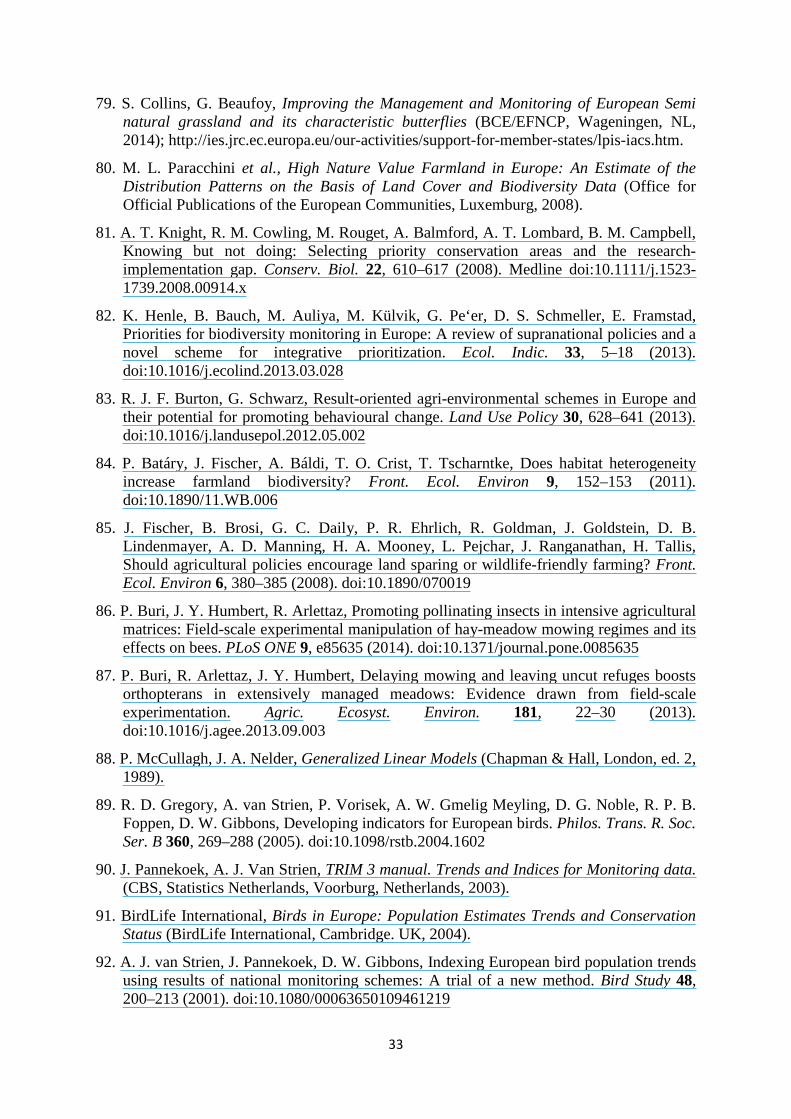
33
79. S. Collins, G. Beaufoy, Improving the Management and Monitoring of European Semi natural grassland and its characteristic butterflies (BCE/EFNCP, Wageningen, NL, 2014); http://ies.jrc.ec.europa.eu/our-activities/support-for-member-states/lpis-iacs.htm.
80. M. L. Paracchini et al., High Nature Value Farmland in Europe: An Estimate of the Distribution Patterns on the Basis of Land Cover and Biodiversity Data (Office for Official Publications of the European Communities, Luxemburg, 2008).
81. A. T. Knight, R. M. Cowling, M. Rouget, A. Balmford, A. T. Lombard, B. M. Campbell, Knowing but not doing: Selecting priority conservation areas and the research-implementation gap. Conserv. Biol. 22, 610–617 (2008). Medline doi:10.1111/j.1523-1739.2008.00914.x
82. K. Henle, B. Bauch, M. Auliya, M. Külvik, G. Pe‘er, D. S. Schmeller, E. Framstad, Priorities for biodiversity monitoring in Europe: A review of supranational policies and a novel scheme for integrative prioritization. Ecol. Indic. 33, 5–18 (2013). doi:10.1016/j.ecolind.2013.03.028
83. R. J. F. Burton, G. Schwarz, Result-oriented agri-environmental schemes in Europe and their potential for promoting behavioural change. Land Use Policy 30, 628–641 (2013). doi:10.1016/j.landusepol.2012.05.002
84. P. Batáry, J. Fischer, A. Báldi, T. O. Crist, T. Tscharntke, Does habitat heterogeneity increase farmland biodiversity? Front. Ecol. Environ 9, 152–153 (2011). doi:10.1890/11.WB.006
85. J. Fischer, B. Brosi, G. C. Daily, P. R. Ehrlich, R. Goldman, J. Goldstein, D. B. Lindenmayer, A. D. Manning, H. A. Mooney, L. Pejchar, J. Ranganathan, H. Tallis, Should agricultural policies encourage land sparing or wildlife-friendly farming? Front. Ecol. Environ 6, 380–385 (2008). doi:10.1890/070019
86. P. Buri, J. Y. Humbert, R. Arlettaz, Promoting pollinating insects in intensive agricultural matrices: Field-scale experimental manipulation of hay-meadow mowing regimes and its effects on bees. PLoS ONE 9, e85635 (2014). doi:10.1371/journal.pone.0085635
87. P. Buri, R. Arlettaz, J. Y. Humbert, Delaying mowing and leaving uncut refuges boosts orthopterans in extensively managed meadows: Evidence drawn from field-scale experimentation. Agric. Ecosyst. Environ. 181, 22–30 (2013). doi:10.1016/j.agee.2013.09.003
88. P. McCullagh, J. A. Nelder, Generalized Linear Models (Chapman & Hall, London, ed. 2, 1989).
89. R. D. Gregory, A. van Strien, P. Vorisek, A. W. Gmelig Meyling, D. G. Noble, R. P. B. Foppen, D. W. Gibbons, Developing indicators for European birds. Philos. Trans. R. Soc. Ser. B 360, 269–288 (2005). doi:10.1098/rstb.2004.1602
90. J. Pannekoek, A. J. Van Strien, TRIM 3 manual. Trends and Indices for Monitoring data. (CBS, Statistics Netherlands, Voorburg, Netherlands, 2003).
91. BirdLife International, Birds in Europe: Population Estimates Trends and Conservation Status (BirdLife International, Cambridge. UK, 2004).
92. A. J. van Strien, J. Pannekoek, D. W. Gibbons, Indexing European bird population trends using results of national monitoring schemes: A trial of a new method. Bird Study 48, 200–213 (2001). doi:10.1080/00063650109461219


