Embed Size (px)
Citation preview
Ei
JMa
b
c
d
a
ARRAA
KIEFFWL
1
mrwaapdb
ar
M
0d
Sensors and Actuators B 136 (2009) 546–554
Contents lists available at ScienceDirect
Sensors and Actuators B: Chemical
journa l homepage: www.e lsev ier .com/ locate /snb
thylene optical spectrometer for apple ripening monitoringn controlled atmosphere store-houses
. Fonollosaa,d,∗, B. Halfordb, L. Fonsecac, J. Santanderc, S. Udinaa,d,. Morenoa, J. Hildenbrandb, J. Wöllensteinb, S. Marcoa,d
Departament d’Electrònica, Universitat de Barcelona, Martí i Franquès 1, 08028 Barcelona, SpainFraunhofer Institute for Physical Measurement Techniques, Heidenhofstr. 8, 79110 Freiburg, GermanyCentre Nacional de Microelectrònica, Campus UAB, 08193 Bellaterra, SpainArtificial Olfaction Lab, Institute of Bioengineering of Catalonia, Baldiri i Rexach 13, 08028 Barcelona, Spain
r t i c l e i n f o
rticle history:eceived 8 August 2008eceived in revised form 17 November 2008ccepted 8 December 2008vailable online 14 December 2008
eywords:R spectrometerthyleneruit storageresnel lens
a b s t r a c t
In today’s store-houses the ripening of fruit is controlled by managing the ethylene concentration inthe ambient atmosphere. Precise and continuous ethylene monitoring is very advantageous since lowethylene concentrations are produced by the fruit itself and are indicative of its ripeness, and on otheroccasions, ethylene is externally added when ripeness or degreening of the product must be promoted. Inthis work, a multichannel mid-infrared spectrometer for ethylene measurement is built and characterized.The instrument contains additional channels to reject potential cross-interferences like ammonia andethanol. Additionally, these channels are useful for monitoring a potential malfunction of the coolingsystem and possible fouling of the fruit, respectively. The complete spectrometer contains a silicon-basedmacroporous infrared (IR) emitter, a miniaturized long path cell (white cell), a four-channel detectormodule, low-noise analog amplification and filtering, and a microcontroller-based lock-in amplifier. The
hite cellock-in amplifier
new inner architecture of the detector module features a fourfold thermopile array with narrow bandoptical filters attached by flip-chip technology, and a Fresnel lens array attached on the lid of the package.Laboratory tests show that the system is able to distinguish between ammonia and ethylene, featuringa detection limit of 30 ppm and 160 ppm (95% confidence) for ethylene and ammonia, respectively. Fieldtests show that the spectrometer is suitable as an ethylene alarm to detect fruit ripening and prevent fruitto decline into senescence. Simulation results show that system selectivity could be improved by setting
ther a
ammonia channel to ano. Introduction
At home most varieties of apple can be stored for approxi-ately a couple of weeks. However, large-scale production of apples
equires huge crop and fruit storing for several months, in such aay that the final fruit is in good organoleptic quality. With that
im, fruit is harvested before it is ripe enough to be consumednd is stored in controlled atmosphere chambers to delay ripeningrocess. Harvesting mature unripe fruit increases shelf life, slowsown degradation in firmness and acidity, and green ground-color
ecomes slower than in ripe fruit.Nowadays apples can be stored in different conditions: cold stor-ge (CS) which is the usual procedure during transport and at theetailer vending, low oxygen (LO), and ultra low oxygen (ULO) which
∗ Corresponding autor at: Departament d’Electrònica, Universitat de Barcelona,artí i Franquès 1, 08028 Barcelona, Spain.
E-mail address: [email protected] (J. Fonollosa).
925-4005/$ – see front matter © 2008 Elsevier B.V. All rights reserved.oi:10.1016/j.snb.2008.12.015
bsorption wavelength.© 2008 Elsevier B.V. All rights reserved.
are the techniques applied for long duration fruit storage. Table 1shows typical oxygen and carbon dioxide concentrations, relativehumidity, and temperature for CS, LO, and ULO conditions. ULO stor-age rooms slow down ethylene synthesis and respiration processextending the storage period of 7–9 months [1], and have benefi-cial effects on fruit firmness, titratable acidity and color [2,3]. Onthe other hand, the use of unripe fruit and such storage conditionsworsen apple’s flavor since the production of volatile compoundsresponsible for the aroma is reduced [4,5] and fruit taste is stronglyimpaired [6].
Ethylene plays a twofold role in fruit development: it can bethought as an indicator that fruit is ripening (low ethylene concen-trations are produced by the fruit itself), and also as a hormonethat triggers the ripening process of fruit [7,8]. In some occasions
ethylene is externally added when ripeness or degreening of theproduct must be promoted. In store-houses, ethylene concentrationis below 1 ppm while fruit is unripe. Then, as fruit ripening begins,the production of ethylene increases dramatically and its concen-tration continuously rises to values higher than 100 ppm. Fruit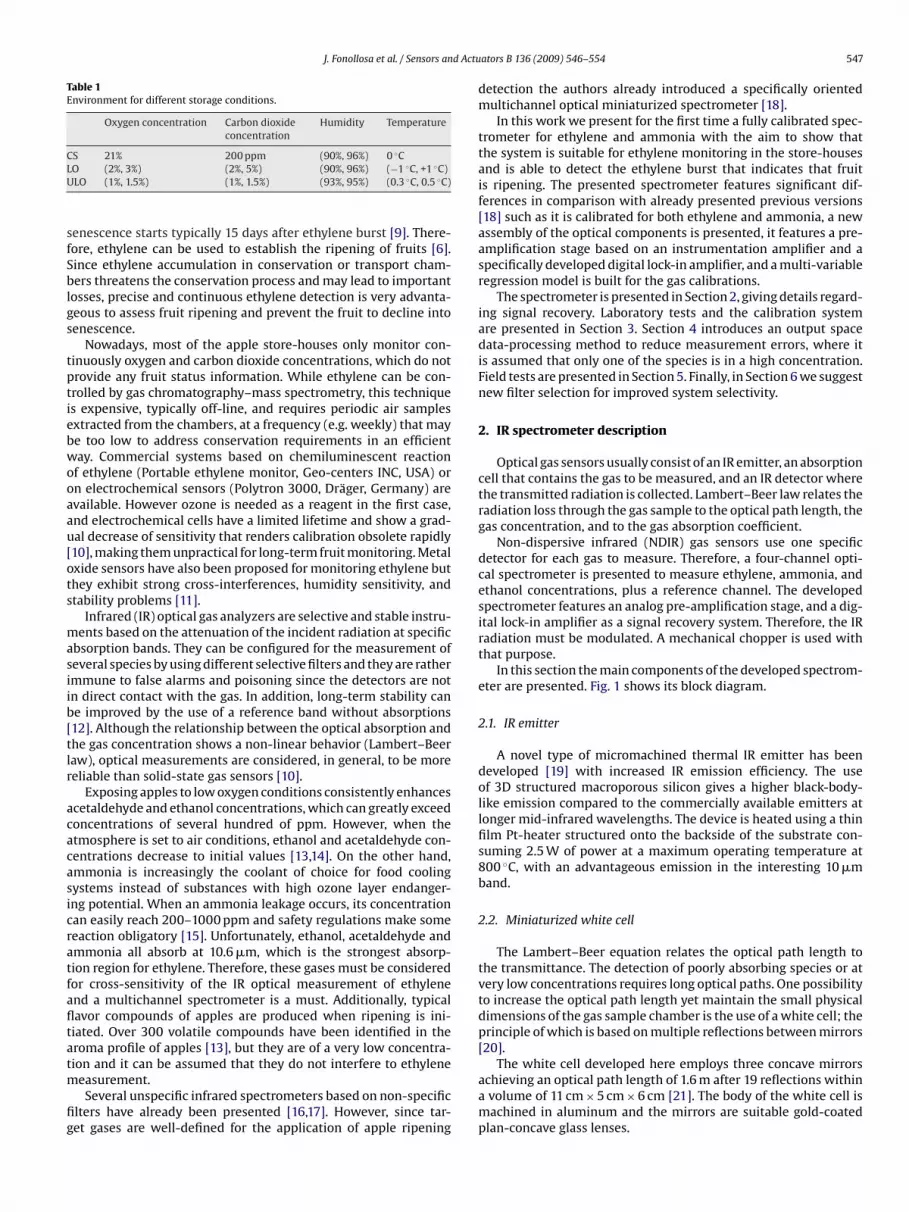
J. Fonollosa et al. / Sensors and Actu
Table 1Environment for different storage conditions.
Oxygen concentration Carbon dioxideconcentration
Humidity Temperature
CLU
sfSblgs
tptiebwooaau[ots
masiib[tlr
acacasicratfafltatm
fig
[20].The white cell developed here employs three concave mirrors
S 21% 200 ppm (90%, 96%) 0 ◦CO (2%, 3%) (2%, 5%) (90%, 96%) (−1 ◦C, +1 ◦C)LO (1%, 1.5%) (1%, 1.5%) (93%, 95%) (0.3 ◦C, 0.5 ◦C)
enescence starts typically 15 days after ethylene burst [9]. There-ore, ethylene can be used to establish the ripening of fruits [6].ince ethylene accumulation in conservation or transport cham-ers threatens the conservation process and may lead to important
osses, precise and continuous ethylene detection is very advanta-eous to assess fruit ripening and prevent the fruit to decline intoenescence.
Nowadays, most of the apple store-houses only monitor con-inuously oxygen and carbon dioxide concentrations, which do notrovide any fruit status information. While ethylene can be con-rolled by gas chromatography–mass spectrometry, this techniques expensive, typically off-line, and requires periodic air samplesxtracted from the chambers, at a frequency (e.g. weekly) that maye too low to address conservation requirements in an efficientay. Commercial systems based on chemiluminescent reactionf ethylene (Portable ethylene monitor, Geo-centers INC, USA) orn electrochemical sensors (Polytron 3000, Dräger, Germany) arevailable. However ozone is needed as a reagent in the first case,nd electrochemical cells have a limited lifetime and show a grad-al decrease of sensitivity that renders calibration obsolete rapidly10], making them unpractical for long-term fruit monitoring. Metalxide sensors have also been proposed for monitoring ethylene buthey exhibit strong cross-interferences, humidity sensitivity, andtability problems [11].
Infrared (IR) optical gas analyzers are selective and stable instru-ents based on the attenuation of the incident radiation at specific
bsorption bands. They can be configured for the measurement ofeveral species by using different selective filters and they are rathermmune to false alarms and poisoning since the detectors are notn direct contact with the gas. In addition, long-term stability cane improved by the use of a reference band without absorptions12]. Although the relationship between the optical absorption andhe gas concentration shows a non-linear behavior (Lambert–Beeraw), optical measurements are considered, in general, to be moreeliable than solid-state gas sensors [10].
Exposing apples to low oxygen conditions consistently enhancescetaldehyde and ethanol concentrations, which can greatly exceedoncentrations of several hundred of ppm. However, when thetmosphere is set to air conditions, ethanol and acetaldehyde con-entrations decrease to initial values [13,14]. On the other hand,mmonia is increasingly the coolant of choice for food coolingystems instead of substances with high ozone layer endanger-ng potential. When an ammonia leakage occurs, its concentrationan easily reach 200–1000 ppm and safety regulations make someeaction obligatory [15]. Unfortunately, ethanol, acetaldehyde andmmonia all absorb at 10.6 �m, which is the strongest absorp-ion region for ethylene. Therefore, these gases must be consideredor cross-sensitivity of the IR optical measurement of ethylenend a multichannel spectrometer is a must. Additionally, typicalavor compounds of apples are produced when ripening is ini-iated. Over 300 volatile compounds have been identified in theroma profile of apples [13], but they are of a very low concentra-ion and it can be assumed that they do not interfere to ethylene
easurement.Several unspecific infrared spectrometers based on non-specific
lters have already been presented [16,17]. However, since tar-et gases are well-defined for the application of apple ripening
ators B 136 (2009) 546–554 547
detection the authors already introduced a specifically orientedmultichannel optical miniaturized spectrometer [18].
In this work we present for the first time a fully calibrated spec-trometer for ethylene and ammonia with the aim to show thatthe system is suitable for ethylene monitoring in the store-housesand is able to detect the ethylene burst that indicates that fruitis ripening. The presented spectrometer features significant dif-ferences in comparison with already presented previous versions[18] such as it is calibrated for both ethylene and ammonia, a newassembly of the optical components is presented, it features a pre-amplification stage based on an instrumentation amplifier and aspecifically developed digital lock-in amplifier, and a multi-variableregression model is built for the gas calibrations.
The spectrometer is presented in Section 2, giving details regard-ing signal recovery. Laboratory tests and the calibration systemare presented in Section 3. Section 4 introduces an output spacedata-processing method to reduce measurement errors, where itis assumed that only one of the species is in a high concentration.Field tests are presented in Section 5. Finally, in Section 6 we suggestnew filter selection for improved system selectivity.
2. IR spectrometer description
Optical gas sensors usually consist of an IR emitter, an absorptioncell that contains the gas to be measured, and an IR detector wherethe transmitted radiation is collected. Lambert–Beer law relates theradiation loss through the gas sample to the optical path length, thegas concentration, and to the gas absorption coefficient.
Non-dispersive infrared (NDIR) gas sensors use one specificdetector for each gas to measure. Therefore, a four-channel opti-cal spectrometer is presented to measure ethylene, ammonia, andethanol concentrations, plus a reference channel. The developedspectrometer features an analog pre-amplification stage, and a dig-ital lock-in amplifier as a signal recovery system. Therefore, the IRradiation must be modulated. A mechanical chopper is used withthat purpose.
In this section the main components of the developed spectrom-eter are presented. Fig. 1 shows its block diagram.
2.1. IR emitter
A novel type of micromachined thermal IR emitter has beendeveloped [19] with increased IR emission efficiency. The useof 3D structured macroporous silicon gives a higher black-body-like emission compared to the commercially available emitters atlonger mid-infrared wavelengths. The device is heated using a thinfilm Pt-heater structured onto the backside of the substrate con-suming 2.5 W of power at a maximum operating temperature at800 ◦C, with an advantageous emission in the interesting 10 �mband.
2.2. Miniaturized white cell
The Lambert–Beer equation relates the optical path length tothe transmittance. The detection of poorly absorbing species or atvery low concentrations requires long optical paths. One possibilityto increase the optical path length yet maintain the small physicaldimensions of the gas sample chamber is the use of a white cell; theprinciple of which is based on multiple reflections between mirrors
achieving an optical path length of 1.6 m after 19 reflections withina volume of 11 cm × 5 cm × 6 cm [21]. The body of the white cell ismachined in aluminum and the mirrors are suitable gold-coatedplan-concave glass lenses.
548 J. Fonollosa et al. / Sensors and Actuators B 136 (2009) 546–554
Cell, IR
2
tsctstt
belmrogmcEmr
aLdtpwCb
pttDaaooi
tcstis
Fig. 1. Optical system, with miniaturized white
.3. Detector module
A novel highly integrated compact detection module comprisinghermopiles, optical filters, and focusing elements is used to mea-ure the remaining radiation after gas absorption [22]. IR detectorsonsist of a substrate chip with a 2 × 2 array of thermopile-elementshat is attached to the base of a TO-8 package. For wavelengthelection the appropriate optical filters are flip-chipped onto thehermopile-elements. A multi-Fresnel lens array is assembled inhe lid of the package to optimize the device detectivity.
Micromachined thermopiles based on CMOS processing andulk micromachining are chosen as infrared detectors since theyxhibit good performance in terms of reproducibility, accuracy,ow cost, sensitivity and rapid response [23]. Additionally, ther-
opiles do not need power to be operated, offer a wide spectralesponse, can be fabricated in silicon technology, and an arrayf them can be easily integrated with a low foot-print in a sin-le chip [18]. Substrate chips (6.1 mm × 6.1 mm size) with fouricromachined thermopiles in a 2 × 2 arrays, featuring a size
ompatible with a TO-8 package, have been fabricated [24].ach thermopile features 32 thermocouples and absorber andembrane sizes are 350 �m × 350 �m and 1300 �m × 1300 �m,
espectively.Optical filters, which provide the selectivity of each channel,
re commercial narrow bandpass filters (supplied by Filtrop AG,iechtenstein; and by LOT-Oriel, Germany) properly diced and con-itioned to be attached to the thermopile substrate by flip-chipechniques [23]. Filter selection was made considering the mostrominent absorption bands for the target gases: 3.4 �m centralavelength (CWL) and 4% bandwidth (BW) for ethanol; 9.7 �mWL and 4% BW for ammonia, 3.9 �m CWL and 2% for referenceand, and 10.6 �m CWL and 4% for ethylene.
The purpose of the lens array is to collect as much radiation asossible from the absorption cell and to divide the total IR radia-ion transmitted into four parts and focus each one of them intohe corresponding absorber element of the four thermopile array.iffractive Fresnel lenses are chosen as focusing element since theyre compatible with the planar nature of silicon microtechnologynd silicon is transparent in the IR range of interest. The advantagesf diffractive lenses are less absorption, and the typical advantagesf silicon technology such as reliability, mass production, and costssues [22,25].
A Fresnel lens consists of a series of concentric rings with a givenapered shape, whose width decreases with the distance to the
entre. Each ring is ideally shaped in such a way that produces a con-tructive interference at the lens focal point. However, planar siliconechnology leads Fresnel lenses design to follow a staircase approx-mation of the original curved profile. Lens efficiency calculationshow that an approach based on the use of four photolithographicemitter, detector module, and optical chopper.
masks to design a four lens array in a single chip is a cost effectivealternative and assures optical transmission efficiencies over 85% inthe worst case. To prevent reflection losses at the lens surfaces, zincsulphide antireflection �/4 layers were deposited. A specific four6.7 mm focal length lens array for the required system applicationwas fabricated [22].
2.4. Signal recovery system
Lock-in amplifiers are widely used as signal recovery systemssince they are characterized by a wide dynamic range which givesthe ability to measure signals accompanied by relatively high levelsof noise and interference. A lock-in amplifier behaves like a band-pass filter centred on a reference frequency. Signal modulation (atreference frequency) is convenient to shift the signal to a lowernoise band. In practice, the modulation frequency is usually madeas high as possible to facilitate separation of the chopped outputvoltage from noise components [26].
The signal recovery system is composed of an analog pre-amplification stage with pre-filters and a digital lock-in amplifierbased on a MSP430F4270 microcontroller (Texas Instruments, USA).The aim of the pre-amplification stage is to expand the low ther-mopile voltage range to the 0–0.6 V programmed analog-digitalconverter input range. Instrumentation amplifier configuration isparticularly advantageous if the amplifier is positioned some dis-tance away from the signal source, in order to cancel common modedisturbances at the input terminals. An AMP01 (Analog Devices)low-noise instrumentation amplifier was chosen for this task.
The IR radiation, which will be later partially absorbed by thegas, must be modulated since the designed signal recovery systemis a lock-in amplifier. In some cases, IR radiation may be directlymodulated by switching the IR emitter. But in our case, the largethermal capacity of the IR emitter and the corresponding large timeconstant (up to 5 s) limit the modulation frequency. For this reasonthe IR emitter operates in continuous mode, and an optical chop-per modulates the emitted radiation at 1 Hz, which is the optimumfrequency compatible with the time response of the detector.
Since the detector unit is a four-channel device, the pre-amplification stage is fourfold. Each pre-amplification stagefeatures one AMP01 instrumentation amplifier and a follow up fil-ter stage to reduce the noise and avoid aliasing before the lock-inroutine. Instrumentation amplifiers are designed with the requiredgain to expand the voltage to 0–0.6 V (104 V/V for reference andethylene channels, and 6 × 10³ V/V for ethanol and ammonia chan-
nels). The pre-filter stage features a 4th order unity gain low-passfilter, implemented using Sallen-Key architecture, and with a cut-off frequency of 2.5 Hz.The advantages of digital lock-in are the implementation ofthe carrier frequency range to arbitrarily low values, implementa-
J. Fonollosa et al. / Sensors and Actuators B 136 (2009) 546–554 549
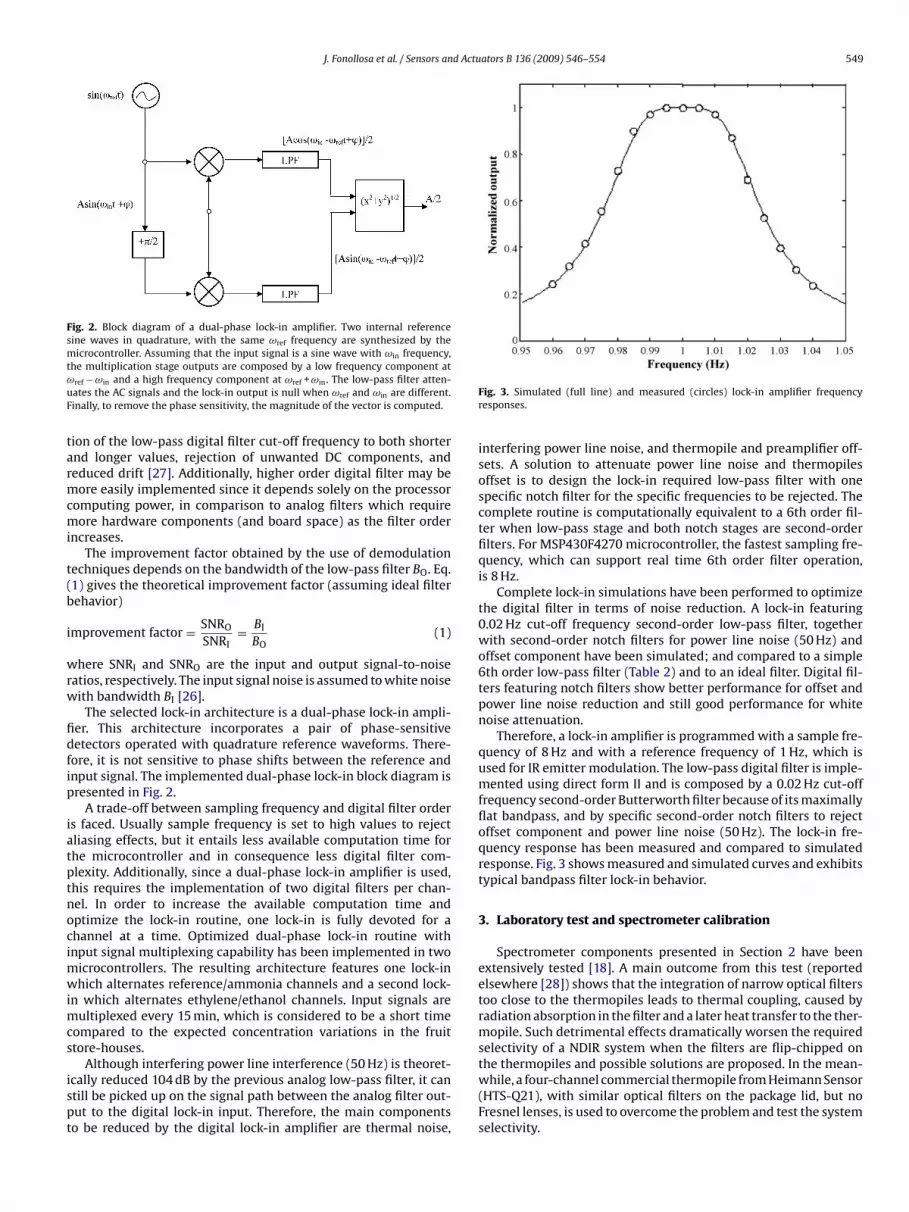
Fig. 2. Block diagram of a dual-phase lock-in amplifier. Two internal referencesine waves in quadrature, with the same ωref frequency are synthesized by themicrocontroller. Assuming that the input signal is a sine wave with ωin frequency,tωuF
tarmcmi
t(b
i
wrw
fidfip
iatptnocimwimcs
ispt
he multiplication stage outputs are composed by a low frequency component atref − ωin and a high frequency component at ωref + ωin. The low-pass filter atten-ates the AC signals and the lock-in output is null when ωref and ωin are different.inally, to remove the phase sensitivity, the magnitude of the vector is computed.
ion of the low-pass digital filter cut-off frequency to both shorternd longer values, rejection of unwanted DC components, andeduced drift [27]. Additionally, higher order digital filter may beore easily implemented since it depends solely on the processor
omputing power, in comparison to analog filters which requireore hardware components (and board space) as the filter order
ncreases.The improvement factor obtained by the use of demodulation
echniques depends on the bandwidth of the low-pass filter BO. Eq.1) gives the theoretical improvement factor (assuming ideal filterehavior)
mprovement factor = SNRO
SNRI= BI
BO(1)
here SNRI and SNRO are the input and output signal-to-noiseatios, respectively. The input signal noise is assumed to white noiseith bandwidth BI [26].
The selected lock-in architecture is a dual-phase lock-in ampli-er. This architecture incorporates a pair of phase-sensitiveetectors operated with quadrature reference waveforms. There-ore, it is not sensitive to phase shifts between the reference andnput signal. The implemented dual-phase lock-in block diagram isresented in Fig. 2.
A trade-off between sampling frequency and digital filter orders faced. Usually sample frequency is set to high values to rejectliasing effects, but it entails less available computation time forhe microcontroller and in consequence less digital filter com-lexity. Additionally, since a dual-phase lock-in amplifier is used,his requires the implementation of two digital filters per chan-el. In order to increase the available computation time andptimize the lock-in routine, one lock-in is fully devoted for ahannel at a time. Optimized dual-phase lock-in routine withnput signal multiplexing capability has been implemented in two
icrocontrollers. The resulting architecture features one lock-inhich alternates reference/ammonia channels and a second lock-
n which alternates ethylene/ethanol channels. Input signals areultiplexed every 15 min, which is considered to be a short time
ompared to the expected concentration variations in the fruittore-houses.
Although interfering power line interference (50 Hz) is theoret-cally reduced 104 dB by the previous analog low-pass filter, it cantill be picked up on the signal path between the analog filter out-ut to the digital lock-in input. Therefore, the main componentso be reduced by the digital lock-in amplifier are thermal noise,
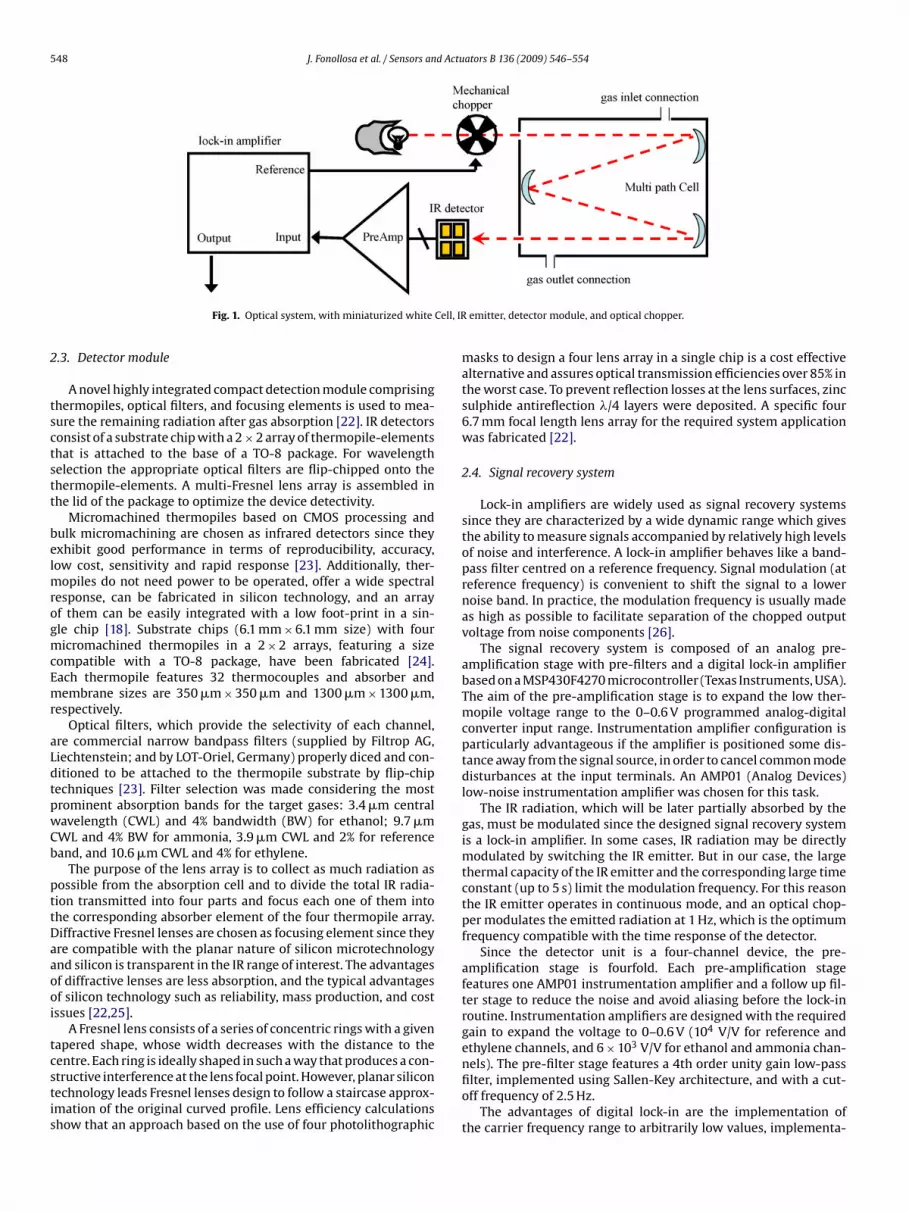
Fig. 3. Simulated (full line) and measured (circles) lock-in amplifier frequencyresponses.
interfering power line noise, and thermopile and preamplifier off-sets. A solution to attenuate power line noise and thermopilesoffset is to design the lock-in required low-pass filter with onespecific notch filter for the specific frequencies to be rejected. Thecomplete routine is computationally equivalent to a 6th order fil-ter when low-pass stage and both notch stages are second-orderfilters. For MSP430F4270 microcontroller, the fastest sampling fre-quency, which can support real time 6th order filter operation,is 8 Hz.
Complete lock-in simulations have been performed to optimizethe digital filter in terms of noise reduction. A lock-in featuring0.02 Hz cut-off frequency second-order low-pass filter, togetherwith second-order notch filters for power line noise (50 Hz) andoffset component have been simulated; and compared to a simple6th order low-pass filter (Table 2) and to an ideal filter. Digital fil-ters featuring notch filters show better performance for offset andpower line noise reduction and still good performance for whitenoise attenuation.
Therefore, a lock-in amplifier is programmed with a sample fre-quency of 8 Hz and with a reference frequency of 1 Hz, which isused for IR emitter modulation. The low-pass digital filter is imple-mented using direct form II and is composed by a 0.02 Hz cut-offfrequency second-order Butterworth filter because of its maximallyflat bandpass, and by specific second-order notch filters to rejectoffset component and power line noise (50 Hz). The lock-in fre-quency response has been measured and compared to simulatedresponse. Fig. 3 shows measured and simulated curves and exhibitstypical bandpass filter lock-in behavior.
3. Laboratory test and spectrometer calibration
Spectrometer components presented in Section 2 have beenextensively tested [18]. A main outcome from this test (reportedelsewhere [28]) shows that the integration of narrow optical filterstoo close to the thermopiles leads to thermal coupling, caused byradiation absorption in the filter and a later heat transfer to the ther-mopile. Such detrimental effects dramatically worsen the requiredselectivity of a NDIR system when the filters are flip-chipped onthe thermopiles and possible solutions are proposed. In the mean-
while, a four-channel commercial thermopile from Heimann Sensor(HTS-Q21), with similar optical filters on the package lid, but noFresnel lenses, is used to overcome the problem and test the systemselectivity.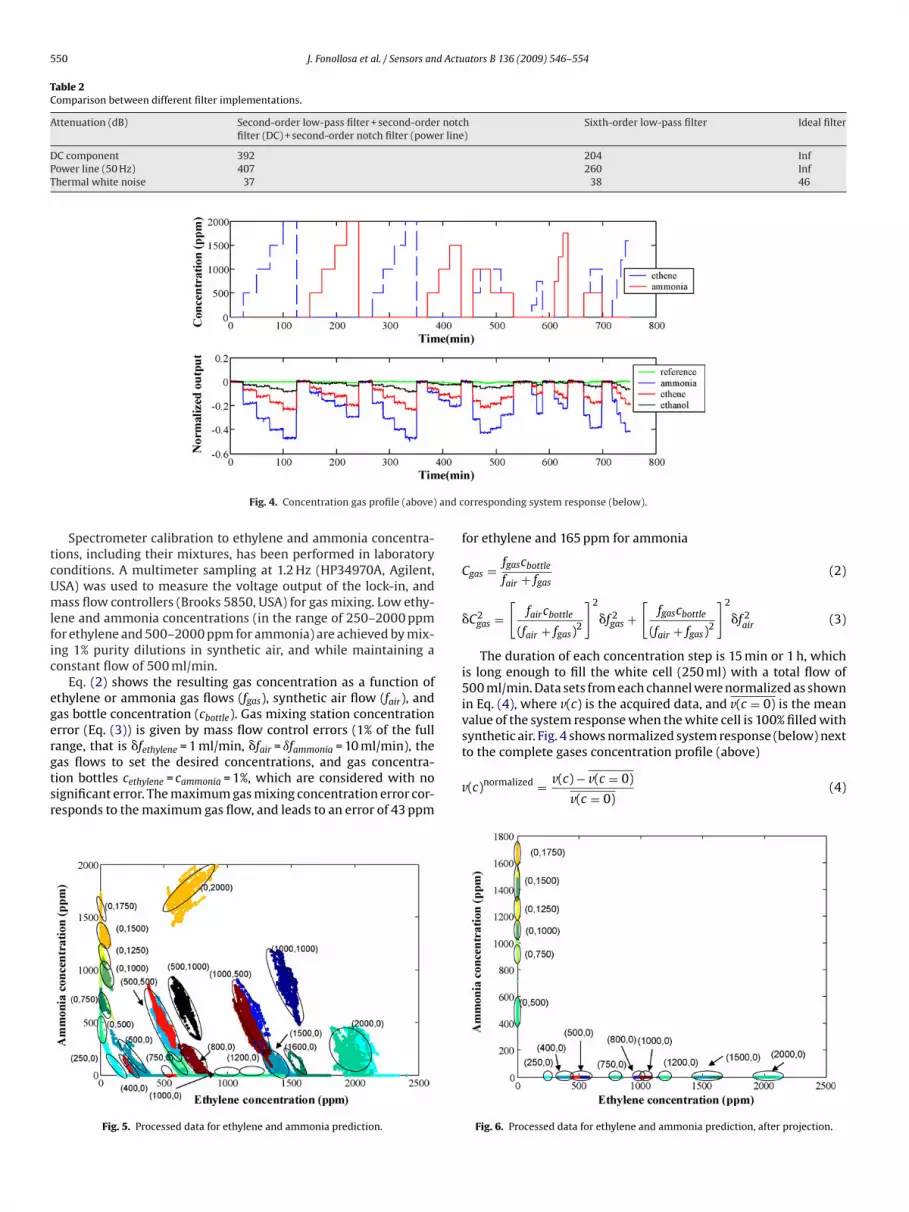
550 J. Fonollosa et al. / Sensors and Actuators B 136 (2009) 546–554
Table 2Comparison between different filter implementations.
Attenuation (dB) Second-order low-pass filter + second-order notchfilter (DC) + second-order notch filter (power line)
Sixth-order low-pass filter Ideal filter
DC component 392 204 InfPower line (50 Hz) 407 260 InfThermal white noise 37 38 46
and c
tcUmlfic
egergtsr
synthetic air. Fig. 4 shows normalized system response (below) nextto the complete gases concentration profile (above)
Fig. 4. Concentration gas profile (above)
Spectrometer calibration to ethylene and ammonia concentra-ions, including their mixtures, has been performed in laboratoryonditions. A multimeter sampling at 1.2 Hz (HP34970A, Agilent,SA) was used to measure the voltage output of the lock-in, andass flow controllers (Brooks 5850, USA) for gas mixing. Low ethy-
ene and ammonia concentrations (in the range of 250–2000 ppmor ethylene and 500–2000 ppm for ammonia) are achieved by mix-ng 1% purity dilutions in synthetic air, and while maintaining aonstant flow of 500 ml/min.
Eq. (2) shows the resulting gas concentration as a function ofthylene or ammonia gas flows (fgas), synthetic air flow (fair), andas bottle concentration (cbottle). Gas mixing station concentrationrror (Eq. (3)) is given by mass flow control errors (1% of the fullange, that is �fethylene = 1 ml/min, �fair = ıfammonia = 10 ml/min), the
as flows to set the desired concentrations, and gas concentra-ion bottles cethylene = cammonia = 1%, which are considered with noignificant error. The maximum gas mixing concentration error cor-esponds to the maximum gas flow, and leads to an error of 43 ppmFig. 5. Processed data for ethylene and ammonia prediction.
orresponding system response (below).
for ethylene and 165 ppm for ammonia
Cgas = fgascbottle
fair + fgas(2)
�C2gas =
[faircbottle
(fair + fgas)2
]2
�f 2gas +
[fgascbottle
(fair + fgas)2
]2
�f 2air (3)
The duration of each concentration step is 15 min or 1 h, whichis long enough to fill the white cell (250 ml) with a total flow of500 ml/min. Data sets from each channel were normalized as shownin Eq. (4), where v(c) is the acquired data, and v(c = 0) is the meanvalue of the system response when the white cell is 100% filled with
v(c)normalized = v(c) − v(c = 0)
v(c = 0)(4)
Fig. 6. Processed data for ethylene and ammonia prediction, after projection.
J. Fonollosa et al. / Sensors and Actuators B 136 (2009) 546–554 551
ents L
tbatTu
ttefwc
csibutlPbmPr
saie
4
tetii
Under the hypothesis of pure gases, the other gas concentration isautomatically zeroed. Moreover, to improve the prediction accu-racy for the selected gas, the data is later transformed using alinear operator in the direction of maximum variance towards the
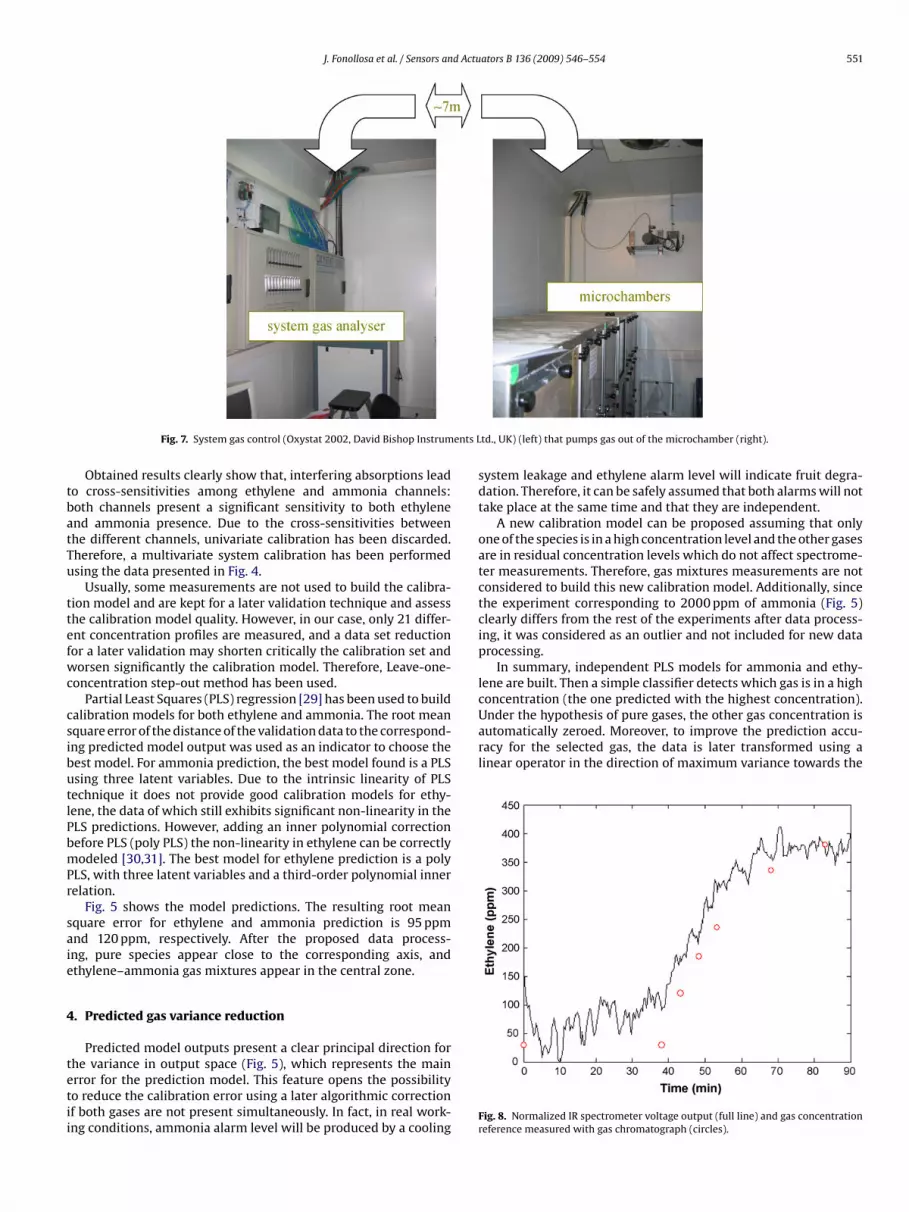
Fig. 7. System gas control (Oxystat 2002, David Bishop Instrum
Obtained results clearly show that, interfering absorptions leado cross-sensitivities among ethylene and ammonia channels:oth channels present a significant sensitivity to both ethylenend ammonia presence. Due to the cross-sensitivities betweenhe different channels, univariate calibration has been discarded.herefore, a multivariate system calibration has been performedsing the data presented in Fig. 4.
Usually, some measurements are not used to build the calibra-ion model and are kept for a later validation technique and assesshe calibration model quality. However, in our case, only 21 differ-nt concentration profiles are measured, and a data set reductionor a later validation may shorten critically the calibration set andorsen significantly the calibration model. Therefore, Leave-one-
oncentration step-out method has been used.Partial Least Squares (PLS) regression [29] has been used to build
alibration models for both ethylene and ammonia. The root meanquare error of the distance of the validation data to the correspond-ng predicted model output was used as an indicator to choose theest model. For ammonia prediction, the best model found is a PLSsing three latent variables. Due to the intrinsic linearity of PLSechnique it does not provide good calibration models for ethy-ene, the data of which still exhibits significant non-linearity in theLS predictions. However, adding an inner polynomial correctionefore PLS (poly PLS) the non-linearity in ethylene can be correctlyodeled [30,31]. The best model for ethylene prediction is a poly
LS, with three latent variables and a third-order polynomial innerelation.
Fig. 5 shows the model predictions. The resulting root meanquare error for ethylene and ammonia prediction is 95 ppmnd 120 ppm, respectively. After the proposed data process-ng, pure species appear close to the corresponding axis, andthylene–ammonia gas mixtures appear in the central zone.
. Predicted gas variance reduction
Predicted model outputs present a clear principal direction for
he variance in output space (Fig. 5), which represents the mainrror for the prediction model. This feature opens the possibilityo reduce the calibration error using a later algorithmic correctionf both gases are not present simultaneously. In fact, in real work-ng conditions, ammonia alarm level will be produced by a coolingtd., UK) (left) that pumps gas out of the microchamber (right).
system leakage and ethylene alarm level will indicate fruit degra-dation. Therefore, it can be safely assumed that both alarms will nottake place at the same time and that they are independent.
A new calibration model can be proposed assuming that onlyone of the species is in a high concentration level and the other gasesare in residual concentration levels which do not affect spectrome-ter measurements. Therefore, gas mixtures measurements are notconsidered to build this new calibration model. Additionally, sincethe experiment corresponding to 2000 ppm of ammonia (Fig. 5)clearly differs from the rest of the experiments after data process-ing, it was considered as an outlier and not included for new dataprocessing.
In summary, independent PLS models for ammonia and ethy-lene are built. Then a simple classifier detects which gas is in a highconcentration (the one predicted with the highest concentration).
Fig. 8. Normalized IR spectrometer voltage output (full line) and gas concentrationreference measured with gas chromatograph (circles).
5 d Actuators B 136 (2009) 546–554
cfpmF
tattA2afelwes
5
apicwg
fgLgtiaLuaeam
tfiHfib
6
iaCiipacm(d
52 J. Fonollosa et al. / Sensors an
orresponding gas axis (in prediction space). By doing so, the trans-ormed clusters have their variance greatly reduced. After this datarocessing, prediction errors become much smaller reaching a rootean square error of 15 ppm for ethylene and 80 ppm for ammonia.
ig. 6 shows the data projected to the axis.With the new calibration model, it can be said that the detec-
ion limit is 30 ppm of ethylene and 160 ppm of ammonia, withconfidence interval of 95%. In consequence, the fabricated spec-
rometer is able to detect the fruit ethylene burst which indicateshat the fruit is ripe at least 1 week before it declines to senescence.dditionally, the instrument detects ammonia leakage before the00 ppm, which obliges to switch on the ventilation and set a pre-larm [15]. It is remarkable that experimental gas detection limitsor the designed spectrometer are close to the gas mixing stationrrors. Therefore, the obtained gas detection limits represent upperimit values, and a better spectrometer performance may be found
hen using a gas mixing station featuring better accuracy. How-ver, obtained results show that the designed IR spectrometer isuitable for ethylene and ammonia alarm system.
. Field tests
Laboratory tests give promising results concerning ethylene andmmonia detection. However, in order to assess the spectrometererformance in real storage conditions, field test were carried out
n IRTA-Lleida, Spain, where usually ripening tests of fruit in typi-al fruit storage conditions are performed. Microstorage chambers,ith a volume of 140 l and featuring gas connections to an ethylene
as line, were used to simulate real fruit storage conditions.The IR spectrometer, which is at room temperature outside the
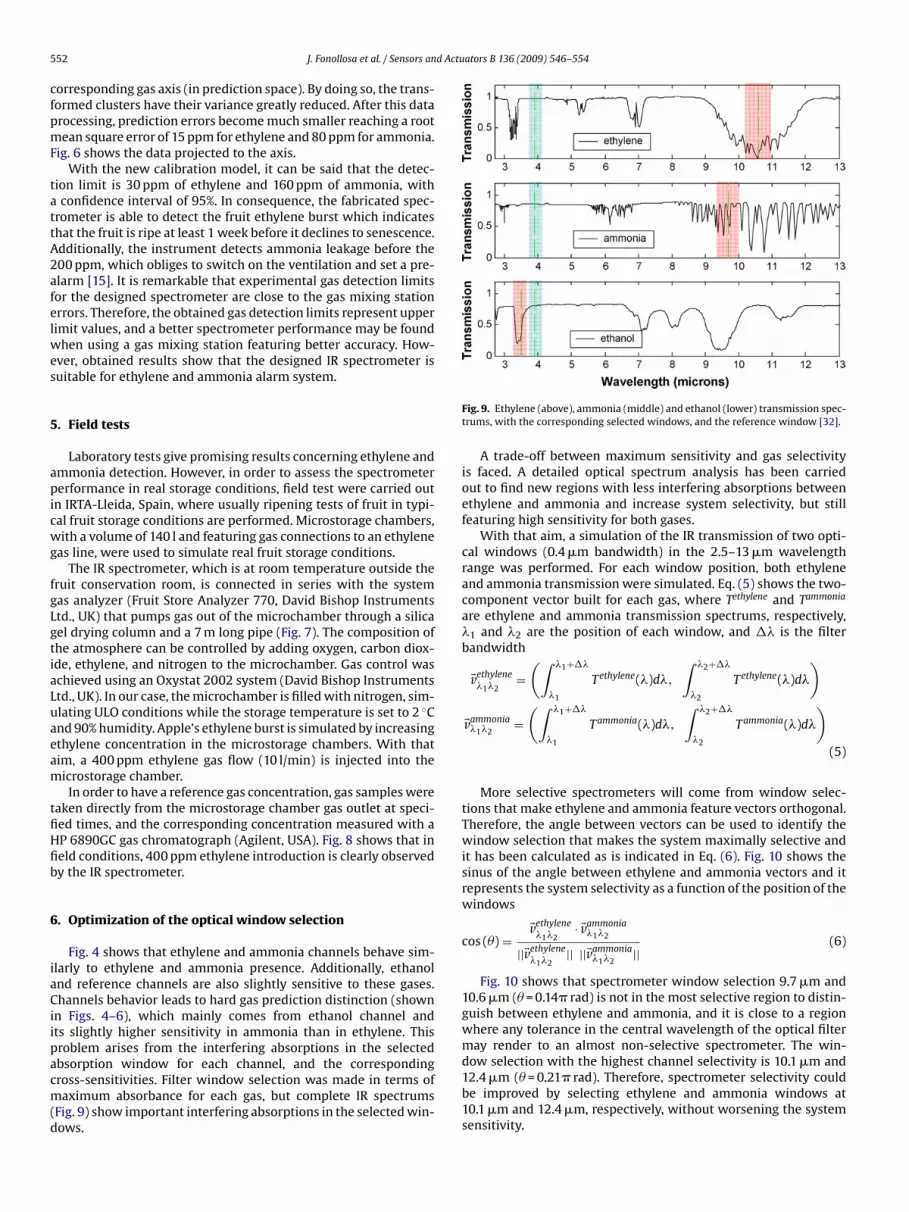
ruit conservation room, is connected in series with the systemas analyzer (Fruit Store Analyzer 770, David Bishop Instrumentstd., UK) that pumps gas out of the microchamber through a silicael drying column and a 7 m long pipe (Fig. 7). The composition ofhe atmosphere can be controlled by adding oxygen, carbon diox-de, ethylene, and nitrogen to the microchamber. Gas control waschieved using an Oxystat 2002 system (David Bishop Instrumentstd., UK). In our case, the microchamber is filled with nitrogen, sim-lating ULO conditions while the storage temperature is set to 2 ◦Cnd 90% humidity. Apple’s ethylene burst is simulated by increasingthylene concentration in the microstorage chambers. With thatim, a 400 ppm ethylene gas flow (10 l/min) is injected into theicrostorage chamber.In order to have a reference gas concentration, gas samples were
aken directly from the microstorage chamber gas outlet at speci-ed times, and the corresponding concentration measured with aP 6890GC gas chromatograph (Agilent, USA). Fig. 8 shows that ineld conditions, 400 ppm ethylene introduction is clearly observedy the IR spectrometer.
. Optimization of the optical window selection
Fig. 4 shows that ethylene and ammonia channels behave sim-larly to ethylene and ammonia presence. Additionally, ethanolnd reference channels are also slightly sensitive to these gases.hannels behavior leads to hard gas prediction distinction (shown
n Figs. 4–6), which mainly comes from ethanol channel andts slightly higher sensitivity in ammonia than in ethylene. Thisroblem arises from the interfering absorptions in the selected
bsorption window for each channel, and the correspondingross-sensitivities. Filter window selection was made in terms ofaximum absorbance for each gas, but complete IR spectrumsFig. 9) show important interfering absorptions in the selected win-ows.
Fig. 9. Ethylene (above), ammonia (middle) and ethanol (lower) transmission spec-trums, with the corresponding selected windows, and the reference window [32].
A trade-off between maximum sensitivity and gas selectivityis faced. A detailed optical spectrum analysis has been carriedout to find new regions with less interfering absorptions betweenethylene and ammonia and increase system selectivity, but stillfeaturing high sensitivity for both gases.
With that aim, a simulation of the IR transmission of two opti-cal windows (0.4 �m bandwidth) in the 2.5–13 �m wavelengthrange was performed. For each window position, both ethyleneand ammonia transmission were simulated. Eq. (5) shows the two-component vector built for each gas, where Tethylene and Tammonia
are ethylene and ammonia transmission spectrums, respectively,�1 and �2 are the position of each window, and �� is the filterbandwidth
�vethylene�1�2
=(∫ �1+��
�1
Tethylene(�)d�,
∫ �2+��
�2
Tethylene(�)d�
)
�vammonia�1�2
=(∫ �1+��
�1
Tammonia(�)d�,
∫ �2+��
�2
Tammonia(�)d�
)
(5)
More selective spectrometers will come from window selec-tions that make ethylene and ammonia feature vectors orthogonal.Therefore, the angle between vectors can be used to identify thewindow selection that makes the system maximally selective andit has been calculated as is indicated in Eq. (6). Fig. 10 shows thesinus of the angle between ethylene and ammonia vectors and itrepresents the system selectivity as a function of the position of thewindows
cos (�) =�vethylene
�1�2· �vammonia
�1�2
||�vethylene�1�2
|| ||�vammonia�1�2
||(6)
Fig. 10 shows that spectrometer window selection 9.7 �m and10.6 �m (� = 0.14� rad) is not in the most selective region to distin-guish between ethylene and ammonia, and it is close to a regionwhere any tolerance in the central wavelength of the optical filtermay render to an almost non-selective spectrometer. The win-
dow selection with the highest channel selectivity is 10.1 �m and12.4 �m (� = 0.21� rad). Therefore, spectrometer selectivity couldbe improved by selecting ethylene and ammonia windows at10.1 �m and 12.4 �m, respectively, without worsening the systemsensitivity.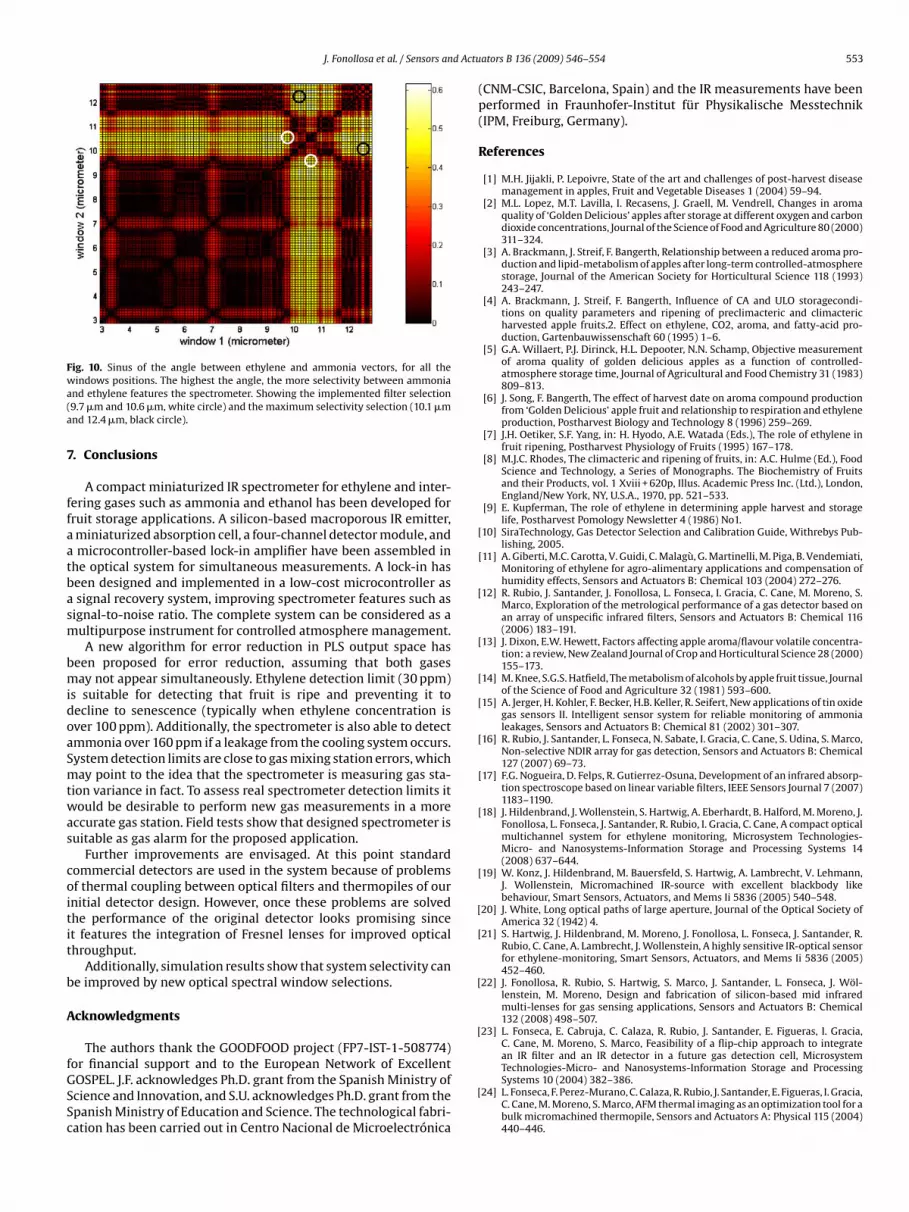
J. Fonollosa et al. / Sensors and Actu
Fig. 10. Sinus of the angle between ethylene and ammonia vectors, for all thewa(a
7
ffaatbasm
bmidoaSmtwas
coitit
b
A
fGSSc
[
[
[
[
[
[
[
[
[
[
[
[
indows positions. The highest the angle, the more selectivity between ammoniand ethylene features the spectrometer. Showing the implemented filter selection9.7 �m and 10.6 �m, white circle) and the maximum selectivity selection (10.1 �mnd 12.4 �m, black circle).
. Conclusions
A compact miniaturized IR spectrometer for ethylene and inter-ering gases such as ammonia and ethanol has been developed forruit storage applications. A silicon-based macroporous IR emitter,miniaturized absorption cell, a four-channel detector module, andmicrocontroller-based lock-in amplifier have been assembled in
he optical system for simultaneous measurements. A lock-in haseen designed and implemented in a low-cost microcontroller assignal recovery system, improving spectrometer features such as
ignal-to-noise ratio. The complete system can be considered as aultipurpose instrument for controlled atmosphere management.A new algorithm for error reduction in PLS output space has
een proposed for error reduction, assuming that both gasesay not appear simultaneously. Ethylene detection limit (30 ppm)
s suitable for detecting that fruit is ripe and preventing it toecline to senescence (typically when ethylene concentration isver 100 ppm). Additionally, the spectrometer is also able to detectmmonia over 160 ppm if a leakage from the cooling system occurs.ystem detection limits are close to gas mixing station errors, whichay point to the idea that the spectrometer is measuring gas sta-
ion variance in fact. To assess real spectrometer detection limits itould be desirable to perform new gas measurements in a more
ccurate gas station. Field tests show that designed spectrometer isuitable as gas alarm for the proposed application.
Further improvements are envisaged. At this point standardommercial detectors are used in the system because of problemsf thermal coupling between optical filters and thermopiles of ournitial detector design. However, once these problems are solvedhe performance of the original detector looks promising sincet features the integration of Fresnel lenses for improved opticalhroughput.
Additionally, simulation results show that system selectivity cane improved by new optical spectral window selections.
cknowledgments
The authors thank the GOODFOOD project (FP7-IST-1-508774)
or financial support and to the European Network of ExcellentOSPEL. J.F. acknowledges Ph.D. grant from the Spanish Ministry ofcience and Innovation, and S.U. acknowledges Ph.D. grant from thepanish Ministry of Education and Science. The technological fabri-ation has been carried out in Centro Nacional de Microelectrónica[
ators B 136 (2009) 546–554 553
(CNM-CSIC, Barcelona, Spain) and the IR measurements have beenperformed in Fraunhofer-Institut für Physikalische Messtechnik(IPM, Freiburg, Germany).
References
[1] M.H. Jijakli, P. Lepoivre, State of the art and challenges of post-harvest diseasemanagement in apples, Fruit and Vegetable Diseases 1 (2004) 59–94.
[2] M.L. Lopez, M.T. Lavilla, I. Recasens, J. Graell, M. Vendrell, Changes in aromaquality of ‘Golden Delicious’ apples after storage at different oxygen and carbondioxide concentrations, Journal of the Science of Food and Agriculture 80 (2000)311–324.
[3] A. Brackmann, J. Streif, F. Bangerth, Relationship between a reduced aroma pro-duction and lipid-metabolism of apples after long-term controlled-atmospherestorage, Journal of the American Society for Horticultural Science 118 (1993)243–247.
[4] A. Brackmann, J. Streif, F. Bangerth, Influence of CA and ULO storagecondi-tions on quality parameters and ripening of preclimacteric and climactericharvested apple fruits.2. Effect on ethylene, CO2, aroma, and fatty-acid pro-duction, Gartenbauwissenschaft 60 (1995) 1–6.
[5] G.A. Willaert, P.J. Dirinck, H.L. Depooter, N.N. Schamp, Objective measurementof aroma quality of golden delicious apples as a function of controlled-atmosphere storage time, Journal of Agricultural and Food Chemistry 31 (1983)809–813.
[6] J. Song, F. Bangerth, The effect of harvest date on aroma compound productionfrom ‘Golden Delicious’ apple fruit and relationship to respiration and ethyleneproduction, Postharvest Biology and Technology 8 (1996) 259–269.
[7] J.H. Oetiker, S.F. Yang, in: H. Hyodo, A.E. Watada (Eds.), The role of ethylene infruit ripening, Postharvest Physiology of Fruits (1995) 167–178.
[8] M.J.C. Rhodes, The climacteric and ripening of fruits, in: A.C. Hulme (Ed.), FoodScience and Technology, a Series of Monographs. The Biochemistry of Fruitsand their Products, vol. 1 Xviii + 620p, Illus. Academic Press Inc. (Ltd.), London,England/New York, NY, U.S.A., 1970, pp. 521–533.
[9] E. Kupferman, The role of ethylene in determining apple harvest and storagelife, Postharvest Pomology Newsletter 4 (1986) No1.
10] SiraTechnology, Gas Detector Selection and Calibration Guide, Withrebys Pub-lishing, 2005.
[11] A. Giberti, M.C. Carotta, V. Guidi, C. Malagù, G. Martinelli, M. Piga, B. Vendemiati,Monitoring of ethylene for agro-alimentary applications and compensation ofhumidity effects, Sensors and Actuators B: Chemical 103 (2004) 272–276.
12] R. Rubio, J. Santander, J. Fonollosa, L. Fonseca, I. Gracia, C. Cane, M. Moreno, S.Marco, Exploration of the metrological performance of a gas detector based onan array of unspecific infrared filters, Sensors and Actuators B: Chemical 116(2006) 183–191.
13] J. Dixon, E.W. Hewett, Factors affecting apple aroma/flavour volatile concentra-tion: a review, New Zealand Journal of Crop and Horticultural Science 28 (2000)155–173.
14] M. Knee, S.G.S. Hatfield, The metabolism of alcohols by apple fruit tissue, Journalof the Science of Food and Agriculture 32 (1981) 593–600.
15] A. Jerger, H. Kohler, F. Becker, H.B. Keller, R. Seifert, New applications of tin oxidegas sensors II. Intelligent sensor system for reliable monitoring of ammonialeakages, Sensors and Actuators B: Chemical 81 (2002) 301–307.
16] R. Rubio, J. Santander, L. Fonseca, N. Sabate, I. Gracia, C. Cane, S. Udina, S. Marco,Non-selective NDIR array for gas detection, Sensors and Actuators B: Chemical127 (2007) 69–73.
[17] F.G. Nogueira, D. Felps, R. Gutierrez-Osuna, Development of an infrared absorp-tion spectroscope based on linear variable filters, IEEE Sensors Journal 7 (2007)1183–1190.
18] J. Hildenbrand, J. Wollenstein, S. Hartwig, A. Eberhardt, B. Halford, M. Moreno, J.Fonollosa, L. Fonseca, J. Santander, R. Rubio, I. Gracia, C. Cane, A compact opticalmultichannel system for ethylene monitoring, Microsystem Technologies-Micro- and Nanosystems-Information Storage and Processing Systems 14(2008) 637–644.
19] W. Konz, J. Hildenbrand, M. Bauersfeld, S. Hartwig, A. Lambrecht, V. Lehmann,J. Wollenstein, Micromachined IR-source with excellent blackbody likebehaviour, Smart Sensors, Actuators, and Mems Ii 5836 (2005) 540–548.
20] J. White, Long optical paths of large aperture, Journal of the Optical Society ofAmerica 32 (1942) 4.
21] S. Hartwig, J. Hildenbrand, M. Moreno, J. Fonollosa, L. Fonseca, J. Santander, R.Rubio, C. Cane, A. Lambrecht, J. Wollenstein, A highly sensitive IR-optical sensorfor ethylene-monitoring, Smart Sensors, Actuators, and Mems Ii 5836 (2005)452–460.
22] J. Fonollosa, R. Rubio, S. Hartwig, S. Marco, J. Santander, L. Fonseca, J. Wöl-lenstein, M. Moreno, Design and fabrication of silicon-based mid infraredmulti-lenses for gas sensing applications, Sensors and Actuators B: Chemical132 (2008) 498–507.
23] L. Fonseca, E. Cabruja, C. Calaza, R. Rubio, J. Santander, E. Figueras, I. Gracia,C. Cane, M. Moreno, S. Marco, Feasibility of a flip-chip approach to integratean IR filter and an IR detector in a future gas detection cell, Microsystem
Technologies-Micro- and Nanosystems-Information Storage and ProcessingSystems 10 (2004) 382–386.24] L. Fonseca, F. Perez-Murano, C. Calaza, R. Rubio, J. Santander, E. Figueras, I. Gracia,C. Cane, M. Moreno, S. Marco, AFM thermal imaging as an optimization tool for abulk micromachined thermopile, Sensors and Actuators A: Physical 115 (2004)440–446.
5 d Actu
[
[
[
[
[
[
[
[
B
JBEsis
Bohroried
LB1sfmPc
54 J. Fonollosa et al. / Sensors an
25] J. Fonollosa, R. Rubio, J. Hildenbrand, M. Moreno, S. Marco, J. Santander, L. Fon-seca, S. Hartwig, J. Wollenstein, Fresnel lenses: study and fabrication in silicontechnology for medium-IR applications—art no. 61860R, Mems, Moems, andMicromachining Ii 6186 (2006) R1860–R11860.
26] M.L. Meade, Lock-in Amplifiers: Principles and Applications, Peter PeregrinusLtd., London, 1983.
27] L.A. Barragan, J.I. Artigas, R. Alonso, F. Villuendas, A modular, low-cost, digitalsignal processor-based lock-in card for measuring optical attenuation, Reviewof Scientific Instruments 72 (2001) 247–251.
28] J. Fonollosa, M. Carmona, J. Santander, L. Fonseca, M. Moreno, S. Marco, Limits tothe integration of filters and lenses on thermoelectric IR detectors by flip-chiptechniques, Sensors and Actuators A: Physical 149 (2009) 65–73.
29] S. Wold, M. Sjöström, L. Eriksson, PLS-regression: a basic tool of chemometrics,Chemometrics and Intelligent Laboratory Systems 58 (2001) 109–130.
30] S. Wold, N. Kettanehwold, B. Skagerberg, Nonlinear PLS modeling, Chemomet-rics and Intelligent Laboratory Systems 7 (1989) 53–65.
31] C. Calaza, E. Meca, S. Marco, M. Moreno, J. Samitier, L. Fonseca, I. Gracia, C.Cane, Assessment of the final metrological characteristics of a MOEMS-basedNDIR spectrometer through system modeling and data processing, IEEE SensorsJournal 3 (2003) 587–594.
32] N. I. o. S. a. T. (NIST), The NIST Chemistry WebBook, 2005.
iographies
ordi Fonollosa was born in Barcelona, on December 26, 1980. He received his.S. in Physics in 2002, and his B.S. and the master of science degree in Electronicngineering in 2007, from the University of Barcelona, where he started his Ph.D.tudies in 2004. His main research areas are related to infrared sensing technologies,ncluding optical components design, and both analog and digital signal recoveryystems.
ernard Halford received his B.S. in Electronic Engineering from the Bolton Institutef Technology in 1976. In 1982 he joined Fraunhofer IPM, where his work experienceas been mainly focussed on the development and implementation of componentselated to opto-electronic applications in optical spectroscopy, including the designf low-noise front-end amplifiers and system calibration with optical sources. Mostecent projects include work on the development of a FTIR spectrometer, a rotat-ng filter spectrometer and electronics used in digital imaging processing. Furtherxperience includes work in the field of design, fabrication and testing of mid-IRetectors for spectroscopic applications.
uis Fonseca was born in Barcelona, Spain, on February 17, 1966. He received his.S. and Ph.D. degrees in physics from the Autonomous University of Barcelona in
988 and 1992, respectively. In 2001 he joined the CNM Microsystems group as a fullenior researcher being his actual research focused on technological developmentsor gas sensing and more specifically on optical gas sensing. He has been involved inore than 30 Spanish and European projects, the last one being the FP6 Integratedroject GoodFood (Food Safety and Quality with Microsystems) which he helped tooordinate.
ators B 136 (2009) 546–554
Joaquín Santander was born in Terrassa, Spain, in 1966. He received the B.S. andPh.D. degrees in physics from the Autonomous University of Barcelona, Spain, in1989 and 1996, respectively. He is currently working at the Microelectronics NationalCenter in Barcelona, as responsible for the electrical parametric characterization ofdifferent microelectronic technologies (CMOS, MCM, sensors, microsystems) usingmainly test structures. His main research areas are related to microsystems, gassensing applications and micro-fuel cells.
Sergi Udina began his degree in physics in 1995 and obtained the degree in elec-tronic engineering by the Universitat de Barcelona in 2004, and the Master of Sciencedegree in electronic engineering in 2007. His current investigation work is related tochemical and thermal sensors, multivariate calibration, signal processing and stan-dard sensor interfacing basically including IEEE1451. Other strong interests includeaudio signal processing and engineering, power electronics, DLP, and 6 DOF real-time positioning. He is currently pursuing his Ph.D. degree at the Departamentd’Electronica of the Universitat de Barcelona.
Mauricio Moreno was born in Barcelona, Spain. He received the degree in physicsin 1989 from the University of Barcelona (UB), and the Ph.D. degree in sciences in1995 from the Polytechnic University of Catalonia (UPC), Spain. He has been Asso-ciate Professor in the Electronics Department, UB, since 1997. He is involved in thedesign and test of microoptics devices in silicon technologies, and optical waveguidegrating devices for biosensing applications. Other fields of interest include arrays ofintegrated photodetectors in CMOS technology for imaging.
Jürgen Hildenbrand, scientist, received his degree in Microsystems Engineeringfrom the University of Freiburg in 2003. After 1-year collaboration work betweenFraunhofer IPM and the simulation group of the Institute of Microsytems Tech-nology, he started his Ph.D. on MEMS based thermal emitters at Fraunhofer IPM.Beside the thermal emitter research he works in the field of mid-infrared spectro-scopic system development. This includes NDIR-systems as well as quantum cascadebased laser spectrometers. Here, his main interests are optical simulation and systemintegration.
Jürgen Wöllenstein received his diploma in electrical engineering from the Univer-sity of Kassel, Germany in 1994. In 2003 he finished his Ph.D.-thesis at the sameuniversity. In 1994 he joined the Fraunhofer Institute of Physical Measurement,Freiburg, Germany, where he is engaged in development of optical and semicon-ductor based microsystems for gas analysis.
Santiago Marco completed his university degree (Licenciado) in Applied Physicsin 1988 and received a Ph.D. in Microsystem Technology from the Universityof Barcelona in 1993. He is associate Professor (Profesor Titular) at the Depar-
tament d’Electronica of Universitat de Barcelona since 1995. He has recentlybeen appointed leader of the Artificial Olfaction Lab at the Institute of Bio-engineering of Catalonia. His research concerns the development of signal/dataprocessing algorithmic solutions for smart chemical sensing based in sensor arraysor microspectrometers integrated typically using Microsystem Technologies (moreat http://www.ibecbarcelona.eu and http://isp.el.ub.es).


