Embed Size (px)
Citation preview
1
ETDP SETA
SCHOOLING
SECTOR SKILLS PLAN
2013/2014 UPDATE
FINAL SUBMISSION DATE: 15/11/2012
2
Acknowledgements The Education Moving Up was commissioned by the ETDP SETA to conduct the Schooling Sector Skills Plan
external research. The ETDP SETA wishes to extend sincere gratitude to the researchers including C.L.A.S.S.
Consulting, Creative Consulting and Henry Badenhorst & Associates who compiled this report.
The full version of this report will be available on the ETDP SETA Website: www.etdpseta.org.za
Content
No. Description Page
List of acronyms 5
List of tables 8
List of figures 10
Chapter 1 1. Overview of schooling sector 11
1.2 Research Design 12
1.2.1 Introduction 12
1.2.2 Stakeholder interview 14
1.3 Limitations 14
Chapter 2 2. Schooling sector profile 17
2.1 Institutional profile of schooling 17
2.1.1 Introduction 17
2.1.2 Overall data view of schooling sector in South Africa 17
2.1.3 Learners in the schooling sector 20
2.1.3.1 Public school learners 20
2.1.3.2 Independent school learners 20
2.1.3.3 Public and independent school learners 21
2.1.4 Educator in the schooling sector 22
2.1.4.1 Public school educators 22
2.1.4.2 Independent school educators 23
2.1.4.3 Public and independent school educators 23
2.1.5 Schools in the schooling sector 23
2.1.5.1 Public schools 24
2.1.5.2 Independent schools 25
2.1.5.3 Public and independent schools 30
2.1.6 Integration of learner, educator and school data in schooling 30
2.1.6.1 School governing body educators and the learner educator ratio (LER) 31
2.1.6.2 Learner school ratio (LSR) and the educator school ratio (ESR) 32
2.2 Policy framework 33
2.2.1 Legislative framework 33
2.2.2 Political framework 36
2.3 Socio-Economic profile 38
Chapter 3 3.1 Drivers of change for the ETD and schooling sector 42
3.1.1 External drivers of change in the ETD sector 42
3.1.1.1 Globalisation 42
3.1.1.2 Global recession 42
3
3.1.1.3 Changes in technology 42
3.1.2 Internal drivers of change 43
3.1.2.1 Legislation 43
3.1.2.2 Social drivers 43
3.1.2.3 Economic drivers 44
3.1.2.4 Technological drivers 45
3.1.2.5 Human resource development strategy for South Africa as a driver 45
3.1.2.6 Schooling specific drivers 46
3.2 Overview of current challenges in the schooling sector 49
3.2.1 Department of Education 49
3.2.2 Schooling challenges 50
3.2.2.1 Orphan learners and attendance of learners 50
3.2.2.2 Reasons for not attending and educational institution 54
3.2.2.3 Corporal punishment 54
3.2.2.4 School infrastructure backlogs 55
3.2.2.5 Growth in independent schools 57
3.3 Employment profile of schooling 57
3.3.1 Distribution of staff types 57
3.3.2 Employee demographic profile 59
3.3.3 Employment patterns and trends 62
3.3.3.1 Educator termination rates 62
3.3.3.2 Educator attrition rates 62
3.4 Skills supply 67
3.4.1 Occupational routes into schooling 67
3.4.1.1 Pathways in teacher education 67
3.4.1.2 Educator qualifications 67
3.4.2 Skills supply analysis 73
3.5 Skills demand 78
3.5.1 Factors impacting on demand 78
3.5.1.1 Demand in Department of Education in public schools 78
3.5.1.2 Demands in independent schools 79
3.5.1.3 Crucial monitoring and evaluation as well as support and development questions 79
3.5.2 Scarce and critical skills priorities 81
3.5.3 Demand and supply analysis 83
3.6 Findings of the research project 86
3.6.1 Western Cape schools 86
3.6.2 KwaZulu-Natal schools 100
3.6.3 Direct and indirect ideas from the data from the two provinces 111
Chapter 4 4. Sector strategy 115
4.1 Priority areas and alignment with national strategies/imperatives 115
4.1.1 Medium term strategic framework (MTSF) 115
4.1.2 New growth plan (NGP) 116
4.1.3 National skills development strategy III (NSDS III) 118
4.1.4 Industrial policy action plan (IPAP) 120
4.1.5 National Development Plan (NDP 2030) 121
4.1.6 Integrated Strategic Planning Framework for Teacher Development in SA (2011-25) 122
4.2 New and emerging sector challenges regarding skills development 123
4.3 Proposed ETDP Seta intervention 125
4
Chapter 5 5. Way forward regarding SSP research 128
5.1 Challenges regarding research process 128
5.2 Gaps regarding research update 130
5.3 Recommendations in terms of gaps 134
Reference 136
Appendix 1: Key informants and provincial participants 140
5
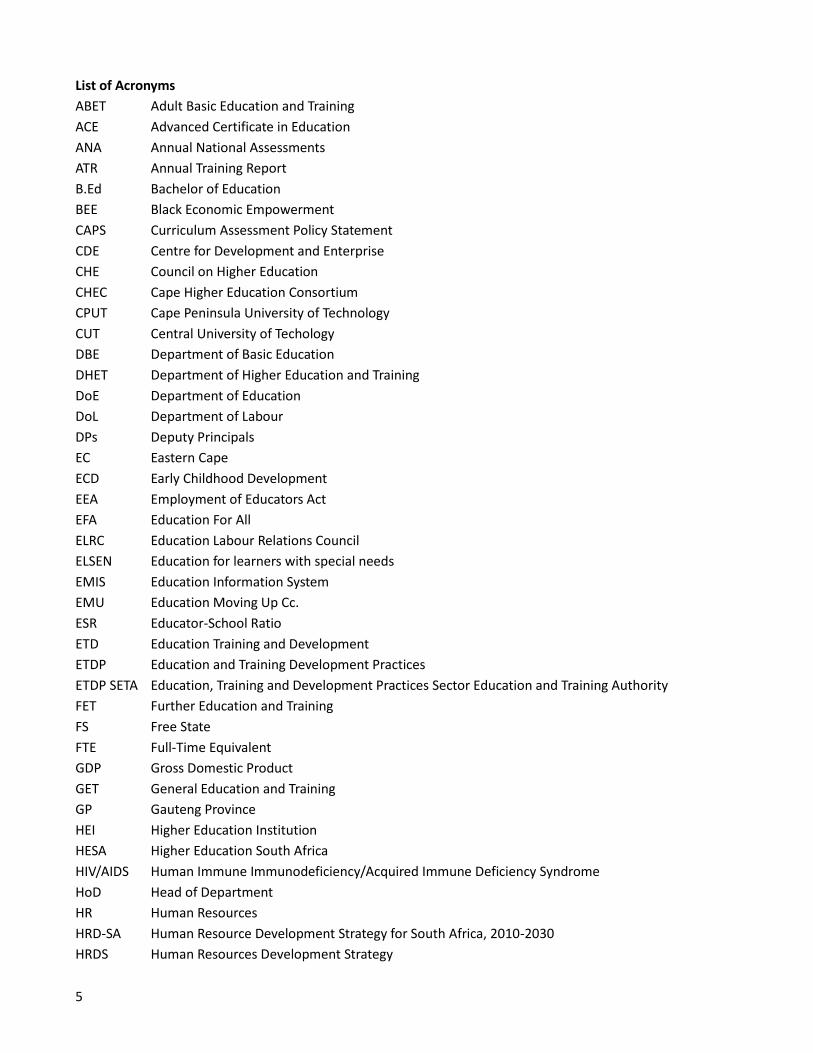
List of Acronyms
ABET Adult Basic Education and Training
ACE Advanced Certificate in Education
ANA Annual National Assessments
ATR Annual Training Report
B.Ed Bachelor of Education
BEE Black Economic Empowerment
CAPS Curriculum Assessment Policy Statement
CDE Centre for Development and Enterprise
CHE Council on Higher Education
CHEC Cape Higher Education Consortium
CPUT Cape Peninsula University of Technology
CUT Central University of Techology
DBE Department of Basic Education
DHET Department of Higher Education and Training
DoE Department of Education
DoL Department of Labour
DPs Deputy Principals
EC Eastern Cape
ECD Early Childhood Development
EEA Employment of Educators Act
EFA Education For All
ELRC Education Labour Relations Council
ELSEN Education for learners with special needs
EMIS Education Information System
EMU Education Moving Up Cc.
ESR Educator-School Ratio
ETD Education Training and Development
ETDP Education and Training Development Practices
ETDP SETA Education, Training and Development Practices Sector Education and Training Authority
FET Further Education and Training
FS Free State
FTE Full-Time Equivalent
GDP Gross Domestic Product
GET General Education and Training
GP Gauteng Province
HEI Higher Education Institution
HESA Higher Education South Africa
HIV/AIDS Human Immune Immunodeficiency/Acquired Immune Deficiency Syndrome
HoD Head of Department
HR Human Resources
HRD-SA Human Resource Development Strategy for South Africa, 2010-2030
HRDS Human Resources Development Strategy
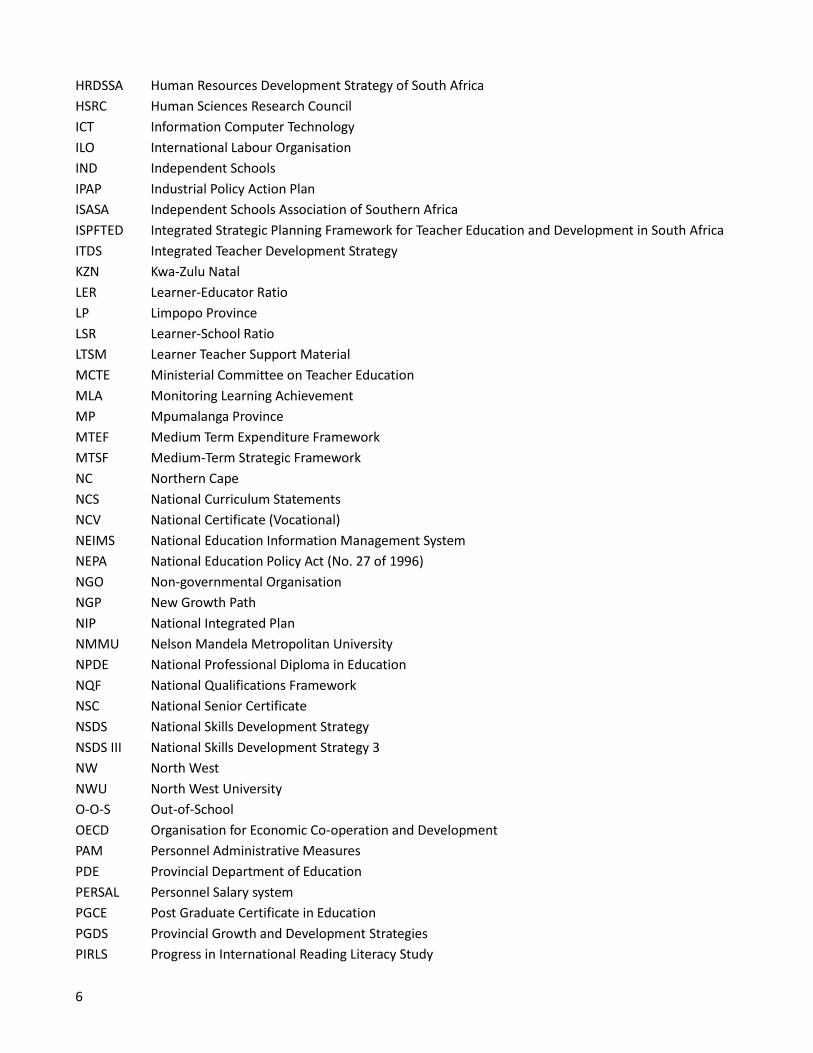
6
HRDSSA Human Resources Development Strategy of South Africa
HSRC Human Sciences Research Council
ICT Information Computer Technology
ILO International Labour Organisation
IND Independent Schools
IPAP Industrial Policy Action Plan
ISASA Independent Schools Association of Southern Africa
ISPFTED Integrated Strategic Planning Framework for Teacher Education and Development in South Africa
ITDS Integrated Teacher Development Strategy
KZN Kwa-Zulu Natal
LER Learner-Educator Ratio
LP Limpopo Province
LSR Learner-School Ratio
LTSM Learner Teacher Support Material
MCTE Ministerial Committee on Teacher Education
MLA Monitoring Learning Achievement
MP Mpumalanga Province
MTEF Medium Term Expenditure Framework
MTSF Medium-Term Strategic Framework
NC Northern Cape
NCS National Curriculum Statements
NCV National Certificate (Vocational)
NEIMS National Education Information Management System
NEPA National Education Policy Act (No. 27 of 1996)
NGO Non-governmental Organisation
NGP New Growth Path
NIP National Integrated Plan
NMMU Nelson Mandela Metropolitan University
NPDE National Professional Diploma in Education
NQF National Qualifications Framework
NSC National Senior Certificate
NSDS National Skills Development Strategy
NSDS III National Skills Development Strategy 3
NW North West
NWU North West University
O-O-S Out-of-School
OECD Organisation for Economic Co-operation and Development
PAM Personnel Administrative Measures
PDE Provincial Department of Education
PERSAL Personnel Salary system
PGCE Post Graduate Certificate in Education
PGDS Provincial Growth and Development Strategies
PIRLS Progress in International Reading Literacy Study
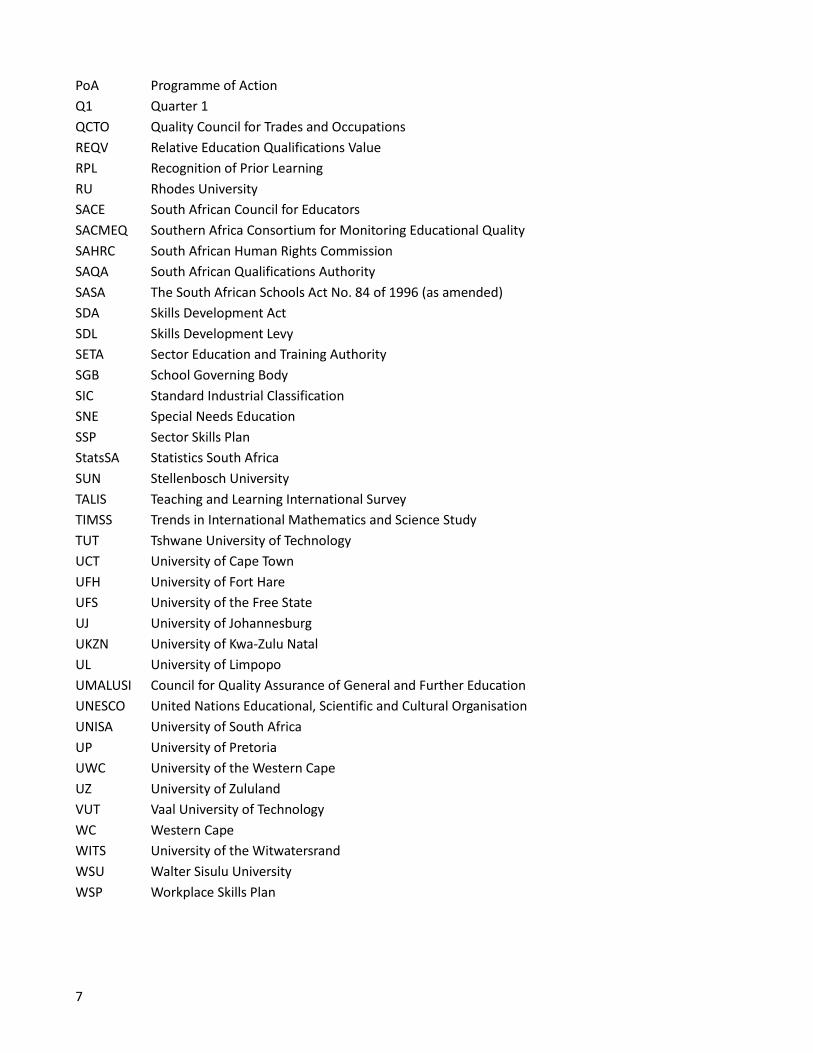
7
PoA Programme of Action
Q1 Quarter 1
QCTO Quality Council for Trades and Occupations
REQV Relative Education Qualifications Value
RPL Recognition of Prior Learning
RU Rhodes University
SACE South African Council for Educators
SACMEQ Southern Africa Consortium for Monitoring Educational Quality
SAHRC South African Human Rights Commission
SAQA South African Qualifications Authority
SASA The South African Schools Act No. 84 of 1996 (as amended)
SDA Skills Development Act
SDL Skills Development Levy
SETA Sector Education and Training Authority
SGB School Governing Body
SIC Standard Industrial Classification
SNE Special Needs Education
SSP Sector Skills Plan
StatsSA Statistics South Africa
SUN Stellenbosch University
TALIS Teaching and Learning International Survey
TIMSS Trends in International Mathematics and Science Study
TUT Tshwane University of Technology
UCT University of Cape Town
UFH University of Fort Hare
UFS University of the Free State
UJ University of Johannesburg
UKZN University of Kwa-Zulu Natal
UL University of Limpopo
UMALUSI Council for Quality Assurance of General and Further Education
UNESCO United Nations Educational, Scientific and Cultural Organisation
UNISA University of South Africa
UP University of Pretoria
UWC University of the Western Cape
UZ University of Zululand
VUT Vaal University of Technology
WC Western Cape
WITS University of the Witwatersrand
WSU Walter Sisulu University
WSP Workplace Skills Plan
8
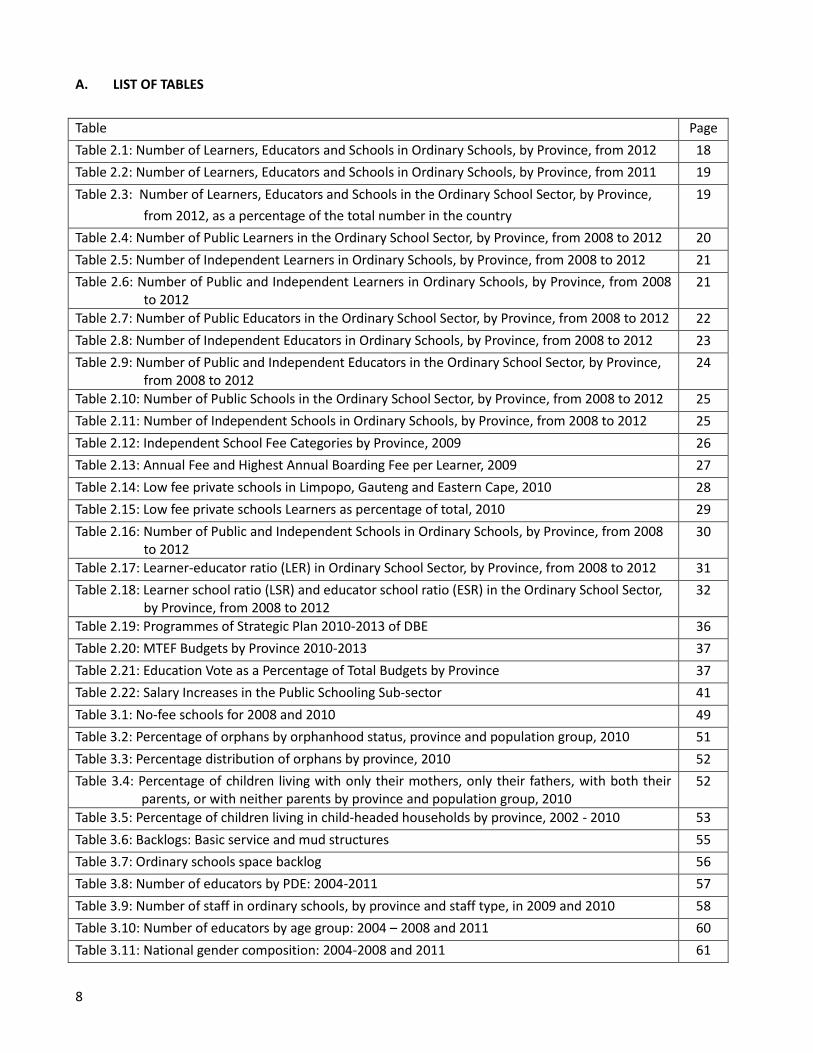
A. LIST OF TABLES
Table Page
Table 2.1: Number of Learners, Educators and Schools in Ordinary Schools, by Province, from 2012 18
Table 2.2: Number of Learners, Educators and Schools in Ordinary Schools, by Province, from 2011 19
Table 2.3: Number of Learners, Educators and Schools in the Ordinary School Sector, by Province,
from 2012, as a percentage of the total number in the country
19
Table 2.4: Number of Public Learners in the Ordinary School Sector, by Province, from 2008 to 2012 20
Table 2.5: Number of Independent Learners in Ordinary Schools, by Province, from 2008 to 2012 21
Table 2.6: Number of Public and Independent Learners in Ordinary Schools, by Province, from 2008 to 2012
21
Table 2.7: Number of Public Educators in the Ordinary School Sector, by Province, from 2008 to 2012 22
Table 2.8: Number of Independent Educators in Ordinary Schools, by Province, from 2008 to 2012 23
Table 2.9: Number of Public and Independent Educators in the Ordinary School Sector, by Province, from 2008 to 2012
24
Table 2.10: Number of Public Schools in the Ordinary School Sector, by Province, from 2008 to 2012 25
Table 2.11: Number of Independent Schools in Ordinary Schools, by Province, from 2008 to 2012 25
Table 2.12: Independent School Fee Categories by Province, 2009 26
Table 2.13: Annual Fee and Highest Annual Boarding Fee per Learner, 2009 27
Table 2.14: Low fee private schools in Limpopo, Gauteng and Eastern Cape, 2010 28
Table 2.15: Low fee private schools Learners as percentage of total, 2010 29
Table 2.16: Number of Public and Independent Schools in Ordinary Schools, by Province, from 2008 to 2012
30
Table 2.17: Learner-educator ratio (LER) in Ordinary School Sector, by Province, from 2008 to 2012 31
Table 2.18: Learner school ratio (LSR) and educator school ratio (ESR) in the Ordinary School Sector, by Province, from 2008 to 2012
32
Table 2.19: Programmes of Strategic Plan 2010-2013 of DBE 36
Table 2.20: MTEF Budgets by Province 2010-2013 37
Table 2.21: Education Vote as a Percentage of Total Budgets by Province 37
Table 2.22: Salary Increases in the Public Schooling Sub-sector 41
Table 3.1: No-fee schools for 2008 and 2010 49
Table 3.2: Percentage of orphans by orphanhood status, province and population group, 2010 51
Table 3.3: Percentage distribution of orphans by province, 2010 52
Table 3.4: Percentage of children living with only their mothers, only their fathers, with both their parents, or with neither parents by province and population group, 2010
52
Table 3.5: Percentage of children living in child-headed households by province, 2002 - 2010 53
Table 3.6: Backlogs: Basic service and mud structures 55
Table 3.7: Ordinary schools space backlog 56
Table 3.8: Number of educators by PDE: 2004-2011 57
Table 3.9: Number of staff in ordinary schools, by province and staff type, in 2009 and 2010 58
Table 3.10: Number of educators by age group: 2004 – 2008 and 2011 60
Table 3.11: National gender composition: 2004-2008 and 2011 61
9
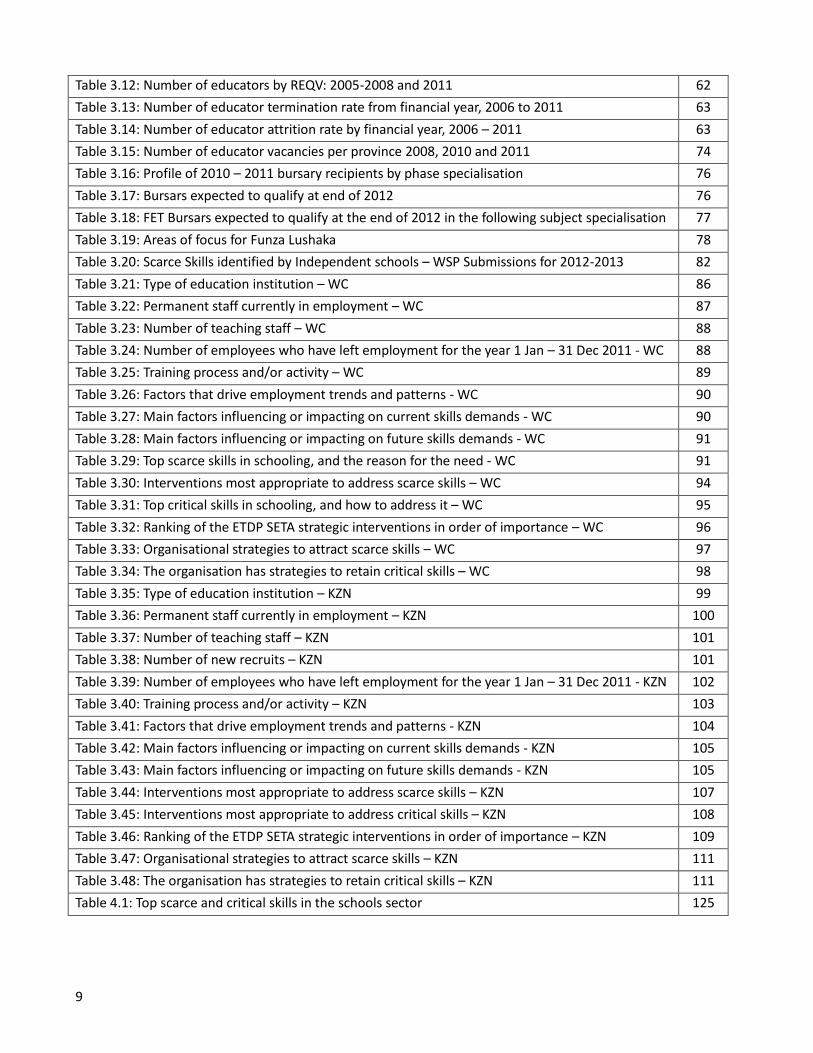
Table 3.12: Number of educators by REQV: 2005-2008 and 2011 62
Table 3.13: Number of educator termination rate from financial year, 2006 to 2011 63
Table 3.14: Number of educator attrition rate by financial year, 2006 – 2011 63
Table 3.15: Number of educator vacancies per province 2008, 2010 and 2011 74
Table 3.16: Profile of 2010 – 2011 bursary recipients by phase specialisation 76
Table 3.17: Bursars expected to qualify at end of 2012 76
Table 3.18: FET Bursars expected to qualify at the end of 2012 in the following subject specialisation 77
Table 3.19: Areas of focus for Funza Lushaka 78
Table 3.20: Scarce Skills identified by Independent schools – WSP Submissions for 2012-2013 82
Table 3.21: Type of education institution – WC 86
Table 3.22: Permanent staff currently in employment – WC 87
Table 3.23: Number of teaching staff – WC 88
Table 3.24: Number of employees who have left employment for the year 1 Jan – 31 Dec 2011 - WC 88
Table 3.25: Training process and/or activity – WC 89
Table 3.26: Factors that drive employment trends and patterns - WC 90
Table 3.27: Main factors influencing or impacting on current skills demands - WC 90
Table 3.28: Main factors influencing or impacting on future skills demands - WC 91
Table 3.29: Top scarce skills in schooling, and the reason for the need - WC 91
Table 3.30: Interventions most appropriate to address scarce skills – WC 94
Table 3.31: Top critical skills in schooling, and how to address it – WC 95
Table 3.32: Ranking of the ETDP SETA strategic interventions in order of importance – WC 96
Table 3.33: Organisational strategies to attract scarce skills – WC 97
Table 3.34: The organisation has strategies to retain critical skills – WC 98
Table 3.35: Type of education institution – KZN 99
Table 3.36: Permanent staff currently in employment – KZN 100
Table 3.37: Number of teaching staff – KZN 101
Table 3.38: Number of new recruits – KZN 101
Table 3.39: Number of employees who have left employment for the year 1 Jan – 31 Dec 2011 - KZN 102
Table 3.40: Training process and/or activity – KZN 103
Table 3.41: Factors that drive employment trends and patterns - KZN 104
Table 3.42: Main factors influencing or impacting on current skills demands - KZN 105
Table 3.43: Main factors influencing or impacting on future skills demands - KZN 105
Table 3.44: Interventions most appropriate to address scarce skills – KZN 107
Table 3.45: Interventions most appropriate to address critical skills – KZN 108
Table 3.46: Ranking of the ETDP SETA strategic interventions in order of importance – KZN 109
Table 3.47: Organisational strategies to attract scarce skills – KZN 111
Table 3.48: The organisation has strategies to retain critical skills – KZN 111
Table 4.1: Top scarce and critical skills in the schools sector 125
10
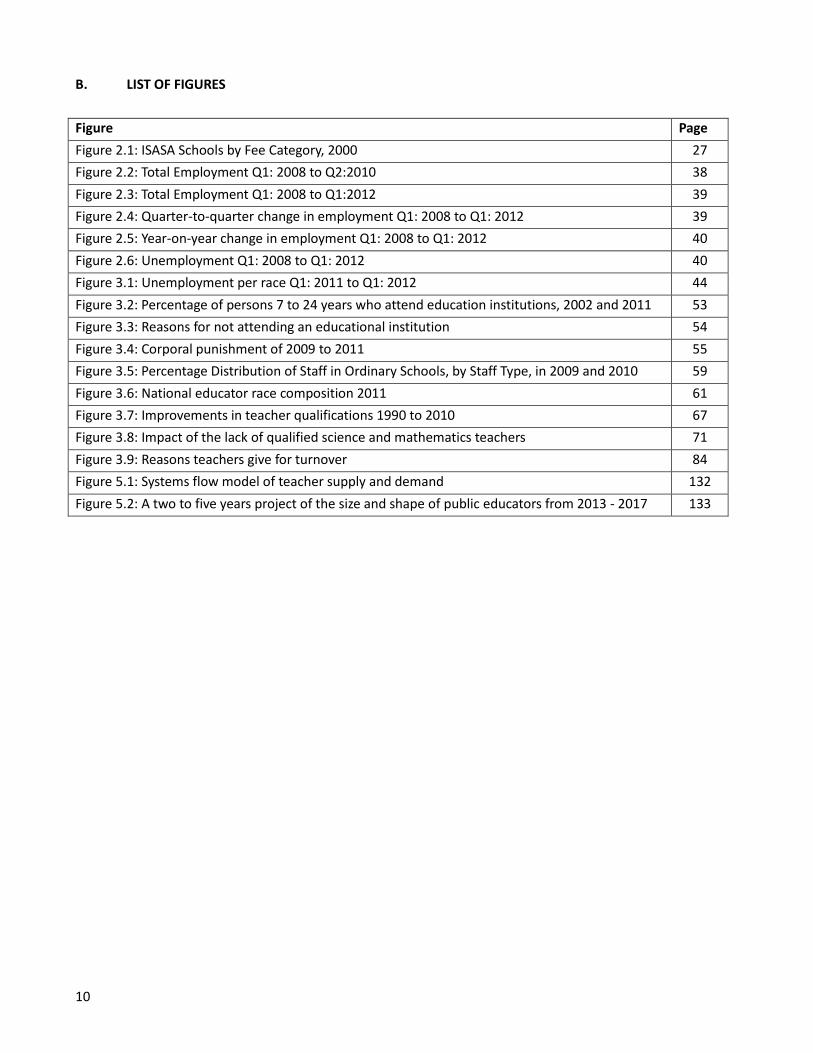
B. LIST OF FIGURES
Figure Page
Figure 2.1: ISASA Schools by Fee Category, 2000 27
Figure 2.2: Total Employment Q1: 2008 to Q2:2010 38
Figure 2.3: Total Employment Q1: 2008 to Q1:2012 39
Figure 2.4: Quarter-to-quarter change in employment Q1: 2008 to Q1: 2012 39
Figure 2.5: Year-on-year change in employment Q1: 2008 to Q1: 2012 40
Figure 2.6: Unemployment Q1: 2008 to Q1: 2012 40
Figure 3.1: Unemployment per race Q1: 2011 to Q1: 2012 44
Figure 3.2: Percentage of persons 7 to 24 years who attend education institutions, 2002 and 2011 53
Figure 3.3: Reasons for not attending an educational institution 54
Figure 3.4: Corporal punishment of 2009 to 2011 55
Figure 3.5: Percentage Distribution of Staff in Ordinary Schools, by Staff Type, in 2009 and 2010 59
Figure 3.6: National educator race composition 2011 61
Figure 3.7: Improvements in teacher qualifications 1990 to 2010 67
Figure 3.8: Impact of the lack of qualified science and mathematics teachers 71
Figure 3.9: Reasons teachers give for turnover 84
Figure 5.1: Systems flow model of teacher supply and demand 132
Figure 5.2: A two to five years project of the size and shape of public educators from 2013 - 2017 133
11
Chapter 1: Overview of Schooling Sector
1.1 Introduction
Given our South African context, and history, there exists a need for an experiential learning system which
encompasses the formal processes for better learning and skills, as provided by the full and part qualifications
on the National Qualifications Framework (NQF). The nation’s learning and development process acknowledges
that Education and Training policy and provision has always been a contentious area. Public policy measures
have resulted in strong expectations from the education system. Symbolically, this change of ethos became the
dominant modus operandi soon after the democratic elections of 1994. Practically, the implications of the shift
are still unravelling. It is not only the implications of the new dispensation which will secure attention, but the
full spectrum of school workplace demands which will occupy attention in the broader considerations of skills
development.
It is evident that the pre-1994 South African scenario of deliberate institutional and human fragmentation and
separation is being addressed in all its complex manifestations. Since Apartheid hegemony was so pervasive,
redress is slow. Change is also made more difficult because of the unique nature of our society and the intricate
webs of statutory oppressions. A kind of constructed (albeit unreal) reality has been inserted into the social
fabric of what remains a very “strange” society, resulting in a submerged “othering” which remains a potent
and negative force. This has resulted in a society described as 'African in spirit, Eastern by insertion and
European by design'. And each of these powerful cultural impetuses has contributed to a vast crucible of
contradictory and often warring nation builders, subtended generally by a European power structure and, of
more recent origin, by the sweep of globalisation.
The fact that our country has at times experienced relative workplace peace is not a symptom of a meeting of
minds and cultures, but rather a response to the spectre of poverty which haunts an overwhelming percentage
of South Africans, especially those who live below subsistence level. In a country which has been subjected to
one of the most systematic historical skewing in recent history, it is clear that history itself would be set adrift in
the kind of political technology which is built on specially nuanced and selected signifieds. This results in
continuing subscriptions to the wrong referents, in the relocation of wrong or misleading referents by
bedevilling the referential map with all kinds of prejudices, submersions, silences, marginalisations,
estrangements, and even persecution.
The conceptual blind-spot in some research work, dealing with skills auditing and acquisition, is either the
marginal or even non-existent reference to development and support systems, especially in the South African
context. A concomitant result of this, without devaluing the role of procedures in the education and service
industries, is the grafting on of the industrial metaphor of product and machine output as eminently human
activities, intentions and processes. The globalisation of the world economy undoubtedly impacts on the way
our fledgling post-Apartheid democracy interfaces with the world. This is expressed in how we develop our
human resources to mediate, at best, or manage, at least, the so-called Big Capital. What needs reclaiming in
the education, training and service industries, however, is the empowerment of the individual as a voluntary
change agent, capable of using intentionality (will) and reciprocity (response to change) in order to
operationalise or realise the vision and mission of skills development in the South African context.
12
There have been and continue to be many government interventions to reverse the massive negative impact of
Apartheid. One of them has been the establishing of Sector Education and Training Authorities (SETAs) whose
list of functions is outlined in Chapter 3 Section 10 of the Skills Development Act (1998). One of the functions is
to develop and implement a sector skills plan which forms the delivery vehicle of the framework of the national
skills development strategy.
According to the Framework for the National Skills Development Strategy 2011/12 – 2015/16, Sector Skills Plans
are five-year Sector Education and Training Skills Development reports prepared by Sector Education and
Training Authorities (SETAs), aimed at identifying:
The skills needs of industry / economic sectors (skills shortages, skills gaps and skills supply) based on the
standard industrial classification codes allocated to each individual SETA by the Minister in the SETA
establishment and re-certification process;
Possibilities and constraints in the effective utilisation and development of skills in relation to government’s
priorities and the objectives of the Human Resource Development Strategy (HRDS), the National Skills
Development Strategy (NSDS), Provincial Growth and Development Strategies (including major projects)
and relevant industry / economic strategies.
This report will therefore respond to some of the issues mentioned above and will continue to project a
contemporary picture of the state of schooling within the education systems. But more precisely in the
conceptual sections, propose a future methodology that allows the sector the ability to make future projections
and scenario building in order to be proactive in responding to challenges in the education system.
1.2 Research Design
1.2.1 Introduction
It is well known, from numerous research reports, what we are in desperate need of a comprehensive and
cross-sectoral grade R-12 vision, mission and action plan, built on the foundation of a legitimate education data
system. The overall intent of this data system should be to provide stakeholders with information that
addresses critical questions about teacher supply and demand and therefore the skills development gaps
among teachers, as well as learner progress in relation to teacher competence and the delivery of quality
education in South Africa. This report therefore incorporates data that allows the SETA to address the research
questions identified in the literature for teacher up-skilling, re-skilling, supply and demand; through the study
conducted in this project.
The following steps were identified:
1. The identification of a priority list of research questions the DBE data system should provide SETA with the
capacity to address;
2. A gap analysis comparing the current status of the DBE’s data system with the information needs associated
with the research questions; and
13
3. A technical capabilities gap analysis at the classroom level to help ensure that data from the DBE’s
longitudinal data system is accessible to key stakeholders including principals, teachers, and other district
leaders.
The methodology for identifying critical research questions included:
1. A review of ETDP SETA documentation describing the vision for the data system, with its primary
objectives to have information on the quality and number of the educator workforce in all its different
dimensions, as well as the ability to monitor and analyse training costs; provide for financial integrity and
accountability; and have the capability to link across these various data components by class, by phase, by
teacher, by school, by district, and comprehensively at the national level.
2. A review of the literature on longitudinal data systems that included the publications and policy briefs
produced by the SETA and the national and parastatal departments over the past few years, as well as other
pertinent resources on data use at multiple levels of the education system. The national literature also
highlighted the types of questions that high quality state data systems should enable multiple stakeholders
to address.
3. Interviews with two provincial (Western Cape and KwaZulu-Natal provinces) as well as national
(Department of Basic Education) stakeholder group representatives identified by the lead researcher. The
interview process provided an overall indication of stakeholders’ beliefs and understanding about the most
important types of data the system should provide. Frequently cited areas focused on measuring learner
progress, longitudinal learner growth and accurately determining dropout rates, teacher quality and
preparation, teacher impact on learners, funding allocations, and the ability to determine programme
outcomes.
4. A survey of district, school, and provincial representatives through the distribution of a generic
questionnaire, with specific focus on schooling issues and challenges. The survey process represented the
final stage of identifying the high priority research questions for the SETA’s data system. Across the two (2)
sample provinces of the Western Cape (WC) and KwaZulu-Natal (KZN), as well as district, and school
surveys, there were a total of forty (40) questionnaires that reflected SETA’s priorities.
The methodology for identifying the data system gaps centered on two primary activities:
1. Interviews and discussions with key stakeholders at strategic, managerial and operational levels at the
Department of Basic Education (DBE), WC and KZN Department of Education (DoE). This activity created a
detailed recording process and transcripts for qualitative ethnographic analysis in order to detect emerging
themes and patterns.
2. Distribution of survey questionnaires and data collection through e-mailing participants who responded to
the cellular phone SMS use to verify their contact details, as well as the uploading of data with a view to
facilitate statistical analysis.
14
1.2.2 Stakeholder Interviews
At the start of the project, EMU developed a list of internal stakeholders to participate in the interview process.
Interviews were conducted with each of the stakeholders to gather information about their use and need for
data, with particular focus on the need for a teacher supply and demand framework. These interviews were
conducted on 6-7 September 2012 with the WC DoE, on 9-10 September with KZN DoE stakeholders, and on
12-13 September 2012 with the DBE representatives. The eight (8) interviewees consisted primarily of
individuals within the respective provinces and DBE who are members of the Human Resources Division for
managerial and operational responses, and the Heads of Departments (Superintendents) for strategic
responses. As “Data Stewards” and “Data Owners,” this group represented Human Resources (HR) and other
related sectors including student, educator, financial, and cross-sectional reporting. The team also played
critical roles in providing system and data expertise throughout the process. For a complete list of interviewees
from the two provinces and the Department of Basic Education, see Appendix A.
The interview protocol included an explanation of the goals of the project and questions about the
interviewee’s sources and uses of data, with specific focus on the key questions those interviewees were asked
but were unable to address in detail due to lack of data or data connections, and validation of existing
documented metadata. The nature of the questions and the synthesisation of responses and recommendations
will be covered in detail within the teacher supply and demand session, which includes the project description
and interview protocol given to all interviewees.
All interviews were conducted face-to-face. The lead researcher set the context for the interview and led a brief
introduction to the data’s place, value and function at the start of each interview. The interview was video
recorded as the session was in progress, to help ensure the accuracy and timeliness of the information
transcription. The interviews provided a critical opportunity to validate and refine data. Follow-up information
including the incorporation of additional data elements, systems or collections, as well as the synthesis and
integration of the notes, was facilitated following the interview. The lead researcher followed-up with several
individuals to clarify specific points identified as quotations and paraphrasing and gathered additional
information.
Due to the open-ended nature of the interviews, each one was different and focused on the unique aspects of
their context; namely their strategic, managerial and operational intervention role. This allowed the interviewer
to more thoroughly discuss the area of greatest interest or importance to the interviewees. The notes and
metadata from these interviews were captured in the transcript.
1.3 Limitations
This section will cover three domains of limitations, namely (i) those limitations which we announce and
thereafter explain the importance of, (ii) those limitations we intend to reflect on in terms of their nature, and
then subsequently use to justify the choices we made to minimise the impact, and (iii) those limitations we
analysed in order to suggest how they can be minimised or overcome in future research processes.
15
1.3.1 Announcing limitations
There are many limitations that we faced within this research process. The majority of which are listed in
chapter five, which include both research and content gaps. The limitations that will be discussed within this
section focus on those that had the greatest impact on the quality of the recommendations, as well as our
ability to effectively respond to the research requirements as stated in the contractual agreement.
Some of the limitations are regarded as potential ones, since we do not know the degree to which these
different factors limited our recommendations or our ability to effectively respond to the contractual
agreements. For example, we know that when we adopted a survey research design, a failure to use this
sampling technique significantly limits our ability to make broader generalisations for our results, i.e. our ability
to make statistical inferences from our sample to the population being investigated, let alone what the
response rate among a constituency that has never submitted such data collection reports will be. However,
the degree to which this will reduce the quality of our recommendations is a matter of debate. While the
limitation indicated above is a very obvious research limitation, other limitations are more obscure within the
research process. Therefore, we will focus on those limitations that had the greatest impact on our
recommendations, as well as our ability to respond to the research requirements.
The current data collection process and instruments need to be scrutinised since they are not synthesised with
the data requirements in the report. The majority of data from the survey is historical, and a one-year glimpse
into what happened. To understand the trend and patterns within skills development and the response to the
skills gaps, multiple years must be included in order to allow comparative analyses. Furthermore, if purposeful
sampling is applied, then data from previous years can be utilised, but not in the random process followed in
this year’s report.
1.3.2 Reflecting limitations
The limitations announced above can be reduced or eliminated when the data collection instrument is more
specific in nature, as in relation to the sub-sector under research, i.e. schooling, as well as if we synchronise the
skeleton requirements of the SSP report as captured in the contractual agreement with the data fields
contained in the survey instrument. A big portion of the data fields are qualitative in nature, and therefore it
gives the researchers no opportunity to contrast or compare due to the different responses.
The strengthening of the sample size among the public and independent schools will assist the researchers to
triangulate the skills gaps submitted by the provincial departments with those from schools within the given
province. However, for the purpose of this report, despite the small sample size, there is a close correlation
between the broad needs identified at national and provincial level, with that of the individual schools.
16
1.3.3 Forward looking limitations
These limitations are adequately covered in the section of recommendations related to short, medium and long
term improvements in the research process, in chapter five. However, we can state that the response to the
recommendations will only contribute to the improvement in quality of the research at hand. In particular, it
will respond to the internal and external validity of this report, clarify and respond to the extraneous and
confounding variables which are outside the control and possible influence of either and/or both the
researchers and the SETA, such as the availability of data sets and the response time, if any, of those of the data
sets agencies.
The construction validity issues will be covered when we deal with the research process and flow
recommendations also in chapter five.
The convergent and divergent validity will be improved when the sample size representative of the population,
as well as when the availability of data and the analysis of it is cemented in the debates and conversations of
the SETA.
Narratives are mostly driven by ‘opinion-based’ conversations and decision making within committees rather
than ‘data-driven’ conversations and decision making.
Finally the content validity of the report will be strengthened when multiple sources of similar and same data
exists and when data sets are not collected in a way that only respond to single user agencies. Moreover , the
placing of data sets within the public domain could enhance the quality of the data sets when these are open
for scrutiny and verification by external and independent respondents. Our current content is dependent on
the meticulousness of the supplier of the data. Any typographical or interpretation errors is difficult to uncover.
17
Chapter 2: Schooling Sector Profile
2.1 Institutional Profile of Schooling
This section will report on the size, shape and scope of the schooling sector, with specific focus on the learners,
educators and schools as institutions, demarcated among the nine provinces in the country. All the data
represented in the report comes from secondary data systems within the government institutions, and
therefore the triangulation of data is not possible at this time due to the lack of integration across various
databases in education.
2.1.1 Introduction
The schooling sub-sector includes both public and independent education. School governing bodies form a
sub-sector of public education. The schooling sub-sector also covers about 60% of the total representation of
the ETDP SETA constituencies and therefore constitutes the largest constituency, in comparison to the 16 other
constituencies represented through various Standards Industrial Classifications (SIC). These constituencies
represent six (6) major ETD designations, namely (i) Research, (ii) Education and Training, (iii) Non-
governmental Organisations, (iv) Trade Unions, (v) Political Parties, and (vi) Libraries.
The schooling sub-sector includes both public and independent education, of which school governing bodies
form a sub-sector of both mentioned. Due to the current method and nature of data collection and analysis,
the school governing body educator component within the public and independent schools is not separated in
order to facilitate the understanding, nature, size and shape of this important component.
2.1.2 Overall view of the schooling sector in South Africa
Education is a fundamental right for all citizens. This right is enshrined in the Bill of Rights of the South African
Constitution, which stipulates that “everyone has a right to basic education, including adult basic education and
further education which the state, through reasonable measures must make progressively available and
accessible” (RSA, 1996).
As far as schooling is concerned, it is the joint responsibility of the Department of Basic Education and
Provincial Departments of Education (PDEs). The Department of Basic Education is responsible for national
policy, norms and standards. The Provincial Departments of Education (PDEs) are responsible for the
implementation of the national mandates. The core legislation governing schooling is: the National Education
Policy Act (NEPA) (1996), the South African Schools Act (SASA) (1996), and the National Curriculum Statements
(NCS) which will be replaced by the Curriculum Assessment Policy Statement (CAPS) as was phased-in from
2011. Each Provincial Department has Provincial Education Acts and regulations.
The schooling sector is made up of learners who are taught by teachers. These teachers are managed by
departmental officials. The data on learners is detailed, while the data of teachers and officials are combined
within a category called ‘educators’. There is no clear separation of the different levels of educators working
within the sector, i.e. classroom based, heads of departments, deputy principals, principals, subject and
institutional specialist, district, provincial and national officials.
18
As indicated earlier, there are two types of schools in South Africa; namely public and independent schools.
Public schools are controlled by the government through the education departments, while independent
schools are controlled by privately-owned individuals and/or structures. Although independent schools are
privately controlled, they have to be registered with the relevant provincial departments where they are
located and comply with the various education regulations and policies which are prescribed to all learners,
teachers and schools. There is, however, some flexibility and freedom granted to independent schools.
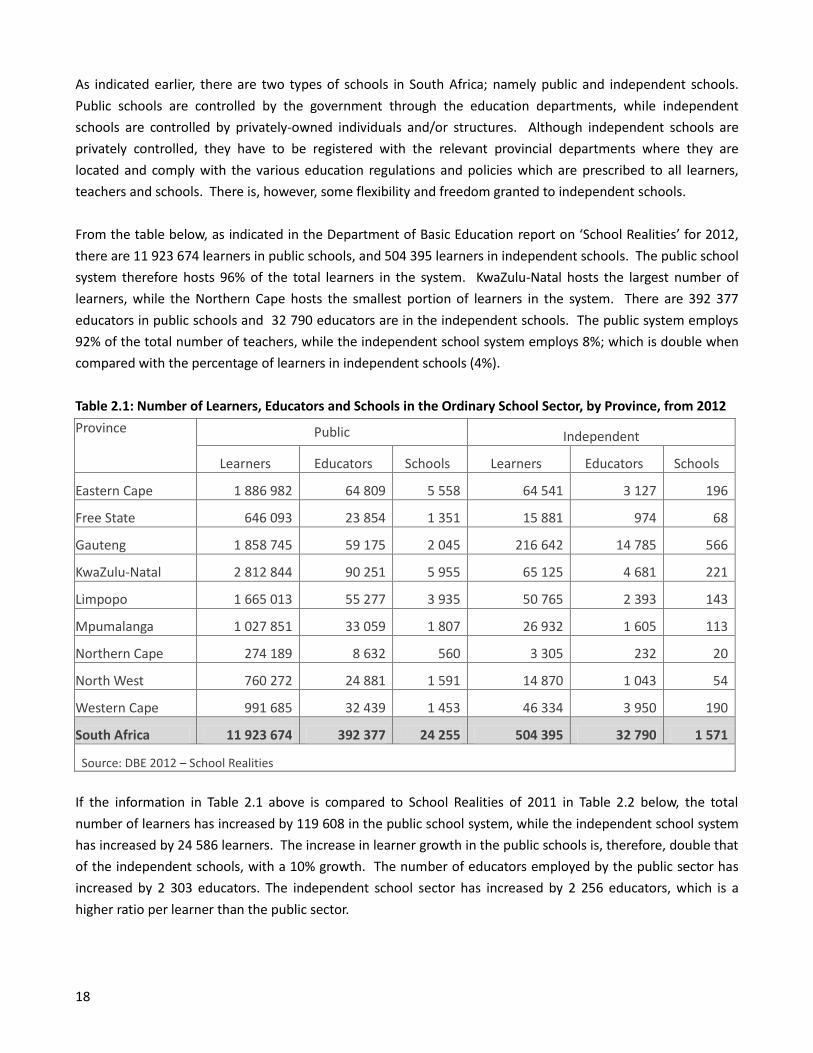
From the table below, as indicated in the Department of Basic Education report on ‘School Realities’ for 2012,
there are 11 923 674 learners in public schools, and 504 395 learners in independent schools. The public school
system therefore hosts 96% of the total learners in the system. KwaZulu-Natal hosts the largest number of
learners, while the Northern Cape hosts the smallest portion of learners in the system. There are 392 377
educators in public schools and 32 790 educators are in the independent schools. The public system employs
92% of the total number of teachers, while the independent school system employs 8%; which is double when
compared with the percentage of learners in independent schools (4%).
Table 2.1: Number of Learners, Educators and Schools in the Ordinary School Sector, by Province, from 2012
Province Public Independent
Learners Educators Schools Learners Educators Schools
Eastern Cape 1 886 982 64 809 5 558 64 541 3 127 196
Free State 646 093 23 854 1 351 15 881 974 68
Gauteng 1 858 745 59 175 2 045 216 642 14 785 566
KwaZulu-Natal 2 812 844 90 251 5 955 65 125 4 681 221
Limpopo 1 665 013 55 277 3 935 50 765 2 393 143
Mpumalanga 1 027 851 33 059 1 807 26 932 1 605 113
Northern Cape 274 189 8 632 560 3 305 232 20
North West 760 272 24 881 1 591 14 870 1 043 54
Western Cape 991 685 32 439 1 453 46 334 3 950 190
South Africa 11 923 674 392 377 24 255 504 395 32 790 1 571
Source: DBE 2012 – School Realities
If the information in Table 2.1 above is compared to School Realities of 2011 in Table 2.2 below, the total
number of learners has increased by 119 608 in the public school system, while the independent school system
has increased by 24 586 learners. The increase in learner growth in the public schools is, therefore, double that
of the independent schools, with a 10% growth. The number of educators employed by the public sector has
increased by 2 303 educators. The independent school sector has increased by 2 256 educators, which is a
higher ratio per learner than the public sector.
19
Table 2.2: Number of Learners, Educators and Schools in Ordinary School Sector, by Province, from 2011
Province
Public Independent Public and Independent
Lear
ne
rs
Edu
cato
rs
Sch
oo
ls
Lear
ne
rs
Edu
cato
rs
Sch
oo
ls
Lear
ne
rs
As
% o
f N
atio
nal
Tota
l
Edu
cato
rs
As
% o
f N
atio
nal
Tota
l
Sch
oo
ls
As
% o
f N
atio
nal
Tota
l
Eastern Cape 1 910 265 65 861 5 589 53 313 2 638 166 1 963 578 16.0 68 499 16.3 5 755 22.3
Free State 641 219 23 203 1 371 16 791 854 66 658 010 5.4 24 057 5.7 1 437 5.6
Gauteng 1 810 197 57 836 2 040 207 734 13 696 519 2 017 931 16.4 71 532 17.0 2 559 9.9
KwaZulu-Natal 2 781 830 88 710 5 957 65 548 4 556 223 2 847 378 23.2 93 266 22.2 6 180 23.9
Limpopo 1 645 746 55 672 3 931 49 778 2 344 142 1 695 524 13.8 58 016 13.8 4 073 15.8
Mpumalanga 1 021 722 33 126 1 821 24 829 1 497 110 1 046 551 8.5 34 623 8.2 1 931 7.5
Northern Cape 271 474 8 664 591 3 271 235 20 274 745 2.2 8 899 2.1 611 2.4
North West 751 294 24 965 1 614 13 826 932 55 765 120 6.2 25 897 6.2 1 669 6.5
Western Cape 970 319 32 037 1 451 44 719 3 782 185 1 015 038 8.3 35 819 8.5 1 636 6.3
South Africa 11 804 066 390 074 24 365 479 809 30 534 1 486 12 283 875 100 420 608 100 25 851 100
Source: DBE 2011 – School Realities
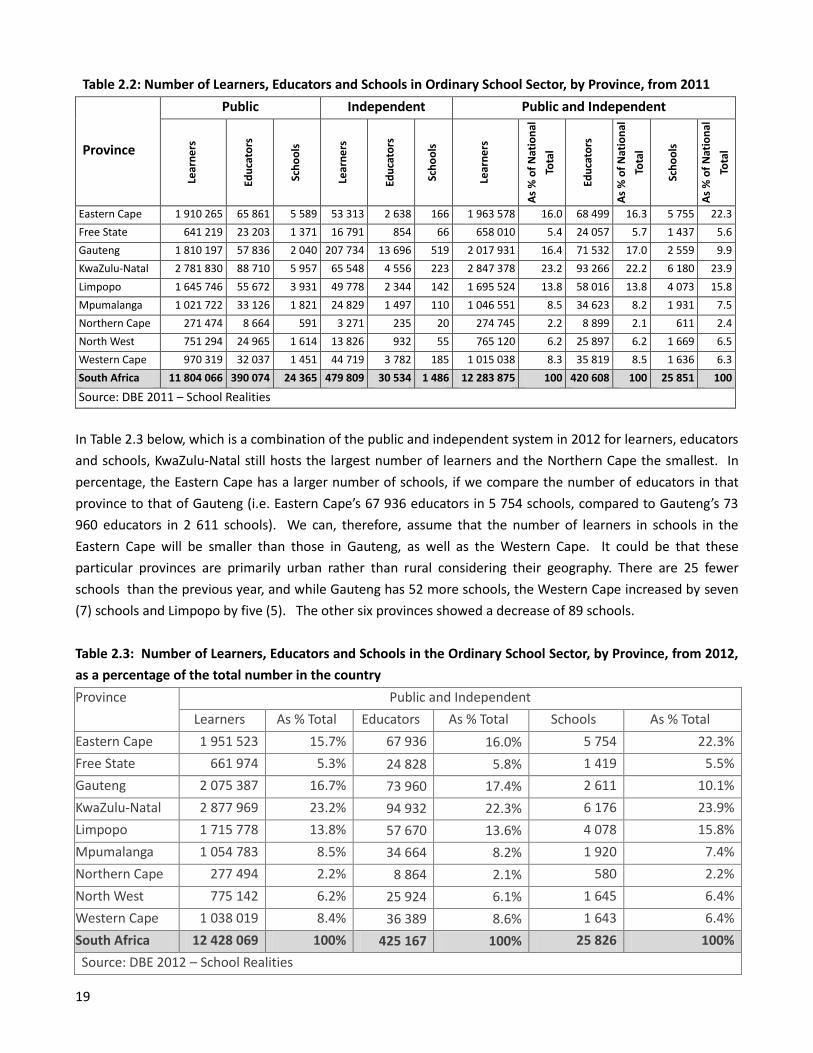
In Table 2.3 below, which is a combination of the public and independent system in 2012 for learners, educators
and schools, KwaZulu-Natal still hosts the largest number of learners and the Northern Cape the smallest. In
percentage, the Eastern Cape has a larger number of schools, if we compare the number of educators in that
province to that of Gauteng (i.e. Eastern Cape’s 67 936 educators in 5 754 schools, compared to Gauteng’s 73
960 educators in 2 611 schools). We can, therefore, assume that the number of learners in schools in the
Eastern Cape will be smaller than those in Gauteng, as well as the Western Cape. It could be that these
particular provinces are primarily urban rather than rural considering their geography. There are 25 fewer
schools than the previous year, and while Gauteng has 52 more schools, the Western Cape increased by seven
(7) schools and Limpopo by five (5). The other six provinces showed a decrease of 89 schools.
Table 2.3: Number of Learners, Educators and Schools in the Ordinary School Sector, by Province, from 2012,
as a percentage of the total number in the country
Province Public and Independent
Learners As % Total Educators As % Total Schools As % Total
Eastern Cape 1 951 523 15.7% 67 936 16.0% 5 754 22.3%
Free State 661 974 5.3% 24 828 5.8% 1 419 5.5%
Gauteng 2 075 387 16.7% 73 960 17.4% 2 611 10.1%
KwaZulu-Natal 2 877 969 23.2% 94 932 22.3% 6 176 23.9%
Limpopo 1 715 778 13.8% 57 670 13.6% 4 078 15.8%
Mpumalanga 1 054 783 8.5% 34 664 8.2% 1 920 7.4%
Northern Cape 277 494 2.2% 8 864 2.1% 580 2.2%
North West 775 142 6.2% 25 924 6.1% 1 645 6.4%
Western Cape 1 038 019 8.4% 36 389 8.6% 1 643 6.4%
South Africa 12 428 069 100% 425 167 100% 25 826 100%
Source: DBE 2012 – School Realities
20
2.1.3 Learners in the schooling sector
The schooling sector comprises of public and independent school learners and this report does not include
‘special needs learners’, or more often referred to as ‘special needs education’ (SNE) due to limited data
available in this area.
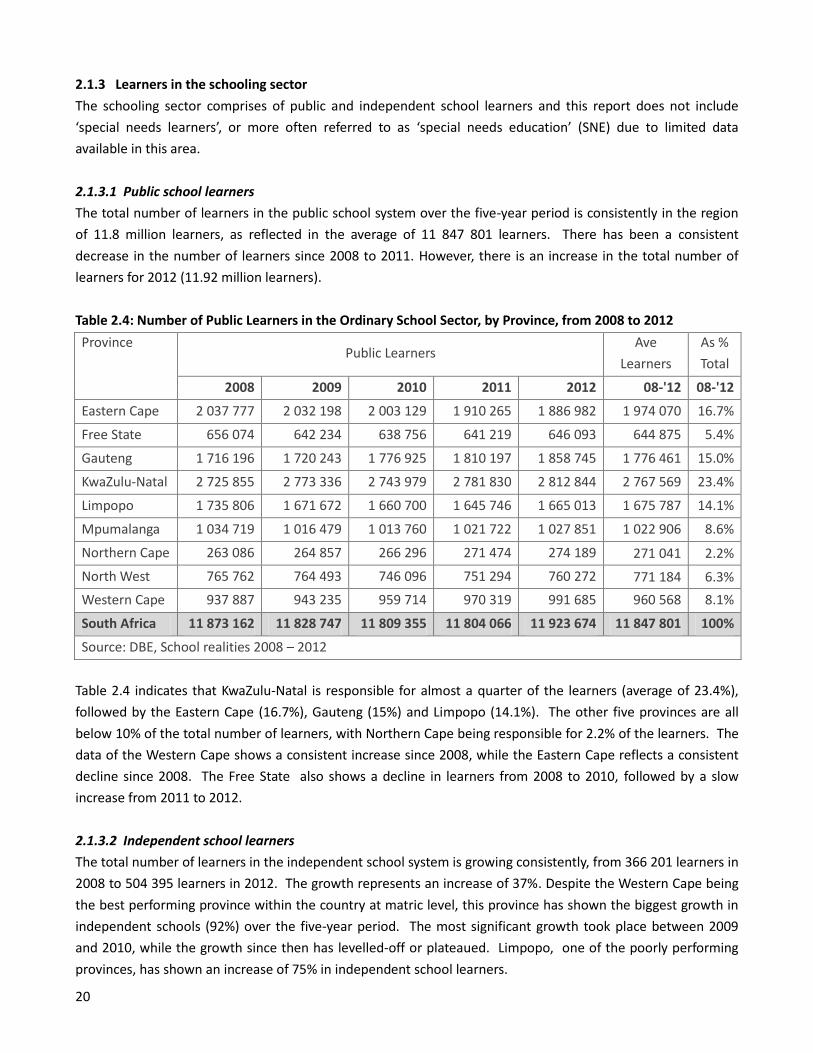
2.1.3.1 Public school learners
The total number of learners in the public school system over the five-year period is consistently in the region
of 11.8 million learners, as reflected in the average of 11 847 801 learners. There has been a consistent
decrease in the number of learners since 2008 to 2011. However, there is an increase in the total number of
learners for 2012 (11.92 million learners).
Table 2.4: Number of Public Learners in the Ordinary School Sector, by Province, from 2008 to 2012
Province Public Learners
Ave
Learners
As %
Total
2008 2009 2010 2011 2012 08-'12 08-'12
Eastern Cape 2 037 777 2 032 198 2 003 129 1 910 265 1 886 982 1 974 070 16.7%
Free State 656 074 642 234 638 756 641 219 646 093 644 875 5.4%
Gauteng 1 716 196 1 720 243 1 776 925 1 810 197 1 858 745 1 776 461 15.0%
KwaZulu-Natal 2 725 855 2 773 336 2 743 979 2 781 830 2 812 844 2 767 569 23.4%
Limpopo 1 735 806 1 671 672 1 660 700 1 645 746 1 665 013 1 675 787 14.1%
Mpumalanga 1 034 719 1 016 479 1 013 760 1 021 722 1 027 851 1 022 906 8.6%
Northern Cape 263 086 264 857 266 296 271 474 274 189 271 041 2.2%
North West 765 762 764 493 746 096 751 294 760 272 771 184 6.3%
Western Cape 937 887 943 235 959 714 970 319 991 685 960 568 8.1%
South Africa 11 873 162 11 828 747 11 809 355 11 804 066 11 923 674 11 847 801 100%
Source: DBE, School realities 2008 – 2012
Table 2.4 indicates that KwaZulu-Natal is responsible for almost a quarter of the learners (average of 23.4%),
followed by the Eastern Cape (16.7%), Gauteng (15%) and Limpopo (14.1%). The other five provinces are all
below 10% of the total number of learners, with Northern Cape being responsible for 2.2% of the learners. The
data of the Western Cape shows a consistent increase since 2008, while the Eastern Cape reflects a consistent
decline since 2008. The Free State also shows a decline in learners from 2008 to 2010, followed by a slow
increase from 2011 to 2012.
2.1.3.2 Independent school learners
The total number of learners in the independent school system is growing consistently, from 366 201 learners in
2008 to 504 395 learners in 2012. The growth represents an increase of 37%. Despite the Western Cape being
the best performing province within the country at matric level, this province has shown the biggest growth in
independent schools (92%) over the five-year period. The most significant growth took place between 2009
and 2010, while the growth since then has levelled-off or plateaued. Limpopo, one of the poorly performing
provinces, has shown an increase of 75% in independent school learners.
21
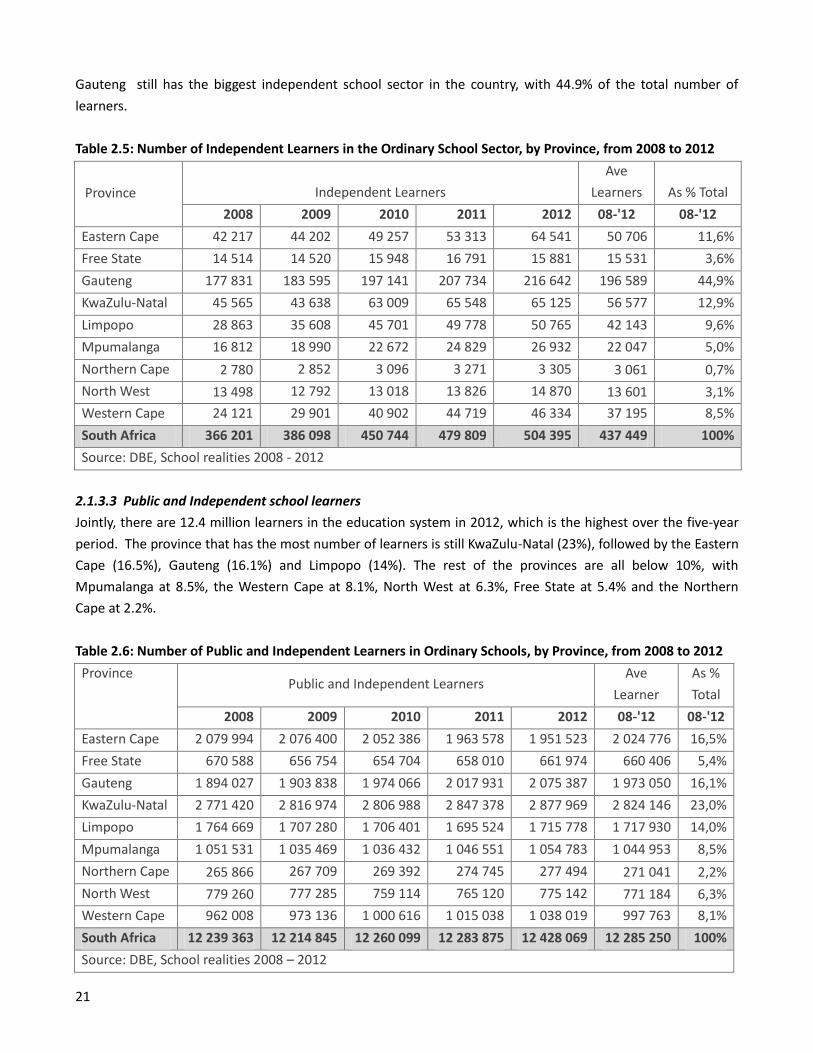
Gauteng still has the biggest independent school sector in the country, with 44.9% of the total number of
learners.
Table 2.5: Number of Independent Learners in the Ordinary School Sector, by Province, from 2008 to 2012
Province
Independent Learners
Ave
Learners As % Total
2008 2009 2010 2011 2012 08-'12 08-'12
Eastern Cape 42 217 44 202 49 257 53 313 64 541 50 706 11,6%
Free State 14 514 14 520 15 948 16 791 15 881 15 531 3,6%
Gauteng 177 831 183 595 197 141 207 734 216 642 196 589 44,9%
KwaZulu-Natal 45 565 43 638 63 009 65 548 65 125 56 577 12,9%
Limpopo 28 863 35 608 45 701 49 778 50 765 42 143 9,6%
Mpumalanga 16 812 18 990 22 672 24 829 26 932 22 047 5,0%
Northern Cape 2 780 2 852 3 096 3 271 3 305 3 061 0,7%
North West 13 498 12 792 13 018 13 826 14 870 13 601 3,1%
Western Cape 24 121 29 901 40 902 44 719 46 334 37 195 8,5%
South Africa 366 201 386 098 450 744 479 809 504 395 437 449 100%
Source: DBE, School realities 2008 - 2012
2.1.3.3 Public and Independent school learners
Jointly, there are 12.4 million learners in the education system in 2012, which is the highest over the five-year
period. The province that has the most number of learners is still KwaZulu-Natal (23%), followed by the Eastern
Cape (16.5%), Gauteng (16.1%) and Limpopo (14%). The rest of the provinces are all below 10%, with
Mpumalanga at 8.5%, the Western Cape at 8.1%, North West at 6.3%, Free State at 5.4% and the Northern
Cape at 2.2%.
Table 2.6: Number of Public and Independent Learners in Ordinary Schools, by Province, from 2008 to 2012
Province Public and Independent Learners
Ave
Learner
As %
Total
2008 2009 2010 2011 2012 08-'12 08-'12
Eastern Cape 2 079 994 2 076 400 2 052 386 1 963 578 1 951 523 2 024 776 16,5%
Free State 670 588 656 754 654 704 658 010 661 974 660 406 5,4%
Gauteng 1 894 027 1 903 838 1 974 066 2 017 931 2 075 387 1 973 050 16,1%
KwaZulu-Natal 2 771 420 2 816 974 2 806 988 2 847 378 2 877 969 2 824 146 23,0%
Limpopo 1 764 669 1 707 280 1 706 401 1 695 524 1 715 778 1 717 930 14,0%
Mpumalanga 1 051 531 1 035 469 1 036 432 1 046 551 1 054 783 1 044 953 8,5%
Northern Cape 265 866 267 709 269 392 274 745 277 494 271 041 2,2%
North West 779 260 777 285 759 114 765 120 775 142 771 184 6,3%
Western Cape 962 008 973 136 1 000 616 1 015 038 1 038 019 997 763 8,1%
South Africa 12 239 363 12 214 845 12 260 099 12 283 875 12 428 069 12 285 250 100%
Source: DBE, School realities 2008 – 2012
22
KwaZulu-Natal and the Eastern Cape share an average of more than 2 million learners over the past 5 years,
while Gauteng, Limpopo and Mpumalanga have over 1 million learners. KwaZulu-Natal has more than 10 times
more learners than the Northern Cape.
2.1.4 Educators in the schooling sector
The schooling sector consists of public and independent school educators, while both of these sectors will
supplement their government-paid educators with additional educators paid for by the School Governing
Bodies (SBGs). The emergence and contributions of SGB-paid educators will be discussed separately.
Furthermore, reference to “public school educators” and “independent school educators” is an indication that
these educators are appointed permanently in substantive posts, for which the school receives a subsidy as in
the case of independent schools, or the educator is on the pay-roll of the government as in the case of public
schools.
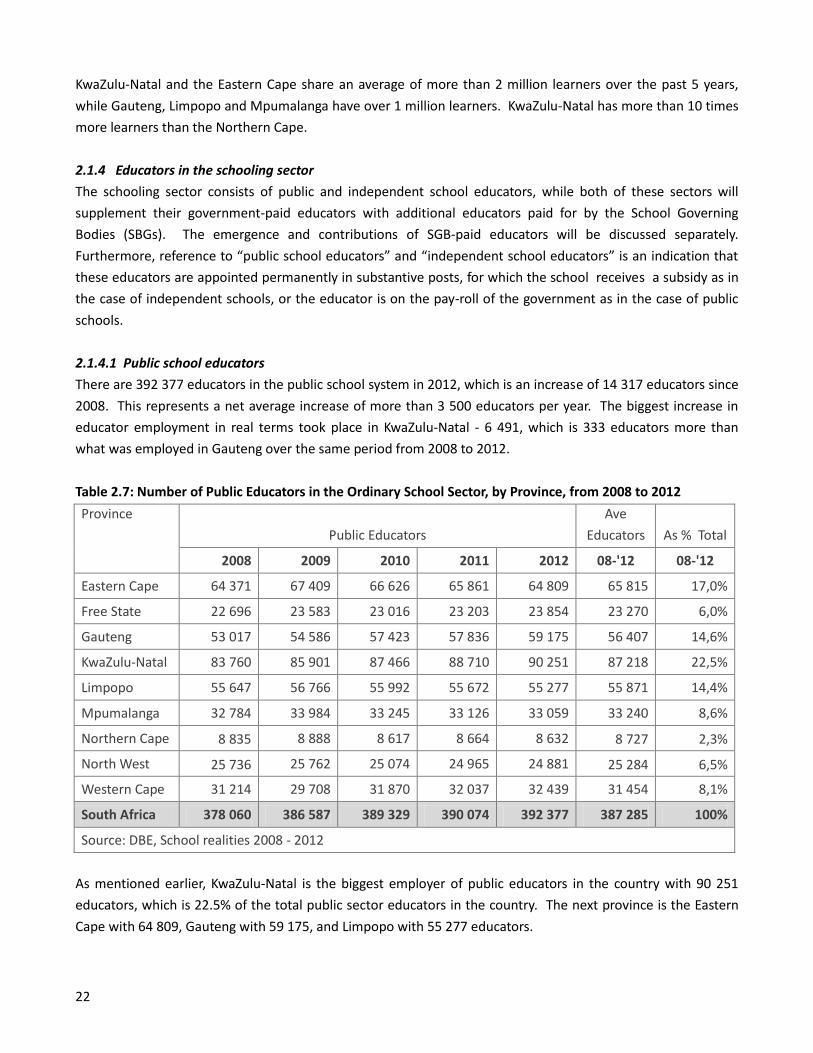
2.1.4.1 Public school educators
There are 392 377 educators in the public school system in 2012, which is an increase of 14 317 educators since
2008. This represents a net average increase of more than 3 500 educators per year. The biggest increase in
educator employment in real terms took place in KwaZulu-Natal - 6 491, which is 333 educators more than
what was employed in Gauteng over the same period from 2008 to 2012.
Table 2.7: Number of Public Educators in the Ordinary School Sector, by Province, from 2008 to 2012
Province
Public Educators
Ave
Educators As % Total
2008 2009 2010 2011 2012 08-'12 08-'12
Eastern Cape 64 371 67 409 66 626 65 861 64 809 65 815 17,0%
Free State 22 696 23 583 23 016 23 203 23 854 23 270 6,0%
Gauteng 53 017 54 586 57 423 57 836 59 175 56 407 14,6%
KwaZulu-Natal 83 760 85 901 87 466 88 710 90 251 87 218 22,5%
Limpopo 55 647 56 766 55 992 55 672 55 277 55 871 14,4%
Mpumalanga 32 784 33 984 33 245 33 126 33 059 33 240 8,6%
Northern Cape 8 835 8 888 8 617 8 664 8 632 8 727 2,3%
North West 25 736 25 762 25 074 24 965 24 881 25 284 6,5%
Western Cape 31 214 29 708 31 870 32 037 32 439 31 454 8,1%
South Africa 378 060 386 587 389 329 390 074 392 377 387 285 100%
Source: DBE, School realities 2008 - 2012
As mentioned earlier, KwaZulu-Natal is the biggest employer of public educators in the country with 90 251
educators, which is 22.5% of the total public sector educators in the country. The next province is the Eastern
Cape with 64 809, Gauteng with 59 175, and Limpopo with 55 277 educators.
23
The Eastern Cape shows a steady decline in educator employment since 2009; from 67 409 to 64 809 in 2012.
By contrasts, the Western Cape shows a steady increase since 2009 from 29 708 to 32 439 in 2012.
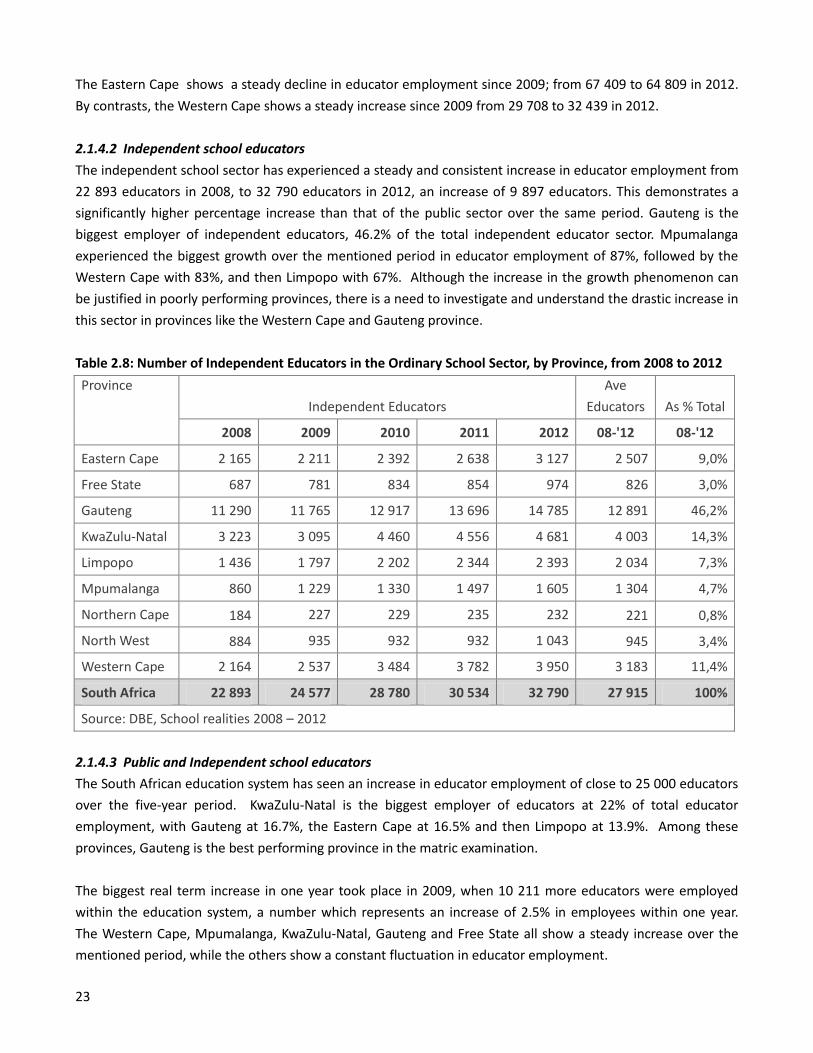
2.1.4.2 Independent school educators
The independent school sector has experienced a steady and consistent increase in educator employment from
22 893 educators in 2008, to 32 790 educators in 2012, an increase of 9 897 educators. This demonstrates a
significantly higher percentage increase than that of the public sector over the same period. Gauteng is the
biggest employer of independent educators, 46.2% of the total independent educator sector. Mpumalanga
experienced the biggest growth over the mentioned period in educator employment of 87%, followed by the
Western Cape with 83%, and then Limpopo with 67%. Although the increase in the growth phenomenon can
be justified in poorly performing provinces, there is a need to investigate and understand the drastic increase in
this sector in provinces like the Western Cape and Gauteng province.
Table 2.8: Number of Independent Educators in the Ordinary School Sector, by Province, from 2008 to 2012
Province
Independent Educators
Ave
Educators As % Total
2008 2009 2010 2011 2012 08-'12 08-'12
Eastern Cape 2 165 2 211 2 392 2 638 3 127 2 507 9,0%
Free State 687 781 834 854 974 826 3,0%
Gauteng 11 290 11 765 12 917 13 696 14 785 12 891 46,2%
KwaZulu-Natal 3 223 3 095 4 460 4 556 4 681 4 003 14,3%
Limpopo 1 436 1 797 2 202 2 344 2 393 2 034 7,3%
Mpumalanga 860 1 229 1 330 1 497 1 605 1 304 4,7%
Northern Cape 184 227 229 235 232 221 0,8%
North West 884 935 932 932 1 043 945 3,4%
Western Cape 2 164 2 537 3 484 3 782 3 950 3 183 11,4%
South Africa 22 893 24 577 28 780 30 534 32 790 27 915 100%
Source: DBE, School realities 2008 – 2012
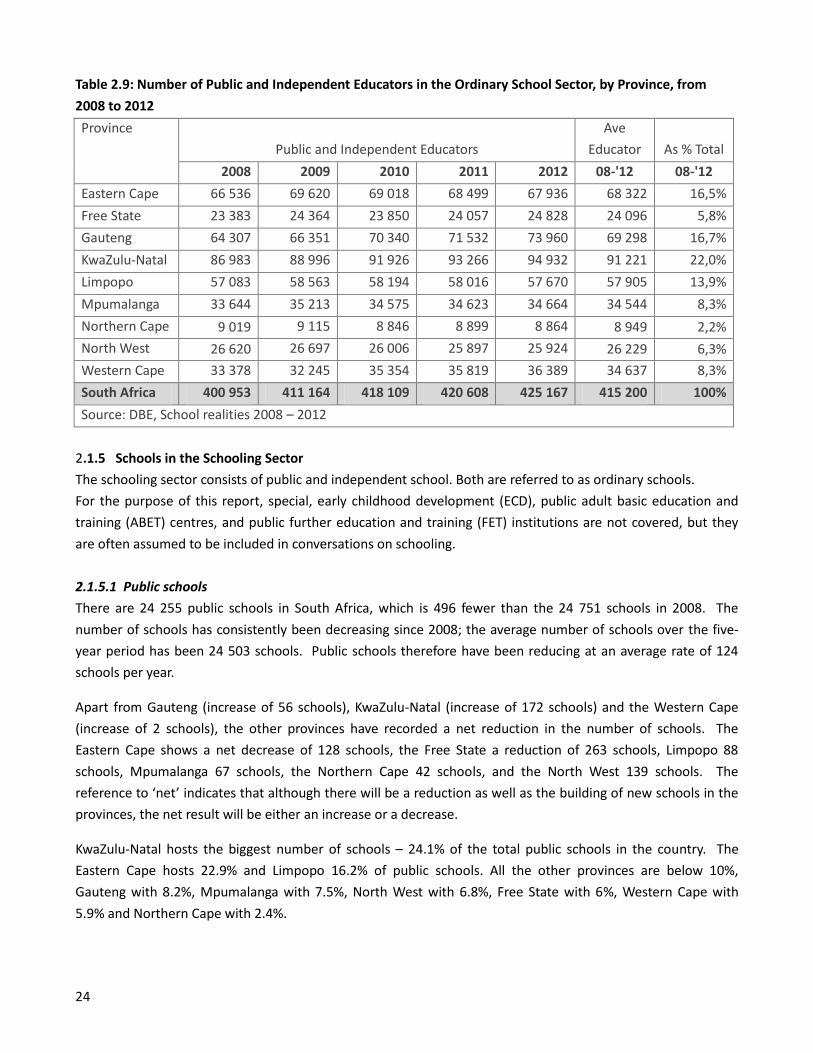
2.1.4.3 Public and Independent school educators
The South African education system has seen an increase in educator employment of close to 25 000 educators
over the five-year period. KwaZulu-Natal is the biggest employer of educators at 22% of total educator
employment, with Gauteng at 16.7%, the Eastern Cape at 16.5% and then Limpopo at 13.9%. Among these
provinces, Gauteng is the best performing province in the matric examination.
The biggest real term increase in one year took place in 2009, when 10 211 more educators were employed
within the education system, a number which represents an increase of 2.5% in employees within one year.
The Western Cape, Mpumalanga, KwaZulu-Natal, Gauteng and Free State all show a steady increase over the
mentioned period, while the others show a constant fluctuation in educator employment.
24
Table 2.9: Number of Public and Independent Educators in the Ordinary School Sector, by Province, from
2008 to 2012
Province
Public and Independent Educators
Ave
Educator As % Total
2008 2009 2010 2011 2012 08-'12 08-'12
Eastern Cape 66 536 69 620 69 018 68 499 67 936 68 322 16,5%
Free State 23 383 24 364 23 850 24 057 24 828 24 096 5,8%
Gauteng 64 307 66 351 70 340 71 532 73 960 69 298 16,7%
KwaZulu-Natal 86 983 88 996 91 926 93 266 94 932 91 221 22,0%
Limpopo 57 083 58 563 58 194 58 016 57 670 57 905 13,9%
Mpumalanga 33 644 35 213 34 575 34 623 34 664 34 544 8,3%
Northern Cape 9 019 9 115 8 846 8 899 8 864 8 949 2,2%
North West 26 620 26 697 26 006 25 897 25 924 26 229 6,3%
Western Cape 33 378 32 245 35 354 35 819 36 389 34 637 8,3%
South Africa 400 953 411 164 418 109 420 608 425 167 415 200 100%
Source: DBE, School realities 2008 – 2012
2.1.5 Schools in the Schooling Sector
The schooling sector consists of public and independent school. Both are referred to as ordinary schools.
For the purpose of this report, special, early childhood development (ECD), public adult basic education and
training (ABET) centres, and public further education and training (FET) institutions are not covered, but they
are often assumed to be included in conversations on schooling.
2.1.5.1 Public schools
There are 24 255 public schools in South Africa, which is 496 fewer than the 24 751 schools in 2008. The
number of schools has consistently been decreasing since 2008; the average number of schools over the five-
year period has been 24 503 schools. Public schools therefore have been reducing at an average rate of 124
schools per year.
Apart from Gauteng (increase of 56 schools), KwaZulu-Natal (increase of 172 schools) and the Western Cape
(increase of 2 schools), the other provinces have recorded a net reduction in the number of schools. The
Eastern Cape shows a net decrease of 128 schools, the Free State a reduction of 263 schools, Limpopo 88
schools, Mpumalanga 67 schools, the Northern Cape 42 schools, and the North West 139 schools. The
reference to ‘net’ indicates that although there will be a reduction as well as the building of new schools in the
provinces, the net result will be either an increase or a decrease.
KwaZulu-Natal hosts the biggest number of schools – 24.1% of the total public schools in the country. The
Eastern Cape hosts 22.9% and Limpopo 16.2% of public schools. All the other provinces are below 10%,
Gauteng with 8.2%, Mpumalanga with 7.5%, North West with 6.8%, Free State with 6%, Western Cape with
5.9% and Northern Cape with 2.4%.
25
Table 2.10: Number of Public Schools in the Ordinary School Sector, by Province, from 2008 to 2012
Province Public Schools Ave Schools As % Total
2008 2009 2010 2011 2012 08-'12 08-'12
Eastern Cape 5 686 5 668 5 588 5 589 5 558 5 618 22,9%
Free State 1 614 1 547 1 422 1 371 1 351 1 461 6,0%
Gauteng 1 989 1 970 2 013 2 040 2 045 2 011 8,2%
KwaZulu-Natal 5 783 5 907 5 927 5 957 5 955 5 906 24,1%
Limpopo 4 023 3 988 3 965 3 931 3 935 3 968 16,2%
Mpumalanga 1 873 1 844 1 838 1 821 1 807 1 837 7,5%
Northern Cape 602 600 597 591 560 590 2,4%
North West 1 730 1 716 1 646 1 614 1 591 1 659 6,8%
Western Cape 1 451 1 453 1 455 1 451 1 453 1 453 5,9%
South Africa 24 751 24 693 24 451 24 365 24 255 24 503 100%
Source: DBE, School Realities from 2008 to 2012
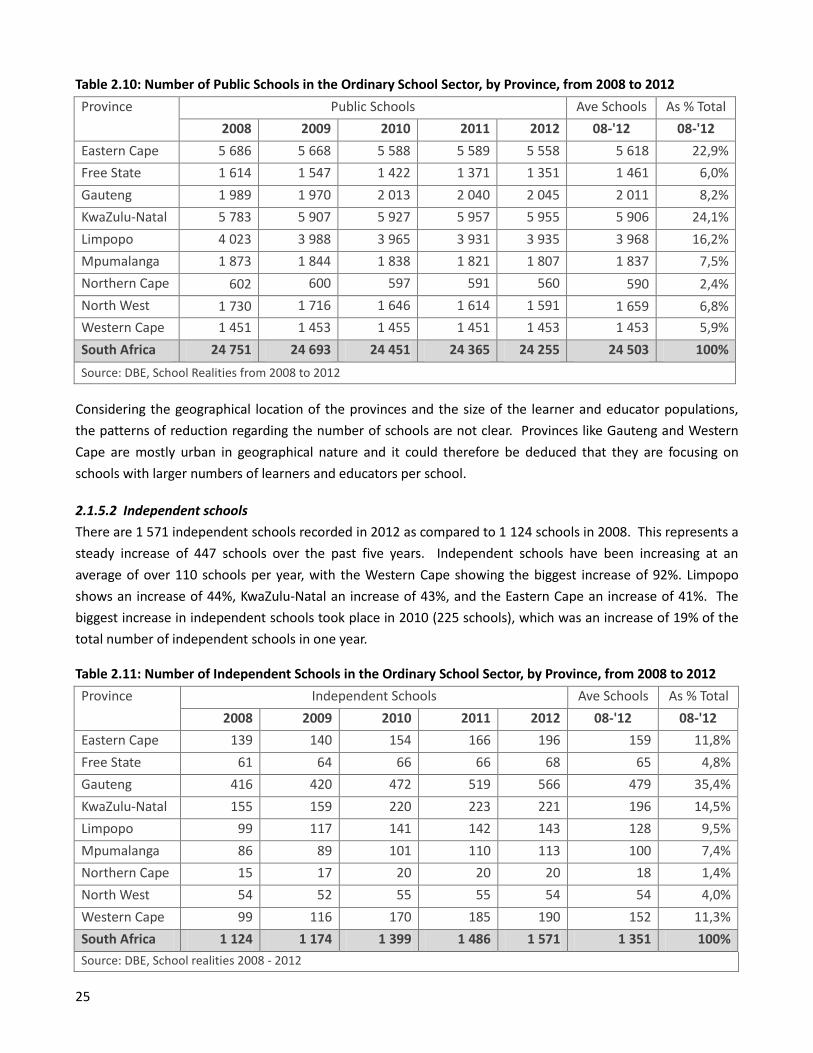
Considering the geographical location of the provinces and the size of the learner and educator populations,
the patterns of reduction regarding the number of schools are not clear. Provinces like Gauteng and Western
Cape are mostly urban in geographical nature and it could therefore be deduced that they are focusing on
schools with larger numbers of learners and educators per school.
2.1.5.2 Independent schools
There are 1 571 independent schools recorded in 2012 as compared to 1 124 schools in 2008. This represents a
steady increase of 447 schools over the past five years. Independent schools have been increasing at an
average of over 110 schools per year, with the Western Cape showing the biggest increase of 92%. Limpopo
shows an increase of 44%, KwaZulu-Natal an increase of 43%, and the Eastern Cape an increase of 41%. The
biggest increase in independent schools took place in 2010 (225 schools), which was an increase of 19% of the
total number of independent schools in one year.
Table 2.11: Number of Independent Schools in the Ordinary School Sector, by Province, from 2008 to 2012
Province Independent Schools Ave Schools As % Total
2008 2009 2010 2011 2012 08-'12 08-'12
Eastern Cape 139 140 154 166 196 159 11,8%
Free State 61 64 66 66 68 65 4,8%
Gauteng 416 420 472 519 566 479 35,4%
KwaZulu-Natal 155 159 220 223 221 196 14,5%
Limpopo 99 117 141 142 143 128 9,5%
Mpumalanga 86 89 101 110 113 100 7,4%
Northern Cape 15 17 20 20 20 18 1,4%
North West 54 52 55 55 54 54 4,0%
Western Cape 99 116 170 185 190 152 11,3%
South Africa 1 124 1 174 1 399 1 486 1 571 1 351 100%
Source: DBE, School realities 2008 - 2012
26
Gauteng has the biggest number of independent schools – 35.4% of the total independent schools, KwaZulu-
Natal has 14.5%, the Eastern Cape 11.8% and then the Western Cape hosts 11.3%. All the other provinces have
less than 10%; Limpopo with 9.5%, Mpumalanga with 7.4%, Free State with 4.8%, North West with 4% and
Northern Cape with 1.4%. There is no significant movement in the number of independent schools in the North
West, Free State or Northern Cape. Gauteng and the Western Cape, however, have seen increases of 150 and
91 independent schools respectively over the mentioned period. This trend is continuing, despite these
provinces being the best performing provinces in the exit matric examination.
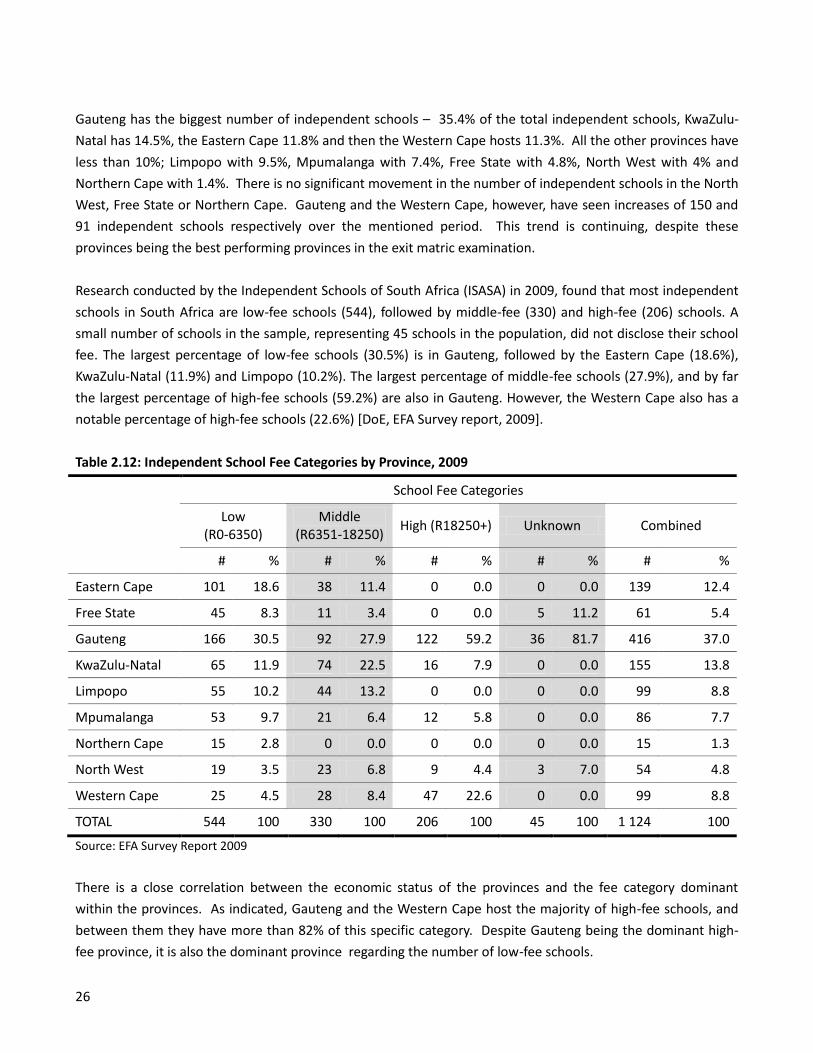
Research conducted by the Independent Schools of South Africa (ISASA) in 2009, found that most independent
schools in South Africa are low-fee schools (544), followed by middle-fee (330) and high-fee (206) schools. A
small number of schools in the sample, representing 45 schools in the population, did not disclose their school
fee. The largest percentage of low-fee schools (30.5%) is in Gauteng, followed by the Eastern Cape (18.6%),
KwaZulu-Natal (11.9%) and Limpopo (10.2%). The largest percentage of middle-fee schools (27.9%), and by far
the largest percentage of high-fee schools (59.2%) are also in Gauteng. However, the Western Cape also has a
notable percentage of high-fee schools (22.6%) [DoE, EFA Survey report, 2009].
Table 2.12: Independent School Fee Categories by Province, 2009
School Fee Categories
Low (R0-6350)
Middle (R6351-18250)
High (R18250+) Unknown Combined
# % # % # % # % # %
Eastern Cape 101 18.6 38 11.4 0 0.0 0 0.0 139 12.4
Free State 45 8.3 11 3.4 0 0.0 5 11.2 61 5.4
Gauteng 166 30.5 92 27.9 122 59.2 36 81.7 416 37.0
KwaZulu-Natal 65 11.9 74 22.5 16 7.9 0 0.0 155 13.8
Limpopo 55 10.2 44 13.2 0 0.0 0 0.0 99 8.8
Mpumalanga 53 9.7 21 6.4 12 5.8 0 0.0 86 7.7
Northern Cape 15 2.8 0 0.0 0 0.0 0 0.0 15 1.3
North West 19 3.5 23 6.8 9 4.4 3 7.0 54 4.8
Western Cape 25 4.5 28 8.4 47 22.6 0 0.0 99 8.8
TOTAL 544 100 330 100 206 100 45 100 1 124 100
Source: EFA Survey Report 2009
There is a close correlation between the economic status of the provinces and the fee category dominant
within the provinces. As indicated, Gauteng and the Western Cape host the majority of high-fee schools, and
between them they have more than 82% of this specific category. Despite Gauteng being the dominant high-
fee province, it is also the dominant province regarding the number of low-fee schools.
27
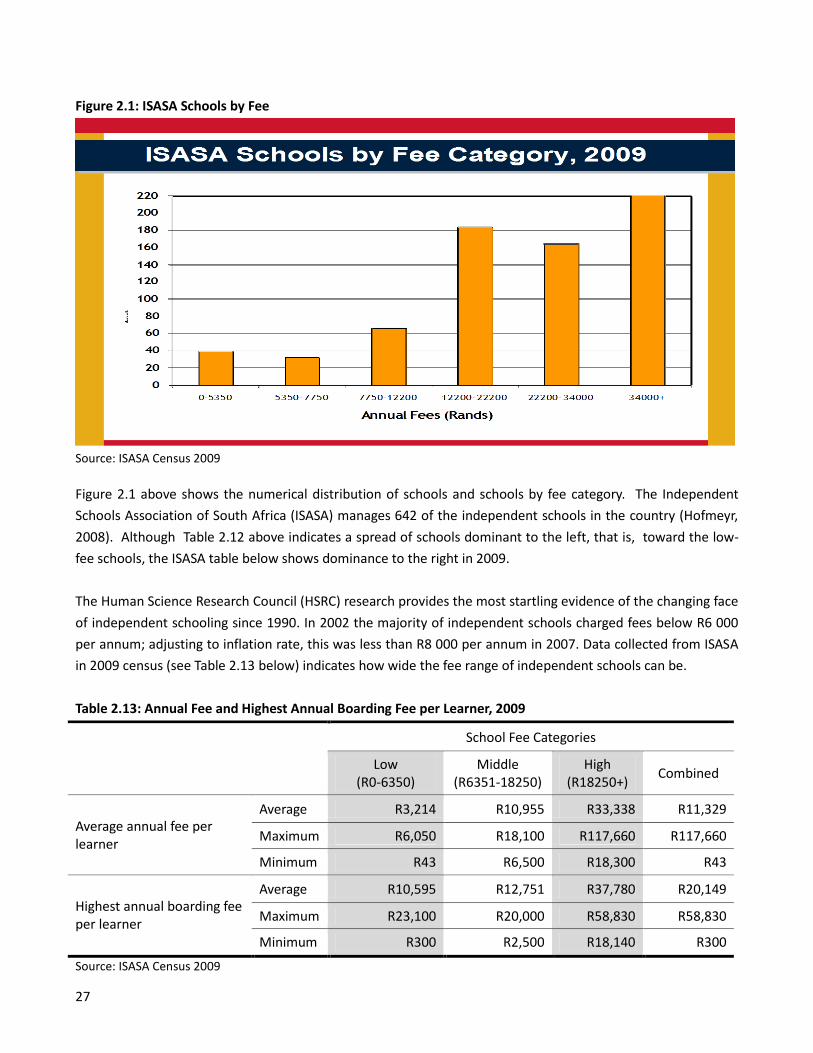
Figure 2.1: ISASA Schools by Fee
Source: ISASA Census 2009
Figure 2.1 above shows the numerical distribution of schools and schools by fee category. The Independent
Schools Association of South Africa (ISASA) manages 642 of the independent schools in the country (Hofmeyr,
2008). Although Table 2.12 above indicates a spread of schools dominant to the left, that is, toward the low-
fee schools, the ISASA table below shows dominance to the right in 2009.
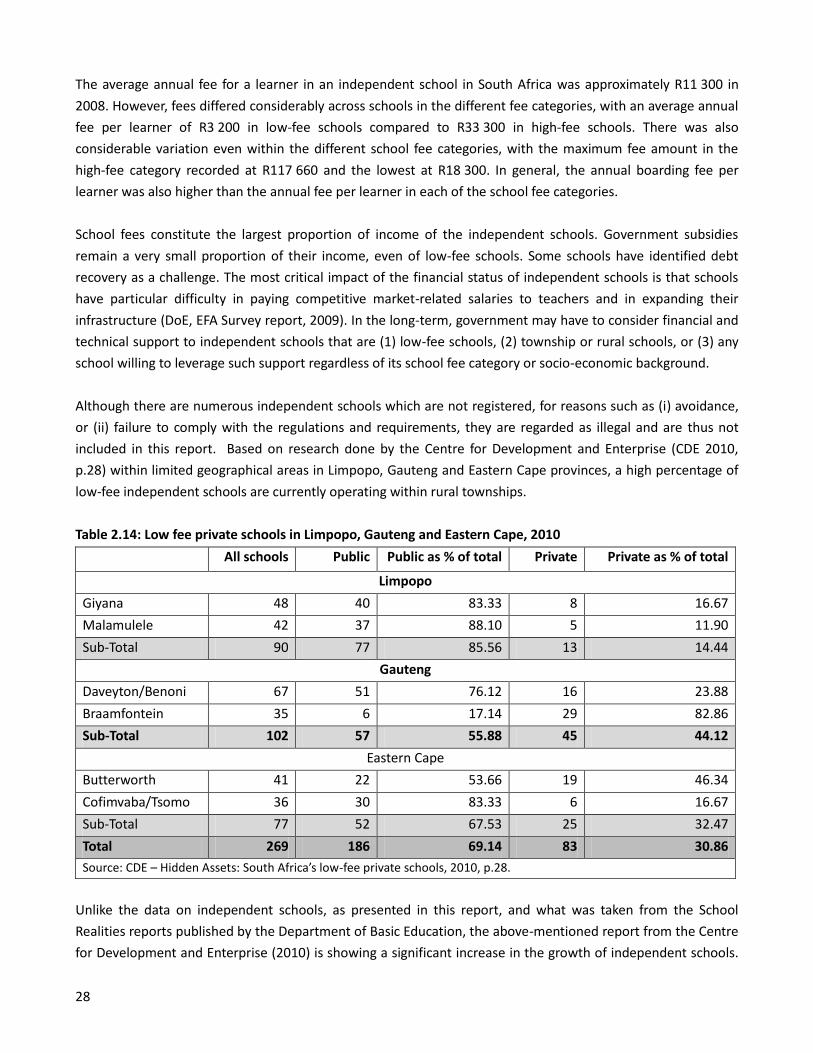
The Human Science Research Council (HSRC) research provides the most startling evidence of the changing face
of independent schooling since 1990. In 2002 the majority of independent schools charged fees below R6 000
per annum; adjusting to inflation rate, this was less than R8 000 per annum in 2007. Data collected from ISASA
in 2009 census (see Table 2.13 below) indicates how wide the fee range of independent schools can be.
Table 2.13: Annual Fee and Highest Annual Boarding Fee per Learner, 2009
School Fee Categories
Low (R0-6350)
Middle (R6351-18250)
High (R18250+)
Combined
Average annual fee per learner
Average R3,214 R10,955 R33,338 R11,329
Maximum R6,050 R18,100 R117,660 R117,660
Minimum R43 R6,500 R18,300 R43
Highest annual boarding fee per learner
Average R10,595 R12,751 R37,780 R20,149
Maximum R23,100 R20,000 R58,830 R58,830
Minimum R300 R2,500 R18,140 R300
Source: ISASA Census 2009
28
The average annual fee for a learner in an independent school in South Africa was approximately R11 300 in
2008. However, fees differed considerably across schools in the different fee categories, with an average annual
fee per learner of R3 200 in low-fee schools compared to R33 300 in high-fee schools. There was also
considerable variation even within the different school fee categories, with the maximum fee amount in the
high-fee category recorded at R117 660 and the lowest at R18 300. In general, the annual boarding fee per
learner was also higher than the annual fee per learner in each of the school fee categories.
School fees constitute the largest proportion of income of the independent schools. Government subsidies
remain a very small proportion of their income, even of low-fee schools. Some schools have identified debt
recovery as a challenge. The most critical impact of the financial status of independent schools is that schools
have particular difficulty in paying competitive market-related salaries to teachers and in expanding their
infrastructure (DoE, EFA Survey report, 2009). In the long-term, government may have to consider financial and
technical support to independent schools that are (1) low-fee schools, (2) township or rural schools, or (3) any
school willing to leverage such support regardless of its school fee category or socio-economic background.
Although there are numerous independent schools which are not registered, for reasons such as (i) avoidance,
or (ii) failure to comply with the regulations and requirements, they are regarded as illegal and are thus not
included in this report. Based on research done by the Centre for Development and Enterprise (CDE 2010,
p.28) within limited geographical areas in Limpopo, Gauteng and Eastern Cape provinces, a high percentage of
low-fee independent schools are currently operating within rural townships.
Table 2.14: Low fee private schools in Limpopo, Gauteng and Eastern Cape, 2010
All schools Public Public as % of total Private Private as % of total
Limpopo
Giyana 48 40 83.33 8 16.67
Malamulele 42 37 88.10 5 11.90
Sub-Total 90 77 85.56 13 14.44
Gauteng
Daveyton/Benoni 67 51 76.12 16 23.88
Braamfontein 35 6 17.14 29 82.86
Sub-Total 102 57 55.88 45 44.12
Eastern Cape
Butterworth 41 22 53.66 19 46.34
Cofimvaba/Tsomo 36 30 83.33 6 16.67
Sub-Total 77 52 67.53 25 32.47
Total 269 186 69.14 83 30.86
Source: CDE – Hidden Assets: South Africa’s low-fee private schools, 2010, p.28.
Unlike the data on independent schools, as presented in this report, and what was taken from the School
Realities reports published by the Department of Basic Education, the above-mentioned report from the Centre
for Development and Enterprise (2010) is showing a significant increase in the growth of independent schools.
29
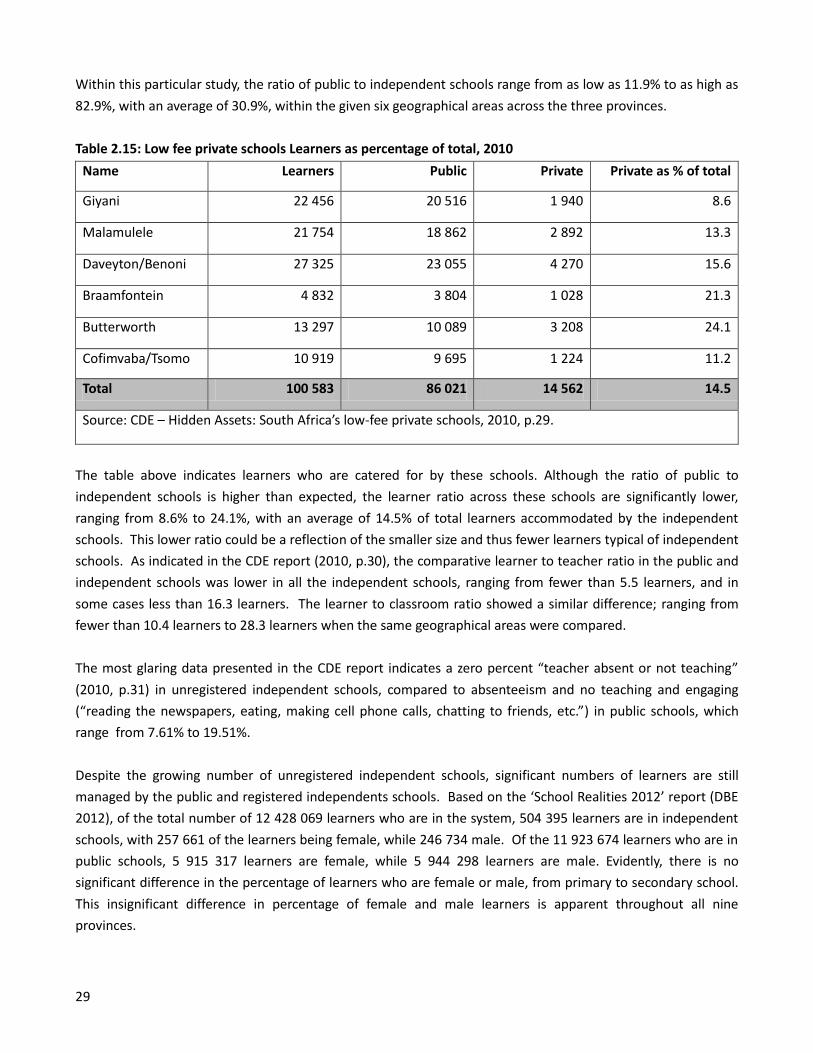
Within this particular study, the ratio of public to independent schools range from as low as 11.9% to as high as
82.9%, with an average of 30.9%, within the given six geographical areas across the three provinces.
Table 2.15: Low fee private schools Learners as percentage of total, 2010
Name Learners Public Private Private as % of total
Giyani 22 456 20 516 1 940 8.6
Malamulele 21 754 18 862 2 892 13.3
Daveyton/Benoni 27 325 23 055 4 270 15.6
Braamfontein 4 832 3 804 1 028 21.3
Butterworth 13 297 10 089 3 208 24.1
Cofimvaba/Tsomo 10 919 9 695 1 224 11.2
Total 100 583 86 021 14 562 14.5
Source: CDE – Hidden Assets: South Africa’s low-fee private schools, 2010, p.29.
The table above indicates learners who are catered for by these schools. Although the ratio of public to
independent schools is higher than expected, the learner ratio across these schools are significantly lower,
ranging from 8.6% to 24.1%, with an average of 14.5% of total learners accommodated by the independent
schools. This lower ratio could be a reflection of the smaller size and thus fewer learners typical of independent
schools. As indicated in the CDE report (2010, p.30), the comparative learner to teacher ratio in the public and
independent schools was lower in all the independent schools, ranging from fewer than 5.5 learners, and in
some cases less than 16.3 learners. The learner to classroom ratio showed a similar difference; ranging from
fewer than 10.4 learners to 28.3 learners when the same geographical areas were compared.
The most glaring data presented in the CDE report indicates a zero percent “teacher absent or not teaching”
(2010, p.31) in unregistered independent schools, compared to absenteeism and no teaching and engaging
(“reading the newspapers, eating, making cell phone calls, chatting to friends, etc.”) in public schools, which
range from 7.61% to 19.51%.
Despite the growing number of unregistered independent schools, significant numbers of learners are still
managed by the public and registered independents schools. Based on the ‘School Realities 2012’ report (DBE
2012), of the total number of 12 428 069 learners who are in the system, 504 395 learners are in independent
schools, with 257 661 of the learners being female, while 246 734 male. Of the 11 923 674 learners who are in
public schools, 5 915 317 learners are female, while 5 944 298 learners are male. Evidently, there is no
significant difference in the percentage of learners who are female or male, from primary to secondary school.
This insignificant difference in percentage of female and male learners is apparent throughout all nine
provinces.
30
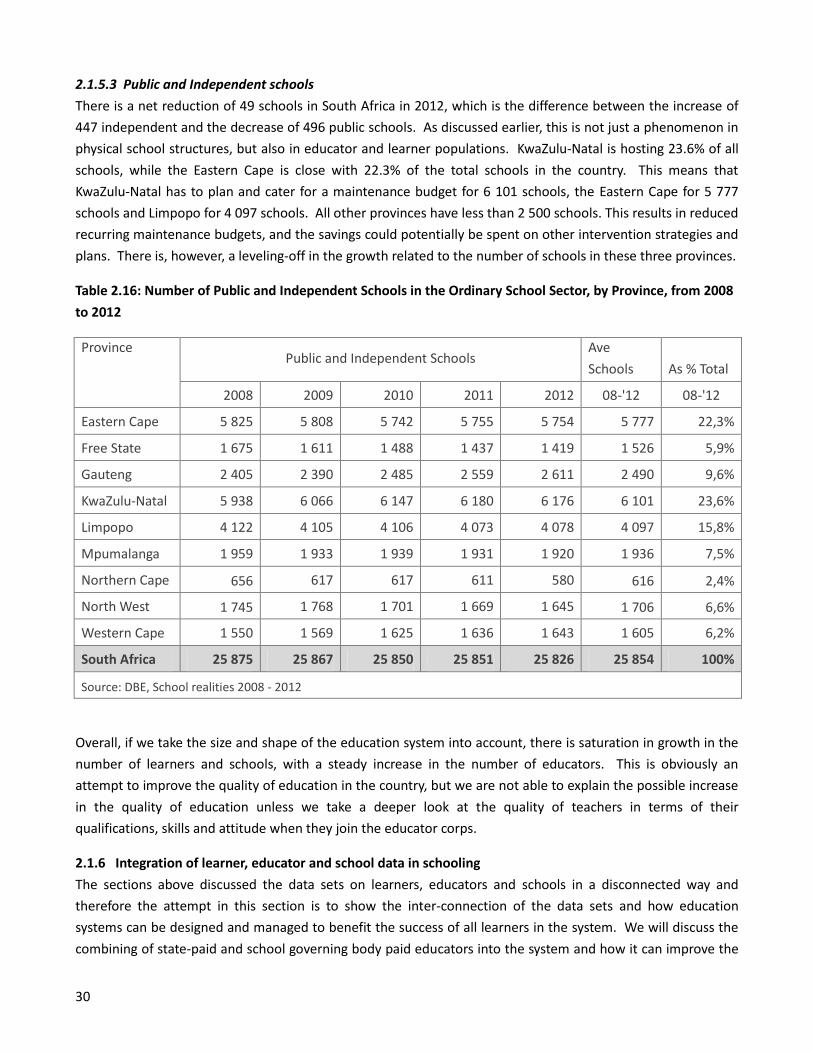
2.1.5.3 Public and Independent schools
There is a net reduction of 49 schools in South Africa in 2012, which is the difference between the increase of
447 independent and the decrease of 496 public schools. As discussed earlier, this is not just a phenomenon in
physical school structures, but also in educator and learner populations. KwaZulu-Natal is hosting 23.6% of all
schools, while the Eastern Cape is close with 22.3% of the total schools in the country. This means that
KwaZulu-Natal has to plan and cater for a maintenance budget for 6 101 schools, the Eastern Cape for 5 777
schools and Limpopo for 4 097 schools. All other provinces have less than 2 500 schools. This results in reduced
recurring maintenance budgets, and the savings could potentially be spent on other intervention strategies and
plans. There is, however, a leveling-off in the growth related to the number of schools in these three provinces.
Table 2.16: Number of Public and Independent Schools in the Ordinary School Sector, by Province, from 2008
to 2012
Province Public and Independent Schools
Ave
Schools As % Total
2008 2009 2010 2011 2012 08-'12 08-'12
Eastern Cape 5 825 5 808 5 742 5 755 5 754 5 777 22,3%
Free State 1 675 1 611 1 488 1 437 1 419 1 526 5,9%
Gauteng 2 405 2 390 2 485 2 559 2 611 2 490 9,6%
KwaZulu-Natal 5 938 6 066 6 147 6 180 6 176 6 101 23,6%
Limpopo 4 122 4 105 4 106 4 073 4 078 4 097 15,8%
Mpumalanga 1 959 1 933 1 939 1 931 1 920 1 936 7,5%
Northern Cape 656 617 617 611 580 616 2,4%
North West 1 745 1 768 1 701 1 669 1 645 1 706 6,6%
Western Cape 1 550 1 569 1 625 1 636 1 643 1 605 6,2%
South Africa 25 875 25 867 25 850 25 851 25 826 25 854 100%
Source: DBE, School realities 2008 - 2012
Overall, if we take the size and shape of the education system into account, there is saturation in growth in the
number of learners and schools, with a steady increase in the number of educators. This is obviously an
attempt to improve the quality of education in the country, but we are not able to explain the possible increase
in the quality of education unless we take a deeper look at the quality of teachers in terms of their
qualifications, skills and attitude when they join the educator corps.
2.1.6 Integration of learner, educator and school data in schooling
The sections above discussed the data sets on learners, educators and schools in a disconnected way and
therefore the attempt in this section is to show the inter-connection of the data sets and how education
systems can be designed and managed to benefit the success of all learners in the system. We will discuss the
combining of state-paid and school governing body paid educators into the system and how it can improve the
31
learner educator ratio (LER). This last group of educators is known in the education system to be “SGB-paid”
educators, and will include all educators who are employed either on a temporary basis or in a permanent
capacity at the school The next two integration ratios to be discussed will be the learner school ratio (LSR) and
the education school ratio (ESR), both of which were briefly discussed in the preceding section.
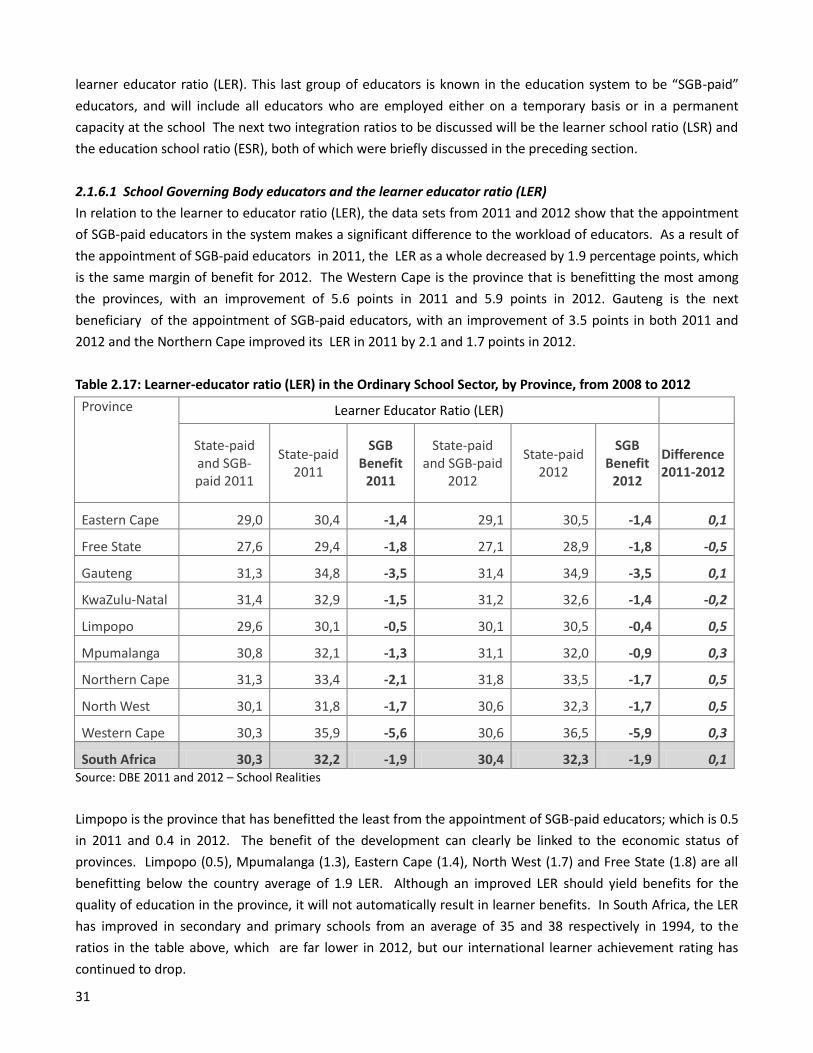
2.1.6.1 School Governing Body educators and the learner educator ratio (LER)
In relation to the learner to educator ratio (LER), the data sets from 2011 and 2012 show that the appointment
of SGB-paid educators in the system makes a significant difference to the workload of educators. As a result of
the appointment of SGB-paid educators in 2011, the LER as a whole decreased by 1.9 percentage points, which
is the same margin of benefit for 2012. The Western Cape is the province that is benefitting the most among
the provinces, with an improvement of 5.6 points in 2011 and 5.9 points in 2012. Gauteng is the next
beneficiary of the appointment of SGB-paid educators, with an improvement of 3.5 points in both 2011 and
2012 and the Northern Cape improved its LER in 2011 by 2.1 and 1.7 points in 2012.
Table 2.17: Learner-educator ratio (LER) in the Ordinary School Sector, by Province, from 2008 to 2012
Province Learner Educator Ratio (LER)
State-paid and SGB-paid 2011
State-paid 2011
SGB Benefit
2011
State-paid and SGB-paid
2012
State-paid 2012
SGB Benefit
2012
Difference 2011-2012
Eastern Cape 29,0 30,4 -1,4 29,1 30,5 -1,4 0,1
Free State 27,6 29,4 -1,8 27,1 28,9 -1,8 -0,5
Gauteng 31,3 34,8 -3,5 31,4 34,9 -3,5 0,1
KwaZulu-Natal 31,4 32,9 -1,5 31,2 32,6 -1,4 -0,2
Limpopo 29,6 30,1 -0,5 30,1 30,5 -0,4 0,5
Mpumalanga 30,8 32,1 -1,3 31,1 32,0 -0,9 0,3
Northern Cape 31,3 33,4 -2,1 31,8 33,5 -1,7 0,5
North West 30,1 31,8 -1,7 30,6 32,3 -1,7 0,5
Western Cape 30,3 35,9 -5,6 30,6 36,5 -5,9 0,3
South Africa 30,3 32,2 -1,9 30,4 32,3 -1,9 0,1 Source: DBE 2011 and 2012 – School Realities
Limpopo is the province that has benefitted the least from the appointment of SGB-paid educators; which is 0.5
in 2011 and 0.4 in 2012. The benefit of the development can clearly be linked to the economic status of
provinces. Limpopo (0.5), Mpumalanga (1.3), Eastern Cape (1.4), North West (1.7) and Free State (1.8) are all
benefitting below the country average of 1.9 LER. Although an improved LER should yield benefits for the
quality of education in the province, it will not automatically result in learner benefits. In South Africa, the LER
has improved in secondary and primary schools from an average of 35 and 38 respectively in 1994, to the
ratios in the table above, which are far lower in 2012, but our international learner achievement rating has
continued to drop.
32
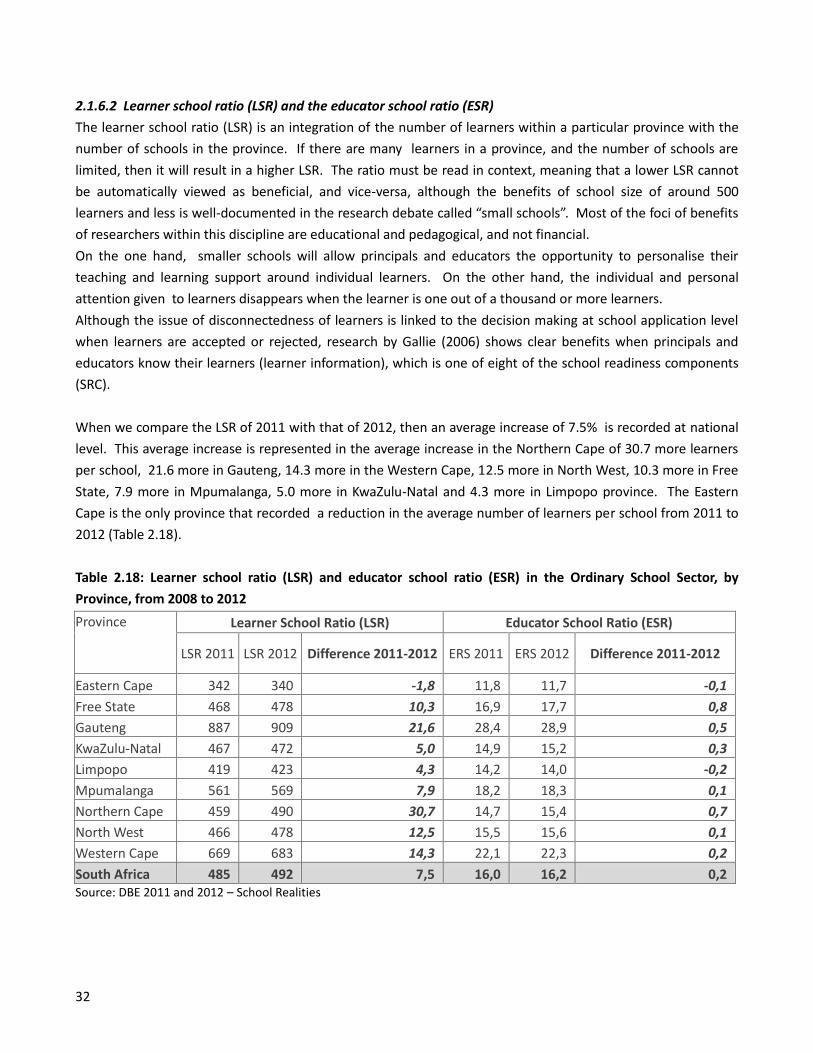
2.1.6.2 Learner school ratio (LSR) and the educator school ratio (ESR)
The learner school ratio (LSR) is an integration of the number of learners within a particular province with the
number of schools in the province. If there are many learners in a province, and the number of schools are
limited, then it will result in a higher LSR. The ratio must be read in context, meaning that a lower LSR cannot
be automatically viewed as beneficial, and vice-versa, although the benefits of school size of around 500
learners and less is well-documented in the research debate called “small schools”. Most of the foci of benefits
of researchers within this discipline are educational and pedagogical, and not financial.
On the one hand, smaller schools will allow principals and educators the opportunity to personalise their
teaching and learning support around individual learners. On the other hand, the individual and personal
attention given to learners disappears when the learner is one out of a thousand or more learners.
Although the issue of disconnectedness of learners is linked to the decision making at school application level
when learners are accepted or rejected, research by Gallie (2006) shows clear benefits when principals and
educators know their learners (learner information), which is one of eight of the school readiness components
(SRC).
When we compare the LSR of 2011 with that of 2012, then an average increase of 7.5% is recorded at national
level. This average increase is represented in the average increase in the Northern Cape of 30.7 more learners
per school, 21.6 more in Gauteng, 14.3 more in the Western Cape, 12.5 more in North West, 10.3 more in Free
State, 7.9 more in Mpumalanga, 5.0 more in KwaZulu-Natal and 4.3 more in Limpopo province. The Eastern
Cape is the only province that recorded a reduction in the average number of learners per school from 2011 to
2012 (Table 2.18).
Table 2.18: Learner school ratio (LSR) and educator school ratio (ESR) in the Ordinary School Sector, by
Province, from 2008 to 2012
Province Learner School Ratio (LSR) Educator School Ratio (ESR)
LSR 2011 LSR 2012 Difference 2011-2012 ERS 2011 ERS 2012 Difference 2011-2012
Eastern Cape 342 340 -1,8 11,8 11,7 -0,1
Free State 468 478 10,3 16,9 17,7 0,8
Gauteng 887 909 21,6 28,4 28,9 0,5
KwaZulu-Natal 467 472 5,0 14,9 15,2 0,3
Limpopo 419 423 4,3 14,2 14,0 -0,2
Mpumalanga 561 569 7,9 18,2 18,3 0,1
Northern Cape 459 490 30,7 14,7 15,4 0,7
North West 466 478 12,5 15,5 15,6 0,1
Western Cape 669 683 14,3 22,1 22,3 0,2
South Africa 485 492 7,5 16,0 16,2 0,2 Source: DBE 2011 and 2012 – School Realities
33
The educator school ratio (ESR) is an integration of the number of schools with the number of educators in the
province. This ratio reflects the average number of educators that would be present and available per school in
specific provinces.
If the number of schools is high, and the number of educators is low, then the ESR will be high and vice-versa.
As discussed earlier in the educator and school section, the overall trend in the country is the levelling-off of
the number of schools, while we see a steady increase in the number of educators employed in the system.
The average ERS countrywide has increased from 16.0 to 16.2 (0.2) educators per school. The biggest increase
is recorded in the Free State with 0.8, with the Northern Cape showing an increase of 0.7 and Gauteng with an
increase of 0.5 educators per school. All other provinces, except the Eastern Cape, recorded an increase less
than 0.5 (KwaZulu-Natal with 0.3, Western Cape with 0.2, and both Mpumalanga and North West with 0.1
increase in educators per school. The Eastern Cape recorded a decrease of 0.1 educators per school (see Table
2.18 above).
2.2. Policy Framework
Education is the responsibility of the national and provincial spheres of government. The national sphere has
exclusive legislative responsibility for tertiary education and shares responsibility with the provincial spheres for
all other levels of education. Through the National Education Policy Act of 1996, the Minister of Education,
working with the provinces, sets the political agenda and determines the national norms and standards for
education planning, provision, governance, monitoring and evaluation. The nine provincial departments of
education are responsible for implementing education policy and programmes aligned with the national goals.
They make funding decisions and exercise executive responsibility for all General Education and Training (GET) –
from grade R (or grade 0, the reception year) to grades 1-3 (the Foundation Phase of GET), grades 4-6 (the
Intermediate Phase), grades 7-9 (the Senior Phase), as well as for Further Education and Training (FET) from
grades 10-12.
2.2.1 Legislative framework
The South African Schools Act (Act 80 of 1996) (SASA) as amended promotes access, quality and democratic
governance in the schooling system. Its purpose is to ensure that all learners have the right of access to quality
education without discrimination and makes schooling compulsory for children aged 7 to 15. It provides for two
types of schools, namely independent schools and public schools. The school funding norms, outlined in SASA,
prioritise redress and target poverty with regard to the allocation of funds for the public schooling system. The
SASA has been amended by the Education Laws Amendment Act (Act 24 of 2005), which authorises the
declaration of schools in poverty-stricken areas as “no-fee schools”, and also by the Education Laws
Amendment Act (Act 31 of 2007).
The SASA also regulates the provision of public schools and education by province. The democratic governance
of schools through school governing bodies is now effected in public schools countrywide (in particular the
establishment and operation of school governing bodies), the funding of schools and the establishment and
funding of independent schools. With regard to school governing bodies, the intention was to create a model of
governance that devolved powers to SGBs which comprise of the school principal and elected representatives
34
of parents, educators, non-teaching staff and (in secondary schools) learners. They may also co-opt non-voting
members onto the SGB. Parents have a majority stake in order to ensure that previously marginalised
constituencies have a greater voice (OECD, 2009).
The Further Education and Training Colleges Act of 2006 supersedes the Further Education and Training Act of
1998 and its aim is to regulate further education and training, which is defined as “all learning and training
programmes leading to qualifications at levels 2 to 4 of the National Qualifications Framework or such levels
determined by SAQA … which levels are above general education but below higher education” (Republic of
South Africa, 2006). Further education and training, therefore, comprises the senior secondary component of
schooling (grades 10-12) as well as further education and training colleges. The final three years of secondary
school are not compulsory, but government is constitutionally obliged to make further education and training
available. Learners can acquire a FET qualification by completing grade 12 in the schooling system, or by
attaining equivalent certification from one of 50 public FET colleges or through opportunities offered by the
private college sector.
The South African Schools Act 1996, as amended, also deals with the establishment and funding of
independent schools and FET colleges. From a policy perspective, the right of any person to establish and
operate an independent/private institution at his or her own cost is entrenched within the South African
Constitution. However, an institution may not operate without being registered by the head of the provincial
Department of Education. An independent institution’s standards may also not be inferior to standards at
comparable public institutions, and it must not discriminate on the grounds of race.
The National Norms and Standards for School Funding provides a framework for the subsidisation of
independent schools, which has contributed to the growth of the sector (Hofmeyr and Lee, 2004). The funding
norms have encouraged the growth of lower-fee independent schools able to serve black communities by
awarding higher subsides to lower-fee schools. They also promote the growth of not-for-profit schools by
denying for-profit schools a subsidy and contribute to curtailing the number of unregistered schools as the
benefits of registering in relation to subsidy is an incentive (Du Toit, 2004).
The Basic Education Laws Amendment Act amends specific provisions of the following legislation:
South African Schools Act (Act 80 of 1996)
National Education Policy Act (Act 27 of 1996)
Employment of Educators Act (Act 76 of 1998)
South African Council for Educators Act (Act 31 of 2000)
General and Further Education and Training Quality Assurance Act (Act 58 of 2001)
The Act contains technical and substantive amendments and aims to align the above legislative framework with
the new education dispensation that came about during 2009 when the Department of Education was split into
two distinct yet interrelated departments. Among others, the Act amends sections of the above laws regarding
the prohibition of political activities during school time, the extended financial responsibility of principals, non-
discrimination in respect of official languages at schools and the provision of distinct categories of public
schools.
35
Independent schools are exposed to a wide range of legislation on many fronts: registration, reporting,
funding, curriculum and assessment, quality assurance, labour relations, rates and taxation, human rights and
other legislative demands placed on private institutions. The reporting requirements vary across provinces in
terms of the administrative burden placed on the schools. Due to this variation in the reporting structures on
specifically skills development and human capital development, it has a negative impact on the ETDPSETA to
effectively access the skills development assessments for the entire independent schools sub-sector (ETDP SETA
Report: August 2010). The regulations also assume the existence of a school governing body, which
independent schools are not required to establish, as good governance in the sector is regulated by company
law and common law, not by education legislation.
The South African Qualifications Authority Act (Act 58 of 1995) provides for the establishment of the National
Qualifications Framework (NQF), which forms the scaffolding for a national learning system that integrates
education and training at all levels. The joint launch of the Human Resources Development Strategy by the
Minister of Labour and the Minister of Education, on 23 April 2001, reinforced the resolve to establish an
integrated education, training and development strategy that would harness the potential of our adult learners.
The design of the NQF has been refined with the publication of the Higher Education Qualifications Framework
in the Government Gazette (No 928, 5 October 2007) to provide ten levels of the NQF. The school and college
level qualifications occupy Levels 1 to 4 as in the original formulation, with plans to accommodate some of the
college level qualifications at Level 5. Higher education qualifications in the new formulation of the NQF occupy
six levels, Levels 5 to 10. Levels 5 to 7 are undergraduate and Levels 8 to 10 are postgraduate (DBE Annual
Report 2010/11).
The promulgation of the SAQA Act in 1995 gave an integrative impetus to a fractured education and training
system in formal institutions, workplaces and the development sector. The SAQA Act has been repealed and
replaced by the National Qualifications Framework Act 67 of 2008 as amended by the Higher Education Laws
Amendment Act 26 of 2010. It discusses, inter alia, framework levels, the three sub-frameworks (General and
Further Education and Training, Higher Education and Training and Trades and Occupations), qualifications and
part-qualifications, professional bodies and the three Quality Councils (Umalusi, Council on Higher Education
and the QCTO).
In November 2009, the Department of Higher Education and Training announced that it would assume
responsibility for skills development that had previously been controlled by the Department of Labour. In April
2010 the proposed new SETA landscape and a draft framework for a new National Skills Development Strategy
to be implemented between March 2011 and March 2016 (http://www.vocational.co.za) was announced.
The new SETA landscape involves the following:
Fifteen of the existing SETAs being recertified with minor changes.
Six new SETAs being formed as a result of the amalgamation of existing SETAs or sub-sectors of existing
SETAs.
A reduction in the total number of SETAs from 23 to 21.
2.2.2 Political framework

36
The Department of Basic Education’s Strategic Plan (2010-2013) explains the key strategic objectives of the
Department in the current Medium Term Expenditure Framework. They relate to areas over which the national
department has direct control in the provision of education in the country. Some of the priority areas that the
national department has identified to improve quality of education are curriculum support for teachers,
teacher development and education, school infrastructure, quality assessment, learners' well-being and
inclusive education. There will be greater involvement in respect of planning and managing these priorities
from national level.
The most recent budget speech in February 2012 reflected a continuing growth in education budget allocation
of R207 billion for 2012/13, with a projection of increase up to R236 billion over the next three years towards
education in 2014/15. At provincial level, education spending was expected to grow by 5.9% over the next
three years, from R169.9 billion for 2013 to R183.8 billion in 2015. An additional R18 billion was allocated to
learner subsidies for no-fee schools and the expansion of access to Grade R. A further R235 million was set
aside for tailored interventions aimed at improving literacy and numeracy in grades 3 and 6.
Table 2.19: Programmes of Strategic Plan 2010-2013 of DBE
Programmed Budget (million)
Curriculum Policy, Support and
Monitoring
R80.874 (curriculum implementation and monitoring and schooling
including inclusive education)
R43.981 with EPEWP (Kha Ri Gude)
R3.951 (National Curriculum Institute)
R762.278 (curriculum quality and enhancement)
Teacher Education Human
Resources Development and
Management
R80.768 (education and human resource management)
R432.949 (teacher education and development)
Planning, Quality Assessment
and Monitoring and Evaluation
R42.169 (information monitoring and evaluation)
R11.301 (financial and physical planning and analysis)
R95.228 (education measurement, assessment and public examinations)
Social Responsibility R15.997 (social inclusion)
R3 872.938 (health in education)
R7.785 (gender equity, rural education, race and values in education)
Source: DBE 2010 – Strategic Plan 2012-2013
One area of particular interest is the amount of money allocated for learner and teacher support materials
(LTSM). LTSM represent a core component of a successful education, in that many learners still do not have the
necessary textbooks or receive them too late. The recent non-delivery of textbooks to learners in Limpopo and
other provinces is likely to impact very significantly in learner performance. It also highlights the kind of
administrative blunders that defeat government’s commitment to invest large amounts in LTSMs.
Government allocations to education have historically been the largest element of the national budget. Taking
into account the three medium-term expenditure framework (MTEF) financial years running from 2010/11.
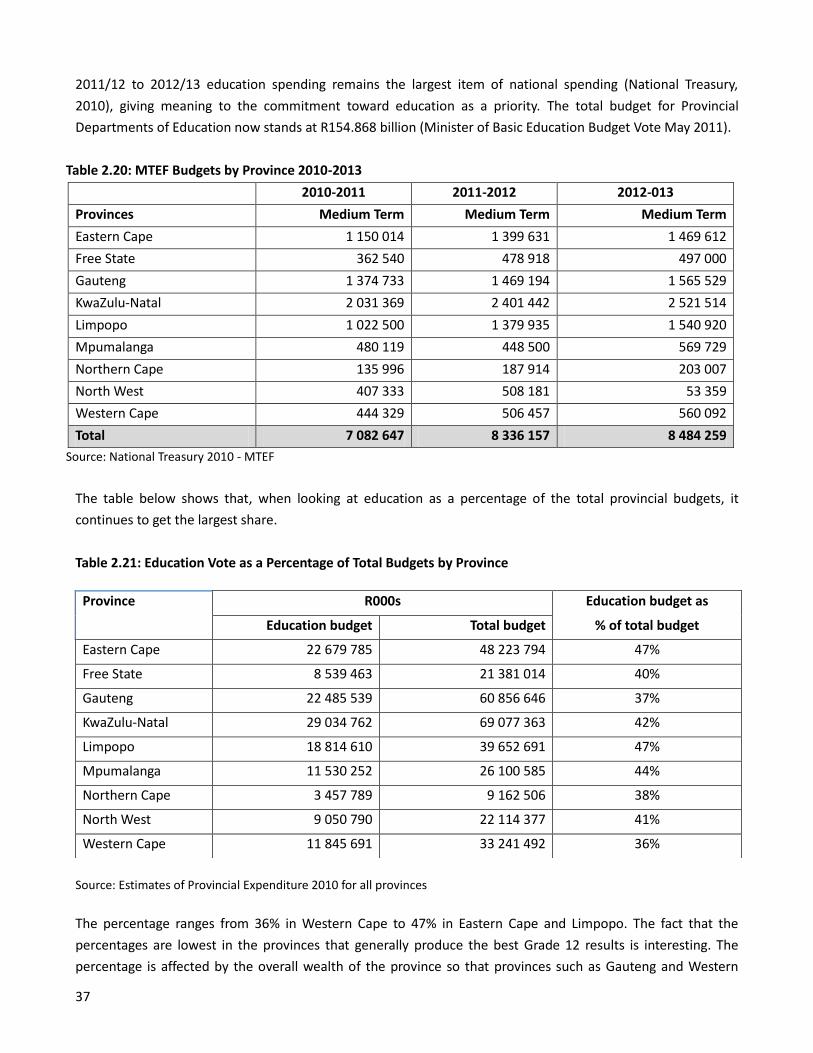
37
2011/12 to 2012/13 education spending remains the largest item of national spending (National Treasury,
2010), giving meaning to the commitment toward education as a priority. The total budget for Provincial
Departments of Education now stands at R154.868 billion (Minister of Basic Education Budget Vote May 2011).
Table 2.20: MTEF Budgets by Province 2010-2013
2010-2011 2011-2012 2012-013
Provinces Medium Term Medium Term Medium Term
Eastern Cape 1 150 014 1 399 631 1 469 612
Free State 362 540 478 918 497 000
Gauteng 1 374 733 1 469 194 1 565 529
KwaZulu-Natal 2 031 369 2 401 442 2 521 514
Limpopo 1 022 500 1 379 935 1 540 920
Mpumalanga 480 119 448 500 569 729
Northern Cape 135 996 187 914 203 007
North West 407 333 508 181 53 359
Western Cape 444 329 506 457 560 092
Total 7 082 647 8 336 157 8 484 259
Source: National Treasury 2010 - MTEF
The table below shows that, when looking at education as a percentage of the total provincial budgets, it
continues to get the largest share.
Table 2.21: Education Vote as a Percentage of Total Budgets by Province
Source: Estimates of Provincial Expenditure 2010 for all provinces
The percentage ranges from 36% in Western Cape to 47% in Eastern Cape and Limpopo. The fact that the
percentages are lowest in the provinces that generally produce the best Grade 12 results is interesting. The
percentage is affected by the overall wealth of the province so that provinces such as Gauteng and Western
Province R000s Education budget as
Education budget Total budget % of total budget
Eastern Cape 22 679 785 48 223 794 47%
Free State 8 539 463 21 381 014 40%
Gauteng 22 485 539 60 856 646 37%
KwaZulu-Natal 29 034 762 69 077 363 42%
Limpopo 18 814 610 39 652 691 47%
Mpumalanga 11 530 252 26 100 585 44%
Northern Cape 3 457 789 9 162 506 38%
North West 9 050 790 22 114 377 41%
Western Cape 11 845 691 33 241 492 36%
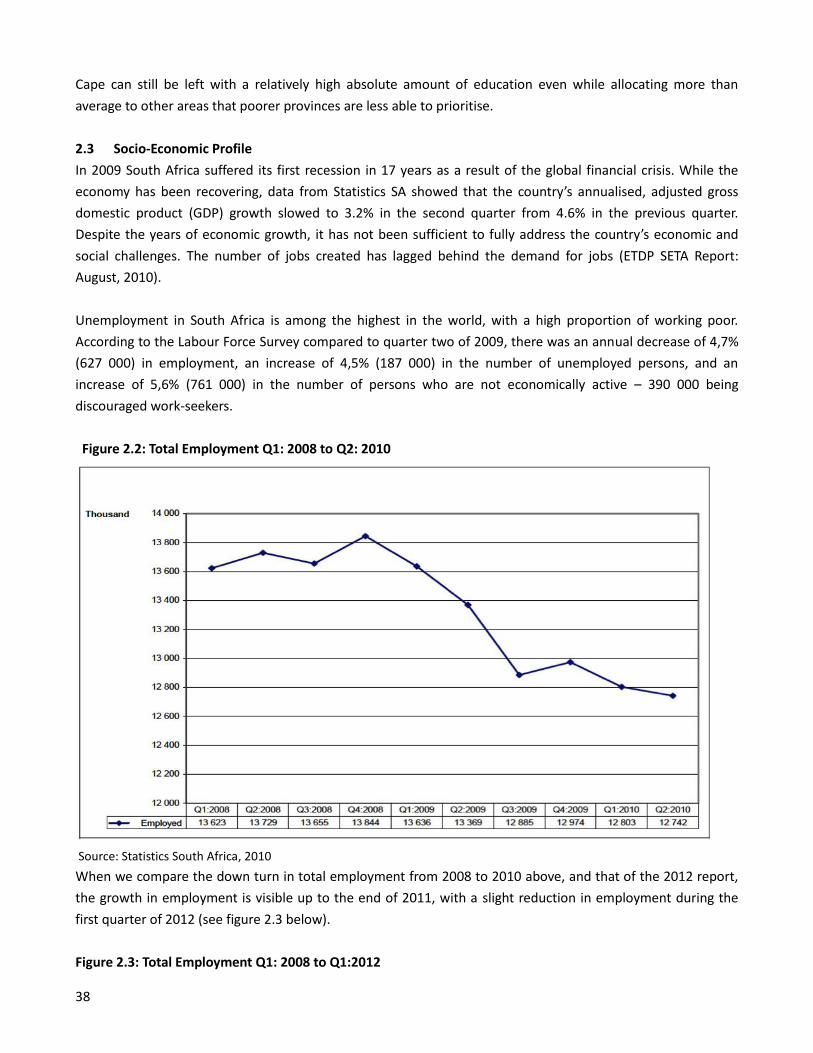
38
Cape can still be left with a relatively high absolute amount of education even while allocating more than
average to other areas that poorer provinces are less able to prioritise.
2.3 Socio-Economic Profile
In 2009 South Africa suffered its first recession in 17 years as a result of the global financial crisis. While the
economy has been recovering, data from Statistics SA showed that the country’s annualised, adjusted gross
domestic product (GDP) growth slowed to 3.2% in the second quarter from 4.6% in the previous quarter.
Despite the years of economic growth, it has not been sufficient to fully address the country’s economic and
social challenges. The number of jobs created has lagged behind the demand for jobs (ETDP SETA Report:
August, 2010).
Unemployment in South Africa is among the highest in the world, with a high proportion of working poor.
According to the Labour Force Survey compared to quarter two of 2009, there was an annual decrease of 4,7%
(627 000) in employment, an increase of 4,5% (187 000) in the number of unemployed persons, and an
increase of 5,6% (761 000) in the number of persons who are not economically active – 390 000 being
discouraged work-seekers.
Figure 2.2: Total Employment Q1: 2008 to Q2: 2010
Source: Statistics South Africa, 2010
When we compare the down turn in total employment from 2008 to 2010 above, and that of the 2012 report,
the growth in employment is visible up to the end of 2011, with a slight reduction in employment during the
first quarter of 2012 (see figure 2.3 below).
Figure 2.3: Total Employment Q1: 2008 to Q1:2012
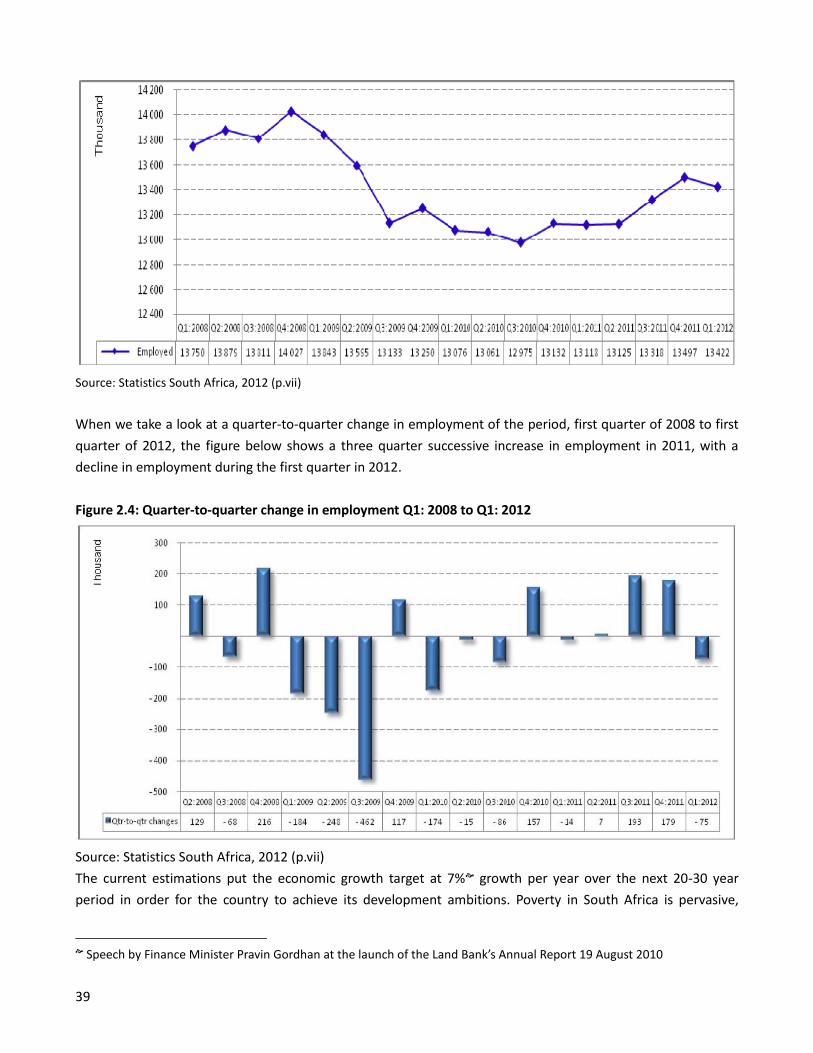
39
Source: Statistics South Africa, 2012 (p.vii)
When we take a look at a quarter-to-quarter change in employment of the period, first quarter of 2008 to first
quarter of 2012, the figure below shows a three quarter successive increase in employment in 2011, with a
decline in employment during the first quarter in 2012.
Figure 2.4: Quarter-to-quarter change in employment Q1: 2008 to Q1: 2012
Source: Statistics South Africa, 2012 (p.vii)
The current estimations put the economic growth target at 7% growth per year over the next 20-30 year
period in order for the country to achieve its development ambitions. Poverty in South Africa is pervasive,
Speech by Finance Minister Pravin Gordhan at the launch of the Land Bank’s Annual Report 19 August 2010
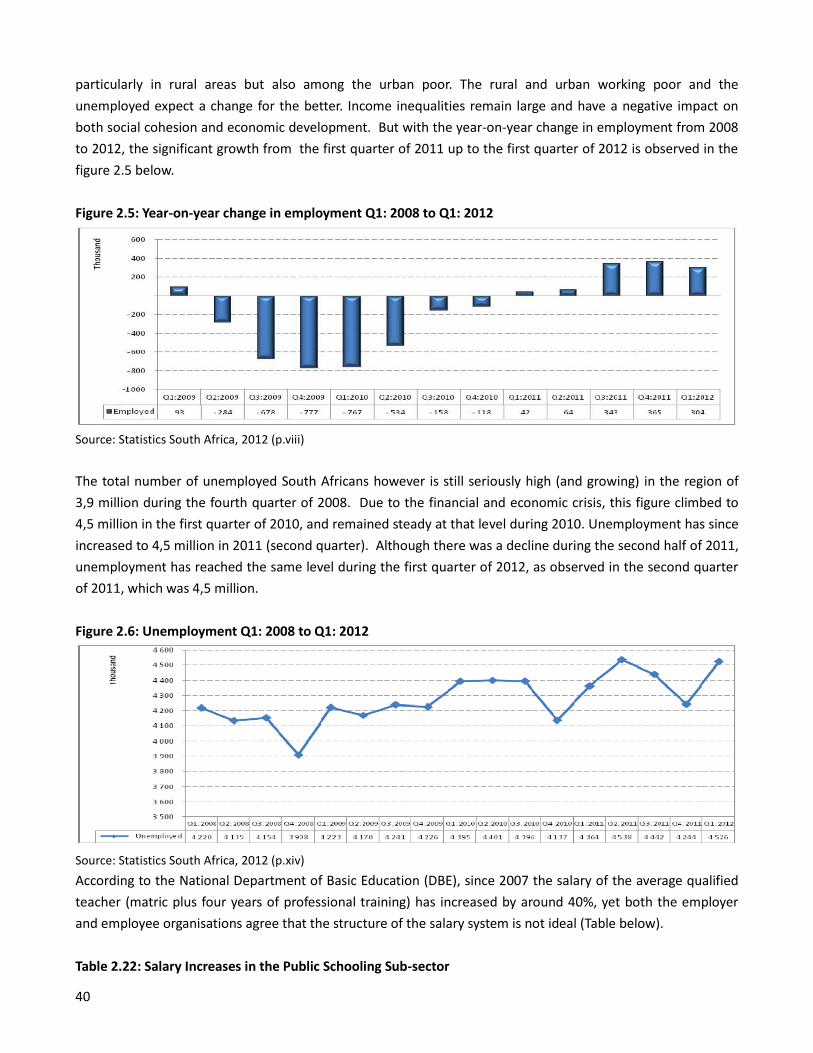
40
particularly in rural areas but also among the urban poor. The rural and urban working poor and the
unemployed expect a change for the better. Income inequalities remain large and have a negative impact on
both social cohesion and economic development. But with the year-on-year change in employment from 2008
to 2012, the significant growth from the first quarter of 2011 up to the first quarter of 2012 is observed in the
figure 2.5 below.
Figure 2.5: Year-on-year change in employment Q1: 2008 to Q1: 2012
Source: Statistics South Africa, 2012 (p.viii)
The total number of unemployed South Africans however is still seriously high (and growing) in the region of
3,9 million during the fourth quarter of 2008. Due to the financial and economic crisis, this figure climbed to
4,5 million in the first quarter of 2010, and remained steady at that level during 2010. Unemployment has since
increased to 4,5 million in 2011 (second quarter). Although there was a decline during the second half of 2011,
unemployment has reached the same level during the first quarter of 2012, as observed in the second quarter
of 2011, which was 4,5 million.
Figure 2.6: Unemployment Q1: 2008 to Q1: 2012
Source: Statistics South Africa, 2012 (p.xiv)
According to the National Department of Basic Education (DBE), since 2007 the salary of the average qualified
teacher (matric plus four years of professional training) has increased by around 40%, yet both the employer
and employee organisations agree that the structure of the salary system is not ideal (Table below).
Table 2.22: Salary Increases in the Public Schooling Sub-sector
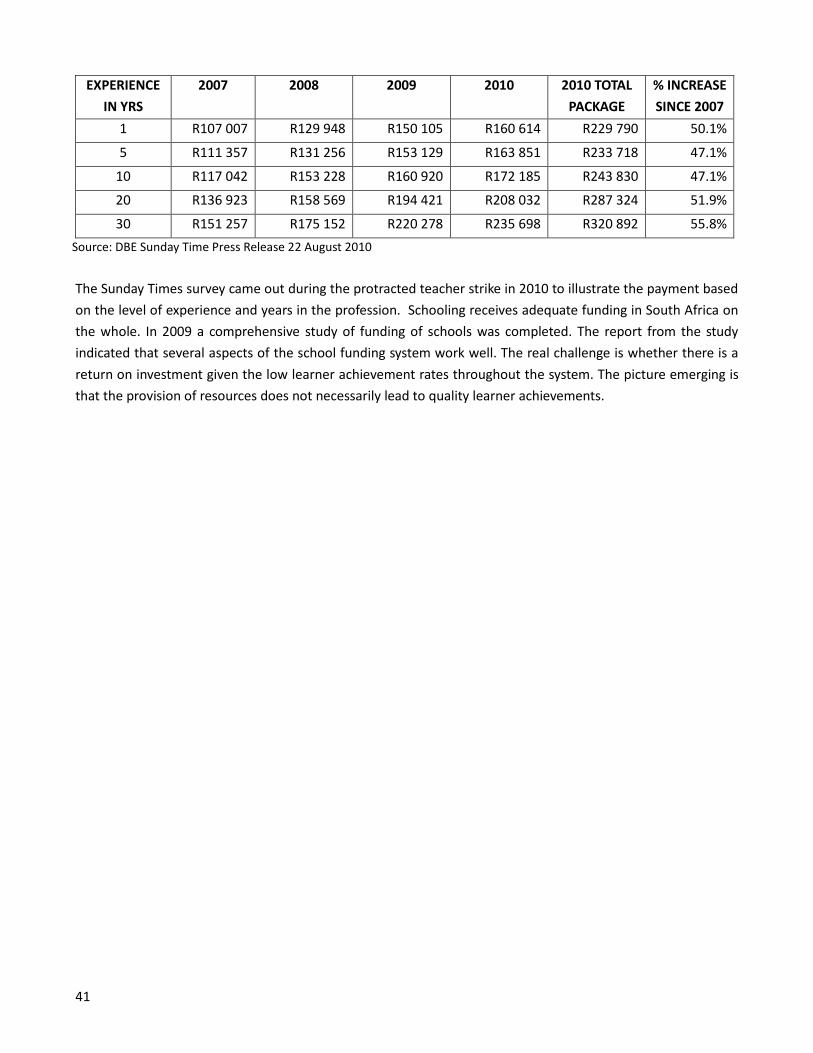
41
EXPERIENCE
IN YRS
2007 2008 2009 2010 2010 TOTAL
PACKAGE
% INCREASE
SINCE 2007
1 R107 007 R129 948 R150 105 R160 614 R229 790 50.1%
5 R111 357 R131 256 R153 129 R163 851 R233 718 47.1%
10 R117 042 R153 228 R160 920 R172 185 R243 830 47.1%
20 R136 923 R158 569 R194 421 R208 032 R287 324 51.9%
30 R151 257 R175 152 R220 278 R235 698 R320 892 55.8%
Source: DBE Sunday Time Press Release 22 August 2010
The Sunday Times survey came out during the protracted teacher strike in 2010 to illustrate the payment based
on the level of experience and years in the profession. Schooling receives adequate funding in South Africa on
the whole. In 2009 a comprehensive study of funding of schools was completed. The report from the study
indicated that several aspects of the school funding system work well. The real challenge is whether there is a
return on investment given the low learner achievement rates throughout the system. The picture emerging is
that the provision of resources does not necessarily lead to quality learner achievements.
42
Chapter 3: ETD Skills Supply and Demand
3.1 Drivers of Change for the ETD and schooling sector
This discussion will examine external and internal drivers of change in the ETD sector, with specific reference to
the schooling sector, where appropriate.
3.1.1 External drivers of change in the ETD sector
3.1.1.1 Globalisation
Perhaps the most powerful and influential external driver of change is globalisation. This is arguably the most
important phenomenon in today’s economic and educational environment. Globalisation means that
geographical boundaries are rapidly losing their influence and that more and more businesses and institutions
are competing in respect of product and service delivery worldwide.
An outcome of globalisation is a “brain drain”, and the underdeveloped countries are fast losing a large part of
their highly-skilled workers. The ETDP SETA (2010) report shows that there is a worldwide shortage of
professionals in key economic sectors in both developed and developing countries. This shortage is giving rise
to a global “war on talent”. According to Mentornet, globalisation leads to an increase in the competition for
skills and talent so that qualified ETD practitioners (teachers, lecturers, researchers, assessors, moderators)
emigrate to countries where they are paid more and where they receive better intellectual stimulation. On the
positive side globalisation makes information more readily available so that people can learn from other
countries and share ideas on new developments.
Globalisation is also opening up the global market. South Africa, like many other countries, is moving from
product based economies to service economies. The influence of the market crisis impacts on education supply
and demands in terms of skilling and re-skilling processes which are brought in by the implementation of new
technology. This leads to the shedding of jobs. The demand for new skills in the sector impacts on teacher
training and teacher development.
According to Mentornet’s website, the following external factors require consideration when discussing
education and training:
3.1.1.2 The global recession
This has a negative impact on employment and funds available for ETD related projects. Less money is available
to spend on education and community development projects.
3.1.1.3 Changes in technology
Changes in technology lead to educators rapidly becoming redundant, if they do not keep pace with the latest
technology. Changes in technology are primarily responsible for an escalation in skills shortages and mismatch
and for the decline in the need for unskilled labour. On the positive side, changes in technology enable us to
offer education and training much more efficiently than in the past.
43
3.1.2 Internal drivers of change
The following are important internal drivers of change within the ETD sector:
3.1.2.1 Legislation
Legislation is a powerful driver of change as discussed in the legislative framework section above. It sets the
tone for some compliance requirements as well as acting as stabilising tools in any organisational setup.
3.1.2.2 Social drivers
At least four main sets of social challenges impact dramatically on education and training provision in SA:
a. HIV/AIDS (Human Immune Immunodeficiency/Acquired Immune Deficiency Syndrome) pandemic
The HIV and AIDS pandemic has dramatic implications for education and training. With regards to learners, by
2015 there will be almost 200 000 school-going children living with AIDS. There will be 3.5 million AIDS orphans
of school-going age. Teachers will face significant challenges should these learners be in school. Learners may
also encounter difficulty in accessing schools. The number of teachers who are HIV positive or who are living
with AIDS is expected to result in major attrition of teachers, increased absenteeism from schools and early
retirement or mortality. The above information paints a grim picture of the potential impact of HIV and Aids on
education and training.
b. Violence in South African society
Forms of violence include gang-related violence, violence against women and violence linked to racism or
xenophobia. All these forms of violence impact on schooling, in particular and education and training in
general. Violence affects learners’ transit to or from school, their performance at school and their homes and
communities. Educators are called upon to respond to learners’ lack of motivation and their ability to learn. Job
satisfaction amongst educators who are confronted daily with such challenges is undermined. Possession of
weapons by learners, sexual abuse, the use of alcohol and drugs on school premises and burglaries all have a
debilitating effect on the morale of school managers, educators, and governing bodies. Gang-related violence at
school is a huge source of concern. In one of the secondary schools in Gauteng, a grade 11 learner “shot dead
the grade 10 pupil”(News 24, 20 November 2012) for repeatedly being bullied.
c. Refugees or migrants from other countries
It is estimated that there are up to 8 million refugees or migrants living illegally in South Africa (Palmary,
2002:4). Data released by the Home Affairs director-general, Mkuseli Apleni, in May 2012, indicates that it is
estimated that there are almost 30 000 people formally registered as asylum seekers in South Africa, the
highest number in the world (Sowetan 2012). The scale and depth of prejudice affects learners and has
implications for educators who are required to handle diversity in their classes.
d. Poverty and Unemployment
It is estimated that at present there are about 13 million working South Africans. Those currently not working in
South Africa are predominantly black, women, young and poorly educated. In fact, while over 85 percent of
those with a university degree are working, fewer than 35 percent of those without a matric qualification have
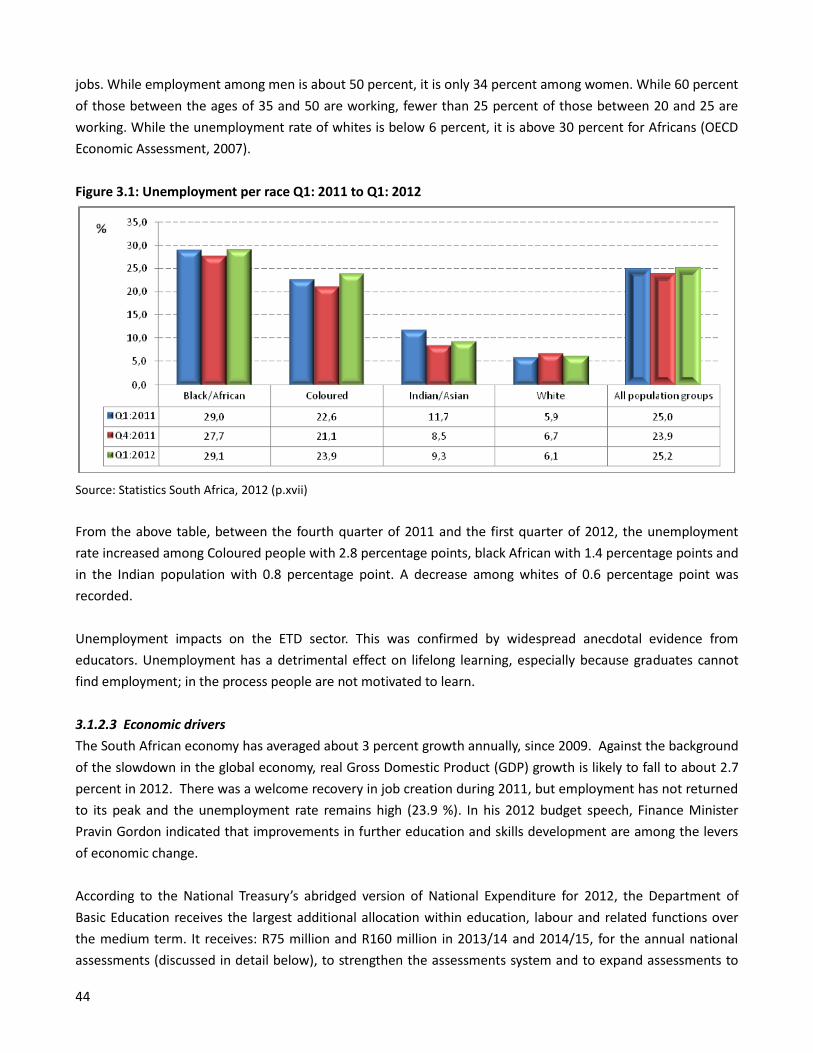
44
jobs. While employment among men is about 50 percent, it is only 34 percent among women. While 60 percent
of those between the ages of 35 and 50 are working, fewer than 25 percent of those between 20 and 25 are
working. While the unemployment rate of whites is below 6 percent, it is above 30 percent for Africans (OECD
Economic Assessment, 2007).
Figure 3.1: Unemployment per race Q1: 2011 to Q1: 2012
Source: Statistics South Africa, 2012 (p.xvii)
From the above table, between the fourth quarter of 2011 and the first quarter of 2012, the unemployment
rate increased among Coloured people with 2.8 percentage points, black African with 1.4 percentage points and
in the Indian population with 0.8 percentage point. A decrease among whites of 0.6 percentage point was
recorded.
Unemployment impacts on the ETD sector. This was confirmed by widespread anecdotal evidence from
educators. Unemployment has a detrimental effect on lifelong learning, especially because graduates cannot
find employment; in the process people are not motivated to learn.
3.1.2.3 Economic drivers
The South African economy has averaged about 3 percent growth annually, since 2009. Against the background
of the slowdown in the global economy, real Gross Domestic Product (GDP) growth is likely to fall to about 2.7
percent in 2012. There was a welcome recovery in job creation during 2011, but employment has not returned
to its peak and the unemployment rate remains high (23.9 %). In his 2012 budget speech, Finance Minister
Pravin Gordon indicated that improvements in further education and skills development are among the levers
of economic change.
According to the National Treasury’s abridged version of National Expenditure for 2012, the Department of
Basic Education receives the largest additional allocation within education, labour and related functions over
the medium term. It receives: R75 million and R160 million in 2013/14 and 2014/15, for the annual national
assessments (discussed in detail below), to strengthen the assessments system and to expand assessments to
45
include grade 9; and R450.4 million and R839.3 million in 2013/14 and 2014/15 is directed towards equalising
the subsidy per learner to all no-fee schools. The department is allocated a further R666.3 million in 2013/14
and R1.1 billion in 2014/15 to increase the provincial equitable share, to progressively equalise funding for
grade R learners to be in line with learners in grades 1 to 12 (Budget Speech 2012).
3.1.2.4 Technological drivers
Rapid developments in technology challenge South Africa to produce people with cutting edge knowledge to
innovate and maintain new technologies. They also challenge ETD practitioners to utilise technology in their
classrooms, smart boards or computer software. Given the extremely uneven internal distribution of access to
technology, it is a major challenge is to avoid the possibility of the majority of the South African learner
population to be excluded from participating in the local and global information revolution.
3.1.2.5 Human Resource Development Strategy for South Africa (HRDS-SA) (2010-2030) as a driver
South Africa’s growth and development trajectory continues to be driven by a pursuit for increased equity,
access and quality across race, gender, geographic locality and disability. These issues continue to drive
transformation across sectors and form the basis for planning in various arenas, including:
Black Economic Empowerment
Human Resource Development
Job Creation, Poverty Alleviation and Social Development
The frameworks for addressing the areas of development take various forms which have traditionally operated
in isolation from one another.
Government has adopted a national planning framework which seeks to drive coherence and impact
throughout the education and training system. This Human Resource Development Strategy for South Africa
(HRDS-SA) (2010-2030) is purposefully located within an expansive conception of HRD; a conception that
accounts for the imperatives that derive from our economic, social and wider development agendas. The
Strategy acknowledges that the contribution of each individual to South Africa’s development agenda is a
function of both ability and agency. The productivity of each individual is determined by, among others, her/his
technical skills; the extent to which her/his basic needs are met; values and orientation; social inclusion and a
commitment to advancing the public good.
The primary goal of the HRDS-SA is to contribute to human development. The strategic priorities and
interventions that make up the Strategy are explicitly designed to respond to economic, social and wider
development imperatives. The HRDS-SA is a macro-strategy which seeks to locate education and training within
the broader developmental agenda of the country and therefore ensure common alignment of various
government programmes in addressing human development challenges. The HRD-SA establishes broad
outcomes for equitable access to education and training and the development of skilled people.
Here are some select education and training related issues addressed by the Human Resource Development
Strategy for South Africa (HRDSSA):
To ensure universal access to quality early childhood development, from birth up to age four;
To eradicate adult illiteracy;
46
To ensure that all people remain in education and training up to age 18;
To ensure that all new entrants to the labour market have access to employment-focused education and
training opportunities;
To ensure that levels of investment are above global averages for all areas of education and training;
To ensure that inequality in education and training is significantly less than the prevailing income inequality;
To ensure that education and training are equitable in terms of race, gender, disability and geographic
location;
To ensure that the balance between emigration and immigration reflects a net positive inflow of people
with skills that are a priority for economic development;
To ensure that all adults in the labour market have access to education and training opportunities that will
enable them to achieve a minimum NQF level 4 qualification;
To ensure progressive improvements in the external efficiency and effectiveness of higher education,
further education and the occupational learning system.
This Sector Skills Plan seeks alignment with this broad national planning framework.
3.1.2.6 Schooling specific drivers
The Medium-Term Strategic Framework (MTSF) outlines government’s key strategic priorities for economic
growth and social development for the period 2009-2014. The MTSF provides a guide for planning and resource
allocation across all spheres of government. The MTSF has “strengthening the skills and human resource base”
as one of its strategic objectives and this manifests a Programme of Action (PoA) which forms the basis for a
delivery agreement for each of the ministers. The PoA represents the state’s shift to an outcome-driven
planning framework. The 12 outcomes expressed in the PoA are an expression of the key priorities that
government seeks to address. There are two outcomes that inform the agenda for the education and training
system over the next few years:
Outcome 1: Improved Quality of Basic Education, which incorporates the following outputs:
o improvement in quality of teaching and learning,
o improvement in quality of assessment, and
o improved planning and accountability.
Outcome 2: A skilled and capable workforce to support an inclusive growth path, which incorporates the
following outputs:
o a credible institutional mechanism for skills planning,
o access to programmes leading to intermediate and high level learning,
o access to occupationally directed programmes in needed areas and thereby expand the availability
of intermediate level skills (with a special focus on artisan skills),
o access to high level occupationally-directed programmes in needed areas, and
o research, development and innovation in human development for a growing knowledge economy.
These outcomes cut across the education and training system and have important implications for planning, in
that they link inputs to performance. Therefore, investment in infrastructure, capacity building or resources
should be done in such a way as to contribute in an integrated manner to the expected outcomes of the system.

47
The National Skills Development Strategy (NSDS III) gives expression to the HRDS-SA and government’s strategic
objectives and provides an overarching framework for sector skills planning and the implementation of skills
development. Sector skills plans should be aligned to government. Industry development initiatives should
address the needs of unemployed youth, provide for new occupational qualifications, thereby addressing the
challenges within FET Colleges and building strong partnership to deliver on the strategy.
a. Curriculum Assessment Policy Statement (CAPS)
CAPS is a key driver of change for the schooling sector and its implementation poses professional and
managerial implications for skills in the sector. Last year alone it was anticipated that 105 000 teachers will be
trained by 350 departmental officials in an effort to introduce CAPS. CAPS is discussed in detail later in this
document.
b. Annual National Assessment (ANA)
The Department of Basic Education will be conducting the Annual National Assessment (ANA) in September
2012 in grades 1 to 6 and 9 in all public schools and grade 3 or 6 in all independent primary schools that are
eligible for government subsidy. Over 7 million learners will write tests in languages and mathematics. The ANA
is discussed later in this document.
c. Natural attrition
Natural attrition is also one of the drivers of the change in the sector, the current rate is 3% according to
recently conducted studies. It will be important to model need projections based on what the attrition rates tell
us in combination with the other factors.
d. Skills shortage and mismatch
The shortage of skills in mathematics, science, computer science and accounting science is arguably one of the
most important challenges of the ETD Sector. People still tend to follow learning programmes for which there
are no or very little skill needs in industry.
e. Change from unskilled to skilled labour as employment expectation
Structural changes in the South African economy from intensive use of unskilled labour to an increased demand
for technology-based skills is partially responsible for the changing demand for skills, which results in higher
unemployment.
f. Social development issues
It is especially in rural areas where communities have a desperate need for almost any ETD, although the need
for education in social issues, such as HIV/AIDS (discussed), literacy and ECD is the most severe.
g. Performance by learners
The need for better quality ETD is indisputable if the current poor performance of learners at school and
students at universities and colleges is to be turned around. This is especially important in the case of
mathematics, science and accounting.
48
h. Educator supply
High turnover in educators due to poor remuneration, inadequate benefits and lowered job satisfaction is
responsible for a decrease in the number of available qualified ETD practitioners, which increases the demand
for such people. Teacher attrition is signalled to be restrained by recruitment programmes that will ensure that
vacancies are filled in the near future.
i. Shortages of mathematics and science teachers
One of the major stumbling blocks in the education and training system relates to weak mathematics and
science learner performance at all levels in the system. Students cannot perform if their educators are unable
to offer them good quality ETD. Over the past several years the overall grade 12 pass rate has shown a steady
decline, even though the end of 2010 statistics showed a promising positive trend. This development has
placed undue pressure on universities who have to work with students with a poor academic background.
Mathematics and science investment in schools is gravely needed. Poor performance in these subjects and
learner aversion to the selection of mathematics and science courses and careers will have a serious impact on
the economy.
j. Education quality
The challenge brought about by poor education quality is demonstrated by the findings of a presidential review
into education highlighting a teaching practice where books were not being used as a teaching aid. It was noted
that, although books were available for both language and mathematics in all but two of the schools reviewed,
no books were seen being used in 43% of language classes and 69% of mathematics classes. The most common
form of reading in these classes consisted of teachers writing 3 or 4 sentences on the board and then leading
the reading of these, with children following in chorus. There are many other examples of poor teaching
practice. The detrimental impact of this on lifelong learning and economic growth is obvious.
k. Rural areas
The poor schooling system in the townships and rural areas contributes to the high level of unemployment This
situation is exacerbated by the job losses and retrenchments in the industry which in turn produce dropouts
due to lack of funds for school fees and transport. Many learners especially in the rural areas and township
schools do not have enough resources to acquire quality education. Many factors contribute to the
deterioration of education in historically disadvantaged schools.
A number of drivers and challenges that impact on the ETD sector (and more specifically on the schooling sub-
sector) have been identified above. For the ETDPSETA, the challenge is to ensure that there is an adequate
knowledge base from which to fully understand the challenges in the education and training system that impact
on its performance against the two key outcomes outlined above and then to understand the role of different
stakeholders in addressing these challenges towards achieving these outcomes. This will ensure optimal
allocation of resources and effectiveness of interventions.
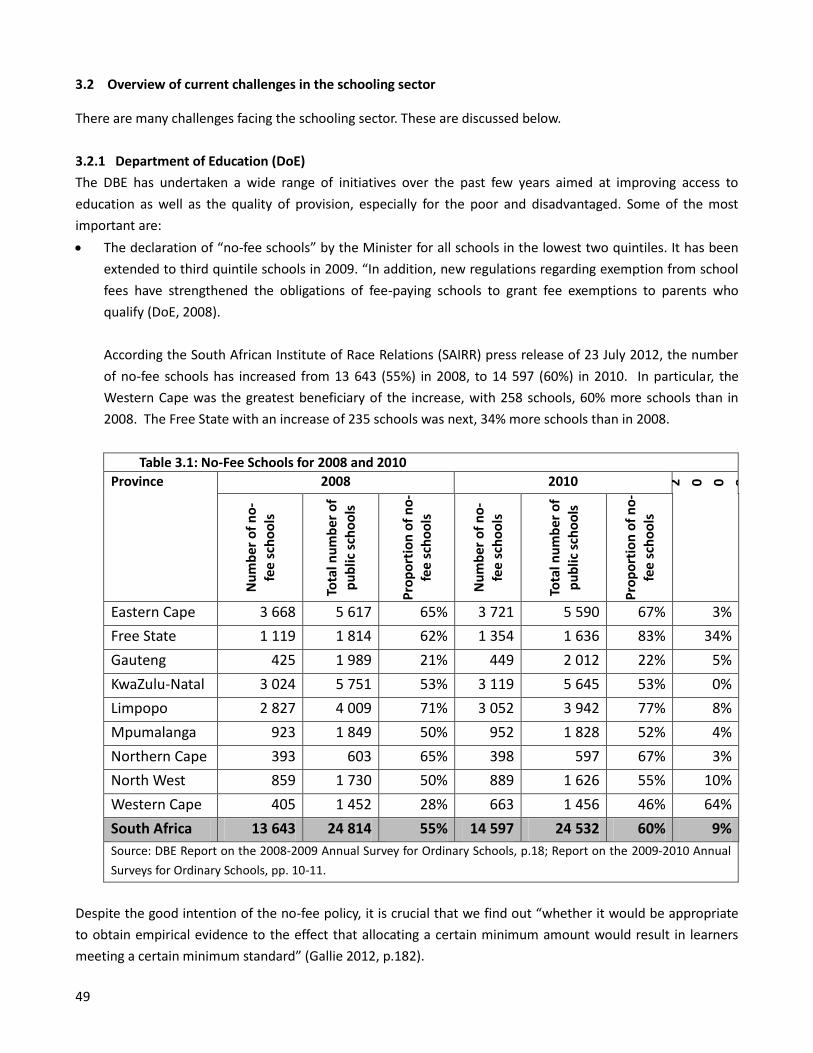
49
3.2 Overview of current challenges in the schooling sector
There are many challenges facing the schooling sector. These are discussed below.
3.2.1 Department of Education (DoE)
The DBE has undertaken a wide range of initiatives over the past few years aimed at improving access to
education as well as the quality of provision, especially for the poor and disadvantaged. Some of the most
important are:
The declaration of “no-fee schools” by the Minister for all schools in the lowest two quintiles. It has been
extended to third quintile schools in 2009. “In addition, new regulations regarding exemption from school
fees have strengthened the obligations of fee-paying schools to grant fee exemptions to parents who
qualify (DoE, 2008).
According the South African Institute of Race Relations (SAIRR) press release of 23 July 2012, the number
of no-fee schools has increased from 13 643 (55%) in 2008, to 14 597 (60%) in 2010. In particular, the
Western Cape was the greatest beneficiary of the increase, with 258 schools, 60% more schools than in
2008. The Free State with an increase of 235 schools was next, 34% more schools than in 2008.
Table 3.1: No-Fee Schools for 2008 and 2010
Province 2008 2010 C h a n g e
2 0 0 8 - 2 0 1 0
Nu
mb
er o
f n
o-
fee
sch
oo
ls
Tota
l nu
mb
er o
f p
ub
lic s
cho
ols
Pro
po
rtio
n o
f n
o-
fee
sch
oo
ls
Nu
mb
er o
f n
o-
fee
sch
oo
ls
Tota
l nu
mb
er o
f
pu
blic
sch
oo
ls
Pro
po
rtio
n o
f n
o-
fee
sch
oo
ls
Eastern Cape 3 668 5 617 65% 3 721 5 590 67% 3%
Free State 1 119 1 814 62% 1 354 1 636 83% 34%
Gauteng 425 1 989 21% 449 2 012 22% 5%
KwaZulu-Natal 3 024 5 751 53% 3 119 5 645 53% 0%
Limpopo 2 827 4 009 71% 3 052 3 942 77% 8%
Mpumalanga 923 1 849 50% 952 1 828 52% 4%
Northern Cape 393 603 65% 398 597 67% 3%
North West 859 1 730 50% 889 1 626 55% 10%
Western Cape 405 1 452 28% 663 1 456 46% 64%
South Africa 13 643 24 814 55% 14 597 24 532 60% 9%
Source: DBE Report on the 2008-2009 Annual Survey for Ordinary Schools, p.18; Report on the 2009-2010 Annual
Surveys for Ordinary Schools, pp. 10-11.
Despite the good intention of the no-fee policy, it is crucial that we find out “whether it would be appropriate
to obtain empirical evidence to the effect that allocating a certain minimum amount would result in learners
meeting a certain minimum standard” (Gallie 2012, p.182).
50
The Directorate of Rural Education was established to address the inequalities between urban and rural
schooling. A National Framework for Quality Education in Rural Areas (DoE, 2006)has been formulated and
focuses on, amongst others, attracting and retaining learners in rural schools, restructuring and improving
infrastructure, rationalising schools, and signing agreements between Provincial Departments of Education
(PDEs) and land-owners who are mainly commercial farmers.
In a recent article in South African Rural Educator (Volume 1, 7 February 2012), the Deputy Minister Surty
outlined the challenges of rural education as (i) the socio-economic realities of rural areas, (ii) rural areas are
not attractive for teachers, (iii) inappropriate teaching methods, and (iv) a correlation between language and
performance. His advice is an integrated and holistic approach in tackling the problems by focusing on the
following areas:
Supporting cognitive development pre-Grade R
Increasing the uptake of Grade Rs
Improving literacy and numeracy in the foundation phase
Providing the right combination of languages for learning
Supporting multi-grade schools through infrastructure, teacher training, curriculum, importance of playing,
connectivity and a rural incentive for teachers
He affirmed these goals by quoting Mbilwe Secondary and Dendron High, both in Limpopo as schools that
are rural and excellent; producing 40 distinctions in Mathematics and Science at matric level in 2011.
The most prominent current driver of the public school sector – especially schools serving the poor – is the
concern about the quality of education in these schools. A number of assessment studies in recent years have
shown that the educational achievements of learners in SA schools are unacceptably poor. This has been
confirmed by four international studies, namely the Monitoring Learning Achievement (MLA) Project, the
Trends in International Mathematics and Science Study (TIMSS), the Southern Africa Consortium for Monitoring
Educational Quality (SACMEQ) study and the Progress in International Reading Literacy Study (PIRLS). All these
studies show South African learners having exceptionally low levels of basic literacy and numeracy skills
compared to learners in other countries.
3.2.2 Schooling challenges
The greatest challenges that the schooling system has to contend and grapple with, is the participation of
children who are orphaned and those who are not attending educational institutions. The children below are
defined as those people under the age of 18. Child-headed households are interpreted as households with only
children as members, while a mixed-generation household will be seen as having both adults and children as
members of the household.
3.2.2.1 Orphan learners and attendance of learners
Some of the significant challenges faced by the schooling system are the participation of orphans and the
attendance of learners. The challenges which learners face when they are orphaned, either through maternal,
paternal or double orphanage, are enormous.
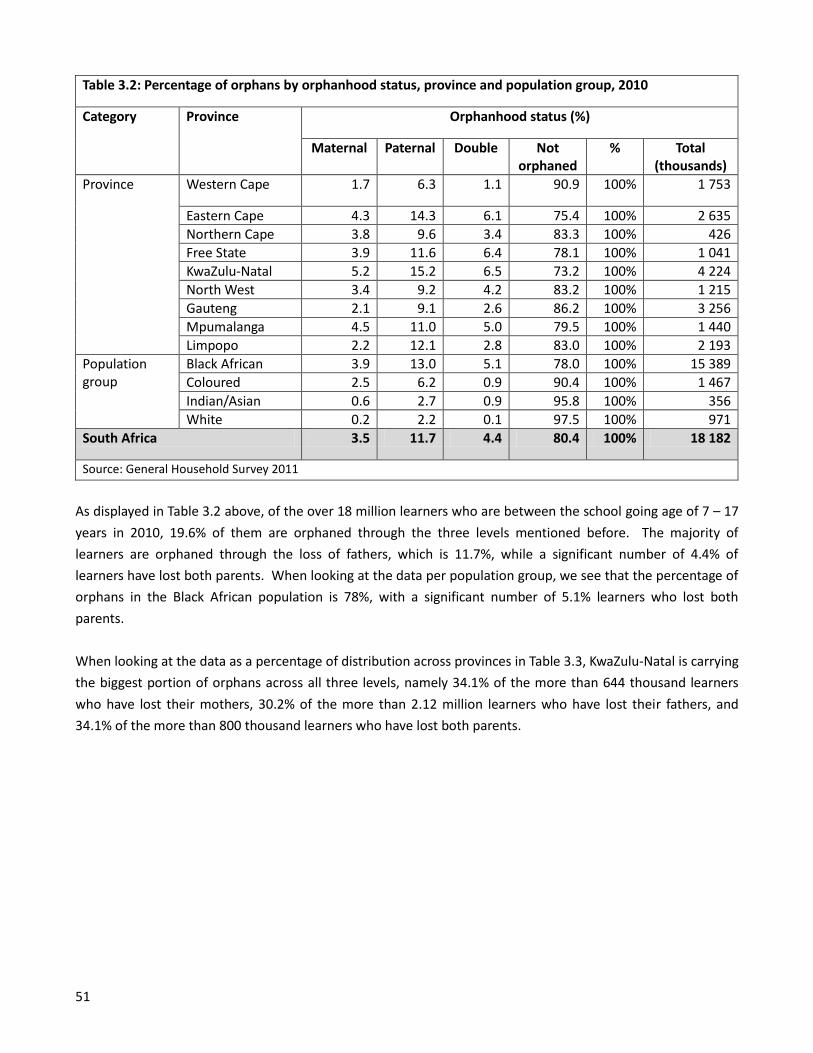
51
Table 3.2: Percentage of orphans by orphanhood status, province and population group, 2010
Category Province Orphanhood status (%)
Maternal Paternal Double Not orphaned
% Total (thousands)
Province Western Cape 1.7 6.3 1.1 90.9 100% 1 753
Eastern Cape 4.3 14.3 6.1 75.4 100% 2 635
Northern Cape 3.8 9.6 3.4 83.3 100% 426
Free State 3.9 11.6 6.4 78.1 100% 1 041
KwaZulu-Natal 5.2 15.2 6.5 73.2 100% 4 224
North West 3.4 9.2 4.2 83.2 100% 1 215
Gauteng 2.1 9.1 2.6 86.2 100% 3 256
Mpumalanga 4.5 11.0 5.0 79.5 100% 1 440
Limpopo 2.2 12.1 2.8 83.0 100% 2 193
Population group
Black African 3.9 13.0 5.1 78.0 100% 15 389
Coloured 2.5 6.2 0.9 90.4 100% 1 467
Indian/Asian 0.6 2.7 0.9 95.8 100% 356
White 0.2 2.2 0.1 97.5 100% 971
South Africa 3.5 11.7 4.4 80.4 100% 18 182
Source: General Household Survey 2011
As displayed in Table 3.2 above, of the over 18 million learners who are between the school going age of 7 – 17
years in 2010, 19.6% of them are orphaned through the three levels mentioned before. The majority of
learners are orphaned through the loss of fathers, which is 11.7%, while a significant number of 4.4% of
learners have lost both parents. When looking at the data per population group, we see that the percentage of
orphans in the Black African population is 78%, with a significant number of 5.1% learners who lost both
parents.
When looking at the data as a percentage of distribution across provinces in Table 3.3, KwaZulu-Natal is carrying
the biggest portion of orphans across all three levels, namely 34.1% of the more than 644 thousand learners
who have lost their mothers, 30.2% of the more than 2.12 million learners who have lost their fathers, and
34.1% of the more than 800 thousand learners who have lost both parents.
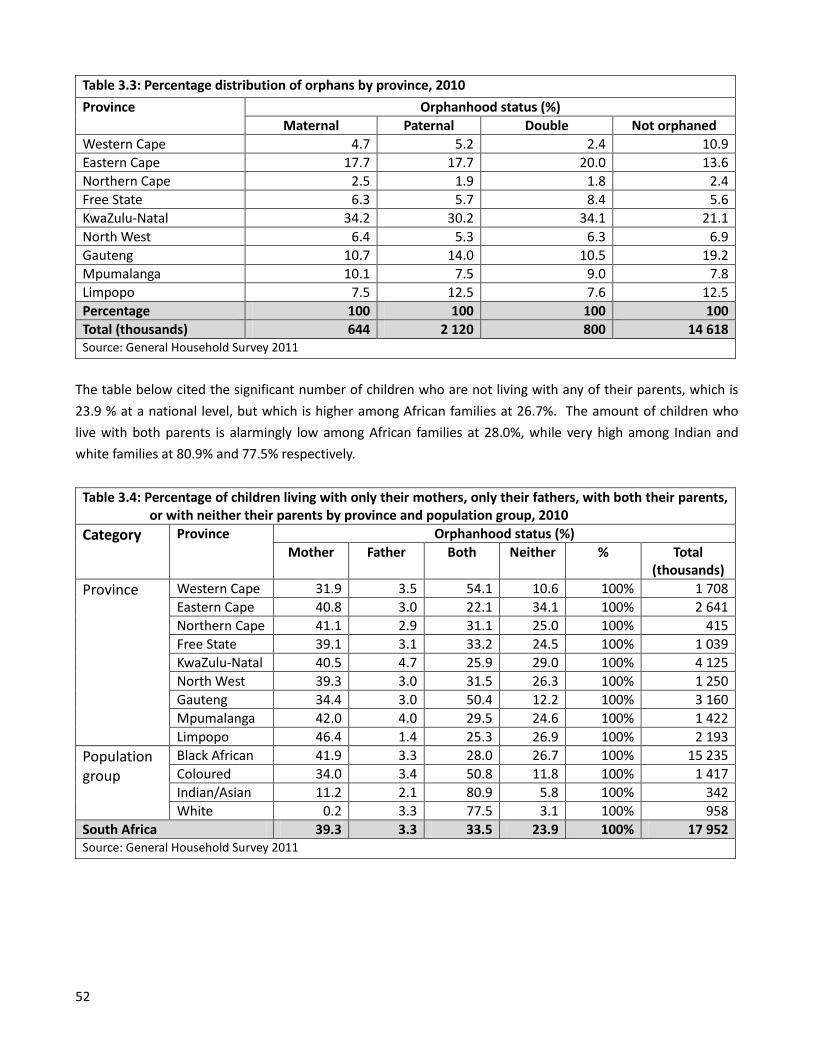
52
Table 3.3: Percentage distribution of orphans by province, 2010
Province Orphanhood status (%)
Maternal Paternal Double Not orphaned
Western Cape 4.7 5.2 2.4 10.9
Eastern Cape 17.7 17.7 20.0 13.6
Northern Cape 2.5 1.9 1.8 2.4
Free State 6.3 5.7 8.4 5.6
KwaZulu-Natal 34.2 30.2 34.1 21.1
North West 6.4 5.3 6.3 6.9
Gauteng 10.7 14.0 10.5 19.2
Mpumalanga 10.1 7.5 9.0 7.8
Limpopo 7.5 12.5 7.6 12.5
Percentage 100 100 100 100
Total (thousands) 644 2 120 800 14 618 Source: General Household Survey 2011
The table below cited the significant number of children who are not living with any of their parents, which is
23.9 % at a national level, but which is higher among African families at 26.7%. The amount of children who
live with both parents is alarmingly low among African families at 28.0%, while very high among Indian and
white families at 80.9% and 77.5% respectively.
Table 3.4: Percentage of children living with only their mothers, only their fathers, with both their parents, or with neither their parents by province and population group, 2010
Category Province Orphanhood status (%)
Mother Father Both Neither % Total (thousands)
Province Western Cape 31.9 3.5 54.1 10.6 100% 1 708
Eastern Cape 40.8 3.0 22.1 34.1 100% 2 641
Northern Cape 41.1 2.9 31.1 25.0 100% 415
Free State 39.1 3.1 33.2 24.5 100% 1 039
KwaZulu-Natal 40.5 4.7 25.9 29.0 100% 4 125
North West 39.3 3.0 31.5 26.3 100% 1 250
Gauteng 34.4 3.0 50.4 12.2 100% 3 160
Mpumalanga 42.0 4.0 29.5 24.6 100% 1 422
Limpopo 46.4 1.4 25.3 26.9 100% 2 193
Population group
Black African 41.9 3.3 28.0 26.7 100% 15 235
Coloured 34.0 3.4 50.8 11.8 100% 1 417
Indian/Asian 11.2 2.1 80.9 5.8 100% 342
White 0.2 3.3 77.5 3.1 100% 958
South Africa 39.3 3.3 33.5 23.9 100% 17 952 Source: General Household Survey 2011
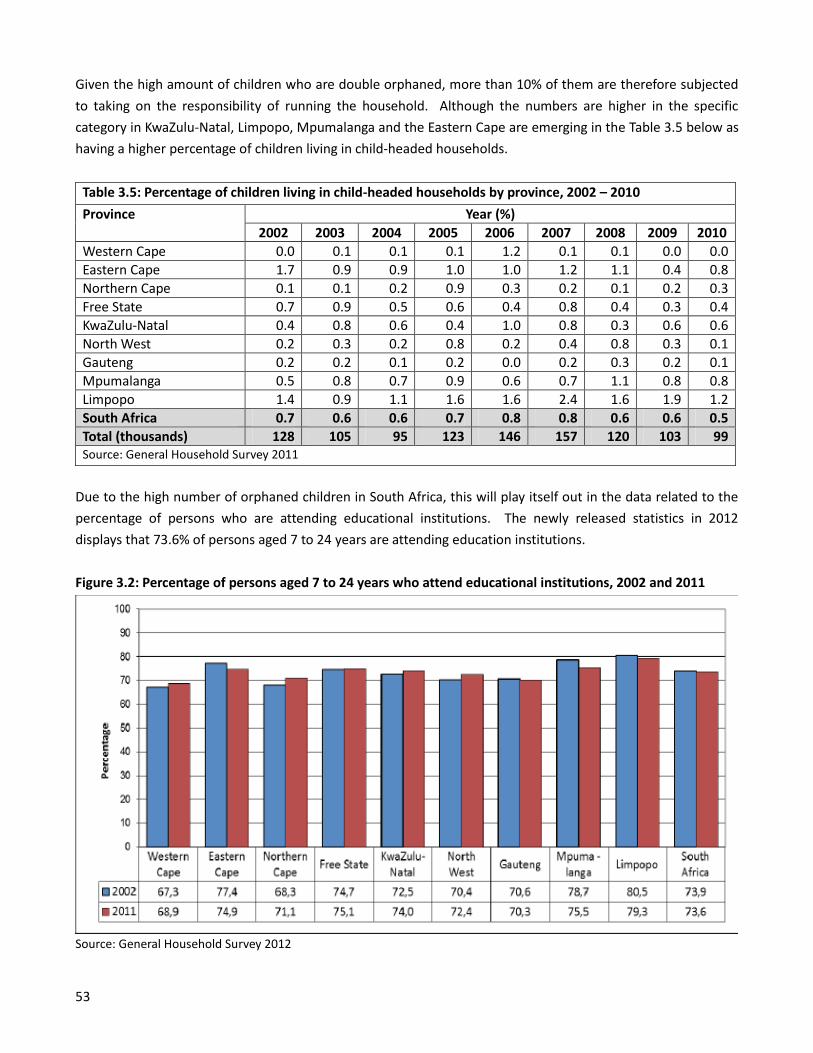
53
Given the high amount of children who are double orphaned, more than 10% of them are therefore subjected
to taking on the responsibility of running the household. Although the numbers are higher in the specific
category in KwaZulu-Natal, Limpopo, Mpumalanga and the Eastern Cape are emerging in the Table 3.5 below as
having a higher percentage of children living in child-headed households.
Table 3.5: Percentage of children living in child-headed households by province, 2002 – 2010
Province Year (%)
2002 2003 2004 2005 2006 2007 2008 2009 2010
Western Cape 0.0 0.1 0.1 0.1 1.2 0.1 0.1 0.0 0.0
Eastern Cape 1.7 0.9 0.9 1.0 1.0 1.2 1.1 0.4 0.8
Northern Cape 0.1 0.1 0.2 0.9 0.3 0.2 0.1 0.2 0.3
Free State 0.7 0.9 0.5 0.6 0.4 0.8 0.4 0.3 0.4
KwaZulu-Natal 0.4 0.8 0.6 0.4 1.0 0.8 0.3 0.6 0.6
North West 0.2 0.3 0.2 0.8 0.2 0.4 0.8 0.3 0.1
Gauteng 0.2 0.2 0.1 0.2 0.0 0.2 0.3 0.2 0.1
Mpumalanga 0.5 0.8 0.7 0.9 0.6 0.7 1.1 0.8 0.8
Limpopo 1.4 0.9 1.1 1.6 1.6 2.4 1.6 1.9 1.2
South Africa 0.7 0.6 0.6 0.7 0.8 0.8 0.6 0.6 0.5
Total (thousands) 128 105 95 123 146 157 120 103 99 Source: General Household Survey 2011
Due to the high number of orphaned children in South Africa, this will play itself out in the data related to the
percentage of persons who are attending educational institutions. The newly released statistics in 2012
displays that 73.6% of persons aged 7 to 24 years are attending education institutions.
Figure 3.2: Percentage of persons aged 7 to 24 years who attend educational institutions, 2002 and 2011
Source: General Household Survey 2012
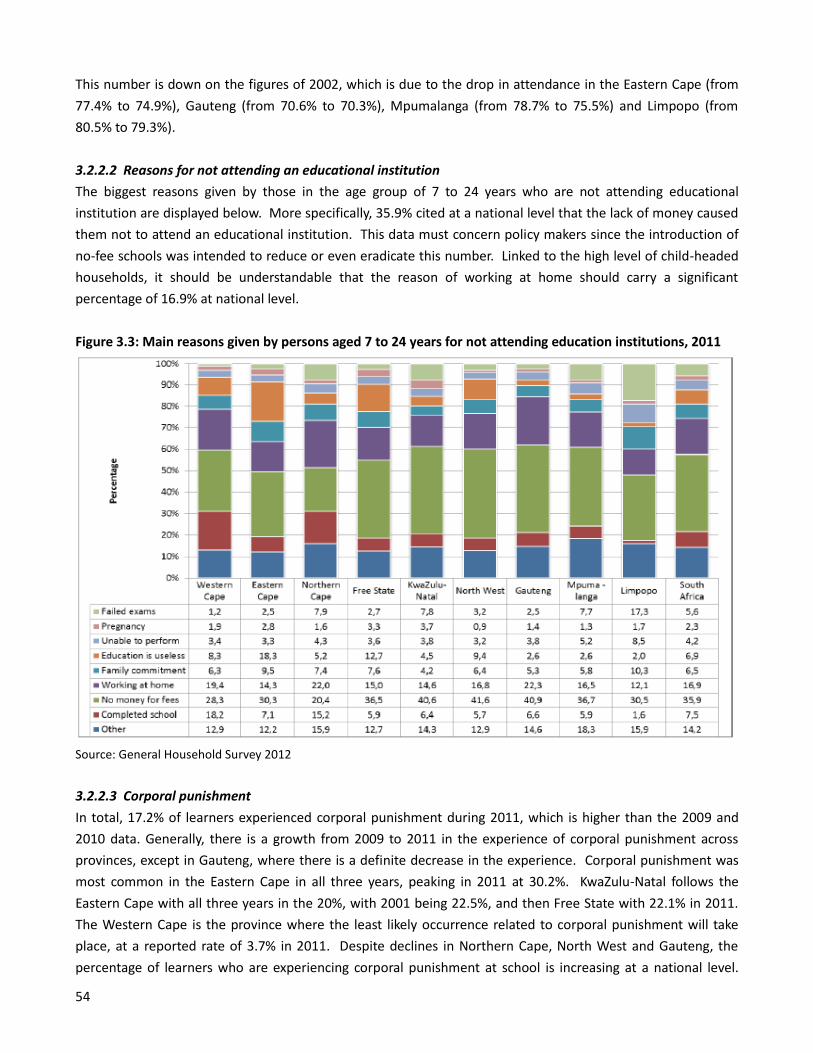
54
This number is down on the figures of 2002, which is due to the drop in attendance in the Eastern Cape (from
77.4% to 74.9%), Gauteng (from 70.6% to 70.3%), Mpumalanga (from 78.7% to 75.5%) and Limpopo (from
80.5% to 79.3%).
3.2.2.2 Reasons for not attending an educational institution
The biggest reasons given by those in the age group of 7 to 24 years who are not attending educational
institution are displayed below. More specifically, 35.9% cited at a national level that the lack of money caused
them not to attend an educational institution. This data must concern policy makers since the introduction of
no-fee schools was intended to reduce or even eradicate this number. Linked to the high level of child-headed
households, it should be understandable that the reason of working at home should carry a significant
percentage of 16.9% at national level.
Figure 3.3: Main reasons given by persons aged 7 to 24 years for not attending education institutions, 2011
Source: General Household Survey 2012
3.2.2.3 Corporal punishment
In total, 17.2% of learners experienced corporal punishment during 2011, which is higher than the 2009 and
2010 data. Generally, there is a growth from 2009 to 2011 in the experience of corporal punishment across
provinces, except in Gauteng, where there is a definite decrease in the experience. Corporal punishment was
most common in the Eastern Cape in all three years, peaking in 2011 at 30.2%. KwaZulu-Natal follows the
Eastern Cape with all three years in the 20%, with 2001 being 22.5%, and then Free State with 22.1% in 2011.
The Western Cape is the province where the least likely occurrence related to corporal punishment will take
place, at a reported rate of 3.7% in 2011. Despite declines in Northern Cape, North West and Gauteng, the
percentage of learners who are experiencing corporal punishment at school is increasing at a national level.
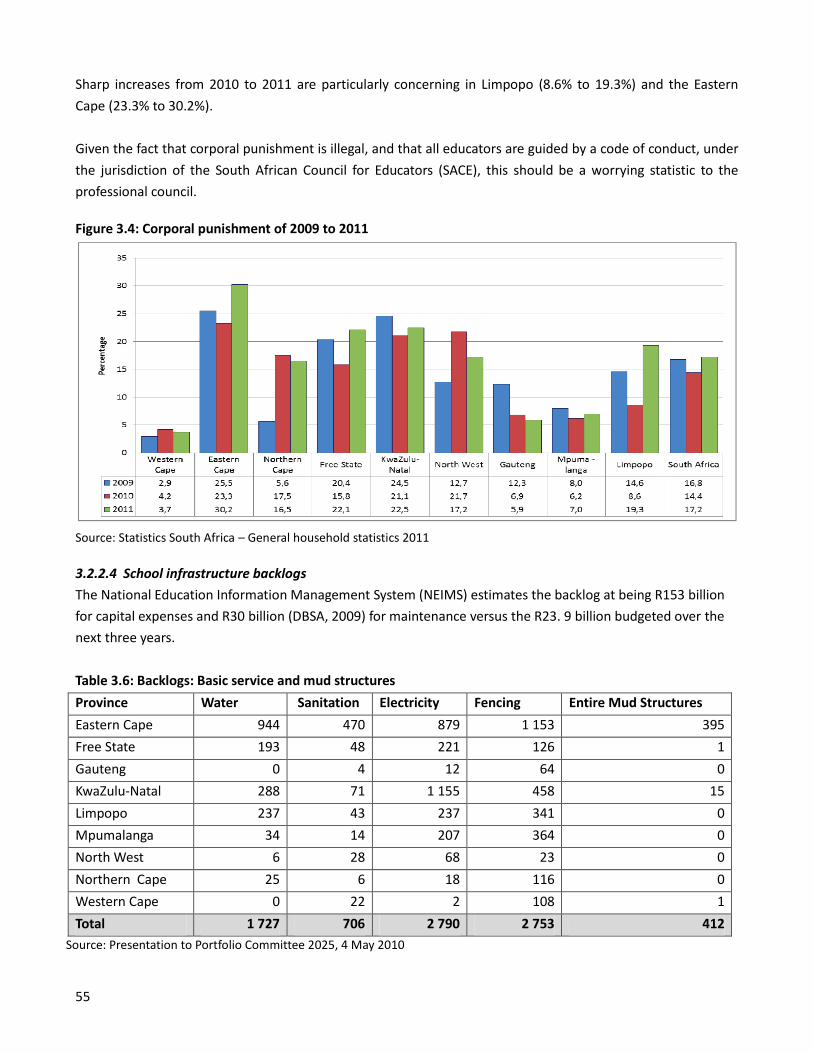
55
Sharp increases from 2010 to 2011 are particularly concerning in Limpopo (8.6% to 19.3%) and the Eastern
Cape (23.3% to 30.2%).
Given the fact that corporal punishment is illegal, and that all educators are guided by a code of conduct, under
the jurisdiction of the South African Council for Educators (SACE), this should be a worrying statistic to the
professional council.
Figure 3.4: Corporal punishment of 2009 to 2011
Source: Statistics South Africa – General household statistics 2011
3.2.2.4 School infrastructure backlogs
The National Education Information Management System (NEIMS) estimates the backlog at being R153 billion
for capital expenses and R30 billion (DBSA, 2009) for maintenance versus the R23. 9 billion budgeted over the
next three years.
Table 3.6: Backlogs: Basic service and mud structures
Province Water Sanitation Electricity Fencing Entire Mud Structures
Eastern Cape 944 470 879 1 153 395
Free State 193 48 221 126 1
Gauteng 0 4 12 64 0
KwaZulu-Natal 288 71 1 155 458 15
Limpopo 237 43 237 341 0
Mpumalanga 34 14 207 364 0
North West 6 28 68 23 0
Northern Cape 25 6 18 116 0
Western Cape 0 22 2 108 1
Total 1 727 706 2 790 2 753 412
Source: Presentation to Portfolio Committee 2025, 4 May 2010
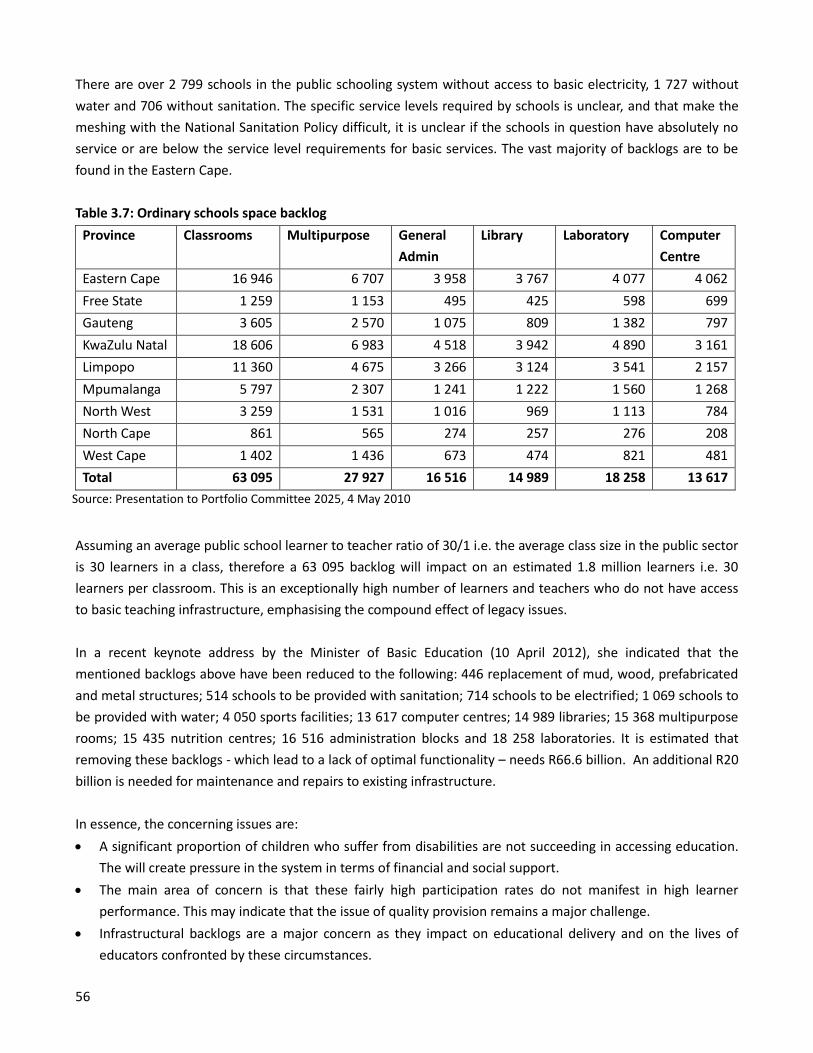
56
There are over 2 799 schools in the public schooling system without access to basic electricity, 1 727 without
water and 706 without sanitation. The specific service levels required by schools is unclear, and that make the
meshing with the National Sanitation Policy difficult, it is unclear if the schools in question have absolutely no
service or are below the service level requirements for basic services. The vast majority of backlogs are to be
found in the Eastern Cape.
Table 3.7: Ordinary schools space backlog
Province Classrooms Multipurpose General
Admin
Library Laboratory Computer
Centre
Eastern Cape 16 946 6 707 3 958 3 767 4 077 4 062
Free State 1 259 1 153 495 425 598 699
Gauteng 3 605 2 570 1 075 809 1 382 797
KwaZulu Natal 18 606 6 983 4 518 3 942 4 890 3 161
Limpopo 11 360 4 675 3 266 3 124 3 541 2 157
Mpumalanga 5 797 2 307 1 241 1 222 1 560 1 268
North West 3 259 1 531 1 016 969 1 113 784
North Cape 861 565 274 257 276 208
West Cape 1 402 1 436 673 474 821 481
Total 63 095 27 927 16 516 14 989 18 258 13 617
Source: Presentation to Portfolio Committee 2025, 4 May 2010
Assuming an average public school learner to teacher ratio of 30/1 i.e. the average class size in the public sector
is 30 learners in a class, therefore a 63 095 backlog will impact on an estimated 1.8 million learners i.e. 30
learners per classroom. This is an exceptionally high number of learners and teachers who do not have access
to basic teaching infrastructure, emphasising the compound effect of legacy issues.
In a recent keynote address by the Minister of Basic Education (10 April 2012), she indicated that the
mentioned backlogs above have been reduced to the following: 446 replacement of mud, wood, prefabricated
and metal structures; 514 schools to be provided with sanitation; 714 schools to be electrified; 1 069 schools to
be provided with water; 4 050 sports facilities; 13 617 computer centres; 14 989 libraries; 15 368 multipurpose
rooms; 15 435 nutrition centres; 16 516 administration blocks and 18 258 laboratories. It is estimated that
removing these backlogs - which lead to a lack of optimal functionality – needs R66.6 billion. An additional R20
billion is needed for maintenance and repairs to existing infrastructure.
In essence, the concerning issues are:
A significant proportion of children who suffer from disabilities are not succeeding in accessing education.
The will create pressure in the system in terms of financial and social support.
The main area of concern is that these fairly high participation rates do not manifest in high learner
performance. This may indicate that the issue of quality provision remains a major challenge.
Infrastructural backlogs are a major concern as they impact on educational delivery and on the lives of
educators confronted by these circumstances.
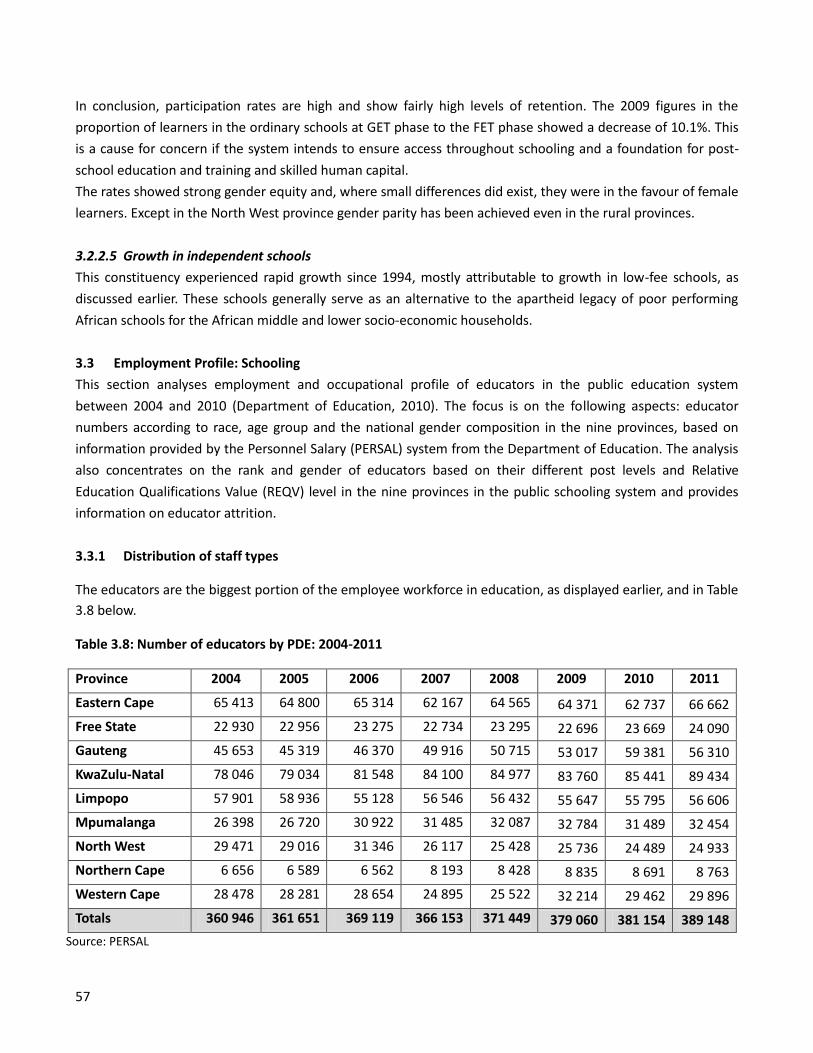
57
In conclusion, participation rates are high and show fairly high levels of retention. The 2009 figures in the
proportion of learners in the ordinary schools at GET phase to the FET phase showed a decrease of 10.1%. This
is a cause for concern if the system intends to ensure access throughout schooling and a foundation for post-
school education and training and skilled human capital.
The rates showed strong gender equity and, where small differences did exist, they were in the favour of female
learners. Except in the North West province gender parity has been achieved even in the rural provinces.
3.2.2.5 Growth in independent schools
This constituency experienced rapid growth since 1994, mostly attributable to growth in low-fee schools, as
discussed earlier. These schools generally serve as an alternative to the apartheid legacy of poor performing
African schools for the African middle and lower socio-economic households.
3.3 Employment Profile: Schooling
This section analyses employment and occupational profile of educators in the public education system
between 2004 and 2010 (Department of Education, 2010). The focus is on the following aspects: educator
numbers according to race, age group and the national gender composition in the nine provinces, based on
information provided by the Personnel Salary (PERSAL) system from the Department of Education. The analysis
also concentrates on the rank and gender of educators based on their different post levels and Relative
Education Qualifications Value (REQV) level in the nine provinces in the public schooling system and provides
information on educator attrition.
3.3.1 Distribution of staff types
The educators are the biggest portion of the employee workforce in education, as displayed earlier, and in Table
3.8 below.
Table 3.8: Number of educators by PDE: 2004-2011
Province 2004 2005 2006 2007 2008 2009 2010 2011
Eastern Cape 65 413 64 800 65 314 62 167 64 565 64 371 62 737 66 662
Free State 22 930 22 956 23 275 22 734 23 295 22 696 23 669 24 090
Gauteng 45 653 45 319 46 370 49 916 50 715 53 017 59 381 56 310
KwaZulu-Natal 78 046 79 034 81 548 84 100 84 977 83 760 85 441 89 434
Limpopo 57 901 58 936 55 128 56 546 56 432 55 647 55 795 56 606
Mpumalanga 26 398 26 720 30 922 31 485 32 087 32 784 31 489 32 454
North West 29 471 29 016 31 346 26 117 25 428 25 736 24 489 24 933
Northern Cape 6 656 6 589 6 562 8 193 8 428 8 835 8 691 8 763
Western Cape 28 478 28 281 28 654 24 895 25 522 32 214 29 462 29 896
Totals 360 946 361 651 369 119 366 153 371 449 379 060 381 154 389 148
Source: PERSAL
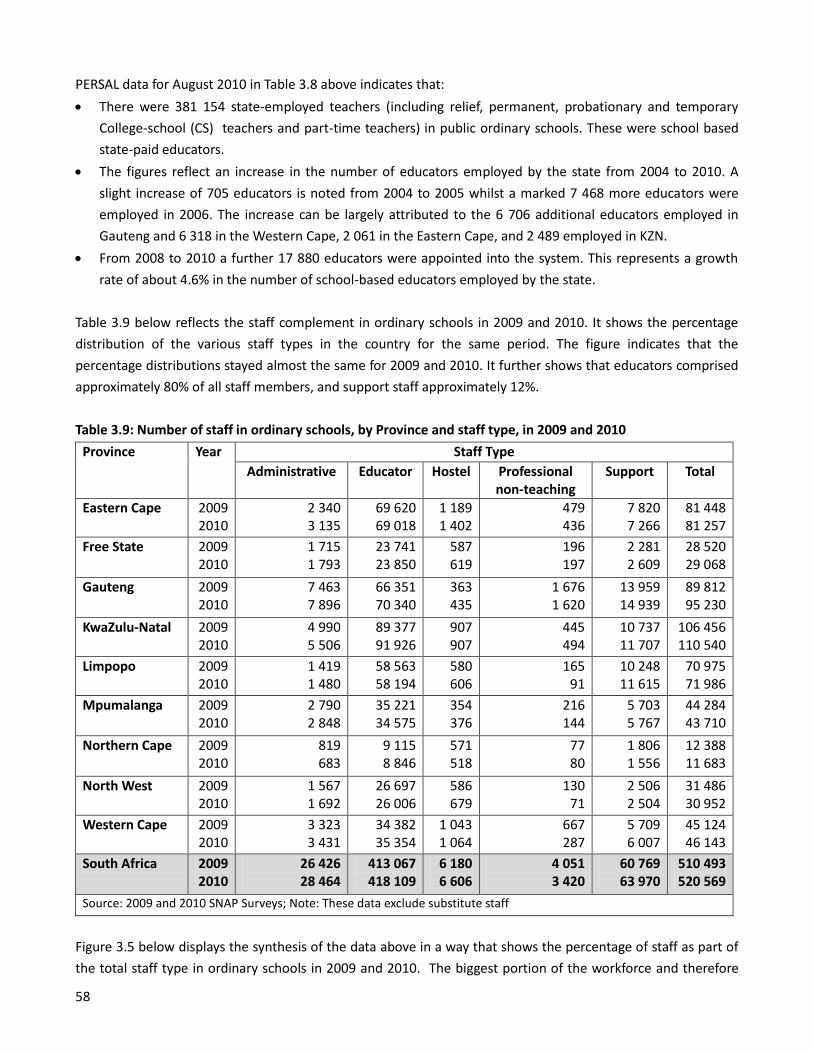
58
PERSAL data for August 2010 in Table 3.8 above indicates that:
There were 381 154 state-employed teachers (including relief, permanent, probationary and temporary
College-school (CS) teachers and part-time teachers) in public ordinary schools. These were school based
state-paid educators.
The figures reflect an increase in the number of educators employed by the state from 2004 to 2010. A
slight increase of 705 educators is noted from 2004 to 2005 whilst a marked 7 468 more educators were
employed in 2006. The increase can be largely attributed to the 6 706 additional educators employed in
Gauteng and 6 318 in the Western Cape, 2 061 in the Eastern Cape, and 2 489 employed in KZN.
From 2008 to 2010 a further 17 880 educators were appointed into the system. This represents a growth
rate of about 4.6% in the number of school-based educators employed by the state.
Table 3.9 below reflects the staff complement in ordinary schools in 2009 and 2010. It shows the percentage
distribution of the various staff types in the country for the same period. The figure indicates that the
percentage distributions stayed almost the same for 2009 and 2010. It further shows that educators comprised
approximately 80% of all staff members, and support staff approximately 12%.
Table 3.9: Number of staff in ordinary schools, by Province and staff type, in 2009 and 2010
Province Year Staff Type
Administrative Educator Hostel Professional non-teaching
Support Total
Eastern Cape 2009 2010
2 340 3 135
69 620 69 018
1 189 1 402
479 436
7 820 7 266
81 448 81 257
Free State 2009 2010
1 715 1 793
23 741 23 850
587 619
196 197
2 281 2 609
28 520 29 068
Gauteng 2009 2010
7 463 7 896
66 351 70 340
363 435
1 676 1 620
13 959 14 939
89 812 95 230
KwaZulu-Natal 2009 2010
4 990 5 506
89 377 91 926
907 907
445 494
10 737 11 707
106 456 110 540
Limpopo 2009 2010
1 419 1 480
58 563 58 194
580 606
165 91
10 248 11 615
70 975 71 986
Mpumalanga 2009 2010
2 790 2 848
35 221 34 575
354 376
216 144
5 703 5 767
44 284 43 710
Northern Cape 2009 2010
819 683
9 115 8 846
571 518
77 80
1 806 1 556
12 388 11 683
North West 2009 2010
1 567 1 692
26 697 26 006
586 679
130 71
2 506 2 504
31 486 30 952
Western Cape 2009 2010
3 323 3 431
34 382 35 354
1 043 1 064
667 287
5 709 6 007
45 124 46 143
South Africa 2009 2010
26 426 28 464
413 067 418 109
6 180 6 606
4 051 3 420
60 769 63 970
510 493 520 569
Source: 2009 and 2010 SNAP Surveys; Note: These data exclude substitute staff
Figure 3.5 below displays the synthesis of the data above in a way that shows the percentage of staff as part of
the total staff type in ordinary schools in 2009 and 2010. The biggest portion of the workforce and therefore
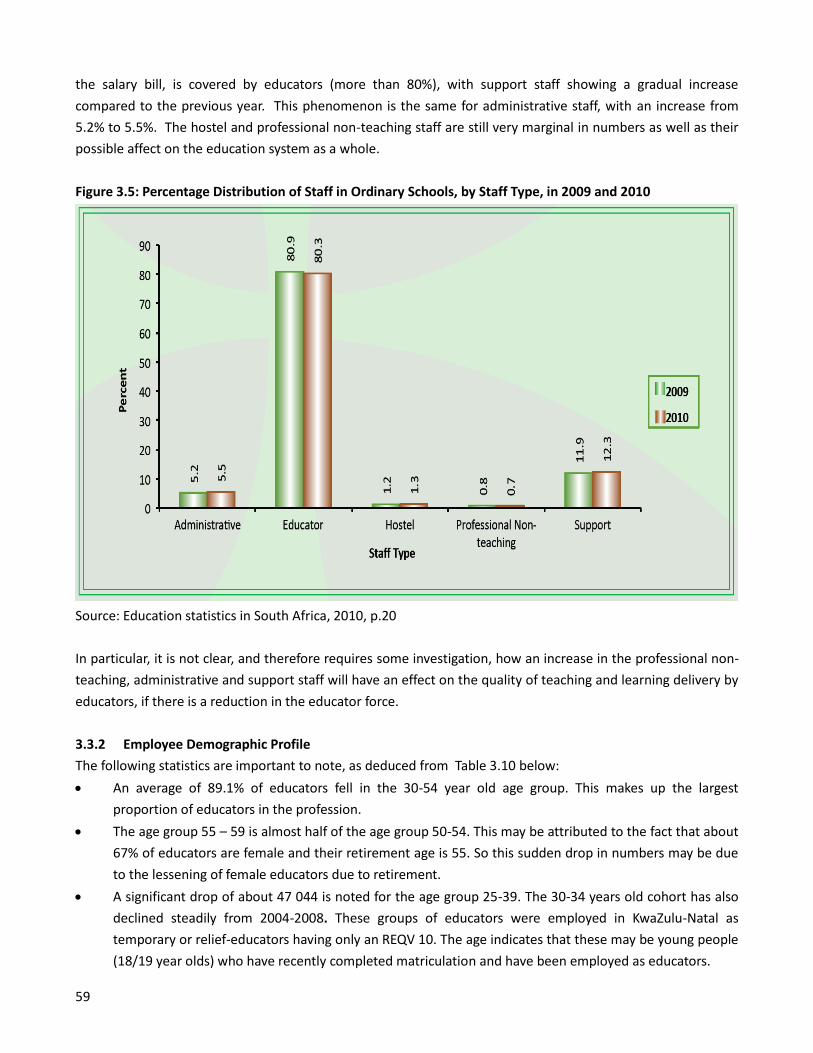
59
the salary bill, is covered by educators (more than 80%), with support staff showing a gradual increase
compared to the previous year. This phenomenon is the same for administrative staff, with an increase from
5.2% to 5.5%. The hostel and professional non-teaching staff are still very marginal in numbers as well as their
possible affect on the education system as a whole.
Figure 3.5: Percentage Distribution of Staff in Ordinary Schools, by Staff Type, in 2009 and 2010
Source: Education statistics in South Africa, 2010, p.20
In particular, it is not clear, and therefore requires some investigation, how an increase in the professional non-
teaching, administrative and support staff will have an effect on the quality of teaching and learning delivery by
educators, if there is a reduction in the educator force.
3.3.2 Employee Demographic Profile
The following statistics are important to note, as deduced from Table 3.10 below:
An average of 89.1% of educators fell in the 30-54 year old age group. This makes up the largest
proportion of educators in the profession.
The age group 55 – 59 is almost half of the age group 50-54. This may be attributed to the fact that about
67% of educators are female and their retirement age is 55. So this sudden drop in numbers may be due
to the lessening of female educators due to retirement.
A significant drop of about 47 044 is noted for the age group 25-39. The 30-34 years old cohort has also
declined steadily from 2004-2008. These groups of educators were employed in KwaZulu-Natal as
temporary or relief-educators having only an REQV 10. The age indicates that these may be young people
(18/19 year olds) who have recently completed matriculation and have been employed as educators.
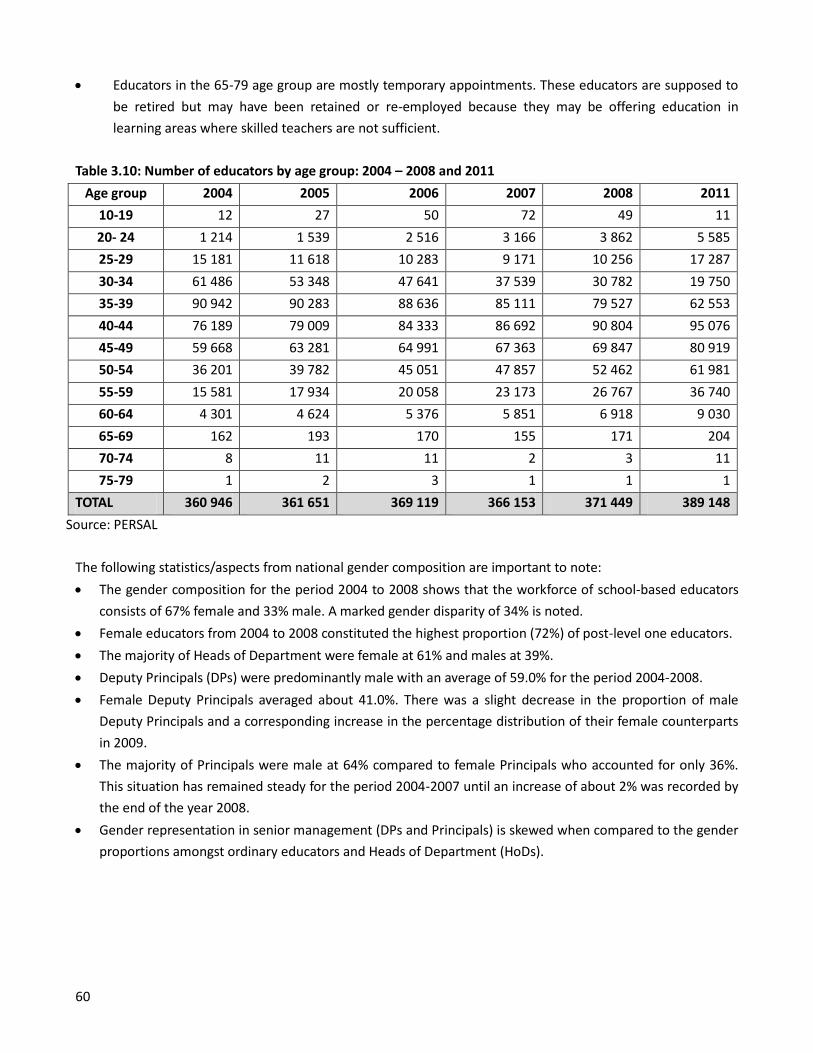
60
Educators in the 65-79 age group are mostly temporary appointments. These educators are supposed to
be retired but may have been retained or re-employed because they may be offering education in
learning areas where skilled teachers are not sufficient.
Table 3.10: Number of educators by age group: 2004 – 2008 and 2011
Age group 2004 2005 2006 2007 2008 2011
10-19 12 27 50 72 49 11
20- 24 1 214 1 539 2 516 3 166 3 862 5 585
25-29 15 181 11 618 10 283 9 171 10 256 17 287
30-34 61 486 53 348 47 641 37 539 30 782 19 750
35-39 90 942 90 283 88 636 85 111 79 527 62 553
40-44 76 189 79 009 84 333 86 692 90 804 95 076
45-49 59 668 63 281 64 991 67 363 69 847 80 919
50-54 36 201 39 782 45 051 47 857 52 462 61 981
55-59 15 581 17 934 20 058 23 173 26 767 36 740
60-64 4 301 4 624 5 376 5 851 6 918 9 030
65-69 162 193 170 155 171 204
70-74 8 11 11 2 3 11
75-79 1 2 3 1 1 1
TOTAL 360 946 361 651 369 119 366 153 371 449 389 148
Source: PERSAL
The following statistics/aspects from national gender composition are important to note:
The gender composition for the period 2004 to 2008 shows that the workforce of school-based educators
consists of 67% female and 33% male. A marked gender disparity of 34% is noted.
Female educators from 2004 to 2008 constituted the highest proportion (72%) of post-level one educators.
The majority of Heads of Department were female at 61% and males at 39%.
Deputy Principals (DPs) were predominantly male with an average of 59.0% for the period 2004-2008.
Female Deputy Principals averaged about 41.0%. There was a slight decrease in the proportion of male
Deputy Principals and a corresponding increase in the percentage distribution of their female counterparts
in 2009.
The majority of Principals were male at 64% compared to female Principals who accounted for only 36%.
This situation has remained steady for the period 2004-2007 until an increase of about 2% was recorded by
the end of the year 2008.
Gender representation in senior management (DPs and Principals) is skewed when compared to the gender
proportions amongst ordinary educators and Heads of Department (HoDs).
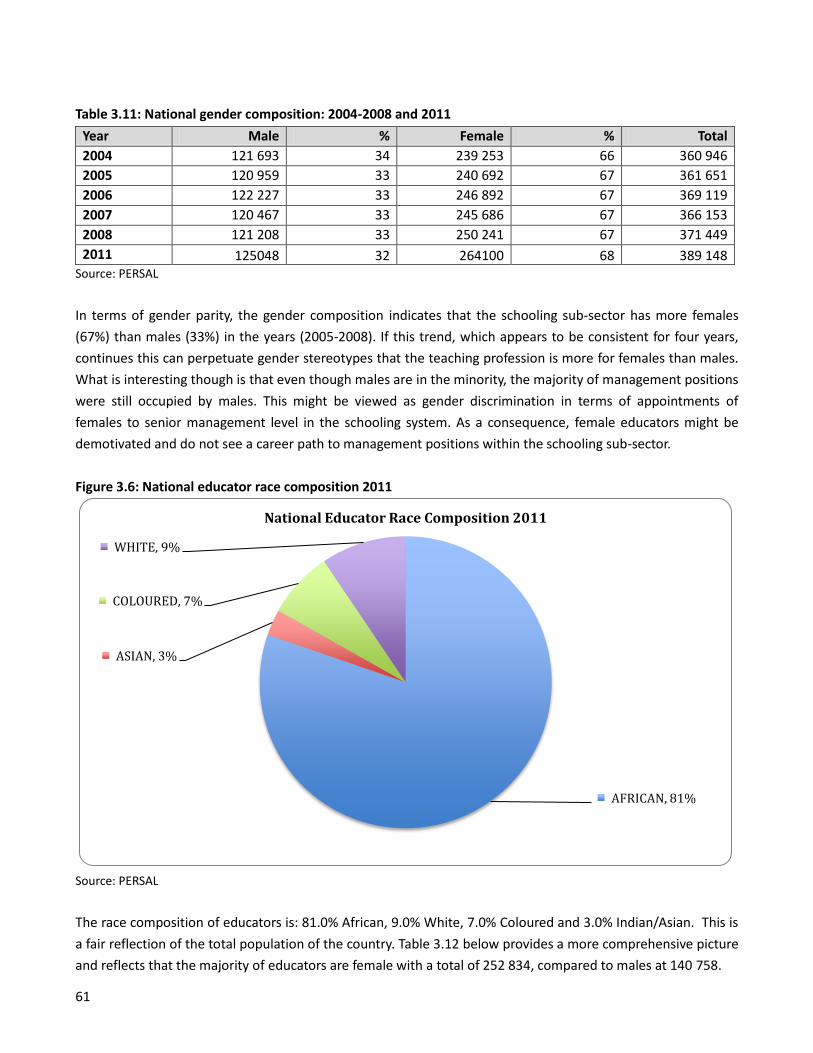
61
Table 3.11: National gender composition: 2004-2008 and 2011
Year Male % Female % Total
2004 121 693 34 239 253 66 360 946
2005 120 959 33 240 692 67 361 651
2006 122 227 33 246 892 67 369 119
2007 120 467 33 245 686 67 366 153
2008 121 208 33 250 241 67 371 449
2011 125048 32 264100 68 389 148 Source: PERSAL
In terms of gender parity, the gender composition indicates that the schooling sub-sector has more females
(67%) than males (33%) in the years (2005-2008). If this trend, which appears to be consistent for four years,
continues this can perpetuate gender stereotypes that the teaching profession is more for females than males.
What is interesting though is that even though males are in the minority, the majority of management positions
were still occupied by males. This might be viewed as gender discrimination in terms of appointments of
females to senior management level in the schooling system. As a consequence, female educators might be
demotivated and do not see a career path to management positions within the schooling sub-sector.
Figure 3.6: National educator race composition 2011
Source: PERSAL
The race composition of educators is: 81.0% African, 9.0% White, 7.0% Coloured and 3.0% Indian/Asian. This is
a fair reflection of the total population of the country. Table 3.12 below provides a more comprehensive picture
and reflects that the majority of educators are female with a total of 252 834, compared to males at 140 758.
AFRICAN, 81%
ASIAN, 3%
COLOURED, 7%
WHITE, 9%
National Educator Race Composition 2011
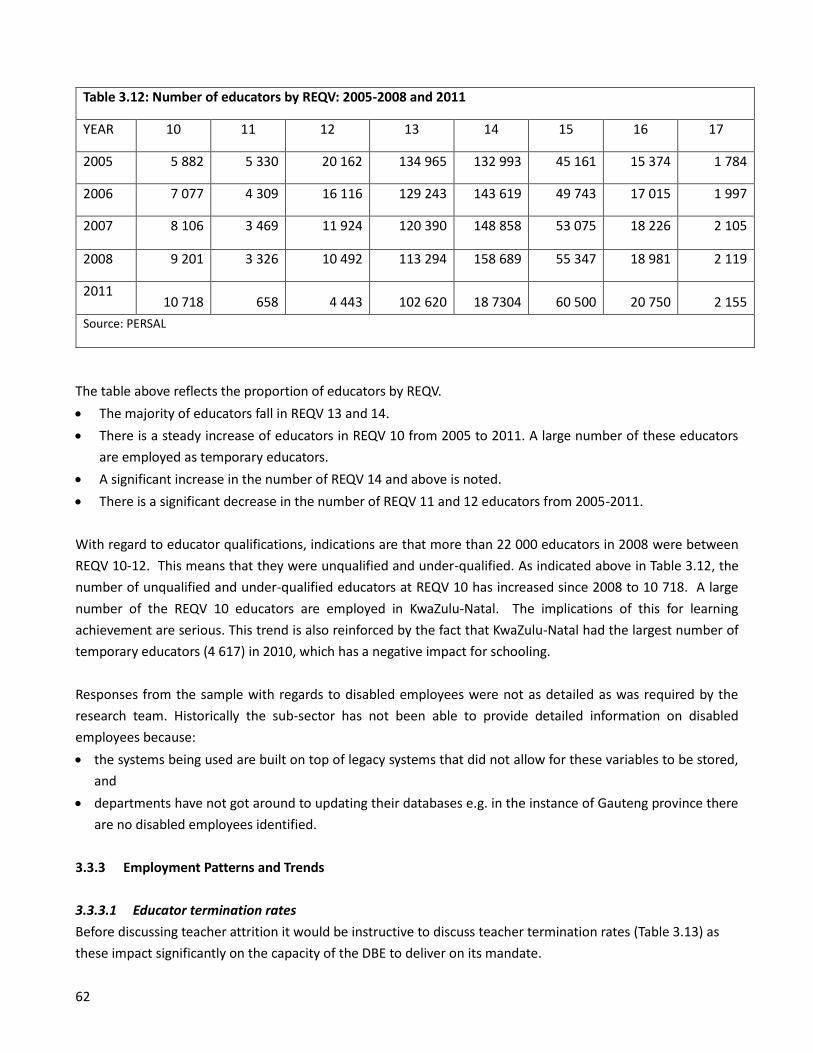
62
The table above reflects the proportion of educators by REQV.
The majority of educators fall in REQV 13 and 14.
There is a steady increase of educators in REQV 10 from 2005 to 2011. A large number of these educators
are employed as temporary educators.
A significant increase in the number of REQV 14 and above is noted.
There is a significant decrease in the number of REQV 11 and 12 educators from 2005-2011.
With regard to educator qualifications, indications are that more than 22 000 educators in 2008 were between
REQV 10-12. This means that they were unqualified and under-qualified. As indicated above in Table 3.12, the
number of unqualified and under-qualified educators at REQV 10 has increased since 2008 to 10 718. A large
number of the REQV 10 educators are employed in KwaZulu-Natal. The implications of this for learning
achievement are serious. This trend is also reinforced by the fact that KwaZulu-Natal had the largest number of
temporary educators (4 617) in 2010, which has a negative impact for schooling.
Responses from the sample with regards to disabled employees were not as detailed as was required by the
research team. Historically the sub-sector has not been able to provide detailed information on disabled
employees because:
the systems being used are built on top of legacy systems that did not allow for these variables to be stored,
and
departments have not got around to updating their databases e.g. in the instance of Gauteng province there
are no disabled employees identified.
3.3.3 Employment Patterns and Trends
3.3.3.1 Educator termination rates
Before discussing teacher attrition it would be instructive to discuss teacher termination rates (Table 3.13) as
these impact significantly on the capacity of the DBE to deliver on its mandate.
Table 3.12: Number of educators by REQV: 2005-2008 and 2011
YEAR 10 11 12 13 14 15 16 17
2005 5 882 5 330 20 162 134 965 132 993 45 161 15 374 1 784
2006 7 077 4 309 16 116 129 243 143 619 49 743 17 015 1 997
2007 8 106 3 469 11 924 120 390 148 858 53 075 18 226 2 105
2008 9 201 3 326 10 492 113 294 158 689 55 347 18 981 2 119
2011 10 718 658 4 443 102 620 18 7304 60 500 20 750 2 155
Source: PERSAL
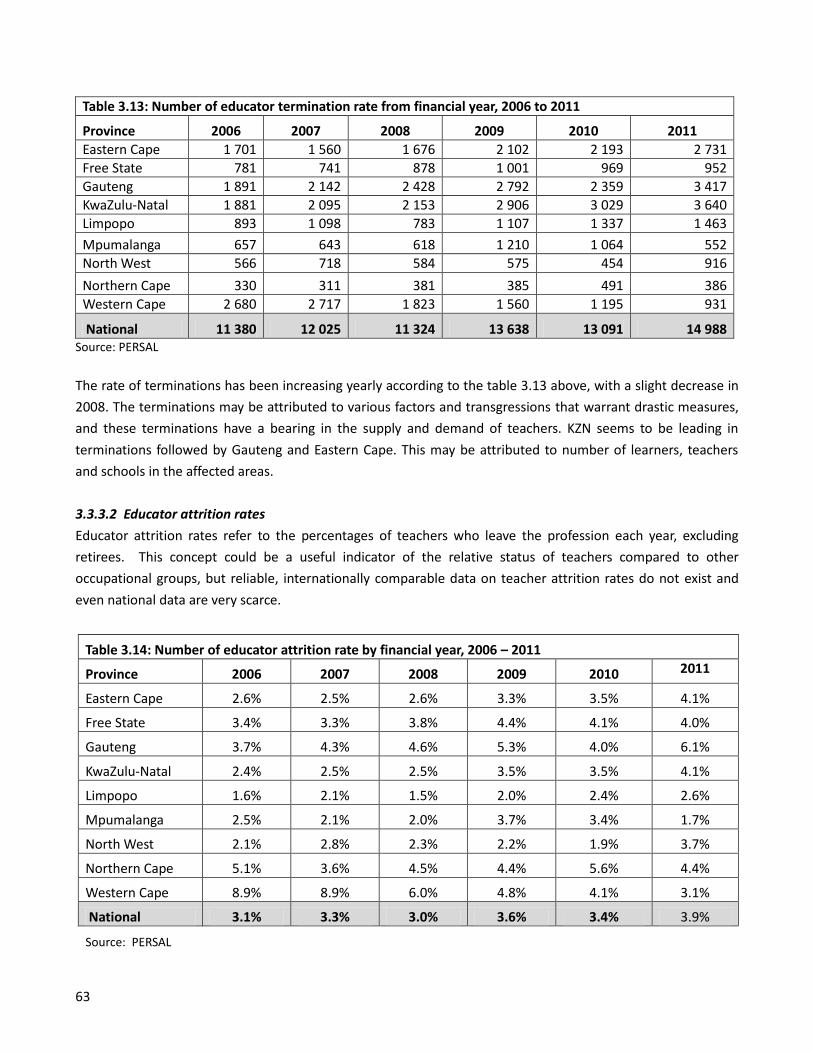
63
Table 3.13: Number of educator termination rate from financial year, 2006 to 2011
Province 2006 2007 2008 2009 2010 2011
Eastern Cape 1 701 1 560 1 676 2 102 2 193 2 731
Free State 781 741 878 1 001 969 952
Gauteng 1 891 2 142 2 428 2 792 2 359 3 417
KwaZulu-Natal 1 881 2 095 2 153 2 906 3 029 3 640
Limpopo 893 1 098 783 1 107 1 337 1 463
Mpumalanga 657 643 618 1 210 1 064 552
North West 566 718 584 575 454 916
Northern Cape 330 311 381 385 491 386
Western Cape 2 680 2 717 1 823 1 560 1 195 931
National 11 380 12 025 11 324 13 638 13 091 14 988 Source: PERSAL
The rate of terminations has been increasing yearly according to the table 3.13 above, with a slight decrease in
2008. The terminations may be attributed to various factors and transgressions that warrant drastic measures,
and these terminations have a bearing in the supply and demand of teachers. KZN seems to be leading in
terminations followed by Gauteng and Eastern Cape. This may be attributed to number of learners, teachers
and schools in the affected areas.
3.3.3.2 Educator attrition rates
Educator attrition rates refer to the percentages of teachers who leave the profession each year, excluding
retirees. This concept could be a useful indicator of the relative status of teachers compared to other
occupational groups, but reliable, internationally comparable data on teacher attrition rates do not exist and
even national data are very scarce.
Table 3.14: Number of educator attrition rate by financial year, 2006 – 2011
Province 2006 2007 2008 2009 2010 2011
Eastern Cape 2.6% 2.5% 2.6% 3.3% 3.5% 4.1%
Free State 3.4% 3.3% 3.8% 4.4% 4.1% 4.0%
Gauteng 3.7% 4.3% 4.6% 5.3% 4.0% 6.1%
KwaZulu-Natal 2.4% 2.5% 2.5% 3.5% 3.5% 4.1%
Limpopo 1.6% 2.1% 1.5% 2.0% 2.4% 2.6%
Mpumalanga 2.5% 2.1% 2.0% 3.7% 3.4% 1.7%
North West 2.1% 2.8% 2.3% 2.2% 1.9% 3.7%
Northern Cape 5.1% 3.6% 4.5% 4.4% 5.6% 4.4%
Western Cape 8.9% 8.9% 6.0% 4.8% 4.1% 3.1%
National 3.1% 3.3% 3.0% 3.6% 3.4% 3.9%
Source: PERSAL
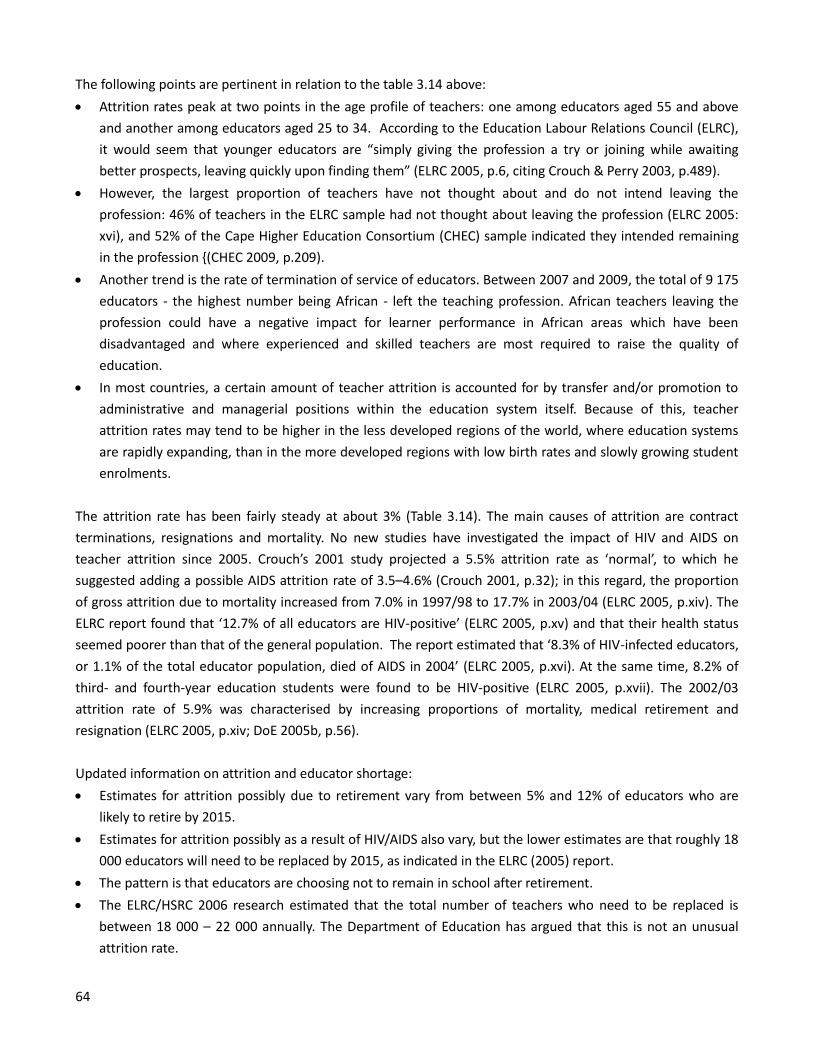
64
The following points are pertinent in relation to the table 3.14 above:
Attrition rates peak at two points in the age profile of teachers: one among educators aged 55 and above
and another among educators aged 25 to 34. According to the Education Labour Relations Council (ELRC),
it would seem that younger educators are “simply giving the profession a try or joining while awaiting
better prospects, leaving quickly upon finding them” (ELRC 2005, p.6, citing Crouch & Perry 2003, p.489).
However, the largest proportion of teachers have not thought about and do not intend leaving the
profession: 46% of teachers in the ELRC sample had not thought about leaving the profession (ELRC 2005:
xvi), and 52% of the Cape Higher Education Consortium (CHEC) sample indicated they intended remaining
in the profession {(CHEC 2009, p.209).
Another trend is the rate of termination of service of educators. Between 2007 and 2009, the total of 9 175
educators - the highest number being African - left the teaching profession. African teachers leaving the
profession could have a negative impact for learner performance in African areas which have been
disadvantaged and where experienced and skilled teachers are most required to raise the quality of
education.
In most countries, a certain amount of teacher attrition is accounted for by transfer and/or promotion to
administrative and managerial positions within the education system itself. Because of this, teacher
attrition rates may tend to be higher in the less developed regions of the world, where education systems
are rapidly expanding, than in the more developed regions with low birth rates and slowly growing student
enrolments.
The attrition rate has been fairly steady at about 3% (Table 3.14). The main causes of attrition are contract
terminations, resignations and mortality. No new studies have investigated the impact of HIV and AIDS on
teacher attrition since 2005. Crouch’s 2001 study projected a 5.5% attrition rate as ‘normal’, to which he
suggested adding a possible AIDS attrition rate of 3.5–4.6% (Crouch 2001, p.32); in this regard, the proportion
of gross attrition due to mortality increased from 7.0% in 1997/98 to 17.7% in 2003/04 (ELRC 2005, p.xiv). The
ELRC report found that ‘12.7% of all educators are HIV-positive’ (ELRC 2005, p.xv) and that their health status
seemed poorer than that of the general population. The report estimated that ‘8.3% of HIV-infected educators,
or 1.1% of the total educator population, died of AIDS in 2004’ (ELRC 2005, p.xvi). At the same time, 8.2% of
third- and fourth-year education students were found to be HIV-positive (ELRC 2005, p.xvii). The 2002/03
attrition rate of 5.9% was characterised by increasing proportions of mortality, medical retirement and
resignation (ELRC 2005, p.xiv; DoE 2005b, p.56).
Updated information on attrition and educator shortage:
Estimates for attrition possibly due to retirement vary from between 5% and 12% of educators who are
likely to retire by 2015.
Estimates for attrition possibly as a result of HIV/AIDS also vary, but the lower estimates are that roughly 18
000 educators will need to be replaced by 2015, as indicated in the ELRC (2005) report.
The pattern is that educators are choosing not to remain in school after retirement.
The ELRC/HSRC 2006 research estimated that the total number of teachers who need to be replaced is
between 18 000 – 22 000 annually. The Department of Education has argued that this is not an unusual
attrition rate.
65
The current and projected shortages are also subject and phase specific, with mathematics and science
subject areas reporting particularly high shortages. The Minister of Basic Education earlier in 2012
indicated that “a total of 561 schools in KwaZulu-Natal needed additional mathematics teachers, with 557
needing mathematical literacy teachers and 508 requiring more science teachers” (Sunday World, 2012).
While causes of attrition are not always clear, there are also varied claims about why education is failing to
attract interest from potential new entrants.
In a study conducted by the HSRC for the ELRC in 2005, it was found that 55% of teachers would leave teaching
if they could. The reasons cited for this included:
workload stress
low salaries
lack of discipline in schools, and
lack of career advancement.
Attrition rates seem greatest among younger teachers; employment options and pension considerations act
seem to keep many older teachers in the profession. The loss of young teachers from the profession creates a
drain on the strength of the teaching force. The working conditions for teachers vary enormously, depending on
the location and environmental circumstances of schools. Apart from their direct professional responsibilities,
many teachers have to cope with the effects of major socio-economic disadvantage and domestic dysfunction.
The high South African unemployment rate masks a much higher incidence in some areas, with the resultant
social consequences (OECD, 2010). Some of these factors include:
Education of parents - Many parents are unable to give the understanding and active support to their
children to help their progression at school. Many lack formal education themselves. “Parent education
levels are strongly associated with the well-being of children, child survival rates and the capacity to
support children through school. The census of 2001 noted the high illiteracy rate in South Africa,
particularly among women, as problematic with consequences for children because women are most often
the primary caregivers … Many parents lack the knowledge, confidence and material resources to support
their children’s education therefore many children either do not attend school or prop out in the early
grades.” (ELRU, 2007)
Impact of social issues – There are great concern among policy makers and teachers about a growing, but
destructive sub-culture impinging on school life. This include incidences of vandalism, learner violence,
intimidation and rape - which are sometimes fuelled by indulgence in drug-taking - impinge on school life
(DBSA, 2009). In the past, most educational current expenditure went on paying teacher salaries. The
proportion retained for discretionary funding on school resources has improved in recent years – from
However, expenditure on the security needs of some schools has been making inroads into these funds.
Despite the pressure on schools to respond to above mentioned community issues, they also have to cope
with the side effects of family breakdown, increased incidence of single parent families and the migratory
patterns of parents who have to travel far from home in search of work.
Remote areas - Some provinces have been finding it very difficult to recruit teachers for remote rural areas,
while for some subjects, such as mathematics or science, it this has been virtually impossible. Incentives
66
such as bonuses and transport are being used to encourage teachers to go to such schools. (Christie, et al,
2007)
HIV/AIDS- The impact of HIV/AIDS on South African society has been severe and has also taken its toll
among the teaching force. A study on the health of educators, conducted for the ELRC (2005), revealed that
there was a high incidence of HIV among educators, at 12.7%, with the highest prevalence among Africans
at 16%. The highest proportion of affected teachers was in the younger age bracket, those who had been
teaching from 0 to 14 years, who accounted for 55.5% of those affected. Educators residing and working in
rural areas had significantly higher HIV prevalence than those inurban areas (Peltzer, et al, 2005).
Workload- A study on teacher workload for the ELRC reported that many teachers often arrive late to
school and leave early; much of the time spent at school is devoted to administrative tasks, rather than
teaching and learning. Thus, the working conditions for many teachers are not conducive to high-level
performance. Teachers in former whites-only schools teach in class for an average of 6.5 hours a day, while
teachers in schools in disadvantaged communities teach for around 3.5 hours a day. The result is that the
outcomes of learners in these schools are unequal (Presidency, 2009). There is therefore a need to look
beyond the subject skills gap in disadvantaged schools, and also factors in the need for motivational,
commitment and time-on-task skills among teachers in the mentioned schools.
According to a UNESCO Report (1998), in most countries, a certain amount of teacher attrition is accounted for
by transfer and/or promotion to administrative and managerial positions within the education system itself;
because of this, teacher attrition rates may tend to be higher in the less developed regions of the world, where
education systems are rapidly expanding, than in the more developed regions with low birth rates and slowly
growing student enrolments.
In Africa in the 1960s and 1970s, ex-teachers could be found throughout the state administrations of most of
the newly independent countries. However, teacher attrition rates have probably been highest in East and
Central Europe, and the countries of the former Soviet Union, partly because of the difficulties facing all
categories of public sector employees in most of these countries, but also in part because many teachers found
that they had skills (e.g. foreign languages, information technology) which have been in demand in the
burgeoning private industrial and service sectors.
Ingersoll (2002) maintains that OECD countries vary in their experience of the demand for, and supply of
teachers. However, the overall trend is similar to the experience of Australia. The OECD publication Education
Policy Analysis 2002 makes the following observations:
In half of OECD countries, a majority of 15-year olds attend a school whose principal thinks that student
learning is hindered at least a little by a teacher shortage/inadequacy.
In certain countries, although by no means all, it is becoming harder to fill teaching posts.
Attrition rates from the teaching profession vary widely across countries. In some, the majority of people
leaving teaching are retiring; in others only a small minority.
Teaching workforces are ageing across the OECD. In some OECD countries, over 40 percent of teachers are
in their 50s.
In almost all countries, teacher salaries fell relative to national income per head during the late 1990s.
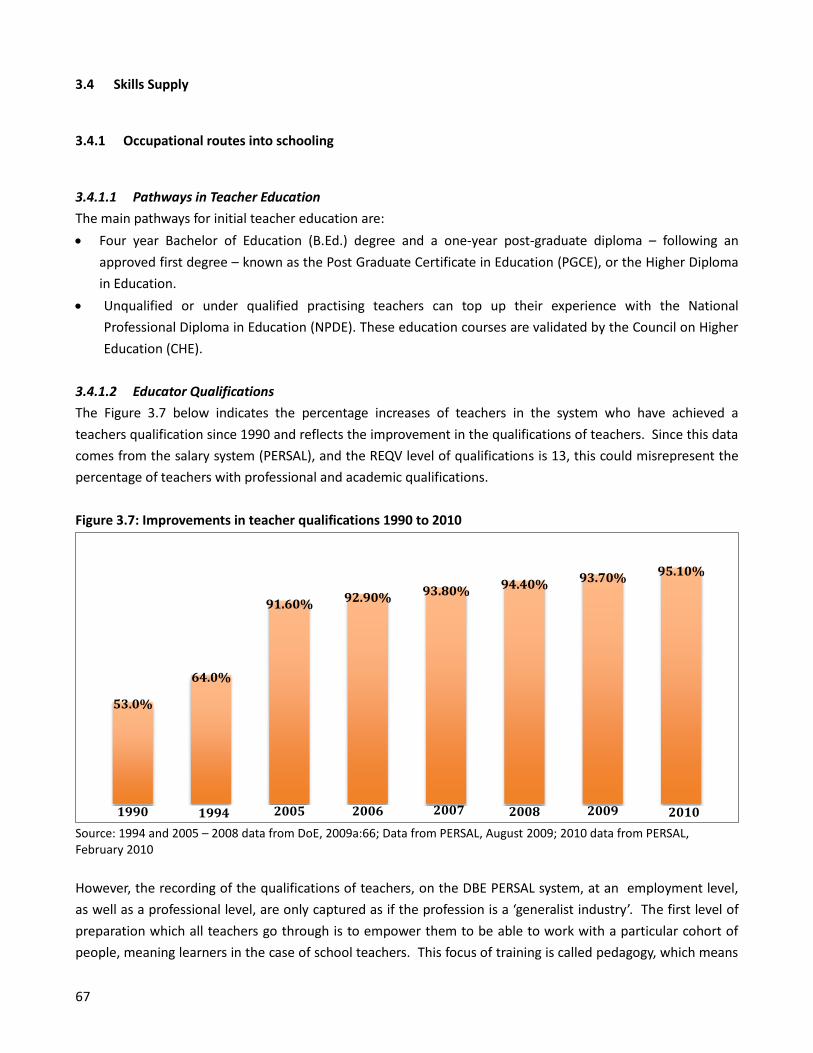
67
3.4 Skills Supply
3.4.1 Occupational routes into schooling
3.4.1.1 Pathways in Teacher Education
The main pathways for initial teacher education are:
Four year Bachelor of Education (B.Ed.) degree and a one-year post-graduate diploma – following an
approved first degree – known as the Post Graduate Certificate in Education (PGCE), or the Higher Diploma
in Education.
Unqualified or under qualified practising teachers can top up their experience with the National
Professional Diploma in Education (NPDE). These education courses are validated by the Council on Higher
Education (CHE).
3.4.1.2 Educator Qualifications
The Figure 3.7 below indicates the percentage increases of teachers in the system who have achieved a
teachers qualification since 1990 and reflects the improvement in the qualifications of teachers. Since this data
comes from the salary system (PERSAL), and the REQV level of qualifications is 13, this could misrepresent the
percentage of teachers with professional and academic qualifications.
Figure 3.7: Improvements in teacher qualifications 1990 to 2010
Source: 1994 and 2005 – 2008 data from DoE, 2009a:66; Data from PERSAL, August 2009; 2010 data from PERSAL, February 2010
However, the recording of the qualifications of teachers, on the DBE PERSAL system, at an employment level,
as well as a professional level, are only captured as if the profession is a ‘generalist industry’. The first level of
preparation which all teachers go through is to empower them to be able to work with a particular cohort of
people, meaning learners in the case of school teachers. This focus of training is called pedagogy, which means
1990 1994 2005 2006 2007 2008 2009 2010
53.0%
64.0%
91.60% 92.90% 93.80% 94.40% 93.70% 95.10%
68
the skills to work with children. The second level of preparation focuses on the particular subject(s) the
teachers will employ to facilitate learning among children. Currently, teachers are only recorded as to whether
they have a teachers qualification, meaning whether they are pedagogues. It means that the focus is on the
generalist capacity and skills for teachers, rather than the specialist skills like mathematics, accounting, etc.
Such generalist skills include building positive relationships between teachers and learners, different learning
styles, listening skills, etc. But the success of learners in any learning area is also dependent on the capacity,
skills and ability of teachers to know the content of their learning areas. Clarity around the above-mentioned
issue and practice is crucial in relation to the definitions within the skills development sector regarding ‘scarce
and critical skills’. As stated by the Department of Labour (DoL, 2006), “scarce skills, as a concept, refers to an
absolute or relative demand for skilled people to fill particular roles/ professions or occupations in the labour
market”, while “critical skills as a concept, refers to the demand for an element of the practical, foundational or
reflexive competence that allows for specialisation within roles/ professions or occupations and includes
specific ‘top-up’ skills”. In the absent of moving the schooling sub-sector to a specialist industry, will nullify the
important distinctions which are contained within these two concepts, with specific reference to the need to
have practical, foundational and reflexive competences to allow teachers to be specialists within their area of
teaching.
The ETDP SETA (2010) reporting on data from the Department of Education (2009), notes that, the majority of
educators in the schooling system is qualified (i.e minimum of 3 years of teacher training qualification). In 1990
53% of educators were qualified compared to 94.4% in 2008. Although the majority of educators is qualified,
performance of learners in terms of throughputs and graduate rates does not reflect a high quality of educator
impact in the schooling system. When comparing the average learners who entered schools in 1999 to 2010,
there is a throughput rate of less than 50%. Gallie (2011) argues that of the average number 1.2 million
learners who enter schooling in grade one every year, about 0.5 million learners end up writing the matric
examination. And according to the Annual National Assessment (ANA) results of 2011 (DBE 2011), the average
learner pass in grade 3 in Literacy was 35%, and 28% in Numeracy, while in grade 6 the average pass was 28% in
Languages and 30% in Mathematics. In terms of racial breakdown of educator qualifications, 93.9% of Blacks,
92.2% of Coloureds, 98.1% of Indians and 99.5% of Whites are qualified. The lack of qualified teachers in the
majority of schools, who are staffed mostly by Black teachers, will therefore have a negative impact on the
qualify of teaching, let alone the quality of facilitating learning and the improvement of learner learning in the
education system.
According to the Criteria for the Recognition of Qualifications for Employment in Education based on the Norms
and Standards for Education a minimum REQV 13 (which equates to a minimum of three-year professional
training) is required in order to be registered with the South African Council for Educators. There are three
criteria that are used in order to identify teachers as unqualified or under-qualified. These are teachers who do
not have (i) a matriculation, or (ii) National Senior Certificate and three years of training as a teacher, or (iii)
who have received training outside the field of education.
The fact that learning outcomes among children and youth remain low as indicated in the ANA results and the
throughput rate above, while the percentage of qualified educators has increased, raises questions about the
value of these qualifications as a measure of the competence of teachers. A discussion on the impact of
69
educator qualifications on the quality of educational outcomes would be enhanced by also looking at issues
such as educators’ subject matter knowledge, their pedagogical skills, the use of learning material and
curriculum coverage as well as the quality of educator training.
Even though there was a significant improvement in the number of qualified educators between 1990 and 2008
(from 53% to 94.4%) a corresponding improvement in learner performance has not been noted. This has been
described as “a sharp distinction between qualifications and competence”. During the workshop on the Charter
of Basic Education Rights for Children in South Africa, on 19 July 2012, it was argued that there are also
indications that the majority of teachers know little more about the subject they teach than the children they
teach and some teachers know even less (SAHRC: 2012).
It is also imperative that issues related to Recognition of Prior Learning (RPL) be considered, especially in
relation to the process of verifying the relevance and applicability of learning outcomes. Educators generally
have exposure to formal and informal training. According to SAQA, “Recognition of prior learning means the
comparison of the previous learning and experience of a learner howsoever obtained against the learning
outcomes required for a specified qualification, and the acceptance for purposes of qualification of that which
meets the requirements”.
This definition makes clear a number of principles in the development and execution of RPL:
Learning occurs in all kinds of situations – formal, informal and non-formal
Measurement of the learning takes place against specific learning outcomes required for a specific
qualification and
Credits are awarded for such learning if it meets the requirements of the qualification.
Therefore, the process of recognising prior learning is about:
Identifying what the candidate knows and can do
Matching the candidate’s skills, knowledge and experience to specific standards and the associated
assessment criteria of a qualification
Assessing the candidate against those standards and
Crediting the candidate for skills, knowledge and experience built up through formal, informal and non-
formal learning that occurred in the past.
According to Class Consulting’s research paper (2005), Recognition of Prior Learning occurs where formal or
informal learning experience is suitably assessed, and, where appropriate, is recognised through the provision
of credits. Recognition of Prior Learning needs to be contextualised to incorporate culture, language, race,
gender and class as determinants of access and redress rather than of gate-keeping.
The DoE needs to ensure the development of flexible RPL processes that meet the needs of educators. RPL
facilitators and assessors need to be trained to advance the principle of redress and equity. Their training
programmes should include:
Culturally appropriate and flexible assessment methods
70
Cultural support during assessment
Cultural awareness on the part of the RPL facilitator and assessor
Appropriate language requirements of the benchmark and
The assessment of language and literacy skills by a language expert.
In order to affirm and continuously empower educators, RPL processes must be instituted to give recognition to
training of any description and experience.
The ultimate responsibility for supplying educator personnel through recruitment, preparation, induction,
development and utilisation of human resources in the public education sector lies with the public authority
and public institutions. This supply is operationalised and coordinated through structures such as the
Department of Basic Education (DBE) and the nine Provincial Education Departments (PDEs) for public
schooling (DBE, 2011-2025).
All efforts to improve educators and their development are vested within the support of the Department of
Basic Education and the PDEs, the DHET, the teacher unions, the South African Council for Educators (SACE) and
the Education, Training and Development Practice Sector Education and Training Authority {(ETDP-Seta) (DBE,
2011-2025)}.
There is both an absolute shortage of teachers and a relative shortage of teachers qualified and competent
enough to teach specific subjects or learning areas (primarily mathematics, the sciences, technology and
languages), especially in specific phases like the Foundation Phase, in Special Needs schools and in rural and
remote areas.
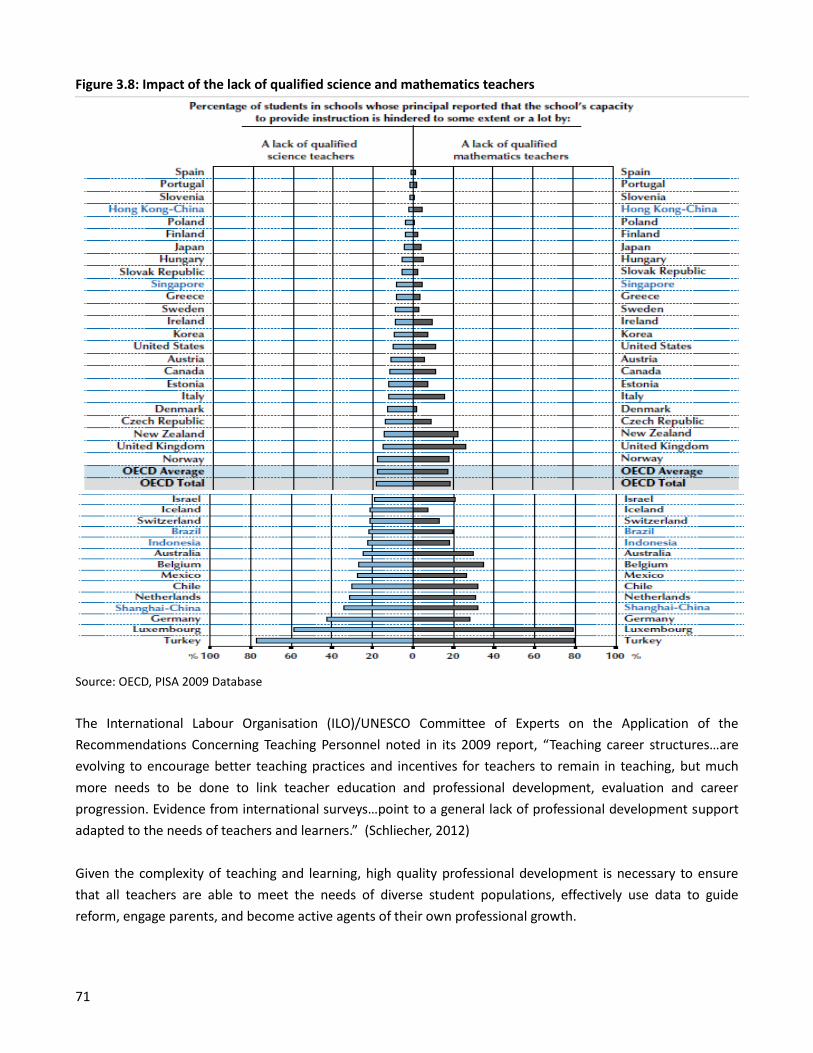
71
Figure 3.8: Impact of the lack of qualified science and mathematics teachers
Source: OECD, PISA 2009 Database
The International Labour Organisation (ILO)/UNESCO Committee of Experts on the Application of the
Recommendations Concerning Teaching Personnel noted in its 2009 report, “Teaching career structures…are
evolving to encourage better teaching practices and incentives for teachers to remain in teaching, but much
more needs to be done to link teacher education and professional development, evaluation and career
progression. Evidence from international surveys…point to a general lack of professional development support
adapted to the needs of teachers and learners.” (Schliecher, 2012)
Given the complexity of teaching and learning, high quality professional development is necessary to ensure
that all teachers are able to meet the needs of diverse student populations, effectively use data to guide
reform, engage parents, and become active agents of their own professional growth.
72
The development of teachers beyond their initial education can serve a range of purposes, including to:
update individuals’ knowledge of a subject in light of recent advances in the area;
update individuals’ skills and approaches in light of the development of new teaching techniques and
objectives, new circumstances, and new educational research;
enable individuals to apply changes made to curricula or other aspects of teaching practice;
enable schools to develop and apply new strategies concerning the curriculum and other aspects of
teaching practice;
exchange information and expertise among teachers and others, e.g. academics and industrialists; and/or
help weaker teachers become more effective.
Issues of professional development are not just relevant to the overall supply of quality teachers, but also to
address specific issues of teacher shortages. Across the 18 OECD countries participating in the Teaching and
Learning International Survey (TALIS), the aspect of teachers’ work most frequently rated by teachers as an area
of need for development was “Teaching special learning needs students”. This can be especially challenging in
the case of disadvantaged schools, as students in these schools often have a wider range of abilities and needs.
In seeking to meet teachers’ professional development requirements, policy makers and practitioners need to
consider both how to support and encourage participation and how to ensure that opportunities match
teachers’ needs. This needs to be balanced with the cost in terms of both finance and teachers’ time. OECD
research identifies several aspects as central to successfully bridging the gap between the ideal learning
environment and day-to-day practice:
Effective professional development needs to be ongoing, include training, practice and feedback, and
provide adequate time and follow-up support. Successful programs involve teachers in learning activities
that are similar to those they will use with their students and encourage the development of teachers’
learning communities.
Teacher development needs to be linked with wider goals of school and system development, and with
appraisal and feedback practices and school evaluation.
There is often a need to re-examine structures and practices that inhibit inter-disciplinary practice and to
provide more room for teachers to take time to learn deeply, and employ inquiry- and group-based
approaches, especially in the core areas of curriculum and assessment.
In the South African context there has been a decline in teacher graduates for a variety of reasons.
Universities have limited capacity to enroll large numbers of students as compared to the teacher training
colleges.
Financial constraints and restrictive university requirements are said to be possible contributing factors
also.
Other reasons include diminishing interest in teaching, poor public image of the profession, uncertainty
regarding job placement and competition for talented students from other high wage sectors such as
engineering, financial services, mining and medicine and challenging working conditions.
73
In 2009, 5 942 new educators graduated from public higher education institutions, about 1 275 were
Foundation Phase teachers and about 2 949 were FET-level teachers. Given the particular shortage in the
number of qualifying Foundation Phase teachers there has been a substantial growth in the total number of
Foundation Phase Full-Time Equivalents (FTEs) (24.9%) and an even greater growth in the number of first-time
enrolments (52.2%).
3.4.2 Skills Supply Analysis
The Employment of Educators Act (EEA, No. 76 of 1998) allows converting a temporary appointment to a
permanent appointment without recommendation from the School Governing Body (SGB). Therefore
temporary appointments (in vacant substantive posts) of all suitably qualified teachers who match the profile of
the post they are occupying could be converted to permanent. These teachers could also apply either for the
same or other posts once they are advertised in terms of the applicable regulations in the Personnel
Administration Measures (PAM).
The existing legislation provisions and regulations enable permanent appointment of temporary teachers. As a
result the rate of temporary appointments has reduced over the years and there is also no reason why teachers
can be kept in temporary posts for long periods. There are however, also instances why some teachers
employed in temporary positions are not employed permanently. The main reasons include unqualified or
under-qualified teachers who temporarily occupy posts in which suitably qualified candidates could not be
found and qualified teachers who do not suitably match the profile of the post they are temporarily occupying.
The percentage of temporary educators employed was 13 555 in relation to the total educator workforce in the
system (411 164) which is 3.3%. High number of temporary educators were recorded in Eastern Cape (3 588),
KwaZulu-Natal (4 617) and Gauteng (1 964). Although the number of temporary educators seems to be
insignificant, it has an impact in easing the supply and demand of teachers.
Table 3.15 indicates the number of vacancies in the provinces in 2008, 2010 and 2011. It must be noted that the
number of vacancies does not imply a shortage of educators in the labour market. It simply means that
provincial education departments have not filled vacant posts.
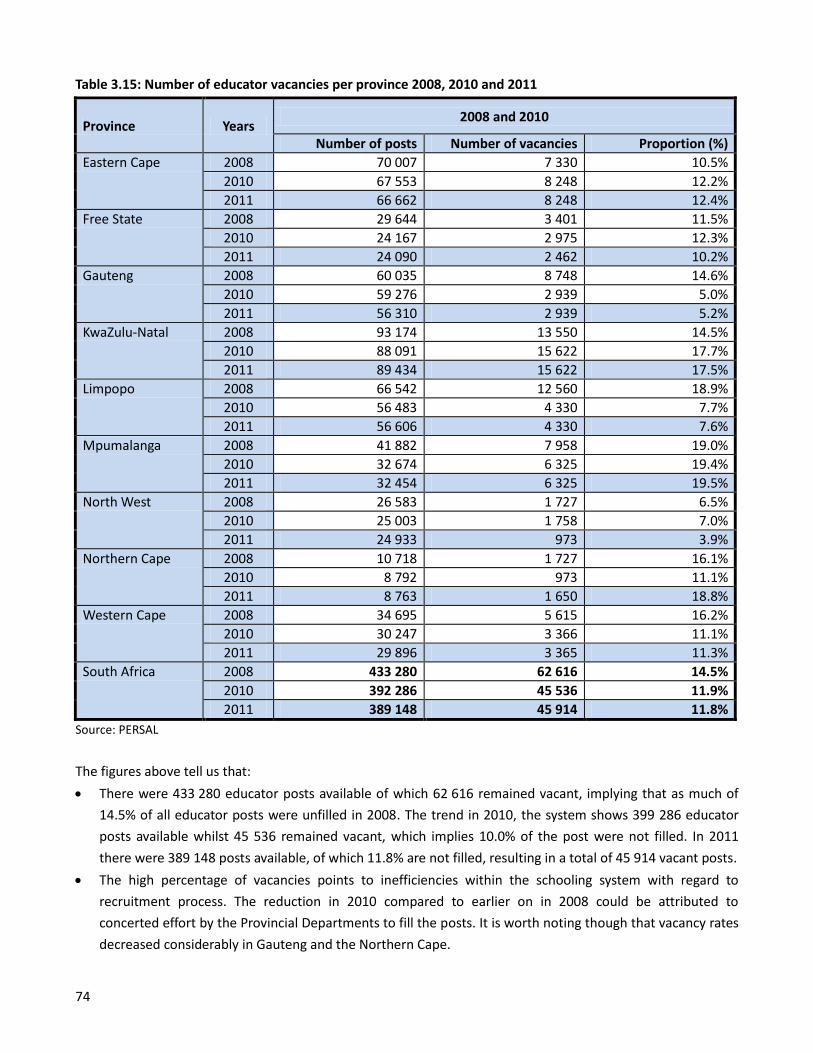
74
Table 3.15: Number of educator vacancies per province 2008, 2010 and 2011
Province Years 2008 and 2010
Number of posts Number of vacancies Proportion (%)
Eastern Cape 2008 70 007 7 330 10.5%
2010 67 553 8 248 12.2%
2011 66 662 8 248 12.4%
Free State 2008 29 644 3 401 11.5%
2010 24 167 2 975 12.3%
2011 24 090 2 462 10.2%
Gauteng 2008 60 035 8 748 14.6%
2010 59 276 2 939 5.0%
2011 56 310 2 939 5.2%
KwaZulu-Natal 2008 93 174 13 550 14.5%
2010 88 091 15 622 17.7%
2011 89 434 15 622 17.5%
Limpopo 2008 66 542 12 560 18.9%
2010 56 483 4 330 7.7%
2011 56 606 4 330 7.6%
Mpumalanga 2008 41 882 7 958 19.0%
2010 32 674 6 325 19.4%
2011 32 454 6 325 19.5%
North West 2008 26 583 1 727 6.5%
2010 25 003 1 758 7.0%
2011 24 933 973 3.9%
Northern Cape 2008 10 718 1 727 16.1%
2010 8 792 973 11.1%
2011 8 763 1 650 18.8%
Western Cape 2008 34 695 5 615 16.2%
2010 30 247 3 366 11.1%
2011 29 896 3 365 11.3%
South Africa 2008 433 280 62 616 14.5%
2010 392 286 45 536 11.9%
2011 389 148 45 914 11.8%
Source: PERSAL
The figures above tell us that:
There were 433 280 educator posts available of which 62 616 remained vacant, implying that as much of
14.5% of all educator posts were unfilled in 2008. The trend in 2010, the system shows 399 286 educator
posts available whilst 45 536 remained vacant, which implies 10.0% of the post were not filled. In 2011
there were 389 148 posts available, of which 11.8% are not filled, resulting in a total of 45 914 vacant posts.
The high percentage of vacancies points to inefficiencies within the schooling system with regard to
recruitment process. The reduction in 2010 compared to earlier on in 2008 could be attributed to
concerted effort by the Provincial Departments to fill the posts. It is worth noting though that vacancy rates
decreased considerably in Gauteng and the Northern Cape.
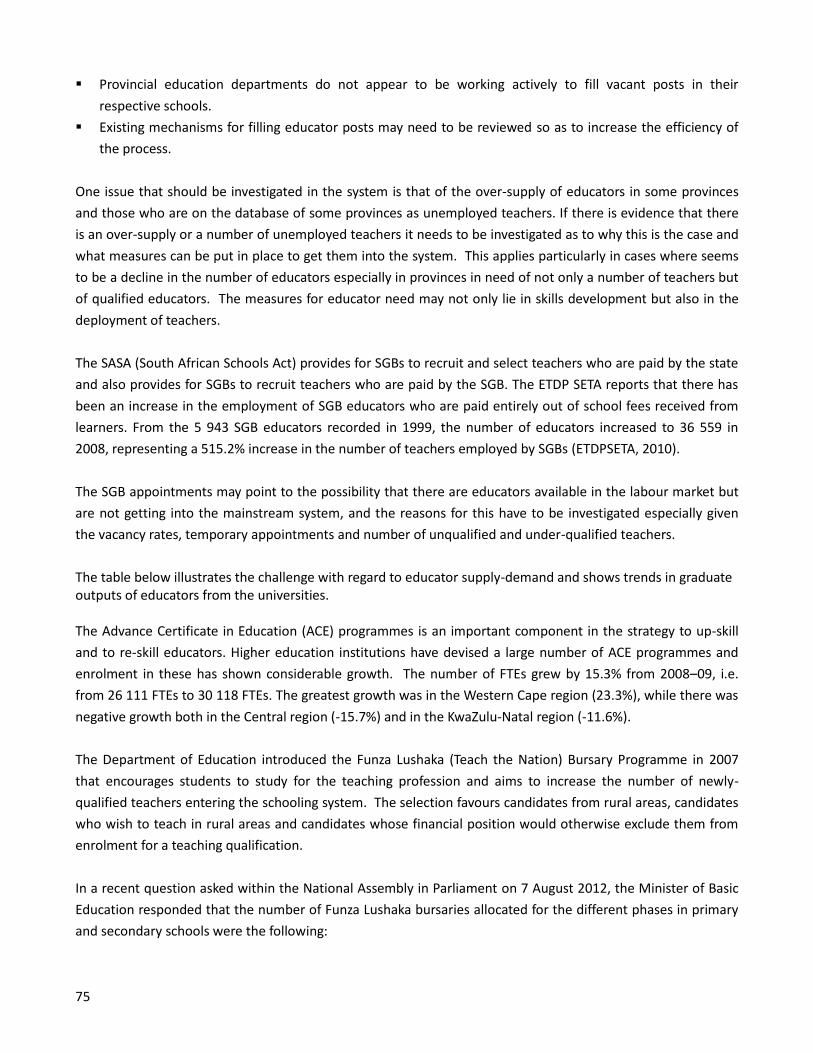
75
Provincial education departments do not appear to be working actively to fill vacant posts in their
respective schools.
Existing mechanisms for filling educator posts may need to be reviewed so as to increase the efficiency of
the process.
One issue that should be investigated in the system is that of the over-supply of educators in some provinces
and those who are on the database of some provinces as unemployed teachers. If there is evidence that there
is an over-supply or a number of unemployed teachers it needs to be investigated as to why this is the case and
what measures can be put in place to get them into the system. This applies particularly in cases where seems
to be a decline in the number of educators especially in provinces in need of not only a number of teachers but
of qualified educators. The measures for educator need may not only lie in skills development but also in the
deployment of teachers.
The SASA (South African Schools Act) provides for SGBs to recruit and select teachers who are paid by the state
and also provides for SGBs to recruit teachers who are paid by the SGB. The ETDP SETA reports that there has
been an increase in the employment of SGB educators who are paid entirely out of school fees received from
learners. From the 5 943 SGB educators recorded in 1999, the number of educators increased to 36 559 in
2008, representing a 515.2% increase in the number of teachers employed by SGBs (ETDPSETA, 2010).
The SGB appointments may point to the possibility that there are educators available in the labour market but
are not getting into the mainstream system, and the reasons for this have to be investigated especially given
the vacancy rates, temporary appointments and number of unqualified and under-qualified teachers.
The table below illustrates the challenge with regard to educator supply-demand and shows trends in graduate outputs of educators from the universities. The Advance Certificate in Education (ACE) programmes is an important component in the strategy to up-skill
and to re-skill educators. Higher education institutions have devised a large number of ACE programmes and
enrolment in these has shown considerable growth. The number of FTEs grew by 15.3% from 2008–09, i.e.
from 26 111 FTEs to 30 118 FTEs. The greatest growth was in the Western Cape region (23.3%), while there was
negative growth both in the Central region (-15.7%) and in the KwaZulu-Natal region (-11.6%).
The Department of Education introduced the Funza Lushaka (Teach the Nation) Bursary Programme in 2007
that encourages students to study for the teaching profession and aims to increase the number of newly-
qualified teachers entering the schooling system. The selection favours candidates from rural areas, candidates
who wish to teach in rural areas and candidates whose financial position would otherwise exclude them from
enrolment for a teaching qualification.
In a recent question asked within the National Assembly in Parliament on 7 August 2012, the Minister of Basic
Education responded that the number of Funza Lushaka bursaries allocated for the different phases in primary
and secondary schools were the following:
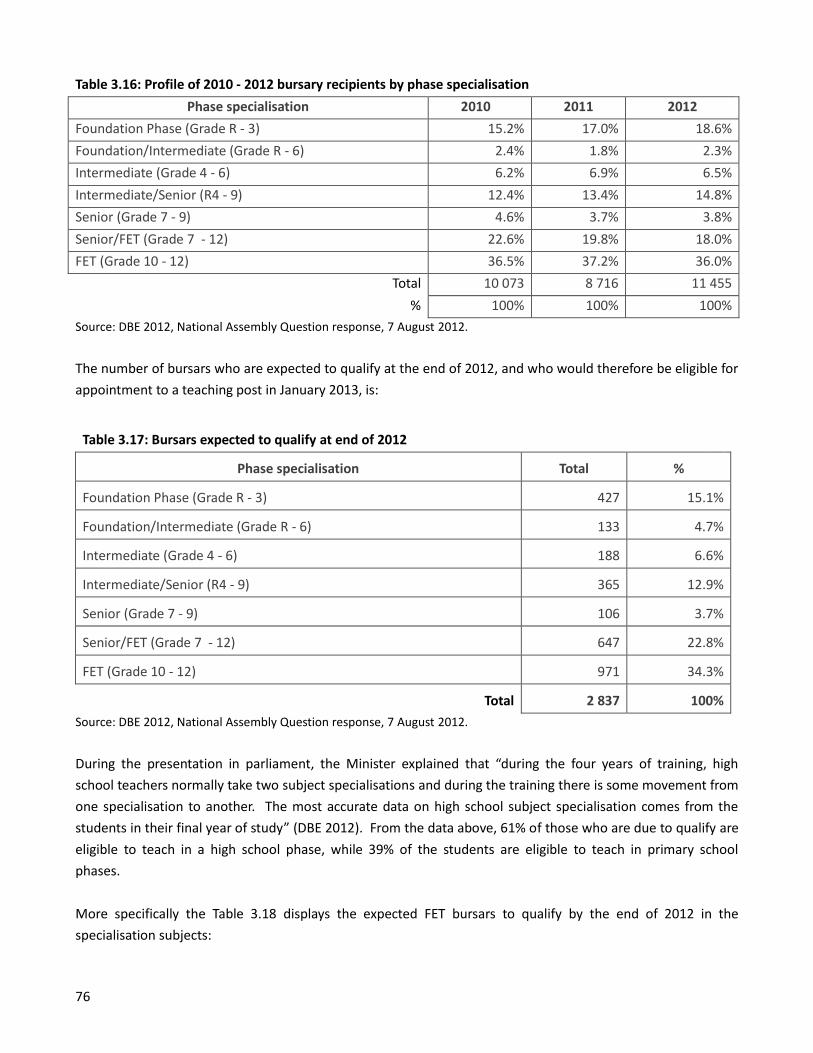
76
Table 3.16: Profile of 2010 - 2012 bursary recipients by phase specialisation
Phase specialisation 2010 2011 2012
Foundation Phase (Grade R - 3) 15.2% 17.0% 18.6%
Foundation/Intermediate (Grade R - 6) 2.4% 1.8% 2.3%
Intermediate (Grade 4 - 6) 6.2% 6.9% 6.5%
Intermediate/Senior (R4 - 9) 12.4% 13.4% 14.8%
Senior (Grade 7 - 9) 4.6% 3.7% 3.8%
Senior/FET (Grade 7 - 12) 22.6% 19.8% 18.0%
FET (Grade 10 - 12) 36.5% 37.2% 36.0%
Total 10 073 8 716 11 455
% 100% 100% 100%
Source: DBE 2012, National Assembly Question response, 7 August 2012.
The number of bursars who are expected to qualify at the end of 2012, and who would therefore be eligible for
appointment to a teaching post in January 2013, is:
Table 3.17: Bursars expected to qualify at end of 2012
Phase specialisation Total %
Foundation Phase (Grade R - 3) 427 15.1%
Foundation/Intermediate (Grade R - 6) 133 4.7%
Intermediate (Grade 4 - 6) 188 6.6%
Intermediate/Senior (R4 - 9) 365 12.9%
Senior (Grade 7 - 9) 106 3.7%
Senior/FET (Grade 7 - 12) 647 22.8%
FET (Grade 10 - 12) 971 34.3%
Total 2 837 100%
Source: DBE 2012, National Assembly Question response, 7 August 2012.
During the presentation in parliament, the Minister explained that “during the four years of training, high
school teachers normally take two subject specialisations and during the training there is some movement from
one specialisation to another. The most accurate data on high school subject specialisation comes from the
students in their final year of study” (DBE 2012). From the data above, 61% of those who are due to qualify are
eligible to teach in a high school phase, while 39% of the students are eligible to teach in primary school
phases.
More specifically the Table 3.18 displays the expected FET bursars to qualify by the end of 2012 in the
specialisation subjects:
77
Table 3.18: FET Bursars expected to qualify at the end of 2012 in the following subject specialisation
FET Subject Specialisation (Grade 10 - 12) Total % of Total % per Subject
Accounting 162 5.6% 11.5%
African Language - isiNdebele 4 0.1% 0.3%
African Language - isiXhosa 78 2.7% 5.5%
African Language - isiZulu 169 5.9% 12.0%
African Language - Sepedi 73 2.5% 5.2%
African Language - Sesotho 24 0.8% 1.7%
African Language - Setswana 6 0.2% 0.4%
African Language - Siswati 4 0.1% 0.3%
African Language - Tshivenda 13 0.5% 0.9%
African Language - Xitsonga 19 0.7% 1.3%
Agricultural Sciences 24 0.8% 1.7%
Civil Technology 14 0.5% 1.0%
Computer Applications Technology 154 5.3% 10.9%
Economics 235 8.1% 16.7%
Electrical Technology 13 0.5% 0.9%
Engineering Graphic and Design 31 1.1% 2.2%
English Languages 489 16.9% 34.7%
Geography 183 6.3% 13.0%
Information Technology 39 1.4% 2.8%
Life Sciences 334 11.6% 23.7%
Mathematical Literacy 159 5.5% 11.3%
Mathematics 413 14.3% 29.3%
Mechanical Technology 16 0.6% 1.1%
Physical Sciences 229 7.9% 16.2%
Total for FET subject specialisation 2 885 100.0% 204.5%
Students 1 411
Source: DBE 2012, National Assembly Question response, 7 August 2012.
Note to Table 3.18: The 204% refers to the fact that students are taking 2 or more specialised subjects and therefore the
over-count of subjects compared to students.
Over the past three years, 1 696 students graduated in 2009, 2 588 in 2010 and 2 634 in 2011. Of those who
graduated, 617 students who graduated in 2009 were placed within the first three months of 2010 in schools,
while 1 083 of 2010 were placed in 2011, and 946 of 2011 were placed in 2012. Of the total available Funza
Lushaka bursars still in need of placement, 623 were placed in rural areas in 2010, 874 were placed in rural
areas in 2011, while 407 were placed in rural areas during 2012 (DBE, 2012).
Everything else being equal, selection favours candidates from rural areas, candidates who wish to teach in
rural areas and candidates whose financial position would otherwise exclude them from enrolment for a
teaching qualification.

78
Table 3.19: Areas of focus for Funza Lushaka
Foundation Phase
(Grades R- 3)
Intermediate Phase
(Grades 4 – 6)
Senior Phase
(Grades 7 – 9)
FET Phase
(Grades 10 –12)
• Foundation phase
specialisation
and design
• African languages
• English language
• Mathematics
• Natural sciences
• Technology
• African languages
• English language
• Mathematics
• Natural sciences
• Technology
• African languages
• Agricultural sciences
• Agricultural technology
• Civil technology
• Computer applications
technology
• Electrical technology
• Engineering graphics
• English language
• Information technology
• Life sciences
• Mathematics
• Mathematical literacy
• Mechanical technology
• Physical sciences
The Funza Lushaka Bursary is only awarded if one of the priority area specialisation subject/s is included as a
teaching subject in a student’s qualification. As Table 3.19 above indicates, these phases include specialisation
in the Foundation Phase, Languages, Mathematics and Physical Science (EFA, 2010:69).
The table 3.19 above lists in summary the areas of scarce and critical skills identified by the ITDS. In another
attempt to address the shortfall of supply evidenced above the Department of Basic Education has plans to
increase the number of foreign teachers in schools where posts cannot be filled with suitably qualified South
Africans, particularly in Mathematics, Science and Technology. The secondary aim of the department will not
only be to have educators in class for delivery of the subject matter, but also to ensure that there is a transfer of
skills from the foreign educators to the local educators and learners and/or vice versa. This drive has resulted in
2 354 of the employed educators not being South Africans.
3.5 Skills Demand
3.5.1 Factors Impacting on Demand
3.5.1.1 Demand in DoE – Public schools
South Africa currently has about 392 000 publicly paid educators, and another almost 33 000 privately-paid
educators.
The attrition rate for public educators with at least three years of post secondary training is around 3% per year,
meaning around 12 000 of educators leave the public system permanently or at least for many years before
79
they return. If under-qualified educators are considered the attrition rate is different, but the 12 000 figure
provides a good indication of how many qualified educators must be replaced.
3.5.1.2 Demand in Independent Schools
A total of 91% of educators are qualified, 7% unqualified and 2% under-qualified in independent schools
(Hofmeyr, 2005). According to the data from ETDP SETA Workplace Skills Plans (WSPs) and Annual Training
Reports (ATRs), top-up skills are needed in several in several occupations. These are listed below:
Accounting teachers grade 10 – 12
Design teachers grade 10 – 12
Mathematical literacy teachers grade 10 – 12
Mathematics teachers
Natural sciences teachers, and
English language teachers.
Many education systems in various countries face a huge challenge in recruiting high-quality graduates as
teachers, particularly in area where a shortage exists and retaining them once they are hired. How countries
have been successful in matching their supply of high quality teachers to their needs should be explored. How
have they prepared teachers for priority subjects or locations? Some of the strategies they adopted to attract
the most talented teaches to the most challenging classrooms have been to offer competitive compensation
and other incentives, career prospects and diversity and affording teachers the responsibility as professionals.
Through active recruitment campaigns that emphasise the fulfilling nature of teaching as a profession, the
authorities seek to attract groups that might not otherwise have considered teaching. Where teaching is seen
as an attractive profession, its status can further be enhanced through selective recruitment that makes
teachers feel that they will be entering into a career that is sought after by accomplished professionals. All this
demands that initial education prepares new teachers to play an active role in designing and delivery of
education, rather than just following standardised practices.
3.5.1.3 Crucial monitoring and evaluation, as well as support and development questions
The following questions require serious thought by those involved in planning and implementing intervention
programmes:
Regarding the production and retention of teachers, consideration must be given to:
Resource implications
Should the training pay less attention to the teacher’s learning as an outcome?
How might it take subject matter into account?
What might it draw from research on teaching and learning and which ideological approach should it
privilege?
Should the training be undifferentiated or as certificated, diploma or graduate level or lumped together
at a fixed level? How productive will this be? Or are these concerns unproductive divides?
How do we bridge traditional separations of pre-service and in-service teacher education to create a
professional continuum of teacher education that includes the induction phase?
What teachers need for both pre-service and In-service courses, most likely should include:

80
o Practical Teaching Knowledge
o Pedagogical Content Knowledge
o Content Knowledge
Non-traditional delivery methods may include:
o Work experience immersion before placement
o Subsequent in-set courses
o Institutionalised on site staff development through subject committees
o Distance learning or face-to-face accredited short courses
Mentoring of mentors and teachers
What might be the characteristics of effective training courses?
It could include:
o Needs-based design of the program
o Tailored to needs of district or region
o Tailored to needs of participants, backgrounds, etc.
o Entrance standards:
• Screening, appropriate backgrounds, match between program design and background
• Intensive training focusing on professional expertise.
• Subject content, pedagogical knowledge and skill training.
• Pedagogical content knowledge.
• Human rights and inclusive education issues.
What might be the characteristics of effective in-set programmes through subject committees on site?
It includes:
o On-site support during training
o Comprehensive system of support from experienced, trained mentors or lead teachers or Heads of
Departments.
o Candidates go through their training in subject cohorts at school so they have peer support.
o Candidates have the opportunity of guided practice in lesson planning and teaching.
Frequent program evaluation by district officials
o Continuous monitoring, evaluation, and feedback of individual and group performance to allow for
program adjustment.
o Schools receive frequent evaluation of their teaching from well-trained mentors and subject advisors or
curriculum implementers.
o School receives continual formal and informal evaluation of their instruction from the subject advisors
or curriculum implementers.
High standards:
o Teaching standards tied to curriculum for teaching.
o Teachers demonstrate that they have mastered the knowledge, skills, and dispositions identified in
curriculum standards and can have a positive impact on lifelong learning.
Ongoing support of teachers:
o Structured, well-supervised induction period when the novice receives observation and assistance in
the classroom by an experienced teacher.
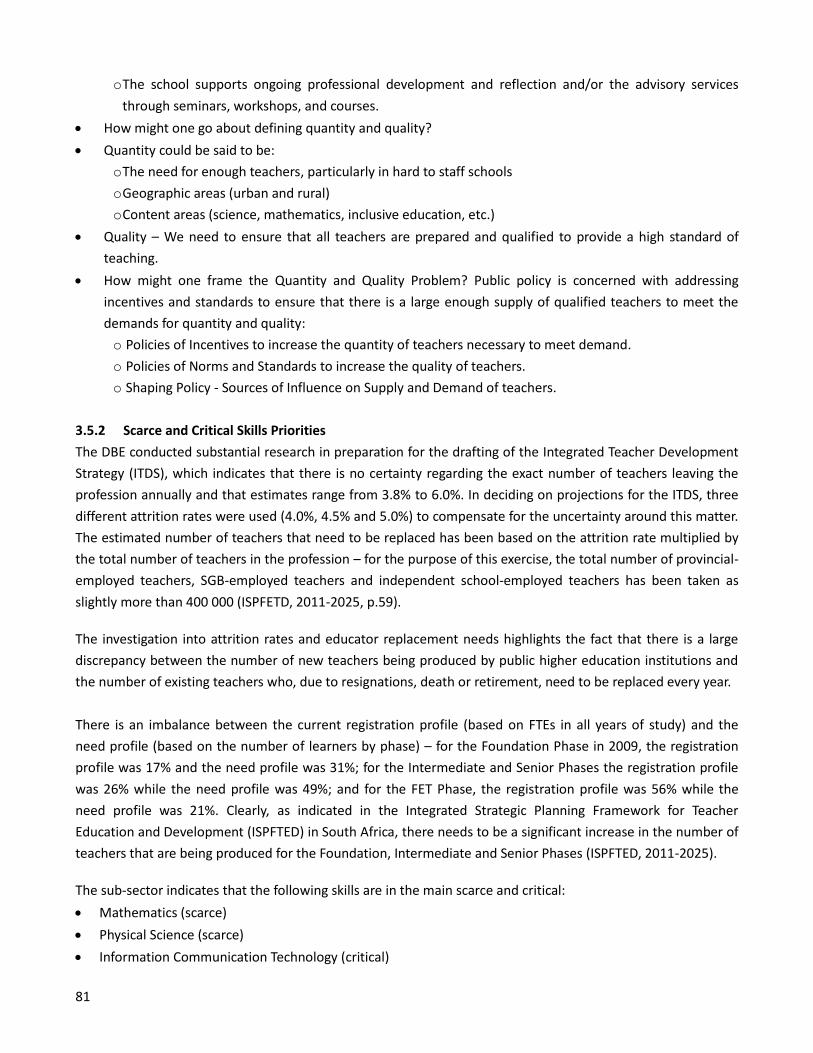
81
o The school supports ongoing professional development and reflection and/or the advisory services
through seminars, workshops, and courses.
How might one go about defining quantity and quality?
Quantity could be said to be:
o The need for enough teachers, particularly in hard to staff schools
o Geographic areas (urban and rural)
o Content areas (science, mathematics, inclusive education, etc.)
Quality – We need to ensure that all teachers are prepared and qualified to provide a high standard of
teaching.
How might one frame the Quantity and Quality Problem? Public policy is concerned with addressing
incentives and standards to ensure that there is a large enough supply of qualified teachers to meet the
demands for quantity and quality:
o Policies of Incentives to increase the quantity of teachers necessary to meet demand.
o Policies of Norms and Standards to increase the quality of teachers.
o Shaping Policy - Sources of Influence on Supply and Demand of teachers.
3.5.2 Scarce and Critical Skills Priorities
The DBE conducted substantial research in preparation for the drafting of the Integrated Teacher Development
Strategy (ITDS), which indicates that there is no certainty regarding the exact number of teachers leaving the
profession annually and that estimates range from 3.8% to 6.0%. In deciding on projections for the ITDS, three
different attrition rates were used (4.0%, 4.5% and 5.0%) to compensate for the uncertainty around this matter.
The estimated number of teachers that need to be replaced has been based on the attrition rate multiplied by
the total number of teachers in the profession – for the purpose of this exercise, the total number of provincial-
employed teachers, SGB-employed teachers and independent school-employed teachers has been taken as
slightly more than 400 000 (ISPFETD, 2011-2025, p.59).
The investigation into attrition rates and educator replacement needs highlights the fact that there is a large
discrepancy between the number of new teachers being produced by public higher education institutions and
the number of existing teachers who, due to resignations, death or retirement, need to be replaced every year.
There is an imbalance between the current registration profile (based on FTEs in all years of study) and the
need profile (based on the number of learners by phase) – for the Foundation Phase in 2009, the registration
profile was 17% and the need profile was 31%; for the Intermediate and Senior Phases the registration profile
was 26% while the need profile was 49%; and for the FET Phase, the registration profile was 56% while the
need profile was 21%. Clearly, as indicated in the Integrated Strategic Planning Framework for Teacher
Education and Development (ISPFTED) in South Africa, there needs to be a significant increase in the number of
teachers that are being produced for the Foundation, Intermediate and Senior Phases (ISPFTED, 2011-2025).
The sub-sector indicates that the following skills are in the main scarce and critical:
Mathematics (scarce)
Physical Science (scarce)
Information Communication Technology (critical)

82
Financial Management, Risk and Business Planning (critical)
In the education sector the research indicates that the shortage is skewed by the supply and demand; some
provinces are more affected by this shortage than others due to teacher supply. The rural areas are more
disadvantaged by the supply and demand process than the privileged and affluent schools that can afford to
hire high-calibre teachers and offer them incentives.
There are several reasons for the scarcity:
Relative scarcity because of geographic location
Relative scarcity because of equity issues.
Absolute scarcity because of numbers of persons available in the market.
Salary packages being better in the private sector.
New subject matter being introduced into curriculum.
Studies have shown that Mathematics and Science teachers are scarce because they earn more in other
industries than the teaching sector. This means that they are in demand, hence, their mobility to other
industries or sectors is guaranteed. The colleges and universities are not producing enough of these teachers,
although the Funza Lushaka programme is trying to ease this backlog by supplying more teachers who have
majored in Mathematics and Sciences subjects.
Table 3.20 below reflects the scarce skills identified by the independent schools.
Table 3.20: Scarce Skills Identified by Independent Schools - WSP Submission for 2012-2013
OFO Code Occupation Job Specification Demand
232123 Mathematics Teacher (Grades 10 - 12) Mathematics Teacher, FET Phase 163
233101 Maths Teacher (Grades 4 - 9) Educator, Maths Educator, Maths teacher 217
232126 Physical Science Teacher (Grade 10-12) 165
232119 Language Teacher Main language teacher, Zulu Teacher, Xhosa Teacher, Afrikaans teacher 232
235201 Special Needs Teacher
Remedial teacher, rehabilitation teacher, education therapist, behaviour support teacher, special education teacher, remedial teacher, teacher of gifted students 170
234201 Foundation Phase Teacher Intermediate teacher 154
233102 Natural Science teacher 100
232101 Accounting teacher (Grade 10-12) 96
235301 Teacher of English To Speakers of Other Languages English Teacher, English language teacher 21
232122 Mathematics Literacy
51
232118 Information Technology Teacher 52
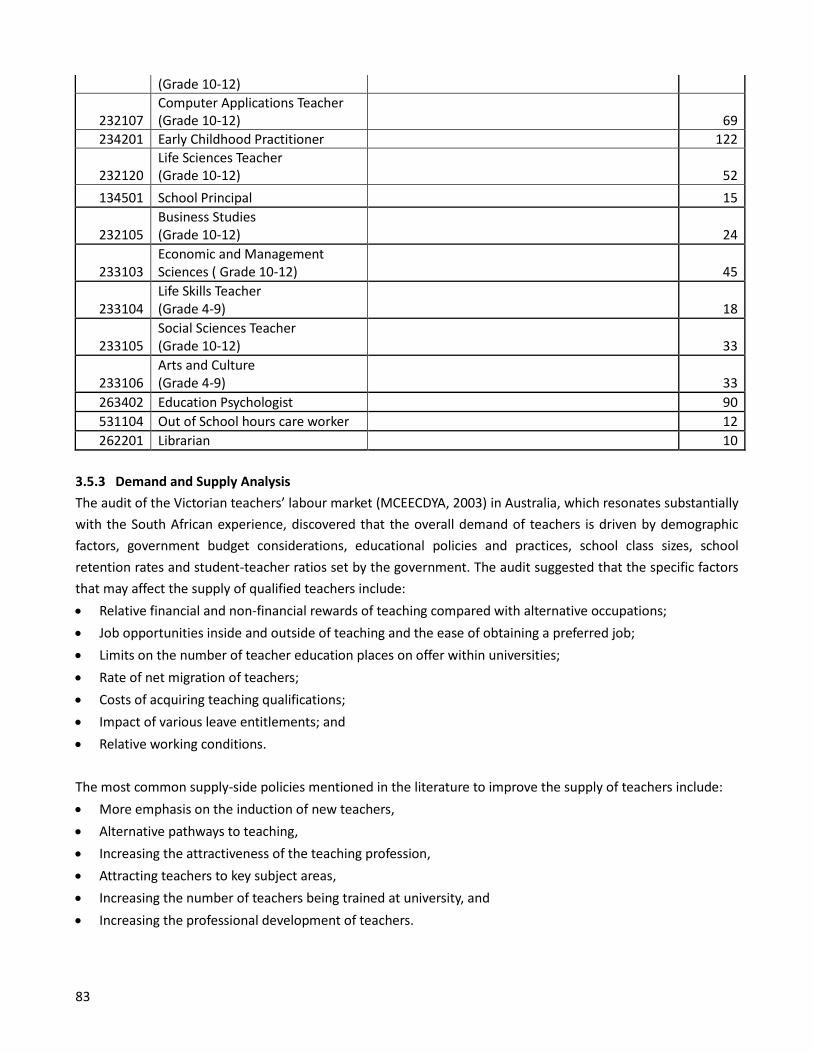
83
(Grade 10-12)
232107 Computer Applications Teacher (Grade 10-12) 69
234201 Early Childhood Practitioner 122
232120 Life Sciences Teacher (Grade 10-12) 52
134501 School Principal
15
232105 Business Studies (Grade 10-12)
24
233103 Economic and Management Sciences ( Grade 10-12)
45
233104 Life Skills Teacher (Grade 4-9)
18
233105 Social Sciences Teacher (Grade 10-12) 33
233106 Arts and Culture (Grade 4-9)
33
263402 Education Psychologist
90
531104 Out of School hours care worker
12
262201 Librarian
10
3.5.3 Demand and Supply Analysis
The audit of the Victorian teachers’ labour market (MCEECDYA, 2003) in Australia, which resonates substantially
with the South African experience, discovered that the overall demand of teachers is driven by demographic
factors, government budget considerations, educational policies and practices, school class sizes, school
retention rates and student-teacher ratios set by the government. The audit suggested that the specific factors
that may affect the supply of qualified teachers include:
Relative financial and non-financial rewards of teaching compared with alternative occupations;
Job opportunities inside and outside of teaching and the ease of obtaining a preferred job;
Limits on the number of teacher education places on offer within universities;
Rate of net migration of teachers;
Costs of acquiring teaching qualifications;
Impact of various leave entitlements; and
Relative working conditions.
The most common supply-side policies mentioned in the literature to improve the supply of teachers include:
More emphasis on the induction of new teachers,
Alternative pathways to teaching,
Increasing the attractiveness of the teaching profession,
Attracting teachers to key subject areas,
Increasing the number of teachers being trained at university, and
Increasing the professional development of teachers.
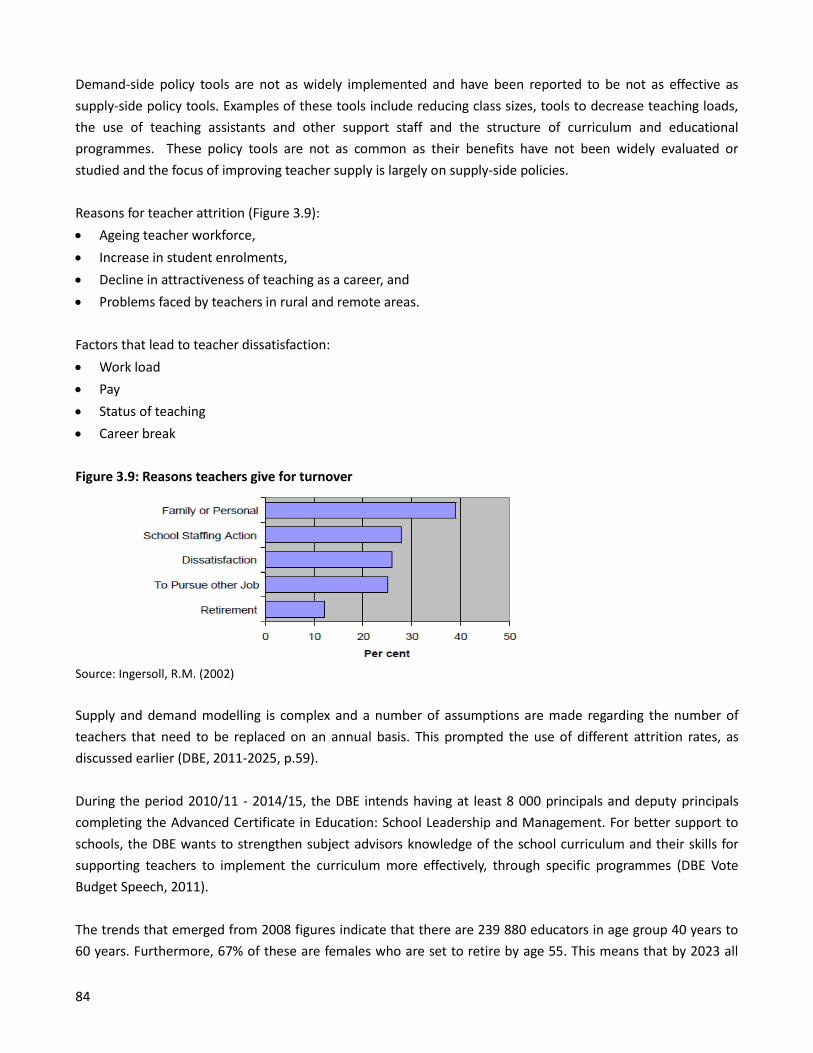
84
Demand-side policy tools are not as widely implemented and have been reported to be not as effective as
supply-side policy tools. Examples of these tools include reducing class sizes, tools to decrease teaching loads,
the use of teaching assistants and other support staff and the structure of curriculum and educational
programmes. These policy tools are not as common as their benefits have not been widely evaluated or
studied and the focus of improving teacher supply is largely on supply-side policies.
Reasons for teacher attrition (Figure 3.9):
Ageing teacher workforce,
Increase in student enrolments,
Decline in attractiveness of teaching as a career, and
Problems faced by teachers in rural and remote areas.
Factors that lead to teacher dissatisfaction:
Work load
Pay
Status of teaching
Career break
Figure 3.9: Reasons teachers give for turnover
Source: Ingersoll, R.M. (2002)
Supply and demand modelling is complex and a number of assumptions are made regarding the number of
teachers that need to be replaced on an annual basis. This prompted the use of different attrition rates, as
discussed earlier (DBE, 2011-2025, p.59).
During the period 2010/11 - 2014/15, the DBE intends having at least 8 000 principals and deputy principals
completing the Advanced Certificate in Education: School Leadership and Management. For better support to
schools, the DBE wants to strengthen subject advisors knowledge of the school curriculum and their skills for
supporting teachers to implement the curriculum more effectively, through specific programmes (DBE Vote
Budget Speech, 2011).
The trends that emerged from 2008 figures indicate that there are 239 880 educators in age group 40 years to
60 years. Furthermore, 67% of these are females who are set to retire by age 55. This means that by 2023 all

85
67% of the teachers in this age group will have retired. By 2028 all 239 880 will have retired. The number of
teachers below 40 is currently at 120 000 and has been declining steadily since 2004. If the current number can
be maintained it means the system will need to increase the number of teachers by 119 880 by 2018. At the
rate of less than 10 000 graduates per annum being produced, combined with the decline in the under 40s, and
with the attrition and vacancy rates mentioned above, indications are there will be a catastrophic shortage of
educators in the years ahead.
The DBE has put in place resources for the expansion of the mainstreaming of learners with special needs. This
will have an impact on the skills requirements of educators in order for them to deal with these learners. It will
also have an impact on curriculum management and will require that school management teams acquire the
requisite skills. Furthermore, the low numbers of female principals and deputy principals in spite of the female
dominance at ordinary educator and Head of Department (HoD) levels indicates that there is a need to raise the
number of females at this level.
The one area that needs further investigation is the demand for teachers who can teach at Foundation Phase in
African languages, in order to ensure the successful implementation of the language in education policies and
curriculum. It is believed that there is a shortage of these teachers but this would need to be verified by further
research and the demand correctly quantified. If the need is verified then there will be a demand for not only
teachers who are fluent in African languages but who also have the requisite educator skills to teach in African
languages.
The Foundations for Learning Programme was initiated to address poor learner performance in Literacy and
Numeracy in the system. The programme provides schools and teachers with clear directives through
Government Gazette 30880 on optimum use of allocated time; daily teaching activities; basic recommended
resources and assessment. Resources in the form of Assessment Frameworks that pace teaching and learning
across the school terms for Literacy and Numeracy (Grades R-6) assist teachers to plan teaching and learning
appropriately. Forty weekly lesson plans that give guidance on daily teaching activities and assessment were
provided to all public primary schools. Provincial departments ensure that the necessary support and
development for schools and educators is provided using resources can be effectively (EFA, 2010:65).
Another area of demand is with regard to increasing the quality of current educators by providing them with
teacher qualifications. There are 13 818 under-qualified teachers who require a REQV 13 qualification and a
further 9 201 unqualified educators who need REQV qualifications. The supply system is seemingly unable to
cater for the numbers required and it is a concern as to how these educators will be able to access the
education and training they require.
The shortage of teachers also has a knock on effect on other skills needs of the sub-sector. Curriculum and
materials developers, examiners for matriculation and assessors for the Annual National Assessments (ANAs)
for grades 3 and 6 will have to be recruited from the educator workforce.

86
3.6 Findings of the research project in two provinces
As part of the extension of the methodology of collection data sets from a wider range of suppliers of
information, with specific reference to publics and independent schools, and how they make up a significant
section of the ETDP SETA, the collection of data from provinces has been identified as a positive move to ensure
triangulation and verification of data sets primary from provincial and national departments. It was argued that
skills development is often a specific school and district challenge, since employees are resistant to frequent
relocation of families and extended travelling to workplaces. Therefore, when skills gaps are identified or
vacancies are announced, job seekers or those who are looking for promotions do not identify these vacancies
outside their ‘zone of comfort’, meaning the distance they are prepared to travel and/or the places they will
consider to relocate. It is crucial for the ETDP SETA to get closer to the decision-making zones which are the
specific schools.
Since we do have over twenty five thousand schools, located in nine provinces, it was decided to limit this first
attempt to collect data from two provinces, namely the Western Cape and KwaZulu-Natal, which give us both
the foundation knowledge of urban and rural experiences as well as complexities. It is however intended to
widen the collection of data in a gradual and incremental way in order to reach a stage where data from all nine
provinces will be represented in future SSPs.
Responses were received from independent and public schools in the Western Cape and Kwa-Zulu Natal. These
responses will be presented as follows:
Response from the Western Cape, both independent and public schools; and
Response from the KwaZulu-Natal, both independent and public schools.
3.6.1 Western Cape schools
From the invitations sent out to schools via the provincial education department, due to their requirement that
schools need to be communicated with through the province, three (3) independent and seventeen (17) public
schools responded, totalling twenty (20) schools. The
majority (16) of respondents where from primary schools.
It was difficult to follow up on schools since we never had
direct contact with them. It is therefore important that
the ETDP SETA sets up arrangements with the provincial
departments in order to facilitate these expectations in
future research activities.
The majority (13) of the schools are within the
organisation size of 10 – 49 employees. There is therefore
the need to look at whether we should demarcate this
interval more deeply in order to allow further analysis
within this category. Furthermore, although the survey
requested the splitting of staff within government and
SGB employed staff, the overwhelming respondents did not separate the data, since they don’t work with this
separation within their developmental and organisational processes. The separation of teachers into
Table 3.21: TYPE OF EDUCATION INSTITUTION
Public Schools
Primary school 15
Secondary school 1
Combined school 1
Intermediate school
Independent Schools
Primary school 1
Secondary school
Combined school 1
Intermediate school 1
87
government and SGB employees only occurs from an employment and contractual point of view, but has no
significant influence when management do developmental and allocation of workload among staff. Despite a
follow up request to all those who responded, the data did not improve significantly in order to report on this
separation of staff into government and SGB employees phenomena. As reported earlier regarding the
reduction in teacher-learner ratio in the system, solving this data collection challenge is important for future
reports.
Within this sample of schools, they employ a total number of 72 managers, 552 professionals, 6 technicians and
associate professionals, 95 clerical support workers, 50 service and sales workers, 6 skilled agricultural and
other related trades workers, and 164 elementary occupations workers (see table below). This amounts to 977
employees within these 20 schools, which is an average employment of 49.9 workers per school. When
compared with the educator school ratio for this province of 22.3 educators, the average of this group of
schools are significantly higher at 31.5 per educators (managers, professionals and associate professionals).
The reference to educators in the schooling sub-sector includes all three categories of occupations, namely
managers, professionals and associate professionals.
Table 3.22: PERMANENT STAFF CURRENTLY IN EMPLOYMENT
Occupational Group Africans Coloureds
Indians /
Asians Whites Total
M F M F M F M F M F
Managers 4 4 4 7 0 3 19 13 32 40
Professionals 6
3
5 30 74 2 12 46 273 92 460
Technicians and Associate
Professionals 1 0 0 0 0 0 2 3 3 3
Clerical Support Workers 2 4 1 16 0 2 2 54 5 90
Service and Sales Workers 1 3 2 13 0 1 1 7 4 45
Skilled Agricultural, Forestry, Fishery,
Craft and Related Trades Workers 1 0 5 0 0 0 0 0 6 0
Plant and Machine Operators and
Assemblers 0 0 0 0 0 0 0 0 0 0
Elementary Occupations 27
3
3 22 38 0 0 7 9 62 102
Source: ETDP SETA Schooling Survey 2012
142 740
As expected and in line with the national data on the various occupations categories, the majority of
employment in table above is within the professional group (552), followed by elementary occupations (1 64),
clerical support workers (95) and then managers (72). Educators are making up more than 80% of the entire
workforce in education. The ratio of managers to rest of employees is 12,6 workers per manager. Due to
historical reasons, the elementary staff group is still represented more to the left, meaning among the Black
employees, while the managers and clerical support workers groupings are represented more to the right,
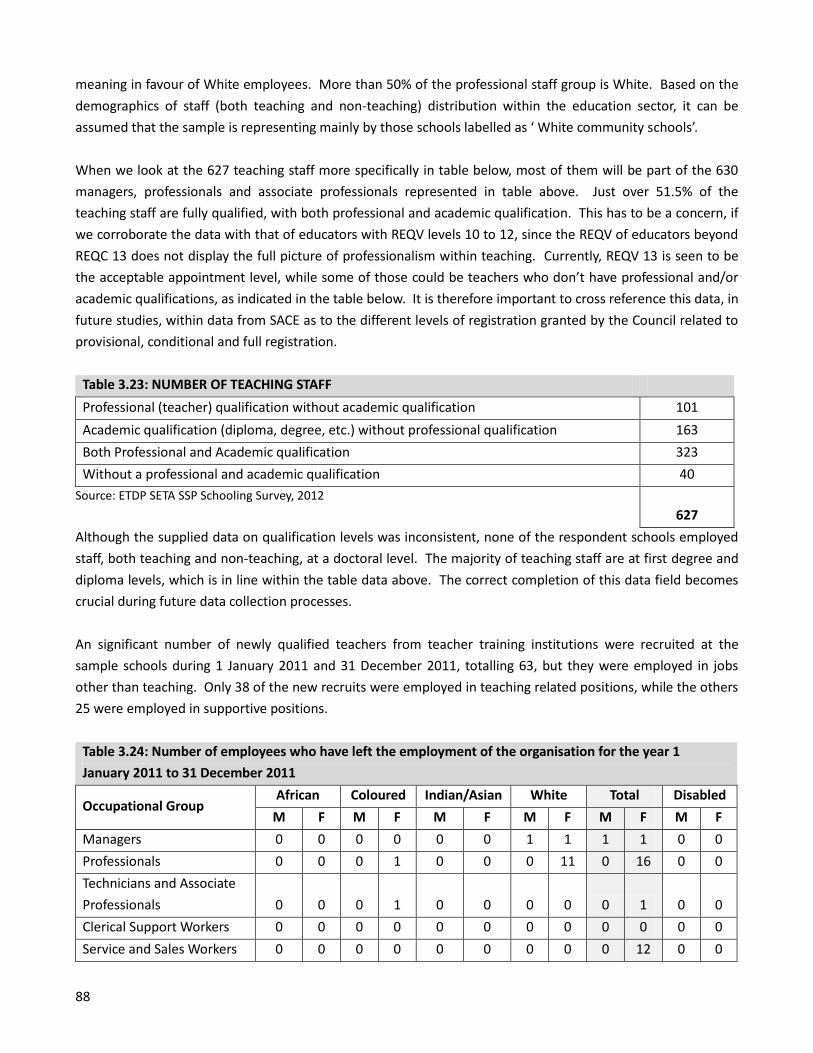
88
meaning in favour of White employees. More than 50% of the professional staff group is White. Based on the
demographics of staff (both teaching and non-teaching) distribution within the education sector, it can be
assumed that the sample is representing mainly by those schools labelled as ‘ White community schools’.
When we look at the 627 teaching staff more specifically in table below, most of them will be part of the 630
managers, professionals and associate professionals represented in table above. Just over 51.5% of the
teaching staff are fully qualified, with both professional and academic qualification. This has to be a concern, if
we corroborate the data with that of educators with REQV levels 10 to 12, since the REQV of educators beyond
REQC 13 does not display the full picture of professionalism within teaching. Currently, REQV 13 is seen to be
the acceptable appointment level, while some of those could be teachers who don’t have professional and/or
academic qualifications, as indicated in the table below. It is therefore important to cross reference this data, in
future studies, within data from SACE as to the different levels of registration granted by the Council related to
provisional, conditional and full registration.
Table 3.23: NUMBER OF TEACHING STAFF
Professional (teacher) qualification without academic qualification 101
Academic qualification (diploma, degree, etc.) without professional qualification 163
Both Professional and Academic qualification 323
Without a professional and academic qualification 40
Source: ETDP SETA SSP Schooling Survey, 2012
627
Although the supplied data on qualification levels was inconsistent, none of the respondent schools employed
staff, both teaching and non-teaching, at a doctoral level. The majority of teaching staff are at first degree and
diploma levels, which is in line within the table data above. The correct completion of this data field becomes
crucial during future data collection processes.
An significant number of newly qualified teachers from teacher training institutions were recruited at the
sample schools during 1 January 2011 and 31 December 2011, totalling 63, but they were employed in jobs
other than teaching. Only 38 of the new recruits were employed in teaching related positions, while the others
25 were employed in supportive positions.
Table 3.24: Number of employees who have left the employment of the organisation for the year 1
January 2011 to 31 December 2011
Occupational Group African Coloured Indian/Asian White Total Disabled
M F M F M F M F M F M F
Managers 0 0 0 0 0 0 1 1 1 1 0 0
Professionals 0 0 0 1 0 0 0 11 0 16 0 0
Technicians and Associate
Professionals 0 0 0 1 0 0 0 0 0 1 0 0
Clerical Support Workers 0 0 0 0 0 0 0 0 0 0 0 0
Service and Sales Workers 0 0 0 0 0 0 0 0 0 12 0 0

89
Skilled Agricultural,
Forestry, Fishery, Craft and
Related Trades Workers 0 0 0 0 0 0 0 0 0 0 0 0
Plant and Machine
Operators and Assemblers 0 0 0 0 0 0 0 0 0 0 0 0
Elementary Occupations 0 0 0 0 0 0 0 0 1 4 0 0
Source: ETDP SETA SSP Schooling Survey, 2012
Not all the respondent schools completed the necessary information related to skills development. Among the
sample schools, 440 employees engaged in Continuous Professional Development programmes at 16 schools,
while 529 attended Short courses at 14 of the schools. Formal study programmes were undertaken by 38
employees of the 12 schools, and 104 employees attended and or presented at conferences at 12 schools.
None of the school employees participated in the ETDP SETA funded internships.
A total of R109 015 was spent at 11 schools on Continuous Professional Development programmes for 401
employees, while 9 schools spent R162,574 on Short courses for 461 employees. A total of 8 schools spent
R155,432 on Formal study programmes for 21 employees and 8 schools spent R119,461 on 88 employees
attending and presenting at conferences.
With reference to the usefulness of training processes and/or activities at school level, 19 respondent schools
either agree or strongly agree that the on-site skills were used; that training lead to upskilling and reskilling; and
that the training is relevant, useful and practical for the workplace. There is however doubt among 3 schools
whether the training is responding to important transformational needs.
Table 3.25: TRAINING PROCESS AND / OR ACTIVITY
Training process and /or activity
N/A No
Response
Strongly
Agree Agree Neutral Disagree
Strongly
Disagree
Training supports on-site use of skills learnt 9 10
Training leads to up-skilled and re-skilled
accredited staff 7 12
Training is relevant, useful, and practical for
the workplace. 9 10
Training addresses important
transformational needs in the sector 6 9 3
Source: ETDP SETA SSP Schooling Survey, 2012
Almost an equal number of respondent schools indicated that they are not aware (Yes is 9 and No is 11) of a
growth or decline in job opportunities in the schooling sector. This could be due to the fact that there is a
growth within the independent schools, while the is stabilisation in schools and learners in the public sector,
but still a growth in the educator employment.

90
In the table below, the respondent schools have indicated a diverse perspective of what a re the factors that
drive employment trends and patterns in schooling. There is no clear pattern, other than the fact that most
schools are towards the ‘agree’ and ‘strongly agree’ side of the response table. A significant higher scoring was
given to ‘employment contractor working conditions’ which include poor salaries, no pensions, etc. It could be
that some of the respondent schools are employing a significant amount of SGB employees, where the burden
is on the school and the governance structure to negotiate and agree on employment contracts.
Table 3.26: FACTORS THAT DRIVE EMPLOYMENT TRENDS AND PATTERNS IN YOUR SUB-SECTOR OR
CONSTITUENCY OR ORGANISATION
Trend/contributing factor
N/A No
Response
Strongly
Agree Agree Neutral Disagree
Strongly
Disagree
Brain drainage e.g. migration to other subjects,
school phases, move to other sectors, etc 2 4 6 2 4 1
Employment contractor working conditions
e.g. poor salaries, no pensions, no career path,
opportunities from industry, etc 2 5 9 2 1
Economic outlook e.g. poor sustainability of
SGB funding, lack of employment opportunities,
etc 2 5 6 1 4 1
Labour costs (increased site overhead costs
contributes to low wages in SGB posts) 2 3 6 3 3 1
Source: ETDP SETA Schooling Survey, 2012
In table below, respondent schools identified salaries (70%) as the main factor influencing skills demand in a
negative way, while the of job opportunities (58%) was second, the availability of career pathing (42%) was
third and access to training and development for teachers (22%) was fourth. In contract, access to training and
development (78%) was identified by others as the most positive factor in skills demand, and followed by the
career paths (58%) available. The job opportunities (39%) and salaries (30%) were close third and fourth. It is
ironic that salaries was see as the most negative (70%) but also the less positive (30%) factor. It confirms that
the increase in salaries might not flip those who see salaries as negative to a positive factor, but it will only
reduce their negative perception of salaries as a factor.
Table 3.27: MAIN FACTORS INFLUENCING OR IMPACTING ON THE CURRENT SKILLS DEMAND IN YOUR
CONSTITUENCY OR SUB SECTOR
Factor Positive Negative
Salaries 6 14
Career paths 11 8
Access to training and development 14 4
Job opportunities 7 11
Source: ETDP SETA SSP Schooling Survey, 2012
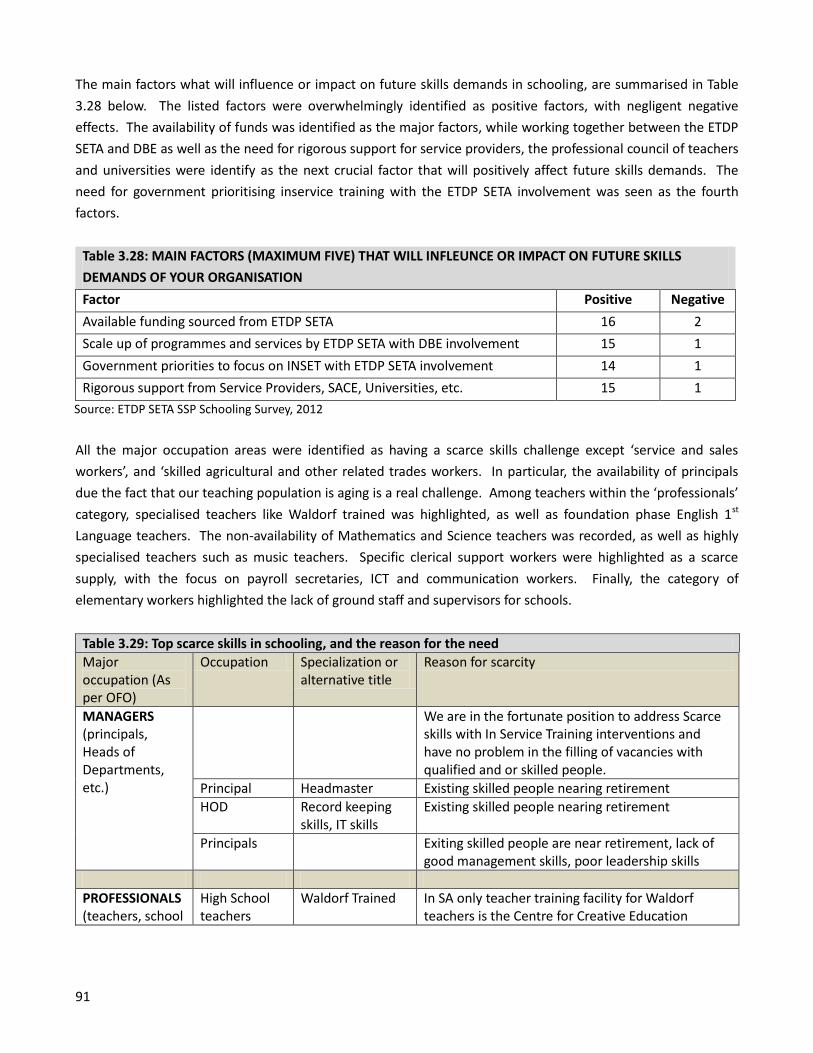
91
The main factors what will influence or impact on future skills demands in schooling, are summarised in Table
3.28 below. The listed factors were overwhelmingly identified as positive factors, with negligent negative
effects. The availability of funds was identified as the major factors, while working together between the ETDP
SETA and DBE as well as the need for rigorous support for service providers, the professional council of teachers
and universities were identify as the next crucial factor that will positively affect future skills demands. The
need for government prioritising inservice training with the ETDP SETA involvement was seen as the fourth
factors.
Table 3.28: MAIN FACTORS (MAXIMUM FIVE) THAT WILL INFLEUNCE OR IMPACT ON FUTURE SKILLS
DEMANDS OF YOUR ORGANISATION
Factor Positive Negative
Available funding sourced from ETDP SETA 16 2
Scale up of programmes and services by ETDP SETA with DBE involvement 15 1
Government priorities to focus on INSET with ETDP SETA involvement 14 1
Rigorous support from Service Providers, SACE, Universities, etc. 15 1
Source: ETDP SETA SSP Schooling Survey, 2012
All the major occupation areas were identified as having a scarce skills challenge except ‘service and sales
workers’, and ‘skilled agricultural and other related trades workers. In particular, the availability of principals
due the fact that our teaching population is aging is a real challenge. Among teachers within the ‘professionals’
category, specialised teachers like Waldorf trained was highlighted, as well as foundation phase English 1st
Language teachers. The non-availability of Mathematics and Science teachers was recorded, as well as highly
specialised teachers such as music teachers. Specific clerical support workers were highlighted as a scarce
supply, with the focus on payroll secretaries, ICT and communication workers. Finally, the category of
elementary workers highlighted the lack of ground staff and supervisors for schools.
Table 3.29: Top scarce skills in schooling, and the reason for the need
Major occupation (As per OFO)
Occupation Specialization or alternative title
Reason for scarcity
MANAGERS (principals, Heads of Departments, etc.)
We are in the fortunate position to address Scarce skills with In Service Training interventions and have no problem in the filling of vacancies with qualified and or skilled people.
Principal Headmaster Existing skilled people nearing retirement
HOD Record keeping skills, IT skills
Existing skilled people nearing retirement
Principals Exiting skilled people are near retirement, lack of good management skills, poor leadership skills
PROFESSIONALS (teachers, school
High School teachers
Waldorf Trained In SA only teacher training facility for Waldorf teachers is the Centre for Creative Education
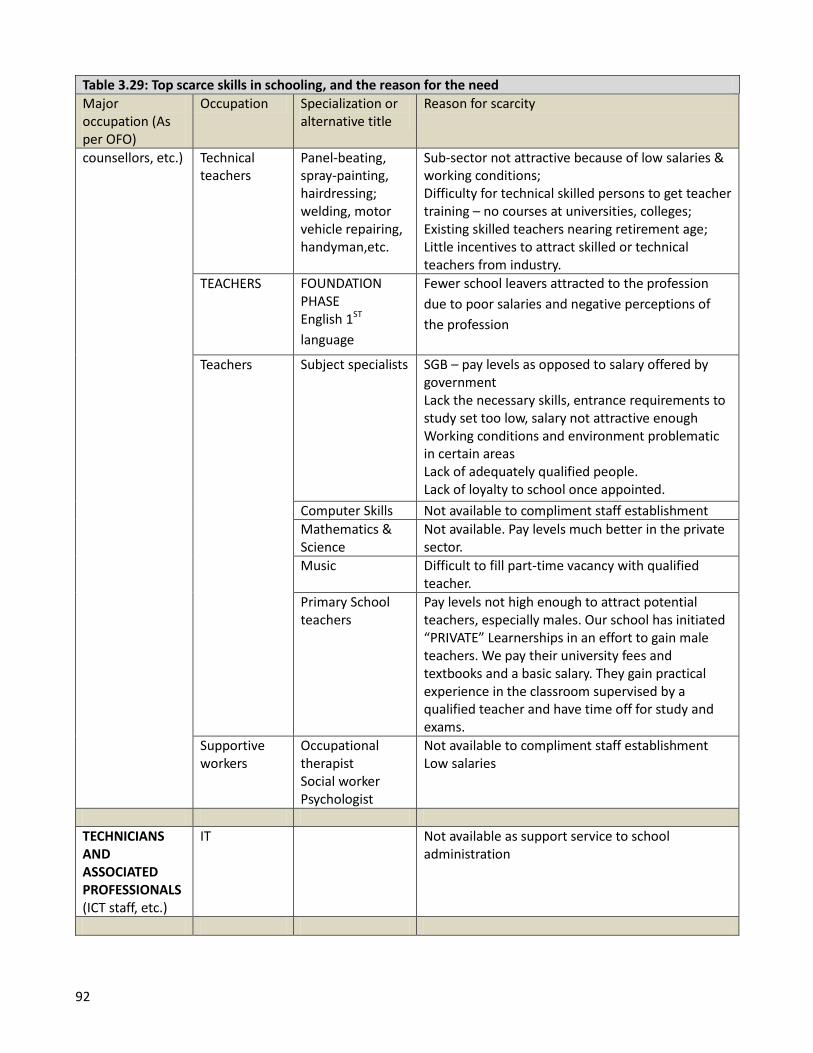
92
Table 3.29: Top scarce skills in schooling, and the reason for the need
Major occupation (As per OFO)
Occupation Specialization or alternative title
Reason for scarcity
counsellors, etc.) Technical teachers
Panel-beating, spray-painting, hairdressing; welding, motor vehicle repairing, handyman,etc.
Sub-sector not attractive because of low salaries & working conditions; Difficulty for technical skilled persons to get teacher training – no courses at universities, colleges; Existing skilled teachers nearing retirement age; Little incentives to attract skilled or technical teachers from industry.
TEACHERS FOUNDATION PHASE English 1ST
language
Fewer school leavers attracted to the profession
due to poor salaries and negative perceptions of
the profession
Teachers Subject specialists SGB – pay levels as opposed to salary offered by government Lack the necessary skills, entrance requirements to study set too low, salary not attractive enough Working conditions and environment problematic in certain areas Lack of adequately qualified people. Lack of loyalty to school once appointed.
Computer Skills Not available to compliment staff establishment
Mathematics & Science
Not available. Pay levels much better in the private sector.
Music Difficult to fill part-time vacancy with qualified teacher.
Primary School teachers
Pay levels not high enough to attract potential teachers, especially males. Our school has initiated “PRIVATE” Learnerships in an effort to gain male teachers. We pay their university fees and textbooks and a basic salary. They gain practical experience in the classroom supervised by a qualified teacher and have time off for study and exams.
Supportive workers
Occupational therapist Social worker Psychologist
Not available to compliment staff establishment Low salaries
TECHNICIANS AND ASSOCIATED PROFESSIONALS (ICT staff, etc.)
IT Not available as support service to school administration
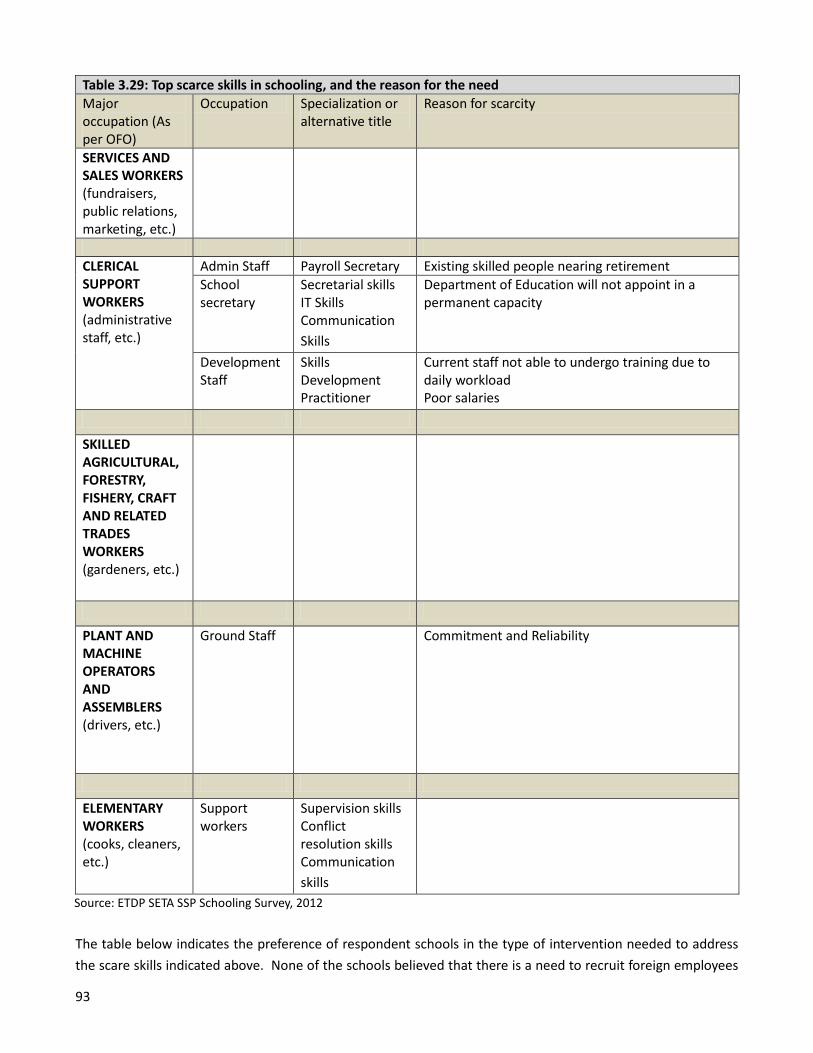
93
Table 3.29: Top scarce skills in schooling, and the reason for the need
Major occupation (As per OFO)
Occupation Specialization or alternative title
Reason for scarcity
SERVICES AND SALES WORKERS (fundraisers, public relations, marketing, etc.)
CLERICAL SUPPORT WORKERS (administrative staff, etc.)
Admin Staff Payroll Secretary Existing skilled people nearing retirement
School secretary
Secretarial skills IT Skills Communication
Skills
Department of Education will not appoint in a permanent capacity
Development Staff
Skills Development Practitioner
Current staff not able to undergo training due to daily workload Poor salaries
SKILLED AGRICULTURAL, FORESTRY, FISHERY, CRAFT AND RELATED TRADES WORKERS (gardeners, etc.)
PLANT AND MACHINE OPERATORS AND ASSEMBLERS (drivers, etc.)
Ground Staff Commitment and Reliability
ELEMENTARY WORKERS (cooks, cleaners, etc.)
Support workers
Supervision skills Conflict resolution skills Communication
skills
Source: ETDP SETA SSP Schooling Survey, 2012
The table below indicates the preference of respondent schools in the type of intervention needed to address
the scare skills indicated above. None of the schools believed that there is a need to recruit foreign employees
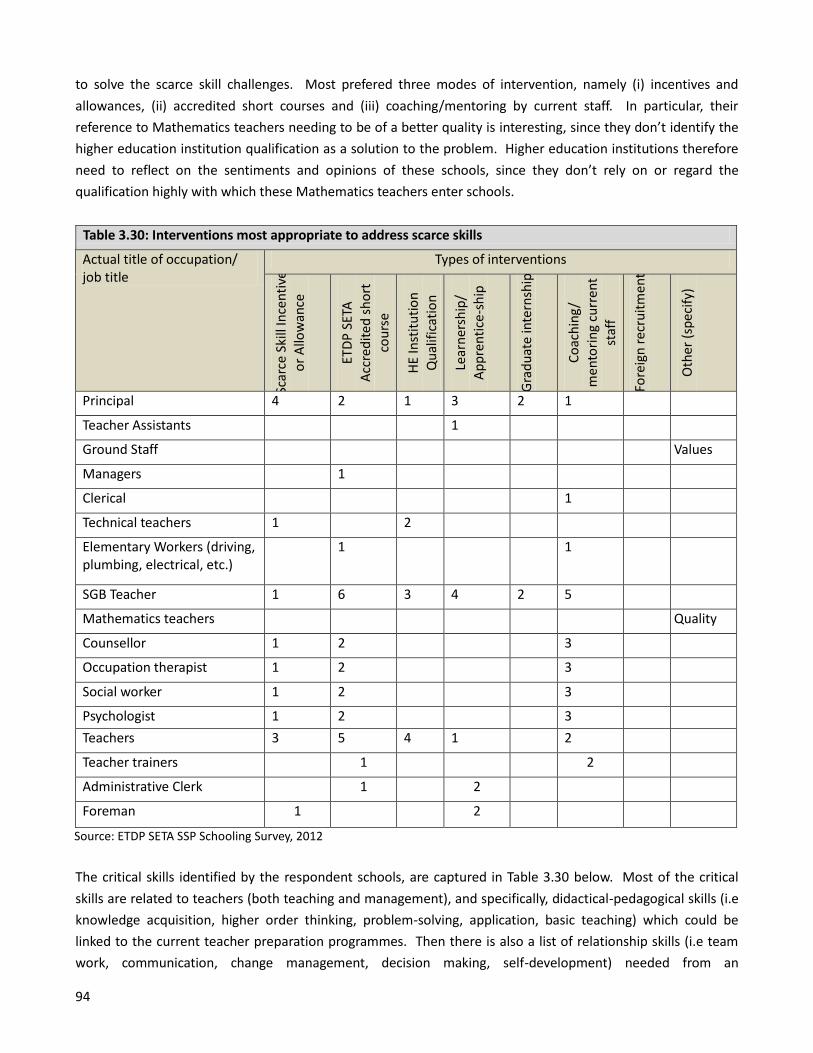
94
to solve the scarce skill challenges. Most prefered three modes of intervention, namely (i) incentives and
allowances, (ii) accredited short courses and (iii) coaching/mentoring by current staff. In particular, their
reference to Mathematics teachers needing to be of a better quality is interesting, since they don’t identify the
higher education institution qualification as a solution to the problem. Higher education institutions therefore
need to reflect on the sentiments and opinions of these schools, since they don’t rely on or regard the
qualification highly with which these Mathematics teachers enter schools.
Table 3.30: Interventions most appropriate to address scarce skills
Actual title of occupation/ job title
Types of interventions
Scar
ce S
kill
Ince
nti
ve
or
Allo
wan
ce
ETD
P S
ETA
Acc
red
ited
sh
ort
co
urs
e
HE
Inst
itu
tio
n
Qu
alif
icat
ion
Lear
ner
ship
/ A
pp
ren
tice
-sh
ip
Gra
du
ate
inte
rnsh
ip
Co
ach
ing/
men
tori
ng
curr
ent
staf
f
Fore
ign
rec
ruit
men
t
Oth
er (
spec
ify)
Principal 4 2 1 3 2 1
Teacher Assistants 1
Ground Staff Values
Managers 1
Clerical 1
Technical teachers 1 2
Elementary Workers (driving, plumbing, electrical, etc.)
1 1
SGB Teacher 1 6 3 4 2 5
Mathematics teachers Quality
Counsellor 1 2 3
Occupation therapist 1 2 3
Social worker 1 2 3
Psychologist 1 2 3
Teachers 3 5 4 1 2
Teacher trainers 1 2
Administrative Clerk 1 2
Foreman 1 2
Source: ETDP SETA SSP Schooling Survey, 2012
The critical skills identified by the respondent schools, are captured in Table 3.30 below. Most of the critical
skills are related to teachers (both teaching and management), and specifically, didactical-pedagogical skills (i.e
knowledge acquisition, higher order thinking, problem-solving, application, basic teaching) which could be
linked to the current teacher preparation programmes. Then there is also a list of relationship skills (i.e team
work, communication, change management, decision making, self-development) needed from an
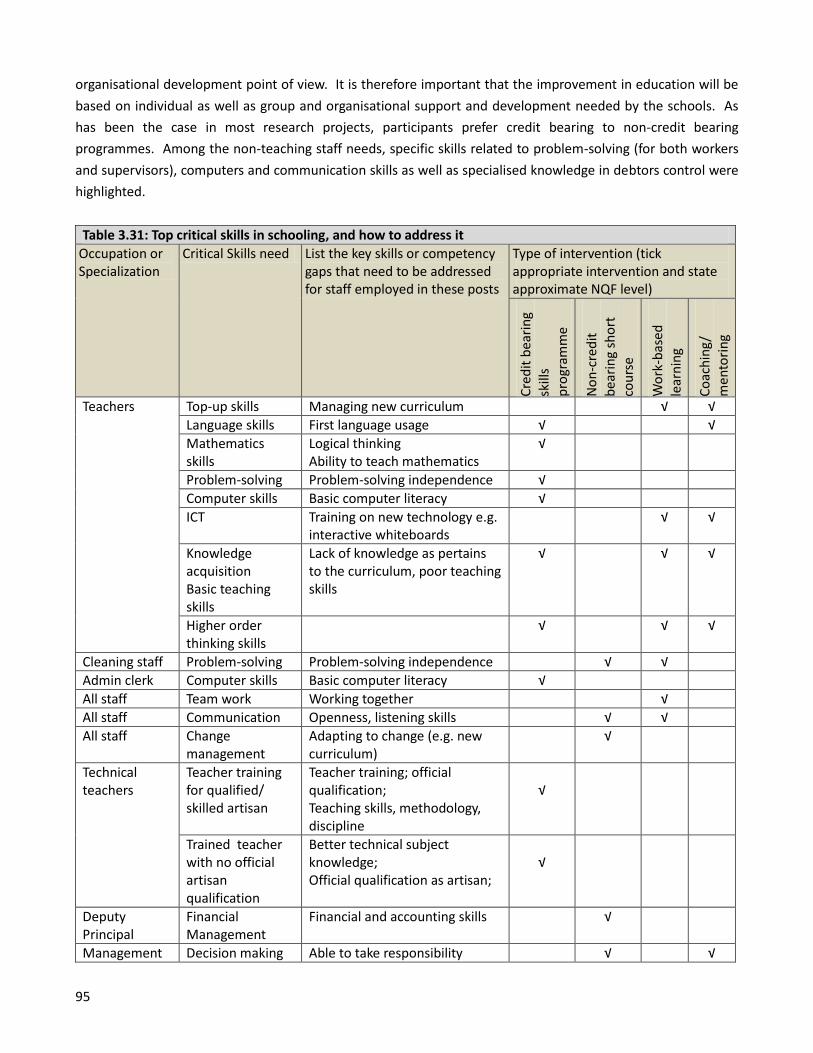
95
organisational development point of view. It is therefore important that the improvement in education will be
based on individual as well as group and organisational support and development needed by the schools. As
has been the case in most research projects, participants prefer credit bearing to non-credit bearing
programmes. Among the non-teaching staff needs, specific skills related to problem-solving (for both workers
and supervisors), computers and communication skills as well as specialised knowledge in debtors control were
highlighted.
Table 3.31: Top critical skills in schooling, and how to address it
Occupation or Specialization
Critical Skills need List the key skills or competency gaps that need to be addressed for staff employed in these posts
Type of intervention (tick appropriate intervention and state approximate NQF level)
Cre
dit
bea
rin
g sk
ills
pro
gram
me
No
n-c
red
it
bea
rin
g sh
ort
co
urs
e
Wo
rk-b
ased
le
arn
ing
Co
ach
ing/
m
ento
rin
g
Teachers Top-up skills Managing new curriculum √ √
Language skills First language usage √ √
Mathematics skills
Logical thinking Ability to teach mathematics
√
Problem-solving Problem-solving independence √
Computer skills Basic computer literacy √
ICT Training on new technology e.g. interactive whiteboards
√ √
Knowledge acquisition Basic teaching skills
Lack of knowledge as pertains to the curriculum, poor teaching skills
√ √ √
Higher order thinking skills
√ √ √
Cleaning staff Problem-solving Problem-solving independence √ √
Admin clerk Computer skills Basic computer literacy √
All staff Team work Working together √
All staff Communication Openness, listening skills √ √
All staff Change management
Adapting to change (e.g. new curriculum)
√
Technical teachers
Teacher training for qualified/ skilled artisan
Teacher training; official qualification; Teaching skills, methodology, discipline
√
Trained teacher with no official artisan qualification
Better technical subject knowledge; Official qualification as artisan;
√
Deputy Principal
Financial Management
Financial and accounting skills √
Management Decision making Able to take responsibility √ √
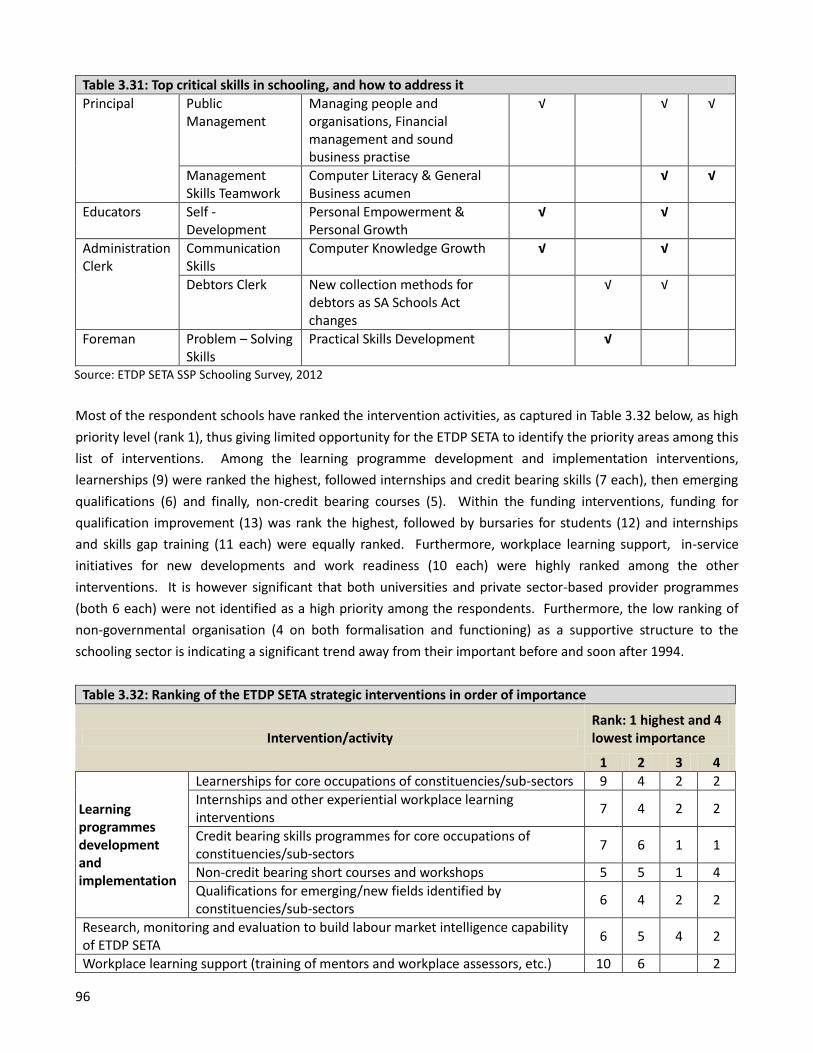
96
Table 3.31: Top critical skills in schooling, and how to address it
Principal Public Management
Managing people and organisations, Financial management and sound business practise
√ √ √
Management Skills Teamwork
Computer Literacy & General Business acumen
√ √
Educators Self - Development
Personal Empowerment & Personal Growth
√ √
Administration Clerk
Communication Skills
Computer Knowledge Growth √ √
Debtors Clerk New collection methods for debtors as SA Schools Act changes
√ √
Foreman Problem – Solving Skills
Practical Skills Development √
Source: ETDP SETA SSP Schooling Survey, 2012
Most of the respondent schools have ranked the intervention activities, as captured in Table 3.32 below, as high
priority level (rank 1), thus giving limited opportunity for the ETDP SETA to identify the priority areas among this
list of interventions. Among the learning programme development and implementation interventions,
learnerships (9) were ranked the highest, followed internships and credit bearing skills (7 each), then emerging
qualifications (6) and finally, non-credit bearing courses (5). Within the funding interventions, funding for
qualification improvement (13) was rank the highest, followed by bursaries for students (12) and internships
and skills gap training (11 each) were equally ranked. Furthermore, workplace learning support, in-service
initiatives for new developments and work readiness (10 each) were highly ranked among the other
interventions. It is however significant that both universities and private sector-based provider programmes
(both 6 each) were not identified as a high priority among the respondents. Furthermore, the low ranking of
non-governmental organisation (4 on both formalisation and functioning) as a supportive structure to the
schooling sector is indicating a significant trend away from their important before and soon after 1994.
Table 3.32: Ranking of the ETDP SETA strategic interventions in order of importance
Intervention/activity Rank: 1 highest and 4 lowest importance
1 2 3 4
Learning programmes development and implementation
Learnerships for core occupations of constituencies/sub-sectors 9 4 2 2
Internships and other experiential workplace learning interventions
7 4 2 2
Credit bearing skills programmes for core occupations of constituencies/sub-sectors
7 6 1 1
Non-credit bearing short courses and workshops 5 5 1 4
Qualifications for emerging/new fields identified by constituencies/sub-sectors
6 4 2 2
Research, monitoring and evaluation to build labour market intelligence capability of ETDP SETA
6 5 4 2
Workplace learning support (training of mentors and workplace assessors, etc.) 10 6 2
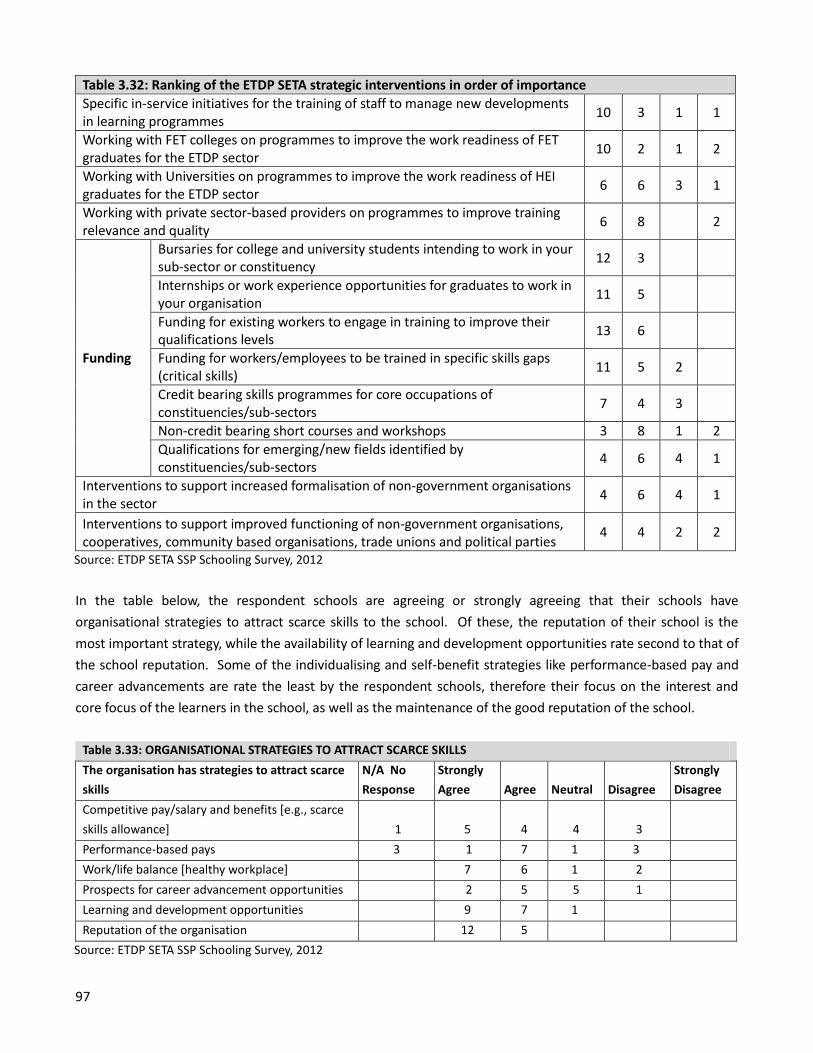
97
Table 3.32: Ranking of the ETDP SETA strategic interventions in order of importance
Specific in-service initiatives for the training of staff to manage new developments in learning programmes
10 3 1 1
Working with FET colleges on programmes to improve the work readiness of FET graduates for the ETDP sector
10 2 1 2
Working with Universities on programmes to improve the work readiness of HEI graduates for the ETDP sector
6 6 3 1
Working with private sector-based providers on programmes to improve training relevance and quality
6 8 2
Funding
Bursaries for college and university students intending to work in your sub-sector or constituency
12 3
Internships or work experience opportunities for graduates to work in your organisation
11 5
Funding for existing workers to engage in training to improve their qualifications levels
13 6
Funding for workers/employees to be trained in specific skills gaps (critical skills)
11 5 2
Credit bearing skills programmes for core occupations of constituencies/sub-sectors
7 4 3
Non-credit bearing short courses and workshops 3 8 1 2
Qualifications for emerging/new fields identified by constituencies/sub-sectors
4 6 4 1
Interventions to support increased formalisation of non-government organisations in the sector
4 6 4 1
Interventions to support improved functioning of non-government organisations, cooperatives, community based organisations, trade unions and political parties
4 4 2 2
Source: ETDP SETA SSP Schooling Survey, 2012
In the table below, the respondent schools are agreeing or strongly agreeing that their schools have
organisational strategies to attract scarce skills to the school. Of these, the reputation of their school is the
most important strategy, while the availability of learning and development opportunities rate second to that of
the school reputation. Some of the individualising and self-benefit strategies like performance-based pay and
career advancements are rate the least by the respondent schools, therefore their focus on the interest and
core focus of the learners in the school, as well as the maintenance of the good reputation of the school.
Table 3.33: ORGANISATIONAL STRATEGIES TO ATTRACT SCARCE SKILLS
The organisation has strategies to attract scarce
skills
N/A No
Response
Strongly
Agree Agree Neutral Disagree
Strongly
Disagree
Competitive pay/salary and benefits [e.g., scarce
skills allowance] 1 5 4 4 3
Performance-based pays 3 1 7 1 3
Work/life balance [healthy workplace] 7 6 1 2
Prospects for career advancement opportunities 2 5 5 1
Learning and development opportunities 9 7 1
Reputation of the organisation 12 5
Source: ETDP SETA SSP Schooling Survey, 2012
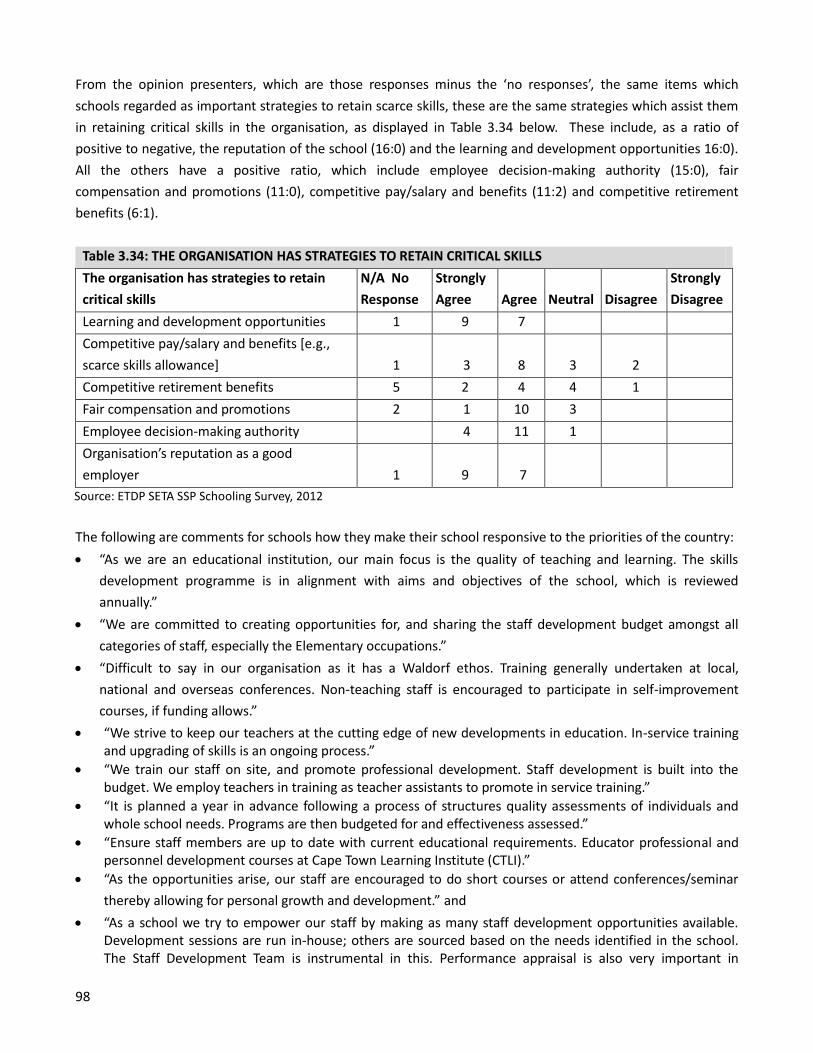
98
From the opinion presenters, which are those responses minus the ‘no responses’, the same items which
schools regarded as important strategies to retain scarce skills, these are the same strategies which assist them
in retaining critical skills in the organisation, as displayed in Table 3.34 below. These include, as a ratio of
positive to negative, the reputation of the school (16:0) and the learning and development opportunities 16:0).
All the others have a positive ratio, which include employee decision-making authority (15:0), fair
compensation and promotions (11:0), competitive pay/salary and benefits (11:2) and competitive retirement
benefits (6:1).
Table 3.34: THE ORGANISATION HAS STRATEGIES TO RETAIN CRITICAL SKILLS
The organisation has strategies to retain
critical skills
N/A No
Response
Strongly
Agree Agree Neutral Disagree
Strongly
Disagree
Learning and development opportunities 1 9 7
Competitive pay/salary and benefits [e.g.,
scarce skills allowance] 1 3 8 3 2
Competitive retirement benefits 5 2 4 4 1
Fair compensation and promotions 2 1 10 3
Employee decision-making authority 4 11 1
Organisation’s reputation as a good
employer 1 9 7
Source: ETDP SETA SSP Schooling Survey, 2012
The following are comments for schools how they make their school responsive to the priorities of the country:
“As we are an educational institution, our main focus is the quality of teaching and learning. The skills
development programme is in alignment with aims and objectives of the school, which is reviewed
annually.”
“We are committed to creating opportunities for, and sharing the staff development budget amongst all
categories of staff, especially the Elementary occupations.”
“Difficult to say in our organisation as it has a Waldorf ethos. Training generally undertaken at local,
national and overseas conferences. Non-teaching staff is encouraged to participate in self-improvement
courses, if funding allows.”
“We strive to keep our teachers at the cutting edge of new developments in education. In-service training and upgrading of skills is an ongoing process.”
“We train our staff on site, and promote professional development. Staff development is built into the budget. We employ teachers in training as teacher assistants to promote in service training.”
“It is planned a year in advance following a process of structures quality assessments of individuals and whole school needs. Programs are then budgeted for and effectiveness assessed.”
“Ensure staff members are up to date with current educational requirements. Educator professional and personnel development courses at Cape Town Learning Institute (CTLI).”
“As the opportunities arise, our staff are encouraged to do short courses or attend conferences/seminar
thereby allowing for personal growth and development.” and
“As a school we try to empower our staff by making as many staff development opportunities available. Development sessions are run in-house; others are sourced based on the needs identified in the school. The Staff Development Team is instrumental in this. Performance appraisal is also very important in
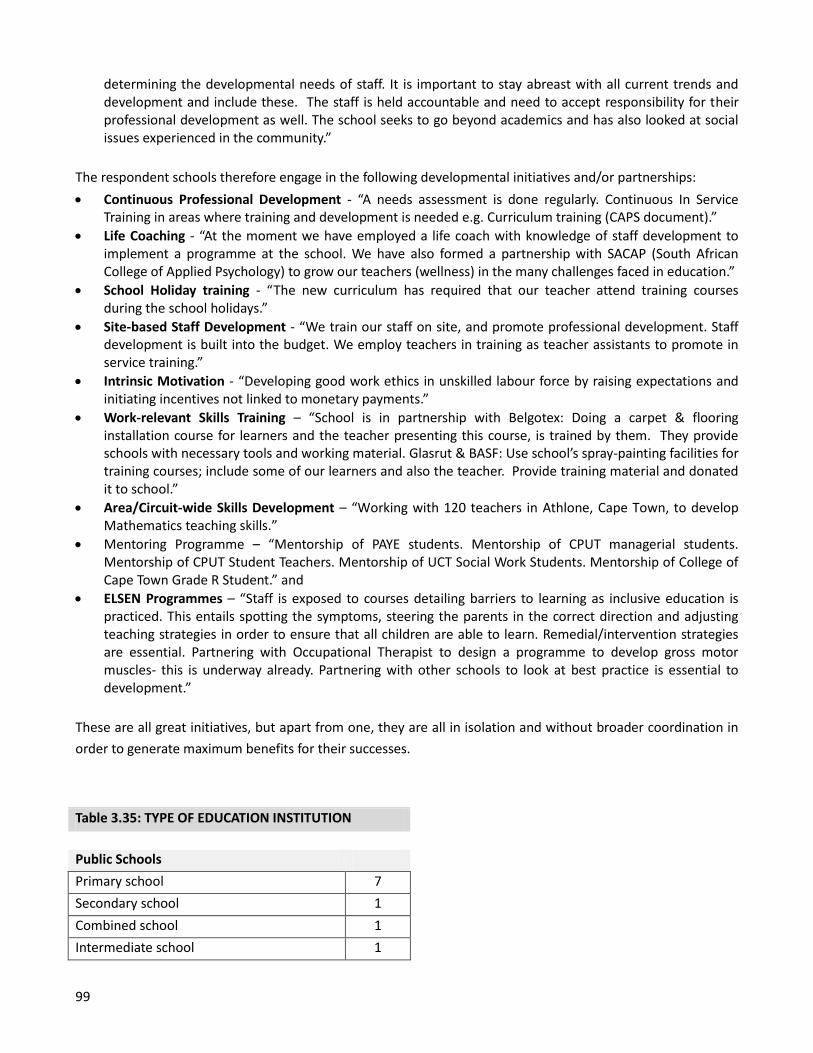
99
determining the developmental needs of staff. It is important to stay abreast with all current trends and development and include these. The staff is held accountable and need to accept responsibility for their professional development as well. The school seeks to go beyond academics and has also looked at social issues experienced in the community.”
The respondent schools therefore engage in the following developmental initiatives and/or partnerships:
Continuous Professional Development - “A needs assessment is done regularly. Continuous In Service Training in areas where training and development is needed e.g. Curriculum training (CAPS document).”
Life Coaching - “At the moment we have employed a life coach with knowledge of staff development to implement a programme at the school. We have also formed a partnership with SACAP (South African College of Applied Psychology) to grow our teachers (wellness) in the many challenges faced in education.”
School Holiday training - “The new curriculum has required that our teacher attend training courses during the school holidays.”
Site-based Staff Development - “We train our staff on site, and promote professional development. Staff development is built into the budget. We employ teachers in training as teacher assistants to promote in service training.”
Intrinsic Motivation - “Developing good work ethics in unskilled labour force by raising expectations and initiating incentives not linked to monetary payments.”
Work-relevant Skills Training – “School is in partnership with Belgotex: Doing a carpet & flooring installation course for learners and the teacher presenting this course, is trained by them. They provide schools with necessary tools and working material. Glasrut & BASF: Use school’s spray-painting facilities for training courses; include some of our learners and also the teacher. Provide training material and donated it to school.”
Area/Circuit-wide Skills Development – “Working with 120 teachers in Athlone, Cape Town, to develop Mathematics teaching skills.”
Mentoring Programme – “Mentorship of PAYE students. Mentorship of CPUT managerial students. Mentorship of CPUT Student Teachers. Mentorship of UCT Social Work Students. Mentorship of College of Cape Town Grade R Student.” and
ELSEN Programmes – “Staff is exposed to courses detailing barriers to learning as inclusive education is practiced. This entails spotting the symptoms, steering the parents in the correct direction and adjusting teaching strategies in order to ensure that all children are able to learn. Remedial/intervention strategies are essential. Partnering with Occupational Therapist to design a programme to develop gross motor muscles- this is underway already. Partnering with other schools to look at best practice is essential to development.”
These are all great initiatives, but apart from one, they are all in isolation and without broader coordination in
order to generate maximum benefits for their successes.
Table 3.35: TYPE OF EDUCATION INSTITUTION
Public Schools
Primary school 7
Secondary school 1
Combined school 1
Intermediate school 1
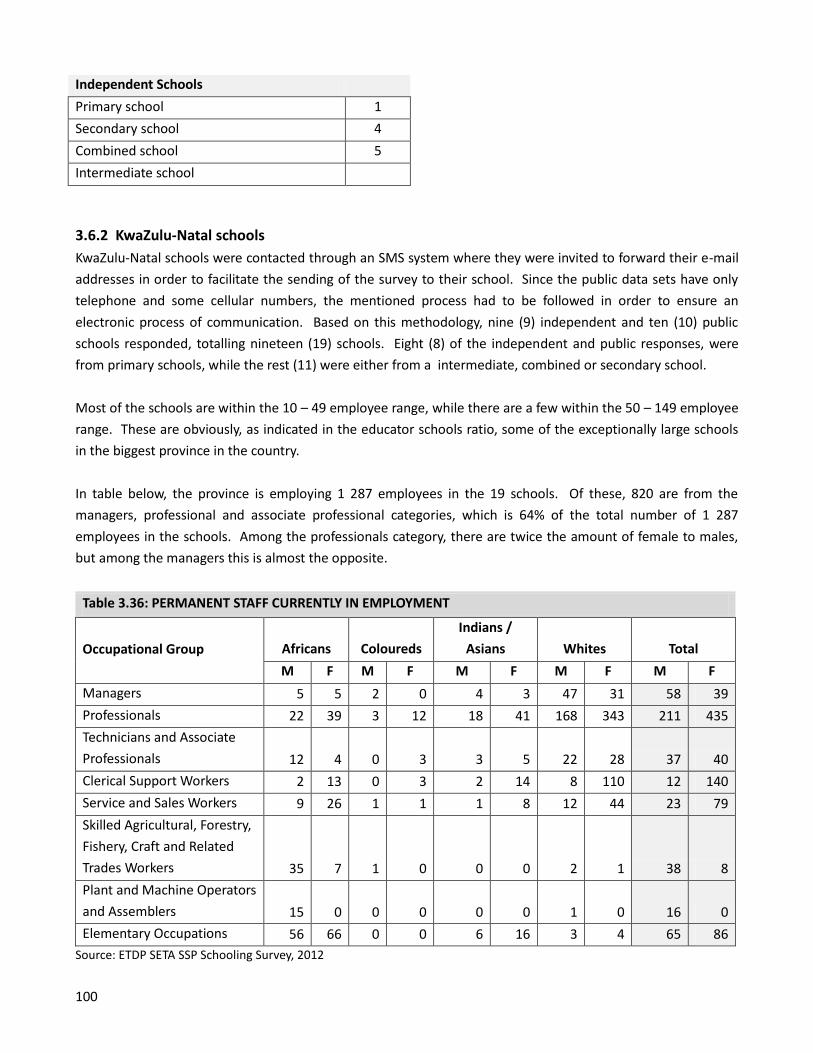
100
3.6.2 KwaZulu-Natal schools
KwaZulu-Natal schools were contacted through an SMS system where they were invited to forward their e-mail
addresses in order to facilitate the sending of the survey to their school. Since the public data sets have only
telephone and some cellular numbers, the mentioned process had to be followed in order to ensure an
electronic process of communication. Based on this methodology, nine (9) independent and ten (10) public
schools responded, totalling nineteen (19) schools. Eight (8) of the independent and public responses, were
from primary schools, while the rest (11) were either from a intermediate, combined or secondary school.
Most of the schools are within the 10 – 49 employee range, while there are a few within the 50 – 149 employee
range. These are obviously, as indicated in the educator schools ratio, some of the exceptionally large schools
in the biggest province in the country.
In table below, the province is employing 1 287 employees in the 19 schools. Of these, 820 are from the
managers, professional and associate professional categories, which is 64% of the total number of 1 287
employees in the schools. Among the professionals category, there are twice the amount of female to males,
but among the managers this is almost the opposite.
Table 3.36: PERMANENT STAFF CURRENTLY IN EMPLOYMENT
Occupational Group Africans Coloureds
Indians /
Asians Whites Total
M F M F M F M F M F
Managers 5 5 2 0 4 3 47 31 58 39
Professionals 22 39 3 12 18 41 168 343 211 435
Technicians and Associate
Professionals 12 4 0 3 3 5 22 28 37 40
Clerical Support Workers 2 13 0 3 2 14 8 110 12 140
Service and Sales Workers 9 26 1 1 1 8 12 44 23 79
Skilled Agricultural, Forestry,
Fishery, Craft and Related
Trades Workers 35 7 1 0 0 0 2 1 38 8
Plant and Machine Operators
and Assemblers 15 0 0 0 0 0 1 0 16 0
Elementary Occupations 56 66 0 0 6 16 3 4 65 86
Source: ETDP SETA SSP Schooling Survey, 2012
Independent Schools
Primary school 1
Secondary school 4
Combined school 5
Intermediate school
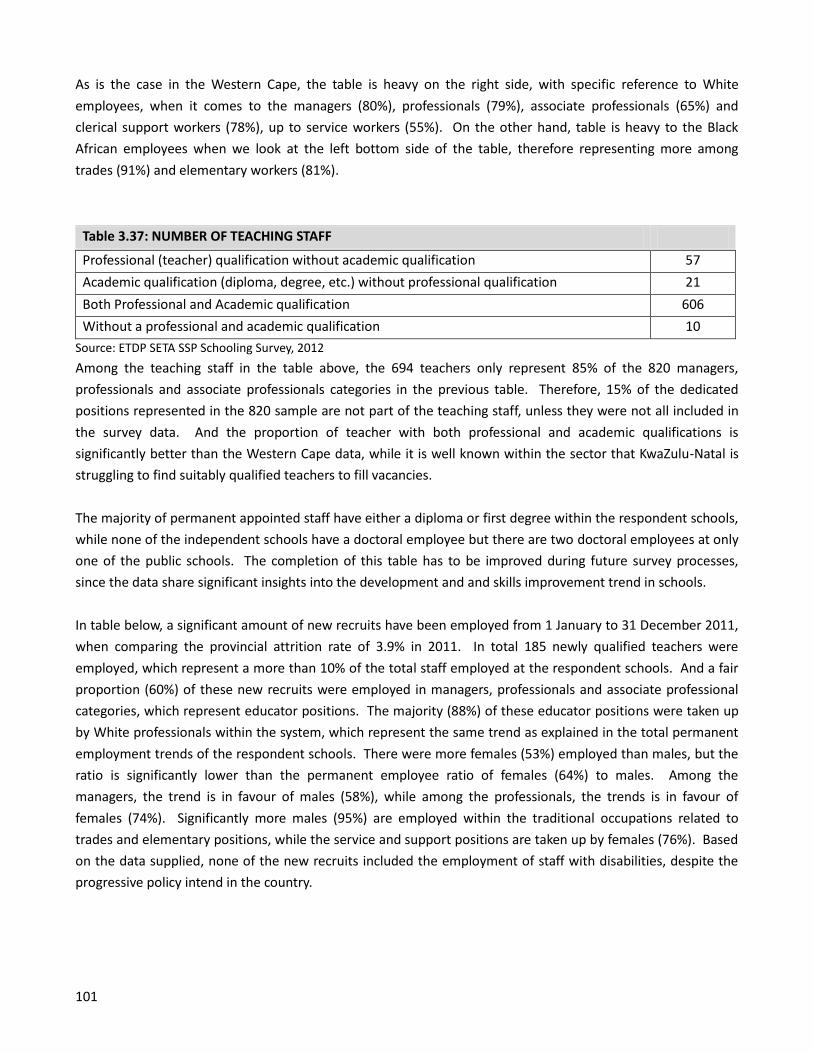
101
As is the case in the Western Cape, the table is heavy on the right side, with specific reference to White
employees, when it comes to the managers (80%), professionals (79%), associate professionals (65%) and
clerical support workers (78%), up to service workers (55%). On the other hand, table is heavy to the Black
African employees when we look at the left bottom side of the table, therefore representing more among
trades (91%) and elementary workers (81%).
Table 3.37: NUMBER OF TEACHING STAFF
Professional (teacher) qualification without academic qualification 57
Academic qualification (diploma, degree, etc.) without professional qualification 21
Both Professional and Academic qualification 606
Without a professional and academic qualification 10
Source: ETDP SETA SSP Schooling Survey, 2012
Among the teaching staff in the table above, the 694 teachers only represent 85% of the 820 managers,
professionals and associate professionals categories in the previous table. Therefore, 15% of the dedicated
positions represented in the 820 sample are not part of the teaching staff, unless they were not all included in
the survey data. And the proportion of teacher with both professional and academic qualifications is
significantly better than the Western Cape data, while it is well known within the sector that KwaZulu-Natal is
struggling to find suitably qualified teachers to fill vacancies.
The majority of permanent appointed staff have either a diploma or first degree within the respondent schools,
while none of the independent schools have a doctoral employee but there are two doctoral employees at only
one of the public schools. The completion of this table has to be improved during future survey processes,
since the data share significant insights into the development and and skills improvement trend in schools.
In table below, a significant amount of new recruits have been employed from 1 January to 31 December 2011,
when comparing the provincial attrition rate of 3.9% in 2011. In total 185 newly qualified teachers were
employed, which represent a more than 10% of the total staff employed at the respondent schools. And a fair
proportion (60%) of these new recruits were employed in managers, professionals and associate professional
categories, which represent educator positions. The majority (88%) of these educator positions were taken up
by White professionals within the system, which represent the same trend as explained in the total permanent
employment trends of the respondent schools. There were more females (53%) employed than males, but the
ratio is significantly lower than the permanent employee ratio of females (64%) to males. Among the
managers, the trend is in favour of males (58%), while among the professionals, the trends is in favour of
females (74%). Significantly more males (95%) are employed within the traditional occupations related to
trades and elementary positions, while the service and support positions are taken up by females (76%). Based
on the data supplied, none of the new recruits included the employment of staff with disabilities, despite the
progressive policy intend in the country.
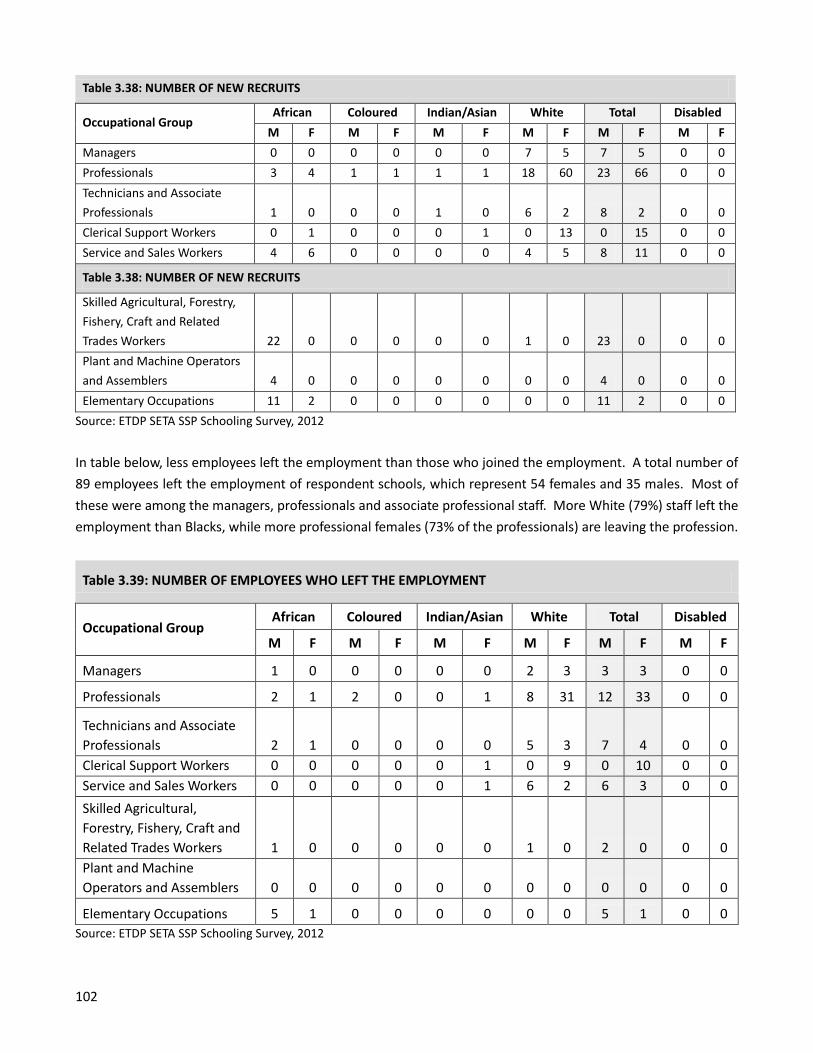
102
Table 3.38: NUMBER OF NEW RECRUITS
Occupational Group African Coloured Indian/Asian White Total Disabled
M F M F M F M F M F M F
Managers 0 0 0 0 0 0 7 5 7 5 0 0
Professionals 3 4 1 1 1 1 18 60 23 66 0 0
Technicians and Associate
Professionals 1 0 0 0 1 0 6 2 8 2 0 0
Clerical Support Workers 0 1 0 0 0 1 0 13 0 15 0 0
Service and Sales Workers 4 6 0 0 0 0 4 5 8 11 0 0
Table 3.38: NUMBER OF NEW RECRUITS
Skilled Agricultural, Forestry,
Fishery, Craft and Related
Trades Workers 22 0 0 0 0 0 1 0 23 0 0 0
Plant and Machine Operators
and Assemblers 4 0 0 0 0 0 0 0 4 0 0 0
Elementary Occupations 11 2 0 0 0 0 0 0 11 2 0 0
Source: ETDP SETA SSP Schooling Survey, 2012
In table below, less employees left the employment than those who joined the employment. A total number of
89 employees left the employment of respondent schools, which represent 54 females and 35 males. Most of
these were among the managers, professionals and associate professional staff. More White (79%) staff left the
employment than Blacks, while more professional females (73% of the professionals) are leaving the profession.
Table 3.39: NUMBER OF EMPLOYEES WHO LEFT THE EMPLOYMENT
Occupational Group African Coloured Indian/Asian White Total Disabled
M F M F M F M F M F M F
Managers 1 0 0 0 0 0 2 3 3 3 0 0
Professionals 2 1 2 0 0 1 8 31 12 33 0 0
Technicians and Associate
Professionals 2 1 0 0 0 0 5 3 7 4 0 0
Clerical Support Workers 0 0 0 0 0 1 0 9 0 10 0 0
Service and Sales Workers 0 0 0 0 0 1 6 2 6 3 0 0
Skilled Agricultural,
Forestry, Fishery, Craft and
Related Trades Workers 1 0 0 0 0 0 1 0 2 0 0 0
Plant and Machine
Operators and Assemblers 0 0 0 0 0 0 0 0 0 0 0 0
Elementary Occupations 5 1 0 0 0 0 0 0 5 1 0 0
Source: ETDP SETA SSP Schooling Survey, 2012
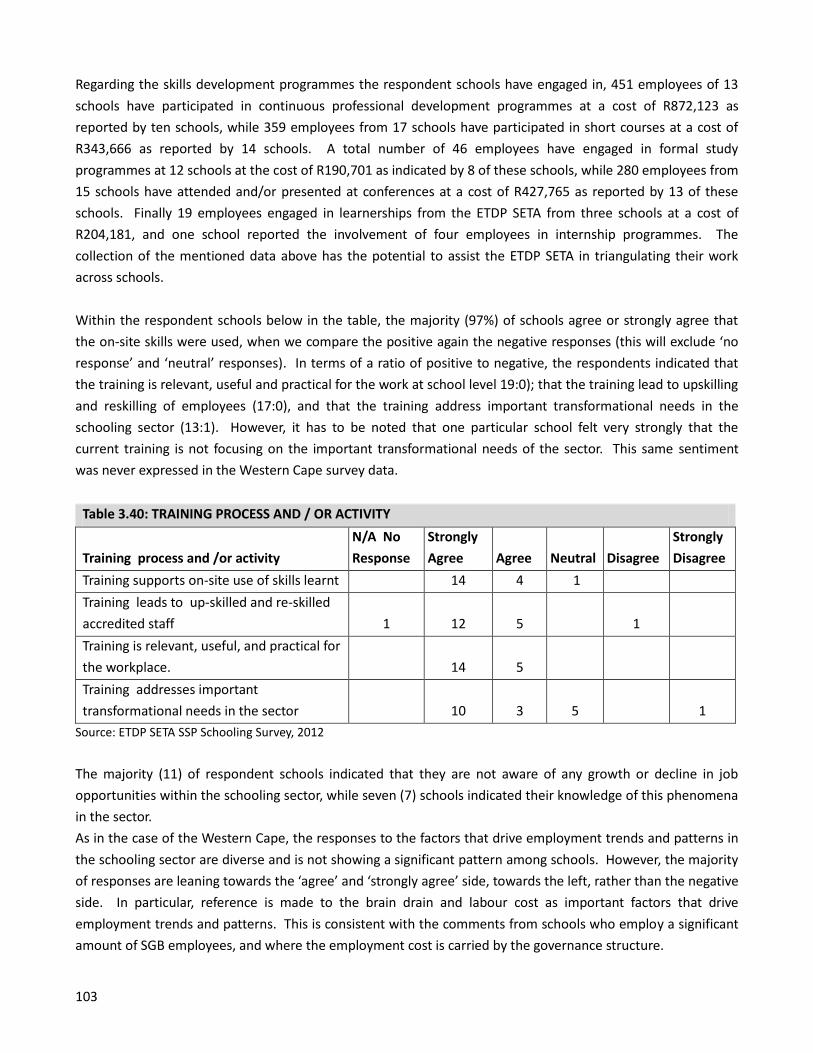
103
Regarding the skills development programmes the respondent schools have engaged in, 451 employees of 13
schools have participated in continuous professional development programmes at a cost of R872,123 as
reported by ten schools, while 359 employees from 17 schools have participated in short courses at a cost of
R343,666 as reported by 14 schools. A total number of 46 employees have engaged in formal study
programmes at 12 schools at the cost of R190,701 as indicated by 8 of these schools, while 280 employees from
15 schools have attended and/or presented at conferences at a cost of R427,765 as reported by 13 of these
schools. Finally 19 employees engaged in learnerships from the ETDP SETA from three schools at a cost of
R204,181, and one school reported the involvement of four employees in internship programmes. The
collection of the mentioned data above has the potential to assist the ETDP SETA in triangulating their work
across schools.
Within the respondent schools below in the table, the majority (97%) of schools agree or strongly agree that
the on-site skills were used, when we compare the positive again the negative responses (this will exclude ‘no
response’ and ‘neutral’ responses). In terms of a ratio of positive to negative, the respondents indicated that
the training is relevant, useful and practical for the work at school level 19:0); that the training lead to upskilling
and reskilling of employees (17:0), and that the training address important transformational needs in the
schooling sector (13:1). However, it has to be noted that one particular school felt very strongly that the
current training is not focusing on the important transformational needs of the sector. This same sentiment
was never expressed in the Western Cape survey data.
Table 3.40: TRAINING PROCESS AND / OR ACTIVITY
Training process and /or activity
N/A No
Response
Strongly
Agree Agree Neutral Disagree
Strongly
Disagree
Training supports on-site use of skills learnt 14 4 1
Training leads to up-skilled and re-skilled
accredited staff 1 12 5 1
Training is relevant, useful, and practical for
the workplace. 14 5
Training addresses important
transformational needs in the sector 10 3 5 1
Source: ETDP SETA SSP Schooling Survey, 2012
The majority (11) of respondent schools indicated that they are not aware of any growth or decline in job
opportunities within the schooling sector, while seven (7) schools indicated their knowledge of this phenomena
in the sector.
As in the case of the Western Cape, the responses to the factors that drive employment trends and patterns in
the schooling sector are diverse and is not showing a significant pattern among schools. However, the majority
of responses are leaning towards the ‘agree’ and ‘strongly agree’ side, towards the left, rather than the negative
side. In particular, reference is made to the brain drain and labour cost as important factors that drive
employment trends and patterns. This is consistent with the comments from schools who employ a significant
amount of SGB employees, and where the employment cost is carried by the governance structure.
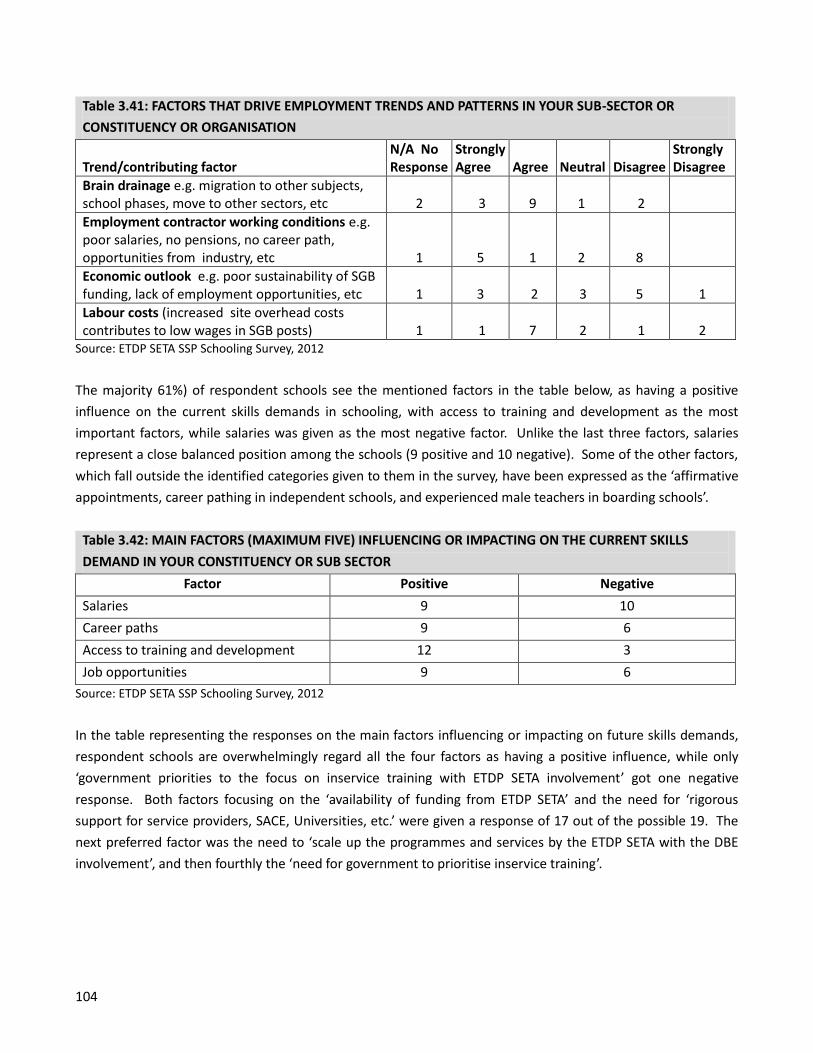
104
Table 3.41: FACTORS THAT DRIVE EMPLOYMENT TRENDS AND PATTERNS IN YOUR SUB-SECTOR OR
CONSTITUENCY OR ORGANISATION
Trend/contributing factor N/A No Response
Strongly Agree Agree Neutral Disagree
Strongly Disagree
Brain drainage e.g. migration to other subjects, school phases, move to other sectors, etc 2 3 9 1 2
Employment contractor working conditions e.g. poor salaries, no pensions, no career path, opportunities from industry, etc 1 5 1 2 8
Economic outlook e.g. poor sustainability of SGB funding, lack of employment opportunities, etc 1 3 2 3 5 1
Labour costs (increased site overhead costs contributes to low wages in SGB posts) 1 1 7 2 1 2
Source: ETDP SETA SSP Schooling Survey, 2012
The majority 61%) of respondent schools see the mentioned factors in the table below, as having a positive
influence on the current skills demands in schooling, with access to training and development as the most
important factors, while salaries was given as the most negative factor. Unlike the last three factors, salaries
represent a close balanced position among the schools (9 positive and 10 negative). Some of the other factors,
which fall outside the identified categories given to them in the survey, have been expressed as the ‘affirmative
appointments, career pathing in independent schools, and experienced male teachers in boarding schools’.
Table 3.42: MAIN FACTORS (MAXIMUM FIVE) INFLUENCING OR IMPACTING ON THE CURRENT SKILLS
DEMAND IN YOUR CONSTITUENCY OR SUB SECTOR
Factor Positive Negative
Salaries 9 10
Career paths 9 6
Access to training and development 12 3
Job opportunities 9 6
Source: ETDP SETA SSP Schooling Survey, 2012
In the table representing the responses on the main factors influencing or impacting on future skills demands,
respondent schools are overwhelmingly regard all the four factors as having a positive influence, while only
‘government priorities to the focus on inservice training with ETDP SETA involvement’ got one negative
response. Both factors focusing on the ‘availability of funding from ETDP SETA’ and the need for ‘rigorous
support for service providers, SACE, Universities, etc.’ were given a response of 17 out of the possible 19. The
next preferred factor was the need to ‘scale up the programmes and services by the ETDP SETA with the DBE
involvement’, and then fourthly the ‘need for government to prioritise inservice training’.

105
Table 3.43: MAIN FACTORS (MAXIMUM FIVE) THAT WILL INFLEUNCE OR IMPACT ON FUTURE SKILLS DEMANDS OF
YOUR ORGANISATION
Factor Positive Negative
Available funding sourced from ETDP SETA 17
Scale up of programmes and services by ETDP SETA with DBE involvement 13
Government priorities to focus on INSET with ETDP SETA involvement 11 1
Rigorous support from Service Providers, SACE, Universities, etc. 17
Source: ETDP SETA SSP Schooling Survey, 2012
As far as the scarcity of skills within the schooling sector is concerned, the respondent schools identify the
following major occupations, within the related occupation and specialisation, as well as the reasons for
scarcity:
Managers:
o Principals with LSEN skills, since they are not paid well, have a big workload, are not treated fairly,
and that most are not trained for LSEN;
o Principals, Deputies and HoDs who are nearing their retirement, and that replacements are not
available;
o Deputy principals LSEN skills, since they are not paid well, have a big workload, are not treated
fairly, and that most are not trained for LSEN, and others who do not have school management
skills;
o Heads of Department with academic skills are not paid well, and the remuneration is not attractive
for additional responsibilities; those with care and support skills; and those who are LSEN specialist
due to the lack of proper remuneration, heavy workload and there are no new trainees.
Professionals:
o Master teachers not available at primary school level, due to the lack of training quality;
o Teachers who need to teach Zulu, technology, remedial, visual arts, mathematics, physical science,
networking, computer applications, accounting, life science, English, music, dance, drama, EGD,
etc., due to the lack of available trained teachers;
o Speech therapists, audiologist, occupational therapists, education psychologists, and social workers
are not available to work within education due to the lack of vacancies.
Technicians and associated professionals:
o Property managers to manage the site;
o Secretary with competence in office management;
o Clerks with librarian skills, ICT, financial management and human relations.
Service workers:
o Boarding school hostel matrons due to the lack of skills;
o Residential care assistances with conflict management skills, since most are inexperience and have
a lack of orientation to the job;
o Teacher’s aide with ETDP methodology, since they are inexperienced.
o Business officers with commercial and legal skills.
106
Elementary workers:
o Handy persons within apprenticeship and/or learnership experience, since often these are
employees who are illiterate and innumerate;
o Security staff that have an understanding of health issues.
In order to respond to the challenges of the mentioned 28 scarce skills, the table below represents the
respondent schools suggesting the following interventions and the most appropriate type of interventions to
solve the problem. The list from such a small sample of schools is extensive, ranging from administrative staff
within technical skills to professional staff with academic and practical skills. The list even respond to the
auxiliary services such as boarding school matrons needed as specific schools.
Among the 28 scarce skills, 80 different intervention types have been mentioned by the respondents, in order
to overcome the scarce skills problems. In terms of intervention types, coaching and mentoring current staff to
overcome the problems has been identified the most (29%). Thereafter, qualifications through higher
education institutions was indicated as the second option (23%), with graduate internship as the third
intervention type preferred (15%). None of the respondents indicated the recruitment of foreigners as an
option (0%), while a particular pattern on the training of Afrikaans, Mathematics and Physical Science teachers
been identified as other, meaning that they wanted a different type of intervention other than the current
seven intervention types. Higher education qualifications was the most popular choice of intervention type as
a first choice (15 out of 17 choices), while coaching and mentoring was preferred the most frequent times as an
intervention type of third choice.
Most of the scarce skills list (64%) identified three types of interventions, with higher education qualifications
and coaching/mentoring as the most common two choices (43%) among the 28 scarce skills, but the frequency
of choice of combining higher education qualifications and graduate internship, as well as graduate internship
with coaching/mentoring were the same (39%), whether as first, second, third or fourth choice. Occupational
therapist and SGB policy development were the only two scarce skills preferred through one type of
intervention, namely ETDP SETA accredited short course and coaching/mentoring of current staff respectively.
The training of teachers received the most (5 out of 7 options) number of intervention types.
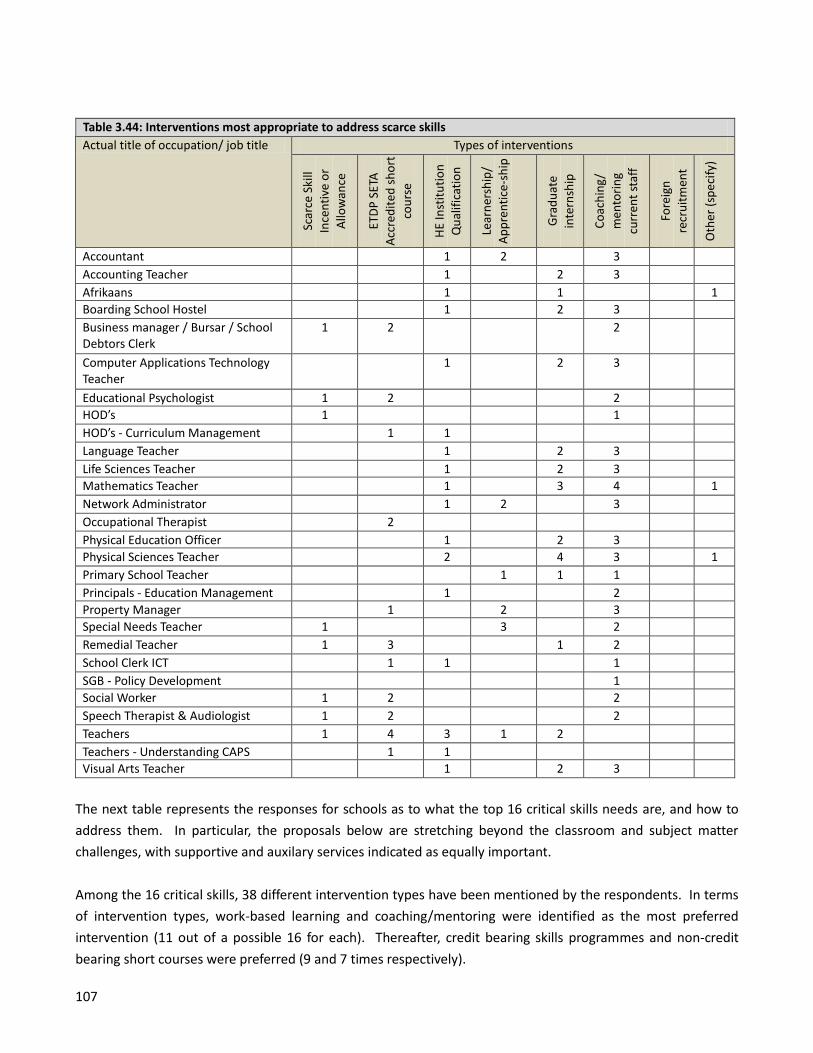
107
Table 3.44: Interventions most appropriate to address scarce skills
Actual title of occupation/ job title Types of interventions
Scar
ce S
kill
Ince
nti
ve o
r
Allo
wan
ce
ETD
P S
ETA
Acc
red
ited
sh
ort
cou
rse
HE
Inst
itu
tio
n
Qu
alif
icat
ion
Lear
ner
ship
/
Ap
pre
nti
ce-s
hip
Gra
du
ate
inte
rnsh
ip
Co
ach
ing
/
men
tori
ng
curr
ent
staf
f
Fore
ign
recr
uit
men
t
Oth
er (
spe
cify
)
Accountant 1 2 3
Accounting Teacher 1 2 3
Afrikaans 1 1 1
Boarding School Hostel 1 2 3
Business manager / Bursar / School Debtors Clerk
1 2 2
Computer Applications Technology Teacher
1 2 3
Educational Psychologist 1 2 2
HOD’s 1 1
HOD’s - Curriculum Management 1 1
Language Teacher 1 2 3
Life Sciences Teacher 1 2 3
Mathematics Teacher 1 3 4 1
Network Administrator 1 2 3
Occupational Therapist 2
Physical Education Officer 1 2 3
Physical Sciences Teacher 2 4 3 1
Primary School Teacher 1 1 1
Principals - Education Management 1 2
Property Manager 1 2 3
Special Needs Teacher 1 3 2
Remedial Teacher 1 3 1 2
School Clerk ICT 1 1 1
SGB - Policy Development 1
Social Worker 1 2 2
Speech Therapist & Audiologist 1 2 2
Teachers 1 4 3 1 2
Teachers - Understanding CAPS 1 1
Visual Arts Teacher 1 2 3
The next table represents the responses for schools as to what the top 16 critical skills needs are, and how to
address them. In particular, the proposals below are stretching beyond the classroom and subject matter
challenges, with supportive and auxilary services indicated as equally important.
Among the 16 critical skills, 38 different intervention types have been mentioned by the respondents. In terms
of intervention types, work-based learning and coaching/mentoring were identified as the most preferred
intervention (11 out of a possible 16 for each). Thereafter, credit bearing skills programmes and non-credit
bearing short courses were preferred (9 and 7 times respectively).
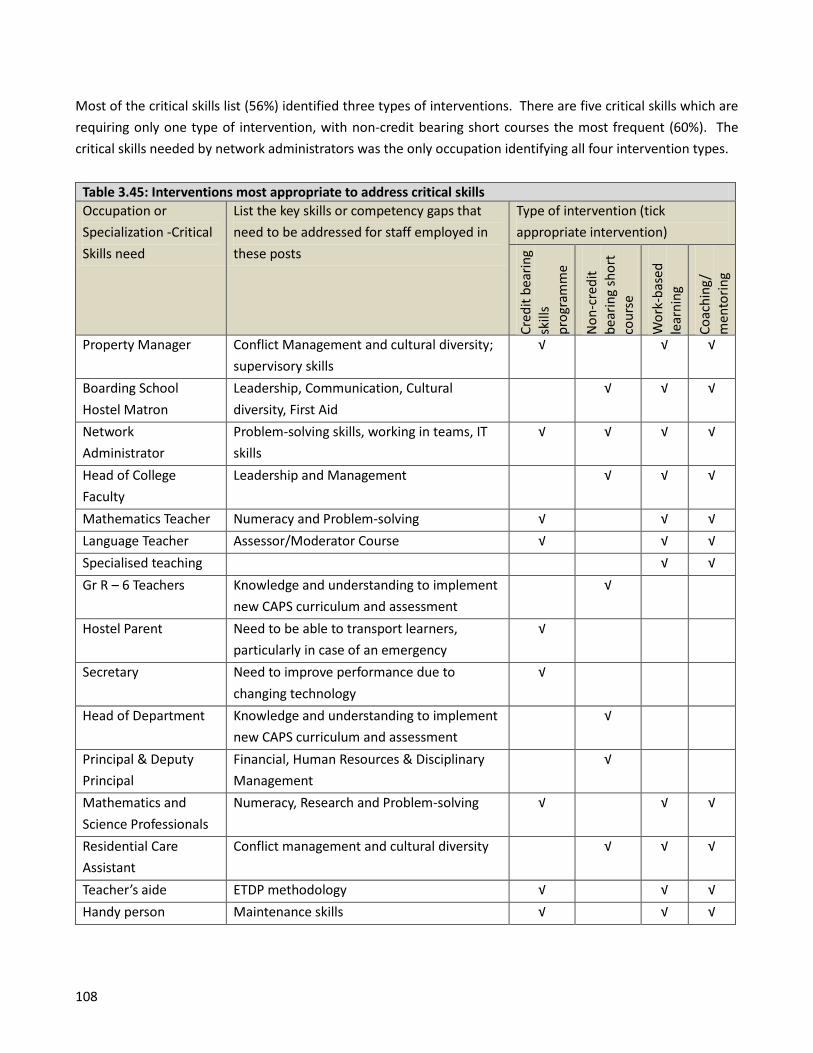
108
Most of the critical skills list (56%) identified three types of interventions. There are five critical skills which are
requiring only one type of intervention, with non-credit bearing short courses the most frequent (60%). The
critical skills needed by network administrators was the only occupation identifying all four intervention types.
Table 3.45: Interventions most appropriate to address critical skills
Occupation or
Specialization -Critical
Skills need
List the key skills or competency gaps that
need to be addressed for staff employed in
these posts
Type of intervention (tick
appropriate intervention)
Cre
dit
bea
rin
g sk
ills
pro
gram
me
No
n-c
red
it
bea
rin
g sh
ort
co
urs
e
Wo
rk-b
ased
le
arn
ing
Co
ach
ing/
m
ento
rin
g
Property Manager Conflict Management and cultural diversity;
supervisory skills
√ √ √
Boarding School
Hostel Matron
Leadership, Communication, Cultural
diversity, First Aid
√ √ √
Network
Administrator
Problem-solving skills, working in teams, IT
skills
√ √ √ √
Head of College
Faculty
Leadership and Management √ √ √
Mathematics Teacher Numeracy and Problem-solving √ √ √
Language Teacher Assessor/Moderator Course √ √ √
Specialised teaching √ √
Gr R – 6 Teachers Knowledge and understanding to implement
new CAPS curriculum and assessment
√
Hostel Parent Need to be able to transport learners,
particularly in case of an emergency
√
Secretary Need to improve performance due to
changing technology
√
Head of Department Knowledge and understanding to implement
new CAPS curriculum and assessment
√
Principal & Deputy
Principal
Financial, Human Resources & Disciplinary
Management
√
Mathematics and
Science Professionals
Numeracy, Research and Problem-solving √ √ √
Residential Care
Assistant
Conflict management and cultural diversity √ √ √
Teacher’s aide ETDP methodology √ √ √
Handy person Maintenance skills √ √ √
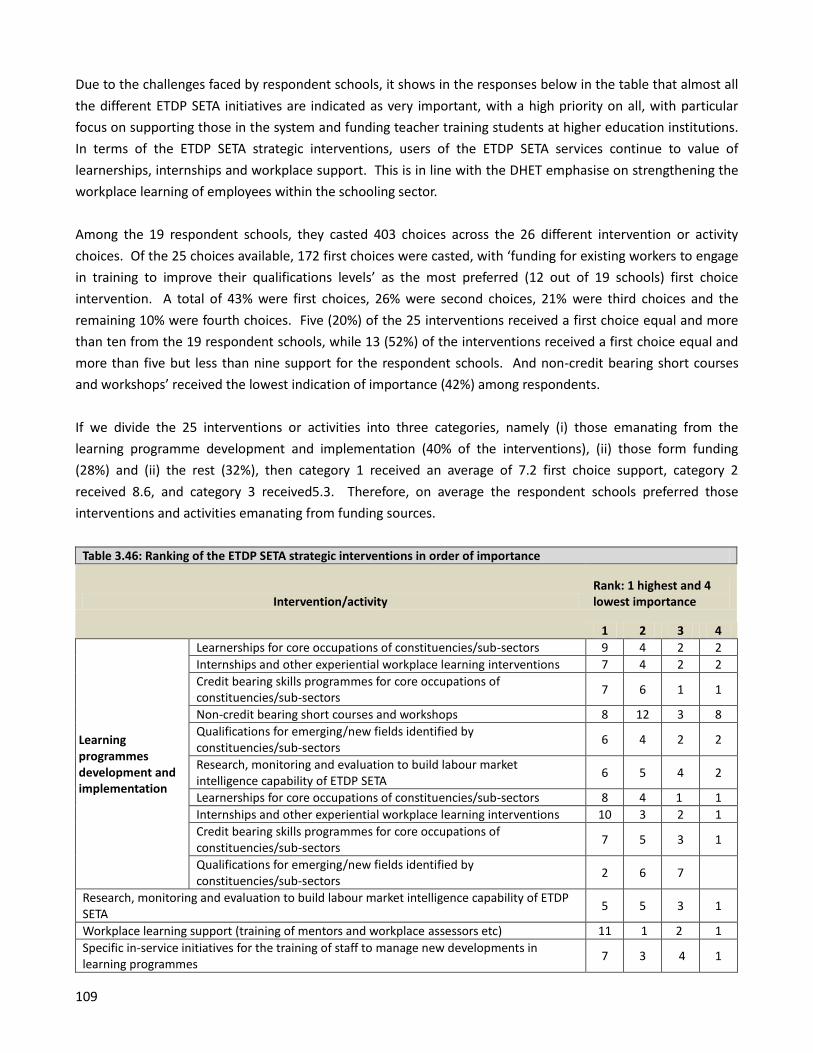
109
Due to the challenges faced by respondent schools, it shows in the responses below in the table that almost all
the different ETDP SETA initiatives are indicated as very important, with a high priority on all, with particular
focus on supporting those in the system and funding teacher training students at higher education institutions.
In terms of the ETDP SETA strategic interventions, users of the ETDP SETA services continue to value of
learnerships, internships and workplace support. This is in line with the DHET emphasise on strengthening the
workplace learning of employees within the schooling sector.
Among the 19 respondent schools, they casted 403 choices across the 26 different intervention or activity
choices. Of the 25 choices available, 172 first choices were casted, with ‘funding for existing workers to engage
in training to improve their qualifications levels’ as the most preferred (12 out of 19 schools) first choice
intervention. A total of 43% were first choices, 26% were second choices, 21% were third choices and the
remaining 10% were fourth choices. Five (20%) of the 25 interventions received a first choice equal and more
than ten from the 19 respondent schools, while 13 (52%) of the interventions received a first choice equal and
more than five but less than nine support for the respondent schools. And non-credit bearing short courses
and workshops’ received the lowest indication of importance (42%) among respondents.
If we divide the 25 interventions or activities into three categories, namely (i) those emanating from the
learning programme development and implementation (40% of the interventions), (ii) those form funding
(28%) and (ii) the rest (32%), then category 1 received an average of 7.2 first choice support, category 2
received 8.6, and category 3 received5.3. Therefore, on average the respondent schools preferred those
interventions and activities emanating from funding sources.
Table 3.46: Ranking of the ETDP SETA strategic interventions in order of importance
Intervention/activity Rank: 1 highest and 4 lowest importance
1 2 3 4
Learning programmes development and implementation
Learnerships for core occupations of constituencies/sub-sectors 9 4 2 2
Internships and other experiential workplace learning interventions 7 4 2 2
Credit bearing skills programmes for core occupations of constituencies/sub-sectors
7 6 1 1
Non-credit bearing short courses and workshops 8 12 3 8
Qualifications for emerging/new fields identified by constituencies/sub-sectors
6 4 2 2
Research, monitoring and evaluation to build labour market intelligence capability of ETDP SETA
6 5 4 2
Learnerships for core occupations of constituencies/sub-sectors 8 4 1 1
Internships and other experiential workplace learning interventions 10 3 2 1
Credit bearing skills programmes for core occupations of constituencies/sub-sectors
7 5 3 1
Qualifications for emerging/new fields identified by constituencies/sub-sectors
2 6 7
Research, monitoring and evaluation to build labour market intelligence capability of ETDP SETA
5 5 3 1
Workplace learning support (training of mentors and workplace assessors etc) 11 1 2 1
Specific in-service initiatives for the training of staff to manage new developments in learning programmes
7 3 4 1
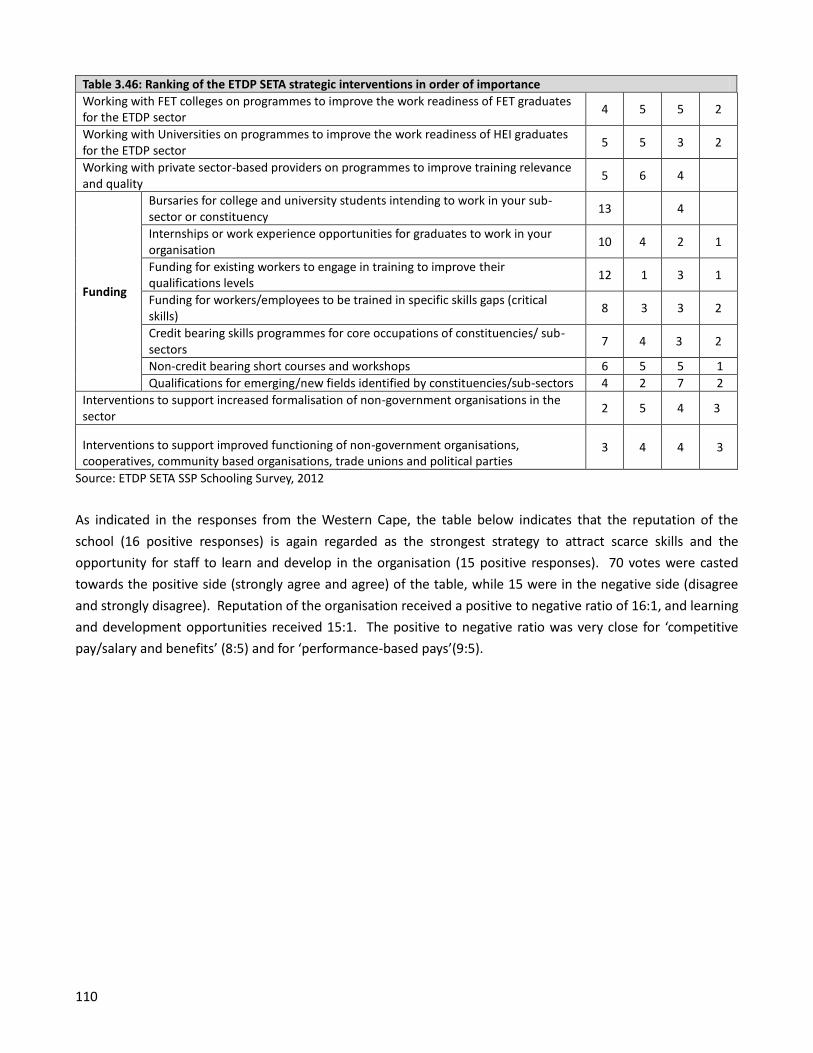
110
Table 3.46: Ranking of the ETDP SETA strategic interventions in order of importance
Working with FET colleges on programmes to improve the work readiness of FET graduates for the ETDP sector
4 5 5 2
Working with Universities on programmes to improve the work readiness of HEI graduates for the ETDP sector
5 5 3 2
Working with private sector-based providers on programmes to improve training relevance and quality
5 6 4
Funding
Bursaries for college and university students intending to work in your sub-sector or constituency
13 4
Internships or work experience opportunities for graduates to work in your organisation
10 4 2 1
Funding for existing workers to engage in training to improve their qualifications levels
12 1 3 1
Funding for workers/employees to be trained in specific skills gaps (critical skills)
8 3 3 2
Credit bearing skills programmes for core occupations of constituencies/ sub-sectors
7 4 3 2
Non-credit bearing short courses and workshops 6 5 5 1
Qualifications for emerging/new fields identified by constituencies/sub-sectors 4 2 7 2
Interventions to support increased formalisation of non-government organisations in the sector
2 5 4 3
Interventions to support improved functioning of non-government organisations, cooperatives, community based organisations, trade unions and political parties
3 4 4 3
Source: ETDP SETA SSP Schooling Survey, 2012
As indicated in the responses from the Western Cape, the table below indicates that the reputation of the
school (16 positive responses) is again regarded as the strongest strategy to attract scarce skills and the
opportunity for staff to learn and develop in the organisation (15 positive responses). 70 votes were casted
towards the positive side (strongly agree and agree) of the table, while 15 were in the negative side (disagree
and strongly disagree). Reputation of the organisation received a positive to negative ratio of 16:1, and learning
and development opportunities received 15:1. The positive to negative ratio was very close for ‘competitive
pay/salary and benefits’ (8:5) and for ‘performance-based pays’(9:5).
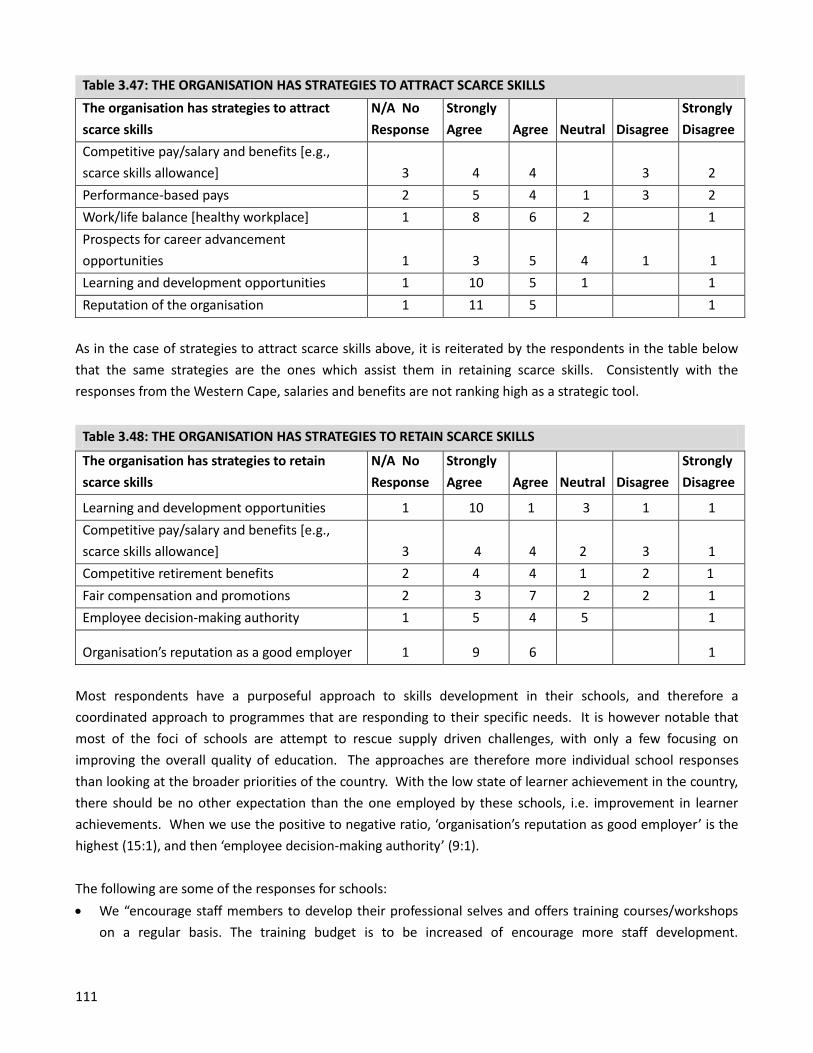
111
Table 3.47: THE ORGANISATION HAS STRATEGIES TO ATTRACT SCARCE SKILLS
The organisation has strategies to attract
scarce skills
N/A No
Response
Strongly
Agree Agree Neutral Disagree
Strongly
Disagree
Competitive pay/salary and benefits [e.g.,
scarce skills allowance] 3 4 4 3 2
Performance-based pays 2 5 4 1 3 2
Work/life balance [healthy workplace] 1 8 6 2 1
Prospects for career advancement
opportunities 1 3 5 4 1 1
Learning and development opportunities 1 10 5 1 1
Reputation of the organisation 1 11 5 1
As in the case of strategies to attract scarce skills above, it is reiterated by the respondents in the table below
that the same strategies are the ones which assist them in retaining scarce skills. Consistently with the
responses from the Western Cape, salaries and benefits are not ranking high as a strategic tool.
Table 3.48: THE ORGANISATION HAS STRATEGIES TO RETAIN SCARCE SKILLS
The organisation has strategies to retain
scarce skills
N/A No
Response
Strongly
Agree Agree Neutral Disagree
Strongly
Disagree
Learning and development opportunities 1 10 1 3 1 1
Competitive pay/salary and benefits [e.g.,
scarce skills allowance] 3 4 4 2 3 1
Competitive retirement benefits 2 4 4 1 2 1
Fair compensation and promotions 2 3 7 2 2 1
Employee decision-making authority 1 5 4 5 1
Organisation’s reputation as a good employer 1 9 6 1
Most respondents have a purposeful approach to skills development in their schools, and therefore a
coordinated approach to programmes that are responding to their specific needs. It is however notable that
most of the foci of schools are attempt to rescue supply driven challenges, with only a few focusing on
improving the overall quality of education. The approaches are therefore more individual school responses
than looking at the broader priorities of the country. With the low state of learner achievement in the country,
there should be no other expectation than the one employed by these schools, i.e. improvement in learner
achievements. When we use the positive to negative ratio, ‘organisation’s reputation as good employer’ is the
highest (15:1), and then ‘employee decision-making authority’ (9:1).
The following are some of the responses for schools:
We “encourage staff members to develop their professional selves and offers training courses/workshops
on a regular basis. The training budget is to be increased of encourage more staff development.
112
Consideration is to be given to introduce Learnerships for an elementary occupation, i.e. Electrical or
Plumbing Learnership.”
“Staff undergoes staff development programmes on a weekly basis. People leaving take these skills with
them.”
“Our School Governing Board budget a fair amount on development for our staff as a whole. We even pay
for Education Department staff to be developed, as we cannot rely on the Education Department to
competently do this. That which they do offer is often sub standard.”
“Support given to rural disadvantage schools by running a winter mathematics holiday school. Helped a
rural disadvantage school to register as an Independent School. Currently assisting this school with
development, organisation structure and staff development.”
“Recruitment to the teaching profession is always difficult particularly in seeking teachers of physical science, mathematics, accounting and languages. The school concentrates on curriculum development to assist our current staff.”
“We try to develop all our staff every year, professional staff attend training and development workshops.
Non-teaching staff attends in house training development. The therapist and teachers attend workshops
that are relevant to our curricula.”
“Our programme of skills & development applies to all our staff. Our core business is education and our
teaching complement is continuously developing and honing skills, which ultimately reflects on our
learners’ success. We have maintained a 100% matric pass rate over the past several years. Our learners
leave as well adjusted, young adults who a ready to enter the working environment.”
Finally numerous schools have cemented skills development initiatives and partnerships that are stretching
over many years. It is a clear indication that school do realise that they have to work together, but the
information below is indicating a relationship across known boundaries, and not too many formations of new
relationships. The following are some of the initiatives and partnerships:
Continuous Professional Development - “Staff development Programmes; Workshops conducted by the
Department of Education, Learnerships for student teachers (mainly our own ex-pupils) in scarce subjects,
Interschool /cluster subject meetings. Conferences hosted by the Association of Muslim Schools.”
Partnering Programmes - “We partner with accredited education bodies, such as ISASA, SAHISA, SABISA,
ISDHA and NAPTOSA, drawing all the relevant ‘best practices’ from these organisations and incorporating
them into our educational programme.”
Learnership Programme - “Our Governing Body run a very successfully learnership programme – learners study through UNISA and assist and are developed at our school. We encourage and pay for educators to attend at least one development programme per term. A number of our staff are embarking on furthering their studies, however, they have to fund these studies themselves. The school ensures that there are a number of ‘whole staff’ development programmes during the year.”
Site-based Staff Development - “We offer ongoing short-courses, seminars for the different disciplines on
the staff. The school will act as a resource school to other schools around us in need. We have already
offered our services to the ESDESS in our area. We offer training of interns and other teachers. The principal
and numerous teachers are affiliated to the Remedial Teachers’ Association and SAALED in KwaZulu-Natal.
These organisations arrange international speakers that keep all disciplines in our school updated. These
remedial solutions are also disseminated to the mainstream teachers who attend them. One of our
teachers is ETDP SETA approved to lecture and run courses for Facilitators, Teacher Aids and Teachers.” And
113
“Workshops on caps for the educators, fish bowl training, autism, SAALED conferences and attending other
workshops.”
Parental Support Programmes - “The psychology department in the school holds a weekly “Parent Support” Meeting, with different speakers every week to assist, up-skill and train parents on matters relating to children being at a Remedial School and the disabilities they have to deal with. We have a library that has a section with literature that is a resource for the teachers, with the latest information from research from other countries. We are a leading school in Remedial Education, and we have an excellent reputation for remediating children in the short term, so that they successfully return to mainstream schools.”
Area/Circuit-wide Skills Development “Support and host Redcap teacher training events. Support and mentorship programs with local colleagues.”
Despite the narrow range of partnerships and initiatives, it must be noted that schools still reach out to their
neighbours and other schools to build some common working relationship.
3.6.3 Direct and indirect ideas from the data from the two provinces
The following points below require serious consideration when determining interventions for educators so that
the areas of scarce and critical skills can be adequately addressed. In particular, the guiding question can be:
"What do we know and what more do we need to learn about teacher education and preparation that takes
into account the results of more than 30 years of research on teaching and learning?” What teacher beliefs,
knowledge and skills should support the vision for teacher supply and demand? Based on the responses for the
two provinces, the vision should include:
Teachers need to know their subject;
Teachers need to have subject specific pedagogical content knowledge;
Teachers need to have knowledge about curriculum/instructional approaches;
Teachers need to have practical knowledge of running a diverse clientele of learners;
Teachers need to have knowledge of the students they teach and how learners learn;
Teachers need to know about the norms and standards of teachers in practice.
Questions to guide future researchers as it impacts on cost, social investment and demand and supply of
teachers:
What subject content and in what form do teachers need to know?
How do we bridge traditional separations of pre-service and in-service teacher education to create a
professional continuum of teacher education that includes the induction phase?
How do diverse teachers acquire beliefs, knowledge and skills across a variety of educational settings and
opportunities?
o What coursework and field experiences lead to the development of knowledge and skills that help
teachers, at various points in their professional development, bring reform visions into classrooms
(action research, institutional partnerships)?
o What roles can teacher professional learning communities at best, or subject committees — groups
of teachers learning together—play in the continued education and production of professional
knowledge (e.g. mentoring, communities of practice)?
What are the implications of what teachers learn for their learners?
114
Who are the teacher candidates? How do the following influence candidates’ development as teachers?
o Age, race, culture, gender, language, class, self-image
o Prior experience
o Subject knowledge
o Context and societal influences
The final tentative comments are therefore that we have to balance the issue of supply and demand, since our
current focus is only on supply, without linking the consequences of demand side decision making on the
supply side of teacher. Furthermore, there has to be an awareness of the implications and consequences
associated with the trade-offs between the quantity and quality focus in teacher supply and demand. The
responses from the two provinces suggest that the overt focus on extrinsic rewards at the expense as intrinsic,
well-being and values driven issues are ignored during the bigger debates in education.
115
Chapter 4: Sector Strategy
4.1 Priority Areas and Alignment with National Strategies/Imperatives
There are at least six policy frameworks that are relevant to the schooling sector skills plan:
1. Medium Term Strategic Framework (MTSF)
2. National Growth Path (NGP) - 2010
3. National Skills Development Strategy III (NSDS III)
4. Industrial Policy Action Plan (IPAP)
5. National Development Plan – 2030
6. Integrated Strategic Planning Framework for Teacher Education and development in South Africa (2011-
2025)
4.1.1 Medium Term Strategic Framework (MTSF)
The MTSF emphasises the need for a growth trajectory that will address the economy’s structural constraints,
expand the industrial base and create decent work opportunities on a large scale. Critically, investment in
quality education for all young people and in skills development forms the bedrock of government’s approach.
Indeed, success in reducing poverty, in eliminating structural unemployment, in implementing a comprehensive
social security system, in building social cohesion and in reducing crime will depend in large measure on the
progress made in growing the economy in an equitable manner, underpinned by a growing skills base. In turn,
progress in these social areas will contribute to economic growth.
The Medium Term Strategic Framework 2009-2014 has identified the following imperatives to be considered for
government delivery. Special attention must be given to Strategic Priority 4.
Strategic Priority 1: Speeding up growth and transforming the economy to create decent work and
sustainable livelihoods. The main objective is to respond appropriately, promptly and effectively so that
growth in decent employment and improvements in income security are reinforced, and investment
sustained to build up national economic capability and improve industrial competitiveness.
Strategic Priority 2: Massive programme to build economic and social infrastructure. In the period
ahead, government will continue with the investment programme aimed at expanding and improving
social and economic infrastructure to increase access, quality and reliability of public services and to
support economic activities while also considering environmental sustainability and pursuing maximum
employment impact. The state will continue with programmes to provide and maintain health,
education, library, sporting, recreation and other social infrastructure.
Strategic Priority 3: Comprehensive rural development strategy linked to land and agrarian reform and
food security. Between 10 and 15 million South Africans live in areas that are characterised by extreme
poverty and underdevelopment. Recognising the diversity of South Africa’s rural areas, the overall
objective is to develop and implement a comprehensive strategy of rural development that will be aimed
at improving the quality of life of rural households, enhancing the country’s food security through a
broader base of agricultural production, and exploiting the varied economic potential that each region of
the country enjoys.
116
Strategic Priority 4: Strengthen the skills and human resource base. Education has enjoyed the largest
share of the national budget throughout the past 15 years. This significant investment in building human
capital and capabilities has gradually improved the country’s human resource and skills base. However,
progress has not been optimal and the achievements have not taken place on the required scale. Our
objective is thus to focus our skills and education system towards the delivery of quality outcomes. The
focus will be on, amongst others, learner outcomes, early childhood development (ECD), improving
schools management and monitoring and evaluation (M&E) systems and supporting and developing a
high quality teaching profession.
Strategic Priority 5: Improve the health profile of all South Africans. In the current MTSF period the state
aims to transform the public health system so as to reduce inequalities in that system, improve quality of
care and public facilities, boost human resources and step up the fight against HIV/Aids, TB and other
communicable diseases as well as lifestyle and other causes of ill-health and mortality.
Strategic Priority 6: Intensify the fight against crime and corruption. Government is determined to curb
levels of crime and corruption. Contact crimes, crimes against women and children and organised crime
remain a key focus, and so is the combating of corruption.
Strategic Priority 7: Build cohesive, caring and sustainable communities. Social cohesion is important if
we are to achieve developmental success. However, inequalities of condition and opportunity and
weaknesses with regard to a sense of being part of a common enterprise are placing severe stress and
strain on social cohesion. In this MTSF period, government aims to meet our target of halving poverty
and unemployment by 2014.
Strategic Priority 8: Pursuing African advancement and enhanced international co-operation. Over the
medium term, the main goal is to ensure that our foreign relations contribute to the creation of an
environment conducive to economic growth and development domestically, within Africa and in other
developing countries.
Strategic Priority 9: Sustainable Resource Management and use. Like the rest of the world, we are
vulnerable to the impacts of climate change, biodiversity loss and diminishing water resources.
Strategic Priority 10: Building a developmental state including improvement of public services and
strengthening democratic institutions. In the previous mandate period, government committed itself to
improving the capacity of the state for growth and development. This remains a priority.
These ten MTSF priorities need to occupy centre stage in the draft National Skills Development Strategy III
(discussed later in this chapter). Skills development is clearly a cross cutting field (point 4) and is considered to
be a supporting component for the rest. Thus the extent to which skills development contributes to achieving
the MTSF priorities will be a significant indicator of the success of the whole plan. For this reason, these
priorities must form an important focus area and a priority for sector skills planning.
4.1.2 New Growth Path
The New Growth Path aims to enhance growth, employment creation and equity. The policy’s principal target is
to create five million jobs over the next 10 years. This framework reflects government’s commitment to
prioritising employment creation in all economic policies. It identifies strategies that will enable South Africa to
grow in a more equitable and inclusive manner while attaining South Africa’s developmental agenda.
117
The following are some of the important points emphasised by the New Growth Path document, especially
Point 2 on skills development.
1. Central to the New Growth Path is a massive investment in infrastructure as a critical driver of jobs across
the economy.
The framework identifies investments in five key areas namely: energy, transport, communication,
water and housing. Sustaining high levels of public investment in these areas will create jobs in
construction, operation and maintenance of infrastructure.
The new growth path sees the infrastructure programme as a trigger to build a local supplier
industry for the manufacture of the components for the build-programme.
Specific measures, particularly changes to procurement policy and regulations, are identified to
ensure that this is achieved. Risks include the still fragile global recovery; competition and
collaboration with the new fast-growing economies; and competing interests domestically.
2. Smarter coordination between government and stronger partnerships with the private sector and
organised labour will galvanise our resources in achieving the aims of the New Growth Path.
Government calls on every South African to contribute to building our nation over the coming 20
years to ensure a collective effort, creativity and solidarity.
Good leadership and strong governance are critical in ensuring that South Africa takes charge of
the new opportunities. Government commits to cut wasteful spending, tackle corruption and align
the allocation of public money with developmental priorities.
Government recognises that job targets can only be achieved if the State performs better and if
the private sector grows in labour-absorbing parts of the economy.
The New Growth Path identifies measures to strengthen the capacity of the state and enhance the
performance of the private sector to achieve employment and growth goals.
3. The New Growth Path proposes major improvements in government, with a call for slashing unnecessary
red tape, improving competition in the economy and stepping up skills development.
The role of government departments and agencies in meeting set targets for scarce and key skills is
critical. This emphasis on skills applies across the economy and will be a centrepiece of partnership
with business and labour.
Key targets include the aim to produce 30 000 engineers by 2014, with a focus on Mathematics
and Science as well as changes to university funding formulae to achieve this, and 50 000 artisans
by 2015, with annual targets for Eskom and Transnet and for individual Sector Education and
Training Authority institutions to achieve this.
The document calls for greater focus on workplace training, targeting on-the-job training and
refresher programmes for 10% of the workforce every year.
It also calls for measures to make it easier to import scarce skills by streamlining the work permit
and visa system. This will be accompanied by a skills transfer programme to ensure that local skills
development is enhanced.
118
The New Growth Path is our vision to place jobs and decent work at the centre of economic policy. It sets a
target of five million new jobs to be created by 2020. It sets out the key job drivers and the priority sectors that
we will focus on over the next few years. It is based on strong and sustained, inclusive economic growth and the
rebuilding of the productive sectors of the economy. Infrastructure development in particular is a
foundation for more jobs and addressing rural under-development (The South African LED Network).
SETAs are expected to agree to ‘... numerical targets for completed apprenticeships, with systems to track
progress, particularly in construction, mining, manufacturing and new industries such as in the green economy’
(ibid). The New Growth Path also specifically calls for a review of the apprenticeship system to enable broader
access, suggesting that the current system is in need of reconsideration.
4.1.3 National Skills Development Strategy III (NSDS III)
The following are some ideas regarding and/or emanating from the NSDS III:
This strategy draws on lessons learned from NSDS I and II. The key driving force of this strategy is
improving the effectiveness and efficiency of the skills development system. This strategy represents an
explicit commitment to encouraging the linking of skills development to career paths, career
development and promoting sustainable employment and in-work progression. The emphasis is
particularly on those who do not have relevant technical skills or adequate reading, writing and
numeracy skills to enable them to access employment.
The strategy promotes partnerships between employers, public education institutions (FET colleges,
universities of technologies and universities), private training providers and SETAs, to ensure that cross-
sectoral and inter-sectoral needs are addressed.
The NSDS will be guided by, and measured against, several key developmental and transformation
imperatives: race, class, gender, geographic considerations, and age differences, as well as disability and
the HIV and AIDS pandemic. The DHET will monitor and evaluate the role of all the institutions in the
skills development system, guided by these key transformational priorities.
NSDS III addresses the scope and mandate of the SETAs. SETAs are expected to facilitate the delivery of
sector-specific skills interventions that help achieve the goals of NSDS III, address employer demand and
deliver results. They must be the authority on labour market intelligence and ensure that skills needs and
strategies to address these needs are set out clearly in sector skills plans. They must be recognised
experts in relation to skills demand in their sectors. NSDS III provides a stronger base for the SETAs and
Department of Higher Education and Training (DHET) through service level agreements, to set targets
that align with sector skills needs - that is, there is no one-size-fits-all - and ensures an improved focus on
the core mandate of SETAs.
Another key institution in ensuring the success of NSDS III is the National Skills Fund, which is a catalytic
fund, enabling the state to drive key skills strategies as well as meet the training needs of the
unemployed, non levy-paying cooperatives, NGOs and community structures and vulnerable groups. The
National Science Foundation (NSF) is a national resource which will be used to both initiate and respond
to national skills priorities.
119
The strategy places great emphasis on relevance, quality and sustainability of skills training programmes
to ensure that they impact positively on poverty reduction and the eradication of inequalities. It focuses
on eight goals, each with accompanying outcomes and outputs which will be used as the basis for
monitoring and evaluating NSDS implementation and impact.
There is currently no institutional mechanism that provides credible information and analysis with regard to the
supply and demand for skills. For this reason, the following goals were developed:
Goal 1: Establishing a credible institutional mechanism for skills planning - NSDS will ensure that the
national need in relation to skills development is researched, documented and communicated to enable
effective planning across all economic sectors. South Africa faces a shortage of intermediate skills,
especially artisan skills. The intention is to ensure that 10,000 artisans per year qualify with relevant skills
and find employment.
Goal 2: Increasing access to occupationally-directed programmes, both intermediate level as well as
higher level professional qualifications - The public Further Education and Training (FET) college system
is central to government's programmes of skilling and re-skilling the youth and adults of South Africa. Its
transformation is key to the integration of education and training and responding to the skills needs in
our country.
Goal 3: Promoting the growth of a public FET college system that is responsive to sector, local, regional
and national skills needs and priorities - NSDS will address challenges in this regard. This includes
promoting partnerships between DHET, SETAs, employers, private providers and public FET colleges to
increase capacity to meet industry and developmental needs of the country.
Goal 4: Addressing the low level of youth and adult language and numeracy skills to enable additional
training - NSDS will develop a national strategy to provide all young people leaving school with an
opportunity to engage in training or work experience, and improve their employability.
Goal 5: Encouraging better use of workplace-based skills development - NSDS seeks to address the
training of employed workers in order to improve productivity and the overall growth and development
of our economy. Skills development is not just about training people for employment; it must also
empower people to create opportunities to make a living for themselves. This is highlighted in Goal 6.
Goal 6: Encouraging and supporting cooperatives, small enterprises, worker-initiated, NGO and
community training initiatives – NSDS seeks to support and assist the growth of small and medium size
enterprises, as well as community based and initiated organisations.
Goal 7: Increasing public sector capacity for improved service delivery and supporting the building of a
developmental state - NSDS addresses the challenge of public sector capacity. This is taking on renewed
importance due to the affirmation by government of the need for a developmental state, capable of
intervening in the economy to build an inclusive growth path.
Goal 8: Building career and vocational guidance – NSDS III addresses the lack of guidance to direct
young people in particular to programmes for which they have an aptitude and which will provide
training in areas needed in the economy.
120
Implementing the NSDS III is a collective responsibility of all stakeholders and partners in skills development.
The DHET will play a leading role in ensuring that the goals and objectives of the NSDS III are realised. The DHET
is moving away from an exclusive focus on quantitative measures of impact and success. Instead, the
monitoring and evaluation of this strategy will also focus on qualitative indicators, because it is important to
evaluate the impact of the initiatives in this strategy and ensure that the programmes provided meet the
required quality and relevance (DHET, 2011).
The NSDS has particular significance for sector skills plans (SSPs) central to the SETAs’ activities and form the
core of their mandates. The overall importance of ensuring alignment between DHET and SETAs will be
contained in the service level agreements determined and agreed annually.
Crucially, the document reinforces the role of partnerships critical to the achievement of identified goals. A
partnership and collective responsibility between stakeholders – government, business organisations, trade
unions, constituency bodies – and our delivery agents – SETAs, public bodies, employers, trade and professional
bodies, public and private training providers, community-based organisations, cooperatives and NGOs – is
critical to achieving our aspirations of higher economic growth and development, higher productivity and a
skilled and capable workforce to support a skills revolution in our country. We need to find innovative ways of
working together to improve the efficiency, quality and, crucially, the impact of education, skills development
and training (DHET, 2011, p.26).
The importance of SETAs therefore, given their responsibility to develop skills, requires more concerted
attention from other entities to ensure that the national development goals are achieved.
The DHET requires that each sector skills plan is scrutinised or signed off by the directors general of relevant
government departments. In the case of SETA, these departments will include:
The Department of Trade and Industry. This means inter alia that the SETA might be required to align the
sector skills plan with that of the Industrial Policy Action Plan (IPAP) and possibly others.
The Department of Economic Development. The imperatives of the National Growth Plan, as a national
strategic driving force for decent work, poverty reduction, equality and growth, should be considered.
4.1.4 Industrial Policy Action Plan (IPAP)
The Industrial Policy Action Plan (IPAP) of the Department of Trade and Industry (DTI) represents a crucial
component of the overall industrial strategy of the country. In January 2007, cabinet adopted the National
Industrial Policy Framework (NIPF) which set out government’s broad approach to industrialisation. IPAP was
the implementation of industrial policy. The three-year rolling plans with defined targets, budgets and
timeframes is in its second implementation phase, with the first plan dedicated to ‘easy to do actions’.
The second IPAP is a ‘need to do’ document and was launched by the President’s state of the nation address on
3 June 2009. It was recognised that one year is too short a period, and that future IPAPs will be for a three-year
rolling period, updated annually and with a 10-year outlook on desired economic outcomes.
121
IPAP II indicates that seven sets of policies are critical to achieve a scaled up industrial policy and a shift towards
strengthening the productive side of the economy in general. These seven sets of policies are:
Stronger articulation between macroeconomic and microeconomic policies
Industrial financing channelled to real economy sectors
Leveraging public and private procurement to raise domestic production and employment in a range of
sectors, including alignment of B-BBEE and industrial development objectives, and influence over private
procurement
Developmental trade policies which deploy trade measures in a selected and strategic manner
including tariffs, enforcement and SQAM (standards, quality assurance and metrology) measures
Competition and regulation policies that lower costs for productive investments and poor and
working class households
Skills and innovation policies that are aligned to sectoral priorities and
Deploying these policies in general and in relation to more ambitious sector strategies, thereby building
on work already done.
4.1.5 National Development Plan (NDP) – 2030
The diagnostic report of this plan indicates that “the quality of education for poor Black South Africans is sub-
standard” (NPC 2012, p.13). It shows that 1 million learners exit the system annually, but only 35% leave the
system with a grade 12 certificate. The NDP-2030 includes the following for schooling:
The need to promote high professional standards among mathematics and science teachers
The need for institutional structures to attract, invest and retain the best teachers
A link between the performance of teachers and their remuneration, taking into account mitigating
factors such as the school environment and socio-economic status of learners
To develop and sustain a professional culture at school level, with well-run, skilled and dedicated
principals who foster a vibrant but disciplined environment that is conducive to learning
A curriculum that will respond to the needs of the South African society
Developing capacity at school level to implement policy and ensure a common goal among all
stakeholders to achieve good educational outcomes that are responsive to community needs and
economic development
District must provide targeted support to improve practices within schools, and ensure communication
and information share between the district and schools
The need to share best and appropriate practice among schools
Parents to be given meaningful information on the children’s performance
To develop assessment mechanisms that will enable parents to compare learner performance across
schools in districts
Ability to access information that helps districts and policy makers to have a focused approach to
teaching and learning improvement
Adequate and appropriate capacity to help and support schools that are performing poorly
Learners must receive high-quality instruction in both mother-tongue and English from early in the
foundation phase

122
Infrastructure backlogs must be addressed in order to ensure basic standards for infrastructure and
equipment set by the national DBE.
The report argues that if we ensure the above-mentioned challenges are responded to, our schooling system
will have the following characteristics:
All learners and teachers will be motivated
Principals will be effective managers who provide administrative and curriculum leadership
Parents will be involved in the school where their children are attending
Schools will be accountable to the parents
There will be committed and professional teachers with good knowledge of the subject(s) they teach;
Knowledgeable district officials will support schools and the teachers
Government will be the custodian of good administrative processes and procedures in education, which
will include appointment and disciplining of teachers
The teacher unions will ensure that proper procedures are followed by the employers
All the basic infrastructure requirements are adhered to and
High speed broadband is available to support learning through ICT.
The quantifiable targets for schooling for 2030 (NDP 2012, p.275) are:
About 80 percent of schools and learners achieve 50 percent and above in literacy, mathematics and
science in grades 3, 6 and 9
Increase the number of students eligible to study mathematics and science at university to 450 000 per
year
South Africa improves its position in international rankings and
About 80 percent of every cohort of learners successfully completes the full 12 years of schooling.
4.1.6 Integrated Strategic Planning Framework for Teacher Education and Development in South Africa
(ISPFTEDSA) - (2011 – 2025)
This policy document is derived from the Teacher Development Summit Declarations in 2009, where there was
a call for an integrated plan for teacher development in South Africa. The intention of the declaration was to
ensure that the following issues are accomplished:
Define clear roles, responsibilities and innovative, collaborative relationships among the key stakeholders
for the improvement of teacher development
Relate key decisions to the broader context of teacher supply, utilisation and demand
Define the appropriate institutional arrangements for the delivery of key components of teacher
development such as teacher education and professional development
Identify clear priorities and realistic timeframes for implementation
Recognise the needs of Early Childhood Development and Foundation Phase educators as a particularly
important aspect of the Plan
Reduce the overload of policy prescriptions and regulations
Provide for an equitable, adequate and efficient allocation of funds and other resources to enable all
teachers to perfect the art of teaching
123
Provide a platform for the development of robust human resource management and information systems
that facilitate equitable and efficient provision of and support for teacher development.
From these declaration points of the ISPFTEDSA the following central recommendations were generated, which
focus on: ten (10) Systemic coordination issues; seven (7) Institutional capacity issues; three (3) Funding issues;
10 Initial Teacher Education issues; 19 Continuing Professional Development issues; six (6) Early Childhood
Development issues; and eight (8) Research issues.
The DBE was given 15 years to implement the plan. Given the mentioned policy document above, and the
research data from literature review, interview and survey responses, the new/emerging challenges and
recommendations for SETA interventions are presented.
4.2 New/Emerging sector challenges regarding Skills Development
The recommendations in this section will be divided into those systemic and methodological processes that
have to be looked at by the SETA in order to aid the important work directly related to skills development in
schooling. As argued before in the report, the focusing on skills development without taking into account and
tackling the negative systemic and methodological practices at play currently, will not yield the full potential of
all the programmes undertaken by the SETA. The first group of recommendations are therefore all related to
the focus group interviews as well as the methodological gaps and challenges identified during the research
process.
There is a need to clarify what is the purpose and definition of skills development in schools, with specific
reference to the legislative guidelines of the SETA vis-à-vis the responsibility of the Department of Basic
Education. As taken from the Integrated Strategic Planning Framework for Teacher Education and
Development in South Africa (ISPFTEDSA 2011), the SETA has to clarify whether it has the responsibility
to ‘fix up’ gaps within the professional qualifications of teachers. These gaps may be based on the
historical training and development received by teachers during Apartheid or emerged with the shifting
requirements and changes in the educational curricula of the country. Or, should the focus of skills
development in schools be on the professional, ethical and moral conduct of teachers, to ensure that
teacher growth during the different stages of development moves from mediocre to good to excellent
Currently, we are primarily focusing on getting the quantity of supply and demand right, which is
important, but this approach will not respond to the need for quality education in the country.
Closely linked to the above-mentioned recommendation is the need to have a supply and demand
modelling approach and tool in place, which will give us not just a sense of what is and what has been
going on in the supply and demand domain of teachers, but more importantly what education, and more
specifically what the teaching force will look like in the foreseeable future (say the next 5 years), and how
the SETA can play a proactive role in supporting the employment agencies of education in the country.
The interviews and responses from senior provincial people in the two provinces visited indicated that
they fully support such a venture by the SETA and believe that such a tool will assist them in doing short,
to medium, to long-term planning in an environment where data will guide decision making rather than
the current ‘opinion-based’ decision making.
124
There is also a need to differentiate between the requirements of beginner student teachers, newly
qualified teachers, those who are intending to become excellent and finally those who are potential
master teachers. Our current approach is neither needs focused, not is it based on specific and
specialised skills development interventions, which should be linked to both the stages of teacher growth
as well as the specific subject and phase/grade needs of teachers. The current ‘one-size-fits-all’ approach
which is more a supply rather than a demand response to skills development only leads to a ‘hit or miss’
result. To this end, there is a need for more stability in teacher work allocation rather than focusing on
the compliance requirements when work allocation is done at the end or beginning of the calendar year
rather than focusing on compliance requirements.
In relation to the stabilisation of teacher work allocation, there is a need to understand and popularise a
more human resource management (HRM) strategic approach in education that will ensure adherence to
the basic requirements of teacher employment, as captured within the Public Administrative Measures
(PAM) as well as the professional requirements from the South African Council for Educators (SACE).
These are all policy tools which need to be respected and adhered to, with allowance for deviations
required when situations warrant such deviations. The lack of adherence to the existing policy tools
results in the undermining of most of the teacher skills development initiatives in practice.
There is a need to seriously look at a holistic teacher supply and demand modelling approach, which will
take into account the erratic human resource operations at employment levels as well as the lack of our
international competitiveness as far as learner achievement is concerned. Teacher skills development
and employment and teacher quality and learner achievement must be seen as a continuum, where
decisions and policies in one domain will often have negative and/or positive effects in other domains.
There are numerous recent research documents that indicate that the quality of an education system is
closely linked to the quality of teachers in the system. The holistic continuum will include initial teacher
training and development, and how it influences employment possibilities. As indicated in the teacher
supply section, the number of teachers who are qualifying at the end of 2012 will not satisfy the demand
needs of the country. While close to 3000 teachers will graduate at the end of this year in the entire
country, just the KwaZulu-Natal Department of Education alone will need approximately 5200 to
augment the shortage in that province (from focus group interview with Head of the KZN province).
Furthermore, it is crucial that those teachers who are newly-employed, attend a proper induction
programme rather than going through the ‘handing over of policy documents’ process. To this end, the
SETA can play a leading role in capacitating current teachers in the system on how to induct new teachers
at their schools.
While the challenges of most heads of provincial departments focus on getting a teacher in every
classroom to teach, the focus must also include the need to ensure that relevant content specialist
teachers are in the classroom. The teachers should be equipped with pedagogical skills to transfer that
knowledge from themselves to learners, a process which takes into account the skills of how to facilitate
learning as a developmental process. To attain a high-level of teaching quality among all teachers might
take a long time, but we have to focus on individual teachers and to empower and develop them on a
one-to-one basis. Furthermore, there might be a need to consider the capacitation of teachers with
pedagogical content knowledge through learning teams at school and district level. The coordination of

125
such an approach will not necessarily be conducted by districts and schools. It will succeed with
assistance from the SETA.
If we assume that the above-mentioned issues are clarified and developed, in particular a reliable teacher
supply and demand modelling system is instituted and teacher utilisation and allocation is stabilised, the
following new challenges will have to be mediated:
Training and developing of educators at all levels, with specific focus on the policy, planning and support
levels at national, provincial, district and circuits levels. The focus will also be at the operational school
levels to design, collect, analyse and interpret educational data within the system. In the interviews with
provincial officials during the focus group sessions it was acknowledged that there was a the lack of
personnel to ensure that the education system makes decisions based on reliable , credible and ‘real
time’ data.
An education workforce that utilises Information and Communication Technology (ICT) as a preferred
work or production methodology, and are therefore competent, capacitated and confident in the
utilisation of these tools.
4.3 Proposed ETDP SETA Intervention (Short, Medium and Long-Term recommendations)
From a systems point of view, there has been no significant shift in the requested scare and critical skills within
the schooling sector, other than the emphasis that these are becoming more and more urgent among the
respondents in the survey process. The list below, as presented by the SETA in March 2012, is a strong
foundation to continue the work of skills development in the country.
Below are the requests and suggestions from the research data from the surveys:
Table 4.1: Top scarce and critical skills in the Schooling Sector
OFO Occupation (Scarce Skills) Specialisation/alternative titles
241501 Special Needs Education Teacher (Skill Level 5)
Education Therapist, Occupational Therapist, Language and Mathematics remedial
241423 Mathematics Teacher (Grades 10 - 12) (Skill Level 5)
Mathematics Lectures for the FET, High School Mathematics Teachers
241101 Early Childhood Development Practitioners (Skill Level 5)
Grade Reception Year Teachers
241426 Physical Science Teacher (Grades 10 - 12) (Skill Level 5)
Physical Science Teachers
241422 Mathematical Literacy Teacher (Grades 10 - 12) (Skill Level 5)
Mathematics Literacy for senior phase Teachers
241302 Natural Sciences Teacher (Grades 4 - 9) (Skill Level 5)
Natural Science Teachers
241201 Foundational Phase School Teacher (Skill Level 5)
Primary School Teacher
241421 Life Sciences Teacher (Grades 10 - 12) (Skill Level 5)
Life Sciences Teachers, Social Sciences Teachers
126
Source: Presentation done by SETA in March 2012 (slide 14 and 15)
4.3.1 Short term recommendations
The immediate support and interventions requested by schools during the survey process include the
supply of teachers to fill scarce and critical subject areas such as mathematics, science, accounting ,
computer applications technology, life sciences, visual arts, and various languages teachers.
Another set of immediate needs is related to supportive staff such as remedial and special needs
teachers, occupational therapists, and social workers in education.
The third group of immediate interventions relate to support staff such as principals who need to be
trained and developed in their positions as school leaders, and the lack of curriculum and instructional
leadership skills among heads of departments, both the availability of them as well as the need to train
and develop them. It is stated that heads of departments might be the only layer of managers in the
system that never received formal and proper training, and therefore it is unfair to expect HoDs to
perform their duties with distinction while the education system is not capacitating and preparing them
for the task at hand.
The final group which needs immediate attention will be the auxiliary support staff such as property
managers, supervisors of ground staff, network administrators and financial and business managers for
both schools and hostels.
4.3.2 Medium and long-term recommendations
A more focused training and development programme that shifts the teaching and learning methodology
away from ‘talk and chalk’ in order to ensure vibrancy and relevance to the learning style of the current
learner population in schools;
Supporting the two major attempts by the DBE to improve the quality of educational delivery in schools,
namely the Curriculum Assessment Policy Statements (CAPS) and the Annual National Assessment (ANA).
If these national initiatives are to succeed, then the DBE and ETDP Seta’s focus should be on the three
levels of assessment training programme namely the need to foreground Assessment on learning
(summative), assessment for learning (quality classroom practice), and assessment as learning (making
transparent success criteria). Such a programme will ensure that there is a strong professional and
developmental focus on (i) accountability for results, (ii) quality of services and products, and (iii)
alignment of services and products with the expectations articulated in CAPS. The quality markers for
such a programme will be (i) proper scaffolding of adult learning, (i) content and examples should be
grounded in needs of diverse learners, and (iii) a methodology that engages and supports teachers. The
134301 School Principal (Skill Level 5)
Deputy Principal, Early Childhood Development School Principal, Independent School Principal
241400 Senior Phase, Technical and FET Teachers (Skill Level 5)
Senior Phase and FET Teachers [e.g., fitting and turning, electronics, motor engineering, megatronics, CNC, automotive repair and maintenance, boiler-making lecturers, electrical engineering, welding, electronics, tourism & tourism, graphic design, beauty therapy, etc]
127
strategic goals of the programme will therefore be to (i) improve the curriculum responsiveness, (ii)
ensure flexibility in schooling, (iii) enhance staff professionalism and working relationships, (iv) improve
the resource management capacity and competency, including ICT skills, and (v) assure quality.
128
Chapter 5: Way Forward Regarding SSP Research
5.1 Challenges regarding Research Process
The list of issues below has been shared with research colleagues at numerous times, and therefore will not be
presented as a detached opinion of the process, but rather as a developmental reflection on the challenges and
hurdles to overcome. Some of these might even be issues that will be resolved at its own time during the
organisational developmental phases as the processes and procedures become clearer within the SETA.
There has to be a better way of organising the structuring of the process of skills development updates
within the SETA. Currently, as as mentioned before, the process feels, from a research point of view, like
a ‘micro-wave’ event, where most of the data collection processes are so rushed that it is difficult to
enjoy such an enriching event. It should be possible to allocate the research responsibility over a year
period in order to allow the research organisation to get familiar with the ‘working’ of the SETA, or even
build and cement the processes and relationships formed during the previous update(s). Failing to create
a more reasonable process will perpetuate the pressure situation where both SETA research staff and
researchers will rush to just adhere to the ‘compliance’ responsibilities of the process rather than
stretching the report to be an enlightening research piece.
The alignment between the Sector Skills Plan, the Strategic Plan, the Annual Plan, the Workplace Skills
Plans, the Annual Training Reports, and some other plans we might not be aware of, should be clarified
and possibly separated when they do not have inherent connections and links. Some of these plans have
individual schools, provincial and sometimes national focused perspectives, while others are more
internal planning tools.
The current approach of having a generic survey data collection instrument across the diverse sub-
sectors within the SETA might not be the most productive way of collecting data, since the different
sectors have completely unconnected aims and objectives, which creates the need for a more flexible
approach to the survey collection process. We do appreciate the flexibility that exists in the current
process, but believe that the foundations of some of the generic fields might need more specificity such
as the ‘size of the organisation’. Most schools fall within the ’10 – 49’ and ’50 – 149’ intervals, and
therefore the sub-division of these intervals will prove to be more useful for deeper analyses in the
schooling sector.
There is no familiarity of the data collection process related to skills development in public schools, due
to the current practice of WSP submission by provinces. Therefore when we embarked upon the
collection of data from the two provinces, it was a real struggle for public schools to respond to the
request which lead to a low response rate. Furthermore, due to the close perceptional link between the
data in the survey instrument and the WSP and ATR among independent schools, some of these schools
felt that it was a duplication when they received the survey request. Therefore, proper alignment must
be facilitated during the design process of the survey instrument.
The ‘advertising’ and marketing of the importance of the SSP beyond a compliance process should be
considered, especially when this communication is focused in the direction of the clients of the SETA,
which should be the schools in the country. Too many see this as a bureaucratic process which is aimed at
submitting a report to the DoL and DHET. The SSP report has the potential to be an exciting research
129
instrument for all in the schooling sectors, especially the individual schools and related human resource
practitioners.
There is a need to reflect and crystalise the research principles within the SSP report process, with
specific reference to the specific research paradigm that is driving the process; which research approach
is followed and perhaps dominant; how the literature review is utilised as input, process and
recommendation justification and support; identify where, when and how data will be gathered; which
data collection methods and possibly there a mix will be managed; which technical data collection
instruments should be employed, and what data analysis techniques and tools should be used; how the
storage, management, organising, sorting, coding and displaying of data will take place; whether opinion-
based, empirical-based, archival-based and/or analytical based research methods will be utilised to
make recommendations and draw thematic and/or statistical conclusions, etc. A lack of clarity within
these areas will result in unbalanced and less empowering research processes among the researchers
and the compilers of the composite report.
Since the SSP report is pulled together through a process of combining and synthesising the individual
reports for sub-sector researchers, it is important to develop a ‘merging methodology’ which will assist
both sub-sector researchers and the compilers of the SSP report. The trustworthiness of information
ordering and sequencing is crucial, since different interpretations and deduction are possible when
information is not organised in the way it was intended. The challenges of internal validity and credibility
of the report come to the fore. Furthermore, the external validity and transferability, objectivity and
conformability could be questioned. The sharing of a SSP report framework which was shared with us
during the middle part of the research process is a step in the right direction, but more proactive work is
needed.
The order in which the report is written might need some conceptual reflection, especially with regards
the the schooling sector. Within the sector, we could consider the following flow: (i) strategic context and
imperatives; (ii) general profile of the sector; (iii) overview of the sub-sectors; (iv) employment profile; (v)
other profile issues (HiV/Aids, remuneration, quality of teachers, nature of employment, etc.); (vi)
analysis of teacher demand; (vii) analysis of teacher supply; (viii) skills development demands and supply
issues; (ix) inter-connectedness and priorities of the sector; (x) recommendations and strategies
One of the most challenging activities was getting access to data sources and responses crucial to the
task, and their response rate when contacted. Furthermore, some of the data shared by the various data
agencies do not have the data in the format that is useful and/or useable for the purpose of the report.
More challengingly, some of the data agencies simply do not respond to requests. It is therefore crucial
that the SETA acts as a support structure to ensure that data agencies respond in order for researchers to
conclude their tasks. There could also be a case for the SETA to consider setting up their own internal
agency which will facilitate the majority of data sets necessary for report completion.
Finally, there is some vagueness related to some of the data sets, and how the SETA will facilitate
processes in order to separate combined data and create comfort related to the data sets which will
ensure that respondents do not feel that the data will negatively affect them. For example, the utilisation
of the concept ‘SGB employees’, and the current practice is a case in point.
130
5.2 Gaps regarding Research Update
The way the SETA defines ‘skills development’ and the related processes linked to this activity has
become crucial, since there are variant interpretations, understandings and more importantly, practices
that are taking place within the sub-sector. This was discussed with the interviewees and they believe
that clarity on these issues could assist a more harmonious relationship between different roleplayers.
One of the interviewees responded that:
“we’ve had lots of arguments about skills development … especially between the (union)
and myself … in certain circles skills is seen as only a hard thing, a skills that you can do. So,
the argument is that if we say we’re doing curriculum training, then the unions say that’s
not skills development … that’s your job because you changed the curriculum so you must
do it … its not a skill … maybe that is where the methodology comes in.” (Interviewee C)
Another response was that if we do not have a baseline of what skills development should be building
on, then
“… it’s probably pretty much a waste of time. We’re not seeing any impact within people
with poor matric results, unless you’re extraordinary and you just went to a really bad
school …” (Interviewee A).
From the responses of interviewees, there are two sets of challenges, namely whether skills
development is ‘anything and everything’ where the focus is on ensuring a competent workforce, or
whether it is a specific focus of ensuring that the workforce is enhanced from possessing mediocre skills
to excellence. In the first challenge, the deficit in skills is not taken care of during the recruitment and
selections phase, by reflecting on the quality of candidates the formal training institutions are sending
out in the working environment. In particular, the question will then focus on the quality of teachers
who are applying, are selected and are practising in schools, in relation to the higher education
institutions they come from. It is argued that if we do not make that link, and if we do not question the
role of the higher education institution, especially in relation to the deficit in skills and competencies of
teachers trained by them, then we will have a reactive rather than a proactive strategy to skills
development. The second challenge indicated is that we should be, to a greater degree, comfortable
with the teachers we are employing in the system and then we can focus on improving the quality of
teaching and learning in the schools. If we continue to focus skills development on those who are not
competent to teach, it is difficult to move the system to a level of excellence.
131
Related to the clarity needed on how we define skills development, is the process of where we derive our
data from, which will respond to our understanding of the skills gaps. As discussed with the Schooling
Chamber committee, there is a need for a teacher supply and demand modeling framework, since skills
development, as argued in an earlier point, should be looked at; the deficit between either what is
needed (demand) and what is available (supply) or what has been produced (supplied) and what is
required (demanded). Some of the gaps could be through the slowness of higher education updating
their training and development programmes and methodology to the ever-changing nature of the
industry they produce employees for, as well as the shifting in practice and knowledge demands at school
level, while these are not fed through to the training and development institutions. Both of these
arguments are also influenced by the changing technological drivers within the specific industry.
If we continue to follow the current process of skills development analysis, we will remain at a historical
understanding of what is going on in the sector, rather than the potential of knowing in advance what the
challenges could be in the next two to five years, and how we can develop strategies to prevent these
potential challenges from becoming a reality. From the interviewees, it is clear that most of them are
dealing with the immediate issues, since these are so overwhelming that there is little time to think
about future challenges. Furthermore, some of these challenges have been around for some time and to
some interviewees there might not be ‘quick solutions’ to most of these challenges. An analysis of most
of the issues raised by them could be that a substantial number of challenges are due to the lack of a
planning instrument that allow people to ‘see the whole rather than the parts’, since some of the parts
are influencing other parts of the system. For example, a perceived low quality education system does
not attract high quality students to become teachers. Equally, if the entrance level of becoming a teacher
is the lowest in higher education institutions and is seen as the ‘last resort’, then the best quality teachers
will not become teachers.
The challenge related to the need for a modeling framework is directly linked to our ability to engage in
future planning, projections and forecasting. Currently the majority of the report content are historical
descriptions rather than projections. We therefore have to look at the existing supply and demand
modeling and forecasting frameworks and identify the most appropriate one for the stage of
development we are faced with in South Africa. Below are five different frameworks, namely (i) skills
forecasting models – linear extrapolation of past trends, (ii) labour market signaling models – signal
dashboard in terms of policy, investment, technology, research findings, collective agreements, etc. –
mostly reactive (iii) qualitative models – scenario planning, key informant interviews, focus group
discussions, questionnaires – useful as a complementary approach in pro-active and not reactive way, (iv)
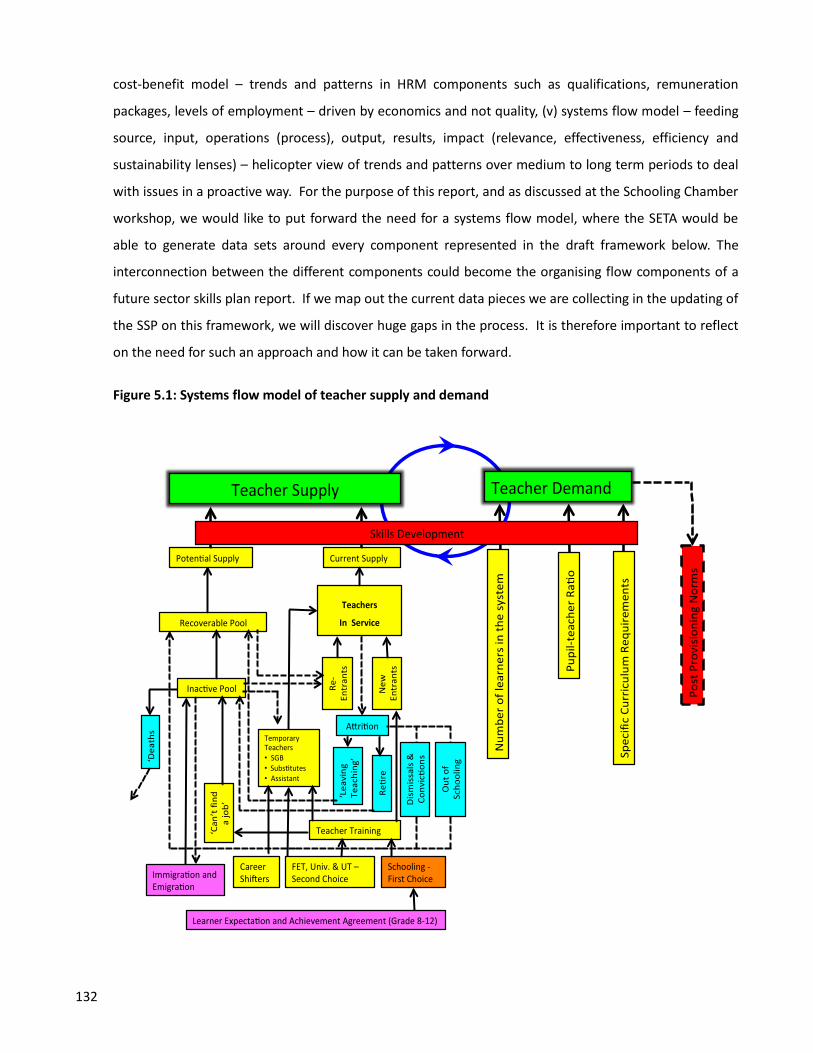
132
cost-benefit model – trends and patterns in HRM components such as qualifications, remuneration
packages, levels of employment – driven by economics and not quality, (v) systems flow model – feeding
source, input, operations (process), output, results, impact (relevance, effectiveness, efficiency and
sustainability lenses) – helicopter view of trends and patterns over medium to long term periods to deal
with issues in a proactive way. For the purpose of this report, and as discussed at the Schooling Chamber
workshop, we would like to put forward the need for a systems flow model, where the SETA would be
able to generate data sets around every component represented in the draft framework below. The
interconnection between the different components could become the organising flow components of a
future sector skills plan report. If we map out the current data pieces we are collecting in the updating of
the SSP on this framework, we will discover huge gaps in the process. It is therefore important to reflect
on the need for such an approach and how it can be taken forward.
Figure 5.1: Systems flow model of teacher supply and demand
TeacherSupply
CurrentSupply
RecoverablePool
Poten alSupply
Inac vePool
CareerShi ers
TeacherTraining
A ri on
Re
re
‘Leaving
Teaching’
Schooling-FirstChoice
FET,Univ.&UT–SecondChoice
TemporaryTeachers• SGB• Subs tutes• Assistant
New
Entrants
Re-
Entrants
Teachers
InService
SkillsDevelopment
‘Can’tfind
ajob’
TeacherDemandNumberoflearnersinthesystem
Pupil-teacherRa
o
SpecificCurriculumRequirements
PostProvisioningNorm
s
‘Deaths
Dismissals&
Convicons
Outof
Schooling
Immigra onandEmigra on
LearnerExpecta onandAchievementAgreement(Grade8-12)
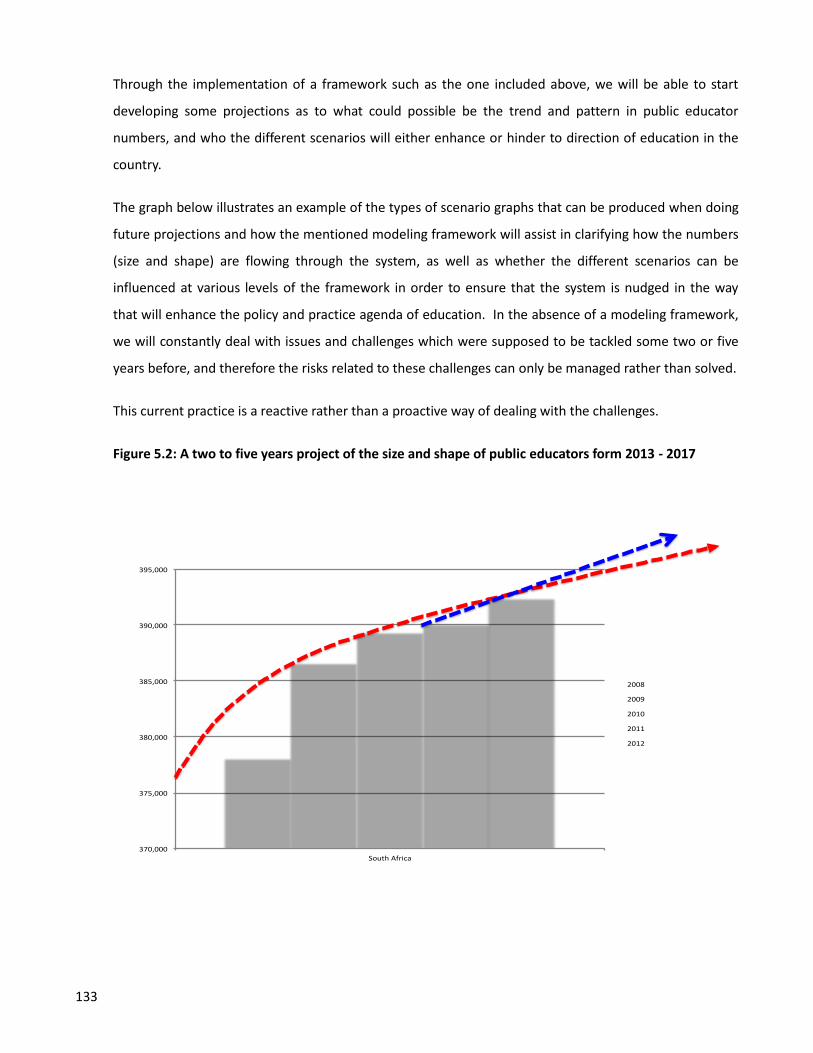
133
Through the implementation of a framework such as the one included above, we will be able to start
developing some projections as to what could possible be the trend and pattern in public educator
numbers, and who the different scenarios will either enhance or hinder to direction of education in the
country.
The graph below illustrates an example of the types of scenario graphs that can be produced when doing
future projections and how the mentioned modeling framework will assist in clarifying how the numbers
(size and shape) are flowing through the system, as well as whether the different scenarios can be
influenced at various levels of the framework in order to ensure that the system is nudged in the way
that will enhance the policy and practice agenda of education. In the absence of a modeling framework,
we will constantly deal with issues and challenges which were supposed to be tackled some two or five
years before, and therefore the risks related to these challenges can only be managed rather than solved.
This current practice is a reactive rather than a proactive way of dealing with the challenges.
Figure 5.2: A two to five years project of the size and shape of public educators form 2013 - 2017
370,000
375,000
380,000
385,000
390,000
395,000
SouthAfrica
2008
2009
2010
2011
2012
134
Finally, there is a need to push the data collection process of the schooling system into a specialist
rather than a generalist industry approach. Currently, all the policy and data practices are pointing to
schooling as generalist industry where the specialisation of teachers is perceived to be ‘being a teacher’
rather than ‘being a mathematics, science, etc. teacher’. The foundation of this argument is located in
the way we collect the data in schooling and how we foreground key issues in the system. For example,
it is possible for schools to allocate a work load of subjects to teachers who were never trained in the
pedagogy, methodology and didactics of the mentioned subjects. The real challenge, as discussed with
the interviewees in the two provinces, is to what extent our children are failing their subject(s) because
they are not ‘clever enough’, or to what extend can their failure be linked to the lack of pedagogical,
methodology and didactic knowledge of their teachers. Likewise, the professional council of teachers
(SACE) is only focusing on where a person is qualified as a teacher when registering them, rather than
their subject specialisation. A teacher is therefore registered to teach in the education system rather
than registered to teach a particular subject or subjects in the system. This scenario plays itself out in
the data from PERSAL. The way records are kept in schools related to the competencies of teachers,
how work allocations and timetable needs are focused on only satisfying the ELRC policy requirements,
etc. As reported to us by the interviewees, our education system is totally “vulnerable” to be legally
challenged in relation to this matter.
5.3 Recommendations in terms of Gaps (Short, Medium and Long-Term)
Based on all the issues raised in this section, we would like to put forward recommendations in terms of short, medium and long-term priorities:
Short term priorities:
A big portion of the research process gaps could easily be solved through a consultative process of
researchers connected to the SETA process and the ultimate intentions of the research process. We
however have to ensure that the process deals with both the compliance requirements as well as the
clientele needs as related to the challenges facing public and independent schooling in the country.
These decisions are mostly process issues and conceptual stances which are needed to guide the
different researchers in the process. This will ease the work of the SETA research team in ensuring that
researchers know in advance what is expected rather than the current ‘hit or miss’ approach. These
obviously include invisible things like the editorial style preferred by the SETA, etc.
The research principles within which the SETA operates and do research work is also crucial. This will
cement the quality and validity of the content and proposals within the report. The SSP has to become a
respected research document within the arena of research. The acid test will obviously be, in future, the
amount of times the content of the SSP is quoted and/paraphrased within research outputs.
135
Medium term priorities:
The adoption of a teacher supply and demand modeling framework has the potential to not just assist
the research process in a more structured and informed way, but could also assist the provincial
colleagues in their planning process. As indicated in the report before, the provincial colleagues at
operational, managerial and strategical level find themselves unable to make the necessary projections
and forecasting, due to the lack of such a modeling framework.
Develop the willingness among schools to be involved in this research process and also link and ensure
the benefits of such a process to revert back to them. It is only when those who are expected to spend
their time and energy with research processes, see and feel the benefits of their engagement therewith,
that they will willingly participate in such events.
Long term priorities:
To balance the research process between compliance and client-oriented needs. Since the SETA is driven
by stakeholder representation, this should not be too challenging. The current ‘disconnection’ of sub-
sector research process, which might be due to the grand scale of the work of the SETA, does not ensure
a systemic understanding of the entire education sector. As indicated in the modeling framework an
understanding of the FET sub-sector in relation to the schooling sub-sector of grade 10 -12, is crucial in
order to understand who is fed within the higher education sub-sector. All of these are only possible
when we have a clear idea of the ECD sub-sector and the relations of this sub-sector to the foundation
phase processes in schools. Dealing with the sub-sectors in an inter-connected way might assist in
ensuring that we get the bigger picture of the education sector.
In conclusion, we would like to stress that the recommendations contained in this report stem from the data
and information herein presented. It is obvious that the consolidated SSP report further needs organisational
recommendations as formulated by the Schooling Chamber, and strategic/political recommendations from the
board and other stakeholder forums within the SETA. Both of these cannot be supplied by a research process
unless the researchers engage with the research recommendations in a forum where the above-mentioned two
constituencies can add their specific recommendations, i.e. organisational and political. It will be inappropriate
for researchers to make such recommendations while not being part of the debates and discussion process in
the SETA.
136
References:
Centre for Development and Enterprise (2010), Hidden assets: South Africa’s low-fee private schools, CDE
Publishers, Johannesburg.
Christie, P., Butler, D. and Potterton, M. (2007), Schools that Work, Report to the Minister of Education by the
Ministerial Committee, 13 October 2007.
Department of Basic Education (2010), Annual report 2010/11, Government Printers, Pretoria.
Department of Basic Education (2010), Key interventions/activities for implementation of Schooling 2025,
presentation to Portfolio Committee 2025, 4 May 2010, Cape Town.
Department of Basic Education (2010), School realities 2010, Government Printers, Pretoria.
Department of Basic Education (2010), Strategic plan 2010-2013, Government Printers, Pretoria.
Department of Basic Education (2011), Integrated strategic planning framework for teacher education and
development in South Africa, Government Printers, Pretoria.
Department of Basic Education (2011), Report on the Annual National Assessment of 2011, Government
Printers, Pretoria.
Department of Basic Education (2011), School realities 2011, Government Printers, Pretoria.
Department of Basic Education (2012), Minister of Basic Education response in the National Assembly, Question
2453: Internal question paper 29/2012, 7 August 2012, Cape Town
Department of Basic Education (2012), School realities 2012, Government Printers, Pretoria.
Department of Education (2000), Criteria for the recognition of qualifications for employment in education
based on the norms and standards for educators, Government Gazette 21565 published on 22 September 2000,
Government Printers, Pretoria.
Department of Education (2006), A national framework for quality education in rural areas, Government
Printers, Pretoria.
Department of Education (2007), Education statistics in South Africa 2008, Government Printers, Pretoria.
Department of Education (2008), Education statistics in South Africa 2009, Government Printers, Pretoria.
Department of Education (2008), National norms and standards for funding, Government Printers, Pretoria.
Department of Education (2008), School realities 2008, Government Printers, Pretoria.
Department of Education (2009), Education for All (EFA) – 2009 Country report: South Africa, Government
Printers, Pretoria.
Department of Education (2009), Education statistics in South Africa 2010, Government Printers, Pretoria.
Department of Education (2009), Report of the Ministerial Committee on Transformation and Social Cohesion
and the Elimination of Discrimination in Public Higher Education Institutions, Government Printers, Pretoria.
Department of Education (2009), School realities 2009, Government Printers, Pretoria.
137
Department of Higher Education and Training (2011), National skills development strategy III, Government
Printers, Pretoria.
Development Bank of South Africa (DBSA) (2009), Education roadmap – Focus on schooling system, narrative
report July 2009, Johannesburg.
Du Toit, J.L. (2004), Independent schooling in post-Apartheid South Africa: A quantitative overview, HSRC
Publishers, Cape Town.
Early Learning Resource Unit (ELRU) (2007), Putting Children and Families First, Oxfam, Cape Town.
Gallie, M. (2011), The state of education in South Africa and the challenges facing the country, presentation
made to TeachSA ambassadors during their orientation on 12 December 20111, Johannesburg.
Gallie, M. (2012), The financing of education: A strategic management perspective, in Financial management in
education in South Africa, (ed) Van Rooyen, pp. 173-198, Van Schaik, Pretoria.
General and Further Education and Training Quality Assurance Act (Act 58 of 2001)
Hofmeyr, J. (2008), Getting the talented poor to independent schools, presentation at the JET conference on
What works in school development, Johannesburg.
Hofmeyr, J. and Lee, S. (2004). The changing face of private schooling, in Changing class: Education and social
change in post-Apartheid South Africa, (ed) Chisholm, L., HSRC Press, Pretoria.
Ingersoll, R.M. (2002), The teacher Shortage: A case of wrong diagnosis and wrong prescription National
Association of Secondary School Principals, NASSP Bulletin June 2002.
keynote address by the Minister of Basic Education (10 April 2012), she indicated that the mentioned backlogs
MCEECDYA (2003). Demand and supply of primary and secondary school teachers in Australia, Part G, Australia.
National Treasury (2007), Provincial Budgets and Expenditure Review 2003/04 to 2009/10, Government
Printers, Pretoria.
National Treasury (2009), Provincial Budgets and Expenditure Review 20005/06-2011/12, Government Printers,
Pretoria.
Organisation for Economic Cooperation and Development (OECD) (2008), Reviews of National Policies for
Education: South Africa, OECD.
Organisation for Economic Cooperation and Development (OECD) (2007), Economic Assessment, OECD.
Organisation for Economic Cooperation and Development (OECD) (2002), Education Policy Analysis 2002, OECD.
Organisation for Economic Cooperation and Development (OECD) (2010), Economic Surveys: South Africa,
OECD.
Organisation for Economic Cooperation and Development (OECD), PISA 2009 Database, OECD
Organisation for Economic Cooperation and Development (OECD), Teaching and Learning International Survey
(TALIS), OECD.
138
Palmary, I. (2002), Refugees, Safety and Xenophobia in South African Cities: The role of local government,
Research report written for the Centre for the Study of Violence and Reconciliation.
Peltzer, K., Shisana, O., Udjo, E., Wilson, D., Rehle, T., et al (2005), Educator supply and demand in the South
African public education system: Integrated report, HSRC Press, Pretoria.
Republic of South Africa (1998), Employment of Educators Act no. 76 of 1998, published on 2 October 1998,
Gazette no. 19320, Government Printers, Cape Town.
Republic of South Africa (2006), Education laws amendment Act no.24 of 2005, Government Gazette no.28426,
published 26 January 2006, Government Printers, Cape Town.
Republic of South Africa (2006), Education laws amendment Act no.31 of 2007, Government Gazette no.30637,
published 31 December 2007, Government Printers, Cape Town.
Republic of South Africa (RSA) (1996), Constitution of the Republic of South Africa, Government Printers,
Pretoria.
Schleicher, A. (Ed.) (2012), Preparing Teachers and Developing School Leaders for the 21st Century: Lessons
from around the World, OECD.
South African Human Rights Commission (SAHRC) (2012), Charter of Basic Education Rights for Children in
South Africa, on 19 July 2012, Johannesburg
South African Institute of Race Relations (SAIRR) (2012), Rise in no-fee schools, press release on 23 July 2012,
Johannesburg.
South African Rural Educator (2011), Quality education for rural schools in South Africa, published on 7
February 2012, Volume 1, Wellington.
Sowetan Live (2012), Refugees overwhelm South Africa, 23 May 2012, www.sowetanlive.co.za.
Statistics South Africa (2011), General household survey 2010, Government Printers, Pretoria.
Statistics South Africa (2011), General household survey 2011, Government Printers, Pretoria.
UNESCO (1998), World education report 1998: Teachers and teaching in a changing world, Unesco Publishing,
Paris.
139
APPENDIX 1 Data suppliers, Key Informants and Provincial Participants
The PERSAL data was supplied by the Department of Basic Education in August 2012.
Information from the following stakeholders informed this Schooling constituency contribution to the
ETDP SETA Sector Skills Plan Update for 2012/13
Survey Respondents
KwaZulu-Natal
Public School
Athlone Park Primary School
Durban Girls High School
Livingstone Primary School
Northdene Preparatory School
Northlands Primary School
Ottawa Primary School
Port Shepstone High School
Schola Amoris School – LSEN
St Henry's Marist College
Umhlali Primary School
Independent Schools
Camelot College
Felixton College
Heritage Academy
John Wesley School
Kearsney College
Maritzburg Muslim School for Girls
Saint Charles College
The Hiltonian Society
The Wykeham Collegiate
Western Cape
Public Schools
Bay Primary School
Bergvliet Primary School
Camps Bay Preparatory School
Edgemead Primary School
Grassy Park E.C. Primary School
Hillside Primary School
Kenridge Primary School

140
Laerskool Van Riebeeckstrand
Mountain Road Primary School
Pelican Park Primary
Plumstead Preparatory School
Rondebosch Boys Preparatory School
Saambou Primary School
Tamboerskloof School
Ukhanyo Primary School
Van Kervel School of Skill
Wynberg Girls Junior School
Independent Schools
Kenridge Primary School Trust
Michael Oak Waldorf School
St George's Grammar School
Schooling Chamber SSP Workshop
Haroon Mohamed Public Employer National Office DBE
Roseline Tyler Public Employer KwaZulu-Natal DBE
Shashi Nankoo Public Employer Gauteng DBE
Suritha Kaminsky NAISA
Zamile Hector Sinuka Labour (PEU)
Anthony Akal Labour (NAPTOSA)
Maryna Besseling Labour (SAOU)
Ntebo Leepile Labour (SADTU)
Gerrard Francis ETDP SETA Gauteng Coordinator
Josie Singaram ETDP SETA
Zanele Khubisa ETDP SETA
Provincial Interviews
KwaZulu Natal
Nkosinathi Sishi Head of Department – KwaZulu-Natal
Nkosinathi Ngcobo Senior Manager – Human Resources Management
Mandla Msweli Senior Manager – Skills Development
Western Cape
Penelope Vinjevold Head of Department – Western Cape Education Department
Ivan Carolus Director – Human Resource Administration (Rural)
Eddie Kirsten Director – Cape Teaching and Leadership Institute


![DOĞU AFRİKA JEOPOLİTİĞİ VE TÜRKİYE’NİN SOMALİ POLİTİKASI [SETA, 2014]](https://img.dokumen.tips/doc/110x75/6320c3b0069357aa45065904/dogu-afrika-jeopolitigi-ve-tuerkiyenin-somali-politikasi-seta-2014.jpg)


