Embed Size (px)
Citation preview
Table of Contents
ACKNOWLEDGEMENTS .............................................................................................................................................. XI
EXECUTIVE SUMMARY ............................................................................................................................................. XIII
1 INTRODUCTION .................................................................................................................................................. 1
1.1 BACKGROUND ....................................................................................................................................................... 1
1.2 STUDY PURPOSE AND OBJECTIVES ............................................................................................................................. 1
Purpose ......................................................................................................................................................... 2
Objectives of the study ................................................................................................................................. 2
1.3 RESEARCH QUESTIONS ............................................................................................................................................. 2
1.4 SCOPE OF WORK .................................................................................................................................................... 3
1.5 STRUCTURE OF THE REPORT ...................................................................................................................................... 3
2 DESCRIPTION OF THE ETDP SETA PROGRAMME AND LEARNING INTERVENTIONS ............................................. 4
2.1 OVERVIEW OF THE ETDP SETA ................................................................................................................................ 4
2.2 DESCRIPTION OF THE ETDP SETA LEARNING INTERVENTIONS ......................................................................................... 6
Bursary Intervention ..................................................................................................................................... 6
Learnership ................................................................................................................................................... 7
Internships .................................................................................................................................................... 8
Work-integrated Learning (TVETs) .............................................................................................................. 10
Work-integrated Learning UoTs .................................................................................................................. 11
3 LITERATURE REVIEW: SCHOOL TO WORK TRANSITIONS (STWT) ........................................................................ 13
3.1 INTRODUCTION .................................................................................................................................................... 13
3.2 CONCEPTUAL FRAMEWORK: FACTORS INFLUENCING SCHOOL TO WORK TRANSITIONS ......................................................... 14
Internal factors ............................................................................................................................................ 15
External factors ........................................................................................................................................... 17
Labour market policies ................................................................................................................................ 18
3.3 COMPONENTS OF THE SCHOOL TO WORK TRANSITION .................................................................................................. 19
3.4 POST-SCHOOL EDUCATION AND TRAINING LANDSCAPE IN SOUTH AFRICA ......................................................................... 22
Legislative and policy context ..................................................................................................................... 22
SETAs’ role in advancing post-school education and training..................................................................... 23
3.5 IMPLEMENTATION OF POST-SCHOOLING EDUCATION AND TRAINING INTERVENTIONS.......................................................... 25
Implementation of WIL interventions: Lessons from the literature ............................................................ 25
Implementation of bursary interventions: Lessons from the literature ...................................................... 31
Implementation of learnership interventions: Lessons from the literature ................................................ 33
Implementation of Internships: Lessons from the Literature ...................................................................... 34
3.6 EMPLOYMENT OUTCOMES OF SKILLS AND LEARNING INTERVENTIONS ............................................................................. 35
3.7 IMPLEMENTATION OF TRACER STUDIES ..................................................................................................................... 36
3.8 CONCLUSION ....................................................................................................................................................... 37
4 METHODOLOGY ................................................................................................................................................ 39
4.1 AIMS AND OBJECTIVES OF THE TRACK AND TRACE STUDY.............................................................................................. 39
Evaluation Questions .................................................................................................................................. 40
Scope of work .............................................................................................................................................. 40
4.2 DETERMINING AN ACCEPTABLE SAMPLE SIZE .............................................................................................................. 41
4.3 THEORY-BASED EVALUATION .................................................................................................................................. 41
4.4 RECONSTRUCTED THEORY OF CHANGE NARRATIVES IN RESPECT OF THE FIVE LEARNING INTERVENTIONS ................................. 41
Theory of Change: Bursaries narrative statement ...................................................................................... 41
Theory of Change: Learnerships narrative statement ................................................................................. 44
Theory of Change: Internships narrative statement ................................................................................... 46
Theory of Change: WIL TVETs narrative statement .................................................................................... 48
Theory of Change: WIL UoTs narrative statement ...................................................................................... 50
Theory of Change for Employers ................................................................................................................. 52
4.5 ANALYTICAL FRAMEWORK ...................................................................................................................................... 54
4.6 LEARNER SURVEY SAMPLING .................................................................................................................................. 56
Learner Population ...................................................................................................................................... 56
Sampling approach for survey of learners .................................................................................................. 57
Sample construction .................................................................................................................................... 57
Learner sample achieved ............................................................................................................................ 58
Differences between target and sample achieved ...................................................................................... 59
Representivity of achieved sample and comparison to randomised sample approach .............................. 59
Final learner sample achieved: Adjusting for refusal to participate and incomplete questionnaires ......... 60
Response rate .............................................................................................................................................. 61
4.7 EMPLOYER SURVEY SAMPLE ................................................................................................................................... 62
4.8 DATA COLLECTION INSTRUMENTS AND COLLECTION METHODS ..................................................................................... 63
Beneficiary instrument ................................................................................................................................ 63
Employer instrument ................................................................................................................................... 64
4.9 DATA CLEANING AND ANALYSIS ............................................................................................................................... 64
4.10 STUDY CHALLENGES AND LIMITATIONS ...................................................................................................................... 64
Beneficiary survey challenges ..................................................................................................................... 65
Employer survey challenges ........................................................................................................................ 66
4.11 ETHICAL CONSIDERATIONS ...................................................................................................................................... 67
5 RESEARCH FINDINGS ON BENEFICIARY SURVEY ................................................................................................. 68
5.1 ETDP SETA LEARNING INTERVENTION PARTICIPATION ............................................................................................... 68
Participation in the ETDP SETA Learning Interventions .............................................................................. 68
Prior access to a SETA-funded learning intervention .................................................................................. 70
5.2 SPATIAL DEMOGRAPHICS OF SAMPLED BENEFICIARIES ................................................................................................. 72
Distribution of Beneficiaries by Nationality ................................................................................................ 73
Distribution of respondents by province ..................................................................................................... 73
Migration of Beneficiaries across Provinces ............................................................................................... 74
5.3 DEMOGRAPHIC PROFILE OF BENEFICIARIES ................................................................................................................ 76
Representation by Race .............................................................................................................................. 76
Representation of people living with a disability ........................................................................................ 76
Distribution by age and gender ................................................................................................................... 77
Realisation of demographic targets ............................................................................................................ 80
5.4 SOCIOECONOMIC PROFILE OF BENEFICIARIES .............................................................................................................. 82
Household composition ............................................................................................................................... 82
Socioeconomic status of beneficiaries ........................................................................................................ 82
5.5 EMPLOYMENT STATUS OF BENEFICIARY PRIOR TO PARTICIPATION IN ETDP SETA LEARNING INTERVENTION ............................ 86
5.6 BENEFICIARY PERSPECTIVES ON LEARNING INTERVENTION ............................................................................................. 89
NQF Level of Beneficiary arising from participation in ETDP SETA-funded learning intervention .............. 89
Quality and relevance of training/mentorship received ............................................................................. 91
Beneficiary programme expectations ......................................................................................................... 92
Relevance of learning/training intervention to their work ......................................................................... 94
5.7 OUTCOMES OF THE ETDP SETA LEARNING INTERVENTIONS ......................................................................................... 95
Changes in learners’ career progression ..................................................................................................... 96
Current employment status ........................................................................................................................ 97
Self-employment ....................................................................................................................................... 113
Unemployment / inactivity ....................................................................................................................... 115
Full-time study and not working ............................................................................................................... 123
5.8 PARTICIPANTS’ PERCEPTIONS AND RECOMMENDATIONS IN RESPECT OF THE ETDP SETA-FUNDED LEARNING INTERVENTIONS .. 126
Satisfaction with the ETDP SETA Learning Intervention ............................................................................ 127
Areas for improving the delivery of learning interventions....................................................................... 127
Beneficiary recommendations to ETDP SETA on improving the learning interventions ............................ 129
5.9 OVERALL ASSESSMENT OF TRANSITIONS INTO THE LABOUR MARKET .............................................................................. 130
Labour market transitions before and after the intervention ................................................................... 132
5.10 CONCLUSION ..................................................................................................................................................... 133
6 RESEARCH FINDINGS EMPLOYER EVALUATION OUTCOMES ............................................................................ 134
6.1 ETDP SETA LEARNING INTERVENTION PARTICIPATION OF EMPLOYER .......................................................................... 135
Learning Intervention of Beneficiary associated with employer ............................................................... 135
Financial year for this participant ............................................................................................................. 136
6.2 PROFILE OF EMPLOYER AND EMPLOYER REPRESENTATIVE ........................................................................................... 136
Profile of Employer Representative ........................................................................................................... 136
Population group of employer representatives......................................................................................... 137
Employer representative’s employment history in their current role ....................................................... 137
6.3 EMPLOYER COMPANY PROFILE .............................................................................................................................. 138
Economic sector in which employer operates ........................................................................................... 138
Employers’ alignment to the ETDP SETA sub-sectors and constituencies ................................................. 138
Employer and ETDP SETA engagements ................................................................................................... 139
Employer hosting of ETDP SETA beneficiaries ........................................................................................... 140
6.4 OUTCOMES FOR ETDP SETA-FUNDED BENEFICIARIES ............................................................................................... 144
6.5 BENEFITS DERIVED BY EMPLOYER OF ETDP SETA-FUNDED SUPPORT TO EMPLOYEE ......................................................... 145
Learning intervention bridges gap between theoretical learning and practical workplace needs ........... 145
Versatility of workers across the organisation .......................................................................................... 146
High-quality employees ............................................................................................................................ 146
Employee efficiency on the job ................................................................................................................. 146
Employees’ impact on co-workers ............................................................................................................ 147
Employee productivity in the organisation ............................................................................................... 147
Employee contribution to company morale, staff retention and career planning .................................... 148
6.6 CONCLUSION ..................................................................................................................................................... 148
7 VALIDATION OF THEORY OF CHANGE .............................................................................................................. 151
7.1 CROSS-CUTTING OUTCOMES ................................................................................................................................. 151
Transformation Outcomes ........................................................................................................................ 151
Employment Outcomes and impacts ........................................................................................................ 151
Increase the pool of qualified, skilled and capable workers responsive and relevant to the sector needs
151
Sector and constituency stakeholder commitment to learning and skills development ........................... 151
Outcomes in respect of quality mentoring and supervision provided to employees ................................ 151
ETDP SETA design and administration of learning interventions .............................................................. 151
Outcomes with regard to transition durations ......................................................................................... 152
7.2 SPECIFIC LEARNING INTERVENTION OUTCOMES ........................................................................................................ 152
ToC outcomes with regard to Bursaries .................................................................................................... 152
ToC outcomes with respect to Learnerships.............................................................................................. 152
ToC outcomes with regard to Internships ................................................................................................. 152
ToC outcomes with regard to WIL for TVETs ............................................................................................. 153
ToC outcomes with regard to WIL for UoTs .............................................................................................. 153
ToC outcomes with regard to Employers .................................................................................................. 153
7.3 EMBEDDING THE THEORY OF CHANGE IN ETDP SETA ............................................................................................... 154
8 CONCLUSIONS AND RECOMMENDATIONS ...................................................................................................... 155
8.1 SUMMARY OF ACTIVITIES ..................................................................................................................................... 155
8.2 KEY RESEARCH FINDINGS ..................................................................................................................................... 155
To gather data about the effectiveness and impacts of the skills development interventions indicated
above. The impacts could be direct or indirect, intended or unintended. .............................................................. 156
To understand the wider effects of these interventions – social, economic and technical – on individual
beneficiaries. .......................................................................................................................................................... 157
To generate evidence of key achievements and challenges to inform the decision-making process for
senior management and accounting authority on programme delivery mechanisms, and how these can be
improved in future to ensure sustainability. ........................................................................................................... 157
To determine the nature of employment of learners who received employment. ................................... 158
To pilot a survey of the perceptions of employers on the value of learnerships, WIL and internships. . 159
8.3 CONCLUSIONS ................................................................................................................................................... 159
8.4 RECOMMENDATIONS .......................................................................................................................................... 160
Design recruitment strategies to ensure that the disability equity target is met ..................................... 160
Revisit recruitment strategies in respect of demographic and socio-economic target for specific learning
interventions .......................................................................................................................................................... 160
Ensure further integration and alignment of ETDP SETA programmes within a Theory of Change
framework .............................................................................................................................................................. 160
Enhance initiatives to improve learner employability ............................................................................... 160
Increase employer engagements with the ETDP SETA .............................................................................. 160
Institutionalising evaluation studies ......................................................................................................... 161
9 REFERENCES .................................................................................................................................................... 162
List of Figures
FIGURE 1: ETD 14 SUB-SECTORS ............................................................................................................................................... 5 FIGURE 2: CONCEPTUAL FRAMEWORK OF THE SCHOOL-WORK TRANSITION PROCESS ........................................................................... 15 FIGURE 3: DEFINITIONS AND STAGES IN THE TRANSITION PROCESS ................................................................................................... 19 FIGURE 4: TRANSITION PHASES ................................................................................................................................................ 21 FIGURE 5: NSDS III STRATEGIC OUTCOMES. ............................................................................................................................... 24 FIGURE 6: AN OVERVIEW OF VARIOUS CATEGORIES OF WORKPLACE-BASED LEARNING IN SOUTH AFRICA ................................................. 25 FIGURE 7: THEORY OF CHANGE FOR BURSARIES ........................................................................................................................... 43 FIGURE 8: THEORY OF CHANGE FOR LEARNERSHIPS ...................................................................................................................... 45 FIGURE 9: THEORY OF CHANGE FOR INTERNSHIPS ........................................................................................................................ 47 FIGURE 10: THEORY OF CHANGE FOR WIL TVETS ....................................................................................................................... 49 FIGURE 11: THEORY OF CHANGE FOR WIL UOTS ......................................................................................................................... 51 FIGURE 12: THEORY OF CHANGE FOR EMPLOYER ......................................................................................................................... 53 FIGURE 13: STWT ANALYTICAL FRAMEWORK FOR THE EVALUATION ................................................................................................ 54 FIGURE 14: NUMBER OF INCOMPLETE QUESTIONNAIRES BY SKILLS INTERVENTION (N = 51) .................................................................. 60 FIGURE 15: FINAL ACHIEVED CONSENT BY LEARNING INTERVENTION (N = 3,788) ............................................................................... 61 FIGURE 16: ETDP SETABENEFICIARIES WHO CONSENTED TO PARTICIPATE IN THE STUDY BY FINANCIAL YEAR ........................................... 62 FIGURE 17: SAMPLE ACHIEVED FOR EMPLOYER SURVEY BY LEARNING INTERVENTION (N = 349) ............................................................ 63 FIGURE 18: CAN YOU PLEASE CONFIRM THAT YOU COMPLETED THE ETDP SETA LEARNING INTERVENTION? ........................................... 68 FIGURE 19: DID YOU RECEIVE A CERTIFICATE AFTER COMPLETION OF THE LEARNING INTERVENTION ........................................................ 69 FIGURE 20: DID YOU PREVIOUSLY ACCESS ANY OTHER SETA LEARNING INTERVENTION/S BEFORE DOING THE ETDP SETA LEARNING
INTERVENTION WE ARE INTERVIEWING YOU FOR? ................................................................................................................ 70 FIGURE 21: WHICH SETA HAD FUNDED THE PREVIOUS LEARNING INTERVENTION? ............................................................................. 71 FIGURE 22: DID YOU COMPLETE THE LEARNING/TRAINING/SKILLS INTERVENTION MENTIONED? ............................................................ 71 FIGURE 23: DID YOU COMPLETE THE LEARNING/TRAINING/SKILLS INTERVENTION MENTIONED? ............................................................ 72 FIGURE 24: PARTICIPATION IN SETA FUNDED LEARNING INTERVENTION PRIOR TO THE ETDP SETA ONE BY CURRENT EMPLOYMENT STATUS . 72 FIGURE 25: PERCENTAGE OF PEOPLE STILL IN THE SAME PROVINCE WHERE THEY DID THEIR SCHOOLING ................................................... 75 FIGURE 26: DISTRIBUTION OF PEOPLE LIVING WITH A DISABILITY BY LEARNING INTERVENTION ............................................................... 77 FIGURE 27: SAMPLE POPULATION PYRAMID – DEMOGRAPHIC STRUCTURE OF STUDY (N = 3,767) ......................................................... 79 FIGURE 28: GROSS HOUSEHOLD INCOME BY INTERVENTION (N = 2,746) .......................................................................................... 83 FIGURE 29: POVERTY INDICATORS OF ETDP SETA BENEFICIARIES BY INTERVENTION (N = 2,730) ........................................................ 85 FIGURE 30: POVERTY INDICATORS OF ETDP SETA BENEFICIARIES BY GENDER AND AGE YOUTH COHORT (N = 2,730) ............................... 85 FIGURE 31: POVERTY INDICATORS OF ETDP SETA BENEFICIARIES BY PROVINCE (N = 2,730) .............................................................. 86 FIGURE 32: WERE YOU EMPLOYED AT THE COMPANY/ORGANISATION WHERE YOU COMPLETED THE LEARNING INTERVENTION? .................. 88 FIGURE 33: WHAT NQF LEVEL OF THE LEARNING INTERVENTION THAT YOU COMPLETED? .................................................................... 90 FIGURE 34: HIGHEST LEVEL OF EDUCATION PASSED ...................................................................................................................... 90 FIGURE 35: QUALITY OF TRAINING/MENTORSHIP RECEIVED BY ETDP SETABENEFICIARIES (N =3,785) .................................................. 91 FIGURE 36: RELEVANCE OF TRAINING AND MENTORSHIP RECEIVED (N = 3,785) ................................................................................ 92 FIGURE 37: DID ETDP SETAPROGRAMME MEET YOUR EXPECTATIONS? .......................................................................................... 93 FIGURE 38: TO WHAT EXTENT IS YOUR WORK RELATED TO WHAT YOU LEARNED DURING THE LEARNING INTERVENTION? ............................ 95 FIGURE 39: FOCUS OF EVALUATION IS ON THE B.2* PATHWAY OF THE ANALYTICAL FRAMEWORK .......................................................... 95 FIGURE 40: CHANGES IN CAREER AFTER YOU COMPLETED YOUR PROGRAMME?.................................................................................. 97 FIGURE 41: DISABILITY BY EMPLOYMENT STATUS ......................................................................................................................... 99 FIGURE 42: HIGHEST EDUCATIONAL LEVEL PASSED BY EMPLOYMENT STATUS ................................................................................... 100 FIGURE 43: EMPLOYMENT STATUS BY PROVINCE ....................................................................................................................... 100 FIGURE 44: TO WHAT EXTENT DO YOU THINK THE ETDP SETA’S INTERVENTION ASSISTED YOU WITH FINDING A JOB/STARTING A BUSINESS?
............................................................................................................................................................................... 101 FIGURE 45: HOW WOULD YOU CLASSIFY THE EMPLOYER THAT YOU WORK FOR? ............................................................................... 102 FIGURE 46: WHAT IS THE TYPE OF EMPLOYMENT? ..................................................................................................................... 104
FIGURE 47: WHAT IS THE NATURE OF YOUR EMPLOYMENT CONTRACT? .......................................................................................... 105 FIGURE 48: ARE YOU WORKING IN THE SAME INDUSTRY IN WHICH YOUR LEARNING INTERVENTION TOOK PLACE? ................................... 105 FIGURE 49: CURRENT JOB SATISFACTION .................................................................................................................................. 108 FIGURE 50: HAS YOUR SALARY CHANGED AS A RESULT OF THE LEARNING INTERVENTION? .................................................................. 110 FIGURE 51: I RECEIVED A PROMOTION AFTER COMPLETION OF THE LEARNING INTERVENTION .............................................................. 110 FIGURE 52: I MOVED TO A NEW POSITION AFTER COMPLETION OF THE LEARNING INTERVENTION ......................................................... 111 FIGURE 53: THERE WAS NO CHANGE IN MY EMPLOYMENT ........................................................................................................... 111 FIGURE 54: TO WHAT EXTENT HAVE YOUR CAREER EXPECTATIONS BEEN MET AT THE TIME OF COMPLETING YOUR LEARNING INTERVENTION?112 FIGURE 55: DID YOU START THIS BUSINESS AFTER COMPLETING THE LEARNING/TRAINING INTERVENTION? (N = 53)................................ 113 FIGURE 56: BENEFICIARIES WHO STARTED BUSINESSES AFTER RECEIVING TRAINING BY THEIR AGE COHORT (N = 53) ................................ 113 FIGURE 57: THE EXTENT IN WHICH BENEFICIARIES HAVE BEEN ABLE TO APPLY WHAT THEY LEARNT FROM ETDP SETATO START THEIR OWN
BUSINESS (N = 54) ...................................................................................................................................................... 114 FIGURE 58: BUSINESS REGISTERED WITH VAT BY LEARNING INTERVENTIONS (N = 53) ....................................................................... 114 FIGURE 59: WHICH OF THE FOLLOWING STATEMENTS MOST ACCURATELY DESCRIBE YOUR CURRENT SITUATION? .................................... 116 FIGURE 60: HOW LONG HAVE YOU BEEN LOOKING FOR A JOB? ..................................................................................................... 116 FIGURE 61: HAVE YOU EVER REFUSED A JOB THAT WAS OFFERED TO YOU? ...................................................................................... 118 FIGURE 62: WHY DID YOU REFUSE A JOB OPPORTUNITY? ............................................................................................................. 119 FIGURE 63: WHAT METHOD HAVE YOU USED TO LOOK FOR WORK? ............................................................................................... 120 FIGURE 64: WHAT QUALIFICATIONS ARE YOU STUDYING FOR BY GENDER OF BENEFICIARIES ................................................................ 124 FIGURE 65: THREE MAIN REASONS FOR STUDYING BY GENDER OF BENEFICIARIES .............................................................................. 125 FIGURE 66: HOW CAN ETDP SETA IMPROVE DELIVERY OF LEARNING/TRAINING INTERVENTIONS? ...................................................... 127 FIGURE 67: WOULD YOU RECOMMEND THE ETDP SETAPROGRAMME TO OTHERS? ......................................................................... 129 FIGURE 68: ARE YOU EMPLOYED BY THE COMPANY/EMPLOYER WHERE YOU DID YOUR LEARNING INTERVENTION? .................................. 131 FIGURE 69: TO WHAT EXTENT DO YOU THINK THE ETDP-SETAS INTERVENTION ASSISTED YOU WITH FINDING THE JOB/STARTING THE BUSINESS,
IF SELF-EMPLOYED? ..................................................................................................................................................... 131 FIGURE 70: DISTRIBUTION OF BENEFICIARIES IN EMPLOYER SURVEY ............................................................................................... 135 FIGURE 71: FINANCIAL YEAR BENEFICIARY COMPLETED INTERVENTION ........................................................................................... 136 FIGURE 72: OCCUPATION OF EMPLOYER RESPONDENT ................................................................................................................ 137 FIGURE 73: POPULATION GROUP OF EMPLOYER RESPONDENT ...................................................................................................... 137 FIGURE 74: DURATION IN THE CURRENT ROLE IN THE ORGANISATION ............................................................................................. 138 FIGURE 75: IN WHICH ETDP SUB-SECTOR DOES YOUR COMPANY/ORGANISATION FALL UNDER? ......................................................... 139 FIGURE 76: DOES YOUR COMPANY/INSTITUTION HAVE ANY DIRECT ENGAGEMENT WITH ETDP SETA? ................................................ 139 FIGURE 77: THINKING ABOUT THE PAST 5 YEARS CAN YOU PLEASE SELECT EACH YEAR YOU HAVE HOSTED/ EMPLOYED/ SUPPORTED AT LEAST
ONE ETDP SETA BENEFICIARY? ..................................................................................................................................... 140 FIGURE 78: HOW MANY ETDP SETABENEFICIARIES ACROSS THE DIFFERENT INTERVENTIONS HAS YOUR ORGANISATION SUPPORTED SINCE
2015? ..................................................................................................................................................................... 141 FIGURE 79: ON OVERAGE HOW WOULD YOU RATE THE QUALITY OF THE LEARNER’S BASIC EDUCATION PRIOR TO COMMENCING WITH YOUR
COMPANY/ORGANISATION? .......................................................................................................................................... 142 FIGURE 80: WAS THE ETDP SETABENEFICIARY (WHO GAVE US YOUR CONTACT DETAILS) WORKING FOR YOUR COMPANY AT THE TIME THEY
WERE PURSUING THEIR STUDIES/TRAINING? ..................................................................................................................... 143 FIGURE 81: IN WHAT WAY DID THE EARNINGS OF THE EMPLOYEE CHANGE AS A RESULT OF THE LEARNING INTERVENTION? ....................... 144 FIGURE 82: CHANGES IN EMPLOYEE EARNINGS AS REPORTED BY EMPLOYER ..................................................................................... 144 FIGURE 83: TO WHAT EXTENT DOES THE INTERVENTIONS BRIDGE THE GAP BETWEEN THEORETICAL LEARNING AND PRACTICAL WORKPLACE
NEEDS? ..................................................................................................................................................................... 145 FIGURE 84: TO WHAT EXTENT EMPLOYEES ARE MORE EFFICIENT AT DOING THEIR JOBS RELATIVE TO THOSE WHO WITH NO TRAINING? ........ 147 FIGURE 85: TO WHAT EXTENT IT INSPIRES AND ENCOURAGE OTHER WORKERS TO DEVELOP THEIR SKILLS? .............................................. 147 FIGURE 86: TO WHAT EXTENT PRODUCTIVITY IS INCREASED IN THE ORGANISATION? .......................................................................... 148 FIGURE 87: TO WHAT EXTENT IT IMPROVES COMPANY MORALE AND ASSIST IN STAFF RETENTION AND CAREER PLANNING? ....................... 148
List of Tables
TABLE 1: SOCIO-ECONOMIC AND DEMOGRAPHIC CHARACTERISTICS OF BENEFICIARIES ........................................................................ XVII TABLE 2: SUMMARY OF EVALUATION OUTCOMES: EMPLOYER SECTOR AND NATURE OF EMPLOYMENT ................................................... XIX TABLE 3: BURSARY GRANT TARGETS ............................................................................................................................................ 6 TABLE 4: LEARNERSHIP GRANT TARGETS ....................................................................................................................................... 7 TABLE 5: INTERNSHIP PROGRAMME TARGETS ................................................................................................................................ 9 TABLE 6: WORK-INTEGRATED LEARNING TVET COLLEGE PLACEMENT TARGETS .................................................................................. 10 TABLE 7: WORK-INTEGRATED LEARNING FOR UOTS TARGETS ......................................................................................................... 11 TABLE 8: DEFINITIONS OF WORK-BASED LEARNING ....................................................................................................................... 27 TABLE 9: STAKEHOLDER ROLES AND RESPONSIBILITIES IN IMPLEMENTATION OF WIL ........................................................................... 28 TABLE 10: EMPLOYMENT OUTCOMES OF SETA FUNDED LEARNING INTERVENTIONS COMPARING % UNEMPLOYED AT THE START AND AFTER
PROGRAMME ............................................................................................................................................................... 35 TABLE 11: RESPONSE RATES ON TRACER STUDIES CONDUCTED IN SOUTH AFRICA AND GLOBALLY .......................................................... 36 TABLE 12: DIMENSIONS OF ASSESSMENT AND ALIGNMENT TO STUDY OBJECTIVES AND EVALUATION QUESTIONS ....................................... 55 TABLE 13: POPULATION OF LEARNERS WHO COMPLETED THE LEARNING INTERVENTION WITH CONTACTABLE DETAILS ................................ 57 TABLE 14: RANDOM SAMPLE DRAWN FROM A STRATIFIED POPULATION OF 7,438 AT 5% MARGIN OF ERROR AND 95% CONFIDENCE INTERVAL
................................................................................................................................................................................. 57 TABLE 15: DISTRIBUTION OF 40% SAMPLE BY LEARNING INTERVENTION AND FINANCIAL YEAR .............................................................. 58 TABLE 16: SAMPLE SIZE ACHIEVED BY LEARNING INTERVENTION AND FINANCIAL YEAR.......................................................................... 58 TABLE 17: TYPE OF CONTACT NUMBER BY WORKING STATUS .......................................................................................................... 58 TABLE 18: RESPONSE RATES, ALL CONTACT NUMBERS VS. WORKING NUMBERS .................................................................................. 58 TABLE 19: DIFFERENCES BETWEEN TARGET AND SAMPLE ACHIEVED BY INTERVENTION AND YEAR OF COMPLETION..................................... 59 TABLE 20: DIFFERENCES IN SAMPLE PROPORTIONS BY INTERVENTION POPULATION VS. ACHIEVED SAMPLE ............................................... 59 TABLE 21: BENEFICIARIES BY CONSENT STATUS AND FINANCIAL YEAR ............................................................................................... 60 TABLE 22: FINAL REALISED SAMPLE AFTER ADJUSTING FOR INCOMPLETE QUESTIONNAIRES VS TARGETED SAMPLE ...................................... 61 TABLE 23: NUMBER OF BENEFICIARIES WHO CONSENTED TO GIVE THEIR EMPLOYERS’ CONTACT DETAILS ................................................. 62 TABLE 24: SPECIFIC ETDP SETA DEMOGRAPHIC TARGETS ADOPTED FOR STUDY REFERENCE PERIOD ...................................................... 73 TABLE 25: NATIONALITY OF BENEFICIARIES ................................................................................................................................. 73 TABLE 26: PROVINCE IN WHICH THE BENEFICIARIES CURRENTLY RESIDED ........................................................................................... 73 TABLE 27: PROVINCE OF RESIDENCE TRANSITION MATRIX* (N = 3,785) ........................................................................................... 74 TABLE 28: RACE OF THE BENEFICIARIES ...................................................................................................................................... 76 TABLE 29: NUMBER OF PEOPLE WITH A DISABILITY BY LEARNING INTERVENTION ................................................................................ 77 TABLE 30: SUMMARY STATISTICS ON AGE BY INTERVENTION AND GENDER OF BENEFICIARY (N = 3,767) ................................................. 78 TABLE 31: DEMOGRAPHIC STATISTICS FOR BENEFICIARY SAMPLE (N = 3,767) ................................................................................... 80 TABLE 32: DEMOGRAPHIC TARGETS VS. EVALUATION OUTCOMES (%) .............................................................................................. 81 TABLE 33: HOUSEHOLD SIZE SUMMARY STATISTICS OF BENEFICIARIES (N = 3,742) ............................................................................. 82 TABLE 34: CURRENT GROSS MONTHLY INCOME BY EMPLOYMENT STATUS OF BENEFICIARIES ................................................................. 83 TABLE 35: SUMMARY STATISTICS OF BENEFICIARIES’ HOUSEHOLD GROSS MONTHLY INCOME BY INTERVENTION AND GENDER ...................... 84 TABLE 36: AT THE TIME YOU STARTED THE ETDP SETALEARNING INTERVENTION WHAT WAS YOUR EMPLOYMENT STATUS? ...................... 87 TABLE 37: LENGTH OF TIME THAT BENEFICIARIES HAD BEEN UNEMPLOYED (%) .................................................................................. 88 TABLE 38: WHAT WAS THE NQF LEVEL OF THE LEARNING INTERVENTION THAT YOU COMPLETED? ........................................................ 89 TABLE 39: CURRENT EMPLOYMENT STATUS BY THE RELEVANCE OF THE TRAINING OR MENTORSHIP RECEIVED .......................................... 92 TABLE 40: LEARNER EXPECTATIONS ........................................................................................................................................... 93 TABLE 41: SUMMARY OF BENEFICIARY CURRENT EMPLOYMENT STATUS BY THE FINANCIAL YEAR ............................................................ 97 TABLE 42: CURRENT EMPLOYMENT STATUS OF THE ETDP SETABY LEARNING INTERVENTION .............................................................. 98 TABLE 43: CURRENT EMPLOYMENT STATUS BY RACE ..................................................................................................................... 98 TABLE 44: CURRENT EMPLOYMENT STATUS BY GENDER ................................................................................................................. 99 TABLE 45: ETDP SETA CONSTITUENCY AND NON-ETDP SECTOR EMPLOYERS N = 1,646 ................................................................ 102 TABLE 46: DISTRIBUTION OF PRIVATE COMPANIES BY SECTORS .................................................................................................... 103
TABLE 47: SUMMARY OF BENEFICIARIES’ OCCUPATION BY INTERVENTIONS ...................................................................................... 106 TABLE 48: HOW MUCH DO YOU EARN PER MONTH BEFORE ANY DEDUCTIONS? (N = 1,403) ............................................................... 108 TABLE 49: HOW MANY HOURS DO USUALLY WORK PER WEEK? ..................................................................................................... 109 TABLE 50: EMPLOYEE BENEFITS .............................................................................................................................................. 109 TABLE 51: GROSS MONTHLY INCOME FOR THE SELF-EMPLOYED .................................................................................................... 115 TABLE 52: ONE MAIN REASON WHY YOU THINK YOU ARE ECONOMICALLY INACTIVE ........................................................................... 117 TABLE 53: REASONS FOR REFUSING A JOB OPPORTUNITY BY AGE COHORTS ...................................................................................... 119 TABLE 54: CONDITIONS UNDER WHICH BENEFICIARY WOULD ACCEPT A GIVEN JOB (MULTIPLE RESPONSES*) .......................................... 121 TABLE 55: SUMMARY STATISTICS ON MINIMUM ACCEPTABLE MONTHLY SALARY (R) FOR THE EMPLOYED ............................................... 121 TABLE 56: SUMMARY STATISTICS ON MINIMUM ACCEPTABLE MONTHLY SALARY (R) FOR THE UNEMPLOYED ........................................... 122 TABLE 57: SINCE YOU ARE UNEMPLOYED, HOW YOU DO SUPPORT YOURSELF? (MULTIPLE RESPONSE*) ................................................ 122 TABLE 58: WHERE ARE YOU CURRENTLY REGISTERED FOR FULL-TIME STUDY? .................................................................................. 123 TABLE 59: WHERE ETDP SETABENEFICIARIES STUDYING FULL TIME ARE CURRENTLY REGISTERED, BY AGE COHORT ................................ 123 TABLE 60: WHAT QUALIFICATIONS ARE YOU STUDYING FOR, BY LEARNING INTERVENTION? (N = 160) ................................................. 124 TABLE 61: THREE MAIN REASONS FOR STUDYING BY TYPE OF INTERVENTION (MULTIPLE RESPONSE*) ................................................... 125 TABLE 62: BASED ON YOUR EXPERIENCE, IS THERE ANYTHING YOU WOULD LIKE THE SETA TO KNOW THAT MIGHT HELP THEM IN IMPROVING
THE DELIVERY OF ITS LEARNING/TRAINING INTERVENTIONS? ................................................................................................ 126 TABLE 63: OUTCOMES IN TERMS OF EMPLOYMENT OF BENEFICIARIES, COMPARING BEFORE AND AFTER THE INTERVENTION ...................... 132 TABLE 64: TRANSITION MATRIX FOR LABOUR MARKET TRANSITIONS BEFORE AND AFTER THE INTERVENTION .......................................... 133 TABLE 65: ECONOMIC SECTOR OF COMPANY/ORGANISATION ...................................................................................................... 138 TABLE 66: HOW DO YOU GENERALLY RECRUIT LEARNERS INTO YOUR COMPANY/ORGANISATION? ........................................................ 141 TABLE 67: TO WHAT EXTENT DID THE LEARNING INTERVENTION CREATE MULTI-SKILLED WORKERS WHO CAN WORK ACROSS THE
ORGANISATION? ......................................................................................................................................................... 146 TABLE 68: TO WHAT EXTENT DID THE LEARNING INTERVENTION PROVIDE EMPLOYERS WITH HIGH-QUALITY EMPLOYEES? .......................... 146 TABLE 69: SOCIO-ECONOMIC AND DEMOGRAPHIC CHARACTERISTICS OF BENEFICIARIES ..................................................................... 156 TABLE 70: SUMMARY OF EVALUATION OUTCOMES: EMPLOYER SECTOR AND NATURE OF EMPLOYMENT ............................................... 158
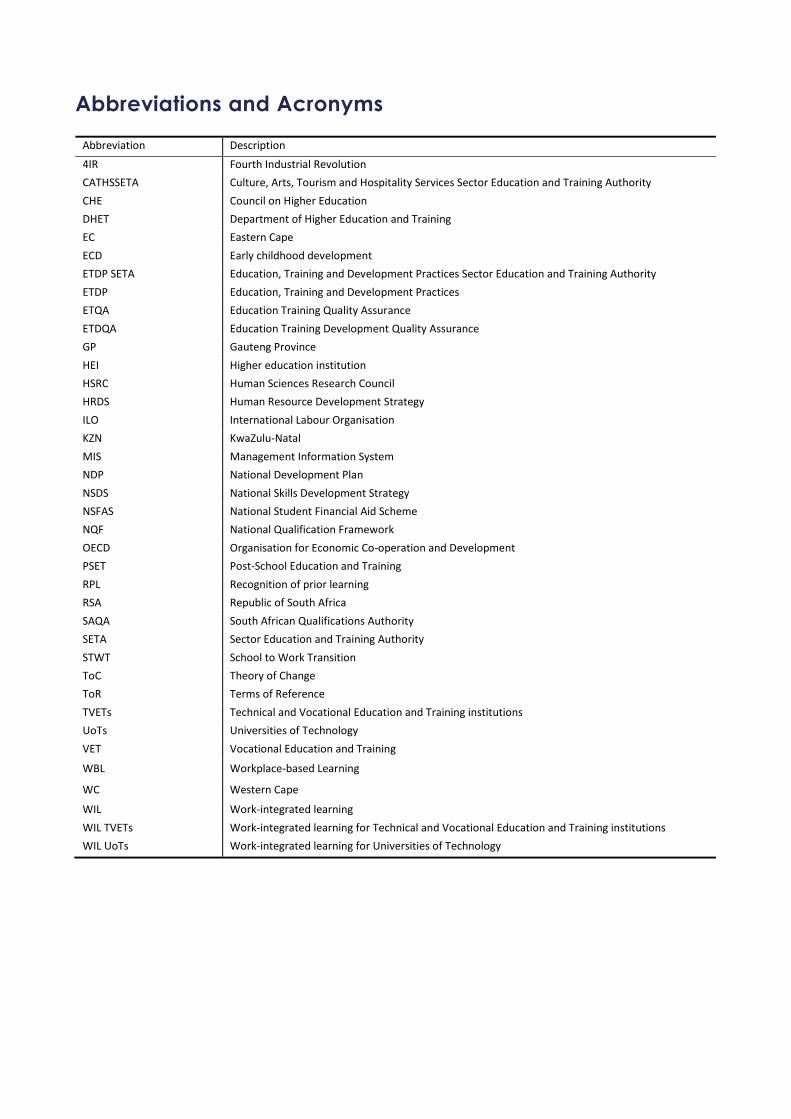
Abbreviations and Acronyms
Abbreviation Description
4IR Fourth Industrial Revolution
CATHSSETA Culture, Arts, Tourism and Hospitality Services Sector Education and Training Authority
CHE Council on Higher Education
DHET Department of Higher Education and Training
EC Eastern Cape
ECD Early childhood development
ETDP SETA Education, Training and Development Practices Sector Education and Training Authority
ETDP Education, Training and Development Practices
ETQA Education Training Quality Assurance
ETDQA Education Training Development Quality Assurance
GP Gauteng Province
HEI Higher education institution
HSRC Human Sciences Research Council
HRDS Human Resource Development Strategy
ILO International Labour Organisation
KZN KwaZulu-Natal
MIS Management Information System
NDP National Development Plan
NSDS National Skills Development Strategy
NSFAS National Student Financial Aid Scheme
NQF National Qualification Framework
OECD Organisation for Economic Co-operation and Development
PSET Post-School Education and Training
RPL Recognition of prior learning
RSA Republic of South Africa
SAQA South African Qualifications Authority
SETA Sector Education and Training Authority
STWT School to Work Transition
ToC
ToR
Theory of Change
Terms of Reference
TVETs Technical and Vocational Education and Training institutions
UoTs Universities of Technology
VET Vocational Education and Training
WBL Workplace-based Learning
WC Western Cape
WIL Work-integrated learning
WIL TVETs Work-integrated learning for Technical and Vocational Education and Training institutions
WIL UoTs Work-integrated learning for Universities of Technology
Gatekeeper approval from Government institutions
It is proposed that the ETDP SETA engage with the DHET, Department of Basic Education and HEIs to motivate
for increased employer participation. A significant number of the employers are in the public sector. The
leadership of the DHET, Department of Basic Education and higher education institutions to create awareness
among senior managers of the value of such studies and secure prior agreement to participate. Increasing
numbers of studies of this nature will be required.
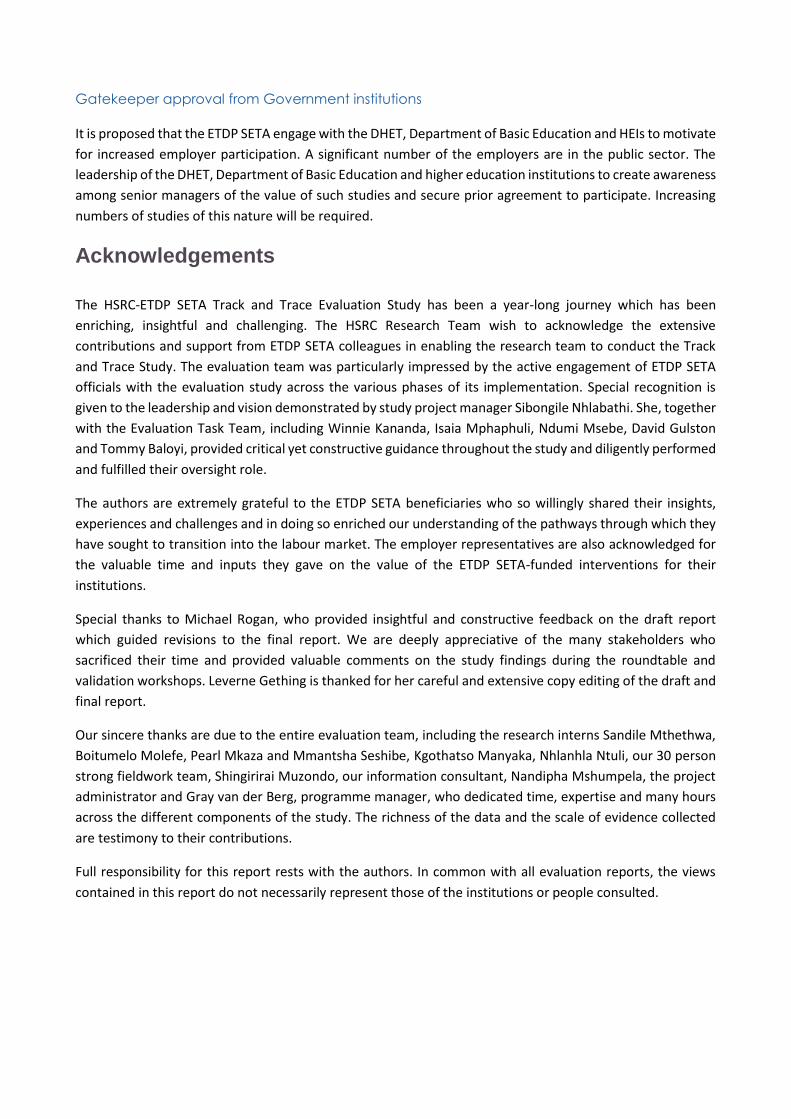
Acknowledgements
The HSRC-ETDP SETA Track and Trace Evaluation Study has been a year-long journey which has been
enriching, insightful and challenging. The HSRC Research Team wish to acknowledge the extensive
contributions and support from ETDP SETA colleagues in enabling the research team to conduct the Track
and Trace Study. The evaluation team was particularly impressed by the active engagement of ETDP SETA
officials with the evaluation study across the various phases of its implementation. Special recognition is
given to the leadership and vision demonstrated by study project manager Sibongile Nhlabathi. She, together
with the Evaluation Task Team, including Winnie Kananda, Isaia Mphaphuli, Ndumi Msebe, David Gulston
and Tommy Baloyi, provided critical yet constructive guidance throughout the study and diligently performed
and fulfilled their oversight role.
The authors are extremely grateful to the ETDP SETA beneficiaries who so willingly shared their insights,
experiences and challenges and in doing so enriched our understanding of the pathways through which they
have sought to transition into the labour market. The employer representatives are also acknowledged for
the valuable time and inputs they gave on the value of the ETDP SETA-funded interventions for their
institutions.
Special thanks to Michael Rogan, who provided insightful and constructive feedback on the draft report
which guided revisions to the final report. We are deeply appreciative of the many stakeholders who
sacrificed their time and provided valuable comments on the study findings during the roundtable and
validation workshops. Leverne Gething is thanked for her careful and extensive copy editing of the draft and
final report.
Our sincere thanks are due to the entire evaluation team, including the research interns Sandile Mthethwa,
Boitumelo Molefe, Pearl Mkaza and Mmantsha Seshibe, Kgothatso Manyaka, Nhlanhla Ntuli, our 30 person
strong fieldwork team, Shingirirai Muzondo, our information consultant, Nandipha Mshumpela, the project
administrator and Gray van der Berg, programme manager, who dedicated time, expertise and many hours
across the different components of the study. The richness of the data and the scale of evidence collected
are testimony to their contributions.
Full responsibility for this report rests with the authors. In common with all evaluation reports, the views
contained in this report do not necessarily represent those of the institutions or people consulted.
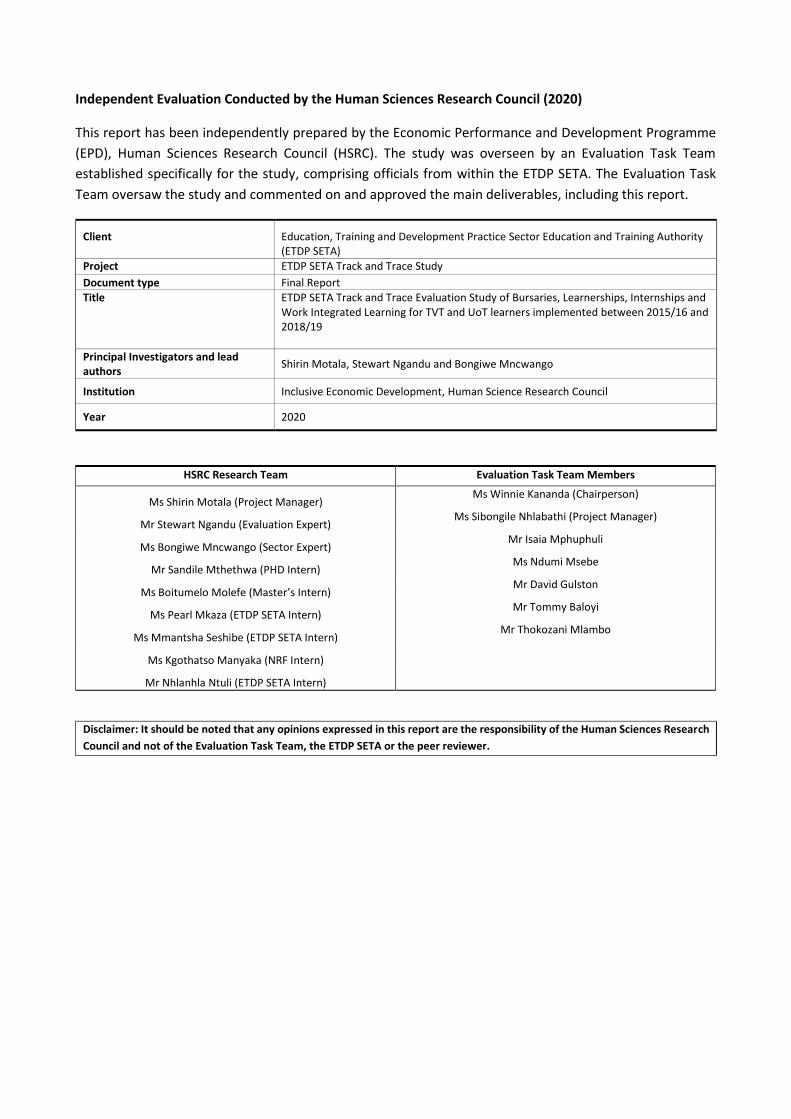
Independent Evaluation Conducted by the Human Sciences Research Council (2020)
This report has been independently prepared by the Economic Performance and Development Programme
(EPD), Human Sciences Research Council (HSRC). The study was overseen by an Evaluation Task Team
established specifically for the study, comprising officials from within the ETDP SETA. The Evaluation Task
Team oversaw the study and commented on and approved the main deliverables, including this report.
Client Education, Training and Development Practice Sector Education and Training Authority (ETDP SETA)
Project ETDP SETA Track and Trace Study
Document type Final Report Title ETDP SETA Track and Trace Evaluation Study of Bursaries, Learnerships, Internships and
Work Integrated Learning for TVT and UoT learners implemented between 2015/16 and 2018/19
Principal Investigators and lead authors
Shirin Motala, Stewart Ngandu and Bongiwe Mncwango
Institution Inclusive Economic Development, Human Science Research Council
Year 2020
HSRC Research Team Evaluation Task Team Members
Ms Shirin Motala (Project Manager) Ms Winnie Kananda (Chairperson)
Mr Stewart Ngandu (Evaluation Expert) Ms Sibongile Nhlabathi (Project Manager)
Ms Bongiwe Mncwango (Sector Expert) Mr Isaia Mphuphuli
Mr Sandile Mthethwa (PHD Intern) Ms Ndumi Msebe
Ms Boitumelo Molefe (Master’s Intern) Mr David Gulston
Ms Pearl Mkaza (ETDP SETA Intern) Mr Tommy Baloyi
Ms Mmantsha Seshibe (ETDP SETA Intern) Mr Thokozani Mlambo
Ms Kgothatso Manyaka (NRF Intern)
Mr Nhlanhla Ntuli (ETDP SETA Intern)
Disclaimer: It should be noted that any opinions expressed in this report are the responsibility of the Human Sciences Research
Council and not of the Evaluation Task Team, the ETDP SETA or the peer reviewer.

Executive Summary
Introduction
Addressing skills deficits continues to be a major concern for South Africa within a context of unprecedented
levels of poverty, unemployment and inequality. While economic growth remains subdued, the labour
market is not able to absorb the rapidly expanding supply of workers, particularly young workers. Globally
there is recognition of the crucial contribution that a skilled workforce plays in advancing economic
transformation (World Bank, 2018). A lack of training or entry into skilled occupations is associated with
negative future employment (Bradley & Nguyen, 2004) and earning outcomes.
Globally, school to work transitions (STWT) have become non-linear, extended and more uncertain; as such
it is important to look at the factors responsible for smooth or broken transitions. The literature focusing on
transitions from secondary school and into the world of work has grouped these factors into individual,
institutional (school-related or higher education and training variables) and labour market contexts.
Identifying factors with an impact on the transitions is particularly important for the South African context,
which is marked by pronounced inequalities.
Central to the National Skills Development Strategy (NSDS) III (Department of Higher Education and Training
(DHET), 2011) framework is the commitment to increase access to high-quality and relevant education, and
training and skills development, including workplace learning and experience, to enable participation in the
economy and society by all South Africans and reduce inequalities (DHET, 2011).
As one of 21 SETAs in South Africa, the Education Training and Development Practices (ETDP) SETA was
established through the Skills Development Act of 1998 (Skills Development Act No. 97 of 1998, 1998) to
facilitate the development of skills in relation to sector- identified skills needs. The ETDP SETA’s (ETDP SETA,
2019, p. 8) vision is:
To promote and facilitate the development and improvement of the skills profile of the sector’s
workforce in order to benefit employers, workers and employees in the sector.
The ETDP SETA has been instrumental in implementing a range of learning interventions to facilitate the
development of skills in relation to sector-identified skills needs. These include, among others, the five
learning interventions which are the focus of this study, namely bursaries1, learnerships, internships and
work-integrated learning (WIL) interventions with Technical and Vocational Education and Training (TVET)
institutions and Universities of Technology (UoT) between the 2015/16 and 2018/19 financial period.
The SETAs and the DHET are now increasingly required to answer questions that relate to outcomes and
impacts (particularly labour market outcomes) of the programmes implemented. The Human Sciences
Research Council (HSRC) therefore understands the necessity of tracer studies as arising from this broader
context.
1 Bursaries are for employed and unemployed learners.
Study Objectives
The ETDP SETA commissioned the HSRC to undertake a Track and Trace Evaluation Study with the aim of
understanding the outcomes and impacts of five skills development interventions supported by the ETDP
SETA, and to determine whether or not bursaries2, learnerships, internships and work-integrated learning
interventions targeted to TVET and UoT learners are achieving their objectives. The study was expected to
understand, explore and document key features, trends, challenges and outcomes of these learning
interventions.
The objectives of the study are summarised as follows:
a. To gather data about the effectiveness and impacts of the five skills development interventions
supported by the ETDP SETA for the period 2015/16 to 2018/19. The impacts could be direct or
indirect and intended or unintended.
b. To understand the wider effects of these interventions – social, economic and technical – on
individual beneficiaries.
c. To generate evidence of the key achievements and challenges to inform the decision-making process
for senior management and accounting authority on programme delivery mechanisms and how
these can be improved in future in order to ensure sustainability.
d. To determine the nature of employment of learners who received employment.
e. To pilot a survey of the perceptions of employers on the value of learnerships, WIL and internships.
Methodology
This section provides an overview of the approach and methodology employed in respect of the study, with
section 5 of this report providing the details regarding the methodology. A theory-based evaluation approach
was used with a cross-sectional research design. This approach sought to understand the pathways through
which change was expected to occur, with an emphasis on detailing the assumptions on which the
intervention logic was premised.
Reconstitution of Theories of Change and Results Log Frames
Recognising that theories of change (ToCs) did not exist for the five learning interventions, an initial phase of
the study involved the retrospective reconstruction of the ToC through a participative process involving key
ETDP SETA officials. This was aimed at capturing the pathways that lead to the goal intent of the SETA’s five
interventions. The articulation of the ToCs contributed to the development of a Results Log Frame for each
of the five learning interventions.
Analytical Framework
For our analytical framework we built on Nilsson’s conceptual framework for school to work transitions
(STWT) (2019) and made several extensions to operationalise his conceptual framework (see section 4.5) as
the lens through which the findings of this evaluation would be understood.
2 Targeted to employed and unemployed people for full qualifications, either as a degree, diploma or higher certificate.
Nilsson’s framework highlighted the existence of a gap between education and targeted labour market
outcomes that people transition to and emphasised that central to this broad relationship are internal and
external factors that influence the duration and strength of the transition. We posit that given the SETA’s
role and impact through the quantum of expenditure in the post-school education and training (PSET) sector,
there are two broad pathways that one can follow:
Pathway 1: Individuals who traverse the STWT without exposure to any SETA intervention;
Pathway 2: ETDP SETA interventions enter the STWT process as an external factor that is meant to
enhance the efficacy of the transition.
The outcome of each pathway on the achieved transition will vary, and from the broader South African PSET
and STWT literature it can generally be hypothesised, ceteris paribus, that the second pathway is potentially
stronger and would lead to shorter duration transitions due to the SETA-funded intervention, compared to a
control group that did not access SETA support. It is also important to note that throughout each pathway
internal and external factors would continue to mediate and influence the entire process. These factors are
key in helping us understand and contextualise the achieved transitions. For example, the role of internal
factors such as social networks might shorten the transition duration for some individuals via the first
pathway, while for others socioeconomic background might constrain them from accessing post-schooling
skills development and training; however, once exposed to these interventions via the second pathway,
external factors such as the macro economy, e.g. the ability to create enough jobs, might mitigate against a
successful transition. Above and beyond the latter, the rationale of the SETA is that the design of its
interventions confer certain benefits that would lead to a more efficient transition (Nilsson, 2019).
Research Methods
To address the study objectives a number of different research methodologies were employed, including a
literature review and reconstruction of ToCs and Results Log-frames in respect of bursaries, learnerships,
internships, WIL TVET and WIL UoT learning Interventions. Primary research was conducted both with
beneficiaries of the five learning interventions and the employers of those beneficiaries who are currently
employed. Secondary data analysis included an analysis of data on ETDP SETA beneficiaries of the five
learning interventions and a detailed desk review of evidence to contextualise our understanding of the
research findings, as well as to deliver insight into emerging trends impacting on the ETDP sector. The study
was undertaken in line with principles of ethical research involving human subjects.
Telephonic interviews were conducted with structured survey instruments for learners and employers, and
captured on the REDCAP (Research Electronic Data Capture) platform. The learner survey was administered
to learners with contactable details for the five designated learning interventions.
The total realised population of learners with contact details was 7,438 as extracted from the ETDP SETA
Management Information System (MIS). These were learners who had undertaken and completed a learning
intervention between 2015/16 and 2018/19 financial years. The interviews were conducted during the
period November 2019 to January 2020, which is between 10 months to 3 years after completion of the
learning intervention. The expectation had been to deliver a realised sample of 40-60%; 4,002 ETDP SETA
beneficiaries were successfully contacted. This number represents the number of learners who actually
answered the phone, and relative to the total population of 7,438 this represents a response rate of 54%.
However, the study found that only 5,085 of the 7,438 telephone numbers were working, and this means
that the response rate for working numbers is significantly higher at 79%. Of the 4,002 learners who were
contacted, the study reports on the responses of 3,788 learners; 163 refused to participate in the study, with
3,839 consenting to being interviewed. The 3,839 completed questionnaires were all assessed for level of
completeness, and 51 were found to be incomplete, arising from some participants dropping out after the
first few modules, while others did so halfway into the interview. Participants had completed the learning
interventions between April 2015 and March 2019, and as interviews were conducted in November 2019 to
January 2020, they were conducted at least seven months after completion for those who graduated in 2019,
and up to five years later for those who graduated in 2015 or later.
The terms of reference had requested that the study interview 20 current employers of ETDP SETA-funded
beneficiaries. The HSRC reasoned that the study population of beneficiaries was large and that the proposed
sample size would not give results that were representative of the population – more so when one factors in
the diversity of the ETD sector by sub-sector and by the five learning interventions. The study found 1,810
learners who were employed at the time of the survey. The HSRC targeted the entire population of 1,135
learners who consented to and provided current employer details, and at a 5% margin of error and a
confidence level of 95% and eligible employer population of those who consented, this gave a target sample
of 288. The study managed to achieve a sample of 349.
Study Outputs
The study generated the following research reports as core deliverables during the study and in the preparation of this report. The reports contain insights used in the analysis of the findings and which have contributed to the drafting of this report. These reports include:
HSRC ETDP SETA Track and Trace Study Inception Report.
HSRC ETDP SETA Tracer Study Literature Review Report.
HSRC ETDP SETA Tracer Study ToC and Log-Frame Report for Bursaries.
HSRC ETDP SETA Tracer Study ToC and Log-Frame Report for Learnerships.
HSRC ETDP SETA Tracer Study ToC and Log-Frame Report for Internships.
HSRC ETDP SETA Tracer Study ToC and Log-Frame Report for WIL TVETs.
HSRC ETDP SETA Tracer Study ToC and Log-Frame Report for WIL UoTs.
ETDP SETA Track and Trace Fieldwork Report.
HSRC ETDP SETA Track and Trace Study Final Report September 2020.
Research Findings
The research findings are presented in relation to the broad objectives of the study. Presenting the findings
in this manner addresses the key research questions articulated in section 1.3. The key findings report
evidence in respect of the following indicators: employment status of the beneficiaries (employed, self-
employed and unemployed); employment rates; nature of employment (access to benefits); key
achievements and challenges; the wider socioeconomic effects of the interventions on the beneficiaries;
career progression for beneficiaries; and employer perceptions of the value of learning interventions
(employable people; increased productivity of the company).
To gather data about the effectiveness and impacts of the skills development interventions indicated
above. The impacts could be direct or indirect, intended or unintended.
The findings are conclusive in that ETDP SETA learning interventions have exceeded in their equity
targeting of previously disadvantaged women, youth and Black people;
It did not however meet its target for people with disabilities;
In respect of enabling access to disadvantaged learners from households in poverty, the study
findings confirm the high prevalence of learners from larger households and high prevalence of
poverty;
The study also found that half of all beneficiaries were unemployed at the time they commenced
with the learning intervention;
As elaborated in section 5, there are significant variations in outcomes by learning interventions,
with particular focus on recruitment of younger beneficiaries between the ages of 18 and 35 years
across all interventions, but specifically with regard to bursary interventions.
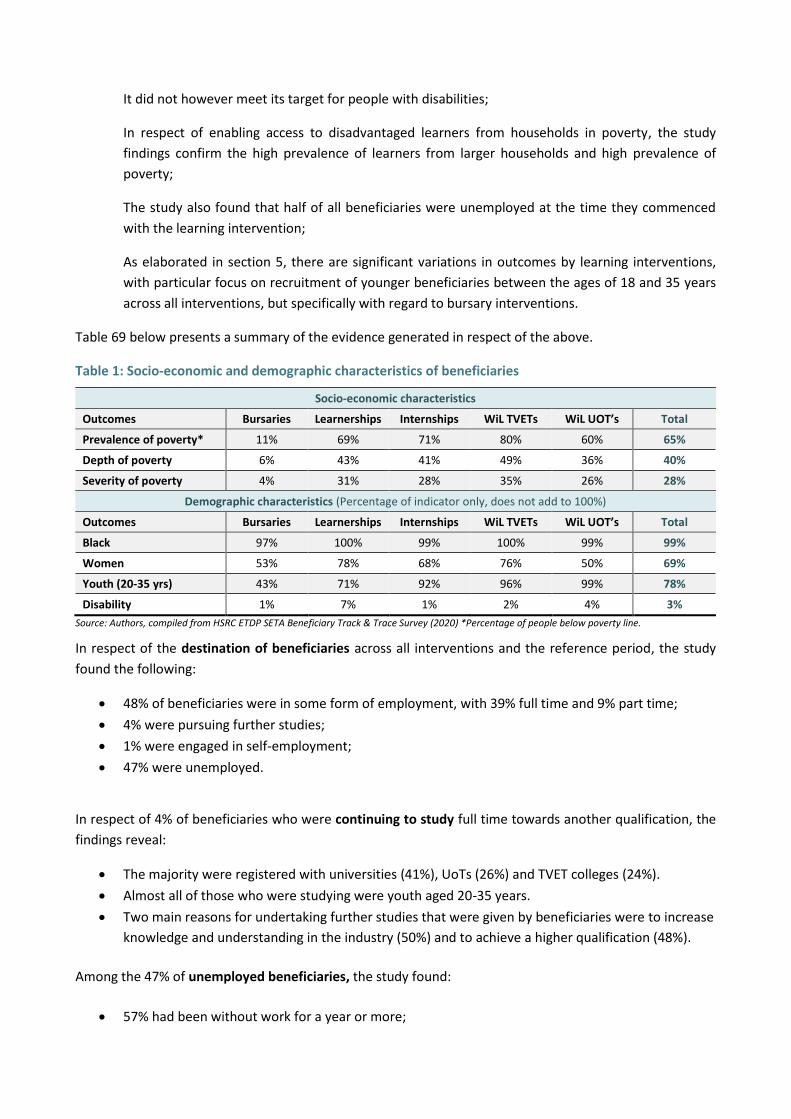
Table 69 below presents a summary of the evidence generated in respect of the above.
Table 1: Socio-economic and demographic characteristics of beneficiaries
Socio-economic characteristics
Outcomes Bursaries Learnerships Internships WiL TVETs WiL UOT’s Total
Prevalence of poverty* 11% 69% 71% 80% 60% 65%
Depth of poverty 6% 43% 41% 49% 36% 40%
Severity of poverty 4% 31% 28% 35% 26% 28%
Demographic characteristics (Percentage of indicator only, does not add to 100%)
Outcomes Bursaries Learnerships Internships WiL TVETs WiL UOT’s Total
Black 97% 100% 99% 100% 99% 99%
Women 53% 78% 68% 76% 50% 69%
Youth (20-35 yrs) 43% 71% 92% 96% 99% 78%
Disability 1% 7% 1% 2% 4% 3%
Source: Authors, compiled from HSRC ETDP SETA Beneficiary Track & Trace Survey (2020) *Percentage of people below poverty line.
In respect of the destination of beneficiaries across all interventions and the reference period, the study
found the following:
48% of beneficiaries were in some form of employment, with 39% full time and 9% part time;
4% were pursuing further studies;
1% were engaged in self-employment;
47% were unemployed.
In respect of 4% of beneficiaries who were continuing to study full time towards another qualification, the
findings reveal:
The majority were registered with universities (41%), UoTs (26%) and TVET colleges (24%).
Almost all of those who were studying were youth aged 20-35 years.
Two main reasons for undertaking further studies that were given by beneficiaries were to increase
knowledge and understanding in the industry (50%) and to achieve a higher qualification (48%).
Among the 47% of unemployed beneficiaries, the study found:
57% had been without work for a year or more;
encouragingly, 95% of the unemployed were actively looking for work;
the main reason given by 44% of the unemployed in respect of their unemployed status was the lack
of available jobs in the labour market;
in order for us to establish the presence of reservation wage dynamics in this population, we explored
potential attitudes of beneficiaries towards work, and noted that only 3% had ever declined a job
offer.
To understand the wider effects of these interventions – social, economic and technical – on individual
beneficiaries.
The study provides evidence that beneficiaries have gained a range of skills, with more than half
(54%) indicating that the training received was highly relevant to the work they were doing.
Beneficiaries who had secured employment on a full-time basis reported earnings ranging from the
lowest at R6,000 (slightly less than double the minimum wage) to R29,000.
All reported qualitatively on impacts to their wellbeing, both personally and on their households,
resulting from access to an income.
Self-esteem and career mobility were also reported by beneficiaries as key outcomes of
participation in the learning interventions; this was supported by most beneficiaries, including
those who were unemployed.
To generate evidence of key achievements and challenges to inform the decision-making process for
senior management and accounting authority on programme delivery mechanisms, and how these can be
improved in future to ensure sustainability.
Achievements
As postulated in the literature review in section 3, the SETA’s role is to promote the employability of
beneficiaries and not necessarily directly their employment. The labour market transition analysis presented
in section 5.9 allows for it to be concluded that:
ETDP SETA has contributed significantly to the realisation of the employability outcome. When we
consider the net transitions into employment and out of unemployment, there was a 37% positive
net transition, which means that more people moved into employment than into unemployment,
as illustrated in Table 64.
Barring the influence of external factors such as the performance of the economy, one can
conclude that ETDP SETA’s learning interventions appear to be making some contribution in
facilitating the postulated transitions as per intervention ToCs.
Challenges
Administrative challenges were reported by a quarter of all beneficiaries (27%) in terms of not
receiving their certificates after completion;
About 10% of WIL beneficiaries raised concerns about aspects of the design of these learning
interventions, including insufficient resources, poor match with their placement, and poor quality
or non-existent mentoring provided by the employer.
To determine the nature of employment of learners who received employment.
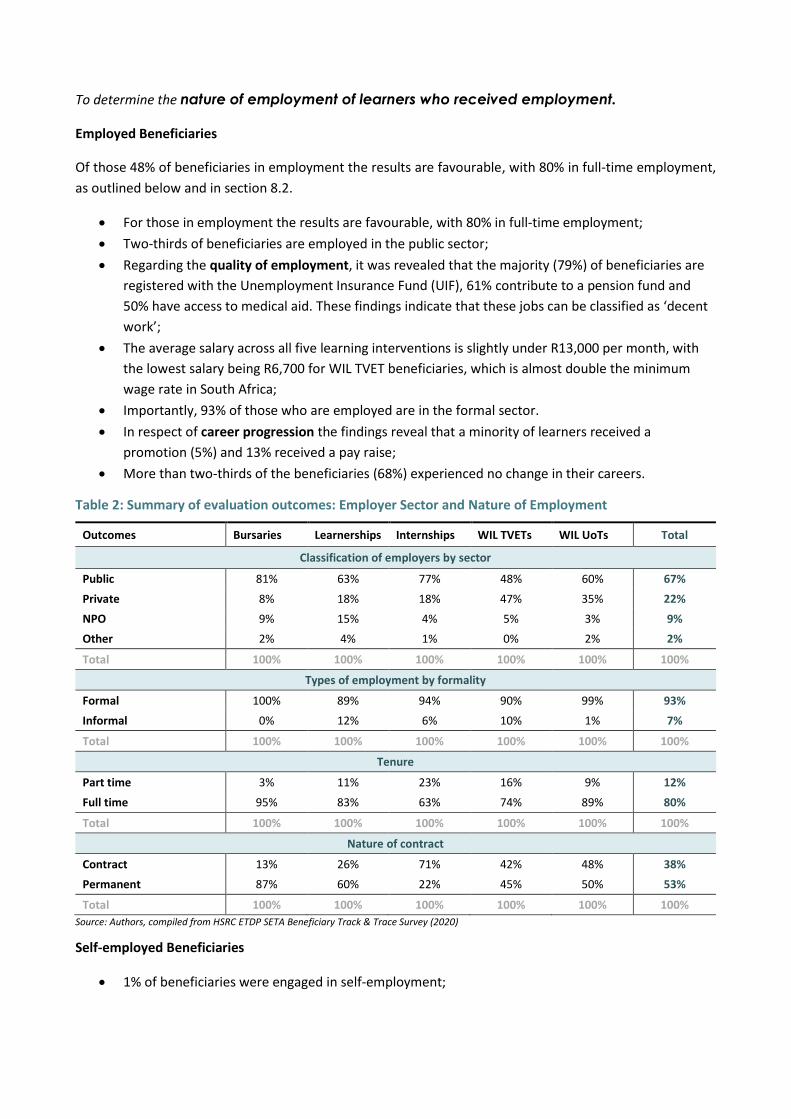
Employed Beneficiaries
Of those 48% of beneficiaries in employment the results are favourable, with 80% in full-time employment,
as outlined below and in section 8.2.
For those in employment the results are favourable, with 80% in full-time employment;
Two-thirds of beneficiaries are employed in the public sector;
Regarding the quality of employment, it was revealed that the majority (79%) of beneficiaries are
registered with the Unemployment Insurance Fund (UIF), 61% contribute to a pension fund and
50% have access to medical aid. These findings indicate that these jobs can be classified as ‘decent
work’;
The average salary across all five learning interventions is slightly under R13,000 per month, with
the lowest salary being R6,700 for WIL TVET beneficiaries, which is almost double the minimum
wage rate in South Africa;
Importantly, 93% of those who are employed are in the formal sector.
In respect of career progression the findings reveal that a minority of learners received a
promotion (5%) and 13% received a pay raise;
More than two-thirds of the beneficiaries (68%) experienced no change in their careers.
Table 2: Summary of evaluation outcomes: Employer Sector and Nature of Employment
Outcomes Bursaries Learnerships Internships WIL TVETs WIL UoTs Total
Classification of employers by sector
Public 81% 63% 77% 48% 60% 67%
Private 8% 18% 18% 47% 35% 22%
NPO 9% 15% 4% 5% 3% 9%
Other 2% 4% 1% 0% 2% 2%
Total 100% 100% 100% 100% 100% 100%
Types of employment by formality
Formal 100% 89% 94% 90% 99% 93%
Informal 0% 12% 6% 10% 1% 7%
Total 100% 100% 100% 100% 100% 100%
Tenure
Part time 3% 11% 23% 16% 9% 12%
Full time 95% 83% 63% 74% 89% 80%
Total 100% 100% 100% 100% 100% 100%
Nature of contract
Contract 13% 26% 71% 42% 48% 38%
Permanent 87% 60% 22% 45% 50% 53%
Total 100% 100% 100% 100% 100% 100%
Source: Authors, compiled from HSRC ETDP SETA Beneficiary Track & Trace Survey (2020)
Self-employed Beneficiaries
1% of beneficiaries were engaged in self-employment;

In terms of economic well-being, the study found no significant difference between those who
started a business after completion of the training programme and those who did not start a
business;
Of the beneficiaries who have started a business, youth between the ages of 20-35 years
predominate;
Most of the businesses operate informally with only 20% being VAT registered;
In assessing the economic viability of these businesses, a third of these self-employed beneficiaries
were earning less than R1,000 and just over a tenth were earning between R2,001 and R4,500 a
month.
To pilot a survey of the perceptions of employers on the value of learnerships, WIL and
internships.
Employer perspectives on the value of the learning interventions were explored in the study, and the
following was noted:
The majority of the employers (91%) highlighted that the learning interventions had served to
bridge the gap between theoretical learning and practical workplace needs, with 60% of the
employers in agreement that this was achieved to a 'great extent' and 31% in agreement that it had
achieved this to a 'moderate extent'.
Six in every ten employers (63%) were greatly in agreement that the learning intervention had
contributed to the development of multi-skilled workers.
There was overwhelming agreement by employers, with 57% noting that this was the case to a
great extent, that ‘employees who have gone through the learning interventions were more
efficient at doing their job compared to those who received no training’.
Firm productivity is an important indicator for the success of the firm, and overall a large majority
of the employers (91%) agreed that participation of employees in the learning interventions has
contributed to increased productivity in the organisation.
Regarding the impact on beneficiaries, on average employers reported that 12% of employees’
earnings had increased across all learning interventions, although a disaggregated analysis reveals
that a third of WIL UoT beneficiaries (35%) and a quarter of bursary beneficiaries’ (26%) had
reported increases in their salaries.
Conclusions
The foregoing analysis included a thorough interrogation of indicators chosen on the basis of intervention
ToCs, including the subjective assessments of the SETA’s beneficiaries of the role that the ETDP’s
interventions played in assisting them to secure employment. One can conclude that, among other factors
(both external and internal), ETDP SETA’s learning interventions appear to be making some contribution in
facilitating the postulated transitions as per intervention ToCs. Framed another way, the body of evidence
assembled here is incompatible with a hypothesis of no impact. This is more so when the socioeconomic
status of most beneficiaries is taken into consideration.
The ToC pathways have generated insights with respect to the pathways that have been confirmed and those
which are weak. It has identified intervention-specific assumptions and outcomes that need to be revised.
The ETDP SETA is to be congratulated for embracing the ToC approach to monitoring and evaluation of SETA
outcomes. To integrate and mainstream its use widely across the institution and in respect of all streams of
work, from design to implementation, monitoring and strategic decision making, is the task which now lies
ahead of them.
Recommendations
The following recommendations are therefore being put forward:
1. Design recruitment strategies to ensure that the disability equity target is met
It is evident across many government interventions that while the commitment to meeting targets regarding
people with disabilities exists, the ability to recruit is lacking. The ETDP SETA is encouraged to develop a
recruitment strategy for this group of learners, with engagements with key stakeholders, particularly people
with disabilities themselves through their representative organisations.
2. Revisit recruitment strategies in respect of demographic and socio-economic
targets for specific learning interventions
Areas which require improvement relate to increasing access to younger cohorts of learners between the
ages of 18-35 years across all interventions, and specifically for bursary beneficiaries to target youth up to
35 years of age, given that the average age of learners was found to be 32 years across all interventions and
40 years for bursary beneficiaries, as reported in section 5.3.3.
It is further proposed that the ETDP SETA review its targeting of bursary beneficiaries in relation to the ToC
in respect of providing support to high-income learners accessing bursary interventions.
SETA recruitment strategies per learning intervention need to be revisited to enable more spatial equity; for
example, where almost half of all WIL UoT beneficiaries are from the Western Cape.
3. Ensure further integration and alignment of ETDP SETA programmes within a Theory
of Change framework
The need for orientation and the mainstreaming of ToC in the projects and programmes implemented by the
ETDP SETA is highly recommended. This will involve awareness raising and the inclusion of performance
indicators to measure the effective integration of ToC in all programmes implemented by the SETA.
4. Enhance initiatives to improve learner employability
This is focused on designing and implementing interventions to strengthen employer mentoring and
supervision capabilities. Improvements in administration systems regarding the delivery of certification is
another area which will contribute to employability. ETDP SETA’s role in the supervision of placements is also
encouraged as a means of enhancing the quality of the WIL placements. In addition, attention needs to be
given to how to retain the bulk of the skilled workforce within the ETDP sector.
5. Increase employer engagements with the ETDP SETA
The relatively small number of organisations who have active engagement with the ETDP SETA needs to be
given further attention. The aim would be to increase the number of organisations who host learners and to
increase the number of learners benefitting from ETDP SETA interventions in these organisations.
6. Institutionalising evaluation studies
Enhancing the Management Information System records on learners
ETDP SETA should request an alternate number if a landline number is provided as the primary contact
number for beneficiaries in the skills intervention MIS. Given the relatively high functioning rates on cell-
phones, increasing the number of cell-phone numbers would greatly increase the overall response rate. In
general, this calls for overall improvements to the SETMIS database.
Informing learners about such research studies and requesting their participation during
induction
Increasing numbers of studies of this nature will be required. It is unclear whether learners are advised in the
contracts they sign that they might be called upon to participate in such studies. Even if this is the case, it is
evident from the responses that most participants did not remember this. It is recommended that
guidebooks or manuals as well as the contract document indicate that such requests will arise, to ensure that
learners understand the value of such studies and are thus motivated to participate. This could be reinforced
in orientation sessions and forums where learners meet with the ETDP SETA. In addition, newsletters, social
media and other related platforms should be utilised to communicate more widely about these surveys.
Employer awareness of role of SETAs
It is recommended that SETAs in general and the ETDP SETA more specifically work with the Human
Resources Departments of employer bodies to facilitate increased awareness of the role of SETAs, and the
importance of participation in such studies among the managers at these institutions, beyond those in the
Human Resources Departments.
1 Introduction
1.1 Background
Addressing skills deficits continues to be a major concern for South Africa (SA) within a context of
unprecedented levels of poverty, unemployment and inequality. While economic growth remains subdued,
the labour market is not able to absorb the rapidly expanding supply of workers, particularly young workers.
Globally there is recognition of the crucial contribution that a skilled workforce plays in advancing economic
transformation (World Bank, 2018).
In SA the Sector Education and Training Authorities (SETAs) were established to ensure and facilitate the
development of skills in relation to sectoral-relevant identified skills needs. As the key institutions which
mediate between education and work, SETAs are responsible for the development of a skills pipeline through
promoting and supporting awarding of bursaries, learnerships, apprenticeships, work-integrated learning
(WIL) and internships (Skills Development Act 97 of 1998). As one of 21 SETAs in SA, the Education, Training
and Development Practices (ETDP) SETA has been instrumental in implementing a range of learning
interventions to facilitate the development of skills in relation to sector-identified skills needs.
One of the main highlights of the National Skills Development Strategy III (NSDS III) (Department of Higher
Education and Training [DHET], 2011) is the observation that there needs to be less focus on numerical
targets (outputs or numbers in the post-school education and training (PSET) system), and more focus on
outcomes and impact. The SETAs and the DHET are now increasingly required to answer questions that relate
to outcomes and impacts (particularly labour market outcomes) of the programmes implemented.
Critical to theory-based evaluations is the construction of a theory of change (ToC) as the entry-point for an
evaluation study, which provides a way of delineating pathways through which SETA-funded interventions
achieve their impact. This has led to a reconsideration of the types of information required to assess the
extent to which learning activities are successful and effective.
The HSRC therefore understands the need for commissioning of the ETDP SETA’s Tracer Evaluation Study as
arising from this broader context. The Evaluation study focuses on five learning interventions implemented
by the ETDP SETA between the 2015/16 and 2018/19 financial period: bursaries, learnerships, internships,
and WIL interventions with Technical and Vocational Education and Training institutions (TVETs) and
Universities of Technology (UoTs).
The study is aimed at generating information on the outcomes of learners after completion of their learning
intervention, progress with respect to income and career progression, skills development, and relevance of
a skilled workforce for employers and its contribution to productivity and growth of the economy. The
findings generated are expected to assist the ETDP SETA in understanding the value and relevance of the
interventions implemented, identifying areas requiring improvement and supporting evidence-informed
planning and decision making.
1.2 Study Purpose and Objectives
The Terms of Reference (ToR) outline the study purpose, objectives and scope of the study, as listed below.
Purpose
To understand, explore and document key features, trends, challenges and outcomes of the skills
interventions in the ETDP sectors.
To assist in further developing a sustainable skills development strategy for the ETDP SETA, which
will contribute positively to the ETDP sectors and promote inclusive economic growth in the
country.
The primary focus of the study is to understand the outcomes of programmes through the tracking
and tracing of learners who have been supported by the SETA.
The main purpose of the assignment will be to provide the SETA with information regarding the
activities of learners who have completed these programmes.
To determine whether a programme is achieving its mission and assist in demonstrating the
programme’s outcomes by assessing the following:
o Employment status (employed, self-employed and unemployed);
o Employment rates; and
o Nature of employment in terms of employment sector or types of employment (e.g. formal
or informal), tenure (part time or full time, contract or permanent), salary level, benefits
(Unemployment Insurance Fund (UIF), pension, medical aid, allowances).
Objectives of the study
The objectives of the study are:
To gather data about the effectiveness and impacts of the skills development interventions
indicated above. The impacts could be direct or indirect, intended or unintended.
To understand the wider effects of these interventions – social, economic and technical – on
individual beneficiaries.
To generate evidence of key achievements and challenges to inform the decision-making process
for senior management and accounting authority on programme delivery mechanisms, and how
these can be improved in future to ensure sustainability.
To determine the nature of employment of learners who received employment.
To pilot a survey of the perceptions of employers on the value of learnerships, WIL and
internships.
1.3 Research questions
The research questions pertaining to this study as listed in the ToR are as follows:
What are destinations of students who completed?
o Are they employed?
o Are they not working?
o Are they studying further?
If employed:
o Where are they employed (name of the company/organisation)?
o What is their occupation?
o Has there been a change in jobs since completing the learning programme?
o After the programme has there been a difference in rank/post level?
o Are they employed full time or part time and temporarily or on contract?
o What are their wages?
o What benefits and allowances are they receiving?
If not in employment, why?
o Are they studying full time?
o Are they looking for employment?
o Are they Ill?
o Are they looking after parents, siblings?
1.4 Scope of work
The scope of work required in achieving the objectives above included conducting an empirical study on
tracking and tracing learners, by interviewing 100% population of learners who completed learnerships, WIL,
internships and bursaries, with a response rate of between 40% and 60%.
The activities aligned to the scope of work included designing instruments for both the beneficiary survey
and employer interview, undertaking the survey using computer-assisted telephonic interviews, conducting
20 employer interviews telephonically and producing a report on the findings. The development of
instruments was informed by a literature review. An important component of the scope of work was the
reconstruction of the Theory of Change and results chain log-frame for each of the learning interventions.
1.5 Structure of the report
Section 2 of this report provides a brief description of the ETDP SETA and the five learning interventions. In
section 3 a review of the literature is presented, with a conceptual framework which provides context for the
analysis of the post-school to work transition, and the drivers of effectiveness of learning interventions which
are the focus of this study. This is followed by section 4, which presents the study methodology including the
reconstructed ToCs, and the analytical framework which outlines the transition process from school to work,
identifying the factors which influence outcome determinants. Section 5 presents results from the
Beneficiary Survey, and section 6 presents the findings from the Employer Survey. Section 7 presents findings
in respect of the pathways through which change was intended to be realised, and the concluding section 8
summarises key findings in relation to the study objectives and presents recommendations for enhancement
of the interventions.
2 Description of the ETDP SETA Programme and Learning
Interventions
2.1 Overview of the ETDP SETA
The ETDP SETA is one of 21 SETAs, 18 of which were originally established in 2000, and was re-established by
the Minister for Higher Education and Training in 2019 with no changes for the period 01 April 2020 to 31
March 2030. As outlined in the ETDP SETA Final Strategic Plan 2015-2020 (ETDP SETA, 2019, p. 8) its vision is:
To promote and facilitate the development and improvement of the skills profile of the sector’s
workforce in order to benefit employers, workers and employees in the sector.
The ETDP SETA mission statement which seeks to realise this vision is to promote and facilitate education,
training and development whereby:
Workforce skills levels are raised;
A variety of career paths are available;
Supply and demand in the labour market is balanced;
Quality of education and training provided is improved;
The levy grant scheme is efficiently administered;
Effective communication channels are in place, both internally and externally;
Liaison with key sector stakeholders, including other SETAs, the DHET, National Skills Authority, and
Quality Council among others, is timeous and appropriate;
Efficient service delivery is encouraged; and
Employers, workers and employees in the sector benefit from quality training, higher productivity
and harmonious mutual dependence.
The ETDP SETA’s role in respect of upskilling the workforce through reducing the scarce and critical skills gaps
in the sector is guided by the Medium Term Strategic Framework 2014-2019 which sets out its priorities, with
Outcome 5 directly informing the work of ETDP SETA (Republic of South Africa (RSA), 2019, p. 22):
Outcome 5: Skilled and capable workforce to support an inclusive growth path
The ETDP SETA translated this imperative in its Strategic Outcome (SO) Goals 3, 4, 5 and 6 namely:
SO 3: Skilled personnel to improve teaching and learning;
SO 4: Increased number of undergraduates and graduates who successfully enter the PSET system
and the labour market;
SO 5: Increased human and institutional capacity within the non-schooling and post-schooling ETDP
SETA constituencies; and
SO 6: Improved quality of graduates of skills programmes in the ETD sector to satisfy qualification
needs of the ETD sector by March 2020.
The ETDP SETA has a diverse scope of coverage, with 17 Standard Industrial Classifications (SIC codes) which
indicate the area of economic activity (ETDP SETA, 2019). These have been organised around 14 subsectors
that fall within its mandate, as reflected in Figure 1 below.
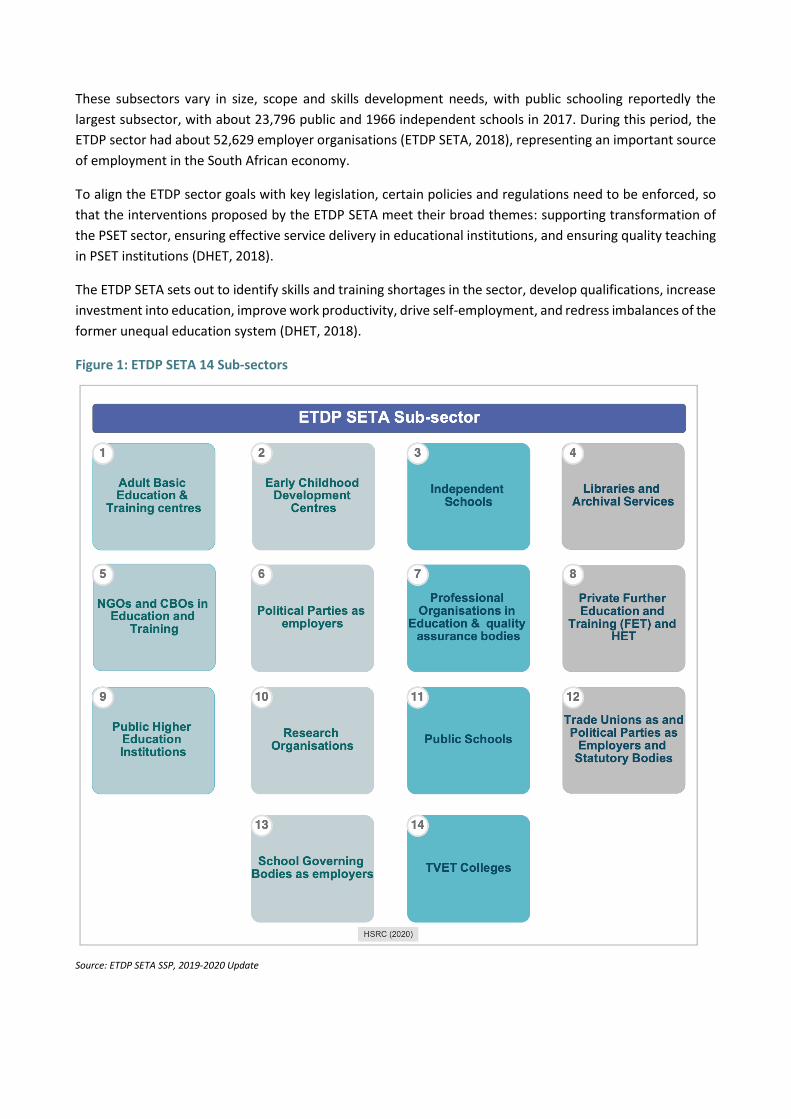
These subsectors vary in size, scope and skills development needs, with public schooling reportedly the
largest subsector, with about 23,796 public and 1966 independent schools in 2017. During this period, the
ETDP sector had about 52,629 employer organisations (ETDP SETA, 2018), representing an important source
of employment in the South African economy.
To align the ETDP sector goals with key legislation, certain policies and regulations need to be enforced, so
that the interventions proposed by the ETDP SETA meet their broad themes: supporting transformation of
the PSET sector, ensuring effective service delivery in educational institutions, and ensuring quality teaching
in PSET institutions (DHET, 2018).
The ETDP SETA sets out to identify skills and training shortages in the sector, develop qualifications, increase
investment into education, improve work productivity, drive self-employment, and redress imbalances of the
former unequal education system (DHET, 2018).
Figure 1: ETDP SETA 14 Sub-sectors
Source: ETDP SETA SSP, 2019-2020 Update
2.2 Description of the ETDP SETA learning interventions
The five learning interventions, which are the focus of this evaluation, are among the many interventions
implemented by the SETA in order to achieve its mandate. These include bursaries, internships, learnerships
and WIL for TVETs and UoTs. This section provides a brief description of each of the learning interventions
including their objective, target and operational modalities.
Bursary Intervention
2.2.1.1 Objective of the learning Intervention
The core objective of a bursary programme is that it promotes wider access for previously disadvantaged
learners to higher education and to address skills shortages within the sector and more widely across SA.
Through the awarding of bursaries, the ETDP SETA aims to ensure a continuous and increased supply of a
skilled workforce in the sector of identified scarce occupations and skills as well as to improve service delivery
in the public sector. Awarding of bursaries seeks to provide unemployed youth with an opportunity to gain a
qualification (ETDP SETA, 2016, p. 50) and for employed beneficiaries to enhance their qualifications and
skills. Awarding of bursaries to employees in a firm in the ETDP sector is aimed at encouraging employers to
contribute to skills development, particularly in the area of scarce skills required by that firm.
2.2.1.2 Description of the intervention
Bursaries are awarded to employed and unemployed learners to access higher education and technical
vocational training. Learners who are awarded bursaries are assumed to be registered for further studies
with a relevant HEI. The career prospects of bursary holders are expected to be enhanced at the termination
of the programme; likewise, the skills acquired are expected to promote mid- and high-level skills for the
sector. The focus on improving soft skills includes those related to management, leadership and relationship
building (INSETA, 2020a).
Table 3: Bursary grant targets
Target Description
Bursaries for unemployed learners
This is a monetary award made to institutions. The SETA awards bursaries for one year, renewed annually, based on progress. This intervention is a grant awarded to unemployed learners enrolled in part or full qualifications registered on the National Qualification Framework (NQF).
Bursaries for employed learners
This is a monetary award made to employed learners. This intervention is a grant awarded to employed learners enrolled in part or full qualifications registered on the NQF.
Source: ETDP SETA (2016)
Recruitment of bursary recipients is through engagement with social partners and interactions with
employers and specific constituencies targeted by that SETA.
The ETDP SETA targets bursaries for the following scarce skills:
Bachelor of Education in Maths and Science;
Bachelor of Commerce;

Bachelor of Science in Applied Mathematics;
Master’s in Commerce;
Computer Studies
Public Finance; and
Advanced Certificate of Education in Leadership and Management.
Implementation of the bursary intervention entails activities such as:
Registering the bursary recipient onto the ETDP SETA Management Information System (MIS); and
Issuing of a Purchase Order to facilitate transfer of funds to the recipient.
Support for the learner through two learner support meetings hosted annually; and
The hosting of stakeholder meetings at regular intervals.
SETA-funded bursaries cover fees for the course and in some instances other related costs. ETDP SETA
indicates that its bursary values are linked to the NQF level, with NQF level 7 receiving R50,000.00, which
increases by R5,000.00 for each subsequent NQF level (8 and 9).
Key stakeholders in respect of the bursary intervention include ETDP officials such as the Provincial Managers
and Project Coordinators. External stakeholders are officials from universities; and TVETs (ETDP SETA, n.d.-
a).
Learnership
2.2.2.1 Objective of the learning Intervention
A learnership is a work-based experiential learning intervention, which enables the learner to acquire an
NQF-registered qualification associated with a specific qualification, trade or profession, while gaining work
experience. Its value lies in the fact that learners who are unable to engage in full-time study are provided
with an opportunity to work and learn at the same time. Learnerships aim to redress the unequal access to
education, training and employment opportunities, as well as skills shortages in the labour market for a
specific competency.
2.2.2.2 Description of the intervention
A learnership comprises structured and practical work-based learning and structured theoretical training.
The manner in which the programme is split involves 30% theoretical learning and 70% practical work
experience with a mentor to guide the process. Learnerships are managed by the ETDP SETA and involve the
commitment of three stakeholders: the learner, the employer and the training provider. The roles and
functions of each of these stakeholders are outlined in a written agreement.
The learner enters a contract with the employer for a fixed period, whilst at the same time studying towards
the qualification the duration of which is predefined. The formal learning component is delivered by an
accredited skills development service provider and includes an assessment component (ETDP SETA, n.d.-d).
A learnership is designed to provide the learner with a variety of skills that include technical, work-specific
and life skills such as communication and teamwork skills (SASSETA, 2019b).
Table 4: Learnership grant targets
Targets Description
Learnership for Unemployed Workers Programme
This is a structured learning programme over a maximum period of 18 months for unemployed learners. It includes theoretical and practical workplace experiential learning and leads to an occupationally related qualification registered on the NQF. It includes a stipend for the learner.
Learnership for Employed Workers Programme
This is a structured learning programme over a period of 12 months for employed learners. It includes theoretical and practical workplace experiential learning and leads to an occupationally related qualification registered on the NQF.
Source: ETDP SETA (2016b)
The funding from the ETDP SETA covers the cost of the training as well as an allowance for the learner for
the duration of the learnership, if that learner is unemployed. The learnership is targeted at unemployed and
employed beneficiaries but employed beneficiaries do not receive an allowance. During the learnership the
learner attends a prescribed number of classroom sessions. The maximum period of a learnership is 18
months (ETDP SETA, n.d.-d).
Key activities undertaken in respect of the learnership intervention include:
Appointment of a training provider, facilitation of training as well as the assessment, moderation
and verification of the training programme.
The learner must sign an employment contract and a learning agreement.
Regular attendance by the learner at contact sessions, in line with the notional contact hours of
learning required to achieve a specific qualification.
During the learnership the learner will be expected to submit assignments and undertake practical
tasks and projects and keep timesheets which are signed off by the mentor and submitted to the
SETA monthly. The learner is also expected to maintain a logbook/portfolio of evidence for the
duration of the intervention.
The host employer must provide a job description and assign a mentor for the duration of the
learnership. In addition, the employer must induct the learner with respect to workplace policies
and procedures.
In respect of management of the contract, service level agreements will have to be signed, project
deliverables are timeously submitted, and funds are disbursed accordingly.
The SETA is also responsible for hosting stakeholder meetings at regular intervals to monitor
progress in implementation.
Stakeholders who need to be engaged in this initiative include ETDP SETA officials, training providers, host
employers, learners, ETQA officers and officials from the ETDQA unit (ETDP SETA, n.d.-d).
Internships
2.2.3.1 Objectives of learning intervention
An internship is a structured programme targeted at university and UoT graduates aimed at giving such
graduates an opportunity to build on their qualifications by exposure to structured workplace experience.
Exposure to workplace experience empowers unemployed graduates with practical knowledge
commensurate with their qualification (ETDP SETA, 2017c).

2.2.3.2 Description of the intervention
The ETDP SETA’s focus is on work experience in areas of scarce and/or critical skills in the sector, with the
internship providing graduates an opportunity to apply their knowledge in real situations (Table 5). The
internship is a full-time placement with an institution (government or private sector). The skills gained from
internships, as noted by Ismail (2018), are interpersonal, confidence, self-efficacy and professionalism.
Table 5: Internship programme targets
Targets Description
Internships Programme This is a 12-month workplace experience programme designed for unemployed learners who have already completed an NQF level 5 to 8 qualification at a university or UoT that is relevant to employment but have not yet gathered the necessary practical experience to enable them to obtain employment.
Source: ETDP SETA (2017b)
The target group is unemployed people, giving them up to 12 months’ work experience (ETDP SETA, 2017c).
Internships are focused on continuous development and are aligned to the specific qualification which the
learner has achieved, namely:
National Senior Certificate level
Diploma
National first degree
Honours degree
Master’s degree
PhD
The value of the stipend that is paid is linked to the specific qualification that the graduate has acquired. The
ETDP SETA’s internships are targeted to unemployed beneficiaries only, with the grant value being
disaggregated by the qualification level, from National Senior Certificate up to PhD. A stipend is paid to the
beneficiary on a monthly basis, at R2,500 per month at National Senior Certificate level up to R6,500 per
month at PhD level.
In order to motivate employers to provide internship opportunities, two types of internship grants are paid:
A grant to cover the costs of the training service provider;
Another grant to cover the stipend of the learner.
In addition, a third specific grant is provided to learners with a disability, of an additional R5,000
per year.
The employer is expected to provide a designated mentor for the graduate. On completion of the internship,
the learner receives a Letter of Recognition from the host employer. The benefit for the employer of hosting
an intern is that they have an opportunity to assess the intern to see if they are employable, enhancing the
possibility of that individual securing a permanent job. Key activities involved in an Internship include:
Recruitment of beneficiaries through engagements with constituencies;
Identification of potential employers for the graduate;
Signing of learner agreements between the learner, SETA and the employer;
Capturing of the learner's information on the SETA MIS;
Induction of mentors and coaches on what is expected of them;
Induction of learner to the workplace policies and procedures;
Provision of tax incentives to employers;
Payment of the stipend to the intern;
Production of timesheets and maintenance of logbooks/portfolios of evidence; and
Student support meetings held, and student monitoring visits undertaken.
Key stakeholders involved here are the unemployed graduate (potential employee), the host company
(potential employer), and the ETDP SETA (ETDP SETA, 2017c).
Work-integrated Learning (TVETs)
2.2.4.1 Objectives of the learning intervention
The aim of the ETDP SETA WIL TVET intervention is to provide TVET learners with access to structured
workplace experience in the relevant sectors. This is expected to serve as a springboard for access to
employment or to becoming self-employed. It is expected that through the WIL exposure, graduates will
acquire relevant attributes and work-related competencies. TVETs’ training duration is generally three years
for a certificate, with the focus on educating and training students to work in technical or vocational fields.
In some instances a graduate from a TVET may be able to continue further studies in a UoT.
2.2.4.2 Description of the learning intervention
Access to WIL enables TVET learners to meet curriculum requirements in order to complete their studies and
achieve a relevant qualification (Table 6). The maximum duration of a WIL placement is 18 months. The
expectation is that once they have had such workplace exposure, the learner will be able to complete a
qualification in order to secure employment more easily or become self-employed (ETDP SETA, n.d.-c).
Table 6: Work-integrated learning TVET college placement targets
Targets Description
WIL – Technical and Vocational Education and Training
This is a 12–18-month workplace experience programme designed for candidates who have completed a National Accredited Technical Education Diploma 6 qualification and require compulsory work experience in order to obtain their qualification. It is targeted at marginalised groups, including women, youth and people with disabilities
Source: ETDP SETA (n.d.-b)
Key activities related to WIL include:
Registering of the learner on the ETDP SETA MIS;
Identification of host employers and securing their commitment to hosting the learner through a
formal Memorandum of Agreement;
Issuing of Purchase Orders to enable payment of a stipend to the learner;
The workplace where the learner is placed is expected to have appropriate equipment and facilities
as required, and deemed to be ready and suitable;
A clearly defined job description has to be provided for the learner so that they are aware of what
to expect, and that the placement fulfils the need of providing relevant experience to the learner;
The host employer is expected to nominate a mentor, who will oversee the placement and provide
onsite mentoring and training of the learner;
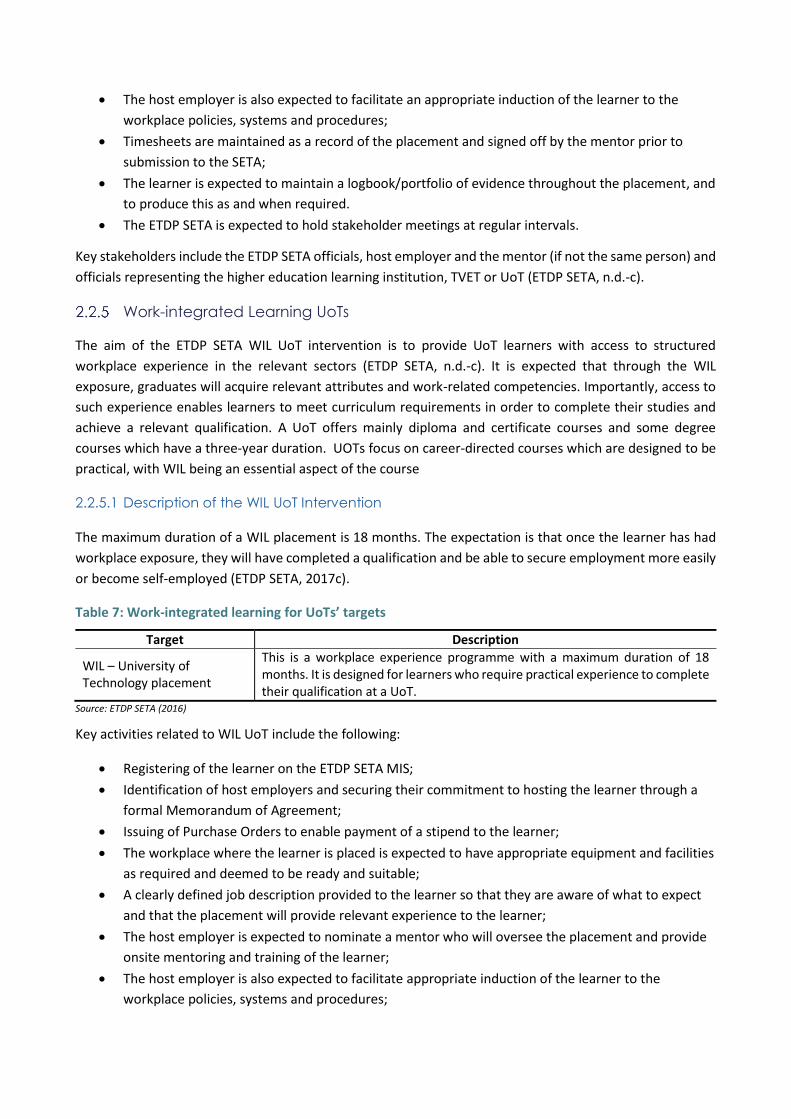
The host employer is also expected to facilitate an appropriate induction of the learner to the
workplace policies, systems and procedures;
Timesheets are maintained as a record of the placement and signed off by the mentor prior to
submission to the SETA;
The learner is expected to maintain a logbook/portfolio of evidence throughout the placement, and
to produce this as and when required.
The ETDP SETA is expected to hold stakeholder meetings at regular intervals.
Key stakeholders include the ETDP SETA officials, host employer and the mentor (if not the same person) and
officials representing the higher education learning institution, TVET or UoT (ETDP SETA, n.d.-c).
Work-integrated Learning UoTs
The aim of the ETDP SETA WIL UoT intervention is to provide UoT learners with access to structured
workplace experience in the relevant sectors (ETDP SETA, n.d.-c). It is expected that through the WIL
exposure, graduates will acquire relevant attributes and work-related competencies. Importantly, access to
such experience enables learners to meet curriculum requirements in order to complete their studies and
achieve a relevant qualification. A UoT offers mainly diploma and certificate courses and some degree
courses which have a three-year duration. UOTs focus on career-directed courses which are designed to be
practical, with WIL being an essential aspect of the course
2.2.5.1 Description of the WIL UoT Intervention
The maximum duration of a WIL placement is 18 months. The expectation is that once the learner has had
workplace exposure, they will have completed a qualification and be able to secure employment more easily
or become self-employed (ETDP SETA, 2017c).
Table 7: Work-integrated learning for UoTs’ targets
Target Description
WIL – University of Technology placement
This is a workplace experience programme with a maximum duration of 18 months. It is designed for learners who require practical experience to complete their qualification at a UoT.
Source: ETDP SETA (2016)
Key activities related to WIL UoT include the following:
Registering of the learner on the ETDP SETA MIS;
Identification of host employers and securing their commitment to hosting the learner through a
formal Memorandum of Agreement;
Issuing of Purchase Orders to enable payment of a stipend to the learner;
The workplace where the learner is placed is expected to have appropriate equipment and facilities
as required and deemed to be ready and suitable;
A clearly defined job description provided to the learner so that they are aware of what to expect
and that the placement will provide relevant experience to the learner;
The host employer is expected to nominate a mentor who will oversee the placement and provide
onsite mentoring and training of the learner;
The host employer is also expected to facilitate appropriate induction of the learner to the
workplace policies, systems and procedures;

Timesheets are maintained as a record of the placement and signed off by the mentor prior to
submission to the SETA;
The learner is expected to maintain a logbook/portfolio of evidence throughout the placement and
to produce this as and when required.
The ETDP SETA is expected to hold stakeholder meetings at regular intervals.
Key stakeholders include the ETDP SETA officials, host employer and the mentor (if not the same person) and
officials representing the higher education learning institution, either TVET or UoT (ETDP SETA, n.d.-c). The
skills developed through the WIL include technical, business and soft skills, with a focus on motivational,
interpersonal, maturity and confidence skills (DHET, 2013a).
3 Literature Review: School to Work Transitions (STWT)
3.1 Introduction
“A bad start to a young person’s working life has immediate and long lasting economic, personal
and social costs” (Bradley & Nguyen, 2004, p. 513).
The long-standing links between education, inequality and social mobility call for an in-depth investigation
of the nature and character of transitions, especially of youth from school to work, and particularly in a
developing country like SA. Nilsson (2019, p. 746) broadly describes the “school to work transitions as that
period in time during which an individual leaves school and finds suitable employment”. A more nuanced
definition is provided by Mastercard Foundation, where the school to work transition is understood as a
“process during which youth shift from being predominantly in an educational environment, to more
permanently either looking for, being available for or starting a job, to gradually improving their livelihood”
(Mastercard, 2019). In the same vein, Alam and De Diego (2019) define STWT also as a process "that enable
young people (aged 15-24) to move easily from initial education to productive and decent work". The authors
also identify two key central elements of this process: 1) preparing young people for the transition (where
skills for work, qualifications, knowledge, competencies and values are developed), and 2) making the actual
transition (finding productive and decent work opportunities that make use of the skills developed).
In the absence of a common definition of school to work transitions (STWT), there is also no agreement on
when exactly transitions begin or end. For instance, the International Labour Organisation (ILO) argues that
transitions begin upon graduation, and from the first economic activity. However, Nilsson (2019) concurs
with Alam and De Diego (2019) that transitions could begin even before leaving school or graduation.
According to the ILO (2009) a completed transition relates to finding 'regular or satisfactory' employment.
Importantly for the ILO, quality of employment matters, and considers a number of workplace experience
indicators, including job stability, type of contract and job satisfaction (ILO, 2009). Nguyen and colleagues
(2010, p. 32) of the National Centre for Vocational Education Research also opt for a narrow definition:
… the main outcome of youth transitions is for school leavers to attain the state of employment, as
opposed to unemployment or non-participation in the labour force. However, if we are to accept
that the appropriate objective function is to maximise welfare, a richer set of considerations should
be considered. This will encompass questions of the quality of employment. Some commonly
identified dimensions of job quality include earnings, skill levels, job security, training and
promotion opportunities, flexibility, self-assessed job satisfaction and ‘vocational congruence’
‘Youth’ is perceived as the right time to invest in education and training, and that is where most countries
have institutionalised arrangements to facilitate entry into educational and vocational programmes to
facilitate smooth transitions into employment or possible entrepreneurship. A lack of training or entry into
skilled occupations is associated with negative future employment (Bradley & Nguyen, 2004) and earning
outcomes. Youth bulges in developing countries present both an opportunity (demographic dividend) and a
threat if youth do not transition into decent employment or sustainable livelihoods (Nilsson, 2019; Alam &
De Diego, 2019).
While there are a number of models that are used to frame STWT, Bradley and Nguyen (2004) identify the
human capital theory as the most widely used framework for investigating STWT. In this theory, education is
perceived as an investment decision made by young people, who therefore choose to either continue
investing more in their education or training beyond current levels of education, or to stop investing in formal
schooling and enter the labour market (Bradley & Nguyen, 2004, p. 486).
Human capital theory further suggests that choices made by young people are informed by an assessment
of whether the value of the intended benefits of education and training in the future is greater than the
current costs which are linked to enrolment in education. Such costs include fees, books, subsistence and
accommodation, and even potential loss of foregone incomes, together with the non-monetised costs and
benefits of engaging in education and training (Bradley & Nguyen, 2004).
An important observation made by human capital theorists is that family background and individual ability
are important mediating factors in young people’s decision to invest in further education. This is explained
by the fact that individuals from better-off families incur lower relative costs in making such an investment.
3.2 Conceptual framework: Factors influencing school to work
transitions
Globally, STWT have become non-linear, extended and more uncertain. As such it is important to look at the
factors responsible for smooth or broken transitions. The literature focusing on transitions from secondary
school into the world of work has grouped these factors into individual, institutional (school-related or higher
education and training variables) and labour market context. A useful framework below demonstrates a
three-staged transition process, where internal factors (e.g. gender, race, individual ability) and external
factors (e.g. macro-economic environment, institutional and school characteristics and labour market
policies) interact with the educational system and indirectly influence STWT outcome determinants (Nilsson,
2019). These factors are explained further in the next section. Here (Figure 2) individuals begin school and
end with an 'achieved transition'. Nilsson’s work is aimed at bridging the knowledge gap on STWT, which has
been largely based on evidence from high-income countries, through extensively reviewing evidence from
developing countries to inform his framework (Nilsson, 2019).
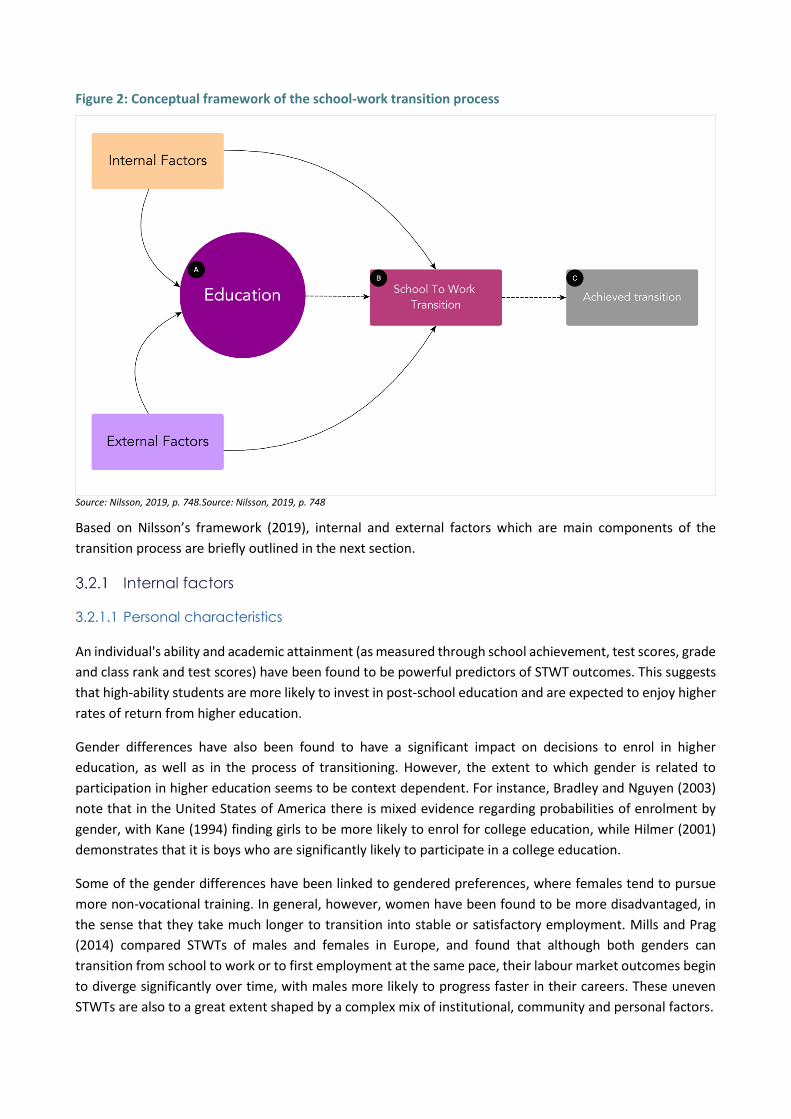
Figure 2: Conceptual framework of the school-work transition process
Source: Nilsson, 2019, p. 748.Source: Nilsson, 2019, p. 748
Based on Nilsson’s framework (2019), internal and external factors which are main components of the
transition process are briefly outlined in the next section.
Internal factors
3.2.1.1 Personal characteristics
An individual's ability and academic attainment (as measured through school achievement, test scores, grade
and class rank and test scores) have been found to be powerful predictors of STWT outcomes. This suggests
that high-ability students are more likely to invest in post-school education and are expected to enjoy higher
rates of return from higher education.
Gender differences have also been found to have a significant impact on decisions to enrol in higher
education, as well as in the process of transitioning. However, the extent to which gender is related to
participation in higher education seems to be context dependent. For instance, Bradley and Nguyen (2003)
note that in the United States of America there is mixed evidence regarding probabilities of enrolment by
gender, with Kane (1994) finding girls to be more likely to enrol for college education, while Hilmer (2001)
demonstrates that it is boys who are significantly likely to participate in a college education.
Some of the gender differences have been linked to gendered preferences, where females tend to pursue
more non-vocational training. In general, however, women have been found to be more disadvantaged, in
the sense that they take much longer to transition into stable or satisfactory employment. Mills and Prag
(2014) compared STWTs of males and females in Europe, and found that although both genders can
transition from school to work or to first employment at the same pace, their labour market outcomes begin
to diverge significantly over time, with males more likely to progress faster in their careers. These uneven
STWTs are also to a great extent shaped by a complex mix of institutional, community and personal factors.
Differences by race and ethnicity in attending post-school education and its impact on overall STWTs has also
been investigated. Counter to the expectation that students from ethnic minority groups are less likely to
pursue post-compulsory education than their white counterparts, because of poor socioeconomic
backgrounds, there is significant empirical evidence suggesting that young people from ethnic minorities are
more likely to transition into higher education and training. Some of this evidence (Ellwood & Kane, 2000)
suggests that Black and Hispanic high school graduates in the United States of America were more likely to
attend college. However, whilst Desjardien et al. (1999) did not find any evidence of ethnic differences, more
'able' high school graduates were found to proceed to attend college, no matter the ethnic group.
Looking closely into STWTs, Bradley and Taylor (2002) investigated racial differences in the further education
and training participation rates, employment, and unemployment; they found that although non-white
students are less likely to enter the labour market, they are more likely than their white counterparts to
participate in further education. Higher probabilities of participation in post-compulsory education are then
attributed to fear of racial discrimination when attempting to access the labour market.
The influence of family background factors has also been noted in literature. This includes parental education
and occupation, family income, and family size and structure. Apart from possibilities of intellectual heredity,
it is expected that the more educated the parent is, the greater the chances of investing in their children’s
education. Furthermore, social class speaks to economic support and the availability of resources to finance
education. Family or the household serves as an important network (Nilsson, 2019) which is useful for job
search processes as well as career guidance. Personal contacts also represent an important job search
channel, as is the case in SA. However, families as institutions can also transmit a social disadvantage
associated with inferior labour market outcomes, thus reinforcing social inequalities (Iannelli, 2003, in Kogan
& Muller, 2003).
Specifically, in the South African context there is growing literature demonstrating how some of these
internal factors, such as school performance, race, gender, family background or social class, shape education
and employment outcomes (Haroon Bhorat et al., 2017; Case et al., 2018; Fongwa et al., 2018; Rogan &
Reynolds, 2016). SA has a dualistic public schooling system which produces very diverse educational
outcomes: on one hand a better-performing segment serves the affluent minority, and on the other hand
the majority of learners, who are largely from poor households, are serviced by a less efficient segment of
the system (Fleisch, 2008). Based on the TIMSS 2015 results, Reddy, Juan, Fongwa and Isdale (2019) found
that almost 80% of Grade 9 leaners in no fee paying (quintiles 1, 2 and 3) schools (largely Black) did not meet
the minimum knowledge and skills benchmark of 400 points, compared to 38% in fee-paying (quantile 4 and
5) schools.
Wide gaps in the educational achievement of children from different socioeconomic status backgrounds
demonstrate the association between type of school attended and the learner’s socioeconomic background.
Moses, Berg, and Rich (2017) report that according to the Stats SA Community Survey of 2016, children with
parents who had higher education levels were more likely to achieve upward educational mobility. While
most white youth with post-secondary qualifications had parents with a similar qualification, 56%
intergenerational transmission of similar qualifications was achieved by 28% of coloured, 27% of Indian and
24% of African youth (Stats SA, 2017, p. 87). In general, learners from well-off families enjoy favourable
educational outcomes as they are more than likely to finish primary school on time, reach matric, pursue a
university education and find employment (Moses et al., 2017). Learning outcomes at the lower levels of
schooling influences the type of subjects selected as well as the choice of HEI, which all later influence
employment prospects (through securing employment and earnings) and life chances.
Gender differences are also evident in as far as school and higher education participation is concerned, and
these patterns have a bearing on subsequent patterns of transitions. Pointing to the female advantage, some
studies (Broekhuizen & Spaull, 2017; Spaull & Makaluza, 2019) show that girls consistently enjoy superior
academic achievement through schooling and higher education, and are less likely to repeat a grade and
drop out of school. However, Bhorat et al. (2017) suggest that girls lose the advantage when they reach the
labour market, as can be seen from their poor labour market outcomes, and this is strongly mediated by race
(Espi et al., 2019).
External factors
3.2.2.1 Institutional or school-related factors
School-related variables have also been found to have an influence on transitions in postsecondary schooling
and training. Particularly in the literature from the United Kingdom, the broad finding is that students from
selected schools are more likely to make transitions in further education and training than students from
comprehensive schools (Bradley & Taylor, 2002). This is a very important factor in South Africa, considering
the heterogenous nature of the schooling and the PSET system which offer very varied educational quality,
resulting in diverse education and labour market outcomes. In this context, the type of school, and higher
education and training institution (such as higher education institutions (HEIs), or TVET colleges) attended
significantly affects the individual’s labour market outcomes.
Although in general graduates have much lower unemployment rates than non-graduates, studies looking at
their employment trajectories show that the institution where one obtains the qualification matters.
Generally, university graduates have: 1) better employment prospects than graduates from other institutions
such as TVET colleges (Lehohla, 2017; Van Broekhuizen, 2016; van der Berg & van Broekhuizen, 2012); and
2) enjoy better financial returns compared to the diplomates3 (Branson et al., 2009, in Wildschut, Mncwango,
Rogan, Rust, & Fongwa, 2018). Furthermore, TVETs are perceived as an inferior option by both learners and
employers (Lehohla, 2017; Ismail & Mujuru, 2020).
The type of university attended also influences employment prospects. Rogan and Reynolds (2016)
conducted a graduate tracer study in the Eastern Cape and found that students who obtained degrees from
Black or historically disadvantaged universities are more likely to be unemployed. Poor employment
prospects of graduates from historically disadvantaged universities have been attributed to a number of
factors, including employer bias and lack of social networks on the part of graduates. Walker and Fongwa
(2017) also argued that the university’s status and reputation matter, as the major private sector employers
expressed preference of students from historically White universities.
3.2.2.2 The Macroeconomic Environment
Ryan (1999) observes another important determinant of STWTs and outcomes – the state of the economy,
and more specifically the number of decent jobs available in a given economy. The economies of low-income
countries are not growing quickly enough to absorb the rapidly growing labour force, particularly first-time
labour market entrants, a feature prevalent across the African continent for both men and women and in
3 Comprised of HEI and TVET graduates with NQF level 5 or 6 qualifications (Van Broekhuizen, 2016, p. 4)
both the formal and informal labour markets (Khan, 2020). Furthermore, regarding the structure of the
labour market in terms of sectoral growth, it has been argued that labour markets in low-income countries
have been moving towards pre-industrialisation and labour reallocation from agriculture to service sector
employment, which is largely characterised by vulnerable employment.
Labour market policies
Globally, active labour market policies have been employed in both developed and developing countries to
stimulate economic growth and development, promote access to employment and respond to the needs and
deficits within an economy. Typical active labour market policies and interventions have focused on training
of economically active adults, incentivising firms to employ people through the provision of employment
subsidies and rebates, provision of matching services which link economically active adults to jobs, promoting
enterprise development and providing public works programmes. Increasingly these policies have focused
on enhancing youth employment outcomes (Crépon et al., 2016).
Training programmes of diverse nature have been widely implemented, with differences relating to the type
of skills that the programme seeks to develop, the nature and intensity of training provided, the duration of
the training intervention and the level of financial investment made. There is a wealth of literature on the
impact of such programmes, which appears to suggest that there are positive long-term impacts of these
programmes (Crépon et al., 2016).
Nilsson (2019), drawing on evidence from various systematic reviews, argues that these programmes have
achieved little or modest results with respect to improvements in employment and earnings, although he
acknowledges that some programmes, such as business skills training, have positively impacted on business
creation. Public employment programmes were also reviewed, and evidence pointed to relative inefficiencies
in implementing such programmes. In contrast, reviews of the effects of vocational and technical training
targeted at youth in developing countries (both low and middle income) have proven to be effective in
promoting employment and income. Evidence suggests that programmes that transfer cash and physical
assets to individuals appear to have had more sustained positive impacts on youth employment. Nilsson
(2019) posits that a combination of these labour market interventions, rather than standalone responses,
are more likely to contribute to improved STWT for youth.
Other factors affecting overall employment opportunities noted across the literature include geographical
areas and economic cycles (Hannan et al., 1996; Bradley & Nguyen, 2004), English language proficiency, and
disability. However, the effect of the various factors is very complex, as most of them tend to be inextricably
linked. For instance, the socioeconomic status of a person has an impact on school achievement and post-
school outcomes, including occupational status.
Employers are widely recognised as having a key contribution to make towards enhancing skills in the
workforce. There are, however, varied approaches to such contributions, including identifying skills gaps and
needs, offering workplace skills training, induction and institutional socialisation of employees, valuing of
learning and training, mentoring and supervision, financial contributions to skills development (such as levy
payments or budgeting for skills development), performance appraisal systems and partnering with relevant
PSET institutions towards the effective delivery of skills programmes (Smith & Comyn, 2004; Centre for
Career Management Skills, 2009).
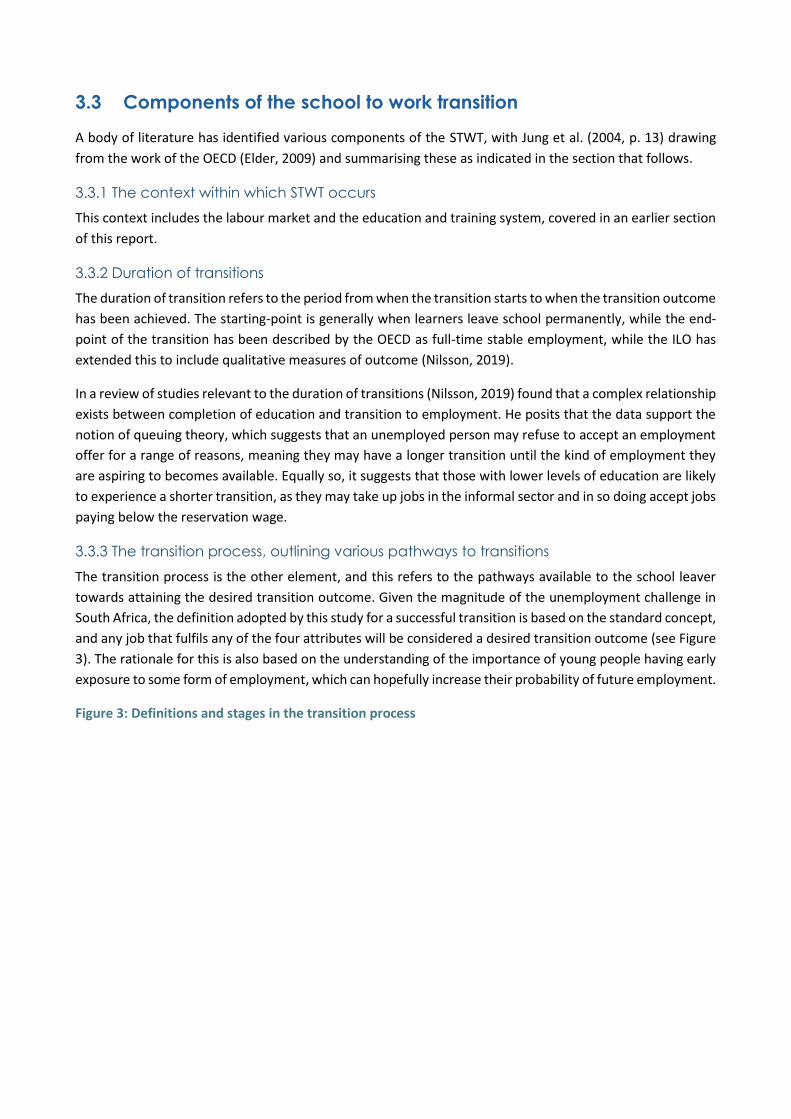
3.3 Components of the school to work transition
A body of literature has identified various components of the STWT, with Jung et al. (2004, p. 13) drawing
from the work of the OECD (Elder, 2009) and summarising these as indicated in the section that follows.
3.3.1 The context within which STWT occurs
This context includes the labour market and the education and training system, covered in an earlier section
of this report.
3.3.2 Duration of transitions
The duration of transition refers to the period from when the transition starts to when the transition outcome
has been achieved. The starting-point is generally when learners leave school permanently, while the end-
point of the transition has been described by the OECD as full-time stable employment, while the ILO has
extended this to include qualitative measures of outcome (Nilsson, 2019).
In a review of studies relevant to the duration of transitions (Nilsson, 2019) found that a complex relationship
exists between completion of education and transition to employment. He posits that the data support the
notion of queuing theory, which suggests that an unemployed person may refuse to accept an employment
offer for a range of reasons, meaning they may have a longer transition until the kind of employment they
are aspiring to becomes available. Equally so, it suggests that those with lower levels of education are likely
to experience a shorter transition, as they may take up jobs in the informal sector and in so doing accept jobs
paying below the reservation wage.
3.3.3 The transition process, outlining various pathways to transitions
The transition process is the other element, and this refers to the pathways available to the school leaver
towards attaining the desired transition outcome. Given the magnitude of the unemployment challenge in
South Africa, the definition adopted by this study for a successful transition is based on the standard concept,
and any job that fulfils any of the four attributes will be considered a desired transition outcome (see Figure
3). The rationale for this is also based on the understanding of the importance of young people having early
exposure to some form of employment, which can hopefully increase their probability of future employment.
Figure 3: Definitions and stages in the transition process
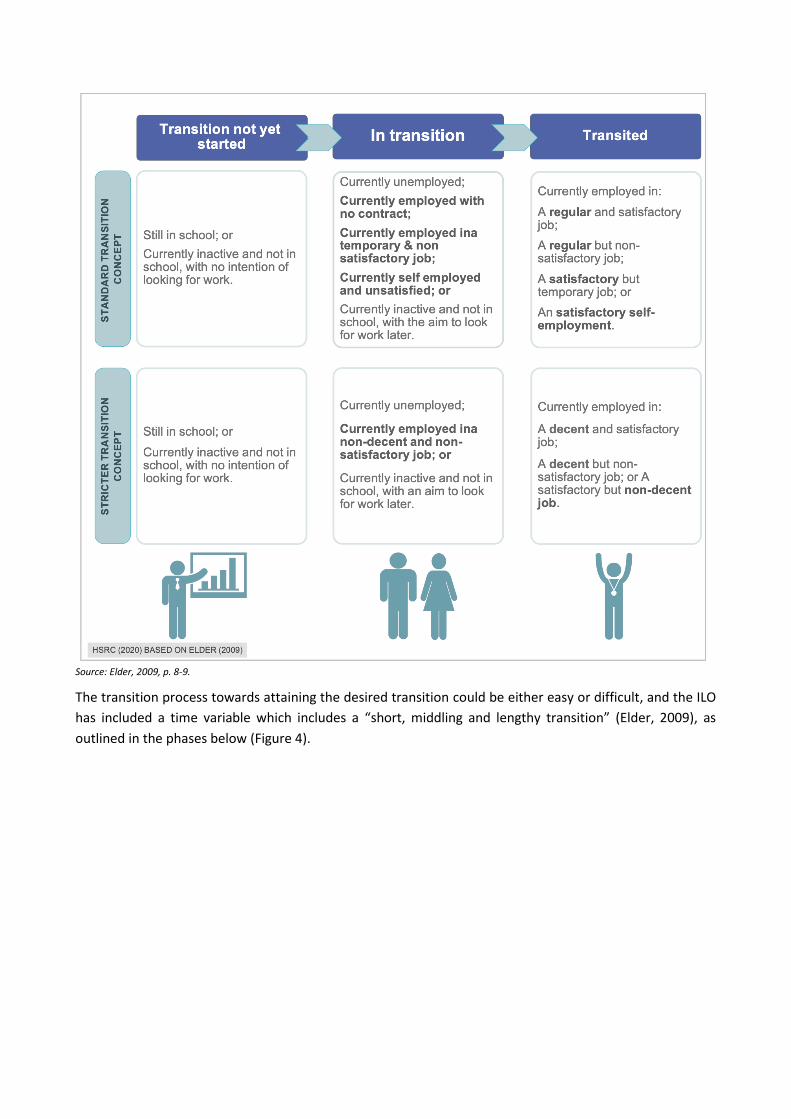
Source: Elder, 2009, p. 8-9.
The transition process towards attaining the desired transition could be either easy or difficult, and the ILO
has included a time variable which includes a “short, middling and lengthy transition” (Elder, 2009), as
outlined in the phases below (Figure 4).
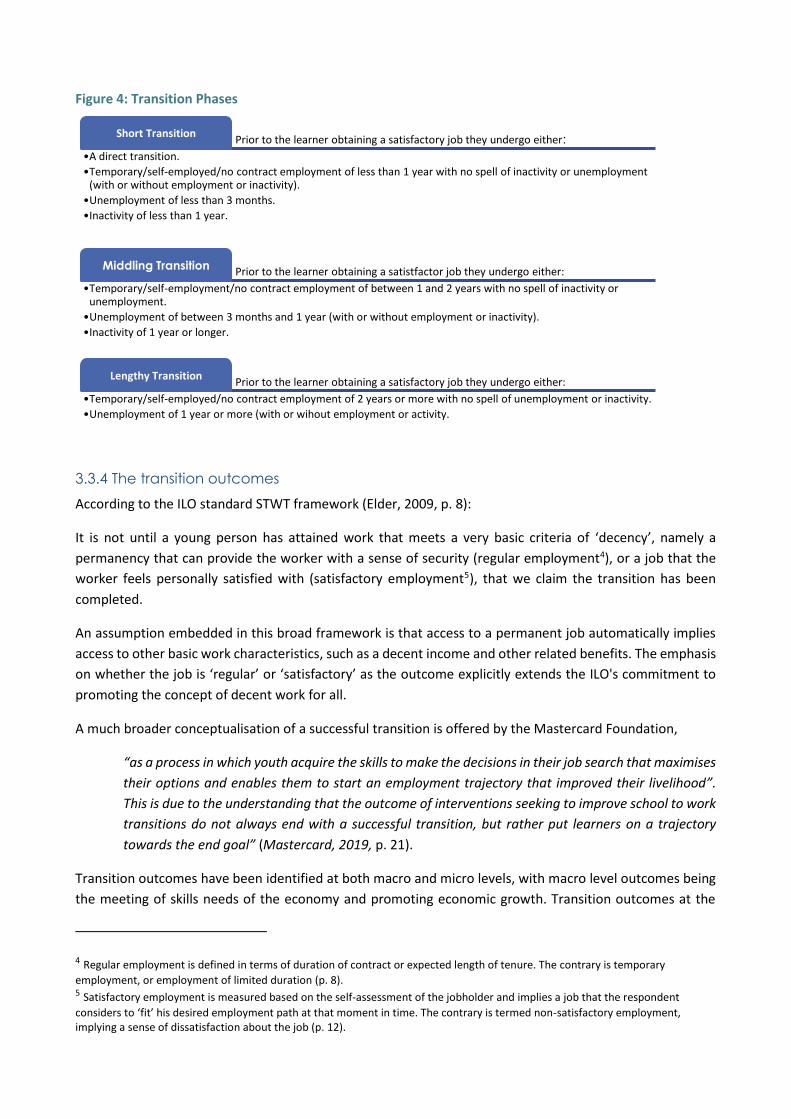
Figure 4: Transition Phases
3.3.4 The transition outcomes
According to the ILO standard STWT framework (Elder, 2009, p. 8):
It is not until a young person has attained work that meets a very basic criteria of ‘decency’, namely a
permanency that can provide the worker with a sense of security (regular employment4), or a job that the
worker feels personally satisfied with (satisfactory employment5), that we claim the transition has been
completed.
An assumption embedded in this broad framework is that access to a permanent job automatically implies
access to other basic work characteristics, such as a decent income and other related benefits. The emphasis
on whether the job is ‘regular’ or ‘satisfactory’ as the outcome explicitly extends the ILO's commitment to
promoting the concept of decent work for all.
A much broader conceptualisation of a successful transition is offered by the Mastercard Foundation,
“as a process in which youth acquire the skills to make the decisions in their job search that maximises
their options and enables them to start an employment trajectory that improved their livelihood”.
This is due to the understanding that the outcome of interventions seeking to improve school to work
transitions do not always end with a successful transition, but rather put learners on a trajectory
towards the end goal” (Mastercard, 2019, p. 21).
Transition outcomes have been identified at both macro and micro levels, with macro level outcomes being
the meeting of skills needs of the economy and promoting economic growth. Transition outcomes at the
4 Regular employment is defined in terms of duration of contract or expected length of tenure. The contrary is temporary
employment, or employment of limited duration (p. 8). 5 Satisfactory employment is measured based on the self-assessment of the jobholder and implies a job that the respondent
considers to ‘fit’ his desired employment path at that moment in time. The contrary is termed non-satisfactory employment, implying a sense of dissatisfaction about the job (p. 12).
Prior to the learner obtaining a satisfactory job they undergo either:Short Transition
•A direct transition.
•Temporary/self-employed/no contract employment of less than 1 year with no spell of inactivity or unemployment (with or without employment or inactivity).
•Unemployment of less than 3 months.
•Inactivity of less than 1 year.
Prior to the learner obtaining a satistfactor job they undergo either: Middling Transition
•Temporary/self-employment/no contract employment of between 1 and 2 years with no spell of inactivity or unemployment.
•Unemployment of between 3 months and 1 year (with or without employment or inactivity).
•Inactivity of 1 year or longer.
Prior to the learner obtaining a satisfactory job they undergo either: Lengthy Transition
•Temporary/self-employed/no contract employment of 2 years or more with no spell of unemployment or inactivity.
•Unemployment of 1 year or more (with or wihout employment or activity.
micro level include economic outcomes such as improved labour force participation, security of employment,
occupational status, access to on-the-job training and development, career mobility and job satisfaction.
Non-economic outcomes include migration, family formation and establishing independent households
(Hannan et al., 1996). Failure to transition, particularly for the large cohort of youth globally, has been
associated with increased at-risk behaviour, reduced self-confidence, low self-esteem, inhibition of
motivation and depression (Sissons & Jones, 2012; Hannan et al., 1996). Failure to transition, particularly for
the large cohort of youth globally, has been associated with increased at-risk behaviour, reduced self-
confidence, low self-esteem, inhibition of motivation and depression (Sissons & Jones, 2012).
3.3.5 Limitations of the STWT Conceptual Framework
Identifying factors with an impact on the STWT is particularly important for the South African context, which
is marked by pronounced inequalities. Although countries vary in terms of economic, sociodemographic and
institutional characteristics, the factors or elements of the transition process tend to cut across both
developed and developing countries.
However, the Mastercard Foundation report (Mastercard, 2019) rightfully observes that ‘school to work’
transitions are context specific. Learners might follow different paths between school and work, differing in
starting and end points and duration. Transitions appear to be even more complex in developing countries
where the majority of youth have low levels of education, economies with large informal sectors, and where
individuals participate in varied economic activities, at times simultaneously, to sustain their livelihoods.
Particularly in South Africa, studies presented above demonstrate that successful transitions are an outcome
of a complex interplay of internal and external factors; however, our historical legacy has deemed race a
consistent mediating factor.
The High Level SETA M&E framework (Ward & Rosenberg, 2020; p. 12) has appropriately defined the SETAs’
shared responsibility as being to enhance beneficiary employability and not their employment. This is
consistent with the standard definition of a successful transition discussed earlier in this section.
Furthermore, local evidence points to the existence of large structural unemployment, employer biases and
contextual challenges, a negative perception of the TVET sector, and a changing world of work and skills
needs due to the impending Fourth Industrial Revolution (4IR). All these contextual factors have a bearing
on the shape and duration of youth transitions and need to be considered in investigations of STWT. It is
contended that some of the assumptions underpinning the ILO STWT Framework require revisiting in the
context of a global pattern of increased informalisation of employment and the related precarity which
accompanies it.
3.4 Post-school education and training landscape in South Africa
Legislative and policy context
The Constitution of South Africa (1996) as the supreme law provides the right to education for all South
African citizens, with the belief that this will contribute to a better quality of life for all. The Government has
set out a number of key priorities, among them being the maximisation of individuals’ potential and a better
quality life for all South African citizens (RSA, 1996).
The South African Government has attempted to give effect to the right to education, particularly post-
schooling education, through a plethora of legislative and policy initiatives which seek to expand the current
provision of quality higher education and training. Central to this are the following:
The White Paper on Post School Education and Training (DHET, 2014);
The Human Resource Development Strategy (HRDS) for South Africa (DHET, 2009);
The National Student Financial Aid Scheme (NSFAS) Act No. 56 of 1999 (RSA, 1999); and
The National Qualifications Framework (NQF) Act No. 67 of 2008, (RSA, 2009).
Of relevance to this study is the role of SETAs, which the White Paper has tasked with promoting linkages
between the various institutions and stakeholders. The White Paper highlights the importance of
collaboration between colleges and employers in the provision of internships, learnerships and other learning
interventions, with the aim of enabling clear linkages between educational provision and the labour market
(DHET, 2014).
Responding to skills challenges and attempting to smooth the learning to work transitions, the White Paper
(DHET, 2014) recognised the inadequate skills levels and poor readiness of new entrants into the labour
market. This refers to those leaving formal secondary and tertiary education and entering the labour market
for the first time. The situation is even more precarious for those who lack any form of formal education or
are in long-term unemployment with no basic numeracy and literacy skills, and thus lack necessary entry-
level skills and work experience.
SETAs’ role in advancing post-school education and training
The SETAs were established in 2000 through the Skills Development Act of 1998 (RSA, 1998, Chapter 3,
Section 10) to facilitate the development of skills in relation to sector-identified skills needs. Initially, 25 (now
21) SETAs replaced the 33 industry training boards that existed prior to 2000 and were a response to the
need for skills development across different sectors.
SETAs have been charged with a myriad of objectives and responsibilities, but one which was amplified in
the White Paper for Post School Education and Training is that of “obtaining accurate data about workplace
skills needs, as well as supporting providers in delivering programme’s necessary in their sectors” (DHET,
2014, p 67). As the key institutions which mediate between education and work, SETAs are responsible for
the development of a skills pipeline through promoting and supporting learnerships, apprenticeships or
internships.
Responding to skills challenges and attempting to smooth the transition from learning to work, the
framework recognised the inadequate skills levels and poor readiness of new entrants into the labour market.
This refers to those leaving formal secondary and tertiary education and entering the labour market for the
first time.
The situation is even more precarious for those who lack any form of formal education, are in long-term
unemployment, with no basic numeracy and literacy skills, and thus lack the necessary entry-level skills and
work experience. Employers prefer to employ individuals with some form of formal education or work
experience. As it is, about 60% of the persons who are unemployed in SA have never worked before (Van
Staden, 2015).
Central to the NSDS III framework was thus a commitment to increased access to high-quality and relevant
education, and training and skills development, including workplace learning and experience, to enable
participation in the economy and society by all South Africans and reduce inequalities (DHET, 2011).
Consequently, NSDS III identified 8 strategic outcomes, that have served to guide the SETAs since 2011
(Figure 5).
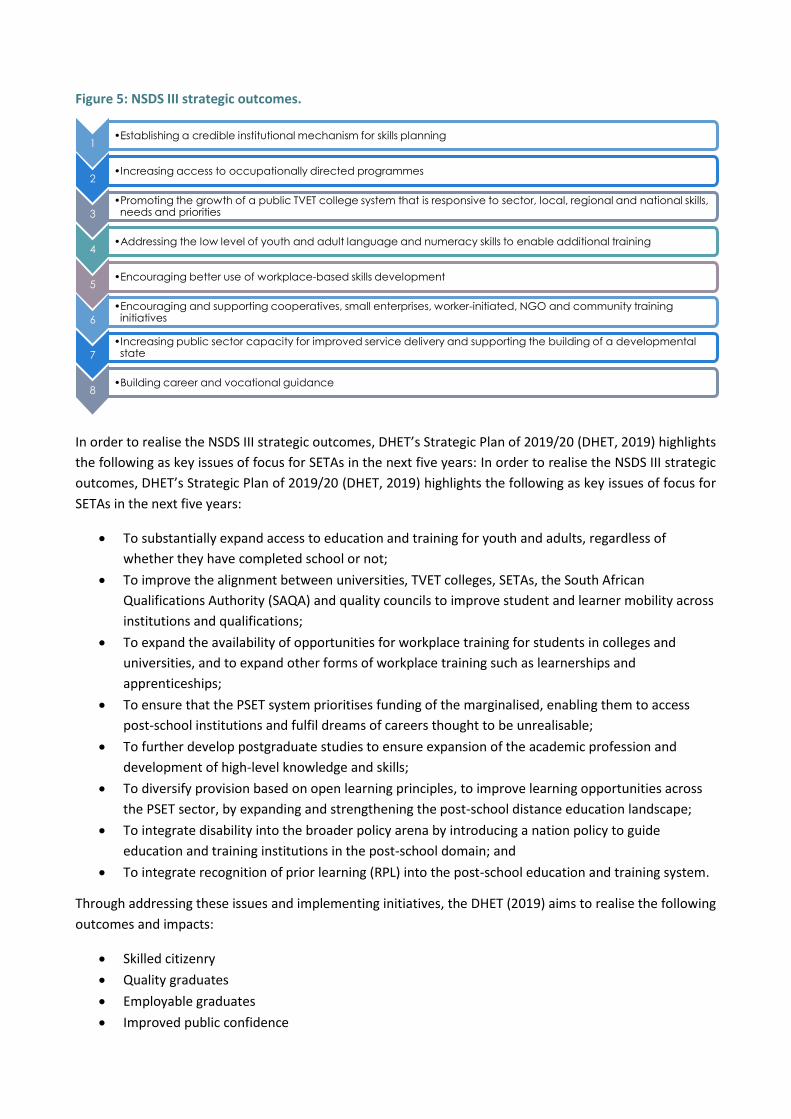
Figure 5: NSDS III strategic outcomes.
In order to realise the NSDS III strategic outcomes, DHET’s Strategic Plan of 2019/20 (DHET, 2019) highlights
the following as key issues of focus for SETAs in the next five years: In order to realise the NSDS III strategic
outcomes, DHET’s Strategic Plan of 2019/20 (DHET, 2019) highlights the following as key issues of focus for
SETAs in the next five years:
To substantially expand access to education and training for youth and adults, regardless of
whether they have completed school or not;
To improve the alignment between universities, TVET colleges, SETAs, the South African
Qualifications Authority (SAQA) and quality councils to improve student and learner mobility across
institutions and qualifications;
To expand the availability of opportunities for workplace training for students in colleges and
universities, and to expand other forms of workplace training such as learnerships and
apprenticeships;
To ensure that the PSET system prioritises funding of the marginalised, enabling them to access
post-school institutions and fulfil dreams of careers thought to be unrealisable;
To further develop postgraduate studies to ensure expansion of the academic profession and
development of high-level knowledge and skills;
To diversify provision based on open learning principles, to improve learning opportunities across
the PSET sector, by expanding and strengthening the post-school distance education landscape;
To integrate disability into the broader policy arena by introducing a nation policy to guide
education and training institutions in the post-school domain; and
To integrate recognition of prior learning (RPL) into the post-school education and training system.
Through addressing these issues and implementing initiatives, the DHET (2019) aims to realise the following
outcomes and impacts:
Skilled citizenry
Quality graduates
Employable graduates
Improved public confidence
1•Establishing a credible institutional mechanism for skills planning
2•Increasing access to occupationally directed programmes
3
•Promoting the growth of a public TVET college system that is responsive to sector, local, regional and national skills, needs and priorities
4•Addressing the low level of youth and adult language and numeracy skills to enable additional training
5•Encouraging better use of workplace-based skills development
6
•Encouraging and supporting cooperatives, small enterprises, worker-initiated, NGO and community training initiatives
7
•Increasing public sector capacity for improved service delivery and supporting the building of a developmental state
8•Building career and vocational guidance
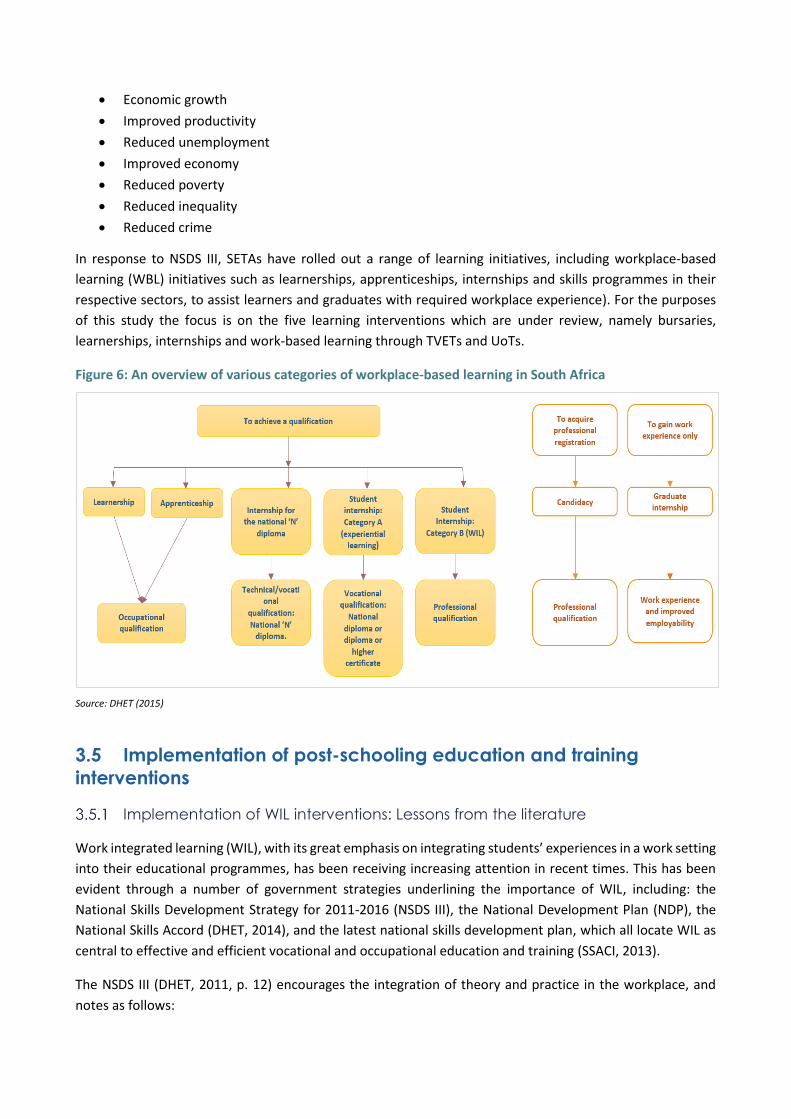
Economic growth
Improved productivity
Reduced unemployment
Improved economy
Reduced poverty
Reduced inequality
Reduced crime
In response to NSDS III, SETAs have rolled out a range of learning initiatives, including workplace-based
learning (WBL) initiatives such as learnerships, apprenticeships, internships and skills programmes in their
respective sectors, to assist learners and graduates with required workplace experience). For the purposes
of this study the focus is on the five learning interventions which are under review, namely bursaries,
learnerships, internships and work-based learning through TVETs and UoTs.
Figure 6: An overview of various categories of workplace-based learning in South Africa
Source: DHET (2015)
3.5 Implementation of post-schooling education and training
interventions
Implementation of WIL interventions: Lessons from the literature
Work integrated learning (WIL), with its great emphasis on integrating students’ experiences in a work setting
into their educational programmes, has been receiving increasing attention in recent times. This has been
evident through a number of government strategies underlining the importance of WIL, including: the
National Skills Development Strategy for 2011-2016 (NSDS III), the National Development Plan (NDP), the
National Skills Accord (DHET, 2014), and the latest national skills development plan, which all locate WIL as
central to effective and efficient vocational and occupational education and training (SSACI, 2013).
The NSDS III (DHET, 2011, p. 12) encourages the integration of theory and practice in the workplace, and
notes as follows:
‘Workplace learning should be an integral part of all vocational programmes. Establishing effective
partnerships between education and training systems and employers to provide for workplace
training would ensure that skills have real labour market relevance and that young people gain an
early appreciation of and exposure to the world of work’.
In 2014 the White Paper for Post-School Education and Training: Building an Expanded, Effective and
Integrated Post-School System (DHET, 2014, p. 16) stated:
‘Since the main purpose of the TVET colleges is to prepare students for the workplace, it is essential
that they develop and maintain close working relationships with employers in their areas. Close
partnerships between colleges and employers can assist the colleges in locating workplace
opportunities for students who need practical experience’.
The NDP (National Planning Commission, 2012) also recognises the importance of workplace-based training
as part of skills development. It emphasises the important role played by FET colleges in vocational education
and training. Furthermore, the NDP stresses the role of SETAs in supporting the development of relationships
between educational institutions and employers.
The National Skills Accord committed all parties, including government, organised business and labour, and
civil society to increase the numbers of apprenticeships, internships, workplace-based experience for college
students and other opportunities for WIL in the industry. This is embedded in the second commitment
(Department of Economic Development, 2012, p. 6):
‘To make internship and placement opportunities available within workplaces. Companies will
annually make 12 000 placements/internship spaces available for students who complete their
certificates at FET Colleges, 5000 internships for 3rd year students at Universities of Technology who
need the work experience as part of their qualifications, and opportunities for training exposure in a
work environment for at least 16 000 lecturers at FET Colleges. This will be phased in, with 20% of the
target to be achieved in 2011, 50% in 2012 and 100% from 2013.’
Furthermore, the implementation of WIL is part of the Minister of Higher Education and Training’s delivery
agreement, outcome 5 – a skilled and capable workforce to support an inclusive growth path, and output 3
– access to occupationally directed programmes. As such, the provision of WIL has become a key
performance area for public TVET colleges and the same applies to UoTs. This is reinforced through the DHET
Technical Guidelines for Quarterly Performance, which require institutions of higher learning to report on
placement of students in learnerships and apprenticeships, N6 graduates in internships, NC(V) and report on
students in workplace-based experience and lecturers in workplace exposure (SSACI, 2013).
Ability to measure the impact of the various work-based learning interventions has historically been
hampered by a lack of common understanding: first of what WBL is, and second, of the relationship between
different approaches of WBL (Wildschut et al., 2017). The concept of WBL is often used interchangeably with
other terms such as WIL, practice-based learning, work-related learning, etc. The ILO notes that
“apprenticeships, cadetships, traineeship and internships are effective means of bridging school and the
world of work for young people by making it possible for them to acquire work experience along with
technical and professional training” (ILO, 2009, p. 8).
Given the whole range of programmes covered under this concept, different conceptualisations however
converge on the recognition that WBL encompasses different kinds of learning taking place in ‘real’ work
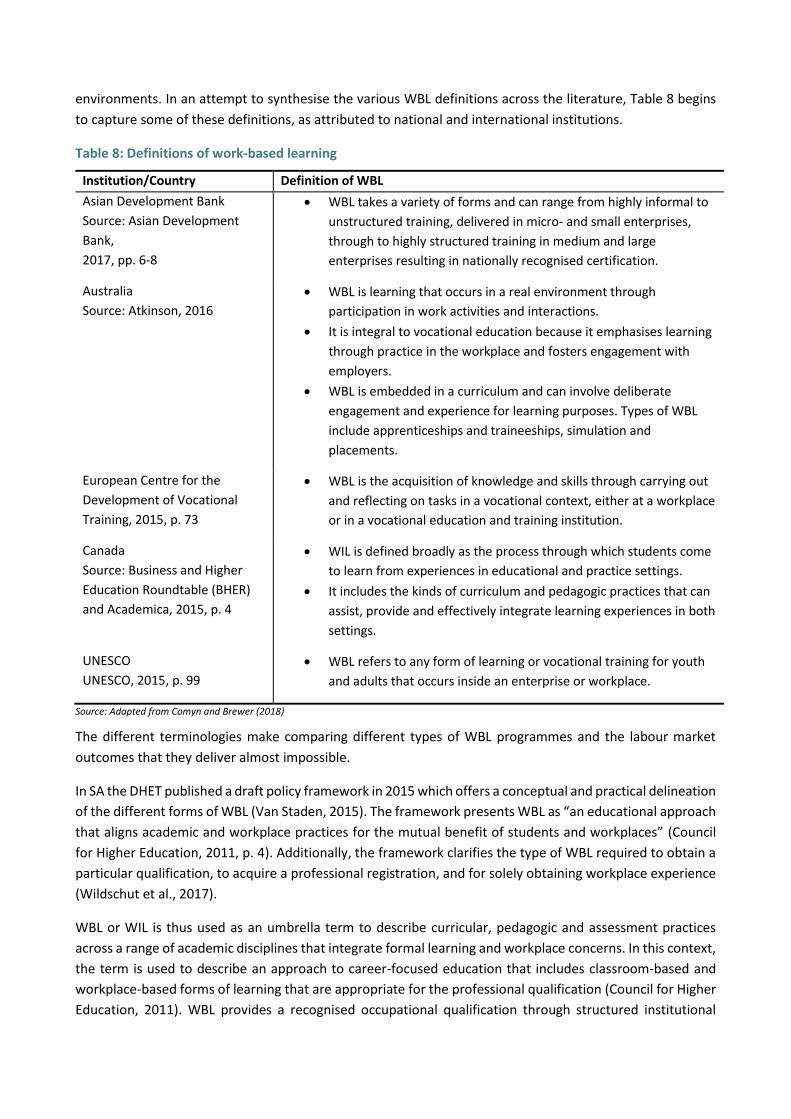
environments. In an attempt to synthesise the various WBL definitions across the literature, Table 8 begins
to capture some of these definitions, as attributed to national and international institutions.
Table 8: Definitions of work-based learning
Institution/Country Definition of WBL
Asian Development Bank
Source: Asian Development
Bank,
2017, pp. 6-8
WBL takes a variety of forms and can range from highly informal to
unstructured training, delivered in micro- and small enterprises,
through to highly structured training in medium and large
enterprises resulting in nationally recognised certification.
Australia
Source: Atkinson, 2016
WBL is learning that occurs in a real environment through
participation in work activities and interactions.
It is integral to vocational education because it emphasises learning
through practice in the workplace and fosters engagement with
employers.
WBL is embedded in a curriculum and can involve deliberate
engagement and experience for learning purposes. Types of WBL
include apprenticeships and traineeships, simulation and
placements.
European Centre for the
Development of Vocational
Training, 2015, p. 73
WBL is the acquisition of knowledge and skills through carrying out
and reflecting on tasks in a vocational context, either at a workplace
or in a vocational education and training institution.
Canada
Source: Business and Higher
Education Roundtable (BHER)
and Academica, 2015, p. 4
WIL is defined broadly as the process through which students come
to learn from experiences in educational and practice settings.
It includes the kinds of curriculum and pedagogic practices that can
assist, provide and effectively integrate learning experiences in both
settings.
UNESCO
UNESCO, 2015, p. 99
WBL refers to any form of learning or vocational training for youth
and adults that occurs inside an enterprise or workplace.
Source: Adapted from Comyn and Brewer (2018)
The different terminologies make comparing different types of WBL programmes and the labour market
outcomes that they deliver almost impossible.
In SA the DHET published a draft policy framework in 2015 which offers a conceptual and practical delineation
of the different forms of WBL (Van Staden, 2015). The framework presents WBL as “an educational approach
that aligns academic and workplace practices for the mutual benefit of students and workplaces” (Council
for Higher Education, 2011, p. 4). Additionally, the framework clarifies the type of WBL required to obtain a
particular qualification, to acquire a professional registration, and for solely obtaining workplace experience
(Wildschut et al., 2017).
WBL or WIL is thus used as an umbrella term to describe curricular, pedagogic and assessment practices
across a range of academic disciplines that integrate formal learning and workplace concerns. In this context,
the term is used to describe an approach to career-focused education that includes classroom-based and
workplace-based forms of learning that are appropriate for the professional qualification (Council for Higher
Education, 2011). WBL provides a recognised occupational qualification through structured institutional
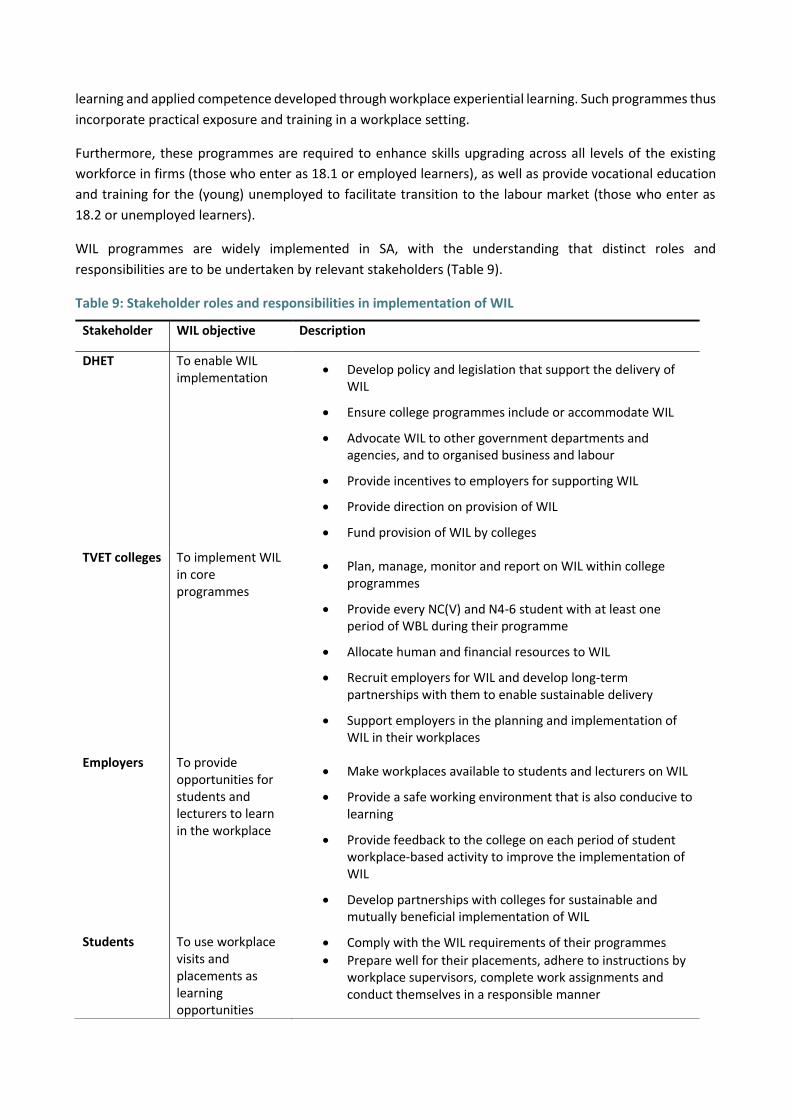
learning and applied competence developed through workplace experiential learning. Such programmes thus
incorporate practical exposure and training in a workplace setting.
Furthermore, these programmes are required to enhance skills upgrading across all levels of the existing
workforce in firms (those who enter as 18.1 or employed learners), as well as provide vocational education
and training for the (young) unemployed to facilitate transition to the labour market (those who enter as
18.2 or unemployed learners).
WIL programmes are widely implemented in SA, with the understanding that distinct roles and
responsibilities are to be undertaken by relevant stakeholders (Table 9).
Table 9: Stakeholder roles and responsibilities in implementation of WIL
Stakeholder WIL objective Description
DHET To enable WIL implementation
Develop policy and legislation that support the delivery of WIL
Ensure college programmes include or accommodate WIL
Advocate WIL to other government departments and agencies, and to organised business and labour
Provide incentives to employers for supporting WIL
Provide direction on provision of WIL
Fund provision of WIL by colleges
TVET colleges To implement WIL in core programmes
Plan, manage, monitor and report on WIL within college programmes
Provide every NC(V) and N4-6 student with at least one period of WBL during their programme
Allocate human and financial resources to WIL
Recruit employers for WIL and develop long-term partnerships with them to enable sustainable delivery
Support employers in the planning and implementation of WIL in their workplaces
Employers To provide opportunities for students and lecturers to learn in the workplace
Make workplaces available to students and lecturers on WIL
Provide a safe working environment that is also conducive to learning
Provide feedback to the college on each period of student workplace-based activity to improve the implementation of WIL
Develop partnerships with colleges for sustainable and mutually beneficial implementation of WIL
Students To use workplace visits and placements as learning opportunities
Comply with the WIL requirements of their programmes
Prepare well for their placements, adhere to instructions by workplace supervisors, complete work assignments and conduct themselves in a responsible manner
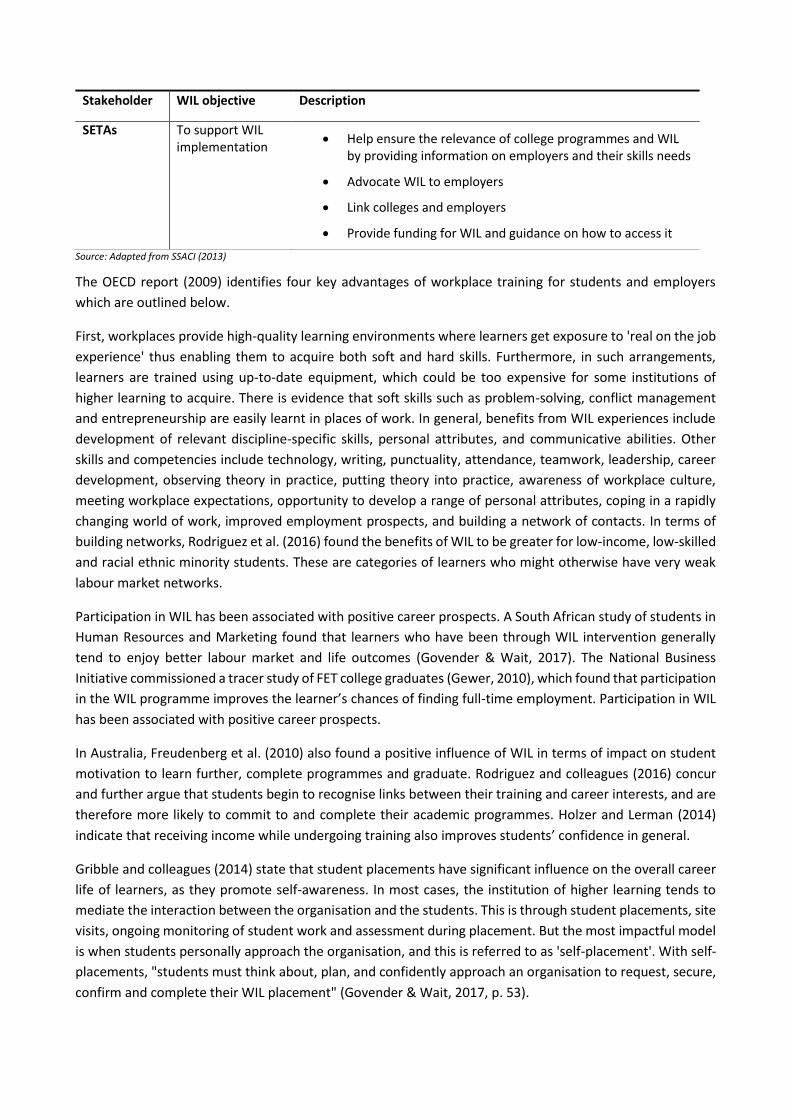
Stakeholder WIL objective Description
SETAs To support WIL implementation
Help ensure the relevance of college programmes and WIL by providing information on employers and their skills needs
Advocate WIL to employers
Link colleges and employers
Provide funding for WIL and guidance on how to access it
Source: Adapted from SSACI (2013)
The OECD report (2009) identifies four key advantages of workplace training for students and employers
which are outlined below.
First, workplaces provide high-quality learning environments where learners get exposure to 'real on the job
experience' thus enabling them to acquire both soft and hard skills. Furthermore, in such arrangements,
learners are trained using up-to-date equipment, which could be too expensive for some institutions of
higher learning to acquire. There is evidence that soft skills such as problem-solving, conflict management
and entrepreneurship are easily learnt in places of work. In general, benefits from WIL experiences include
development of relevant discipline-specific skills, personal attributes, and communicative abilities. Other
skills and competencies include technology, writing, punctuality, attendance, teamwork, leadership, career
development, observing theory in practice, putting theory into practice, awareness of workplace culture,
meeting workplace expectations, opportunity to develop a range of personal attributes, coping in a rapidly
changing world of work, improved employment prospects, and building a network of contacts. In terms of
building networks, Rodriguez et al. (2016) found the benefits of WIL to be greater for low-income, low-skilled
and racial ethnic minority students. These are categories of learners who might otherwise have very weak
labour market networks.
Participation in WIL has been associated with positive career prospects. A South African study of students in
Human Resources and Marketing found that learners who have been through WIL intervention generally
tend to enjoy better labour market and life outcomes (Govender & Wait, 2017). The National Business
Initiative commissioned a tracer study of FET college graduates (Gewer, 2010), which found that participation
in the WIL programme improves the learner’s chances of finding full-time employment. Participation in WIL
has been associated with positive career prospects.
In Australia, Freudenberg et al. (2010) also found a positive influence of WIL in terms of impact on student
motivation to learn further, complete programmes and graduate. Rodriguez and colleagues (2016) concur
and further argue that students begin to recognise links between their training and career interests, and are
therefore more likely to commit to and complete their academic programmes. Holzer and Lerman (2014)
indicate that receiving income while undergoing training also improves students’ confidence in general.
Gribble and colleagues (2014) state that student placements have significant influence on the overall career
life of learners, as they promote self-awareness. In most cases, the institution of higher learning tends to
mediate the interaction between the organisation and the students. This is through student placements, site
visits, ongoing monitoring of student work and assessment during placement. But the most impactful model
is when students personally approach the organisation, and this is referred to as 'self-placement'. With self-
placements, "students must think about, plan, and confidently approach an organisation to request, secure,
confirm and complete their WIL placement" (Govender & Wait, 2017, p. 53).
Second, whilst participation in WIL improves STWT on the part of learners, it also brings along a host of
recruitment benefits for employers. Importantly, WIL serves as a useful mechanism for creating a well-skilled,
and labour market-ready talent pool. Employers who are already training learners are in an advantageous
position, able to screen and select the best from the cohort of trainees, thereby rendering their recruitment
and induction processes more effective and less costly.
Third, employer commitment and provision of workplace training serves as a signal that a VET programme
offered is of labour market value. The work-related skills and attitudes that students develop during WIL are
highly valued by employers (Rodriguez et al., 2016).
Fourth, WIL learners get an opportunity to make a productive contribution to the firm as well the economy
at large.
Importantly, the OECD (2009) stresses that these benefits only accrue to structured workplace learning in a
vocational programme. In line with this, SACCI (2013) identified 8 guiding principles for the effective
implementation of WIL:
It is part of the core business of colleges (and UoTs) to integrate WIL into their curricula;
Planning and implementation of the workplace component must be done systematically and
institutionalised in the college;
The workplace component of WIL must be in suitable workplaces that are able to provide the
required experience in a safe and healthy environment;
WIL depends on the continued involvement and support of employers. Colleges must therefore
strive to address the skills needs of local employers and accommodate their business objectives,
operating procedures, work processes, calendars, timing and managerial systems;
The longer and more frequent the workplace-based components of a WIL programme are, the
more effective it is likely to be;
WIL requires good preparation of students and employers; each must know what is required of
them and how to meet these requirements;
Students need to be mentored during WIL placements so that problems are resolved quickly and
opportunities for learning are fully exploited; and
Monitoring and reporting are necessary for effective WIL implementation and compliance with
DHET requirements.
Care in the planning and implementation of the programme is therefore key to its success. For instance,
effective delivery of WIL requires strong and mutually beneficial partnerships between institutions of
education and training and with local employers. In an investigation of work-based placements in the
engineering sector at mining schools (including the Universities of Johannesburg, Witwatersrand, Pretoria
and UNISA), the commitment of universities to collaborate with other relevant stakeholders in the
intervention was found to play an important role in the successful provision of WIL (Maseko, 2018).
Rodriguez et al. (2016) maintain that quality WIL pedagogy should be designed to maximise impact in student
outcomes. The content of the programme should thus be developed with the aim of advancing students’
career awareness, career exploration, career preparation and career training. It is for this reason that
Wedekind (2016) argues that the experiential components of the interventions need to be properly thought
through and integrated with other parts of the curriculum.
Whilst the above discussion demonstrates that the relationship between employers and colleges is of critical
importance to the success of the intervention, care should be taken to ensure that both the employer and
the institution perspectives are considered in a well-balanced manner. Notably, Rambe (2018) cautions that
there is much focus on improving learning outcomes without much attention being given to the nature and
process of development of educational content. Peacock and Ladkin (2002) posit that employers must be
involved in the training design and curriculum development. Rodrigues and colleagues (2016) argue that the
main element which is central to successful programmes is having strong alignment between classroom-
based learning and workplace experiences and learning.
A review of learner outcomes in SA noted the need for a well-developed curriculum for classroom-based
learning which is integrated with WBL; this was emphasised as key to the success of WIL (Arends et al.,
2016). A further finding was that the role of the employer in ensuring an effective induction of the learner
into the workplace and a well-structured mentorship programme was key to the successful outcome of
the WIL. Of relevance for SETAs was the recommendation in this study that SETA offices in colleges could
play a useful role in facilitating greater interaction and cooperation between TVET colleges and UoTs and
employers (Arends et al., 2016)..
It is posited that these partnerships will assist with the recruitment of learning and enhancing employability,
promoting continued training and development of the workforce and improving the existing skills base. At
the same time, this assists in the development of products and process development and technology transfer
to boost academic development.
Implementation of bursary interventions: Lessons from the literature
State funding to increase access to higher education for beneficiaries from low-income households has been
in practice in developed countries such as USA and UK for decades (Callender & Wilkinson, 2013). Similarly,
in SA, it is found that learners without bursaries had to raise student loans via banks, but that many would
not qualify to receive a loan and as a result were denied access to higher education (Naidoo & Mckay, 2018).
However, the study found that the bursary-targeting mechanism – which appeared to focus mainly on how
‘needy’ the applicant was, without due consideration to the performance of the learner – had resulted in
money being spent on learners whose academic performance was very poor.
There is rich literature in England which has sought to explore the impact of bursaries as a tool of promoting
wider participation by traditionally underrepresented groups in higher education. Universities have been
found to be using bursaries as competitive marketing tools, as opposed to fulfilling the primary purpose of
widening access (Harrison et al., 2018). Harrison and Hatt (2012, p. 708) introduce the concept of
“ossification by status”, where elite universities offer higher-value bursaries compared to low-status
institutions.
Callender, Wilkinson and Hopkin (2013) found that as part of financial considerations, bursaries had failed to
influence students’ choices between universities or the decision to enter higher education. Several reasons
have been put forward for this, including: 1) students not being aware of the extent of benefits before joining
the programme, thus making it impossible to influence their choice; 2) choice of university and degree
programmes are academically driven processes, and bursaries only play a small role in this regard; and 3)
that students’ sensitivity to financial incentives has been overestimated.
It is for these reasons that Harrison and colleagues argue for a broader conceptualisation of participation in
HEIs, which is beyond simple access, to include the nature of student experience and the impact on the
retention and academic outcomes (Harrison et al., 2018). They concluded (Harrison et al., 2018, p, 693) by
saying that although evidence of the impact of bursary offerings on choices and enrolments is limited,
nonetheless:
‘bursaries do provide a lubricating resource that enables students to craft an individual experience
with features that are likely to support success and retention, by strengthening social networks.
Reducing anxiety and raising motivation as well as improving access to the formal and informal
curriculum.’
Therefore, given evidence from England and elsewhere, there is limited evidence demonstrating that
bursaries significantly impact on student decisions. Harrison and Hatt (2012) argue that students from lower
socioeconomic groups remain significantly less likely to move away from their home areas, limiting the
number of universities available to them. Anxiety about social comfort continues to act as a barrier to
progression to elite universities. Callender et al. (2013) found that students from non-traditional backgrounds
are discouraged from applying for elite universities due to fear of debt, and rather elect to enrol in local
universities.
In England Moriarty et al. (2012) conducted a study focused on a social work bursary scheme which was
introduced in 2003 as a financial incentive to encourage students to pursue social work-related fields. One
of the key findings was that bursary incentives were perceived as insufficient to meet the student’s needs.
Furthermore, students were found to be highly motivated particularly if obtaining a qualification was likely
to result in a promotion or a pay increase. However, in general the bursary intervention did increase numbers
of enrolments, and supported students from disadvantaged backgrounds who otherwise would not have
been able to pursue studies in the field of social work.
Encouraging evidence from a South African study shows a high absorption of NSFAS-funded higher education
graduates, with about 90% chance of graduates becoming employed, but low graduation rates (Wildschut et
al., 2017). However, gender, race and university type continue to be significant predictors of the likelihood
of labour market absorption.
In South Africa, the DHET (2010, 2012, 2013) Delivery agreement for outcome 5 recognises the use of NSFAS
as an instrument to facilitate the provision of financial aid to academically eligible and financially
disadvantaged students. NSFAS is available to all South African citizens who are registered at a public South
African HEI, i.e. university or TVET college, for their first post-school qualification who meet the means test,
which requires that the learners are from households with incomes of less than R350 000 per annum (Garrod
& Wildschut, 2020). Since 2018, the scheme has provided a complete bursary for the full cost of study (fees,
and university or college residence) and applicable allowances for food, travel, books, and accommodation
(for those not residing in the university or college residence). Furthermore, NSFAS provides targeted
bursaries to specific programmes like the Funza Lushaka Bursary for students pursuing a teaching
qualification, the Department of Social Development bursary for students studying social work, as well as
other SETA bursaries which are targeted to grow sectoral priority skills.
Encouraging empirical evidence demonstrates the positive impact of the funding scheme on student access,
and success in PSET (Bhorat & Pillay, 2017; Villiers et al., 2013). The scheme has been successful in improving
opportunities for students from historically disadvantaged backgrounds to get higher education (Bhorat &
Pillay, 2017). In 2019, NSFAS funded more than 550 000 students at TVET colleges and universities, with the
main beneficiaries being Black African students. For instance, in 2012 the racial composition of beneficiaries
was as follows: 91% African, 4% Coloured, 1.5% Indian, and 3% White. With respect to labour market
outcomes, Wildschut, Rogan, and Mncwango (2020) found a high labour market absorption rate of NSFAS-
funded graduates. However, beneficiaries achieve low graduation rates. Specifically, results showed that
NSFAS-funded graduates have about a 90% chance of becoming employed. Yet gender, race and university
type continue to be significant predictors of the overall likelihood of labour market absorption.
The Skills Development Act (No. 97 of 1998) encourages public service employers to budget at least 1% of
payroll for the training and education of employees. In correspondence, the NDP (National Planning
Commission, 2012) aims to improve the quality of education, skills development and innovation through the
provision of loans and bursaries to upgrade the qualifications, knowledge, skills and abilities of students and
employees.
Implementation of learnership interventions: Lessons from the literature
With the NDP (National Planning Commission, 2012) seeking to address skills development as well as the gap
between the current education and training provided and the needs of the labour market, the Skills
Development Act supports the notion through the provision of learnerships using a SETA, provided the
learnership will include practical work experience of a specified nature, as well as lead to a qualification
related to an occupation.
Learnerships have been identified as key policy instruments for enhancing employability, particularly among
youth in SA. Implementation of learnerships which combine theoretical instruction with practical experience
have been implemented across the African continent, although not on the scale implemented in SA (Rankin
et al., 2014). These have been seen to enhance early labour market transitions, although the benefits have
been seen to diminish over time. The imperative driving its implementation in SA was the strong correlation
between unemployment and the low skills of the workforce. In SA it was found that larger firms (200–999
employees) are more likely to participate in a SETA-accredited learnership programme (40%), compared to
smaller firms (10–19 employees), with only 13% participating. It also found that firms with larger numbers of
low-skilled workers (85%) were less likely to participate in a SETA-funded intervention compared with firms
where 65% of the staff were low-skilled. It was also found that workers who participated in a learnership
were more likely to find employment immediately after completion of the training intervention (Rankin et
al., 2014).
An HSRC learnerships study (Wildschut et al., 2012) found that participants reported enhancement of skills
levels, particularly soft skills such as teamwork and confidence. The findings also confirmed that completion
of a learnership was a strong indicator of employment as a successful impact. Interestingly, the study found
that once learners had secured employment, they stayed in it, while those who did not secure employment
moved on to further studies. Similar findings were reported for students who participated in an FP&M
learnership where the growth of financial skills, soft skills and personal development skills and improved
attitudes towards life were reported (FP&M SETA, 2014). More recently an INSETA study noted that students
who found employment through a learnership reported having gained analytical and business skills.
Unemployed students also reported improvements in their soft and technical skills (INSETA, 2020b).
In terms of types of employers, the study noted that learners were being absorbed into the formal sector,
and then mainly by large private and government sector employers. The study also tracked migration of
learners after completion of the learnership, finding a net migration away from the Eastern Cape, Limpopo
and North West provinces, which are among the poorer provinces in SA. In respect of net in- migration, the
study found movement towards Gauteng followed by the Western Cape.
Interestingly, the study compared the employment outcomes of two sets of learners, namely the 18.1 group
being employed learners, and the 18.2 group being unemployed learners. The findings revealed slight
differences between the two groups: the 18.1 group had 89% experience of a single transition into
employment, while the 18.2 group had 84% experience of such a transition (Wildschut et al., 2012).
A concern was noted that learnerships appeared to be concentrated closer to the metros and in more
affluent provinces, with almost 60% of all learnerships being found in GP, WC and KZN. Hence while the
impact of such programmes is promising, the failure to reach populations most in need was noted. It was
recommended that the targeting should increasingly be focused on women, with low socioeconomic status,
who are African, with low educational levels and in low-status occupations and sectors (Kruss et al., 2014).
Implementation of Internships: Lessons from the Literature
Internships as an instrument for learning and skills development have been identified as valuable
experiential-based learning which, if appropriately implemented, can be participative, interactive, ensure
contact with the environment and involve students in evaluating their experience. Internships involve three
stakeholders, namely the learner, the assigned mentor and the organisation within which the learner is
placed (Madiba, 2015). Evidence highlights the benefits of internships as implemented in the United Kingdom
(Ismail, 2018) as including:
Development of soft skills such as interpersonal skills;
Institutional learning and practical work develop technical and problem-solving skills;
Ability to develop communication and teamwork skills;
Internships increase the probability of securing employment and have a positive effect on earnings;
Internships are less likely to promote postgraduate studies; and
Interns provide labour to companies at a reduced cost and reduce the recruitment and training
costs of companies.
A critical component of an internship is that of mentorship. An extensive body of research suggests that
effective mentoring requires that the mentor has both the time and the understanding of their role as a
mentor, especially the ability to provide regular and continuous feedback and guidance (Ismial, 2018).
However, Madiba (2015) raises the problematic point that the socio-psychological issues relating to
mentoring are undervalued and overlooked, and as a result they impact negatively on the transfer of skills
and knowledge. He further argues that despite extensive legislation in SA to address racial discrimination,
what is required is for organisational culture to change – and legislative measures only contribute in part to
achieving this.
Internship programmes are usually targeted at learners who have completed their studies and require
workplace experiential learning in order to receive their qualification. A CATHSSETA study noted that
significant differences existed between employer expectations of the requisite skills set of the learner and
those which the learner possessed. This was specifically with respect to learners’ capacity towards customer
orientation and to satisfy their needs, and the ability to be proactive. Employers noted that the CATHSSETA-
funded interventions were not meeting the specific needs of this tourism and people-oriented sector. It was
recommended that the prior classroom-based learning should thus integrate the development of learners’
soft skills and work ethic into the curriculum (Zwane et al., 2014).
An assessment of internship programmes implemented in Pakistan found that these had a positive effect on
skills development and labour market access. The study noted that the strength of these programmes was
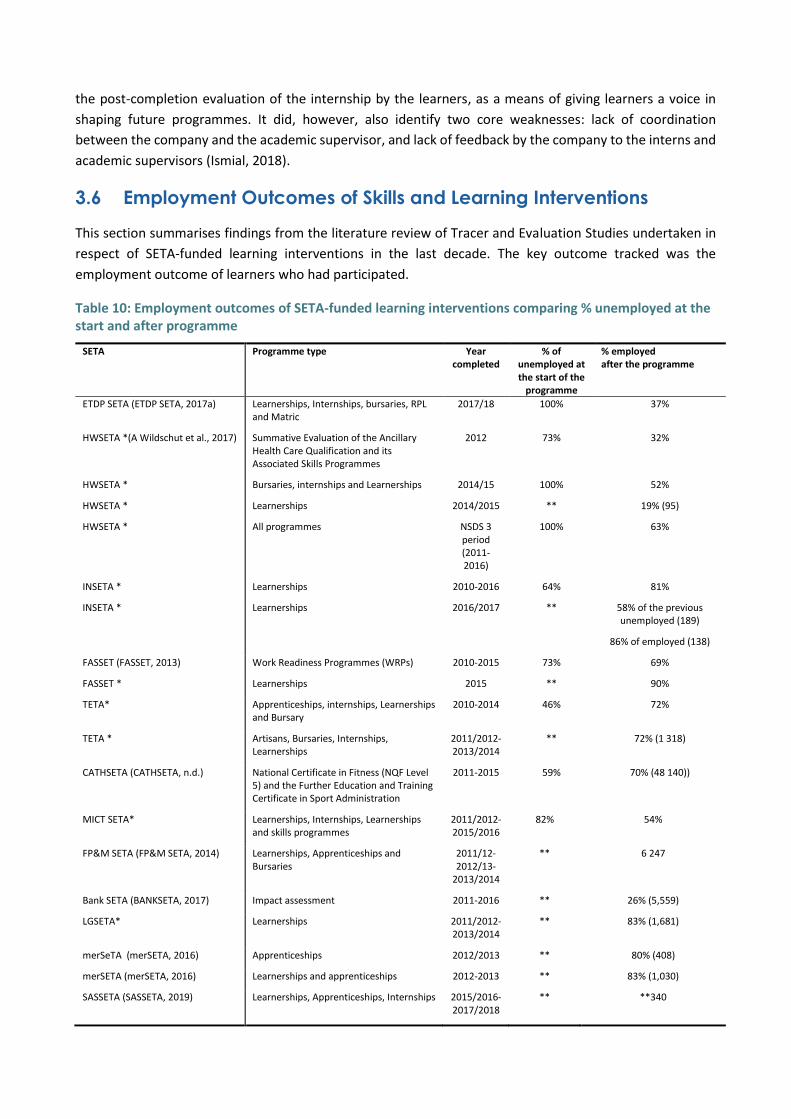
the post-completion evaluation of the internship by the learners, as a means of giving learners a voice in
shaping future programmes. It did, however, also identify two core weaknesses: lack of coordination
between the company and the academic supervisor, and lack of feedback by the company to the interns and
academic supervisors (Ismial, 2018).
3.6 Employment Outcomes of Skills and Learning Interventions
This section summarises findings from the literature review of Tracer and Evaluation Studies undertaken in
respect of SETA-funded learning interventions in the last decade. The key outcome tracked was the
employment outcome of learners who had participated.
Table 10: Employment outcomes of SETA-funded learning interventions comparing % unemployed at the start and after programme
SETA Programme type Year completed
% of unemployed at the start of the
programme
% employed after the programme
ETDP SETA (ETDP SETA, 2017a) Learnerships, Internships, bursaries, RPL and Matric
2017/18 100% 37%
HWSETA *(A Wildschut et al., 2017) Summative Evaluation of the Ancillary Health Care Qualification and its Associated Skills Programmes
2012 73% 32%
HWSETA * Bursaries, internships and Learnerships 2014/15 100% 52%
HWSETA * Learnerships 2014/2015 ** 19% (95)
HWSETA * All programmes NSDS 3 period (2011-2016)
100% 63%
INSETA * Learnerships 2010-2016 64% 81%
INSETA * Learnerships 2016/2017 ** 58% of the previous unemployed (189)
86% of employed (138)
FASSET (FASSET, 2013) Work Readiness Programmes (WRPs) 2010-2015 73% 69%
FASSET * Learnerships 2015 ** 90%
TETA* Apprenticeships, internships, Learnerships and Bursary
2010-2014 46% 72%
TETA * Artisans, Bursaries, Internships, Learnerships
2011/2012-2013/2014
** 72% (1 318)
CATHSETA (CATHSETA, n.d.) National Certificate in Fitness (NQF Level 5) and the Further Education and Training Certificate in Sport Administration
2011-2015 59% 70% (48 140))
MICT SETA* Learnerships, Internships, Learnerships and skills programmes
2011/2012-2015/2016
82% 54%
FP&M SETA (FP&M SETA, 2014) Learnerships, Apprenticeships and Bursaries
2011/12-2012/13-
2013/2014
** 6 247
Bank SETA (BANKSETA, 2017) Impact assessment 2011-2016 ** 26% (5,559)
LGSETA* Learnerships 2011/2012-2013/2014
** 83% (1,681)
merSeTA (merSETA, 2016) Apprenticeships 2012/2013 ** 80% (408)
merSETA (merSETA, 2016) Learnerships and apprenticeships 2012-2013 ** 83% (1,030)
SASSETA (SASSETA, 2019) Learnerships, Apprenticeships, Internships 2015/2016-2017/2018
** **340
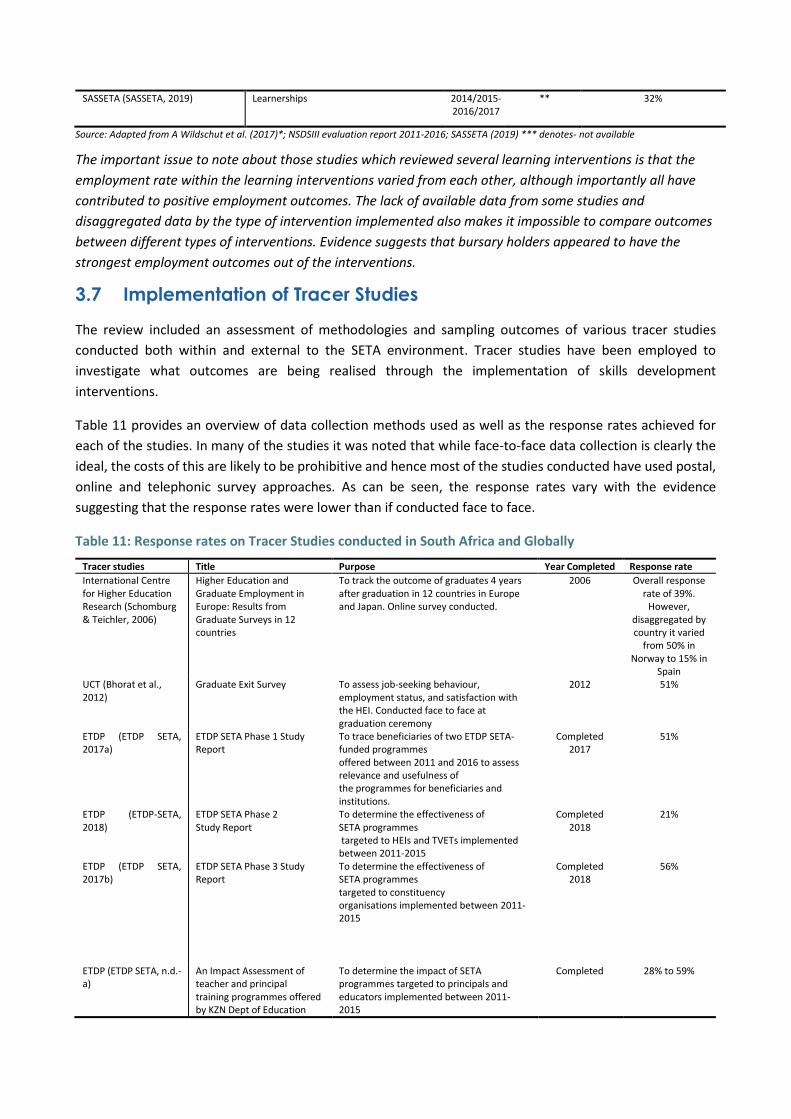
SASSETA (SASSETA, 2019) Learnerships 2014/2015-2016/2017
** 32%
Source: Adapted from A Wildschut et al. (2017)*; NSDSIII evaluation report 2011-2016; SASSETA (2019) *** denotes- not available
The important issue to note about those studies which reviewed several learning interventions is that the
employment rate within the learning interventions varied from each other, although importantly all have
contributed to positive employment outcomes. The lack of available data from some studies and
disaggregated data by the type of intervention implemented also makes it impossible to compare outcomes
between different types of interventions. Evidence suggests that bursary holders appeared to have the
strongest employment outcomes out of the interventions.
3.7 Implementation of Tracer Studies
The review included an assessment of methodologies and sampling outcomes of various tracer studies
conducted both within and external to the SETA environment. Tracer studies have been employed to
investigate what outcomes are being realised through the implementation of skills development
interventions.
Table 11 provides an overview of data collection methods used as well as the response rates achieved for
each of the studies. In many of the studies it was noted that while face-to-face data collection is clearly the
ideal, the costs of this are likely to be prohibitive and hence most of the studies conducted have used postal,
online and telephonic survey approaches. As can be seen, the response rates vary with the evidence
suggesting that the response rates were lower than if conducted face to face.
Table 11: Response rates on Tracer Studies conducted in South Africa and Globally
Tracer studies Title Purpose Year Completed Response rate
International Centre for Higher Education Research (Schomburg & Teichler, 2006)
Higher Education and Graduate Employment in Europe: Results from Graduate Surveys in 12 countries
To track the outcome of graduates 4 years after graduation in 12 countries in Europe and Japan. Online survey conducted.
2006 Overall response rate of 39%.
However, disaggregated by country it varied
from 50% in Norway to 15% in
Spain UCT (Bhorat et al., 2012)
Graduate Exit Survey To assess job-seeking behaviour, employment status, and satisfaction with the HEI. Conducted face to face at graduation ceremony
2012 51%
ETDP (ETDP SETA, 2017a)
ETDP SETA Phase 1 Study Report
To trace beneficiaries of two ETDP SETA- funded programmes offered between 2011 and 2016 to assess relevance and usefulness of the programmes for beneficiaries and institutions.
Completed 2017
51%
ETDP (ETDP-SETA, 2018)
ETDP SETA Phase 2 Study Report
To determine the effectiveness of SETA programmes targeted to HEIs and TVETs implemented between 2011-2015
Completed 2018
21%
ETDP (ETDP SETA, 2017b)
ETDP SETA Phase 3 Study Report
To determine the effectiveness of SETA programmes targeted to constituency organisations implemented between 2011-2015
Completed 2018
56%
ETDP (ETDP SETA, n.d.-a)
An Impact Assessment of teacher and principal training programmes offered by KZN Dept of Education
To determine the impact of SETA programmes targeted to principals and educators implemented between 2011-2015
Completed 28% to 59%
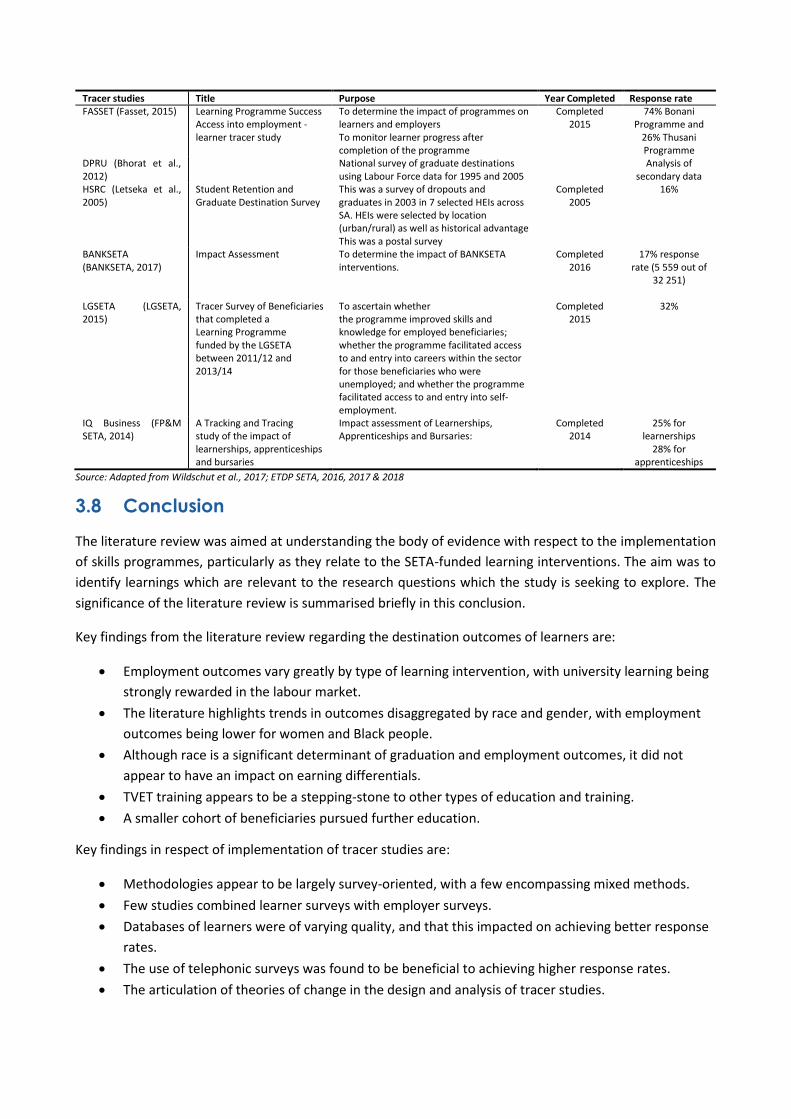
Tracer studies Title Purpose Year Completed Response rate FASSET (Fasset, 2015) Learning Programme Success
Access into employment -learner tracer study
To determine the impact of programmes on learners and employers To monitor learner progress after completion of the programme
Completed 2015
74% Bonani Programme and
26% Thusani Programme
DPRU (Bhorat et al., 2012)
National survey of graduate destinations using Labour Force data for 1995 and 2005
Analysis of secondary data
HSRC (Letseka et al., 2005)
Student Retention and Graduate Destination Survey
This was a survey of dropouts and graduates in 2003 in 7 selected HEIs across SA. HEIs were selected by location (urban/rural) as well as historical advantage This was a postal survey
Completed 2005
16%
BANKSETA (BANKSETA, 2017)
Impact Assessment To determine the impact of BANKSETA interventions.
Completed 2016
17% response rate (5 559 out of
32 251)
LGSETA (LGSETA, 2015)
Tracer Survey of Beneficiaries that completed a Learning Programme funded by the LGSETA between 2011/12 and 2013/14
To ascertain whether the programme improved skills and knowledge for employed beneficiaries; whether the programme facilitated access to and entry into careers within the sector for those beneficiaries who were unemployed; and whether the programme facilitated access to and entry into self-employment.
Completed 2015
32%
IQ Business (FP&M SETA, 2014)
A Tracking and Tracing study of the impact of learnerships, apprenticeships and bursaries
Impact assessment of Learnerships, Apprenticeships and Bursaries:
Completed 2014
25% for learnerships
28% for apprenticeships
Source: Adapted from Wildschut et al., 2017; ETDP SETA, 2016, 2017 & 2018
3.8 Conclusion
The literature review was aimed at understanding the body of evidence with respect to the implementation
of skills programmes, particularly as they relate to the SETA-funded learning interventions. The aim was to
identify learnings which are relevant to the research questions which the study is seeking to explore. The
significance of the literature review is summarised briefly in this conclusion.
Key findings from the literature review regarding the destination outcomes of learners are:
Employment outcomes vary greatly by type of learning intervention, with university learning being
strongly rewarded in the labour market.
The literature highlights trends in outcomes disaggregated by race and gender, with employment
outcomes being lower for women and Black people.
Although race is a significant determinant of graduation and employment outcomes, it did not
appear to have an impact on earning differentials.
TVET training appears to be a stepping-stone to other types of education and training.
A smaller cohort of beneficiaries pursued further education.
Key findings in respect of implementation of tracer studies are:
Methodologies appear to be largely survey-oriented, with a few encompassing mixed methods.
Few studies combined learner surveys with employer surveys.
Databases of learners were of varying quality, and that this impacted on achieving better response
rates.
The use of telephonic surveys was found to be beneficial to achieving higher response rates.
The articulation of theories of change in the design and analysis of tracer studies.

The literature review contributed to the development of the theoretical and conceptual framework for
understanding STWT in respect of this study. It made it clear that the pathways through which change has
occurred are nuanced and not linear. Interestingly, only a few studies utilised the ToC as a key component of
the methodology, which unpacks assumptions with respect to the pathways through which change has been
achieved. Its value has been in articulating these assumptions which it was intended would be tested drawing
on the study findings. Importantly, the literature review validated the key indicators as identified in the ToC,
to be measured in this study
The literature review has also informed and affirmed the nature of the questions which were included in
both the learner and the employer surveys. It also provided a lens for the gendered analysis of the findings,
given the key focus of the NSDS III on achieving gender equity objectives.
4 Methodology
4.1 Aims and objectives of the Track and Trace Study
As outlined in the Terms of Reference (ToR), the aim of this study is to provide the ETDP SETA with
information regarding the outcomes for learners who have completed one of the five learning interventions.
In addition, the study will document key features, trends and challenges arising from implementation of the
learning interventions:
To understand, explore and document key features, trends, challenges and outcomes of the skills
interventions in the ETDP sectors.
To assist in further developing a sustainable skills development strategy for the ETDP SETA, which
will contribute positively to the ETDP sector and promote inclusive economic growth in the
country.
The primary focus of the study is to understand the outcomes of programmes through the tracking
and tracing of learners supported by the SETA.
To determine whether a programme is achieving its mission and assist in demonstrating the
programme’s outcomes, by assessing the following:
o Employment status (employed, self-employed and unemployed)
o Employment rates
o Nature of employment, in terms of employment sector or types of employment, for
example:
Formal or informal
Tenure
Part time or full time
Contract or permanent
Salary levels
Benefits
Unemployment Insurance Fund (UIF)
Pension
Medical aid
Allowances
The objectives of the study and scope of work necessary for the achievement of the study objectives are as
outlined below:
To gather data about the effectiveness and impacts of five skills/learning development
interventions, namely learnerships, internships, bursaries, and WIL for UOTs and for TVETs. The
reference period for the study is the 2015/16 to 2018/19 period. The impacts could be direct or
indirect and intended or unintended.
To understand the wider effects of these interventions – social, economic and technical – on
individual beneficiaries.
To generate evidence of key achievements and challenges to inform the decision-making process
for senior management and accounting authority on programme delivery mechanisms and how
these can be improved in future on order to ensure sustainability.
To determine the nature of employment of those learners who received employment.
To pilot a survey of the perceptions of employers on the value of learnerships, WIL and internships.
Evaluation Questions
The ToR outlined the questions listed below which the study needed to explore. These were reviewed
against the study objectives:
What are the destinations of students who completed?
o Are they employed?
o Are they not working?
o Are they studying further?
If employed:
o Where are they employed (name of the company/organisation)?
o What is their occupation?
o Has there been a change in jobs since completing the learning programme?
o After the programme, has there been a difference in rank/post level?
o Are they employed full time or part time and temporary or on contract?
o What are their wages?
o What benefits and allowances are they getting?
If not in employment, why?
o Are they studying full time?
o Are they looking for employment?
o Are they ill?
o Are they looking after parents, siblings?
Scope of work
Underpinned by the HSRC’s understanding of the ToR, the following core activities, which constitute the
scope of work, were identified:
Conduct a scoping exercise to assess the state of the ETDP SETA’s programme data and data
systems;
Construct an implicit ToC in respect of each of the five learning interventions implemented by the
ETDP SETA in consultation with ETDP SETA officials;
Develop a logic framework for the interventions informed by the Theories of Change;
Undertake a desktop review of ETDP SETA documentation;
Undertake a systematic literature review of academic and grey literature on the interventions
being evaluated within the context of a post-school education and training system.
Design and test instruments for data collection with learners and current employers;
Conduct telephonic interviews with a sample of learners with a 40–60% response rate;
Conduct telephonic interviews with a sample of 20 employers;
Deliver interview data in Excel format for both learners and employers;
Produce a draft and final comprehensive Track and Trace Study report;
Present preliminary and results of the evaluation to relevant forums, as identified by the ETDP
SETA.
4.2 Determining an acceptable sample size
Two sampling statistics that have an impact on the sample size are the margin of error and the confidence
level. These are important if there is a desire to extrapolate the results across the total population of
beneficiaries inclusive of the intervention type and the year of completion. The margin of error is simply the
amount of error that we are willing to tolerate, with a lower margin of error requiring a larger sample size.
The confidence level is the amount of uncertainty we can accept, with higher levels requiring larger samples.
The adoption of a sampling approach is determined by the study objectives and available data on the total
population of a study as well as access to that population.
For this study, this sampling approach does not apply as the total population of the ETDP SETA learners for
the five learning interventions during the period 2015 to 2019 was included. The details in respect of how
the study population was arrived at and managed for the study are elaborated on in Section 4.6 of this report.
4.3 Theory-based evaluation
The HSRC proposed a theory-based mixed methodology for the study. The proposal was for the review
process to be underpinned by a theory-based design, which would seek to understand the causal through
which change is expected to occur. This approach placed emphasis on detailing the assumptions on which
the intervention logic is premised.
It was recognised that a ToC did not exist for the five learning interventions, and that this would require a
retrospective reconstruction of the ToCs as a key initial phase of the study. The objective of this exercise was
to reconstitute the ToC that captures the causal that lead to the goal intent of the SETA’s five interventions.
A secondary objective of the ToC reconstruction exercise would be to align the questions in the survey
instrument for learners which the ETDP SETA shared, to ensure that they captured the indicators in the ToC
adequately and facilitated collection of appropriate evidence.
Through a participative process involving stakeholders from the ETDP SETA across provincial and national
directorates, a ToC and results log chain in respect of each of the five learning interventions was developed.
A detailed Theory of Change and Results Framework Report is attached as Annexure 1.
In the section that follows, the narrative Theory of Change for each of the five interventions is presented.
4.4 Reconstructed Theory of Change narratives in respect of the five
learning interventions
Theory of Change: Bursaries narrative statement
The bursaries Theory of Change is defined by a series of causal pathways that show the rationale for the
intervention as articulated in the problem statement, that is:
Poor supply of skilled workers in scarce occupations and skills in the sector, which negatively
impacts the productivity of firms, which in turn affects the country’s economic growth.
Skills shortages in the sector and the country.
Lack of funding for skills development.
Lack of participation for previously disadvantaged individuals in the economy due to access issues
in post-school education and training.
If ETDP SETA invests its resources into the development of systems, guidelines and a supportive skills
development institutional framework, then it will be able to implement the BURSARY programme, which
will in turn provide opportunities for workers and the unemployed in the sector. It will allow them to enter
further education and gain qualifications in scarce and critical skills. This will increase the supply of skills to
scarce occupations and the number of people accessing higher education and vocational training from
previously disadvantaged backgrounds. This will lead to a reduction in the shortage of qualified and skilled
people in the workforce, and an increase in the number of unemployed people in post-school education. This
will eventually contribute to better service delivery, higher productivity, and skilled youth in the ETD sector,
whilst encouraging lifelong learning, and increasing access to jobs for different groups, such as women and
the disabled.
4.4.1.1 Intervention hypothesis – Bursary programme
In the context of the intervention Theory of Change, the following hypothesis can be framed:
ETDP SETA’s bursary interventions enable beneficiaries who cannot afford further education to:
Acquire new or enhanced skills and competencies to meet the demand for scarce and critical skills;
and
Gain access to new or enhanced employment or self-employment opportunities.
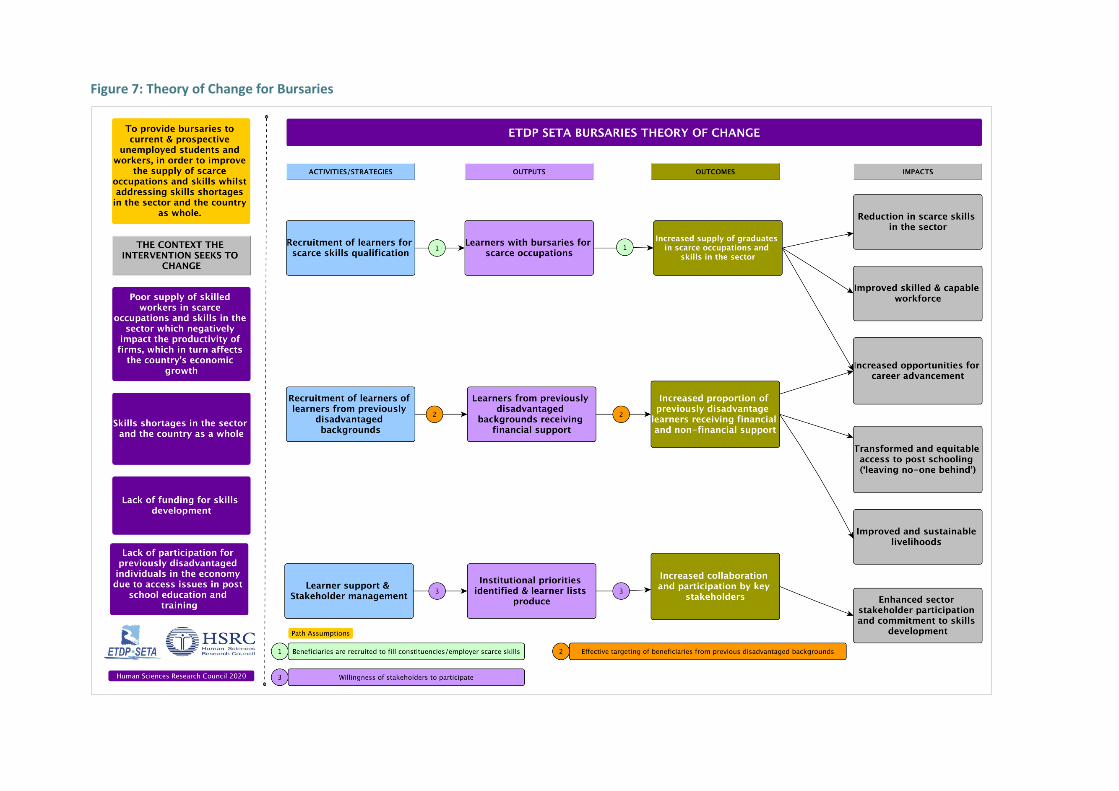
Figure 7: Theory of Change for Bursaries
Theory of Change: Learnerships narrative statement
The learnerships Theory of Change is defined by a series of causal pathways that show the rationale for the
intervention, as articulated in the problem statement, that is:
Young unemployed people lack appropriate qualifications and/or relevant practical skills for
employment.
Employed workers lack career mobility and progression in the workplace due to lack of
qualifications (for the employed).
Lack of employment opportunities (for the unemployed).
Lack of structured learning in workplaces.
Theory of Change Narrative
If ETDP SETA invests its resources into the development of systems, guidelines and a supportive skills
development institutional framework, then it will be able to implement the LEARNERSHIP programme. This
will allow learners who cannot afford full-time study, and those that cannot afford to be on a learning
programme that is not directly (or practically) related to their field of work, to further their post-school
education towards an NQF qualification. This will increase their knowledge and work experience in a cost-
effective way, that empowers them with relevant skills. This will lead to an increase in the number of learners
with job-ready skills and competencies, which in turn will enhance their opportunities for career mobility,
and progression in the workplace, due to the acquired qualifications. This will lead to an overall improvement
in the qualifications of the workforce, with increased earning capacity and sustained employment.
4.4.2.1 Intervention hypothesis – Learnerships
In the context of the intervention Theory of Change, the following hypothesis can be framed:
ETDP SETA’s learnership intervention enables beneficiaries who cannot afford full-time study, and those that
cannot afford to be on a learning programme that is not directly (or practically) related to their field of work,
to:
Enhance their skills and qualifications in a way that meets the demand for scarce and critical skills;
and
Gain access to new or enhanced employment or self-employment opportunities, including the
possibility of career mobility.
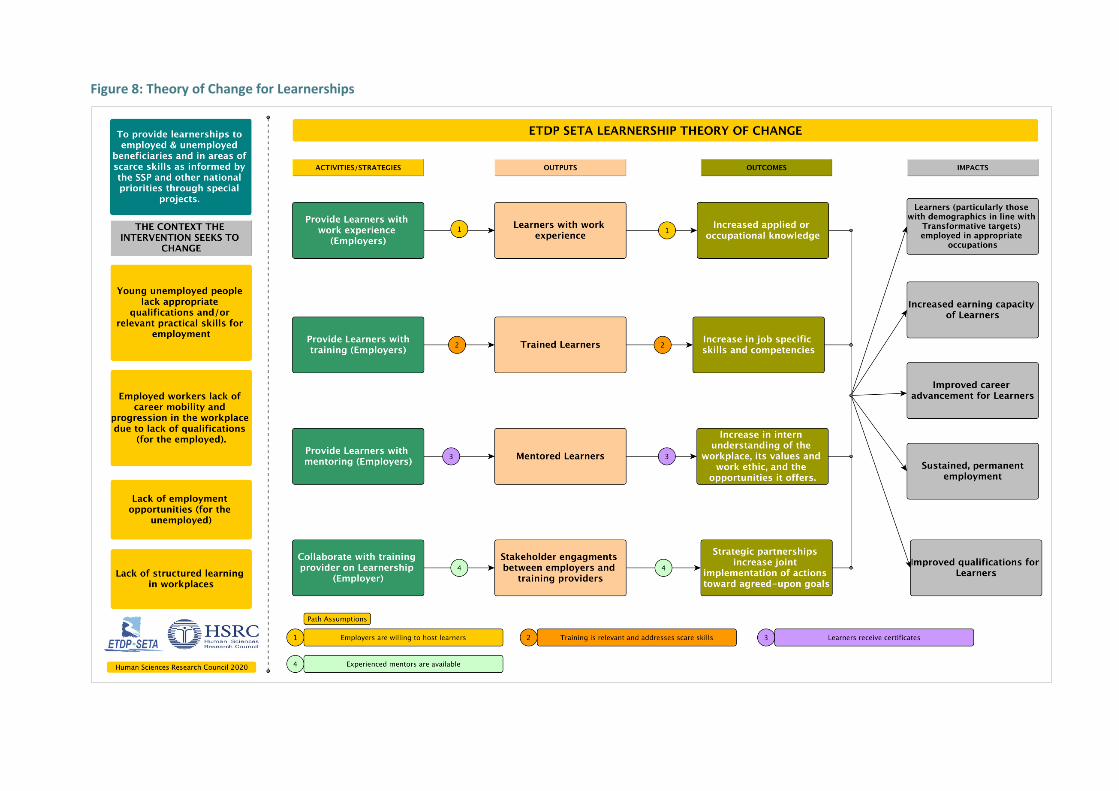
Figure 8: Theory of Change for Learnerships
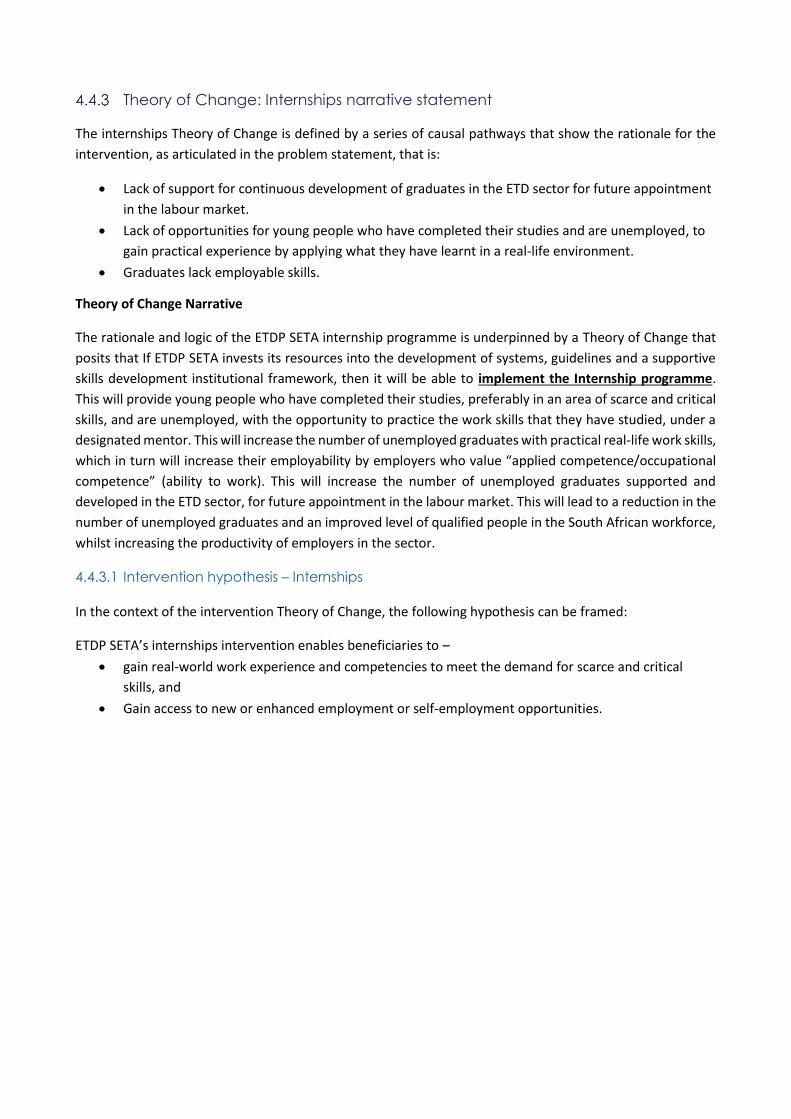
Theory of Change: Internships narrative statement
The internships Theory of Change is defined by a series of causal pathways that show the rationale for the
intervention, as articulated in the problem statement, that is:
Lack of support for continuous development of graduates in the ETD sector for future appointment
in the labour market.
Lack of opportunities for young people who have completed their studies and are unemployed, to
gain practical experience by applying what they have learnt in a real-life environment.
Graduates lack employable skills.
Theory of Change Narrative
The rationale and logic of the ETDP SETA internship programme is underpinned by a Theory of Change that
posits that If ETDP SETA invests its resources into the development of systems, guidelines and a supportive
skills development institutional framework, then it will be able to implement the Internship programme.
This will provide young people who have completed their studies, preferably in an area of scarce and critical
skills, and are unemployed, with the opportunity to practice the work skills that they have studied, under a
designated mentor. This will increase the number of unemployed graduates with practical real-life work skills,
which in turn will increase their employability by employers who value “applied competence/occupational
competence” (ability to work). This will increase the number of unemployed graduates supported and
developed in the ETD sector, for future appointment in the labour market. This will lead to a reduction in the
number of unemployed graduates and an improved level of qualified people in the South African workforce,
whilst increasing the productivity of employers in the sector.
4.4.3.1 Intervention hypothesis – Internships
In the context of the intervention Theory of Change, the following hypothesis can be framed:
ETDP SETA’s internships intervention enables beneficiaries to –
gain real-world work experience and competencies to meet the demand for scarce and critical
skills, and
Gain access to new or enhanced employment or self-employment opportunities.
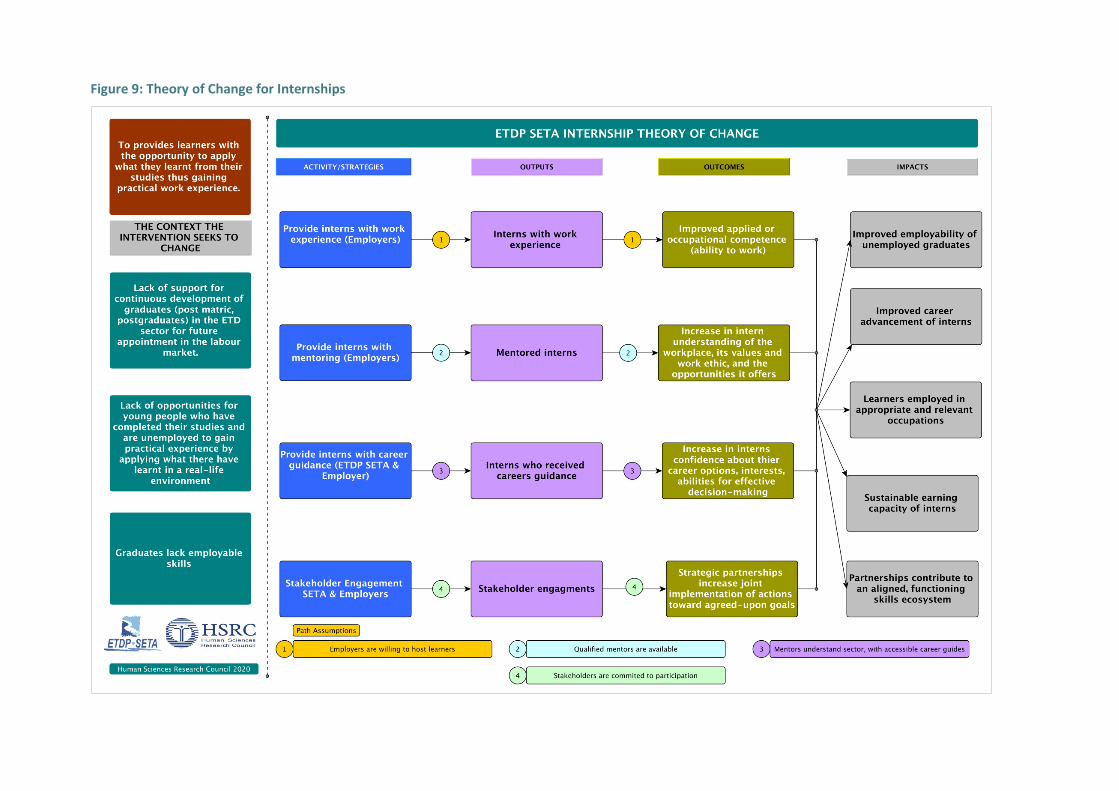
Figure 9: Theory of Change for Internships
Theory of Change: WIL TVETs narrative statement
The WIL TVET Theory of Change is defined by a series of causal pathways. It shows the rationale for the
intervention, as articulated in the problem statement, that is:
TVET students in ETD sectors are not getting structured workplace experience/exposure.
TVET students in ETD sectors are failing to fulfil the set curriculum requirements, and as such
cannot achieve various qualifications.
TVET students in ETD sectors face limited opportunities for employment or self-employment.
Theory of Change Narrative
If ETDP SETA invests its resources into the development of systems, guidelines and a supportive skills
development institutional framework, then it will be able to implement the WIL for TVET programme by
providing grants for work experience. This will allow learners in scarce and critical skills programmes to get
experience by assisting them to find employment or preparing them to become self-employed. This will allow
them to fulfil the work experience requirements of their TVET programmes, whilst increasing the supply of
scarce and critical skills in the sector. This will increase the number of TVET students in ETDP sectors accessing
structured workplace experience/exposure, and those achieving relevant qualifications. This will lead to
enhanced competencies and skills in the sector and an improved level of qualified people in the South African
workforce, whilst meeting the need for improved economic wellbeing and social development of the
workforce.
4.4.4.1 Intervention hypothesis – WIL TVETs
In the context of the intervention Theory of Change, the following hypothesis can be framed:
ETDP SETA’s WIL for TVET intervention enables TVET learners to –
fulfil the work experience requirements of their TVET programmes,
enhance their skills and qualifications in a way that meets the demand for scarce and critical skills,
and
Gain access to new or enhanced employment or self-employment opportunities, including the
possibility of career mobility.
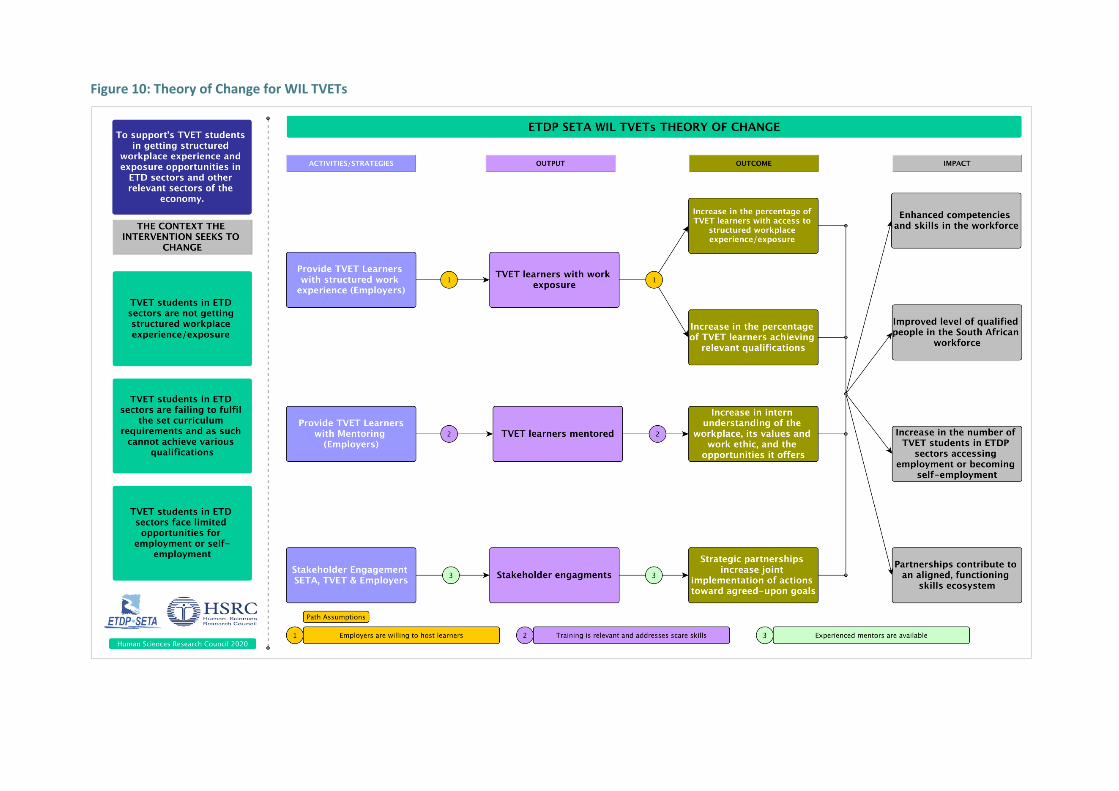
Figure 10: Theory of Change for WIL TVETs
Theory of Change: WIL UoTs narrative statement
The WIL UoTs Theory of Change is defined by a series of causal pathways. The rationale for the intervention,
as articulated in the problem statement, is that:
UoT students in ETD sectors are not getting structured workplace experience/exposure.
UoT students in ETD sectors are failing to fulfil the set curriculum requirements and as such cannot
achieve various qualifications.
UoT students in ETD sectors face limited opportunities for employment or self-employment.
Theory of Change Narrative
If ETDP SETA invests its resources into the development of systems, guidelines and a supportive skills
development institutional framework, then it will be able to implement the WIL for UoT programme by
providing grants for work experience. This will allow learners in scarce and critical skills programmes to get
experience by assisting them to find employment or preparing them to become self-employed. This will allow
them to fulfil the work experience requirements of their UoT programmes whilst increasing the supply of
scarce and critical skills in the sector. This will increase the number of UoTs students in ETDP sectors accessing
structured workplace experience/exposure and those achieving relevant qualifications. This will lead to
enhanced competencies and skills in the sector and an improved level of qualified people in the South African
workforce, whilst meeting the need for improved economic wellbeing and social development of the
workforce.
4.4.5.1 Intervention hypothesis – WIL UoTs
In the context of the intervention Theory of Change, the following hypothesis can be framed:
ETDP SETA’s WIL for UoT intervention enables UoT learners to –
fulfil their work experience requirements of their UoT programmes,
enhance their skills and qualifications in a way that meets the demand for scarce and critical skills,
and
gain access to new or enhanced employment or self-employment opportunities, including the
possibility of career mobility.
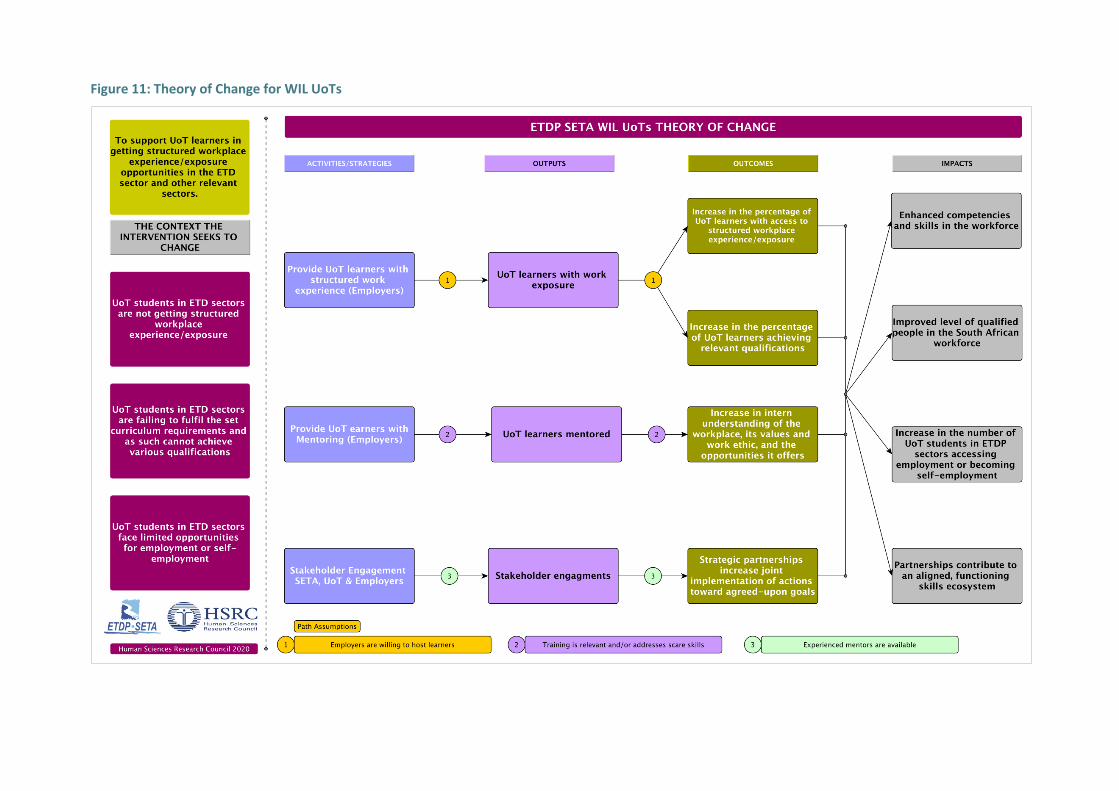
Figure 11: Theory of Change for WIL UoTs
Theory of Change for Employers
The Employer theory of change is articulated in the problem statement, that:
Employers’ needs are not addressed in respect of sourcing work ready and skilled workers;
Employers are unable to fill vacancies in scarce and critical skills;
Employers are unable to meet their employment equity targets with appropriately skilled workers.
Theory of Change Narrative
If ETDP SETA invests its resources into the development of systems, guidelines and a supportive skills
development institutional framework, then it will be able to implement learning interventions which respond
to employer needs. It will thus provide grants for skills development programmes implemented by
employers, provide bursaries for upskilling workers, provide grants for work experience and link employers
with workers requiring WBL opportunities. This will allow learners in scarce and critical skills programmes to
acquire accredited skills and access WBL experience. This will allow employers to find a pool of work-ready
and skilled workers, enable them to fill scarce and critical skills vacancies, enhance their middle and high-
level management capabilities and enable them to meet their employment equity targets. This will lead to
employers whose productivity is increased, reduced employment costs, a reduction in vacancies for scarce
and critical skills in firms and an improved level of qualified people in the South African workforce. This in
turn will contribute to economic growth and competitiveness of firms, whilst also contributing to improved
economic wellbeing and social development of the workforce.
4.4.6.1 Intervention hypothesis – Employers
In the context of the intervention Theory of Change, the following hypothesis can be framed:
ETDP SETA’s Learning and Skills development intervention enables Employers to –
contribute to an improved level of qualified people in the workforce through increased uptake of
ETDP SETA beneficiaries;
fill their scarce and critical skills vacancies;
reduce costs of employment and cost of skills development;
enhance the level of skills amongst their employees, including middle and higher-levels skills and
qualifications, in a way that meets the sector’s demand for scarce and critical skills;
promote the possibility of career mobility among the workforce;
improved employer outcomes in terms of productivity and growth of the firm; and
ensure ongoing employer involvement in ETDP SETA’s programmes and therefore increased
ownership of skills development by owners.
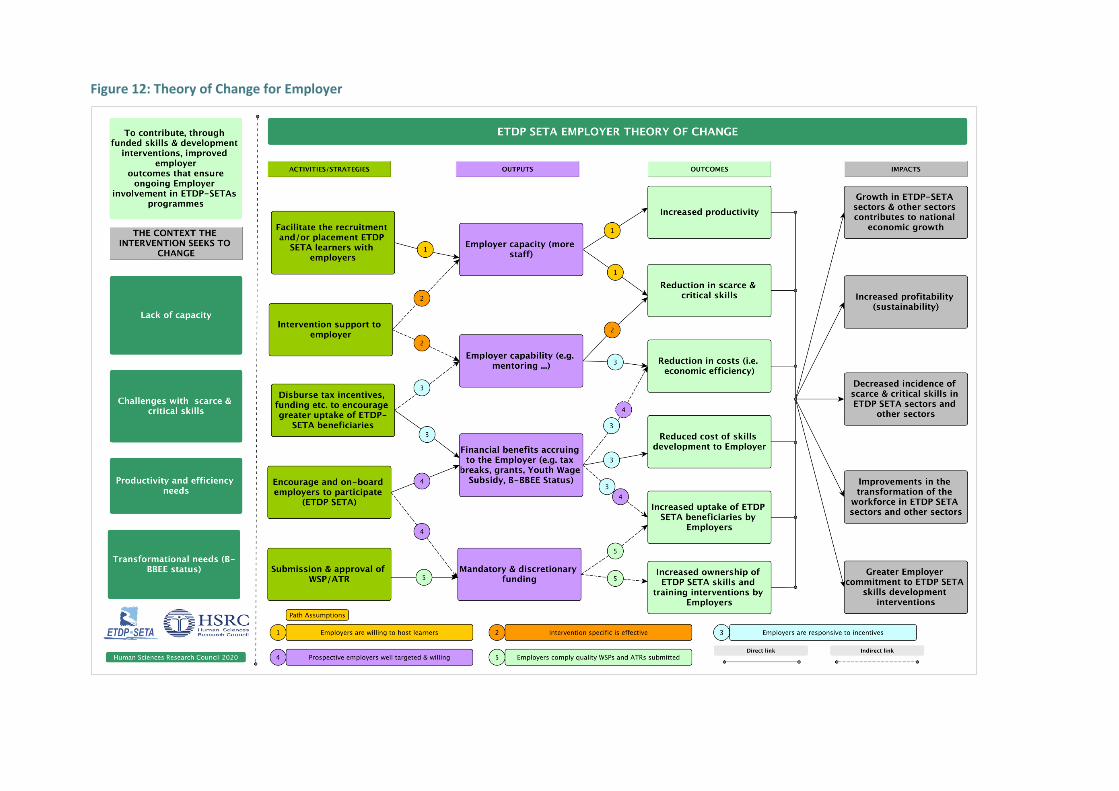
Figure 12: Theory of Change for Employer
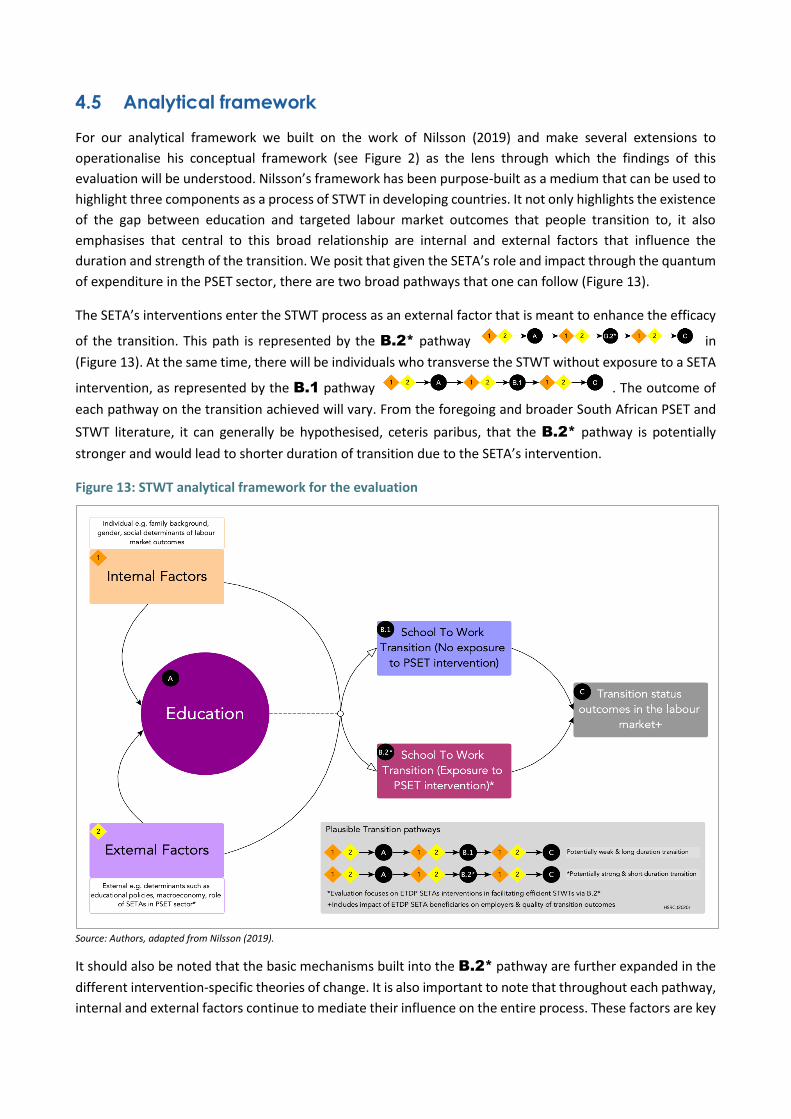
4.5 Analytical framework
For our analytical framework we built on the work of Nilsson (2019) and make several extensions to
operationalise his conceptual framework (see Figure 2) as the lens through which the findings of this
evaluation will be understood. Nilsson’s framework has been purpose-built as a medium that can be used to
highlight three components as a process of STWT in developing countries. It not only highlights the existence
of the gap between education and targeted labour market outcomes that people transition to, it also
emphasises that central to this broad relationship are internal and external factors that influence the
duration and strength of the transition. We posit that given the SETA’s role and impact through the quantum
of expenditure in the PSET sector, there are two broad pathways that one can follow (Figure 13).
The SETA’s interventions enter the STWT process as an external factor that is meant to enhance the efficacy
of the transition. This path is represented by the B.2* pathway in
(Figure 13). At the same time, there will be individuals who transverse the STWT without exposure to a SETA
intervention, as represented by the B.1 pathway . The outcome of
each pathway on the transition achieved will vary. From the foregoing and broader South African PSET and
STWT literature, it can generally be hypothesised, ceteris paribus, that the B.2* pathway is potentially
stronger and would lead to shorter duration of transition due to the SETA’s intervention.
Figure 13: STWT analytical framework for the evaluation
Source: Authors, adapted from Nilsson (2019).
It should also be noted that the basic mechanisms built into the B.2* pathway are further expanded in the
different intervention-specific theories of change. It is also important to note that throughout each pathway,
internal and external factors continue to mediate their influence on the entire process. These factors are key
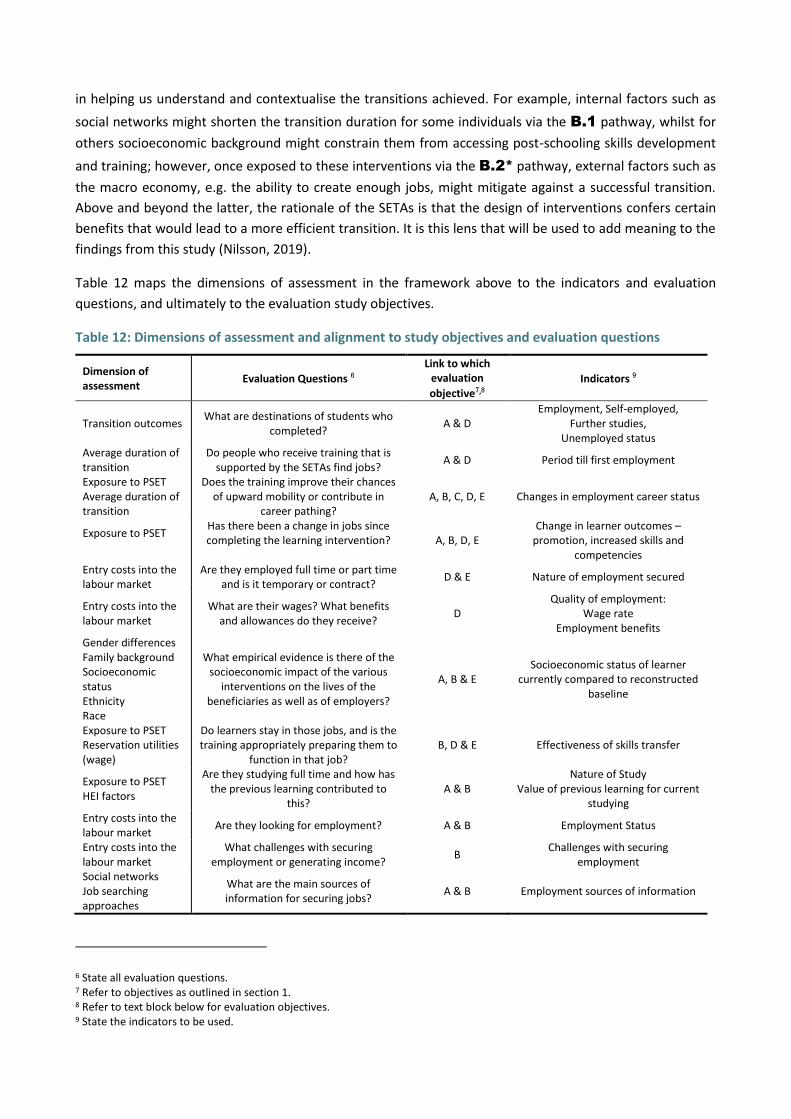
in helping us understand and contextualise the transitions achieved. For example, internal factors such as
social networks might shorten the transition duration for some individuals via the B.1 pathway, whilst for
others socioeconomic background might constrain them from accessing post-schooling skills development
and training; however, once exposed to these interventions via the B.2* pathway, external factors such as
the macro economy, e.g. the ability to create enough jobs, might mitigate against a successful transition.
Above and beyond the latter, the rationale of the SETAs is that the design of interventions confers certain
benefits that would lead to a more efficient transition. It is this lens that will be used to add meaning to the
findings from this study (Nilsson, 2019).
Table 12 maps the dimensions of assessment in the framework above to the indicators and evaluation
questions, and ultimately to the evaluation study objectives.
Table 12: Dimensions of assessment and alignment to study objectives and evaluation questions
Dimension of assessment
Evaluation Questions 6
Link to which evaluation
objective7,8 Indicators 9
Transition outcomes What are destinations of students who
completed? A & D
Employment, Self-employed, Further studies,
Unemployed status Average duration of transition
Do people who receive training that is supported by the SETAs find jobs?
A & D Period till first employment
Exposure to PSET Average duration of transition
Does the training improve their chances of upward mobility or contribute in
career pathing? A, B, C, D, E Changes in employment career status
Exposure to PSET
Has there been a change in jobs since completing the learning intervention?
A, B, D, E
Change in learner outcomes – promotion, increased skills and
competencies Entry costs into the labour market
Are they employed full time or part time and is it temporary or contract?
D & E Nature of employment secured
Entry costs into the labour market
What are their wages? What benefits and allowances do they receive?
D Quality of employment:
Wage rate Employment benefits
Gender differences Family background Socioeconomic status Ethnicity Race
What empirical evidence is there of the socioeconomic impact of the various
interventions on the lives of the beneficiaries as well as of employers?
A, B & E Socioeconomic status of learner
currently compared to reconstructed baseline
Exposure to PSET Reservation utilities (wage)
Do learners stay in those jobs, and is the training appropriately preparing them to
function in that job? B, D & E Effectiveness of skills transfer
Exposure to PSET HEI factors
Are they studying full time and how has the previous learning contributed to
this? A & B
Nature of Study Value of previous learning for current
studying Entry costs into the labour market
Are they looking for employment? A & B Employment Status
Entry costs into the labour market
What challenges with securing employment or generating income?
B Challenges with securing
employment Social networks Job searching approaches
What are the main sources of information for securing jobs?
A & B Employment sources of information
6 State all evaluation questions. 7 Refer to objectives as outlined in section 1. 8 Refer to text block below for evaluation objectives. 9 State the indicators to be used.
Dimension of assessment
Evaluation Questions 6
Link to which evaluation
objective7,8 Indicators 9
Individual ability and academic attainment
If unemployed, why? How are they supporting themselves?
B Reasons for unemployed
Support while unemployed
Source: Authors
As is evident from Table 12 above, several dimensions of assessment respond to the study objectives. The
objectives are listed below for ease of reference.
ETDP SETA TRACER STUDY OBJECTIVES
Learning intervention effectiveness and impacts: To gather data about the effectiveness and impacts of five
skills/learning development interventions, namely: learnerships, internships, bursaries, workplace-
integrated learning for universities of technology and for technical and vocational education training
institutions. The reference period for the study is the 2015/16 to 2018/19 period. The impacts could be direct
or indirect and intended or unintended;
Beneficiary wider impacts: To understand the wider effects of these interventions – social, economic and
technical – on individual beneficiaries;
Achievements and challenges: To generate evidence of key achievements and challenges to inform the
decision-making process for senior management and accounting authority on programme delivery
mechanisms and how these can be improved in the future on order to ensure sustainability;
Nature of employment: To determine the nature of employment of learners who received employment; and
Employer perceptions: To pilot a survey of the perceptions of employers on the value of learnerships, WIL
and internships.
4.6 Learner Survey Sampling
Learner Population
The Terms of Reference (ToR) for the study had provided an indicative population to inform sampling with a
specified number of learners who had completed learnerships, internships, bursaries and workplace
integrated learning (WiL TVETs and WiL UoTs) interventions. The ToR specified a sample size of between 40%
and 60%. The databases provided by ETDP SETA in respect of the study population comprised of 16 Excel
Quarterly Management Reports for all quarters over the financial years 2015/16 to 2018/19 and 5 Excel
Indicium generated reports for each skills project for all quarters over the financial period 2016/17 to
2018/19.
The database assessment sought to determine the number of beneficiaries with valid and current contact
details. A database assessment exercise focused on the development of the sample frame and this revealed
that the total realised population of learners with contact details was significantly lower, at 7,438 compared
with 10,003 from the ToR, across all five interventions and the reference period of 2015/16 to 2018/19. Using
this revised total population of 7,438 the sample size at 40% and 60% was recalculated.
A critical limitation of tracer studies is the assumption that the database of learners is comprehensive. A
review of tracer studies conducted in South Africa had reported low response rates and had noted that this
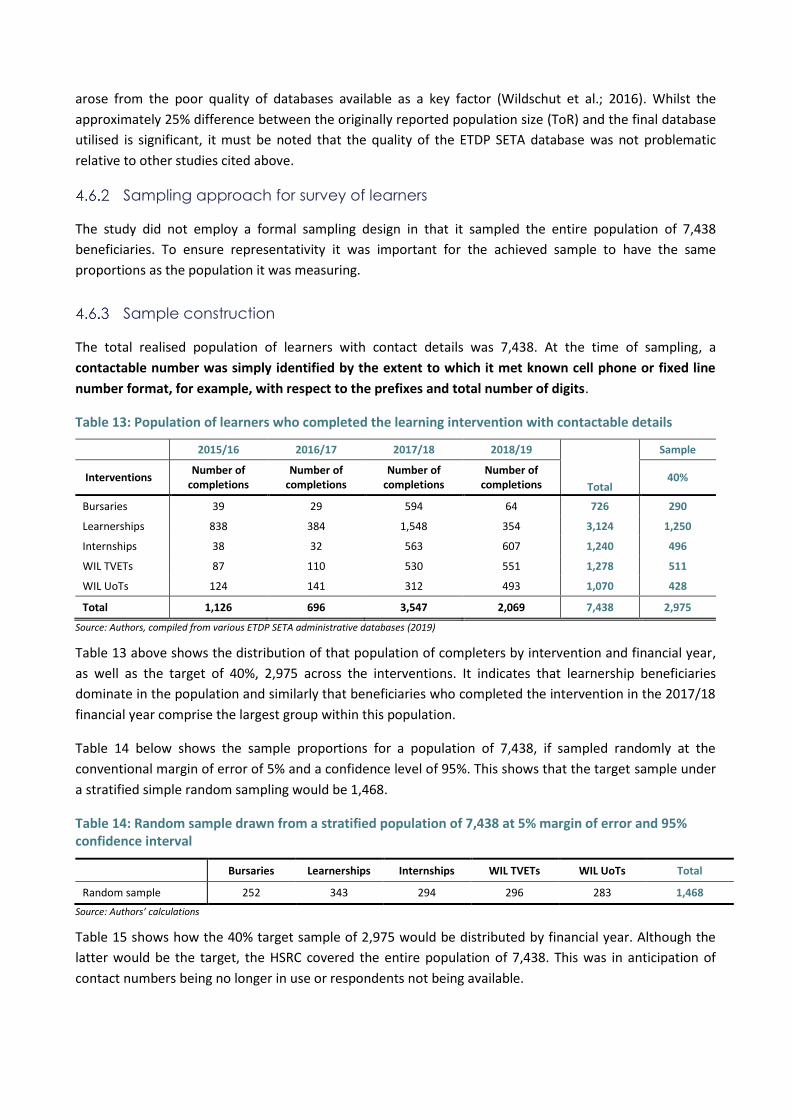
arose from the poor quality of databases available as a key factor (Wildschut et al.; 2016). Whilst the
approximately 25% difference between the originally reported population size (ToR) and the final database
utilised is significant, it must be noted that the quality of the ETDP SETA database was not problematic
relative to other studies cited above.
Sampling approach for survey of learners
The study did not employ a formal sampling design in that it sampled the entire population of 7,438
beneficiaries. To ensure representativity it was important for the achieved sample to have the same
proportions as the population it was measuring.
Sample construction
The total realised population of learners with contact details was 7,438. At the time of sampling, a
contactable number was simply identified by the extent to which it met known cell phone or fixed line
number format, for example, with respect to the prefixes and total number of digits.
Table 13: Population of learners who completed the learning intervention with contactable details
2015/16 2016/17 2017/18 2018/19 Sample
Interventions Number of
completions Number of
completions Number of
completions Number of
completions Total 40%
Bursaries 39 29 594 64 726 290
Learnerships 838 384 1,548 354 3,124 1,250
Internships 38 32 563 607 1,240 496
WIL TVETs 87 110 530 551 1,278 511
WIL UoTs 124 141 312 493 1,070 428
Total 1,126 696 3,547 2,069 7,438 2,975
Source: Authors, compiled from various ETDP SETA administrative databases (2019)
Table 13 above shows the distribution of that population of completers by intervention and financial year,
as well as the target of 40%, 2,975 across the interventions. It indicates that learnership beneficiaries
dominate in the population and similarly that beneficiaries who completed the intervention in the 2017/18
financial year comprise the largest group within this population.
Table 14 below shows the sample proportions for a population of 7,438, if sampled randomly at the
conventional margin of error of 5% and a confidence level of 95%. This shows that the target sample under
a stratified simple random sampling would be 1,468.
Table 14: Random sample drawn from a stratified population of 7,438 at 5% margin of error and 95% confidence interval
Bursaries Learnerships Internships WIL TVETs WIL UoTs Total
Random sample 252 343 294 296 283 1,468
Source: Authors’ calculations
Table 15 shows how the 40% target sample of 2,975 would be distributed by financial year. Although the
latter would be the target, the HSRC covered the entire population of 7,438. This was in anticipation of
contact numbers being no longer in use or respondents not being available.
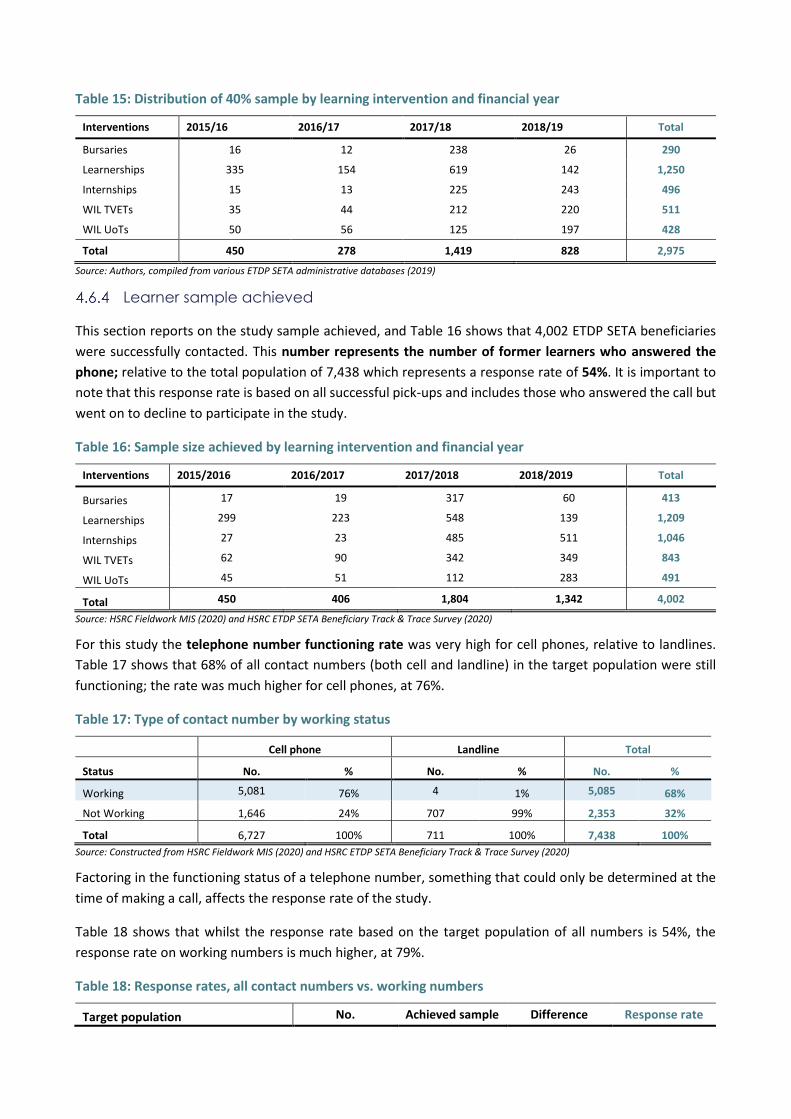
Table 15: Distribution of 40% sample by learning intervention and financial year
Interventions 2015/16 2016/17 2017/18 2018/19 Total
Bursaries 16 12 238 26 290
Learnerships 335 154 619 142 1,250
Internships 15 13 225 243 496
WIL TVETs 35 44 212 220 511
WIL UoTs 50 56 125 197 428
Total 450 278 1,419 828 2,975
Source: Authors, compiled from various ETDP SETA administrative databases (2019)
Learner sample achieved
This section reports on the study sample achieved, and Table 16 shows that 4,002 ETDP SETA beneficiaries
were successfully contacted. This number represents the number of former learners who answered the
phone; relative to the total population of 7,438 which represents a response rate of 54%. It is important to
note that this response rate is based on all successful pick-ups and includes those who answered the call but
went on to decline to participate in the study.
Table 16: Sample size achieved by learning intervention and financial year
Interventions 2015/2016 2016/2017 2017/2018 2018/2019 Total
Bursaries 17 19 317 60 413
Learnerships 299 223 548 139 1,209
Internships 27 23 485 511 1,046
WIL TVETs 62 90 342 349 843
WIL UoTs 45 51 112 283 491
Total 450 406 1,804 1,342 4,002
Source: HSRC Fieldwork MIS (2020) and HSRC ETDP SETA Beneficiary Track & Trace Survey (2020)
For this study the telephone number functioning rate was very high for cell phones, relative to landlines.
Table 17 shows that 68% of all contact numbers (both cell and landline) in the target population were still
functioning; the rate was much higher for cell phones, at 76%.
Table 17: Type of contact number by working status
Cell phone Landline Total
Status No. % No. % No. %
Working 5,081 76% 4 1% 5,085 68%
Not Working 1,646 24% 707 99% 2,353 32%
Total 6,727 100% 711 100% 7,438 100%
Source: Constructed from HSRC Fieldwork MIS (2020) and HSRC ETDP SETA Beneficiary Track & Trace Survey (2020)
Factoring in the functioning status of a telephone number, something that could only be determined at the
time of making a call, affects the response rate of the study.
Table 18 shows that whilst the response rate based on the target population of all numbers is 54%, the
response rate on working numbers is much higher, at 79%.
Table 18: Response rates, all contact numbers vs. working numbers
Target population No. Achieved sample Difference Response rate
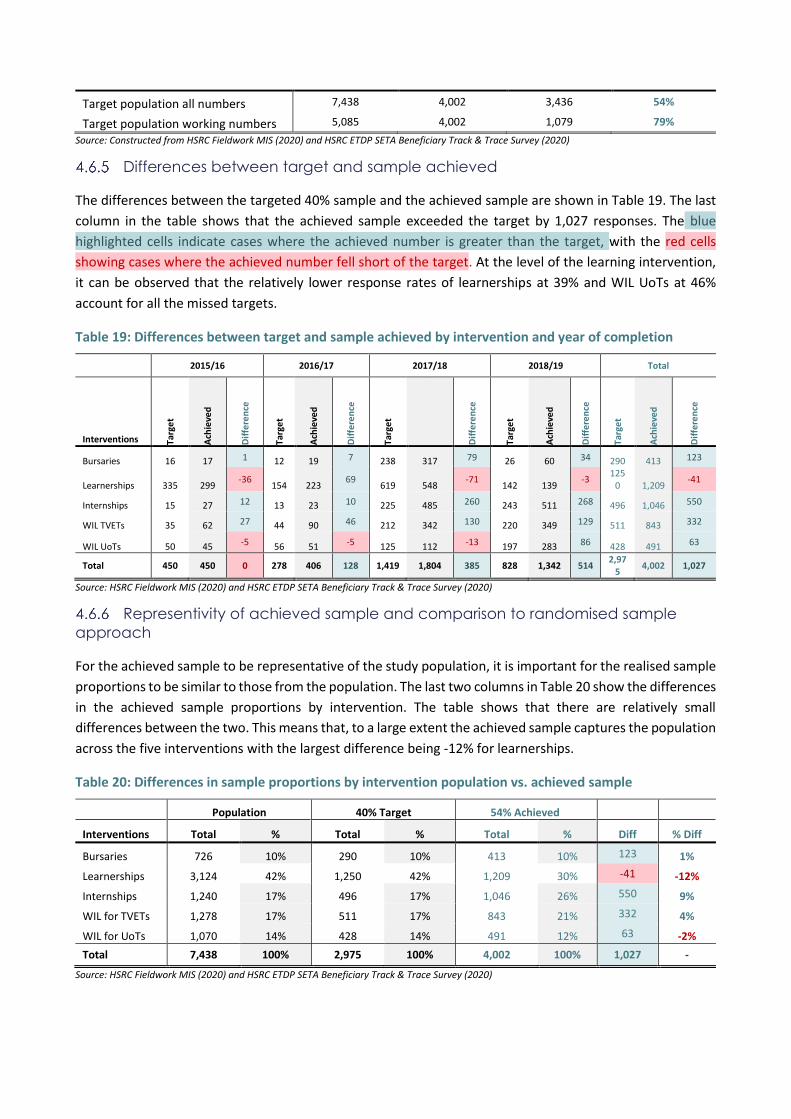
Target population all numbers 7,438 4,002 3,436 54%
Target population working numbers 5,085 4,002 1,079 79%
Source: Constructed from HSRC Fieldwork MIS (2020) and HSRC ETDP SETA Beneficiary Track & Trace Survey (2020)
Differences between target and sample achieved
The differences between the targeted 40% sample and the achieved sample are shown in Table 19. The last
column in the table shows that the achieved sample exceeded the target by 1,027 responses. The blue
highlighted cells indicate cases where the achieved number is greater than the target, with the red cells
showing cases where the achieved number fell short of the target. At the level of the learning intervention,
it can be observed that the relatively lower response rates of learnerships at 39% and WIL UoTs at 46%
account for all the missed targets.
Table 19: Differences between target and sample achieved by intervention and year of completion
2015/16 2016/17 2017/18 2018/19 Total
Interventions Targ
et
Ach
ieve
d
Dif
fere
nce
Targ
et
Ach
ieve
d
Dif
fere
nce
Targ
et
Dif
fere
nce
Targ
et
Ach
ieve
d
Dif
fere
nce
Targ
et
Ach
ieve
d
Dif
fere
nce
Bursaries 16 17 1 12 19 7 238 317 79 26 60 34 290 413 123
Learnerships 335 299 -36
154 223 69
619 548 -71
142 139 -3
1250 1,209
-41
Internships 15 27 12 13 23 10 225 485 260 243 511 268 496 1,046 550
WIL TVETs 35 62 27 44 90 46 212 342 130 220 349 129 511 843 332
WIL UoTs 50 45 -5 56 51 -5 125 112 -13 197 283 86 428 491 63
Total 450 450 0 278 406 128 1,419 1,804 385 828 1,342 514 2,97
5 4,002 1,027
Source: HSRC Fieldwork MIS (2020) and HSRC ETDP SETA Beneficiary Track & Trace Survey (2020)
Representivity of achieved sample and comparison to randomised sample
approach
For the achieved sample to be representative of the study population, it is important for the realised sample
proportions to be similar to those from the population. The last two columns in Table 20 show the differences
in the achieved sample proportions by intervention. The table shows that there are relatively small
differences between the two. This means that, to a large extent the achieved sample captures the population
across the five interventions with the largest difference being -12% for learnerships.
Table 20: Differences in sample proportions by intervention population vs. achieved sample
Population 40% Target 54% Achieved
Interventions Total % Total % Total % Diff % Diff
Bursaries 726 10% 290 10% 413 10% 123 1%
Learnerships 3,124 42% 1,250 42% 1,209 30% -41 -12%
Internships 1,240 17% 496 17% 1,046 26% 550 9%
WIL for TVETs 1,278 17% 511 17% 843 21% 332 4%
WIL for UoTs 1,070 14% 428 14% 491 12% 63 -2%
Total 7,438 100% 2,975 100% 4,002 100% 1,027 -
Source: HSRC Fieldwork MIS (2020) and HSRC ETDP SETA Beneficiary Track & Trace Survey (2020)
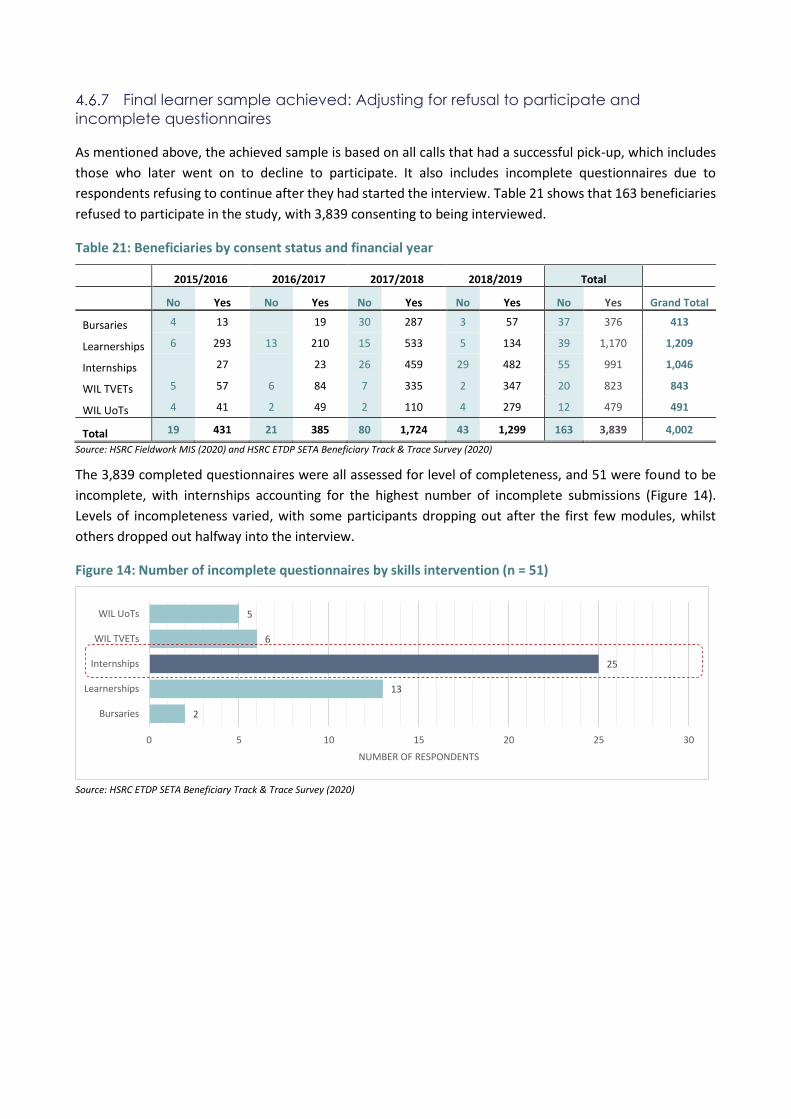
Final learner sample achieved: Adjusting for refusal to participate and
incomplete questionnaires
As mentioned above, the achieved sample is based on all calls that had a successful pick-up, which includes
those who later went on to decline to participate. It also includes incomplete questionnaires due to
respondents refusing to continue after they had started the interview. Table 21 shows that 163 beneficiaries
refused to participate in the study, with 3,839 consenting to being interviewed.
Table 21: Beneficiaries by consent status and financial year
2015/2016 2016/2017 2017/2018 2018/2019 Total
No Yes No Yes No Yes No Yes No Yes Grand Total
Bursaries 4 13 19 30 287 3 57 37 376 413
Learnerships 6 293 13 210 15 533 5 134 39 1,170 1,209
Internships 27 23 26 459 29 482 55 991 1,046
WIL TVETs 5 57 6 84 7 335 2 347 20 823 843
WIL UoTs 4 41 2 49 2 110 4 279 12 479 491
Total 19 431 21 385 80 1,724 43 1,299 163 3,839 4,002
Source: HSRC Fieldwork MIS (2020) and HSRC ETDP SETA Beneficiary Track & Trace Survey (2020)
The 3,839 completed questionnaires were all assessed for level of completeness, and 51 were found to be
incomplete, with internships accounting for the highest number of incomplete submissions (Figure 14).
Levels of incompleteness varied, with some participants dropping out after the first few modules, whilst
others dropped out halfway into the interview.
Figure 14: Number of incomplete questionnaires by skills intervention (n = 51)
Source: HSRC ETDP SETA Beneficiary Track & Trace Survey (2020)
2
13
25
6
5
0 5 10 15 20 25 30
Bursaries
Learnerships
Internships
WIL TVETs
WIL UoTs
NUMBER OF RESPONDENTS
Table 22 shows the final realised sample of 3,788 that fed into the study analysis.
Table 22: Final realised sample after adjusting for incomplete questionnaires vs targeted sample
Intervention 2015/2016 2016/2017 2017/2018 2018/2019 Total
Targ
et
Ach
ieve
d
Targ
et
Ach
ieve
d
Targ
et
Ach
ieve
d
Targ
et
Ach
ieve
d
Targ
et
Ach
ieve
d
Bursaries 16 13 12 19 238 285 26 57 290 374
Learnerships 335 292 154 206 619 528 142 131 1250 1,157
Internships 15 27 13 22 225 449 243 468 496 966
WIL TVETs 35 56 44 84 212 333 220 344 511 817
WIL UoTs 50 41 56 48 125 109 197 276 428 491
Total 450 429 278 379 1,419 1,704 828 1,276 2,975 3,788
Source: HSRC ETDP SETA Beneficiary Track & Trace Survey (2020)
The final sample, as indicated in Table 22 above, indicates that across all interventions except learnerships
the target sample size was exceeded and similarly across all years when the intervention was completed the
target sample was exceeded, with the exception of the 2015/16 financial year.
Response rate
This section provides an overview of beneficiaries who were sampled for this ETDP SETA tracer study. Figure
15 shows that 3,788 beneficiaries of the ETDP SETA programme consented to participate in the study, that
is, 95% of the total sample, with only 5% refusing to participate. Participants in internships made up the
largest percentage (30%) of those who consented, while those receiving bursaries (12%) and learnerships
(10%) had the lowest percentages.
Figure 15: Final consent achieved, by learning intervention (n = 3,788)
Source: HSRC ETDP SETA Beneficiary Track & Trace Survey (2020)
The consent was also analysed by the financial years for which the beneficiaries were enrolled in the ETDP
SETA programme. The results in Figure 16 show that out of the 3,788 population, the majority of 45
beneficiaries were in the programme between the 2017/18 and 2018/19 financial years.
10%
30%
26%
21%
12%
0% 5% 10% 15% 20% 25% 30% 35% 40% 45% 50%
Learnership
Internship
WIL TVETs
WIL UoTs
Bursaries
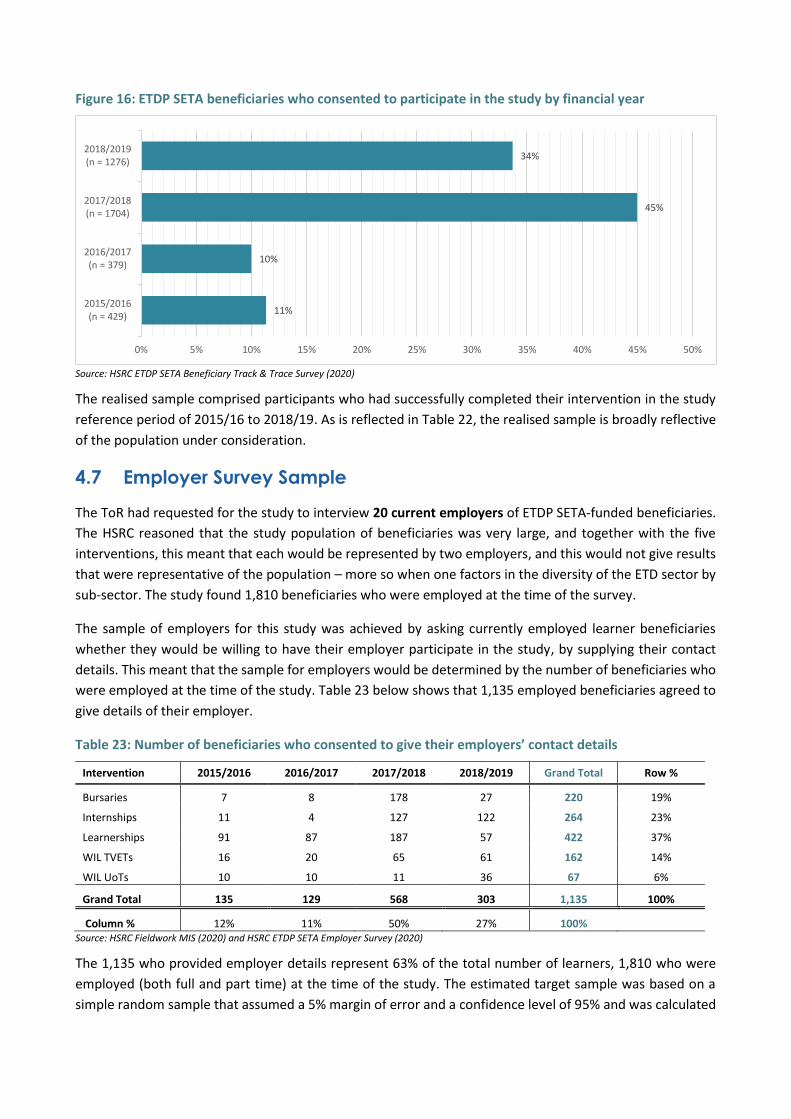
Figure 16: ETDP SETA beneficiaries who consented to participate in the study by financial year
Source: HSRC ETDP SETA Beneficiary Track & Trace Survey (2020)
The realised sample comprised participants who had successfully completed their intervention in the study
reference period of 2015/16 to 2018/19. As is reflected in Table 22, the realised sample is broadly reflective
of the population under consideration.
4.7 Employer Survey Sample
The ToR had requested for the study to interview 20 current employers of ETDP SETA-funded beneficiaries.
The HSRC reasoned that the study population of beneficiaries was very large, and together with the five
interventions, this meant that each would be represented by two employers, and this would not give results
that were representative of the population – more so when one factors in the diversity of the ETD sector by
sub-sector. The study found 1,810 beneficiaries who were employed at the time of the survey.
The sample of employers for this study was achieved by asking currently employed learner beneficiaries
whether they would be willing to have their employer participate in the study, by supplying their contact
details. This meant that the sample for employers would be determined by the number of beneficiaries who
were employed at the time of the study. Table 23 below shows that 1,135 employed beneficiaries agreed to
give details of their employer.
Table 23: Number of beneficiaries who consented to give their employers’ contact details
Intervention 2015/2016 2016/2017 2017/2018 2018/2019 Grand Total Row %
Bursaries 7 8 178 27 220 19%
Internships 11 4 127 122 264 23%
Learnerships 91 87 187 57 422 37%
WIL TVETs 16 20 65 61 162 14%
WIL UoTs 10 10 11 36 67 6%
Grand Total 135 129 568 303 1,135 100%
Column % 12% 11% 50% 27% 100% Source: HSRC Fieldwork MIS (2020) and HSRC ETDP SETA Employer Survey (2020)
The 1,135 who provided employer details represent 63% of the total number of learners, 1,810 who were
employed (both full and part time) at the time of the study. The estimated target sample was based on a
simple random sample that assumed a 5% margin of error and a confidence level of 95% and was calculated
11%
10%
45%
34%
0% 5% 10% 15% 20% 25% 30% 35% 40% 45% 50%
2015/2016(n = 429)
2016/2017(n = 379)
2017/2018(n = 1704)
2018/2019(n = 1276)
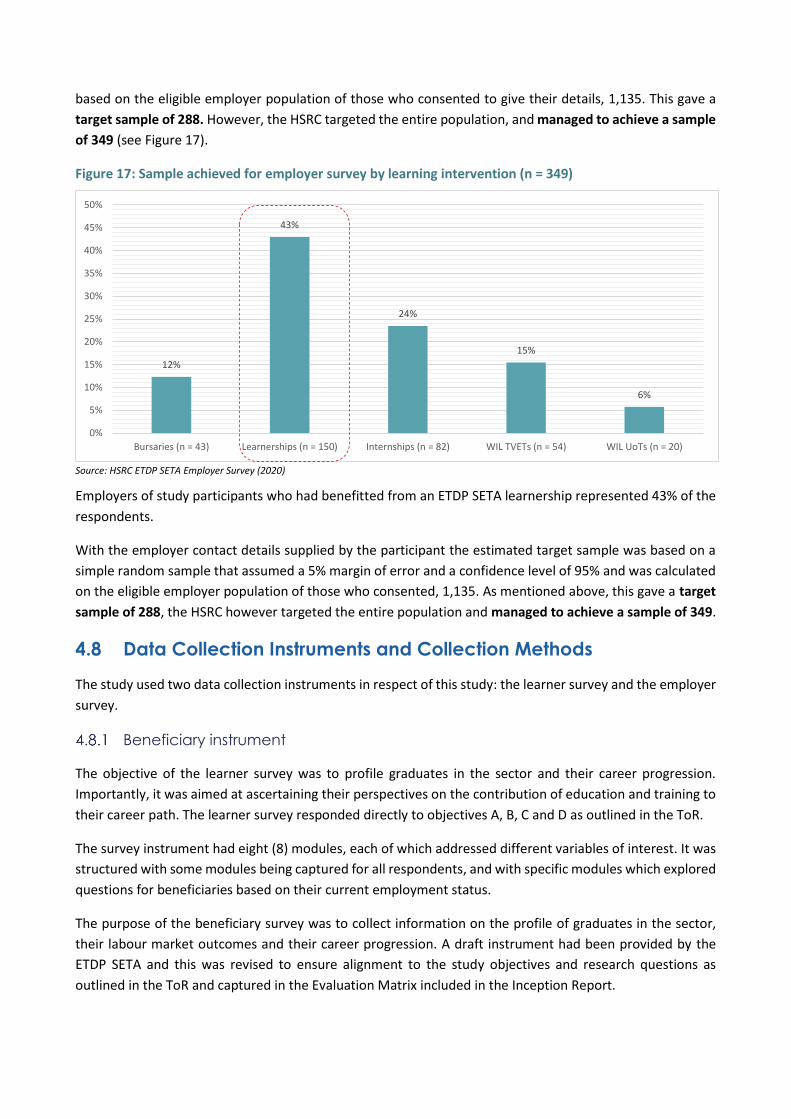
based on the eligible employer population of those who consented to give their details, 1,135. This gave a
target sample of 288. However, the HSRC targeted the entire population, and managed to achieve a sample
of 349 (see Figure 17).
Figure 17: Sample achieved for employer survey by learning intervention (n = 349)
Source: HSRC ETDP SETA Employer Survey (2020)
Employers of study participants who had benefitted from an ETDP SETA learnership represented 43% of the
respondents.
With the employer contact details supplied by the participant the estimated target sample was based on a
simple random sample that assumed a 5% margin of error and a confidence level of 95% and was calculated
on the eligible employer population of those who consented, 1,135. As mentioned above, this gave a target
sample of 288, the HSRC however targeted the entire population and managed to achieve a sample of 349.
4.8 Data Collection Instruments and Collection Methods
The study used two data collection instruments in respect of this study: the learner survey and the employer
survey.
Beneficiary instrument
The objective of the learner survey was to profile graduates in the sector and their career progression.
Importantly, it was aimed at ascertaining their perspectives on the contribution of education and training to
their career path. The learner survey responded directly to objectives A, B, C and D as outlined in the ToR.
The survey instrument had eight (8) modules, each of which addressed different variables of interest. It was
structured with some modules being captured for all respondents, and with specific modules which explored
questions for beneficiaries based on their current employment status.
The purpose of the beneficiary survey was to collect information on the profile of graduates in the sector,
their labour market outcomes and their career progression. A draft instrument had been provided by the
ETDP SETA and this was revised to ensure alignment to the study objectives and research questions as
outlined in the ToR and captured in the Evaluation Matrix included in the Inception Report.
12%
43%
24%
15%
6%
0%
5%
10%
15%
20%
25%
30%
35%
40%
45%
50%
Bursaries (n = 43) Learnerships (n = 150) Internships (n = 82) WIL TVETs (n = 54) WIL UoTs (n = 20)
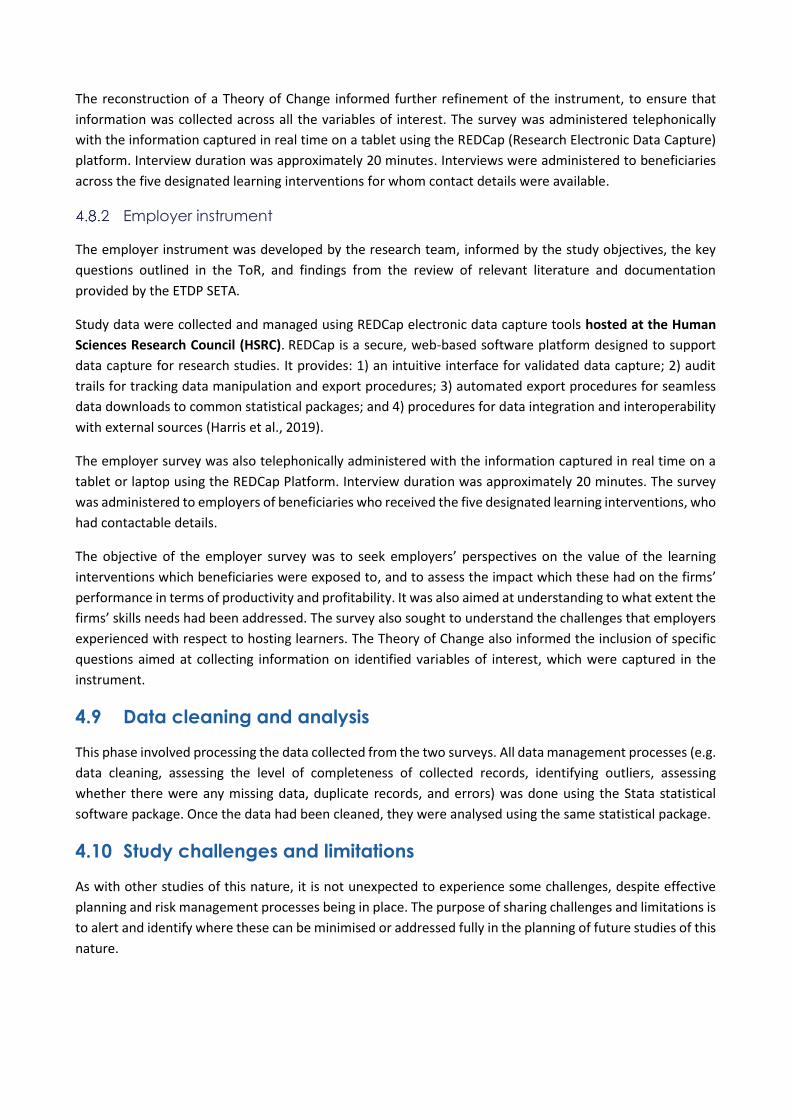
The reconstruction of a Theory of Change informed further refinement of the instrument, to ensure that
information was collected across all the variables of interest. The survey was administered telephonically
with the information captured in real time on a tablet using the REDCap (Research Electronic Data Capture)
platform. Interview duration was approximately 20 minutes. Interviews were administered to beneficiaries
across the five designated learning interventions for whom contact details were available.
Employer instrument
The employer instrument was developed by the research team, informed by the study objectives, the key
questions outlined in the ToR, and findings from the review of relevant literature and documentation
provided by the ETDP SETA.
Study data were collected and managed using REDCap electronic data capture tools hosted at the Human
Sciences Research Council (HSRC). REDCap is a secure, web-based software platform designed to support
data capture for research studies. It provides: 1) an intuitive interface for validated data capture; 2) audit
trails for tracking data manipulation and export procedures; 3) automated export procedures for seamless
data downloads to common statistical packages; and 4) procedures for data integration and interoperability
with external sources (Harris et al., 2019).
The employer survey was also telephonically administered with the information captured in real time on a
tablet or laptop using the REDCap Platform. Interview duration was approximately 20 minutes. The survey
was administered to employers of beneficiaries who received the five designated learning interventions, who
had contactable details.
The objective of the employer survey was to seek employers’ perspectives on the value of the learning
interventions which beneficiaries were exposed to, and to assess the impact which these had on the firms’
performance in terms of productivity and profitability. It was also aimed at understanding to what extent the
firms’ skills needs had been addressed. The survey also sought to understand the challenges that employers
experienced with respect to hosting learners. The Theory of Change also informed the inclusion of specific
questions aimed at collecting information on identified variables of interest, which were captured in the
instrument.
4.9 Data cleaning and analysis
This phase involved processing the data collected from the two surveys. All data management processes (e.g.
data cleaning, assessing the level of completeness of collected records, identifying outliers, assessing
whether there were any missing data, duplicate records, and errors) was done using the Stata statistical
software package. Once the data had been cleaned, they were analysed using the same statistical package.
4.10 Study challenges and limitations
As with other studies of this nature, it is not unexpected to experience some challenges, despite effective
planning and risk management processes being in place. The purpose of sharing challenges and limitations is
to alert and identify where these can be minimised or addressed fully in the planning of future studies of this
nature.
Beneficiary survey challenges
4.10.1.1 Beneficiary Population Database
A key concern for tracer studies has been the availability of a database with current contact details for the
beneficiaries. Evidence from an ETDP SETA study and from other tracer studies in South Africa had recorded
low response rates of between 15-35% with the key factor influencing this noted as primarily uncontactable
respondents, followed by respondents who were unwilling or unable to participate and incomplete
interviews or other circumstances (ETDP SETA, 2017; Wildschut et al., 2017). In anticipation of this challenge,
the mitigation strategy adopted was the inclusion of the entire population of beneficiaries with contact
details as the study sample.
4.10.1.2 Not seeing the need to participate and fears of being scammed
First and foremost, some learners did not understand why they needed to participate in a study of this
nature, even with fieldworkers explaining the reasons to them over the phone. Once information sheets and
consent forms with shared with them via WhatsApp or email, most were happy to participate. However, a
few respondents remained suspicious; this was more prevalent among respondents who had completed
postgraduate qualifications. Examples of such responses include:
“I can't continue with the interview because nowadays there are a lot of scams, so I am not comfortable
with giving you my information”.
“It’s not going to benefit me and asking about my employment status is unnecessary”.
4.10.1.3 Not knowing that the skills intervention was funded by the ETDP SETA
A number of respondents were unaware that the skills intervention had been funded by the ETDP SETA, with
several insisting that their intervention had been funded by NSFAS or the university, and even some who
insisted that they had never had direct contact with the SETA.
4.10.1.4 Learners sampled as completed insisting that they hadn’t finished
A serious challenge confronted by enumerators was the number of learners who claimed that they had not completed the learning intervention, despite the data base indicating to the contrary. The comments below illustrate this point:
“I enrolled but quit before the programme started”.
“I have not yet completed studies; I have one exam left”.
“I did not complete the internship because I got another job in a new organisation”.
“I dropped out 3 months before completing as I had to go back to college”.
4.10.1.5 Certificates not received
Complaints about not having received certificates were made by some respondents. In some cases, there
was an expectation that the enumerator would resolve this matter. The respondents were provided with the
SETA’s contact details and encouraged to contact the relevant offices in their province to lodge their concern.
4.10.1.6 Expectations of the possibility of employment
Several unemployed learners had the expectation that these interviews were being conducted to recruit
them for employment, and enumerators had to brief them that the interview was not for this purpose.
4.10.1.7 Fear of sharing employer details
Some learners were suspicious as to why an interview would be conducted with their employer. It seems
that there were fears that this was related to their performance assessment, and hence they were reluctant
to share this information. A further group of learners, mainly educators, did not want to provide the
employers’ contact details as they said, “SETA has the details and they should provide this information”.
Another related issue was that many of their employers were Circuit Managers or Heads of Departments,
and they would not provide names or contact details but insisted that we call the regional office and find out
this information.
Mitigation: Enumerators were trained to motivate participation by assuring the respondents of the purpose
of the study. To a large extent, this facilitated a lower rate of refusal.
4.10.1.8 Same contact numbers for different beneficiaries
Enumerators noted that in some instances several respondents in the same skills programme in a province,
all had the same contact number, and that it was not possible to get through to that number. It is unclear
why this would be the case.
4.10.1.9 Dropped calls due to bad reception
There were a few cases where the telephone reception was extremely poor, and as a result calls dropped
during the interview. This prolonged the interview, sometimes up to an hour, or a follow-up interview was
required to complete the survey, which at times resulted in the respondent not being contactable for
completion. This explains the 51 incomplete interviews, which had to be excluded from the analysis.
Employer survey challenges
4.10.2.1 Challenges with negotiating employer participation
Unlike the beneficiaries, who had had a direct relationship with the SETA, some employers did not know that
their employee had benefitted from an ETDP SETA-funded skills intervention. This meant that a considerable
amount of time was spent by enumerators explaining to the employer who the SETA was and why they should
participate in the survey. This was despite sharing the ETDP SETA information letter as well as the information
sheet and consent form. This was more apparent if the respondent had not been employed at that company
at the time of undertaking the learning intervention.
Mitigation: The Invitation to Participate letter which the HSRC requested from the ETDP SETA served to
address this problem to a large extent. There is, however, a general poor understanding by employers of the
role of SETAs.
4.10.2.2 Confusion over who should respond, supervisor or human resources
Several of the supervisors/managers questioned why they should be interviewed, and some suggested that
the person who had supervised/employed the beneficiary at the time of their studies should be contacted
instead, as that person would be able to make a comparative assessment.
Mitigation: Enumerators were trained to address this by explaining the importance of the direct line manager
providing the responses.
4.10.2.3 Public sector officials
Several government officials, again mostly senior education officials, were reluctant to participate as they
were on the road and out of their offices, or very busy due to the start of the school year.
Mitigation: Efforts were made to accommodate respondents who were too busy by rescheduling interviews
for later in the day, or after schools had closed, or on a Saturday. However, these were not readily taken up.
4.10.2.4 Supervisors wanting approval
Approval of gatekeepers was another factor which made some supervisors/managers reluctant to participate
in the study, as they were concerned that this had not received the stamp of approval from their seniors.
They also felt that this was a task for the enumerator or the SETA to secure such approval.
Mitigation: Enumerators attempted to follow up with officials of higher designations to facilitate
participation. This was partially successful.
4.11 Ethical considerations
The project was undertaken in line with the principles of ethical research involving human subjects. These
principles included special attention to communicating the aims of the study, and the rights of people
participating in the research, with written informed consent, and confidentiality in place. The study proposal
and key informant interview schedules, and consent forms were submitted as part of the Ethics Approval
application to the HSRC Research Ethics Committee (REC). The study received full ethical clearance (No REC
4/23/10/19).
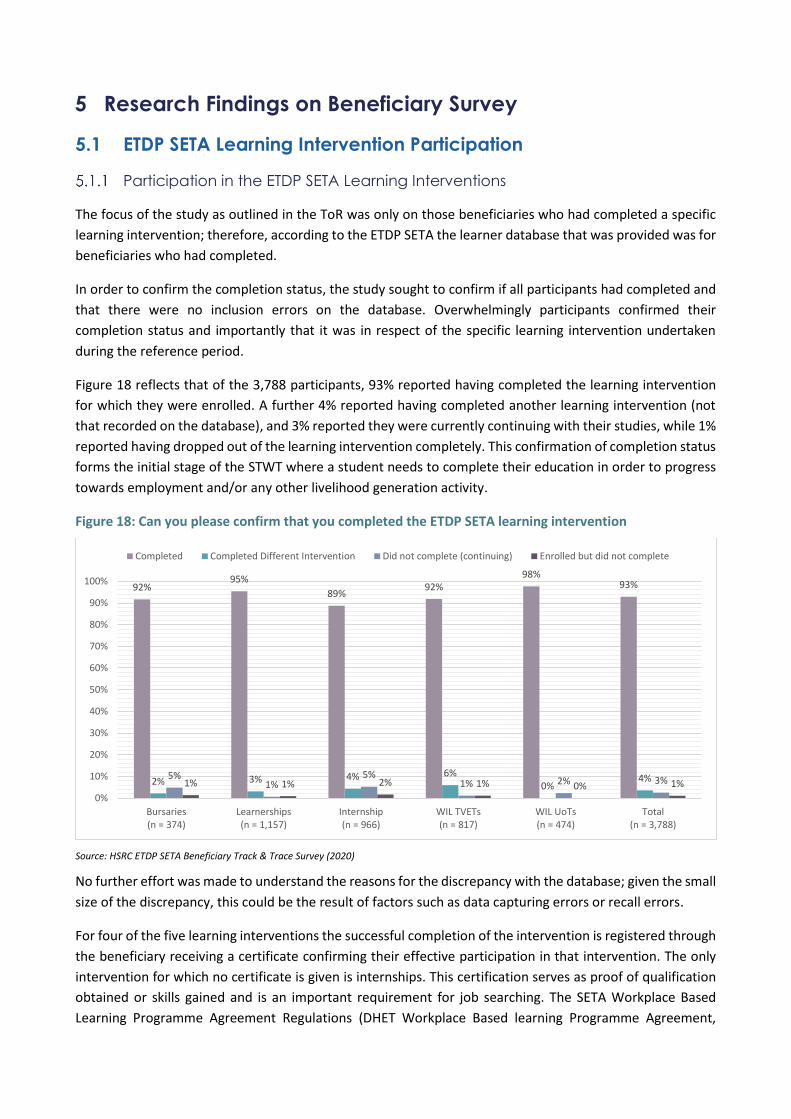
5 Research Findings on Beneficiary Survey
5.1 ETDP SETA Learning Intervention Participation
Participation in the ETDP SETA Learning Interventions
The focus of the study as outlined in the ToR was only on those beneficiaries who had completed a specific
learning intervention; therefore, according to the ETDP SETA the learner database that was provided was for
beneficiaries who had completed.
In order to confirm the completion status, the study sought to confirm if all participants had completed and
that there were no inclusion errors on the database. Overwhelmingly participants confirmed their
completion status and importantly that it was in respect of the specific learning intervention undertaken
during the reference period.
Figure 18 reflects that of the 3,788 participants, 93% reported having completed the learning intervention
for which they were enrolled. A further 4% reported having completed another learning intervention (not
that recorded on the database), and 3% reported they were currently continuing with their studies, while 1%
reported having dropped out of the learning intervention completely. This confirmation of completion status
forms the initial stage of the STWT where a student needs to complete their education in order to progress
towards employment and/or any other livelihood generation activity.
Figure 18: Can you please confirm that you completed the ETDP SETA learning intervention
Source: HSRC ETDP SETA Beneficiary Track & Trace Survey (2020)
No further effort was made to understand the reasons for the discrepancy with the database; given the small
size of the discrepancy, this could be the result of factors such as data capturing errors or recall errors.
For four of the five learning interventions the successful completion of the intervention is registered through
the beneficiary receiving a certificate confirming their effective participation in that intervention. The only
intervention for which no certificate is given is internships. This certification serves as proof of qualification
obtained or skills gained and is an important requirement for job searching. The SETA Workplace Based
Learning Programme Agreement Regulations (DHET Workplace Based learning Programme Agreement,
92%95%
89%92%
98%93%
2% 3% 4% 6%0%
4%5%1%
5%1% 2% 3%1% 1% 2% 1% 0% 1%
0%
10%
20%
30%
40%
50%
60%
70%
80%
90%
100%
Bursaries(n = 374)
Learnerships(n = 1,157)
Internship(n = 966)
WIL TVETs(n = 817)
WIL UoTs(n = 474)
Total(n = 3,788)
Completed Completed Different Intervention Did not complete (continuing) Enrolled but did not complete
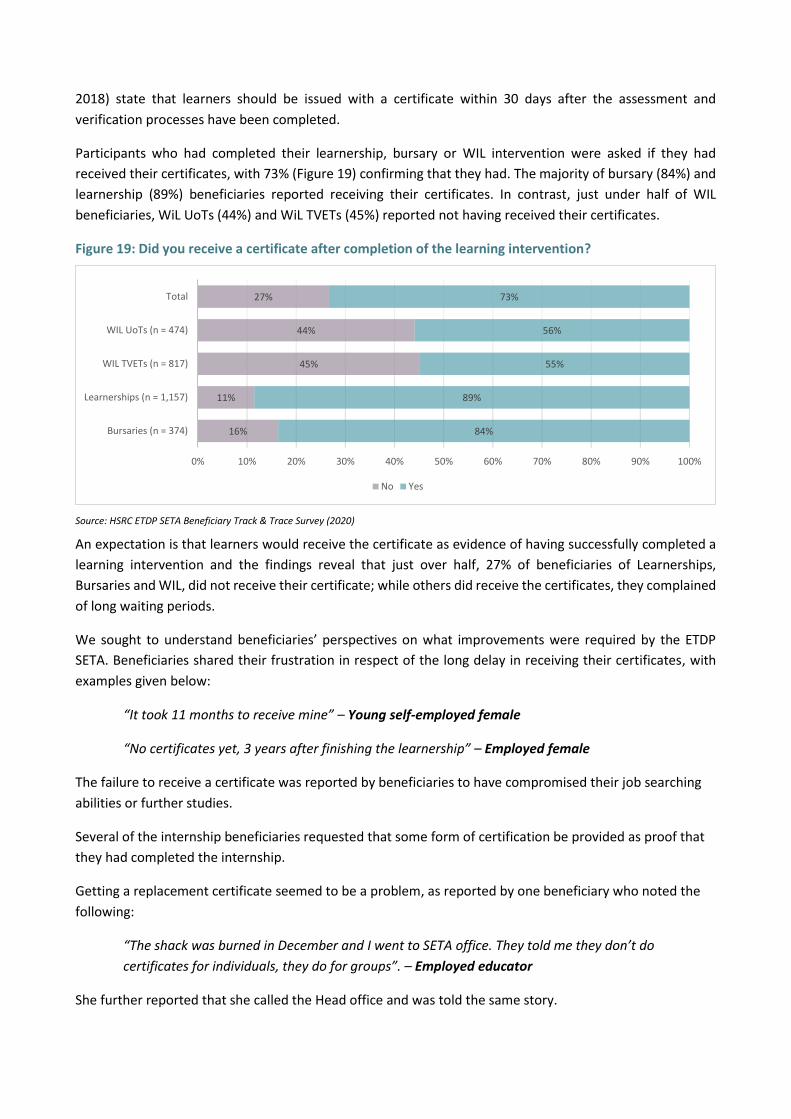
2018) state that learners should be issued with a certificate within 30 days after the assessment and
verification processes have been completed.
Participants who had completed their learnership, bursary or WIL intervention were asked if they had
received their certificates, with 73% (Figure 19) confirming that they had. The majority of bursary (84%) and
learnership (89%) beneficiaries reported receiving their certificates. In contrast, just under half of WIL
beneficiaries, WiL UoTs (44%) and WiL TVETs (45%) reported not having received their certificates.
Figure 19: Did you receive a certificate after completion of the learning intervention?
Source: HSRC ETDP SETA Beneficiary Track & Trace Survey (2020)
An expectation is that learners would receive the certificate as evidence of having successfully completed a
learning intervention and the findings reveal that just over half, 27% of beneficiaries of Learnerships,
Bursaries and WIL, did not receive their certificate; while others did receive the certificates, they complained
of long waiting periods.
We sought to understand beneficiaries’ perspectives on what improvements were required by the ETDP
SETA. Beneficiaries shared their frustration in respect of the long delay in receiving their certificates, with
examples given below:
“It took 11 months to receive mine” – Young self-employed female
“No certificates yet, 3 years after finishing the learnership” – Employed female
The failure to receive a certificate was reported by beneficiaries to have compromised their job searching
abilities or further studies.
Several of the internship beneficiaries requested that some form of certification be provided as proof that
they had completed the internship.
Getting a replacement certificate seemed to be a problem, as reported by one beneficiary who noted the
following:
“The shack was burned in December and I went to SETA office. They told me they don’t do
certificates for individuals, they do for groups”. – Employed educator
She further reported that she called the Head office and was told the same story.
16%
11%
45%
44%
27%
84%
89%
55%
56%
73%
0% 10% 20% 30% 40% 50% 60% 70% 80% 90% 100%
Bursaries (n = 374)
Learnerships (n = 1,157)
WIL TVETs (n = 817)
WIL UoTs (n = 474)
Total
No Yes
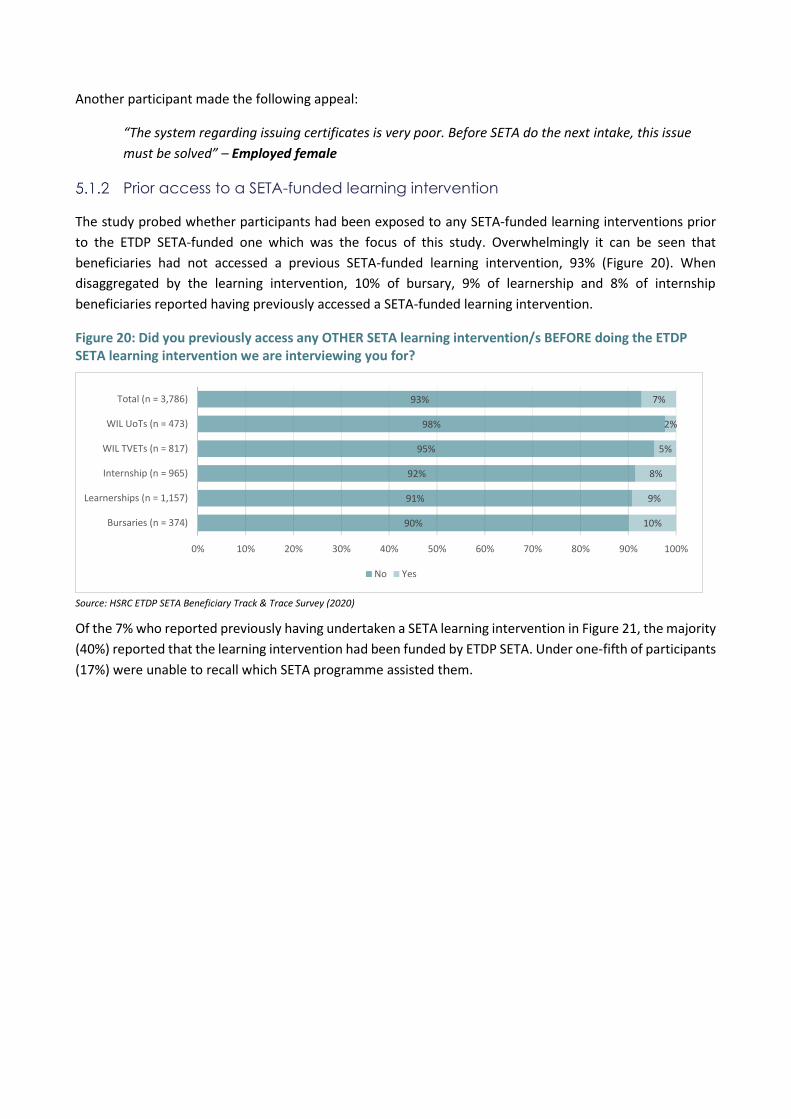
Another participant made the following appeal:
“The system regarding issuing certificates is very poor. Before SETA do the next intake, this issue
must be solved” – Employed female
Prior access to a SETA-funded learning intervention
The study probed whether participants had been exposed to any SETA-funded learning interventions prior
to the ETDP SETA-funded one which was the focus of this study. Overwhelmingly it can be seen that
beneficiaries had not accessed a previous SETA-funded learning intervention, 93% (Figure 20). When
disaggregated by the learning intervention, 10% of bursary, 9% of learnership and 8% of internship
beneficiaries reported having previously accessed a SETA-funded learning intervention.
Figure 20: Did you previously access any OTHER SETA learning intervention/s BEFORE doing the ETDP SETA learning intervention we are interviewing you for?
Source: HSRC ETDP SETA Beneficiary Track & Trace Survey (2020)
Of the 7% who reported previously having undertaken a SETA learning intervention in Figure 21, the majority
(40%) reported that the learning intervention had been funded by ETDP SETA. Under one-fifth of participants
(17%) were unable to recall which SETA programme assisted them.
90%
91%
92%
95%
98%
93%
10%
9%
8%
5%
2%
7%
0% 10% 20% 30% 40% 50% 60% 70% 80% 90% 100%
Bursaries (n = 374)
Learnerships (n = 1,157)
Internship (n = 965)
WIL TVETs (n = 817)
WIL UoTs (n = 473)
Total (n = 3,786)
No Yes
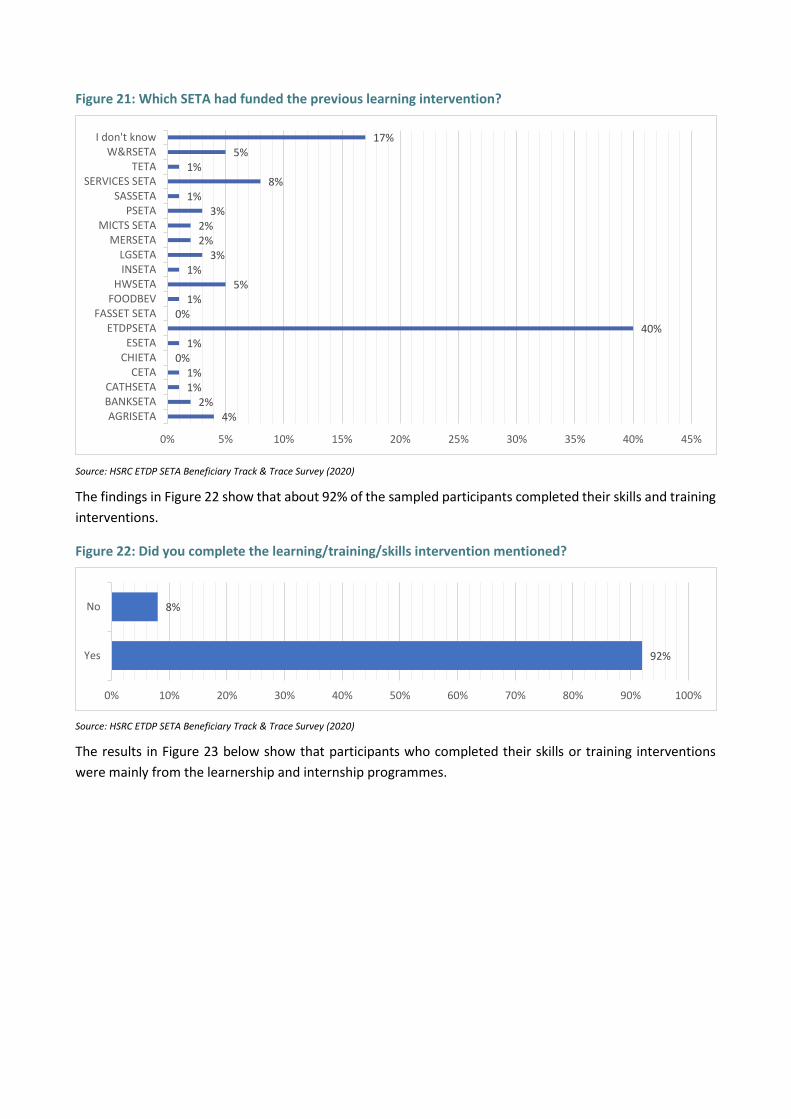
Figure 21: Which SETA had funded the previous learning intervention?
Source: HSRC ETDP SETA Beneficiary Track & Trace Survey (2020)
The findings in Figure 22 show that about 92% of the sampled participants completed their skills and training
interventions.
Figure 22: Did you complete the learning/training/skills intervention mentioned?
Source: HSRC ETDP SETA Beneficiary Track & Trace Survey (2020)
The results in Figure 23 below show that participants who completed their skills or training interventions
were mainly from the learnership and internship programmes.
4%2%
1%1%
0%1%
40%0%
1%5%
1%3%
2%2%
3%1%
8%1%
5%17%
0% 5% 10% 15% 20% 25% 30% 35% 40% 45%
AGRISETABANKSETACATHSETA
CETACHIETA
ESETAETDPSETA
FASSET SETAFOODBEV
HWSETAINSETALGSETA
MERSETAMICTS SETA
PSETASASSETA
SERVICES SETATETA
W&RSETAI don't know
92%
8%
0% 10% 20% 30% 40% 50% 60% 70% 80% 90% 100%
Yes
No
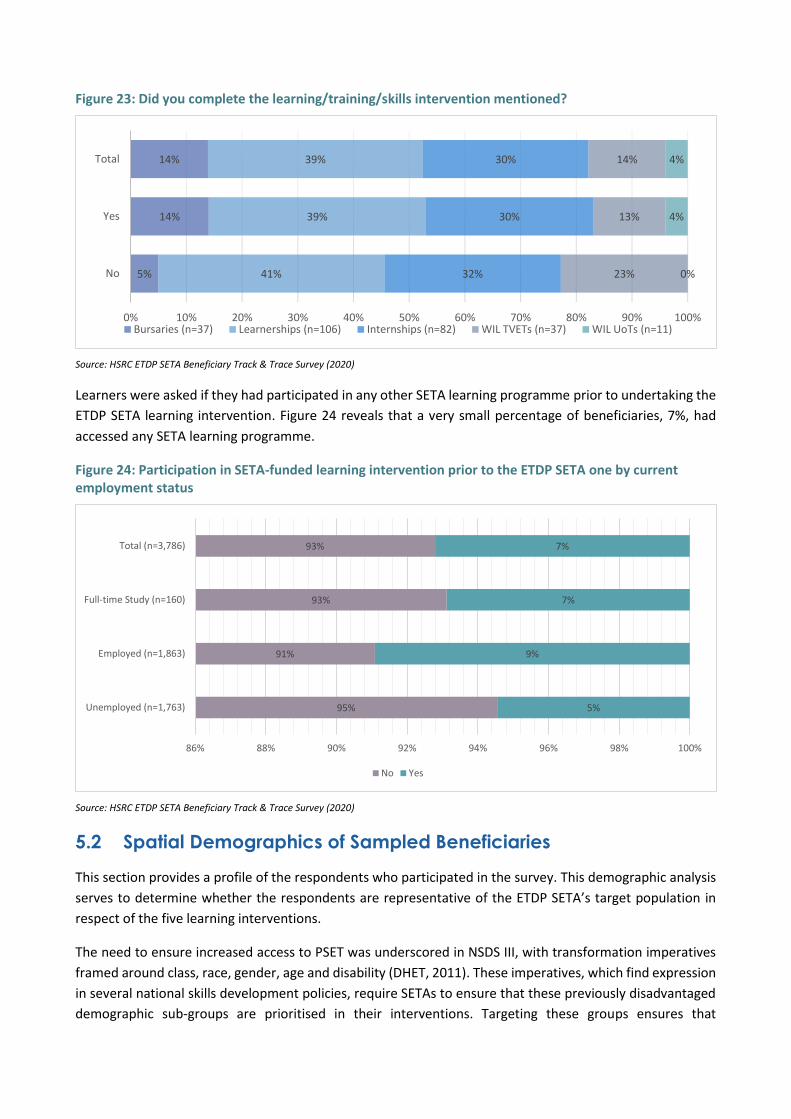
Figure 23: Did you complete the learning/training/skills intervention mentioned?
Source: HSRC ETDP SETA Beneficiary Track & Trace Survey (2020)
Learners were asked if they had participated in any other SETA learning programme prior to undertaking the
ETDP SETA learning intervention. Figure 24 reveals that a very small percentage of beneficiaries, 7%, had
accessed any SETA learning programme.
Figure 24: Participation in SETA-funded learning intervention prior to the ETDP SETA one by current employment status
Source: HSRC ETDP SETA Beneficiary Track & Trace Survey (2020)
5.2 Spatial Demographics of Sampled Beneficiaries
This section provides a profile of the respondents who participated in the survey. This demographic analysis
serves to determine whether the respondents are representative of the ETDP SETA’s target population in
respect of the five learning interventions.
The need to ensure increased access to PSET was underscored in NSDS III, with transformation imperatives
framed around class, race, gender, age and disability (DHET, 2011). These imperatives, which find expression
in several national skills development policies, require SETAs to ensure that these previously disadvantaged
demographic sub-groups are prioritised in their interventions. Targeting these groups ensures that
5%
14%
14%
41%
39%
39%
32%
30%
30%
23%
13%
14%
0%
4%
4%
0% 10% 20% 30% 40% 50% 60% 70% 80% 90% 100%
No
Yes
Total
Bursaries (n=37) Learnerships (n=106) Internships (n=82) WIL TVETs (n=37) WIL UoTs (n=11)
95%
91%
93%
93%
5%
9%
7%
7%
86% 88% 90% 92% 94% 96% 98% 100%
Unemployed (n=1,763)
Employed (n=1,863)
Full-time Study (n=160)
Total (n=3,786)
No Yes
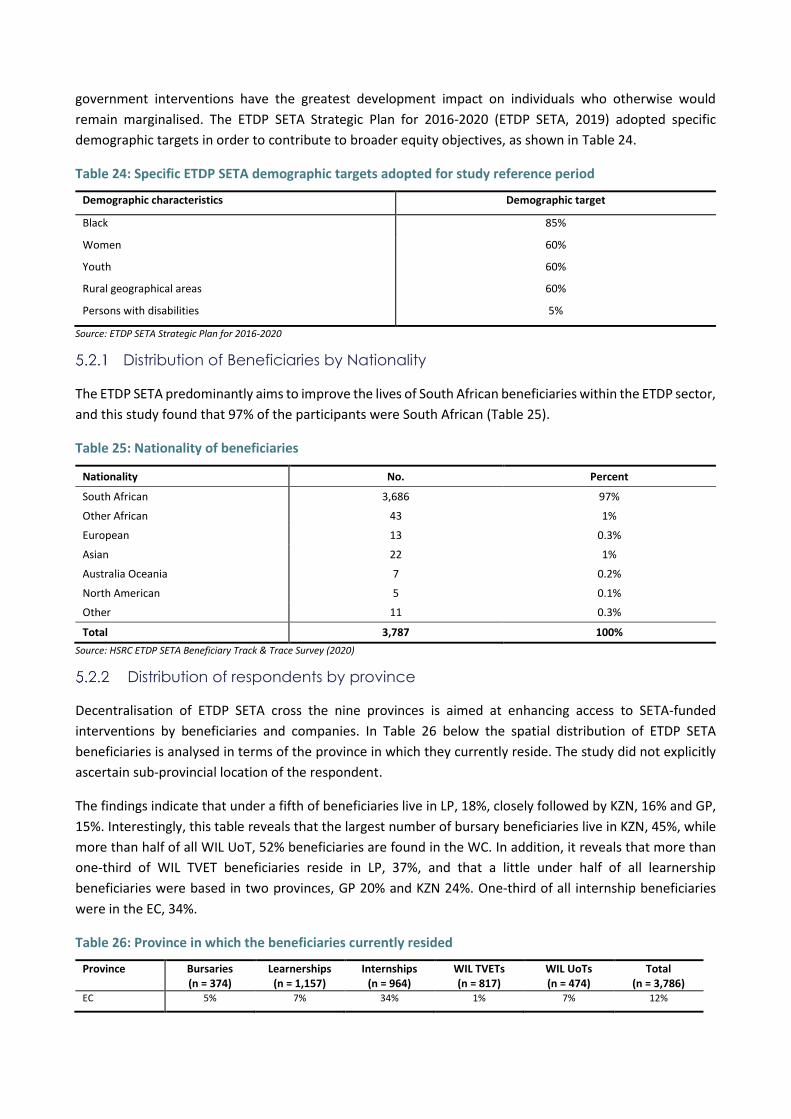
government interventions have the greatest development impact on individuals who otherwise would
remain marginalised. The ETDP SETA Strategic Plan for 2016-2020 (ETDP SETA, 2019) adopted specific
demographic targets in order to contribute to broader equity objectives, as shown in Table 24.
Table 24: Specific ETDP SETA demographic targets adopted for study reference period
Demographic characteristics Demographic target
Black 85%
Women 60%
Youth 60%
Rural geographical areas 60%
Persons with disabilities 5%
Source: ETDP SETA Strategic Plan for 2016-2020
Distribution of Beneficiaries by Nationality
The ETDP SETA predominantly aims to improve the lives of South African beneficiaries within the ETDP sector,
and this study found that 97% of the participants were South African (Table 25).
Table 25: Nationality of beneficiaries
Nationality No. Percent
South African 3,686 97%
Other African 43 1%
European 13 0.3%
Asian 22 1%
Australia Oceania 7 0.2%
North American 5 0.1%
Other 11 0.3%
Total 3,787 100%
Source: HSRC ETDP SETA Beneficiary Track & Trace Survey (2020)
Distribution of respondents by province
Decentralisation of ETDP SETA cross the nine provinces is aimed at enhancing access to SETA-funded
interventions by beneficiaries and companies. In Table 26 below the spatial distribution of ETDP SETA
beneficiaries is analysed in terms of the province in which they currently reside. The study did not explicitly
ascertain sub-provincial location of the respondent.
The findings indicate that under a fifth of beneficiaries live in LP, 18%, closely followed by KZN, 16% and GP,
15%. Interestingly, this table reveals that the largest number of bursary beneficiaries live in KZN, 45%, while
more than half of all WIL UoT, 52% beneficiaries are found in the WC. In addition, it reveals that more than
one-third of WIL TVET beneficiaries reside in LP, 37%, and that a little under half of all learnership
beneficiaries were based in two provinces, GP 20% and KZN 24%. One-third of all internship beneficiaries
were in the EC, 34%.
Table 26: Province in which the beneficiaries currently resided
Province Bursaries (n = 374)
Learnerships (n = 1,157)
Internships (n = 964)
WIL TVETs (n = 817)
WIL UoTs (n = 474)
Total (n = 3,786)
EC 5% 7% 34% 1% 7% 12%
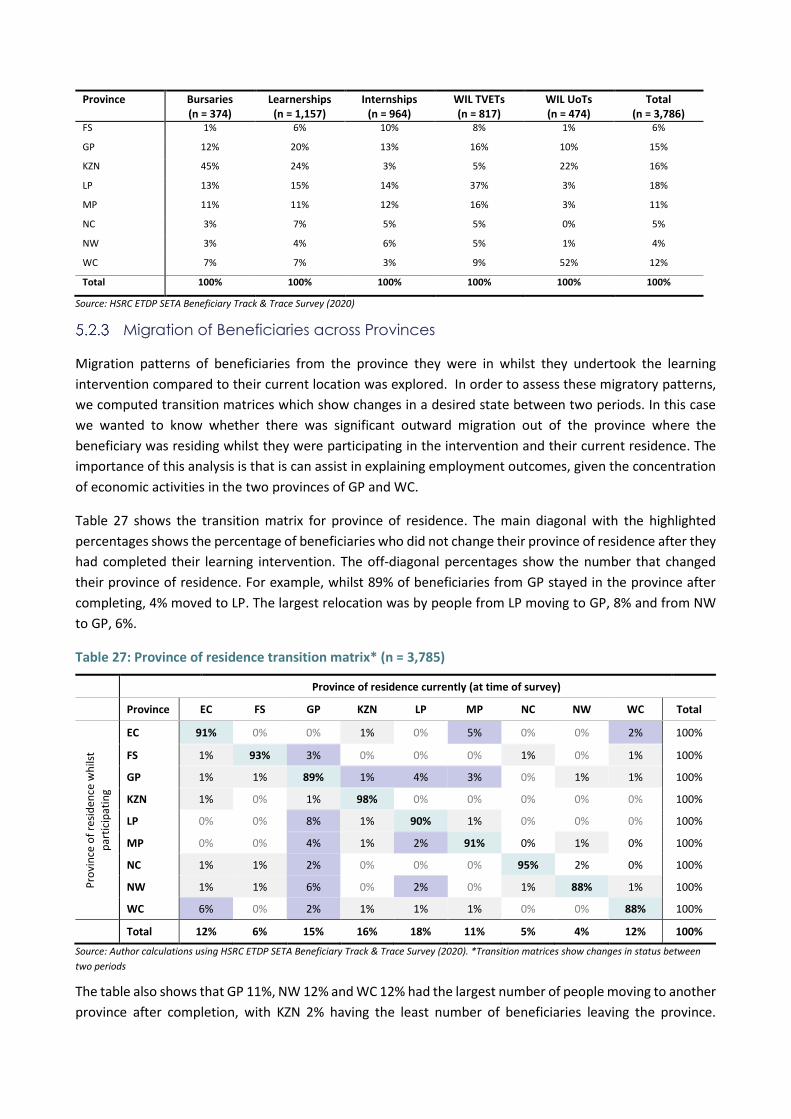
Province Bursaries (n = 374)
Learnerships (n = 1,157)
Internships (n = 964)
WIL TVETs (n = 817)
WIL UoTs (n = 474)
Total (n = 3,786)
FS 1% 6% 10% 8% 1% 6%
GP 12% 20% 13% 16% 10% 15%
KZN 45% 24% 3% 5% 22% 16%
LP 13% 15% 14% 37% 3% 18%
MP 11% 11% 12% 16% 3% 11%
NC 3% 7% 5% 5% 0% 5%
NW 3% 4% 6% 5% 1% 4%
WC 7% 7% 3% 9% 52% 12%
Total 100% 100% 100% 100% 100% 100%
Source: HSRC ETDP SETA Beneficiary Track & Trace Survey (2020)
Migration of Beneficiaries across Provinces
Migration patterns of beneficiaries from the province they were in whilst they undertook the learning
intervention compared to their current location was explored. In order to assess these migratory patterns,
we computed transition matrices which show changes in a desired state between two periods. In this case
we wanted to know whether there was significant outward migration out of the province where the
beneficiary was residing whilst they were participating in the intervention and their current residence. The
importance of this analysis is that is can assist in explaining employment outcomes, given the concentration
of economic activities in the two provinces of GP and WC.
Table 27 shows the transition matrix for province of residence. The main diagonal with the highlighted
percentages shows the percentage of beneficiaries who did not change their province of residence after they
had completed their learning intervention. The off-diagonal percentages show the number that changed
their province of residence. For example, whilst 89% of beneficiaries from GP stayed in the province after
completing, 4% moved to LP. The largest relocation was by people from LP moving to GP, 8% and from NW
to GP, 6%.
Table 27: Province of residence transition matrix* (n = 3,785)
Province of residence currently (at time of survey)
Province EC FS GP KZN LP MP NC NW WC Total
Pro
vin
ce o
f re
sid
ence
wh
ilst
par
tici
pat
ing
EC 91% 0% 0% 1% 0% 5% 0% 0% 2% 100%
FS 1% 93% 3% 0% 0% 0% 1% 0% 1% 100%
GP 1% 1% 89% 1% 4% 3% 0% 1% 1% 100%
KZN 1% 0% 1% 98% 0% 0% 0% 0% 0% 100%
LP 0% 0% 8% 1% 90% 1% 0% 0% 0% 100%
MP 0% 0% 4% 1% 2% 91% 0% 1% 0% 100%
NC 1% 1% 2% 0% 0% 0% 95% 2% 0% 100%
NW 1% 1% 6% 0% 2% 0% 1% 88% 1% 100%
WC 6% 0% 2% 1% 1% 1% 0% 0% 88% 100%
Total 12% 6% 15% 16% 18% 11% 5% 4% 12% 100%
Source: Author calculations using HSRC ETDP SETA Beneficiary Track & Trace Survey (2020). *Transition matrices show changes in status between
two periods
The table also shows that GP 11%, NW 12% and WC 12% had the largest number of people moving to another
province after completion, with KZN 2% having the least number of beneficiaries leaving the province.
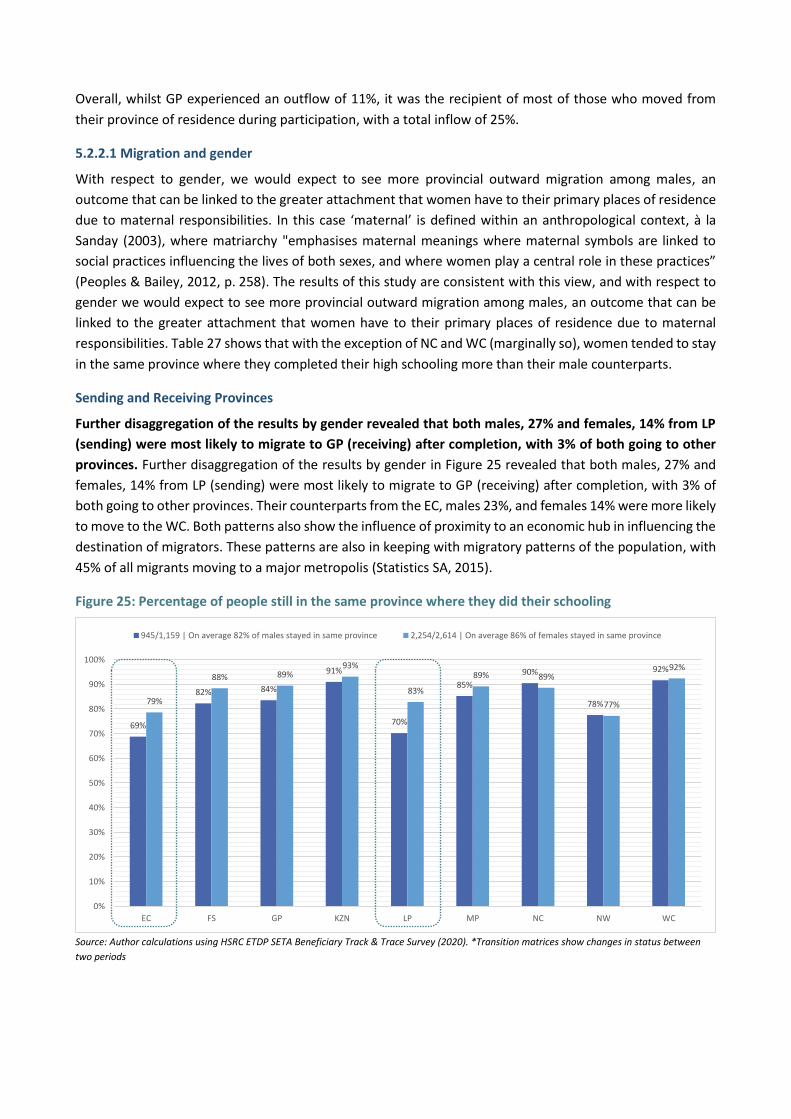
Overall, whilst GP experienced an outflow of 11%, it was the recipient of most of those who moved from
their province of residence during participation, with a total inflow of 25%.
5.2.2.1 Migration and gender
With respect to gender, we would expect to see more provincial outward migration among males, an
outcome that can be linked to the greater attachment that women have to their primary places of residence
due to maternal responsibilities. In this case ‘maternal’ is defined within an anthropological context, à la
Sanday (2003), where matriarchy "emphasises maternal meanings where maternal symbols are linked to
social practices influencing the lives of both sexes, and where women play a central role in these practices”
(Peoples & Bailey, 2012, p. 258). The results of this study are consistent with this view, and with respect to
gender we would expect to see more provincial outward migration among males, an outcome that can be
linked to the greater attachment that women have to their primary places of residence due to maternal
responsibilities. Table 27 shows that with the exception of NC and WC (marginally so), women tended to stay
in the same province where they completed their high schooling more than their male counterparts.
Sending and Receiving Provinces
Further disaggregation of the results by gender revealed that both males, 27% and females, 14% from LP
(sending) were most likely to migrate to GP (receiving) after completion, with 3% of both going to other
provinces. Further disaggregation of the results by gender in Figure 25 revealed that both males, 27% and
females, 14% from LP (sending) were most likely to migrate to GP (receiving) after completion, with 3% of
both going to other provinces. Their counterparts from the EC, males 23%, and females 14% were more likely
to move to the WC. Both patterns also show the influence of proximity to an economic hub in influencing the
destination of migrators. These patterns are also in keeping with migratory patterns of the population, with
45% of all migrants moving to a major metropolis (Statistics SA, 2015).
Figure 25: Percentage of people still in the same province where they did their schooling
Source: Author calculations using HSRC ETDP SETA Beneficiary Track & Trace Survey (2020). *Transition matrices show changes in status between
two periods
69%
82% 84%
91%
70%
85%
90%
78%
92%
79%
88% 89%93%
83%
89% 89%
77%
92%
0%
10%
20%
30%
40%
50%
60%
70%
80%
90%
100%
EC FS GP KZN LP MP NC NW WC
945/1,159 | On average 82% of males stayed in same province 2,254/2,614 | On average 86% of females stayed in same province
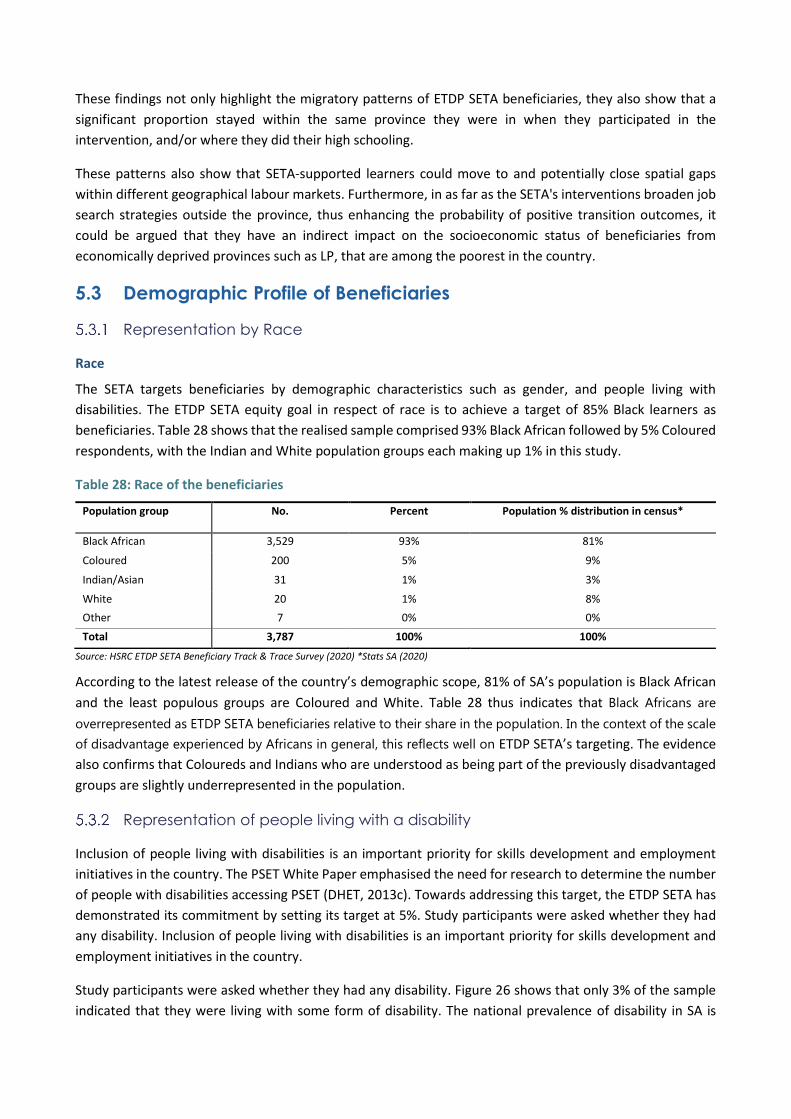
These findings not only highlight the migratory patterns of ETDP SETA beneficiaries, they also show that a
significant proportion stayed within the same province they were in when they participated in the
intervention, and/or where they did their high schooling.
These patterns also show that SETA-supported learners could move to and potentially close spatial gaps
within different geographical labour markets. Furthermore, in as far as the SETA's interventions broaden job
search strategies outside the province, thus enhancing the probability of positive transition outcomes, it
could be argued that they have an indirect impact on the socioeconomic status of beneficiaries from
economically deprived provinces such as LP, that are among the poorest in the country.
5.3 Demographic Profile of Beneficiaries
Representation by Race
Race
The SETA targets beneficiaries by demographic characteristics such as gender, and people living with
disabilities. The ETDP SETA equity goal in respect of race is to achieve a target of 85% Black learners as
beneficiaries. Table 28 shows that the realised sample comprised 93% Black African followed by 5% Coloured
respondents, with the Indian and White population groups each making up 1% in this study.
Table 28: Race of the beneficiaries
Source: HSRC ETDP SETA Beneficiary Track & Trace Survey (2020) *Stats SA (2020)
According to the latest release of the country’s demographic scope, 81% of SA’s population is Black African
and the least populous groups are Coloured and White. Table 28 thus indicates that Black Africans are
overrepresented as ETDP SETA beneficiaries relative to their share in the population. In the context of the scale
of disadvantage experienced by Africans in general, this reflects well on ETDP SETA’s targeting. The evidence
also confirms that Coloureds and Indians who are understood as being part of the previously disadvantaged
groups are slightly underrepresented in the population.
Representation of people living with a disability
Inclusion of people living with disabilities is an important priority for skills development and employment
initiatives in the country. The PSET White Paper emphasised the need for research to determine the number
of people with disabilities accessing PSET (DHET, 2013c). Towards addressing this target, the ETDP SETA has
demonstrated its commitment by setting its target at 5%. Study participants were asked whether they had
any disability. Inclusion of people living with disabilities is an important priority for skills development and
employment initiatives in the country.
Study participants were asked whether they had any disability. Figure 26 shows that only 3% of the sample
indicated that they were living with some form of disability. The national prevalence of disability in SA is
Population group No. Percent Population % distribution in census*
Black African 3,529 93% 81%
Coloured 200 5% 9%
Indian/Asian 31 1% 3%
White 20 1% 8%
Other 7 0% 0%
Total 3,787 100% 100%
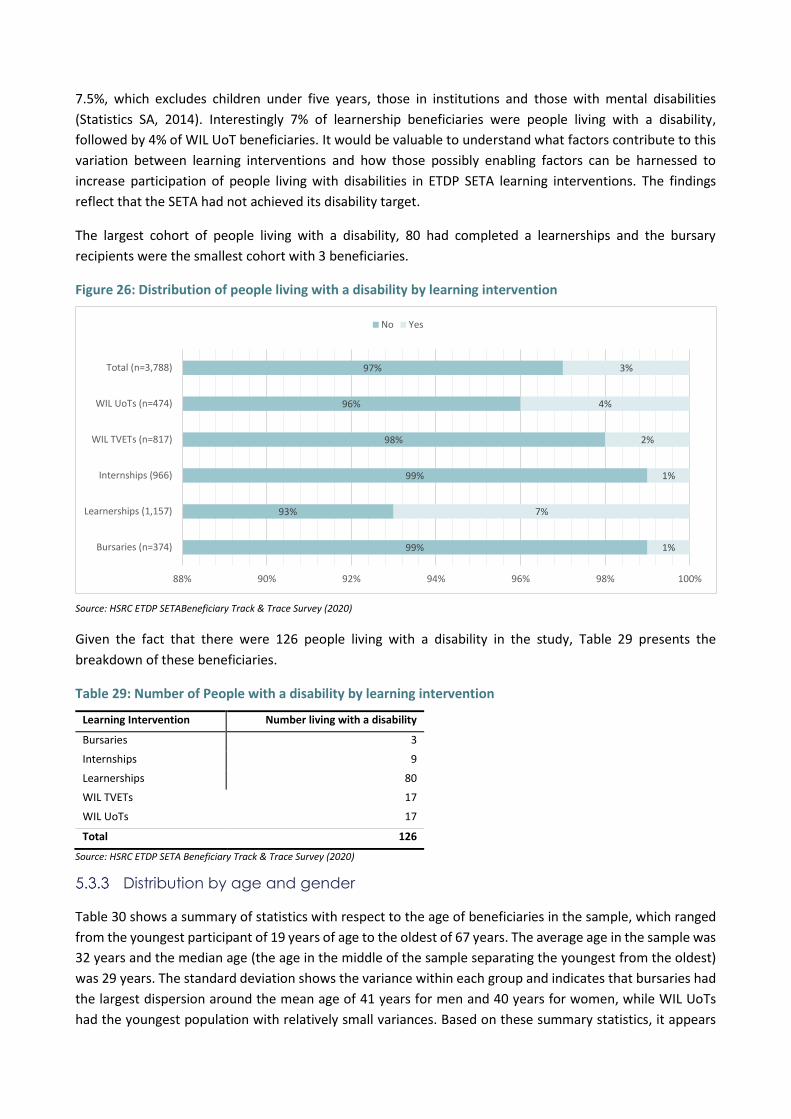
7.5%, which excludes children under five years, those in institutions and those with mental disabilities
(Statistics SA, 2014). Interestingly 7% of learnership beneficiaries were people living with a disability,
followed by 4% of WIL UoT beneficiaries. It would be valuable to understand what factors contribute to this
variation between learning interventions and how those possibly enabling factors can be harnessed to
increase participation of people living with disabilities in ETDP SETA learning interventions. The findings
reflect that the SETA had not achieved its disability target.
The largest cohort of people living with a disability, 80 had completed a learnerships and the bursary
recipients were the smallest cohort with 3 beneficiaries.
Figure 26: Distribution of people living with a disability by learning intervention
Source: HSRC ETDP SETABeneficiary Track & Trace Survey (2020)
Given the fact that there were 126 people living with a disability in the study, Table 29 presents the
breakdown of these beneficiaries.
Table 29: Number of People with a disability by learning intervention
Learning Intervention Number living with a disability
Bursaries 3
Internships 9
Learnerships 80
WIL TVETs 17
WIL UoTs 17
Total 126
Source: HSRC ETDP SETA Beneficiary Track & Trace Survey (2020)
Distribution by age and gender
Table 30 shows a summary of statistics with respect to the age of beneficiaries in the sample, which ranged
from the youngest participant of 19 years of age to the oldest of 67 years. The average age in the sample was
32 years and the median age (the age in the middle of the sample separating the youngest from the oldest)
was 29 years. The standard deviation shows the variance within each group and indicates that bursaries had
the largest dispersion around the mean age of 41 years for men and 40 years for women, while WIL UoTs
had the youngest population with relatively small variances. Based on these summary statistics, it appears
99%
93%
99%
98%
96%
97%
1%
7%
1%
2%
4%
3%
88% 90% 92% 94% 96% 98% 100%
Bursaries (n=374)
Learnerships (1,157)
Internships (966)
WIL TVETs (n=817)
WIL UoTs (n=474)
Total (n=3,788)
No Yes
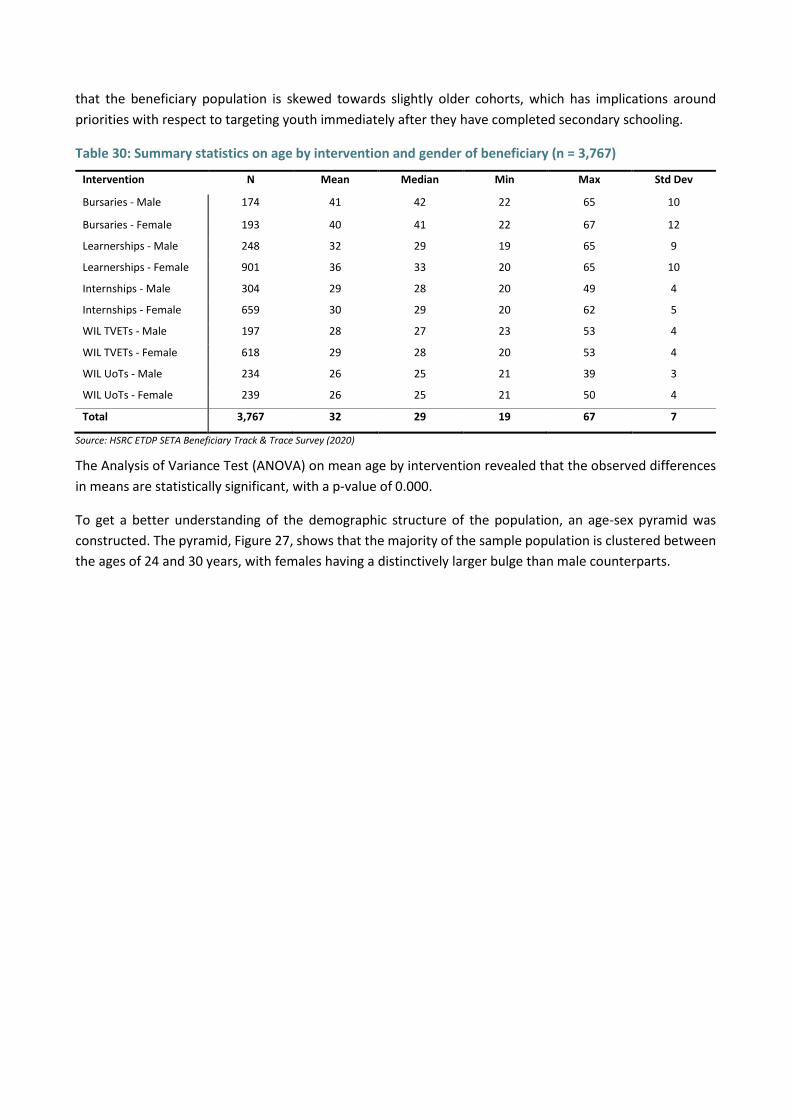
that the beneficiary population is skewed towards slightly older cohorts, which has implications around
priorities with respect to targeting youth immediately after they have completed secondary schooling.
Table 30: Summary statistics on age by intervention and gender of beneficiary (n = 3,767)
Intervention N Mean Median Min Max Std Dev
Bursaries - Male 174 41 42 22 65 10
Bursaries - Female 193 40 41 22 67 12
Learnerships - Male 248 32 29 19 65 9
Learnerships - Female 901 36 33 20 65 10
Internships - Male 304 29 28 20 49 4
Internships - Female 659 30 29 20 62 5
WIL TVETs - Male 197 28 27 23 53 4
WIL TVETs - Female 618 29 28 20 53 4
WIL UoTs - Male 234 26 25 21 39 3
WIL UoTs - Female 239 26 25 21 50 4
Total 3,767 32 29 19 67 7
Source: HSRC ETDP SETA Beneficiary Track & Trace Survey (2020)
The Analysis of Variance Test (ANOVA) on mean age by intervention revealed that the observed differences
in means are statistically significant, with a p-value of 0.000.
To get a better understanding of the demographic structure of the population, an age-sex pyramid was
constructed. The pyramid, Figure 27, shows that the majority of the sample population is clustered between
the ages of 24 and 30 years, with females having a distinctively larger bulge than male counterparts.
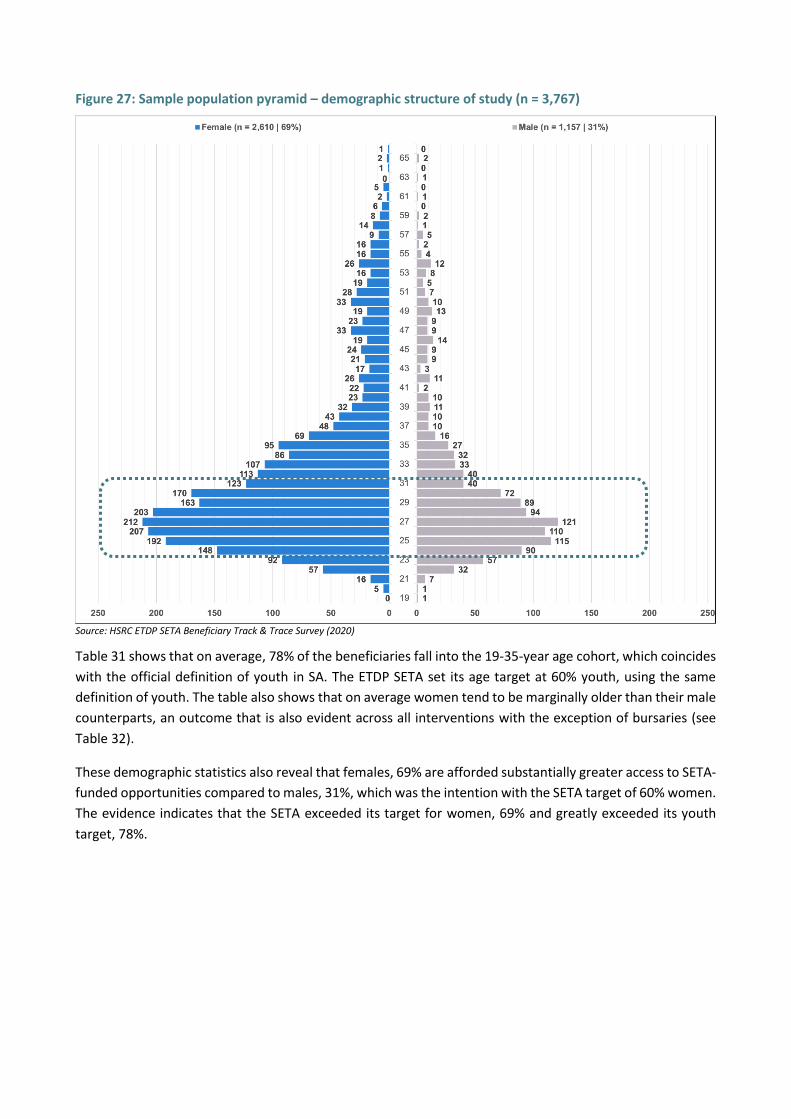
Figure 27: Sample population pyramid – demographic structure of study (n = 3,767)
Source: HSRC ETDP SETA Beneficiary Track & Trace Survey (2020)
Table 31 shows that on average, 78% of the beneficiaries fall into the 19-35-year age cohort, which coincides
with the official definition of youth in SA. The ETDP SETA set its age target at 60% youth, using the same
definition of youth. The table also shows that on average women tend to be marginally older than their male
counterparts, an outcome that is also evident across all interventions with the exception of bursaries (see
Table 32).
These demographic statistics also reveal that females, 69% are afforded substantially greater access to SETA-
funded opportunities compared to males, 31%, which was the intention with the SETA target of 60% women.
The evidence indicates that the SETA exceeded its target for women, 69% and greatly exceeded its youth
target, 78%.
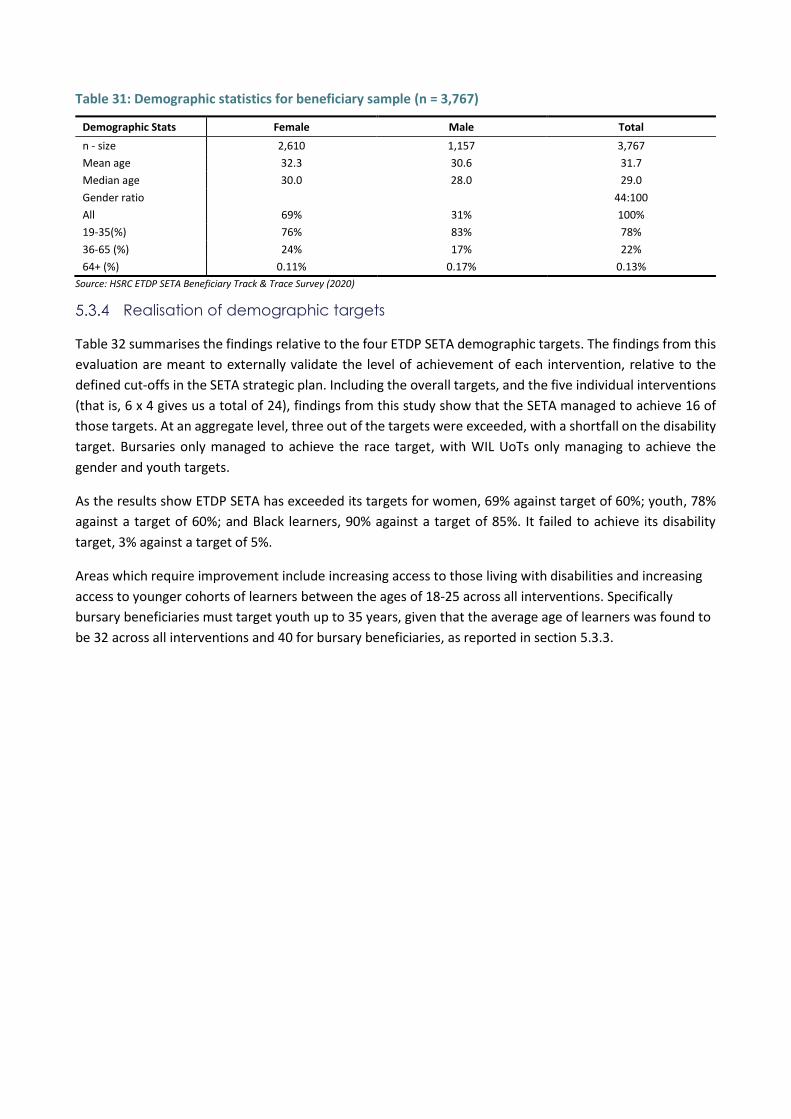
Table 31: Demographic statistics for beneficiary sample (n = 3,767)
Demographic Stats Female Male Total
n - size 2,610 1,157 3,767
Mean age 32.3 30.6 31.7
Median age 30.0 28.0 29.0
Gender ratio 44:100
All 69% 31% 100%
19-35(%) 76% 83% 78%
36-65 (%) 24% 17% 22%
64+ (%) 0.11% 0.17% 0.13%
Source: HSRC ETDP SETA Beneficiary Track & Trace Survey (2020)
Realisation of demographic targets
Table 32 summarises the findings relative to the four ETDP SETA demographic targets. The findings from this
evaluation are meant to externally validate the level of achievement of each intervention, relative to the
defined cut-offs in the SETA strategic plan. Including the overall targets, and the five individual interventions
(that is, 6 x 4 gives us a total of 24), findings from this study show that the SETA managed to achieve 16 of
those targets. At an aggregate level, three out of the targets were exceeded, with a shortfall on the disability
target. Bursaries only managed to achieve the race target, with WIL UoTs only managing to achieve the
gender and youth targets.
As the results show ETDP SETA has exceeded its targets for women, 69% against target of 60%; youth, 78%
against a target of 60%; and Black learners, 90% against a target of 85%. It failed to achieve its disability
target, 3% against a target of 5%.
Areas which require improvement include increasing access to those living with disabilities and increasing
access to younger cohorts of learners between the ages of 18-25 across all interventions. Specifically
bursary beneficiaries must target youth up to 35 years, given that the average age of learners was found to
be 32 across all interventions and 40 for bursary beneficiaries, as reported in section 5.3.3.
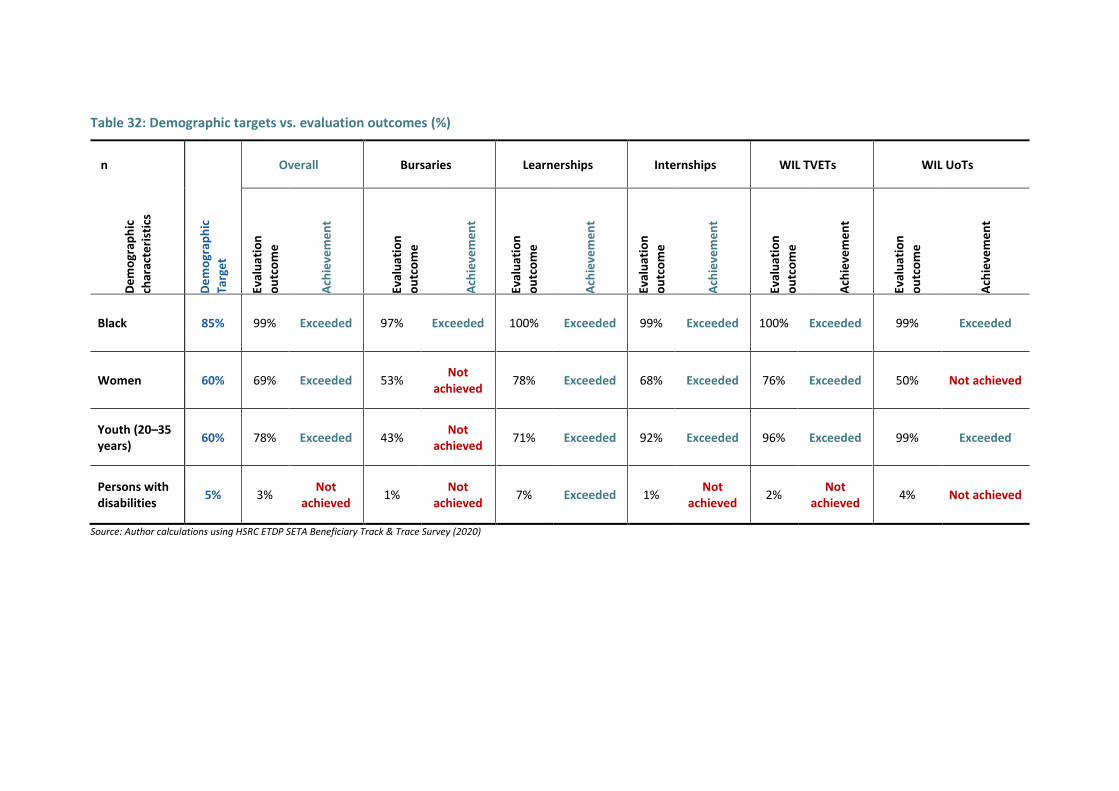
Table 32: Demographic targets vs. evaluation outcomes (%)
n Overall Bursaries Learnerships Internships WIL TVETs WIL UoTs
De
mo
grap
hic
char
acte
rist
ics
De
mo
grap
hic
Targ
et
Eval
uat
ion
ou
tco
me
Ach
ieve
me
nt
Eval
uat
ion
ou
tco
me
Ach
ieve
me
nt
Eval
uat
ion
ou
tco
me
Ach
ieve
me
nt
Eval
uat
ion
ou
tco
me
Ach
ieve
me
nt
Eval
uat
ion
ou
tco
me
Ach
ieve
me
nt
Eval
uat
ion
ou
tco
me
Ach
ieve
me
nt
Black 85% 99% Exceeded 97% Exceeded 100% Exceeded 99% Exceeded 100% Exceeded 99% Exceeded
Women 60% 69% Exceeded 53% Not
achieved 78% Exceeded 68% Exceeded 76% Exceeded 50% Not achieved
Youth (20–35 years)
60% 78% Exceeded 43% Not
achieved 71% Exceeded 92% Exceeded 96% Exceeded 99% Exceeded
Persons with disabilities
5% 3% Not
achieved 1%
Not achieved
7% Exceeded 1% Not
achieved 2%
Not achieved
4% Not achieved
Source: Author calculations using HSRC ETDP SETA Beneficiary Track & Trace Survey (2020)
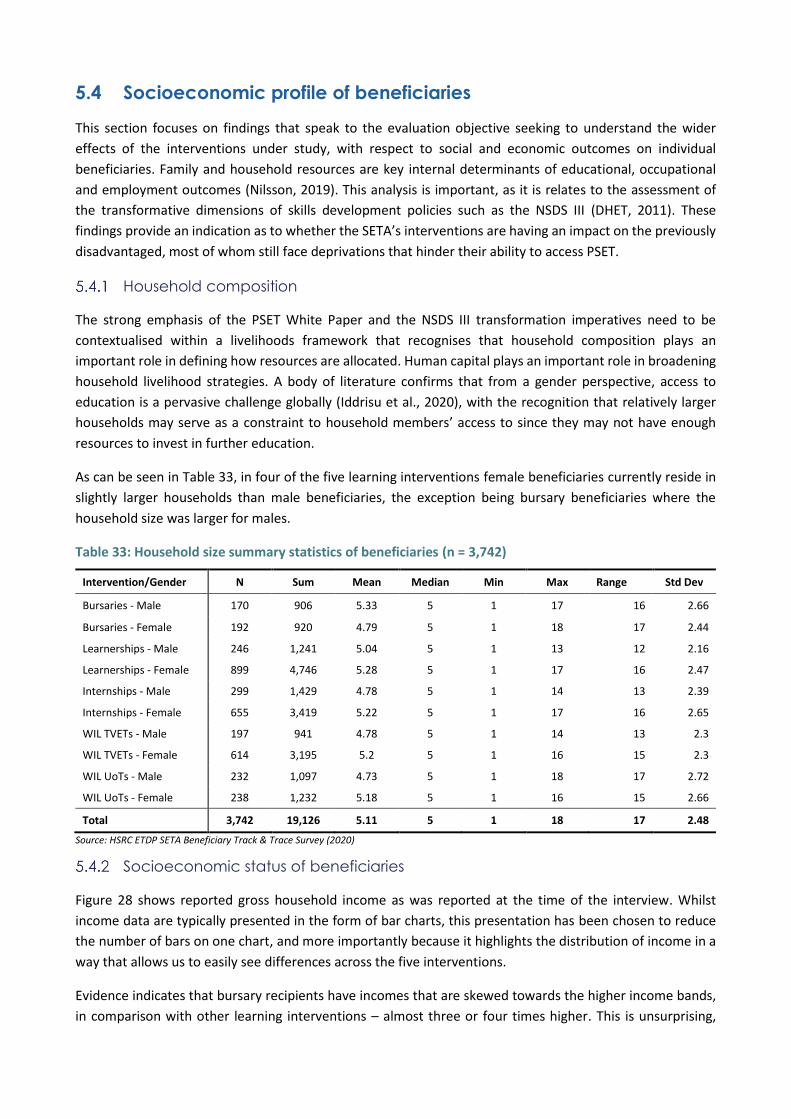
5.4 Socioeconomic profile of beneficiaries
This section focuses on findings that speak to the evaluation objective seeking to understand the wider
effects of the interventions under study, with respect to social and economic outcomes on individual
beneficiaries. Family and household resources are key internal determinants of educational, occupational
and employment outcomes (Nilsson, 2019). This analysis is important, as it is relates to the assessment of
the transformative dimensions of skills development policies such as the NSDS III (DHET, 2011). These
findings provide an indication as to whether the SETA’s interventions are having an impact on the previously
disadvantaged, most of whom still face deprivations that hinder their ability to access PSET.
Household composition
The strong emphasis of the PSET White Paper and the NSDS III transformation imperatives need to be
contextualised within a livelihoods framework that recognises that household composition plays an
important role in defining how resources are allocated. Human capital plays an important role in broadening
household livelihood strategies. A body of literature confirms that from a gender perspective, access to
education is a pervasive challenge globally (Iddrisu et al., 2020), with the recognition that relatively larger
households may serve as a constraint to household members’ access to since they may not have enough
resources to invest in further education.
As can be seen in Table 33, in four of the five learning interventions female beneficiaries currently reside in
slightly larger households than male beneficiaries, the exception being bursary beneficiaries where the
household size was larger for males.
Table 33: Household size summary statistics of beneficiaries (n = 3,742)
Intervention/Gender N Sum Mean Median Min Max Range Std Dev
Bursaries - Male 170 906 5.33 5 1 17 16 2.66
Bursaries - Female 192 920 4.79 5 1 18 17 2.44
Learnerships - Male 246 1,241 5.04 5 1 13 12 2.16
Learnerships - Female 899 4,746 5.28 5 1 17 16 2.47
Internships - Male 299 1,429 4.78 5 1 14 13 2.39
Internships - Female 655 3,419 5.22 5 1 17 16 2.65
WIL TVETs - Male 197 941 4.78 5 1 14 13 2.3
WIL TVETs - Female 614 3,195 5.2 5 1 16 15 2.3
WIL UoTs - Male 232 1,097 4.73 5 1 18 17 2.72
WIL UoTs - Female 238 1,232 5.18 5 1 16 15 2.66
Total 3,742 19,126 5.11 5 1 18 17 2.48
Source: HSRC ETDP SETA Beneficiary Track & Trace Survey (2020)
Socioeconomic status of beneficiaries
Figure 28 shows reported gross household income as was reported at the time of the interview. Whilst
income data are typically presented in the form of bar charts, this presentation has been chosen to reduce
the number of bars on one chart, and more importantly because it highlights the distribution of income in a
way that allows us to easily see differences across the five interventions.
Evidence indicates that bursary recipients have incomes that are skewed towards the higher income bands,
in comparison with other learning interventions – almost three or four times higher. This is unsurprising,
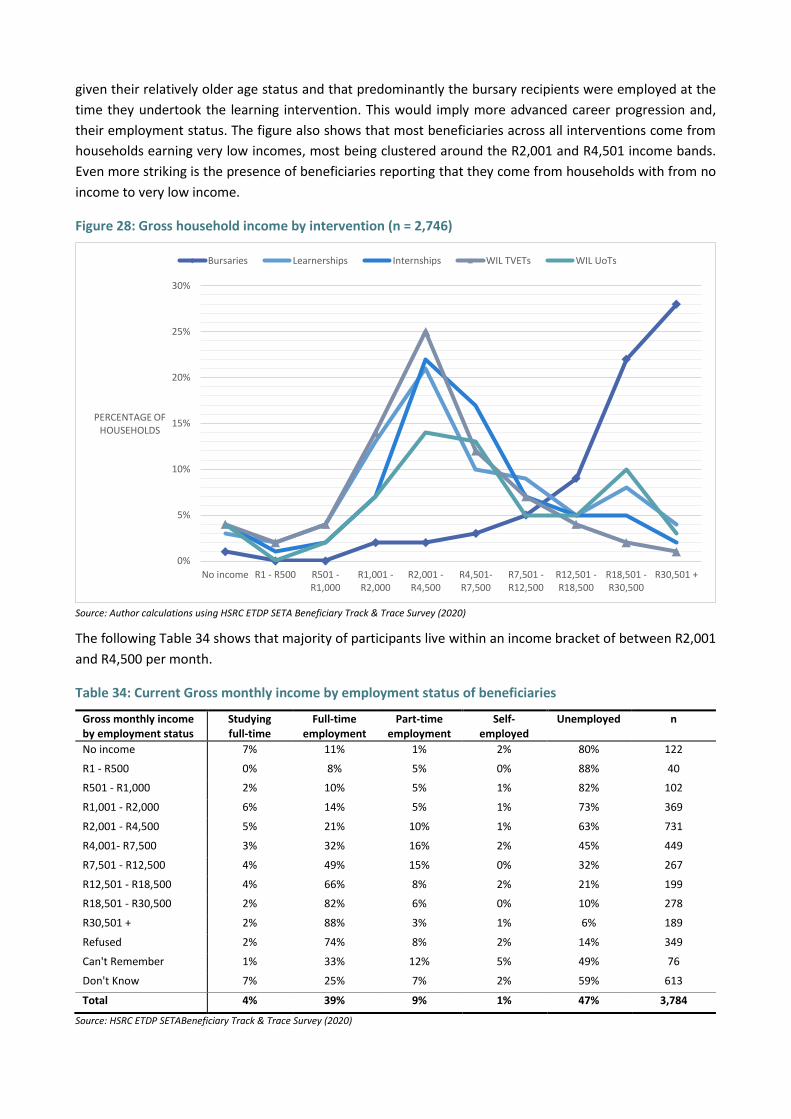
given their relatively older age status and that predominantly the bursary recipients were employed at the
time they undertook the learning intervention. This would imply more advanced career progression and,
their employment status. The figure also shows that most beneficiaries across all interventions come from
households earning very low incomes, most being clustered around the R2,001 and R4,501 income bands.
Even more striking is the presence of beneficiaries reporting that they come from households with from no
income to very low income.
Figure 28: Gross household income by intervention (n = 2,746)
Source: Author calculations using HSRC ETDP SETA Beneficiary Track & Trace Survey (2020)
The following Table 34 shows that majority of participants live within an income bracket of between R2,001
and R4,500 per month.
Table 34: Current Gross monthly income by employment status of beneficiaries
Gross monthly income by employment status
Studying full-time
Full-time employment
Part-time employment
Self-employed
Unemployed n
No income 7% 11% 1% 2% 80% 122
R1 - R500 0% 8% 5% 0% 88% 40
R501 - R1,000 2% 10% 5% 1% 82% 102
R1,001 - R2,000 6% 14% 5% 1% 73% 369
R2,001 - R4,500 5% 21% 10% 1% 63% 731
R4,001- R7,500 3% 32% 16% 2% 45% 449
R7,501 - R12,500 4% 49% 15% 0% 32% 267
R12,501 - R18,500 4% 66% 8% 2% 21% 199
R18,501 - R30,500 2% 82% 6% 0% 10% 278
R30,501 + 2% 88% 3% 1% 6% 189
Refused 2% 74% 8% 2% 14% 349
Can't Remember 1% 33% 12% 5% 49% 76
Don't Know 7% 25% 7% 2% 59% 613
Total 4% 39% 9% 1% 47% 3,784
Source: HSRC ETDP SETABeneficiary Track & Trace Survey (2020)
0%
5%
10%
15%
20%
25%
30%
No income R1 - R500 R501 -R1,000
R1,001 -R2,000
R2,001 -R4,500
R4,501-R7,500
R7,501 -R12,500
R12,501 -R18,500
R18,501 -R30,500
R30,501 +
PERCENTAGE OF HOUSEHOLDS
Bursaries Learnerships Internships WIL TVETs WIL UoTs
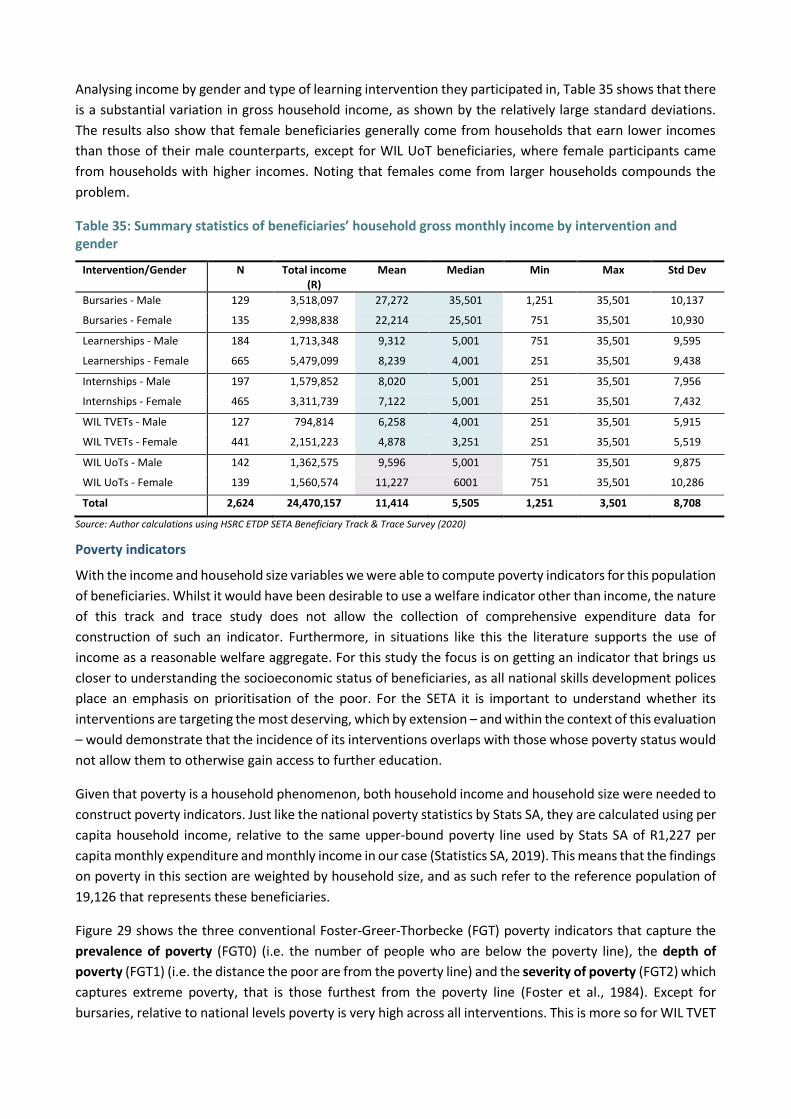
Analysing income by gender and type of learning intervention they participated in, Table 35 shows that there
is a substantial variation in gross household income, as shown by the relatively large standard deviations.
The results also show that female beneficiaries generally come from households that earn lower incomes
than those of their male counterparts, except for WIL UoT beneficiaries, where female participants came
from households with higher incomes. Noting that females come from larger households compounds the
problem.
Table 35: Summary statistics of beneficiaries’ household gross monthly income by intervention and gender
Intervention/Gender N Total income (R)
Mean Median Min Max Std Dev
Bursaries - Male 129 3,518,097 27,272 35,501 1,251 35,501 10,137
Bursaries - Female 135 2,998,838 22,214 25,501 751 35,501 10,930
Learnerships - Male 184 1,713,348 9,312 5,001 751 35,501 9,595
Learnerships - Female 665 5,479,099 8,239 4,001 251 35,501 9,438
Internships - Male 197 1,579,852 8,020 5,001 251 35,501 7,956
Internships - Female 465 3,311,739 7,122 5,001 251 35,501 7,432
WIL TVETs - Male 127 794,814 6,258 4,001 251 35,501 5,915
WIL TVETs - Female 441 2,151,223 4,878 3,251 251 35,501 5,519
WIL UoTs - Male 142 1,362,575 9,596 5,001 751 35,501 9,875
WIL UoTs - Female 139 1,560,574 11,227 6001 751 35,501 10,286
Total 2,624 24,470,157 11,414 5,505 1,251 3,501 8,708
Source: Author calculations using HSRC ETDP SETA Beneficiary Track & Trace Survey (2020)
Poverty indicators
With the income and household size variables we were able to compute poverty indicators for this population
of beneficiaries. Whilst it would have been desirable to use a welfare indicator other than income, the nature
of this track and trace study does not allow the collection of comprehensive expenditure data for
construction of such an indicator. Furthermore, in situations like this the literature supports the use of
income as a reasonable welfare aggregate. For this study the focus is on getting an indicator that brings us
closer to understanding the socioeconomic status of beneficiaries, as all national skills development polices
place an emphasis on prioritisation of the poor. For the SETA it is important to understand whether its
interventions are targeting the most deserving, which by extension – and within the context of this evaluation
– would demonstrate that the incidence of its interventions overlaps with those whose poverty status would
not allow them to otherwise gain access to further education.
Given that poverty is a household phenomenon, both household income and household size were needed to
construct poverty indicators. Just like the national poverty statistics by Stats SA, they are calculated using per
capita household income, relative to the same upper-bound poverty line used by Stats SA of R1,227 per
capita monthly expenditure and monthly income in our case (Statistics SA, 2019). This means that the findings
on poverty in this section are weighted by household size, and as such refer to the reference population of
19,126 that represents these beneficiaries.
Figure 29 shows the three conventional Foster-Greer-Thorbecke (FGT) poverty indicators that capture the
prevalence of poverty (FGT0) (i.e. the number of people who are below the poverty line), the depth of
poverty (FGT1) (i.e. the distance the poor are from the poverty line) and the severity of poverty (FGT2) which
captures extreme poverty, that is those furthest from the poverty line (Foster et al., 1984). Except for
bursaries, relative to national levels poverty is very high across all interventions. This is more so for WIL TVET
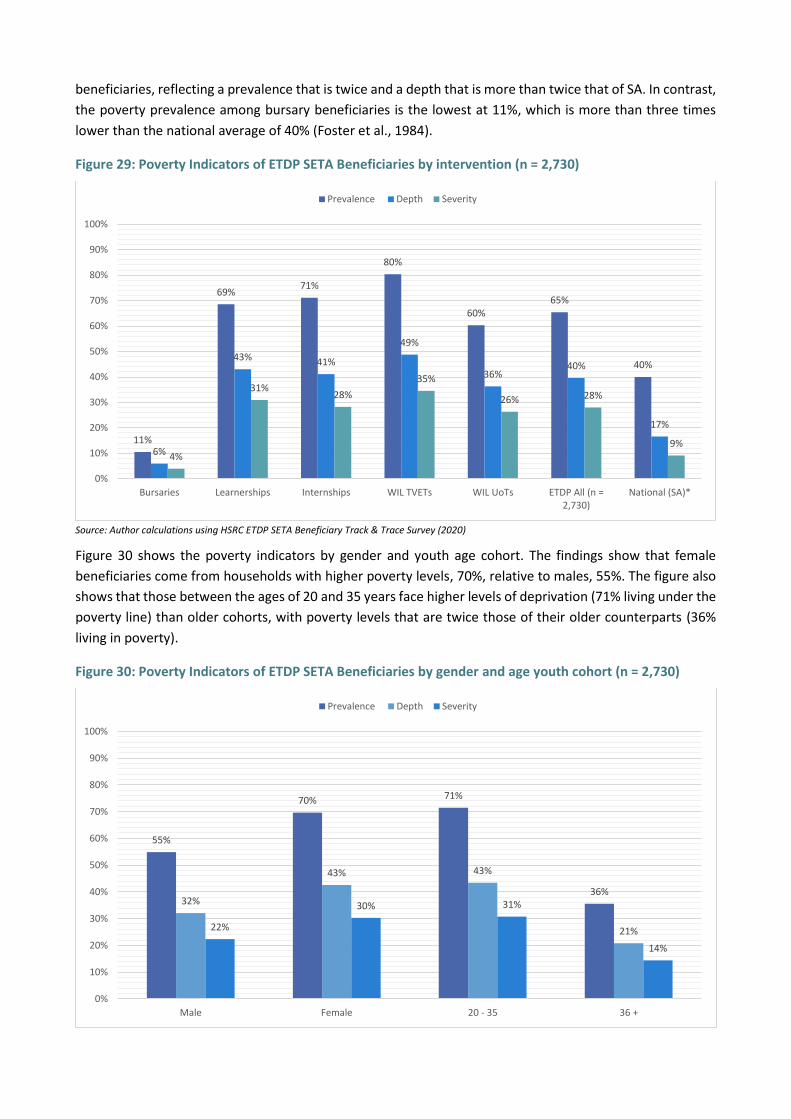
beneficiaries, reflecting a prevalence that is twice and a depth that is more than twice that of SA. In contrast,
the poverty prevalence among bursary beneficiaries is the lowest at 11%, which is more than three times
lower than the national average of 40% (Foster et al., 1984).
Figure 29: Poverty Indicators of ETDP SETA Beneficiaries by intervention (n = 2,730)
Source: Author calculations using HSRC ETDP SETA Beneficiary Track & Trace Survey (2020)
Figure 30 shows the poverty indicators by gender and youth age cohort. The findings show that female
beneficiaries come from households with higher poverty levels, 70%, relative to males, 55%. The figure also
shows that those between the ages of 20 and 35 years face higher levels of deprivation (71% living under the
poverty line) than older cohorts, with poverty levels that are twice those of their older counterparts (36%
living in poverty).
Figure 30: Poverty Indicators of ETDP SETA Beneficiaries by gender and age youth cohort (n = 2,730)
11%
69%71%
80%
60%65%
40%
6%
43% 41%
49%
36%40%
17%
4%
31%28%
35%
26% 28%
9%
0%
10%
20%
30%
40%
50%
60%
70%
80%
90%
100%
Bursaries Learnerships Internships WIL TVETs WIL UoTs ETDP All (n =2,730)
National (SA)*
Prevalence Depth Severity
55%
70% 71%
36%32%
43% 43%
21%22%
30% 31%
14%
0%
10%
20%
30%
40%
50%
60%
70%
80%
90%
100%
Male Female 20 - 35 36 +
Prevalence Depth Severity
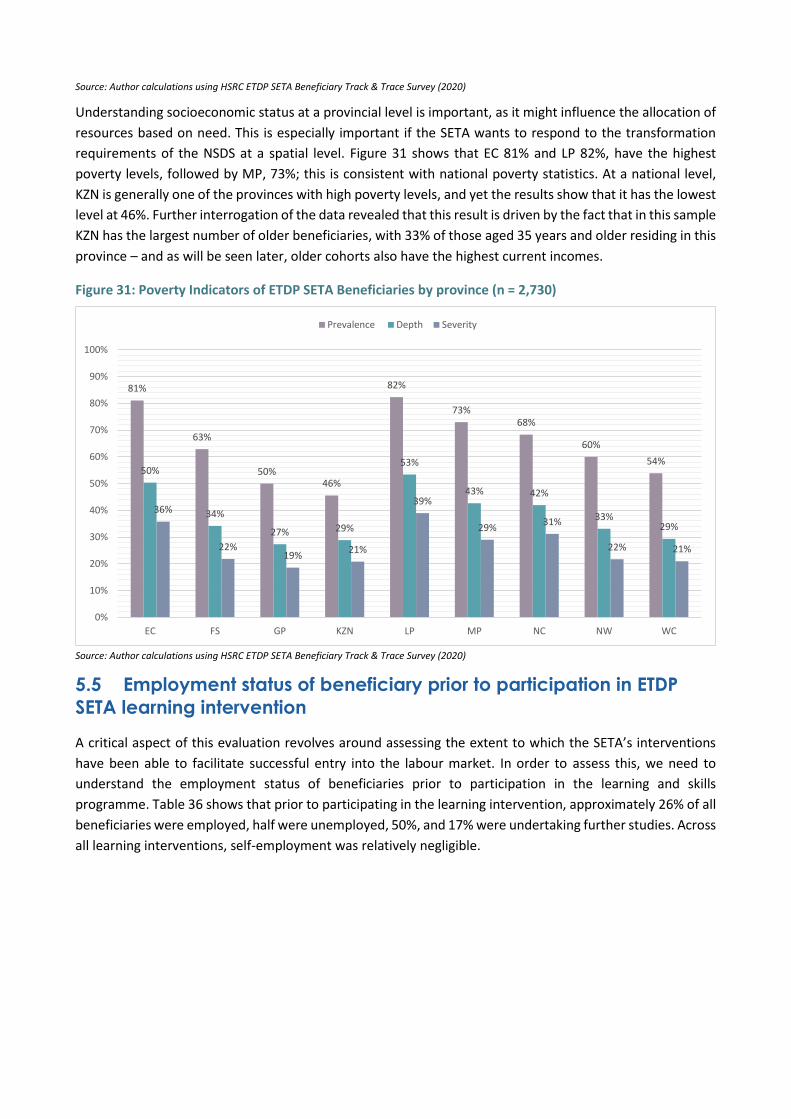
Source: Author calculations using HSRC ETDP SETA Beneficiary Track & Trace Survey (2020)
Understanding socioeconomic status at a provincial level is important, as it might influence the allocation of
resources based on need. This is especially important if the SETA wants to respond to the transformation
requirements of the NSDS at a spatial level. Figure 31 shows that EC 81% and LP 82%, have the highest
poverty levels, followed by MP, 73%; this is consistent with national poverty statistics. At a national level,
KZN is generally one of the provinces with high poverty levels, and yet the results show that it has the lowest
level at 46%. Further interrogation of the data revealed that this result is driven by the fact that in this sample
KZN has the largest number of older beneficiaries, with 33% of those aged 35 years and older residing in this
province – and as will be seen later, older cohorts also have the highest current incomes.
Figure 31: Poverty Indicators of ETDP SETA Beneficiaries by province (n = 2,730)
Source: Author calculations using HSRC ETDP SETA Beneficiary Track & Trace Survey (2020)
5.5 Employment status of beneficiary prior to participation in ETDP
SETA learning intervention
A critical aspect of this evaluation revolves around assessing the extent to which the SETA’s interventions
have been able to facilitate successful entry into the labour market. In order to assess this, we need to
understand the employment status of beneficiaries prior to participation in the learning and skills
programme. Table 36 shows that prior to participating in the learning intervention, approximately 26% of all
beneficiaries were employed, half were unemployed, 50%, and 17% were undertaking further studies. Across
all learning interventions, self-employment was relatively negligible.
81%
63%
50%46%
82%
73%68%
60%
54%50%
34%
27% 29%
53%
43% 42%
33%29%
36%
22%19%
21%
39%
29%31%
22% 21%
0%
10%
20%
30%
40%
50%
60%
70%
80%
90%
100%
EC FS GP KZN LP MP NC NW WC
Prevalence Depth Severity
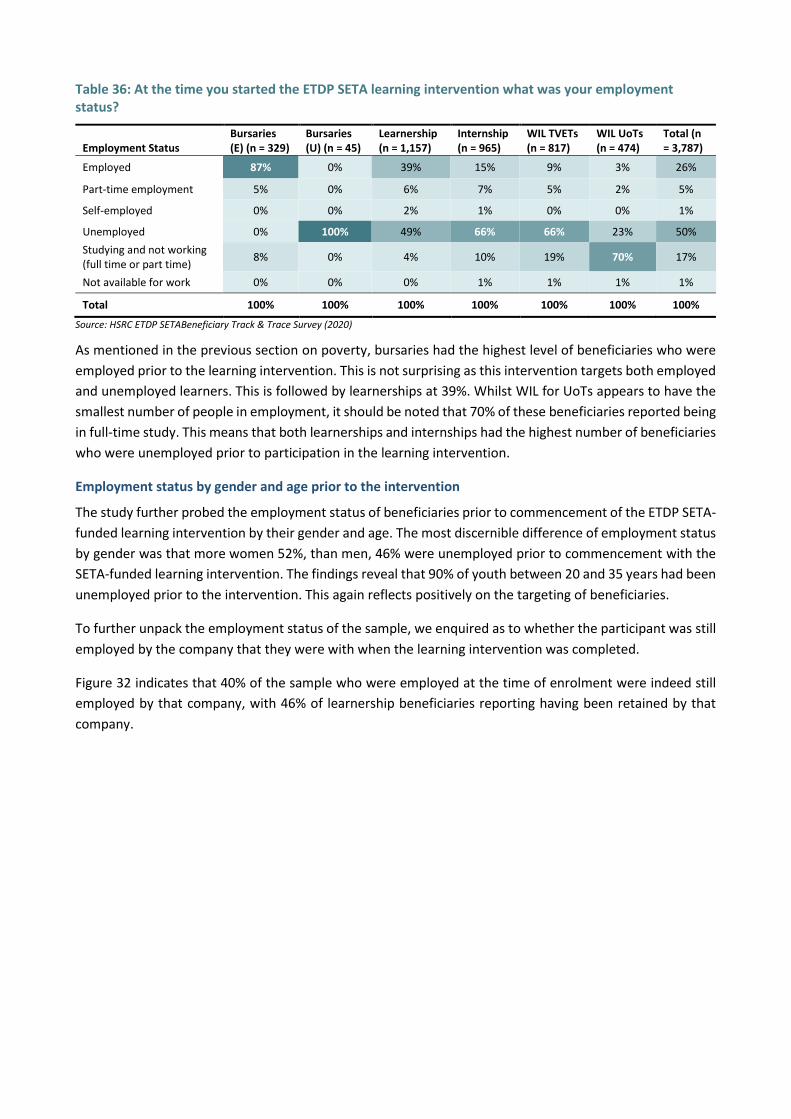
Table 36: At the time you started the ETDP SETA learning intervention what was your employment status?
Employment Status Bursaries (E) (n = 329)
Bursaries (U) (n = 45)
Learnership (n = 1,157)
Internship (n = 965)
WIL TVETs (n = 817)
WIL UoTs (n = 474)
Total (n = 3,787)
Employed 87% 0% 39% 15% 9% 3% 26%
Part-time employment 5% 0% 6% 7% 5% 2% 5%
Self-employed 0% 0% 2% 1% 0% 0% 1%
Unemployed 0% 100% 49% 66% 66% 23% 50%
Studying and not working (full time or part time)
8% 0% 4% 10% 19% 70% 17%
Not available for work 0% 0% 0% 1% 1% 1% 1%
Total 100% 100% 100% 100% 100% 100% 100%
Source: HSRC ETDP SETABeneficiary Track & Trace Survey (2020)
As mentioned in the previous section on poverty, bursaries had the highest level of beneficiaries who were
employed prior to the learning intervention. This is not surprising as this intervention targets both employed
and unemployed learners. This is followed by learnerships at 39%. Whilst WIL for UoTs appears to have the
smallest number of people in employment, it should be noted that 70% of these beneficiaries reported being
in full-time study. This means that both learnerships and internships had the highest number of beneficiaries
who were unemployed prior to participation in the learning intervention.
Employment status by gender and age prior to the intervention
The study further probed the employment status of beneficiaries prior to commencement of the ETDP SETA-
funded learning intervention by their gender and age. The most discernible difference of employment status
by gender was that more women 52%, than men, 46% were unemployed prior to commencement with the
SETA-funded learning intervention. The findings reveal that 90% of youth between 20 and 35 years had been
unemployed prior to the intervention. This again reflects positively on the targeting of beneficiaries.
To further unpack the employment status of the sample, we enquired as to whether the participant was still
employed by the company that they were with when the learning intervention was completed.
Figure 32 indicates that 40% of the sample who were employed at the time of enrolment were indeed still
employed by that company, with 46% of learnership beneficiaries reporting having been retained by that
company.
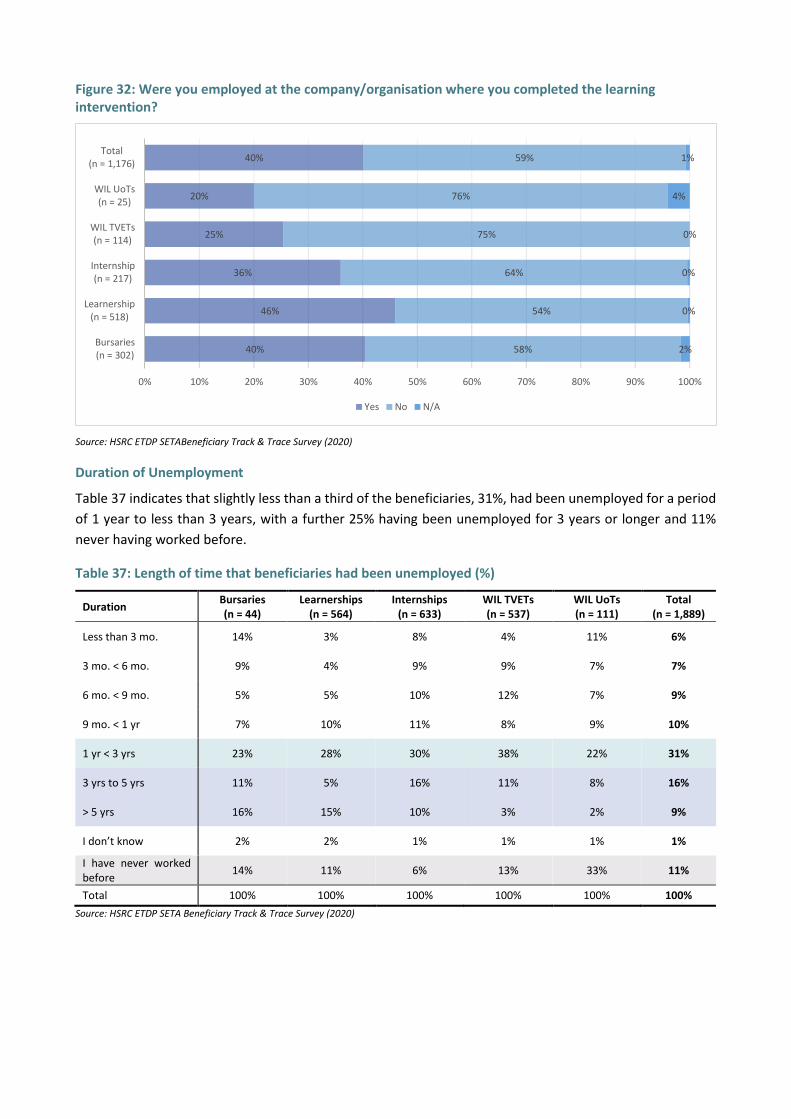
Figure 32: Were you employed at the company/organisation where you completed the learning intervention?
Source: HSRC ETDP SETABeneficiary Track & Trace Survey (2020)
Duration of Unemployment
Table 37 indicates that slightly less than a third of the beneficiaries, 31%, had been unemployed for a period
of 1 year to less than 3 years, with a further 25% having been unemployed for 3 years or longer and 11%
never having worked before.
Table 37: Length of time that beneficiaries had been unemployed (%)
Duration Bursaries (n = 44)
Learnerships (n = 564)
Internships (n = 633)
WIL TVETs (n = 537)
WIL UoTs (n = 111)
Total (n = 1,889)
Less than 3 mo. 14% 3% 8% 4% 11% 6%
3 mo. < 6 mo. 9% 4% 9% 9% 7% 7%
6 mo. < 9 mo. 5% 5% 10% 12% 7% 9%
9 mo. < 1 yr 7% 10% 11% 8% 9% 10%
1 yr < 3 yrs 23% 28% 30% 38% 22% 31%
3 yrs to 5 yrs 11% 5% 16% 11% 8% 16%
> 5 yrs 16% 15% 10% 3% 2% 9%
I don’t know 2% 2% 1% 1% 1% 1%
I have never worked before
14% 11% 6% 13% 33% 11%
Total 100% 100% 100% 100% 100% 100%
Source: HSRC ETDP SETA Beneficiary Track & Trace Survey (2020)
40%
46%
36%
25%
20%
40%
58%
54%
64%
75%
76%
59%
2%
0%
0%
0%
4%
1%
0% 10% 20% 30% 40% 50% 60% 70% 80% 90% 100%
Bursaries(n = 302)
Learnership(n = 518)
Internship(n = 217)
WIL TVETs(n = 114)
WIL UoTs(n = 25)
Total(n = 1,176)
Yes No N/A
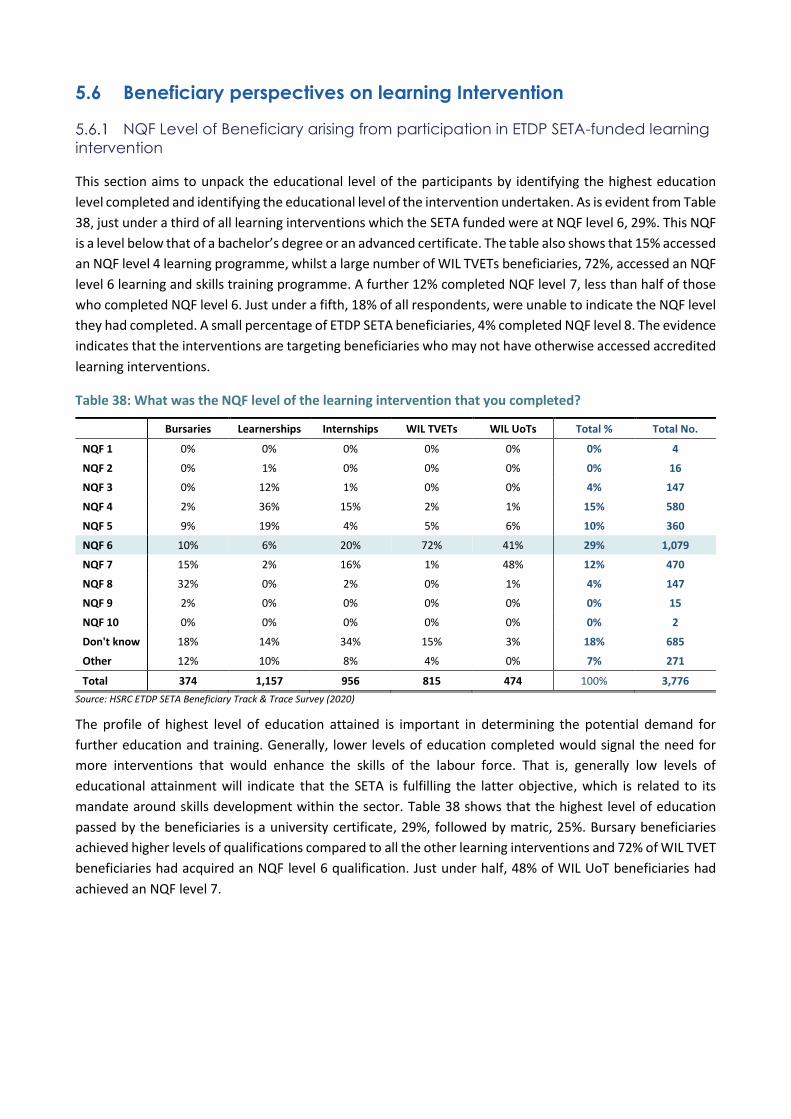
5.6 Beneficiary perspectives on learning Intervention
NQF Level of Beneficiary arising from participation in ETDP SETA-funded learning
intervention
This section aims to unpack the educational level of the participants by identifying the highest education
level completed and identifying the educational level of the intervention undertaken. As is evident from Table
38, just under a third of all learning interventions which the SETA funded were at NQF level 6, 29%. This NQF
is a level below that of a bachelor’s degree or an advanced certificate. The table also shows that 15% accessed
an NQF level 4 learning programme, whilst a large number of WIL TVETs beneficiaries, 72%, accessed an NQF
level 6 learning and skills training programme. A further 12% completed NQF level 7, less than half of those
who completed NQF level 6. Just under a fifth, 18% of all respondents, were unable to indicate the NQF level
they had completed. A small percentage of ETDP SETA beneficiaries, 4% completed NQF level 8. The evidence
indicates that the interventions are targeting beneficiaries who may not have otherwise accessed accredited
learning interventions.
Table 38: What was the NQF level of the learning intervention that you completed?
Bursaries Learnerships Internships WIL TVETs WIL UoTs Total % Total No.
NQF 1 0% 0% 0% 0% 0% 0% 4
NQF 2 0% 1% 0% 0% 0% 0% 16
NQF 3 0% 12% 1% 0% 0% 4% 147
NQF 4 2% 36% 15% 2% 1% 15% 580
NQF 5 9% 19% 4% 5% 6% 10% 360
NQF 6 10% 6% 20% 72% 41% 29% 1,079
NQF 7 15% 2% 16% 1% 48% 12% 470
NQF 8 32% 0% 2% 0% 1% 4% 147
NQF 9 2% 0% 0% 0% 0% 0% 15
NQF 10 0% 0% 0% 0% 0% 0% 2
Don't know 18% 14% 34% 15% 3% 18% 685
Other 12% 10% 8% 4% 0% 7% 271
Total 374 1,157 956 815 474 100% 3,776
Source: HSRC ETDP SETA Beneficiary Track & Trace Survey (2020)
The profile of highest level of education attained is important in determining the potential demand for
further education and training. Generally, lower levels of education completed would signal the need for
more interventions that would enhance the skills of the labour force. That is, generally low levels of
educational attainment will indicate that the SETA is fulfilling the latter objective, which is related to its
mandate around skills development within the sector. Table 38 shows that the highest level of education
passed by the beneficiaries is a university certificate, 29%, followed by matric, 25%. Bursary beneficiaries
achieved higher levels of qualifications compared to all the other learning interventions and 72% of WIL TVET
beneficiaries had acquired an NQF level 6 qualification. Just under half, 48% of WIL UoT beneficiaries had
achieved an NQF level 7.
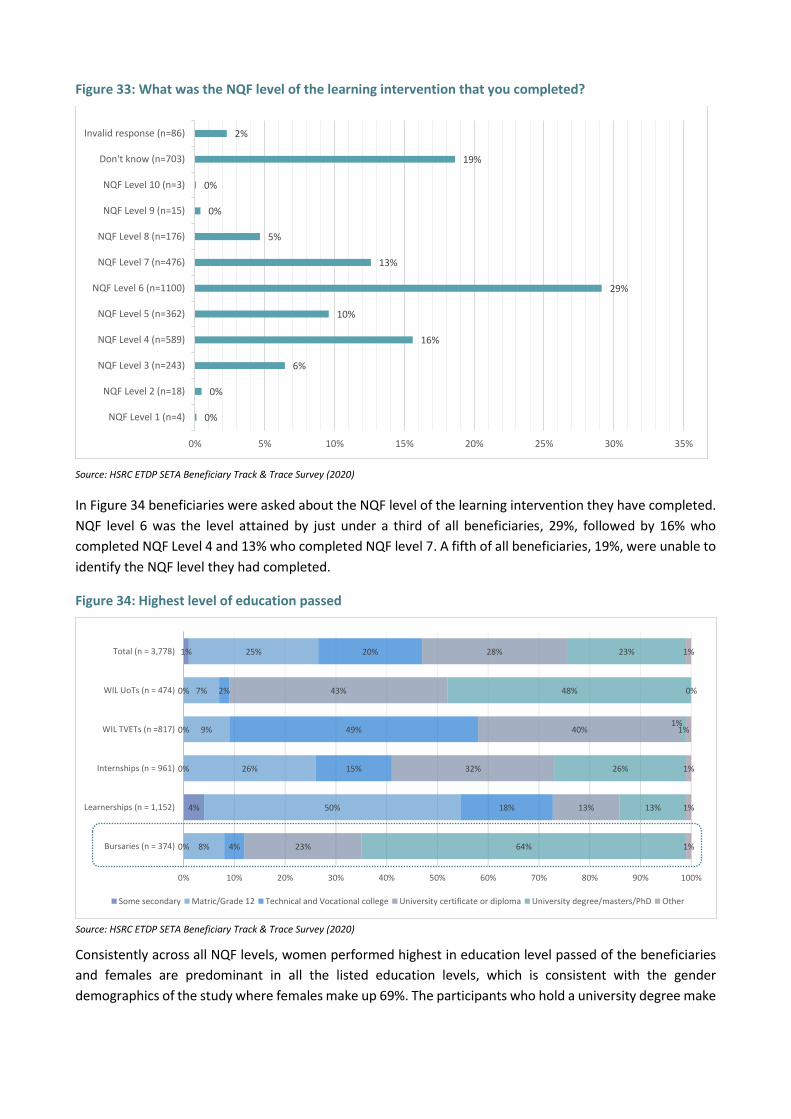
Figure 33: What was the NQF level of the learning intervention that you completed?
Source: HSRC ETDP SETA Beneficiary Track & Trace Survey (2020)
In Figure 34 beneficiaries were asked about the NQF level of the learning intervention they have completed.
NQF level 6 was the level attained by just under a third of all beneficiaries, 29%, followed by 16% who
completed NQF Level 4 and 13% who completed NQF level 7. A fifth of all beneficiaries, 19%, were unable to
identify the NQF level they had completed.
Figure 34: Highest level of education passed
Source: HSRC ETDP SETA Beneficiary Track & Trace Survey (2020)
Consistently across all NQF levels, women performed highest in education level passed of the beneficiaries
and females are predominant in all the listed education levels, which is consistent with the gender
demographics of the study where females make up 69%. The participants who hold a university degree make
0%
0%
6%
16%
10%
29%
13%
5%
0%
0%
19%
2%
0% 5% 10% 15% 20% 25% 30% 35%
NQF Level 1 (n=4)
NQF Level 2 (n=18)
NQF Level 3 (n=243)
NQF Level 4 (n=589)
NQF Level 5 (n=362)
NQF Level 6 (n=1100)
NQF Level 7 (n=476)
NQF Level 8 (n=176)
NQF Level 9 (n=15)
NQF Level 10 (n=3)
Don't know (n=703)
Invalid response (n=86)
0%
4%
0%
0%
0%
1%
8%
50%
26%
9%
7%
25%
4%
18%
15%
49%
2%
20%
23%
13%
32%
40%
43%
28%
64%
13%
26%
1%
48%
23%
1%
1%
1%
1%
0%
1%
0% 10% 20% 30% 40% 50% 60% 70% 80% 90% 100%
Bursaries (n = 374)
Learnerships (n = 1,152)
Internships (n = 961)
WIL TVETs (n =817)
WIL UoTs (n = 474)
Total (n = 3,778)
Some secondary Matric/Grade 12 Technical and Vocational college University certificate or diploma University degree/masters/PhD Other
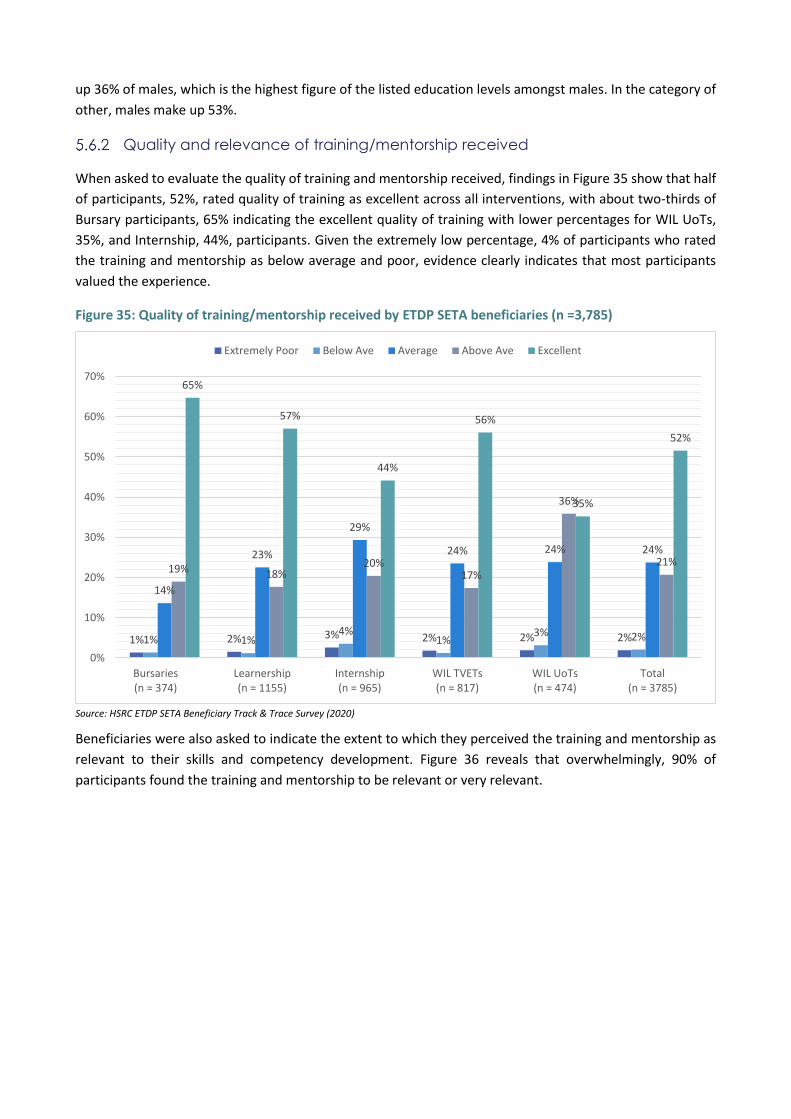
up 36% of males, which is the highest figure of the listed education levels amongst males. In the category of
other, males make up 53%.
Quality and relevance of training/mentorship received
When asked to evaluate the quality of training and mentorship received, findings in Figure 35 show that half
of participants, 52%, rated quality of training as excellent across all interventions, with about two-thirds of
Bursary participants, 65% indicating the excellent quality of training with lower percentages for WIL UoTs,
35%, and Internship, 44%, participants. Given the extremely low percentage, 4% of participants who rated
the training and mentorship as below average and poor, evidence clearly indicates that most participants
valued the experience.
Figure 35: Quality of training/mentorship received by ETDP SETA beneficiaries (n =3,785)
Source: HSRC ETDP SETA Beneficiary Track & Trace Survey (2020)
Beneficiaries were also asked to indicate the extent to which they perceived the training and mentorship as
relevant to their skills and competency development. Figure 36 reveals that overwhelmingly, 90% of
participants found the training and mentorship to be relevant or very relevant.
1% 2% 3% 2% 2% 2%1% 1%4%
1%3% 2%
14%
23%
29%
24% 24% 24%
19% 18%20%
17%
36%
21%
65%
57%
44%
56%
35%
52%
0%
10%
20%
30%
40%
50%
60%
70%
Bursaries(n = 374)
Learnership(n = 1155)
Internship(n = 965)
WIL TVETs(n = 817)
WIL UoTs(n = 474)
Total(n = 3785)
Extremely Poor Below Ave Average Above Ave Excellent
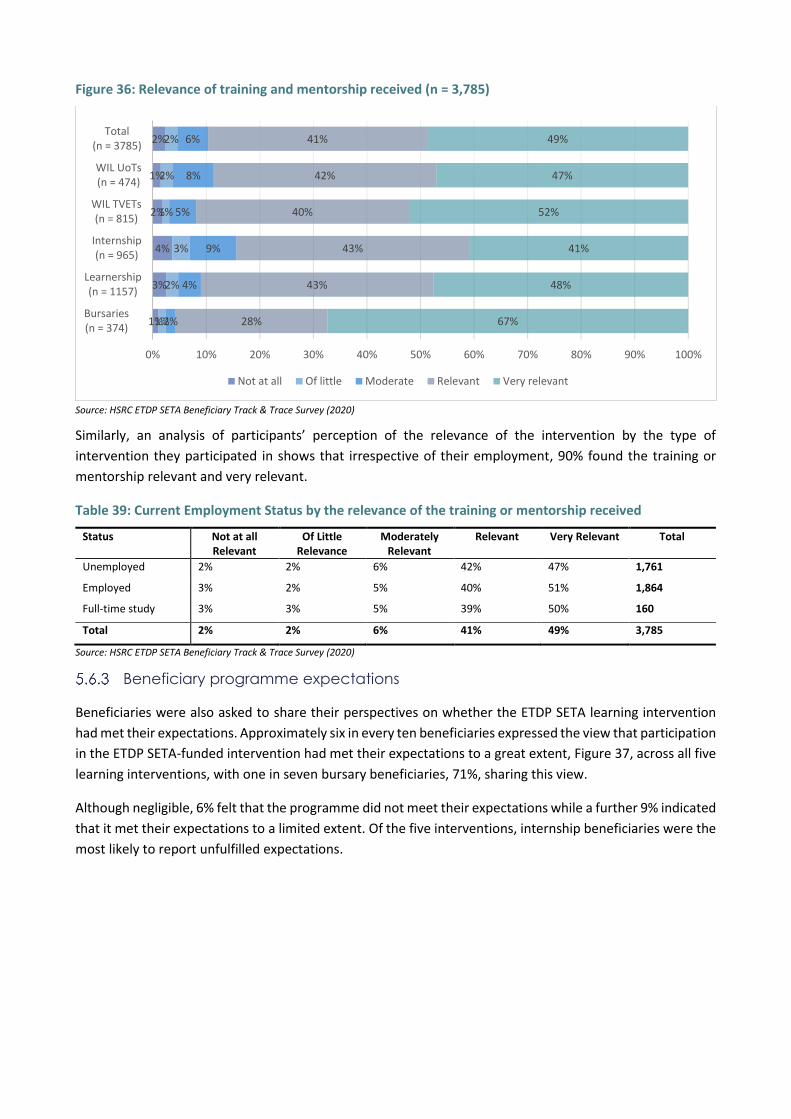
Figure 36: Relevance of training and mentorship received (n = 3,785)
Source: HSRC ETDP SETA Beneficiary Track & Trace Survey (2020)
Similarly, an analysis of participants’ perception of the relevance of the intervention by the type of
intervention they participated in shows that irrespective of their employment, 90% found the training or
mentorship relevant and very relevant.
Table 39: Current Employment Status by the relevance of the training or mentorship received
Status Not at all Relevant
Of Little Relevance
Moderately Relevant
Relevant Very Relevant Total
Unemployed 2% 2% 6% 42% 47% 1,761
Employed 3% 2% 5% 40% 51% 1,864
Full-time study 3% 3% 5% 39% 50% 160
Total 2% 2% 6% 41% 49% 3,785
Source: HSRC ETDP SETA Beneficiary Track & Trace Survey (2020)
Beneficiary programme expectations
Beneficiaries were also asked to share their perspectives on whether the ETDP SETA learning intervention
had met their expectations. Approximately six in every ten beneficiaries expressed the view that participation
in the ETDP SETA-funded intervention had met their expectations to a great extent, Figure 37, across all five
learning interventions, with one in seven bursary beneficiaries, 71%, sharing this view.
Although negligible, 6% felt that the programme did not meet their expectations while a further 9% indicated
that it met their expectations to a limited extent. Of the five interventions, internship beneficiaries were the
most likely to report unfulfilled expectations.
1%
3%
4%
2%
1%
2%
1%
2%
3%
1%
2%
2%
2%
4%
9%
5%
8%
6%
28%
43%
43%
40%
42%
41%
67%
48%
41%
52%
47%
49%
0% 10% 20% 30% 40% 50% 60% 70% 80% 90% 100%
Bursaries(n = 374)
Learnership(n = 1157)
Internship(n = 965)
WIL TVETs(n = 815)
WIL UoTs(n = 474)
Total(n = 3785)
Not at all Of little Moderate Relevant Very relevant
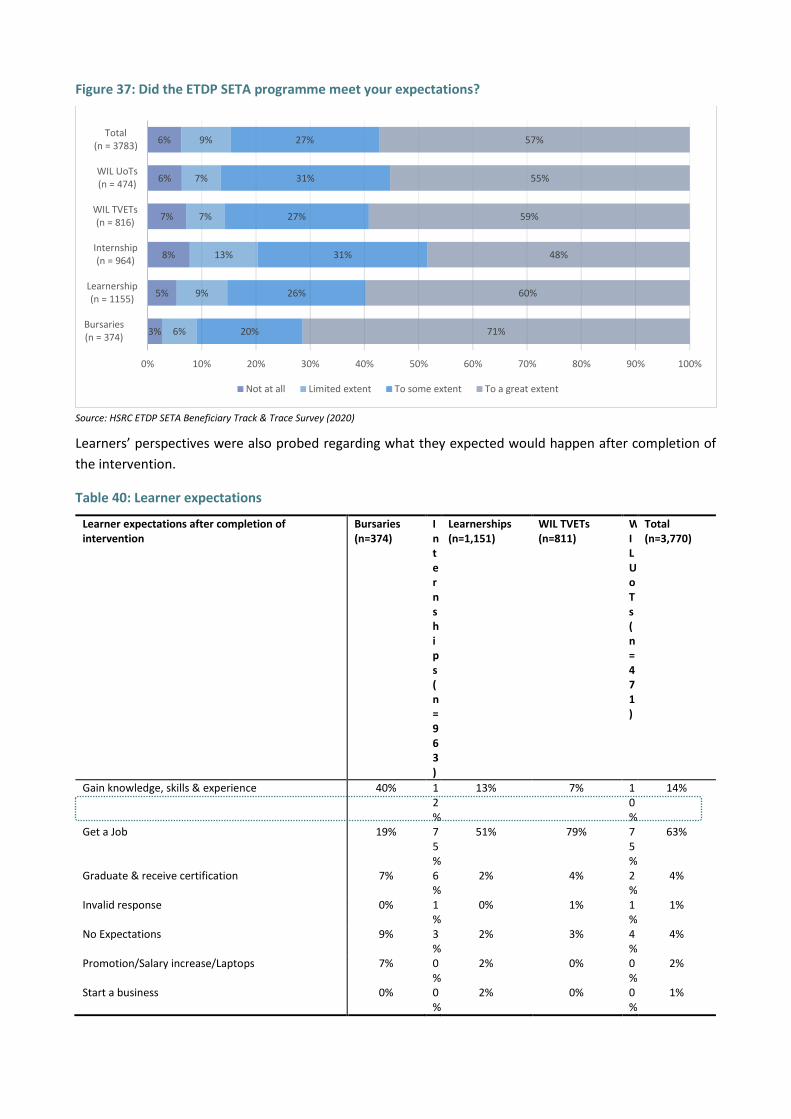
Figure 37: Did the ETDP SETA programme meet your expectations?
Source: HSRC ETDP SETA Beneficiary Track & Trace Survey (2020)
Learners’ perspectives were also probed regarding what they expected would happen after completion of
the intervention.
Table 40: Learner expectations
Learner expectations after completion of intervention
Bursaries (n=374)
Internships (n=963)
Learnerships (n=1,151)
WIL TVETs (n=811)
WIL UoTs (n=471)
Total (n=3,770)
Gain knowledge, skills & experience 40% 12%
13% 7% 10%
14%
Get a Job 19% 75%
51% 79% 75%
63%
Graduate & receive certification 7% 6%
2% 4% 2%
4%
Invalid response 0% 1%
0% 1% 1%
1%
No Expectations 9% 3%
2% 3% 4%
4%
Promotion/Salary increase/Laptops 7% 0%
2% 0% 0%
2%
Start a business 0% 0%
2% 0% 0%
1%
3%
5%
8%
7%
6%
6%
6%
9%
13%
7%
7%
9%
20%
26%
31%
27%
31%
27%
71%
60%
48%
59%
55%
57%
0% 10% 20% 30% 40% 50% 60% 70% 80% 90% 100%
Bursaries(n = 374)
Learnership(n = 1155)
Internship(n = 964)
WIL TVETs(n = 816)
WIL UoTs(n = 474)
Total(n = 3783)
Not at all Limited extent To some extent To a great extent

Opportunity for further studies 15% 4%
16% 6% 8%
10%
Computer literacy skills 2% 0%
11% 0% 0%
4%
Source: HSRC ETDP SETA Beneficiary Track & Trace Survey (2020)
It is evident across four of the learning programmes that securing employment was the most favoured
expectation (63%) after completion of the learning intervention, Table 40. Bursary learners rated the most
favoured expectation as gaining knowledge and experience (40%) and their second expectation was getting
a job (19%). Gaining knowledge, skills and experience rated the second best at 14%, followed by opportunity
for further study at 10%. Although government has placed high emphasis on small business development,
very few learners (1%) aspired to start a business
Relevance of learning/training intervention to their work
Next, we look at the relevance of the study interventions to the current jobs of the beneficiaries. Figure 38
indicates that 56% of the beneficiaries found the training to be highly relevant to the work they were
currently doing. The findings further reveal that bursary beneficiaries, 72%, were the most likely to report
close alignment between current employment and the kind of training received, followed by 58% of
learnership beneficiaries.
This outcome is unsurprising, given the age and possible career advancement of beneficiaries accessing the
two interventions. This would suggest that they might be able to select learning opportunities that are better
aligned to their work. From the perspective of the evaluation, this outcome speaks to the effectiveness of
the skills programme’s objective of enhancing the skills levels of the labour force.
A fifth of WIL TVETs beneficiaries, 20%, which is almost double the average, expressed concerns about the
lack of relevance of the training to their current work, with a lower percentage of WIL UoTs, 14% and
learnerships, 12%, beneficiaries feeling the same way. One TVET participant expressed the need for:
“Transparent channels of report if bad conduct from service provider”
A few participants bemoaned the relevance of the qualification. A currently part-time employee said the
following:
“On my opinion this certificate is not recognised because I have been applying and not get even
one interview from my internship. I am not sure what the problem is”.
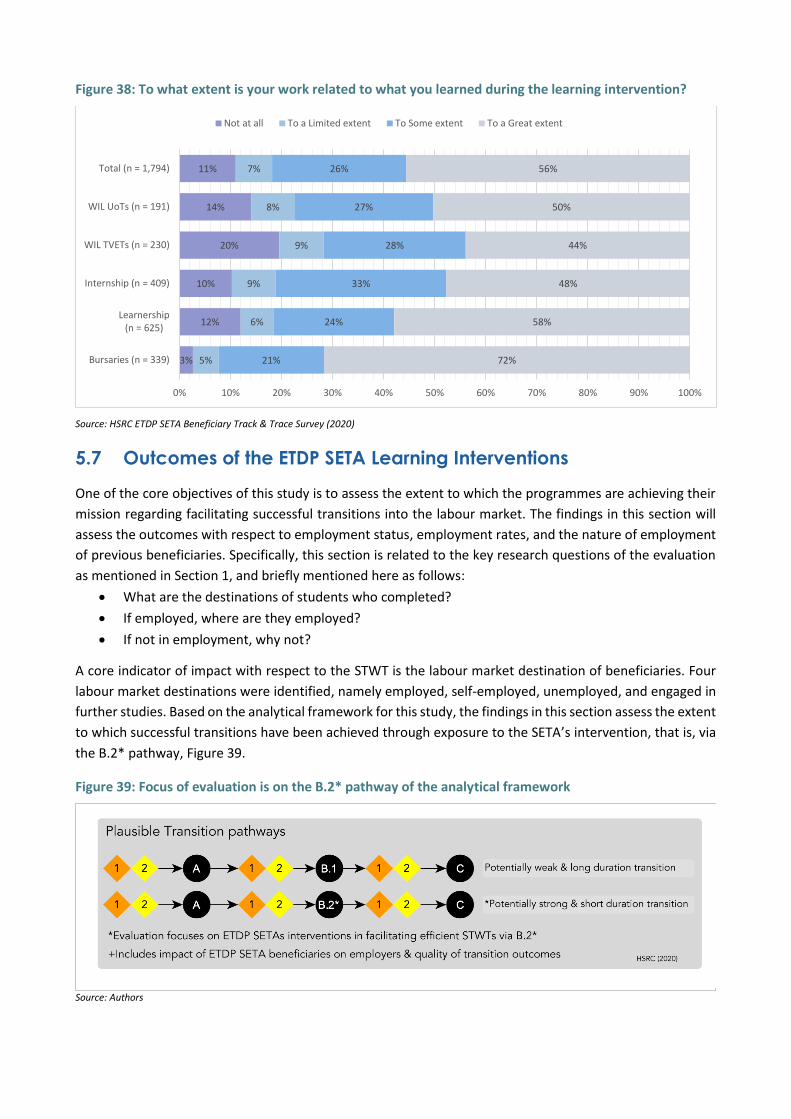
Figure 38: To what extent is your work related to what you learned during the learning intervention?
Source: HSRC ETDP SETA Beneficiary Track & Trace Survey (2020)
5.7 Outcomes of the ETDP SETA Learning Interventions
One of the core objectives of this study is to assess the extent to which the programmes are achieving their
mission regarding facilitating successful transitions into the labour market. The findings in this section will
assess the outcomes with respect to employment status, employment rates, and the nature of employment
of previous beneficiaries. Specifically, this section is related to the key research questions of the evaluation
as mentioned in Section 1, and briefly mentioned here as follows:
What are the destinations of students who completed?
If employed, where are they employed?
If not in employment, why not?
A core indicator of impact with respect to the STWT is the labour market destination of beneficiaries. Four
labour market destinations were identified, namely employed, self-employed, unemployed, and engaged in
further studies. Based on the analytical framework for this study, the findings in this section assess the extent
to which successful transitions have been achieved through exposure to the SETA’s intervention, that is, via
the B.2* pathway, Figure 39.
Figure 39: Focus of evaluation is on the B.2* pathway of the analytical framework
Source: Authors
3%
12%
10%
20%
14%
11%
5%
6%
9%
9%
8%
7%
21%
24%
33%
28%
27%
26%
72%
58%
48%
44%
50%
56%
0% 10% 20% 30% 40% 50% 60% 70% 80% 90% 100%
Bursaries (n = 339)
Learnership(n = 625)
Internship (n = 409)
WIL TVETs (n = 230)
WIL UoTs (n = 191)
Total (n = 1,794)
Not at all To a Limited extent To Some extent To a Great extent
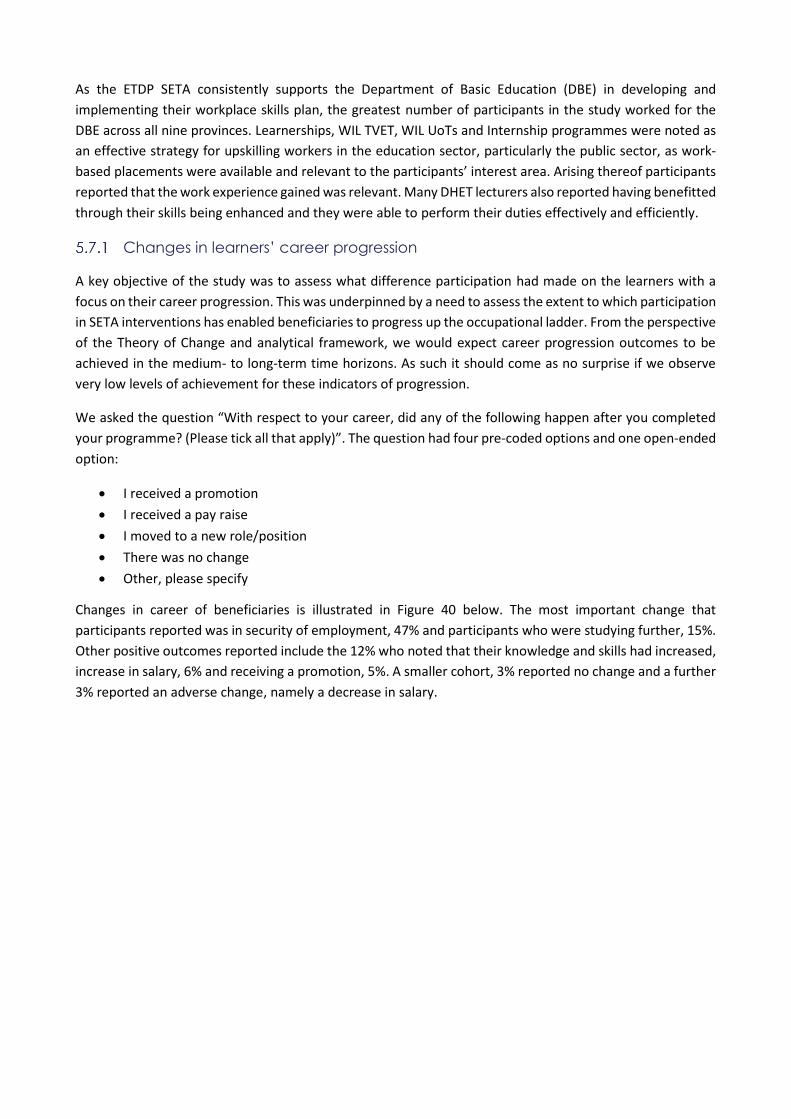
As the ETDP SETA consistently supports the Department of Basic Education (DBE) in developing and
implementing their workplace skills plan, the greatest number of participants in the study worked for the
DBE across all nine provinces. Learnerships, WIL TVET, WIL UoTs and Internship programmes were noted as
an effective strategy for upskilling workers in the education sector, particularly the public sector, as work-
based placements were available and relevant to the participants’ interest area. Arising thereof participants
reported that the work experience gained was relevant. Many DHET lecturers also reported having benefitted
through their skills being enhanced and they were able to perform their duties effectively and efficiently.
Changes in learners’ career progression
A key objective of the study was to assess what difference participation had made on the learners with a
focus on their career progression. This was underpinned by a need to assess the extent to which participation
in SETA interventions has enabled beneficiaries to progress up the occupational ladder. From the perspective
of the Theory of Change and analytical framework, we would expect career progression outcomes to be
achieved in the medium- to long-term time horizons. As such it should come as no surprise if we observe
very low levels of achievement for these indicators of progression.
We asked the question “With respect to your career, did any of the following happen after you completed
your programme? (Please tick all that apply)”. The question had four pre-coded options and one open-ended
option:
I received a promotion
I received a pay raise
I moved to a new role/position
There was no change
Other, please specify
Changes in career of beneficiaries is illustrated in Figure 40 below. The most important change that
participants reported was in security of employment, 47% and participants who were studying further, 15%.
Other positive outcomes reported include the 12% who noted that their knowledge and skills had increased,
increase in salary, 6% and receiving a promotion, 5%. A smaller cohort, 3% reported no change and a further
3% reported an adverse change, namely a decrease in salary.
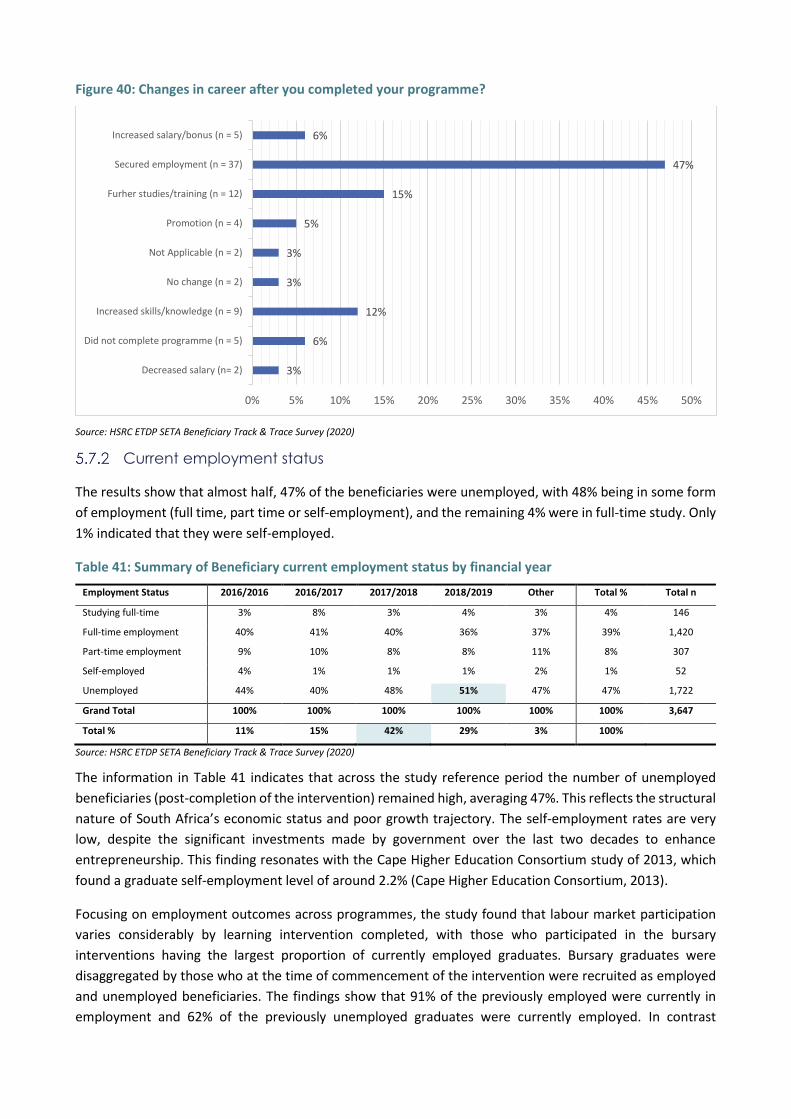
Figure 40: Changes in career after you completed your programme?
Source: HSRC ETDP SETA Beneficiary Track & Trace Survey (2020)
Current employment status
The results show that almost half, 47% of the beneficiaries were unemployed, with 48% being in some form
of employment (full time, part time or self-employment), and the remaining 4% were in full-time study. Only
1% indicated that they were self-employed.
Table 41: Summary of Beneficiary current employment status by financial year
Employment Status 2016/2016 2016/2017 2017/2018 2018/2019 Other Total % Total n
Studying full-time 3% 8% 3% 4% 3% 4% 146
Full-time employment 40% 41% 40% 36% 37% 39% 1,420
Part-time employment 9% 10% 8% 8% 11% 8% 307
Self-employed 4% 1% 1% 1% 2% 1% 52
Unemployed 44% 40% 48% 51% 47% 47% 1,722
Grand Total 100% 100% 100% 100% 100% 100% 3,647
Total % 11% 15% 42% 29% 3% 100%
Source: HSRC ETDP SETA Beneficiary Track & Trace Survey (2020)
The information in Table 41 indicates that across the study reference period the number of unemployed
beneficiaries (post-completion of the intervention) remained high, averaging 47%. This reflects the structural
nature of South Africa’s economic status and poor growth trajectory. The self-employment rates are very
low, despite the significant investments made by government over the last two decades to enhance
entrepreneurship. This finding resonates with the Cape Higher Education Consortium study of 2013, which
found a graduate self-employment level of around 2.2% (Cape Higher Education Consortium, 2013).
Focusing on employment outcomes across programmes, the study found that labour market participation
varies considerably by learning intervention completed, with those who participated in the bursary
interventions having the largest proportion of currently employed graduates. Bursary graduates were
disaggregated by those who at the time of commencement of the intervention were recruited as employed
and unemployed beneficiaries. The findings show that 91% of the previously employed were currently in
employment and 62% of the previously unemployed graduates were currently employed. In contrast
3%
6%
12%
3%
3%
5%
15%
47%
6%
0% 5% 10% 15% 20% 25% 30% 35% 40% 45% 50%
Decreased salary (n= 2)
Did not complete programme (n = 5)
Increased skills/knowledge (n = 9)
No change (n = 2)
Not Applicable (n = 2)
Promotion (n = 4)
Furher studies/training (n = 12)
Secured employment (n = 37)
Increased salary/bonus (n = 5)
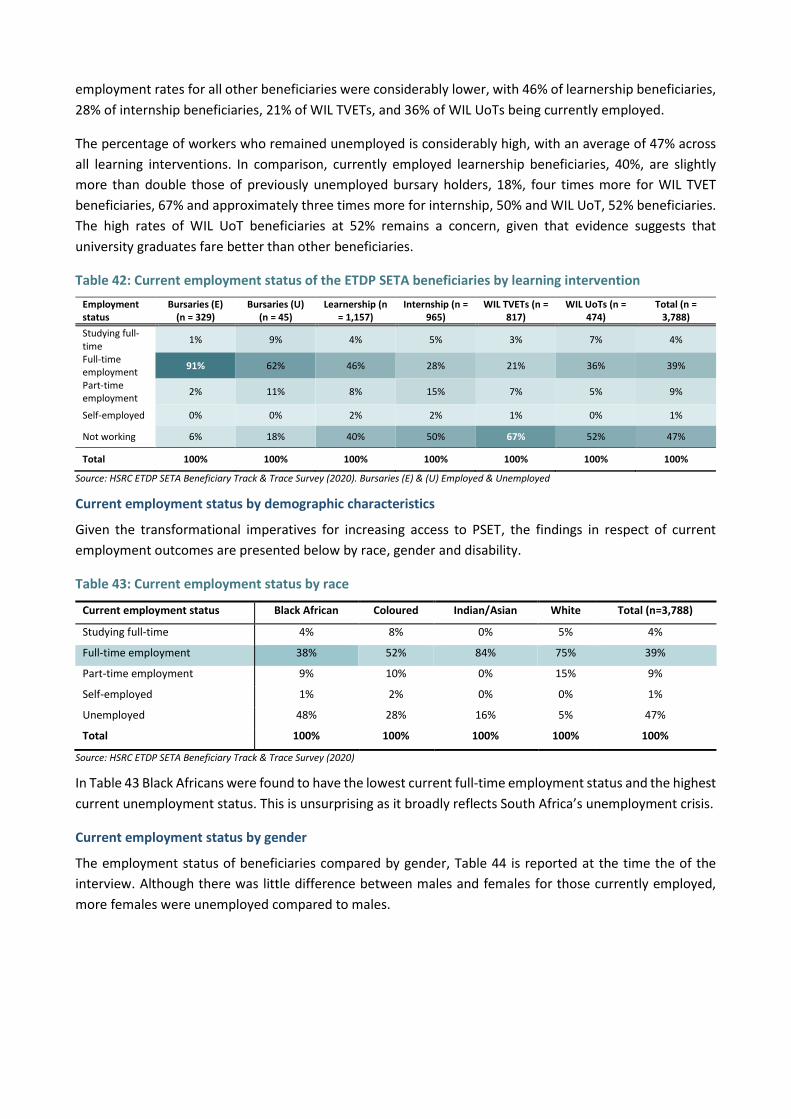
employment rates for all other beneficiaries were considerably lower, with 46% of learnership beneficiaries,
28% of internship beneficiaries, 21% of WIL TVETs, and 36% of WIL UoTs being currently employed.
The percentage of workers who remained unemployed is considerably high, with an average of 47% across
all learning interventions. In comparison, currently employed learnership beneficiaries, 40%, are slightly
more than double those of previously unemployed bursary holders, 18%, four times more for WIL TVET
beneficiaries, 67% and approximately three times more for internship, 50% and WIL UoT, 52% beneficiaries.
The high rates of WIL UoT beneficiaries at 52% remains a concern, given that evidence suggests that
university graduates fare better than other beneficiaries.
Table 42: Current employment status of the ETDP SETA beneficiaries by learning intervention
Employment status
Bursaries (E) (n = 329)
Bursaries (U) (n = 45)
Learnership (n = 1,157)
Internship (n = 965)
WIL TVETs (n = 817)
WIL UoTs (n = 474)
Total (n = 3,788)
Studying full-time
1% 9% 4% 5% 3% 7% 4%
Full-time employment
91% 62% 46% 28% 21% 36% 39%
Part-time employment
2% 11% 8% 15% 7% 5% 9%
Self-employed 0% 0% 2% 2% 1% 0% 1%
Not working 6% 18% 40% 50% 67% 52% 47%
Total 100% 100% 100% 100% 100% 100% 100%
Source: HSRC ETDP SETA Beneficiary Track & Trace Survey (2020). Bursaries (E) & (U) Employed & Unemployed
Current employment status by demographic characteristics
Given the transformational imperatives for increasing access to PSET, the findings in respect of current
employment outcomes are presented below by race, gender and disability.
Table 43: Current employment status by race
Current employment status Black African Coloured Indian/Asian White Total (n=3,788)
Studying full-time 4% 8% 0% 5% 4%
Full-time employment 38% 52% 84% 75% 39%
Part-time employment 9% 10% 0% 15% 9%
Self-employed 1% 2% 0% 0% 1%
Unemployed 48% 28% 16% 5% 47%
Total 100% 100% 100% 100% 100%
Source: HSRC ETDP SETA Beneficiary Track & Trace Survey (2020)
In Table 43 Black Africans were found to have the lowest current full-time employment status and the highest
current unemployment status. This is unsurprising as it broadly reflects South Africa’s unemployment crisis.
Current employment status by gender
The employment status of beneficiaries compared by gender, Table 44 is reported at the time the of the
interview. Although there was little difference between males and females for those currently employed,
more females were unemployed compared to males.
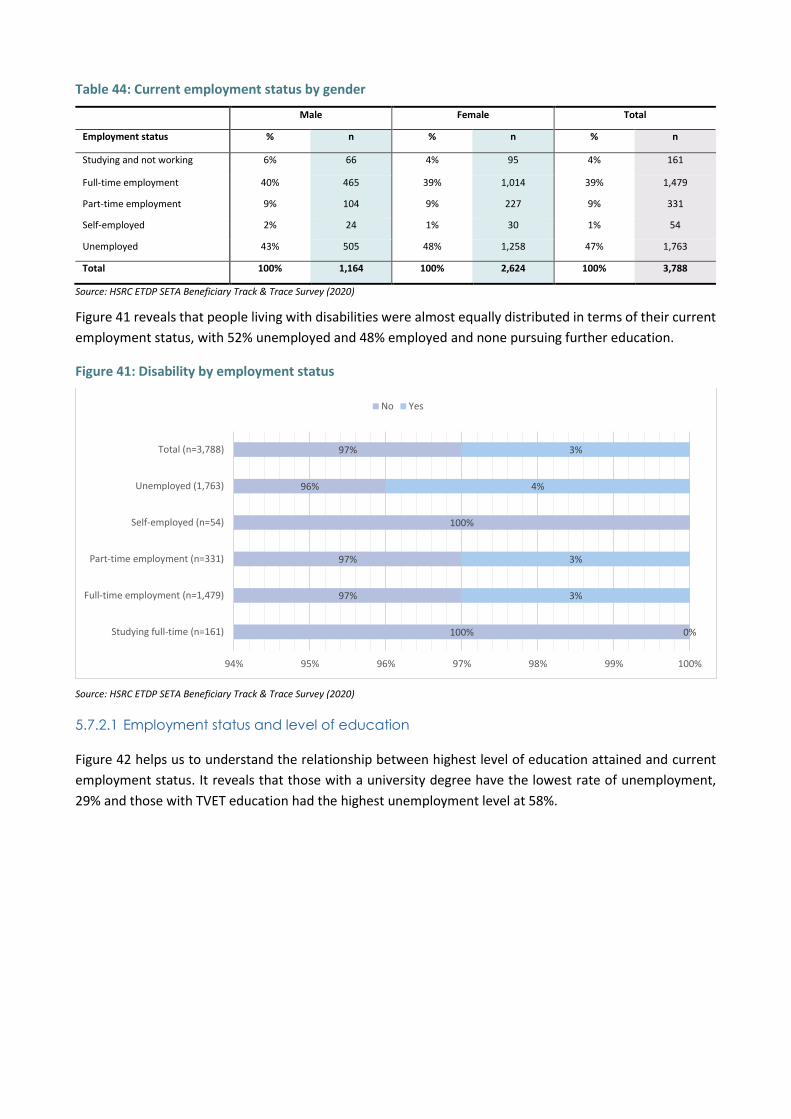
Table 44: Current employment status by gender
Male Female Total
Employment status % n % n % n
Studying and not working 6% 66 4% 95 4% 161
Full-time employment 40% 465 39% 1,014 39% 1,479
Part-time employment 9% 104 9% 227 9% 331
Self-employed 2% 24 1% 30 1% 54
Unemployed 43% 505 48% 1,258 47% 1,763
Total 100% 1,164 100% 2,624 100% 3,788
Source: HSRC ETDP SETA Beneficiary Track & Trace Survey (2020)
Figure 41 reveals that people living with disabilities were almost equally distributed in terms of their current
employment status, with 52% unemployed and 48% employed and none pursuing further education.
Figure 41: Disability by employment status
Source: HSRC ETDP SETA Beneficiary Track & Trace Survey (2020)
5.7.2.1 Employment status and level of education
Figure 42 helps us to understand the relationship between highest level of education attained and current
employment status. It reveals that those with a university degree have the lowest rate of unemployment,
29% and those with TVET education had the highest unemployment level at 58%.
100%
97%
97%
100%
96%
97%
0%
3%
3%
4%
3%
94% 95% 96% 97% 98% 99% 100%
Studying full-time (n=161)
Full-time employment (n=1,479)
Part-time employment (n=331)
Self-employed (n=54)
Unemployed (1,763)
Total (n=3,788)
No Yes
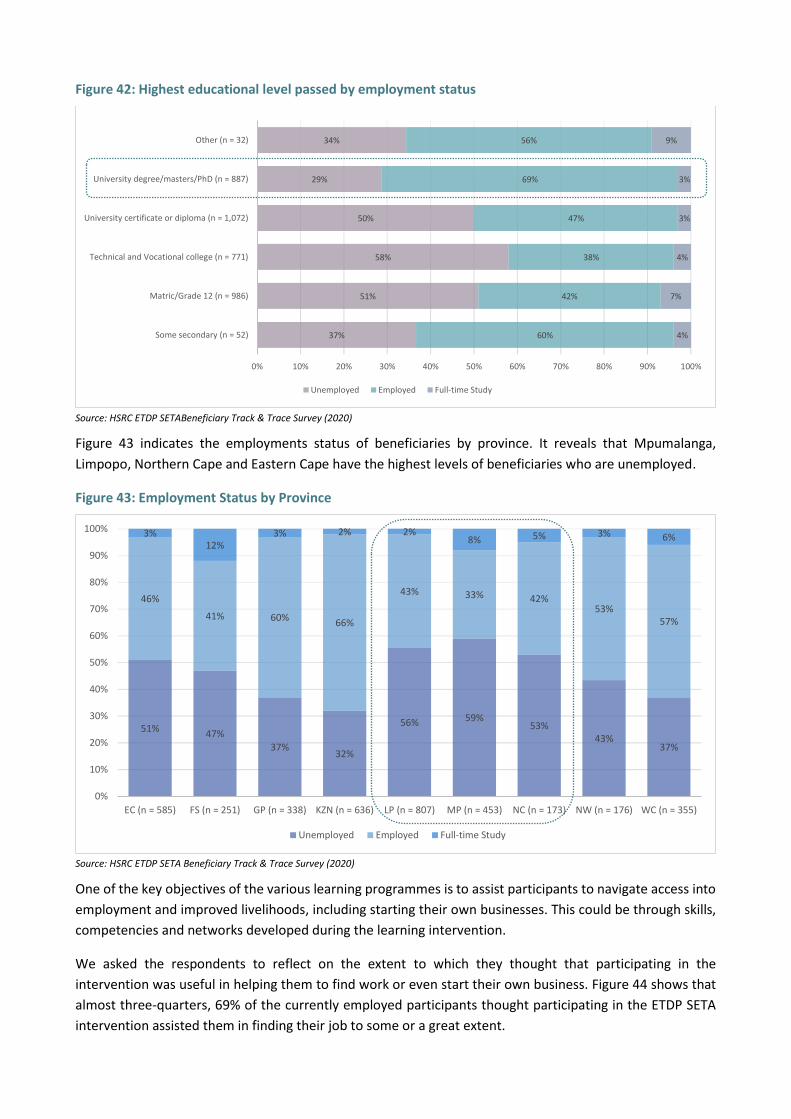
Figure 42: Highest educational level passed by employment status
Source: HSRC ETDP SETABeneficiary Track & Trace Survey (2020)
Figure 43 indicates the employments status of beneficiaries by province. It reveals that Mpumalanga,
Limpopo, Northern Cape and Eastern Cape have the highest levels of beneficiaries who are unemployed.
Figure 43: Employment Status by Province
Source: HSRC ETDP SETA Beneficiary Track & Trace Survey (2020)
One of the key objectives of the various learning programmes is to assist participants to navigate access into
employment and improved livelihoods, including starting their own businesses. This could be through skills,
competencies and networks developed during the learning intervention.
We asked the respondents to reflect on the extent to which they thought that participating in the
intervention was useful in helping them to find work or even start their own business. Figure 44 shows that
almost three-quarters, 69% of the currently employed participants thought participating in the ETDP SETA
intervention assisted them in finding their job to some or a great extent.
37%
51%
58%
50%
29%
34%
60%
42%
38%
47%
69%
56%
4%
7%
4%
3%
3%
9%
0% 10% 20% 30% 40% 50% 60% 70% 80% 90% 100%
Some secondary (n = 52)
Matric/Grade 12 (n = 986)
Technical and Vocational college (n = 771)
University certificate or diploma (n = 1,072)
University degree/masters/PhD (n = 887)
Other (n = 32)
Unemployed Employed Full-time Study
51% 47%
37%32%
56% 59%53%
43%37%
46%
41% 60%66%
43% 33% 42%53%
57%
3%12%
3% 2% 2%8% 5% 3% 6%
0%
10%
20%
30%
40%
50%
60%
70%
80%
90%
100%
EC (n = 585) FS (n = 251) GP (n = 338) KZN (n = 636) LP (n = 807) MP (n = 453) NC (n = 173) NW (n = 176) WC (n = 355)
Unemployed Employed Full-time Study
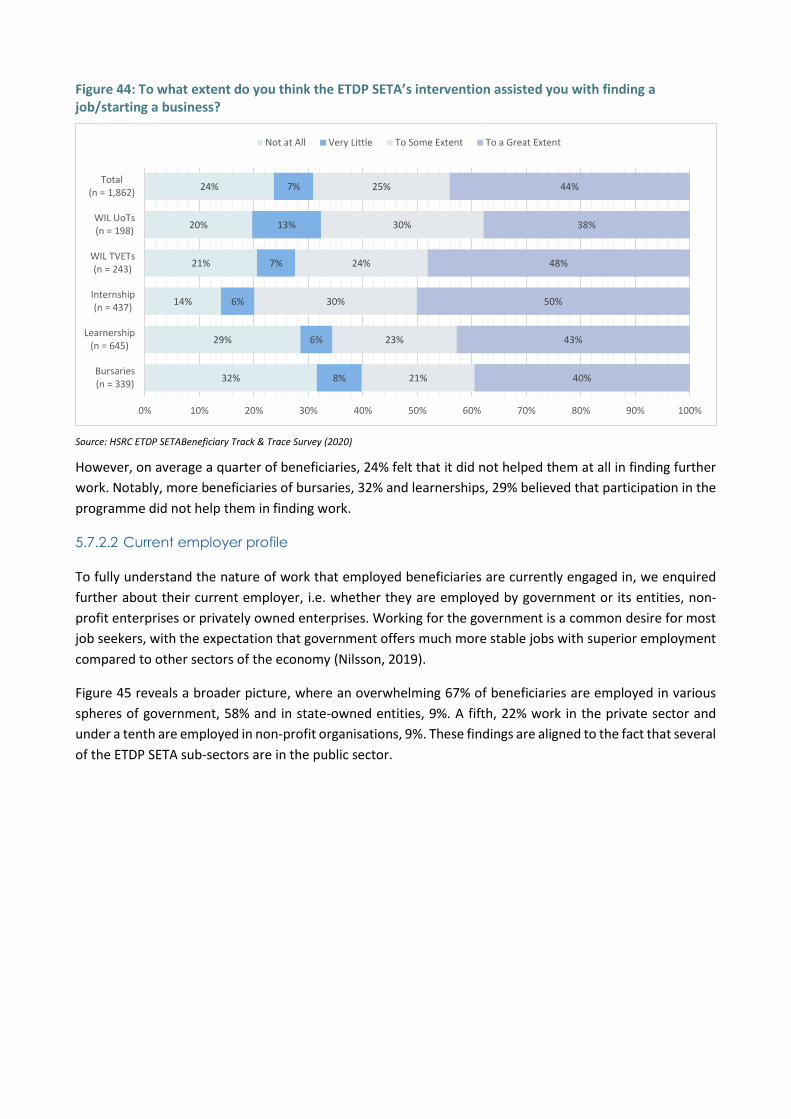
Figure 44: To what extent do you think the ETDP SETA’s intervention assisted you with finding a job/starting a business?
Source: HSRC ETDP SETABeneficiary Track & Trace Survey (2020)
However, on average a quarter of beneficiaries, 24% felt that it did not helped them at all in finding further
work. Notably, more beneficiaries of bursaries, 32% and learnerships, 29% believed that participation in the
programme did not help them in finding work.
5.7.2.2 Current employer profile
To fully understand the nature of work that employed beneficiaries are currently engaged in, we enquired
further about their current employer, i.e. whether they are employed by government or its entities, non-
profit enterprises or privately owned enterprises. Working for the government is a common desire for most
job seekers, with the expectation that government offers much more stable jobs with superior employment
compared to other sectors of the economy (Nilsson, 2019).
Figure 45 reveals a broader picture, where an overwhelming 67% of beneficiaries are employed in various
spheres of government, 58% and in state-owned entities, 9%. A fifth, 22% work in the private sector and
under a tenth are employed in non-profit organisations, 9%. These findings are aligned to the fact that several
of the ETDP SETA sub-sectors are in the public sector.
32%
29%
14%
21%
20%
24%
8%
6%
6%
7%
13%
7%
21%
23%
30%
24%
30%
25%
40%
43%
50%
48%
38%
44%
0% 10% 20% 30% 40% 50% 60% 70% 80% 90% 100%
Bursaries(n = 339)
Learnership(n = 645)
Internship(n = 437)
WIL TVETs(n = 243)
WIL UoTs(n = 198)
Total(n = 1,862)
Not at All Very Little To Some Extent To a Great Extent
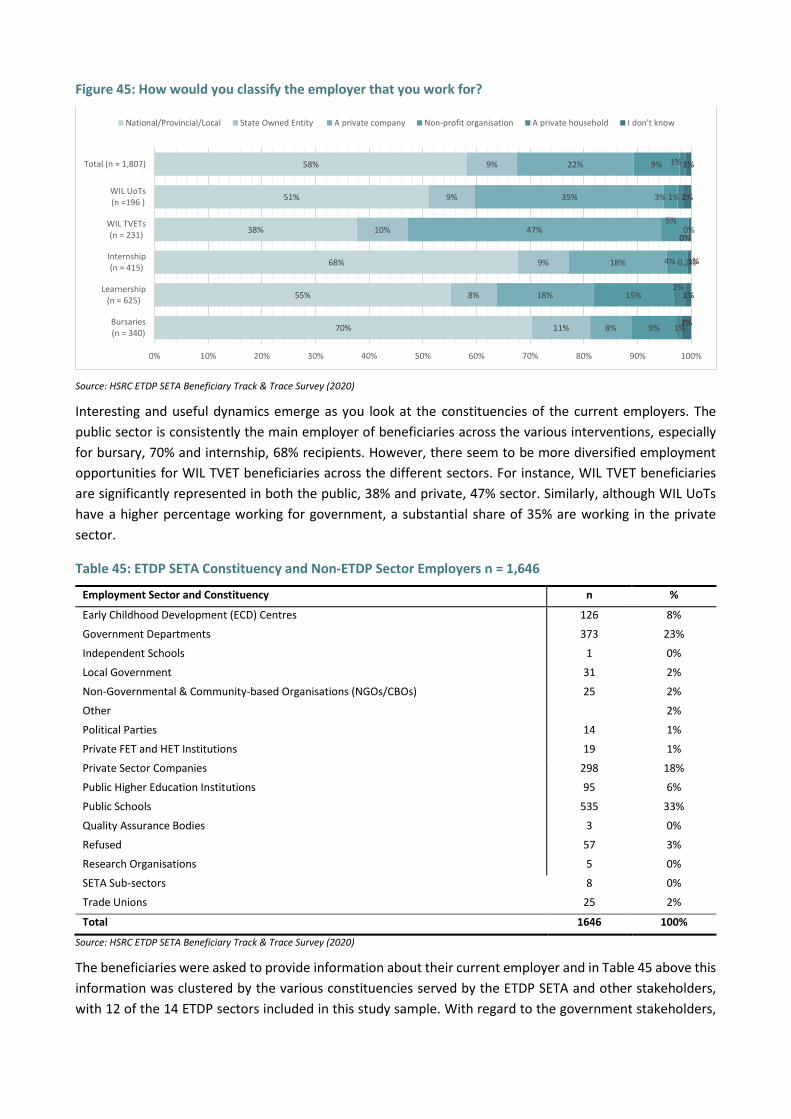
Figure 45: How would you classify the employer that you work for?
Source: HSRC ETDP SETA Beneficiary Track & Trace Survey (2020)
Interesting and useful dynamics emerge as you look at the constituencies of the current employers. The
public sector is consistently the main employer of beneficiaries across the various interventions, especially
for bursary, 70% and internship, 68% recipients. However, there seem to be more diversified employment
opportunities for WIL TVET beneficiaries across the different sectors. For instance, WIL TVET beneficiaries
are significantly represented in both the public, 38% and private, 47% sector. Similarly, although WIL UoTs
have a higher percentage working for government, a substantial share of 35% are working in the private
sector.
Table 45: ETDP SETA Constituency and Non-ETDP Sector Employers n = 1,646
Employment Sector and Constituency n %
Early Childhood Development (ECD) Centres 126 8%
Government Departments 373 23%
Independent Schools 1 0%
Local Government 31 2%
Non-Governmental & Community-based Organisations (NGOs/CBOs) 25 2%
Other 31 2%
Political Parties 14 1%
Private FET and HET Institutions 19 1%
Private Sector Companies 298 18%
Public Higher Education Institutions 95 6%
Public Schools 535 33%
Quality Assurance Bodies 3 0%
Refused 57 3%
Research Organisations 5 0%
SETA Sub-sectors 8 0%
Trade Unions 25 2%
Total 1646 100%
Source: HSRC ETDP SETA Beneficiary Track & Trace Survey (2020)
The beneficiaries were asked to provide information about their current employer and in Table 45 above this
information was clustered by the various constituencies served by the ETDP SETA and other stakeholders,
with 12 of the 14 ETDP sectors included in this study sample. With regard to the government stakeholders,
70%
55%
68%
38%
51%
58%
11%
8%
9%
10%
9%
9%
8%
18%
18%
47%
35%
22%
9%
15%
4%
5%
3%
9%
1%
2%
0.2%
0%
1%
1%
2%
1%
1%
0%
2%
1%
0% 10% 20% 30% 40% 50% 60% 70% 80% 90% 100%
Bursaries(n = 340)
Learnership(n = 625)
Internship(n = 415)
WIL TVETs(n = 231)
WIL UoTs(n =196 )
Total (n = 1,807)
National/Provincial/Local State Owned Entity A private company Non-profit organisation A private household I don't know
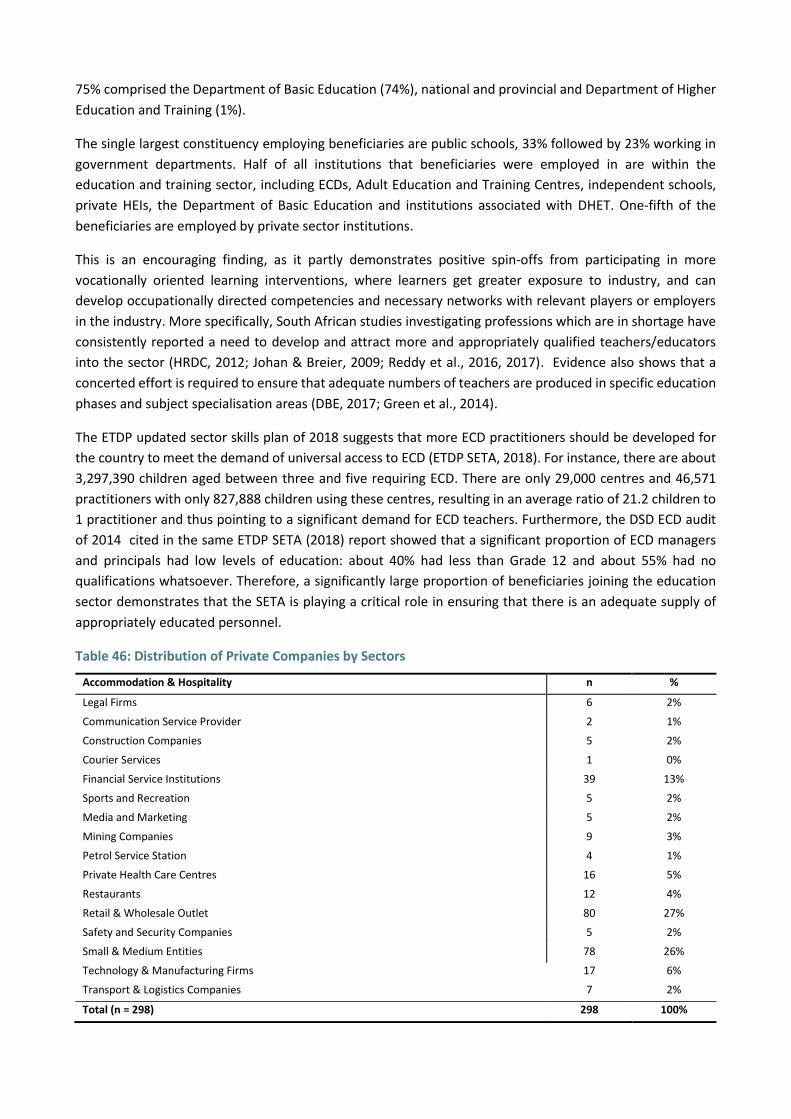
75% comprised the Department of Basic Education (74%), national and provincial and Department of Higher
Education and Training (1%).
The single largest constituency employing beneficiaries are public schools, 33% followed by 23% working in
government departments. Half of all institutions that beneficiaries were employed in are within the
education and training sector, including ECDs, Adult Education and Training Centres, independent schools,
private HEIs, the Department of Basic Education and institutions associated with DHET. One-fifth of the
beneficiaries are employed by private sector institutions.
This is an encouraging finding, as it partly demonstrates positive spin-offs from participating in more
vocationally oriented learning interventions, where learners get greater exposure to industry, and can
develop occupationally directed competencies and necessary networks with relevant players or employers
in the industry. More specifically, South African studies investigating professions which are in shortage have
consistently reported a need to develop and attract more and appropriately qualified teachers/educators
into the sector (HRDC, 2012; Johan & Breier, 2009; Reddy et al., 2016, 2017). Evidence also shows that a
concerted effort is required to ensure that adequate numbers of teachers are produced in specific education
phases and subject specialisation areas (DBE, 2017; Green et al., 2014).
The ETDP updated sector skills plan of 2018 suggests that more ECD practitioners should be developed for
the country to meet the demand of universal access to ECD (ETDP SETA, 2018). For instance, there are about
3,297,390 children aged between three and five requiring ECD. There are only 29,000 centres and 46,571
practitioners with only 827,888 children using these centres, resulting in an average ratio of 21.2 children to
1 practitioner and thus pointing to a significant demand for ECD teachers. Furthermore, the DSD ECD audit
of 2014 cited in the same ETDP SETA (2018) report showed that a significant proportion of ECD managers
and principals had low levels of education: about 40% had less than Grade 12 and about 55% had no
qualifications whatsoever. Therefore, a significantly large proportion of beneficiaries joining the education
sector demonstrates that the SETA is playing a critical role in ensuring that there is an adequate supply of
appropriately educated personnel.
Table 46: Distribution of Private Companies by Sectors
Accommodation & Hospitality n %
Legal Firms 6 2%
Communication Service Provider 2 1%
Construction Companies 5 2%
Courier Services 1 0%
Financial Service Institutions 39 13%
Sports and Recreation 5 2%
Media and Marketing 5 2%
Mining Companies 9 3%
Petrol Service Station 4 1%
Private Health Care Centres 16 5%
Restaurants 12 4%
Retail & Wholesale Outlet 80 27%
Safety and Security Companies 5 2%
Small & Medium Entities 78 26%
Technology & Manufacturing Firms 17 6%
Transport & Logistics Companies 7 2%
Total (n = 298) 298 100%
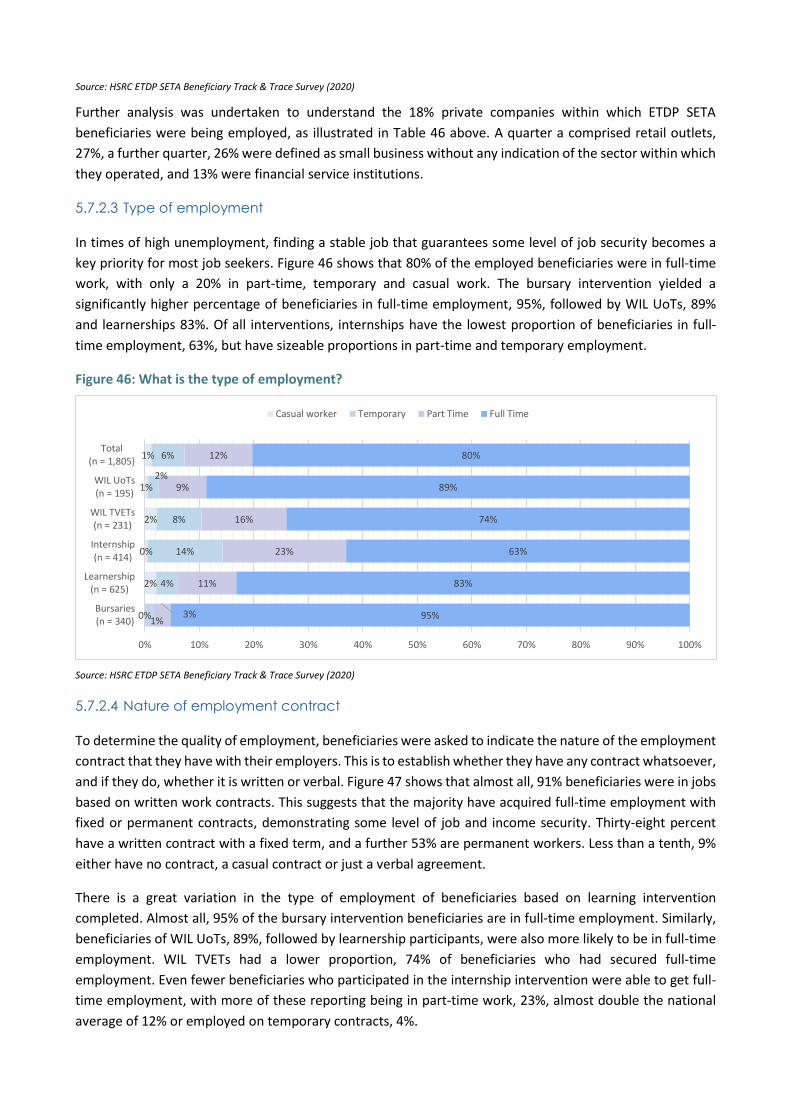
Source: HSRC ETDP SETA Beneficiary Track & Trace Survey (2020)
Further analysis was undertaken to understand the 18% private companies within which ETDP SETA
beneficiaries were being employed, as illustrated in Table 46 above. A quarter a comprised retail outlets,
27%, a further quarter, 26% were defined as small business without any indication of the sector within which
they operated, and 13% were financial service institutions.
5.7.2.3 Type of employment
In times of high unemployment, finding a stable job that guarantees some level of job security becomes a
key priority for most job seekers. Figure 46 shows that 80% of the employed beneficiaries were in full-time
work, with only a 20% in part-time, temporary and casual work. The bursary intervention yielded a
significantly higher percentage of beneficiaries in full-time employment, 95%, followed by WIL UoTs, 89%
and learnerships 83%. Of all interventions, internships have the lowest proportion of beneficiaries in full-
time employment, 63%, but have sizeable proportions in part-time and temporary employment.
Figure 46: What is the type of employment?
Source: HSRC ETDP SETA Beneficiary Track & Trace Survey (2020)
5.7.2.4 Nature of employment contract
To determine the quality of employment, beneficiaries were asked to indicate the nature of the employment
contract that they have with their employers. This is to establish whether they have any contract whatsoever,
and if they do, whether it is written or verbal. Figure 47 shows that almost all, 91% beneficiaries were in jobs
based on written work contracts. This suggests that the majority have acquired full-time employment with
fixed or permanent contracts, demonstrating some level of job and income security. Thirty-eight percent
have a written contract with a fixed term, and a further 53% are permanent workers. Less than a tenth, 9%
either have no contract, a casual contract or just a verbal agreement.
There is a great variation in the type of employment of beneficiaries based on learning intervention
completed. Almost all, 95% of the bursary intervention beneficiaries are in full-time employment. Similarly,
beneficiaries of WIL UoTs, 89%, followed by learnership participants, were also more likely to be in full-time
employment. WIL TVETs had a lower proportion, 74% of beneficiaries who had secured full-time
employment. Even fewer beneficiaries who participated in the internship intervention were able to get full-
time employment, with more of these reporting being in part-time work, 23%, almost double the national
average of 12% or employed on temporary contracts, 4%.
0%
2%
0%
2%
1%
1%
1%
4%
14%
8%
2%
6%
3%
11%
23%
16%
9%
12%
95%
83%
63%
74%
89%
80%
0% 10% 20% 30% 40% 50% 60% 70% 80% 90% 100%
Bursaries(n = 340)
Learnership(n = 625)
Internship(n = 414)
WIL TVETs(n = 231)
WIL UoTs(n = 195)
Total(n = 1,805)
Casual worker Temporary Part Time Full Time
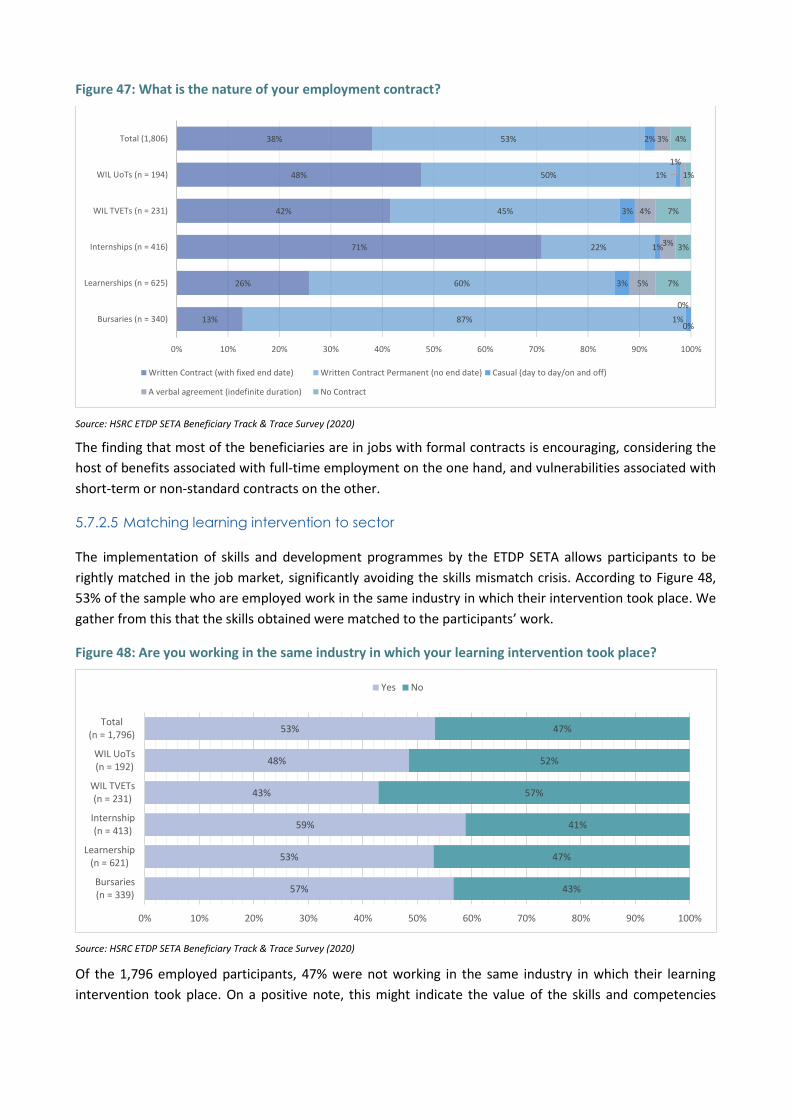
Figure 47: What is the nature of your employment contract?
Source: HSRC ETDP SETA Beneficiary Track & Trace Survey (2020)
The finding that most of the beneficiaries are in jobs with formal contracts is encouraging, considering the
host of benefits associated with full-time employment on the one hand, and vulnerabilities associated with
short-term or non-standard contracts on the other.
5.7.2.5 Matching learning intervention to sector
The implementation of skills and development programmes by the ETDP SETA allows participants to be
rightly matched in the job market, significantly avoiding the skills mismatch crisis. According to Figure 48,
53% of the sample who are employed work in the same industry in which their intervention took place. We
gather from this that the skills obtained were matched to the participants’ work.
Figure 48: Are you working in the same industry in which your learning intervention took place?
Source: HSRC ETDP SETA Beneficiary Track & Trace Survey (2020)
Of the 1,796 employed participants, 47% were not working in the same industry in which their learning
intervention took place. On a positive note, this might indicate the value of the skills and competencies
13%
26%
71%
42%
48%
38%
87%
60%
22%
45%
50%
53%
1%
3%
1%
3%
1%
2%
0%
5%
3%
4%
1%
3%
0%
7%
3%
7%
1%
4%
0% 10% 20% 30% 40% 50% 60% 70% 80% 90% 100%
Bursaries (n = 340)
Learnerships (n = 625)
Internships (n = 416)
WIL TVETs (n = 231)
WIL UoTs (n = 194)
Total (1,806)
Written Contract (with fixed end date) Written Contract Permanent (no end date) Casual (day to day/on and off)
A verbal agreement (indefinite duration) No Contract
57%
53%
59%
43%
48%
53%
43%
47%
41%
57%
52%
47%
0% 10% 20% 30% 40% 50% 60% 70% 80% 90% 100%
Bursaries(n = 339)
Learnership(n = 621)
Internship(n = 413)
WIL TVETs(n = 231)
WIL UoTs(n = 192)
Total(n = 1,796)
Yes No
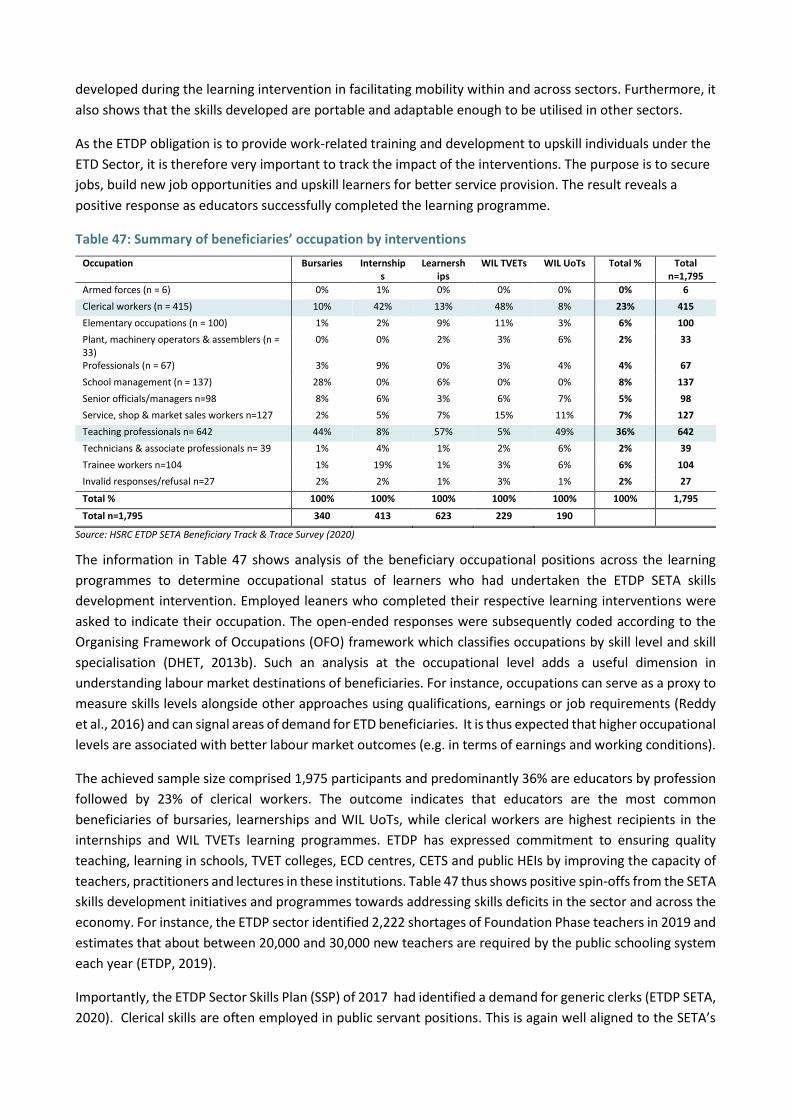
developed during the learning intervention in facilitating mobility within and across sectors. Furthermore, it
also shows that the skills developed are portable and adaptable enough to be utilised in other sectors.
As the ETDP obligation is to provide work-related training and development to upskill individuals under the
ETD Sector, it is therefore very important to track the impact of the interventions. The purpose is to secure
jobs, build new job opportunities and upskill learners for better service provision. The result reveals a
positive response as educators successfully completed the learning programme.
Table 47: Summary of beneficiaries’ occupation by interventions
Occupation Bursaries Internships
Learnerships
WIL TVETs WIL UoTs Total % Total n=1,795
Armed forces (n = 6) 0% 1% 0% 0% 0% 0% 6
Clerical workers (n = 415) 10% 42% 13% 48% 8% 23% 415
Elementary occupations (n = 100) 1% 2% 9% 11% 3% 6% 100
Plant, machinery operators & assemblers (n = 33)
0% 0% 2% 3% 6% 2% 33
Professionals (n = 67) 3% 9% 0% 3% 4% 4% 67
School management (n = 137) 28% 0% 6% 0% 0% 8% 137
Senior officials/managers n=98 8% 6% 3% 6% 7% 5% 98
Service, shop & market sales workers n=127 2% 5% 7% 15% 11% 7% 127
Teaching professionals n= 642 44% 8% 57% 5% 49% 36% 642
Technicians & associate professionals n= 39 1% 4% 1% 2% 6% 2% 39
Trainee workers n=104 1% 19% 1% 3% 6% 6% 104
Invalid responses/refusal n=27 2% 2% 1% 3% 1% 2% 27
Total % 100% 100% 100% 100% 100% 100% 1,795
Total n=1,795 340 413 623 229 190
Source: HSRC ETDP SETA Beneficiary Track & Trace Survey (2020)
The information in Table 47 shows analysis of the beneficiary occupational positions across the learning
programmes to determine occupational status of learners who had undertaken the ETDP SETA skills
development intervention. Employed leaners who completed their respective learning interventions were
asked to indicate their occupation. The open-ended responses were subsequently coded according to the
Organising Framework of Occupations (OFO) framework which classifies occupations by skill level and skill
specialisation (DHET, 2013b). Such an analysis at the occupational level adds a useful dimension in
understanding labour market destinations of beneficiaries. For instance, occupations can serve as a proxy to
measure skills levels alongside other approaches using qualifications, earnings or job requirements (Reddy
et al., 2016) and can signal areas of demand for ETD beneficiaries. It is thus expected that higher occupational
levels are associated with better labour market outcomes (e.g. in terms of earnings and working conditions).
The achieved sample size comprised 1,975 participants and predominantly 36% are educators by profession
followed by 23% of clerical workers. The outcome indicates that educators are the most common
beneficiaries of bursaries, learnerships and WIL UoTs, while clerical workers are highest recipients in the
internships and WIL TVETs learning programmes. ETDP has expressed commitment to ensuring quality
teaching, learning in schools, TVET colleges, ECD centres, CETS and public HEIs by improving the capacity of
teachers, practitioners and lectures in these institutions. Table 47 thus shows positive spin-offs from the SETA
skills development initiatives and programmes towards addressing skills deficits in the sector and across the
economy. For instance, the ETDP sector identified 2,222 shortages of Foundation Phase teachers in 2019 and
estimates that about between 20,000 and 30,000 new teachers are required by the public schooling system
each year (ETDP, 2019).
Importantly, the ETDP Sector Skills Plan (SSP) of 2017 had identified a demand for generic clerks (ETDP SETA,
2020). Clerical skills are often employed in public servant positions. This is again well aligned to the SETA’s
commitment to improving administration, management, leadership, governance and research capacity with
the aim of supporting teaching and training professionals.
About 8% of the beneficiaries were part of school management, and almost all had completed a bursary
programme. These positions, such as those of school principals and department heads, have also been
identified as in demand in the ETD sector (ETDP SETA, 2020). This is followed by service, shop and market
sales workers with 7%. Notably, elementary occupations, technicians and associates as well as plant,
machinery operators and assemblers had much lower representativity, which is well expected considering
the education levels of beneficiaries. Although represented in minute proportions, this shows that the ETD
sector does not just comprise white-collar workers. In fact, the sector has identified a need to develop the
technicians and trade workers occupation (ETDP SETA, 2020) alongside a need for research and development
managers as hard to fill vacancies in a number of organisations.
Very few learners occupied senior official, manager and other professionals’ positions (this category contains
occupations such as lecturers, accountants, training and development professionals). Again, this was also
expected because of lead time to accumulating adequate experience for learners to move to some of these
high skill level positions. Therefore, beneficiaries have begun to occupy occupations which have been
identified as priority areas for development, including teaching professionals, where there has consistently
been a call to improve on appropriately skilled staff to respond to the skills demands in that area. Apparently
the ETDP SETA’s obligations have not been shifted from the focus on the skills development enhancement
and promotion of employment within the ETD sector.
5.7.2.6 Satisfaction with current job
Job satisfaction is a subjective appraisal of one's work, and therefore useful in capturing employees' overall
levels of satisfaction with work. Importantly, job satisfaction is a useful indicator of future labour market
behaviour (Clark, 1998). For instance, high satisfaction is associated with greater employee commitment and
performance, whilst dissatisfaction is related to absenteeism and intention to quit and might even discourage
future labour market participation. Figure 49 shows that the majority, 78% of the employed beneficiaries are
satisfied with their jobs: 31% are highly satisfied and 47% are satisfied with their jobs.
Disaggregating by learning interventions revealed stark differences in satisfaction levels. Bursary
beneficiaries registered the highest levels of satisfaction, 90%, followed by WIL UoT beneficiaries, 80%, then
learnerships and internships, 76% and 78%, with WIL TVET beneficiaries exhibiting lower levels of job
satisfaction, Figure 49.
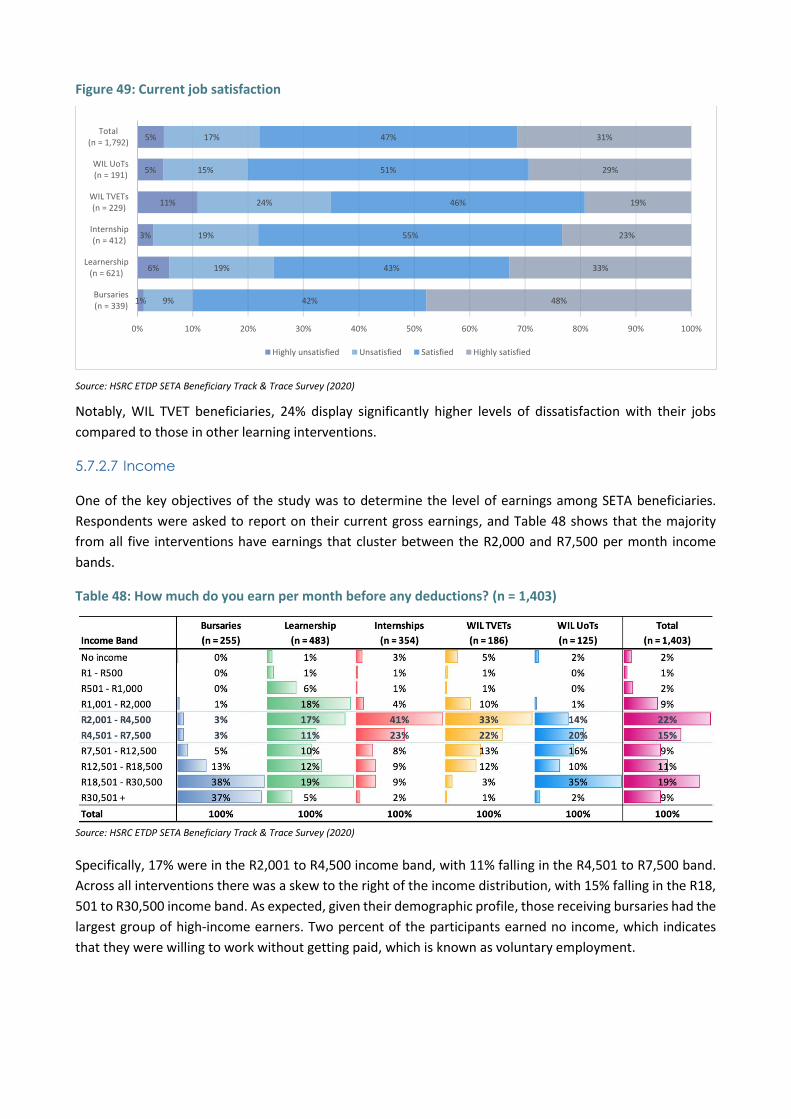
Figure 49: Current job satisfaction
Source: HSRC ETDP SETA Beneficiary Track & Trace Survey (2020)
Notably, WIL TVET beneficiaries, 24% display significantly higher levels of dissatisfaction with their jobs
compared to those in other learning interventions.
5.7.2.7 Income
One of the key objectives of the study was to determine the level of earnings among SETA beneficiaries.
Respondents were asked to report on their current gross earnings, and Table 48 shows that the majority
from all five interventions have earnings that cluster between the R2,000 and R7,500 per month income
bands.
Table 48: How much do you earn per month before any deductions? (n = 1,403)
Source: HSRC ETDP SETA Beneficiary Track & Trace Survey (2020)
Specifically, 17% were in the R2,001 to R4,500 income band, with 11% falling in the R4,501 to R7,500 band.
Across all interventions there was a skew to the right of the income distribution, with 15% falling in the R18,
501 to R30,500 income band. As expected, given their demographic profile, those receiving bursaries had the
largest group of high-income earners. Two percent of the participants earned no income, which indicates
that they were willing to work without getting paid, which is known as voluntary employment.
1%
6%
3%
11%
5%
5%
9%
19%
19%
24%
15%
17%
42%
43%
55%
46%
51%
47%
48%
33%
23%
19%
29%
31%
0% 10% 20% 30% 40% 50% 60% 70% 80% 90% 100%
Bursaries(n = 339)
Learnership(n = 621)
Internship(n = 412)
WIL TVETs(n = 229)
WIL UoTs(n = 191)
Total(n = 1,792)
Highly unsatisfied Unsatisfied Satisfied Highly satisfied
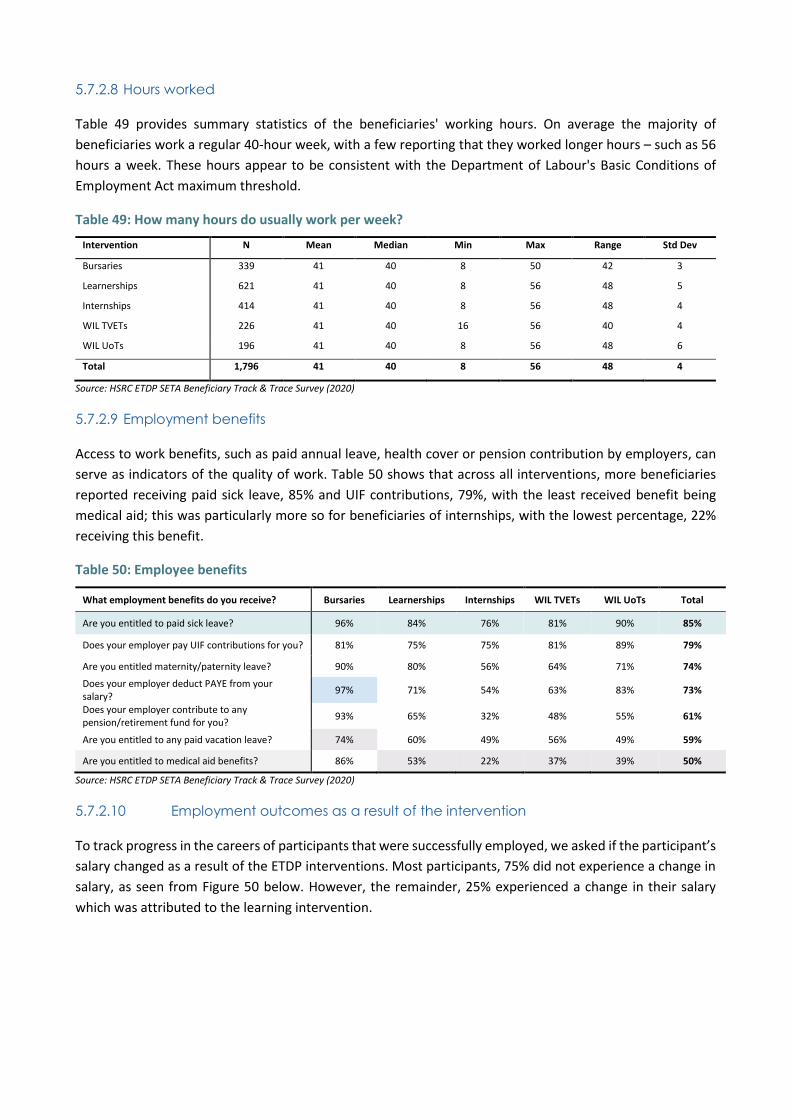
5.7.2.8 Hours worked
Table 49 provides summary statistics of the beneficiaries' working hours. On average the majority of
beneficiaries work a regular 40-hour week, with a few reporting that they worked longer hours – such as 56
hours a week. These hours appear to be consistent with the Department of Labour's Basic Conditions of
Employment Act maximum threshold.
Table 49: How many hours do usually work per week?
Intervention N Mean Median Min Max Range Std Dev
Bursaries 339 41 40 8 50 42 3
Learnerships 621 41 40 8 56 48 5
Internships 414 41 40 8 56 48 4
WIL TVETs 226 41 40 16 56 40 4
WIL UoTs 196 41 40 8 56 48 6
Total 1,796 41 40 8 56 48 4
Source: HSRC ETDP SETA Beneficiary Track & Trace Survey (2020)
5.7.2.9 Employment benefits
Access to work benefits, such as paid annual leave, health cover or pension contribution by employers, can
serve as indicators of the quality of work. Table 50 shows that across all interventions, more beneficiaries
reported receiving paid sick leave, 85% and UIF contributions, 79%, with the least received benefit being
medical aid; this was particularly more so for beneficiaries of internships, with the lowest percentage, 22%
receiving this benefit.
Table 50: Employee benefits
What employment benefits do you receive? Bursaries Learnerships Internships WIL TVETs WIL UoTs Total
Are you entitled to paid sick leave? 96% 84% 76% 81% 90% 85%
Does your employer pay UIF contributions for you? 81% 75% 75% 81% 89% 79%
Are you entitled maternity/paternity leave? 90% 80% 56% 64% 71% 74%
Does your employer deduct PAYE from your salary?
97% 71% 54% 63% 83% 73%
Does your employer contribute to any pension/retirement fund for you?
93% 65% 32% 48% 55% 61%
Are you entitled to any paid vacation leave? 74% 60% 49% 56% 49% 59%
Are you entitled to medical aid benefits? 86% 53% 22% 37% 39% 50%
Source: HSRC ETDP SETA Beneficiary Track & Trace Survey (2020)
5.7.2.10 Employment outcomes as a result of the intervention
To track progress in the careers of participants that were successfully employed, we asked if the participant’s
salary changed as a result of the ETDP interventions. Most participants, 75% did not experience a change in
salary, as seen from Figure 50 below. However, the remainder, 25% experienced a change in their salary
which was attributed to the learning intervention.
Figure 50: Has your salary changed as a result of the learning intervention?
Source: HSRC ETDP SETA Beneficiary Track & Trace Survey (2020)
5.7.2.11 Career progression
In order to understand the beneficiaries’ reported positive changes, the evidence was analysed by the type
of learning intervention they had participated in. This was assessed against four indicators, namely receiving
a promotion, increase in salary, change in position and no change at all.
Promotion
Promotions in the workplace indicate employer confidence in and appreciation of their skills and
competencies. Figure 51 shows that only a small minority, 5% received promotions, and that learnership
beneficiaries were slightly more likely to have received promotions compared to those from other
interventions.
Figure 51: I received a promotion after completion of the learning intervention
Source: HSRC ETDP SETABeneficiary Track & Trace Survey (2020)
82% 82%
66%70%
64%
75%
18% 18%
34%30%
36%
25%
0%
10%
20%
30%
40%
50%
60%
70%
80%
90%
Bursaries(n = 340)
Learnership (n = 623)
Internship(n = 411)
WIL TVETs(n = 229)
WIL UoTs(n = 191)
Total(n = 1,794)
No Yes
95%
94%
95%
97%
95%
95%
5%
6%
5%
3%
5%
5%
0% 10% 20% 30% 40% 50% 60% 70% 80% 90% 100%
Bursaries (n = 340)
Learnerships (n = 627)
Internships (n = 416)
WIL TVETs (n = 231)
WIL UoTs (n = 196)
Total (n = 1,810)
No Yes
Promotions in the workplace often occur after years of work experience have taken place and growth in core
competencies have been reflected in the employee. Looking at Figure 51 we can make an assumption that
95% of the beneficiaries who did not receive a promotion, among other reasons, mainly lacked the required
years of service and experience, and that this an outcome that would materialise in the medium to long term.
Another indicator of career progression that was investigated was whether the beneficiary had moved to a
new role or position. Figure 52 shows that less than a fifth, 16% of the beneficiaries indicated that they had
moved to a new position. Disaggregated by learning intervention it is evident that more than a quarter of
WiL UoT beneficiaries, 28% moved to a new position while less than one-tenth of bursary beneficiaries were
similarly rewarded. A fifth of WIL TVET and internship beneficiaries also reported having been moved to a
new position.
Figure 52: I moved to a new position after completion of the learning intervention
Source: HSRC ETDP SETA Beneficiary Track & Trace Survey (2020)
Overall, it can be observed in Figure 53 that about two-thirds of the participants did not experience any
change in their career with respect to promotions, salary increase or change in position.
Figure 53: There was no change in my employment
Source: HSRC ETDP SETA Beneficiary Track & Trace Survey (2020)
92%
87%
81%
81%
72%
84%
8%
13%
19%
19%
28%
16%
0% 10% 20% 30% 40% 50% 60% 70% 80% 90% 100%
Bursaries (n = 340)
Learnership (n = 628)
Internship (n = 417)
WIL TVETs (n = 234)
WIL UoTs (n = 196)
Total (n = 1,815)
No Yes
20%
26%
41%
37%
48%
32%
80%
74%
59%
63%
52%
68%
0% 10% 20% 30% 40% 50% 60% 70% 80% 90% 100%
Bursaries (n = 340)
Learnershipss (n = 628)
Internship (n = 417)
WIL TVETs (n = 234)
WIL UoTs (n = 196)
Total (n = 1,815)
No Yes
Changes in career expectations
Figure 54 shows that almost half of the beneficiaries perceived that their career expectations had been met
to a great extent when they completed the learning intervention; about a third claimed that their
expectations were met but only to some extent, and a tenth indicated that their expectations were met to a
limited extent. Nine percent said that the learning interventions did not meet their career expectations at
all. Bursary beneficiaries were those most likely to report that career expectations were met to a great extent.
Figure 54: To what extent have your career expectations been met at the time of completing your learning intervention?
Source: HSRC ETDP SETA Beneficiary Track & Trace Survey (2020)
5.7.2.12 Summary of Employment Outcomes
As the results on employment status show, absorption rates remain relatively low and on average only 49%
were in employment with 39% in full-time employment. Wide variations are noted between learning
interventions, with 91% of previously employed bursary beneficiaries currently employed compared with
62% of those who were unemployed at the time they commenced the training. Less than half of all
learnership beneficiaries, 46% are employed followed by 36% of WIL UoT beneficiaries. Internship
beneficiaries, 28% and WIL TVET beneficiaries, 21% were the groups with the lowest current employment
rates (section 5.7.2).
Whilst the levels of employment were roughly the same for both males and females, there were
disproportionately more women who were unemployed (48%) relative to their male counterparts (43%). The
overall association between gender and employment status was found to be statistically significant and
highlights a stylised fact regarding the gendered nature of the South African labour market, and forms the
basis for the gender targets.
It is important to note that some of the employment outcomes could also be influenced by the fact that an
insufficient amount of time had lapsed between the periods of completion for some of the learners,
especially those who finished in the 2018/19 financial year. As noted in the studies’ conceptual and analytical
frameworks, external factors have a direct impact on influencing the extent to which successful transitions
can be made into the labour market. In the South African context, the unprecedented levels of
65%
48%
42%
40%
45%
48%
25%
32%
38%
35%
36%
33%
6%
11%
12%
11%
9%
10%
4%
9%
9%
13%
10%
9%
0% 10% 20% 30% 40% 50% 60% 70% 80% 90% 100%
Bursaries(n = 339)
Learnership(n = 622)
Internship(n = 411)
WIL TVETs(n = 230)
WIL UoTs(n = 191)
Total (n = 1,793)
To a Great Extent To Some Extent To a Limited Extent Not at All
unemployment generally and in respect of youth remain key factors impacting on transitions into the labour
market.
Self-employment
This section explores whether exposure to the ETDP SETA programme induced an entrepreneurial spirit
among its beneficiaries. Figure 55 below shows that overall, there was no significant difference between
beneficiaries who started their own business and those who did not do so after receiving training. However,
the results also revealed that beneficiaries who had been enrolled in the learnership intervention were more
likely to start their own businesses than those in other interventions.
Figure 55: Did you start this business after completing the learning/training intervention? (n = 53)
Source: HSRC ETDP SETA Beneficiary Track & Trace Survey (2020)
When looking at business ownership by age, it is encouraging to note that youth predominate among the
few who started businesses after receiving training. Figure 56 shows that 90% of the beneficiaries who
started their own business ventures fall within the youth category.
Figure 56: Beneficiaries who started businesses after receiving training by their age cohort (n = 53)
Source: HSRC ETDP SETA Beneficiary Track & Trace Survey (2020)
A large majority of the beneficiaries with businesses recognised that skills and competencies gained during
their training were very valuable in starting their own businesses. Figure 57 shows that 63% of the
beneficiaries said that these skills were useful to a great 35% and some 28% extent in starting businesses.
These findings indicate that most beneficiaries perceived the content of training to have been relevant and
6
13
7
1
27
12
8
5
1
26
0
5
10
15
20
25
30
Learnerships Internships WIL TVETs WIL UoTs Total
NU
MB
ER O
F R
ESP
ON
DEN
TS
No Yes
87%
13%
0% 10% 20% 30% 40% 50% 60% 70% 80% 90%
20-35
36+
useful in helping them start their own businesses. Of concern is that almost a third 30% felt that the training
received was not at all useful when they were starting their own businesses.
Figure 57: The extent in which beneficiaries have been able to apply what they learnt from ETDP SETA to start their own business (n = 54)
Source: HSRC ETDP SETA Beneficiary Track & Trace Survey (2020)
ETDP SETA beneficiaries who are entrepreneurs were further questioned about whether businesses they
were running were registered to pay VAT. The findings in Figure 58 reveal that while about 12 business
owners do pay VAT, the large majority, 37 of these beneficiaries are running businesses that are not
registered for VAT. This suggests that such businesses could be informal, as can be seen in Figure 58. It is
evident that there were significantly more of those who had received learnerships, 7 operating more
formalised or registered operations. In contrast, beneficiaries who had been through the WIL UoTs
internships were more likely to operate unregistered businesses.
Figure 58: Business registered with VAT by learning interventions (n = 53)
Source: HSRC ETDP SETA Beneficiary Track & Trace Survey (2020)
30%
7%
28%
35%
0% 5% 10% 15% 20% 25% 30% 35% 40%
Not at All (n = 16)
To a Limited Extent (n = 4)
To Some Extent (n = 15)
To a Great Extent (n = 19)
1 12
0
4
10
16
9
2
37
7
4
10
12
0
5
10
15
20
25
30
35
40
Learnerships Internships WIL TVETs WIL UoTs Total
NU
MB
ER O
F R
ESP
ON
DEN
TS
I dont know No Yes
In order to assess how well the self-employed beneficiaries were doing, these respondents were asked what
their gross monthly income was. The results in Table 51 show that almost one-third of these self-employed
beneficiaries live at a point between having no income at all, and making at least R1,000 a month.
Table 51: Gross monthly income for the self-employed
Income band Learnerships Internships WIL TVETs WIL UoTs Total % Cum. Freq.
No income 1 2 1 4 8% 8%
R1 - R500 1 1 2 4 8% 15%
R501 - R1,000 2 2 2 1 7 13% 28%
R1,001 - R2,000 2 1 2 5 9% 38%
R2,001 - R4,500 4 1 1 6 11% 49%
R4,001- R7,500 4 4 1 9 17% 66%
R7,501 - R12,500 2 2 4% 70%
R12,501 - R18,500 2 1 1 4 8% 77%
R18,501 - R30,500 1 1 2 4% 81%
R30,501 + 1 1 2% 83%
No answer 2 6 1 9 17% 100%
Total 18 21 12 2 53 100%
Source: HSRC ETDP SETA Beneficiary Track & Trace Survey (2020)
There were age differences with respect to income earnings, with older cohorts being in the higher income
brackets, whilst almost half of the youth were making at least R2,000 per month, with about 10% making no
income at all.
Unemployment / inactivity
Unemployed vs. discouraged work seekers
In unemployment studies it is important to distinguish between being unemployed relative to being non-
searching unemployed, of which a sub-group are discouraged workers. For someone to be classified as being
unemployed, they must be actively looking for employment. Discouraged workers are a sub-group of the
non-searching unemployed, who have given up hope of finding a job but will accept if offered employment.
In order to understand the profile of the unemployed, respondents were asked to choose a description that
best captured their current situation. The findings show that although economically inactive, almost all
beneficiaries are actively looking for work and fit the conventional definition of unemployed, Figure 59. This
is important, as it is reflecting great optimism on the part of the beneficiaries – and that they have not been
discouraged or lost hope of finding work.
Figure 59: Which of the following statements most accurately describe your current situation?
Source: HSRC ETDP SETA Beneficiary Track & Trace Survey (2020)
Duration of unemployment
The length of time spent unemployed has a significant impact on the overall process and period of
transitioning into the labour market. Although shorter spells of unemployment are expected at times,
prolonged periods of unemployment are of major concern. The study explored the issue of duration of
unemployment of the beneficiaries and results in Figure 60 indicate that over half, 57% had been without
work for a year or more. This implies that this group could readily be categorised as long-term unemployed,
and at risk of economic exclusion. This suggests the existence of complex challenges related to integrating
this group of workers into the labour market.
Figure 60: How long have you been looking for a job?
Source: HSRC ETDP SETA Beneficiary Track & Trace Survey (2020)
Main reason for being economically inactive
The ETDP SETA beneficiaries were also asked to indicate main reasons why they are unemployed. Such
information is critical as it is these perceptions that partly inform motivation of job search, intensity and
strategies adopted. Results show that about 54% of these unemployed beneficiaries cited a lack of available
jobs in the local labour market, while 20% cited mismatch of skills possessed, and the ones required by the
96%
0%1%1%0%1%
0%
10%
20%
30%
40%
50%
60%
70%
80%
90%
100%
Unemployed andlooking for work
(n = 1697)
Unemployed andhave given up looking
for(n = 6)
Unemployed andcurrently not lookingBUT willing to work
(n = 18)
Unemployed and NOTlooking for work
(n = 20)
Unemployed andunable to work
(n = 2)
Other (n = 17)
14%
5%
6%
14%
40%
12%
5%
3%
0% 5% 10% 15% 20% 25% 30% 35% 40% 45%
Less than 3 months (n = 235)
3 months - less than 6 months (n=88)
6 months - less than 9 months (n=113)
9 months - less than a year (n=244)
1 year - less than 3 years (n=710)
3 years - 5 years (n=205)
More than 5 years (n=96)
I dont know (n=53)
labour market. The latter begins to capture the perceived role of external factors such as the economic
climate and the shrinking job opportunities in the transitions of these beneficiaries.
Table 52: One main reason why you think you are economically inactive
Reason for being inactive in the job market Frequency %
No jobs available in my area 945 54%
Unable to find work requiring my skills 351 20%
Lack of resources to look for a job 72 4%
Lost hope of finding any kind of work 11 1%
Nepotism/corruption 81 5%
Awaiting the season for work 37 2%
Not looking for a job 12 1%
Pregnancy 9 1%
Age constraints/disability/criminal record 11 1%
Housewife/homemaker/family consideration 3 0,2%
Undergoing training to help find work 20 1%
Retired/too old to work 8 0,5%
Do not know 200 11%
Total 1,760 100%
Source: HSRC ETDP SETA Beneficiary Track & Trace Survey (2020)
It is interesting that 5% of beneficiaries highlighted corruption and nepotism as the reasons they were unable
to secure employment, while a further 4% noted the lack of resources for job searching. The responses below
provide a nuanced perspective on why people were currently inactive economically:
“I resigned because of the pressure and threats; I mean threats of the position”– Male bursary
beneficiary aged 45-49.
“Corruption, people are bribing for positions and nepotism”– Male learnership beneficiary aged 30-
34.
About half of the beneficiaries said they are not working due to the unavailability of jobs:
“The government is not advertising and providing jobs for us”- Female learnership beneficiary aged
30-34.
“Older teachers do not want to retire, and they prevent us to get jobs” – Female WIL UoT beneficiary
aged 20-24.
“I am still waiting to be placed by Funza Lushaka” – Male WIL UoT beneficiary aged 20-24.
“We are living in very poor area with no access to internet, our applications do not get to employers
on time- Female internship beneficiary aged 25-39.
“The government is investing in education than balancing employment sectors” – Male internship
respondent aged 25-29.
“I think it because of my disability” – Male learnership beneficiary aged 35-39.
Possibility of voluntary unemployment
The debate of whether there is the presence of a reservation wage has been a part of the South African
labour market literature since the dawn of democracy (Banerjee et al., 2008). A reservation wage can be
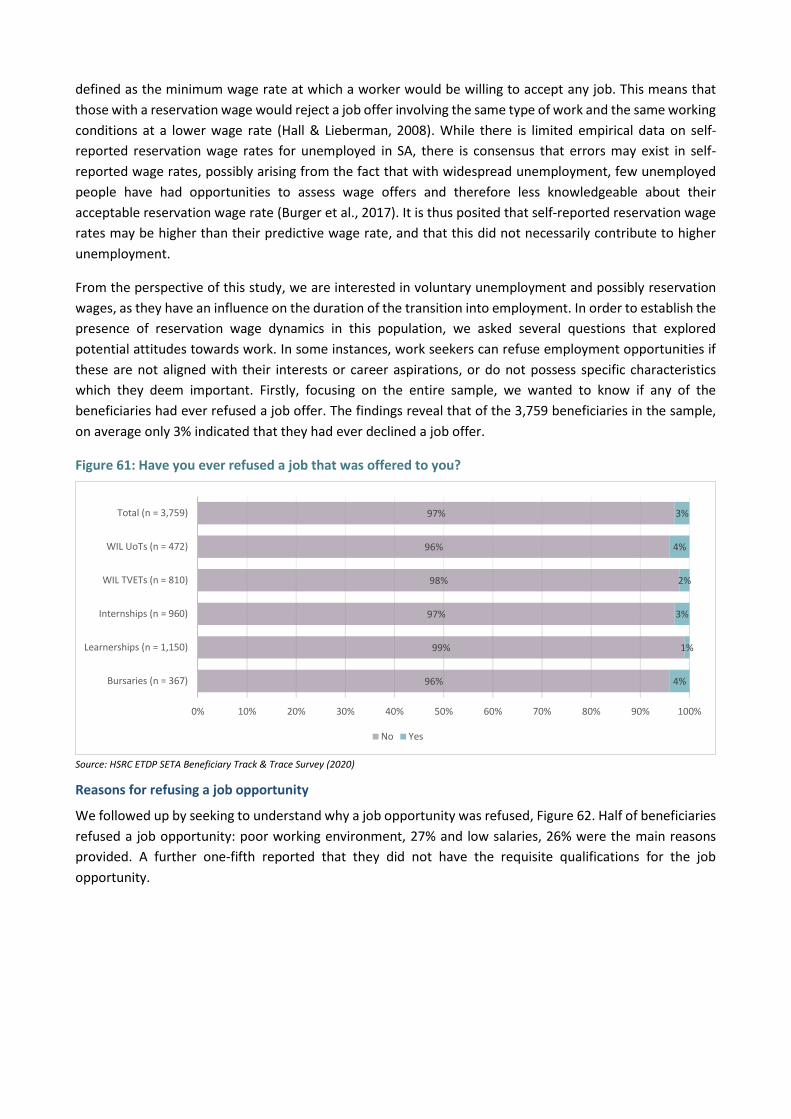
defined as the minimum wage rate at which a worker would be willing to accept any job. This means that
those with a reservation wage would reject a job offer involving the same type of work and the same working
conditions at a lower wage rate (Hall & Lieberman, 2008). While there is limited empirical data on self-
reported reservation wage rates for unemployed in SA, there is consensus that errors may exist in self-
reported wage rates, possibly arising from the fact that with widespread unemployment, few unemployed
people have had opportunities to assess wage offers and therefore less knowledgeable about their
acceptable reservation wage rate (Burger et al., 2017). It is thus posited that self-reported reservation wage
rates may be higher than their predictive wage rate, and that this did not necessarily contribute to higher
unemployment.
From the perspective of this study, we are interested in voluntary unemployment and possibly reservation
wages, as they have an influence on the duration of the transition into employment. In order to establish the
presence of reservation wage dynamics in this population, we asked several questions that explored
potential attitudes towards work. In some instances, work seekers can refuse employment opportunities if
these are not aligned with their interests or career aspirations, or do not possess specific characteristics
which they deem important. Firstly, focusing on the entire sample, we wanted to know if any of the
beneficiaries had ever refused a job offer. The findings reveal that of the 3,759 beneficiaries in the sample,
on average only 3% indicated that they had ever declined a job offer.
Figure 61: Have you ever refused a job that was offered to you?
Source: HSRC ETDP SETA Beneficiary Track & Trace Survey (2020)
Reasons for refusing a job opportunity
We followed up by seeking to understand why a job opportunity was refused, Figure 62. Half of beneficiaries
refused a job opportunity: poor working environment, 27% and low salaries, 26% were the main reasons
provided. A further one-fifth reported that they did not have the requisite qualifications for the job
opportunity.
96%
99%
97%
98%
96%
97%
4%
1%
3%
2%
4%
3%
0% 10% 20% 30% 40% 50% 60% 70% 80% 90% 100%
Bursaries (n = 367)
Learnerships (n = 1,150)
Internships (n = 960)
WIL TVETs (n = 810)
WIL UoTs (n = 472)
Total (n = 3,759)
No Yes
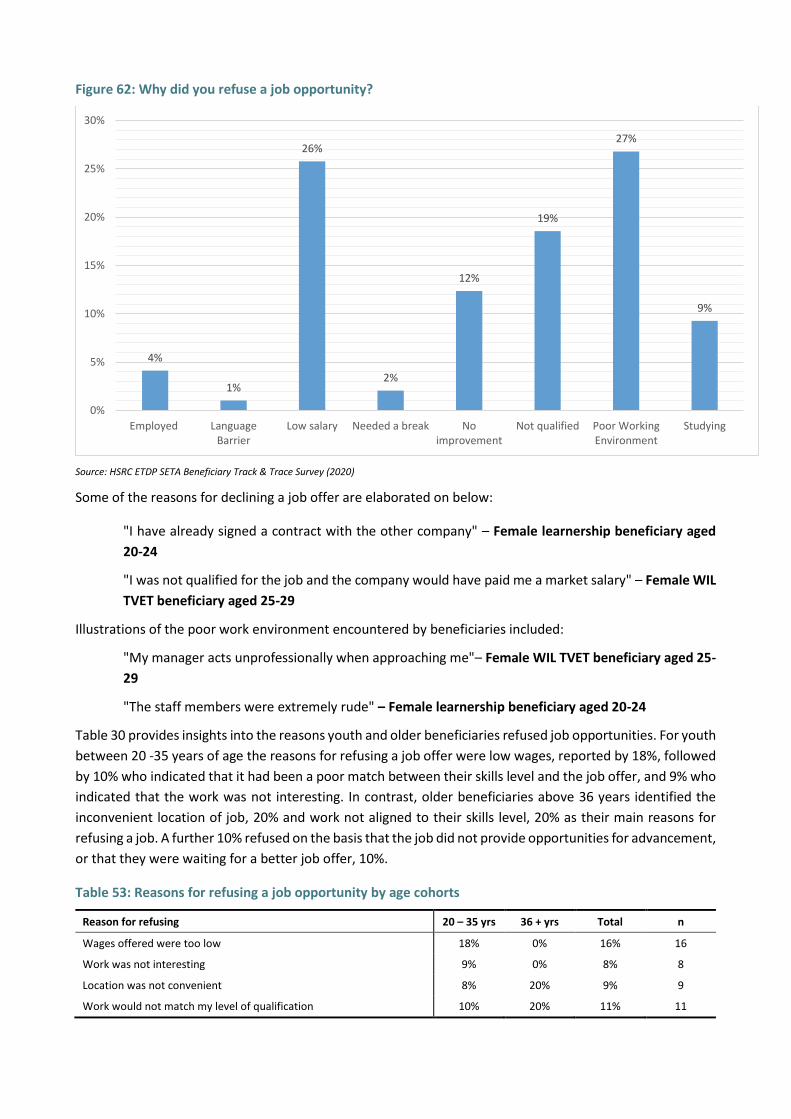
Figure 62: Why did you refuse a job opportunity?
Source: HSRC ETDP SETA Beneficiary Track & Trace Survey (2020)
Some of the reasons for declining a job offer are elaborated on below:
"I have already signed a contract with the other company" – Female learnership beneficiary aged
20-24
"I was not qualified for the job and the company would have paid me a market salary" – Female WIL
TVET beneficiary aged 25-29
Illustrations of the poor work environment encountered by beneficiaries included:
"My manager acts unprofessionally when approaching me"– Female WIL TVET beneficiary aged 25-
29
"The staff members were extremely rude" – Female learnership beneficiary aged 20-24
Table 30 provides insights into the reasons youth and older beneficiaries refused job opportunities. For youth
between 20 -35 years of age the reasons for refusing a job offer were low wages, reported by 18%, followed
by 10% who indicated that it had been a poor match between their skills level and the job offer, and 9% who
indicated that the work was not interesting. In contrast, older beneficiaries above 36 years identified the
inconvenient location of job, 20% and work not aligned to their skills level, 20% as their main reasons for
refusing a job. A further 10% refused on the basis that the job did not provide opportunities for advancement,
or that they were waiting for a better job offer, 10%.
Table 53: Reasons for refusing a job opportunity by age cohorts
Reason for refusing 20 – 35 yrs 36 + yrs Total n
Wages offered were too low 18% 0% 16% 16
Work was not interesting 9% 0% 8% 8
Location was not convenient 8% 20% 9% 9
Work would not match my level of qualification 10% 20% 11% 11
4%
1%
26%
2%
12%
19%
27%
9%
0%
5%
10%
15%
20%
25%
30%
Employed LanguageBarrier
Low salary Needed a break Noimprovement
Not qualified Poor WorkingEnvironment
Studying
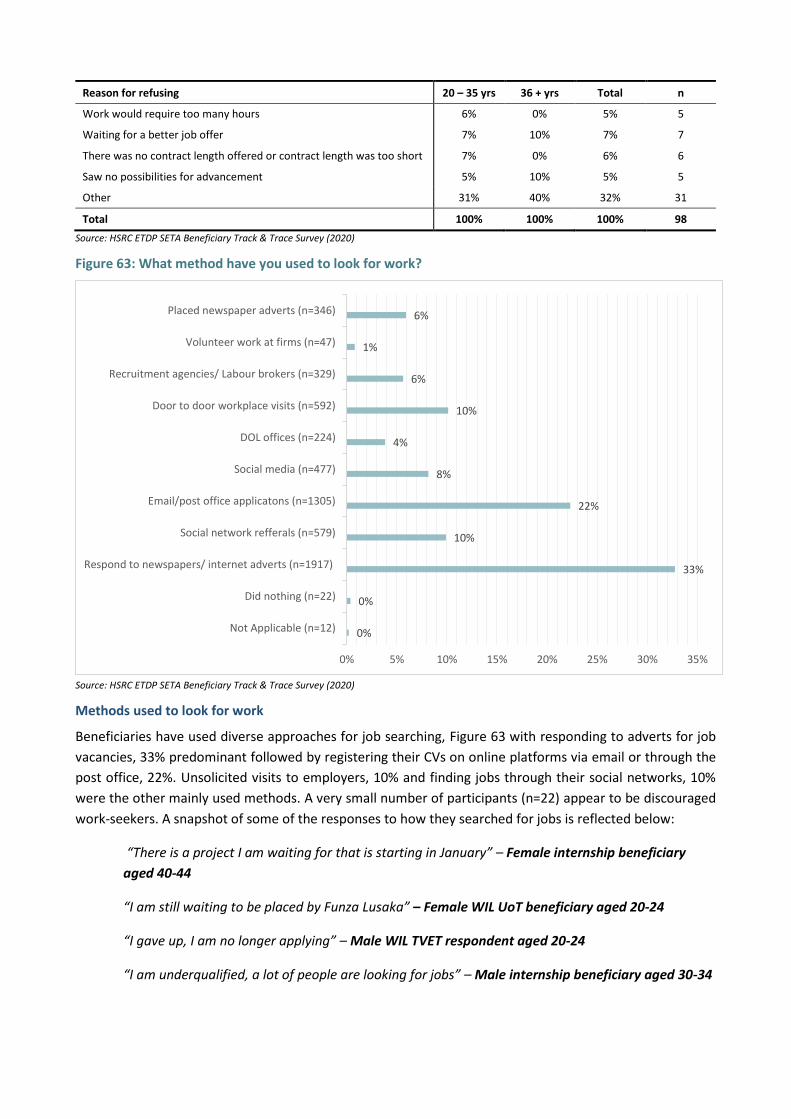
Reason for refusing 20 – 35 yrs 36 + yrs Total n
Work would require too many hours 6% 0% 5% 5
Waiting for a better job offer 7% 10% 7% 7
There was no contract length offered or contract length was too short 7% 0% 6% 6
Saw no possibilities for advancement 5% 10% 5% 5
Other 31% 40% 32% 31
Total 100% 100% 100% 98
Source: HSRC ETDP SETA Beneficiary Track & Trace Survey (2020)
Figure 63: What method have you used to look for work?
Source: HSRC ETDP SETA Beneficiary Track & Trace Survey (2020)
Methods used to look for work
Beneficiaries have used diverse approaches for job searching, Figure 63 with responding to adverts for job
vacancies, 33% predominant followed by registering their CVs on online platforms via email or through the
post office, 22%. Unsolicited visits to employers, 10% and finding jobs through their social networks, 10%
were the other mainly used methods. A very small number of participants (n=22) appear to be discouraged
work-seekers. A snapshot of some of the responses to how they searched for jobs is reflected below:
“There is a project I am waiting for that is starting in January” – Female internship beneficiary
aged 40-44
“I am still waiting to be placed by Funza Lusaka” – Female WIL UoT beneficiary aged 20-24
“I gave up, I am no longer applying” – Male WIL TVET respondent aged 20-24
“I am underqualified, a lot of people are looking for jobs” – Male internship beneficiary aged 30-34
0%
0%
33%
10%
22%
8%
4%
10%
6%
1%
6%
0% 5% 10% 15% 20% 25% 30% 35%
Not Applicable (n=12)
Did nothing (n=22)
Respond to newspapers/ internet adverts (n=1917)
Social network refferals (n=579)
Email/post office applicatons (n=1305)
Social media (n=477)
DOL offices (n=224)
Door to door workplace visits (n=592)
Recruitment agencies/ Labour brokers (n=329)
Volunteer work at firms (n=47)
Placed newspaper adverts (n=346)
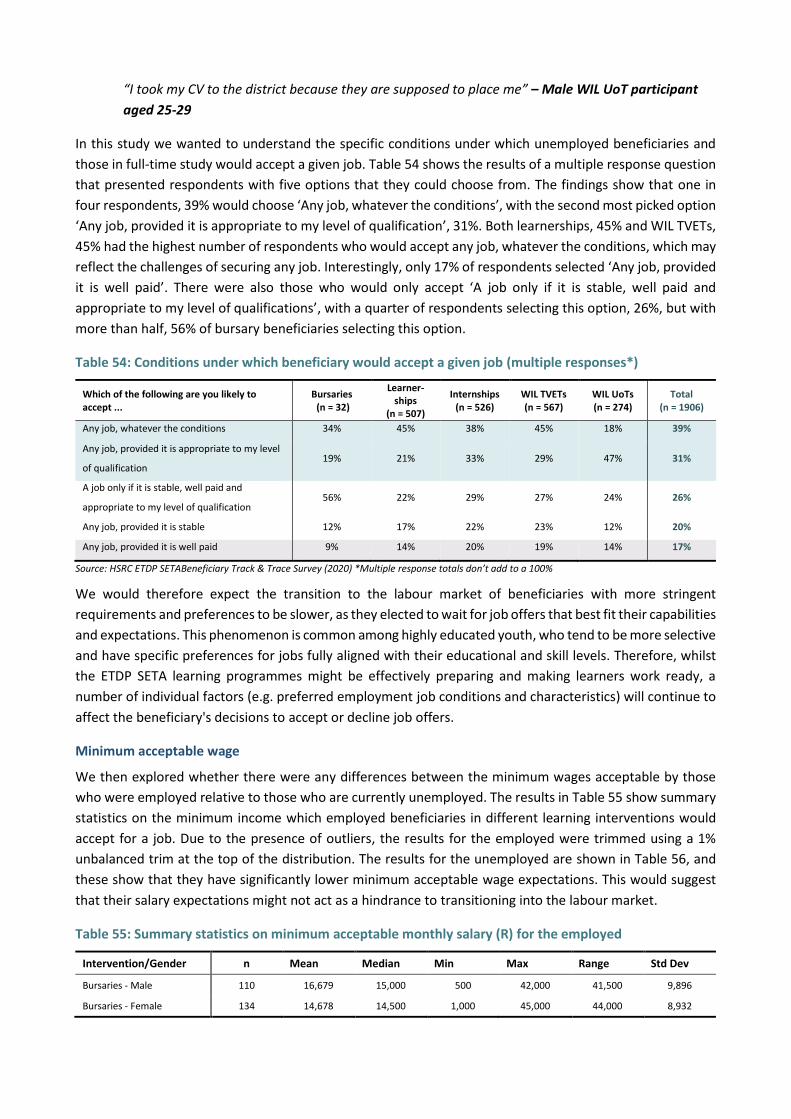
“I took my CV to the district because they are supposed to place me” – Male WIL UoT participant
aged 25-29
In this study we wanted to understand the specific conditions under which unemployed beneficiaries and
those in full-time study would accept a given job. Table 54 shows the results of a multiple response question
that presented respondents with five options that they could choose from. The findings show that one in
four respondents, 39% would choose ‘Any job, whatever the conditions’, with the second most picked option
‘Any job, provided it is appropriate to my level of qualification’, 31%. Both learnerships, 45% and WIL TVETs,
45% had the highest number of respondents who would accept any job, whatever the conditions, which may
reflect the challenges of securing any job. Interestingly, only 17% of respondents selected ‘Any job, provided
it is well paid’. There were also those who would only accept ‘A job only if it is stable, well paid and
appropriate to my level of qualifications’, with a quarter of respondents selecting this option, 26%, but with
more than half, 56% of bursary beneficiaries selecting this option.
Table 54: Conditions under which beneficiary would accept a given job (multiple responses*)
Which of the following are you likely to accept ...
Bursaries (n = 32)
Learner-ships
(n = 507)
Internships (n = 526)
WIL TVETs (n = 567)
WIL UoTs (n = 274)
Total (n = 1906)
Any job, whatever the conditions 34% 45% 38% 45% 18% 39%
Any job, provided it is appropriate to my level
of qualification 19% 21% 33% 29% 47% 31%
A job only if it is stable, well paid and
appropriate to my level of qualification 56% 22% 29% 27% 24% 26%
Any job, provided it is stable 12% 17% 22% 23% 12% 20%
Any job, provided it is well paid 9% 14% 20% 19% 14% 17%
Source: HSRC ETDP SETABeneficiary Track & Trace Survey (2020) *Multiple response totals don’t add to a 100%
We would therefore expect the transition to the labour market of beneficiaries with more stringent
requirements and preferences to be slower, as they elected to wait for job offers that best fit their capabilities
and expectations. This phenomenon is common among highly educated youth, who tend to be more selective
and have specific preferences for jobs fully aligned with their educational and skill levels. Therefore, whilst
the ETDP SETA learning programmes might be effectively preparing and making learners work ready, a
number of individual factors (e.g. preferred employment job conditions and characteristics) will continue to
affect the beneficiary's decisions to accept or decline job offers.
Minimum acceptable wage
We then explored whether there were any differences between the minimum wages acceptable by those
who were employed relative to those who are currently unemployed. The results in Table 55 show summary
statistics on the minimum income which employed beneficiaries in different learning interventions would
accept for a job. Due to the presence of outliers, the results for the employed were trimmed using a 1%
unbalanced trim at the top of the distribution. The results for the unemployed are shown in Table 56, and
these show that they have significantly lower minimum acceptable wage expectations. This would suggest
that their salary expectations might not act as a hindrance to transitioning into the labour market.
Table 55: Summary statistics on minimum acceptable monthly salary (R) for the employed
Intervention/Gender n Mean Median Min Max Range Std Dev
Bursaries - Male 110 16,679 15,000 500 42,000 41,500 9,896
Bursaries - Female 134 14,678 14,500 1,000 45,000 44,000 8,932
Intervention/Gender n Mean Median Min Max Range Std Dev
Learnerships - Male 92 8,947 5,000 500 40,000 39,500 9,437
Learnerships - Female 399 7,331 4,900 250 42,000 41,750 7,448
Internships - Male 106 6,549 5,000 1,000 25,000 24,000 4,827
Internships - Female 253 6,250 5,000 250 40,000 39,750 5,789
WIL TVETs - Male 57 5,956 5,000 1,000 17,000 16,000 3,902
WIL TVETs - Female 138 4,935 4,000 1,000 15,000 14,000 3,130
WIL UoTs - Male 79 8,708 8,000 1,000 25,000 24,000 5,891
WIL UoTs - Female 84 9,446 10,000 1,000 26,000 25,000 5,821
Total 1,452 8,490 5,000 250 45,000 44,750 7,743
Source: HSRC ETDP SETA Beneficiary Track & Trace Survey (2020)
It can also be observed that men consistently have higher minimum wage expectations than their female
counterparts, and it is not immediately clear what would drive these gendered wage differences.
Table 56: Summary statistics on minimum acceptable monthly salary (R) for the unemployed
Intervention/Gender N Mean Median Min Max Range Std Dev
Bursaries - Male 5 5,300 4,500 2,000 9,000 7,000 2,885
Bursaries - Female 10 7,390 7,450 1,000 15,000 14,000 3,979
Learnerships - Male 93 4,402 3,000 500 40,000 39,500 4,696
Learnerships - Female 274 3,276 2,500 300 45,000 44,700 3,541
Internships - Male 126 4,837 4,000 250 30,000 29,750 4,259
Internships - Female 268 4,321 3,500 500 30,000 29,500 3,355
WIL TVETs - Male 90 4,837 4,000 1,000 34,000 33,000 4,435
WIL TVETs - Female 344 4,174 3,500 500 29,900 29,400 3,021
WIL UoTs - Male 104 7,216 6,000 1,000 25,000 24,000 4,806
WIL UoTs - Female 113 7,096 5,000 1,000 25,000 24,000 5,404
Total 1427 4,624 3,500 250 45,000 44,750 4,060
Source: HSRC ETDP SETA Beneficiary Track & Trace Survey (2020)
Socioeconomic support for the unemployed
The next question is how these economically inactive beneficiaries are sustaining themselves. Table 57
indicates sources of support for the unemployed and shows that a large majority, 52% are supported by other
household members. This is in line with the proposition that the youth and young adults might choose to
continue living with parents for financial support (Choi et al., 2019; Klasen & Woolard, 2008). This means that
milestones associated with transition to adulthood, including family formation or marriage decisions, could
be delayed. It also evident that government grants play a vital role in supporting the unemployed
beneficiaries. About 17% rely on child grants, with others citing reliance on other forms of government
grants, such as old age and disability, 3% and welfare grants. Notably, access to a wide range of social grants
has been found to be positively associated with job searching by youth (De Lannoy et al., 2018).
Table 57: Since you are unemployed, how you do support yourself? (Multiple response*)
Forms of support Frequency Percentage
Supported by persons in the household 1,262 58%
Child support/foster care grants 375 17%
Other sources of support 206 9%
Forms of support Frequency Percentage
Old age or disability pension 141 6%
Supported by persons NOT in the household 75 3%
Other welfare grants 71 3%
From savings or money previously earned 34 2%
Supported by charity, church, welfare, etc. 14 2%
Receive Unemployment Insurance Fund (UIF) 6 0
Total 2,184 100
Source: HSRC ETDP SETA Beneficiary Track & Trace Survey (2020). *Multiple responses percentages do not add up to 100%
Full-time study and not working
Choosing to study further is another possible destination for learners who have completed a learning
intervention. This section focuses on those beneficiaries who indicated that they were studying full time
towards another qualification. Table 58 shows that 160 individuals were studying further at the time of the
survey, giving a full-time study rate of 4% within the realised sample. This table also gives an indication of
the higher education and training institutions where the beneficiaries are registered. Most of the
beneficiaries, 41% are registered with universities, UoTs, 26% and TVET colleges, 24%, with a very small
proportion registered with other post-school and education institutions. The results further show that
majority of internship beneficiaries are registered at universities, while more than half of learnership
beneficiaries are at TVET colleges.
Table 58: Where are you currently registered for full-time study?
Institution Bursaries Learnerships Internships WIL
TVETs WIL UoTs Total %
University of Technology 1 7 8 4 22 42 26%
University 6 6 28 16 9 65 41%
TVET College 0 28 7 4 0 39 24%
Adult education centre/Community education and Training (CET) colleges
0 1 0 0 0 1 1%
Private college 0 3 3 1 0 7 4%
Other 0 3 3 0 0 6 4%
Total 7 48 49 25 31 160 100%
Source: HSRC ETDP SETABeneficiary Track & Trace Survey (2020)
The results in Table 59, by age cohort, show that almost all of those studying full time are youth, with only
one individual above the age of 35 years.
Table 59: Where ETDP SETA beneficiaries studying full time are currently registered, by age cohort
Institution 20 – 35 yrs 36 + yrs Total
University of Technology 41 0 41
University 62 1 63
TVET College 39 0 39
Adult education centre/Community education and Training (CET) colleges
1 0 1
Private college 7 0 7
Other 6 0 6
Total 156 1 157
Source: HSRC ETDP SETA Beneficiary Track & Trace Survey (2020)
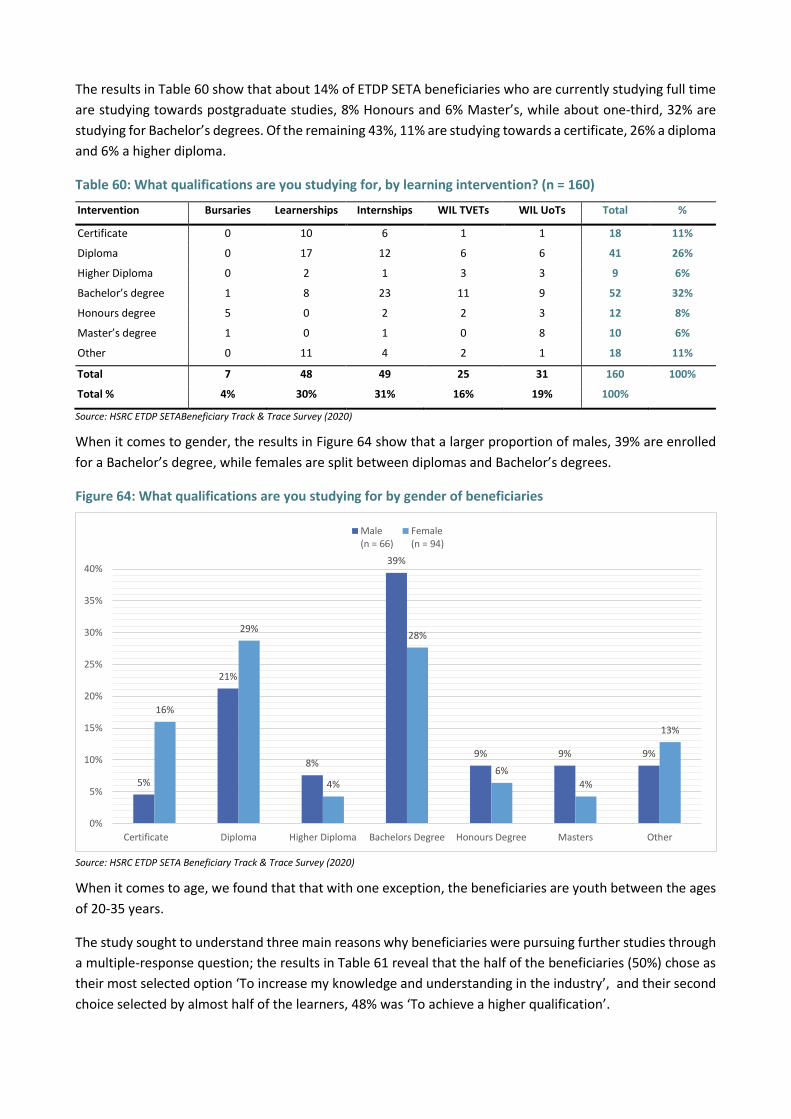
The results in Table 60 show that about 14% of ETDP SETA beneficiaries who are currently studying full time
are studying towards postgraduate studies, 8% Honours and 6% Master’s, while about one-third, 32% are
studying for Bachelor’s degrees. Of the remaining 43%, 11% are studying towards a certificate, 26% a diploma
and 6% a higher diploma.
Table 60: What qualifications are you studying for, by learning intervention? (n = 160)
Intervention Bursaries Learnerships Internships WIL TVETs WIL UoTs Total %
Certificate 0 10 6 1 1 18 11%
Diploma 0 17 12 6 6 41 26%
Higher Diploma 0 2 1 3 3 9 6%
Bachelor’s degree 1 8 23 11 9 52 32%
Honours degree 5 0 2 2 3 12 8%
Master’s degree 1 0 1 0 8 10 6%
Other 0 11 4 2 1 18 11%
Total 7 48 49 25 31 160 100%
Total % 4% 30% 31% 16% 19% 100%
Source: HSRC ETDP SETABeneficiary Track & Trace Survey (2020)
When it comes to gender, the results in Figure 64 show that a larger proportion of males, 39% are enrolled
for a Bachelor’s degree, while females are split between diplomas and Bachelor’s degrees.
Figure 64: What qualifications are you studying for by gender of beneficiaries
Source: HSRC ETDP SETA Beneficiary Track & Trace Survey (2020)
When it comes to age, we found that that with one exception, the beneficiaries are youth between the ages
of 20-35 years.
The study sought to understand three main reasons why beneficiaries were pursuing further studies through
a multiple-response question; the results in Table 61 reveal that the half of the beneficiaries (50%) chose as
their most selected option ‘To increase my knowledge and understanding in the industry’, and their second
choice selected by almost half of the learners, 48% was ‘To achieve a higher qualification’.
5%
21%
8%
39%
9% 9% 9%
16%
29%
4%
28%
6%
4%
13%
0%
5%
10%
15%
20%
25%
30%
35%
40%
Certificate Diploma Higher Diploma Bachelors Degree Honours Degree Masters Other
Male(n = 66)
Female(n = 94)
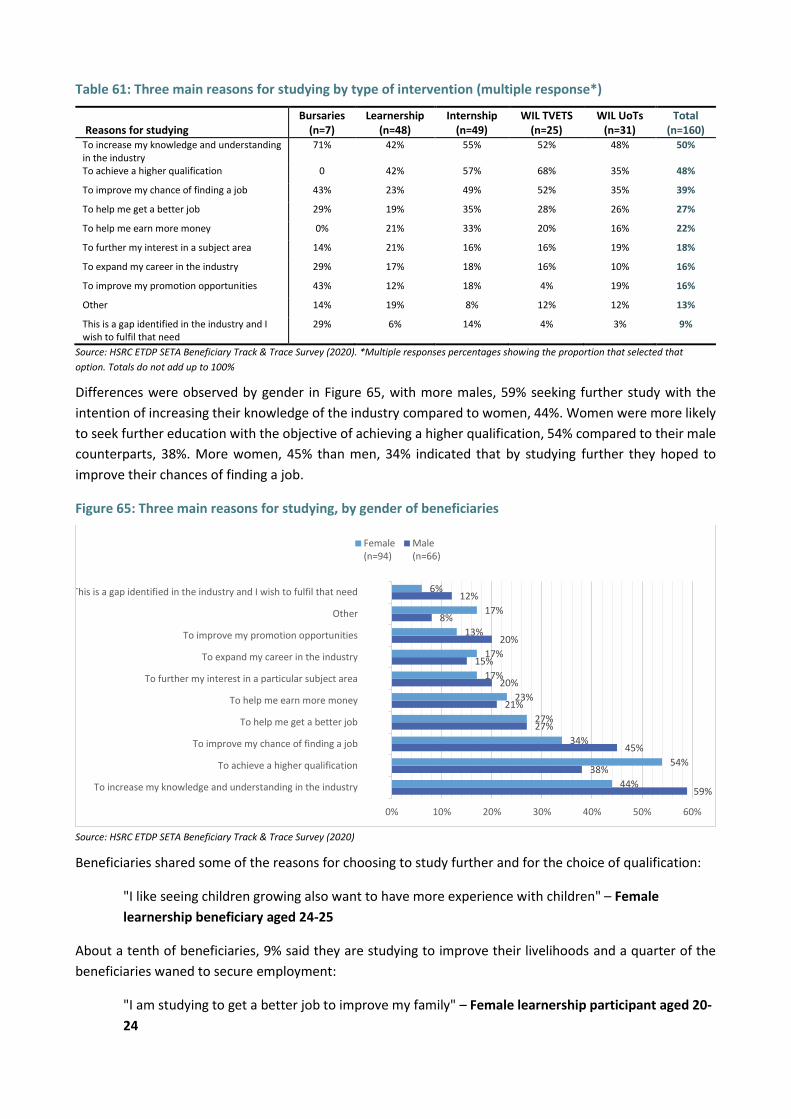
Table 61: Three main reasons for studying by type of intervention (multiple response*)
Reasons for studying Bursaries
(n=7) Learnership
(n=48) Internship
(n=49) WIL TVETS
(n=25) WIL UoTs
(n=31) Total
(n=160) To increase my knowledge and understanding in the industry
71% 42% 55% 52% 48% 50%
To achieve a higher qualification 0 42% 57% 68% 35% 48%
To improve my chance of finding a job 43% 23% 49% 52% 35% 39%
To help me get a better job 29% 19% 35% 28% 26% 27%
To help me earn more money 0% 21% 33% 20% 16% 22%
To further my interest in a subject area 14% 21% 16% 16% 19% 18%
To expand my career in the industry 29% 17% 18% 16% 10% 16%
To improve my promotion opportunities 43% 12% 18% 4% 19% 16%
Other 14% 19% 8% 12% 12% 13%
This is a gap identified in the industry and I wish to fulfil that need
29% 6% 14% 4% 3% 9%
Source: HSRC ETDP SETA Beneficiary Track & Trace Survey (2020). *Multiple responses percentages showing the proportion that selected that
option. Totals do not add up to 100%
Differences were observed by gender in Figure 65, with more males, 59% seeking further study with the
intention of increasing their knowledge of the industry compared to women, 44%. Women were more likely
to seek further education with the objective of achieving a higher qualification, 54% compared to their male
counterparts, 38%. More women, 45% than men, 34% indicated that by studying further they hoped to
improve their chances of finding a job.
Figure 65: Three main reasons for studying, by gender of beneficiaries
Source: HSRC ETDP SETA Beneficiary Track & Trace Survey (2020)
Beneficiaries shared some of the reasons for choosing to study further and for the choice of qualification:
"I like seeing children growing also want to have more experience with children" – Female
learnership beneficiary aged 24-25
About a tenth of beneficiaries, 9% said they are studying to improve their livelihoods and a quarter of the
beneficiaries waned to secure employment:
"I am studying to get a better job to improve my family" – Female learnership participant aged 20-
24
59%
38%
45%
27%
21%
20%
15%
20%
8%
12%
44%
54%
34%
27%
23%
17%
17%
13%
17%
6%
0% 10% 20% 30% 40% 50% 60%
To increase my knowledge and understanding in the industry
To achieve a higher qualification
To improve my chance of finding a job
To help me get a better job
To help me earn more money
To further my interest in a particular subject area
To expand my career in the industry
To improve my promotion opportunities
Other
This is a gap identified in the industry and I wish to fulfil that need
Female(n=94)
Male(n=66)
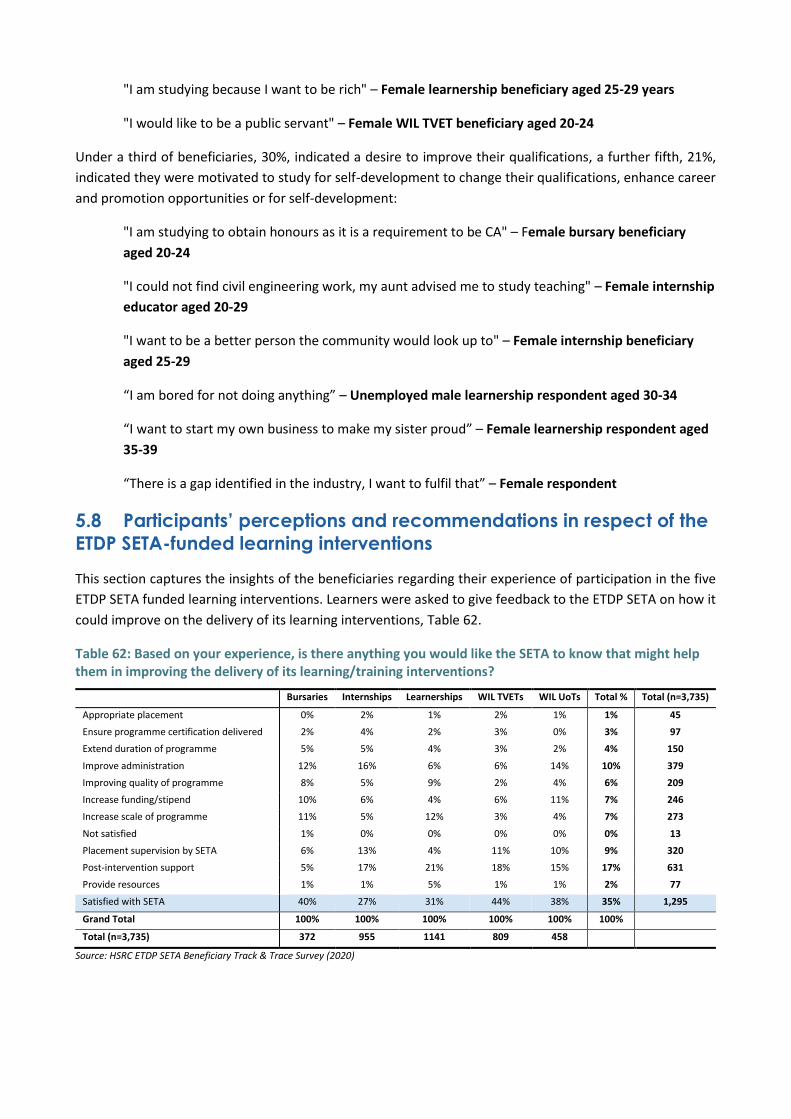
"I am studying because I want to be rich" – Female learnership beneficiary aged 25-29 years
"I would like to be a public servant" – Female WIL TVET beneficiary aged 20-24
Under a third of beneficiaries, 30%, indicated a desire to improve their qualifications, a further fifth, 21%,
indicated they were motivated to study for self-development to change their qualifications, enhance career
and promotion opportunities or for self-development:
"I am studying to obtain honours as it is a requirement to be CA" – Female bursary beneficiary
aged 20-24
"I could not find civil engineering work, my aunt advised me to study teaching" – Female internship
educator aged 20-29
"I want to be a better person the community would look up to" – Female internship beneficiary
aged 25-29
“I am bored for not doing anything” – Unemployed male learnership respondent aged 30-34
“I want to start my own business to make my sister proud” – Female learnership respondent aged
35-39
“There is a gap identified in the industry, I want to fulfil that” – Female respondent
5.8 Participants’ perceptions and recommendations in respect of the
ETDP SETA-funded learning interventions
This section captures the insights of the beneficiaries regarding their experience of participation in the five
ETDP SETA funded learning interventions. Learners were asked to give feedback to the ETDP SETA on how it
could improve on the delivery of its learning interventions, Table 62.
Table 62: Based on your experience, is there anything you would like the SETA to know that might help them in improving the delivery of its learning/training interventions?
Bursaries Internships Learnerships WIL TVETs WIL UoTs Total % Total (n=3,735)
Appropriate placement 0% 2% 1% 2% 1% 1% 45
Ensure programme certification delivered 2% 4% 2% 3% 0% 3% 97
Extend duration of programme 5% 5% 4% 3% 2% 4% 150
Improve administration 12% 16% 6% 6% 14% 10% 379
Improving quality of programme 8% 5% 9% 2% 4% 6% 209
Increase funding/stipend 10% 6% 4% 6% 11% 7% 246
Increase scale of programme 11% 5% 12% 3% 4% 7% 273
Not satisfied 1% 0% 0% 0% 0% 0% 13
Placement supervision by SETA 6% 13% 4% 11% 10% 9% 320
Post-intervention support 5% 17% 21% 18% 15% 17% 631
Provide resources 1% 1% 5% 1% 1% 2% 77
Satisfied with SETA 40% 27% 31% 44% 38% 35% 1,295
Grand Total 100% 100% 100% 100% 100% 100%
Total (n=3,735) 372 955 1141 809 458
Source: HSRC ETDP SETA Beneficiary Track & Trace Survey (2020)
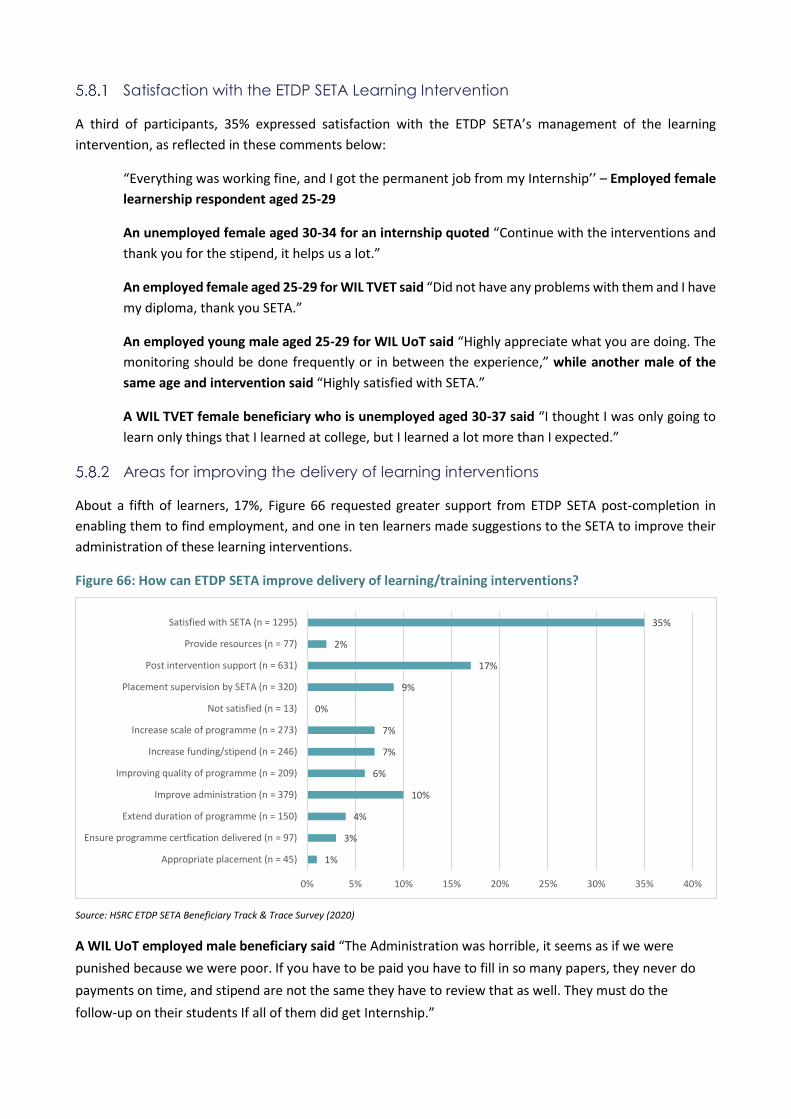
Satisfaction with the ETDP SETA Learning Intervention
A third of participants, 35% expressed satisfaction with the ETDP SETA’s management of the learning
intervention, as reflected in these comments below:
“Everything was working fine, and I got the permanent job from my Internship’’ – Employed female
learnership respondent aged 25-29
An unemployed female aged 30-34 for an internship quoted “Continue with the interventions and
thank you for the stipend, it helps us a lot.”
An employed female aged 25-29 for WIL TVET said “Did not have any problems with them and I have
my diploma, thank you SETA.”
An employed young male aged 25-29 for WIL UoT said “Highly appreciate what you are doing. The
monitoring should be done frequently or in between the experience,” while another male of the
same age and intervention said “Highly satisfied with SETA.”
A WIL TVET female beneficiary who is unemployed aged 30-37 said “I thought I was only going to
learn only things that I learned at college, but I learned a lot more than I expected.”
Areas for improving the delivery of learning interventions
About a fifth of learners, 17%, Figure 66 requested greater support from ETDP SETA post-completion in
enabling them to find employment, and one in ten learners made suggestions to the SETA to improve their
administration of these learning interventions.
Figure 66: How can ETDP SETA improve delivery of learning/training interventions?
Source: HSRC ETDP SETA Beneficiary Track & Trace Survey (2020)
A WIL UoT employed male beneficiary said “The Administration was horrible, it seems as if we were
punished because we were poor. If you have to be paid you have to fill in so many papers, they never do
payments on time, and stipend are not the same they have to review that as well. They must do the
follow-up on their students If all of them did get Internship.”
1%
3%
4%
10%
6%
7%
7%
0%
9%
17%
2%
35%
0% 5% 10% 15% 20% 25% 30% 35% 40%
Appropriate placement (n = 45)
Ensure programme certfication delivered (n = 97)
Extend duration of programme (n = 150)
Improve administration (n = 379)
Improving quality of programme (n = 209)
Increase funding/stipend (n = 246)
Increase scale of programme (n = 273)
Not satisfied (n = 13)
Placement supervision by SETA (n = 320)
Post intervention support (n = 631)
Provide resources (n = 77)
Satisfied with SETA (n = 1295)

A few learners expressed their concerns about how the WIL programme was implemented in terms of its
duration, which did not allow for meaningful skills development, and the need for improvements in the
quality of the placement:
“SETA must make sure that its interns do not lose interest on the programme by making sure that
interns are properly placed” – A male aged 24-29
A young unemployed male for WIL UoT aged between 20-24 noted “In its current form, SETA
programme does not make any meaningful difference to beneficiaries because it’s abused by
companies to get cheap labour every year without exposing the trainees to the world of work and
the 6 months or a year period is not enough to get workplace experience.”
“SETA must make sure that its interns do not lose interest on the programme by making sure that
interns are properly placed” – Male aged 24-29 for WIL TVET
Amongst the learnership programmes beneficiaries there were many expectations in respect of SETA
enabling them to get a promotion, salary raise and receive laptops:
A female teacher aged 50-54 said “I expected to get laptop from the department of education
and for the department to take other educators through the same training. I expected to get a
pay raise as we upgraded ourselves.”
“For me, SETA must stick to their promises; they promised us that we will get an internship after
the programme but nothing happened” – Unemployed female aged 25-29 for WIL TVET
A full-time employed female aged 30-34 said “Make the training close to us. We cannot afford
transport and food.”
A female aged 35-39, WIL TVET said “SETA should place people where they will be able to get the
experience that they require for their qualifications.”
“I think SETA should do more and place graduates and not put them in places where they will not
be employable and absorbed” – An unemployed female aged 30-34, internship
“If they can do research before placements for their practicals and ensure that the institution will
allow beneficiaries the experience they need” – Unemployed female learnership participant
aged 30-34
“Hours were too much for people coming from work. So SETA should shorten times and decrease
the workload because we receive a lot of work in short space of time”– female teacher aged 55-
59 who had completed a learnership
An unemployed female internship learner aged between 25-29 noted “Decentralise the
internship institution so that those who can't afford the money for rent can still do internships at
places near their residential area.”
A female learnership beneficiary age 35-39 said “When giving assignments SETA should give
them more time as they have to juggle work and be students at the same time.”
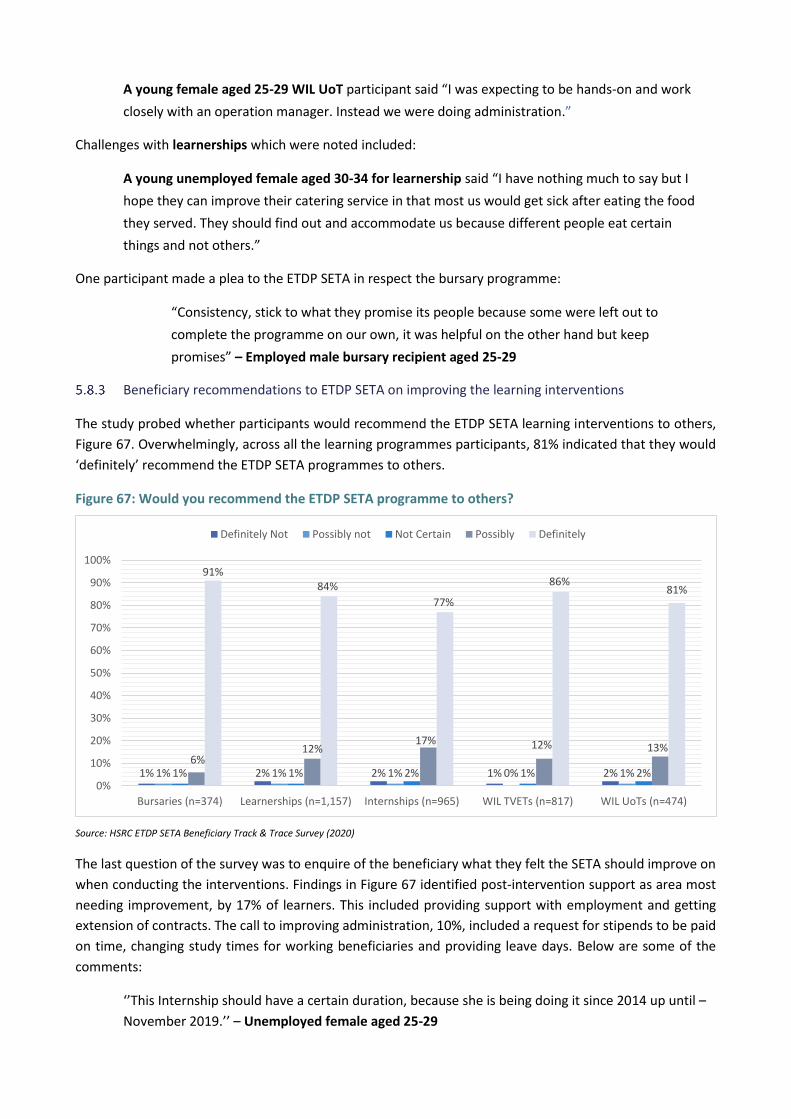
A young female aged 25-29 WIL UoT participant said “I was expecting to be hands-on and work
closely with an operation manager. Instead we were doing administration.”
Challenges with learnerships which were noted included:
A young unemployed female aged 30-34 for learnership said “I have nothing much to say but I
hope they can improve their catering service in that most us would get sick after eating the food
they served. They should find out and accommodate us because different people eat certain
things and not others.”
One participant made a plea to the ETDP SETA in respect the bursary programme:
“Consistency, stick to what they promise its people because some were left out to
complete the programme on our own, it was helpful on the other hand but keep
promises” – Employed male bursary recipient aged 25-29
Beneficiary recommendations to ETDP SETA on improving the learning interventions
The study probed whether participants would recommend the ETDP SETA learning interventions to others,
Figure 67. Overwhelmingly, across all the learning programmes participants, 81% indicated that they would
‘definitely’ recommend the ETDP SETA programmes to others.
Figure 67: Would you recommend the ETDP SETA programme to others?
Source: HSRC ETDP SETA Beneficiary Track & Trace Survey (2020)
The last question of the survey was to enquire of the beneficiary what they felt the SETA should improve on
when conducting the interventions. Findings in Figure 67 identified post-intervention support as area most
needing improvement, by 17% of learners. This included providing support with employment and getting
extension of contracts. The call to improving administration, 10%, included a request for stipends to be paid
on time, changing study times for working beneficiaries and providing leave days. Below are some of the
comments:
‘’This Internship should have a certain duration, because she is being doing it since 2014 up until –
November 2019.’’ – Unemployed female aged 25-29
1% 2% 2% 1% 2%1% 1% 1% 0% 1%1% 1% 2% 1% 2%6%
12%17% 12% 13%
91%84%
77%
86%81%
0%
10%
20%
30%
40%
50%
60%
70%
80%
90%
100%
Bursaries (n=374) Learnerships (n=1,157) Internships (n=965) WIL TVETs (n=817) WIL UoTs (n=474)
Definitely Not Possibly not Not Certain Possibly Definitely
‘’Happy, nothing to say, moved from getting R12,000 to becoming a qualified teacher in high school
and earning R20,000’’ – Female teacher aged 50-54
‘’Learnership assisted me with confidence in that I am confident now when addressing a crowd. So I
thank them for that.’’ – Part-time employed female aged 25-29
‘’The only thing that we didn't get was food but other than that everything was on time. It's hard to
study on an empty stomach.’’ – Full-time employed male aged 20-24
5.9 Overall assessment of transitions into the labour market
The foregoing sections focused on profiling beneficiaries by their employment status. This section brings all
of the outcomes together to determine the extent to which the patterns that we see were driven by exposure
to the intervention. It is noted that there are likely to be a number of factors that influence whether someone
has a successful transition or not. As per the analytical framework for this study, there are a whole range of
external and internal factors that are at play. This means the SETA’s interventions can only contribute
towards the final outcome.
Transition duration, which relates to the time it takes for a learner to have achieved their desired labour
market status, was highlighted in the literature review, section 3 of this report. A short transition was when
a learner experiences a direct and immediate transition or one that arises with a period of inactivity being
less than a year. A middling transition was where the learner experienced periods of employment without
any inactivity, although the employment was of a temporary and no contract nature. It could also include
inactivity of a duration beyond one year. A lengthy transition was when the learner experienced
unemployment of 1 year or more (with or without employment or activity).
The previous section highlighted the self-reported reasons why people think they are unemployed, with 44%
indicating that there are no jobs available in their area. This is further compounded by the migration analysis
that showed that a larger proportion of individuals are still in the same province where they took part in the
intervention. This means that these individuals might remain unemployed, despite there being employment
opportunities in other provincial job markets. This also means that whilst the SETA cannot take 100% credit
for all successful transitions, transition failures should not be quickly translated as failures of the SETA’s
interventions.
To gain an understanding of the extent to which those who were employed felt that the intervention had
played some role in assisting them in securing the current job, we excluded those who had indicated that
they were employed at the same company/organisation as at the time of their studies. Figure 68 shows that
only 41% were still employed at the same company.
Figure 68: Are you employed by the company/employer where you did your learning intervention?
Source: HSRC ETDP SETA Beneficiary Track & Trace Survey (2020)
We asked the 59% who were no longer working for the same company or employer the extent to which they
felt that the learning intervention had assisted with finding their current job. Figure 69 shows that across all
learning there was consensus that participating in the ETDP SETA intervention had contributed to a great
extent in securing their current job. This was particularly evident for WIL TVET beneficiaries, with 40%
agreeing that the intervention had greatly assisted.
These results indicate that the majority of respondents could link the impact of the intervention to their
current employment status, which suggests that beneficiaries perceived the SETA’s interventions as
contributing to facilitating successful transition into the labour market.
Figure 69: To what extent do you think the ETDP SETA’s intervention assisted you with finding the job/starting the business, if self-employed?
Source: HSRC ETDP SETA Beneficiary Track & Trace Survey (2020)
In order to get a better picture of the pre-intervention and post-intervention employment status, Table 63
shows the net differences between these two periods. The overall rate of employment (i.e. inclusive of full
time, part time and self-employed) was 17% higher at the time of the survey than it was before the
beneficiaries started on the intervention. The highest increase was linked to WIL UoTs, 37% followed by
40%
44%
54%
28%
24%
41%
60%
56%
46%
72%
76%
59%
0% 10% 20% 30% 40% 50% 60% 70% 80% 90% 100%
Bursaries (n = 339)
Learnerships (n = 625)
Internships (n = 414)
WIL TVETs (n = 231)
WIL UoTs (n = 196)
Total (n = 1,805)
Yes No
34%
35%
24%
26%
23%
30%
11%
8%
11%
8%
16%
10%
23%
25%
32%
26%
30%
27%
32%
32%
33%
40%
32%
33%
0% 10% 20% 30% 40% 50% 60% 70% 80% 90% 100%
Bursaries (n = 205)
Learnership (n = 367)
Internships (n = 212)
WIL TVETs (n = 179)
WIL UoTs (n = 151)
Total (n = 1,114)
Not at All Very Little To Some Extent To a Great Extent
internships, 22%. This rise in the overall employment rate, though positive, was however not met by a
corresponding decrease in the unemployment rate, which is partly explained by the increase in the WIL UoT
beneficiaries’ unemployment rate of 28%.
Table 63: Outcomes in terms of employment of beneficiaries, comparing before and after the intervention
Outcomes Bursaries (E)
Bursaries (U)
Learnerships Internships WIL TVETs
WIL UoTs
Total
Employment status
Total employment rates10 BEFORE
92% 0% 47% 24% 14% 5% 32%
Total employment rates AFTER
93% 73% 56% 45% 30% 42% 49%
Difference* 1% 73% 9% 22% 15% 37% 17%
Unemployed BEFORE 0% 100% 49% 66% 66% 23% 50%
Unemployed AFTER 6% 18% 40% 50% 67% 52% 47%
Difference* -6% 82% -9% -16% 1% 28% -3%
Full-time employment BEFORE
87% 0% 39% 15% 9% 3% 26%
Full-time employment AFTER 91% 62% 46% 28% 21% 36% 39%
Difference* 4% 62% 7% 13% 12% 33% 13%
Part-time employment BEFORE
5% 0% 6% 7% 5% 2% 5%
Part-time employment AFTER 2% 11% 8% 15% 7% 5% 9%
Difference* -3% 11% 2% 7% 2% 3% 3%
Self-employed BEFORE 0% 0% 2% 1% 0% 0% 1%
Self-employed AFTER 0% 0% 2% 2% 1% 0% 1%
Difference* 0% 0% 0% 1% 1% 0% 1%
Studying full-time BEFORE 8% 0% 4% 10% 19% 70% 17%
Studying full-time AFTER 1% 9% 4% 5% 3% 7% 4%
Difference* -7% 9% 0% -5% -16% -63% -13%
Source: HSRC ETDP SETA Beneficiary Track & Trace Survey (2020)
The changes in both the employment and unemployment rates for WIL UoTs were driven by the fact that
this was also the group that had the highest number of people in full-time study 70%, before. This means
that they also had the largest number of beneficiaries that entered the labour market 63%, with only 7%
remaining in full-time study. Internships, 16%, learnerships, 9% and bursaries, 5% all experienced reductions
in the unemployment rate. Full-time employment rose by 13% whilst the rates of part-time employment and
self-employment only rose marginally, by 3% and 1% respectively.
Labour market transitions before and after the intervention
Whilst a description of these differences gives us an overall picture of the changes between the two periods,
we need to dig deeper to understand the specific transitions that occurred by tracking the outcomes of each
individual person. In other words, did the person who started off in a state of employment remain employed?
What about the people who were unemployed – how many of them moved into employment and how many
stayed unemployed?
10 Total employment rate includes full time, part time and self-employed.
In order to conduct this analysis, we computed the labour market transition matrix based on the employment
status of the beneficiaries before and after the intervention. In Table 64 the rows of the table show the initial
employment status, and the columns show the final status. Between the time of starting the intervention
and completion, 81% of the beneficiaries employed full time remained in employment, and the remaining
19% transitioned as follows: part-time employment 4%, self-employed 1%, unemployed 13%, and studying
full time 1%. This means 128 people moved into unemployment from full-time employment by the time they
completed their intervention.
Table 64: Transition matrix for labour market transitions before and after the intervention
Employment status
CURRENT LABOUR MARKET STATUS (AFTER)
Full-time employed Part-time
employment Self-employed Unemployed
Studying full time
Total
LAB
OU
R M
AR
KET
STA
TUS
BEF
OR
E
Full-time employed 81% 4% 1% 13% 1% 100%
786 39 9 128 8 970
Part-time employment
25% 37% 0% 35% 2% 100%
52 76 1 73 5 207
Self-employed 16% 6% 34% 41% 3% 100%
5 2 11 13 1 32
Unemployed 22% 9% 1% 63% 4% 100%
413 179 27 1,191 83 1,893
Studying full time 33% 5% 1% 51% 9% 100%
217 34 6 336 62 655
Total % 39% 9% 1% 46% 4% 100%
Total No. 1,473 330 54 1,741 159 3,757
Source: Author calculations using HSRC ETDP SETA Beneficiary Track & Trace Survey (2020). *Transition matrices show changes in status between
two periods. Values on the diagonal indicate the number who did not change status, e.g. 81% (786) started off in full-time employment and stayed in
full-time employment after completion
With respect to those who were unemployed, 63% remained unemployed, whilst the remaining 37% shifted
into full-time employment, 22%, part-time employment, 9%, self-employment, 1% and studying full time,
4%. This represents 702 people who moved out of unemployment to a positive economically active status
and full-time study.
As for those who were studying full time, this group was the most unstable between the two periods, with
instability meaning that this group had the highest number of transitions with only 9% remaining in full-time
study. The majority shifted into unemployment, 51%, with 33% shifting into full-time employment.
The transition durations of learners in this study were evidently informed by the type of learning intervention
learners had engaged in, their employment status at the time they commenced with the learning
intervention, and the nature of the qualification and HEI associated with that qualification.
Overall, when we consider the net transitions into employment and out of unemployment, there was a
positive net transition, which means that more people moved into employment than into unemployment.
5.10 Conclusion
For a theory-based evaluation the objective was to triangulate the evidence by assessing the different
indicators based on intervention ToCs. This included the assessments of the SETA’s beneficiaries' subjective
views, on the role ETDP’s interventions played in assisting them in securing employment and achieving other
labour market outcomes. Whilst direct causality cannot be conclusively inferred, outside the context of a
randomised control trial, from the overall picture that emerges it appears as if there is some evidence in
support of the basic logic in the intervention ToCs. Barring the influence of external factors such as the
performance of the economy, one can conclude that ETDP SETA’s learning interventions appear to be making
some contribution in facilitating the postulated transitions as per intervention ToCs. Framed another way,
the body of evidence assembled here is incompatible with a hypothesis of no impact; this is more so when
the socioeconomic status of most beneficiaries is taken into consideration.
The transformative dimensions of skills development policies such as the NSDS III (DHET, 2011) place a great
emphasis on the goal of achieving transformation within the PSET sector, aimed at increasing access of
previously historically disadvantaged people to skills development interventions, and the evidence confirms
that ETDP SETA’s interventions have contributed accordingly.
As the results on employment status show, absorption rates remain relatively low and on average only 49%
were in employment with 39% in full-time employment. Wide variations are noted between learning
interventions, with 91% of previously employed bursary beneficiaries currently employed compared with
62% of those who were unemployed at the time they commenced the training. Less than half of all
learnership beneficiaries, 46% are employed followed by 36% of WIL UoT beneficiaries. Internship
beneficiaries, 28% and WIL TVET beneficiaries, 21% were the groups with the lowest current employment
rates (section 5.7.2).
Whilst the levels of employment were roughly the same for both males and females, there were
disproportionately more women who were unemployed (48%) relative to their male counterparts (43%). The
overall association between gender and employment status was found to be statistically significant, and
highlights a stylised fact regarding the gendered nature of the South African labour market and forms the
basis for the gender targets.
It is important to note that some of the employment outcomes could also be influenced by the fact that an
insufficient amount of time had lapsed between the periods of completion for some of the learners,
especially those who finished in the 2018/19 financial year. As noted in the studies’ conceptual and analytical
frameworks, external factors have a direct impact on influencing the extent to which successful transitions
into the labour market can be made. In the South African context, the unprecedented levels of
unemployment generally and in respect of youth remain a key factor impacting on transitions into the labour
market.
The labour market transition analysis presented allows for it to be concluded that ETDP SETA has contributed
significantly to the realisation of the employability outcome. When we consider the net transitions into
employment and out of unemployment, there was a 37% positive net transition, which means that more
people moved into employment than into unemployment, as illustrated in Table 64.
6 Research Findings Employer Evaluation Outcomes
This section of the report presents employer perceptions of the value and benefits of employee participation
in WIL, internships and learnerships. In the context of the increasing demand for a skilled workforce, engaging
with employers and obtaining their perspectives is important for determining and for the design of skills
interventions. This is based on the expectation that the employer is best able to identify the skills needs of
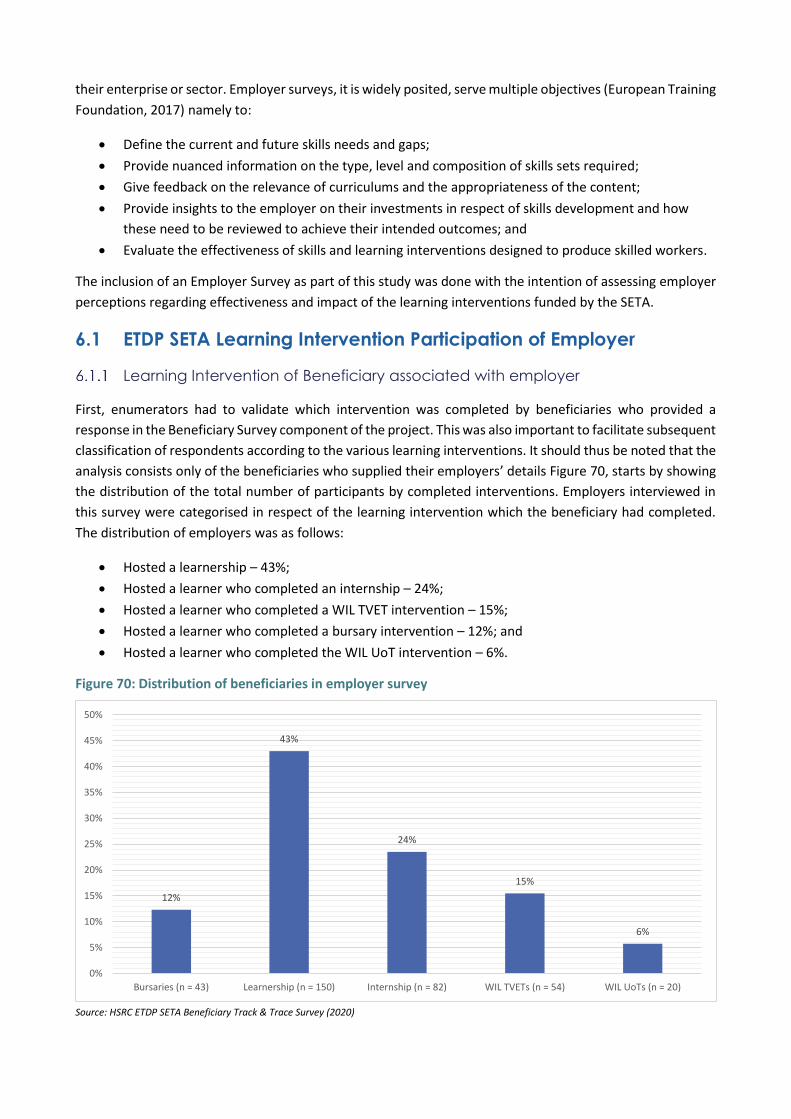
their enterprise or sector. Employer surveys, it is widely posited, serve multiple objectives (European Training
Foundation, 2017) namely to:
Define the current and future skills needs and gaps;
Provide nuanced information on the type, level and composition of skills sets required;
Give feedback on the relevance of curriculums and the appropriateness of the content;
Provide insights to the employer on their investments in respect of skills development and how
these need to be reviewed to achieve their intended outcomes; and
Evaluate the effectiveness of skills and learning interventions designed to produce skilled workers.
The inclusion of an Employer Survey as part of this study was done with the intention of assessing employer
perceptions regarding effectiveness and impact of the learning interventions funded by the SETA.
6.1 ETDP SETA Learning Intervention Participation of Employer
Learning Intervention of Beneficiary associated with employer
First, enumerators had to validate which intervention was completed by beneficiaries who provided a
response in the Beneficiary Survey component of the project. This was also important to facilitate subsequent
classification of respondents according to the various learning interventions. It should thus be noted that the
analysis consists only of the beneficiaries who supplied their employers’ details Figure 70, starts by showing
the distribution of the total number of participants by completed interventions. Employers interviewed in
this survey were categorised in respect of the learning intervention which the beneficiary had completed.
The distribution of employers was as follows:
Hosted a learnership – 43%;
Hosted a learner who completed an internship – 24%;
Hosted a learner who completed a WIL TVET intervention – 15%;
Hosted a learner who completed a bursary intervention – 12%; and
Hosted a learner who completed the WIL UoT intervention – 6%.
Figure 70: Distribution of beneficiaries in employer survey
Source: HSRC ETDP SETA Beneficiary Track & Trace Survey (2020)
12%
43%
24%
15%
6%
0%
5%
10%
15%
20%
25%
30%
35%
40%
45%
50%
Bursaries (n = 43) Learnership (n = 150) Internship (n = 82) WIL TVETs (n = 54) WIL UoTs (n = 20)
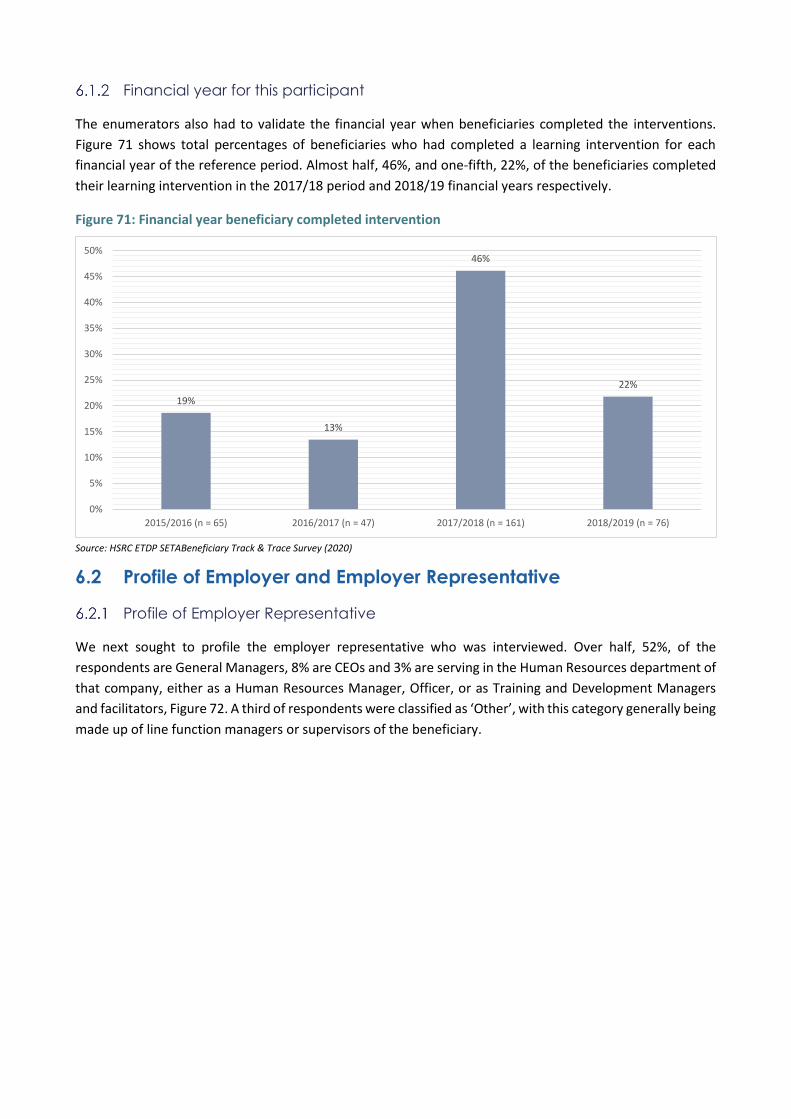
Financial year for this participant
The enumerators also had to validate the financial year when beneficiaries completed the interventions.
Figure 71 shows total percentages of beneficiaries who had completed a learning intervention for each
financial year of the reference period. Almost half, 46%, and one-fifth, 22%, of the beneficiaries completed
their learning intervention in the 2017/18 period and 2018/19 financial years respectively.
Figure 71: Financial year beneficiary completed intervention
Source: HSRC ETDP SETABeneficiary Track & Trace Survey (2020)
6.2 Profile of Employer and Employer Representative
Profile of Employer Representative
We next sought to profile the employer representative who was interviewed. Over half, 52%, of the
respondents are General Managers, 8% are CEOs and 3% are serving in the Human Resources department of
that company, either as a Human Resources Manager, Officer, or as Training and Development Managers
and facilitators, Figure 72. A third of respondents were classified as ‘Other’, with this category generally being
made up of line function managers or supervisors of the beneficiary.
19%
13%
46%
22%
0%
5%
10%
15%
20%
25%
30%
35%
40%
45%
50%
2015/2016 (n = 65) 2016/2017 (n = 47) 2017/2018 (n = 161) 2018/2019 (n = 76)
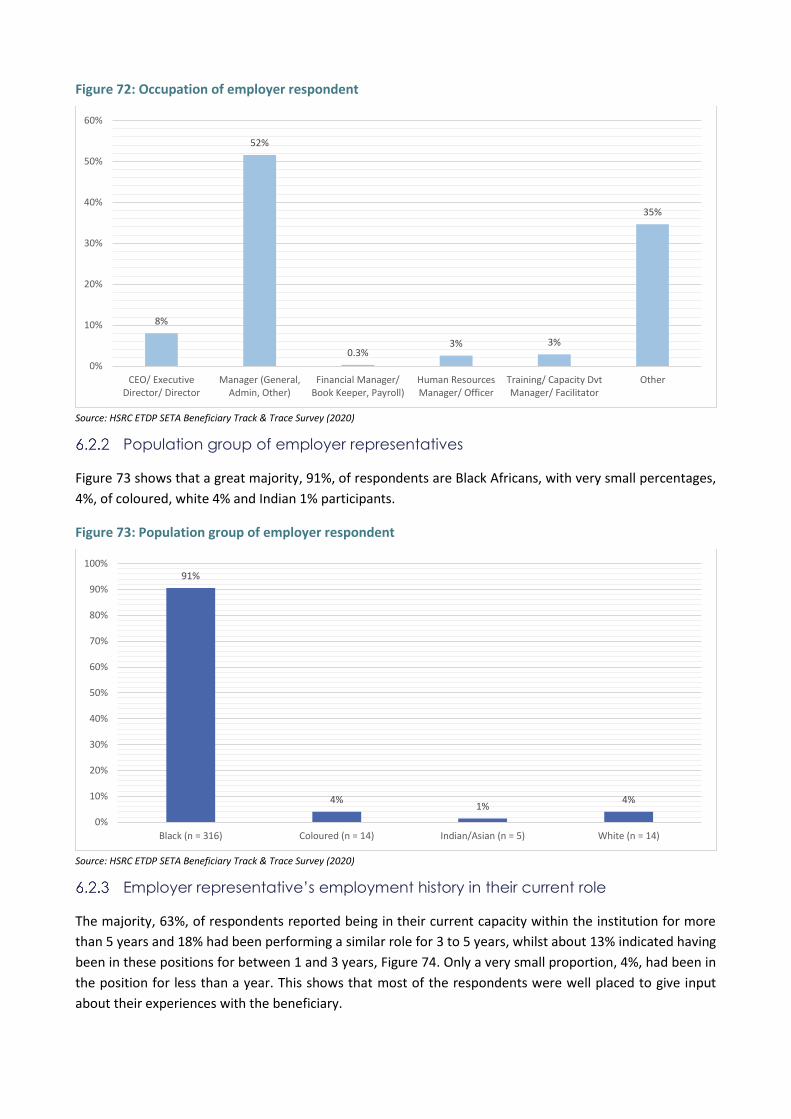
Figure 72: Occupation of employer respondent
Source: HSRC ETDP SETA Beneficiary Track & Trace Survey (2020)
Population group of employer representatives
Figure 73 shows that a great majority, 91%, of respondents are Black Africans, with very small percentages,
4%, of coloured, white 4% and Indian 1% participants.
Figure 73: Population group of employer respondent
Source: HSRC ETDP SETA Beneficiary Track & Trace Survey (2020)
Employer representative’s employment history in their current role
The majority, 63%, of respondents reported being in their current capacity within the institution for more
than 5 years and 18% had been performing a similar role for 3 to 5 years, whilst about 13% indicated having
been in these positions for between 1 and 3 years, Figure 74. Only a very small proportion, 4%, had been in
the position for less than a year. This shows that most of the respondents were well placed to give input
about their experiences with the beneficiary.
8%
52%
0.3%3% 3%
35%
0%
10%
20%
30%
40%
50%
60%
CEO/ ExecutiveDirector/ Director
Manager (General,Admin, Other)
Financial Manager/Book Keeper, Payroll)
Human ResourcesManager/ Officer
Training/ Capacity DvtManager/ Facilitator
Other
91%
4%1%
4%
0%
10%
20%
30%
40%
50%
60%
70%
80%
90%
100%
Black (n = 316) Coloured (n = 14) Indian/Asian (n = 5) White (n = 14)
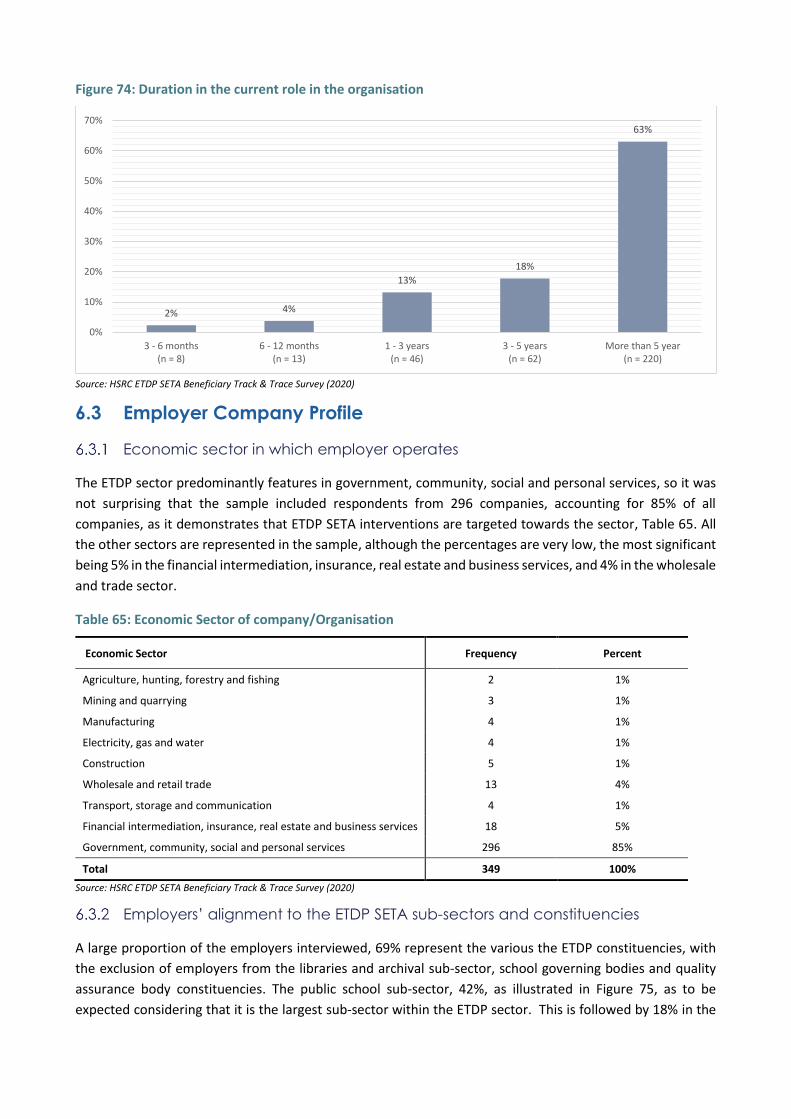
Figure 74: Duration in the current role in the organisation
Source: HSRC ETDP SETA Beneficiary Track & Trace Survey (2020)
6.3 Employer Company Profile
Economic sector in which employer operates
The ETDP sector predominantly features in government, community, social and personal services, so it was
not surprising that the sample included respondents from 296 companies, accounting for 85% of all
companies, as it demonstrates that ETDP SETA interventions are targeted towards the sector, Table 65. All
the other sectors are represented in the sample, although the percentages are very low, the most significant
being 5% in the financial intermediation, insurance, real estate and business services, and 4% in the wholesale
and trade sector.
Table 65: Economic Sector of company/Organisation
Economic Sector Frequency Percent
Agriculture, hunting, forestry and fishing 2 1%
Mining and quarrying 3 1%
Manufacturing 4 1%
Electricity, gas and water 4 1%
Construction 5 1%
Wholesale and retail trade 13 4%
Transport, storage and communication 4 1%
Financial intermediation, insurance, real estate and business services 18 5%
Government, community, social and personal services 296 85%
Total 349 100%
Source: HSRC ETDP SETA Beneficiary Track & Trace Survey (2020)
Employers’ alignment to the ETDP SETA sub-sectors and constituencies
A large proportion of the employers interviewed, 69% represent the various the ETDP constituencies, with
the exclusion of employers from the libraries and archival sub-sector, school governing bodies and quality
assurance body constituencies. The public school sub-sector, 42%, as illustrated in Figure 75, as to be
expected considering that it is the largest sub-sector within the ETDP sector. This is followed by 18% in the
2% 4%
13%
18%
63%
0%
10%
20%
30%
40%
50%
60%
70%
3 - 6 months(n = 8)
6 - 12 months(n = 13)
1 - 3 years(n = 46)
3 - 5 years(n = 62)
More than 5 year(n = 220)
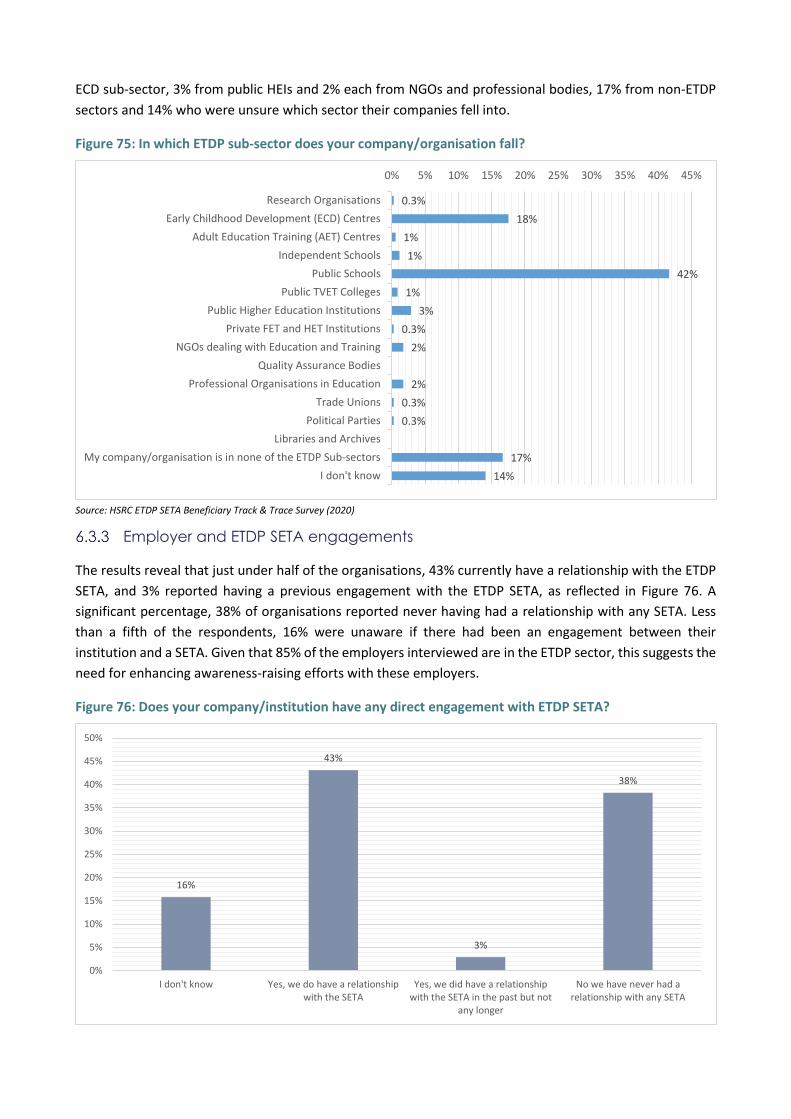
ECD sub-sector, 3% from public HEIs and 2% each from NGOs and professional bodies, 17% from non-ETDP
sectors and 14% who were unsure which sector their companies fell into.
Figure 75: In which ETDP sub-sector does your company/organisation fall?
Source: HSRC ETDP SETA Beneficiary Track & Trace Survey (2020)
Employer and ETDP SETA engagements
The results reveal that just under half of the organisations, 43% currently have a relationship with the ETDP
SETA, and 3% reported having a previous engagement with the ETDP SETA, as reflected in Figure 76. A
significant percentage, 38% of organisations reported never having had a relationship with any SETA. Less
than a fifth of the respondents, 16% were unaware if there had been an engagement between their
institution and a SETA. Given that 85% of the employers interviewed are in the ETDP sector, this suggests the
need for enhancing awareness-raising efforts with these employers.
Figure 76: Does your company/institution have any direct engagement with ETDP SETA?
0.3%
18%
1%
1%
42%
1%
3%
0.3%
2%
2%
0.3%
0.3%
17%
14%
0% 5% 10% 15% 20% 25% 30% 35% 40% 45%
Research Organisations
Early Childhood Development (ECD) Centres
Adult Education Training (AET) Centres
Independent Schools
Public Schools
Public TVET Colleges
Public Higher Education Institutions
Private FET and HET Institutions
NGOs dealing with Education and Training
Quality Assurance Bodies
Professional Organisations in Education
Trade Unions
Political Parties
Libraries and Archives
My company/organisation is in none of the ETDP Sub-sectors
I don't know
16%
43%
3%
38%
0%
5%
10%
15%
20%
25%
30%
35%
40%
45%
50%
I don't know Yes, we do have a relationshipwith the SETA
Yes, we did have a relationshipwith the SETA in the past but not
any longer
No we have never had arelationship with any SETA
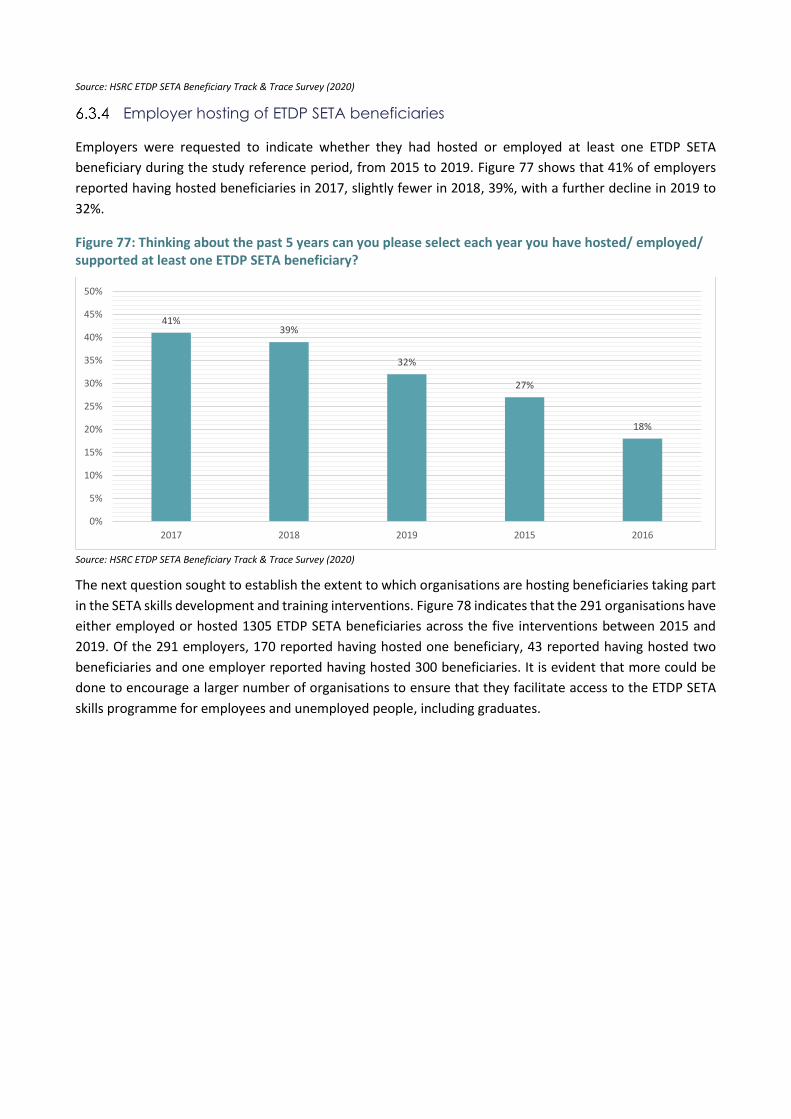
Source: HSRC ETDP SETA Beneficiary Track & Trace Survey (2020)
Employer hosting of ETDP SETA beneficiaries
Employers were requested to indicate whether they had hosted or employed at least one ETDP SETA
beneficiary during the study reference period, from 2015 to 2019. Figure 77 shows that 41% of employers
reported having hosted beneficiaries in 2017, slightly fewer in 2018, 39%, with a further decline in 2019 to
32%.
Figure 77: Thinking about the past 5 years can you please select each year you have hosted/ employed/ supported at least one ETDP SETA beneficiary?
Source: HSRC ETDP SETA Beneficiary Track & Trace Survey (2020)
The next question sought to establish the extent to which organisations are hosting beneficiaries taking part
in the SETA skills development and training interventions. Figure 78 indicates that the 291 organisations have
either employed or hosted 1305 ETDP SETA beneficiaries across the five interventions between 2015 and
2019. Of the 291 employers, 170 reported having hosted one beneficiary, 43 reported having hosted two
beneficiaries and one employer reported having hosted 300 beneficiaries. It is evident that more could be
done to encourage a larger number of organisations to ensure that they facilitate access to the ETDP SETA
skills programme for employees and unemployed people, including graduates.
41%39%
32%
27%
18%
0%
5%
10%
15%
20%
25%
30%
35%
40%
45%
50%
2017 2018 2019 2015 2016
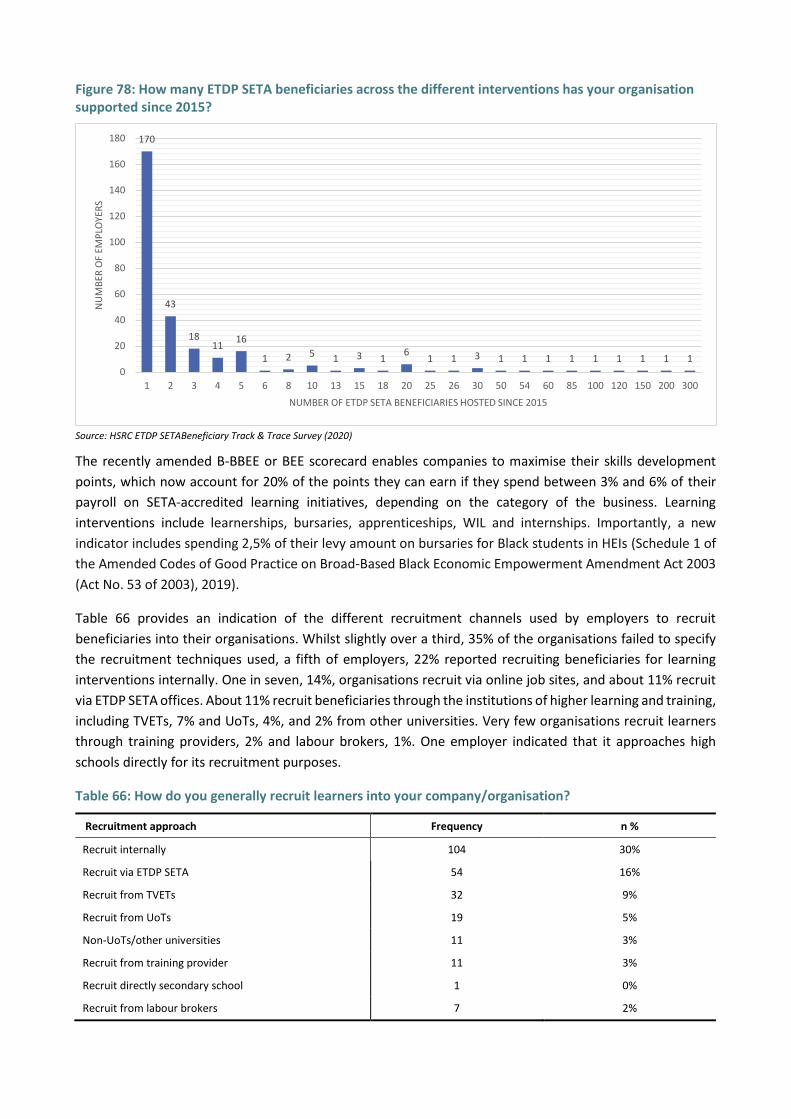
Figure 78: How many ETDP SETA beneficiaries across the different interventions has your organisation supported since 2015?
Source: HSRC ETDP SETABeneficiary Track & Trace Survey (2020)
The recently amended B-BBEE or BEE scorecard enables companies to maximise their skills development
points, which now account for 20% of the points they can earn if they spend between 3% and 6% of their
payroll on SETA-accredited learning initiatives, depending on the category of the business. Learning
interventions include learnerships, bursaries, apprenticeships, WIL and internships. Importantly, a new
indicator includes spending 2,5% of their levy amount on bursaries for Black students in HEIs (Schedule 1 of
the Amended Codes of Good Practice on Broad-Based Black Economic Empowerment Amendment Act 2003
(Act No. 53 of 2003), 2019).
Table 66 provides an indication of the different recruitment channels used by employers to recruit
beneficiaries into their organisations. Whilst slightly over a third, 35% of the organisations failed to specify
the recruitment techniques used, a fifth of employers, 22% reported recruiting beneficiaries for learning
interventions internally. One in seven, 14%, organisations recruit via online job sites, and about 11% recruit
via ETDP SETA offices. About 11% recruit beneficiaries through the institutions of higher learning and training,
including TVETs, 7% and UoTs, 4%, and 2% from other universities. Very few organisations recruit learners
through training providers, 2% and labour brokers, 1%. One employer indicated that it approaches high
schools directly for its recruitment purposes.
Table 66: How do you generally recruit learners into your company/organisation?
Recruitment approach Frequency n %
Recruit internally 104 30%
Recruit via ETDP SETA 54 16%
Recruit from TVETs 32 9%
Recruit from UoTs 19 5%
Non-UoTs/other universities 11 3%
Recruit from training provider 11 3%
Recruit directly secondary school 1 0%
Recruit from labour brokers 7 2%
170
43
1811
16
1 2 5 1 3 16
1 1 3 1 1 1 1 1 1 1 1 10
20
40
60
80
100
120
140
160
180
1 2 3 4 5 6 8 10 13 15 18 20 25 26 30 50 54 60 85 100 120 150 200 300
NU
MB
ER O
F EM
PLO
YER
S
NUMBER OF ETDP SETA BENEFICIARIES HOSTED SINCE 2015
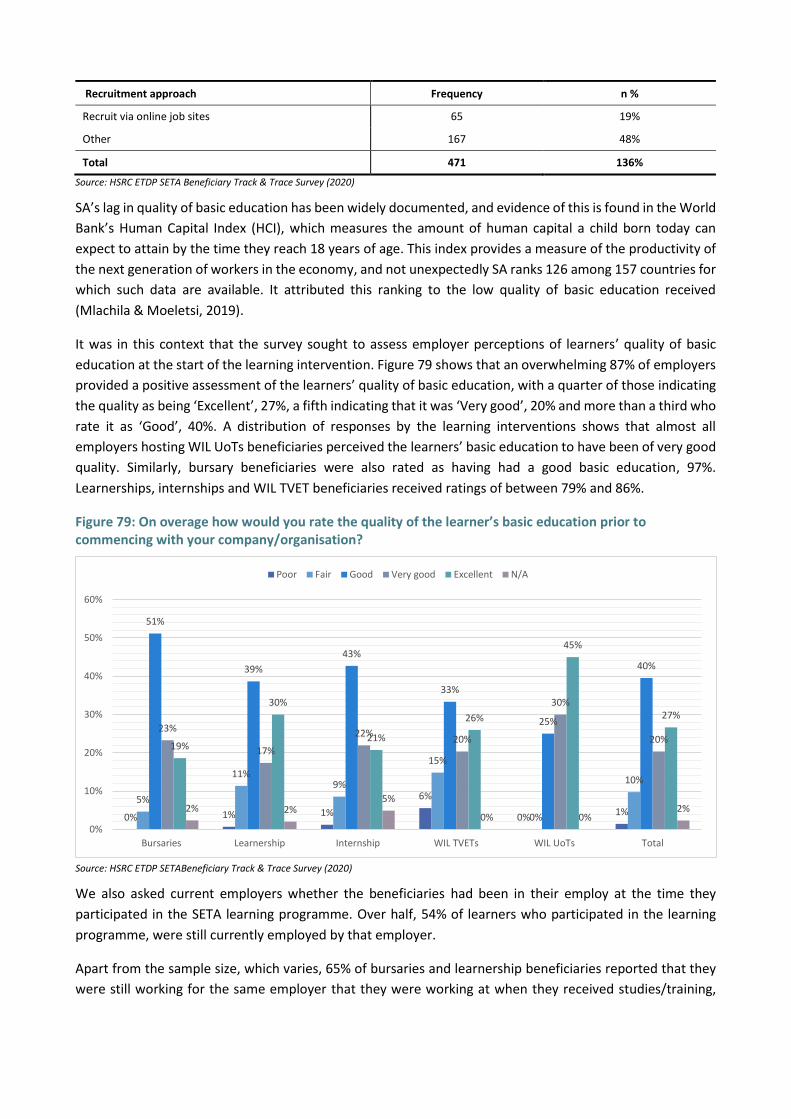
Recruitment approach Frequency n %
Recruit via online job sites 65 19%
Other 167 48%
Total 471 136%
Source: HSRC ETDP SETA Beneficiary Track & Trace Survey (2020)
SA’s lag in quality of basic education has been widely documented, and evidence of this is found in the World
Bank’s Human Capital Index (HCI), which measures the amount of human capital a child born today can
expect to attain by the time they reach 18 years of age. This index provides a measure of the productivity of
the next generation of workers in the economy, and not unexpectedly SA ranks 126 among 157 countries for
which such data are available. It attributed this ranking to the low quality of basic education received
(Mlachila & Moeletsi, 2019).
It was in this context that the survey sought to assess employer perceptions of learners’ quality of basic
education at the start of the learning intervention. Figure 79 shows that an overwhelming 87% of employers
provided a positive assessment of the learners’ quality of basic education, with a quarter of those indicating
the quality as being ‘Excellent’, 27%, a fifth indicating that it was ‘Very good’, 20% and more than a third who
rate it as ‘Good’, 40%. A distribution of responses by the learning interventions shows that almost all
employers hosting WIL UoTs beneficiaries perceived the learners’ basic education to have been of very good
quality. Similarly, bursary beneficiaries were also rated as having had a good basic education, 97%.
Learnerships, internships and WIL TVET beneficiaries received ratings of between 79% and 86%.
Figure 79: On overage how would you rate the quality of the learner’s basic education prior to commencing with your company/organisation?
Source: HSRC ETDP SETABeneficiary Track & Trace Survey (2020)
We also asked current employers whether the beneficiaries had been in their employ at the time they
participated in the SETA learning programme. Over half, 54% of learners who participated in the learning
programme, were still currently employed by that employer.
Apart from the sample size, which varies, 65% of bursaries and learnership beneficiaries reported that they
were still working for the same employer that they were working at when they received studies/training,
0% 1% 1%
6%
0%1%
5%
11%9%
15%
0%
10%
51%
39%
43%
33%
25%
40%
23%
17%
22%20%
30%
20%19%
30%
21%
26%
45%
27%
2% 2%5%
0% 0%2%
0%
10%
20%
30%
40%
50%
60%
Bursaries Learnership Internship WIL TVETs WIL UoTs Total
Poor Fair Good Very good Excellent N/A
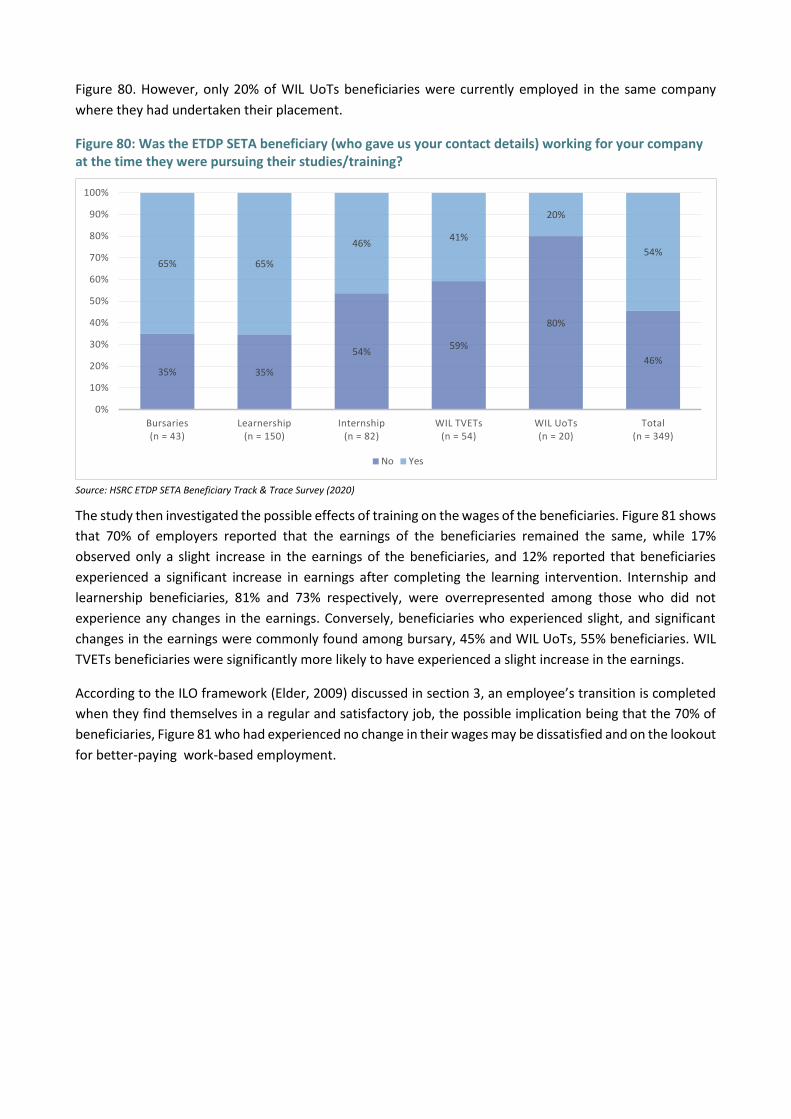
Figure 80. However, only 20% of WIL UoTs beneficiaries were currently employed in the same company
where they had undertaken their placement.
Figure 80: Was the ETDP SETA beneficiary (who gave us your contact details) working for your company at the time they were pursuing their studies/training?
Source: HSRC ETDP SETA Beneficiary Track & Trace Survey (2020)
The study then investigated the possible effects of training on the wages of the beneficiaries. Figure 81 shows
that 70% of employers reported that the earnings of the beneficiaries remained the same, while 17%
observed only a slight increase in the earnings of the beneficiaries, and 12% reported that beneficiaries
experienced a significant increase in earnings after completing the learning intervention. Internship and
learnership beneficiaries, 81% and 73% respectively, were overrepresented among those who did not
experience any changes in the earnings. Conversely, beneficiaries who experienced slight, and significant
changes in the earnings were commonly found among bursary, 45% and WIL UoTs, 55% beneficiaries. WIL
TVETs beneficiaries were significantly more likely to have experienced a slight increase in the earnings.
According to the ILO framework (Elder, 2009) discussed in section 3, an employee’s transition is completed
when they find themselves in a regular and satisfactory job, the possible implication being that the 70% of
beneficiaries, Figure 81 who had experienced no change in their wages may be dissatisfied and on the lookout
for better-paying work-based employment.
35% 35%
54%59%
80%
46%
65% 65%
46%41%
20%
54%
0%
10%
20%
30%
40%
50%
60%
70%
80%
90%
100%
Bursaries (n = 43)
Learnership (n = 150)
Internship (n = 82)
WIL TVETs (n = 54)
WIL UoTs (n = 20)
Total (n = 349)
No Yes
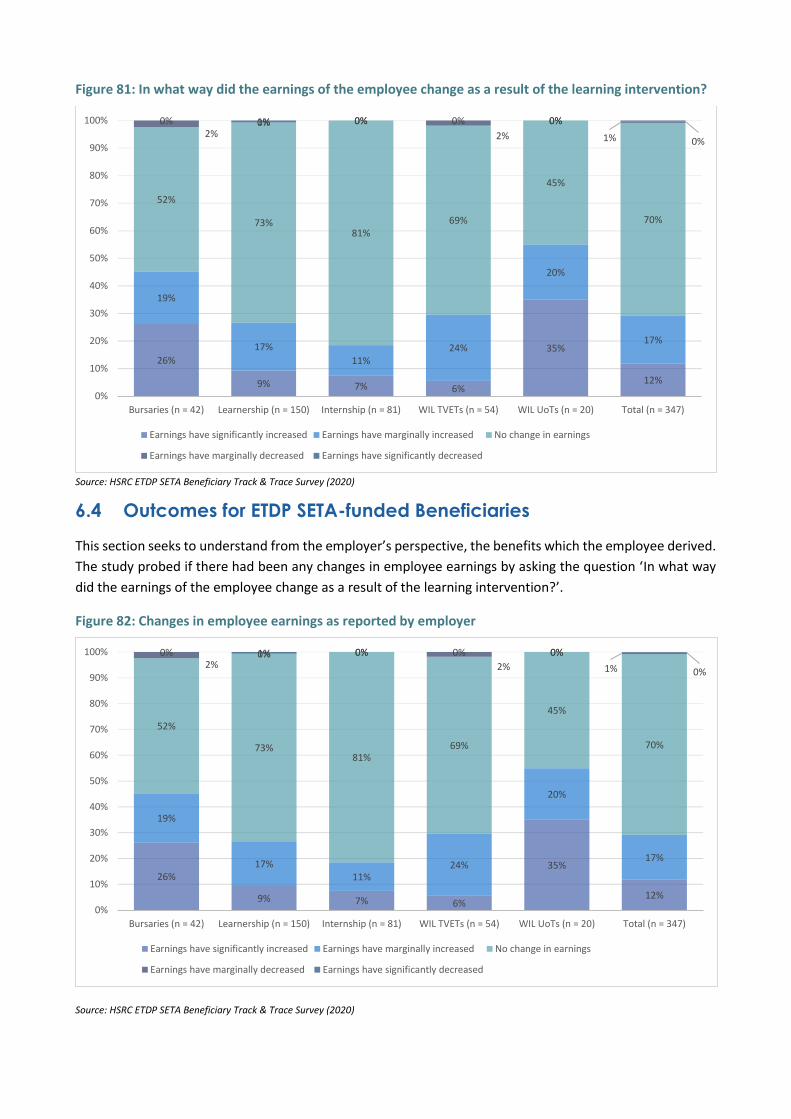
Figure 81: In what way did the earnings of the employee change as a result of the learning intervention?
Source: HSRC ETDP SETA Beneficiary Track & Trace Survey (2020)
6.4 Outcomes for ETDP SETA-funded Beneficiaries
This section seeks to understand from the employer’s perspective, the benefits which the employee derived.
The study probed if there had been any changes in employee earnings by asking the question ‘In what way
did the earnings of the employee change as a result of the learning intervention?’.
Figure 82: Changes in employee earnings as reported by employer
Source: HSRC ETDP SETA Beneficiary Track & Trace Survey (2020)
26%
9% 7% 6%
35%
12%
19%
17%
11%24%
20%
17%
52%
73%81%
69%
45%
70%
2%0% 0%
2%
0%
1%
0% 1% 0% 0% 0%
0%
0%
10%
20%
30%
40%
50%
60%
70%
80%
90%
100%
Bursaries (n = 42) Learnership (n = 150) Internship (n = 81) WIL TVETs (n = 54) WIL UoTs (n = 20) Total (n = 347)
Earnings have significantly increased Earnings have marginally increased No change in earnings
Earnings have marginally decreased Earnings have significantly decreased
26%
9% 7% 6%
35%
12%
19%
17%11%
24%
20%
17%
52%
73%81%
69%
45%
70%
2%0% 0%
2%
0%
1%
0% 1% 0% 0% 0%
0%
0%
10%
20%
30%
40%
50%
60%
70%
80%
90%
100%
Bursaries (n = 42) Learnership (n = 150) Internship (n = 81) WIL TVETs (n = 54) WIL UoTs (n = 20) Total (n = 347)
Earnings have significantly increased Earnings have marginally increased No change in earnings
Earnings have marginally decreased Earnings have significantly decreased
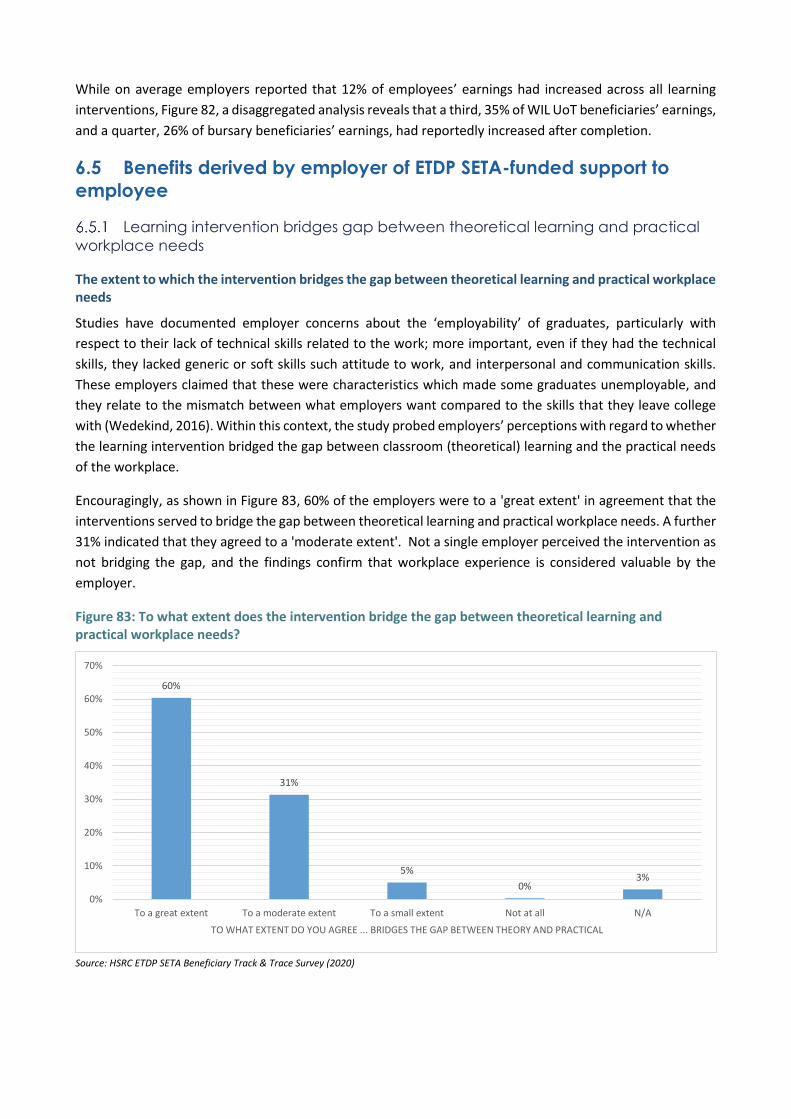
While on average employers reported that 12% of employees’ earnings had increased across all learning
interventions, Figure 82, a disaggregated analysis reveals that a third, 35% of WIL UoT beneficiaries’ earnings,
and a quarter, 26% of bursary beneficiaries’ earnings, had reportedly increased after completion.
6.5 Benefits derived by employer of ETDP SETA-funded support to
employee
Learning intervention bridges gap between theoretical learning and practical
workplace needs
The extent to which the intervention bridges the gap between theoretical learning and practical workplace needs
Studies have documented employer concerns about the ‘employability’ of graduates, particularly with
respect to their lack of technical skills related to the work; more important, even if they had the technical
skills, they lacked generic or soft skills such attitude to work, and interpersonal and communication skills.
These employers claimed that these were characteristics which made some graduates unemployable, and
they relate to the mismatch between what employers want compared to the skills that they leave college
with (Wedekind, 2016). Within this context, the study probed employers’ perceptions with regard to whether
the learning intervention bridged the gap between classroom (theoretical) learning and the practical needs
of the workplace.
Encouragingly, as shown in Figure 83, 60% of the employers were to a 'great extent' in agreement that the
interventions served to bridge the gap between theoretical learning and practical workplace needs. A further
31% indicated that they agreed to a 'moderate extent'. Not a single employer perceived the intervention as
not bridging the gap, and the findings confirm that workplace experience is considered valuable by the
employer.
Figure 83: To what extent does the intervention bridge the gap between theoretical learning and practical workplace needs?
Source: HSRC ETDP SETA Beneficiary Track & Trace Survey (2020)
60%
31%
5%
0%3%
0%
10%
20%
30%
40%
50%
60%
70%
To a great extent To a moderate extent To a small extent Not at all N/A
TO WHAT EXTENT DO YOU AGREE ... BRIDGES THE GAP BETWEEN THEORY AND PRACTICAL
Versatility of workers across the organisation
Understanding the nature of value that WBL had on ensuring greater employability of learners was probed
in a question to employers as to whether the learning intervention had contributed to the development of
multi-skilled workers able to work across the organisation. Six in every ten, 63% of the employers were in
great agreement that the learning intervention had made such a contribution, with a further 29% moderately
agreeing with this viewpoint. Only 1% was not in agreement. The ETDP SETA interventions are clearly
perceived by employers as being effective in successfully preparing learners to become part of a multi-skilled
and highly adaptable workforce.
Table 67: To what extent did the learning intervention create multi-skilled workers who can work across the organisation?
Extent of mulit-skilled workers Percent Frequency
To a great extent 63% 212
To a moderate extent 29% 97
To a small extent 5% 17
Not at all 1% 3
N/A 2% 8
Total 100% 337
Source: HSRC ETDP SETA Beneficiary Track & Trace Survey (2020)
High-quality employees
The employers were asked whether the SETA learning intervention had contributed to high-quality
employees; Table 68 shows that the majority agreed that it had, with 61% indicating that it had done so to a
great extent and 30% to a moderate extent. This finding further confirms that the majority of employers
acknowledged the benefits of the SETA-funded learning initiative. This is supported in the literature, with
employers endorsing WBL as being promising in respect of skilling and preparing employees for success in
the workplace (Rodriguez et al., 2016).
Table 68: To what extent did the learning intervention provide employers with high-quality employees?
Extent of quality employees Percent Frequency
To a great extent 61% 204
To a moderate extent 30% 100
To a small extent 5% 17
Not at all 1% 3
N/A 3% 10
Total 100% 334
Source: HSRC ETDP SETA Beneficiary Track & Trace Survey (2020)
Employee efficiency on the job
Employers were asked to indicate their level of agreement with the statement ‘Employees who have gone
through the learning interventions were more efficient at doing their job compared to those who received
no training’. There was overwhelming agreement by employers, with 57% noting this to a great extent and
32% to a moderate extent, Figure 84. This suggests that employers generally appreciate the skills and
competencies imparted through the learning interventions and perceived those who have participated in the
programmes as much more efficient in their work.
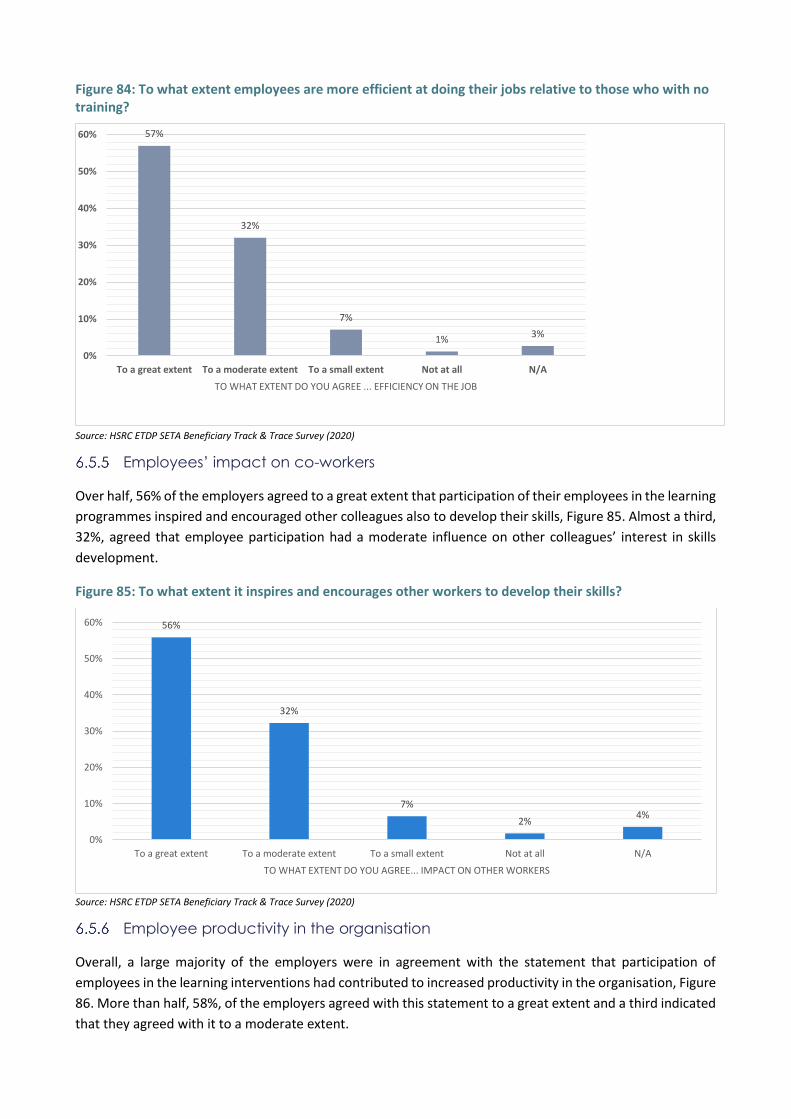
Figure 84: To what extent employees are more efficient at doing their jobs relative to those who with no training?
Source: HSRC ETDP SETA Beneficiary Track & Trace Survey (2020)
Employees’ impact on co-workers
Over half, 56% of the employers agreed to a great extent that participation of their employees in the learning
programmes inspired and encouraged other colleagues also to develop their skills, Figure 85. Almost a third,
32%, agreed that employee participation had a moderate influence on other colleagues’ interest in skills
development.
Figure 85: To what extent it inspires and encourages other workers to develop their skills?
Source: HSRC ETDP SETA Beneficiary Track & Trace Survey (2020)
Employee productivity in the organisation
Overall, a large majority of the employers were in agreement with the statement that participation of
employees in the learning interventions had contributed to increased productivity in the organisation, Figure
86. More than half, 58%, of the employers agreed with this statement to a great extent and a third indicated
that they agreed with it to a moderate extent.
57%
32%
7%
1%3%
0%
10%
20%
30%
40%
50%
60%
To a great extent To a moderate extent To a small extent Not at all N/A
TO WHAT EXTENT DO YOU AGREE ... EFFICIENCY ON THE JOB
56%
32%
7%
2%4%
0%
10%
20%
30%
40%
50%
60%
To a great extent To a moderate extent To a small extent Not at all N/A
TO WHAT EXTENT DO YOU AGREE... IMPACT ON OTHER WORKERS
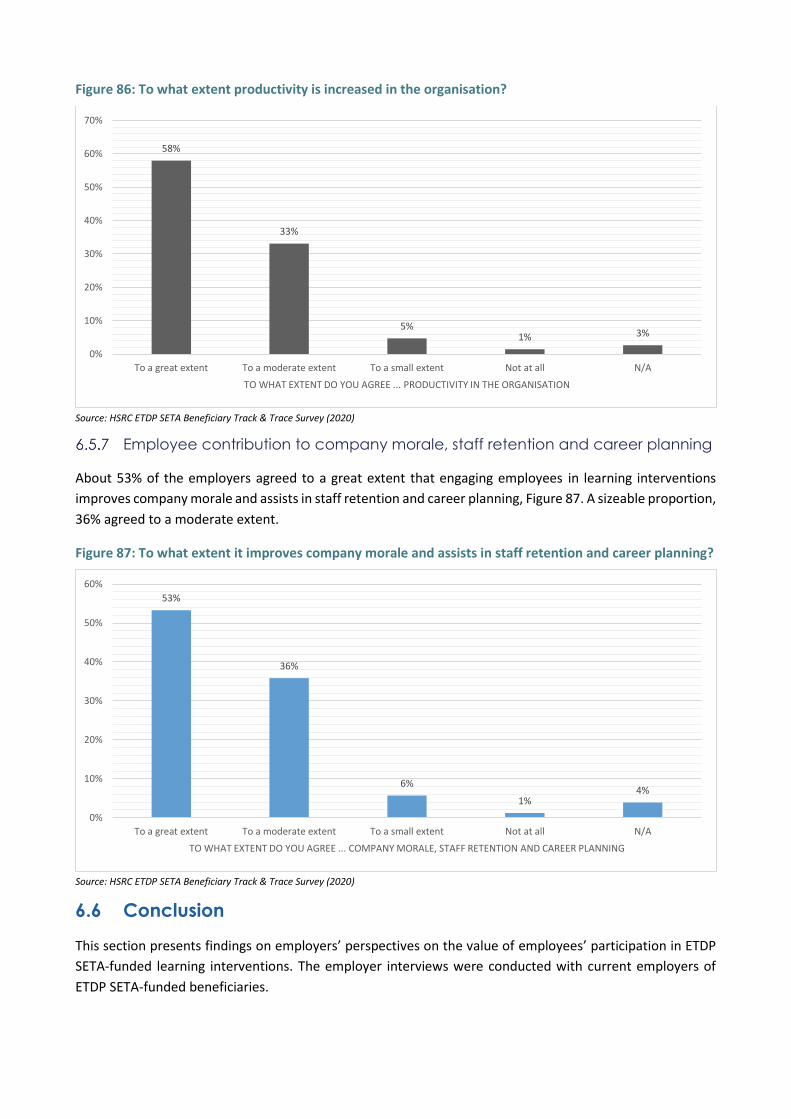
Figure 86: To what extent productivity is increased in the organisation?
Source: HSRC ETDP SETA Beneficiary Track & Trace Survey (2020)
Employee contribution to company morale, staff retention and career planning
About 53% of the employers agreed to a great extent that engaging employees in learning interventions
improves company morale and assists in staff retention and career planning, Figure 87. A sizeable proportion,
36% agreed to a moderate extent.
Figure 87: To what extent it improves company morale and assists in staff retention and career planning?
Source: HSRC ETDP SETA Beneficiary Track & Trace Survey (2020)
6.6 Conclusion
This section presents findings on employers’ perspectives on the value of employees’ participation in ETDP
SETA-funded learning interventions. The employer interviews were conducted with current employers of
ETDP SETA-funded beneficiaries.
58%
33%
5%1% 3%
0%
10%
20%
30%
40%
50%
60%
70%
To a great extent To a moderate extent To a small extent Not at all N/A
TO WHAT EXTENT DO YOU AGREE ... PRODUCTIVITY IN THE ORGANISATION
53%
36%
6%
1%4%
0%
10%
20%
30%
40%
50%
60%
To a great extent To a moderate extent To a small extent Not at all N/A
TO WHAT EXTENT DO YOU AGREE ... COMPANY MORALE, STAFF RETENTION AND CAREER PLANNING

The implementation of skills and development programmes by the ETDP SETA is aimed at matching
participants to the job market, significantly avoiding the skills mismatch crisis. According to Figure 75, 53%
of the sample are employed in the same industry aligned to their learning intervention, and importantly the
results confirm that the interventions address sector needs, with 85% of the employers found in the
government, community, social and personal services sector in which the ETDP sector predominantly
features. Table 47 provides evidence of the sector alignment of employers to the ETDP SETA, including
schools, TVET colleges, ECD centres, CETS and public HEIs, by improving capacity of teachers, practitioners,
lectures and administrators in ECD, schools, TVET colleges CETSCs, and universities. Most of the employers
interviewed were operating in the ETDP SETA sub-sectors, 69%. The 291 employers interviewed were
currently hosting 1305 ETDP SETA beneficiaries. While most of the employers, 170 had hosted one ETDP SETA
beneficiary, 43 employers had hosted two ETDP SETA-funded employees and, incredibly, one employer
reported having hosted 300 ETDP SETA beneficiaries across the study reference period.
These employers had hosted learners across all five learning interventions who are thus broadly
representative of the ETDP SETA-funded learners, although there were fewer employer respondents for WIL
UoTs, 6% compared with the other learning interventions. The employers were also distributed across the
study reference period, with more respondents having hosted a learner who had completed their learning
intervention during the 2017/18 financial year.
Employers are positive about the value of the learning interventions on the learners and benefits that the
companies derived. The majority of the employers, 91% highlighted that the learning interventions had
served to bridge the gap between theoretical learning and practical workplace needs, with 60% of the
employers in agreement that this was so to a 'great extent' and 31% who agreed that it had achieved this to
a 'moderate extent'.
Nearly all employers agreed that the learning intervention had contributed to the development of multi-
skilled workers able to work across the organisation, with 63% confirming that this was to great extent, with
a further 29% moderately agreeing with this viewpoint.
It was evident that most employers appreciate the skills and competencies imparted through the learning
interventions and perceived those who have participated in the programmes as much more efficient in their
work. More than half of the employers, 57% greatly agreed that these “employees were more efficient at
doing their job compared to those who received no training”, with a further 32% confirming this to a
moderate extent.
Agreement was also high among employers that these employees were inspiring and provided
encouragement to other colleagues to develop their skills, with 56% in agreement to a great extent, and 32%
who indicated it had moderate influence on colleagues’ interest in skills development. This they believed
contributed to improving company morale.
A large majority of the employers concurred that employee participation in the learning interventions had
contributed to increased productivity in the organisation, with 58% who agreed with this statement to a
great extent and a third who agreed with it to a moderate extent.
Overall, a large majority of the employers were in agreement with the statement that participation of
employees in the learning interventions had contributed to increased productivity in the organisation,
section 6.5.6. More than half, 58%, of the employers agreed with this statement to a great extent and a third
indicated that they agreed with it to a moderate extent. They all confirmed that the learning interventions
had assisted with staff retention and employee career planning.
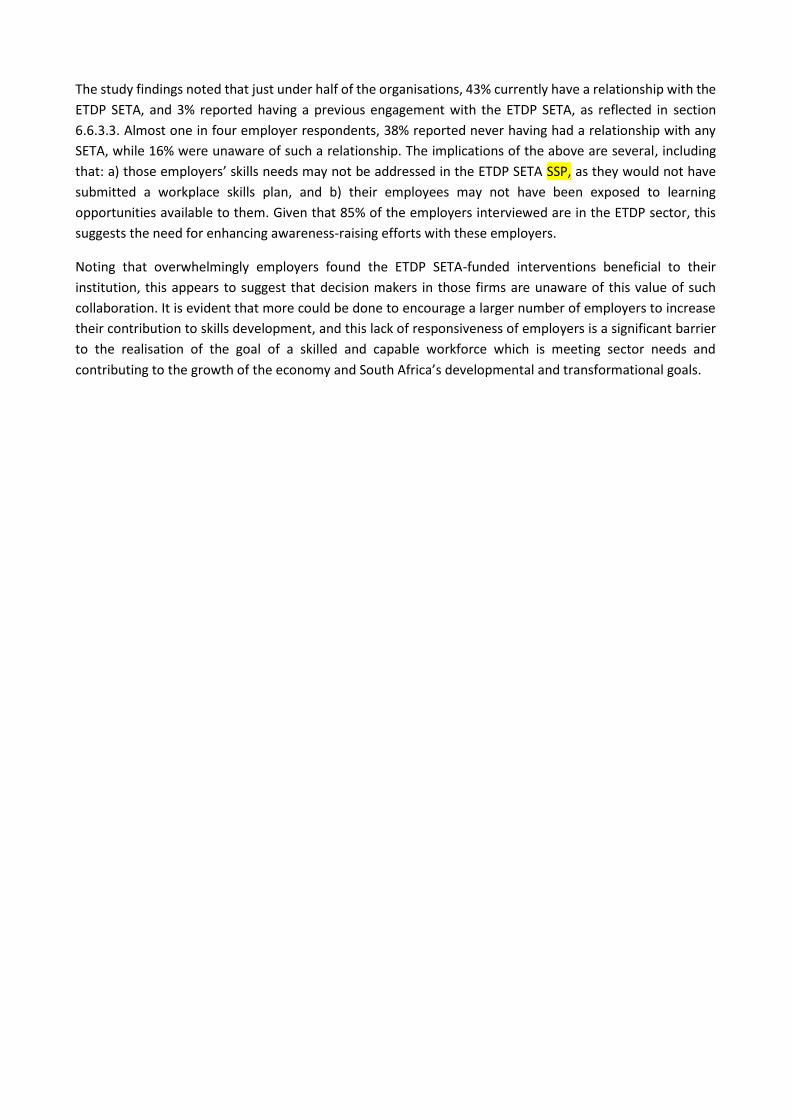
The study findings noted that just under half of the organisations, 43% currently have a relationship with the
ETDP SETA, and 3% reported having a previous engagement with the ETDP SETA, as reflected in section
6.6.3.3. Almost one in four employer respondents, 38% reported never having had a relationship with any
SETA, while 16% were unaware of such a relationship. The implications of the above are several, including
that: a) those employers’ skills needs may not be addressed in the ETDP SETA SSP, as they would not have
submitted a workplace skills plan, and b) their employees may not have been exposed to learning
opportunities available to them. Given that 85% of the employers interviewed are in the ETDP sector, this
suggests the need for enhancing awareness-raising efforts with these employers.
Noting that overwhelmingly employers found the ETDP SETA-funded interventions beneficial to their
institution, this appears to suggest that decision makers in those firms are unaware of this value of such
collaboration. It is evident that more could be done to encourage a larger number of employers to increase
their contribution to skills development, and this lack of responsiveness of employers is a significant barrier
to the realisation of the goal of a skilled and capable workforce which is meeting sector needs and
contributing to the growth of the economy and South Africa’s developmental and transformational goals.
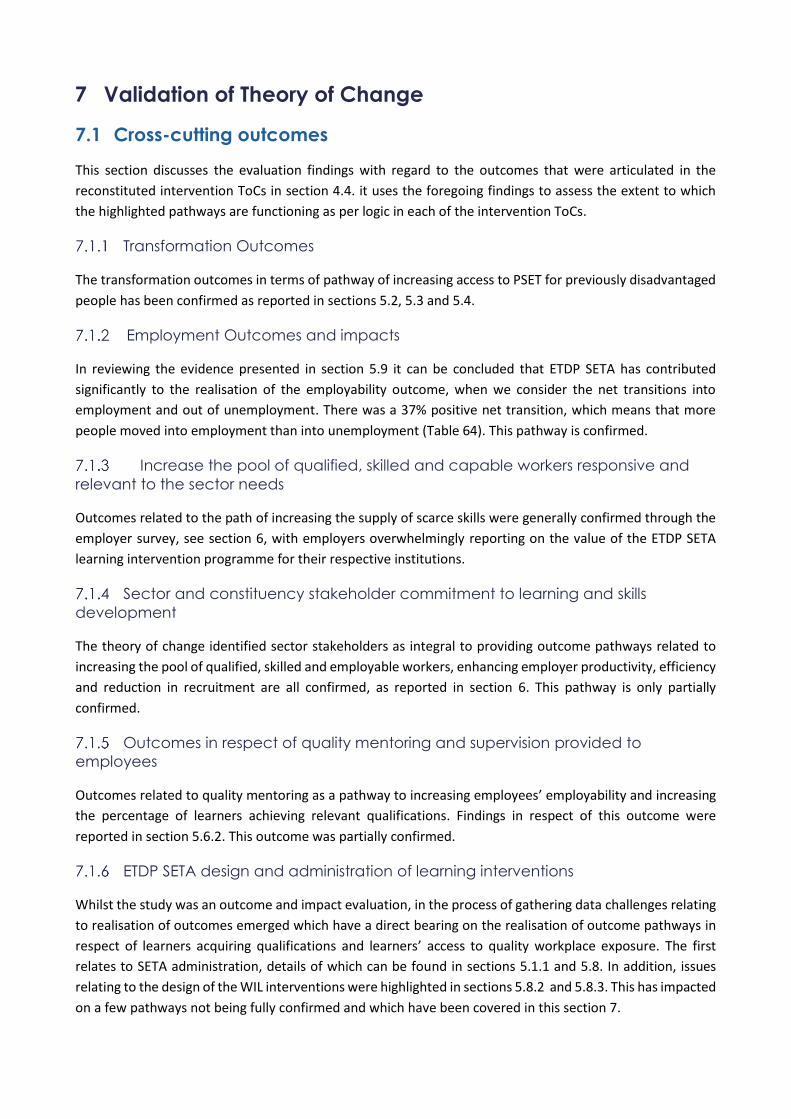
7 Validation of Theory of Change
7.1 Cross-cutting outcomes
This section discusses the evaluation findings with regard to the outcomes that were articulated in the
reconstituted intervention ToCs in section 4.4. it uses the foregoing findings to assess the extent to which
the highlighted pathways are functioning as per logic in each of the intervention ToCs.
Transformation Outcomes
The transformation outcomes in terms of pathway of increasing access to PSET for previously disadvantaged
people has been confirmed as reported in sections 5.2, 5.3 and 5.4.
Employment Outcomes and impacts
In reviewing the evidence presented in section 5.9 it can be concluded that ETDP SETA has contributed
significantly to the realisation of the employability outcome, when we consider the net transitions into
employment and out of unemployment. There was a 37% positive net transition, which means that more
people moved into employment than into unemployment (Table 64). This pathway is confirmed.
Increase the pool of qualified, skilled and capable workers responsive and
relevant to the sector needs
Outcomes related to the path of increasing the supply of scarce skills were generally confirmed through the
employer survey, see section 6, with employers overwhelmingly reporting on the value of the ETDP SETA
learning intervention programme for their respective institutions.
Sector and constituency stakeholder commitment to learning and skills
development
The theory of change identified sector stakeholders as integral to providing outcome pathways related to
increasing the pool of qualified, skilled and employable workers, enhancing employer productivity, efficiency
and reduction in recruitment are all confirmed, as reported in section 6. This pathway is only partially
confirmed.
Outcomes in respect of quality mentoring and supervision provided to
employees
Outcomes related to quality mentoring as a pathway to increasing employees’ employability and increasing
the percentage of learners achieving relevant qualifications. Findings in respect of this outcome were
reported in section 5.6.2. This outcome was partially confirmed.
ETDP SETA design and administration of learning interventions
Whilst the study was an outcome and impact evaluation, in the process of gathering data challenges relating
to realisation of outcomes emerged which have a direct bearing on the realisation of outcome pathways in
respect of learners acquiring qualifications and learners’ access to quality workplace exposure. The first
relates to SETA administration, details of which can be found in sections 5.1.1 and 5.8. In addition, issues
relating to the design of the WIL interventions were highlighted in sections 5.8.2 and 5.8.3. This has impacted
on a few pathways not being fully confirmed and which have been covered in this section 7.
Outcomes with regard to transition durations
Overall, when we consider the net transitions into employment and out of unemployment, there was a
positive net transition, which means that more people moved into employment than into unemployment, as
reported in section 5.9. This pathway is confirmed in respect of short transitions for those previously
employed and those who have acquired higher-level qualifications such as those offered by universities and
UoTs. However, the findings suggest longer transitions for those who had no prior post-schooling education
and whose qualification is a diploma or certificate, particularly those offered by TVETs.
7.2 Specific Learning Intervention Outcomes
ToC outcomes with regard to Bursaries
Bursaries have three pathways (see section 4.4.1), with outcomes related to the path on increasing the supply
of scarce skills generally confirmed through the employer survey, see section 6. Outcomes related to
increasing the proportion of those from previously disadvantaged backgrounds were noted in section 5.3.4
in respect of gender and youth, section 5.4 in respect of socio-economic background, and section 5.2 in
respect of spatial distribution of bursary recipients, and this path was partially achieved. Outcomes related
to stakeholder willingness to participate in supporting skills development are reported in section 7.1.4, with
this path also not fully realised.
Pathway confirmation: No changes are proposed in respect of the pathways as articulated in the Bursary
ToC.
ToC outcomes with respect to Learnerships
Learnerships have four pathways, as illustrated in section 4.4.2 based on the stated objectives of the
intervention. The employer evaluation outcomes as reported in section 6 corroborated that ETDP SETA
beneficiaries have increased occupational or applied knowledge, and beneficiaries having access to
accredited training which contributes to addressing scarce skills are both confirmed. The path in respect of
certification was partially confirmed as reported in section 5.1.1. Outcomes in respect of access of learners
to quality mentoring are reported in 5.6.2 and further assessed in section 7.1.5, confirming that this path was
not fully realised.
Pathway confirmation: Consolidation of pathway 2 and 4 is proposed in respect of the Learnership ToC with
the new path being 2: ‘Employers provide quality training to learners delivered through capable training
providers.’ Introduce new pathway 4: ‘Effective targeting of beneficiaries from previously disadvantaged
backgrounds.’
ToC outcomes with regard to Internships
Internships have four key pathways (section 4.4.3), with outcomes relevant to the stated objectives of the
intervention. Outcomes relating to employers willing to host interns, namely enhanced occupational or
applied competencies, are confirmed as reported in section 6. Outcomes relating to qualified mentors and
being knowledgeable about the sector are reported in section 7.1.5 contributing towards improving
employability of workers is partially confirmed for both these pathways. Outcomes in respect of stakeholder
participation are addressed in section 7.1.4, with neither of paths fully realised.
Pathway confirmation: Consolidation of pathway 2 and 3 towards a new pathway 1: ‘Qualified mentors
available and quality career guidance provided to learners.’ Introduce new pathway 3: ‘Effective targeting of
beneficiaries from previously disadvantaged backgrounds.’ Amend pathway 4: ‘Strategic partnerships
contribute to a functioning skills ecosystem.’
ToC outcomes with regard to WIL for TVETs
WIL TVETs have three pathways based on the stated objectives of the intervention, as illustrated in section
4.4.4. Outcomes related to employer willingness to host learners as it relates to increased employee
workplace exposure is reported in section 7.1.4, with this path partially realised. The employer evaluation
outcomes as reported in section 6 in respect of beneficiaries having the requisite occupational knowledge
and increased sector-specific skills and thus increased employability is confirmed. Outcomes relevant to
beneficiary access to mentoring is reported in section 7.1.5, with this outcome also partially achieved.
Pathway confirmation: Consolidate pathways 2 and 3 into a new pathway 2: ‘Training and mentoring is
relevant and addresses scarce skills and employability of workers.’ Introduce new pathway 3: ‘Effective
targeting of beneficiaries from previously disadvantaged backgrounds.’ Introduce a new pathway 4:
‘Strategic partnerships contribute to a functioning skills ecosystem.’
ToC outcomes with regard to WIL for UoTs
WiL UoTs identified three pathways as articulated in section 4.4.5. Outcomes related to employer willingness
to host learners, including increased percentage of learners with workplace exposure, is reported in section
7.1.4 with this path partially confirmed. The outcomes relevant to the path on increasing the supply of scarce
skills were generally confirmed through the employer survey, see section 6. Outcomes relevant to beneficiary
access to mentoring are reported in section 7.1.5, with this outcome also partially achieved.
Pathway confirmation: Consolidate pathways 2 and 3 into a new pathway 2: ‘Training and mentoring is
relevant and addresses scarce skills and employability of workers.’ Introduce new pathway 3: ‘Effective
targeting of beneficiaries from previously disadvantaged backgrounds.’ Introduce a new pathway 4:
‘Strategic partnerships contribute to a functioning skills ecosystem.’
ToC outcomes with regard to Employers
The Employers ToC identified five pathways based on the stated objectives of the intervention (refer to
4.4.6). Outcomes related to the path of increased productivity are reported in section 6, and the outcomes
related to reduction in scarce and critical skills are reported in section 7.1.3 of the employer survey with this
path confirmed. Outcomes relevant to increasing employers’ capabilities are confirmed in section 6, while
outcomes relevant to capable mentoring are reported in 7.1.5 with this path being partially confirmed.
Employers’ responsiveness to incentives, as evidenced in the pathway in respect of increased employer
efficiency (reduced costs) and reduction in recruitment costs, was confirmed in section 6. However, the
pathway in respect of increased uptake of learners by employers as reported in the same section is partially
confirmed. Ownership of skills planning by employers is similarly reported in section 6 and this path is
partially confirmed.
Pathway confirmation: Merge pathways 1 and 4 as articulated in pathway 4: ‘Prospective employers well
targeted and willing to host learners.’
7.3 Embedding the Theory of Change in ETDP SETA
The application of a ToC approach in an institution has to be addressed through firstly creating understanding
of the concept and awareness of its value, the objective being to engender a culture of appreciation and
value of ToCs and their integration into the institution. Their value will only be realised if they are
institutionalised across all streams of work and by all stakeholders, from the conceptual design phase to
implementation, administration, monitoring and evaluation and strategic decision makers.
Three important factors must be borne in mind: firstly, that ToCs are dynamic and therefore need to be
reviewed and revised at appropriate intervals when the need arises. Secondly, and more important, the
development and revisioning of the ToCs must include stakeholders across the board, both internal and
external. This is important especially in defining the appropriate pathways and unpacking the assumptions
underlying these pathways. Thirdly, revisions must be based on evidence. The process of reconstructing
these ToCs included mainly management of the ETDP SETA, and it is suggested that in revisiting the ToCs a
broader cross-section of stakeholders is included, particularly those directly involved in implementation, and
also external stakeholders including HEIs and sector and constituency stakeholders.
8 Conclusions and Recommendations
This final section presents the conclusions of the study by briefly summarising the activities implemented,
and the key outcomes arising from the study, and then closes with recommendations for moving forward.
The overarching objective of the study commissioned by the ETDP SETA was to “understand, explore and
document key features, trends, challenges and outcomes of the aforementioned skills interventions in the
ETDP sectors”. A secondary objective was to explore employers’ perceptions of the value of these learning
interventions.
8.1 Summary of Activities
The study incorporated several different research methodologies towards gathering evidence in response to
the study objectives. An extensive desktop review of ETDP SETA documentation and a review of published
and grey material formed the basis for the development of a conceptual and analytical framework for the
study. This was followed by a participatory process of reconstructing ToCs and results log-frames in respect
of bursary, learnerships, internships, WIL TVETs and WIL UoTs learning Interventions. Primary research was
conducted with beneficiaries of the five learning interventions and with the employers of currently employed
beneficiaries. Secondary data analysis included a literature review of evidence to contextualise our
understanding of the research findings and deliver insight into emerging trends impacting the ETDP sector.
The study generated several research documents/research reports, a number of which have been utilised
during the study and in the preparation of this report. These reports are listed below:
1. Inception Report;
2. A Literature Review Report;
3. Five Theory of Change and Results Log-Frame Reports in respect of the learning interventions
mentioned above;
4. ETDP SETA Track and Trace Fieldwork Report;
5. Final Track and Trace Evaluation Report.
This report serves to provide insights for ETDP SETA decision makers and implementers into the
achievements and challenges, in order to assist them in determining how the learning interventions can be
improved on in future and to enhance their sustainability. The findings presented in the section that follows
are triangulated from various data sources, including primary and secondary data gathering.
8.2 Key Research Findings
The research findings are presented in relation to the broad objectives of the study. Presenting the findings
in this manner addresses the key research questions articulated in section 1.3. The key findings report
evidence in respect of the following indicators: employment status of the beneficiaries (employed, self-
employed and unemployed); employment rates; nature of employment (access to benefits); key
achievements and challenges; the wider socioeconomic effects of the interventions on the beneficiaries;
career progression for beneficiaries; and employer perceptions of the value of learning interventions
(employable people; increased productivity of the company).
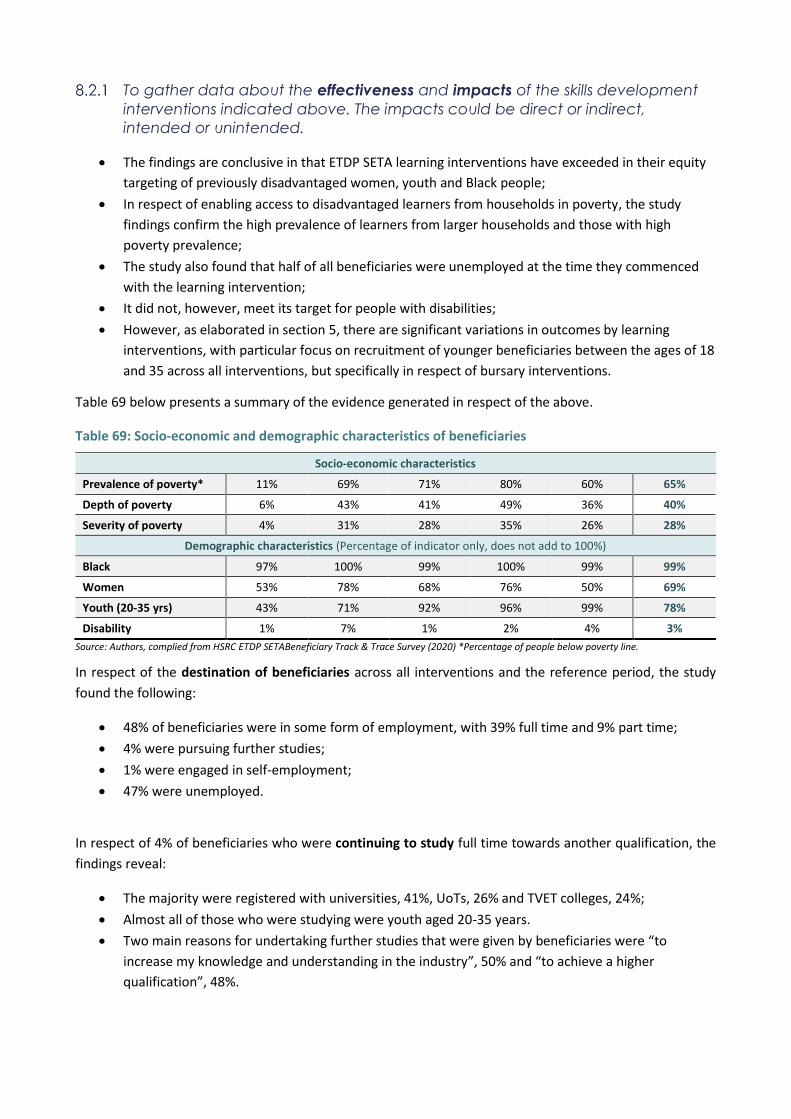
To gather data about the effectiveness and impacts of the skills development
interventions indicated above. The impacts could be direct or indirect,
intended or unintended.
The findings are conclusive in that ETDP SETA learning interventions have exceeded in their equity
targeting of previously disadvantaged women, youth and Black people;
In respect of enabling access to disadvantaged learners from households in poverty, the study
findings confirm the high prevalence of learners from larger households and those with high
poverty prevalence;
The study also found that half of all beneficiaries were unemployed at the time they commenced
with the learning intervention;
It did not, however, meet its target for people with disabilities;
However, as elaborated in section 5, there are significant variations in outcomes by learning
interventions, with particular focus on recruitment of younger beneficiaries between the ages of 18
and 35 across all interventions, but specifically in respect of bursary interventions.
Table 69 below presents a summary of the evidence generated in respect of the above.
Table 69: Socio-economic and demographic characteristics of beneficiaries
Socio-economic characteristics
Prevalence of poverty* 11% 69% 71% 80% 60% 65%
Depth of poverty 6% 43% 41% 49% 36% 40%
Severity of poverty 4% 31% 28% 35% 26% 28%
Demographic characteristics (Percentage of indicator only, does not add to 100%)
Black 97% 100% 99% 100% 99% 99%
Women 53% 78% 68% 76% 50% 69%
Youth (20-35 yrs) 43% 71% 92% 96% 99% 78%
Disability 1% 7% 1% 2% 4% 3%
Source: Authors, complied from HSRC ETDP SETABeneficiary Track & Trace Survey (2020) *Percentage of people below poverty line.
In respect of the destination of beneficiaries across all interventions and the reference period, the study
found the following:
48% of beneficiaries were in some form of employment, with 39% full time and 9% part time;
4% were pursuing further studies;
1% were engaged in self-employment;
47% were unemployed.
In respect of 4% of beneficiaries who were continuing to study full time towards another qualification, the
findings reveal:
The majority were registered with universities, 41%, UoTs, 26% and TVET colleges, 24%;
Almost all of those who were studying were youth aged 20-35 years.
Two main reasons for undertaking further studies that were given by beneficiaries were “to
increase my knowledge and understanding in the industry”, 50% and “to achieve a higher
qualification”, 48%.
Of the 47% of unemployed beneficiaries, the study found:
57% had been without work for a year or more;
Encouragingly, the study found that 95% of the unemployed were actively looking for work.
The main reason given by 44% of the unemployed in respect of their unemployed status was the lack
of available jobs in the labour market.
In order for us to establish the presence of reservation wage dynamics in this population, we
explored potential attitudes of beneficiaries towards work, and noted that only 3% had ever declined
a job offer.
To understand the wider effects of these interventions – social, economic and
technical – on individual beneficiaries.
The study provides evidence that beneficiaries have gained a range of skills, with more than half,
54% indicating that the training received was highly relevant to the work they were doing.
All beneficiaries who had secured employment on a full-time basis reported earnings ranging from
the lowest at R6,000 (slightly less than double the minimum wage) to R 29,000 per month.
All reported qualitatively on wellbeing impacts personally and on their households from access to
an income;
Self-esteem and career mobility were also reported by beneficiaries as key outcomes of
participation in the learning interventions. This was supported by most beneficiaries, including
those who were unemployed.
To generate evidence of key achievements and challenges to inform the
decision-making process for senior management and accounting authority on
programme delivery mechanisms, and how these can be improved in future to
ensure sustainability.
Achievements
As postulated in the literature review in section 3, the SETA’s role is to promote the employability of
beneficiaries and not necessarily directly their employment. The labour market transition analysis presented
in section 5.9 allows for it to be concluded that:
ETDP SETA has contributed significantly to the realisation of the employability outcome. When we
consider the net transitions into employment and out of unemployment, there was a 37% positive
net transition, which means that more people moved into employment than into unemployment,
as illustrated in Table 64.
Barring the influence of external factors such as the performance of the economy, one can
conclude that ETDP SETA’s learning interventions appear to be making some contribution in
facilitating the postulated transitions as per intervention ToCs.
Challenges
Administrative challenges were reported by a quarter of all beneficiaries, 27% in terms of not
receiving their certificates after completion;
About 10% of WIL beneficiaries raised concerns about aspects of the design of these learning
interventions, including insufficient resources, poor match with their placement and poor quality or
non-existent mentoring provided by the employer.
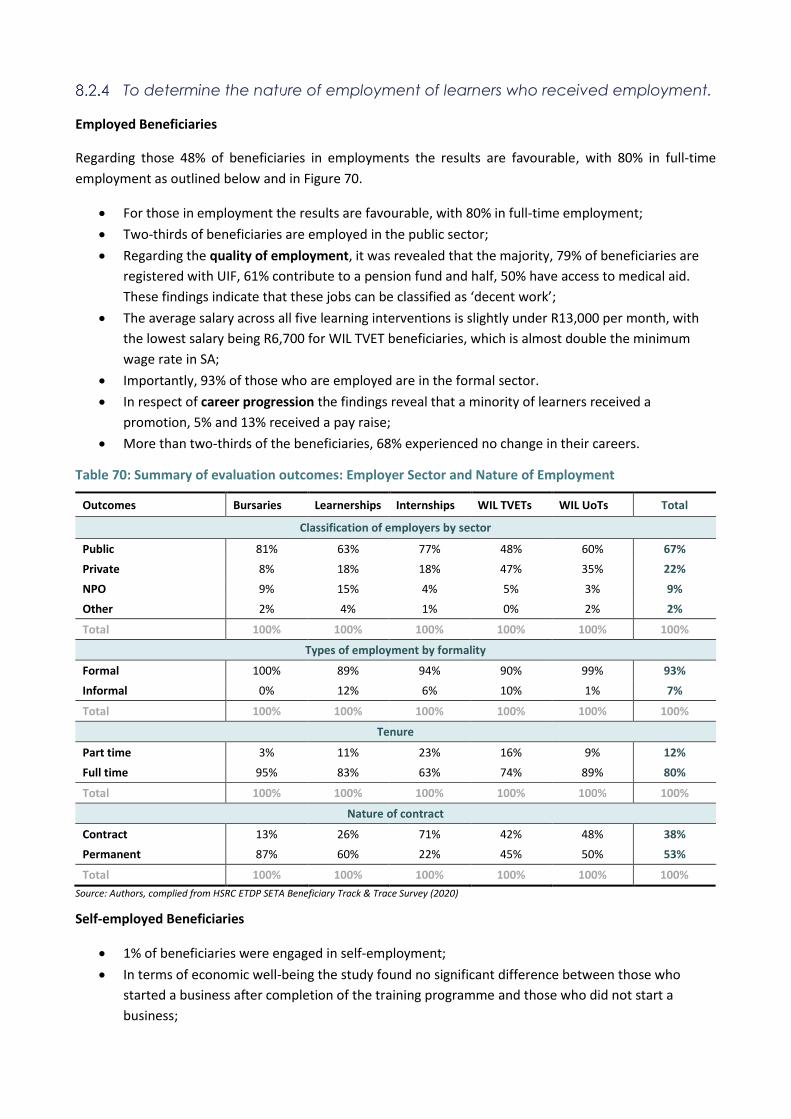
To determine the nature of employment of learners who received employment.
Employed Beneficiaries
Regarding those 48% of beneficiaries in employments the results are favourable, with 80% in full-time
employment as outlined below and in Figure 70.
For those in employment the results are favourable, with 80% in full-time employment;
Two-thirds of beneficiaries are employed in the public sector;
Regarding the quality of employment, it was revealed that the majority, 79% of beneficiaries are
registered with UIF, 61% contribute to a pension fund and half, 50% have access to medical aid.
These findings indicate that these jobs can be classified as ‘decent work’;
The average salary across all five learning interventions is slightly under R13,000 per month, with
the lowest salary being R6,700 for WIL TVET beneficiaries, which is almost double the minimum
wage rate in SA;
Importantly, 93% of those who are employed are in the formal sector.
In respect of career progression the findings reveal that a minority of learners received a
promotion, 5% and 13% received a pay raise;
More than two-thirds of the beneficiaries, 68% experienced no change in their careers.
Table 70: Summary of evaluation outcomes: Employer Sector and Nature of Employment
Outcomes Bursaries Learnerships Internships WIL TVETs WIL UoTs Total
Classification of employers by sector
Public 81% 63% 77% 48% 60% 67%
Private 8% 18% 18% 47% 35% 22%
NPO 9% 15% 4% 5% 3% 9%
Other 2% 4% 1% 0% 2% 2%
Total 100% 100% 100% 100% 100% 100%
Types of employment by formality
Formal 100% 89% 94% 90% 99% 93%
Informal 0% 12% 6% 10% 1% 7%
Total 100% 100% 100% 100% 100% 100%
Tenure
Part time 3% 11% 23% 16% 9% 12%
Full time 95% 83% 63% 74% 89% 80%
Total 100% 100% 100% 100% 100% 100%
Nature of contract
Contract 13% 26% 71% 42% 48% 38%
Permanent 87% 60% 22% 45% 50% 53%
Total 100% 100% 100% 100% 100% 100%
Source: Authors, complied from HSRC ETDP SETA Beneficiary Track & Trace Survey (2020)
Self-employed Beneficiaries
1% of beneficiaries were engaged in self-employment;
In terms of economic well-being the study found no significant difference between those who
started a business after completion of the training programme and those who did not start a
business;
Of the beneficiaries who have started a business, youth between the ages of 20-35 years
predominate;
Most of the businesses operate informally with only 20% being VAT registered;
In assessing the economic viability of these businesses, a third of these self-employed beneficiaries
were earning less than R1,000 and just over a tenth earning between R2,001 and R4,500 a month.
To pilot a survey of the perceptions of employers on the value of learnerships,
WIL and internships.
Employer perspectives on the value of the learning interventions were explored in the study and the
following was noted:
The majority of the employers, 91% highlighted that the learning interventions had served to
bridge the gap between theoretical learning and practical workplace needs, with 60% of the
employers in agreement that this was to a 'great extent' and 31% agreeing that it had achieved this
to a 'moderate extent'.
Six in every ten, 63% employers were greatly in agreement that the learning intervention had
contributed to the development of multi-skilled workers.
There was overwhelming agreement by employers, with 57% noting to a great extent, that
‘employees who have gone through the learning interventions were more efficient at doing their
job compared to those who received no training’.
Firm productivity is an important indicator for the success of the firm, and overall a large majority
of the employers, 91% agreed that participation of employees in the learning interventions has
contributed to increased productivity in the organisation.
Regarding the impact on beneficiaries, on average employers reported that 12% of employees’
earnings had increased across all learning interventions, although a disaggregated analysis reveals
that a third of WIL UoT beneficiaries, 35% and a quarter of bursary beneficiaries’ earnings, 26% had
reported increases in their salaries.
8.3 Conclusions
The foregoing analysis included a thorough interrogation of indicators chosen based on intervention ToCs,
including the subjective assessments of the SETA’s beneficiaries of the role the ETDP’s interventions played
in assisting them to secure employment. One can conclude that, among other factors (both external and
internal), ETDP SETA’s learning interventions appear to be making some contribution in facilitating the
postulated transitions as per intervention ToCs. Framed another way, the body of evidence assembled here
is incompatible with a hypothesis of no impact. This is more so when the socioeconomic status of most
beneficiaries is taken into consideration.
The ToC pathways have generated insights with respect to the pathways that have been confirmed and those
which are weak. It has identified intervention-specific assumptions and outcomes that need to be revised.
The ETDP SETA is to be congratulated for embracing the ToC approach to monitoring and evaluation of SETA
outcomes, with the task now ahead of them to integrate and mainstream its use widely across the institution
and in respect of all streams of work from design to implementation, monitoring and strategic decision
making.
8.4 Recommendations
The following recommendations are therefore being put forward:
Design recruitment strategies to ensure that the disability equity target is met
It is evident across many government interventions that while the commitment to meeting targets regarding
people with disabilities exists, the ability to recruit is lacking. The ETDP SETA is encouraged to develop a
recruitment strategy for this group of learners, with engagements with key stakeholders, particularly people
with disabilities themselves through their representative organisations.
Revisit recruitment strategies in respect of demographic and socio-economic
target for specific learning interventions
Areas which require improvement relate to increasing access to younger cohorts of learners between the
ages of 18-35 across all interventions and specifically for bursary beneficiaries to target youth up to 35 years,
given that the average age of learners was found to be 32 across all interventions and 40, for bursary
beneficiaries as reported in section 5.3.3.
It is further proposed that the ETDP SETA review its targeting of bursary beneficiaries in relation to the ToC
in respect of providing support to high-income learners accessing bursary interventions.
SETA recruitment strategies per learning intervention need to be revisited to enable more spatial equity, for
example where almost half of all WIL UoT beneficiaries are from the Western Cape.
Ensure further integration and alignment of ETDP SETA programmes within a
Theory of Change framework
The need for orientation and the mainstreaming of ToCs in the projects and programmes implemented by
the ETDP SETA is highly recommended. This will involve awareness raising and the inclusion of performance
indicators to measure the effective integration of ToCs in all programmes implemented by the SETA.
Enhance initiatives to improve learner employability
This is focused on designing and implementing interventions to strengthen employer mentoring and
supervision capabilities. Improvements in administration systems regarding the delivery of certification is
another area which will contribute to employability. ETDP SETA’s role in the supervision of placements is also
encouraged as a means of enhancing quality of the WIL placements. In addition, attention needs to be given
to how to retain the bulk of the skilled workforce within the ETDP sector.
Increase employer engagements with the ETDP SETA
The relatively small number of organisations who have active engagement with the ETDP SETA needs to be
given further attention. The aim would be to increase the number of organisations who host learners and to
increase the number of learners benefitting from ETDP SETA interventions in these organisations.
Institutionalising evaluation studies
8.4.6.1 Enhancing the Management Information System records on learners
ETDP SETA should request an alternate number if a landline is provided as the primary contact number for
beneficiaries in the skills intervention MIS. Given the relatively high functioning rates of cell-phones,
increasing the number of cell-phone numbers would greatly increase the overall response rate. In general
this calls for overall improvements to the SETMIS database.
8.4.6.2 Informing learners about such research studies and requesting their participation during
induction
Increasing numbers of studies of this nature will be required. It is unclear whether learners are advised in the
contracts they sign that they might be called upon to participate in such studies. Even if this is the case, it is
evident from the responses that most participants did not remember this. It is recommended that
guidebooks or manuals as well as the contract document indicate that such requests will arise, to ensure that
learners understand the value of such studies and are thus motivated to participate. This could be reinforced
in orientation sessions and forums where learners meet with the ETDP SETA. In addition, newsletters, social
media and other related platforms should be utilised to communicate more widely about these surveys.
8.4.6.3 Gatekeeper approval from Government institutions
It is proposed that the ETDP SETA engage with the DHET, Department of Basic Education and HEIs to motivate
for increased employer participation. A significant number of the employers are in the public sector. The
leadership of the DHET, Department of Basic Education and HEIs need to create awareness among senior
managers of the value of such studies and secure prior agreement to participate. Increasing numbers of
studies of this nature will be required.
8.4.6.4 Employer awareness of role of SETAs
It is recommended that SETAs in general and the ETDP SETA more specifically work with the Human
Resources Departments of employer bodies to facilitate increased awareness of the role of SETAs, and the
importance of participation in such studies among the managers at these institutions, beyond those in the
Human Resources Departments.
9 References
Alam, A., & de Diego, M. E. (2019). Unpacking School to Work Transitions: Data and evidence synthesis (Scoping Paper No. 2, Issue 02).
Arends, F., Chabane, S., & Paterson, A. (2016). Investigating Employer interation with the Employment Services of SA. Policy brief 6. HSRC. http://www.psetresearchrepository.dhet.gov.za/sites/default/files/documentfiles/HSRC LMIP ESSA Report Proof 8_0.pdf
Banerjee, A., Galiani, S., Levinsohn, J., McLaren, Z., & Woolard, I. (2008). Why has unemployment risen in the New South Africa? Economics of Transition, 16(4), 715–740. https://doi.org/10.1111/j.1468-0351.2008.00340.x
BANKSETA. (2017). BANKSETA Impact Assessment Report: National Skills Development Strategy III (2011-2016 ).
Bhorat H., & Pillay, N. (2017). The National Student Financial Aid Scheme (NSFAS) and the development of the higher education system in South Africa: A description of the demographics and performance of NSFAS beneficiaries.
Bhorat, H, Mayet, N., & Visser, M. (2012). Student graduation, labour market destinations and employment earnings. In Student retention and graduate destination: higher education and labour market access and success (Issue March). DPRU.
Bhorat, H., Lilenstein, A., Lilenstein, K., & Oosthuizen, M. (2017). Youth Transitions from Higher Education into the Labour Market (No. 36; Labour Market Intelligence Partnership Report).
Bradley, S. & Nguyen, A.N. (2003). The school-to-work transition The School-to-Work Transition (Issue February). Department of Economics, Lancaster University Management School, UK. https://doi.org/10.4337/9781845421694.00018
Bradley, S., & Nguyen, A. N. (2004). The School-to-Work Transition. In G. Johnes & J. Johnes (Eds.), International Handbook on the Economics of Education (pp. 484–521). Edward Elgar Publishing.
Broekhuizen, H. van, & Spaull, N. (2017). The ‘Martha Effect ’: The Compounding Female Advantage in South African Higher Education (WP14/2017; Stellenbosch Economic Working Papers).
Bradley, S & Taylor, J. (2002). Ethnicity, Educational Attainment and the transition from School. 72(3), 317–346.
Burger, R., Piraino, P., & Zoch, A. (2017). Self-reported reservation wages in high-unemployment contexts (No. 37; Issue May).
Callender, C., & Wilkinson, D. (2013). Student perceptions of the impact of bursaries and institutional aid on their higher education choices and the implications for the national scholarship programme in England. Journal of Social Policy, 42(2), 281–308. https://doi.org/10.1017/S0047279412000992
Cape Higher Education Consortium. (2013). Pathways from university to work: A graduate destination survey of the 2010 Cohort of graduates from the Western Cape universities.
Case, J. M., Marshall, D., & Fongwa, S. (2018). Post-graduation Trajectories of young South africans. In M. Ashwin, Paul and Case Jennifer (Ed.), Higher Education Pathways; South African undergraduate education and the public (Issue December). Young Minds.
CATHSETA. (n.d.). Impact Assessment Summary Findings Presentation Agenda.

Centre for Career Management Skills. (2009). Engaging employers to enhance teaching and learning.
Choi, J., Zhu, J., & Goodman, L. (2019). Young Adults Living in Parents’ Basements Causes and Consequences. Urban Institute. https://www.urban.org/sites/default/files/publication/99707/young_adults_living_in_parents_basements_0.pdf
Clark, A. (1998). OECD Labour Market and Social Policy Occasional Papers No . 34 Measures of Job Satisfaction. https://doi.org/10.1787/670570634774
Comyn, P., & Brewer, L. (2018). Does work-based learning facilitate transitions to decent work? (No. 242; Employment Working Paper). ILO. https://www.ilo.org/employment/Whatwedo/Publications/working-papers/WCMS_635797/lang--en/index.htm
Council for Higher Education. (2011). Work Integrated Learning: Good Practice Guide (No. 12; Higher Edu, HE Monitor). Council for Higher Education (CHE). http://cctprojects.co.za/wbeproject/documents/WIL/Higher_Education_Monitor_12.pdf
Crépon, B., Van den Berg, G. J., & Crépon, B. (2016). Active Labor Market Policies (Issue Discussion Paper 10321).
Department of Basic Education. (2017). Development master plan 2017- 2022 teacher professional.
De Lannoy, A., Graham, L., Patel, L., & Leibbrandt, M. (2018). What Drives Youth Unemployment and What Interventions Help? A Systematic Overview of the Evidence and a Theory of Change. https://www.uj.ac.za/faculties/humanities/csda/Documents/Youth Unemployment report FINAL interactive.pdf
Desjardien, S., Dundar, H., & Hendel, D. (1999). Modelling the college application decision process in a Land Grant University. Economics of Education Review, 18, 117–132.
De Villiers, P., Van Wyk, C., & Van der Berg, S. (2013). The first five years project – A cohort study of students awarded NSFAS loans in the first five years 2000-2004. In Stellenbosch Economic Working Papers: 11/13.
DHET. (2009). Human Resource Development Strategy for South Africa (HRD-SA) 2010 - 2030.
DHET. (2011). National Skills Development Strategy (NSDS III). Department of Higher Education and Training. https://www.gov.za/documents/national-skills-development-strategy-iii
DHET. (2012). National Skills Accord. Department of High Education & Training. http://www.economic.gov.za/communications/publications/national-skills-accord
DHET. (2013a). A framework for providing work-integrated learning in technical and vocational education and training colleges. 27.
DHET. (2013b). Guidelines: Organising framework for occupations (OFO) 2012.
DHET. (2013c). White Paper for Post-School Education and Training: Building An Expanded, Effective and Integrated Post-School System. Department of Higher Education and Training.
DHET. (2014). Post-School Education and Training White Paper for Post-School Education. Goverment Gazette.
DHET (2018) Workplace Based learning Programme Agreement, (2018).
DHET. (2018). SETA’s Skills Journal: Developing skills that are needed together. Department of Higher
Education & Training.
DHET. (2019). Revised Strategic Plan 2015/16 - 2019/20. Department of Higher Education & Training. http://www.dhet.gov.za/Strategic Plans/Strategic Plans/Department of Higher Education and Training revised strategic plan 2015-16 and 2019-20.pdf
Elder, S. (2009). School to Work Transition Survey: A methodological guide: Module 1,Basic concepts, roles and implementation process. International Labour Organisation. https://www.ilo.org/employment/areas/WCMS_140862/lang--en/index.htm
Ellwood, D., & T. Kane. (2000). “Who is getting a college education? Family background and the growing gaps in enrolment”. In Securing the Future - Investing in Children from Birth to College (S. Dasinger & J. Waldfogel, ed.). Russel Sage Foundation.
Espi, G., Francis, D., & Valodia, I. (2019). Gender inequality in the South African labour market: Insights from the Employment Equity Act data. Agenda, 33(4), 44–61. https://doi.org/10.1080/10130950.2019.1674675
ETDP-SETA. (2018). ETDP SETA Phase 2 Programmes Tracer Study.
ETDP-SETA. (2019). ETDP SETA Strategic Plan 2016/2020. The Education, Training and Development Practices Sector Education and Training Authority (ETDP-SETA). http://www.etdpseta.org.za/education/research-and-skills-planning
ETDP. (2019). Final ETD Sector Skills Plan: 2020-2025.
ETDP SETA. (n.d.-a). An Impact Assessment of Teacher & Principal training Programmes offered by the Kwazulu-Natal Department of Education. https://www.etdpseta.org.za/education/sites/default/files/2018-09/KZNDOE Impact Assessment.pdf
ETDP SETA. (n.d.-b). Implementation Guidelines for Learnerships Projects. The Education, Training and Development Practices Sector Education and Training Authority (ETDP-SETA).
ETDP SETA. (n.d.-c). Implementation Guidelines for Workplace Experience For TVET Students Projects (pp. 4–5). The Education, Training and Development Practices Sector Education and Training Authority (ETDP-SETA).
ETDP SETA. (n.d.-d). Implementation Guidelines for Workplace Integrated Learning. The Education, Training and Development Practices Sector Education and Training Authority (ETDP-SETA). http://www.etdpseta.org.za/education/research-and-skills-planning
ETDP SETA. (2017a). ETDP SETA Phase 1 Tracer Study Report (Issue March).
ETDP SETA. (2017b). ETDP SETA Phase 3 Tracer Study Report. The Education, Training and Development Practices Sector Education and Training Authority (ETDP-SETA). http://www.etdpseta.org.za/education/research-and-skills-planning
ETDP SETA. (2017c). Learner Career Guide Handbook in the Education, Training and Development Sector. Education, Training and Development Practices: Sector Education and Training Authority.
ETDP SETA. (2018). ETDP SETA (2018) ETD Sector Skills Plan 2019-2020 (p. 76). ETDP SETA.
ETDP SETA. (2019). ETDP SETA Strategic Plan 2016/2020 updated 2019. The Education, Training and Development Practices Sector Education and Training Authority (ETDP-SETA).
ETDP SETA. (2020). Learner career guide handbook.
European Training Foundation. (2017). Employer surveys - Producing the right skills for the right employers
and enterprises. European Training Foundation. https://www.etf.europa.eu/sites/default/files/m/C4F32CCE637F754AC12580E6004A6574_Employer surveys.pdf
Fasset. (2015). Learning Programme Success Access into employment-learner tracer study.
Fasset. (2013). Fasset Tracer Study: The value of work- readiness programmes (Issue March).
Fleisch, B. (2008). Primary education in crisis : why South African schoolchildren underachieve in reading and mathematics. Juta.
Fongwa, S., Marshall, D., & Case, J. M. (2018). Exploring differences in South African graduate outcomes. In P. Ashwin & J. M. Case (Eds.), Oapen.Org (Vol. 4, pp. 1–307). African Minds. https://doi.org/10.5281/zenodo.1920793
Foster, J., Greer, J., & Thorbecke, E. (1984). A Class of Decomposable Poverty Measures. Econometrica, 52(3), 761–766.
FP&M SETA. (2014). Impact assessment of Learnerships, Apprenticeships and Bursaries.
Freudenberg, B., Brimble, M., & Vyvyan, V. (2010). The Penny Drops : Can Work Integrated Learning Improve Students ’ Learning ? Business Education and Scholarship of Teaching, 4(1), 42–61.
Garrod, N., & Wildschut, A. (2020). How large is the missing middle and what would it cost to fund? Development Southern Africa, 0(0), 1–8. https://doi.org/10.1080/0376835X.2020.1796594
Gewer, A. (2010). Choices and chances: FET colleges and the transition from school to work. Report prepared for DHET, HRD Support Unit. National Business Initiative.
Govender, C., & Wait, M. (2017). Work integrated learning benefits for student career prospects - mixed mode analysis WORK INTEGRATED LEARNING BENEFITS FOR STUDENT CAREER PROSPECTS – MIXED MODE ANALYSIS. South African Journal of Higher Education, 35(5), 49–64. https://doi.org/10.20853/31-5-609
Green, W., Adendorff, M., & Mathebula, B. (2014). ‘Minding the gap?’ A national foundation phase teacher supply and demand analysis: 2012-2020. South African Journal of Childhood Education, 4(3), 23. https://doi.org/10.4102/sajce.v4i3.222
Gribble, N., A. Dender, E. Lawrence, K. M. and T. F. (2014). International WIL placements: Their influence on student professional development, personal growth and cultural competence. Asia Pacific Journal of Cooperative Education, 15(2), 107–117.
Hall, R. E., & Lieberman, M. (2008). Economics: Principles and Applications (4th ed.). South-Western Publishing.
Hannan, D. F., Raffe, D., & Smyth, E. (1996). Cross-National Research on School to Work Transitions : An Analytical Framework.
Harris, P. A., Taylor, R., Minor, B. L., Elliott, V., Fernandez, M., O’Neal, L., McLeod, L., Delacqua, G., Delacqua, F., Kirby, J., & Duda, S. N. (2019). The REDCap consortium: Building an international community of software platform partners. Journal of Biomedical Informatics, 95, 103208. https://doi.org/https://doi.org/10.1016/j.jbi.2019.103208
Harrison, N. and Hatt, S. (2012). Expensive and failing? The role of student bursaries in widening participation and fair access in England. Studies in Higher Education, 37(6).
Harrison, N., Davies, S., Harris, R., & Waller, R. (2018). Access, participation and capabilities: theorising the
contribution of university bursaries to students’ well-being, flourishing and success. Cambridge Journal of Education, 48(6), 677–695. https://doi.org/10.1080/0305764X.2017.1401586
Hilmer, M. (2001). A comparison of alternate specifications of the college attendance equation with an extension to two stage selectivity correction models. Economics of Education Review, 20, 263–278.
Holzer, B. H. J., & Lerman, R. I. (2014). Work-Based Learning to Expand Jobs and Occupational Qualifications for Youth. Center on Budget and Policy Priorities. https://www.cbpp.org/sites/default/files/atoms/files/4-2-14fe-holzer.pdf
HRDC. (2012). Key issues in improving the quantity and quality of professionals in areas of scarce skills (Issue November).
Iannelli, C. (2003). Parental Education and Young Peoples Educational and Labour Market Outcomes - A comparison accross Europe in School to Work Transitions in Europe - Analyses of the EU LFS 2000 Ad hoc Module (I. Kogan; W. Muller (ed.); 2nd Edition). Manheimer Zentrum fur Europaische Sozialforschung.
Iddrisu, A. M., Danquah, M., Barimah, A., & Ohemeng, W. (2020). Gender, age cohort, and household investment in child schooling: New evidence from sub-Saharan Africa (Issue February).
ILO. (2009). School to work Transitions Survey - A methodological guide. International Labour Organisation. http://apyouthnet.ilo.org/resources/school-to-work-transition-survey-a-methodological-guide
INSETA. (2020a). Final Bursaries Findings Report.
INSETA. (2020b). Final Learnerships Findings Report. 43.
Ismail, Z., & Mujuru, S. (2020). Workplace Based Learning and Youth Employment in Africa.
Ismail, Z. (2018). Benefits of Internships for Interns and Host Organisations. University of Birmingham. https://gsdrc.org/publications/benefits-of-internships-for-interns-and-host-organisations/
Johan, E., & Breier, M. (2009). Skills shortages in South Africa: case studies of key professions. (E. Johan & M. Breier (eds.)). HSRC Press.
Jung, T., Misko, J., Lee, K., Dawe, S., Hong, S. Y., & Lee, K. (2004). Effective measures for school-to-work transition in the vocational education system Lessons from Australia and Korea.
Kane, Thomas, J. (1994). College entry by Blacks since 1970 - The Role of College Costs, Family Background and the Returns to Education. Journal of Political Economy, 102(5), 878–911.
Khan, T. (2020). Young, Female and African: Barriers, Interventions and Opportunities for Female Youth.
Klasen, S., & Woolard, I. (2008). Surviving Unemployment Without State Support: Unemployment and Household Formation in South Africa. Journal of African Economies, 18(1), 1–51. https://doi.org/10.1093/jae/ejn007
Kruss, G., Wildschut, A., Rensburg, D. J. van, Visser, M., Haupt, G., & Roodt, J. (2014). Impact assessment of National Skills Development Strategy II: Developing skills and capabilities through the learnership and apprenticeship pathway systems: Synthesis report. Department of Higher Education & Training. http://www.psetresearchrepository.dhet.gov.za/document/impact-assessment-national-skills-development-strategy-ii-developing-skills-and
Lehohla, P. (2017, September). University graduates ‘are more employable than TVET graduates.’ Courant.
Letseka, M., Cosser, M., Breier, M., & Vissor, M. (2005). Student Retention and Graduate Destination Survey. HSRC Press.
file:///C:/Users/mpmkaza/Downloads/MoeketsiLetsekasStudentRetentionandGraduateDestination.pdf
LGSETA. (2015). A Tracer Survey of Beneficiaries that completed a Learning Programme funded by the LGSETA between 2011/12 and 2013/14.
Madiba, M. (2015). An investigation of the role of training and organisational support in the first year of the incubation model to strengthen GIS interns in preparing them for full participation in workplace occupations. A case study of the Groen Sebenza internship project. Rhodes University.
Maseko, L. A. (2018). A review of work-integrated learning in South African mining engineering universities. Southern African Institute of Mining and Metallurgy, 118(May), 1315–1323.
Mastercard. (2019). Background paper: Preparing youth for the transition to work future (Issue February).
Mills, M. & Prag, P. (2014). Gender inequalities in the school-to-work transition in Europe. Short Statistical Report No. 4. Rand Corporation.
merSETA. (2016). Tracer Study (Issue December).
Mlachila, M., & Moeletsi, T. (2019). Struggling to Make the Grade: A Review of the Causes and Consequences of the Weak Outcomes of South Africa ’ s Education System.
Moriarty, J., Manthorpe, J., Hussein, S., Stevens, M., Sharpe, E., MacIntyre, G., Orme, J., Lister, P. G., & Crisp, B. R. (2012). No Title. British Journal of Social Work, 42(957–973).
Moses, E., Berg, S. Van Der, & Rich, K. (2017). A Society Devided: How unequal education quality limits social mobility in South Africa (Synthesisi Report for the Programme to Support Pro-Poor Policy Development (PSPPD)). https://ssrn.com/abstract=2973759
Naidoo, A., & Mckay, T. J. M. (2018). Student Funding and Student Success: A Case Study of a South African University. SA Journal of Higher Education, 32(5), 158–172.
National Planning Commission. (2012). National Development Plan 2030: Our future - make it work. Government of South Africa.
National Qualifications Framework (NQF) Act No. 67 of 2008, (2009). https://www.gov.za/sites/default/files/gcis_document/201409/31909167.pdf
Nguyen, N., Cully, M., Anlezark, A., & Dockery, A. M. (2010). A stocktake of the Longitudinal Surveys of Australian Youth (Technical Report 59).
Nilsson, B. (2019). The School-to-Work Transition in Developing Countries. The Journal of Development Studies, 55(5), 745–764. https://doi.org/10.1080/00220388.2018.1475649
OECD. (2009). Taking Advantage of Workplace Learning in Learning for Jobs. In OECD (Ed.), Learning for Jobs: Synthesis Report of the OECD Reviews of Vocational Education and Training (pp. 61–86). OECD. http://www.oecd.org/education/skills-beyond-school/Learning for Jobs book.pdf
Peacock, N. & Ladkin, A. (2002). Exploring relationships between higher education and industry: a case study of a university and the local tourism industry. Industry and higher education. Industry and Higher Education, 16(3), 393–401.
Peoples, J., & Bailey, G. (2012). An Introduction to Cultural Anthropology (9th ed.). Wadsworth.
Rambe, P. (2018). Using Work Integrated Learning programmes as a strategy to broaden academic and workplace competencies. SA Journal of Human Resource Management, 1–16.
Rankin, N., Roberts, G., & Schöer, V. (2014). The Success of Learnerships?: Lessons from South Africa’s Training and Education Programme (2014/068; WIDER Working Paper, Issue March). UNU-WIDER.
Reddy, V., Bhorat, H., Powell, M., Visser, M., & Arends, F. (2016). Sklls supply and demand in South Africa. Education and Skills Development (ESD) Programme, 1–108.
Reddy, V., Juan, A., Fongwa, S., & Isdale, K. (2019). South African Schooling: The Enigma of Inequality (N. Spaull & J.D. Jansen (ed.); pp. 169–187). Springer.
Reddy, V., Rogan, M., Mncwango, B., & Chabane, S. (2017). Occupations in High Demand in South Africa - A Technical Report.
Republic of South Africa. (1996). The Constitution of the Republic of South Africa. Act No. 108 of 1996.
Republic of South Africa (1999). Act No 56. 1999 National Student Financial Aid Scheme.
Republic of South Africa. (2019). Medium Term Strategic Framework (MTSF) 2014-2019.
Rodriguez, J., Fox, H., & Mccambly, H. (2016). Workbased learning as a pathway to post secondary and career sucess. Insights On Equity and Outcomes Issue 18. https://eric.ed.gov/?id=ED574535
Rogan, M., & Reynolds, J. (2016). Schooling inequality, higher education and the labour market: Evidence from a graduate tracer study in the Eastern Cape. Development Southern Africa, 33(3), 343–360. https://doi.org/10.1080/0376835X.2016.1153454
Ryan, P. (1999). The School-to-Work Transition: Issues for Further Investigation (Vol. 1999, Issue December). OECD. https://www.oecd.org/education/skills-beyond-school/1925685.pdf
Sanday, P. R. (2003). Women at the Center: Life in a Modern Matriarchy (1st ed.). Cornell University Press.
SASSETA. (2019a). SASSETA Tracer Study Project: Tracer Study of learners who have completed Workplace Based Learning (WBL) funded by SASSETA during the 2015/16, 2016/17 and 2017/18 financial periods.
SASSETA. (2019b). The employability of learners completed learnership in 2014-15 to 2016-17. 40.
SASSETA. (2019c). Tracer Study of learners who have completed Workplace Based Learning (WBL) funded by SASSETA during the 2015/16, 2016/17 and 2017/18 financial periods.
Schedule 1 of the Amended Codes of Good Practice on Broad-Based Black Economic Empowerment Amendment Act 2003, (Act No. 53 of 2003), (2019). https://www.gov.za/sites/default/files/gcis_document/201905/42496gen303.pdf
Schomburg, H., & Teichler, U. (2006). Higher Education and Graduate Employment in Europe: Result from Graduate Surveys from Twelve Countries. Higher Education Dynamics 15.
Sissons, P., & Jones, K. (2012). Lost in transition? The changing labour market and young people not in employment, education or training (Issue May).
Skills Development Act No. 97 of 1998 (1998). https://www.gov.za/sites/default/files/gcis_document/201409/a97-98.pdf
Smith, E., & Comyn, P. (2004). The Role of Employers in the Development of Employability Skills in Novice Workers (No. 49; Issue July 2014). https://doi.org/10.1080/13596740400200181
Spaull, N., & Makaluza, N. (2019). Girls Do Better. Agenda, 33(4), 11–28. https://doi.org/10.1080/10130950.2019.1672568
SSACI. (2013). A Framework for Providing Work-Integrated Learning in Technical and Vocational Education
and Training Colleges. SSACI. http://www.ssaci.org.za/images/12._WIL_Framework_for_TVET_Colleges.pdf
Statistics South Africa. (2014). Profile of persons with disabilities in South Africa. Statistics South Africa. https://www.statssa.gov.za/publications/Report-03-01-59/Report-03-01-592011.pdf
Statistics South Africa. (2015). Census 2011: Migration Dynamics in South Africa. Statistics South Africa. http://www.statssa.gov.za/publications/Report-03-01-79/Report-03-01-792011.pdf
Stats SA. (2017). Education series volume III: Educational enrolment and achievement, 2016 (Vol. 3).
Stats SA. (2019). National Poverty Lines 2019 (P0310.1.; Statistical Release). Statistics South Africa. http://www.statssa.gov.za/publications/P03101/P031012019.pdf
Van Broekhuizen, H. (2016). Graduate unemployment and higher education institutions in South Africa (08/16; Stellenbosch Economic Working Papers).
Van der Berg, S., & Van Broekhuizen, H. (2012). Graduate unemployment in South Africa: A much exaggerated problem Stellenbosch Economic Working Papers: 22 / 12 Graduate unemployment in South Africa : A much. 1–53.
Van Staden, E. (2015). A Work Place-Based Learning Policy: The National Perspective. Department of High Education & Training. http://www.saair-web.co.za/wp-content/uploads/2015/08/06-EvS-WBL-for-PSET.pdf
Walker, M., & Fongwa, N. S. (2017). Universities, employability and human development. Macmillan.
Ward, M., & Rosenberg, E. (2020). High-Level M & E Framework for the SETA Environment (Issue August 2018).
Wedekind, V. (2016). Enhancing employability: What can be done to improve TVET students’ chances of finding work? HSRC. http://www.psetresearchrepository.dhet.gov.za/document/enhancing-employability-what-can-be-done-improve-tvet-students’-chances-finding-work
Wildschut, A., Kruss, G., Visser, M., Meyer, T., & Tele, A. (2017). Institutionalising Tracer Studies to Assess the Impact of Workplace-based Training: Reflections on Feasibility.
Wildschut, A., Kruss, G., Rensburg, D. J. van, Haupt, G., & Visser, M. (2012). Impact Assessment of National Skills Development Strategy II: Learnerships and Apprenticeships survey 2010 Technical Report. HSRC. http://www.hsrc.ac.za/en/research-outputs/view/5688
Wildschut, A., Kruss, G., Visser, M., Meyer, T., & Tele, A. (2017). Institutionalising Tracer Studies to Assess the Impact of Workplace-based Training : Reflections on Feasibility. HSRC. http://www.psetresearchrepository.dhet.gov.za/document/institutionalising-tracer-studies-assess-impact-workplace-based-training-reflections
Wildschut, A., Mncwango, B., Rogan, M., Rust, J., & Fongwa, S. (2018). The National Student Financial Aid Scheme (NSFAS ) and its impact: Exploring the absorption into employment of NSFAS-funded graduates. 1–60. http://www.nsfas.org.za/content/reports/NSFAS Complete Report.pdf
Wildschut, A., Rogan, M., & Mncwango, B. (2020). Transformation, stratification and higher education: exploring the absorption into employment of public financial aid beneficiaries across the South African higher education system. Higher Education, 79(6), 961–979. https://doi.org/10.1007/s10734-019-00450-z
World Bank. (2018). A Multiplicity of Skills is Needed to Succeed. The World Bank. http://documents.worldbank.org/curated/en/806751541081039061/pdf/131637-BRI-skills-PUBLIC-

Series-World-Bank-Education-Overview.pdf
Zwane, F. N., du Plessis, L. & Slabbert, E. (2014). Analysing employers’ expectations of employee skills in the South African tourism industry. SA Journal of Human Resource Management, 12(1), 9.


