Embed Size (px)
Citation preview
Marine Geology, 83 (1988) 237-252 237 Elsevier Science Publishers B.V., Amsterdam -- Printed in The Netherlands
ESTIMATION OF ANNUAL BEDLOAD FLUX IN A MACROTIDAL ESTUARY: BRISTOL CHANNEL, U.K.
P E T E R T. HARRIS 1 and M I C H A E L COLLINS 2.
1Ocean Sciences Institute, University of Sydney, Sydney N.S.W. 2006 (Australia) 2Department of Earth Sciences, University of Cambridge, Downing Street, Cambridge CB2 3EQ (England, U.K.)
(Received June 30, 1987; revised and accepted February 19, 1988)
Abstract
Harris, P.T. and Collins, M., 1988. Estimation of annual bedload flux in a macrotidal estuary: Bristol Channel, U.K. Mar. Geol., 83: 237-252.
Sedimentological data from the Bristol Channel indicate that "mutually evasive" ebb- and flood-dominant zones of net bedload transport are present. To test this hypothesis, long-term observations of currents from the channel are combined with empirical formulae to estimate annual bedload transport rates under the combined influence of tidal currents and surface wind-waves. Extrapolating these values over the ebb- and flood-dominant zones, sand flux to the upper part of the channel is estimated at about 64 × 105 t yr- 1 with supply and removal being of nearly equal magnitude. Such patterns of sand and water movement may be typical of tidally dominated estuaries and embayments.
Introduct ion
Sediment t r anspor t measurements obta ined from estuar ies or t idal embayments are often repor ted as a t r anspor t vec tor ~ in terms of g cm-1 s-1 or t m-1 day-1 . The t ime scale reflects in m a n y cases the l imited leng th of t ime over which cu r ren t measurements have been made to form the basis of computa t ions . I t is inhe ren t in such da ta tha t m a n y cyclic or extreme var ia t ions in cu r ren t speed have been ignored. Such var ia t ions are caused by the n e a p - s p r i n g tidal cycles, fluvial discharge, the influence of s torm surges or the super imposed effect of wind-genera ted wave- induced cur- rents. In a s imilar way, the length scale reflects the problems of ex t rapo la t ion of da ta on wate r and sediment movements to su r round ing areas of the seabed. Seabed topography , shorel ine
*Present address: Department of Oceanography, The University, Southampton SO9 5NH (England, U.K.)
conf igura t ion or chang ing oceanograph ic con- di t ions may induce changes in the ra te or d i rec t ion of flow over only a few tens or hundreds of metres.
In the Bristol Channel , U.K., for example, residual bo t tom-water movements mapped by seabed drif ters suggest tha t ebb t idal flow dominates the cent ra l longi tudina l axis of the channel ; in contras t , flood flow is dominan t a long the coas ta l boundar ies (Collins and Ferent inos , 1984). This pa t t e rn is common among t idal ly domina ted systems, reflecting a t ime lag in revers ing the flow di rec t ion of the ebb tide with the m o m e n t u m of the mid- channe l ebb flow pro longing its influence beyond the time of low water . Consequent ly , an inshore cu r ren t is es tabl ished in the flood di rec t ion ahead of the mid-channel flood (McDowell and O 'Connor , 1977, pp.21-22). In this way, ebb and flood tidal cur ren t s are "mu tua l l y evasive", wi th each one domina t ing over a specific area of an es tuary or t idal
0025-3227/88/$03.50 © 1988 Elsevier Science Publishers B.V.
238
embayment. Such water movement results in a similar mutually evasive pattern of net bedload transport (Van Veen, 1950; Robinson, 1956, 1960; Ludwick, 1975; Wright et al., 1975; Reinson, 1977; Amos and Asprey, 1981).
The present investigation examines spatial and temporal variability in the rate and direc- tion of net bedload transport in a macrotidal estuary subject to occasional extremes of swell- wave energy input. Self:recording current meter data from the Bristol Channel are evaluated in terms of annual bedload transport for combina- tions of neap-spring tidal currents under a variety of superimposed wave climates. Bedload transport vectors are assessed in relation to transport pathways within the channel which have been identified previously (Harris and Collins, 1985). Finally, the derived annual transport vectors are used to estimate sand flux into and out of the channel, along the ebb- and flood-dominated zones of net bedload transport.
The Bristol Channel
Coastal geomorphology and bathymetry
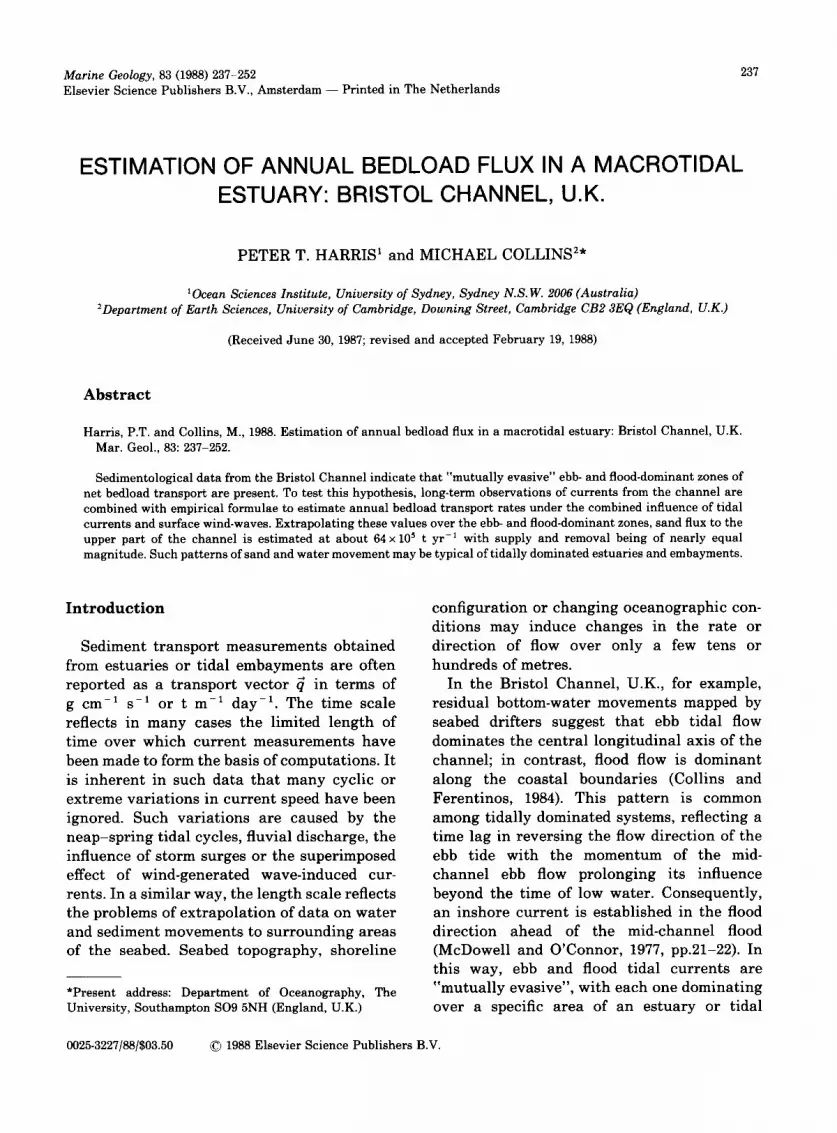
The Bristol Channel is a macrotidal estuary along the southwestern coastline of the U.K.
(Fig.l). The channel shoreline alternates be- tween resistant and erosional cliff features, interspersed with depositional beaches backed by coastal sand dunes (Steers, 1964; Potts, 1968) (Fig.3). An area excepted from this generalisa- tion is the Severn Estuary, where a low-lying shoreline is fronted by extensive intertidal mudflats (Allen, 1987). Only limited amounts of sand are considered to be supplied to the channel through cliff erosion (Parker and Kirby, 1982), although coastal sand dunes act as a sink for sediments removed onshore, from the littoral zone, by the prevailing south- westerly winds.
The bathymetry (Fig.l) indicates that the channel, for the most part, is quite shallow. The Severn Estuary and most of the embay- ments around the channel are less than 10 m in depth (relative to LAT). Within the channel, however, there is an E-W trending valley, referred to at the eastern end as the "Breaksea Valley" (Banner et al., 1971). For the present study this name will be used to describe the entire feature (Fig.l). The valley is deeper than 20 m (LAT) and is more than 30 m deep to the west of 3o30 , (Fig.l); it is considered to have been formed by fluvial run-off at times of
' 1 2UK% ~ I | Bristol i I ~ l~ , j J ~t I
) / - s J i ° ~ ' " ~ / ~ l C h a n n e l ~ ( ~ ;
I . , , ~ " ~ 7 1 ~ J \ ~ / ~ ,p~- Swansea Bay ~ l , t~ i •
-51o30 ' c~ - , x q e~<~ ~-~ Sands ', Z ~¢ "51°30' c~~csk~"LL.S.ar?~'e~a~t'~~ Sreaksea Valley S ~ ~
Holm
• undy , s , a °d . . . . . . . . . . .
Jl~'l ,'q k,,,,-"~ o ,o 2o== _~ % ,')/~f- , - -6 .....
/~- -e0~ ' / ' ~ ~t~Barnstaple Bay
¢ ~711 "ioo ~;oo
Fig. l . Locat ion and bathymetry of the Bristol Channel (after Co|]ins, 1983). Contours are in 10 m intervals.
lowered sea level (Hawkins, 1971; Evans and Thompson, 1979). Based on this single bathy- metric feature, therefore, the channel may be considered a drowned river valley type of estuary (North, 1955, p.90).
Other topographic features present within the channel are Flat Holm and Steep Holm Island, Lundy Island and a series of linear sandbanks (Fig.l). Some bedforms and sub- marine valley features of the channel bed can be detected on SEASAT synthetic aperture radar (SAR) images (Harris et al., 1986).
Surficial sediments and bedforms
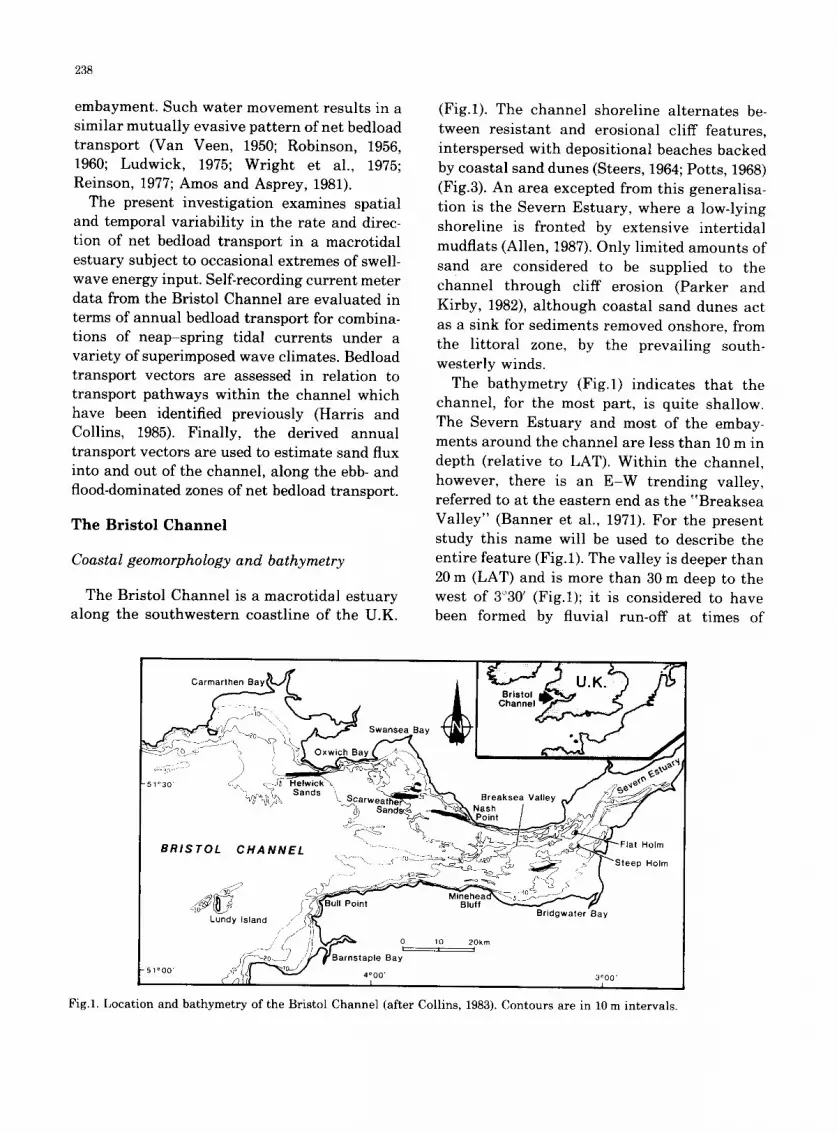
The surficial sediment distribution of the channel has been discussed by Dyer (1984) and by Harris and Collins (1985) (Fig.2). Large areas of the bed are characterised by bedrock exposures. Sand and gravel is found mostly in the embayments and the Severn Estuary. Some coarse-grained material has been noted by Harris (1982) to occupy the floors of submarine valleys within the channel, notably the Break- sea Valley (Figs.1 and 2). Mud deposition is
239
restricted to depositional zones within Swan- sea and Bridgwater Bay and to the Severn Estuary (Harris and Collins, 1985).
Bedforms occur within the channel in four distinct types (Fig.3): (1) linear sandbanks, (2) sandwaves, (3) sand gravel ribbons and (4) megaripples. These bedforms have been dis- cussed previously in terms of a relationship between bedform distribution and sand trans- port pathways (Harris and Collins, 1985).
The transport paths of fine-grained sus- pended sediments in the channel have been summarised by Collins (1983) and Dyer (1984); they are not considered within the context of the present investigation.
Physical oceanographic setting
The Bristol Channel is exceptional among macrotidal estuaries for its tidal range, which is the third largest in the world (after Fro- bisher Bay of Baffin Island and the Bay of Fundy). The tidal wave is amplified in an up- channel direction by the "funnel-shaped" coastline (Fig.l). At Lundy Island, in the outer
Swans Ba~
4 ° W I
Sand banks
o l o 20k rn ~ I I •
3 ° I L
Fig.2. Surficial sediment distribution in the Bristol Channel, based on Harris (1984) and British Geological Survey (1986).

240
I 4 1 o o , ~ ~ 1 I 3°1oo. i
~O°o ° ~ ' P " ~° • ~ - -~ megaripples COASTAL FEATURES
o ° ° o ~ cliffs
- - ' o Oo ~ s a n d w a v e s ~ ~ o
I 4"1°°' I 3°13° I 3"1°° I
Fig.& Distribution of bedforms and coastal features in the Bristol Channel, based on Harris (1984) and British Geological Survey (1986).
part of the channel, the mean spring tidal range is 5 m; this increases to more than 14 m in the Severn Estuary (fig.l, Admiralty, 1974). Tidal currents also increase in an up-channel direction from mean spring surface current speeds of 1.5 m s- 1 at Lundy Island to 2.5 m s- in the Severn Estuary (Hamilton, 1979).
Parts of the channel are exposed to south- westerly swell waves, generated in the Atlantic Ocean. Oceanic swell reaches Swansea Bay (Fig.l) from between 220 ° and 250 ° , over about 40% of the year (Heathershaw et al., 1980). Wave data collected near the Scarweather Sands (Fig.l) from December, 1976 to November, 1977 (Fortnum and Hardcastle, 1979) suggest that, over this period, significant wave heights (Hs) were greater than 1.5 m for approximately 32% of the time and the most frequent wave periods (Tz) were between 6 and 7s. In other parts of the channel fetch is limited by the proximity of the coastline.
Numerical model data
Tidal currents and the resulting bottom shear stress have been modelled numerically for the Bristol Channel by several investiga- tors, notably Robinson (1979), Owen (1980) and Uncles (1982, 1984). Of part icular significance
to the present investigation is the relationship first noted by Pingree and Griffiths (1979) between tidally induced mean bottom stress vectors and the net sand transport directions around the British Isles (as proposed by Kenyon and Stride, 1970). The vectors were computed from a depth-averaged numerical model, which considered interactions between the M 2 and M4 tidal components. As noted by Pingree and Griftiths (1979), the grid used in their model (of the British Isles) could not resolve flow patterns in the vicinity of "geo- graphical obstructions" or in the "shallow beach gradients near to the coast".
Subsequent numerical models have focussed on M2-M4 interactions and the resulting bed shear stress vectors in the Bristol Channel, using a finer grid spacing than that used by Pingree and Griffiths (1979). The directions of maximum tidal shear stress on the channel bed presented by Uncles (1984) are reproduced here (Fig.4), for later comparison with indepen- dently derived net bedload transport directions.
Pathways of net bedload transport
Investigations into the movements of water and sediment within the Bristol Channel estuarine system have in the past concentrated

241
; : 7 2 . : 2 2 " - : 2 2 2 - - - - 2 2 . . . . . ~<: ,
I :.:: j~
i
n ~
Fig.4. Directions of maximum tidal stress on the seabed resul t ing from combined M2-M,, and residual currents (modified from Uncles, 1984) such tha t shaded areas indicate flood (eastward) directions. Maximum stress exceeds 100 dyn cm -2 over most of the channel bed (Uncles, 1984). (Note: magnitude of stress is not indicated by the length of the arrows in the figure).
on Swansea Bay (Fig.l) where a large data base has been accumulated. Data include the results of current meter deployments, seabed drifter and sand tracer studies, and observations on bedform asymmetry and orientation (Fig.5). Based on these data, areas of the bay may be defined as ebb- or flood-dominant with respect to directions of net bedload transport; these
are delimited by extrapolating along a bound- ary line which separates areas of opposing net transport directions(Fig.5). Generally, there is an inshore flood-dominant area and an off- shore ebb-dominant area, with more complex patterns occurring in the immediate vicinity of the linear sand banks. The sand bank crests serve as natural "boundary lines" dividing zones of opposing net transport. Similar pat- terns have been noted from many other tidally dominated estuaries around the world (Harris and Jones, 1988; Harris, in press).
Pat terns of net bedload transport in the remaining parts of the Bristol Channel, exclud- ing Swansea Bay, are less well understood. Data available include (1) asymmetric orienta- tion of bedforms (as mapped in Fig.3), (2) recovery patterns of seabed drifters (Collins and Ferentinos, 1984), (3) heavy mineral distri- butions in seabed samples (Barrie, 1980), and (4) the observed movement of locally derived rock fragments, to the east, along the southern coastline of the channel (Steers, 1964). The information available suggests that the off- shore, mid-channel area is ebb-dominant whilst the coastal, nearshore areas are flood-domi- nant (Harris and Collins, 1985) (Fig.6). Such an hypothesis requires further and more detailed investigation which is the subject of our contribution.
Curren t -mete r s i tes ,and pred ic ted t ranspor t d i rec t ion
~ , Tracer sand r e l e a s e point .and net t ransport direction A
T ¢:~ Asymmetr ic or ientat ion of sandwaves N
¢~ I , I
. . . . . . . . .
I N . . .
Fig.5. Summary of bedload t ranspor t data in Swansea Bay from invest igat ions of Collins et al. (1980), Heathershaw and Hammond (1980), Pa t t ia ra tch i and Collins (1984, 1985) and Harris (1984). The locations of current meter s tat ions discussed in the text (CM1, I and J) are indicated.
j J Fig.6. Summary of available bedload t ranspor t data in the Bristol Channel inferred from bedform or ienta t ion (solid lines), seabed drifter recovery pat terns (dashed lines) and the distr ibut ion of heavy minerals in seabed surficial sediments (after Harris and Collins, 1985). See Fig.5 for details of Swansea Bay. The locations of current meter sites 1-4 and 6 are indicated; arrows indicate directions of estimated annua l t ranspor t (see text).

242
M e t h o d s
Twelve Aanderaa self-recording current meters were deployed in the channel on six moorings during August and September, 1983. At one site (CM3), the current meter was redeployed after 7 days at approximately the same location and at another site (CM5) the near-bed current meter was not recovered. The duration of useful data collected is shown in Table 1.
The location of the current meter stations is shown in Fig.6. Sites were selected on the basis of inferred transport paths, identified from previous investigations (as discussed above), in order to confirm or deny the proposed trans- port directions and quantify transport rates in three distinct environments: (1) within Swan- sea Bay (CM1), (2) a cross section of the Central Bristol Channel (CM2-4 and 6), and (3) within the Breaksea Valley (CM3A and 3B).
Each of the sites was surveyed using side- scan sonar to determine the nature and extent of sediment cover. The equipment used was a Waverly Electronics Mk III towed trans- ducer (fish) connected to a Gifft 4000 recorder operated in dual-channel mode. Seabed sedi- ments were collected at each site at the time of current meter deployment, using a Day grab. These samples were analysed for size
distribution using nested sieves at 1 ¢ size intervals.
Throughout the surveys, position fixing was carried out with a Decca Main Chain, which was typically accurate to _+ 30 m in the studied areas of the channel. Sediment transport vectors were predicted using empirical formu- lae in association with the current meter data, in relation to spring neap tidal cycle varia- tions and the superimposed effects of surface wind-gravity waves on the tidal currents. It should be noted that oceanic and density effects play only a very minor part in generat- ing currents within the channel (Hamilton, 1973) and have been omitted from the present study.
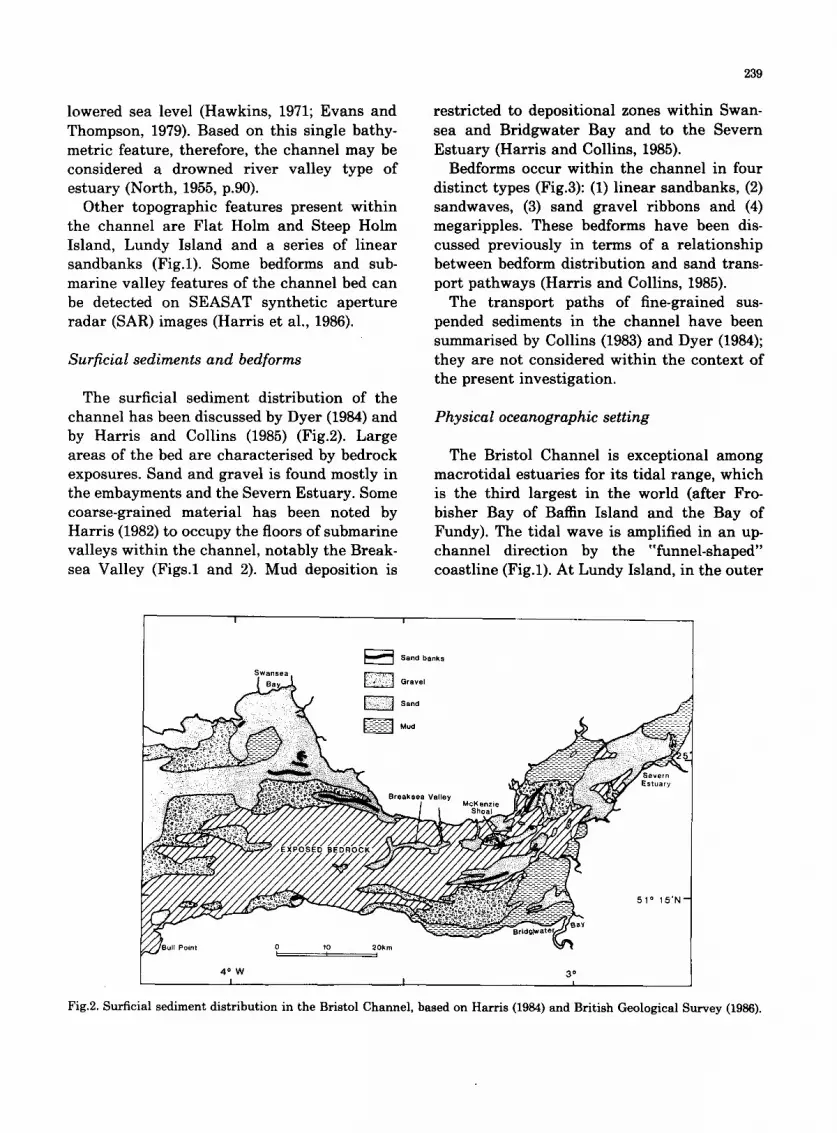
In order to achieve the first of the objectives, namely the identification of transport patterns under tidal currents alone, current meter data corresponding to a period of low surface wave energy (Fig.7) were analysed. Specific periods from 20/8 to 31/8 and from 5/9 to 14/9 were used to isolate five consecutive spring and neap tidal cycles providing data representative of only the tidal currents without superimposed wave activity. Tidal ranges over these periods were equal to 90% of the mean spring range (9.7 m) and 95% of the mean neap range (4.7 m) predicted for the Minehead Bluff area (Fig.l) (Admiralty, 1983).
TABLE 1
Current meter data from 150 cm above the bed used in the present study
Stat ion Date Date Duration of useful data Total Number of 10 min deployed recovered (days) observations
CM1 19/8/83 12/9/83 19/8/83 12/9/83 24 3444 0900-0650
CM2 18/8/83 13/9/83 18/8/83 03/9/83 16 2303 1600-1540
CM3A 18/8/83 25/8/83 18/8/83-25/8/83 7 1007 1400-1340
CM3B 25/8/83 25/10/83 25[8/83-05/10/83 41 5938 1600-2130
CM4 18/8/83 24/8/83 18/8/83 24/8/83 6 867 1300-1320
CM6 17/8/83 12/9/83 17/8/83-12/9/83 26 3727 1300-1000
z 3 6 o c , : :
z - o 1 8 0
~' 0 ,~ 4o
3o
2o
~) lO
c m 3 A
c m 1
cm 2
c m 3 B
c m 4
c m 5
c m 6
S N S N S N S N S
,o ~ ° - - - - -~oo . - • . • - - _
• -...-...---... : : 2 -":..:.-." .° . " " : . . - . . ¢ , " - .
• • • . . . . " , . . . ' . . . "
10 15 20 25 31 5 10 15 20 25 30 ,5 10 15 20
A u g u s t S e p t e m b e r O c t o b e r
Fig.7. Environmental data for the period of current meter deployment. Spring neap tidal phase is indicated by SN SN. Sea state, and wind speed (m s - ' ) and direction data were supplied by H.M. Coastguard Station, Mumbles•
The data sets were subjected to a similar analytical approach as that adopted by Pat- t iaratchi and Collins (1984). Each observation, at a 10 min sampling interval and from 1.5 m above the bed, was used in the sand trans- port equation of Gadd et al. (1978), to predict the mass rate of sediment transport (q) as follows:
q = fl(Ulo o - Uloo.) 3 (1)
where Uloo and Uloo¢ , are the current speed and critical current speed at threshold, measured at 100cm above the bed. /? is a coefficient dependent on grain size and was taken as 4.48 x 10 -5 g cm -4 s -2 in the present investigation (Gadd et al., 1978). The Gadd equation was selected in preference to that of Hardisty (1983) in order to make comparisons between the results of the present study with those of previous investigations (e.g., Pat- t iaratchi and Collins, 1984).
U15o (the height of deployment used in the present study) is related to U, oo by
243
the Von Karman-Prandt l velocity profile equation:
uz= U*ln ( Z Zo (2)
where Z o is the roughness length, x is Von Karman's Constant (taken as 0.4) and Uz is the current speed measured at height Z, above the bed. Thus, at 150 cm above the bed:
U150 = U , (ln 150 - In Zo) (3) /£
and at 100 cm above the bed:
Uloo = U, (ln 100 - In Zo) (4) K
Dividing eqn.(4) by eqn.(3) yields an equation for Uloo in relation to U15o:
In 100 - In Z o Uloo = In 150 - In Z o U15o (5)
The critical current shear velocity (U.c,) required to transport sand (U.¢, = Tx/~,/p, where T is the bed shear stress and p is the water density) has been determined elsewhere in laboratory flume experiments and has been summarised by Miller et al. (1977).
Current observations (U15o) were used here in association with roughness lengths (Zo) of 0.08 cm for the accelerating phase of the tide and 0.16 cm for the decelerating phase. These Z o values are based on local field measure- ments from the sublittoral zone of Oxwich Bay (Fig.l), using a boundary layer rig with loga- rithmically spaced sensors (Pattiaratchi, 1981; Pat t iaratchi and Collins, 1985). Currents measured at 150 cm above the bed can then be related to Uloo by eqn.(5), which assumes that the current velocity profile is logarithmic to within 150 cm above the bed (e.g., Sternberg, 1968; Bowden, 1983). U, can then be found from:
U . _ r l / 2 r r (6) - - ~ J 1 0 0 ~ J l O 0
where OlOO is the mean current speed (i.e., averaged over a 10 min sampling interval) and Cloo is the drag coefficient at 100 cm, which has been shown to approach 3.1x 10 -3 for large

244
Reynolds numbers and small bedforms (Stern- berg, 1968).
To take into account the combined effects of surface waves and tidal currents, the equations of Madsen and Grant (1976) were used. To estimate sediment transport, these investiga- tors used the Einstein-Brown formula (Ein- stein, 1950), in which an instantaneous value for the sediment transport function is given by:
~b(t) = 40~3(t) - q(t) (7) wsD
where ws is the fall velocity of the sediment, D is the grain size and ~(t) is the instantaneous Shields parameter.
An empirical equation for w s has been determined by Gibbs et al. (1971). The instan- taneous Shields parameter O(t) is:
To(t) ~(t) - (8)
(ps - p )pgD
As a wave passes over the seabed, the shear stress will vary from 0 to a maximum value ~o=. Sediment will be transported (or, at least the critical shear stress will be exceeded), there- fore, for only part of the wave period, desig- nated by the interval - t i < t < ti during which positive sediment transport occurs. Integra- tion with time yields:
q~ = ~ ~b(t) dt = C0~ (9) - t i
where C is a constant. The constant C is a function of the ratio ~bm/~¢ ,, where the ratio is greater than 2 (i.e., ~hm/thcr>2 ). C can reach 12.5, based on data from various flume studies (fig.7, p.39, Madsen and Grant, 1976).
Madsen and Grant (1976) suggest that bottom shear stress is related to the vectorial addition of near-bottom wave and (tidal or unidirec- tional) current velocities by a friction factor which includes the wave and current properties. Hence, the instantaneous shear stress is:
1 2 U(,) (10) to(t) = ~fowplU(,)l IU(,)I
where:
I UI £ + I uw(t)l L £ w = I U l + l U w ( t ) l (11)
and:
U(t) = (Uw(t) + U¢, Vw(t) + V c) (12)
where the subscript "c" denotes the current and "w", the wave.
Equation 11 contains fc, the friction factor describing the interaction of the steady cur- rent with the seabed (e.g., Sternberg, 1968), although Madsen and Grant suggest the use of the Darcy-Weisbach relation, given by Richardson and Simons (1967) as:
f¢ = 2 ~** (13)
Equation 12 describes the current vector 0 by its components in the x and y directions (U and V) in which Uw(t) and Vw(t) are the instantaneous (time-dependent) wave-induced velocity components*.
The Madsen and Grant (1976) method for esti- mating sand transport under the combined effect of waves and currents has been described. Since wave data were not collected as part of the present investigation, wave heights and periods presented by Fortnum and Hardcastle (1979) were used with the Madsen and Grant method to estimate the net transport, on an annual basis, through integration with the current meter data from the present investigation. Such a procedure assumes that storms occur with equal frequency over spring and neap tidal cycles and that spring and neap tidal cycles each occur over 50% of the time, with "mixed" tides being ignored. Also, variations in tidal currents related to the annual equinox are ignored.
Based on the data of Fortnum and Hard- castle (1979), three wave heights and periods were employed with the Madsen and Grant method (eqns.7-13) to superimpose on the current meter data. These wave characteristics were termed "average", "oceanic" and "stormy", with corresponding heights and
*Gran t and M a d s e n (1979) p re sen t a redef ini t ion of the combined wave -cu r r en t f r ic t ion fac tor (few), t a k i n g in to a c c o u n t t he n o n l i n e a r i n t e r ac t i on of waves and cu r ren t s . This redef ined few was no t used in the p re sen t s tudy, s ince su i t ab le wave da t a were no t ava i l ab le for the va r i ous c u r r e n t me t e r s t a t ions .
245
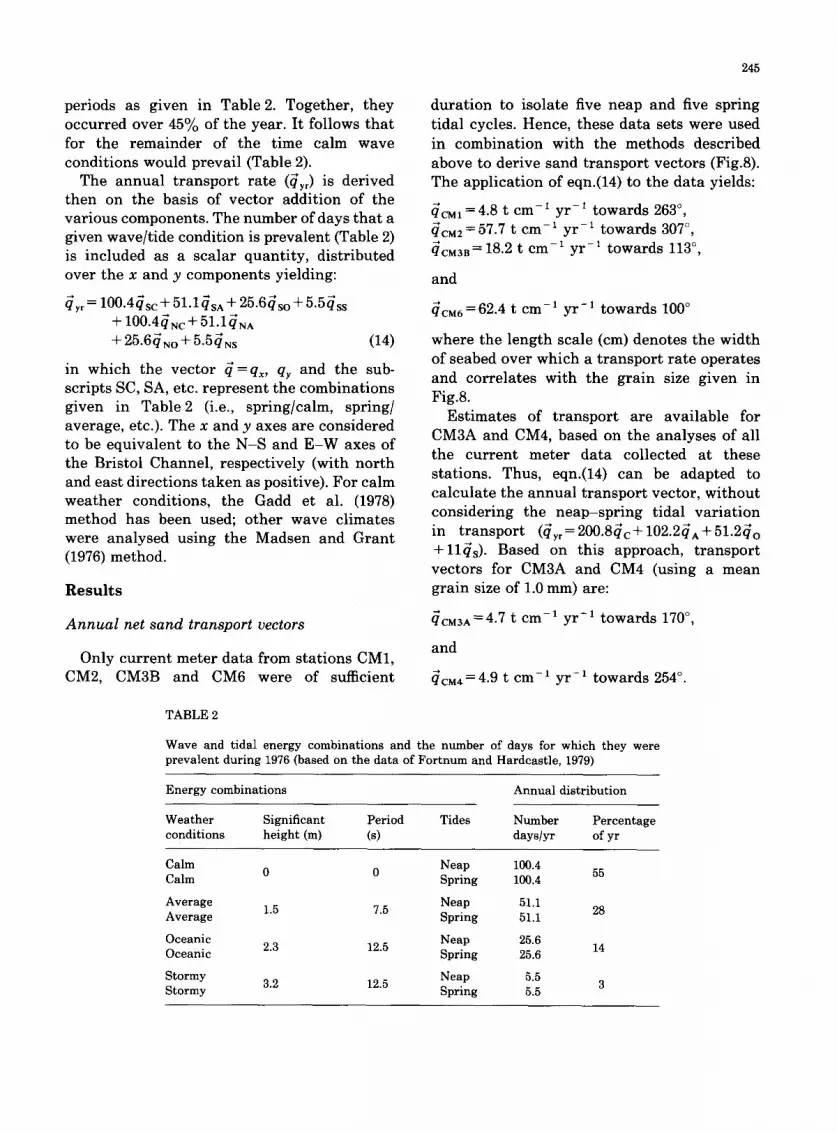
periods as given in Table 2. Together, they occurred over 45#/0 of the year. It follows that for the remainder of the time calm wave conditions would prevail (Table 2).
The annual transport rate (qyr) is derived then on the basis of vector addition of the various components. The number of days that a given wave/tide condition is prevalent (Table 2) is included as a scalar quantity, distributed over the x and y components yielding:
qyr = 100"4qsc + 51"lqsA + 25"6qso + 5.5qss + 100.4(1NC + 51.1~NA + 25-6~NO + 5-5~NS (14)
in which the vector ~=q~, qy and the sub- scripts SC, SA, etc. represent the combinations given in Table2 (i.e., spring/calm, spring/ average, etc.). The x and y axes are considered to be equivalent to the N-S and E-W axes of the Bristol Channel, respectively (with north and east directions taken as positive). For calm weather conditions, the Gadd et al. (1978) method has been used; other wave climates were analysed using the Madsen and Grant (1976) method.
Results
Annual net sand transport vectors
Only current meter data from stations CM1, CM2, CM3B and CM6 were of sufficient
duration to isolate five neap and five spring tidal cycles. Hence, these data sets were used in combination with the methods described above to derive sand transport vectors (Fig.8). The application of eqn.(14) to the data yields:
qCM1 = 4.8 t cm- 1 y r - 1 towards 263 °, qcM2 = 57.7 t cm- 1 yr - 1 towards 307 °, (lCM3B = 18.2 t cm- 1 y r - 1 towards 113 °,
and
qcM6 = 62.4 t cm-1 yr-1 towards 100 °
where the length scale (cm) denotes the width of seabed over which a transport rate operates and correlates with the grain size given in Fig.8.
Estimates of transport are available for CM3A and CM4, based on the analyses of all the current meter data collected at these stations. Thus, eqn.(14) can be adapted to calculate the annual transport vector, without considering the neap-spring tidal variation in transport (~yr=200.S~c+102.2~A+51.2~O +l l~s ) . Based on this approach, transport vectors for CM3A and CM4 (using a mean grain size of 1.0 mm) are:
qCM3A = 4.7 t cm- 1 y r - 1 towards 170 °,
and
qcM4 = 4.9 t cm- 1 y r - 1 towards 254 °.
TABLE2
Wave and tidal energy combinations and the number of days for which they were prevalent during 1976 (based on the data of Fortnum and Hardcastle, 1979)
Energy combinations Annual distribution
Weather Significant Period Tides Ntunber Percentage conditions height (m) (s) days/yr of yr
Calm 0 0 Neap 100.4 55 Calm Spring 100.4
Average 1.5 7.5 Neap 51.1 28 Average Spring 51.1
Oceanic 2.3 12.5 Neap 25.6 14 Oceanic Spring 25.6
Stormy 3.2 12.5 Neap 5.5 3 Stormy Spring 5.5

246
GRAIN S IZE
( m m )
SPRING TIDE
C A L M A V E R A G E O C E A N I C S T O R M Y
NEAP TIDE
C A L M A V E R A G E O C E A N I C S T O R M Y
STATION
o.,, © © Q Q 315 70 318 648
3904 3130 4890 9970
, o Q Q Q Q 1423 491 654 831
Q Q Q Q 3474 3500 5200 8710
. o © Q Q Q 313 66 93 524
o.,o © © © Q 278 107 400 1100
17 135 43 201
Q Q O © 1489 1 5 42 195
Q Q Q Q 149 48 139 305
© Q Q Q 87 63 770 2650
Q Q Q Q , 4 21 80 206
© Q Q © , 5 68 275 3600
Fig.8. Comparison of stations CM1, 2, 3B, 6, I and J transport vectors under differing tidal (neap--spring) and surface wave (calm, average, oceanic or stormy) conditions. The numbers below each circle indicate the sand transport rate (10 -3 g cm 1 s-1) of the grain size given in the left-hand column, in the direction indicated by the arrow within the circle.
Zones of net bedload transport
The data presented above regarding net bedload t ransport directions complement that which is summarised in Figs.5 and 6 and suggest a new ebb-flood zonation for the channel (Fig.9). Transport is interpreted to be primarily towards the west (ebb dominant) in the mid-channel areas with narrow, flood- dominated coastal zones occurring along the channel boundaries. This represents the mutu- ally evasive transport pat tern described pre-
viously and is considered here to be an al ternative to the bedload parting zone model (Johnson et al., 1982). The two models are distinguished by the boundary lines which separate opposing sand streams. Boundaries separating mutually evasive ebb and flood zones of net t ransport generally trend parallel to the axis of an estuary or tidal channel (Fig.9); in contrast, bedload parting zones generally trend normal to such axes (Harris and Collins, 1985).
Two areas of exception to the overall mutu-

247
occurs at both stations CM1 and I, under neap tides and increased (oceanic and stormy) superimposed wave energy (i.e., for 31.3 days yr-~; Fig.8), although at much reduced rates:
qCM1 = 0.19 t cm-1 y r - l towards 046 °,
and
~j = 0.23 t cm- 1 yr - 1 towards 087 °.
Fig.9. Inferred locations of ebb- and flood-dominant zones of net sand transport in the Bristol Channel based on data from the present study supplemented with that presented in Figs.5 and 6. Location of the transect from Nash Point to Minehead Bluff and the sonograph presented in Fig.10 are shown. Sediment flux across the transect is estimated as described in the text.
ally evasive pattern occur along the coastline to the south of Nash Point and in the Breaksea Valley (Fig.9). Transport close inshore (within 1 km) and directly south of Nash Point (CM2) was towards the west (ebb dominant) and in the Breaksea Valley (several kilometres off- shore), it was towards the east (i.e., flood- dominant) (see vectors for CM3B, Fig.8). How- ever, within 100 m of the valley (i.e., on the surrounding areas of more elevated seabed), transport was towards the west (as indicated by the vectors of CM4).
Reversal of transport directions
For comparison with the annual bedload transport predictions for CM1 (for the present investigation, see Fig.8), transport vectors from stations I and J of Pat t iaratchi and Collins (1984) are used. The locations of stations CM1, I and J are shown in Fig.5.
The application of eqn.(14) to the data from stations I and J (Fig.8) gives:
ql = 3.2 t cm- 1 yr - 1 towards 284 °,
and
~j = 6.2 t cm- 1 y r - 1 towards 258 °.
On an annual basis, therefore, there is domi- nant westerly transport at all three stations (CM1, I and J). However, easterly transport
D i s c u s s i o n
Mutually evasive transport patterns in the Bristol Channel
Zones of ebb and flood dominance in the Bristol Channel (Fig.9) may be explained generally in terms of mutually evasive tidal currents. Inshore zones of flood dominance are suggested also in the output from numerical models as represented by the M2-M4 bed shear stress vector diagram (c.f. Figs.4 and 9). Geologically, the significance of these inshore zones is as an explanation for the occurrence of offshore-derived sands in deposits at the up- stream end of the channel (Culver and Banner, 1978; Hamilton et al., 1980; Merefield, 1982). Such a model might also be applicable to other areas where allochthonous sediments are de- posited in a similar, up:stream setting (Kamps, 1963; Buller et al., 1975; Collins et al., 1981).
The traditional explanation for the cause of mutually evasive transport patterns in tidal estuaries (i.e., that the momentum of mid- channel ebb flow prolongs its influence beyond the time of low water with flood currents occur- ring inshore) does not appear to explain the up- channel (flood-dominant) movement predicted by the Breaksea Valley data (CM3B, Fig.8). Similar patterns were reported by Ludwick (1975) from the Chesapeake Bay entrance where areas of flood dominance were "mostly in or related to channels". Further research is required to explain this phenomenon.
Significance of "reversed" transport vectors
Patt iaratchi and Collins (1984) have shown that net transport directions can be reversed
248
under the combined action of neap tides and increased surface wave activity, from direc- tions of t ransport resulting from tidal currents acting alone (station I, Fig.8). A similar pat tern was observed in the data collected at stations CM1 and CM2 in the present study (i.e., there was reversal in the direction of t ransport under neap tides in combination with oceanic stormy wave conditions). In order to assess the significance of such reversed transport directions, with respect to the net (long-term) t ransport paths, tidal and wave components giving rise to the variat ion have been evaluated over a 1 yr period for stations CM1 and I (see above).
These results show that t ransport in the reversed (easterly) direction amounts to ap- proximately 4% and 10% of the total annual (westward) t ransport at stations CM1 and I, respectively. Thus, within the context of an annual budget of sediment passing a fixed observation point, the reversed transport is of little significance. Within the context of the present interpretat ion of mutually evasive ebb and flood zones, however, "reversed" sand transport at stations CM1 and I (i.e., within an ebb-dominant zone) provides a mechanism for sand supply to the adjacent (inshore) flood- dominant zone. In this way, sand initially moving down channel could be removed in- shore and be subsequently transported in an up-channel direction. The net effect, over many years perhaps, would be that sand becomes concentrated along the coastline and removed from the mid-channel, offshore areas. Such a distribution can be observed presently in the surficial sediments of the channel (Fig.2).
Estimating sand flux into and out of the channel
Calculations of sand flux (F) can be made based on current meter data collected at locations along a transect from Nash Point to Minehead Bluff. Flux into the upper channel and Severn Estuary (F(in)) occurs in flood- dominated zones of net t ransport and F(out) occurs in ebb zones (as defined in Fig.9). The
cross section trends normal to the axis of the channel, running from north to south at about 010 °. Since only t ransport vectors normal to this line will result in sand being removed across it, then:
F(in)=~loo c x CX
and
F(out) = q2so,~ x CX (15)
where CX is the length along the transect over which a given vector can be extrapolated, and 41oo o and ~28o o are the t ransport vectors normal to the transect moving sand into and out of the upper channel, respectively.
F(in) is supplied through the southern flood zone (CM6) and the Breaksea Valley (CM3A and 3B). The transport rate at CM6 is 62.4 t cm-1 yr 1, towards 100 °. Assuming the flood zone off Minehead Bluff to be 0.75 km in width, F(in) = 46.8 x 10⁵ t y r 1.
The second flood zone, the Breaksea Valley, has a width of about 1 km. Extrapolat ing the transport rate at CM3B (18.2 t cm-I yr 1 towards 113 °) across this (1 km) width yields: F(in) = 17.7 x 10⁵ t y r - 1. The total F(in)-- 64.5 x 10 ~ t yr
F(out) occurs over the remainder of the ebb- dominant cross section, with a width of 17.5 km, and may be divided into two parts: (1) the area immediately south of Nash Point, represented by CM2, and (2) the remaining part of the cross section, in deeper water, repre- sented by CM4. At Nash Point, there is a 1 km wide patch of sand adjacent to the coastline and CM2 can be used to estimate F(out) for this nearshore region. The t ransport rate at CM2 was 57.7 t cm -1 yr ~ towards 307 °. Such a vector is 27 ° from normal to the cross section and, thus, eqn.(15) yields F(out)=51.4 x 10⁵ t
1 yr The remaining deep-water part of the (ebb-
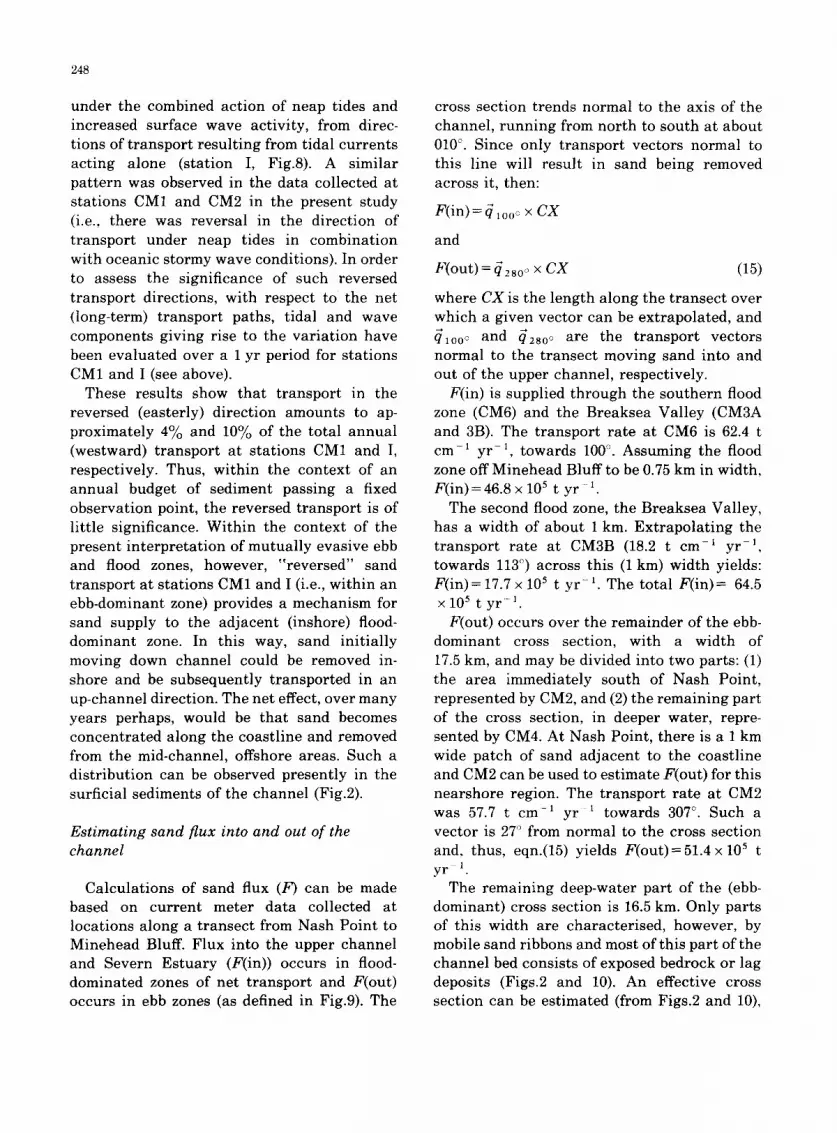
dominant) cross section is 16.5 kin. Only parts of this width are characterised, however, by mobile sand ribbons and most of this part of the channel bed consists of exposed bedrock or lag deposits (Figs.2 and 10). An effective cross section can be estimated (from Figs.2 and 10),
oo
0 0
(D
0
~9 _o
249
250
therefore, as the sum of the dimensions along the cross section of sand ribbon and sediment- covered channel bed; this is about 2.7km. Assuming that the t ransport rate of CM4 is most applicable to these offshore areas, a t ransport rate of 4.9 t cm- 1 y r - 1 towards 254 ° can be used, yielding F(out) = 12.3 x 10⁵ t y r - I.
The combined total of F(out) is to 63.7 × 10⁵ t yr 1 and, hence, the difference between F(in) and F(out) is only 1.1 × l0 s t y r - i (towards the east). We consider that these results indicate a balanced sand flux, with nearly equal amounts of sand being transported into and out of the upper channel and Severn Estuary annually; the net sand flux is equal to zero.
Such a balanced sand flux (of about 64 × 105 t yr 1) with a net (eastward) flux of only 1.1 × 10⁵ t yr -1 may be relevant to the manage- ment of commercial sand deposits within the Bristol Channel. The present rate of aggregate extraction from channel deposits (i.e., sand mining) is approximately 20x10 s t yr -1 (Parker and Kirby, 1982).
Summary and conclusions
The available data from the Bristol Channel (including seabed drifter recovery patterns, sand tracer studies, heavy mineral distribu- tions, bedform orientations, current meter data and numerical model predictions) have been used to define net bedload t ransport patterns, which we interpret as "mutual ly evasive" in nature. Thus, ebb-dominant t ransport occurs in the mid-channel with flood-dominant trans- port occurring within narrow coastal bound- ary zones. Zones of ebb or flood dominance in the channel are delimited by boundary lines which separate opposing directions of net t ransport and which trend nearly parallel to the axis of the channel (Fig.9): this or ientat ion distinguishes them from bedload parting zones proposed previously by other investigators, which trend normal to the channel axis (John- son et al., 1982; Harris and Collins, 1985).
Under the combined action of neap tides and intense surface (wind) wave activity, direc- tions of net bedload t ransport are reversed (by
up to 165 ° ) from the direction of t ransport occurring under other combinations of tidal phase and surface wave activity. The signifi- cance of such t ransport paths is that they are considered to be a means of supplying sand to inshore flood-dominated zones, ra ther than as a direct supply to inshore depocentres. Up- channel t ransport within such coastal zones could explain the presence of shelf-derived sands in the deposits found at the up-stream end of the Bristol Channel and, possibly, in other similar tidally dominated estuaries.
Long-term current meter data have confirmed that net ebb and flood transport occurs along one transect normal to the channel axis; this has been interpreted to represent flood-dominant zones along the southern coastline and in the Breaksea Valley, with ebb-dominant t ransport occurring along the nor thern (Nash Point) coastline and throughout the remaining mid-channel areas. Annual bedload t ransport rates estimated for each of the zones and extrapolated across the transect yield an estimate of annual flux into and out of the upper channel and Severn Estuary. The estimated fluxes are of about equal magnitude, at about 64x 105 t yr -1 Within the limits of precision possible in this type of computation, we interpret the results as indicating a trend towards "equilibrium" con- ditions for sand deposition within the Bristol Channel estuarine system.
Acknowledgements
The authors would like to extend their thanks to: Capt. Brian Davies and the crew of R.V. Venturous; Phil Taylor, Bill Miller and Robin Powell of (NERC) Research Vessel Services, Barry (Wales), for their help in making available and deploying the current meters; Dr. Chari tha Pat t iaratchi , who provided the computer programs used to derive the results presented herein; Dr. Chris Evans of the British Geological Survey (BGS), for pro- viding sidescan sonar data; Mr. Len Hay for draughting the figures and Ms. Jan Greengo (Swansea) and Mrs. Muriel Baxter (Sydney) for
251
their typing services. The manuscript was finalised whilst PTH was in receipt of an Australian Bureau of Mineral Resources Post- doctoral Fellowship and MBC was in receipt of a Visiting Fellowship at St. John's College, Cambridge, affiliated with the Department of Earth Sciences. This contribution is Earth Sciences Contribution No. 1217 of the Univer- sity of Cambridge.
References
Admiralty, 1974. West Coasts of England and Wales Pilot. Hydrogr. of the Navy, Taunton, U.K., l l t h ed., 225 pp.
Admiralty, 1983. Admiralty Tide Tables. Vol.1, European Coastal Waters. Hydrogr. of the Navy, Taunton, U.K., 435 pp~
Allen, J.R.L., 1987. Reworking of muddy intertidal sedi- ments in the Severn Estuary, southwestern U.K. A preliminary survey. Sediment. Geol., 50: 1-23.
Amos, C.L. and Asprey, K.W., 1981. An interpretation of oceanographic and sediment data from the Upper Bay of Fundy. Bedford Inst. Oceanogr. Rep. Ser., BI-R-81-15, 23 pp.
Banner, F.T., Brooks, M. and Williams, E., 1971. The geology of the approaches to Barry, Glamorgan. Proc. Geol. Assoc., 82: 231-248.
Barrie, J.V., 1980. Heavy mineral distribution in bottom sediments of the Bristol Channel, U.K. Estuarine Coastal Mar. Sci., 11: 369-381.
Bowden, K.F., 1983. Physical Oceanography of Coastal Waters. Wiley, Chichester, 302 pp.
British Geological Survey, 1986. Bristol Channel sheet 51°N, 04°W, series 1:250,000, sea bed sediments and Quaternary geology. Ordnance Surv. Southampton (printers).
Buller, A.T., Green, C.D. and McManus, J., 1975. Dynamics and sedimentation: the Tay in comparison with other estuaries. In: J. Hails and A. Carr (Editors), Nearshore Sediment Dynamics and Sedimentation. Wiley, London, pp.201-250.
Collins, M.B., 1983. Supply, distribution, and transport of suspended sediment in a macrotidal environment: Bristol Channel, U.K. Can. J. Fish. Aquat. Sci., 40(1): 44-59.
Collins, M.B. and Ferentinos, G.K., 1984. Residual circula- tion in the Bristol Channel as suggested by Woodhead sea-bed drifter recovery patterns. Oceanol. Acta, 7(1): 33-42.
Collins, M.B., Pattiaratchi, C.B., Banner, F.T. and Feren- tinos, G.K., 1980. The supply of sand to Swansea Bay. In: M.B. Collins et al. (Editors), Industrialised Embayments and their Environmental Problems. Pergamon, London, pp.193 213.
Collins, M.B., Amos, C.L. and Evans, G., 1981. Observa- tions of some sediment transport processes over the
intertidal fiats, The Wash, U.K. Int. Assoc. Sedimentol. Spec. Publ., 5: 81-98.
Culver, S.J. and Banner, F.T., 1978. Foraminiferal assem- blages as Flandrian palaeo-environmental indicators. Palaeogeogr. Palaeoclimatol. Palaeoecol., 24: 53-72.
Dyer, K.R., 1984. Sedimentation processes in the Bristol Channel/Severn Estuary. Mar. Pollut. Bull., 15(2): 53-57.
Einstein, H.A., 1950. The bedload function for sediment transportation in open channel flows. U.S. Dep. Agric. Tech. Bull. 1026, 71 pp.
Evans, D.J. and Thompson, M.S., 1979. The geology of the central Bristol Channel and the Lundy area, S.W. Approaches, British Isles. Proc. Geol. Assoc., 90: 1-14.
Fortnum, B.C.H. and Hardcastle, J.J., 1979. Waves re- corded at Port Talbot on the South Wales coast, Inst. Oceanogr. Sci. U.K., Rep. No. 78/79, 8 pp.
Gadd, P.E., Lavelle, J.W. and Swift, D.J.P., 1978. Estimates of sand transport on the New York shelf using near bottom current meter observations. J. Sediment. Petrol., 48:239 252.
Gibbs, R.J., Mathews, M.D. and Link, D.A., 1971. The relationship between sphere size and settling velocity. J. Sediment. Petrol., 41: 7-18.
Grant, W.D. and Madsen, O.S., 1979. Combined wave and current interaction with a rough bottom. J. Geophys. Res., 84(C4): 1797-1808.
Hamilton, D., 1979. The high energy, sand and mud regime of the Severn Estuary, S.W. Britain. In: R.T. Severn et al. (Editors), Tidal Power and Estuary Management. Proc. Symp. Colston Res. Soc., pp.162-172.
Hamilton, D., Sommerville, J.H. and Stanford, P.N., 1980. Bottom currents and shelf sediments southwest of Britain. Sediment. Geol., 26: 115-138.
Hamilton, P., 1973. The circulation of the Bristol Channel. Geophys. J.R. Astron. Soc., 32: 409-422.
Hardisty, J., 1983. An assessment and calibration of formulations for Bagnold's bedload equation. J. Sedi- ment. Petrol., 53(3): 1007-1010.
Harris, P.T., 1982. The distribution and dynamics of sedimentary bedforms in the Central and Inner Bristol Channel. M.Sc. Thesis, Univ. Wales, Cardiff, 138 pp. (Unpubl.).
Harris, P.T., 1984. Patterns of sediment transport in the Bristol Channel. Ph.D. Thesis, Univ. Wales, Cardiff, 248 pp. (Unpubl.).
Harris, P.T., in press. Large-scale bedforms as indicators of mutually evasive sand transport and the sequential infilling of wide-mouthed estuaries. Sediment. Geol.
Harris, P.T. and Collins, M.B., 1985. Bedford distributions and sediment transport paths in the Bristol Channel and Severn Estuary, U.K. Mar. Geol., 62: 153-166.
Harris, P.T. and Jones, M.R., 1988. Bedform movement in a marine tidal delta: air photo interpretations. Geol. Mag., 125(1): 31-49.
Harris, P.T., Ashley, G.M., Collins, M.B. and James, A.E., 1986. Topographic features of the Bristol Channel seabed: a comparison of SEASAT (synthetic aperture radar) and side-scan sonar images. Int. J. Remote Sens., 7(1): 119-136.
Hawkins, A.B., 1971. Sea level changes around southwest
252
England. In: A.J. Blackman (Editor), Marine Archaeol- ogy. Proc. Symp. Colston Res. Soc., 23rd, pp.267 292.
Heathershaw, A.D. and Hammond, F.D.C., 1980. Transport and deposition of non-cohesive sediments in Swansea Bay. In: M.B. Collins et al. (Editors), Industrialised Embayments and their Environmental Problems. Perga- mon, London, pp.215-247.
Heathershaw, A.D., Blackley, M.W.L. and Hardcastle, P.J., 1980. Wave direction estimates in coastal waters using radar. Coastal Eng., 3:249 267.
Johnson, M.A., Kenyon, N.H., Belderson, R.H. and Stride, A.H., 1982. Sand Transport. In: A.H. Stride (Editor), Offshore Tidal Sands. Chapman and Hall, London, pp.58 94.
Kamps, L.F., 1963. Mud distr ibution and land reclamation in the Eastern Wadden Shallows. Publ. No. 9, Int. Inst. Land Reclam. Improv., Wageningen, Neth., 99 pp.
Kenyon, N.H. and Stride, A.H., 1970. The tide-swept cont inental shelf sediments between the Shetland Isl- ands and France. Sedimentology, 14:159 173.
Ludwick, J.C., 1975. Tidal currents, sediment t ranspor t and sand banks in Chesapeake Bay entrance, Virginia. In: L.E. Cronin (Editor), Estuar ine Research. Academic Press, New York, Vol.2, pp.365 380.
Madsen, O.S. and Grant, W.D., 1976. Sediment t ransport in the coastal environment. Rep. No. 209, Ralph Parsons Lab. for Water Res. Hydrodyn., Dep. Civ. Eng., Mass. Inst. Technol., 105 pp.
McDowell, D.M. and O'Connor, B.A., 1977. Hydraulic Behavior of Estuaries. MacMillan, London, 292 pp.
Merefield, J.R., 1982. Modern carbonate marine-sands in estuaries of southwest England. Geol. Mag., 119(6): 567 580.
Miller, M.C., McCave, I.N. and Komar, P.D., 1977. Threshold of sediment motion under unidirectional currents. Sedimentology, 24:507 527.
North, F.J., 1955. The Evolution of the Bristol Channel. Natl. Mus. Wales, Cardiff, 102 pp.
Owen, A., 1980. The tidal regime of the Bristol Channel: a numerical modelling approach. Geophys. J.R. Astron. Soc., 62:59 75.
Parker, W.R. and Kirby, R., 1982. Sources and t ranspor t pat terns of sediment in the Inner Bristol Channel and Severn Estuary. In: Severn Barrage. Proc. Symp. Inst. Civ. Eng., London. Thetford Press, Nottingham, pp.181 194.
Pat t iaratchi , C.B., 1981. Estimates of sand t ranspor t under
waves and tidal currents. M.Sc. Thesis, Univ. Wales, Cardiff, 194 pp. (Unpubl.).
Pat t iaratchi , C.B. and Collins, M.B., 1984. Sediment t ranspor t under waves and tidal currents: a case study from the nor thern Bristol Channel, U.K. Mar. Geol., 56: 27 40.
Pat t iaratchi , C.B. and Collins, M.B., 1985. Sediment t ransport under the combined influence of waves and tidal currents: an assessment of available formulae. Mar. Geol., 67:83 100.
Pingree, R.D. and Griffiths, D.K., 1979. Sand t ranspor t paths around the Brit ish isles result ing from M 2 and M 4 tidal interactions. J. Mar. Biol. Assoc. U.K., 59:497 513.
Potts, E.A., 1968. The geomorphology of the sand dunes of South Wales, with special reference to the Gower. Ph.D. Thesis, Univ. Wales, Cardiff, 348 pp. (Unpubl.).
Reinson, G.E., 1977. Tidal current control of submarine morphology of the mouth of the Miramichi Estuary, New Brunswick. Can. J. Ear th Sci., 14:2524 2532.
Richardson, E.V. and Simons, D.B., 1967. Resistance to flow in sand channels. Congr. Int. Assoc. Hydraul. Res., 12th (Fort Collins, Colo.).
Robinson, A.H.W., 1956. The submarine morphology of certain port approach channel systems. J. Inst. Navig., 9(1): 20---46.
Robinson, A.H.W., 1960. Ebb flood channel systems in sandy bays and estuaries. Geography, 45: 183-- 199.
Robinson, I.S., 1979. The tidal dynamics of the Irish and Celtic Seas. Geophys. J.R. Astron. Soc., 56:159 197.
Steers, J.A., 1964. The Coastline of England and Wales. Cambridge Univ. Press, Cambridge, 750 pp.
Sternberg, R.W., 1968. Frict ion factors in tidal channels with differing bed roughness. Mar. Geol., 6: 243-260.
Uncles, R.J., 1982. Computed and observed residual currents in the Bristol Channel. Oceanol. Acta, 5(1): 11 20.
Uncles, R.J., 1984. Hydrodynamics of the Bristol Channel. Mar. Pollut. Bull., 15(2): 47 53.
Van Veen, J., 1950. Ebb- and flood-channels in the Dutch tidal waters: K. Ned. Aardrijkskd. Genoot. Tijdschr., 67: 303 325.
Wright, L.D., Coleman, J.M. and Thom, B.G., 1975. Sediment t ranspor t and deposition in a macrotidal river channel: Ord River, Western Australia. In: L.E. Cronin (Editor), Estuar ine Research. Academic Press, New York, Vol.2, pp.309-322.


