Embed Size (px)
Citation preview

Estimating Intracellular Calcium Concentrations and Buffering withoutWavelength Ratioing
M. Maravall, Z. F. Mainen, B. L. Sabatini, and K. SvobodaCold Spring Harbor Laboratory, Cold Spring Harbor, New York 11724 USA
ABSTRACT We describe a method for determining intracellular free calcium concentration ([Ca21]) from single-wavelengthfluorescence signals. In contrast to previous single-wavelength calibration methods, the proposed method does not requireindependent estimates of resting [Ca21] but relies on the measurement of fluorescence close to indicator saturation duringan experiment. Consequently, it is well suited to [Ca21] indicators for which saturation can be achieved under physiologicalconditions. In addition, the method requires that the indicators have large dynamic ranges. Popular indicators such asCalcium Green-1 or Fluo-3 fulfill these conditions. As a test of the method, we measured [Ca21] in CA1 pyramidal neuronsin rat hippocampal slices using Oregon Green BAPTA-1 and 2-photon laser scanning microscopy (BAPTA: 1,2-bis(2-aminophenoxy)ethane-N,N,N9,N9-tetraacetic acid). Resting [Ca21] was 32–59 nM in the proximal apical dendrite. Monitoringaction potential-evoked [Ca21] transients as a function of indicator loading yielded estimates of endogenous bufferingcapacity (44–80) and peak [Ca21] changes at zero added buffer (178–312 nM). In young animals (postnatal days 14–17) ourresults were comparable to previous estimates obtained by ratiometric methods (Helmchen et al., 1996, Biophys. J.70:1069–1081), and no significant differences were seen in older animals (P24–28). We expect our method to be widelyapplicable to measurements of [Ca21] and [Ca21]-dependent processes in small neuronal compartments, particularly in themany situations that do not permit wavelength ratio imaging.
INTRODUCTION
The spatial and temporal dynamics of intracellular freecalcium ([Ca21]) are crucial to many aspects of neuronalfunction. Neuronal excitation produces Ca21 influx into thecytoplasm, where Ca21 drives many intracellular signaltransduction cascades. In addition, the measurement of[Ca21] has been used to report on membrane excitation(Regehr et al., 1989; Jaffe et al., 1992; Helmchen et al.,1996; Schiller et al., 1997; Svoboda et al., 1999) and syn-aptic activation (Muller and Connor, 1991; Murphy et al.,1994; Yuste and Denk, 1995; Denk et al., 1995; Koester andSakmann, 1998; Mainen et al., 1999b) in small neuronalcompartments that are inaccessible to other experimentaltechniques. Techniques for quantifying [Ca21] in smallstructures are therefore of great interest in neurobiology.
The most popular approach to measuring intracellularfree [Ca21] has been ratiometric imaging using the UV-excited [Ca21] indicator Fura-2 (Grynkiewicz et al., 1985)and its relatives. With this method, [Ca21] is calculatedfrom a ratio of fluorescences at two excitation wavelengths,R 5 Fl1/Fl2. Taking this ratio facilitates quantitative mea-surement of [Ca21] by canceling out optical pathlength,excitation intensity, and detector efficiency. The well-known calibration equation (Grynkiewicz et al., 1985) is
@Ca21#
KD5 SR2 Rmin
Rmax 2 RDSSf2
Sb2D (1)
whereRmin and Rmax are the ratios at zero and saturating[Ca21] andSf2/Sb2 is the ratio of calcium-free over calcium-bound fluorescence intensities atl2. The derivation of[Ca21] thus depends on four parameters that have to beindependently calibrated. Using indicators such as Indo-1(Grynkiewicz et al., 1985), it is also possible to use emissionwavelength ratioing.
Several factors conspire to make ratiometric imaging insmall structures difficult, especially in intact tissues. Dual-excitation sources are difficult and expensive to implementin laser scanning microscopy, as in two-photon laser scan-ning microscopy (2PLSM) (Denk et al., 1990; Denk andSvoboda, 1997). The small and noisy fluorescence signalsmeasured from small compartments produce even noisierdual-wavelength ratios, making [Ca21] estimation prone toconsiderable errors. In addition, with Fura-2, the need towork with UV excitation light is disadvantageous because itis absorbed by living tissue, producing autofluorescence andphotodamage.
Visible-light indicators such as the 1,2-bis(2-aminophe-noxy)ethane-N,N,N9,N9-tetraacetic acid (BAPTA)-based in-dicators Oregon Green BAPTA-1 (OGB-1), Calcium Green1 (Haugland, 1996), Fluo-3 (Minta et al., 1989), and theirrelatives have thus become increasingly popular. Uponbinding to Ca21, these dyes increase their quantum effi-ciency without a shift in absorption spectra. The ratios ofbrightnesses of the calcium bound and unbound forms canbe very large (.10), providing the large signal-to-noiseratios required for [Ca21] imaging in small neuronal struc-tures, such as dendritic spines and axon terminals (Murphyet al., 1994; Yuste and Denk, 1995; Koester and Sakmann,1998; Mainen et al., 1999b; Schiller et al., 1998). Theseindicators are well suited to 2PLSM imaging in intact tissue
Received for publication 28 June 1999 and in final form 13 January 2000.
Address reprint requests to Dr. Karel Svoboda, Cold Spring Harbor Lab-oratory, 1 Bungtown Rd., Cold Spring Harbor, NY 11724. Tel.: 516-367-6878; Fax: 516-367-8866; E-mail: [email protected].
© 2000 by the Biophysical Society
0006-3495/00/05/2655/13 $2.00
2655Biophysical Journal Volume 78 May 2000 2655–2667

(Yuste and Denk, 1995; Koester and Sakmann, 1998;Mainen et al., 1999b) and even in vivo (Svoboda et al.,1997, 1999).
Available visible light indicators do not allow wavelengthratioing (Minta et al., 1989; Tsien and Waggoner, 1995).Instead, signals resulting from [Ca21] changes (D[Ca21])are typically expressed as ratios of fluorescence changesover baseline fluorescence, (f 2 fo)/fo. As with wavelengthratio measurements, (f 2 fo)/fo is independent of dye con-centration, optical path length, excitation intensity, and de-tector efficiency. However, (f 2 fo)/fo is a sublinear functionof D[Ca21]: large changes in [Ca21] saturate the indicator(Minta et al., 1989; Tsien and Waggoner, 1995; O’Malley etal., 1999). Additionally, (f 2 fo)/fo depends on baseline[Ca21], [Ca21]0.
A variety of methods have been devised to translatesingle-wavelength fluorescence into [Ca21]. For example,D[Ca21] per action potential was estimated in presynapticterminals in the cerebellum (Regehr and Atluri, 1995) andthe frog tectum (Feller et al., 1996). This calibration is basedon the fact that each action potential in a train that saturatesthe Ca21 indicator contributes the sameD[Ca21]. The curvedescribing the saturation can be used to extractD[Ca21] peraction potential. However, this scheme requires assump-tions about resting [Ca21] or separate ratiometric measure-ments of this quantity. Similar requirements are shared byother methods (Minta et al., 1989; Jaffe et al., 1992; Lev-Ram et al., 1992; O’Malley, 1994; Schiller et al., 1995; Lauet al., 1999). Kao et al. (1989) introduced a variation on thisapproach that requires the use of Ca21 ionophores, which isirreversible and impractical in intact tissue. An interestingalternative employed in frog muscle fibers used simulta-neous absorption and fluorescence measurements to esti-mate resting [Ca21] (Harkins et al., 1993; Kurebayashi etal., 1993). However, absorbance measurements are notpractical at the length scale of subneuronal compartments,especially in intact tissue.
We describe an alternative approach that is particularlyuseful for measurements in small structures and is mosteasily implemented by using high-affinity indicators with alarge dynamic range. It involves the calibration of a smallernumber of parameters than previous methods and does notrequire prior assumptions or calibration of resting [Ca21].Moreover, it naturally yields estimates of resting [Ca21] inaddition to estimates ofD[Ca21]. The key parameter thatneeds to be determined as part of an experiment is thefluorescence at saturating [Ca21]. The method also relies onestimates of the dynamic range and dissociation constant ofthe indicator; these are properties of the indicator and neednot be repeated for every experiment. We introduce a prac-tical procedure for evaluating these parameters under phys-iologically reasonable conditions with high-affinity, largedynamic range indicators such as OGB-1. We also discusshow the resulting estimates of [Ca21] are robust in the faceof small errors in parameter calibration (Appendix B). The
method provides a practical way to measure absolute resting[Ca21] and [Ca21] transient amplitudes in CA1 pyramidalneurons, as well as to compute Ca21 buffering capacity inthese neurons.
THEORY: RELATIONSHIP BETWEENFLUORESCENCE AND [Ca21]
The relationship between single-wavelength fluorescenceand [Ca21] (Tsien, 1989) is straightforward to computewhen Ca21 is in equilibrium with an indicator (.2 ms;Sabatini and Regehr, 1998). The relationship between free[Ca21] and the concentration of Ca21 bound to the fluoro-phore, [FCa], is given by the law of mass action:
@FCa# 5@F#T@Ca21#
KD 1 @Ca21#. (2)
Fluorescence for a single-wavelength dye can be written asf 5 SF[F] 1 SFCa[FCa] 5 SF[F]T 1 (SFCa 2 SF)[FCa],where SF and SFCa are coefficients describing the bright-nesses of the indicator’s unbound and bound forms, and[F]T is its total concentration. Because fluorescence inten-sities at maximum and minimum [Ca21] are given byfmax5SFCa[F]T and fmin 5 SF[F]T, respectively, it follows that[Ca21] can be expressed as (Tsien, 1989)
@Ca21#
KD5
f 2 fmin
fmax 2 f. (3)
This relationship is difficult to use in practice, mainly be-causefmin cannot be evaluated in situ under the same con-ditions as the measurements of interest, because it requiresthe reduction of resting [Ca21] (O’Malley et al., 1999).Furthermore, it is not clear where experimental measure-ments fall within the range of the indicator: the fluorescenceat rest,f0, can differ fromfmin in an uncontrolled way. Thereason for this is that cellular resting [Ca21] levels appear tovary widely (20–200 nM) (Nakajima et al., 1993) anddepend on the state and type of the cell and the quality of therecording (Kennedy and Thomas, 1996; O’Malley et al.,1999). Such resting levels are far from negligible for high-affinity calcium indicators (KD ' 200 nM), typically mak-ing f0 much larger thanfmin.
However, Eq. 3 becomes more illuminating if it is recastin terms of the indicator’s dynamic range,Rf 5 fmax/fmin.
@Ca21#
KD5
f/fmax 2 1/Rf
1 2 f/fmax. (4)
For indicators with a large dynamic range the exact value ofRf is insignificant, because the term 1/Rf will typically bemuch smaller thanf/fmax. This situation applies for Fluo-3(Rf ' 50–200,KD ' 500 nM; Harkins et al., 1993) and forFluo 4 (Rf ' 85–100,KD ' 300 nM, unpublished data) andis schematically illustrated in Fig. 1A. Thus for Fluo-3 and
2656 Maravall et al.
Biophysical Journal 78(5) 2655–2667

similar indicators an estimate offmaxwill suffice to measureabsolute [Ca21]. For indicators with more modest dynamicranges, such as OGB-1,Rf does have to be considered andmust be estimated in situ (Fig. 1B). However, the dynamic
range is a property of the indicator and as such does notdepend on resting [Ca21] and other factors that may varybetween cells. Therefore it need not be determined in everyexperiment. This also holds for the indicator dissociationconstant. Also, the dependence of Eq. 4 on the fluorescencef is only through its ratio withfmax, eliminating dependenceson absolute fluorescence (and hence dye concentration,optical path length, excitation intensity, and detector effi-ciency).
Changes in [Ca21], D[Ca21] [ [Ca21] 2 [Ca21]0, asso-ciated with changes in fluorescence from baseline,df [ (f 2f0)/f0, are given by
D@Ca21#
KD5
fmax
f0~1 2 Rf
21!df
~dfmax 2 df!dfmax. (5)
Compared to Eq. 4, Eq. 5 depends even more weakly onRf
and is thus more robust against uncertainties in this quantity(see Appendix B). This is illustrated in Fig. 1C, where[Ca21] and D[Ca21] are “computed” geometrically.
Quantitation of [Ca21] and of D[Ca21] based on Eqs. 4and 5 depends on calibration of the parametersRf anddfmax,and of the dissociation constantKD (which enters only as ascaling factor).dfmax depends on factors that may varybetween neurons, in particular resting [Ca21], [Ca21]0. Itsdependence on [Ca21]0 is reflected in the equation
dfmax 5~1 2 Rf
21!
Rf21 1 @Ca21#0/KD
, (6)
which follows directly from the relationship between fluo-rescence and [Ca21], assuming that true saturation isreached. Inverting the relationship betweendfmax and[Ca21]0 provides a useful way to estimate resting [Ca21]:
@Ca21#0
KD5
~1 2 Rf21!
dfmax2 Rf
21. (7)
MATERIALS AND METHODS
Brain slice preparation and recording conditions
Hippocampal slices were prepared from juvenile rats (postnatal age (PND)14–30 days) in accordance with animal care and use guidelines of ColdSpring Harbor Laboratory. The brain was removed, sections of braincontaining the hippocampus were blocked, and 300-mm-thick slices werecut on a Vibratome (TPI, St. Louis, MO). These procedures were carriedout with the brain submerged in a chilled (2–5°C) cutting solution bubbledwith carbogen (95% O2/5% CO2). The cutting solution contained (in mM)110 choline chloride, 25 NaHCO3, 25 D-glucose, 11.6 Na ascorbate, 7MgSO4, 3.1 Na pyruvate, 2.5 KCl, 1.25 NaH2PO4, and 0.5 CaCl2. Sliceswere then transferred to a submerged holding chamber containing normalartificial cerebrospinal fluid (ACSF), incubated at 35°C for 30–60 min,and then held at room temperature until used. The composition of thenormal ACSF was (in mM) 127 NaCl, 25 NaHCO3, 25D-glucose, 2.5 KCl,2 CaCl2, 1 MgSO4, and 1.25 NaH2PO4. Experiments were performed at35 6 1°C. Patch electrodes (3–5 MV) were filled with a solution contain-ing (in mM) 135 K methylsulfonate, 10 HEPES, 10 Na phosphocreatine, 4MgCl2, 4 Na2ATP, 0.4 NaGTP. Oregon Green BAPTA-1 or Magnesium
FIGURE 1 Schematic representation of [Ca21] estimation based onmeasurements ofRf and fmax. (A) Relationship between fluorescence(f/fmax) and [Ca21] (units of KD). The case of very largeRf is illustrated,approximating the properties of Fluo-3. For a good lot of Fluo-3Rf '100–200 in vitro (Harkins et al., 1993) and perhaps 40% less in cytoplasm(O’Malley et al., 1999).Solid line, Rf 5 50; long dashed line, Rf 5 200. (B)Determination of [Ca21]0 from resting fluorescencef0 (rescaled fromA).The gray zone indicates the range of possible values of [Ca21]0 based onthe uncertainty inRf. Note that [Ca21]0 can be determined to;10%precision, even whileRf is subject to a variation of a factor of 4. (C) Samedetermination, for the case of intermediateRf, illustrated forRf and KD
approximating the properties of OGB-1: according to our measurementsRf ' 8.5 in cuvette and.5.7 in situ (solid line, Rf 5 5.7; long dashed line,Rf 5 8.5). The gray zone indicates the possible values of [Ca21]0 based onthe uncertainty inRf. Compared to the uncertainty in absolute [Ca21](;40%), the fractional error in the estimation ofD[Ca21] (arrows) fromDf [ (f 2 f0) is much smaller,,10%; it is indicated by the difference inthe lengths of arrows.
Calcium Estimation without Ratioing 2657
Biophysical Journal 78(5) 2655–2667

Green (MG) (both 100mM; Molecular Probes, Eugene, OR) were added tothe internal solution; occasionally pipettes were tip-loaded with indicator-free solution to prevent dye leakage into the extracellular medium.
Two-photon imaging and electrophysiology
We used a custom-built 2PLSM (Mainen et al., 1999a). A Ti:sapphire laser(Tsunami; Spectra Physics, Mountain View, CA) pumped by a 10-W argonion laser (Millenia X; Spectra Physics) was tuned tol ' 810 nm anddelivered;100-fs pulses at 80 MHz. The scanning mirrors (model 6800;Cambridge Instruments, Cambridge, MA) were imaged into the backfocalplane of the objective (603, NA 0.9; Zeiss, Jena, Germany) by a scan lensand the microscope tube lens (both from Zeiss). Fluorescence was detectedin epifluorescence and transfluorescence (through an oil-immersion con-denser, NA 1.4; Zeiss) modes using photomultiplier tubes (R3896;Hamamatsu, Hamamatsu City, Japan) and combined using a summingamplifier. Laser-scanning differential interference contrast (DIC) was im-plemented by the addition of a dichroic mirror and a photodiode in thetransfluorescence path. Image acquisition was controlled bycustom soft-ware (Ray Stepnoski, Bell Laboratories, Lucent Technologies).
Whole-cell recordings were obtained under visual guidance, using in-frared DIC optics and a CCD camera. Dendrites of CA1 pyramidal neuronswere imaged 30–70mm from the soma. Action potentials were evoked incurrent clamp mode, using brief (4 ms) current pulses. Electrophysiologicaldata acquisition was performed using an AD-DA board (PCI-MIO-16E-4)and custom software written in LabView (both from National Instruments,Austin, TX) and in Igor (WaveMetrics, Lake Oswego, OR). Fluorescenceimages were analyzed using custom software written in IDL (ResearchSystems, Boulder, CO) and Igor. Typically line scan images were collectedat 500 Hz.
Fluorescence measurements started;2 min after break-in and endedwhen loading approached a steady state;40 min later. Dye loading wasmonitored by measuring resting fluorescence,f0. Steady state was reachedwhen the intracellular dye concentration equilibrated with the pipetteconcentration. Slice drift caused loss of focus and slight decreases inf0,which were corrected by refocusing during experiments. These decreasingvalues off0 were ignored when exponential fits to the loading time coursewere made.
During each measurement trial of action potential-evoked calcium tran-sients,f0 was determined by averaging fluorescence over at least 128 ms.Peak amplitudes of fluorescence transients were calculated by averagingover 15 ms after the stimulus, or over a 100–120-ms plateau in the case ofsaturating transients evoked by trains. The background signal was mainlydue to photomultiplier tube dark currents and autofluorescence and wassubtracted. Fluorescence time series were extracted by averaging across theremaining spatial dimension of the line scan image of the apical dendrite.
Parameter calibration
Estimation of [Ca21] from fluorescence demands calibration of the param-etersRf, KD, and dfmax (Eqs. 4 and 5).Rf and KD are properties of theindicator in a particular environment and are not expected to vary acrosscells. It has been pointed out thatRf may be smaller in cells than inmeasurement cuvettes, perhaps because of interactions between the indi-cator and cytoplasmic proteins (Harkins et al., 1993; O’Malley et al.,1999); it should also be noted that the dynamic range may vary from batchto batch for some indicators (Harkins et al., 1993). Similarly, the dissoci-ation constant,KD, may be affected by the environment (Busa, 1992). It istherefore important to estimate these parameters in a medium that is asclose as possible to the cytoplasmic environment.
Rf andKD were determined in a cuvette fluorometer at 35°C, pH 7.3,using calibration solutions prepared according to standard procedures(Tsien and Pozzan, 1989). [Ca21] was clamped by EGTA (10 mM) orBAPTA (5 mM) for OGB, and by HEDTA (10 mM) in the case of
Magnesium Green (MG). Solutions contained a small amount of indicator(5 mM, or 10mM for MG) and (in mM) 135 K methylsulfonate, 10 HEPES,and 4 MgCl2, which is identical to the electrode solution. Free [Ca21] wascomputed using the MaxChelator program (Bers et al., 1994) (http://www.stanford.edu/;cpatton/maxc.html). Measurements performed withBAPTA and EGTA buffering produced consistent results. In all caseswhere comparisons have been made, cuvette measurements ofRf have beenseen to provide an upper bound onRf in the cell (Harkins et al., 1993;O’Malley et al., 1999).
Lower bounds on the intracellularRf were obtained in cultured rathippocampal slices (P7, 3–5 days in vitro) because in this preparationhealthy neurons can be found close to the surface of the slice, allowingmore efficient exchange of extracellular solutions. Whole-cell recordingswere performed in normal ACSF until dye loading reached steady state, atwhich point fmax was measured. ACSF was then replaced by zero-[Ca21]ACSF containing 10 mM EGTA, which clamped [Ca21], causing a de-crease inf0. After reaching steady state, the resting fluorescence corre-sponding to minimal resting [Ca21], f0min, was measured, and an estimateof the dynamic range was computed asRf ' fmax/f0min. Because intracel-lular [Ca21] could not be fully clamped to zero with this method, thisestimate was taken as a lower bound onRf complementary to the upperbound from cuvette measurements. No attempts were made to estimateKD
in situ.Intracellular estimates ofdfmax were made during experiments by tran-
siently flooding neurons with Ca21 by stimulation with rapid trains ofaction potentials (APs). During AP trains fluorescence transient amplitudesdue to successive APs diminished as fluorescence increased. After severalAPs a saturating fluorescence plateau was reached, suggesting saturation ofthe Ca21 indicator. To test for indicator saturation, fluorescence transientsproduced by trains at several different frequencies were compared. In aregime far from indicator saturation, the plateau fluorescence at a given APfrequency would be proportional to that frequency, followingD[Ca21](Regehr et al., 1994; Helmchen et al., 1996); in contrast, if the indicatorwas in fact saturated, then plateau fluorescence would be independent offrequency. Typical trains lasted for 360 ms and had frequencies of 56–83Hz. To check whether the underlying [Ca21] accumulations increased inproportion to AP frequency, experiments were repeated under identicalconditions with the low-affinity indicator MG, which has a dissociationconstant almost two orders of magnitude larger than OGB-1 (Haugland,1996).
Errors quoted denote SEM unless specified otherwise.
Single-compartment model of calcium dynamics
To derive estimates of cellular buffer capacities, we used a simple one-compartment model of cellular [Ca21] dynamics (Neher and Augustine,1992; Helmchen et al., 1996). [Ca21] transients produced by brief, smallCa21 currents, such as those produced by single action potentials (at timet 5 tAP), reach peak values:
D@Ca21# ; @Ca21#~tAP! 2 @Ca21#0 5D@Ca21#T
~1 1 kB 1 kF!. (8)
HereD[Ca21]T is the total Ca21 influx due to a single action potential, andkB andkF are the endogenous and added buffer capacities, defined as
kX 5@XCa#
@Ca21#U
rest
5KD
(X)@X#T
~KD(X) 1 @Ca21#0!
2. (9)
Buffer capacities give the ratio of calcium sequestered by a buffer overcalcium that remains free upon a rise in [Ca21]. Here we used the
2658 Maravall et al.
Biophysical Journal 78(5) 2655–2667

differential form of these quantities (Neher and Augustine, 1992),
kX 5D@XCa#
D@Ca21#U
transient
5KD
(X)@X#T
~KD(X) 1 @Ca21#0!~KD
(X) 1 @Ca21#peak!.
(10)
RESULTS
To estimate [Ca21], equations were formulated expressing[Ca21]0 andD[Ca21] in terms of fluorescence andRf, KD,and dfmax (Eqs. 5 and 6). The determination of these pa-rameters can be constrained sufficiently well to allow ac-curate measurement of [Ca21]. We tested this method bymeasuring [Ca21]0 and the amplitudes of action potential-evoked dendritic [Ca21] transients in CA1 pyramidal celldendrites as a function of added buffer capacity.
Parameter calibration
Indicator parametersRf and KD were calibrated in vitrounder conditions mimicking those of experiments (pipetteintracellular solution, 35°C, pH 7.3).Rf was also estimatedintracellularly.
The properties of OGB-1 are summarized in Table 1.(Similar cuvette measurements carried out for OGB-2 gavethe following values in intracellular solution:KD 5 295 613 nM andRf > 16 6 0.5, n 5 8.) Because intracellularmeasurements (Rf ' 4.3–5.7) necessarily gave a lowerbound forRf, we concluded that the true cytoplasmic valuefor the dynamic range of the indicator was above the higherof these values, in the rangeRf ' 5.7–8.5.
The dissociation constant of MG was 50 times larger thanthat of OGB-1:KD 5 10 6 2 mM (n 5 4).
2PLSM fluorescence imaging in CA1apical dendrites
CA1 pyramidal cells were loaded with OGB-1 via patchpipette (Fig. 2A). One or two minutes after break-in, theproximal apical dendrite was visible in the 2PLSM image(Fig. 2B). To image fluorescence with good time resolutionin the dendrite, we used line scan imaging (Fig. 2C). Wethen averaged across a window along the spatial axis of theimage to arrive at a fluorescence time series (Fig. 2D).
Single action potentials evoked by somatic current injec-tions caused fluorescence changes due to Ca21 influxthrough voltage-sensitive calcium channels (Markram et al.,1995). The rise time of single-AP fluorescence changes was,2 ms, while the decay time was in the range of 50–500ms, depending on indicator concentration (Markram et al.,1995; Helmchen et al., 1996); decay times became longer asCa21 was increasingly buffered.
Saturating fluorescence transients
To estimatedfmax, we relied on the fact that rapid trains ofAPs produce large [Ca21] accumulations and that theseaccumulations increase with AP frequency (Helmchen etal., 1996; Regehr et al., 1994). We confirmed these findingsunder our experimental conditions, using fluorescence mea-surements with the low-affinity indicator MG. Because thisindicator’s KD is ;50-fold higher than that of OGB-1, itresponds linearly to [Ca21] changes over a much widerrange. Indeed, MG fluorescence transient amplitudes in-creased with AP frequency up to at least 83 Hz (Fig. 3A),approximately in a linear fashion (Fig. 3B). This confirmedthat [Ca21] accumulations continue to grow with APfrequency.
To estimate the maximum OGB-1 fluorescence transient,dfmax, during experiments, we measured fluorescencechanges produced by the large [Ca21] accumulationsevoked by rapid trains of APs. We attempted to determinewhether indicator saturation was in fact reached duringthese trains by measuring fluorescence levels reached atpeak [Ca21] for several AP frequencies. In contrast to theMG transients, transients obtained with OGB-1 saturated ata steady-state or plateau level,dfplt, over the same range offrequencies (Fig. 3,A and B), implying that OGB-1 wasclose to saturation.
However, OGB-1 fluorescence transients due to succes-sive action potentials in a train could still be resolved, evenat the highest stimulation frequencies (Fig. 3A; see also Fig.4 C, inset). Fluorescence transient peaks following APswere ;4% higher than the corresponding average plateaufluorescence,dfplt, implying thatdfplt remained underdfmax,even at the highest frequencies probed. To assess the qualityof our estimate ofdfmax we thus performed additionalanalyses.
One approach made use of the data of Fig. 3,A and B,which imply that changes in MG fluorescence are propor-tional toD[Ca21] over the range of frequencies used in ourexperiments. We used this relationship to quantify the de-gree of OGB-1 saturation. As expected, plotting OGB-1fluorescence amplitudes against MG fluorescence ampli-tudes gave a hyperbolic relationship, because MG fluores-cence is a measure ofD[Ca21]. A hyperbolic fit provided anestimate of the degree of saturation corresponding to aparticular frequency across cells (Fig. 3C). We define thedegree of saturation at frequencyn asx 5 1003 dfplt/dfmax,
TABLE 1 Properties of the indicator Oregon green BAPTA-1
Parameter Value N
Rf (cuvette) 8.56 0.7 8Rf (in situ) 4.3–5.7 3KD (cuvette) (nM) 2066 5 8
Measurements were performed as described in Materials and Methods. Insitu Rf is given as a range: the largest value was adopted as a best estimatebecause it reflects the best clamping of [Ca21] to a low level for theestimation offmin.
Calcium Estimation without Ratioing 2659
Biophysical Journal 78(5) 2655–2667

such thatx ranges from 0% (linear regime) to 100% (com-plete saturation). For the maximum frequency used in theseexperiments (83 Hz),x 5 89 6 3% (n 5 4). For typicalfrequencies (67 Hz),x 5 87 6 3% (n 5 4).
A second independent approach allowed us to estimatethe degree of saturation reached for each experiment bymaking use of the proportionality of peak [Ca21] accumu-lation to AP frequency (Fig. 3B). This proportionalityimplies that the ratio of [Ca21] accumulations produced atAP frequenciesn2 andn1 is n2/n1. Under conditions close toindicator saturation, the corresponding ratio of fluorescenceplateaus,Q [ (dfplt)n2/(dfplt)n1, is not equal ton2/n1: it isclose to but not quite equal to 1 (Q , ;1). Supposingn2 isthe higher frequency, its degree of saturation can be ex-pressed (Appendix A) as
x 5 10031 2 Qn1/n2
1 2 n1/n2. (11)
With full saturation, the ratio of plateaus at different fre-quencies would by definition beQ 5 1, implyingx 5 100%also. In contrast, averaging over the highest AP frequenciesused in our experiments (n 5 13 cells), we foundx 5 85 64%, in agreement with the previous estimate involvingOGB-1 transients versus MG transients (which does notrequire assuming proportionality to frequency). Using Eq.11, it was possible to estimate the true maximum fluores-cence transient asdfmax 5 dfplt 3 100/x for each neuron.The results in the remainder of the paper were computedusing this correction.
[Ca21] in CA1 pyramidal neurons
Fluorescence measurements began approximately 2 minafter break-in. As found previously (Helmchen et al., 1996),
baseline fluorescence intensity then increased with the con-centration of intracellular dye until it reached a steady state(Fig. 4 A) (with a time constant of 12.56 2.3 min;n 5 7).
Transients evoked by single action potentials were mea-sured during dye loading. As predicted by Eq. 8, transientamplitudes decreased with time as the added buffer capacityincreased (Fig. 4B), while their durations increased (seealso Helmchen et al., 1996). Maximum fluorescence wasalso measured during dye loading (Table 2). If the actionpotential trains actually saturated the indicator, the saturat-ing fluorescence ratio,dfmax [ (fmax 2 f0)/f0, was expectednot to vary with loading because it is independent of [F]T
(Eq. 6). For many cells (n 5 15 out ofn 5 28) we in factfound a constantdfmax over 35–50 min (Fig. 4C). Incontrast,df evoked by single APs always decreased withincreasing added buffer capacity (Fig. 4D).
However, in some neurons baseline fluorescence did notappear to reach steady state (Fig. 5A), anddfmax decreasedwith time (Fig. 5B). Because of the dependence ofdfmax on[Ca21]0 and onRf, it is likely that this effect was due eitherto an increase in [Ca21]0 or to photodamage producingincreased baseline fluorescence (and a degradation ofRf)(Koester et al., 1999). We were able to distinguish betweenthese possibilities because changes in [Ca21]0 are unlikelyto be local, while photodamage is spatially highly restricted(Koester et al., 1999), enabling recovery ofdfmaxby movingto adjacent positions on the dendrite (Fig. 5C). The con-stancy ofdfmax during an experiment could thus be used asa check on [Ca21]0 maintenance and cell health.
Resting calcium concentration
Using Eq. 7, we found [Ca21]0 to be in the range of 3765 nM (Rf ' 5.7) to 54 6 5 nM (Rf ' 8.5) (n 5 12).
FIGURE 2 2PLSM imaging in brain slices. (A) CA1pyramidal neuron labeled with 100mM OGB-1 imagedat the end of an experiment. The white square on theapical dendrite indicates the approximate location of theregion where measurements were carried out. (B)Close-up of proximal apical dendrite from a CA1 neu-ron; the white line indicates the position of the line scan.(C) Line-scan image, showing a transient fluorescenceincrease due to calcium influx evoked by a single actionpotential. The white line indicates the size of the aver-aging window for the fluorescence time series. (D)Fluorescence averaged across the dendrite as a functionof time.
2660 Maravall et al.
Biophysical Journal 78(5) 2655–2667

Classifying cells by postnatal age of animal (two groups:PND 14–17 and PND 24–28) did not reveal significantdifferences in resting [Ca21]. For the younger rats,[Ca21]0 5 36 6 5 nM (Rf 5 5.7) to 536 5 nM (Rf 5 8.5)(n 5 9), while for the older animals [Ca21]0 5 406 22 nM(Rf 5 5.7) to 576 23 nM (Rf 5 8.5) (n 5 3).
Endogenous buffer capacity
The peak amplitude of action potential-evoked [Ca21] tran-sients has an inverse dependence onkF, the added indicatorbuffer capacity (Eq. 8). This reflects the increasing buffer-ing of Ca21 by the added indicator. To estimate the endog-
enous buffer capacitykB, we inverted this relationship:
D@Ca21#21~t 5 tAP! 51 1 kB
D@Ca21#T1
kF
D@Ca21#T, (12)
plotted inverse [Ca21] transient amplitudes againstkF, andfit straight lines to these data (Fig. 6). The intercept with thehorizontal axis gave an estimate ofkB (Helmchen et al.,1996). Averaged over cells (n 5 7), values werekB 5 65615 (Rf 5 5.7) or kB 5 57 6 13 (Rf 5 8.5). Classifyingneurons according to age, we found the buffering capacityin those from older animals (PND 24–28) to be smaller thanfor younger rats (PND 14–17): for the former (n 5 3), kB 548 6 20 (Rf 5 5.7) orkB 5 41 6 17 (Rf 5 8.5), while for
FIGURE 3 Fluorescence transients (df [ (f 2 f0)/f0) in response to trains of action potentials. (A) Dendritic fluorescence transients evoked by AP trainsat different frequencies: lowest to highest, 50 Hz, 62.5 Hz, 83.3 Hz. Dendrites were loaded with Magnesium Green (MG) (a1) (traces averaged over 14trials) or with OGB-1 (a2) (traces averaged over five trials).a2 indicates how OGB-1 levelsdfplt were determined, by averaging over saturated (plateau)portion of transients. (B) Fluorescence transient amplitudes as a function of frequency (fromA). h, MG, n 5 4; {, OGB-1,n 5 4. MG levels are peakfluorescence. For OGB-1, plateau levelsdfplt were computed as indicated ina2. To compare trends, transients were normalized to the levels evoked by50-Hz stimulation. Peak fluorescence levels as measured with MG increased approximately linearly over the range of frequencies sufficient to saturateOGB-1 saturation. (C) Fluorescence levels for OGB-1 plotted against levels for MG (proportional toD[Ca21]). Levels for MG were normalized to levelsevoked by 50-Hz trains, as forB. Fit was made to a known hyperbolic saturating relationship. OGB-1 fluorescence levels were then normalized toasymptotic value of fit,dfasympt. Normalized levels therefore indicate fractional saturation for each point. Horizontal error bars indicate the SEM ofnormalized fluorescence (n 5 4); vertical error bars are the quadratic sum of normalized fluorescence SEM (n 5 4) and standard error of hyperbolic fit.
Calcium Estimation without Ratioing 2661
Biophysical Journal 78(5) 2655–2667

the latter (n 5 4) kB 5 78 6 23 orkB 5 68 6 20 for Rf 55.7 andRf 5 8.5, respectively. However, the differencebetween age groups was not significant (p . 0.05; Welch-Studentt-test).
Action potential-evoked [Ca21] transients
The size of the [Ca21] transients induced by an actionpotential in the apical dendrite in the absence of an indicatorcan be inferred from the relationship betweenD[Ca21]21
andkF, by extrapolating the fits tokF 5 0 (Fig. 6).D[Ca21]averaged over all neurons (n 5 7) wasD[Ca21] 5 2356 57nM for Rf 5 5.7 andD[Ca21] 5 2516 61 nM forRf 5 8.5.Differences in buffer capacity between younger and olderanimals were not found to be significant: For PND 14–17,D[Ca21] 5 2276 65 nM (Rf 5 5.7),D[Ca21] 5 2436 70nM (Rf 5 8.5) (n 5 4), while for PND 24–28,D[Ca21] 52456 138 nM (Rf 5 5.7),D[Ca21] 5 2626 148 nM (Rf 58.5) (n 5 3). A summary of the data presented in thissection is contained in Table 2.
FIGURE 4 Time course of OGB-1 loading and amplitudes of fluorescence transients in a proximal apical dendrite. (A) The baseline fluorescence (f0) wasmeasured every 15 s. Occasionally the image was refocused to compensate for drift of the brain slice. The upper envelope off0 was fit with an exponentialtime course (solid curve). The loading time constant for this cell was 9.2 min. (B) Fluorescence transients (df) evoked by single action potentials at differenttimes after break-in (averages of three to four trials; times are indicated inD). Decreasing transient amplitudes and increasing durations reflect the bufferingof Ca21 by increasing concentrations of [Ca21] indicator. (C) Fluorescence transients evoked by AP trains in early (c1) and late (c2) phases of loading(indicated inD). Transient amplitudes remained constant, reflecting constant [Ca21]0 (Eq. 6). Transients due to differing stimulation frequencies (20 APs,56 Hz; 24 APs, 67 Hz) are superimposed. The inset inc1 shows fluorescence transients evoked (the larger) by the first AP in the train, and (the smaller)by an AP after plateau was reached. (D) Amplitudes of fluorescence transients as a function of loading time. Single action potential transients (F) decreasedas a function of time. Transients evoked by trains (measured at plateaus; 56 Hz,{; 67 Hz,■) remained constant as a function of time.
2662 Maravall et al.
Biophysical Journal 78(5) 2655–2667

DISCUSSION
Because of signal-to-noise ratio considerations, high-affin-ity [Ca21] indicators with large dynamic ranges are espe-cially well suited for [Ca21] estimation in small neuronalcompartments (Muller and Connor, 1991; Murphy et al.,1994; Yuste and Denk, 1995; Denk et al., 1995; Koester andSakmann, 1998; Mainen et al., 1999b). Based on the fluo-rescence signal evoked by a stimulus, it is often of interestto compute an experimental measure proportional to thecorresponding evokedD[Ca21]. The fractional fluorescencechangedf [ (f 2 f0)/f0 has this property, but only in thelinear regime of the indicator ([Ca21] ,, KD). High-affinityindicators show sublineardf even when challenged withmodest [Ca21] transients (cf. Fig. 1). Additional problemswith measurement ofdf are encountered during prolongedexperiments:df might decrease simply becausef0 increases,because of small changes in resting [Ca21], or because ofphotodamage (Koester et al., 1999) or bleaching. Further-more, for a given Ca21 current and resting [Ca21], dfdecreases with increasing indicator concentration, becauseof Ca21 buffering.
We have described a method (Eqs. 4, 5, and 7) to correctfor the nonlinear response of a Ca21 indicator to obtainaccurate estimates ofD[Ca21] and absolute [Ca21]. Thismethod relies on information gained by measuring the max-imum relative fluorescence level in the structure of interest,dfmax, during an experiment. The calculation of [Ca21]requires estimates of two additional parameters: the disso-ciation constant,KD, and the dynamic range,Rf, of the
TABLE 2 [Ca21] regulation in the apical dendrites of CA1pyramidal neurons
Parameter PND 14–17 PND 24–28 Overall
dfmax (%)Mean 240 243 241Range 190–317 152–296 152–317N 9 3 12
D[Ca21] (nM)Mean 237 255 245Range 162–313 107–410 178–312N 4 3 7
kB
Mean 73 44 61Range 48–101 24–68 44–80N 4 3 7
[Ca21]0 (nM)Mean 46 50 47Range 31–58 19–81 32–59N 9 3 12
Column headings indicate age of rats in postnatal days (PND). Values werecomputed as follows:dfmax is given as a range from the minimum to themaximum value recorded across the neurons used for data analysis (aver-age6 SEM across neurons was 2416 15%). Means were computed byassumingRf halfway between its cuvette and in situ values. Ranges aredefined by mean2 SEM for Rf giving the smallest value, and mean1SEM for Rf giving the largest value.
FIGURE 5 Changes in fluorescence as markers of resting [Ca21]0 andcell health. (A) Time course of resting fluorescence. After;40 min ofloading no steady state had been reached. (B) Amplitudes of fluorescencetransients (same cell). Single-AP transients (F) decreased with loading, asdid transients evoked by trains at two different frequencies (56 Hz,{; 67Hz, ■), suggesting an increase in resting [Ca21] (Eq. 6). (C) As in B, fora different cell. Afterdfmax decreased, imaging in an adjacent dendriticregion (;5 mm from the first point; indicated byarrow) recovered thesignal. This suggested that the local drop indfmax was due to localphotodamage while [Ca21]0 remained constant.
Calcium Estimation without Ratioing 2663
Biophysical Journal 78(5) 2655–2667

indicator. Because the calibration parameters are propertiesof an indicator and would not be expected to vary acrosscells of a given type, they do not need to be evaluated duringevery experiment. Nevertheless, because these parametersmay be sensitive to the nature of the intracellular environ-ment, it is important to consider sources of error in calibra-tions based on estimates ofRf andKD (Appendix B).
Parameter calibration androbustness of the method
We estimated a lower bound for the dynamic range ofOregon Green BAPTA-1 in CA1 pyramidal neurons inhippocampal slices, comparingfmax with minimum fluores-cence levels obtained by washing in an extracellular solu-
tion containing zero [Ca21] and high EGTA. Our resultsgave a bound equal to;50–70% of the value ofRf mea-sured in vitro, which is consistent with previous experi-ments conducted with other Ca21 indicators (O’Malley etal., 1999; Harkins et al., 1993). Because our procedure didnot allow us to clamp intracellular [Ca21] to zero, intracel-lular values ofRf may be closer to the in vitro estimate of8.5; in any caseRf is constrained between 5.7 and 8.5.
Importantly, the estimates ofD[Ca21] obtained with ourmethod were quite insensitive to the exact value used forRf.For example, our estimates of the amplitude of single actionpotential [Ca21] transients at zero added buffer (cf. Helm-chen et al., 1996) varied by less than 10% over the rangeRf ' 5.7–8.5 (for an interpretation see Fig. 1B). Ourestimates of absolute [Ca21] were less robust, varying by upto ;40% in the rangeRf ' 5.7–8.5 (Eq. 11). These varia-tions are predicted by error propagation analysis (Appen-dix B).
We estimated the dissociation constant of the indicator,KD, in intracellular solution but not in intact cells. Thisquantity may be quite different in the intracellular environ-ment: a correction of.30% is expected (Minta et al., 1989).BecauseKD appears only as a scale factor in all relevantequations (Eqs. 4, 5, and 7), this correction would applydirectly to all [Ca21] estimates and our derivations ofkB. Asimilar scaling factor applies to measurements with ratio-metric indicators.
With the method presented, the fluorescence at saturating[Ca21], fmax, is measured periodically during each experi-ment at the same position where [Ca21] measurements arebeing obtained. In most neurons, this can be achieved byeliciting trains of action potentials to flood the neuron withCa21 entering through voltage-gated Ca21 channels (Figs. 3and 4).
Because of the weak dependence of fluorescence on[Ca21] at large concentrations (where [Ca21] .. KD) (Fig.1), even relatively high-frequency action potential trains (67Hz) produced only;70–90% saturation in our experimentsin CA1 dendrites. This relatively large variation in satura-tion level may partly reflect differences in action potential-evoked [Ca21] transients, depending on distance from thesoma (range 30–70mm; Regehr et al., 1989; Magee andJohnston, 1997; Svoboda et al., 1999). Thus estimates of[Ca21] based simply on the plateau fluorescence reachedduring a high-frequency train may result in relatively largemeasurement errors (up to;30% for the measurementspresented here; see also Appendix B). These errors grow asf approachesfmax. However, the estimate can be improvedconsiderably if fluorescence transients are measured at morethan one frequency, allowing extrapolation to truedfmax.This necessitates making an assumption about the true na-ture of AP-evokedD[Ca21]. For instance, our techniquerelies on the proportionality of [Ca21] increases to APfrequency (Eq. 11), which was verified by parallel measure-ments with the low-affinity indicator MG.
FIGURE 6 Estimating the endogenous buffer capacity. (A) Inverse sin-gle-AP peak [Ca21] transient increase,D[Ca21]21, versus added buffercapacity,kF, for a cell from a young animal. Endogenous capacity wascomputed from the fit’s intersection with thex axis and was betweenkB 51066 10 (r 5 0.92) (computed withRf 5 5.7) andkB 5 936 9 (r 5 0.92)(Rf 5 8.5). (B) As in A, for a cell from an older animal. Endogenouscapacity was betweenkB 5 78 6 2 (r 5 0.96) (Rf 5 5.7) andkB 5 68 62 (r 5 0.96) (Rf 5 8.5) based on fit to the early part of the experiment (E).Note the pronounced convexity in the curve and the increased slope of laterpoints (F), suggesting a decrease in the amplitudes of the Ca21 current.
2664 Maravall et al.
Biophysical Journal 78(5) 2655–2667
However, saturation can be verified even in cases wherethis assumption does not hold. Assume, for instance, that[Ca21] accumulations evoked by each action potential in atrain have equal sizes at different frequencies. (Althoughthis assumption is similar to the one above, it does not implya constant Ca21 removal rate.) The assumption would beinvalid if Ca21 influx suffered from greater rundown athigher frequencies, but can be tested by comparing fluores-cence transients elicited by individual action potentials atthe beginning and at the end of an AP train. This alternativeassumption also allows extrapolation to truedfmax. Forinstance, using it we recomputed the level of saturation forthe AP train-evoked transients shown in Fig. 4, which are89% saturated, assuming proportionality to frequency asdescribed above. This compares to a value of 93%, using theassumption just introduced, in approximate agreement.Therefore our method does not require proportionality be-tween [Ca21] accumulations and AP frequency.
Measurements of intracellular Ca21
levels and regulation
In addition to permitting accurate calibration of [Ca21] andD[Ca21], measurements of saturating fluorescence tran-sients during an experiment have other benefits. For exam-ple, for healthy neurons with constant [Ca21]0, the ratio ofsaturating fluorescence transient over resting fluorescence,dfmax, should remain constant, independent of changes inindicator concentration. We found this behavior in mostneurons over periods of up to 1 h (see, e.g., Fig. 4). How-ever, other neurons showed a decreasingdfmax, suggestingan increasing resting [Ca21] (Fig. 5). This could be distin-guished from subcellular compartmentalization of indicatoror photoinduced changes in fluorescence (Konig et al.,1999; Koester et al., 1999) by verifying whether transientsize varied as the imaging region was moved to an adjacentposition along the dendrite (Fig. 5C).
Measurements of [Ca21] regulation in hippocampal py-ramidal cells reported in this paper are mostly similar tovalues previously reported with ratiometric indicators. Therange of [Ca21]0 was 32–59 nM, at the low end of the rangereported in cultured neurons (Nakajima et al., 1993), anddistributed over a narrower range, perhaps reflecting ourmethod’s accuracy. Single action potential [Ca21] transientswere, on average, around 250 nM, somewhat higher thanprevious pyramidal cell estimates (Helmchen et al., 1996).Dendritic intracellular buffer capacity (kB) had a mean of;60, slightly smaller than in previous measurements(Helmchen et al., 1996). In some neurons, plots of inverseD[Ca21] versus added buffer capacity showed a distinct lateconvex upswing (Fig. 6B), without changes indfmax, sug-gesting a late decrease in total calcium current. There wereno statistically significant differences in resting [Ca21],average [Ca21] transient size per action potential, or buff-
ering capacity between animals of different age groups(PND 14–17 and PND 24–28).
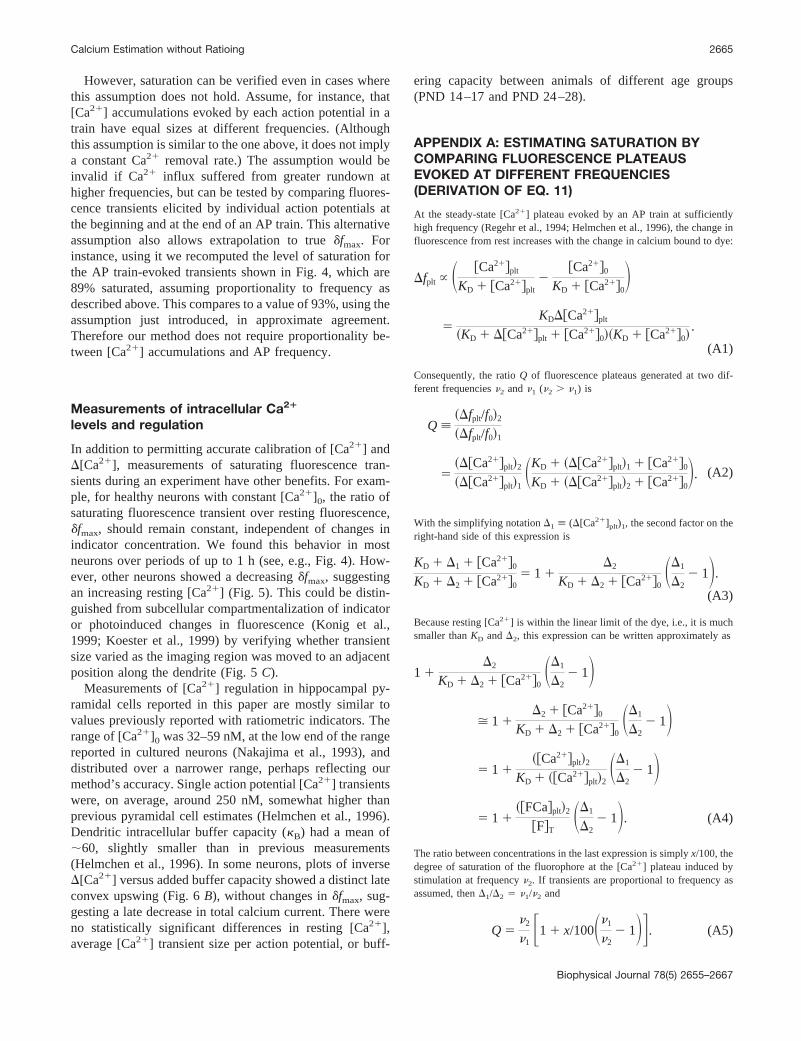
APPENDIX A: ESTIMATING SATURATION BYCOMPARING FLUORESCENCE PLATEAUSEVOKED AT DIFFERENT FREQUENCIES(DERIVATION OF EQ. 11)
At the steady-state [Ca21] plateau evoked by an AP train at sufficientlyhigh frequency (Regehr et al., 1994; Helmchen et al., 1996), the change influorescence from rest increases with the change in calcium bound to dye:
Dfplt } S @Ca21#plt
KD 1 @Ca21#plt2
@Ca21#0
KD 1 @Ca21#0D
5KDD@Ca21#plt
~KD 1 D@Ca21#plt 1 @Ca21#0!~KD 1 @Ca21#0!.
(A1)
Consequently, the ratioQ of fluorescence plateaus generated at two dif-ferent frequenciesn2 andn1 (n2 . n1) is
Q ;~Dfplt/f0!2
~Dfplt/f0!1
5~D@Ca21#plt!2
~D@Ca21#plt!1SKD 1 ~D@Ca21#plt!1 1 @Ca21#0
KD 1 ~D@Ca21#plt!2 1 @Ca21#0D. (A2)
With the simplifying notationD1 [ (D[Ca21]plt)1, the second factor on theright-hand side of this expression is
KD 1 D1 1 @Ca21#0
KD 1 D2 1 @Ca21#05 1 1
D2
KD 1 D2 1 @Ca21#0SD1
D22 1D.
(A3)
Because resting [Ca21] is within the linear limit of the dye, i.e., it is muchsmaller thanKD andD2, this expression can be written approximately as
1 1D2
KD 1 D2 1 @Ca21#0SD1
D22 1D
> 1 1D2 1 @Ca21#0
KD 1 D2 1 @Ca21#0SD1
D22 1D
5 1 1~@Ca21#plt!2
KD 1 ~@Ca21#plt!2SD1
D22 1D
5 1 1~@FCa#plt!2
@F#TSD1
D22 1D. (A4)
The ratio between concentrations in the last expression is simplyx/100, thedegree of saturation of the fluorophore at the [Ca21] plateau induced bystimulation at frequencyn2. If transients are proportional to frequency asassumed, thenD1/D2 5 n1/n2 and
Q 5n2
n1F1 1 x/100Sn1
n22 1DG. (A5)
Calcium Estimation without Ratioing 2665
Biophysical Journal 78(5) 2655–2667

APPENDIX B: PROPAGATION OF PARAMETERCALIBRATION ERRORS
Calibration errors can arise from erroneous estimation of the parametersRf,dfmax, andKD. Errors inKD will simply have a multiplicative effect.
Errors in estimating the dynamic range will give a valueR9f 5 rRf,whereRf is the correct value and the multiplicative factorr is close to 1 (forinstance, ifRf is really around 6 but is estimated to be its cuvette valueRf '8.5, r ' 1.4). This will result in an estimate of [Ca21] that relates to thetrue value as follows:
@Ca21#9
KD5
@Ca21#
KD1
r 2 1
R9f~1 2 f/fmax!. (B1)
The relative error in measured [Ca21] as compared to the correct value isthen
~u@Ca21#!R ;@Ca21#9 2 @Ca21#
@Ca21#5
r 2 1
R9ff/fmax 2 r. (B2)
This quantity is of practical interest because it provides a higher bound onthe relative error in [Ca21] caused by erroneous estimation of the dynamicrange. For any experiment one can define a lower bound toRf given by theratio of saturated and resting fluorescences,fmax/f0. Therefore there is ahigher bound forr and there follows a higher bound for the possiblerelative error. ForD[Ca21] the relative error induced by an incorrectcalibration ofRf is
~uD@Ca21#!R 5r 2 1
R9f 2 r. (B3)
This expression is not directly dependent onf or dfmax and is more robustthan the absolute concentration against errors in determination ofRf. Forexample, ifR9f 5 8.5 andr # 1.5 (values quoted in the main text), then therelative error is (uD[Ca21])R # 7%.
Underestimation of the saturating fluorescencefmax affects measure-ments of resting calcium levels less than does overestimation ofRf.However, errors infmaxgreatly distort measurements at the upper end of thedye’s dynamic range. With an estimated valuef9max 5 wfmax (w , 1),calcium concentration will be overestimated as
@Ca21#9
KD5
@Ca21#
KD1
~1 2 w!~1 2 Rf21!f/f9max
~1 2 f/f9max!~1 2 wf/f9max!, (B4)
which is a relative error of
~u@Ca21#!f 5~1 2 w!~1 2 Rf
21!f/f9max
~1 2 f/f9max!~wf/f9max 2 Rf21!
(B5)
with respect to the true [Ca21]. For D[Ca21],
~uD@Ca21#!f 5~1 2 w!~1/w 2 f/f9maxf0/f9max!
~1 2 f/f9max!~1 2 f0/f9max!. (B6)
Underestimates ofdfmax, df9max5 gdfmax(g , 1), result in overestimates of[Ca21]0 when this quantity is computed according to Eq. 7:
@Ca21#90KD
5@Ca21#0
KD1
~1 2 g!~1 2 Rf21!
df9max. (B7)
The corresponding relative error is
~u@Ca21#0!df 5 ~1 2 g!1 2 Rf
21
g~1 2 Rf21! 2 Rf
21 df9max. (B8)
For a typical fractional saturation value of 87% (see main text), and withRf 5 5.7 anddf9max 5 2.2, this is (u[Ca21]0)df # 32%. OverestimatingRf
(R9f 5 rRf, r . 1) leads, based on this equation, to an overestimate of[Ca21]0 equal to
@Ca21#90KD
5@Ca21#0
KD1
r 2 1
R9f~1 1 1/dfmax!, (B9)
or in relative terms,
~u@Ca21#0!R 5 ~r 2 1!1 1 dfmax
R9f 2 r~1 1 dfmax!. (B10)
For the values quoted in the main textR9f 5 8.5 andr # 1.5, and for atypical value ofdfmax 5 2.2, this is (u[Ca21]0)R # 42%.
We thank Barry J. Burbach for excellent technical assistance, EstherNimchinsky for providing slice cultures, and D. M. O’Malley for a criticalreading of the manuscript.
Supported by the Swartz (MM), Burroughs Wellcome (ZFM), Helen HayWhitney (BLS), Whitaker, Klingenstein, and Mathers Foundations and theNational Institutes of Health (KS).
REFERENCES
Bers, D. M., C. W. Patton, and R. Nuccitelli. 1994. A practical guide to thepreparation of Ca21 buffers.Methods Cell Biol.40:3–29.
Busa, W. B. 1992. Spectral characterization of the effect of viscosity onFura-2 fluorescence: excitation wavelength optimization abolishes theviscosity artifact.Cell Calcium.13:313–319.
Denk, W., J. H. Strickler, and W. W. Webb. 1990. Two-photon laserscanning microscopy.Science.248:73–76.
Denk, W., M. Sugimori, and R. Llinas. 1995. Two types of calciumresponse limited to single spines in cerebellar Purkinje cells.Proc. Natl.Acad. Sci. USA.92:8279–8282.
Denk, W., and K. Svoboda. 1997. Photon upmanship: why multiphotonimaging is more than a gimmick.Neuron.18:351–357.
Feller, M. B., K. R. Delaney, and D. W. Tank. 1996. Presynaptic calciumdynamics at the frog retinotectal synapse.J. Neurophysiol76:381–400.
Grynkiewicz, G., M. Poenie, and R. Y. Tsien. 1985. A new generation ofCa21 indicators with greatly improved fluorescence properties.J. Biol.Chem.260:3440–3450.
Harkins, A. B., N. Kurebayashi, and S. M. Baylor. 1993. Resting myo-plasmic free calcium in frog skeletal muscle fibers estimated with fluo-3.Biophys. J.65:865–881.
Haugland, R. P. 1996. Handbook of Biological Fluorescent Probes andResearch Chemicals. Molecular Probes, Eugene, OR.
Helmchen, F., K. Imoto, and B. Sakmann. 1996. Ca21 buffering and actionpotential-evoked Ca21 signaling in dendrites of pyramidal neurons.Biophys. J.70:1069–1081.
Jaffe, D. B., D. Johnston, N. Lasser-Ross, J. E. Lisman, H. Miyakawa, andW. N. Ross. 1992. The spread of Na1 spikes determines the pattern ofdendritic Ca21 entry into hippocampal neurons.Nature.357:244–246.
Kao, J. P., A. T. Harootunian, and R. Y. Tsien. 1989. Photochemicallygenerated cytosolic calcium pulses and their detection by fluo-3.J. Biol.Chem.264:8179–8184.
Kennedy, H. J., and R. C. Thomas. 1996. Effects of injecting calcium-buffer solution on [Ca21]i in voltage-clamped snail neurons.Biophys. J.70:2120–2130.
Koester, H. J., D. Baur, R. Uhl, and S. W. Hell. 1999. Ca21 fluorescenceimaging with pico- and femtosecond two-photon excitation: signal andphotodamage.Biophys. J.77:2226–2236.
2666 Maravall et al.
Biophysical Journal 78(5) 2655–2667

Koester, H. J., and B. Sakmann. 1998. Calcium dynamics in single spinesduring coincident pre- and postsynaptic activity depend on relativetiming of back propagating action potentials and subthreshold excitatorypostsynaptic potentials.Proc. Natl. Acad. Sci. USA.95:9596–9601.
Konig, K., T. W. Becker, P. Fisher, I. Riemann, and K. J. Halbhuber. 1999.Pulse-length dependence of cellular response to intense near-infraredlaser pulses in multiphoton microscopes.Optics Lett.24:113–115.
Kurebayashi, N., A. B. Harkins, and S. M. Baylor. 1993. Use of fura redas an intracellular calcium indicator in frog skeletal muscle fibers.Biophys. J.64:1934–1960.
Lau, P. M., R. S. Zucker, and D. Bentley. 1999. Induction of filopodia bydirect local elevation of intracellular calcium ion concentration.J. CellBiol. 145:1265–1275.
Lev-Ram, V., H. Miyakawa, N. Lasser-Ross, and W. N. Ross. 1992.Calcium transients in cerebellar Purkinje neurons evoked by intracellularstimulation.J. Neurophysiol.68:1167–1177.
Magee, J. C., and D. Johnston. 1997. A synaptically controlled, associativesignal for Hebbian synaptic plasticity in hippocampal neurons.Science.275:209–213.
Mainen, Z. F., M. Maletic-Savatic, S. H. Shi, Y. Hayashi, R. Malinow, andK. Svoboda. 1999a. Two-photon imaging in living brain slices.Methods: Comp. Methods Enzymol.18:231–239.
Mainen, Z. F., R. Malinow, and K. Svoboda. 1999b. Synaptic calciumtransients in single spines indicate that NMDA receptors are not satu-rated.Nature.399:151–155.
Markram, H., P. J. Helm, and B. Sakmann. 1995. Dendritic calciumtransients evoked by single back-propagating action potentials in ratneocortical pyramidal neurons.J. Physiol. (Lond.).485:1–20.
Minta, A., J. P. Kao, and R. Y. Tsien. 1989. Fluorescent indicators forcytosolic calcium based on rhodamine and fluorescein chromophores.J. Biol. Chem.264:8171–8178.
Muller, W., and J. A. Connor. 1991. Dendritic spines as individual neuro-nal compartments for synaptic Ca21 responses.Nature.354:73–76.
Murphy, T. H., J. M. Baraban, W. G. Wier, and L. A. Blatter. 1994.Visualization of quantal synaptic transmission by dendritic calciumimaging.Science.263:529–532.
Nakajima, K., K. Harada, Y. Ebina, T. Yoshimura, H. Ito, T. Ban, and R.Shingai. 1993. Relationship between resting cytosolic Ca21 and re-sponses induced byN-methylD-aspartate in hippocampal neurons.BrainRes.603:321–323.
Neher, E., and G. J. Augustine. 1992. Calcium gradients and buffers inbovine chromaffin cells.J. Physiol. (Lond.).450:273–301.
O’Malley, D. M. 1994. Calcium permeability of the neuronal nuclearenvelope: evaluation using confocal volumes and intracellular perfusion.J. Neurosci.14:5741–5758.
O’Malley, D. M., B. Burbach, and P. Adams. 1999. Fluorescent calciumindicators: subcellular behavior and use in confocal imaging.In Proto-cols in Confocal Microscopy. S. Paddock, editor. Humana Press, NewYork.
Regehr, W. G., and P. P. Atluri. 1995. Calcium transients in cerebellargranule cell presynaptic terminals.Biophys. J.68:2156–2170.
Regehr, W. G., J. A. Connor, and D. W. Tank. 1989. Optical imaging ofcalcium accumulation in hippocampal pyramidal cells during synapticactivation.Nature.341:533–536.
Regehr, W. G., K. R. Delaney, and D. W. Tank. 1994. The role ofpresynaptic calcium in short-term enhancement at the mossy fiber syn-apse.J. Neurosci.14:523–537.
Sabatini, B. L., and W. G. Regehr. 1998. Optical measurement of presyn-aptic calcium currents.Biophys. J.74:1549–1563.
Schiller, J., F. Helmchen, and B. Sakmann. 1995. Spatial profile of den-dritic calcium transients evoked by action potentials in rat neocorticalpyramidal neurons.J. Physiol. (Lond.).487:583–600.
Schiller, J., Y. Schiller, and D. E. Clapham. 1998. NMDA receptorsamplify calcium influx into dendritic spines during associative pre- andpostsynaptic activation.Nature Neurosci.1:114–118.
Schiller, J., Y. Schiller, G. Stuart, and B. Sakmann. 1997. Calcium action-potentials restricted to distal apical dendrites of rat neocortical pyramidalneurons.J. Physiol. (Lond.).505:605–616.
Svoboda, K., W. Denk, D. Kleinfeld, and D. W. Tank. 1997. In vivodendritic calcium dynamics in neocortical pyramidal neurons.Nature.385:161–165.
Svoboda, K., F. Helmchen, W. Denk, and D. W. Tank. 1999. The spreadof dendritic excitation in layer 2/3 pyramidal neurons in rat barrel cortexin vivo. Nature Neurosci.2:65–73.
Tsien, R. Y. 1989. Fluorescent probes for cell signalling.Annu. Rev.Neurosci.12:227–253.
Tsien, R., and T. Pozzan. 1989. Measurement of cytosolic free Ca21 withquin2.Methods Enzymol.172:230–262.
Tsien, R. Y., and A. Waggoner. 1995. Fluorophores for confocal micros-copy. In Handbook of Biological Confocal Microscopy. J. B. Pawley,editor. Plenum Press, New York. 267–279.
Yuste, R., and W. Denk. 1995. Dendritic spines as basic functional units ofneuronal integration.Nature.375:682–684.
Calcium Estimation without Ratioing 2667
Biophysical Journal 78(5) 2655–2667


