Embed Size (px)
Citation preview
Eur J Appl Physiol (2010) 110:597–606
DOI 10.1007/s00421-010-1544-1ORIGINAL ARTICLE
Mitochondrial gene expression in elite cyclists: eVects of high-intensity interval exercise
Psilander Niklas · Wang Li · Westergren Jens · Tonkonogi Michail · Sahlin Kent
Accepted: 11 June 2010 / Published online: 23 June 2010© Springer-Verlag 2010
Abstract Little is known about the eVect of training ongenetic markers for mitochondrial biogenesis in elite ath-letes. We tested the hypothesis that low-volume sprintinterval exercise (SIE) would be as eVective as high-volume interval exercise (IE). Ten male cyclists competingon national elite level (Wmax 403 § 13 W, VO2peak
68 § 1 mL kg¡1 min¡1) performed two interval exerciseprotocols: 7 £ 30-s “all-out” bouts (SIE) and 3 £ 20-minbouts at »87% of VO2peak (IE). During IE, the work waseightfold larger (1,095 § 43 vs. 135 § 5 kJ) and the exer-cise duration 17 times longer (60 vs. 3.5 min) than duringSIE. Muscle samples were taken before and 3 h after exer-cise. The mRNA of upstream markers of mitochondrialbiogenesis [peroxisome proliferator-activated receptor-�coactivator-1 (PGC-1�), PGC-1�-related coactivator (PRC)and peroxisome proliferator-activated receptor � (PPAR�)]increased to the same extent after SIE and IE (6-, 1.5- and1.5-fold increase, respectively). Of the downstream targets
of PGC-1�, mitochondrial transcription factor A (Tfam)increased only after SIE and was signiWcantly diVerentfrom that after IE (P < 0.05), whereas others increased tothe same extent (pyruvate dehydrogenase kinase, PDK4) orwas unchanged (nuclear respiratory factor 2, NRF2). Weconclude that upstream genetic markers of mitochondrialbiogenesis increase in a similar way in elite athletes afterone exercise session of SIE and IE. However, since the vol-ume and duration of work was considerably lower duringSIE and since Tfam, the downstream target of PGC-1�,increased only after SIE, we conclude that SIE might bea time-eYcient training strategy for highly trainedindividuals.
Keywords Mitochondrial biogenesis · Interval training · Elite athletes · Metabolic adaptation · Transcriptional regulation · PGC-1�
Introduction
Muscle oxidative power correlates strongly with aerobictraining status and endurance performance (Holloszy 1967;Irrcher et al. 2003; Tonkonogi and Sahlin 1997). Endurancetraining is a strong stimulator for mitochondrial biogenesisand 6–7 weeks of aerobic training can increase mitochon-drial volume density, in the working muscle, by 40–60% inuntrained subjects (Tarnopolsky et al. 2007; Tonkonogiet al. 2000).
There is a dispute about which type of training is themost eVective for inducing mitochondrial biogenesis.Based on the improvement in performance, some studiessuggest that traditional endurance exercise (TEE) (65–75%VO2peak for 1–2 h) is a more eVective training strategy thanhigh-intensity interval exercise (Kubukeli et al. 2002).
Communicated by Susan Ward.
P. Niklas · W. Li · S. Kent (&)Åstrand Laboratory, GIH, The Swedish School of Sport and Health Sciences, Box 5626, SE 114 86 Stockholm, Swedene-mail: [email protected]
P. Niklas · W. Li · S. KentDepartment of Physiology and Pharmacology, Karolinska Institutet, Stockholm, Sweden
W. LiInstitute of Physical Education and Health, East China Normal University, Shanghai, China
W. Jens · T. MichailLIVI, Högskolan Dalarnas Idrottsvetenskapliga Institut, Falun, Sweden
123
598 Eur J Appl Physiol (2010) 110:597–606
However, studies in untrained subjects have shown thattraining at high intensity is more eVective in improvingVO2max (Helgerud et al. 2007) and muscle oxidative capac-ity (Daussin et al. 2008) than TEE. Furthermore, recentdata show that 2–6 weeks of low-volume sprint intervalexercise (SIE), at an intensity corresponding to »250% ofVO2peak and an exercise duration of about 3 min per session,has a similar eVect on molecular markers for mitochondrialbiogenesis and endurance performance as TEE (40–120 min exercise per session at »65% of VO2peak) (Burgo-master et al. 2008; Gibala et al. 2006). SIE has thereforebeen suggested to represent a time-eYcient training strat-egy, but this remains to be investigated in endurance-trained athletes.
The eYciency of diVerent training protocols has tradi-tionally been evaluated in cross-sectional studies withdiVerent groups of subjects. However, the large variation inthe response to training between subjects reduces the statis-tical power and makes this study design insensitive. Fur-thermore, elite athletes normally follow a strict diet andtraining regime, making them hard to recruit for long-termtraining studies. Using gene expression analysis, it is possi-ble to evaluate the eYciency of an exercise protocol afterjust a single exercise session and diVerent types of trainingcan therefore be evaluated within the same subject.Although this technique has been used to evaluate trainingprotocols in sedentary and moderately trained subjects(Mortensen et al. 2007; Pilegaard et al. 2005; Wang et al.2009), there are no such studies in elite athletes.
Several signalling pathways regulating the transcriptionof mitochondrial genes have been identiWed, including theAMP-activated protein kinase (AMPK) and the calcium/calmodulin-dependent protein kinase (CaMK) (CoVey andHawley 2007; Terada and Tabata 2004). This regulation ismainly mediated by a family of transcriptional coactivators[e.g. peroxisome proliferator-activated receptor-� coactiva-tor-1 (PGC-1�), PGC-1-related coactivator (PRC) andperoxisome proliferator-activated receptor � (PPAR�)].PGC-1� is a major regulator of mitochondrial biogenesis bycoactivating numerous downstream mitochondrial tran-scription factors including the nuclear respiratory factor 2(NRF-2) and mitochondrial transcription factor A (Tfam)(Gleyzer et al. 2005; Jager et al. 2007). PRC is a member ofthe PGC-1 family and has a transcriptional speciWcityresembling that of PGC-1�, especially in its interactionwith nuclear respiratory factors (Andersson and Scarpulla2001; Scarpulla 2008). PPAR� is mainly expressed in skel-etal muscle and is an isoform of the PPAR family. PPAR�directly regulates some of the genes required for mitochon-drial biogenesis and it has subsequently been shown thatoverexpression or activation of PPAR� results in anincrease in PGC-1� protein via a post-transcriptional mech-anism (Hancock et al. 2008; Holloszy 2008). Furthermore,
recent data indicate that PPAR� interacts with AMPK andthat this interaction dramatically increases the stimulatingeVects of AMPK on mitochondrial biogenesis (Narkar et al.2008). The mRNA levels of PGC-1�, PRC and PPAR�increased already after one exercise session and have amaximal response within 2–3 h. The gene expression ofthese transcriptional coactivators and of downstream mito-chondrial transcription factors, such as Tfam and NRF-2,have been used as markers of mitochondrial biogenesis andto evaluate diVerent training protocols in untrained and nor-mally active subjects. However, little is known about howthese factors are inXuenced by exercise in elite athletes.
The purpose of the present investigation was: (a) tostudy the acute eVects of exercise on molecular markers formitochondrial biogenesis in endurance-trained athletes and(b) to study how these markers were aVected by tworadically diVerent high-intensity exercise protocols [low-volume sprint interval exercise (SIE) vs. high-volume inter-val exercise (IE)]. We hypothesized that both exerciseprotocols would induce an increase in mRNA levels ofmarkers for mitochondrial biogenesis and that this increasewould be similar after SIE and IE despite large diVerencesin time commitment and work done.
Methods
Subjects
Ten highly trained male cyclists volunteered to participatein the study. Average (mean § SE) age, height, weight,VO2peak, citrate synthase activity and Wbre type composition(relative MHC I composition) were: 24.7 § 1.4 years,179.1 § 1.5 cm, 70.1 § 2.0 kg, 67.8 § 1.1 mL min¡1 kg¡1,50 § 3.2 mmol min¡1 kg dry wt.¡1 and 59 § 3%, respec-tively. All the subjects had a long history of endurancetraining, spent 10–20 h of training and racing per week andwere competing at the highest national elite level in roadcycling and mountain biking. The maximal work rate dur-ing a step-wise incremental exercise test (Wmax) was403 § 13 W. Subjects were informed about the possiblerisks and discomforts involved in the experiment and gavetheir written consent prior to commencing the study. Thestudy design was approved by the Regional Ethics Commit-tee of Stockholm, Sweden (2008/422-32).
Preliminary testing
Preliminary testing was performed 1 week before the Wrsttrial. The subjects performed a standardized exercise test(Padilla et al. 2000) on an ergometer (Cyclus 2, RBM elek-tronik-automation GmbH, Leipzig, Germany), riding theirown bicycles in a standardized gear. The bicycle was
123
Eur J Appl Physiol (2010) 110:597–606 599
interfaced with the ergometer by removing both wheels andclamping the front and rear fork to the ergometer usingstandard quick release spanners. The ergometer wasequipped with a freewheel with a 12–25 cog cassette. The“standardized gear” simply means using the largest func-tional gear combination possible. On road bikes, this means53 £ 13 and on mountain bikes 44 £ 13. The 12-tooth cogwas never used due to interference with the set limits of therear derailleur. Initial power output was set at 120 W, with4-min work periods interspersed by 1 min of active recov-ery (50 W) and a 35 W increase between each work period.The average of the three highest consecutive 20 s VO2 val-ues was deWned as VO2peak. Wmax was calculated by the for-mula: Wmax = Wf + (X/240)35, where Wf is the power in thelast completed ramp and X is the time (s) that the powercould be maintained during the following ramp beforeexhaustion. Throughout the test, respiratory parameterswere monitored continuously with an online system (Oxy-con Pro, VIASYS Healthcare GmbH, Hoechberg, Ger-many) and heart rate (HR) was recorded using a S810 heartrate monitor (Polar Electro Oy, Kempele, Finland) inter-faced with a computer. Perceived exertion was ratedaccording to the Borg category scale (6–20).
Experimental protocol
The study was executed for 3 weeks in the middle of May,6 weeks into the competition season. All testings were per-formed 48–72 h after the weekends’ racing and the subjectswere only allowed to do recovery type exercises (heartrate < 120 bpm and duration < 1 h) during this period.After a standardized warm-up ending at a power output cor-responding to RER 1.0, the subjects performed two diVer-ent interval exercise sessions, 1 week apart in acounterbalanced fashion (Table 1). The SIE consisted of7 £ 30-s “all-out” Wingate type intervals (separated by4 min of active rest at 50 W) performed at »110 rpm in anisocadence mode on the Cyclus 2 ergometer. The IE con-sisted of 3 £ 20-min intervals (separated by 4 min of activerest at 50 W), where the subjects were instructed to ride ashard as possible (i.e. time trial eVort) during the three inter-
vals. During each interval, HR was recorded continuously,and VO2 was recorded during the last 5 min. Capillaryblood lactate (sampled from a Wngertip directly after eachinterval), peak power and mean power were measured dur-ing both SIE and IE. A total of four muscle biopsies wereobtained over the course of the experiment, two at eachexercise trial. The Wrst biopsy was obtained 15 min prior tothe exercise sessions, from one leg, and the second biopsywas obtained 3 h after completion of the exercise from theother leg. The relative order between the legs was random-ized. During the 3-h period, between the last exercise boutand the Wnal biopsy, subjects remained seated in the labora-tory.
Dietary control and pre-exercise meals
All subjects kept a dietary record during the 48 h precedingthe Wrst trial, and were instructed to duplicate this duringthe second trial. In order to reproduce the nutritional habitsof endurance athletes, the subjects consumed a beveragecontaining 4.5 kcal kg bw¡1 (0.93 g CHO kg bw¡1 and0.19 g protein kg bw¡1) directly after completion of eachexercise trial and a standardized meal containing13 kcal kg bw¡1 (1.8 g CHO kg bw¡1 and 0.8 g proteinkg bw¡1) 90 min after the completion of each trial.
Analytical procedures
Blood samples
Capillary blood samples were collected from a Wngertip andanalysed for lactate concentration using an automated lac-tate analyser (BIOSEN 5140, EKF Diagnostics, Barleben,Germany).
Muscle samples
Muscle samples were obtained from the middle portion ofthe vastus lateralis muscle through an incision madethrough the skin and fascia at one third the distancebetween the patella and anterior superior iliac spine, usingthe percutaneous needle biopsy technique with suction(Bergstrom 1962). All muscle samples were rapidly frozenin liquid nitrogen and stored at ¡80°C. The samples werethereafter freeze-dried, powdered, dissected free of bloodand connective tissue, and stored at ¡80°C for later deter-mination of mRNA levels, myosin heavy chain (MHC)composition and citrate synthase activity.
Fibre type composition and muscle citrate synthase activity
MHC composition was analysed as described previously(Talmadge and Roy 1993), with some minor modiWcations.
Table 1 Summary of sprint interval exercise (SIE) and high volumeinterval exercise (IE) protocols
Protocol SIE (7 £ 30 s) IE (3 £ 20 min)
Exercise intensity (mean power)
643 § 22 W (»184% of VO2peak)
304 § 12 W (»87% of VO2peak)
Time commitment including rest
27.5 min 68 min
Time commitment excluding rest
3.5 min 60 min
Total work 135 § 5 kJ 1,094 § 43 kJ
123
600 Eur J Appl Physiol (2010) 110:597–606
BrieXy, approximately 1 mg of freeze-dried muscle washomogenized in a buVer containing 2 mM HEPES (pH 7.4),1 mM EDTA, 5 mM EGTA, 10 mM MgCl2, 50 mM�-glycerophosphate, 1 mM N3VO4, 2 mM DTT, 1% TritonX-100, 20 �g leupeptin and 50 �g aprotinin and 40 �gPMSF per mL, and 1% of a phosphatase inhibitor cocktail(Sigma P-2850). The protein concentration was determinedusing a BCA protein assay (Thermo Fisher ScientiWc Inc.,Rockford, IL, USA), after which the muscle homogenateswere dissolved in a sample buVer (Laemmli, containing 5%�-Mercaptoethanol; Bio-Rad Laboratories AB, Sundby-berg, Sweden) and brought to a Wnal protein concentrationof 0.3 �g �l¡1 by heating them for 10 min at 60°C. 20 �l ofeach sample was heated for 5 min at 95°C and allowed tocool before loading on a SDS–PAGE separation and con-centration gel containing 8 and 4% acrylamide, respec-tively. �-Mercaptoethanol (at a Wnal concentration 0.16%)was added to the top running buVer, to improve the sharp-ness of the bands. Electrophoresis was done on ice in a 4°Croom for 24 h at 145 V/12 mA and the bands on the gelwere visualized and quantiWed by silver staining (PlusOneSilver Staining Kit, Protein; Amersham Bioscience, GEHealthcare, Little Chalfont, UK) and scanned with a GelDoc 2000 apparatus. Finally, the relative amounts of thediVerent isozymes of MHC were determined utilizing theQuantity One software, version 4.6.3 (Bio-Rad Laborato-ries AB, Sundbyberg, Sweden).
Muscle citrate synthase activity was analysed in musclehomogenates at 25°C as described previously (Tonkonogiand Sahlin 1997).
RNA extraction and real-time PCR analysis
Total RNA was extracted from 2–5 mg freeze-dried muscletissue using a Polytron PT 1600 E homogenizer (Kinemat-ica, Switzerland) and a PureZOL RNA isolation kit accord-ing to the manufacturer’s instructions (Bio-RadLaboratories AB, Sundbyberg, Sweden). The yield andquality of extracted RNA were estimated by spectrometry.The RNA yield from 1 mg freeze-dried muscle was onaverage 2.3 § 0.1 �g and the absorbance ratio 260/280 was1.6 § 0.02. The somewhat low 260/280 absorbance ratiowas at least in part due to a low pH of the DEPC watersince the absorbance ratio increased to approximately 1.7when the water was neutralized. RNA quality was alsotested in some of the samples with micro-gel electrophore-sis (Experion, Bio-Rad Laboratories AB, Sundbyberg,Sweden) and the obtained values of RNA Quality Indicator(RQI) were >8.5, verifying a high RNA quality. The quan-tiWcation cycle (Cq) for the target genes were between 23(PGC-1�) and 29 (NRF1). The melting curves of the PCRproduct showed only one peak demonstrating speciWcity ofthe primers and absence of contaminations. Preliminary
data from an on-going methodological study showed thatextraction of RNA from freeze-dried muscle resulted insomewhat lower yield (10%) than that from wet muscle,but without diVerences in the indices of quality (260/280absorbance ratio and RQI). RNA (1 �g) was reverse tran-scribed to cDNA (20 �l) using the iScript cDNA synthesiskit (Bio-Rad Laboratories AB, Sundbyberg, Sweden). Real-time RT-PCR was performed with a Bio-Rad iCycler (Bio-Rad Laboratories AB, Sundbyberg, Sweden) in a mixturecontaining 12.5 �l 2£ SYBR Green Supermix (Bio-RadLaboratories AB, Sundbyberg, Sweden), 0.5 �l of both theforward and reverse primers (Wnal concentrations 10 �M),and 11.5 �l template cDNA. The nucleotide sequences ofthe primers are presented in Table 2. Changes in geneexpression were normalized to the reference gene GAPDHand the values were expressed relative to the data obtainedbefore exercise using the 2¡��CT method (Livak andSchmittgen 2001). Resting mRNA levels were calculatedby setting the detection threshold at a Wxed position and theresults are presented as arbitrary units (AU) or fold change.The concentration of cDNA, annealing temperature andthermocycling conditions were optimized for each primerpair and assay sensitivity was high for all PCR products(RSq > 0.99 and eYciency > 90%).
Statistical analyses
Gene expression was analysed using a non-parametric Wil-coxon signed rank test. The Spearman’s correlation test wasused to analyse correlations between variables. DiVerencesin physiologic and metabolic data between intervals withinthe same protocol were analysed with a one-way repeated-measures analysis of variance (ANOVA) followed by apost-hoc test (Fischer LSD) and diVerences between proto-cols of the average values were analysed with a paired ttest. Statistical signiWcance was accepted at P < 0.05 and allvalues are presented as mean § SE.
Results
Physiologic and metabolic data
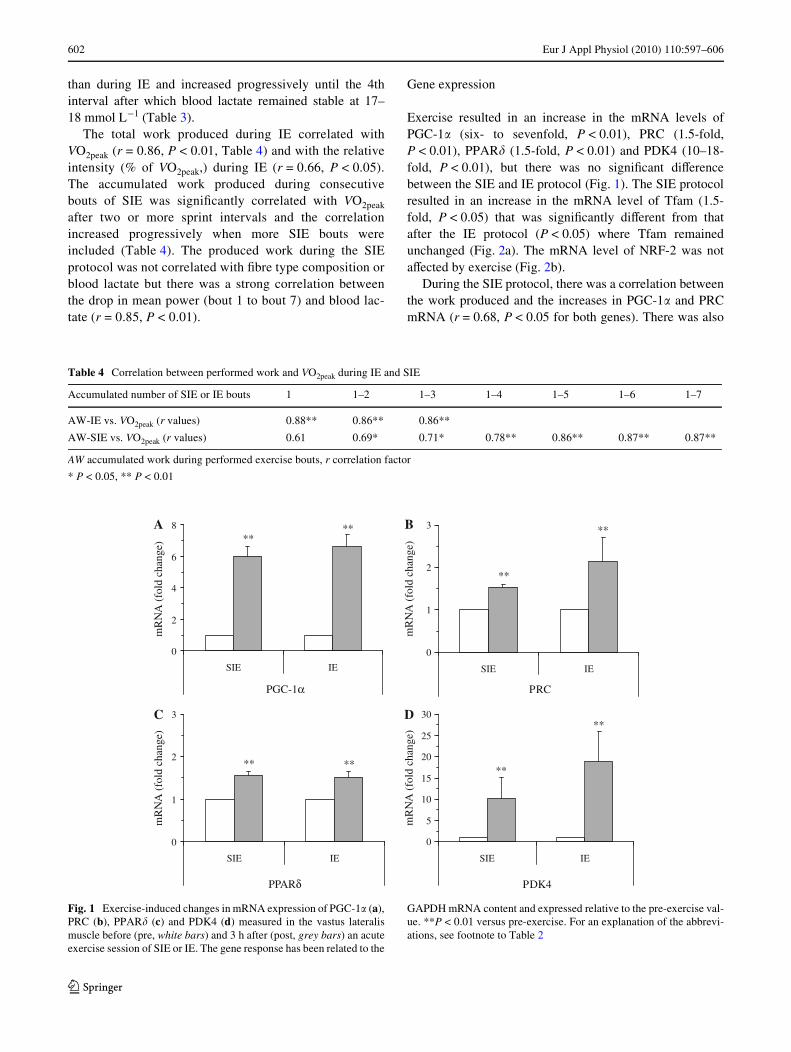
The total work during IE was eightfold higher than that dur-ing SIE and the total exercise duration 17-fold longer(Table 1). During SIE, mean power was twofold higherthan during IE, but in contrast to IE, where power was sim-ilar between the three exercise bouts, mean powerdecreased with 18% between the Wrst and the last of theseven exercise bouts.
There was no signiWcant diVerence between the three IEbouts in RER, VO2 and blood lactate (4.4 § 0.4 mmol L¡1).As expected, blood lactate was much higher during SIE
123
Eur J Appl Physiol (2010) 110:597–606 601
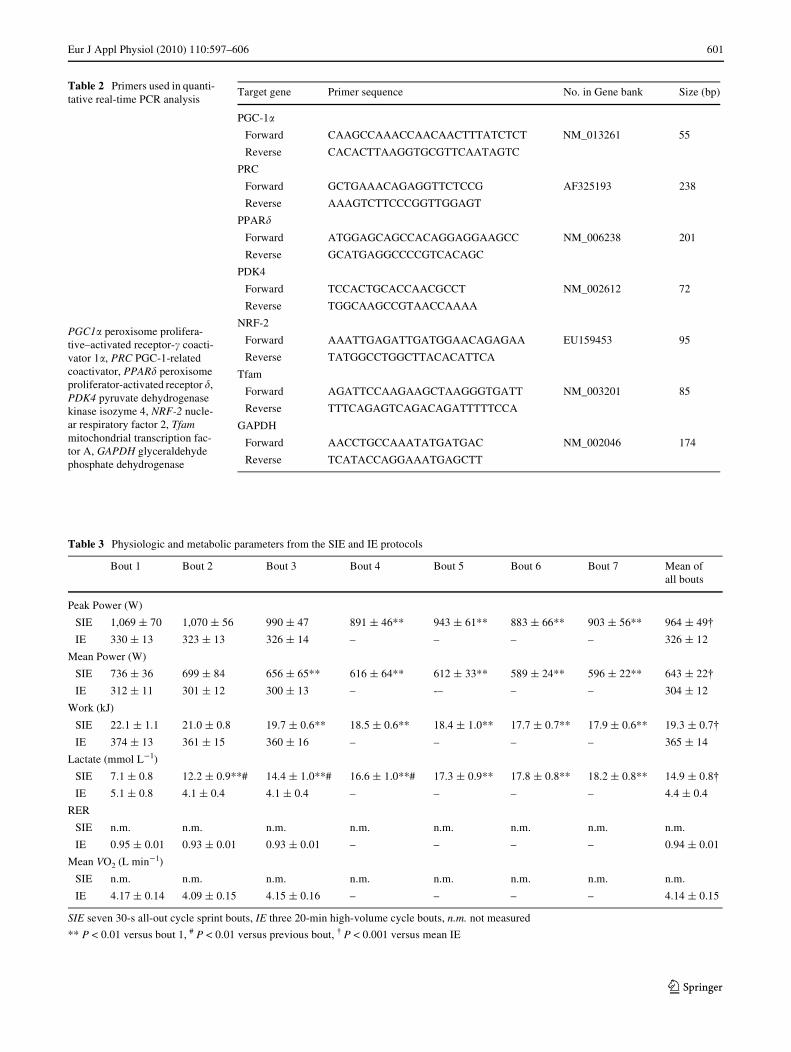
Table 2 Primers used in quanti-tative real-time PCR analysis
Target gene Primer sequence No. in Gene bank Size (bp)
PGC-1�
Forward CAAGCCAAACCAACAACTTTATCTCT NM_013261 55
Reverse CACACTTAAGGTGCGTTCAATAGTC
PRC
Forward GCTGAAACAGAGGTTCTCCG AF325193 238
Reverse AAAGTCTTCCCGGTTGGAGT
PPAR�
Forward ATGGAGCAGCCACAGGAGGAAGCC NM_006238 201
Reverse GCATGAGGCCCCGTCACAGC
PDK4
Forward TCCACTGCACCAACGCCT NM_002612 72
Reverse TGGCAAGCCGTAACCAAAA
NRF-2
Forward AAATTGAGATTGATGGAACAGAGAA EU159453 95
Reverse TATGGCCTGGCTTACACATTCA
Tfam
Forward AGATTCCAAGAAGCTAAGGGTGATT NM_003201 85
Reverse TTTCAGAGTCAGACAGATTTTTCCA
GAPDH
Forward AACCTGCCAAATATGATGAC NM_002046 174
Reverse TCATACCAGGAAATGAGCTT
PGC1� peroxisome prolifera-tive–activated receptor-� coacti-vator 1�, PRC PGC-1-related coactivator, PPAR� peroxisome proliferator-activated receptor �, PDK4 pyruvate dehydrogenase kinase isozyme 4, NRF-2 nucle-ar respiratory factor 2, Tfam mitochondrial transcription fac-tor A, GAPDH glyceraldehyde phosphate dehydrogenase
Table 3 Physiologic and metabolic parameters from the SIE and IE protocols
SIE seven 30-s all-out cycle sprint bouts, IE three 20-min high-volume cycle bouts, n.m. not measured
** P < 0.01 versus bout 1, # P < 0.01 versus previous bout, 9 P < 0.001 versus mean IE
Bout 1 Bout 2 Bout 3 Bout 4 Bout 5 Bout 6 Bout 7 Mean of all bouts
Peak Power (W)
SIE 1,069 § 70 1,070 § 56 990 § 47 891 § 46** 943 § 61** 883 § 66** 903 § 56** 964 § 499IE 330 § 13 323 § 13 326 § 14 – – – – 326 § 12
Mean Power (W)
SIE 736 § 36 699 § 84 656 § 65** 616 § 64** 612 § 33** 589 § 24** 596 § 22** 643 § 229IE 312 § 11 301 § 12 300 § 13 – -– – – 304 § 12
Work (kJ)
SIE 22.1 § 1.1 21.0 § 0.8 19.7 § 0.6** 18.5 § 0.6** 18.4 § 1.0** 17.7 § 0.7** 17.9 § 0.6** 19.3 § 0.79IE 374 § 13 361 § 15 360 § 16 – – – – 365 § 14
Lactate (mmol L¡1)
SIE 7.1 § 0.8 12.2 § 0.9**# 14.4 § 1.0**# 16.6 § 1.0**# 17.3 § 0.9** 17.8 § 0.8** 18.2 § 0.8** 14.9 § 0.89IE 5.1 § 0.8 4.1 § 0.4 4.1 § 0.4 – – – – 4.4 § 0.4
RER
SIE n.m. n.m. n.m. n.m. n.m. n.m. n.m. n.m.
IE 0.95 § 0.01 0.93 § 0.01 0.93 § 0.01 – – – – 0.94 § 0.01
Mean VO2 (L min¡1)
SIE n.m. n.m. n.m. n.m. n.m. n.m. n.m. n.m.
IE 4.17 § 0.14 4.09 § 0.15 4.15 § 0.16 – – – – 4.14 § 0.15
123
602 Eur J Appl Physiol (2010) 110:597–606
than during IE and increased progressively until the 4thinterval after which blood lactate remained stable at 17–18 mmol L¡1 (Table 3).
The total work produced during IE correlated withVO2peak (r = 0.86, P < 0.01, Table 4) and with the relativeintensity (% of VO2peak,) during IE (r = 0.66, P < 0.05).The accumulated work produced during consecutivebouts of SIE was signiWcantly correlated with VO2peak
after two or more sprint intervals and the correlationincreased progressively when more SIE bouts wereincluded (Table 4). The produced work during the SIEprotocol was not correlated with Wbre type composition orblood lactate but there was a strong correlation betweenthe drop in mean power (bout 1 to bout 7) and blood lac-tate (r = 0.85, P < 0.01).
Gene expression
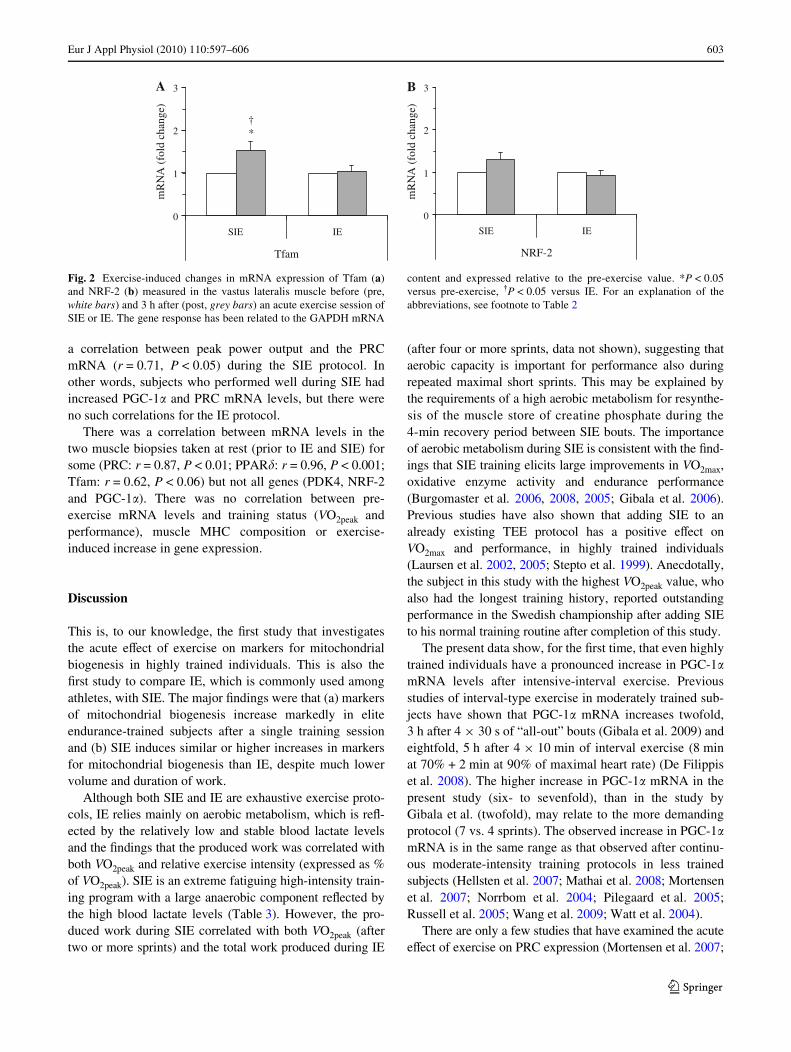
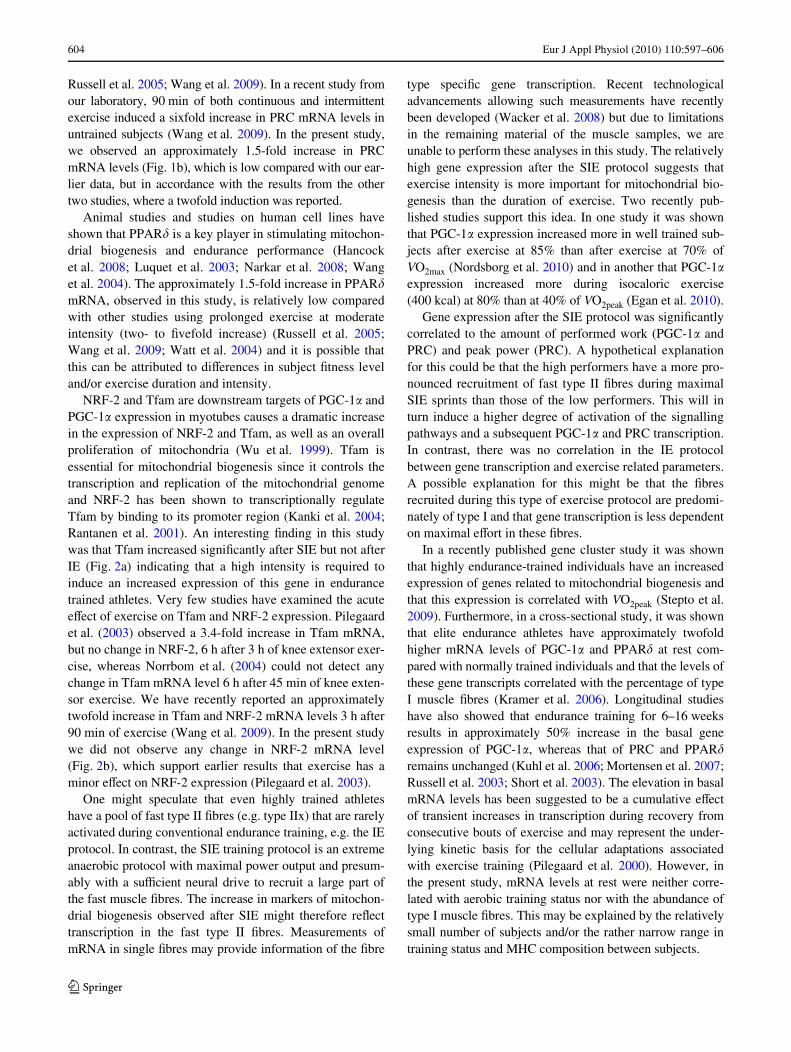
Exercise resulted in an increase in the mRNA levels ofPGC-1� (six- to sevenfold, P < 0.01), PRC (1.5-fold,P < 0.01), PPAR� (1.5-fold, P < 0.01) and PDK4 (10–18-fold, P < 0.01), but there was no signiWcant diVerencebetween the SIE and IE protocol (Fig. 1). The SIE protocolresulted in an increase in the mRNA level of Tfam (1.5-fold, P < 0.05) that was signiWcantly diVerent from thatafter the IE protocol (P < 0.05) where Tfam remainedunchanged (Fig. 2a). The mRNA level of NRF-2 was notaVected by exercise (Fig. 2b).
During the SIE protocol, there was a correlation betweenthe work produced and the increases in PGC-1� and PRCmRNA (r = 0.68, P < 0.05 for both genes). There was also
Table 4 Correlation between performed work and VO2peak during IE and SIE
AW accumulated work during performed exercise bouts, r correlation factor
* P < 0.05, ** P < 0.01
Accumulated number of SIE or IE bouts 1 1–2 1–3 1–4 1–5 1–6 1–7
AW-IE vs. VO2peak (r values) 0.88** 0.86** 0.86**
AW-SIE vs. VO2peak (r values) 0.61 0.69* 0.71* 0.78** 0.86** 0.87** 0.87**
Fig. 1 Exercise-induced changes in mRNA expression of PGC-1� (a),PRC (b), PPAR� (c) and PDK4 (d) measured in the vastus lateralismuscle before (pre, white bars) and 3 h after (post, grey bars) an acuteexercise session of SIE or IE. The gene response has been related to the
GAPDH mRNA content and expressed relative to the pre-exercise val-ue. **P < 0.01 versus pre-exercise. For an explanation of the abbrevi-ations, see footnote to Table 2
0
2
4
6
8
PGC-1α
mR
NA
(fo
ld c
hang
e)
****A
0
1
2
3
SIE IE SIE IE
PRC
mR
NA
(fo
ld c
hang
e)
**
**B
0
1
2
3
SIE IE
PPARδ
mR
NA
(fo
ld c
hang
e)
** **
C
0
5
10
15
20
25
30
SIE IE
PDK4
mR
NA
(fo
ld c
hang
e)
**
**D
123
Eur J Appl Physiol (2010) 110:597–606 603
a correlation between peak power output and the PRCmRNA (r = 0.71, P < 0.05) during the SIE protocol. Inother words, subjects who performed well during SIE hadincreased PGC-1� and PRC mRNA levels, but there wereno such correlations for the IE protocol.
There was a correlation between mRNA levels in thetwo muscle biopsies taken at rest (prior to IE and SIE) forsome (PRC: r = 0.87, P < 0.01; PPAR�: r = 0.96, P < 0.001;Tfam: r = 0.62, P < 0.06) but not all genes (PDK4, NRF-2and PGC-1�). There was no correlation between pre-exercise mRNA levels and training status (VO2peak andperformance), muscle MHC composition or exercise-induced increase in gene expression.
Discussion
This is, to our knowledge, the Wrst study that investigatesthe acute eVect of exercise on markers for mitochondrialbiogenesis in highly trained individuals. This is also theWrst study to compare IE, which is commonly used amongathletes, with SIE. The major Wndings were that (a) markersof mitochondrial biogenesis increase markedly in eliteendurance-trained subjects after a single training sessionand (b) SIE induces similar or higher increases in markersfor mitochondrial biogenesis than IE, despite much lowervolume and duration of work.
Although both SIE and IE are exhaustive exercise proto-cols, IE relies mainly on aerobic metabolism, which is reX-ected by the relatively low and stable blood lactate levelsand the Wndings that the produced work was correlated withboth VO2peak and relative exercise intensity (expressed as %of VO2peak). SIE is an extreme fatiguing high-intensity train-ing program with a large anaerobic component reXected bythe high blood lactate levels (Table 3). However, the pro-duced work during SIE correlated with both VO2peak (aftertwo or more sprints) and the total work produced during IE
(after four or more sprints, data not shown), suggesting thataerobic capacity is important for performance also duringrepeated maximal short sprints. This may be explained bythe requirements of a high aerobic metabolism for resynthe-sis of the muscle store of creatine phosphate during the4-min recovery period between SIE bouts. The importanceof aerobic metabolism during SIE is consistent with the Wnd-ings that SIE training elicits large improvements in VO2max,oxidative enzyme activity and endurance performance(Burgomaster et al. 2006, 2008, 2005; Gibala et al. 2006).Previous studies have also shown that adding SIE to analready existing TEE protocol has a positive eVect onVO2max and performance, in highly trained individuals(Laursen et al. 2002, 2005; Stepto et al. 1999). Anecdotally,the subject in this study with the highest VO2peak value, whoalso had the longest training history, reported outstandingperformance in the Swedish championship after adding SIEto his normal training routine after completion of this study.
The present data show, for the Wrst time, that even highlytrained individuals have a pronounced increase in PGC-1�mRNA levels after intensive-interval exercise. Previousstudies of interval-type exercise in moderately trained sub-jects have shown that PGC-1� mRNA increases twofold,3 h after 4 £ 30 s of “all-out” bouts (Gibala et al. 2009) andeightfold, 5 h after 4 £ 10 min of interval exercise (8 minat 70% + 2 min at 90% of maximal heart rate) (De Filippiset al. 2008). The higher increase in PGC-1� mRNA in thepresent study (six- to sevenfold), than in the study byGibala et al. (twofold), may relate to the more demandingprotocol (7 vs. 4 sprints). The observed increase in PGC-1�mRNA is in the same range as that observed after continu-ous moderate-intensity training protocols in less trainedsubjects (Hellsten et al. 2007; Mathai et al. 2008; Mortensenet al. 2007; Norrbom et al. 2004; Pilegaard et al. 2005;Russell et al. 2005; Wang et al. 2009; Watt et al. 2004).
There are only a few studies that have examined the acuteeVect of exercise on PRC expression (Mortensen et al. 2007;
Fig. 2 Exercise-induced changes in mRNA expression of Tfam (a)and NRF-2 (b) measured in the vastus lateralis muscle before (pre,white bars) and 3 h after (post, grey bars) an acute exercise session ofSIE or IE. The gene response has been related to the GAPDH mRNA
content and expressed relative to the pre-exercise value. *P < 0.05versus pre-exercise, 9P < 0.05 versus IE. For an explanation of theabbreviations, see footnote to Table 2
0
1
2
3
Tfam
mR
NA
(fo
ld c
hang
e)
*†
A
0
1
2
3
SIE IE SIE IE
NRF-2
mR
NA
(fo
ld c
hang
e)
B
123
604 Eur J Appl Physiol (2010) 110:597–606
Russell et al. 2005; Wang et al. 2009). In a recent study fromour laboratory, 90 min of both continuous and intermittentexercise induced a sixfold increase in PRC mRNA levels inuntrained subjects (Wang et al. 2009). In the present study,we observed an approximately 1.5-fold increase in PRCmRNA levels (Fig. 1b), which is low compared with our ear-lier data, but in accordance with the results from the othertwo studies, where a twofold induction was reported.
Animal studies and studies on human cell lines haveshown that PPAR� is a key player in stimulating mitochon-drial biogenesis and endurance performance (Hancocket al. 2008; Luquet et al. 2003; Narkar et al. 2008; Wanget al. 2004). The approximately 1.5-fold increase in PPAR�mRNA, observed in this study, is relatively low comparedwith other studies using prolonged exercise at moderateintensity (two- to Wvefold increase) (Russell et al. 2005;Wang et al. 2009; Watt et al. 2004) and it is possible thatthis can be attributed to diVerences in subject Wtness leveland/or exercise duration and intensity.
NRF-2 and Tfam are downstream targets of PGC-1� andPGC-1� expression in myotubes causes a dramatic increasein the expression of NRF-2 and Tfam, as well as an overallproliferation of mitochondria (Wu et al. 1999). Tfam isessential for mitochondrial biogenesis since it controls thetranscription and replication of the mitochondrial genomeand NRF-2 has been shown to transcriptionally regulateTfam by binding to its promoter region (Kanki et al. 2004;Rantanen et al. 2001). An interesting Wnding in this studywas that Tfam increased signiWcantly after SIE but not afterIE (Fig. 2a) indicating that a high intensity is required toinduce an increased expression of this gene in endurancetrained athletes. Very few studies have examined the acuteeVect of exercise on Tfam and NRF-2 expression. Pilegaardet al. (2003) observed a 3.4-fold increase in Tfam mRNA,but no change in NRF-2, 6 h after 3 h of knee extensor exer-cise, whereas Norrbom et al. (2004) could not detect anychange in Tfam mRNA level 6 h after 45 min of knee exten-sor exercise. We have recently reported an approximatelytwofold increase in Tfam and NRF-2 mRNA levels 3 h after90 min of exercise (Wang et al. 2009). In the present studywe did not observe any change in NRF-2 mRNA level(Fig. 2b), which support earlier results that exercise has aminor eVect on NRF-2 expression (Pilegaard et al. 2003).
One might speculate that even highly trained athleteshave a pool of fast type II Wbres (e.g. type IIx) that are rarelyactivated during conventional endurance training, e.g. the IEprotocol. In contrast, the SIE training protocol is an extremeanaerobic protocol with maximal power output and presum-ably with a suYcient neural drive to recruit a large part ofthe fast muscle Wbres. The increase in markers of mitochon-drial biogenesis observed after SIE might therefore reXecttranscription in the fast type II Wbres. Measurements ofmRNA in single Wbres may provide information of the Wbre
type speciWc gene transcription. Recent technologicaladvancements allowing such measurements have recentlybeen developed (Wacker et al. 2008) but due to limitationsin the remaining material of the muscle samples, we areunable to perform these analyses in this study. The relativelyhigh gene expression after the SIE protocol suggests thatexercise intensity is more important for mitochondrial bio-genesis than the duration of exercise. Two recently pub-lished studies support this idea. In one study it was shownthat PGC-1� expression increased more in well trained sub-jects after exercise at 85% than after exercise at 70% ofVO2max (Nordsborg et al. 2010) and in another that PGC-1�expression increased more during isocaloric exercise(400 kcal) at 80% than at 40% of VO2peak (Egan et al. 2010).
Gene expression after the SIE protocol was signiWcantlycorrelated to the amount of performed work (PGC-1� andPRC) and peak power (PRC). A hypothetical explanationfor this could be that the high performers have a more pro-nounced recruitment of fast type II Wbres during maximalSIE sprints than those of the low performers. This will inturn induce a higher degree of activation of the signallingpathways and a subsequent PGC-1� and PRC transcription.In contrast, there was no correlation in the IE protocolbetween gene transcription and exercise related parameters.A possible explanation for this might be that the Wbresrecruited during this type of exercise protocol are predomi-nately of type I and that gene transcription is less dependenton maximal eVort in these Wbres.
In a recently published gene cluster study it was shownthat highly endurance-trained individuals have an increasedexpression of genes related to mitochondrial biogenesis andthat this expression is correlated with VO2peak (Stepto et al.2009). Furthermore, in a cross-sectional study, it was shownthat elite endurance athletes have approximately twofoldhigher mRNA levels of PGC-1� and PPAR� at rest com-pared with normally trained individuals and that the levels ofthese gene transcripts correlated with the percentage of typeI muscle Wbres (Kramer et al. 2006). Longitudinal studieshave also showed that endurance training for 6–16 weeksresults in approximately 50% increase in the basal geneexpression of PGC-1�, whereas that of PRC and PPAR�remains unchanged (Kuhl et al. 2006; Mortensen et al. 2007;Russell et al. 2003; Short et al. 2003). The elevation in basalmRNA levels has been suggested to be a cumulative eVectof transient increases in transcription during recovery fromconsecutive bouts of exercise and may represent the under-lying kinetic basis for the cellular adaptations associatedwith exercise training (Pilegaard et al. 2000). However, inthe present study, mRNA levels at rest were neither corre-lated with aerobic training status nor with the abundance oftype I muscle Wbres. This may be explained by the relativelysmall number of subjects and/or the rather narrow range intraining status and MHC composition between subjects.
123
Eur J Appl Physiol (2010) 110:597–606 605
The level of mRNA in muscle biopsies taken beforeexercise at two diVerent occasions, separated by 2 weeks,showed a strong correlation for PRC and PPAR�(P < 0.001) and a weak correlation for Tfam (P < 0.06).However, the mRNA level of PGC-1�, PDK4 and NRF-2measured at the two diVerent occasions was not correlatedwith each other and large Xuctuations were observed forPGC-1� (up to 80%) and PDK4 (up to 900%). Theseresults indicate that the PRC, PPAR� and Tfam levels arerather “stable” within the muscle, whereas the PGC-1� andPDK4 levels are more easily inXuenced by external factorssuch as diet and exercise. Although subjects wereinstructed to maintain the same diet and to restrain theirtraining to low intensity exercise 48–72 h prior to the test,it is possible that variation in these factors could inXuencepre-exercise levels of PGC-1� mRNA. Future studies ofgene expression should be designed with a more carefulcontrol of diet and exercise prior to the test, albeit it shouldbe recognized that this is diYcult in studies performed onelite cyclists in the competitive season. Nevertheless, sincethe exercise-induced increase in gene expression was notcorrelated with the pre-exercise level, it seems unlikelythat the variation in pre-exercise PGC-1� mRNA inXu-enced the results.
In summary, we have, for the Wrst time, demonstratedthat transcription of upstream markers of mitochondrialbiogenesis (PGC-1�, PRC, PPAR�) is increased after onesession of exhaustive exercise in highly trained individualswithout diVerences between SIE and IE. Interestingly, themRNA of a downstream target of PGC-1� (Tfam)increased only after SIE. Gene transcription during SIE wasdependent on performed work, which probably relates tothe necessity to activate fast type II Wbres. SIE training maytherefore be an important time-eYcient training strategy toincrease performance in elite athletes who have a longtraining history with peak oxygen levels and metabolicadaptations close to their genetic maximum. Long-termstudies examining enzyme activation, protein levels andperformance are required to conWrm this conclusion.
Acknowledgments This work was supported Wnancially by grantsfrom the Swedish Research Council (project 20654), the SwedishNational Centre for Research in Sport, and GIH, the Swedish Schoolof Sport and Health Sciences. The authors wish to sincerely thank allof our subjects participating in this study and Magnus Knutsson andCharlotte Schönbeck for their helpful assistance. None of the authorshad any potential Wnancial conXicts of interest.
References
Andersson U, Scarpulla RC (2001) Pgc-1-related coactivator, a novel,serum-inducible coactivator of nuclear respiratory factor1-dependent transcription in mammalian cells. Mol Cell Biol21:3738–3749
Bergstrom J (1962) Muscle electrolytes in man determined by neutronactivation analysis on needle biopsy specimens. Scand J Clin LabInvest Suppl 68:1–110
Burgomaster KA, Hughes SC, Heigenhauser GJ, Bradwell SN, GibalaMJ (2005) Six sessions of sprint interval training increases mus-cle oxidative potential and cycle endurance capacity in humans.J Appl Physiol 98:1985–1990
Burgomaster KA, Heigenhauser GJ, Gibala MJ (2006) EVect of short-term sprint interval training on human skeletal muscle carbohy-drate metabolism during exercise and time-trial performance.J Appl Physiol 100:2041–2047
Burgomaster KA, Howarth KR, Phillips SM, Rakobowchuk M,Macdonald MJ, McGee SL, Gibala MJ (2008) Similar metabolicadaptations during exercise after low volume sprint interval andtraditional endurance training in humans. J Physiol 586:151–160
CoVey VG, Hawley JA (2007) The molecular bases of training adapta-tion. Sports Med 37:737–763
Daussin FN, Zoll J, Dufour SP, Ponsot E, Lonsdorfer-Wolf E, Doutre-leau S, Mettauer B, Piquard F, Geny B, Richard R (2008) EVectof interval versus continuous training on cardiorespiratory andmitochondrial functions: relationship to aerobic performanceimprovements in sedentary subjects. Am J Physiol Regul IntegrComp Physiol 295:R264–R272
De Filippis E, Alvarez G, Berria R, Cusi K, Everman S, Meyer C,Mandarino LJ (2008) Insulin-resistant muscle is exerciseresistant: evidence for reduced response of nuclear-encoded mito-chondrial genes to exercise. Am J Physiol Endocrinol Metab294:E607–E614
Egan B, Carson BP, Garcia-Roves PM, Chibalin AV, SarsWeld FM,Barron N, McCaVrey N, Moyna NM, Zierath JR, O’Gorman DJ(2010) Exercise intensity-dependent regulation of PGC-1{alpha}mRNA abundance is associated with diVerential activation ofupstream signalling kinases in human skeletal muscle. J Physiol588(Pt 10):1779–1790
Gibala MJ, Little JP, van Essen M, Wilkin GP, Burgomaster KA,Safdar A, Raha S, Tarnopolsky MA (2006) Short-term sprintinterval versus traditional endurance training: similar initialadaptations in human skeletal muscle and exercise performance.J Physiol 575:901–911
Gibala MJ, McGee SL, Garnham AP, Howlett KF, Snow RJ,Hargreaves M (2009) Brief intense interval exercise activatesAMPK and p38MAPK signaling and increases the expression ofPGC-1alpha in human skeletal muscle. J Appl Physiol 106:929–934
Gleyzer N, Vercauteren K, Scarpulla RC (2005) Control of mitochon-drial transcription speciWcity factors (TFB1 M and TFB2 M) bynuclear respiratory factors (NRF-1 and NRF-2) and PGC-1 familycoactivators. Mol Cell Biol 25:1354–1366
Hancock CR, Han DH, Chen M, Terada S, Yasuda T, Wright DC,Holloszy JO (2008) High-fat diets cause insulin resistance despitean increase in muscle mitochondria. Proc Natl Acad Sci USA105:7815–7820
Helgerud J, Hoydal K, Wang E, Karlsen T, Berg P, Bjerkaas M,Simonsen T, Helgesen C, Hjorth N, Bach R, HoV J (2007) Aero-bic high-intensity intervals improve VO2max more than moderatetraining. Med Sci Sports Exerc 39:665–671
Hellsten Y, Nielsen JJ, Lykkesfeldt J, Bruhn M, Silveira L, PilegaardH, Bangsbo J (2007) Antioxidant supplementation enhances theexercise-induced increase in mitochondrial uncoupling protein 3and endothelial nitric oxide synthase mRNA content in humanskeletal muscle. Free Radic Biol Med 43:353–361
Holloszy JO (1967) Biochemical adaptations in muscle. EVects ofexercise on mitochondrial oxygen uptake and respiratory enzymeactivity in skeletal muscle. J Biol Chem 242:2278–2282
Holloszy JO (2008) Regulation by exercise of skeletal muscle con-tent of mitochondria and GLUT4. J Physiol Pharmacol 59(Suppl7):5–18
123
606 Eur J Appl Physiol (2010) 110:597–606
Irrcher I, Adhihetty PJ, Joseph AM, Ljubicic V, Hood DA (2003)Regulation of mitochondrial biogenesis in muscle by enduranceexercise. Sports Med 33:783–793
Jager S, Handschin C, St-Pierre J, Spiegelman BM (2007) AMP-acti-vated protein kinase (AMPK) action in skeletal muscle via directphosphorylation of PGC-1alpha. Proc Natl Acad Sci USA104:12017–12022
Kanki T, Ohgaki K, Gaspari M, Gustafsson CM, Fukuoh A, Sasaki N,Hamasaki N, Kang D (2004) Architectural role of mitochondrialtranscription factor A in maintenance of human mitochondrialDNA. Mol Cell Biol 24:9823–9834
Kramer DK, Ahlsen M, Norrbom J, Jansson E, Hjeltnes N, GustafssonT, Krook A (2006) Human skeletal muscle Wbre type variationscorrelate with PPAR alpha, PPAR delta and PGC-1 alpha mRNA.Acta Physiol (Oxf) 188:207–216
Kubukeli ZN, Noakes TD, Dennis SC (2002) Training techniques to im-prove endurance exercise performances. Sports Med 32:489–509
Kuhl JE, Ruderman NB, Musi N, Goodyear LJ, Patti ME, CrunkhornS, Dronamraju D, Thorell A, Nygren J, Ljungkvist O, DegerbladM, Stahle A, Brismar TB, Andersen KL, Saha AK, Efendic S,Bavenholm PN (2006) Exercise training decreases the concentra-tion of malonyl-CoA and increases the expression and activity ofmalonyl-CoA decarboxylase in human muscle. Am J PhysiolEndocrinol Metab 290:E1296–E1303
Laursen PB, Shing CM, Peake JM, Coombes JS, Jenkins DG (2002)Interval training program optimization in highly trained endur-ance cyclists. Med Sci Sports Exerc 34:1801–1807
Laursen PB, Shing CM, Peake JM, Coombes JS, Jenkins DG (2005)InXuence of high-intensity interval training on adaptations inwell-trained cyclists. J Strength Cond Res 19:527–533
Livak KJ, Schmittgen TD (2001) Analysis of relative gene expressiondata using real-time quantitative PCR and the 2(-Delta DeltaC(T)) Method. Methods 25:402–408
Luquet S, Lopez-Soriano J, Holst D, Fredenrich A, Melki J,Rassoulzadegan M, Grimaldi PA (2003) Peroxisome proliferator-activated receptor delta controls muscle development and oxida-tive capability. FASEB J 17:2299–2301
Mathai AS, Bonen A, Benton CR, Robinson DL, Graham TE (2008)Rapid exercise-induced changes in PGC-1alpha mRNA and pro-tein in human skeletal muscle. J Appl Physiol 105:1098–1105
Mortensen OH, Plomgaard P, Fischer CP, Hansen AK, Pilegaard H,Pedersen BK (2007) PGC-1beta is downregulated by training inhuman skeletal muscle: no eVect of training twice every secondday vs. once daily on expression of the PGC-1 family. J ApplPhysiol 103:1536–1542
Narkar VA, Downes M, Yu RT, Embler E, Wang YX, Banayo E,Mihaylova MM, Nelson MC, Zou Y, Juguilon H, Kang H, ShawRJ, Evans RM (2008) AMPK and PPARdelta agonists are exer-cise mimetics. Cell 134:405–415
Nordsborg NB, Lundby C, Leick L, Pilegaard H (2010) Relative work-load determines exercise induced increases in PGC-1alpha mRNA.Med Sci Sports Exerc. doi:10.1249/MSS.0b013e3181d2d21c
Norrbom J, Sundberg CJ, Ameln H, Kraus WE, Jansson E, GustafssonT (2004) PGC-1alpha mRNA expression is inXuenced by meta-bolic perturbation in exercising human skeletal muscle. J ApplPhysiol 96:189–194
Padilla S, Mujika I, Orbananos J, Angulo F (2000) Exercise intensityduring competition time trials in professional road cycling. MedSci Sports Exerc 32:850–856
Pilegaard H, Ordway GA, Saltin B, Neufer PD (2000) Transcriptionalregulation of gene expression in human skeletal muscle duringrecovery from exercise. Am J Physiol Endocrinol Metab279:E806–E814
Pilegaard H, Saltin B, Neufer PD (2003) Exercise induces transienttranscriptional activation of the PGC-1alpha gene in human skel-etal muscle. J Physiol 546:851–858
Pilegaard H, Osada T, Andersen LT, Helge JW, Saltin B, Neufer PD(2005) Substrate availability and transcriptional regulation ofmetabolic genes in human skeletal muscle during recovery fromexercise. Metabolism 54:1048–1055
Rantanen A, Jansson M, Oldfors A, Larsson NG (2001) Downregula-tion of Tfam and mtDNA copy number during mammalian sper-matogenesis. Mamm Genome 12:787–792
Russell AP, Feilchenfeldt J, Schreiber S, Praz M, Crettenand A,Gobelet C, Meier CA, Bell DR, Kralli A, Giacobino JP, Deriaz O(2003) Endurance training in humans leads to Wber type-speciWcincreases in levels of peroxisome proliferator-activated receptor-gamma coactivator-1 and peroxisome proliferator-activatedreceptor-alpha in skeletal muscle. Diabetes 52:2874–2881
Russell AP, Hesselink MK, Lo SK, Schrauwen P (2005) Regulation ofmetabolic transcriptional co-activators and transcription factorswith acute exercise. FASEB J 19:986–988
Scarpulla RC (2008) Nuclear control of respiratory chain expressionby nuclear respiratory factors and PGC-1-related coactivator. AnnNY Acad Sci 1147:321–334
Short KR, Vittone JL, Bigelow ML, Proctor DN, Rizza RA, Coenen-Schimke JM, Nair KS (2003) Impact of aerobic exercise trainingon age-related changes in insulin sensitivity and muscle oxidativecapacity. Diabetes 52:1888–1896
Stepto NK, Hawley JA, Dennis SC, Hopkins WG (1999) EVects ofdiVerent interval-training programs on cycling time-trial perfor-mance. Med Sci Sports Exerc 31:736–741
Stepto NK, CoVey VG, Carey AL, Ponnampalam AP, Canny BJ,Powell D, Hawley JA (2009) Global gene expression in skeletalmuscle from well-trained strength and endurance athletes. MedSci Sports Exerc 41:546–565
Talmadge RJ, Roy RR (1993) Electrophoretic separation of rat skeletalmuscle myosin heavy-chain isoforms. J Appl Physiol 75:2337–2340
Tarnopolsky MA, Rennie CD, Robertshaw HA, Fedak-Tarnopolsky SN,Devries MC, Hamadeh MJ (2007) InXuence of endurance exercisetraining and sex on intramyocellular lipid and mitochondrial ultra-structure, substrate use, and mitochondrial enzyme activity. AmJ Physiol Regul Integr Comp Physiol 292:R1271–R1278
Terada S, Tabata I (2004) EVects of acute bouts of running and swim-ming exercise on PGC-1alpha protein expression in rat epit-rochlearis and soleus muscle. Am J Physiol Endocrinol Metab286:E208–E216
Tonkonogi M, Sahlin K (1997) Rate of oxidative phosphorylation inisolated mitochondria from human skeletal muscle: eVect of train-ing status. Acta Physiol Scand 161:345–353
Tonkonogi M, Walsh B, Svensson M, Sahlin K (2000) Mitochondrialfunction and antioxidative defence in human muscle: eVects ofendurance training and oxidative stress. J Physiol 528(Pt 2):379–388
Wacker MJ, Tehel MM, Gallagher PM (2008) Technique for quantita-tive RT-PCR analysis directly from single muscle Wbers. J ApplPhysiol 105:308–315
Wang YX, Zhang CL, Yu RT, Cho HK, Nelson MC, Bayuga-OcampoCR, Ham J, Kang H, Evans RM (2004) Regulation of muscle Wbertype and running endurance by PPARdelta. PLoS Biol 2:e294
Wang L, Psilander N, Tonkonogi M, Ding S, Sahlin K (2009) Similarexpression of oxidative genes after interval and continuous exer-cise. Med Sci Sports Exerc 41:2136–2144
Watt MJ, Southgate RJ, Holmes AG, Febbraio MA (2004) Suppressionof plasma free fatty acids upregulates peroxisome proliferator-activated receptor (PPAR) alpha and delta and PPAR coactivator1alpha in human skeletal muscle, but not lipid regulatory genes.J Mol Endocrinol 33:533–544
Wu Z, Puigserver P, Andersson U, Zhang C, Adelmant G, Mootha V,Troy A, Cinti S, Lowell B, Scarpulla RC, Spiegelman BM (1999)Mechanisms controlling mitochondrial biogenesis and respirationthrough the thermogenic coactivator PGC-1. Cell 98:115–124
123


