Embed Size (px)
Citation preview
ES
VD
a
ARRAA
KERTIS
1
bOmtniffiMoc
ttrlfirR
0d
Research Policy 41 (2012) 614– 623
Contents lists available at SciVerse ScienceDirect
Research Policy
j our nal ho me p ag e: www.elsev ier .com/ locate / respol
nvironmental innovation and R&D cooperation: Empirical evidence frompanish manufacturing firms
alentina De Marchi ∗
epartment of Economics and Management, University of Padova, Via del Santo 33, 35123 Padova, Italy
r t i c l e i n f o
rticle history:eceived 24 August 2010eceived in revised form 17 August 2011ccepted 2 October 2011vailable online 26 October 2011
eywords:
a b s t r a c t
This paper explores the relationship between firms’ R&D cooperation strategies and their propensity tointroduce environmental innovations.
Previous literature has supported that environmental innovations differ from other innovations as faras externalities and drivers of their introduction are concerned, highlighting mainly the importance ofregulation to trigger them. Using data from the Community Innovation Survey on Spanish manufactur-ing firms (PITEC), this paper investigates specificities that affect rather how they are developed, and in
nvironmental innovation&D cooperationwo-part logit modelnnovation surveypain
particular the higher importance of R&D cooperation with external partners.The econometric estimations, controlling for selection bias, suggest that environmental innovative
firms cooperate on innovation with external partners to a higher extent than other innovative firms.Furthermore, cooperation with suppliers, KIBS and universities is more relevant than for other innovators,whereas cooperation with clients does not seem to be differentially important. Finally, the results bespokeof a substitution effect between cooperation activities and the internal R&D effort.
. Introduction
The importance of the environmental agenda for industry haseen rising exponentially at the international level in recent years.n the one hand, increasing consumers’ awareness on the environ-ental impact of their consumption choices and their willingness
o reduce the ecological footprint (Harrison et al., 2005) createsew market opportunities for companies. On the other hand,
ncreasingly restrictive policies punishing environmentally harm-ul behaviors and the action of NGOs, which raises the attention onrms’ polluting activities (Porter and van der Linde, 1995; Spar andure, 2003), encourage firms to control the effects of their activities
n the environment to reduce reputation risks and avoid additionalosts.
The way companies integrate environmental concerns intoheir strategies while consolidating their competitive advantage ishrough environmental innovations. Despite the interest on envi-onmental innovations is on the rise, research on this field is stillimited. A number of studies supported that those innovations dif-er from other innovations as far as externalities and drivers of their
ntroduction are concerned, highlighting mainly the importance ofegulation to trigger them (e.g., Porter and van der Linde, 1995;ennings, 2000; Jaffe et al., 2002, 2005). However, there is still little∗ Tel.: +39 049 827 3848; fax: +39 049 827 4211.E-mail address: [email protected]
048-7333/$ – see front matter © 2011 Elsevier B.V. All rights reserved.oi:10.1016/j.respol.2011.10.002
© 2011 Elsevier B.V. All rights reserved.
empirical evidence on specificities of those innovations regardinghow they are conceived and realized, notwithstanding the impor-tance for policy-making and the development of firms’ strategies. Inthis paper, it is argued that, given their systemic, credence and com-plex character, environmental innovations are peculiar in that R&Dcooperation with external partners is even more important than forthe introduction of other innovations. Evidence that networkingactivities may be an important driver for environmental innova-tion (Hemmelskamp, 1999; Mazzanti and Zoboli, 2005; Horbach,2008) and especially that a strong partnership with suppliers andnetwork partners may be a powerful spur to application of inno-vative environmental technologies (Andersen, 1999, 2002; Geffenand Rothenberg, 2000; Simpson et al., 2007) has been found. How-ever, this literature is lacking in the empirical setting, being mainlyqualitative or focused on restricted geographic areas and, with thenotable exception of Horbach (2008), does not allow for comparisonwith non-environmental innovations.
Against this background, this paper investigates the relationshipbetween R&D cooperation and environmental innovation through astatistical analysis based on the Spanish Innovation Survey (PITEC).The contribution of the paper is multifold. First, it provides acomparative analysis of the importance of R&D cooperation andinternal technological capabilities for environmental innovation as
compared to other types of innovation. If the majority of the quanti-tative analyses on green innovation so far has focused just on greeninnovators (see e.g., Mazzanti and Zoboli, 2005; Rennings et al.,2006), the approach used in this paper will allow comprehending
h Policy 41 (2012) 614– 623 615
iStliittudfi(
lftScr
2
2
dteaceotea
iptmt(lgdaiatacrcppJoidlpfpid
Table 1Main peculiarities of environmental innovations as compared to other types of inno-vations, identified by neoclassical contributions in the environmental innovationeconomics literature.
Environmental innovations Other innovations
Externalities Knowledge externalitiesand environmentalexternalities
Knowledge externalities
Drivers Demand-pull, technology Demand-pull and
V. De Marchi / Researc
f and to what extent they differ from other types of innovation.econd, it investigates R&D cooperation differentiating betweenypes of cooperation partners – considering vertical, horizontal andateral cooperative agreements – acknowledging the literature onnnovation that highlights the different roles of these partners in thennovation process (Tether, 2002; Belderbos et al., 2004a,b). Finally,his paper contributes to the literature on environmental innova-ions from a methodological standpoint. The econometric modelsed allow testing the hypothesis against possible selection biasue to the necessary exclusion from the analysis of non-innovativerms, improving the scant empirical evidence in the literatureHorbach, 2008).
The remainder of the paper is organized in four sections. The fol-owing explores the relevant literature and specifies the hypothesesor the analysis, Section 3 describes the data, the variables andhe econometric specification used in the empirical analysis andection 4 presents the results. Finally, Section 5 contains the con-lusions, the limitations of the study and indications for futureesearch.
. Conceptual background and hypotheses
.1. Is green innovation different?
Green, sustainable, environmental or eco-innovation may beefined as “new or modified processes, techniques, practices, sys-ems and products to avoid or reduce environmental harms” (Kempt al., 2001; Beise and Rennings, 2005). This definition includesll the changes in the product portfolio or in the production pro-esses that tackles sustainability targets, like waste management,co-efficiency, reduction of emissions, recycling, eco-design or anyther action implemented by firms to reduce their environmen-al footprint. It is worth noting that this definition is based on theffect of the innovation activities independent of the initial intentnd includes both incremental and radical improvements.
A crucial question environmental innovation scholars deal withs if those innovations, which are increasingly at the center of theolicy action, need for a specific theory and policy or not. So far,he literature, especially neoclassical contributions, has focused
ainly on two aspects that differentiate them from other innova-ions, which regard their externalities and drivers – what Rennings2000) named the “double externality problem” and the “regu-atory push/pull effect”. As it has been widely discussed in theeneral innovation literature – the literature on innovation thato not focus specifically on the environmental one – innovationnd R&D activities are characterized by positive externalities: thencentive for firms to invest in them lessen as they cannot fullyppropriate the value created, because of knowledge spillovershat benefit other firms. In addition, green innovators producelso an environmental positive externality. Since part of the valuereated is appropriated by society – in the form of reduced envi-onmental damage – rather than by the firms that invested inleaner technologies, which bear higher costs than polluting com-etitors, there is a disincentive for firms to invest in products orrocess that reduce environmental impacts (see Rennings, 2000;
affe et al., 2005). The market-failure derived by the interactionf those two externalities induces a second peculiarity of eco-nnovations: the greater importance of the policy intervention torive their introduction (Rennings, 2000). The general innovation
iterature has highlighted the role of demand-pull and technology-ush factors as determinants of innovation. Several contributions
ocusing on environmental innovations support that, given the lowrivate incentives for firm to invest in them, the regulatory andnstitutional frameworks are to be considered as additional keyeterminants of their introduction (e.g., Porter and van der Linde,
push and regulatorypush/pull factors
technology push factors
1995; Cleff and Rennings, 1999; Kemp, 2000; Jaffe et al., 2002),especially for the development of the more radical changes oftechnological systems toward the greening of industries (Freeman,1992; Rennings, 2000; Foxon and Andersen, 2009).
Table 1 summarizes those peculiarities of environmental inno-vations, which by now have received the highest attention in theliterature on eco-innovations. If they have been corroborated bya vast empirical literature, less explored are other peculiarities,which affect rather how eco-innovations are developed, in particu-lar with respect to the importance of cooperative arrangements fortheir realization. General innovation studies have underlined that,to develop new products or processes, firms increasingly cooperatewith lead users, suppliers, universities and the like rather than rely-ing just on internal resources (Von Hippel, 1988; Chesbrough, 2003;Belderbos et al., 2004b). The systemic, credence and complex char-acter of environmental innovations suggest that, to develop them,cooperation may be even more important than when it comes tointroduce other types of innovations.
Studies spanning from the innovation systems and evolu-tionary economic literatures describe environmental innovationsas systemic, requiring a higher cooperative effort and implyinghigher complementarities with the activities performed by net-work partners (Andersen, 1999, 2002; Foxon and Andersen, 2009).Eco-innovation, in fact, very often requires changes in the rawmaterials or components used, the logistical and technical inte-gration with external partners and the re-design of products.Cooperation with suppliers is important to ensure the supply ofinputs or components with eco-friendly features – which may notbe readily available on the market – to verify that they fulfill therequirements or to modify the internal production process accord-ingly (Geffen and Rothenberg, 2000; Meyer and Hohmann, 2000;Goldbach, 2003; Seuring and Müller, 2008). Technical and orga-nizational interdependencies with suppliers and business clientsare increasing as firms attempt to close their production cyclesand enhance recyclability (see Seuring and Müller, 2008). Further-more, to carry out a product that reduces environmental impactsis a rather complex task and often requires information and skillsdistant from the traditional knowledge base of the industry. Eco-innovations represent a technological frontier on which firms arestill inexperienced and market and technological uncertaintiesincrease as there are no widespread-accepted standards either interms of specific technological solutions or of measures to evaluatethe environmental performance of products and processes.
Finally, the environmental feature of a product or process isoften a hidden attribute that cannot be disentangled even afterthe purchase (Andersen, 1999). Darby and Karny (1973) named thegoods with these qualities “credence goods”, since their value can-not be evaluated in normal use but, if possible, can be assessedjust by acquiring additional costly information. Just in very fewinstances, when purchasing a product, it is possible to understand
if it has been done through a less polluting production processor using a less impacting raw material. This information prob-lem affects both consumers’ purchases of final products and firm’spurchases of raw materials or components. Firms therefore are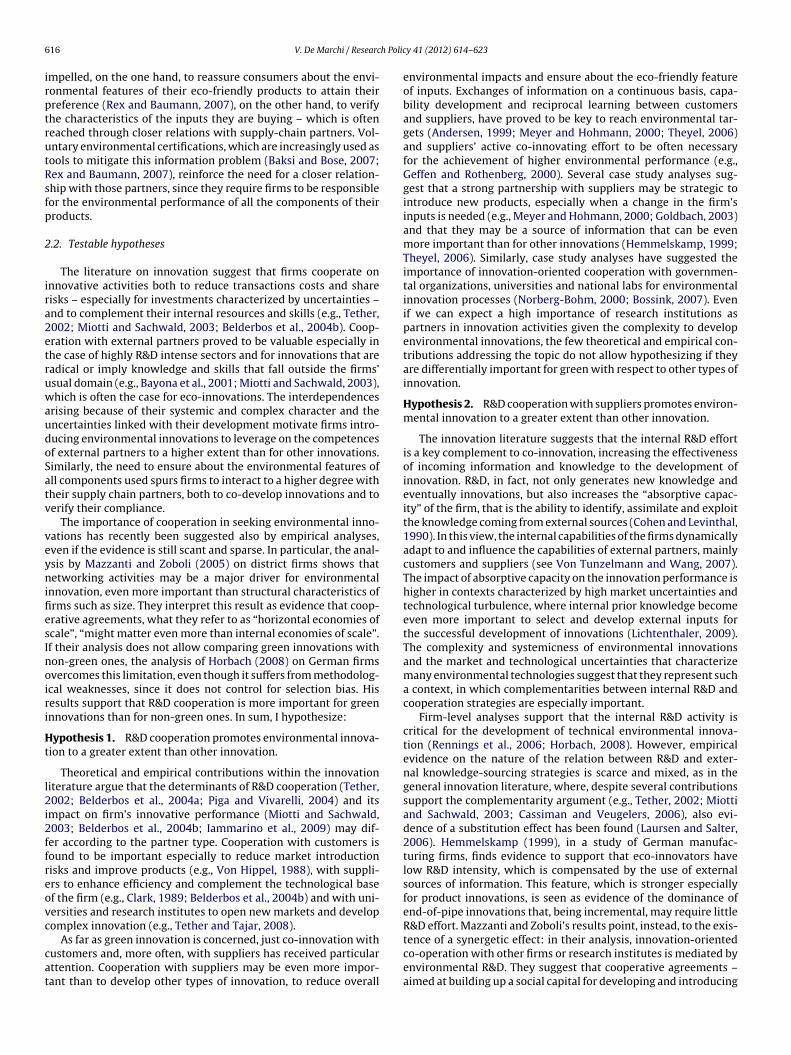
6 h Polic
irptrutRsfp
2
ira2etruwaudoSatv
veynifiesInoiri
Ht
l2i2ffreovc
cat
16 V. De Marchi / Researc
mpelled, on the one hand, to reassure consumers about the envi-onmental features of their eco-friendly products to attain theirreference (Rex and Baumann, 2007), on the other hand, to verifyhe characteristics of the inputs they are buying – which is ofteneached through closer relations with supply-chain partners. Vol-ntary environmental certifications, which are increasingly used asools to mitigate this information problem (Baksi and Bose, 2007;ex and Baumann, 2007), reinforce the need for a closer relation-hip with those partners, since they require firms to be responsibleor the environmental performance of all the components of theirroducts.
.2. Testable hypotheses
The literature on innovation suggest that firms cooperate onnnovative activities both to reduce transactions costs and shareisks – especially for investments characterized by uncertainties –nd to complement their internal resources and skills (e.g., Tether,002; Miotti and Sachwald, 2003; Belderbos et al., 2004b). Coop-ration with external partners proved to be valuable especially inhe case of highly R&D intense sectors and for innovations that areadical or imply knowledge and skills that fall outside the firms’sual domain (e.g., Bayona et al., 2001; Miotti and Sachwald, 2003),hich is often the case for eco-innovations. The interdependences
rising because of their systemic and complex character and thencertainties linked with their development motivate firms intro-ucing environmental innovations to leverage on the competencesf external partners to a higher extent than for other innovations.imilarly, the need to ensure about the environmental features ofll components used spurs firms to interact to a higher degree withheir supply chain partners, both to co-develop innovations and toerify their compliance.
The importance of cooperation in seeking environmental inno-ations has recently been suggested also by empirical analyses,ven if the evidence is still scant and sparse. In particular, the anal-sis by Mazzanti and Zoboli (2005) on district firms shows thatetworking activities may be a major driver for environmental
nnovation, even more important than structural characteristics ofrms such as size. They interpret this result as evidence that coop-rative agreements, what they refer to as “horizontal economies ofcale”, “might matter even more than internal economies of scale”.f their analysis does not allow comparing green innovations withon-green ones, the analysis of Horbach (2008) on German firmsvercomes this limitation, even though it suffers from methodolog-cal weaknesses, since it does not control for selection bias. Hisesults support that R&D cooperation is more important for greennnovations than for non-green ones. In sum, I hypothesize:
ypothesis 1. R&D cooperation promotes environmental innova-ion to a greater extent than other innovation.
Theoretical and empirical contributions within the innovationiterature argue that the determinants of R&D cooperation (Tether,002; Belderbos et al., 2004a; Piga and Vivarelli, 2004) and its
mpact on firm’s innovative performance (Miotti and Sachwald,003; Belderbos et al., 2004b; Iammarino et al., 2009) may dif-er according to the partner type. Cooperation with customers isound to be important especially to reduce market introductionisks and improve products (e.g., Von Hippel, 1988), with suppli-rs to enhance efficiency and complement the technological basef the firm (e.g., Clark, 1989; Belderbos et al., 2004b) and with uni-ersities and research institutes to open new markets and developomplex innovation (e.g., Tether and Tajar, 2008).
As far as green innovation is concerned, just co-innovation withustomers and, more often, with suppliers has received particularttention. Cooperation with suppliers may be even more impor-ant than to develop other types of innovation, to reduce overall
y 41 (2012) 614– 623
environmental impacts and ensure about the eco-friendly featureof inputs. Exchanges of information on a continuous basis, capa-bility development and reciprocal learning between customersand suppliers, have proved to be key to reach environmental tar-gets (Andersen, 1999; Meyer and Hohmann, 2000; Theyel, 2006)and suppliers’ active co-innovating effort to be often necessaryfor the achievement of higher environmental performance (e.g.,Geffen and Rothenberg, 2000). Several case study analyses sug-gest that a strong partnership with suppliers may be strategic tointroduce new products, especially when a change in the firm’sinputs is needed (e.g., Meyer and Hohmann, 2000; Goldbach, 2003)and that they may be a source of information that can be evenmore important than for other innovations (Hemmelskamp, 1999;Theyel, 2006). Similarly, case study analyses have suggested theimportance of innovation-oriented cooperation with governmen-tal organizations, universities and national labs for environmentalinnovation processes (Norberg-Bohm, 2000; Bossink, 2007). Evenif we can expect a high importance of research institutions aspartners in innovation activities given the complexity to developenvironmental innovations, the few theoretical and empirical con-tributions addressing the topic do not allow hypothesizing if theyare differentially important for green with respect to other types ofinnovation.
Hypothesis 2. R&D cooperation with suppliers promotes environ-mental innovation to a greater extent than other innovation.
The innovation literature suggests that the internal R&D effortis a key complement to co-innovation, increasing the effectivenessof incoming information and knowledge to the development ofinnovation. R&D, in fact, not only generates new knowledge andeventually innovations, but also increases the “absorptive capac-ity” of the firm, that is the ability to identify, assimilate and exploitthe knowledge coming from external sources (Cohen and Levinthal,1990). In this view, the internal capabilities of the firms dynamicallyadapt to and influence the capabilities of external partners, mainlycustomers and suppliers (see Von Tunzelmann and Wang, 2007).The impact of absorptive capacity on the innovation performance ishigher in contexts characterized by high market uncertainties andtechnological turbulence, where internal prior knowledge becomeeven more important to select and develop external inputs forthe successful development of innovations (Lichtenthaler, 2009).The complexity and systemicness of environmental innovationsand the market and technological uncertainties that characterizemany environmental technologies suggest that they represent sucha context, in which complementarities between internal R&D andcooperation strategies are especially important.
Firm-level analyses support that the internal R&D activity iscritical for the development of technical environmental innova-tion (Rennings et al., 2006; Horbach, 2008). However, empiricalevidence on the nature of the relation between R&D and exter-nal knowledge-sourcing strategies is scarce and mixed, as in thegeneral innovation literature, where, despite several contributionssupport the complementarity argument (e.g., Tether, 2002; Miottiand Sachwald, 2003; Cassiman and Veugelers, 2006), also evi-dence of a substitution effect has been found (Laursen and Salter,2006). Hemmelskamp (1999), in a study of German manufac-turing firms, finds evidence to support that eco-innovators havelow R&D intensity, which is compensated by the use of externalsources of information. This feature, which is stronger especiallyfor product innovations, is seen as evidence of the dominance ofend-of-pipe innovations that, being incremental, may require littleR&D effort. Mazzanti and Zoboli’s results point, instead, to the exis-
tence of a synergetic effect: in their analysis, innovation-orientedco-operation with other firms or research institutes is mediated byenvironmental R&D. They suggest that cooperative agreements –aimed at building up a social capital for developing and introducing
h Polic
iiaativegm
Hcr
3
3
lttFtoddiiLi(pnse
eriitm2etciavvwdEiSptfl
fA
V. De Marchi / Researc
nnovations – are complementary to the internal environmental-nnovative effort of the firms, but their empirical setting does notllow for comparison with non-green innovation. On the contrary,
number of case study analyses, mainly focused on low-tech indus-ries, supports that the internal resources of the firms are even moremportant than when it comes to introduce other types of inno-ation, to ensure that information and knowledge flowing fromxternal partners are successfully transformed into new technolo-ies (see e.g., Andersen, 1999; Baraldi, 2008). This discussion leadse to state the following hypothesis:
ypothesis 3. Firm’s R&D intensity is more likely to beomplementary to its cooperation strategy when it comes to envi-onmental rather than other innovation.
. Description of the empirical study
.1. The data for the analysis and the empirical setting
The data for the analysis are drawn from the Spanish Techno-ogical Innovation Panel (PITEC)1, which is carried out yearly byhe Spanish National Statistics Institute (INE) in collaboration withhe Spanish Science and Technology Foundation (FECYT) and theoundation for Technological Innovation (COTEC). The rational forhe choice of this data set is multifold. Firstly, this data set is basedn the Community Innovation Survey (CIS) framework, enablingirect comparisons with results of previous literature on similarata sets. CIS has proved to be a valid and reliable tool to understand
nnovation dynamics – being among the most used data sets innnovation studies (e.g., Tether, 2002; Miotti and Sachwald, 2003;aursen and Salter, 2006) – and has already been employed in stud-es performing comparative analysis on environmental innovationsHemmelskamp, 1999; Horbach, 2008). Secondly, being the pur-ose of the study to understand the peculiarities with respect toon-environmental innovations, this data set seemed appropriateince it allows studying both types of innovation, rather than justnvironmental ones.
Finally, the peculiarities of the Spanish innovation systemnable useful comparisons with other countries, and the increasingelevance of environmental issues for the Spanish economy makest a proper setting to investigate green innovations dynamics. Spains a moderate and slow-growing innovator. Its main specializa-ions are traditional industries, with a significant development in
ore advanced industries in recent years (see also Bayona et al.,001). According to the Eurostat statistics, in 2007, the averagexpenditure on R&D was 1.27% of the GDP, versus the 1.85% ofhe EU average. Spain under-performed with respect to other EU27ountries also in terms of overall innovation performance, scor-ng 0.31 versus 0.45 in terms of Summary Innovation Index, anggregate innovation-performance index reported in the EU inno-ation scoreboard. However, Spanish industries benefit from theery active role of the government and higher education sectors,hich in 2007 represented almost half (47%) of the total grossomestic expenditures in R&D, much higher than the 33.9% of theU27 average for the same year. Moreover, Spain has an increas-ngly high specialization in renewable energy production (in 2007,panish wind energy accounted for a quarter of the entire EU27
roduction), and among the highest number of environmental cer-ified firms throughout all the industries (first European countryor ISO14001 and among the first five for number of EMAS and Eco-abel certifications). These results were also due to the increasing1 The data set, the questionnaire and the description of each variable is availableree of charge at the website http://icono.fecyt.es/contenido.asp?dir=05%29Publi/A%29panel.
y 41 (2012) 614– 623 617
policy pressure, aiming both to reduce polluting behaviors and toincrease awareness of the importance of environmental matters.Environmental regulation in Spain is incipient but is fast converg-ing to the EU environmental regulation, which is a rather activeactor on the international scene (Holzinger et al., 2008; Camisón,2010). Several environmental laws were introduced in 2006 and2007, promoting the prevention of pollution and the diffusion ofsustainable development practices.
CIS data contain information on companies’ structural char-acteristics, R&D strategies and innovative activities over a 3-yearperiod. In addition, the PITEC data set includes further informationon R&D activities, regarding how they are organized, the charac-teristics of the personnel and their outsourcing. The PITEC is anunbalanced panel. Administered, in the actual form, since 2003, itcomprises four sub-samples, to preserve representativeness. Thefirst is composed of firms with 200 employees or more, whichrepresent the 73% of all such firms listed by the Spanish CentralCompany Directory, while the second is representative of firmswith intramural R&D expenditures and is based on the sample offirms part of the survey on R&D activities carried out yearly by INEin coordination with the European Institute of Innovation and Tech-nology (EIT). Starting from 2004, two samples of firms with fewerthan 200 but higher than 10 employees were added: one of thefirms reporting external but no intramural R&D expenditures andone with no innovation expenditure. In 2007, the response rate was90.6%. The changing nature of the sample and of the questionnaireis a limitation of the PITEC that poses challenges for inter-temporalanalyses. I therefore decided to focus just on data for one year,2007, which refers to the period 2005–2007 and provides informa-tion on 11,594 active companies. Acknowledging the differences ininnovation activities and cooperation patterns between manufac-turing and services firms (e.g., Hipp and Grupp, 2005), I restrictedthe analysis just to manufacturing activities, being left with 6047companies.
3.2. The variables for the analysis
3.2.1. How to measure environmental innovationEnvironmental patents or environmental investments have
been extensively employed as proxies for green innovations (seee.g., Jaffe and Palmer, 1997; Nameroff et al., 2004), yet they couldlead to under- or over-estimate innovation, for example in the caseof incremental innovations. Following the approach of Horbach(2008), I use instead self-reported data on the effect of the inno-vations introduced, using a question of the PITEC asking aboutthe “importance of reduced environmental impacts or improvedhealth and safety”. Respondents could choose among four possi-bilities, reporting if this effect was null, low, medium or high. Thedependent variable, ENV INN, takes the value 1 if, in the period2005–2007, the company reported high or medium importance ofthis effect and 0 otherwise. This question is therefore used as a filtervariable that allows separating firms that introduced environmen-tal innovations from firms that did not. The use of a dummy asdependent variable will allow comparing the emerging evidencewith that in the existing literature that already used CIS data setsto analyze similar topics (Brunnermeier and Cohen, 2003; Horbach,2008). Unfortunately the questionnaire was not designed to inves-tigate specifically green innovation: this variable could be criticizedfor not capturing it correctly or being too broad. To mitigate thispotential problem, different specifications of the dependent vari-able will be used, testing the robustness of the model.
3.2.2. Engagement in R&D and cooperation for innovationTo verify the hypothesis of the greater importance of coopera-
tion for environmental innovation (Hypothesis 1), I use informationon the active cooperation on innovation with external partners. The
6 h Polic
dhfinspptDpdeiCCissRnntaC
nbapigTmd
3
sGstetiotSafHtt2
prrmsieeRutu
18 V. De Marchi / Researc
ummy variable COOPERATION indicates if the firm reported toave cooperated on any of the innovation activities with externalrms or institutions. The PITEC survey lists seven possible exter-al partners: (1) suppliers of equipment, materials, components oroftware, (2) clients or customers, (3) competitors or other enter-rises of the same industry, (4) consultants, commercial labs orrivate R&D labs, (5) universities or other higher education institu-ions, (6) public research institutes, and (7) technological centers.ummies indicating if the company cooperates with any of thoseartners have been created to test Hypothesis 2 and disentangle theifferent role of vertical, horizontal and lateral agreements towardnvironmental innovation. COOPVENDOR is a binary that equals 1f the company cooperated with partners of typology (1), COOP-LIENT and COOPCOMPET of typology (2) and (3) respectively andOOPSCIENT if the company cooperated with any scientific agent,
.e., with the remaining partners listed in the survey. To under-tand the role of R&D and its relationship with external cooperativetrategies (Hypothesis 3), I employ different measures. The variable&D INTENSITY expresses R&D intensity as the ratio between theumber of employees working in the R&D department and the totalumber of employees. Moreover, I included a dummy indicating ifhe firms perform R&D activities on a continuous basis (CONT R&D),nd its interaction with the variable COOPERATION (the variableOOP R&D), to test for the complementarity argument.
Other than investing in R&D activities or interacting with exter-al firms or institutions, firms may realize innovation activitiesenefiting from the acquisition of external knowledge. The vari-ble EXT R&D indicates expenses on extramural R&D acquisition asercentage of the total expenses devoted to innovation. Similarly,
nnovation may be allowed by the acquisition of new technolo-ies and machineries that incorporate the needed knowledge.he dummy EQUIPMENT indicates if the firm acquired advancedachinery, equipment and computer hardware or software to pro-
uce new or improved products or processes.
.2.3. Control variablesIn addition, I include a number of control variables regarding
tructural characteristics of the firms and their market strategies.iven that studies on environmental innovation have found thatize affects eco-innovation propensity, emphasizing the difficul-ies of small and medium enterprises in facing the complexity ofnvironmental innovations and the investments needed to switcho greener technologies (see e.g., Hemmelskamp, 1999), I includen the analysis the variable SIZE, measured as the natural logarithmf the number of employees. To control for the possible reliance onhe parent firm’s resources and knowledge, I included the dummyUBSIDIARY, valuing 1 if the interviewed firm is a subsidiary ofnother company, based in Spain or abroad. Furthermore, I controlor possible path dependences in the innovation process, which inorbach (2008) emerges as a determinant of eco-innovations, using
he variable INNOVATION04, indicating whether the firm reportedo be an innovator in the previous survey wave, regarding the years002–2004.
In addition, acknowledging the importance of environmentalolicy to foster the greening of industries, I include a variableeflecting the public support to innovation. Policy makers may useegulatory instruments or market-based ones to spur the develop-ent and diffusion of environmental technologies. Several studies
uggest that the second category, which includes subsidies, directncentives and fiscal benefits that may or may not be specific fornvironmental innovations (Jaffe et al., 2005), can be even moreffective than the first is spurring environmental technologies (e.g.,
ennings, 2000). Unfortunately, PITEC data cannot be used to eval-ate the impact of regulation on innovation, but allow capturinghe impact of market-based instruments. The dummy PUB FUNDS,sed also in the analyses by Horbach and Mazzanti and Zoboli, isy 41 (2012) 614– 623
based on a question asking if the firm received fiscal benefits, subsi-dies or any other form of financial support for innovation from local,national or European institutions. Finally, I control for firm’s exportpropensity through the dummy EXPORT – based on a questionasking for the percentage of turnover done in foreign markets in2005–2007 – and its industry specialization – including 13 industrydummies – capturing the impact of different policy restrictions andconsumers’ awareness in different sectors (see e.g., Brunnermeierand Cohen, 2003).
Table A.1 lists the definition and the descriptive statistics of thevariables used and Table A.2 reports the simple correlations.
3.3. Method
Since the dependent variable is a dummy, a binary outcomemodel is used, controlling for possible selection bias arising fromthe exclusion from the analysis of non-innovative firms. I thereforeapply a two-part logit model (Cameron and Trivedi, 2005; Vega-Jurado et al., 2009), a method that has proved to be appropriatefor estimating actual outcomes and more suitable than a Heck-man selection model since the dependent variable is binary andnot continuous (Haas and Hansen, 2005).
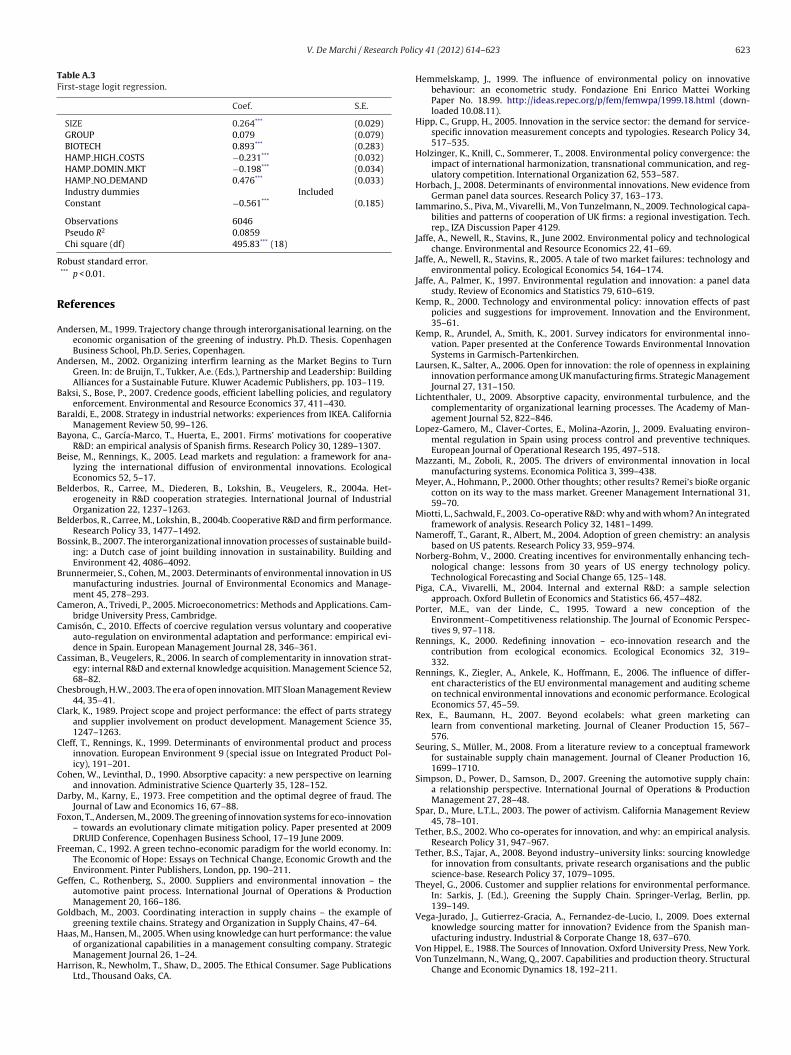
In the first stage, the probability for a firm to become aninnovator (PrINNOVATION) is calculated by regressing exogenousvariables available for all observations (innovative and non-innovative firms) on INNOVATION, a dummy indicating if thefirm introduced any product or process innovation in the period2005–2007. Similar to Vega-Jurado et al. (2009), I used as regres-sors a variable for firm size (SIZE), a variable signaling whetheror not the firm is part of a group (GROUP) and industry dum-mies. Differently from their analysis, variables indicating strictlyexogenous obstacles to innovation are included, regarding the highcost of innovation (HAMP HIGH COSTS), if the market was domi-nated by established firms (HAMP DOMIN MKT) and if there wasno demand for innovation (HAMP NO DEMAND). Finally, a dummyvariable indicating if the firm was involved in the biotechnologyindustry (BIOTECH) has been included. The results of the first-stagelogit regression are displayed in Table A.3. In the second stage, themain model, non-innovative firms are dropped from the analysisbut the inclusion of PrINNOVATION controls for possible selectionbias by including the effects of firms that did not innovate. A logitspecification is used for both stages.
Unfortunately, given the low number of waves available andthe changing nature of the PITEC sample and questionnaire, it wasnot possible to perform panel data models, to control for potentialendogeneity problems coming from the omission of unobservablefirm’s specific characteristics.
3.4. Descriptive statistics
Among the innovators, which represent the 76.3% of the firmsin the PITEC data set, almost half (47.4%) introduced products orprocess innovations that had a high or medium positive impact onthe environment, the definition of environmental innovators usedin this analysis.
In Table 2, I analyze the distribution of green and non-greeninnovators by industry. The comparative analysis highlights theexistence of industry heterogeneity in environmental performance,which is consistent with the results in the extant literature (seee.g., Brunnermeier and Cohen, 2003; Horbach, 2008). In particular,it seems that firms in low-tech industries, such as textile, footwearand plastics are less likely to introduce environmental innovation.
In industries implying more complex technologies, instead, thereis more heterogeneity: in the chemicals and pharmaceuticals themajority of firms are introducing green innovations, whereas inthe machinery and electrical ones this sub-group represents just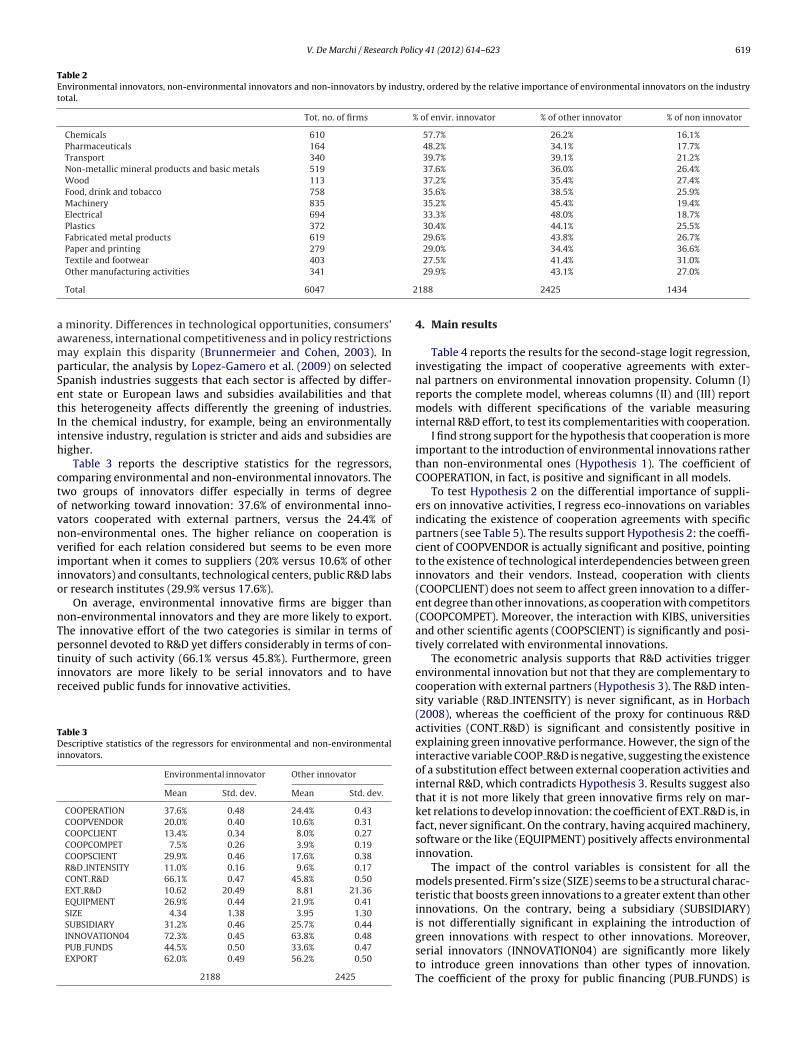
V. De Marchi / Research Policy 41 (2012) 614– 623 619
Table 2Environmental innovators, non-environmental innovators and non-innovators by industry, ordered by the relative importance of environmental innovators on the industrytotal.
Tot. no. of firms % of envir. innovator % of other innovator % of non innovator
Chemicals 610 57.7% 26.2% 16.1%Pharmaceuticals 164 48.2% 34.1% 17.7%Transport 340 39.7% 39.1% 21.2%Non-metallic mineral products and basic metals 519 37.6% 36.0% 26.4%Wood 113 37.2% 35.4% 27.4%Food, drink and tobacco 758 35.6% 38.5% 25.9%Machinery 835 35.2% 45.4% 19.4%Electrical 694 33.3% 48.0% 18.7%Plastics 372 30.4% 44.1% 25.5%Fabricated metal products 619 29.6% 43.8% 26.7%Paper and printing 279 29.0% 34.4% 36.6%Textile and footwear 403 27.5% 41.4% 31.0%
2
aampSetIih
ctovnviio
nTptir
TDi
Other manufacturing activities 341
Total 6047
minority. Differences in technological opportunities, consumers’wareness, international competitiveness and in policy restrictionsay explain this disparity (Brunnermeier and Cohen, 2003). In
articular, the analysis by Lopez-Gamero et al. (2009) on selectedpanish industries suggests that each sector is affected by differ-nt state or European laws and subsidies availabilities and thathis heterogeneity affects differently the greening of industries.n the chemical industry, for example, being an environmentallyntensive industry, regulation is stricter and aids and subsidies areigher.
Table 3 reports the descriptive statistics for the regressors,omparing environmental and non-environmental innovators. Thewo groups of innovators differ especially in terms of degreef networking toward innovation: 37.6% of environmental inno-ators cooperated with external partners, versus the 24.4% ofon-environmental ones. The higher reliance on cooperation iserified for each relation considered but seems to be even moremportant when it comes to suppliers (20% versus 10.6% of othernnovators) and consultants, technological centers, public R&D labsr research institutes (29.9% versus 17.6%).
On average, environmental innovative firms are bigger thanon-environmental innovators and they are more likely to export.he innovative effort of the two categories is similar in terms ofersonnel devoted to R&D yet differs considerably in terms of con-
inuity of such activity (66.1% versus 45.8%). Furthermore, greennnovators are more likely to be serial innovators and to haveeceived public funds for innovative activities.able 3escriptive statistics of the regressors for environmental and non-environmental
nnovators.
Environmental innovator Other innovator
Mean Std. dev. Mean Std. dev.
COOPERATION 37.6% 0.48 24.4% 0.43COOPVENDOR 20.0% 0.40 10.6% 0.31COOPCLIENT 13.4% 0.34 8.0% 0.27COOPCOMPET 7.5% 0.26 3.9% 0.19COOPSCIENT 29.9% 0.46 17.6% 0.38R&D INTENSITY 11.0% 0.16 9.6% 0.17CONT R&D 66.1% 0.47 45.8% 0.50EXT R&D 10.62 20.49 8.81 21.36EQUIPMENT 26.9% 0.44 21.9% 0.41SIZE 4.34 1.38 3.95 1.30SUBSIDIARY 31.2% 0.46 25.7% 0.44INNOVATION04 72.3% 0.45 63.8% 0.48PUB FUNDS 44.5% 0.50 33.6% 0.47EXPORT 62.0% 0.49 56.2% 0.50
2188 2425
29.9% 43.1% 27.0%
188 2425 1434
4. Main results
Table 4 reports the results for the second-stage logit regression,investigating the impact of cooperative agreements with exter-nal partners on environmental innovation propensity. Column (I)reports the complete model, whereas columns (II) and (III) reportmodels with different specifications of the variable measuringinternal R&D effort, to test its complementarities with cooperation.
I find strong support for the hypothesis that cooperation is moreimportant to the introduction of environmental innovations ratherthan non-environmental ones (Hypothesis 1). The coefficient ofCOOPERATION, in fact, is positive and significant in all models.
To test Hypothesis 2 on the differential importance of suppli-ers on innovative activities, I regress eco-innovations on variablesindicating the existence of cooperation agreements with specificpartners (see Table 5). The results support Hypothesis 2: the coeffi-cient of COOPVENDOR is actually significant and positive, pointingto the existence of technological interdependencies between greeninnovators and their vendors. Instead, cooperation with clients(COOPCLIENT) does not seem to affect green innovation to a differ-ent degree than other innovations, as cooperation with competitors(COOPCOMPET). Moreover, the interaction with KIBS, universitiesand other scientific agents (COOPSCIENT) is significantly and posi-tively correlated with environmental innovations.
The econometric analysis supports that R&D activities triggerenvironmental innovation but not that they are complementary tocooperation with external partners (Hypothesis 3). The R&D inten-sity variable (R&D INTENSITY) is never significant, as in Horbach(2008), whereas the coefficient of the proxy for continuous R&Dactivities (CONT R&D) is significant and consistently positive inexplaining green innovative performance. However, the sign of theinteractive variable COOP R&D is negative, suggesting the existenceof a substitution effect between external cooperation activities andinternal R&D, which contradicts Hypothesis 3. Results suggest alsothat it is not more likely that green innovative firms rely on mar-ket relations to develop innovation: the coefficient of EXT R&D is, infact, never significant. On the contrary, having acquired machinery,software or the like (EQUIPMENT) positively affects environmentalinnovation.
The impact of the control variables is consistent for all themodels presented. Firm’s size (SIZE) seems to be a structural charac-teristic that boosts green innovations to a greater extent than otherinnovations. On the contrary, being a subsidiary (SUBSIDIARY)is not differentially significant in explaining the introduction of
green innovations with respect to other innovations. Moreover,serial innovators (INNOVATION04) are significantly more likelyto introduce green innovations than other types of innovation.The coefficient of the proxy for public financing (PUB FUNDS) is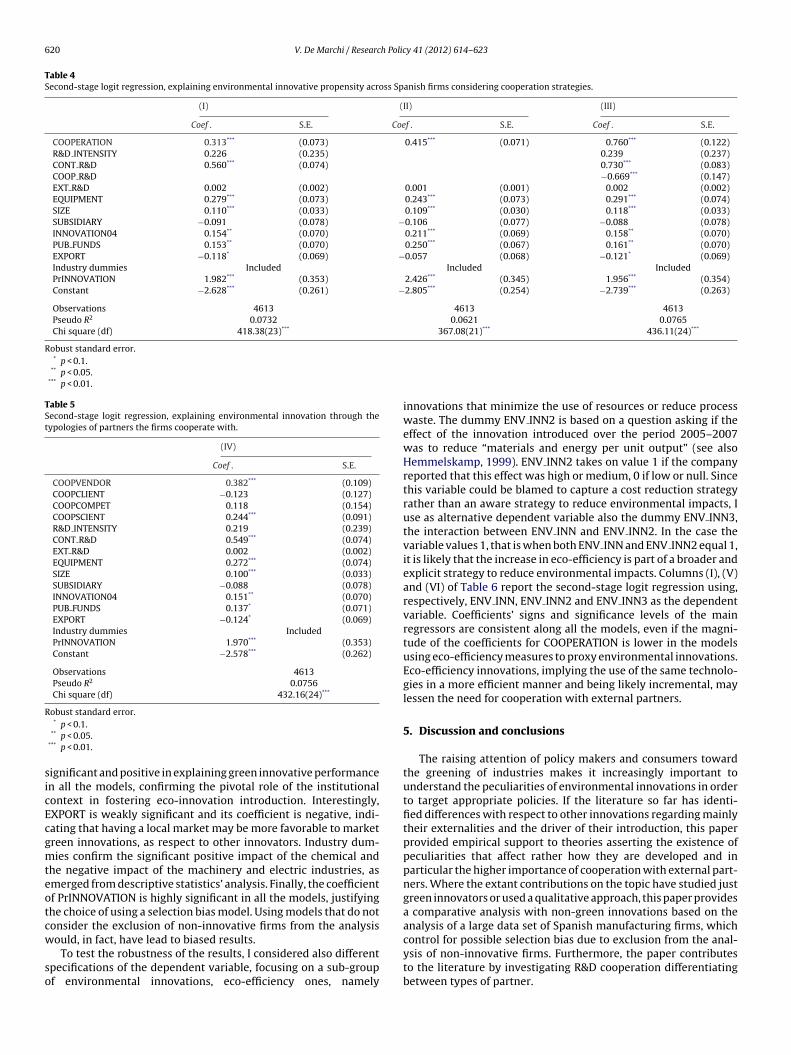
620 V. De Marchi / Research Policy 41 (2012) 614– 623
Table 4Second-stage logit regression, explaining environmental innovative propensity across Spanish firms considering cooperation strategies.
(I) (II) (III)
Coef . S.E. Coef . S.E. Coef . S.E.
COOPERATION 0.313*** (0.073) 0.415*** (0.071) 0.760*** (0.122)R&D INTENSITY 0.226 (0.235) 0.239 (0.237)CONT R&D 0.560*** (0.074) 0.730*** (0.083)COOP R&D −0.669*** (0.147)EXT R&D 0.002 (0.002) 0.001 (0.001) 0.002 (0.002)EQUIPMENT 0.279*** (0.073) 0.243*** (0.073) 0.291*** (0.074)SIZE 0.110*** (0.033) 0.109*** (0.030) 0.118*** (0.033)SUBSIDIARY −0.091 (0.078) −0.106 (0.077) −0.088 (0.078)INNOVATION04 0.154** (0.070) 0.211*** (0.069) 0.158** (0.070)PUB FUNDS 0.153** (0.070) 0.250*** (0.067) 0.161** (0.070)EXPORT −0.118* (0.069) −0.057 (0.068) −0.121* (0.069)Industry dummies Included Included IncludedPrINNOVATION 1.982*** (0.353) 2.426*** (0.345) 1.956*** (0.354)Constant −2.628*** (0.261) −2.805*** (0.254) −2.739*** (0.263)
Observations 4613 4613 4613Pseudo R2 0.0732 0.0621 0.0765Chi square (df) 418.38(23)*** 367.08(21)*** 436.11(24)***
Robust standard error.* p < 0.1.
** p < 0.05.*** p < 0.01.
Table 5Second-stage logit regression, explaining environmental innovation through thetypologies of partners the firms cooperate with.
(IV)
Coef . S.E.
COOPVENDOR 0.382*** (0.109)COOPCLIENT −0.123 (0.127)COOPCOMPET 0.118 (0.154)COOPSCIENT 0.244*** (0.091)R&D INTENSITY 0.219 (0.239)CONT R&D 0.549*** (0.074)EXT R&D 0.002 (0.002)EQUIPMENT 0.272*** (0.074)SIZE 0.100*** (0.033)SUBSIDIARY −0.088 (0.078)INNOVATION04 0.151** (0.070)PUB FUNDS 0.137* (0.071)EXPORT −0.124* (0.069)Industry dummies IncludedPrINNOVATION 1.970*** (0.353)Constant −2.578*** (0.262)
Observations 4613Pseudo R2 0.0756Chi square (df) 432.16(24)***
Robust standard error.
sicEcgmteotcw
so
* p < 0.1.** p < 0.05.
*** p < 0.01.
ignificant and positive in explaining green innovative performancen all the models, confirming the pivotal role of the institutionalontext in fostering eco-innovation introduction. Interestingly,XPORT is weakly significant and its coefficient is negative, indi-ating that having a local market may be more favorable to marketreen innovations, as respect to other innovators. Industry dum-ies confirm the significant positive impact of the chemical and
he negative impact of the machinery and electric industries, asmerged from descriptive statistics’ analysis. Finally, the coefficientf PrINNOVATION is highly significant in all the models, justifyinghe choice of using a selection bias model. Using models that do notonsider the exclusion of non-innovative firms from the analysis
ould, in fact, have lead to biased results.To test the robustness of the results, I considered also differentpecifications of the dependent variable, focusing on a sub-groupf environmental innovations, eco-efficiency ones, namely
innovations that minimize the use of resources or reduce processwaste. The dummy ENV INN2 is based on a question asking if theeffect of the innovation introduced over the period 2005–2007was to reduce “materials and energy per unit output” (see alsoHemmelskamp, 1999). ENV INN2 takes on value 1 if the companyreported that this effect was high or medium, 0 if low or null. Sincethis variable could be blamed to capture a cost reduction strategyrather than an aware strategy to reduce environmental impacts, Iuse as alternative dependent variable also the dummy ENV INN3,the interaction between ENV INN and ENV INN2. In the case thevariable values 1, that is when both ENV INN and ENV INN2 equal 1,it is likely that the increase in eco-efficiency is part of a broader andexplicit strategy to reduce environmental impacts. Columns (I), (V)and (VI) of Table 6 report the second-stage logit regression using,respectively, ENV INN, ENV INN2 and ENV INN3 as the dependentvariable. Coefficients’ signs and significance levels of the mainregressors are consistent along all the models, even if the magni-tude of the coefficients for COOPERATION is lower in the modelsusing eco-efficiency measures to proxy environmental innovations.Eco-efficiency innovations, implying the use of the same technolo-gies in a more efficient manner and being likely incremental, maylessen the need for cooperation with external partners.
5. Discussion and conclusions
The raising attention of policy makers and consumers towardthe greening of industries makes it increasingly important tounderstand the peculiarities of environmental innovations in orderto target appropriate policies. If the literature so far has identi-fied differences with respect to other innovations regarding mainlytheir externalities and the driver of their introduction, this paperprovided empirical support to theories asserting the existence ofpeculiarities that affect rather how they are developed and inparticular the higher importance of cooperation with external part-ners. Where the extant contributions on the topic have studied justgreen innovators or used a qualitative approach, this paper providesa comparative analysis with non-green innovations based on theanalysis of a large data set of Spanish manufacturing firms, which
control for possible selection bias due to exclusion from the anal-ysis of non-innovative firms. Furthermore, the paper contributesto the literature by investigating R&D cooperation differentiatingbetween types of partner.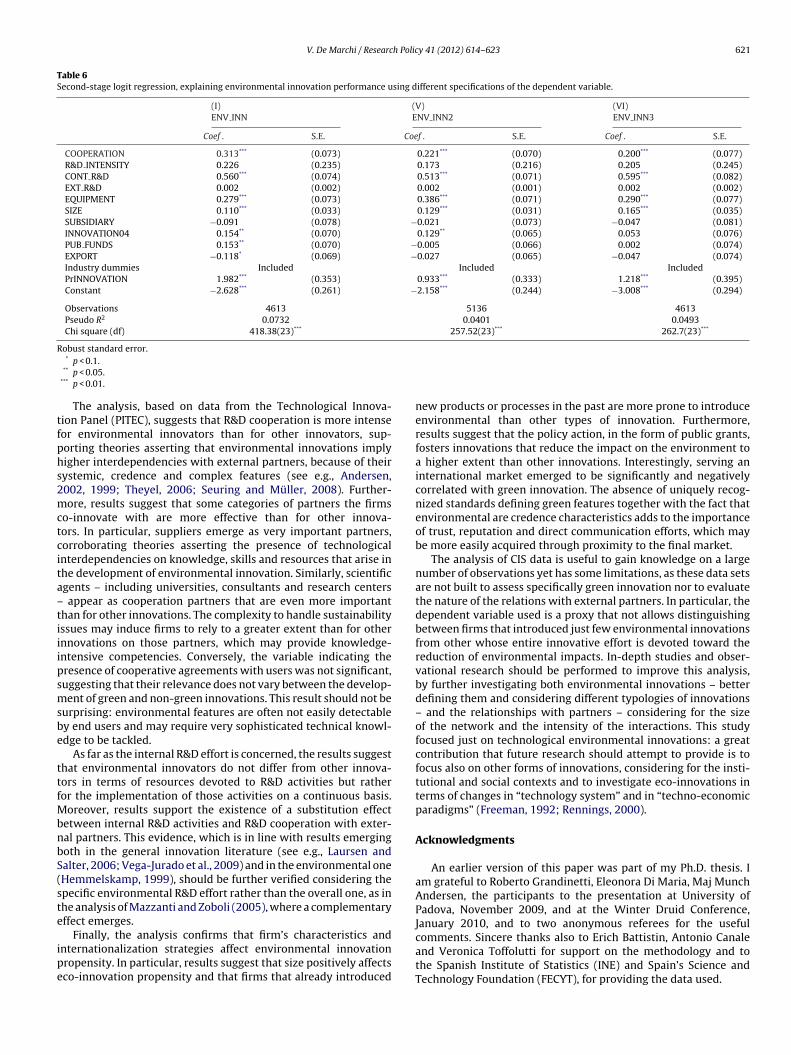
V. De Marchi / Research Policy 41 (2012) 614– 623 621
Table 6Second-stage logit regression, explaining environmental innovation performance using different specifications of the dependent variable.
(I) (V) (VI)ENV INN ENV INN2 ENV INN3
Coef . S.E. Coef . S.E. Coef . S.E.
COOPERATION 0.313*** (0.073) 0.221*** (0.070) 0.200*** (0.077)R&D INTENSITY 0.226 (0.235) 0.173 (0.216) 0.205 (0.245)CONT R&D 0.560*** (0.074) 0.513*** (0.071) 0.595*** (0.082)EXT R&D 0.002 (0.002) 0.002 (0.001) 0.002 (0.002)EQUIPMENT 0.279*** (0.073) 0.386*** (0.071) 0.290*** (0.077)SIZE 0.110*** (0.033) 0.129*** (0.031) 0.165*** (0.035)SUBSIDIARY −0.091 (0.078) −0.021 (0.073) −0.047 (0.081)INNOVATION04 0.154** (0.070) 0.129** (0.065) 0.053 (0.076)PUB FUNDS 0.153** (0.070) −0.005 (0.066) 0.002 (0.074)EXPORT −0.118* (0.069) −0.027 (0.065) −0.047 (0.074)Industry dummies Included Included IncludedPrINNOVATION 1.982*** (0.353) 0.933*** (0.333) 1.218*** (0.395)Constant −2.628*** (0.261) −2.158*** (0.244) −3.008*** (0.294)
Observations 4613 5136 4613Pseudo R2 0.0732 0.0401 0.0493Chi square (df) 418.38(23)*** 257.52(23)*** 262.7(23)***
R
tfphs2mctcita–tiiipsmsbe
ttfMbnbS(ste
ipe
obust standard error.* p < 0.1.
** p < 0.05.*** p < 0.01.
The analysis, based on data from the Technological Innova-ion Panel (PITEC), suggests that R&D cooperation is more intenseor environmental innovators than for other innovators, sup-orting theories asserting that environmental innovations implyigher interdependencies with external partners, because of theirystemic, credence and complex features (see e.g., Andersen,002, 1999; Theyel, 2006; Seuring and Müller, 2008). Further-ore, results suggest that some categories of partners the firms
o-innovate with are more effective than for other innova-ors. In particular, suppliers emerge as very important partners,orroborating theories asserting the presence of technologicalnterdependencies on knowledge, skills and resources that arise inhe development of environmental innovation. Similarly, scientificgents – including universities, consultants and research centers
appear as cooperation partners that are even more importanthan for other innovations. The complexity to handle sustainabilityssues may induce firms to rely to a greater extent than for othernnovations on those partners, which may provide knowledge-ntensive competencies. Conversely, the variable indicating theresence of cooperative agreements with users was not significant,uggesting that their relevance does not vary between the develop-ent of green and non-green innovations. This result should not be
urprising: environmental features are often not easily detectabley end users and may require very sophisticated technical knowl-dge to be tackled.
As far as the internal R&D effort is concerned, the results suggesthat environmental innovators do not differ from other innova-ors in terms of resources devoted to R&D activities but ratheror the implementation of those activities on a continuous basis.
oreover, results support the existence of a substitution effectetween internal R&D activities and R&D cooperation with exter-al partners. This evidence, which is in line with results emergingoth in the general innovation literature (see e.g., Laursen andalter, 2006; Vega-Jurado et al., 2009) and in the environmental oneHemmelskamp, 1999), should be further verified considering thepecific environmental R&D effort rather than the overall one, as inhe analysis of Mazzanti and Zoboli (2005), where a complementaryffect emerges.
Finally, the analysis confirms that firm’s characteristics andnternationalization strategies affect environmental innovationropensity. In particular, results suggest that size positively affectsco-innovation propensity and that firms that already introduced
new products or processes in the past are more prone to introduceenvironmental than other types of innovation. Furthermore,results suggest that the policy action, in the form of public grants,fosters innovations that reduce the impact on the environment toa higher extent than other innovations. Interestingly, serving aninternational market emerged to be significantly and negativelycorrelated with green innovation. The absence of uniquely recog-nized standards defining green features together with the fact thatenvironmental are credence characteristics adds to the importanceof trust, reputation and direct communication efforts, which maybe more easily acquired through proximity to the final market.
The analysis of CIS data is useful to gain knowledge on a largenumber of observations yet has some limitations, as these data setsare not built to assess specifically green innovation nor to evaluatethe nature of the relations with external partners. In particular, thedependent variable used is a proxy that not allows distinguishingbetween firms that introduced just few environmental innovationsfrom other whose entire innovative effort is devoted toward thereduction of environmental impacts. In-depth studies and obser-vational research should be performed to improve this analysis,by further investigating both environmental innovations – betterdefining them and considering different typologies of innovations– and the relationships with partners – considering for the sizeof the network and the intensity of the interactions. This studyfocused just on technological environmental innovations: a greatcontribution that future research should attempt to provide is tofocus also on other forms of innovations, considering for the insti-tutional and social contexts and to investigate eco-innovations interms of changes in “technology system” and in “techno-economicparadigms” (Freeman, 1992; Rennings, 2000).
Acknowledgments
An earlier version of this paper was part of my Ph.D. thesis. Iam grateful to Roberto Grandinetti, Eleonora Di Maria, Maj MunchAndersen, the participants to the presentation at University ofPadova, November 2009, and at the Winter Druid Conference,January 2010, and to two anonymous referees for the useful
comments. Sincere thanks also to Erich Battistin, Antonio Canaleand Veronica Toffolutti for support on the methodology and tothe Spanish Institute of Statistics (INE) and Spain’s Science andTechnology Foundation (FECYT), for providing the data used.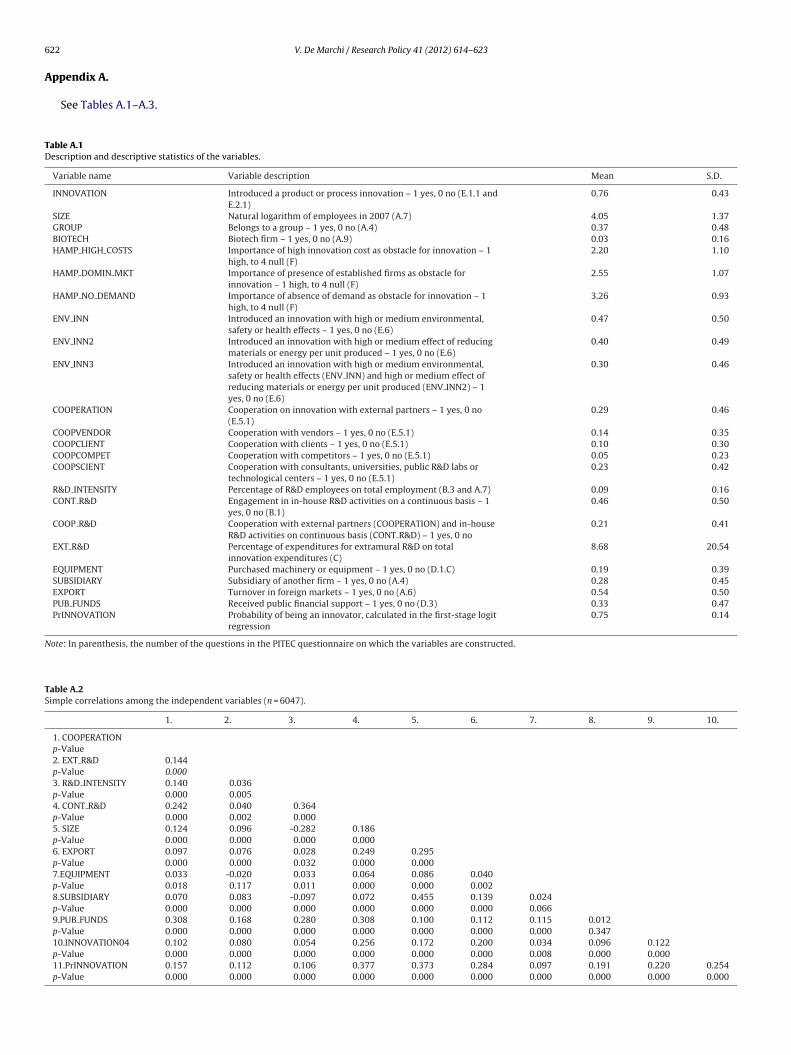
6 h Policy 41 (2012) 614– 623
A
TD
N
TS
22 V. De Marchi / Researc
ppendix A.
See Tables A.1–A.3.
able A.1escription and descriptive statistics of the variables.
Variable name Variable description Mean S.D.
INNOVATION Introduced a product or process innovation – 1 yes, 0 no (E.1.1 andE.2.1)
0.76 0.43
SIZE Natural logarithm of employees in 2007 (A.7) 4.05 1.37GROUP Belongs to a group – 1 yes, 0 no (A.4) 0.37 0.48BIOTECH Biotech firm – 1 yes, 0 no (A.9) 0.03 0.16HAMP HIGH COSTS Importance of high innovation cost as obstacle for innovation – 1
high, to 4 null (F)2.20 1.10
HAMP DOMIN MKT Importance of presence of established firms as obstacle forinnovation – 1 high, to 4 null (F)
2.55 1.07
HAMP NO DEMAND Importance of absence of demand as obstacle for innovation – 1high, to 4 null (F)
3.26 0.93
ENV INN Introduced an innovation with high or medium environmental,safety or health effects – 1 yes, 0 no (E.6)
0.47 0.50
ENV INN2 Introduced an innovation with high or medium effect of reducingmaterials or energy per unit produced – 1 yes, 0 no (E.6)
0.40 0.49
ENV INN3 Introduced an innovation with high or medium environmental,safety or health effects (ENV INN) and high or medium effect ofreducing materials or energy per unit produced (ENV INN2) – 1yes, 0 no (E.6)
0.30 0.46
COOPERATION Cooperation on innovation with external partners – 1 yes, 0 no(E.5.1)
0.29 0.46
COOPVENDOR Cooperation with vendors – 1 yes, 0 no (E.5.1) 0.14 0.35COOPCLIENT Cooperation with clients – 1 yes, 0 no (E.5.1) 0.10 0.30COOPCOMPET Cooperation with competitors – 1 yes, 0 no (E.5.1) 0.05 0.23COOPSCIENT Cooperation with consultants, universities, public R&D labs or
technological centers – 1 yes, 0 no (E.5.1)0.23 0.42
R&D INTENSITY Percentage of R&D employees on total employment (B.3 and A.7) 0.09 0.16CONT R&D Engagement in in-house R&D activities on a continuous basis – 1
yes, 0 no (B.1)0.46 0.50
COOP R&D Cooperation with external partners (COOPERATION) and in-houseR&D activities on continuous basis (CONT R&D) – 1 yes, 0 no
0.21 0.41
EXT R&D Percentage of expenditures for extramural R&D on totalinnovation expenditures (C)
8.68 20.54
EQUIPMENT Purchased machinery or equipment – 1 yes, 0 no (D.1.C) 0.19 0.39SUBSIDIARY Subsidiary of another firm – 1 yes, 0 no (A.4) 0.28 0.45EXPORT Turnover in foreign markets – 1 yes, 0 no (A.6) 0.54 0.50PUB FUNDS Received public financial support – 1 yes, 0 no (D.3) 0.33 0.47PrINNOVATION Probability of being an innovator, calculated in the first-stage logit
regression0.75 0.14
ote: In parenthesis, the number of the questions in the PITEC questionnaire on which the variables are constructed.
able A.2imple correlations among the independent variables (n = 6047).
1. 2. 3. 4. 5. 6. 7. 8. 9. 10.
1. COOPERATIONp-Value2. EXT R&D 0.144p-Value 0.0003. R&D INTENSITY 0.140 0.036p-Value 0.000 0.0054. CONT R&D 0.242 0.040 0.364p-Value 0.000 0.002 0.0005. SIZE 0.124 0.096 -0.282 0.186p-Value 0.000 0.000 0.000 0.0006. EXPORT 0.097 0.076 0.028 0.249 0.295p-Value 0.000 0.000 0.032 0.000 0.0007.EQUIPMENT 0.033 -0.020 0.033 0.064 0.086 0.040p-Value 0.018 0.117 0.011 0.000 0.000 0.0028.SUBSIDIARY 0.070 0.083 -0.097 0.072 0.455 0.139 0.024p-Value 0.000 0.000 0.000 0.000 0.000 0.000 0.0669.PUB FUNDS 0.308 0.168 0.280 0.308 0.100 0.112 0.115 0.012p-Value 0.000 0.000 0.000 0.000 0.000 0.000 0.000 0.34710.INNOVATION04 0.102 0.080 0.054 0.256 0.172 0.200 0.034 0.096 0.122p-Value 0.000 0.000 0.000 0.000 0.000 0.000 0.008 0.000 0.00011.PrINNOVATION 0.157 0.112 0.106 0.377 0.373 0.284 0.097 0.191 0.220 0.254p-Value 0.000 0.000 0.000 0.000 0.000 0.000 0.000 0.000 0.000 0.000
V. De Marchi / Research Polic
Table A.3First-stage logit regression.
Coef. S.E.
SIZE 0.264*** (0.029)GROUP 0.079 (0.079)BIOTECH 0.893*** (0.283)HAMP HIGH COSTS −0.231*** (0.032)HAMP DOMIN MKT −0.198*** (0.034)HAMP NO DEMAND 0.476*** (0.033)Industry dummies IncludedConstant −0.561*** (0.185)
Observations 6046Pseudo R2 0.0859Chi square (df) 495.83*** (18)
R
R
A
A
B
B
B
B
B
B
B
B
C
C
C
C
C
C
C
D
F
F
G
G
H
H
knowledge sourcing matter for innovation? Evidence from the Spanish man-
obust standard error.*** p < 0.01.
eferences
ndersen, M., 1999. Trajectory change through interorganisational learning. on theeconomic organisation of the greening of industry. Ph.D. Thesis. CopenhagenBusiness School, Ph.D. Series, Copenhagen.
ndersen, M., 2002. Organizing interfirm learning as the Market Begins to TurnGreen. In: de Bruijn, T., Tukker, A.e. (Eds.), Partnership and Leadership: BuildingAlliances for a Sustainable Future. Kluwer Academic Publishers, pp. 103–119.
aksi, S., Bose, P., 2007. Credence goods, efficient labelling policies, and regulatoryenforcement. Environmental and Resource Economics 37, 411–430.
araldi, E., 2008. Strategy in industrial networks: experiences from IKEA. CaliforniaManagement Review 50, 99–126.
ayona, C., García-Marco, T., Huerta, E., 2001. Firms’ motivations for cooperativeR&D: an empirical analysis of Spanish firms. Research Policy 30, 1289–1307.
eise, M., Rennings, K., 2005. Lead markets and regulation: a framework for ana-lyzing the international diffusion of environmental innovations. EcologicalEconomics 52, 5–17.
elderbos, R., Carree, M., Diederen, B., Lokshin, B., Veugelers, R., 2004a. Het-erogeneity in R&D cooperation strategies. International Journal of IndustrialOrganization 22, 1237–1263.
elderbos, R., Carree, M., Lokshin, B., 2004b. Cooperative R&D and firm performance.Research Policy 33, 1477–1492.
ossink, B., 2007. The interorganizational innovation processes of sustainable build-ing: a Dutch case of joint building innovation in sustainability. Building andEnvironment 42, 4086–4092.
runnermeier, S., Cohen, M., 2003. Determinants of environmental innovation in USmanufacturing industries. Journal of Environmental Economics and Manage-ment 45, 278–293.
ameron, A., Trivedi, P., 2005. Microeconometrics: Methods and Applications. Cam-bridge University Press, Cambridge.
amisón, C., 2010. Effects of coercive regulation versus voluntary and cooperativeauto-regulation on environmental adaptation and performance: empirical evi-dence in Spain. European Management Journal 28, 346–361.
assiman, B., Veugelers, R., 2006. In search of complementarity in innovation strat-egy: internal R&D and external knowledge acquisition. Management Science 52,68–82.
hesbrough, H.W., 2003. The era of open innovation. MIT Sloan Management Review44, 35–41.
lark, K., 1989. Project scope and project performance: the effect of parts strategyand supplier involvement on product development. Management Science 35,1247–1263.
leff, T., Rennings, K., 1999. Determinants of environmental product and processinnovation. European Environment 9 (special issue on Integrated Product Pol-icy), 191–201.
ohen, W., Levinthal, D., 1990. Absorptive capacity: a new perspective on learningand innovation. Administrative Science Quarterly 35, 128–152.
arby, M., Karny, E., 1973. Free competition and the optimal degree of fraud. TheJournal of Law and Economics 16, 67–88.
oxon, T., Andersen, M., 2009. The greening of innovation systems for eco-innovation– towards an evolutionary climate mitigation policy. Paper presented at 2009DRUID Conference, Copenhagen Business School, 17–19 June 2009.
reeman, C., 1992. A green techno-economic paradigm for the world economy. In:The Economic of Hope: Essays on Technical Change, Economic Growth and theEnvironment. Pinter Publishers, London, pp. 190–211.
effen, C., Rothenberg, S., 2000. Suppliers and environmental innovation – theautomotive paint process. International Journal of Operations & ProductionManagement 20, 166–186.
oldbach, M., 2003. Coordinating interaction in supply chains – the example ofgreening textile chains. Strategy and Organization in Supply Chains, 47–64.
aas, M., Hansen, M., 2005. When using knowledge can hurt performance: the valueof organizational capabilities in a management consulting company. StrategicManagement Journal 26, 1–24.
arrison, R., Newholm, T., Shaw, D., 2005. The Ethical Consumer. Sage PublicationsLtd., Thousand Oaks, CA.
y 41 (2012) 614– 623 623
Hemmelskamp, J., 1999. The influence of environmental policy on innovativebehaviour: an econometric study. Fondazione Eni Enrico Mattei WorkingPaper No. 18.99. http://ideas.repec.org/p/fem/femwpa/1999.18.html (down-loaded 10.08.11).
Hipp, C., Grupp, H., 2005. Innovation in the service sector: the demand for service-specific innovation measurement concepts and typologies. Research Policy 34,517–535.
Holzinger, K., Knill, C., Sommerer, T., 2008. Environmental policy convergence: theimpact of international harmonization, transnational communication, and reg-ulatory competition. International Organization 62, 553–587.
Horbach, J., 2008. Determinants of environmental innovations. New evidence fromGerman panel data sources. Research Policy 37, 163–173.
Iammarino, S., Piva, M., Vivarelli, M., Von Tunzelmann, N., 2009. Technological capa-bilities and patterns of cooperation of UK firms: a regional investigation. Tech.rep., IZA Discussion Paper 4129.
Jaffe, A., Newell, R., Stavins, R., June 2002. Environmental policy and technologicalchange. Environmental and Resource Economics 22, 41–69.
Jaffe, A., Newell, R., Stavins, R., 2005. A tale of two market failures: technology andenvironmental policy. Ecological Economics 54, 164–174.
Jaffe, A., Palmer, K., 1997. Environmental regulation and innovation: a panel datastudy. Review of Economics and Statistics 79, 610–619.
Kemp, R., 2000. Technology and environmental policy: innovation effects of pastpolicies and suggestions for improvement. Innovation and the Environment,35–61.
Kemp, R., Arundel, A., Smith, K., 2001. Survey indicators for environmental inno-vation. Paper presented at the Conference Towards Environmental InnovationSystems in Garmisch-Partenkirchen.
Laursen, K., Salter, A., 2006. Open for innovation: the role of openness in explaininginnovation performance among UK manufacturing firms. Strategic ManagementJournal 27, 131–150.
Lichtenthaler, U., 2009. Absorptive capacity, environmental turbulence, and thecomplementarity of organizational learning processes. The Academy of Man-agement Journal 52, 822–846.
Lopez-Gamero, M., Claver-Cortes, E., Molina-Azorin, J., 2009. Evaluating environ-mental regulation in Spain using process control and preventive techniques.European Journal of Operational Research 195, 497–518.
Mazzanti, M., Zoboli, R., 2005. The drivers of environmental innovation in localmanufacturing systems. Economica Politica 3, 399–438.
Meyer, A., Hohmann, P., 2000. Other thoughts; other results? Remei’s bioRe organiccotton on its way to the mass market. Greener Management International 31,59–70.
Miotti, L., Sachwald, F., 2003. Co-operative R&D: why and with whom? An integratedframework of analysis. Research Policy 32, 1481–1499.
Nameroff, T., Garant, R., Albert, M., 2004. Adoption of green chemistry: an analysisbased on US patents. Research Policy 33, 959–974.
Norberg-Bohm, V., 2000. Creating incentives for environmentally enhancing tech-nological change: lessons from 30 years of US energy technology policy.Technological Forecasting and Social Change 65, 125–148.
Piga, C.A., Vivarelli, M., 2004. Internal and external R&D: a sample selectionapproach. Oxford Bulletin of Economics and Statistics 66, 457–482.
Porter, M.E., van der Linde, C., 1995. Toward a new conception of theEnvironment–Competitiveness relationship. The Journal of Economic Perspec-tives 9, 97–118.
Rennings, K., 2000. Redefining innovation – eco-innovation research and thecontribution from ecological economics. Ecological Economics 32, 319–332.
Rennings, K., Ziegler, A., Ankele, K., Hoffmann, E., 2006. The influence of differ-ent characteristics of the EU environmental management and auditing schemeon technical environmental innovations and economic performance. EcologicalEconomics 57, 45–59.
Rex, E., Baumann, H., 2007. Beyond ecolabels: what green marketing canlearn from conventional marketing. Journal of Cleaner Production 15, 567–576.
Seuring, S., Müller, M., 2008. From a literature review to a conceptual frameworkfor sustainable supply chain management. Journal of Cleaner Production 16,1699–1710.
Simpson, D., Power, D., Samson, D., 2007. Greening the automotive supply chain:a relationship perspective. International Journal of Operations & ProductionManagement 27, 28–48.
Spar, D., Mure, L.T.L., 2003. The power of activism. California Management Review45, 78–101.
Tether, B.S., 2002. Who co-operates for innovation, and why: an empirical analysis.Research Policy 31, 947–967.
Tether, B.S., Tajar, A., 2008. Beyond industry–university links: sourcing knowledgefor innovation from consultants, private research organisations and the publicscience-base. Research Policy 37, 1079–1095.
Theyel, G., 2006. Customer and supplier relations for environmental performance.In: Sarkis, J. (Ed.), Greening the Supply Chain. Springer-Verlag, Berlin, pp.139–149.
Vega-Jurado, J., Gutierrez-Gracia, A., Fernandez-de-Lucio, I., 2009. Does external
ufacturing industry. Industrial & Corporate Change 18, 637–670.Von Hippel, E., 1988. The Sources of Innovation. Oxford University Press, New York.Von Tunzelmann, N., Wang, Q., 2007. Capabilities and production theory. Structural
Change and Economic Dynamics 18, 192–211.