Embed Size (px)
Citation preview
ISSN 0030�400X, Optics and Spectroscopy, 2013, Vol. 115, No. 2, pp. 264–273. © Pleiades Publishing, Ltd., 2013.Original Russian Text © V.A. Sterligov, Ya.A. Gritsaienko, Ya. Men, A. Savchenko, 2013, published in Optika i Spektroskopiya, 2013, Vol. 115, No. 2, pp. 305–315.
264
1. INTRODUCTION
Interaction of plasmon polaritons with differentmicro� and nanoobjects is a rich source of informationabout these objects. A number of high�sensitivity bio�logical and chemical sensors have been designed basedon this process. Angular dependences of specularreflection coefficient are generally analyzed with thisgoal in mind. However, it was shown in [1, 2] that theuse of elastic scattering of surface plasmon polaritons(SPPs) for these purposes has a number of advantages.Processing SPP scattering data yields new and valu�able information on the optical properties of surfaceand the objects located on it.
In this study processes of SPP scattering by a dif�fraction grating (DG) were analyzed. DG was etchedin a thin transparent dielectric layer, deposited on ametal film surface, along which SPPs propagate. Wechose this object because it exhibited significant (bymore than four orders of magnitude) enhancement ofSPP scattering in comparison with scattering of S�polarized excitation light [3].
Studying the spatial distribution of the intensity oflight scattered by SPPs has a number of specific fea�tures; in particular, the range of variation in this inten�sity may be as high as several orders of magnitude, and,hence, special procedures should be implemented torecord intensity in these limits. Under these condi�tions, one has to measure weak signals comparablewith the intrinsic photodetector noise and the level ofspurious signals. Thus, lock�in detection must be usedto measure correctly working signals with necessarysensitivity. In addition, normalization of measuredvalues also calls for measuring the probe laser beam
intensity, which may significantly exceed the levels ofscattered light intensity.
To perform these optical experiments, one shouldprovide spatial displacement of the photodetector, achange in the angle of incidence of laser beam, etc. Inprinciple, these experiments can be implemented oncommercial equipment; however, their cost may be sev�eral hundreds of thousands of dollars in this case.
Here, these problems are solved using simple andinexpensive solutions, which, however, provide fairlyhigh characteristics of the measuring system. Usingthe solutions developed, we analyzed the scattering ofSPPs and evanescent waves from a thin DG depositedon the metal film surface along which SPPs propagate.
2. REFRACTION OF A LIGHT BEAMBY A PRISM
The Kretschmann scheme, in which a metal film isdeposited on a face of a transparent prism, is oftenused to generate SPPs. The latter are excited by illumi�nating this film with a light beam passing through theprism. The Kretschmann scheme is shown in Fig. 1a.A laser beam is incident on the side face of the prism ata point М, is refracted on this face, and arrives at apoint N on the hypotenuse face. Having denoted theangle of incidence of the refracted beam on the hypot�enuse face as Γ and the angle of incidence of the pri�mary beam with respect to the hypotenuse face planeas γ, one can show that there is a kind of analog ofSnell’s law (which will be referred to as Snell’s law fora prism with an angle ψ):
.( ) ( )sin sinnγ − ψ = Γ − ψ
PHYSICALOPTICS
Enhancement of Scattering of Surface Plasmon Polaritonsby Surface Defects: Technique and Results
V. A. Sterligova, Ya. A. Gritsaienkoa, Ya. Menb, and A. Savchenkoc
a Institute of Physics, National Academy of Sciences of Ukraine, 03028 Kyiv, Ukraineb Institut für EBS, Universität Ulm, 89081 Ulm, Germany
c Microbiology and Tumorbiology Centrum, Karolinska Institutet, 17177 Stockholm, Swedene�mail: [email protected] November 19, 2012
Abstract—The intensities of scattering of surface plasmon polaritons by regular surface structures signifi�cantly exceed (by several orders of magnitude) the intensities of scattering of evanescent surface waves fromthese structures. When plasmon polaritons are scattered by diffraction grating grooves a few micrometerswide, the scattering from the trailing edge of a grating groove greatly exceeds the scattering level from thegroove leading edge. Some of our original developments are presented that make it possible to put into effectan inexpensive software–hardware optical complex with a wide dynamic range, high sensitivity, and digitallock�in detection based on the use of a computer sound card.
DOI: 10.1134/S0030400X13070199
OPTICS AND SPECTROSCOPY Vol. 115 No. 2 2013
ENHANCEMENT OF SCATTERING OF SURFACE PLASMON POLARITONS 265
−4
0 20 40 60 80γ, deg
−2
0
2
4
S,
mm
(h)
0
5
10
15
20
−10
0 20 40 60 80
0
10
20
30
L,
mm
(f)2
1.5
1
0.5
0
−10
0 20 40 60 80
0
10
20
L,
mm
(d)9
−20
−30
7
5
3
1
−1
−3
−10
0 20 40 60 80
−5
0
5
L,
mm
(b)
0
−15
−20
5
10
15
20
M
γ
ηπ/4
γ
NL
OX
A
M
γ
ηπ/4γ
N
LO
X
A
O'
−b
M
γ
ηπ/4
γ
NL
OX
A O'
H
R
A'
γ+α
γ+α
M
γ
ηπ/4
γ
O
X
A
γS
P(g)
(e)
(c)
(a)
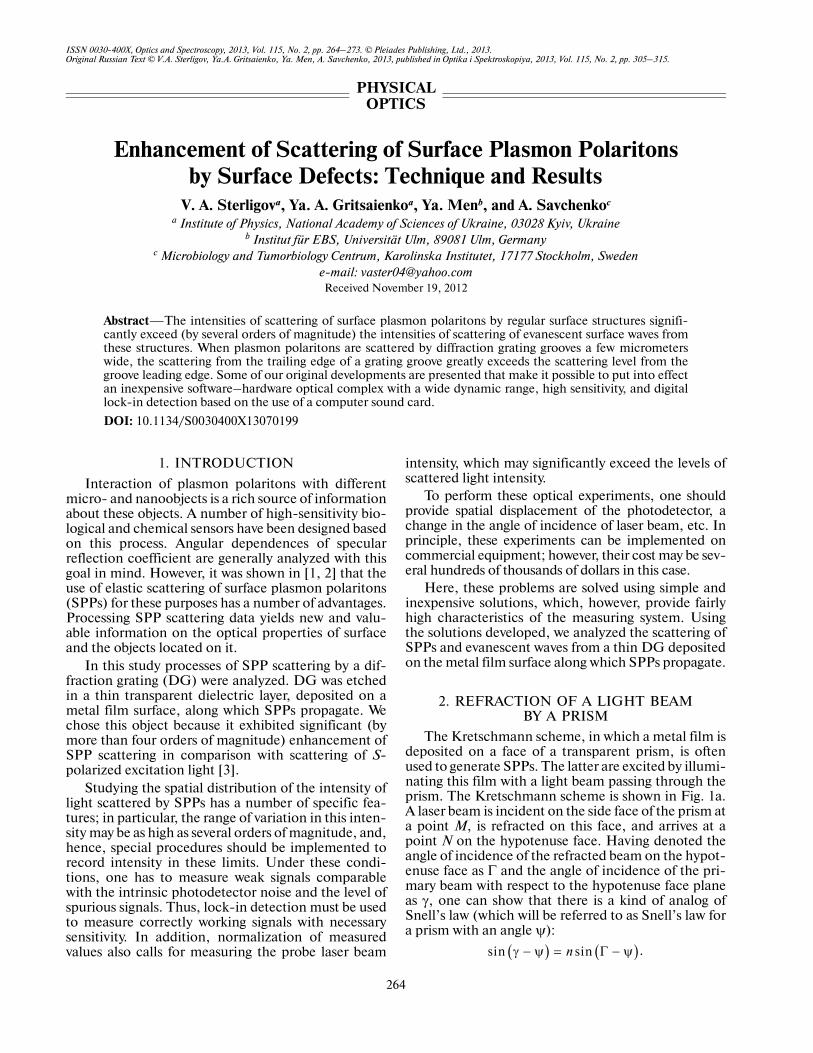
Fig. 1. Optical scheme of light beam refraction by a prism. The metal film on the hypotenuse face of a prism (on the surface ofwhich SPPs are excited) is not shown. Х is the displacement of the axis of rotation with respect to the prism edge. (a, b) The axisof rotation (point О) lies in the hypotenuse plane; the incident beam propagates along the radius of rotation. (c, d) The axis ofrotation is shifted from the hypotenuse plane by distance –b; the incident beam propagates along the radius of rotation. (e, f) Theaxis of rotation lies in the hypotenuse plane; the incident beam is rotated by angle α with respect to the radius of rotation. Theaxis of this rotation is located at distance R from the axis of rotation of the beam. (g, h) The axis of rotation lies in the hypotenuseplane, the incident beam propagates the radius of rotation and is shifted parallel to it by value S. The measured beam displacementat a distance of 15 mm from the axis of rotation to the prism edge is denoted by square markers. The numbers at the curves arethe (b, h) X and (d) b values in millimeters and (f) α values in degrees.
266
OPTICS AND SPECTROSCOPY Vol. 115 No. 2 2013
STERLIGOV et al.
It is convenient to use this relation to calculate theratio of the angle of incidence in air and within a prismwith a refractive index n. This relation is valid for anyψ value; however, we report below the results for a rightprism with ψ = 45°.
With a change in angle of incidence γ, the lightbeam is rotated around point О as an axis of rotation.As a result of this rotation, the position of point Nchanges. However, the known solutions described in[4] do not make it possible to compensate completelythis displacement.
If measurements are performed on homogeneousstructures, this effect can be neglected; however, if thesizes of an object under study are comparable with theincident beam size, this technique yields incorrectresults. Below we report the results of calculating thedisplacements of point N for different directions of theaxis of rotation of the beam relative to the hypotenuseface of the prism.
2.1. In Fig. 1a, the axis of rotation of the incidentbeam intersects the hypotenuse of the prism at pointО. The beam refracted at point M arrives at point N,which lies on the axis of rotation only in the case γ =45°, where the incident beam is normal to the side faceof the prism. Displacement L (L = ON) of the illumi�nated point with respect to the axis of rotation is givenby the relations
, (1)
, (2)
where X = AO is the beam shift with respect to theprism vertex and n is the refractive index of the prism.
Figure 1b shows the calculated L values as func�tions of the angle of incidence γ at different shifts Х.The calculation results show that deviation L increaseswith an increase in Х and in deviation of angle γ from45°. It will be shown below how variations in this devi�ation can be reduced for different spatial configura�tions.
2.2. In Fig. 1c, the axis of rotation is shifted withrespect to the hypotenuse at a distance of –b to pointО '. In this case, displacement L = ON is described bythe formula
, (3)
where η is calculated from formula (2). The results ofcalculation from formula (3) for deviation L at differ�ent b values and Х = 15 mm are shown in Fig. 1d. It canbe seen that, for b = 3.2 mm, the difference ΔL =Lmax – Lmin = 0.04 mm for angle γ varying from 40° to60°. Thus, having shifted the prism along the normalto the hypotenuse with respect to the center of rota�tion, one can significantly stabilize deviation L for theused range of angles γ.
2.3. Let us consider the possibility of compensatingfor the beam displacement by rotating the laser atsome angle with respect to the radius of rotation. Thiscase is shown in Fig. 1e: the center of laser rotation islocated at point О, while the laser, being located atpoint Н at distance R = OH from the axis of rotation,is rotated by angle α with respect to the radius of rota�tion. In this case, displacement L is described by theformula
, (4)
where .
The calculated dependences of L on angle of inci�dence γ at different angles of laser rotation α, Х =15 mm, and R = 300 mm are shown in Fig. 1f. One cansee that angle α = 0.98° corresponds to the smallestvariation in beam displacement ΔL = Lmax – Lmin =0.08 mm in range of angles γ = 40°–60°.
2.4. The above calculations demonstrate how thevariation in the laser beam displacement L can beminimized; however, the experimental geometry withL = 0 can be implemented. To this end, one should usean optical scheme allowing for displacement of a laserbeam parallel to itself by value S while γ changes. Thisconfiguration is shown in Fig. 1g. Laser beam dis�placement S is found from the expression
, (5)
and η is determined from formula (2).Figure 1h shows the results of numerical calcula�
tion of the value from formula (5) as a function of theangle of incidence γ at different distances of the mea�surement point from the prism vertex X. In otherwords, if the distance Х is known, one can calculate thedesired parallel laser displacement in order to com�pensate for the beam displacement with a change inthe angle of incidence.
Thus, when it is necessary to exclude laser�beamdisplacement with respect to an object located on theprism hypotenuse, one must use the method describedin Section 2.2. The method described in Section 2.3 isapplicable when the axis of rotation must lie on thehypotenuse of the prism and the laser beam must not
( )
( )
tan tan
tan tan
1
1
XL
− η ⋅ γ=
η + γ
( )145 arcsin sin(45 )n
η = ° + ° − γ
( ) ( )
( )
tan tan tan tan
tan tan
1 1
1
X bL
− η ⋅ γ + γ + η
=
η + γ
( )( ) ( ) ( )( )
( )( )
tan tan tan tan tan
tan tan
cos 1 1
1
R XL
γ γ + α − γ + η + − γ + α η=
η γ + α +
( )145 arcsin sin(45 )n
η = ° + ° − γ − α( )
( )
tan tan
tan
cos 1
1
XS
γ − γ ⋅ η=
+ η
S
S
OPTICS AND SPECTROSCOPY Vol. 115 No. 2 2013
ENHANCEMENT OF SCATTERING OF SURFACE PLASMON POLARITONS 267
be shifted with respect to the object under study.Finally, if the axis of laser�beam rotation should coin�cide with the hypotenuse of the prism, and illuminatedzone have to be fixed on object under study, themethod described in Section 2.4 should be applied tocompensate for laser�beam displacement.
3. MEASUREMENT OF LIGHT INTENSITYIN A WIDE DYNAMIC RANGE
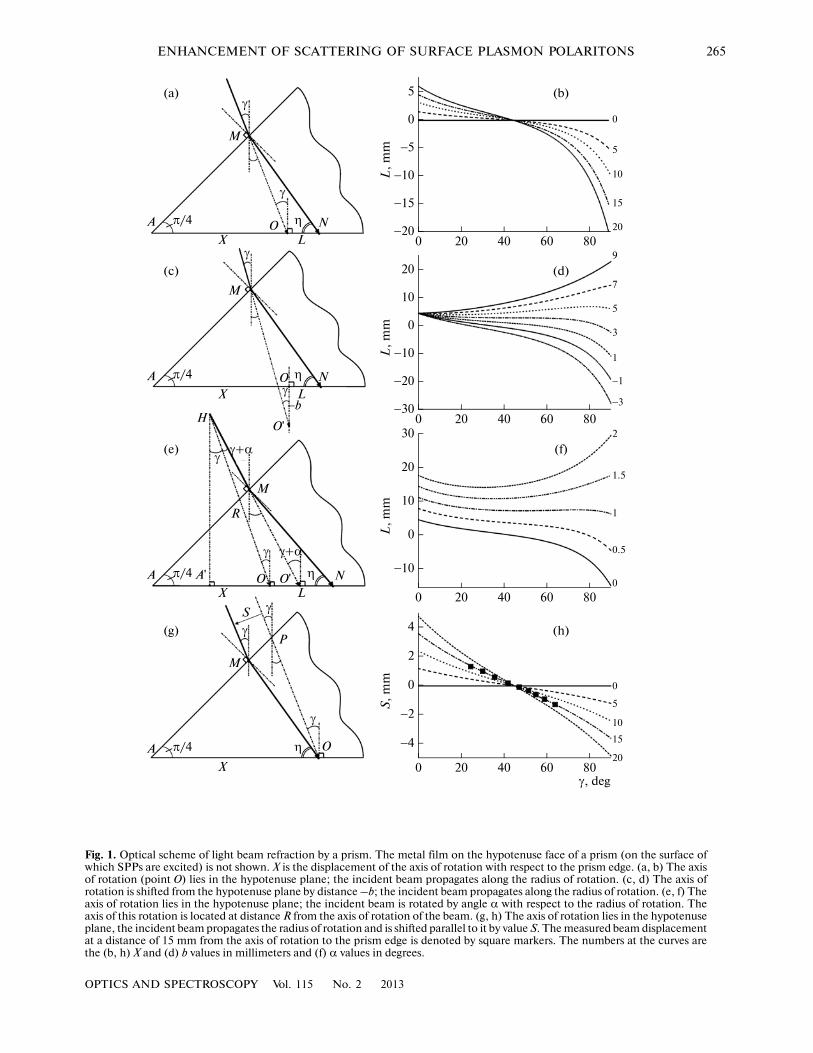
When studying the spatial distribution of scatteredlight intensity, the range of its variation may cover fromfive to six (or even more) orders of magnitude. Mea�surements in this wide dynamic range can be correctlyperformed using either an analog�to�digital converter(ADC) with a resolution of 20�bit reference (orhigher) or by switching the detection sensitivity duringmeasurements. We used the latter version. To this end,we designed a transimpedance amplifier (cur�rent/voltage converter) with a conversion factor set bya computer program controlled during the experi�ment. This amplifier was implemented using a con�ventional current/voltage converter based on an oper�ational amplifier with a multiplexer in the feedbackcircuit. The electric circuit of this converter is shownin Fig. 2. The amplifier input is connected directlywith the photoelectron multiplier tube output (PMTin Fig. 2). The conversion factor was controlled by set�ting the level of controlling signals on two lines of aparallel LPT port. Their combination yields four val�ues of the conversion factor for the transimpedanceamplifier.
The algorithm of switching the conversion factorimplies setting two limiting values of the signal level:upper (Lmax) and lower (Lmin). If the measured valueexceeds Lmax, the program yields a command todecrease the conversion factor and, if the measured
value is smaller than Lmin, the program increases theconversion factor. The Lmax and Lmin values are chosenso that Lmax/Lmin ~ 17 to exclude cyclic switching ofsensitivity at a signal level close to the switchingthreshold.
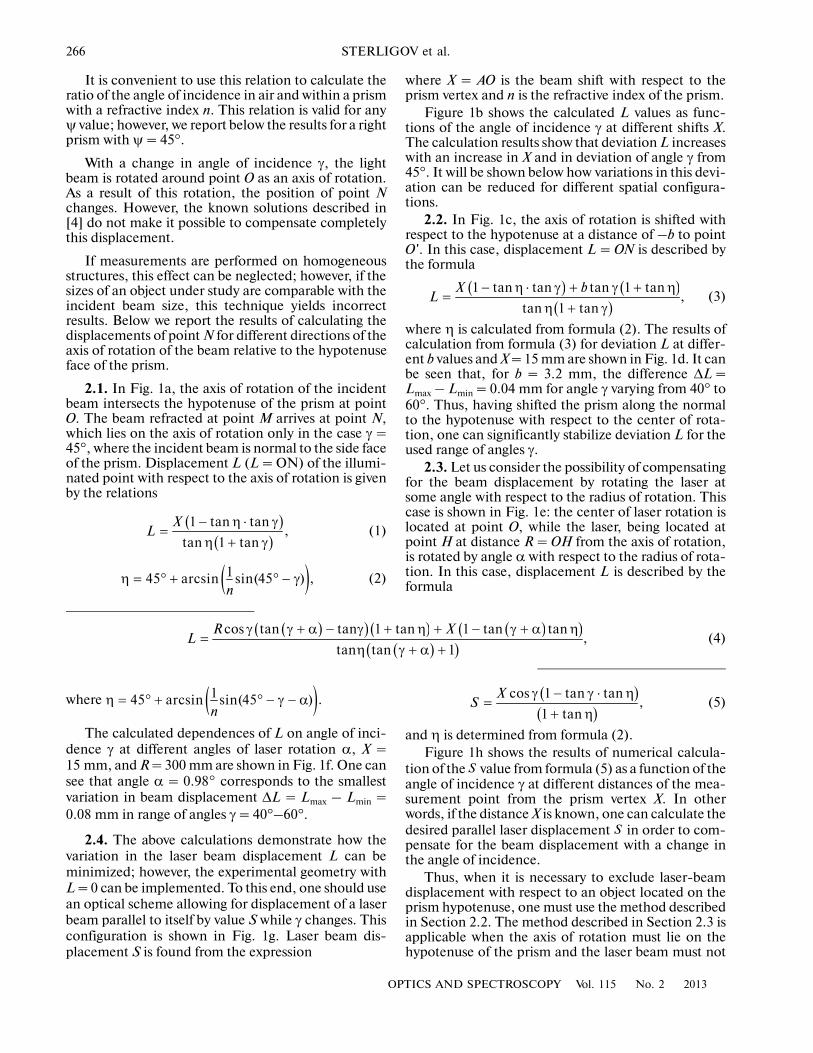
Application of this transimpedance amplifierallowed us to measure the intensity distribution in awide dynamic range. Figure 3 shows an example of thisdistribution: dependence of the angular profile of thelaser beam used in the above�described experiments. Itcan be seen that the measured values vary within fiveorders of magnitude.
4. MALUSMETER AND CALIBRATIONOF SIGNAL DETECTION LINEARITY
An important parameter of the above�describedmeasuring systems, along with the wide dynamicrange, is the linearity of the dependence of the outputsignal on the light intensity. To calibrate this depen�dence, we needed a device with a known value of vari�able light intensity. A set of calibrated light filters canbe used to this end. However, thorough measurementof this dependence needs for many filters with cali�brated transmittance for the light wavelength used inthe experiment.
An alternative solution is the use of rotating polar�izer to change the light intensity. For a linearly polar�ized incident beam, the dependence of the outputintensity on the angle of rotation of polarizer isdescribed by the Malus law. This approach allows oneto record a rather detailed calibration curve and obtain(for a highly polarized laser beam) a wide dynamicrange of controlling the linearity of the measuring sys�tem.
1 k
10 k
100 k
1 M
OutS1
S2
S3
S4A0 A1 GND EN
+VDD
ADG704
D
LPT1LPT2
+5 V
22 µF 100 nF
GND
PMT
100 pF
R 10AD820AN
1
2
9
4
7
6
8
10 3 5
6
7
4
2
3
Fig. 2. Schematic configuration of the transimpedancepreamplifier of an optical signal with a controlled conver�sion factor.
−6
4442 46 48θ, deg
−5
−4
−3
−2
−1
logI, arb. units
Fig. 3. Angular distribution of the relative laser�beamintensity on the logarithmic scale. The background inten�sity correspond to the signal level for θ > 48°.
268
OPTICS AND SPECTROSCOPY Vol. 115 No. 2 2013
STERLIGOV et al.
To implement this solution, we designed a simpleunit, referred to as a malusmeter. It is a polarizerrotated by a stepping motor. A specially developedprogram controls the malusmeter so as to record thedependence of measured signal on the angle of rota�tion of the polarizer. After recording this dependence,the program finds the minimum of the signal; then,the dependence in the vicinity of the minimum isapproximated by a parabola and this analyticalapproximation is used to find the exact position of theminimum: the beginning of the angular coordinates.The angular scale of the polarizer position is calcu�lated based on this point, the angular scale is used tocalculate (according to the Malus law) the light inten�sity transmitted through the polarizer, and the transferdependence of the output signal on the incident lightintensity is built.
This check is necessary, because conditions underwhich this dependence becomes nonlinear can oftenbe implemented in experiments. In addition, the useof a malusmeter with a photodetector operating in thelinear mode allows one to measure (with high accu�racy) the transmission/absorption coefficient of anuncalibrated light filter based on the ratio of measuredslopes of the transfer characteristics for the beamtransmitted through the measured light filter and forthe incident beam.
5. TUNING�FORK MODULATOROF LASER BEAM INTENSITY
The software–hardware measuring complexdescribed here needs a master oscillator, the signalfrom which should synchronize both the laser�beammodulator and the schemes for processing and record�ing signals. We used a tuning�fork oscillator as a master
oscillator; this oscillator, along with mechanical inter�ruption of the laser beam, generated a stable referencesignal, which was used to process measured signals.
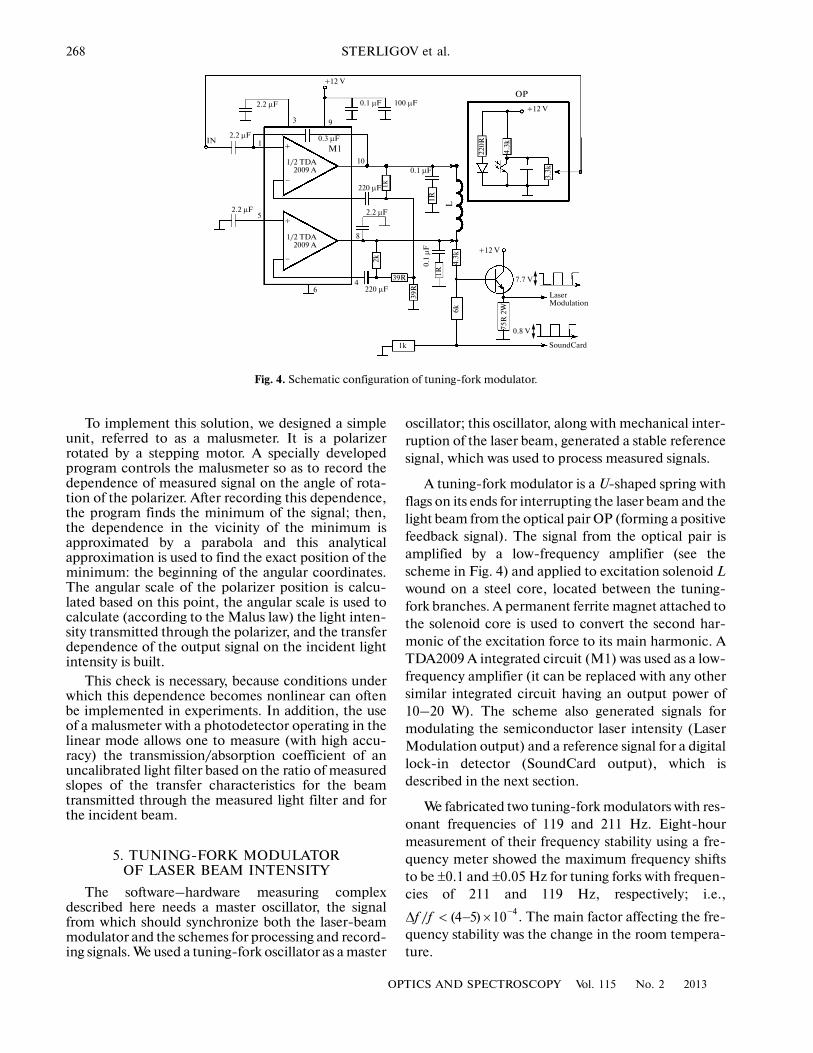
A tuning�fork modulator is a U�shaped spring withflags on its ends for interrupting the laser beam and thelight beam from the optical pair OP (forming a positivefeedback signal). The signal from the optical pair isamplified by a low�frequency amplifier (see thescheme in Fig. 4) and applied to excitation solenoid Lwound on a steel core, located between the tuning�fork branches. A permanent ferrite magnet attached tothe solenoid core is used to convert the second har�monic of the excitation force to its main harmonic. ATDA2009 A integrated circuit (M1) was used as a low�frequency amplifier (it can be replaced with any othersimilar integrated circuit having an output power of10–20 W). The scheme also generated signals formodulating the semiconductor laser intensity (LaserModulation output) and a reference signal for a digitallock�in detector (SoundCard output), which isdescribed in the next section.
We fabricated two tuning�fork modulators with res�onant frequencies of 119 and 211 Hz. Eight�hourmeasurement of their frequency stability using a fre�quency meter showed the maximum frequency shiftsto be ±0.1 and ±0.05 Hz for tuning forks with frequen�cies of 211 and 119 Hz, respectively; i.e.,
. The main factor affecting the fre�quency stability was the change in the room tempera�ture.
/ 4(4 5) 10f f −
Δ < − ×
+12 V
0.1 µF 100 µFOP
+12 V
4.3k
2.2 µFIN
2.2 µF
2.2 µF
0.3 µF
M1
1/2 TDA2009 A
220 µF 1k
1R
2.2 µF
0.1 µ
F
1R
4.3k
+12 V
6k
39R
39R
220 µF
2k
1k
75R
2W
7.7 V
LaserModulation
SoundCard
0.8 V
1/2 TDA2009 A
+
−
+
−
1
3 9
10
5
8
46
0.1 µF
L
220R
Fig. 4. Schematic configuration of tuning�fork modulator.
3.3k
OPTICS AND SPECTROSCOPY Vol. 115 No. 2 2013
ENHANCEMENT OF SCATTERING OF SURFACE PLASMON POLARITONS 269
6. DIGITAL LOCK�IN DETECTORBASED ON A COMPUTER SOUND CARD
To reduce additionally the level of noise and spuri�ous signals in the measuring complex developed, thesignal from the transimpedance amplifier was appliedto an input of selective Unipan 237 amplifier, tuned tothe modulation frequency of tuning�fork oscillator. Itsoutput signal should be converted to a digital signal forfurther processing and recording. Specialized ADCscan be used to this end; however, their application callsfor developing a special unit containing necessary cir�cuits for power supply, control, conversion, program�ming, etc.
However, a computer sound card can be used as thisunit. Even inexpensive sound cards that are built intothe motherboard have two independent ADCs andDACs with typical sampling level values of 16 bit/ref�erence and a sampling rate of 44–48 kHz, while inex�pensive discrete sound cards provide these parametersat levels of 24 bit/reference and 192 kHz, respectively.In the overwhelming majority of cases, the mechanicalmodulation frequency of optical beams is in the rangeof several hundreds of hertz; hence, the aforemen�tioned values of these parameters are more than suffi�cient for solving the problem of digitizing and process�ing optical signals. Moreover, the human ear is verysensitive to nonlinear distortions; therefore, the designof sound cards includes special measures providingtheir high detection linearity, as well as weak crossinfluence of the signals of the right and left channels.An additional convenience of using a sound card is thepossibility of recording their output signals by applyinga number of program packages, in particular, the Mat�lab software.
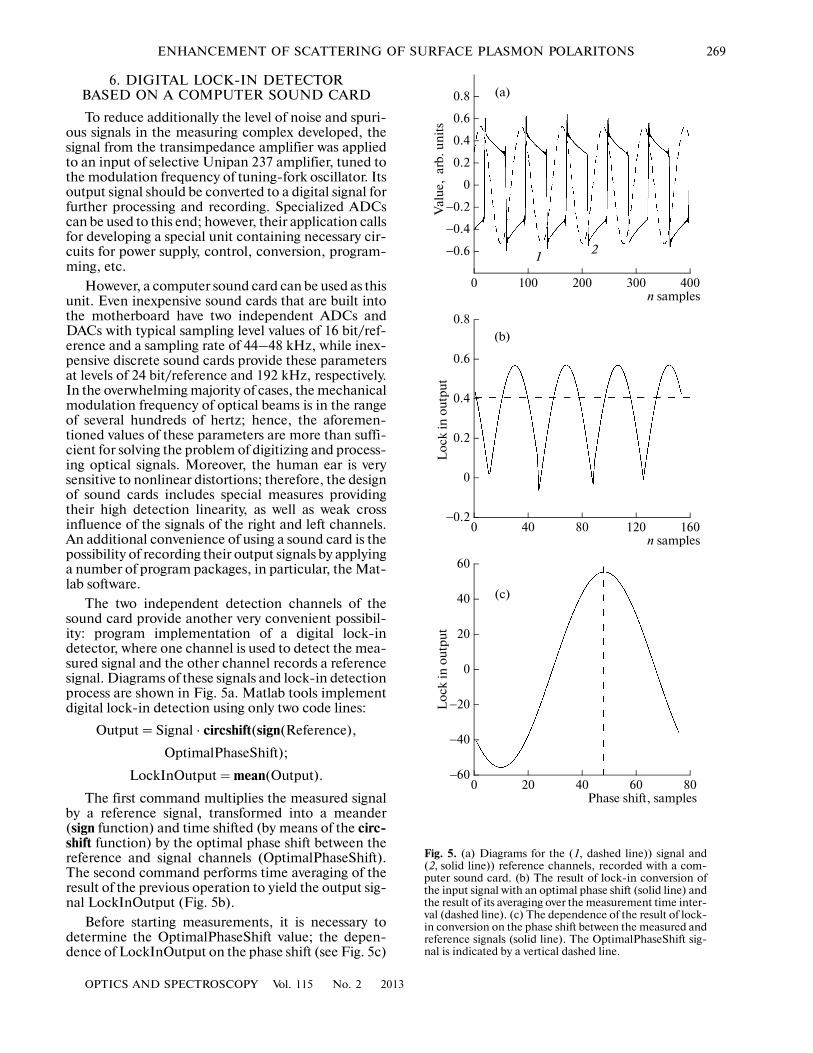
The two independent detection channels of thesound card provide another very convenient possibil�ity: program implementation of a digital lock�indetector, where one channel is used to detect the mea�sured signal and the other channel records a referencesignal. Diagrams of these signals and lock�in detectionprocess are shown in Fig. 5a. Matlab tools implementdigital lock�in detection using only two code lines:
Output = Signal ⋅ circshift(sign(Reference),
OptimalPhaseShift);
LockInOutput = mean(Output).
The first command multiplies the measured signalby a reference signal, transformed into a meander(sign function) and time shifted (by means of the circ�shift function) by the optimal phase shift between thereference and signal channels (OptimalPhaseShift).The second command performs time averaging of theresult of the previous operation to yield the output sig�nal LockInOutput (Fig. 5b).
Before starting measurements, it is necessary todetermine the OptimalPhaseShift value; the depen�dence of LockInOutput on the phase shift (see Fig. 5c)
−40
0 20 40 60 80Phase shift, samples
−60
−20
0
20
40
60
(c)
0
0 40 80 120 160−0.2
0.2
0.4
0.6
0.8
(b)
n samples
Lo
ck in
ou
tpu
t
−0.4
0 100 200 300 400
−0.6
−0.2
0
0.2
0.4
0.8 (a)
n samples
0.6
Lo
ck in
ou
tpu
tV
alu
e, a
rb. u
nit
s
12
Fig. 5. (a) Diagrams for the (1, dashed line)) signal and(2, solid line)) reference channels, recorded with a com�puter sound card. (b) The result of lock�in conversion ofthe input signal with an optimal phase shift (solid line) andthe result of its averaging over the measurement time inter�val (dashed line). (c) The dependence of the result of lock�in conversion on the phase shift between the measured andreference signals (solid line). The OptimalPhaseShift sig�nal is indicated by a vertical dashed line.
270
OPTICS AND SPECTROSCOPY Vol. 115 No. 2 2013
STERLIGOV et al.
is measured for this purpose. The maximum Lock�InOutput value corresponds to the optimal phase shift.
Switching of the conversion factor of transimped�ance amplifier leads to a sharp change in the signallevel; naturally, there is no point in measuring its valueduring relaxation.
We developed a measurement algorithm, whichallows one to determine the instant when the signalstops relaxing; this algorithm works correctly for bothincreasing and decreasing signal levels. Its principle isin exclusion of signal levels when the latter monotoni�cally increase or decrease. An example of implement�ing this algorithm in the Matlab language is shownbelow. The function MeasureIntensity measures thecurrent value of signal, and the operator && is the log�ical operator AND. A signal stops relaxing when theprogram terminates the while … end loop.m1 = MeasureIntensity; m2 = MeasureIntensity;m3 = MeasureIntensity; m4 = MeasureIntensity;while (((m4 – m1)(m4 – m3) > 0) && ((m4 –⎯ m1)(m3 – m2) > 0) && ((m4 – m2)(m3 – m1)>0)&& ((m4 – m1)(m2 – m1)>0))m1 = m2, m2 = m3, m3 = m4, m4 = MeasureInten�sity;end
7. USE OF A COMPUTER PARALLEL PORT FOR CONTROLLING STEPPING MOTORS
We used stepping motors to implement mechanicalmotions in the experimental setups in view of the wideavailability and convenience of application of thesedevices. They have a high specific torque and make itpossible to fix the rotor in previously specified angularpositions, independent of the direction of rotation.Their drawbacks are the necessity for monitoring highcurrents (on the order of few amperes) and complexswitching of these currents through motor coils to pro�vide steps.
However, there are available integral drivers ofstepping motors with simple digital interfaces, whichimplement necessary switching of currents throughmotor coils at the instrumental level. We designed asimple stepping motor controller, controlled by signalsfrom a computer parallel port. Its schematic configu�ration is shown in Fig. 6. This controller is based on aA3967 integrated circuit (Allegro MicroSystems, Inc.,United States).
Each integrated circuit A3967 is designed for con�trolling one stepping motor. It has four driving inputs:an input specifying the direction of rotor rotation, apulse step input, and two inputs specifying value of amotor step. The computer parallel port, the access towhich is implemented in overwhelming majority ofprogram products (including Matlab), has eight inde�pendent signal lines, which allowed us to design a con�troller for independent control of two motors. Thisapproach made the system universal and simple in
programming. To protect the input chains of inte�grated circuits A3967 from possible overshoots andnoises, low�pass filters were included in the inputchains and a digital buffer (based on an integrated cir�cuit LVC245) was used. Its application significantlyincreased the reliability and lifetime of the controller.
8. SAMPLES AND OPTICAL MEASUREMENT SCHEME
In our experiment, SPPs were excited in theKretschmann optical scheme (see Section 1.1). A glassplate was placed on the hypotenuse face of right glass(BK�7) prism with refractive index n = 1.514; the platewas in contact with the prism through a thin layer ofimmersion oil. A 41.3�nm�thick gold film was depos�ited on the plate surface and a 20�nm�thick transpar�ent layer of polymethylmethacrylate (PMMA) wasdeposited on the gold film. Three rectangular holes13.6 μm wide with a period of 401 μm were etched intothe PMMA layer (to the gold film surface) by electron�beam lithography.
SPPs were excited by a semiconductor laser beamwith wavelength λ = 670 nm and a power of 3 mW. Thedegree of polarization of laser radiation was increasedusing an additional linear polarizer. The plane ofpolarization of the laser beam was rotated by 45° withrespect to the plane of incidence in order to orient it ineither P or S position by means of another linearpolarizer.
Scattered light was recorded by a photodetectorbased on PMT type of FEU�136 with a sensitivityswitch described in Section 3. A narrow slit diaphragminstalled before the photodetector provided an angularresolution of about 0.4′.
The PMT signal from the output of transimped�ance amplifier was amplified by a selective amplifier ofUNIPAN 237 type and supplied to the signal channelof the computer sound card, and a signal from the out�put of tuning�fork oscillator was supplied to the refer�ence channel. The output signal was obtained as aresult of digital lock�in detection (see Section 6).
The angular position of the photodetector andangle of incidence γ were set by the stepping motors,control of which was described in Section 7.
We measured the normalized values of scatteredlight intensities:
Ixx = Intxx/I0,
where xx = pp or ss (the first and second subscriptsindicate the orientations of the polarizer and analyzer,respectively) and Intxx and I0 are, respectively, theintensities of the scattered and incident laser beams.The Ixx value was measured in the dependence of thepolar scattering angle θ° at optimal (for exciting SPPs)angle of incidence γ.
The distribution of local scattered light intensityalong the sample surface could be obtained with an

OPTICS AND SPECTROSCOPY Vol. 115 No. 2 2013
ENHANCEMENT OF SCATTERING OF SURFACE PLASMON POLARITONS 271
optical microscope (Carl Zeiss, BK50/70) mountedabove its surface with an optical axis directed normallyto the surface. The light scattered by an E50 × 0.5microlens was imaged on the surface of a CCD sensorof a Canon 300D camera.
9. RESULTS AND DISCUSSION
A change in angle of incidence γ leads to a changein the projection of the wave vector of the incidentbeam on the surface plane. When it becomes equal tothe wave vector of plasma oscillations of the electron
SelInGNDGNDGNDErr#InitGNDGNDGNDGNDGNDGNDGNDGNDGNDGNDGNDGND
Strobe#DOD1D2D3D4D5D6D7
ACK#Busy
PESel
Auto D#SignalGNDLogicGND
GNDPLH
LPT
363534333231302928272625242322212019
123456789
101112131415161718
VCC
R12
1k0 R1
100R
C11 10
0 n
F
VCC
R22
1k0 R2
100R
C17 10
0 n
F
VCC
R23
1k0 R3
100R
C18 10
0 n
F
VCC
R24
1k0 R4
100R
C16 10
0 n
F
VCC
R25
1k0 R5
100R
C12
100
nF
VCC
R26
1k0 R10
100R
C15
100
nF
VCC
R27
1k0R6
100R
C13
100
nF
VCC
R28
1k0R9
100R
GND
VCC
GND
GN
DV
CC
DIRA
STPA
MSA0
MSA1
DIRB
STPB
MSB0
MSB1
VccDE#
LVC245B0B1B2B3B4B5B6B7
GND
Dir
A0A1A2A3A4A5A6A7
U21
23456789
10
2019
1817161514131211
100nF
C14
VCC
VCC
STRA
DIRA
MSA0
VCC
GND
VCC
MSA1
VCC
100u
F
C3
100u
F
C4
100u
F
C9
100u
F
C10
U5
47k
C6
1500
pF
R14
X3
+12VGNDGND+5V
0R
R72412
3
4
5
8
9
10
11
12
23
2221
20
17
16
15
14
13
1
2
3
4
1500
pF
C5
47k
R11
PFDRC1
RST#L2
LoadSupplSensel
L1Anable#
LogicSupplMS2
VrefRC2Sleep#L4LoadSupplSense2L3StepDIRMS1
A3967
R13
IR2
R29
IR2
X_COMP
Stepping Motor A
VCC
VCC
STRB
DIRB
MSB0
VCC
GND
VCC
MSB1
U6
47k
C8
1500
pF
R17
0R
R20241
2
3
4
5
8
9
10
11
12
23
2221
20
17
16
15
14
13
1500
pF
C7
47k
R18
PFDRC1
RST#L2
LoadSupplSensel
L1Anable#
LogicSupplMS2
VrefRC2Sleep#L4LoadSupplSense2L3StepDIRMS1
A3967
R30
IR2
R31
IR2
Stepping Motor В
GND
GN
D
GND
GND
GND
GND
GND
GND
GND
VCC GND
GND
GND
GND
GND
GND
GND
GND
Fig. 6. Schematic configuration of the electronic block of program control of two stepping motors through a computer LPT port(LPT in the scheme).
VCC GND
272
OPTICS AND SPECTROSCOPY Vol. 115 No. 2 2013
STERLIGOV et al.
gas in the metal film, SPPs are excited on the film sur�face. Generally, the SPP optical properties are studiedby measuring the dependences on angle of incidence γfor the specular reflection coefficient, the angulardependence of scattered light intensity, different phaseshifts, etc.
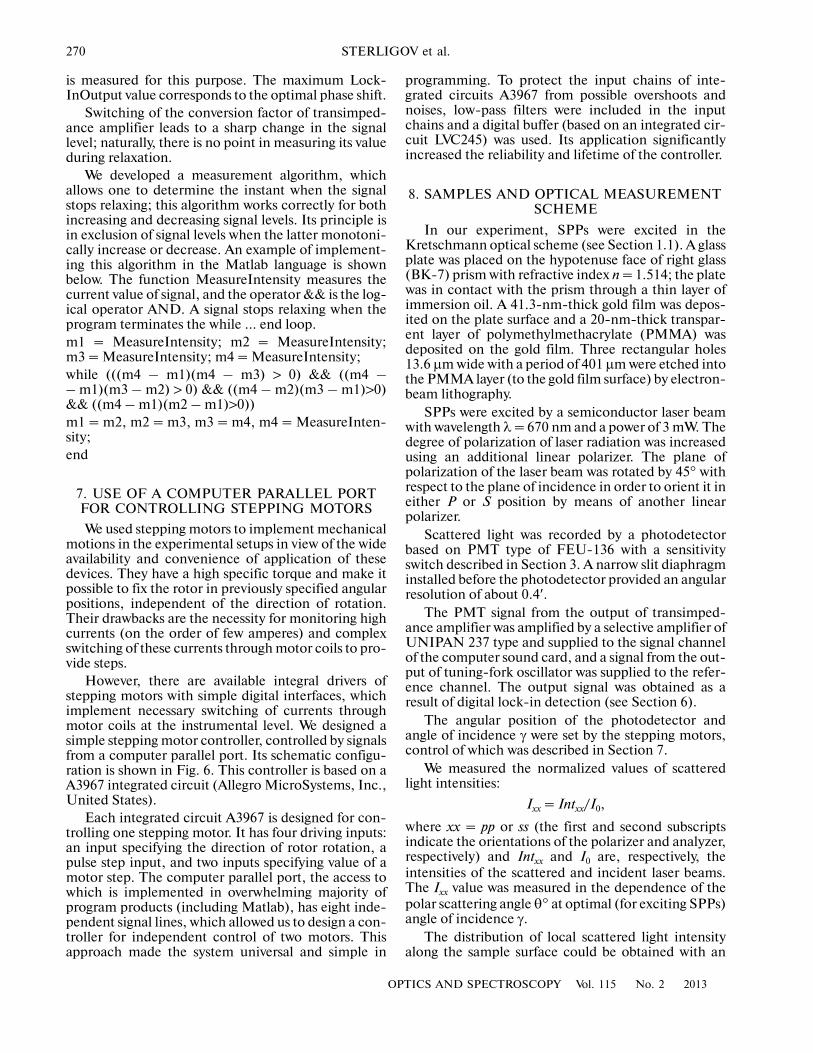
The angular dependences of the logarithm of nor�malized scattering intensities of SPPs and evanescentelectromagnetic waves on a smooth zone of the surfaceand on a three�grooves DG are presented on a polardiagram (Fig. 7). The θ = 0° direction corresponds tothe normal to the sample surface, and θ = 90° is theSPP propagation direction.
The scattering indicatrix for the surface zone withDG upon SPP excitation is shown in Fig. 7 (solid linecurve). At angles θ > 0°, one can see a pronouncedinterference structure of diffracted light (the intensityof which increases to θ = 75°) with a peak value ofabove Ipp ~ 5 × 10⁻⁵ described by relation (1) from [3].The SPP scattering pattern for the smooth surfacezone (circles) lacks this interference structure, and atθ < 0° the DG scattering indicatrix almost coincideswith the corresponding indicatrix for the flat surfacezone with Ipp at a level of 1 × 10⁻⁸. The scattering levelsfor evanescent electromagnetic waves (at S orienta�tions of polarizer and analyzer) for a DG and thesmooth surface zone are comparable in shape andmagnitude; they are Ipp ~ Iss ~ 1 × 10⁻⁸ for the front(copropagating with respect to the SPP propagationdirection) half�plane and Ipp ~ Iss ~ 1 × 10⁻⁹ for the rearhalf�plane. An important feature of the observed scat�tering indicatrices is the complete absence of the char�acteristic interference structure upon excitation of
evanescent waves (SS polarization) for the surfacezone with a DG.
Thus, the data obtained indicate that an interfer�ence structure is observed in the scattering indicatrixonly upon SPP excitation. However, a DG is presenton the surface upon excitation of evanescent waves,and an interference structure should also be observedon it. Its absence in the measured scattering indicatrixis due to the fact that the DG has very low diffractionefficiency: the PMMA layer thickness (and, therefore,the DG depth) is only 20 nm, and this interferencestructure is obscured by the light scattered by stochas�tic surface relief. However, SPP excitation leads to astrong enhancement (by several orders of magnitude)of scattering efficiency, as a result of which the inter�ference structure of the DG scattering indicatrix notonly becomes pronounced but also greatly exceeds (bytwo orders of magnitude in the peak) the scatteringlevel for the flat surface zone.
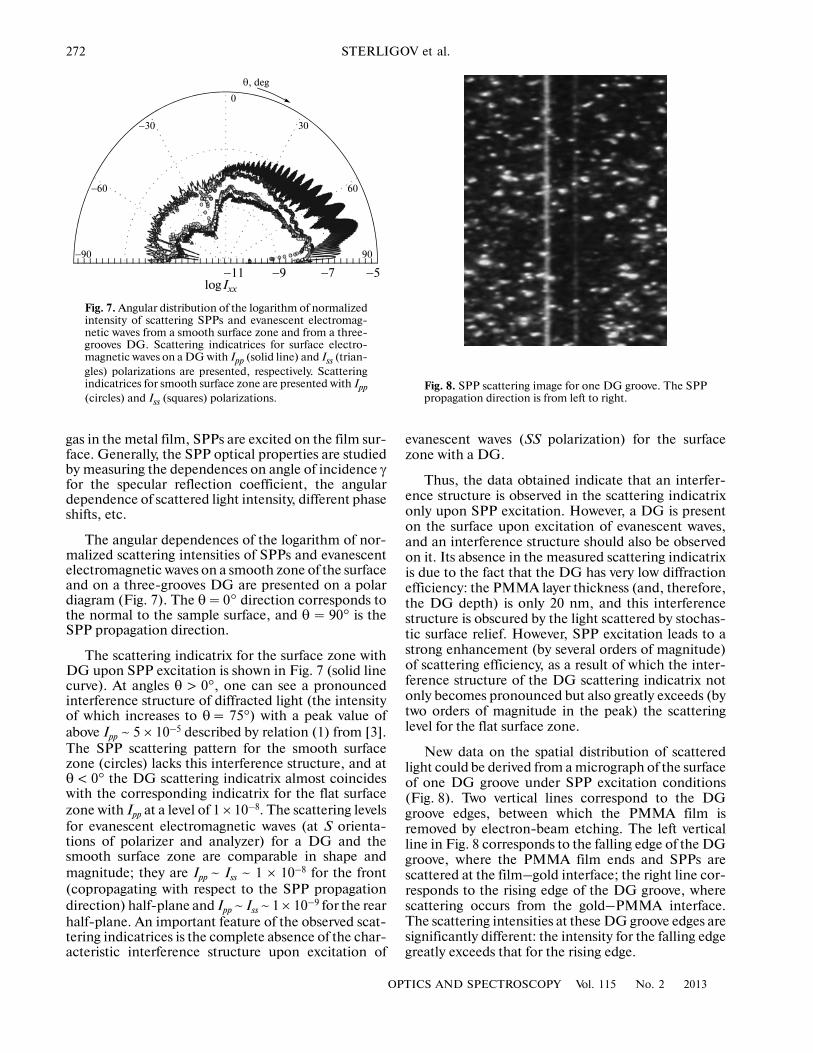
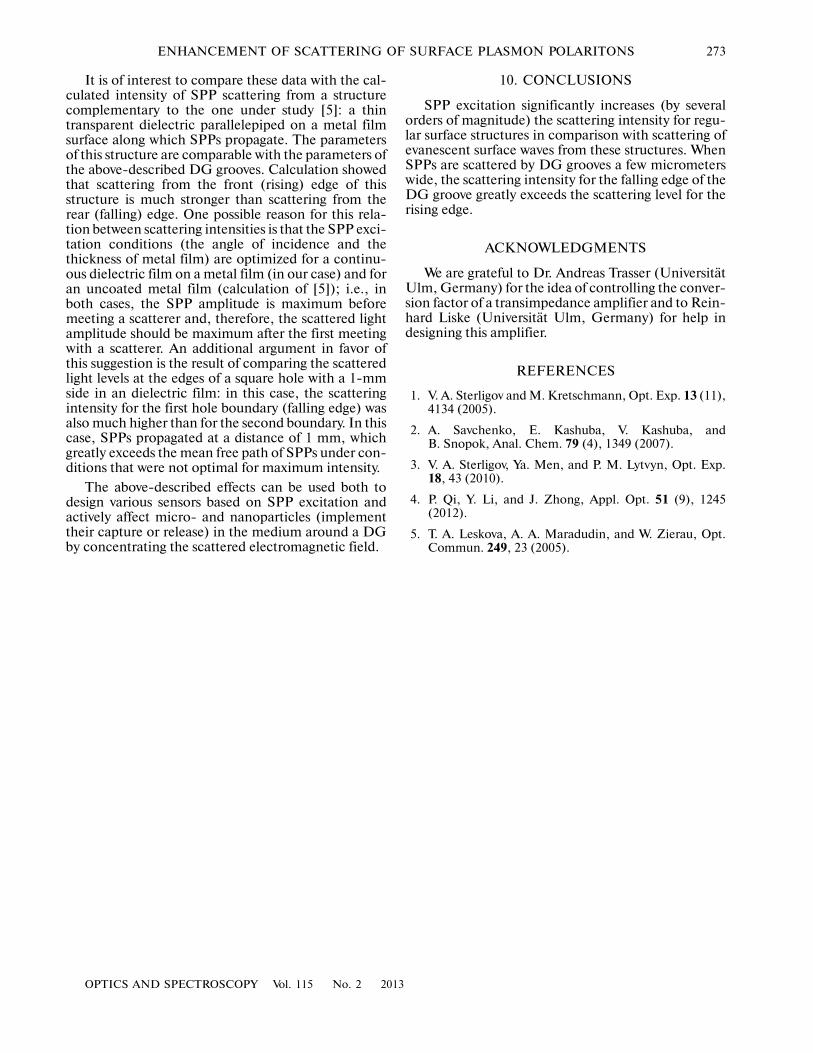
New data on the spatial distribution of scatteredlight could be derived from a micrograph of the surfaceof one DG groove under SPP excitation conditions(Fig. 8). Two vertical lines correspond to the DGgroove edges, between which the PMMA film isremoved by electron�beam etching. The left verticalline in Fig. 8 corresponds to the falling edge of the DGgroove, where the PMMA film ends and SPPs arescattered at the film–gold interface; the right line cor�responds to the rising edge of the DG groove, wherescattering occurs from the gold–PMMA interface.The scattering intensities at these DG groove edges aresignificantly different: the intensity for the falling edgegreatly exceeds that for the rising edge.
−11 −9 −7 −5
90
60
30
0
θ, deg
−30
−60
−90
logIxx
Fig. 7. Angular distribution of the logarithm of normalizedintensity of scattering SPPs and evanescent electromag�netic waves from a smooth surface zone and from a three�grooves DG. Scattering indicatrices for surface electro�magnetic waves on a DG with Ipp (solid line) and Iss (trian�gles) polarizations are presented, respectively. Scatteringindicatrices for smooth surface zone are presented with Ipp(circles) and Iss (squares) polarizations.
Fig. 8. SPP scattering image for one DG groove. The SPPpropagation direction is from left to right.
OPTICS AND SPECTROSCOPY Vol. 115 No. 2 2013
ENHANCEMENT OF SCATTERING OF SURFACE PLASMON POLARITONS 273
It is of interest to compare these data with the cal�culated intensity of SPP scattering from a structurecomplementary to the one under study [5]: a thintransparent dielectric parallelepiped on a metal filmsurface along which SPPs propagate. The parametersof this structure are comparable with the parameters ofthe above�described DG grooves. Calculation showedthat scattering from the front (rising) edge of thisstructure is much stronger than scattering from therear (falling) edge. One possible reason for this rela�tion between scattering intensities is that the SPP exci�tation conditions (the angle of incidence and thethickness of metal film) are optimized for a continu�ous dielectric film on a metal film (in our case) and foran uncoated metal film (calculation of [5]); i.e., inboth cases, the SPP amplitude is maximum beforemeeting a scatterer and, therefore, the scattered lightamplitude should be maximum after the first meetingwith a scatterer. An additional argument in favor ofthis suggestion is the result of comparing the scatteredlight levels at the edges of a square hole with a 1�mmside in an dielectric film: in this case, the scatteringintensity for the first hole boundary (falling edge) wasalso much higher than for the second boundary. In thiscase, SPPs propagated at a distance of 1 mm, whichgreatly exceeds the mean free path of SPPs under con�ditions that were not optimal for maximum intensity.
The above�described effects can be used both todesign various sensors based on SPP excitation andactively affect micro� and nanoparticles (implementtheir capture or release) in the medium around a DGby concentrating the scattered electromagnetic field.
10. CONCLUSIONS
SPP excitation significantly increases (by severalorders of magnitude) the scattering intensity for regu�lar surface structures in comparison with scattering ofevanescent surface waves from these structures. WhenSPPs are scattered by DG grooves a few micrometerswide, the scattering intensity for the falling edge of theDG groove greatly exceeds the scattering level for therising edge.
ACKNOWLEDGMENTS
We are grateful to Dr. Andreas Trasser (UniversitätUlm, Germany) for the idea of controlling the conver�sion factor of a transimpedance amplifier and to Rein�hard Liske (Universität Ulm, Germany) for help indesigning this amplifier.
REFERENCES
1. V. A. Sterligov and M. Kretschmann, Opt. Exp. 13 (11),4134 (2005).
2. A. Savchenko, E. Kashuba, V. Kashuba, andB. Snopok, Anal. Chem. 79 (4), 1349 (2007).
3. V. A. Sterligov, Ya. Men, and P. M. Lytvyn, Opt. Exp.18, 43 (2010).
4. P. Qi, Y. Li, and J. Zhong, Appl. Opt. 51 (9), 1245(2012).
5. T. A. Leskova, A. A. Maradudin, and W. Zierau, Opt.Commun. 249, 23 (2005).


