Embed Size (px)
Citation preview

bigee.net Wuppertal Institute for Climate, Environment and Energy.
Appliances GuideGet super efficient appliances
Energy efficient
Air Conditioners (AC)
Country
South Africa
Authors: Theo Covary, Katrien Du Preez, Thomas Götz
Published: July 2015
Prepared in collaboration by SANEDI and Wuppertal Institute for bigee.net South Africa
Contact:
South African National Energy Development Institute (SANEDI) – Barry Bredenkamp
Wuppertal Institute for Climate, Environment and Energy, Germany – Dr. Stefan Thomas

Energy efficient appliances
bigee.net Wuppertal Institute for Climate, Environment and Energy. 2
Index
1 Country-wide saving potential ................................................................................ 3
2 Subtypes and markets ............................................................................................. 6
3 Efficiency range and user savings ...................................................................... 15
4 Performance and information requirements ................................................... 17
5 Test procedures and standards ......................................................................... 21
6 Application of the Standard ................................................................................. 25
7 References ................................................................................................................ 29

Energy efficient appliances
bigee.net Wuppertal Institute for Climate, Environment and Energy. 3
1 Country-wide saving potential
Air Conditioners (AC)
About 2.6 million electric AC are in use in South Africa (reference year 2010). The average annual con-
sumption of each of these AC amounts to about 3,100 kWh. In total, this causes an annual electricity
consumption of 8.1 TWh. As model calculations show, enormous efficiency improvements can be
achieved, especially if old inefficient models are replaced by modern efficient ones. The calculations of
the efficiency scenario are based on the assumption that every time a new AC is bought, the most effi-
cient “Best Available Technology” (BAT) model is chosen and that the improvements of the most effi-
cient models over the years are taken into account. By this means, even an absolute decoupling of the
annual energy consumption and the increasing stock of AC can be achieved. While the stock is ex-
pected to grow by 73 % between 2010 and 2020, in the efficiency scenario the energy consumption
can be reduced by 7 %. Although the stock is expected to grow significantly by another 120 % until
2030 (following international trends), in the efficiency scenario the increase of energy consumption can
be at least mitigated (Figure 1). Thereby, in particular higher living standards (e.g. increasing appliance
ownership rates and household numbers) have been anticipated. In contrast, in the baseline scenario
with moderate efficiency gains the energy consumption would increase by 27 % by 2020 and 85 %
between 2020 and 2030.
0
2.000.000
4.000.000
6.000.000
8.000.000
10.000.000
12.000.000
14.000.000
16.000.000
18.000.000
20.000.000
0,00
2,00
4,00
6,00
8,00
10,00
12,00
14,00
16,00
18,00
20,00
2009 2012 2015 2018 2021 2024 2027 2030
Sto
ck
TW
h
Scenario A Scenario B Stock
Source: Wuppertal Institute (2015)
Figure 1: Electricity consumption AC, Baseline Scenario (A) vs. Efficiency Scenario (B)
Energy efficient appliances
bigee.net Wuppertal Institute for Climate, Environment and Energy. 4
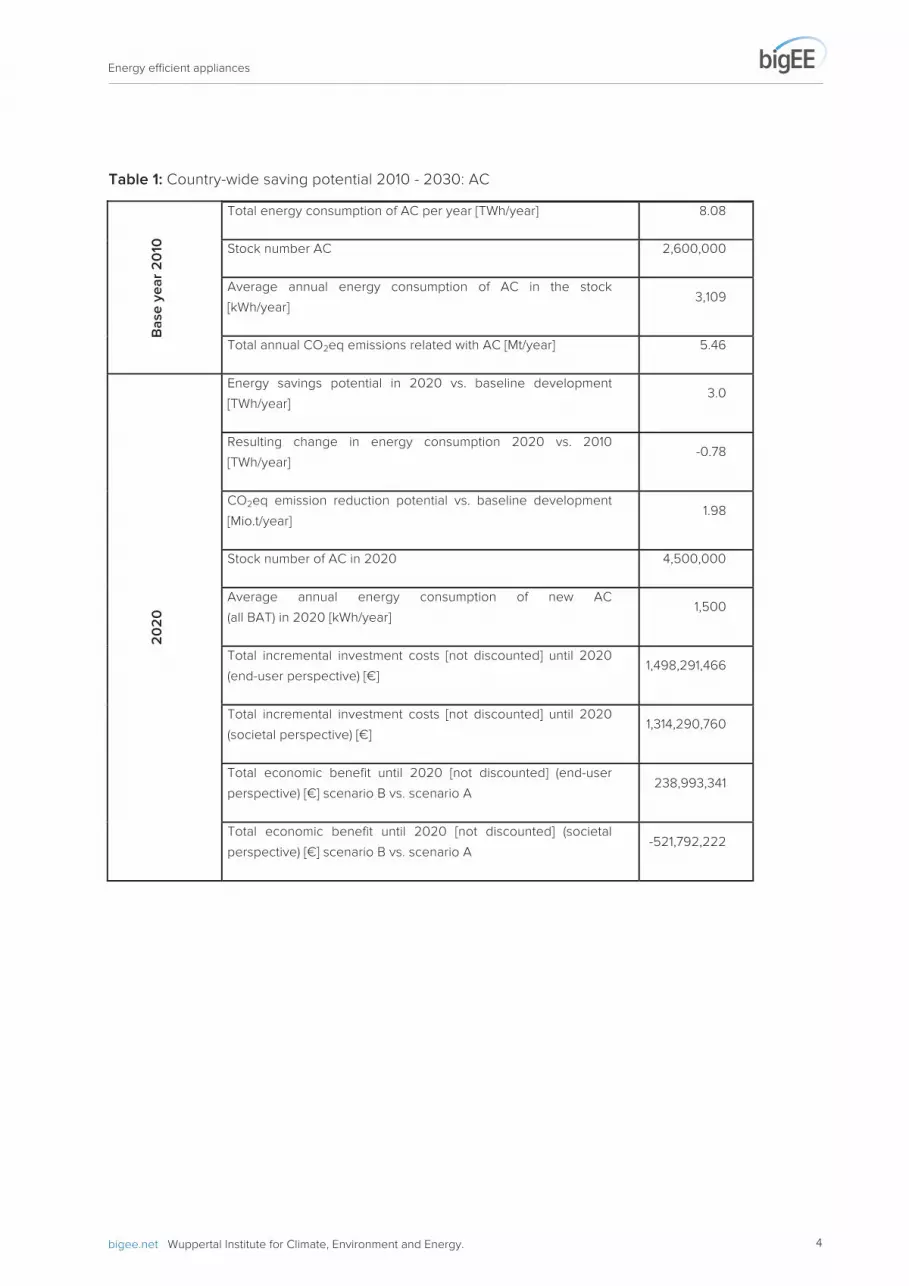
Table 1: Country-wide saving potential 2010 - 2030: AC
Ba
se
ye
ar
20
10
Total energy consumption of AC per year [TWh/year] 8.08
Stock number AC 2,600,000
Average annual energy consumption of AC in the stock
[kWh/year] 3,109
Total annual CO2eq emissions related with AC [Mt/year] 5.46
20
20
Energy savings potential in 2020 vs. baseline development
[TWh/year] 3.0
Resulting change in energy consumption 2020 vs. 2010
[TWh/year] -0.78
CO2eq emission reduction potential vs. baseline development
[Mio.t/year] 1.98
Stock number of AC in 2020 4,500,000
Average annual energy consumption of new AC
(all BAT) in 2020 [kWh/year] 1,500
Total incremental investment costs [not discounted] until 2020
(end-user perspective) [€] 1,498,291,466
Total incremental investment costs [not discounted] until 2020
(societal perspective) [€] 1,314,290,760
Total economic benefit until 2020 [not discounted] (end-user
perspective) [€] scenario B vs. scenario A 238,993,341
Total economic benefit until 2020 [not discounted] (societal
perspective) [€] scenario B vs. scenario A -521,792,222

Energy efficient appliances
bigee.net Wuppertal Institute for Climate, Environment and Energy. 5
2
03
0
Energy savings potential in 2030 vs. baseline development
[TWh/year] 5.79
Resulting change in energy consumption 2030 vs. 2010
[TWh/year] 5.21
CO2eq emission reduction potential vs. baseline development
[Mio.t/year] 3.78
Stock number of AC in 2030 10,000,000
Average annual energy consumption of new AC
(all BAT) in 2030 [kWh/year] 1,200
Total incremental investment costs [not discounted] between
2021 and 2030 (end-user perspective) [€] 3,078,000,000
Total incremental investment costs [not discounted] between
2021 and 2030 (societal perspective) [€] 2,700,000,000
Total economic benefit until 2030 [not discounted] (end-user
perspective) [€] scenario B vs. scenario A 1,644,851,428
Total economic benefit until 2030 [not discounted] (societal
perspective) [€] scenario B vs. scenario A -925,084,293
Lif
eti
me
da
ta f
or
AC
pu
rch
ase
d in
th
e a
na
lyse
d t
ime
fra
me
Total electricity savings, scenario B compared to scenario A
[TWh] 90.55
Total GHG emission reductions scenario B compared to scenario
A [Mt] 59.07
Total incremental investment costs [not discounted] (end-user
perspective) [€] scenario B vs. scenario A 4,576,291,466
Total incremental investment costs [not discounted] (societal
perspective) [€] scenario B vs. scenario A 4,014,290,760
Total economic benefit [not discounted] (end-user perspec-
tive) [€] scenario B vs. scenario A 3,973,113,782
Total economic benefit [not discounted] (societal perspective) [€]
scenario B vs. scenario A 282,730,271
Source: Wuppertal Institute (2015)

Energy efficient appliances
bigee.net Wuppertal Institute for Climate, Environment and Energy. 6
2 Subtypes and markets
AC are not a priority appliance in South Africa but in recent years the popular-
ity has grown in high income households, reaching a 40 % penetration rate in
the most affluent homes. In addition to households, split ACs are often used
in offices without a centralised HVAC system. The AC market was hit hard by
the 2008 economic recession and sales bottomed out only in 2011/12. The
market started to grow again in 2013 and is expected to grow by a com-
pound annual growth rate of 5 % until 2018. The market in South Africa is
dominated by split AC.
South Africa has a long history of appliance manufacturing and the first large appliances (electric
stoves) were manufactured in 1932. Refrigeration came soon after and other domestic appliances such
as gas stoves, washing machines, tumble dryers followed. Historically there was a limited number of
locally manufactured mass produced appliances available to the middle to lower income groups while
the high income groups were traditionally serviced by European imports. With the new democratic
Government and the onset of globalisation in the mid-1990s several South African companies have
shut down their manufacturing plants but still two remain in 2014. However, there has never been any
local manufacture or assembly of AC. These appliances have always been imported due to historically
low sales volumes in South Africa and the specialised components required for AC. There is also no
incentive amongst local companies to manufacture AC as this sector in general is dominated by im-
ported devices especially from large multinational companies that local companies cannot compete
against [1]. AC are also viewed as a luxury item and targeted to the upper income families and commer-
cial properties without a central AC system. All compressor-operated AC with a rated cooling capacity
not exceeding 8.8 kW are subject to a 15 % import duty [2].
As recently as the late 1980’s the country’s electrification rate for residential households was around
35%, whereby almost all white households had electricity and the electrification rate of non-white
households was extremely low. An electrification programme was implemented in the early 1990’s and
by 2001 the electrification rate had increased to 61 % [3] and by 2011 it was 83 % [4]. By the late 1990’s
the country’s electrification programme expanded the market for electrical appliances by an estimated
50 % [5], but this is unlikely to have benefitted the AC market to the same extent as other more essen-
tial appliances such as refrigerators, televisions and to a lesser extent washing machines.
The country’s significant income inequality means that the middle to lower end of the market chooses
appliances almost exclusively based on price and brand. These appliances generally have less func-
tionality and are often higher consumers of electricity. Conversely, upper income households choose
their appliances based on functionality, design, brand, guarantees and after sales service, aesthetics
and to a lesser extent and only more recently on their energy consumption.

Energy efficient appliances
bigee.net Wuppertal Institute for Climate, Environment and Energy. 7
This income inequality also means that the middle to lower income groups categorise their appliances
as ‘essential’ and ‘non-essential’.
Market Characteristics
All AC sold in South Africa must comply with the South African National Standard (SANS) 54511-3:2010.
This standard conforms to the International Electrotechnical Commission Standard IEC 14511-3:2007.
The market is characterised by two types of systems – split and packaged units. A split AC system is
made up of two units - an outside unit including the compressor, and an inside air outlet unit, often also
referred to as the “wall hung head unit”. The two units are connected by pipes that carry refrigerant. A
packaged terminal AC (PTAC) is a self-contained heating and air conditioning system. This report co-
vers units, which are used in residential houses and small commercial properties and thus does not
consider units exceeding 7.1 kW of cooling capacity as defined in the VC9008 [6].
The AC market is unique in many respects in that it was originally dominated by a small set of specialist
companies, who did not manufacture other household appliances such as refrigerators, ovens and
washing machines (e.g. Carrier and Daikin). In recent years Korean appliance manufacturers added
more and more AC to their appliance portfolios. This prompted also South Africa’s biggest manufactur-
ers of appliances to introduce a range of residential AC units, but these are actually all imported units.
In addition there are many small and no-name brands, which enter the South African market in the form
of direct imports. According to interviews held with industry experts, the market in SA is clearly split
between the established local companies and direct imports. Thereby it was also suggested that con-
tainer loads of no-name products enter the country and once the respective products are sold, the
direct import sellers frequently close their shops, leaving the customers without any support [7]
In its 2014 appliance report, Euromonitor states that AC continue to be supported by high income earn-
ers who continue to buy AC despite the tough economic conditions being experienced in the country
since 2008. The report goes on to note a peculiarity of the local market being that although most AC
units have dual functionality, consumers typically do not use AC to heat their homes as they prefer to
use heating specific appliances. This behaviour may change in the future as consumers are expected
to opt increasingly for more energy efficient heating options [8].
With the high electricity tariff increases experienced since 2007 and the uncertainty of electricity supply
in South Africa, major global brands put significant effort into making consumers aware of the innova-
tive functionality and features their AC products offer, with a major focus being energy efficiency. An
example of this is ‘Smart Invertor’ technology, which claims to use less energy than conventional mod-
els. The energy efficient technology is thereby often bundled with additional comfort features such as
Wi-Fi or air purifier functionality, which however may also push up the price of units significantly. Split
models dominate the market due to advantages concerning their size, noise levels and energy effi-
ciency performance relative to the PTAC models [8].
As the Government’s water and electrification programme continues to develop coupled with increas-
ing household income it is expected that also the general penetration rates of appliances will experi-
ence further growth. But with electricity tariffs increasing by as much as 300 % since 2007 and growing
national concern regarding security of electricity supply and water availability in a water scarce country,

Energy efficient appliances
bigee.net Wuppertal Institute for Climate, Environment and Energy. 8
Euromonitor (2014) reports that increasingly manufacturers and consumers are generally moving to-
wards more energy and water efficient appliances as the economy continues to remain subdued and
the price of water and electricity continue to rise. This is certainly the case for AC where sales plum-
meted from a high of 398,500 units in 2006 to reach a low point of 268,000 units in 2012 before the
market started to experience growth once again.
Penetration Rates and Sales
A phenomenon, which has emerged in South Africa over the last 20 years as a result of new zoning
policies is the conversion of former residential houses into office buildings. This is especially prevalent
near to main arterial roads with high traffic volumes making them easily accessible but undesirable to
live in. Once converted, e.g. what was formerly a four-bedroom house may serve as many as a dozen
employees, with multiple smaller offices and meeting rooms, with each one commonly fitted with a ded-
icated AC unit. This could result in six or more units installed in a single location. These units may be
sourced from suppliers who sell direct imports (often older generation, inefficient but cheaper units) or
from agents who supply products from one of the major brand names. Figure 2 shows the annual sales
of AC by category type for the period 1999 to 2013. Figure 3 shows the penetration rate of AC general-
ly, which is as high as 20 % and Figure 4 shows the penetration rate of AC in residential households
only, which is just 4 % but in Figure 4 it can be also seen that the penetration rate is as high as 40 % in
the highest income households. The Life Style Measure (LSM) categorises households on a scale be-
tween 1 and 10, with 1 being indigent or lowest income and 10 representing the highest.
From a relatively small base, sales of ACs are increasing and are quickly becoming an ‘essential’ item
for high income households and small businesses which do not have centrally installed AC, but for now
this is only the case in 6 % of all households.
Source: Euromonitor (2014)
Figure 2: Annual sales of AC by type 1999 - 2013

Energy efficient appliances
bigee.net Wuppertal Institute for Climate, Environment and Energy. 9
0
2
4
6
8
10
12
14
16
18
20
1999 2000 2001 2002 2003 2004 2005 2006 2007 2008 2009 2010 2011 2012 2013
%
Year
Split AC Split AC (Window) PTAC
Source: Euromonitor (2014)
Source: Euromonitor (2014)
Figure 3: Penetration rates of AC by type 1999 - 2013
Figure 4: Penetration rates of AC by household categories (1999 - 2013)

Energy efficient appliances
bigee.net Wuppertal Institute for Climate, Environment and Energy. 10
Table 2 provides a breakdown of sales by AC sub-category type:
2003 2004 2005 2006 2007 2008 2009 2010 2011 2012 2013
AC
Split
Window
PTAC
496
22
4
524
21
4
553
20
5
593
20
5
462
21
4
379
16
3
332
13
3
272
12
3
261
11
3
255
11
2
256
11
2
521 550 578 619 488 399 348 286 275 268 269
Source: Euromonitor (2014)
AC Market – 1995
First interest in energy efficient appliances in South Africa dates back to 1995, when a cost benefit
analysis was undertaken by the Department of Minerals and Energy [9]. The study grouped space heat-
ing and AC into one category and stated the following:
[Energy efficient] ‘Air conditioners can make a large contribution to reduce energy used but [currently]
there are only a few units used in the homes. The units will be bought from suppliers and they may
have energy labels in the country of origin hence they are included on a voluntary basis. Air condition-
ers use about 600 kWh per month and here energy efficiency labels could result in savings of 5 %.
Existing electric space heaters and air conditioners would be replaced after 15 years’. [10]
AC Market – 2010
A study undertaken by the Department of Trade and Industry [7] in 2011 surveyed the Top 7 distributors
of ACs in South Africa. Jointly, these companies accounted for more than 60 % of annual sales in 2010
and 2011. Only some of the AC companies agreed to participate in the study in the form of interviews
and although some data was provided it was limited with almost no information regarding each unit’s
energy performance. It was therefore not possible to develop a profile of the AC units available in the
South African market. The study thus relied on the BSRIA 2010 report [11] to overcome the lack of direct
market data. Table 3 shows the derived market breakdown.
Table 2: Unit sales by format (‘000 units)

Energy efficient appliances
bigee.net Wuppertal Institute for Climate, Environment and Energy. 11
Split unit AC
Energy class Market share Unit energy consumption (UEC)
(%) (kWh)
A++ 0 390
A+ 0 413
A 0 439
B 75 468
C 25 501
D 0 540
E 0 585
Average 476
Please note: Cooling only, UEC according to standard
AC Market – 2014
Figure 5 shows the percentage of models available in the South African market in 2014 by energy
class. The data was sourced from popular online shopping websites, manufacturer websites and data
supplied by manufacturers themselves. 70 models were identified in total. As in 2010, AC distribution
companies did not participate in the data enquiry to the full extent. For this reason it is not a complete
list, but it is believed to represent the market serviced by the major distributors.
Source: Euromonitor (2014)
Table 3: Efficiency market shares and corresponding UEC for split unit air conditioners (2010)
Figure 5: Percentage of AC models by Energy Class and product category (2014)

Energy efficient appliances
bigee.net Wuppertal Institute for Climate, Environment and Energy. 12
Market Trends
South Africa has been in an economic downturn since 2008 and continues to experience sluggish
growth. In October 2014 the Minister of Finance revised annual economic growth down to 1.4 % from a
forecast of 2.7 % in February 2014 [12]. The duration of these tight economic conditions and the steep
rise in electricity tariffs over the same period has had a significant impact on household disposable
income. Electricity tariffs more than tripled over the four-year period 2008 - 2012 and will continue to
rise at an average of 12 % per year from 2014 to 2018. Sales of ACs were hit particularly hard and
dropped by 48 % over a three-year period. Euromonitor (2009) [13] attributed this to the following:
• The building market in South Africa slowed down and went into decline. AC rely on a positive
building market development and on consumers having disposable income;
• Until 2007 most AC were purchased on credit. The introduction of the National Credit Act
(2008), which regulates the credit market in South Africa more strictly to protect consumers,
was expected to impact on sales significantly; and
• Tight economic conditions meant that ACs dropped down in the list of ‘essential’ appliances.
At the top end of the market consumers were still able and willing to spend on AC units, which are be-
coming a standard feature in high-end households and small offices. Distribution companies have also
increased their marketing efforts and above the line advertisements, such as magazines, billboards and
television, is growing. Strong messages about lifestyle, innovation and energy efficiency are communi-
cated. Direct importers continue to sell their products on the market competing on price rather than
functionality and energy performance. Nevertheless, the middle and lower end of the market still opt by
tendency for cheaper alternatives such as ceiling and desktop fans (please see bigEE South Africa
reports on other appliance groups for details).
The combination of the Government’s intention to introduce a mandatory Standards & Labelling (S&L)
programme (for ACs in 2016) and manufacturers realising that consumer awareness and understanding
of energy efficiency is growing has elicited a response. Manufacturers surveyed have confirmed that
for the appliances that are to be included in the Government’s S&L programme their products meet the
MEPS and that they would like to see the programme to come into effect as soon as possible’1. It is with
the retailers where the major uncertainty continues as the delayed implementation of the mandatory
S&L programme means that stores, where there is very limited understanding of how S&L programmes
are applied, remain unclear on what labelling is required and where. This has resulted in a situation
where it is left up to the individual store managers to decide as to whether appliances labels are dis-
played and how to best deal with appliances where the energy efficiency rating is not supplied by the
manufacturer.
As split unit AC require professional installation the majority of these units are not sold through retail
stores but via authorised dealers. It is common practise for these vendors to manage several brands to
meet the broad range of their customers needs. For this reason, marketing campaigns by the major
companies focus on selling the ‘concept of AC’ rather than directly selling a specific single product.
1 Discussion held with technical manager of Defy appliances September, 2014
Energy efficient appliances
bigee.net Wuppertal Institute for Climate, Environment and Energy. 13
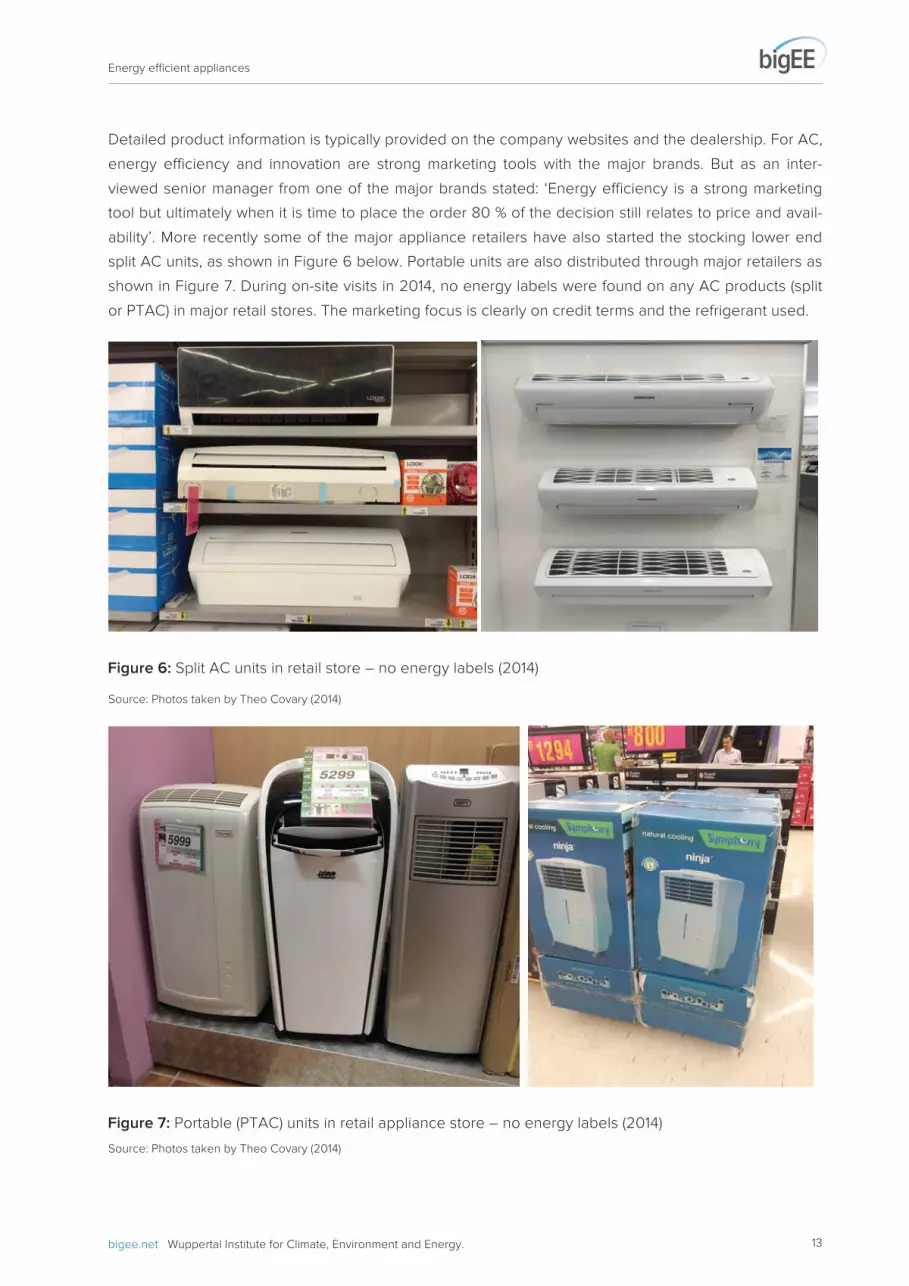
Detailed product information is typically provided on the company websites and the dealership. For AC,
energy efficiency and innovation are strong marketing tools with the major brands. But as an inter-
viewed senior manager from one of the major brands stated: ‘Energy efficiency is a strong marketing
tool but ultimately when it is time to place the order 80 % of the decision still relates to price and avail-
ability’. More recently some of the major appliance retailers have also started the stocking lower end
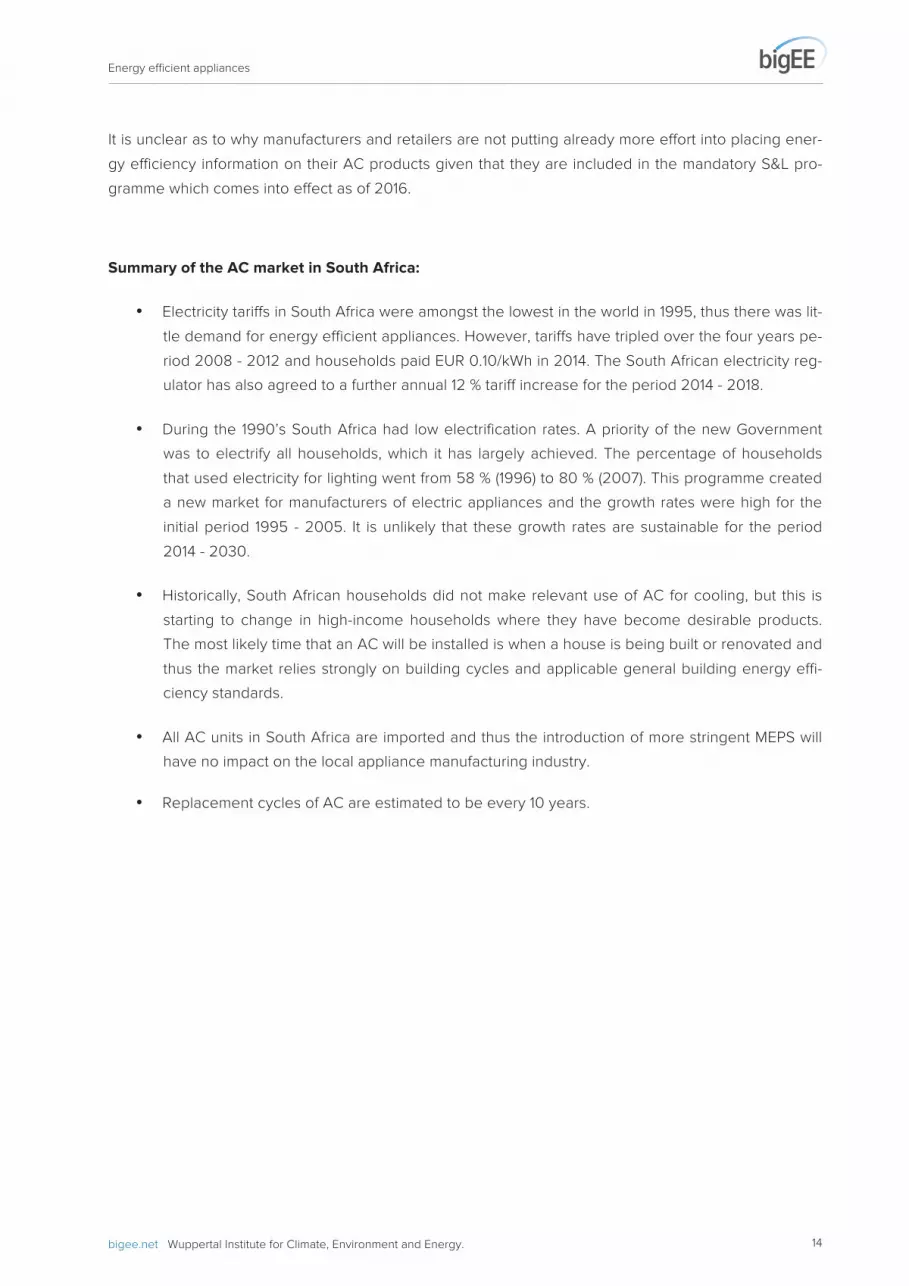
split AC units, as shown in Figure 6 below. Portable units are also distributed through major retailers as
shown in Figure 7. During on-site visits in 2014, no energy labels were found on any AC products (split
or PTAC) in major retail stores. The marketing focus is clearly on credit terms and the refrigerant used.
Source: Photos taken by Theo Covary (2014)
Source: Photos taken by Theo Covary (2014)
Figure 6: Split AC units in retail store – no energy labels (2014)
Figure 7: Portable (PTAC) units in retail appliance store – no energy labels (2014)
Energy efficient appliances
bigee.net Wuppertal Institute for Climate, Environment and Energy. 14
It is unclear as to why manufacturers and retailers are not putting already more effort into placing ener-
gy efficiency information on their AC products given that they are included in the mandatory S&L pro-
gramme which comes into effect as of 2016.
Summary of the AC market in South Africa:
• Electricity tariffs in South Africa were amongst the lowest in the world in 1995, thus there was lit-
tle demand for energy efficient appliances. However, tariffs have tripled over the four years pe-
riod 2008 - 2012 and households paid EUR 0.10/kWh in 2014. The South African electricity reg-
ulator has also agreed to a further annual 12 % tariff increase for the period 2014 - 2018.
• During the 1990’s South Africa had low electrification rates. A priority of the new Government
was to electrify all households, which it has largely achieved. The percentage of households
that used electricity for lighting went from 58 % (1996) to 80 % (2007). This programme created
a new market for manufacturers of electric appliances and the growth rates were high for the
initial period 1995 - 2005. It is unlikely that these growth rates are sustainable for the period
2014 - 2030.
• Historically, South African households did not make relevant use of AC for cooling, but this is
starting to change in high-income households where they have become desirable products.
The most likely time that an AC will be installed is when a house is being built or renovated and
thus the market relies strongly on building cycles and applicable general building energy effi-
ciency standards.
• All AC units in South Africa are imported and thus the introduction of more stringent MEPS will
have no impact on the local appliance manufacturing industry.
• Replacement cycles of AC are estimated to be every 10 years.

Energy efficient appliances
bigee.net Wuppertal Institute for Climate, Environment and Energy. 15
3 Efficiency range and
user savings
The AC market in South Africa is dominated by split unit ACs, with window
and PTAC types controlling only a small percentage. Traditionally, house-
holds have not made relevant use of AC for cooling or heating but this is
slowly starting to change amongst high-income households. Nevertheless,
the biggest application of AC appliances in South Africa remains in small of-
fices (e.g. in rededicated former residential buildings) without central AC sys-
tem. This main application has also influenced the usage estimation used for
efficiency calculations.
The following assumptions were used: AC operated for 5 hours per day throughout the year equalling
1,825 hours in total.
Level Typical
appliance in
the stock
(over all
appliances
in use)
Typical
inefficient
appliance
on the
market.
Typical
appliance
purchased
(BAU –
Business As
Usual)
Best
Available
Technology
(BAT)
Expected
future BAT
(Best not yet
Available
Technology)
Typical
Capacity /
Size
4.5 kW Split AC (Reversible)
Category N/A N/A N/A N/A N/A
Type Existing
inefficient
AC
Non-inverter Non-inverter Inverter AC with
Heat Pump
Inverter AC
with Heat
Pump
Lifetime
(years)
10 10 10 10 10
Table 4: Efficiency range and user savings of AC, based on 2010 data

Energy efficient appliances
bigee.net Wuppertal Institute for Climate, Environment and Energy. 16
Qualitative
perfor-
mance
classifica-
tion of the
provided
service:
Poor
Low
Average
Good
Excellent
No
information
Poor
Low
Average
Good
Excellent
No
information
Poor
Low
Average
Good
Excellent
No
information
Poor
Low
Average
Good
Excellent
No
information
Poor
Low
Average
Good
Excellent
No
information
Yearly energy
consumption:
electricity
(kWh)
3,500 2,600 2,200 1,800 1,500
Yearly energy
cost (ZAR)
5,250 3,900 3,300 2,700 2,250
If applicable:
yearly energy
consumption
for further
energy
carriers
N/A N/A N/A N/A N/A
If applicable:
yearly water
consumption
N/A N/A N/A N/A N/A
Yearly water
cost (ZAR)
N/A N/A N/A N/A N/A
Purchase
cost in
(ZAR)
3,000 3,500 4,000 8,000 16,000
Operation
& Mainte-
nance cost
(ZAR)
1,000
(lifetime)
1,000
(lifetime)
1,500
(lifetime)
2,000
(lifetime)
3,000
(lifetime)
Energy efficient appliances
bigee.net Wuppertal Institute for Climate, Environment and Energy. 17
4 Performance and information
requirements
South Africa introduced a voluntary energy label for refrigerators
and freezers in 2005. The label was based on the EU design and
the objective was to extend this to other large appliances, such as
washing machines, dishwashers and dryers but this did not materi-
alise. National Standards for appliances were issued in 2009. VC
9008 published by the Minister of Trade and Industry on 28 No-
vember 2014 sets a date for the start of a mandatory S&L pro-
gramme. For AC this is 28 of May 2016 and the MEPS has been set
at level B for units not exceeding 7.1 kW (24,000 btu/h).
Energy Label
The South African Energy Strategy of 1998 identified residential appliances as an effective means to
achieve energy savings in the residential sector in South Africa. In 2005 the country’s first National
Energy Efficiency Strategy (NEES) was developed and in the same year the Department of Minerals and
Energy (now Department of Energy) introduced a voluntary labelling scheme, which was a precursor to
a mandatory Standards and Labelling (S&L) Programme.
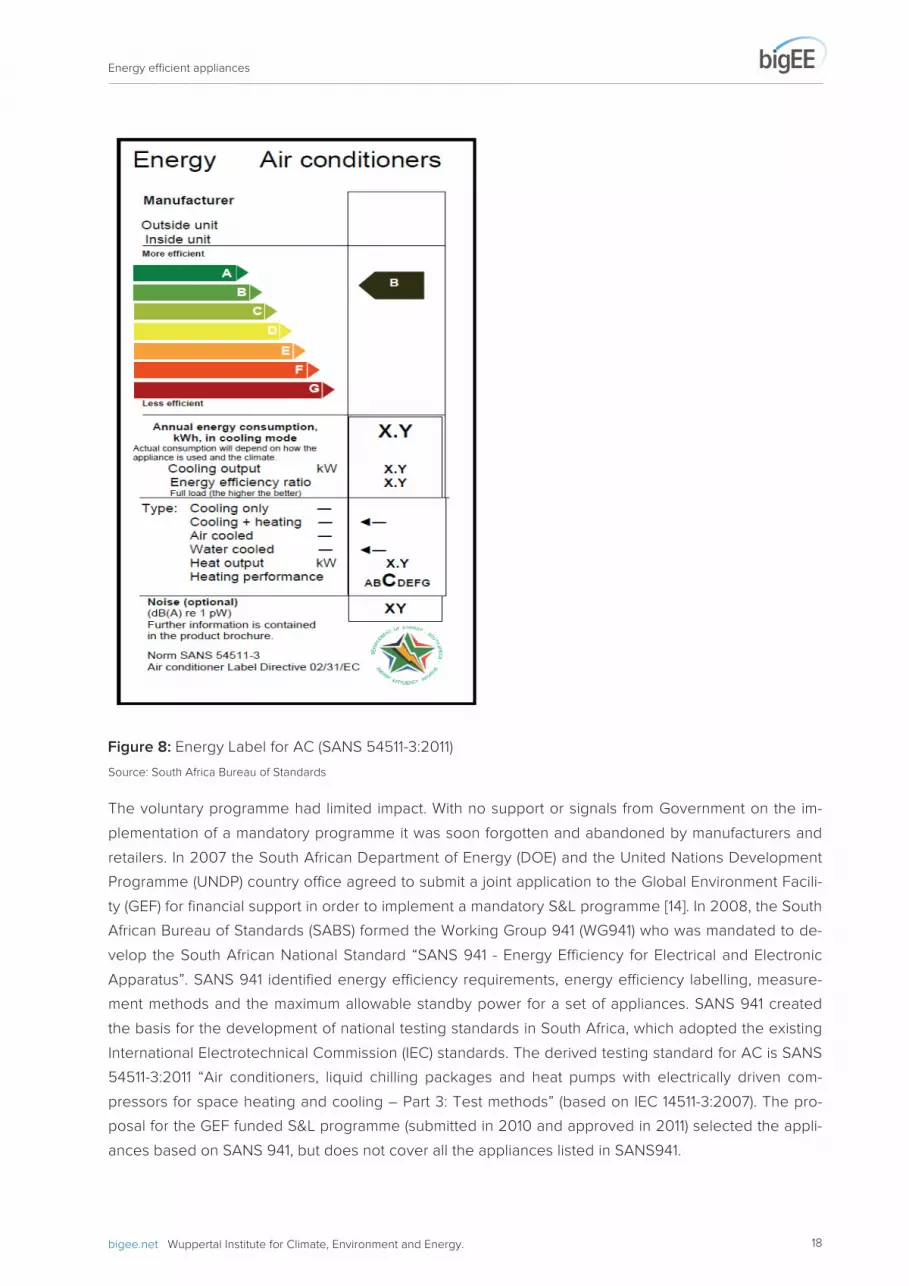
The voluntary scheme targeted refrigerators but encouraged manufacturers to extend it to all their ap-
pliances. It was decided to use the EU designed label, largely because historically the majority of South
Africa’s appliances were imported from Europe. A South African label was designed (Figure 8), which
included some minor changes to the EU label being used at the time, most notably a star with the col-
ours of the South African national flag. The label was registered with all the relevant national and inter-
national authorities.
Energy efficient appliances
bigee.net Wuppertal Institute for Climate, Environment and Energy. 18
Source: South Africa Bureau of Standards
The voluntary programme had limited impact. With no support or signals from Government on the im-
plementation of a mandatory programme it was soon forgotten and abandoned by manufacturers and
retailers. In 2007 the South African Department of Energy (DOE) and the United Nations Development
Programme (UNDP) country office agreed to submit a joint application to the Global Environment Facili-
ty (GEF) for financial support in order to implement a mandatory S&L programme [14]. In 2008, the South
African Bureau of Standards (SABS) formed the Working Group 941 (WG941) who was mandated to de-
velop the South African National Standard “SANS 941 - Energy Efficiency for Electrical and Electronic
Apparatus”. SANS 941 identified energy efficiency requirements, energy efficiency labelling, measure-
ment methods and the maximum allowable standby power for a set of appliances. SANS 941 created
the basis for the development of national testing standards in South Africa, which adopted the existing
International Electrotechnical Commission (IEC) standards. The derived testing standard for AC is SANS
54511-3:2011 “Air conditioners, liquid chilling packages and heat pumps with electrically driven com-
pressors for space heating and cooling – Part 3: Test methods” (based on IEC 14511-3:2007). The pro-
posal for the GEF funded S&L programme (submitted in 2010 and approved in 2011) selected the appli-
ances based on SANS 941, but does not cover all the appliances listed in SANS941.
Figure 8: Energy Label for AC (SANS 54511-3:2011)
Energy efficient appliances
bigee.net Wuppertal Institute for Climate, Environment and Energy. 19
The South African energy label in its current format has certain shortcomings. These include:
• The label designed in 2005 is obsolete, and e.g. does not go beyond A. The standard states
‘the indicators for A+ / A+++ shall be placed at the same level as for class A’;
• Focus Groups undertaken 2012 found that all consumers viewed the programme would benefit
them and supported its implementation. However, reported issues concerning the label includ-
ed confusion regarding the words used for descriptions on the label. For example, why does it
say energy and not electricity? As South Africa has many languages (11 official) so this also
means that certain words may be misunderstood; and
• Including extra information was also questioned. For example, why were noise levels included if
it is an energy label?
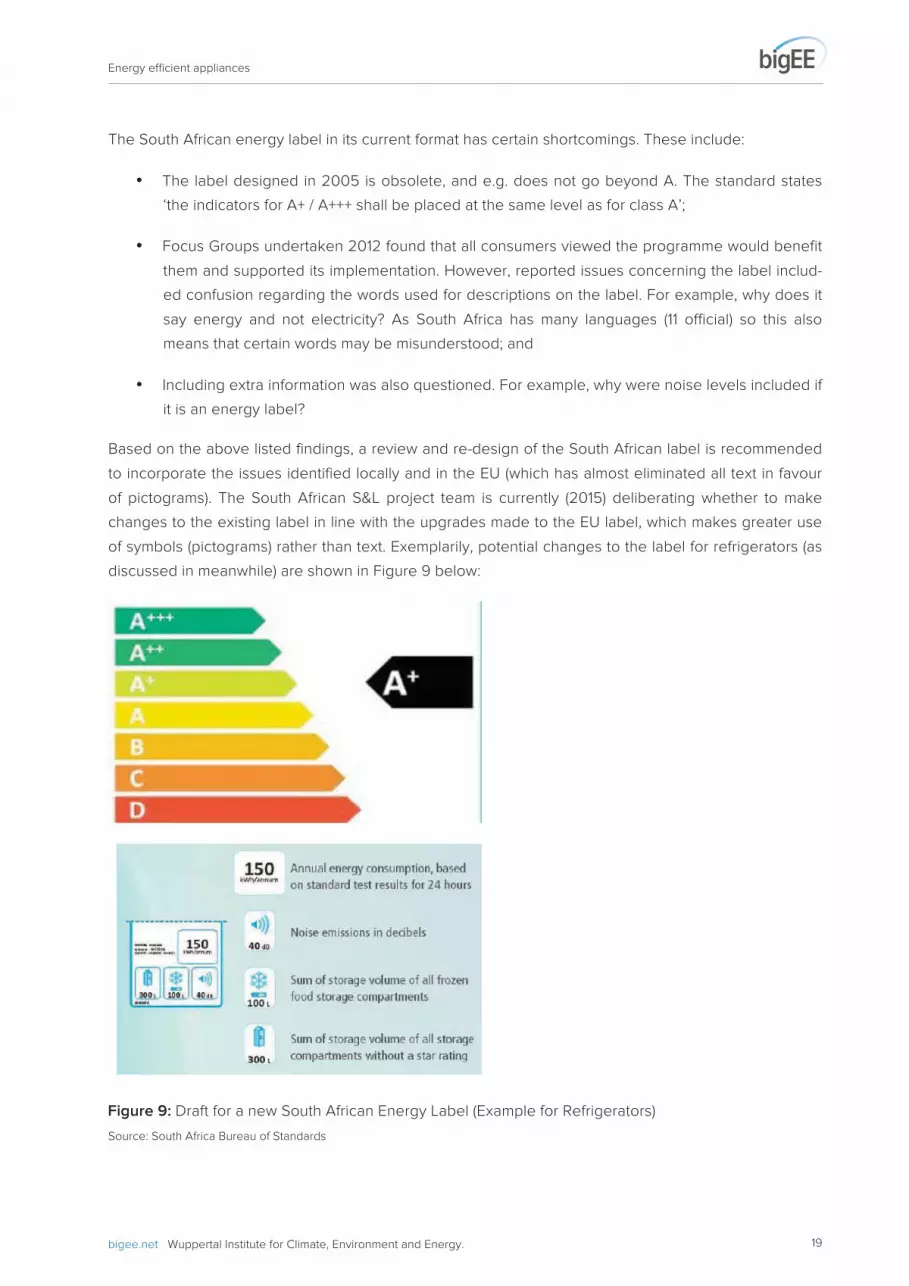
Based on the above listed findings, a review and re-design of the South African label is recommended
to incorporate the issues identified locally and in the EU (which has almost eliminated all text in favour
of pictograms). The South African S&L project team is currently (2015) deliberating whether to make
changes to the existing label in line with the upgrades made to the EU label, which makes greater use
of symbols (pictograms) rather than text. Exemplarily, potential changes to the label for refrigerators (as
discussed in meanwhile) are shown in Figure 9 below:
Source: South Africa Bureau of Standards
Figure 9: Draft for a new South African Energy Label (Example for Refrigerators)
Energy efficient appliances
bigee.net Wuppertal Institute for Climate, Environment and Energy. 20
Minimum Energy Performance Standards (MEPS)
On 7 February 2014, the “Compulsory specification for energy efficiency and labelling of electrical and
electronic apparatus, VC9008” [15] was published by the South African government, which confirmed
the MEPS as:
• AC not exceeding 7.1 kW (24,000 btu/h) cooling capacity, of the wall mounted split, window and
portable types; and heat pumps for space cooling and heating: Label class B
The intention to introduce the above energy class allowed for a mandatory two-month period for public
comments. After this time had elapsed and comments were dealt with, the Minister introduced the
regulations at his / her discretion. On the 28 November 2014 the Department of Trade and Industry
published notification that the VC 9008 will come into effect for AC eighteen months after publication
of the notice i.e.: 28 May 2016 [16].
The MEPS levels were based on the findings of preceding impact assessment studies as well as con-
sultations with manufacturers, retailers and consumer groups.

Energy efficient appliances
bigee.net Wuppertal Institute for Climate, Environment and Energy. 21
5 Test procedures and
standards
All AC sold in South Africa must comply with the South African National
Standard (SANS) 54511-3:2010 “Air conditioners, liquid chilling packages and
heat pumps with electrically driven compressors for space heating and cool-
ing.” This standard conforms to the International Electrotechnical Commission
Standard IEC 14511-3:2007.
Definitions
The following terms and definitions given in EN 14511-1:2007 apply:
• Effective power input (PE): Average electrical power input, expressed in Watt, of the unit within the
defined interval of time obtained from:
o Power input for operation of the compressor and any power input for defrosting;
o Power input for all control and safety devices of the unit; and
o Proportional power input of the conveying devices (e.g. fans, pumps) for ensuring the
transport of the heat transfer media inside the unit.
• Heating capacity (PH): Heat given off by the unit to the heat transfer medium per unit of time, ex-
pressed in Watt.
• Total cooling capacity (PC): Heat given off from the heat transfer medium to the unit per unit of
time, expressed in Watt.
• Energy efficiency ratio (EER): Ratio of the total cooling capacity to the effective power input of the
unit, expressed in Watt/Watt. The EER value indicates the energy efficiency of the cooling perfor-
mance.
• Coefficient of performance (COP): Ratio of the heating capacity to the effective power input of the
unit, expressed in Watt/Watt. The COP value is an indicator of the energy efficiency of the heating
performance.
• Heat transfer medium: Any medium (water, air, etc.) used for the transfer of the heat without
change of state, for example cooled liquid circulating in the evaporator, cooling medium circulating
in the condenser, heat recovery medium circulating in the heat recovery heat exchanger.
• Operating range: Range indicated by the manufacturer and limited by the upper and lower limits of
use (e.g. temperatures, air humidity, voltage) within which the unit is deemed to be fit for use and
has the characteristics published by the manufacturer.
Energy efficient appliances
bigee.net Wuppertal Institute for Climate, Environment and Energy. 22
Overview
The purpose of defining a COP/EER ratio is to provide a relative indicator to evaluate the performance
of an air conditioning system in terms of the energy input by the user or operator and the useful energy
output generated by the system.
Both the EER and COP ratios are determined by the amount of heating and cooling generated by the
air conditioning compared with 1 kilowatt (kW) of electricity it consumes. An air conditioner that gener-
ates 3.6 kW of heating when using 1 kW of electricity has a COP value of 3.6. Therefore the air condi-
tioning that generates most useful heat out of 1 kW of electricity is the most efficient, hence the higher
the COP the more efficient is the air conditioning. Likewise, the higher the EER, the more energy effi-
cient the cooling system. An air conditioner that generates 3.6 kW of cooling when using 1 kW of elec-
tricity has an EER of 3.6.
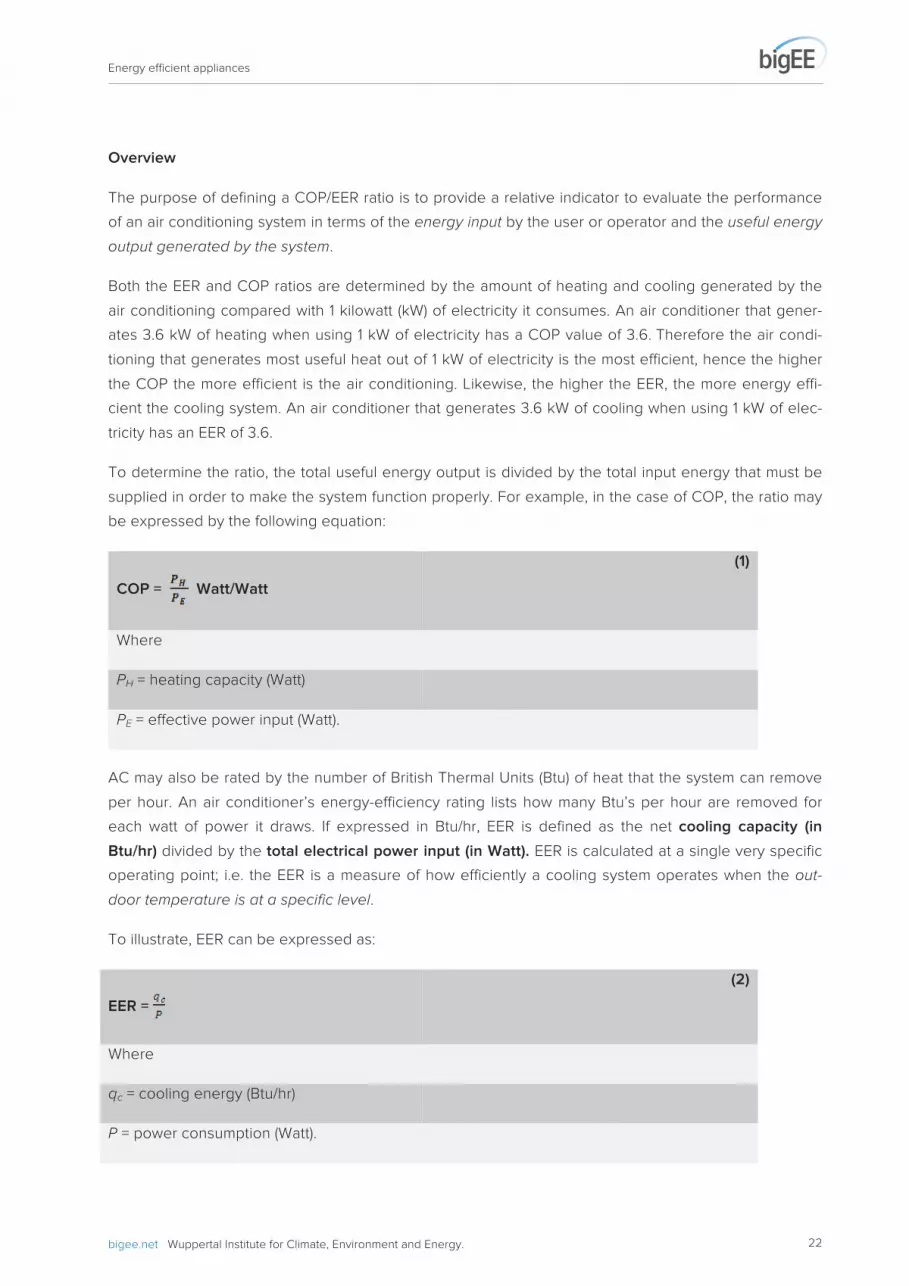
To determine the ratio, the total useful energy output is divided by the total input energy that must be
supplied in order to make the system function properly. For example, in the case of COP, the ratio may
be expressed by the following equation:
COP = Watt/Watt
(1)
Where
PH = heating capacity (Watt)
PE = effective power input (Watt).
AC may also be rated by the number of British Thermal Units (Btu) of heat that the system can remove
per hour. An air conditioner’s energy-efficiency rating lists how many Btu’s per hour are removed for
each watt of power it draws. If expressed in Btu/hr, EER is defined as the net cooling capacity (in
Btu/hr) divided by the total electrical power input (in Watt). EER is calculated at a single very specific
operating point; i.e. the EER is a measure of how efficiently a cooling system operates when the out-
door temperature is at a specific level.
To illustrate, EER can be expressed as:
EER =
(2)
Where
qc = cooling energy (Btu/hr)
P = power consumption (Watt).
Energy efficient appliances
bigee.net Wuppertal Institute for Climate, Environment and Energy. 23
1 Btu = 2.931 x 10⁻⁴
kWh or alternatively 1 Btu/hr = 2.931 x 10⁻⁴
kW.
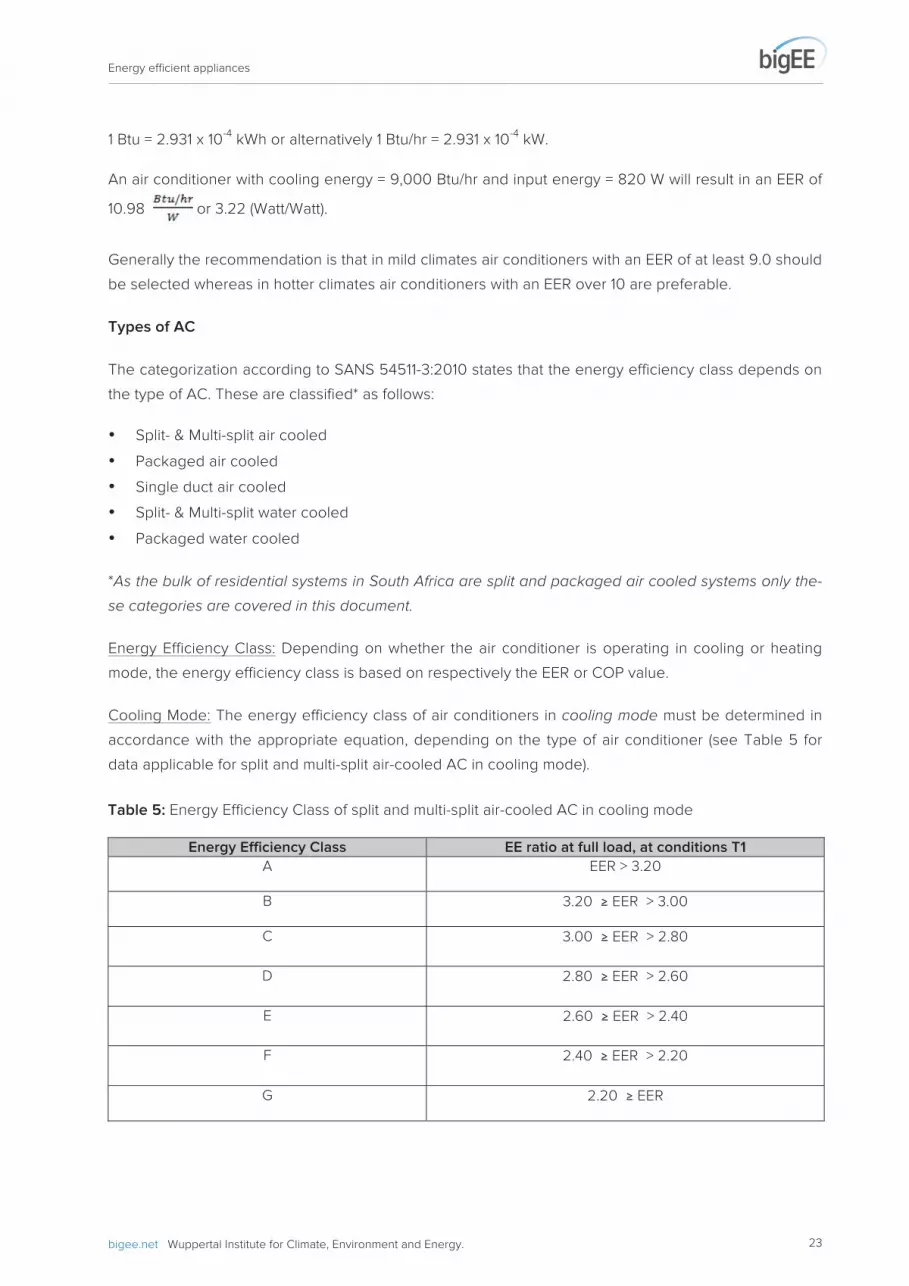
An air conditioner with cooling energy = 9,000 Btu/hr and input energy = 820 W will result in an EER of
10.98 or 3.22 (Watt/Watt).
Generally the recommendation is that in mild climates air conditioners with an EER of at least 9.0 should
be selected whereas in hotter climates air conditioners with an EER over 10 are preferable.
Types of AC
The categorization according to SANS 54511-3:2010 states that the energy efficiency class depends on
the type of AC. These are classified* as follows:
• Split- & Multi-split air cooled
• Packaged air cooled
• Single duct air cooled
• Split- & Multi-split water cooled
• Packaged water cooled
*As the bulk of residential systems in South Africa are split and packaged air cooled systems only the-
se categories are covered in this document.
Energy Efficiency Class: Depending on whether the air conditioner is operating in cooling or heating
mode, the energy efficiency class is based on respectively the EER or COP value.
Cooling Mode: The energy efficiency class of air conditioners in cooling mode must be determined in
accordance with the appropriate equation, depending on the type of air conditioner (see Table 5 for
data applicable for split and multi-split air-cooled AC in cooling mode).
Energy Efficiency Class EE ratio at full load, at conditions T1
A EER > 3.20
B 3.20 EER > 3.00
C 3.00 EER > 2.80
D 2.80 EER > 2.60
E 2.60 EER > 2.40
F 2.40 EER > 2.20
G 2.20 EER
Table 5: Energy Efficiency Class of split and multi-split air-cooled AC in cooling mode
Energy efficient appliances
bigee.net Wuppertal Institute for Climate, Environment and Energy. 24
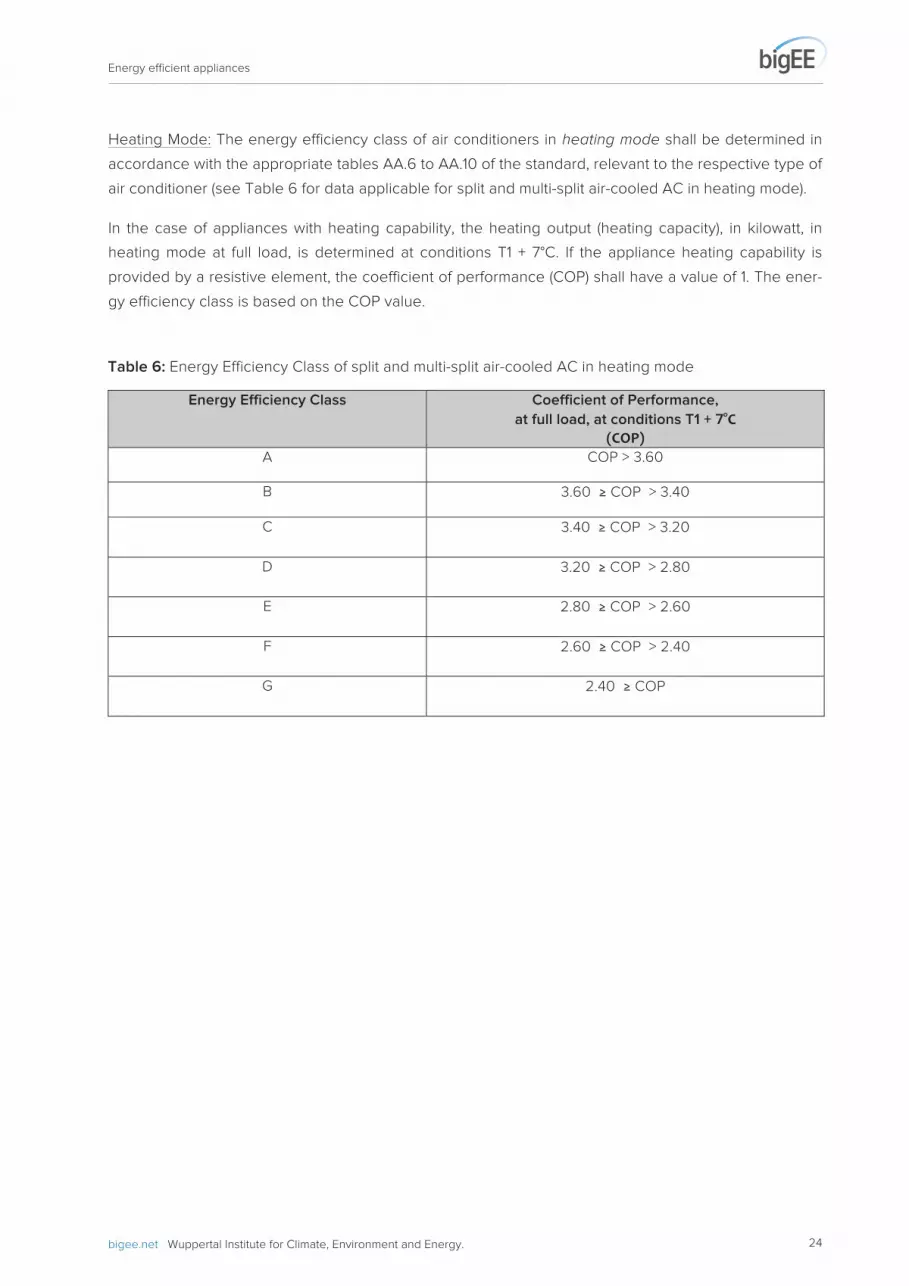
Heating Mode: The energy efficiency class of air conditioners in heating mode shall be determined in
accordance with the appropriate tables AA.6 to AA.10 of the standard, relevant to the respective type of
air conditioner (see Table 6 for data applicable for split and multi-split air-cooled AC in heating mode).
In the case of appliances with heating capability, the heating output (heating capacity), in kilowatt, in
heating mode at full load, is determined at conditions T1 + 7°C. If the appliance heating capability is
provided by a resistive element, the coefficient of performance (COP) shall have a value of 1. The ener-
gy efficiency class is based on the COP value.
Energy Efficiency Class Coefficient of Performance,
at full load, at conditions T1 + 7
A COP > 3.60
B 3.60 COP > 3.40
C 3.40 COP > 3.20
D 3.20 COP > 2.80
E 2.80 COP > 2.60
F 2.60 COP > 2.40
G 2.40 COP
Table 6: Energy Efficiency Class of split and multi-split air-cooled AC in heating mode

Energy efficient appliances
bigee.net Wuppertal Institute for Climate, Environment and Energy. 25
6 Application of the Standard
The SANS 54511-3 formulas to derive the energy class are complicated and
the practical application is difficult to understand for non-experts. To provide
a reference point, a selection of ACs for which actual data was publicly avail-
able was chosen and used to determine annual energy consumption for each
of the energy classes.
The calculations were done by the electrical engineering department of the University of Stellenbosch.
Data obtained for the South African market [19] revealed the following information:
• Types: split, portable, window and floor standing units;
• Classes: Based on the EER values, classes A to E are represented;
• Performance ratios: since only EER values are given and cooling capacity in Btu/hr, cooling mode
operation is generally implied.
• No market data was available for air conditioning units indicating heating mode operation
Cooling Performance
According to the standard [18], an energy label shall provide the following information:
• The indicative annual energy consumption calculated for total input power at an average annual
use of 500 h in cooling mode at full load;
• The cooling output (cooling capacity), in kW, and the energy efficiency ratio (EER), in cooling mode
at full load, determined in accordance with this standard (conditions T1, “moderate”).
The annual consumption (in kWh/yr) for the publicly available datasets [19] indicate that the covered
number of hours in operation is approximately 2,556 hours. Table 7 and Table 8 provide a summary of
the publicly available actual market dataset:

Energy efficient appliances
bigee.net Wuppertal Institute for Climate, Environment and Energy. 26
Type Input_Power
(W)
Annual
consumption
(kWh/yr)
Cooling Capacity
(Btu/hr)
Energy Class EER
(Watt/Watt)
Split No data 5,373.83 23,000 No data 3.21
Split No data 1,985.98 8,500 No data 3.21
Split No data 3,971.96 17,000 No data 3.21
Split No data 8,411.21 36,000 No data 3.21
Split No data 2,562.11 11,000 No data 3.22
Split 820 2,096.27 9,000 A/B 3.22
Split No data 4,192.55 18,000 A/B 3.22
Split No data 2,795.03 12,000 No data 3.22
Split No data 2,096.27 9,000 No data 3.22
Split No data 11,180.12 48,000 No data 3.22
Split No data 4,192.55 18,000 No data 3.22
Split No data 13,975.16 60,000 No data 3.22
Split 1,090 2,786.38 12,000 A/B 3.23
Split No data 8,333.33 36,000 No data 3.24
Split No data 13,384.62 58,000 No data 3.25
Split No data 13,636.36 60,000 No data 3.3
Split No data 3,958.94 18,000 No data 3.41
Split No data 2,639.30 12,000 No data 3.41
Table 7: Actual market dataset of split and multi-split AC with EER >3.20 (Class A)

Energy efficient appliances
bigee.net Wuppertal Institute for Climate, Environment and Energy. 27
Type Input_Power
(W)
Annual
consumption
(kWh/yr)
Cooling
Capacity
(Btu/hr)
Energy
Class
(as stated)
EER
(Watt/Watt)
Energy
efficiency
class
(calc.)
Split No data 8,437.50 36,000 No data 3.2
B Split No data 11,250.00 48,000 No data 3.2
Split No data 5,625.00 24,000 No data 3.2
Split No data 6,382.98 24,000 No data 2.82
C Split No data 12,765.96 48,000 No data 2.82
Split No data 6,405.69 24,000 No data 2.81
Split No data 6,405.69 24,000 C/D 2.81
Split No data 12,996.39 48,000 No data 2.77
D
Split No data 9,818.18 36,000 No data 2.75
Split No data 3,296.70 12,000 No data 2.73
Split No data 13,284.13 48,000 No data 2.71
Split No data 10,112.36 36,000 No data 2.67
Split No data 16,917.29 60,000 No data 2.66
Split No data 17,175.57 60,000 No data 2.62
Split No data 8,620.69 30,000 No data 2.61
Split No data 2,586.21 9,000 No data 2.61
Split No data 5,273.44 18,000 No data 2.56
E
Split 2,060.0 W 5,273.44 18,000 No data 2.56
Split No data 17,786.56 60,000 No data 2.53
Split No data 11,020.41 36,000 No data 2.45
Split No data 7,468.88 24,000 No data 2.41
Based on an assumption of 2,556 hours p.a. the input power PE, in Watt can be calculated which was
done for Table 7 and Table 8, covering classes A to E, and the EER values were verified to be correct.
Consumption Reference Table
The central tendency values of the cooling capacity for the available market data set for split units
(classes A to E) are summarised as follows (Table 9):
Cooling capacity (in Btu/hr)
Average 26,575.47
Mode 12,000
Median 23,000
Table 8: Actual market dataset of split and multi-split AC with EER ≤ 3.20 (Class B and worse)
Table 9: Cooling Capacity

Energy efficient appliances
bigee.net Wuppertal Institute for Climate, Environment and Energy. 28
In order to generate a consumption comparison reference table for air conditioning split-type units op-
erating in cooling mode, it is essential to fix the cooling capacity parameter by constraining it to a realis-
tic and representative value such as the mode value = 12,000 Btu/hr. (The mode value is the value that
occurs most frequently in the data set).
Using the available actual dataset as guideline and equation (2), a consumption reference table (Table
10) for split air conditioners in classes A to E was developed based on the following specifications:
• Type: split unit;
• Operating mode: cooling;
• Operating conditions: at full load under conditions similar to the standard (T1);
• Duration: annual consumption is based on 2,556 hours;
• Cooling capacity: 12,000 Btu/hr, which is the mode value for the available actual data set for prod-
ucts in classes A to E.
From equation (2) it is clear that EER and P are inversely proportional hence ≥ and > (as in the EER ex-
pression) become ≤ and < (in the power consumption expression).
EER =
(2)
Where
qc = cooling energy (Btu/hr)
PE = power consumption (Watt).
Energy Efficiency Class EER (at full load, T1
conditions)
Power consumption P
(in Watt)
A EER > 3.20 P < 3,750
B 3.20 ≥ EER > 3.00 3,750 ≤ P < 4,000
C 3.00 ≥ EER > 2.80 4,000 ≤ P < 4,285
D 2.80 ≥ EER > 2.60 4,285 ≤ P < 4,615
E 2.60 ≥ EER > 2.40 4,615 ≤ P < 5,000
Table 10: Reference table for split type AC in cooling mode with cooling capacity 12,000 btu/hr
Energy efficient appliances
bigee.net Wuppertal Institute for Climate, Environment and Energy. 29
7 References [1] Frost and Sullivan, (2012). Technology Study on Consumer Energy Devices. Department of Trade and
Industry.
[2] Schedules To The Customs And Excise Act, 1964 (Tariff Book) HS 2012: Section 8451.21.10
http://www.sars.gov.za/AllDocs/LegalDoclib/SCEA1964/LAPD-LPrim-Tariff-2012-04%20-
%20Schedule%20No%201%20Part%201%20Chapters%201%20to%2099.pdf Page 513
[3] NER (2001): Lighting up South Africa, National Energy Regulator, Pretoria.
[4] StatsSA (2011): Statistics South Africa, General Household Survey 2011,
www.statssa.gov.za/publications/p0318/p0318april2012.pdf
[5] Bezuidenhout, A. (2002): Overview of the South African White Goods Market, University of the Wit-
watersrand.
[6] Compulsory specification for Energy Efficiency and Labelling of electrical and electronic apparatus
(VC9008). Government Gazette Number 38232. 28 November 2014.
[7] FRIDGE (2012): Energy Performance and Labelling Requirements for Specific Electrical Appliances
and Equipment, 2012. Fund for Research into Industrial Development, Growth and Equity (FRIDGE).
[8] Euromonitor International (2014): Consumer Appliances in South Africa.
[9] Marbek Resources (1997): Appliance energy labelling program: Activity report: results of the benefit-
cost analysis; Department of Minerals and Energy, South Africa.
[10] DME (2005): Appliance Labelling Study, 2003; Department of Minerals and Energy, South Africa.
[11] BSRIA (2010). Split Systems South Africa World Air Conditioning - A multi client study
[12] www.biznews.com/budget/2014/10/south-african-economic-growth-plummet-1-4-nene-warns-
country-turning-point-mtbps/
[13] Euromonitor International (2009): Consumer Appliances in South Africa.
[14] http://undp-ccmap.org/projects/market-transformation-through-energy-efficiency-standards-
labelling-appliances-south-africa
[15] Compulsory specification for Energy Efficiency and Labelling of electrical and electronic apparatus
(VC9008). Government Gazette Number 37288. 7 February 2014
[16] Compulsory specification for Energy Efficiency and Labelling of electrical and electronic apparatus
(VC9008). Government Gazette Number 38232. 28 November 2014

Energy efficient appliances
bigee.net Wuppertal Institute for Climate, Environment and Energy. 30
[17] EN 14511-1 European Standard. Air conditioners, liquid chilling packages and heat pumps with elec-
trically driven compressors for space heating and cooling Part 1: Terms and definitions.
[18] SANS 54511-3:2010 Air conditioners, liquid chilling packages and heat pumps with electrically driven
compressors for space heating and cooling Part 3: Test methods.
[19] South African air-conditioners market share data obtained from Unlimited Energy November 2014.

bigEE is an international initiative of research institutes for technical and policy advice and public agencies in
the field of energy and climate, co-ordinated by the Wuppertal Institute (Germany). It is developing the inter-
national web-based knowledge platform bigee.net for energy efficiency in buildings, building-related tech-
nologies, and appliances in the world’s main climatic zones.
The bigee.net platform informs users about energy efficiency options and savings potentials, net benefits
and how policy can support achieving those savings. Targeted information is paired with recommendations
and examples of good practice.
Partners to date
bigee.net
Co-ordinated by
Dr. Stefan Thomas • [email protected]
Wuppertal Institute for Climate, Environment and Energy • Doeppersberg 19 • 42103 Wuppertal • Germany • Phone: +49 (0)202 2492-129
Your guide to energy effi ciency in buildings.


