Embed Size (px)
Citation preview
Energy Aware Dwelling: A Critical Survey of Interaction Design for Eco-Visualizations
James Pierce, William Odom, and Eli Blevis School of Informatics,
Indiana University at Bloomington, Indiana, USA {piercejj,wodom,eblevis}@indiana.edu
ABSTRACT Eco-visualizations (EVs) are any kind of interactive device targeted at revealing energy use in order to promote sustainable behaviours or foster positive attitudes towards sustainable practices. There are some interesting, informative, highly creative, and delightful EVs now available. This paper provides a critical survey of several noteworthy EVs and classifies them in terms of scale and contexts of use. The paper attempts to provide a foundation for practitioners to design new EVs in more varied scales and contexts and for researchers to continue to refine understandings of how effective EVs can be and how EVs can be made to be more effective. The paper describes (i) feedback types and use-contexts for classifying EVs and (ii) strategies for designing effective EVs.
Categories and Subject Descriptors H5.m. Information interfaces and presentation (e.g., HCI): Miscellaneous.
General Terms Design, Human Factors
Keywords Human-Computer Interaction, Sustainability, Interaction Design, Energy Conservation, Feedback
1. INTRODUCTION This paper builds on and greatly elaborates with many more and different examples an informal report on products that promote energy conservation presented by the author Pierce and his colleague David Roedl in ACM Interactions magazine [31] for the Sustainably Ours forum edited by author Blevis. In this paper, we take a more scholarly approach, and focus specifically on eco-visualizations (EVs). An EV is any kind of interactive device targeted at revealing energy use in order to promote sustainable behaviours or foster positive attitudes towards sustainable practices.
The fields of human-computer interaction and information visualization offer strong potential to provide humans with
increased access to information and the tools to manipulate this information in meaningful ways. Across these fields, concern continues to grow with respect to how interactive systems and technologies can be used (i) to better inform the choices people make in their everyday lives [e.g. 6], (ii) influence the psychological and behavioural factors motivating these decisions [e.g. 11], and (iii) motivate positive behaviour or social change [e.g. 12, 32]. In particular, a key emerging area of interest centres on the role that interactive technology can and should play in facilitating more environmentally sustainable behaviours within the CHI community [2, 15, 24, 25, 28, 40].
As concerns over global warming and the financial costs of energy increasingly pervade international media, energy management is becoming an important and growing area at the intersections of sustainability and HCI and design. For example, artist and designer Tiffany Holmes discusses the notion of sustainability in the context of resource EVs, “The philosophy of sustainability is rooted in how humans manage and maintain resources like electricity and water for future use by all cultures without compromising ecological diversity. Here, sustainability calls for a localized resource management strategy that promotes harmony among organisms from all types of ecosystems—both urban and rural—and among individuals from different cultural and economic backgrounds” [16, p. 154].
In particular, buildings consume considerable amounts of energy and water, and dwellers generally have a high degree of control over their own consumption. For example, as originally quoted in [30, p. 17], “Residential and commercial buildings account for two-thirds of the electricity used in the US, 36 percent of US greenhouse gasses, 9 percent of world greenhouse emissions, and 12 percent of US fresh water consumption [38]. Previous studies have estimated that occupant activities and choices control up to 50 percent of residential energy use, while the balance depends on physical characteristics of buildings and building equipment over which occupants have no control [33]. Production of electrical energy contributes to a broad range of environmental and health problems including climate change, acid deposition, lung ailments, and mercury poisoning. Freshwater consumption (one source of energy use) leads to groundwater and surface water depletion, pollution, and habitat destruction.”
We argue that it is essential for designers and researchers of interactive technology to work towards facilitating more sustainable ways of being in the world. Moreover, interactive technology offers serious potential to achieve this goal by motivating behavioural change in building dwellers and, by consequence, reducing the short and long term environmental impact of buildings. We use the term dweller to denote a person who is occupying a specific space for any non-trivial duration;
OZCHI 2008, December 8-12, 2008, Cairns, QLD, Australia. Copyright the author(s) and CHISIG. Additional copies are available at the ACM Digital Library(http://portal.acm.org/dl.cfm) or can be ordered from CHISIG([email protected]) OZCHI 2008 Proceedings ISBN: 0-9803063-4-5
who has some interest in or control over the energy resources that are consumed in that space at that time. The term dweller implies in our usage an aggregate of any number of terms, namely occupant, resident, tenant, guest, visitor, and so forth.
In particular, we are interested in consumption visualizations—otherwise known as eco-visualizations. We use the acronym “EV” to denote these terms. By EVs, we mean devices that are targeted at revealing energy use in order to promote sustainable behaviours or foster positive attitudes towards sustainable practices. Holmes uses the term eco-visualization to denote novel approaches to displaying “the real time consumption statistics of key environmental resources for the goal of promoting ecological literacy” [16, p. 154]— and the role they might play in persuading building dwellers (commercial or residential) to act more sustainably with respect to their electricity consumption. This notion of EV is clearly related to more general notions of mechanisms of awareness that pervade the HCI literature.
While approaches to reducing consumption of other resources (e.g. water, oil, natural gas, etc.) are important and worthwhile, we focus specifically on electricity, as the majority of EVs to date concentrate on this resource. Additionally, many of the EV projects we will describe have resulted in concrete reduction, however they typically focus on very particular instances or situations. The question is, how might knowledge from previous exemplary EV projects be synthesized and generalized for future applications in diverse environments? What key factors are essential to designing and implementing effective visualizations for particular buildings or use-contexts? And, consequently, how might this knowledge inform our understanding of future HCI and design research with respect to environmental sustainability?
Contributions to the nascent and growing field of EV are at once diverse and context-specific. In what follows, we outline and discuss key qualities and attributes necessary to construct effective EVs. In doing so, we draw upon key exemplary cases of EVs that were implemented and resulted in concrete change. In the remainder of this paper we describe a survey of EVs in terms of the following areas: (i) feedback type, (ii) use-context, and (iii) strategies. We conclude with a discussion of challenges and opportunities for the design of EVs. The ultimate aim of this paper is to contextualize previous exemplary EV designs and implementations in a survey of the field as a means to provide a foundation for practitioners to design new EVs in more varied scales and contexts and for researchers to continue to refine understandings of how effective EVs can be and how
EVs can be made to be more effective.
2. FEEDBACK Feedback is the dynamic means through which information is conveyed to a person who uses a particular visualization device or interface. With respect to the EVs discussed in this paper, feedback is produced from the constant collection and visualization of data relating to varying levels of resource consumption. There are two fundamental aspects which must be considered in the design of any type of consumption feedback. The first concerns the type of data used, while the second concerns the type of visualization used to present the data. We discuss each of these dimensions in turn.
2.1 Data There are a lot of ways to characterize the data and interpretations of data that may be represented in an EV. Rather than enumerate all these many ways, our main purpose here is to be able to characterize EVs in terms of their scale. We are primarily interested in the question of if an EV pertains to a very small scale context of effects, such as a device in a home, or a very large scale context of effects such as the energy consumed by a whole city or even larger entity.
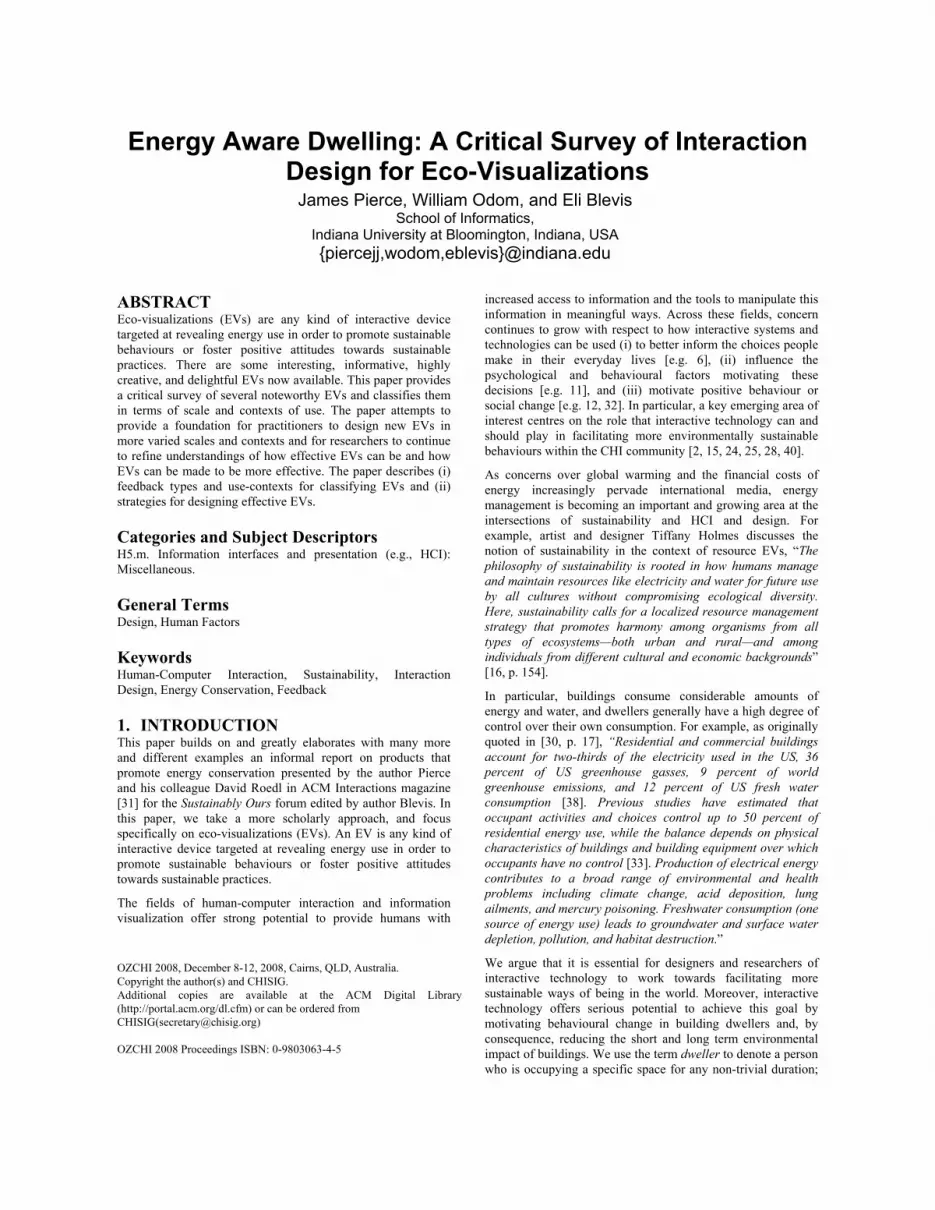
For example the Power-Aware Cord, developed at the Interactive Institute [14], is a redesigned power strip in which the cord is designed to visualize energy, as opposed to hiding it. Energy consumption is visualized through glowing pulses and changes in intensity of light. The Power-Aware Cord is relatively small scale in terms of the data and interpretations of data it represents.
In contrast, the Nuage Vert represents an industrial size EV in the form of a light projected onto the smokestack of a local Helsinki coal-based power station [29]. In this context, increases in wattage consumed by the city’s inhabitants caused the projected visual image to shrink, illustrating a relatively large scale context in terms of the data and interpretations of data it represents. In both examples, we see how the scale significantly affects the type of information that can be communicated and the types of behaviours and interpretations likely to be provoked.
2.2 Visualization We distinguish between two general types of data-visualization, namely, pragmatic visualization and artistic visualization. Traditionally rooted in science, the field of information visualization has increasingly emphasized the importance of art and aesthetics. For example, [22, 23, 37]. Kosara [22, p. 633] uses the concept of the sublime to help distinguish pragmatic visualization from artistic visualization; the latter must "present enough of an enigma to keep an audience interested without being easy to solve", while the former is "designed to remove any sublimity, and instead foster immediate understanding". Viegas and Wattenberg [37, p. 183] contrasts artistic visualization with traditional scientific visualization which is viewed as "a tool to support analytic reasoning." The creators of artistic visualization "recognize the power of visualization to express a point of view. By contrast, traditional analytic visualization tools have sought to minimize distortions, since these may interfere with dispassionate analysis." [37, p. 190]. Artistic visualization thus challenges the notion that
Figure 1. The Power-Aware Cord [35] (left) visualizes the small scale EV denoting electricity entering the device, while the Nuage Vert [29] (right) represents large scale EV denoting the aggregated consumption of an entire city.

visualization is possibly or even is desirably neutral; instead, visualization can and perhaps should be used to persuade as well as analyse.
In the context of energy EV, an example of pragmatic visualization is the Lucid Building Dashboard (figure 3), while an example of a more artistic visualization is Tiffany Holmes' 7000 Oaks and Counting installation (figure 5). The former borrows formal elements from scientific visualization (e.g. line graphs, clear labels) to clearly communicate energy consumption patterns within a building, while the latter uses ambiguous imagery to communicate energy flows within a building with the hope of persuading dwellers to use less. These contrasting perspectives are equally important in the area of EV where clearly communicating information as well as engaging and persuading dwellers may be desirable. The degree to which either (or both) approaches are utilized remains highly dependent on the context.
3. USE-CONTEXT Considering issues related to energy and environmental sustainability receive global media coverage, and energy-consuming products (e.g. computers) populate everyday environments in Western and rapidly growing non-Western settings, it’s not surprising that the contexts in which designers have developed EVs are diverse. We use the term use-context to refer to the environmental and cultural conditions of the intended space in which the visualization is to be implemented. In many cases, EVs aim to encourage certain behaviours at or near the use-context. Here, we discuss two important dimensions to consider when designing and implementing EVs—namely, dweller control and third-party control.
Dweller control refers to the amount of control that a dweller has over the energy consumed within a certain use-context. This is related to the amount and types of power-consuming technology present. Third-party control refers to the amount of control that can be exerted by others (e.g. building managers or owners) over dwellers and the technology implemented within a certain use-context, including technology to support EV. Third-party control also influences cultural and political aspects of the use-context, such as policies or mandates to turn off
lights when not in use. In figure 2 we summarize important use-contexts, plotted according to the dimensions of dweller control and third-party control.
An example use-context with low dweller control, but high third-party control is an office building. Compared with a home, dwellers of an office building typically have less control over electrical devices. Moreover, most behind-the-scenes technologies, such as heating and cooling, are typically automated and not under control of building dwellers, in general. However, the owners and managers of office buildings typically have a higher degree of control over the technology in building and may also encourage or enforce dwellers to conserve energy even if it is not in the dwellers’ immediate interest to do so.
As an example use-context with low dweller control and low third-party control, consider a space in a public building, such as the lobby of a museum. Here, visitors as a specific instance of dwellers have even less control over energy consumption. While building owners do have control over the technology present in the building lobby, we may also consider them to have low control over visitor-dweller behaviour and interactions with technology.
Residential homes are an example of a use-context with high dweller control and low-third party control. Homes typically have many energy consuming products and dwellers typically have a high degree of control over them—these range from small portable devices, to large cooking and cleaning appliances, to technology built into the home, such as lighting and heating and cooling systems. However, third-party control over technology and use within the home is often very limited.
Finally, we have use-contexts such as dormitories and apartment complexes where both dwellers and third-parties have a high degree of control. Similar to residential homes, dormitory residents have a high degree of control over their own energy use. Similar to office buildings, building owners have a high degree of control over the technology present in the building and the types of behaviours encouraged.
Each of these use-contexts presents a unique set of challenges and opportunities with respect to providing consumption feedback and encouraging more sustainable behaviours and attitudes towards energy use. The design goals of a particular EV, and the strategies used to achieve these goals, are highly dependents on the use-context. We discuss such strategies next.
4. STRATEGIES In this section we outline strategies for designing EV. The strategies we present have emerged from our own critical analysis and reflections on numerous diverse EVs—including our own work in this area. Our goal here is to highlight, through
Figure 2. Important use-contexts plotted according to the dimensions of dweller control and third-party control.
Figure 3. The Eco-Eye [10] (left) provides direct feedback on household electrical consumption, while the Wattson [7] (right) additionally provides ambient feedback.
a set of carefully selected exemplars, a range of strategies currently being employed in the design of EVs, suggesting both the breadth of this emerging field and directions for the design and evaluation of future EVs. These strategies include
(i) offering behavioural cues and indicators, (ii) providing tools for analysis,
(iii) creating social incentive to conserve, (iv) connecting behaviour to material impacts of
consumption, (v) encouraging playful engagement and exploration with
energy, (vi) projecting and cultivating sustainable lifestyles and
values, (vii) raising public awareness and facilitating discussion, and
(viii) stimulating critical reflection.
The first two strategies relate to supporting conservation goals by providing clear and useful information or feedback. These visualizations tend to assume that the user already has some motivation to conserve energy (e.g. to save money, or reduce environmental footprint). The third and fourth strategies are focused on creating incentives to conserve, especially in contexts where financial incentives are not present. The final four strategies are focused on more experiential aspects of making consumption visible, ideally helping to create or support conservation goals in the process.
Offering behavioural cues and indicators A common approach to motivating energy conservation is to provide contextual, real-time feedback in the form of simple cues or indicators at or near the point of consumption with the goal of guiding behaviour. A number of commercial products are currently available for residential homes, providing real-time feedback on total household consumption via a numerical display, e.g. the Eco-Eye (figure 3). An alternative to direct numerical feedback is ambient feedback, which uses pre-attentively processed information such as brightness or colour differences in lighting to communicate changes in consumption.
The Wattson is a home energy monitor that integrates both direct and ambient feedback, providing real-time feedback on total energy consumption within the home. Current household electricity consumption is displayed numerically (in watts or Euros) as well via ambient lighting. As described on the designers' website, "When there’s a purple glow, you’re using the average for your home. And when they’re red, you’re using more electricity than usual." [7]. The ambient lighting can thus provide cues indicating that consumption is high and the dweller should turn off appliances. The numerical display provides further information that may help users determine
which appliances are consuming the most energy and should be switched off. Studies have indicated that savings on the order of 10% can be achieved in the home with the use of real-time portable energy displays similar to the The Wattson or Eco-Eye [8, 27].
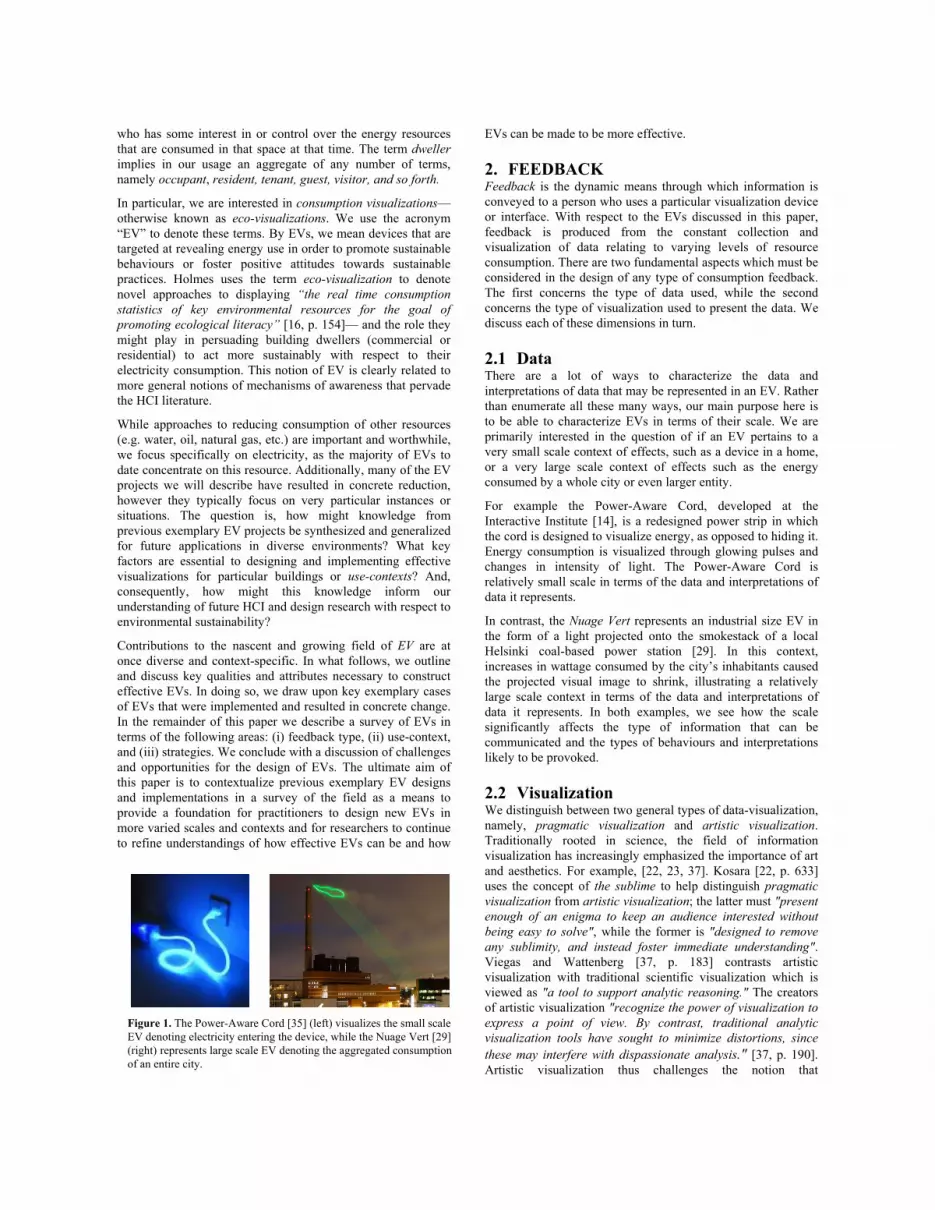
Providing tools for analysis and insight Some systems offer more in depth feedback, allowing users to more deeply explore their consumption patterns. One example is the Lucid Building Dashboard. These dashboards are custom designed and built to be displayed on interactive kiosks in commercial or residential buildings. The displays offer a variety of ways to explore in detail the consumption patterns of an entire building. A similar visualization tool called Holmes (figure 4) is designed specifically for residential use in conjunction with the Wattson. Holmes allows users to view energy use patterns over hours, days, weeks, or months, as well as set target reduction goals to work towards.
Uneo et al. [36] tested an "on-line interactive 'energy-consumption information system' that displays power consumptions of, at most, 18 different appliances, power and city-gas consumption of the whole house and room temperature, for the purpose of motivating energy-saving activities" in 10 residential homes, resulting in 9% reduction in power consumption. However, there is still the issue of incentive—for many, financial or environmental incentives may not be enough to motivate one to conserve or to adopt such a tool in the first place.
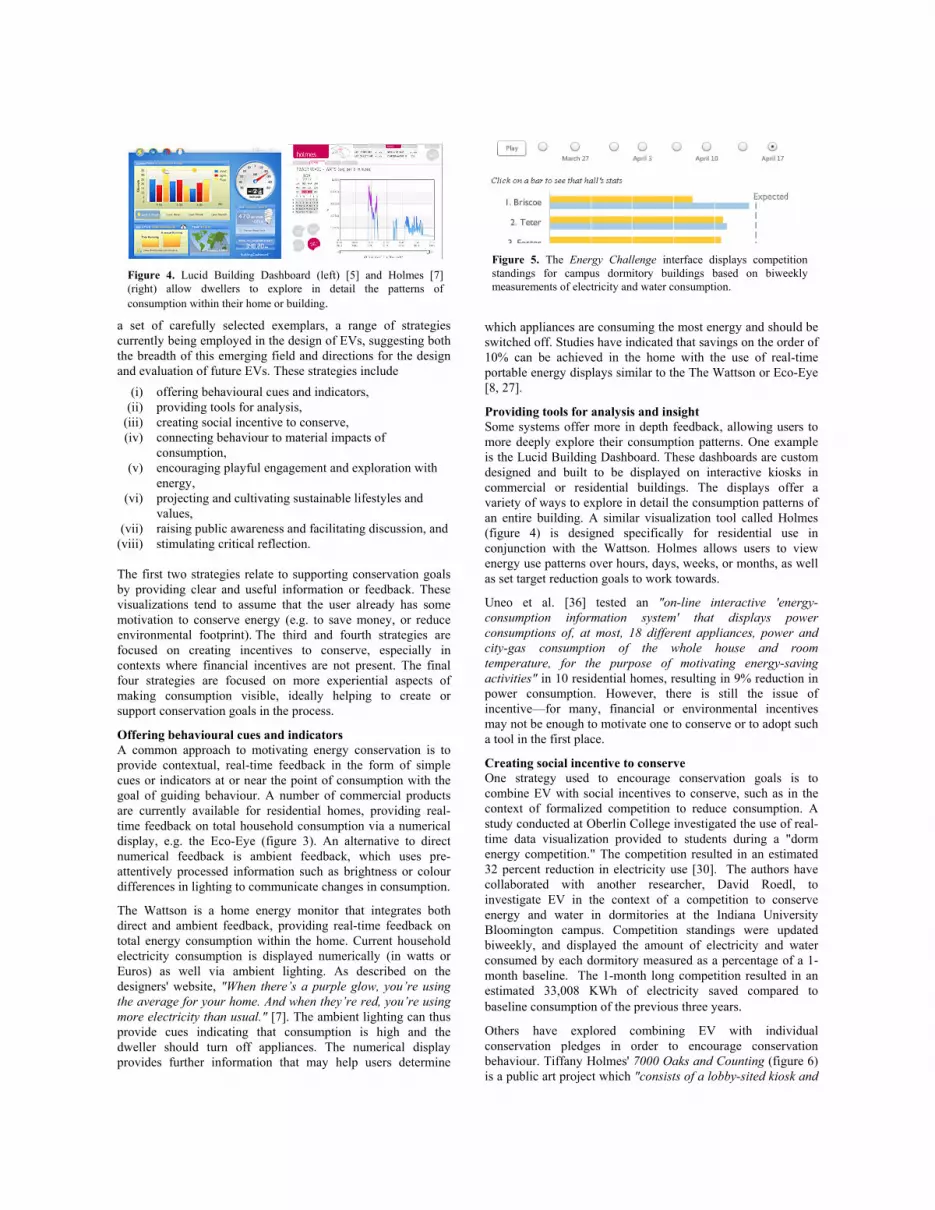
Creating social incentive to conserve One strategy used to encourage conservation goals is to combine EV with social incentives to conserve, such as in the context of formalized competition to reduce consumption. A study conducted at Oberlin College investigated the use of real-time data visualization provided to students during a "dorm energy competition." The competition resulted in an estimated 32 percent reduction in electricity use [30]. The authors have collaborated with another researcher, David Roedl, to investigate EV in the context of a competition to conserve energy and water in dormitories at the Indiana University Bloomington campus. Competition standings were updated biweekly, and displayed the amount of electricity and water consumed by each dormitory measured as a percentage of a 1-month baseline. The 1-month long competition resulted in an estimated 33,008 KWh of electricity saved compared to baseline consumption of the previous three years.
Others have explored combining EV with individual conservation pledges in order to encourage conservation behaviour. Tiffany Holmes' 7000 Oaks and Counting (figure 6) is a public art project which "consists of a lobby-sited kiosk and
Figure 4. Lucid Building Dashboard (left) [5] and Holmes [7] (right) allow dwellers to explore in detail the patterns of consumption within their home or building.
Figure 5. The Energy Challenge interface displays competition standings for campus dormitory buildings based on biweekly measurements of electricity and water consumption.

website that display an animation of dynamic energy loads at the National Center for Supercomputing Applications (NCSA) in Urbana, IL." [16, p. 153] The website component "invites building residents to make individual public commitments to reduce their own carbon footprint. After filling out a web form, the individual’s name is incorporated into the animation sequence and the carbon offset is applied immediately to the building’s total." [16, p. 160]. Holmes notes that this commitment is based on trust, since there is no way to guarantee that users keep their pledge. However, as originally cited by Holmes, studies have demonstrated that making a commitment to conserve can lead to increased reduction in electricity consumption amongst those who pledge [16, 21]. While higher-granularity data may offer the opportunity to provide more meaningful feedback to individuals about their consumption, this project confronts such limitations by soliciting and visualizing individual pledges to conserve. Connecting to material impacts of consumption Often, it is difficult to connect individual actions (e.g. turning off the lights) with the negative consequences of our collective actions (e.g. global warming). Many EVs communicate electricity consumed in terms of environmental figures such as pounds of CO2 emitted or number of trees required to offset these CO2 emissions.
As an alternative to statistical figures, some have experimented with using visual metaphors to forge a connection between consumption and environmental impacts. The 7000 Oaks and Counting project (figure 6) uses an animation of a series of tree images to show the estimated number of trees needed to offset the CO2 emitted during the production of the energy consumed by the building: "One of the key issues in visualizing energy consumption data is the sheer scale of the numbers. … Trees are considerably easier to picture as opposed to…kilowatt hours. The animation brings a little of the outdoors inside: most individuals maintain positive feelings toward trees, particularly species familiar to them." [16, p. 160]. The visualization attempts to communicate numerical statistics in a more meaningful way, creating an emotional connection between the individual and the environmental consequences of electricity consumption. Holmes explicitly acknowledges the deliberate decision to use natural and aesthetic imagery in her visualization as a means to provoke an aesthetic experience in the user.
Encouraging playful engagement and exploration with energy The importance of designing for ludic activities or "activities motivated by curiosity, exploration, and reflection rather than externally defined tasks" has recently been brought to attention
within HCI [13, p. 885]. In the context of energy visualization, the Static! project at the Interactive Institute has developed a research program aimed at developing "a more profound understanding of energy as material in design, including its expressive and aesthetic potential." [1, p. 1]. One example of this project's work is the previously discussed Power-Aware Cord (figure 1), designed to "make the user, to some extent, perceive the light as the actual electricity." [1, p. 12]. While this device does provide behavioural cues—such as indicating devices which are plugged in and consuming energy yet not being used, hence should be unplugged—it is noteworthy in the way it explores the aesthetic potential of energy as a design material. The Power-Aware Cord is not simply visualizing information, it also encourages users to engage physically with energy. This engagement may be for the sole pleasure of becoming involved with energy as a visible and tangible thing, rather than with some conservation or educational purpose. Nonetheless, increased awareness and incentive to conserve may emerge through such playful engagement with the Power-Aware Cord and electrical devices.
Projecting and cultivating sustainable lifestyles and values Many of the visualizations already discussed serve both symbolic and practical functions. For example, the Lucid Building dashboard may provide information that motivates or informs conservation behaviour, but it also communicates that the building owners, managers, or dwellers care about energy conservation. Indeed, a building dashboard is an important way in which buildings that purport to be "green" can show visitors and building dwellers how efficient they are, perhaps even highlighting energy efficient technology that may be less visible, such as solar panels or efficient heating and cooling systems.
An example of a design serving a more purely symbolic function is the Vision Energy Sculpture, a concept for dynamic sculpture which reflects the energy consumption levels in a home or building: "By means of a three step scale symbolizing either no economization, justifiable average consumption or the achievement of the benchmark value, the subject of energy comes visually alive and at the same time encourages society to be more conscious regarding the usage of resources." [4].
The aesthetic form is something the owner would be proud to display, serving as a symbol of sustainable values and lifestyle to others. The dynamic form of the sculpture can serve as a symbol of a personal commitment to conservation. While it may not be particularly useful in informing specific behaviours through detailed feedback, it can function as a persistent reminder to reduce consumption, possibly extending to behaviours outside the immediate use-context.
Figure 7. Vision Energy Sculpture [19] (left) dynamically represents energy consumption levels. The Energy Curtain [35] (right) collects sunlight on its exterior during the day and displays it as glowing patterns on the interior of the curtain at night.
Figure 6. Animation stills from Tiffany Holmes' 7000 Oaks and Counting project, representing high loads (left) and low loads (right).

Facilitating discussion and raising public awareness Some EVs are focused primarily on bringing issues of energy conservation to the forefront of public awareness and discussion. A prime example is the Nuage Vert (described briefly above), an art installation in Helsinki where the energy consumption of the entire city was visualized in the form of a cloud projected with lasers onto the smoke emitted from the city's coal-burning power plant (figure 1). Every night from the 22 to the 29 of February 2008, the emissions were illuminated with the green cloud; the lower the consumption, the larger the illumination projected. An "unplug event" was held on the last day of the installation in which residents were asked to unplug devices to reduce consumption, increasing the size of the "green cloud" projected into the sky. The event succeeded in reducing maximum demand by 800 kVA during the one hour period it was held [29].
The Nuage Vert project demonstrates the potential for EV to bring issues of energy consumption and environmental sustainability to the forefront, and prompt social action. The project also illustrated that aggregated, small granularity data can be effective in persuading people to conserve.
Stimulating critical reflection Recent work in HCI and design has advocated critical approaches to the design of technology which encourages reflection on technology itself, the way it conditions behaviour and the ideological assumptions embedded in it [9, 34]. One exemplar of a critical approach to EV is the Energy Curtain (figure 6) "…a window shade woven from a combination of textile, solar-collection and light-emitting materials… During the day, the shade can be drawn to the extent that people choose to collect sunlight and, during the evening, the collected energy is expressed as a glowing pattern on the inside of the shade.” [35].
However, using the Energy Curtain can actually encourage unsustainable behaviours. We have elsewhere reported that “Closing the curtain during the day will cause the room to darken, possibly requiring the use of artificial lighting. The energy curtain thus forces the user to decide between either using natural light and not being rewarded with the glowing pattern, or using artificial light and being rewarded." [31, p. 7].
Through use, the Energy Curtain can "provoke the realization of how design…renders energy abstract and intangible, and hides the energy costs of our actions" [31, p. 7]. The Energy Curtain may actually encourage energy consumption locally for the purpose of stimulating reflection on how technology itself can encourage consumption.
Critical approaches to EV design can also lead to more pragmatic behavioural and intellectual changes. For example, artist and engineer Natalie Jeremijenko has proposed a power meter that is "accurate, high-tech, and digital, yet as dumb as a brick." [20]. Unlike conventional approaches to power meters aimed at encouraging energy conservation in the home, this meter forces users to estimate how much energy is being consumed before it will display the actual usage: "Let's say you are consuming ten kilowatts. If you say 'Nine' or 'Eleven,' the meter will stay impassively blank. But if you say 'Ten,' the exact electricity consumption will then display. The meter will show you your exact current consumption rate at that moment: say, 10,768 watts." [20].
Ideally, this "dumb" energy meter would both train the user to recognize the patterns of his or her energy consumption and cause a realization that technology is not perfect and responsibility must be taken over an individual's own consumption behaviour. "Because people are good at learning, this device ultimately makes itself obsolete" and can be passed on to a friend or neighbour [20].
5. CHALLENGES AND OPPORTUNITIES The examples we have discussed highlight a number of strategies being used in a variety of contexts and using a variety of feedback-types. However, our critical survey of EVs reveals a number of challenges and opportunities.
5.1 Obtaining and visualizing data A fundamental area of concern with EV is the relationship between data and visualization. If the data available is general and aggregate, at the level of energy consumed by a whole city for example, then it is harder to know what to do to improve sustainable energy practices at the level of individual behaviours and personal energy consuming devices. EVs that provide understandings of individual personal level practices offer opportunities for people to change their individual behaviours. EVs that provide understandings of collective practices have the potential to motivate people to better understand the contributions of their individual behaviours and changes of behaviour. One challenge is to use large scale EVs to raise awareness and motivate behavioural change, while using detailed small scale EVs that inform changes of behaviour on the personal and individual level.
Oftentimes, data pertaining to small scale individual level practices is difficult to obtain. One possibility is to design EVs that visualize data collected voluntarily from dwellers on purpose-constructed web-sites, such as those which solicit individual pledges or conservation goals. Designers may also use other building data (e.g. temperature, air quality, water consumed) in order to create more informative or engaging EVs. Yet another approach is the more “artistic” route, which is characterized by creating EVs that provoke reflection towards individual responsibility, rather than present specific hard data.
5.2 Designing for different use-contexts Another area of concern is how to best apply various strategies and feedback types to different use-contexts. In residential homes, one challenge is that dwellers may not be motivated to acquire or use EVs. Unlike use-contexts with high third-party control, it is difficult to forcefully introduce new technology or policies into peoples' homes. In order to reach populations that do not already have a strong incentive to conserve or to use EVs, it may be necessary to gain a more nuanced understanding of the motivations and values of users. For example, Woodruff et. al [40] present a qualitative study of dwellers who use technology to support environmentally responsible "green" lifestyles. The study finds that motivations clustered into three main areas: counterculture bio-centric activism, American frontier self-reliance and rugged independence, and trend focused utopian optimism. Designers could try to use EVs to better support and cultivate such values within the home. For example, EVs could be used in conjunction with the microgeneration of electricity (e.g. with solar panels) in order to help support values related to self-sufficiency.

Another issue is whether EV in the home will remain useful and relevant over time. The aforementioned study suggests that "persuasive technologies that cleverly pose modest mental challenges and interactive visualization techniques that help users explore the potential outcomes of different actions would be excellent tools for engaging and informing people at different levels of commitment," but also cautions that those users "lost interest over time as they themselves became more competent while the data and interpretative tools remained the same." [40, p. 320]. The authors recommend that "technologies would be more effective if they evolved over time along the same path as the user in order to keep pace with their deepening commitment and understanding." [40, p. 320]. EVs might evolve more useful, complex and nuanced information over time, both for functional and symbolic purposes. An alternative approach is to design EVs as a type of training device that is no longer needed after certain behavioural or intellectual changes have been made, a model suggested by the "dumb" power meter.
An additional challenge particularly relevant to public and domestic use-contexts is designing for experiential and cultural aspects of making energy visible. Designs such as the Power-Aware Cord, Energy Sculpture and the Energy Curtain may be considered examples of a broader trend in third-wave HCI which emphasizes designing for “non-work, non-purposeful, [and] non-rational” uses of technology [3]. Such a perspective is important not only as a means to creating EVs people will adopt and use effectively, but also as ends that will add pleasure and meaning to peoples' lives; helping to transform sustainability itself into a desirable goal. Nonetheless, it is imperative that designers and researchers ensure these approaches ultimately support and motivate conservation, rather than encourage further consumption of energy and materials.
Dormitories, apartments, office buildings and other use-contexts with high third-party control offer strong opportunities to explore competition as an incentive. An alternative approach suggested by Tiffany Holmes' use of pledges is to have EVs support cooperative goals to conserve. Yet another approach is to design EVs that become integrated more long-term within the building environment. One direction to pursue is informative art, which is decorative information visualization that is not immediately recognizable as a data-visualization [17]. Informative art stands midway between artistic and pragmatic visualization since it can easily be read to provide clear information, but only after the user has recognized the display as a data-visualization and learned how to read it [22]. Such an approach may be just what is needed to allow EVs to become an accepted and valued part of everyday life.
5.3 Evaluating EV A final area of concern that must be addressed is the evaluation of EVs. Ideally, an EV should cause measurable reductions in consumption, or otherwise promote more sustainable use of resources. In addition to quantitative evaluations, qualitative evaluations are needed to help further understanding of how EV can affect attitudes, lifestyles and values. Longitudinal studies are also important in determining how behavioural changes and the acceptance of technologies can persist over time.
Also at stake is how we evaluate or judge the experiential and cultural dimensions of EVs. In keeping with third-wave HCI's
emphasis on experience, and artistic visualization's emphasis on art and expression, we should keep in mind that EVs might provide value in addition to that as measured by narrowly construed goals of changing specific behaviours or achieving certain reductions in energy. In this paper, we have provided a framework for classifying EVs more than we have provided a criticism of the relative merits. Such criticism is important, but nonetheless something which we promise in future work.
6. CONCLUSION There are some interesting, informative, highly creative, and delightful EVs now available. We can classify them in terms of scale and contexts of use. Designers with an interest in sustainable interaction design should consider constructing more EVs of various scales and for various contexts as a matter of practice and researchers with an interest in sustainable interaction design need to better understand how effective EVs can be. We have described feedback types and use-contexts for classifying EVs as well as strategies for designing effective EVs, and have given examples of EVs that correspond to each strategy. We conclude by asserting that EVs have great promise as mechanisms of positive behavioural change towards a more sustainable future.
7. ACKNOWLEDGMENTS We gratefully acknowledge the contributions of the reviewers, the designers and researchers involved in the many projects discussed in the paper, and David Roedl for his lead role in the Energy Challenge project.
8. REFERENCES 1. Backlund, S., Gustafsson, A., Gyllenswärd, M., Ilstedt-
Hjelm, S., Mazé, R. & Redström, J. (2006). Static! The Aesthetics of Energy in Everyday Things. In Proc. Design Research Society Wonderground International Conference 2006.
2. Blevis, E. (2007). Sustainable interaction design: invention & disposal, renewal & reuse. In Proc. CHI '07, ACM Press, 503-512.
3. Bødker, S. (2006). When second wave HCI meets third wave challenges. In Proc. of NordiCHI '06, ACM Press, 1-8.
4. BraunPrize 2007. 2007 Finalists, Vision Energy Sculpture. Retrieved July 3, 2008, from http://www.braunprize.com/international/braunprize_406.html
5. Brun, B. (2007). A kilowatt saved is a kilowatt earned. Sustainable Industries magazine. Retrieved July 1, 2008, from http://www.sustainableindustries.com/energy/7240021.html
6. Consolvo, S., Everitt, K., Smith, I., & Landay, J. A. (2006). Design requirements for technologies that encourage physical activity. In Proc. of CHI '06, ACM Press, 457-466.
7. DIY Kyoto. Retrieved July 3, 2008, from http://www.diykyoto.com/wattson/how-wattson-works
8. Dobson, J.K., & J.D.A. Griffin. (1992). Conservation effect of immediate electricity cost feedback on residential consumption behavior. In. Proc. of the ACEEE 1992 Study on Energy Efficiency in Buildings, 33-35.
9. Dunne, A., & Raby. F. (2001). Design Noir: The Secret Life of Electronic Objects. Birkhäuser, Basel, Switzerland.
10. Eco-Eye.com. Retrieved July 3, 2008, from http://www.eco-eye.com/
11. Fogg, B. J. (2002). Persuasive Technology: Using Computers to Change What We Think and Do. Science & Technology Books.
12. Friedman, B., Kahn, P., & Borning, A. (2006). Value sensitive design and information systems. In P. Zhang & D. Galletta (eds.), Human-Computer Interaction and Management Information Systems: Foundations. M.E. Sharpe, New York, 348-372.
13. Gaver, W. W., Bowers, J., Boucher, A., Gellerson, H., Pennington, S., Schmidt, A., Steed, A., Villars, N., & Walker, B. (2004). The drift table: designing for ludic engagement. In Ext. Abs. of CHI '04, ACM Press, 885-900.
14. Gustafsson, A., & Gyllenswärd, M. (2005). The power-aware cord: energy awareness through ambient information display. In Ext. Abs. CHI '05, ACM Press, 1423-1426.
15. Hanks, K., Odom, W., Roedl, D., & Blevis, E. (2008). Sustainable millennials: attitudes towards sustainability and the material effects of interactive technologies. In Proc. CHI '08, ACM Press, 333-342.
16. Holmes, T. G. (2007). Eco-visualization: combining art and technology to reduce energy consumption. In Proc. of the 6th ACM SIGCHI Conference on Creativity & Cognition, ACM Press, 153-162.
17. Holmquist, L. E. & Skog, T. (2003). Informative art: information visualization in everyday environments. In Proc. of GRAPHITE 2003, ACM Press, 229-235.
18. Huang, E. M. & Truong, K. N. (2008). Breaking the disposable technology paradigm: opportunities for sustainable interaction design for mobile phones. In Proc. CHI '08, ACM Press, 323-332.
19. Information Aesthetics (2007). Vision Energy Sculpture http://infosthetics.com/archives/2007/09/ vision_energy_sculpture_braun_prize.html
20. Jeremijenko, N. (2001). A Futureproofed Power Meter. Whole Earth, Summer 2001. Retrieved July 3, 2008, from http://findarticles.com/p/articles/mi_m0GER/is_2001_Summer/ai_76896164
21. Katzev, R., & T. Johnson. Comparing the effects of monetary incentives and foot-in-the-door strategies in promoting residential electricity conservation. (1984). Journal of Applied Social Psychology, 14(1), 12-27.
22. Kosara, R. (2007). Visualization Criticism - The Missing Link Between Information Visualization and Art. In Proc. of the 11th international Conference information Visualization, IEEE Computer Society, 631-636.
23. Lau, A. & Vande Moere, A. (2007). Towards a Model of Information Aesthetics in Information Visualization. In Proc. of the 11th international Conference information Visualization, IEEE Computer Society, 87-92.
24. Mankoff, J. C., Blevis, E., Borning, A., Friedman, B., Fussell, S. R., Hasbrouck, J., Woodruff, A., & Sengers, P.
(2007). Environmental sustainability and interaction. In Ext. Abs. of CHI '07, ACM Press, 2121-2124.
25. Mankoff, J., Matthews, D., Fussell, S. R., & Johnson, M. (2007). Leveraging Social Networks To Motivate Individuals to Reduce their Ecological Footprints. In Proc. HICSS, IEEE Computer Society, 87a.
26. McCalley, L. T., Midden, C. J. H. & Haagdorens, K. (2005). Computing systems for household energy conservation: Consumer response and social ecological considerations. In Proc. of CHI '05 Workshop on Social Implications of Ubiquitous Computing.
27. Mountain, D. (2006). The Impact of Real-Time Feedback on Residential Electricity Consumption: The Hydro One Pilot. Mountain Economic Consulting and Associates Inc., Ontario.
28. Nathan, L. P., Blevis, E., Friedman, B., Hasbrouck, J., & Sengers, P. (2008). Beyond the hype: sustainability & HCI. In Ext. Abs. CHI '08, ACM Press, 2273-2276.
29. Nuage Vert (2008). Nuage Vert Project. Retrieved July 3, 2008, from http://www.pixelache.ac/nuage-blog/
30. Petersen, J. E., Shunturov, V., Janda, K., Platt, G., & Weinberger, K. (2007). Dormitory residents reduce electricity consumption when exposed to real-time visual feedback and incentives. International Journal of Sustainability in Higher Education 8(1), 16-33.
31. Pierce, J. & Roedl, D. (2008). SUSTAINABLY OURS. Changing energy use through design. ACM interactions, 15(4), 6-12.
32. Rosling, H. (2007). Visual technology unveils the beauty of statistics and swaps policy from dissemination to access. Journal of the International Association for Official Statistics, 24(1-2), 103-104.
33. Schipper, L. (1989). Linking lifestyle and energy used: a matter of time?. Annual Review of Energy, 14, 273-320.
34. Sengers, P., Boehner, K., David, S., & Kaye, J. (2005). Reflective design. In Proc. of Critical Computing '05, ACM Press, 49-58.
35. Static! Increasing Energy Awareness. Retrieved July 3, 2008, from http://www.tii.se/static/
36. Ueno, T., Sano, F., Saeki, & O., Tsuji, K. (2006). Effectiveness of an energy-consumption information system on energy savings in residential houses based on monitored data. Applied Energy, 83, 166-183.
37. Viegas, F., & Wattenberg, M. (2007). Artistic Data Visualization: Beyond Visual Analytics. In Proc. of HCII '07, 182-191.
38. Wilson, A. & Yost, P. (2001). Buildings and the environment: the numbers. Environmental Building News 10.
39. Wood, G., & Newborough, M. Dynamic energy-consumption for domestic appliances: Environment, behaviour and design. (2003). Energy and Buildings, 35, 821-841.
40. Woodruff, A., Hasbrouck, J., & Augustin, S. (2008). A bright green perspective on sustainable choices. In Proc. CHI '08, ACM Press, 313-322.


