Embed Size (px)
Citation preview
Energetic Compound False Positives inGround Water Profile Samples
by Jay Clausen, Elizabeth Wessling, and Brad Chirgwin
AbstractThe analytical procedure U.S. EPA SW-846 method 8330 is the predominant technique used for analysis of energetic
compounds in water and soil. The basis for compound identification is nonspecific and for some complex samples may yieldfalse-positive results for energetic compounds. Suspended particulates and drilling fluids are potential interferents intro-duced to ground water profile samples. Profile samples had a higher frequency of false positives relative to monitoring wellsamples. Additionally, the false-positive frequency was lower in samples where no lubricants or greases were used duringdrilling and sampling. Protocol refinements, the inclusion of photodiode array (PDA) spectral analysis, visual inspection ofchromatograms and PDA spectra, and careful manual data evaluation have reduced false-positive detections. A project teaminvestigating ground water with the potential for energetic compounds must have extensive experience with method 8330,knowledge of how to use PDA analysis, and experience in interpreting chromatograms and PDA spectra for the targetcompounds.
IntroductionThe purpose of this paper is to describe effects of dril-
ling materials on field samples analyzed by method 8330(Jenkins et al. 1988)—the predominant technique used foranalysis of energetic compounds in water and soil. TheU.S. Army is beginning to evaluate munition constituentspresent at its installations. To date, only a few military in-stallations have evaluated the presence of energetic com-pounds in ground water in and downgradient of impactranges (Clausen 2005; Jenkins et al. 2005). Therefore, it isimportant to understand the analytical issues potentiallyassociated with characterizing ground water profile andmonitoring well samples. The purpose of ground waterprofiling ‘‘grab samples’’ is to optimize well screen place-ment for monitoring wells in an aquifer and to providescreening-level data of analyte concentrations. Groundwater profile samples are influenced by drilling materialssuch as lubricants and suspended particulates. These inter-ferences sometimes compromise profile samples and yieldfalse positives.
Interference issues first became apparent after sporadicdetections of 1,3-dinitrobenzene (DNB), 1,3,5-trinitroben-zene (TNB), 2-nitrotoluene (2-NT), 3-nitrotoluene (3-NT),4-nitrotoluene (4-NT), picric acid (PA), and pentaerythritoltetranitrate (PETN) were reported in ground water profile
samples collected from a military installation. Later, theaddition of nitroglycerin (NG) as an analyte resulted in an in-creased frequency of detections. The site history indicatedthe energetic compounds octahydro-1,3,5,7-tetranitro-1,3,5,7-tetrazocine (HMX), hexahydro-1,3,5-trinitro-1,3,5-triazine(RDX), 2,4,6-trinitrotoluene (TNT), and amino-dinitrotol-uenes could be expected. Although NG, 2,4-dinitrotoluene(2,4-DNT), and 2,6-dinitrotoluene (2,6-DNT) are constitu-ents of the munitions used at many military facilities,including the military installation studied, their fate andtransport properties suggest they are unlikely to be foundin ground water. Improper evaluation of the analyticalchemistry of water samples collected during the investiga-tion of sites where energetic materials may be present hasthe potential for greatly increasing project costs.
Methods and Materials
DrillingTwo types of drill rigs used for ground water profiling
were a Barber dual-rotary drill rig and a Sonic drill rig.Standard drilling methods were followed. Different greasesevaluated during the drilling and subsequent analytical pro-cesses were Pure Gold�, Well Guard�, and Moly Ultra�.Pure Gold manufactured by CETCO (Arlington Heights,Illinois) contains bentonite clay. Well Guard is a hydrocar-bon free, nonmetallic, vegetable, and synthetic compoundcontaining clay and silica manufactured by Jet Lube
Copyright ª 2007 The Author(s)Journal compilationª 2007National GroundWater Association.
90 Ground Water Monitoring & Remediation 27, no. 3/ Summer 2007/pages 90–101
(Houston, Texas). Moly Ultra is a pharmaceutical gradegrease manufactured by Schaeffer Manufacturing Co. (St.Louis, Missouri) consisting of refined paraffin base oils, alu-minum complex thickeners, pressure additives, rust and oxi-dation inhibitors, and molybdenum disulfide. Grease wasapplied to the threads of the inner drill rods and outer drivecasing, although the outer casing of the Barber drill rig waswelded instead of threaded so grease was not necessary. Alldrill rigs were decontaminated using a high-pressure steamcleaner when they arrived at the site, between each drillinglocation, and before the drill rig left the site. Developmentequipment was also decontaminated between well locationsby steam cleaning.
Monitoring Well Construction and DevelopmentMonitoring wells were constructed with 2.5-inch inside
diameter Schedule 80 polyvinyl chloride having 0.010-inch slots and 10-feet screens. A sand pack consisting of#0 sand was installed around the well screen to a depth2 feet above the top of the well screen, and #00 sand wasused to a depth of at least 4 feet above the top of thescreen to prevent bentonite from infiltrating the coarsersand pack. A bentonite seal at least 2 feet thick was in-stalled on top of the #00 sand. The formation was thenallowed to collapse to fill the remainder of the borehole.Clean sand was added to fill any voids in the boreholeannulus. The top 2 feet of the borehole was grouted witha 95/5% mixture of concrete and bentonite and containedwithin a flush-mount road box to prevent surface contami-nation from migrating along the annulus of the well.
Well development was conducted following standardindustry practices using airlift, inertial, and submersiblepumps. Development consisted of initially using an airliftpump to surge and remove large volumes of water and silt.If the turbidity of the development water did not drop,then the airlift pump was removed and a submersiblepump was installed and pumped at a lower-flow rate. Welldevelopment was considered complete when the field param-eters of pH, specific conductance, temperature, and turbiditystabilized within 10% for three consecutive readings.
Ground Water Sampling
ProfilePrior to sample collection, the Barber rig drill rods and
drive casing were purged with high-pressure (400 psi) air.Ground water samples were collected by lowering a stain-less steel or disposable Teflon� bailer down the inside ofthe drill rod. A check valve at the bottom of the drill rod al-lowed ground water at the desired sampling interval toinfiltrate the drill rod. Grease was typically found on thebailer as it was removed from the inner drill rod duringsampling.
To collect a ground water sample with the Sonic rig,the inner drill rod was removed and a slotted wire-wrappedscreen attached to an inner drill rod was inserted withinthe outer drive casing. The outer drive casing was backedout 5 feet to expose the screen to the aquifer to collecta ground water sample. The annular space between theinner and outer casing was washed out using potable
(chlorinated) water. A purge volume of 1.5 times theamount of water introduced during drilling of the previousinterval was purged. If this volume of water was too greatto be recovered, the sample interval was purged for 1 h,then ground water samples were collected by loweringa packer with an in-line submersible pump mounted ona drill rod down the inside of the outer drive casing. Thepump had a screened drive point attached to the end,which was set at the bottom of the borehole.
Monitoring WellWells were sampled using the industry standard
low-flow sampling technique using either a portable ordedicated stainless steel bladder pump with dedicatedpolyethylene tubing (EPA 1996). Temperature, specificconductance, pH, Eh or oxidation-reduction potential, anddissolved oxygen were measured in the field using a clearflow-through cell. A separate meter was used to monitorturbidity. During well purging, field parameters were moni-tored every 3 to 5 min until stabilization occurred. Whilepurging, the flow-through cell was kept full of water tominimize possible changes in water chemistry upon contactwith the atmosphere. Sample containers were prefilled bythe laboratory with the appropriate amount of preservative.Samples were immediately placed into a cooler with ice forshipment.
AnalyticalAnalysis for energetics was performed using EPA SW-
846 method 8330 (Jenkins et al. 1988), a reverse phasehigh-performance liquid chromatography (HPLC) tech-nique. Chromatography has been used extensively fordetection and quantification of transformation products ofnitroaromatics and nitramines (Walsh 1990). Method 8330provides for either direct injection of water samples intothe instrument or sample extraction followed by injection.Three extraction techniques exist for aqueous samples,including salting out, cartridge solid-phase extraction(SPE), and membrane SPE (Jenkins et al. 1995, 1994). Thisstudy used SPE followed by direct injection, which is thepreferred approach as referenced in the recently updatedmethod 8330B.
Method 8330 uses a chromatographic column to sepa-rate the compounds and an ultraviolet (UV) wavelengthabsorption detector to determine the compounds as theyemerge from the HPLC column. The method specifies theuse of two analytical columns, a ‘‘primary column’’ and‘‘secondary column.’’ The HPLC columns separate thecompounds based on their polarity. Each compound hasa column-specific retention time window during which thecompound of interest will elute, that is, exit the column.Use of two dissimilar analytical column materials providesan increased level of certainty that a specific chemical ispresent.
Once separated on the column, target compounds passthrough an UV/visible spectrophotometer cell that has anopening allowing light of a specific wavelength, 254 nm,to pass through the sample. At this particular wavelength,many organic compounds, including natural organic matterand grease components, absorb some light relative to the
J. Clausen et al./ Ground Water Monitoring & Remediation 27, no. 3: 90–101 91
concentration of the compound in the sample and itsmolecular structure. Due to the nonspecific nature of UVabsorption at 254 nm, positive identification of the targetanalytes can be attained only if retention time comparisonsare made electronically with standard samples. A secondcolumn relying solely on retention time comparisons per-formed by the instrument can often confirm that a peakidentified on the first column is actually a target analyte.
The standard compound list for method 8330 includesHMX, RDX, TNT, 2-amino-4,6-dinitrotoluene (2A-DNT),4-amino-2,6-dinitrotoluene (4A-DNT), 2,4-DNT, 2,6-DNT,TNB, DNB, nitrobenzene (NB), 2-NT, 3-NT, 4-NT, and2,4,6-trinitro-phenylmethylnitramine (tetryl). Proprietarymodifications were made to method 8330 for this study inorder to include the following additional analytes: NG, PA,PETN, 2,4-diamino-6-nitrotoluene (2,4-DANT), and 2,6-diamino-4-nitrotoluene (2,6-DANT). Other modificationsincluded adjustment of the mobile phase to optimize sepa-ration of the expanded analyte list and NG, which is notparticularly suitable for analysis by this method. Presently,SW-846 method 8332 is available for the analysis of NG;however, it is not widely used by environmental laborato-ries since it is a single analyte method.
Chromatogram AssessmentMethod 8330 is sensitive to nontarget organic com-
pounds present in the sample extract. Laboratory interfer-ents may come from solvents, reagents, glassware, andother sample processing hardware. Sampling interferentsmay come from field materials or reagents. These interfer-ents will occasionally yield complex HPLC chromato-grams with numerous peaks. When multiple interferencesexist in a sample extract, it is possible for a target com-pound to be masked by one interference peak on the pri-mary column and confirmed on the second analyticalcolumn by a different interference peak. Peak matchingcan become difficult when many peaks are present and thebases of the peaks overlap or are distorted. If the interfer-ence is a broad base chromatographically unresolved masson both analytical columns, the chromatograms should beflagged. When a broad base is present in the baseline anda target compound is present, it would be evident as apeak on top of the baseline and reintegration is necessary.
Retention times can change slightly after installation ofa new column or if changes are made to the analytical pro-cedures. For this reason, retention time windows are deter-mined for all compounds on each HPLC column each timea new calibration curve is acquired. The laboratory also re-views the data for surrogate retention time shifts in eachsample to see if further adjustments of retention time win-dows due to sample matrix effects are necessary. Thisapproach reduces the reporting of false negatives.
As noted previously, chromatographic analysis bymethod 8330 is susceptible to interferences for some groundwater samples, especially profile samples. Despite thislimitation, there are two major advantages of HPLC overother methods such as gas chromatography/electron cap-ture detector (GC/ECD). First, it is the most commonlyused energetic analytical method by commercial laborato-ries, due in large part to its ruggedness. Second, thermal
degradation of energetic compounds, particularly HMX, isnot an issue as it is for the GC/ECD method (Walsh andRanney 1999). Due to the number of ground water samplesexhibiting many peaks on the primary column, the photodi-ode array (PDA) was added as a method enhancement.
PDA AssessmentPDA is an instrument option on the UV/visible spectro-
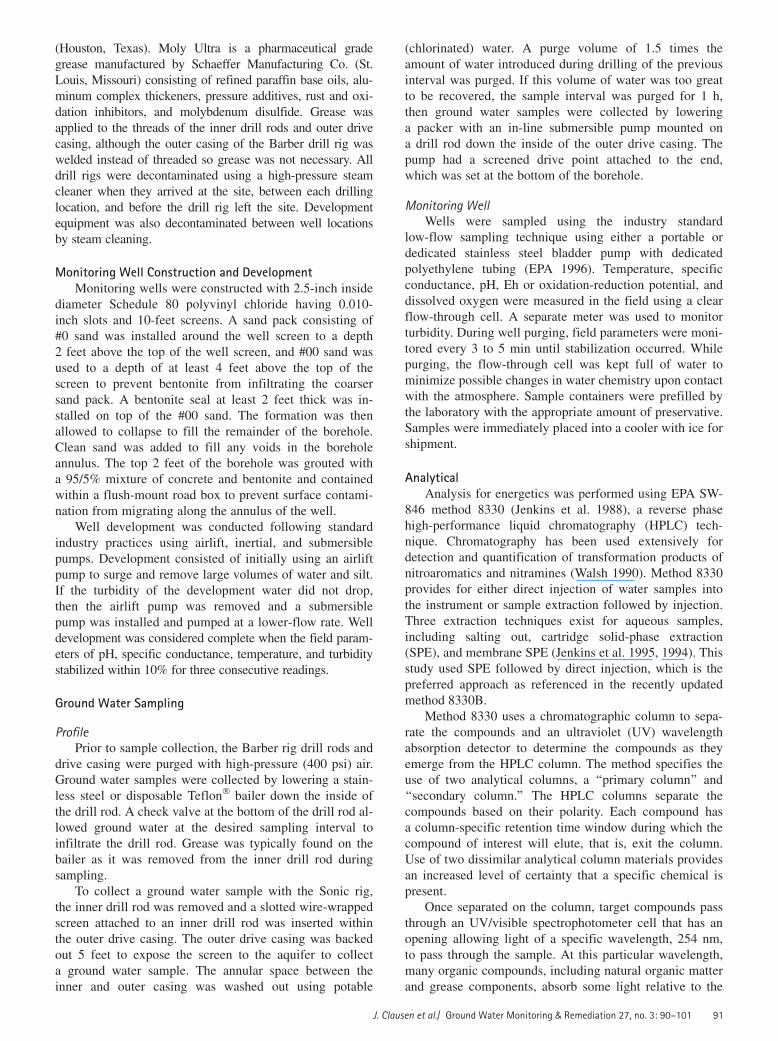
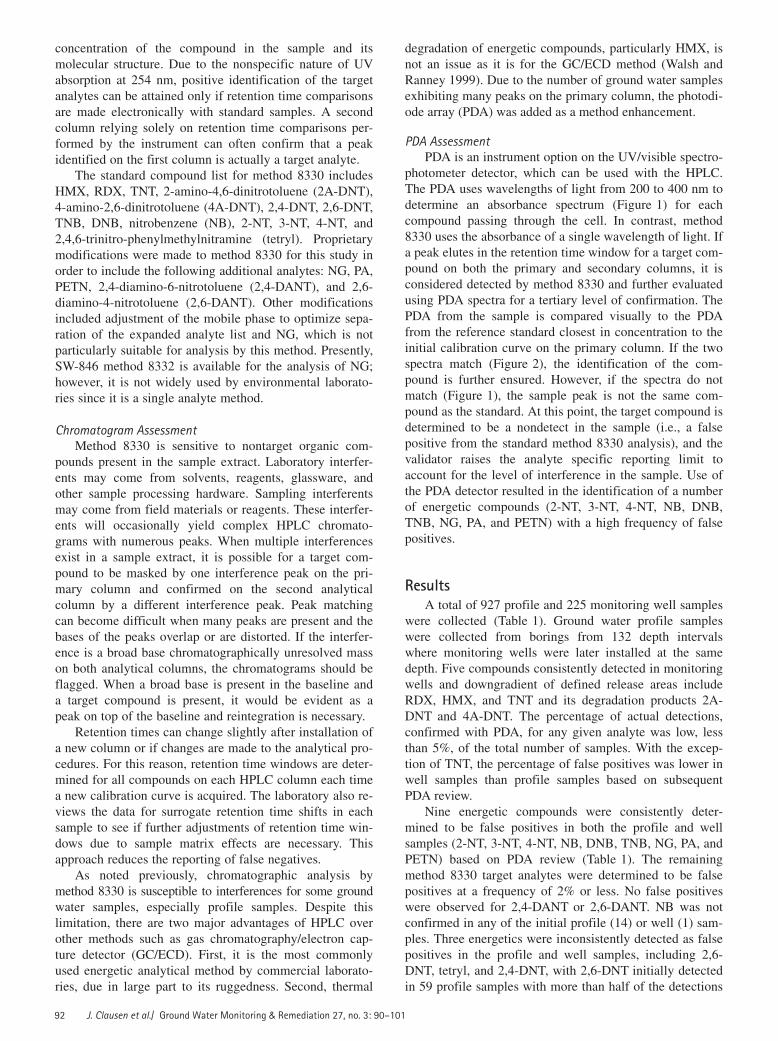
photometer detector, which can be used with the HPLC.The PDA uses wavelengths of light from 200 to 400 nm todetermine an absorbance spectrum (Figure 1) for eachcompound passing through the cell. In contrast, method8330 uses the absorbance of a single wavelength of light. Ifa peak elutes in the retention time window for a target com-pound on both the primary and secondary columns, it isconsidered detected by method 8330 and further evaluatedusing PDA spectra for a tertiary level of confirmation. ThePDA from the sample is compared visually to the PDAfrom the reference standard closest in concentration to theinitial calibration curve on the primary column. If the twospectra match (Figure 2), the identification of the com-pound is further ensured. However, if the spectra do notmatch (Figure 1), the sample peak is not the same com-pound as the standard. At this point, the target compound isdetermined to be a nondetect in the sample (i.e., a falsepositive from the standard method 8330 analysis), and thevalidator raises the analyte specific reporting limit toaccount for the level of interference in the sample. Use ofthe PDA detector resulted in the identification of a numberof energetic compounds (2-NT, 3-NT, 4-NT, NB, DNB,TNB, NG, PA, and PETN) with a high frequency of falsepositives.
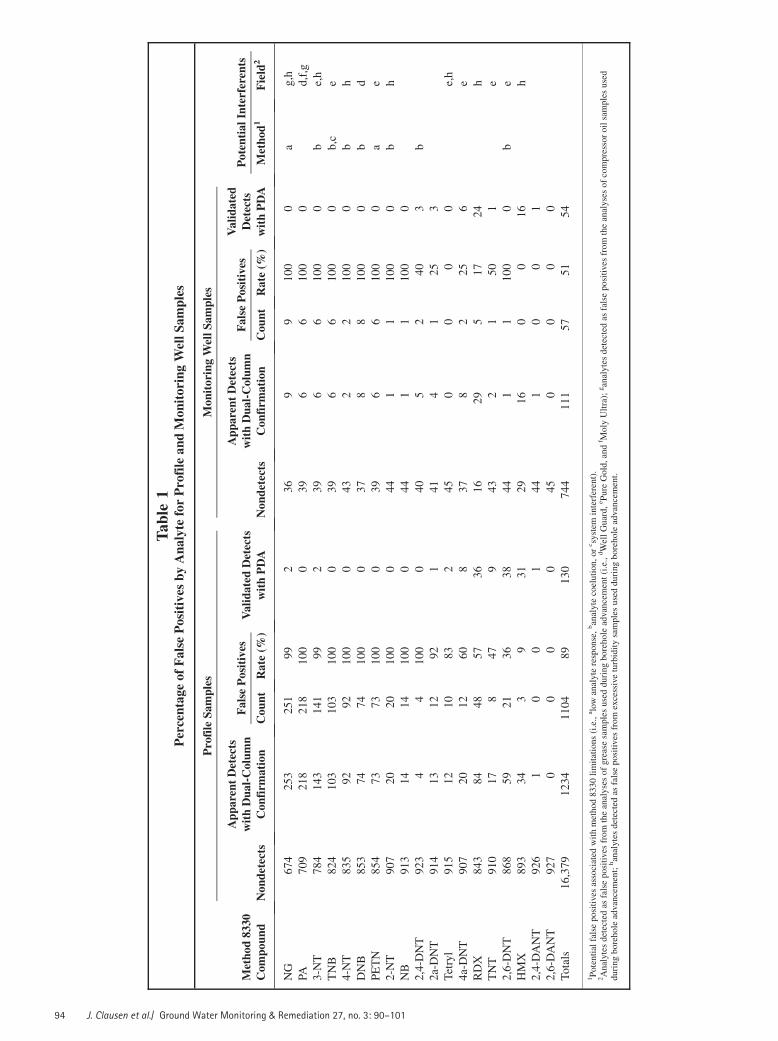
ResultsA total of 927 profile and 225 monitoring well samples
were collected (Table 1). Ground water profile sampleswere collected from borings from 132 depth intervalswhere monitoring wells were later installed at the samedepth. Five compounds consistently detected in monitoringwells and downgradient of defined release areas includeRDX, HMX, and TNT and its degradation products 2A-DNT and 4A-DNT. The percentage of actual detections,confirmed with PDA, for any given analyte was low, lessthan 5%, of the total number of samples. With the excep-tion of TNT, the percentage of false positives was lower inwell samples than profile samples based on subsequentPDA review.
Nine energetic compounds were consistently deter-mined to be false positives in both the profile and wellsamples (2-NT, 3-NT, 4-NT, NB, DNB, TNB, NG, PA, andPETN) based on PDA review (Table 1). The remainingmethod 8330 target analytes were determined to be falsepositives at a frequency of 2% or less. No false positiveswere observed for 2,4-DANT or 2,6-DANT. NB was notconfirmed in any of the initial profile (14) or well (1) sam-ples. Three energetics were inconsistently detected as falsepositives in the profile and well samples, including 2,6-DNT, tetryl, and 2,4-DNT, with 2,6-DNT initially detectedin 59 profile samples with more than half of the detections
J. Clausen et al./ Ground Water Monitoring & Remediation 27, no. 3: 90–10192
confirmed by PDA. Conversely, the only detection of 2,6-DNT in a well sample was determined to be a false posi-tive. The increased number of 2,6-DNT detects in profilesamples (59), as compared to well samples (1), suggesteda field interferent was introduced either during drilling orsampling.
The compound 2,4-DNT was infrequently detected inprofile (4) and well (5) samples. Each of the four profiledetections were determined to be false positives, whereasthree of the five well detections were confirmed with the
PDA. The compound 2,6-DANT was not detected in anyprofile or well samples, whereas 2,4-DANT was confirmedpresent in one profile sample and one well sample. Thetwo confirmed detections, however, did not occur at thesame location and were not replicated during subsequentsampling efforts, suggesting these were also false positives.
Ground Water ProfilePDA spectral review indicated 89% of the apparent
energetic detections in the profile samples were false
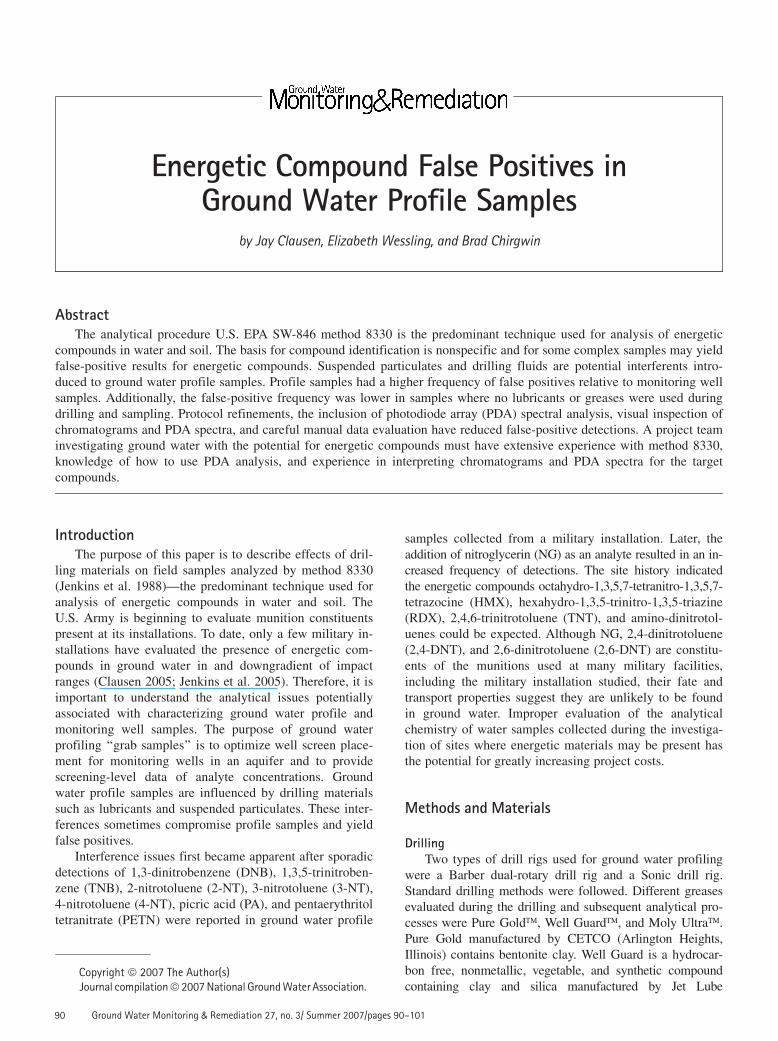
Figure 1. PDA trinitrobenze spectra for a method blank sample.
Figure 2. Example of a PDA spectral match for RDX.
J. Clausen et al./ Ground Water Monitoring & Remediation 27, no. 3: 90–101 93
Table
1PercentageofFalsePositives
byAnalyte
forProfileandMonitoringWellSamples
Method8330
Compound
ProfileSamples
MonitoringWellSamples
Nondetects
ApparentDetects
withDual-Column
Confirm
ation
FalsePositives
ValidatedDetects
withPDA
Nondetects
ApparentDetects
withDual-Column
Confirm
ation
FalsePositives
Validated
Detects
withPDA
PotentialInterferents
Count
Rate
(%)
Count
Rate
(%)
Method1
Field
2
NG
674
253
251
99
236
99
100
0a
g,h
PA709
218
218
100
039
66
100
0d,f,g
3-N
T784
143
141
99
239
66
100
0b
e,h
TNB
824
103
103
100
039
66
100
0b,c
e4-N
T835
92
92
100
043
22
100
0b
hDNB
853
74
74
100
037
88
100
0b
dPETN
854
73
73
100
039
66
100
0a
e2-N
T907
20
20
100
044
11
100
0b
hNB
913
14
14
100
044
11
100
02,4-D
NT
923
44
100
040
52
40
3b
2a-DNT
914
13
12
92
141
41
25
3Tetryl
915
12
10
83
245
00
00
e,h
4a-DNT
907
20
12
60
837
82
25
6e
RDX
843
84
48
57
36
16
29
517
24
hTNT
910
17
847
943
21
50
1e
2,6-D
NT
868
59
21
36
38
44
11
100
0b
eHMX
893
34
39
31
29
16
00
16
h2,4-D
ANT
926
10
01
44
10
01
2,6-D
ANT
927
00
00
45
00
00
Totals
16,379
1234
1104
89
130
744
111
57
51
54
1Potentialfalsepositivesassociated
withmethod8330limitations(i.e.,
alowanalyteresponse,banalytecoelution,orcsystem
interferent).
2Analytesdetectedas
falsepositivesfrom
theanalysesofgreasesamplesusedduringboreholeadvancement(i.e.,
dWellGuard,ePure
Gold,and
f Moly
Ultra);
ganalytesdetectedas
falsepositivesfrom
theanalysesofcompressoroilsamplesused
duringboreholeadvancement;
hanalytesdetectedas
falsepositives
from
excessiveturbiditysamplesusedduringboreholeadvancement.
J. Clausen et al./ Ground Water Monitoring & Remediation 27, no. 3: 90–10194
positives (Table 1). For 10 of the analytes (NG, PA, PETN,TNB, DNB, NB, 2-NT, 3-NT, 4-NT, and 2,4-DNT), the rateof false-positive detections exceeded 99%. Two othercompounds had a high number of false positives, including2A-DNT (92%) and tetryl (83%). Four other compoundswere determined to be false positives nearly half of thetime: 4A-DNT (60%), RDX (57%), TNT (47%), and 2,6-DNT(36%). HMX had one of the lowest false-positive rates at9%. Two remaining compounds 2,4-DANT and 2,6-DANTwere not detected in the 927 profile samples collected withthe single exception of one detection of 2,4-DANT con-firmed by PDA spectral review.
Monitoring WellApproximately half (51%) of the initial energetic de-
tections in monitoring well samples were determined to befalse positives based on PDA spectral review (Table 1).Ten of the target analytes initially ‘‘detected’’ were notconfirmed in any of the well samples, including NG, PA,PETN, TNB, DNB, NB, 2-NT, 3-NT, 4-NT, and 2,6-DNT.Nine of these false positives are the same as those listedabove for the profile samples. One or more false positiveswere evident in 19 of the 45 well samples. These ‘‘apparentdetections’’ were determined to be false positives after PDAreview. Validated results indicate 29 wells with energeticdetections. Energetic compounds consistently detected inthe monitoring wells were HMX, RDX, TNT, 2A-DNT,4A-DNT, and 2,4-DNT.
DiscussionDetections of the energetic compounds HMX, RDX,
and TNT are consistent with the munitions used and theirassociated constituents. In addition, two other energeticsobserved, 2A-DNT and 4A-DNT, are transformation prod-ucts of TNT. In contrast, the apparent detections of PA,PETN, NB, 2-NT, 3-NT, and 4-NT are inconsistent withthe constituents present in the munitions used at the siteand have not been observed at other military ranges stud-ied (Jenkins et al. 2005; Pennington et al. 2005).
Hexahydro-1,3,5-Trinitro-1,3,5-TriazineOf the 225 monitoring wells where profile samples
were collected, RDX was detected 61 times. A statisticalevaluation using the Pearson Correlation technique com-paring ground water profile and monitoring well resultsindicated no statistical difference, that is, correlation coef-ficient of 0.986 at a level of significance p ¼ .0001.
2,6-DinitrotolueneIn contrast to RDX, agreement is poor between ground
water profile and well results for 2,6-DNT. The energeticcompound 2,6-DNT detected in 26 profile samples wasnot detected in any of the wells. A discussion with the ana-lyst and data validation reviewer indicates the chromato-grams for a number of ground water profile samples with2,6-DNT detections were not definitive, and there wassome uncertainty in the analysis of the PDA spectra. Inthese circumstances, the data validator left the question-able detects for the hydrogeologist to interpret in context
with other site data. The locations of the 2,6-DNT detec-tions are in an unlikely area of the impact range fora source and are hydrogeologically inconsistent; that is,the depth of the detections suggests they correspond toa 50-year-old release or greater. Given the lack of confir-mation of the profile results with well samples and incon-sistencies with known fate and transport properties, it issuspected the 2,6-DNT profile detections represent falsepositives.
Low Response Compounds (PETN and NG)As described earlier, method 8330 modifications in-
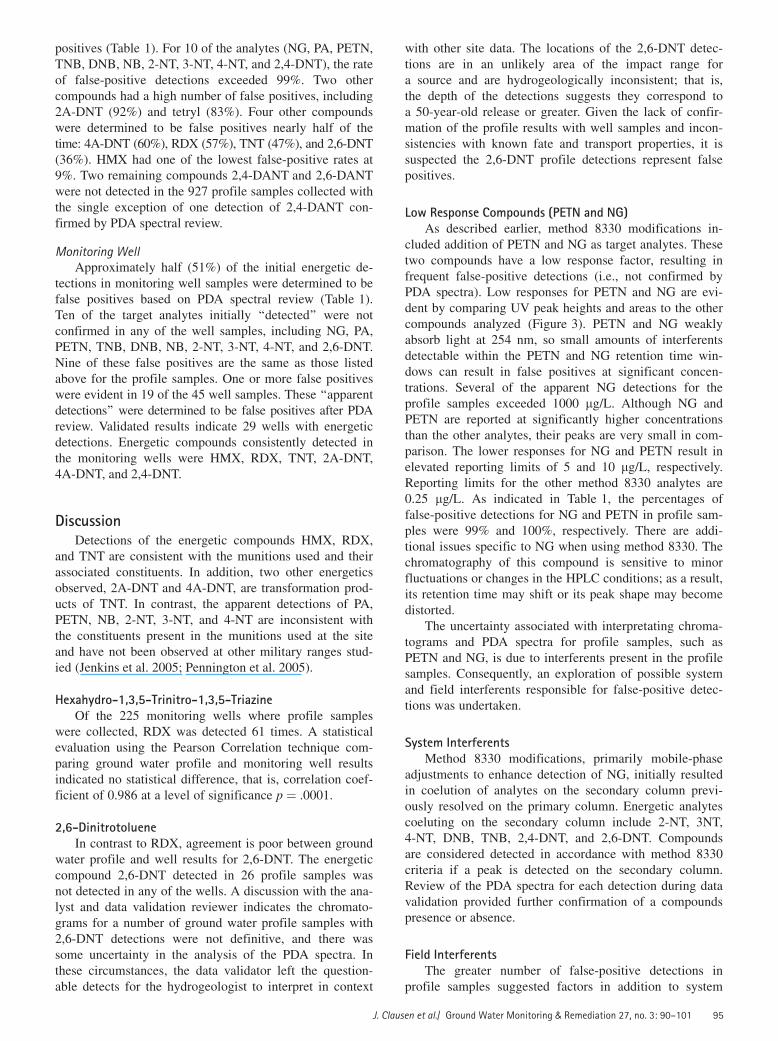
cluded addition of PETN and NG as target analytes. Thesetwo compounds have a low response factor, resulting infrequent false-positive detections (i.e., not confirmed byPDA spectra). Low responses for PETN and NG are evi-dent by comparing UV peak heights and areas to the othercompounds analyzed (Figure 3). PETN and NG weaklyabsorb light at 254 nm, so small amounts of interferentsdetectable within the PETN and NG retention time win-dows can result in false positives at significant concen-trations. Several of the apparent NG detections for theprofile samples exceeded 1000 lg/L. Although NG andPETN are reported at significantly higher concentrationsthan the other analytes, their peaks are very small in com-parison. The lower responses for NG and PETN result inelevated reporting limits of 5 and 10 lg/L, respectively.Reporting limits for the other method 8330 analytes are0.25 lg/L. As indicated in Table 1, the percentages offalse-positive detections for NG and PETN in profile sam-ples were 99% and 100%, respectively. There are addi-tional issues specific to NG when using method 8330. Thechromatography of this compound is sensitive to minorfluctuations or changes in the HPLC conditions; as a result,its retention time may shift or its peak shape may becomedistorted.
The uncertainty associated with interpretating chroma-tograms and PDA spectra for profile samples, such asPETN and NG, is due to interferents present in the profilesamples. Consequently, an exploration of possible systemand field interferents responsible for false-positive detec-tions was undertaken.
System InterferentsMethod 8330 modifications, primarily mobile-phase
adjustments to enhance detection of NG, initially resultedin coelution of analytes on the secondary column previ-ously resolved on the primary column. Energetic analytescoeluting on the secondary column include 2-NT, 3NT,4-NT, DNB, TNB, 2,4-DNT, and 2,6-DNT. Compoundsare considered detected in accordance with method 8330criteria if a peak is detected on the secondary column.Review of the PDA spectra for each detection during datavalidation provided further confirmation of a compoundspresence or absence.
Field InterferentsThe greater number of false-positive detections in
profile samples suggested factors in addition to system
J. Clausen et al./ Ground Water Monitoring & Remediation 27, no. 3: 90–101 95
interferents were involved. Potential field interferents sus-pected included drilling grease, compressor oil, and sus-pended particulate matter in the sample.
GreaseReview of the Material Safety Data Sheets for the dril-
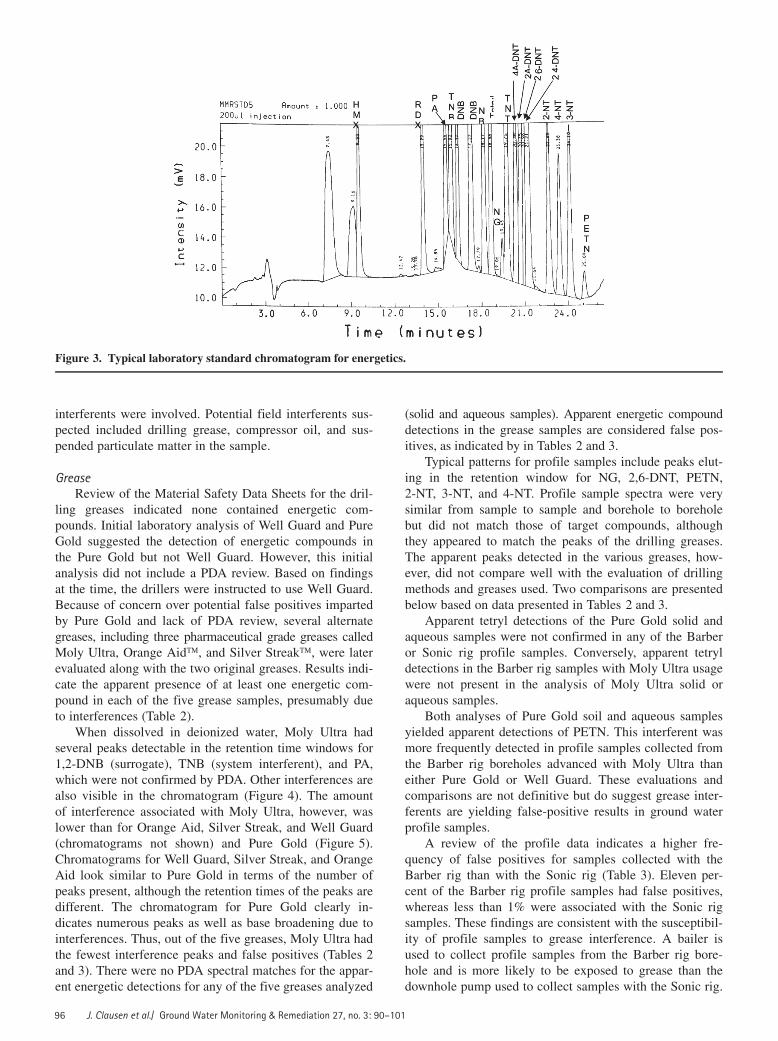
ling greases indicated none contained energetic com-pounds. Initial laboratory analysis of Well Guard and PureGold suggested the detection of energetic compounds inthe Pure Gold but not Well Guard. However, this initialanalysis did not include a PDA review. Based on findingsat the time, the drillers were instructed to use Well Guard.Because of concern over potential false positives impartedby Pure Gold and lack of PDA review, several alternategreases, including three pharmaceutical grade greases calledMoly Ultra, Orange Aid�, and Silver Streak�, were laterevaluated along with the two original greases. Results indi-cate the apparent presence of at least one energetic com-pound in each of the five grease samples, presumably dueto interferences (Table 2).
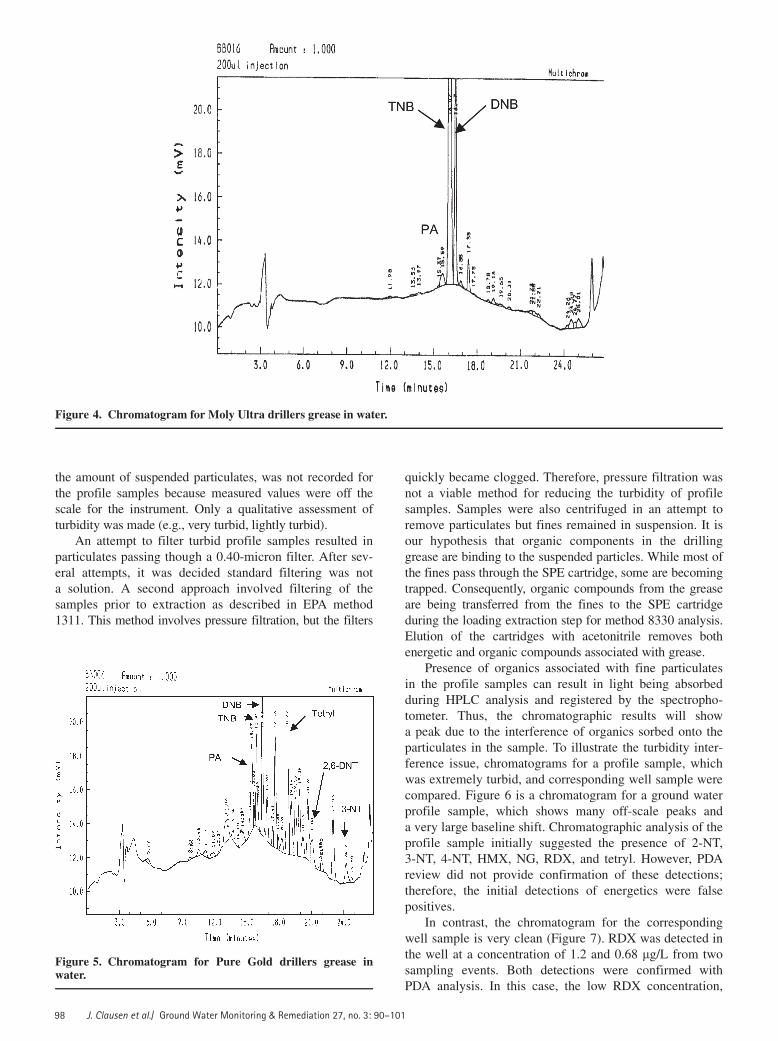
When dissolved in deionized water, Moly Ultra hadseveral peaks detectable in the retention time windows for1,2-DNB (surrogate), TNB (system interferent), and PA,which were not confirmed by PDA. Other interferences arealso visible in the chromatogram (Figure 4). The amountof interference associated with Moly Ultra, however, waslower than for Orange Aid, Silver Streak, and Well Guard(chromatograms not shown) and Pure Gold (Figure 5).Chromatograms for Well Guard, Silver Streak, and OrangeAid look similar to Pure Gold in terms of the number ofpeaks present, although the retention times of the peaks aredifferent. The chromatogram for Pure Gold clearly in-dicates numerous peaks as well as base broadening due tointerferences. Thus, out of the five greases, Moly Ultra hadthe fewest interference peaks and false positives (Tables 2and 3). There were no PDA spectral matches for the appar-ent energetic detections for any of the five greases analyzed
(solid and aqueous samples). Apparent energetic compounddetections in the grease samples are considered false pos-itives, as indicated by in Tables 2 and 3.
Typical patterns for profile samples include peaks elut-ing in the retention window for NG, 2,6-DNT, PETN,2-NT, 3-NT, and 4-NT. Profile sample spectra were verysimilar from sample to sample and borehole to boreholebut did not match those of target compounds, althoughthey appeared to match the peaks of the drilling greases.The apparent peaks detected in the various greases, how-ever, did not compare well with the evaluation of drillingmethods and greases used. Two comparisons are presentedbelow based on data presented in Tables 2 and 3.
Apparent tetryl detections of the Pure Gold solid andaqueous samples were not confirmed in any of the Barberor Sonic rig profile samples. Conversely, apparent tetryldetections in the Barber rig samples with Moly Ultra usagewere not present in the analysis of Moly Ultra solid oraqueous samples.
Both analyses of Pure Gold soil and aqueous samplesyielded apparent detections of PETN. This interferent wasmore frequently detected in profile samples collected fromthe Barber rig boreholes advanced with Moly Ultra thaneither Pure Gold or Well Guard. These evaluations andcomparisons are not definitive but do suggest grease inter-ferents are yielding false-positive results in ground waterprofile samples.
A review of the profile data indicates a higher fre-quency of false positives for samples collected with theBarber rig than with the Sonic rig (Table 3). Eleven per-cent of the Barber rig profile samples had false positives,whereas less than 1% were associated with the Sonic rigsamples. These findings are consistent with the susceptibil-ity of profile samples to grease interference. A bailer isused to collect profile samples from the Barber rig bore-hole and is more likely to be exposed to grease than thedownhole pump used to collect samples with the Sonic rig.
Figure 3. Typical laboratory standard chromatogram for energetics.
J. Clausen et al./ Ground Water Monitoring & Remediation 27, no. 3: 90–10196
In addition, compressor oil is used with the Barber rig andis another potential source of interferents.
Compressor OilTwo different types of compressor oil were used with
the Barber rig. The Barber rig involves a dual-wall drillingsystem with two drilling pipes. Air was blown downbetween the inner and outer casings with the drilling headlocated at the bottom of the center pipe and some air waslost to the aquifer formation in this process. Each of thecompressor oils consisted of multiple organic compounds.When the compressor oils were extracted by the proce-dures specified by method 8330, organic compounds wereextracted and appeared as peaks within the retention timewindows on the primary column for NG and PA. However,later, PDA spectra review (not presented) demonstrated theapparent NG and PA detections were false positives.
One interesting observation involves drive-point sam-ples collected during this study. These samples were col-lected with a Geoprobe� sampling device, which did notrequire use of grease for lubricating the threads of the
drilling pipe or compressor oils for the sampling equip-ment; that is, samples were collected with a bailer. Thenumber of false positives declined from the 17 analyteslisted in Table 3 to three (TNB ¼ 5, NG ¼ 8, and PA ¼ 4).The absence of grease and compressor oil for drilling andsampling with the Geoprobe suggests other factors maycontribute to the generation of false positives listed inTable 3.
Suspended ParticulatesThe overall rate of false-positive detections declined
from 89% in the profile samples to 51% in the well samples(Table 3). More specifically, the rate of false-positive de-tections for RDX was much lower in the well samples (17%)than in the profile samples (57%) and may be attributed tosuspended particulates. Profile samples often had so muchsuspended material that it would take several days for theparticulates to settle. In some cases, as much as three quar-ters of the profile sample consisted of fine suspended sedi-ment. In contrast, the monitoring well samples often showedno visible suspended particulates. Turbidity, a measure of
Table 2Energetic Sample Quality Assurance/Quality Control Results
Material Media Analyzed ID Analyte Detecteda
Well Guard Grease Solid grease DG01-S None detectedDGS003 PA ¼ 820 lg/kg, DNB ¼ 11J lg/kg
Water in contact with solid grease DG01-W None detectedDGW003 PA ¼ 4.2 lg/L
Pure Gold Grease Solid grease DG02-S 4A-DNT¼ 310 lg/kg, PETN¼ 20,000 lg/kg,Tetryl ¼ 3600 lg/kg
DGS002 PETN¼ 17,000 lg/kg, Tetryl¼ 2200 lg/kgWater in contact with solid grease DG-02W TNT ¼ 0.82 lg/L, PETN ¼ 17 lg/L
DGW002 TNB ¼ 1.3 lg/L, Tetryl ¼ 7.4 lg/L,2,6-DNT ¼ 1.1 lg/L, 3-NT ¼ 1.1 lg/L
Moly Ultra Grease Solid grease DGS006 PA ¼ 0.4 lg/kgWater in contact with solid grease DGW006 None detected
Orange Aid Grease Solid grease DGS004 PETN ¼ 14,000 lg/kgWater in contact with solid grease DGW004 None detected
Silver Streak Grease Solid grease DGS005 NG ¼ 18,000 lg/kg, 2A-DNT ¼ 440 lg/kg,4A-DNT ¼ 230 lg/kg
Water in contact with solid grease DGW005 NG ¼ 150 lg/L, 2A-DNT ¼ 3 lg/L,4A-DNT ¼ 2 lg/L, DNB ¼ 0.5 lg/L,PETN ¼ 22 lg/L
FB of DI Water Aqueous DW0105 None detectedFB of DI Water Aqueous WL12XF None detectedFB of DI Water Aqueous WC9EXF None detectedFB of DI Water Aqueous WL28XF None detectedER—electrical tape Aqueous G47DCE None detectedER—electrical tape Aqueous G52DKE None detectedER—electrical tape Aqueous G51DEE None detectedER—electrical tape Aqueous G51DME None detectedER—electrical tape Aqueous G51DQE None detectedDrillers Sand Aqueous SANDDP None detectedDrillers Source Water Aqueous SW0115 None detected
Notes: DI ¼ deionized water; FB ¼ field blank; ER ¼ equipment rinseate.aAll apparent analyte detections were determined to be a false positive after PDA spectral analysis review.
J. Clausen et al./ Ground Water Monitoring & Remediation 27, no. 3: 90–101 97
the amount of suspended particulates, was not recorded forthe profile samples because measured values were off thescale for the instrument. Only a qualitative assessment ofturbidity was made (e.g., very turbid, lightly turbid).
An attempt to filter turbid profile samples resulted inparticulates passing though a 0.40-micron filter. After sev-eral attempts, it was decided standard filtering was nota solution. A second approach involved filtering of thesamples prior to extraction as described in EPA method1311. This method involves pressure filtration, but the filters
quickly became clogged. Therefore, pressure filtration wasnot a viable method for reducing the turbidity of profilesamples. Samples were also centrifuged in an attempt toremove particulates but fines remained in suspension. It isour hypothesis that organic components in the drillinggrease are binding to the suspended particles. While most ofthe fines pass through the SPE cartridge, some are becomingtrapped. Consequently, organic compounds from the greaseare being transferred from the fines to the SPE cartridgeduring the loading extraction step for method 8330 analysis.Elution of the cartridges with acetonitrile removes bothenergetic and organic compounds associated with grease.
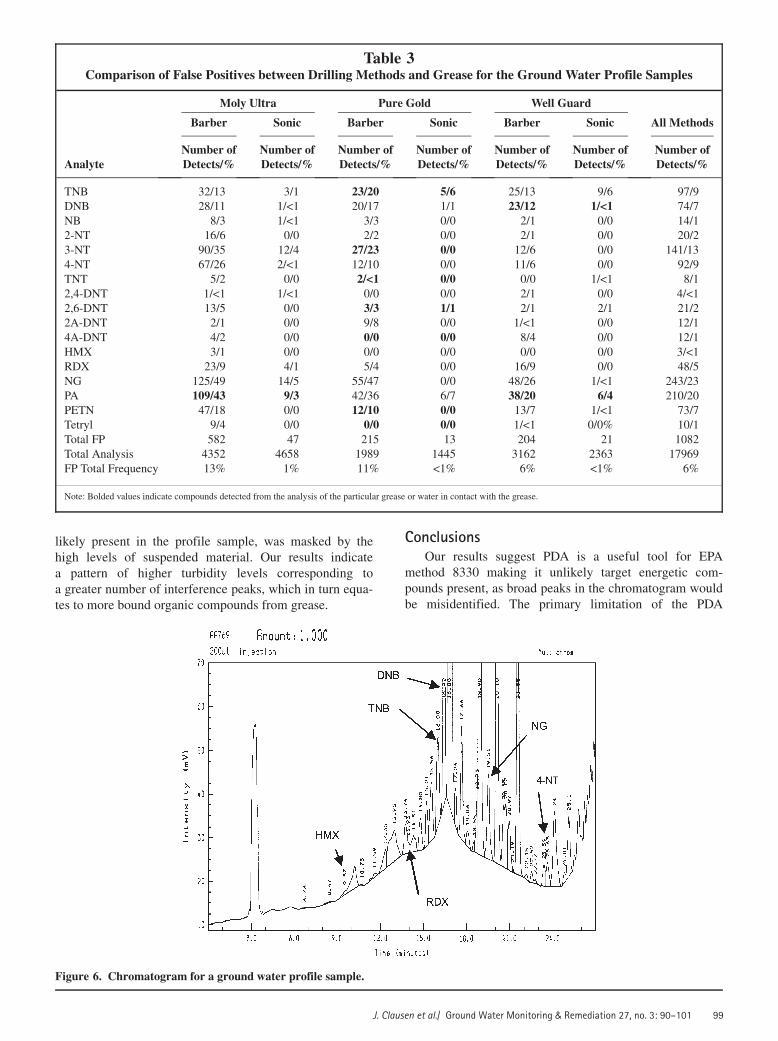
Presence of organics associated with fine particulatesin the profile samples can result in light being absorbedduring HPLC analysis and registered by the spectropho-tometer. Thus, the chromatographic results will showa peak due to the interference of organics sorbed onto theparticulates in the sample. To illustrate the turbidity inter-ference issue, chromatograms for a profile sample, whichwas extremely turbid, and corresponding well sample werecompared. Figure 6 is a chromatogram for a ground waterprofile sample, which shows many off-scale peaks anda very large baseline shift. Chromatographic analysis of theprofile sample initially suggested the presence of 2-NT,3-NT, 4-NT, HMX, NG, RDX, and tetryl. However, PDAreview did not provide confirmation of these detections;therefore, the initial detections of energetics were falsepositives.
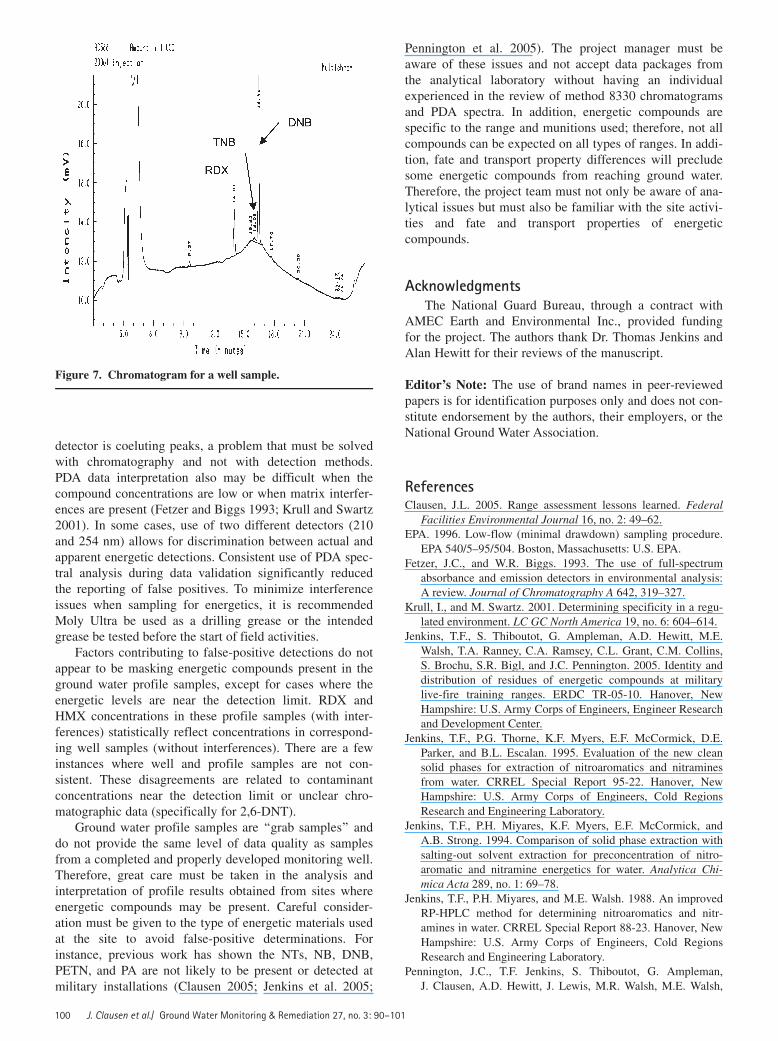
In contrast, the chromatogram for the correspondingwell sample is very clean (Figure 7). RDX was detected inthe well at a concentration of 1.2 and 0.68 lg/L from twosampling events. Both detections were confirmed withPDA analysis. In this case, the low RDX concentration,
Figure 4. Chromatogram for Moly Ultra drillers grease in water.
Figure 5. Chromatogram for Pure Gold drillers grease inwater.
J. Clausen et al./ Ground Water Monitoring & Remediation 27, no. 3: 90–10198
likely present in the profile sample, was masked by thehigh levels of suspended material. Our results indicatea pattern of higher turbidity levels corresponding toa greater number of interference peaks, which in turn equa-tes to more bound organic compounds from grease.
ConclusionsOur results suggest PDA is a useful tool for EPA
method 8330 making it unlikely target energetic com-pounds present, as broad peaks in the chromatogram wouldbe misidentified. The primary limitation of the PDA
Table 3Comparison of False Positives between Drilling Methods and Grease for the Ground Water Profile Samples
Moly Ultra Pure Gold Well Guard
Analyte
Barber Sonic Barber Sonic Barber Sonic All Methods
Number ofDetects/%
Number ofDetects/%
Number ofDetects/%
Number ofDetects/%
Number ofDetects/%
Number ofDetects/%
Number ofDetects/%
TNB 32/13 3/1 23/20 5/6 25/13 9/6 97/9DNB 28/11 1/<1 20/17 1/1 23/12 1/<1 74/7NB 8/3 1/<1 3/3 0/0 2/1 0/0 14/12-NT 16/6 0/0 2/2 0/0 2/1 0/0 20/23-NT 90/35 12/4 27/23 0/0 12/6 0/0 141/134-NT 67/26 2/<1 12/10 0/0 11/6 0/0 92/9TNT 5/2 0/0 2/<1 0/0 0/0 1/<1 8/12,4-DNT 1/<1 1/<1 0/0 0/0 2/1 0/0 4/<12,6-DNT 13/5 0/0 3/3 1/1 2/1 2/1 21/22A-DNT 2/1 0/0 9/8 0/0 1/<1 0/0 12/14A-DNT 4/2 0/0 0/0 0/0 8/4 0/0 12/1HMX 3/1 0/0 0/0 0/0 0/0 0/0 3/<1RDX 23/9 4/1 5/4 0/0 16/9 0/0 48/5NG 125/49 14/5 55/47 0/0 48/26 1/<1 243/23PA 109/43 9/3 42/36 6/7 38/20 6/4 210/20PETN 47/18 0/0 12/10 0/0 13/7 1/<1 73/7Tetryl 9/4 0/0 0/0 0/0 1/<1 0/0% 10/1Total FP 582 47 215 13 204 21 1082Total Analysis 4352 4658 1989 1445 3162 2363 17969FP Total Frequency 13% 1% 11% <1% 6% <1% 6%
Note: Bolded values indicate compounds detected from the analysis of the particular grease or water in contact with the grease.
Figure 6. Chromatogram for a ground water profile sample.
J. Clausen et al./ Ground Water Monitoring & Remediation 27, no. 3: 90–101 99
detector is coeluting peaks, a problem that must be solvedwith chromatography and not with detection methods.PDA data interpretation also may be difficult when thecompound concentrations are low or when matrix interfer-ences are present (Fetzer and Biggs 1993; Krull and Swartz2001). In some cases, use of two different detectors (210and 254 nm) allows for discrimination between actual andapparent energetic detections. Consistent use of PDA spec-tral analysis during data validation significantly reducedthe reporting of false positives. To minimize interferenceissues when sampling for energetics, it is recommendedMoly Ultra be used as a drilling grease or the intendedgrease be tested before the start of field activities.
Factors contributing to false-positive detections do notappear to be masking energetic compounds present in theground water profile samples, except for cases where theenergetic levels are near the detection limit. RDX andHMX concentrations in these profile samples (with inter-ferences) statistically reflect concentrations in correspond-ing well samples (without interferences). There are a fewinstances where well and profile samples are not con-sistent. These disagreements are related to contaminantconcentrations near the detection limit or unclear chro-matographic data (specifically for 2,6-DNT).
Ground water profile samples are ‘‘grab samples’’ anddo not provide the same level of data quality as samplesfrom a completed and properly developed monitoring well.Therefore, great care must be taken in the analysis andinterpretation of profile results obtained from sites whereenergetic compounds may be present. Careful consider-ation must be given to the type of energetic materials usedat the site to avoid false-positive determinations. Forinstance, previous work has shown the NTs, NB, DNB,PETN, and PA are not likely to be present or detected atmilitary installations (Clausen 2005; Jenkins et al. 2005;
Pennington et al. 2005). The project manager must beaware of these issues and not accept data packages fromthe analytical laboratory without having an individualexperienced in the review of method 8330 chromatogramsand PDA spectra. In addition, energetic compounds arespecific to the range and munitions used; therefore, not allcompounds can be expected on all types of ranges. In addi-tion, fate and transport property differences will precludesome energetic compounds from reaching ground water.Therefore, the project team must not only be aware of ana-lytical issues but must also be familiar with the site activi-ties and fate and transport properties of energeticcompounds.
AcknowledgmentsThe National Guard Bureau, through a contract with
AMEC Earth and Environmental Inc., provided fundingfor the project. The authors thank Dr. Thomas Jenkins andAlan Hewitt for their reviews of the manuscript.
Editor’s Note: The use of brand names in peer-reviewedpapers is for identification purposes only and does not con-stitute endorsement by the authors, their employers, or theNational Ground Water Association.
ReferencesClausen, J.L. 2005. Range assessment lessons learned. Federal
Facilities Environmental Journal 16, no. 2: 49–62.EPA. 1996. Low-flow (minimal drawdown) sampling procedure.
EPA 540/5–95/504. Boston, Massachusetts: U.S. EPA.Fetzer, J.C., and W.R. Biggs. 1993. The use of full-spectrum
absorbance and emission detectors in environmental analysis:A review. Journal of Chromatography A 642, 319–327.
Krull, I., and M. Swartz. 2001. Determining specificity in a regu-lated environment. LC GC North America 19, no. 6: 604–614.
Jenkins, T.F., S. Thiboutot, G. Ampleman, A.D. Hewitt, M.E.Walsh, T.A. Ranney, C.A. Ramsey, C.L. Grant, C.M. Collins,S. Brochu, S.R. Bigl, and J.C. Pennington. 2005. Identity anddistribution of residues of energetic compounds at militarylive-fire training ranges. ERDC TR-05-10. Hanover, NewHampshire: U.S. Army Corps of Engineers, Engineer Researchand Development Center.
Jenkins, T.F., P.G. Thorne, K.F. Myers, E.F. McCormick, D.E.Parker, and B.L. Escalan. 1995. Evaluation of the new cleansolid phases for extraction of nitroaromatics and nitraminesfrom water. CRREL Special Report 95-22. Hanover, NewHampshire: U.S. Army Corps of Engineers, Cold RegionsResearch and Engineering Laboratory.
Jenkins, T.F., P.H. Miyares, K.F. Myers, E.F. McCormick, andA.B. Strong. 1994. Comparison of solid phase extraction withsalting-out solvent extraction for preconcentration of nitro-aromatic and nitramine energetics for water. Analytica Chi-mica Acta 289, no. 1: 69–78.
Jenkins, T.F., P.H. Miyares, and M.E. Walsh. 1988. An improvedRP-HPLC method for determining nitroaromatics and nitr-amines in water. CRREL Special Report 88-23. Hanover, NewHampshire: U.S. Army Corps of Engineers, Cold RegionsResearch and Engineering Laboratory.
Pennington, J.C., T.F. Jenkins, S. Thiboutot, G. Ampleman,J. Clausen, A.D. Hewitt, J. Lewis, M.R. Walsh, M.E. Walsh,
Figure 7. Chromatogram for a well sample.
J. Clausen et al./ Ground Water Monitoring & Remediation 27, no. 3: 90–101100

T.A. Ranney, B. Silverblatt, A. Marois, A. Gagnon, P. Brousseau,J.E. Zufelt, K. Poe, M. Bouchard, R. Martel, D.D. Walker,C.A. Ramsey, C.A. Hayes, S.L. Yost, K.L. Bjella, L. Trepanier,T.E. Berry, D.J. Lambert, P. Dube, and N.M. Perron. 2005.Distribution and fate of energetics on DoD test and trainingranges. Interim Report 5. ERDC TR-05-2. Vicksburg, Missis-sippi: U.S. Army Corps of Engineers, Engineer Research andDevelopment Center. Prepared for Strategic EnvironmentalResearch and Development Program.
Walsh, M.E.1990. Environmental transformation products of nitro-aromatics and nitramines. Literature review and recommen-dations for analytical method development. CRREL SpecialReport 90-2. Hanover, New Hampshire: U.S. Army Corps ofEngineers, Cold Regions Research and Engineering Laboratory.
Walsh, M.E., and T.A. Ranney. 1999. Determination of nitro-aromatic, nitramine, and nitrate ester energetics in soil usingGC-EC. CRREL Special Report 99-12. Hanover, New Hamp-shire: U.S. Army Corps of Engineers, Cold Regions Researchand Engineering Laboratory.
Biographical SketchesJay Clausen is at U.S. Army Corps of Engineers, ERDC-
CRREL, 72 Lyme Road, Hanover, NH 03755.Elizabeth Wessling is at MECX, LLC 12269 East Vassar Drive,
Aurora, CO 80014.Brad Chirgwin is at Severn Trent Laboratories Inc., 208
S. Park Drive, Colchester, VT 05446.
J. Clausen et al./ Ground Water Monitoring & Remediation 27, no. 3: 90–101 101


