Embed Size (px)
Citation preview
Electrophysiological Properties of Motor Neurons ina Mouse Model of Severe Spinal Muscular Atrophy:In Vitro versus In Vivo DevelopmentHongmei Zhang1, Natallia Robinson1, Chiayen Wu2, Wenlan Wang2, Melissa A. Harrington1*
1 Department of Biological Sciences, Delaware State University, Dover, Delaware, United States of America, 2 Alfred I. DuPont Hospital for Children, Wilmington, Delaware,
United States of America
Abstract
We examined the electrophysiological activity of motor neurons from the mouse model of severe spinal muscular atrophy(SMA) using two different methods: whole cell patch clamp of neurons cultured from day 13 embryos; and multi-electroderecording of ventral horns in spinal cord slices from pups on post-natal days 5 and 6. We used the MED64 multi-electrodearray to record electrophysiological activity from motor neurons in slices from the lumbar spinal cord of SMA pups and theirunaffected littermates. Recording simultaneously from up to 32 sites across the ventral horn, we observed a significantdecrease in the number of active neurons in 5–6 day-old SMA pups compared to littermates. Ventral horn activity in controlpups is significantly activated by serotonin and depressed by GABA, while these agents had much less effect on SMA slices.In contrast to the large differences observed in spinal cord, neurons cultured from SMA embryos for up to 21 days showedno significant differences in electrophysiological activity compared to littermates. No differences were observed inmembrane potential, frequency of spiking and synaptic activity in cells from SMA embryos compared to controls. Inaddition, we observed no difference in cell survival between cells from SMA embryos and their unaffected littermates. Ourresults represent the first report on the electrophysiology of SMN-deficient motor neurons, and suggest that motor neurondevelopment in vitro follows a different path than in vivo development, a path in which loss of SMN expression has littleeffect on motor neuron function and survival.
Citation: Zhang H, Robinson N, Wu C, Wang W, Harrington MA (2010) Electrophysiological Properties of Motor Neurons in a Mouse Model of Severe SpinalMuscular Atrophy: In Vitro versus In Vivo Development. PLoS ONE 5(7): e11696. doi:10.1371/journal.pone.0011696
Editor: Wen-Liang Zhou, Sun Yat-Sen University, China
Received March 14, 2010; Accepted June 22, 2010; Published July 21, 2010
Copyright: � 2010 Zhang et al. This is an open-access article distributed under the terms of the Creative Commons Attribution License, which permitsunrestricted use, distribution, and reproduction in any medium, provided the original author and source are credited.
Funding: This work was supported by NIH Grants 5S06GM073765-01A2 and 5P20RR016472-05. The funders had no role in study design, data collection andanalysis, decision to publish, or preparation of the manuscript.
Competing Interests: The authors have declared that no competing interests exist.
* E-mail: [email protected]
Introduction
SMA is characterized by motor neuron loss and muscle atrophy,
[1,2,3,4] and is caused by homozygous loss or mutation of the
survival motor neuron gene 1, SMN1 [5,6]. A second copy of the
gene, SMN2, is almost identical to SMN1 except for several single
nucleotide changes, one of which results in alternative splicing and
skipping of exon 7 [7,8] so that 75–90% of SMN transcripts from
SMN2 are truncated and are rapidly degraded in vivo [9]. While
the SMN proteins are ubiquitously expressed, the pathology
associated with SMN1 loss appears to be confined to motor
neurons [10].
A transgenic mouse considered to be a close model of Type 1
SMA, the most severe form, contains a homozygous deletion of the
murine SMN1 gene and carries 2 copies of a human SMN2
transgene [11]. Affected pups appear normal at birth, but within
48 hours show decreased movement, reduced suckling, labored
breathing, and small size compared to wild type littermates, and
they die before post-natal day 7 (P7). Histological analysis of
mutants on post-natal day 1 (P1) shows the normal number of
spinal and brainstem motor neurons, but by P3–P5, motor neuron
cell bodies in the spinal cord are 20–30% lower in number in the
mutants than in age-matched controls, and many of the remaining
neurons appear apoptotic. Interestingly, the severity of the SMA
phenotype seems outpace the loss of motor neuron cell bodies, as
even the most severely affected pups retain 60% or more of spinal
motor neurons [11].
In culture, compared to controls, motor neurons from the SMA
type 1 mouse show decreased axon length, likely as a results of
decreased levels of b-actin [12,13], as well as reduced clustering of
Ca2+ channels in their growth cones, and reduced excitability in axon
terminals [14]. Imaging studies have also demonstrated denervation
of neuromuscular junctions and other synaptic abnormalities that are
apparent as early as embryonic day 18.5 [15]. However, to date,
there have been no reports of electrophysiological studies examining
the excitability of motor neurons from SMN-deficient animal models
either in culture or in vivo.
Here we report our results measuring the electrophysiological
activity of SMN-deficient motor neurons using both single-cell and
multi-electrode methods. We used the MED64 multi-electrode
array to record extracellularly from motor neurons in the ventral
horn of spinal cord slices from 5 and 6 day-old pups from the
mouse model for severe SMA. The 64-electrode array allowed us
to record simultaneously across the entire ventral horn, giving an
overall picture of sharp declines in both the number of active
motor neurons and the frequency of spiking activity in SMN-
deficient mice compared to their normal littermates. In contrast,
whole-cell patch clamp recording of motor neurons cultured from
PLoS ONE | www.plosone.org 1 July 2010 | Volume 5 | Issue 7 | e11696
day 13 embryos showed no difference in the electrophysiological
activity of cells from SMA embryos compared to littermate
controls, even after 21 days in culture. These results represent the
first report of the electrophysiological properties of spinal motor
neurons from an SMN-deficient model organism, and suggest that
motor neuron development in vitro follows a developmental path in
which motor neuron function and survival is much less dependent
on SMN expression than in vivo development.
Methods
Procedures involving animals were conducted in conformity
with National Institute of Health Guidelines for the Care and Use
of Laboratory Animals. All animal experiments were approved by
and conducted in accordance with the Institutional Animal Care
and Use Committees of Delaware State University and the Alfred
I. duPont Hospital for Children (Animal Welfare Assurance
Numbers A3318-01 and A4053-01, respectively).
Mice used for these experiment were of the FVB.Cg-Smn1tm1Msd
Tg(ACTA1-SMN)69Ahmb Tg(SMN2)89Ahmb/J strain and were
grown from breeding stock of stock # 008209 obtained from the
Jackson Laboratory (Bar Harbor, ME). Two heterozygotes were
mated to produce a mixed litter including homozygous mutant
pups. Wild type and heterozygous offspring were used as controls
as their phenotypes are indistinguishable [16,17], and we observed
no differences in the electrophysiological properties of motor
neurons from wild type and heterozygous mice.
Preparation and recording from spinal cord slicesMouse pups 5–6 days old were decapitated, and the spinal cords
were rapidly removed and immediately placed in ice-cold sucrose
artificial cerebrospinal fluid (aCSF) presaturated with 95%O2 and
5% CO2. The tissue was placed in a shallow groove formed in a
gelatin block and glued upright on the stage of a vibratome. After
cutting to the lumbar region, transverse spinal cord slices 400 mm
thick were cut on a 15u angle in ice-cold sucrose aCSF and then
preincubated in Krebs solution oxygenated with 95% O2 and 5%
CO2 at 34uC for at least 1 h before transfer to the recording
chamber.
Multi-electrode recordings were made with the MED64 system
(Automate Scientific) in 50-second increments with a sampling rate
of 20 kHz. The MED probe contains 64 electrodes in an 868 grid
with inter-electrode spacing of 75 mm, and slices were positioned
so that only the ventral horn was over the electrodes (covering just
over half the grid, see Fig. 1A). Data was filtered in Matlab (The
Mathworks Inc., Natick, Massachusetts, USA) by applying a low-
pass filter of cut-off 2.5 kHz, and a high-pass filter with cut-off of
85 Hz. The data were detrended with least squares procedures to
remove spurious trends [18]. For spike extraction, the standard
deviation, d, was calculated and the voltage threshold was set to
64.5d [19]. The spikes were counted and frequency was
determined for each 25 sec of recording on active electrodes –
defined as those with 50 or more spikes per 50 seconds. To sort the
spikes and determine the number of units recorded per electrode, a
set of wavelet coefficients was used to extract features in spikes,
and a supermagnetic clustering algorithm was used for spike
sorting [20]. The significance of the difference between distribu-
tions of spike frequencies was tested with the Kruskal-Wallis test,
with p-value of less than 0.01 considered to be stationary
significant.
Preparation of primary cultures of motor neuronsPrimary cultures were made from the motor neurons of spinal
cords from individual day-13 mouse embryos according to
methods published earlier [21]. Ventral horn cultures with this
method have been shown by immunofluorescence to be almost
completely motor neurons [21]. Briefly, 24-well dishes with
coverslips were coated over 48 hours with 0.01% poly-L-lysine,
then filled with neurobasal medium and kept at 4 uC overnight
or until use. The heads of each embryo are collected and stored at
-20 uC for genotyping while the ventral horns of each spinal cord
were placed individually in 1 ml complete Hibernate E1
(Brainbits, Springfield, IL). The ventral horns were trypsinized
in Hank’’s solution for 13 minutes, the trypsin solution was
replaced with motor neuron (MN) medium with growth factors
and agitated to break up cell clumps. The cell solution was
centrifuged at 300 g for 10 minutes at 37uC in MN medium +4%
BSA, the supernatant was discarded, and cells resuspended from
the pellet with MN medium and counted. Ventral horn neurons
from each individual embryo were dispensed to 6 wells. MN
medium is 95% Neurobasal medium, 2% B27 (Invitrogen), 2%
horse serum, 25 mM b-Mercaptoethanol, 25 mM Glutamic acid,
1% Penicillin-Streptomycin (Mediatech), 50 mM glutamine,
0.01% BDNF (R&D Systems). Cells were incubated 7 days before
recording to allow electrical activity to develop.
For genotyping, genomic DNA was extracted from the head
(embryos) or tail (pups) and amplified by PCR according to the
Jackson Lab protocol.
Whole-cell patch clamp of cultured neuronsElectrodes were triple pulled from borosilicate glass capillaries
and had an impedance of 4–6 MV when filled with internal
solution containing (mM): K-gluconate, 135; MgCl2, 2.0; HEPES,
10.0; EGTA, 0.5; ATP-Mg, 4.0; Na-GTP, 0.5, pH 7.2–7.4, and
290–310 mOsm. QX-314 was added to the intrapipette solution
to eliminate action potential when sPSCs were recorded. The
extracellular solution contained (mM): NaCl, 150.0; KCl, 3.0;
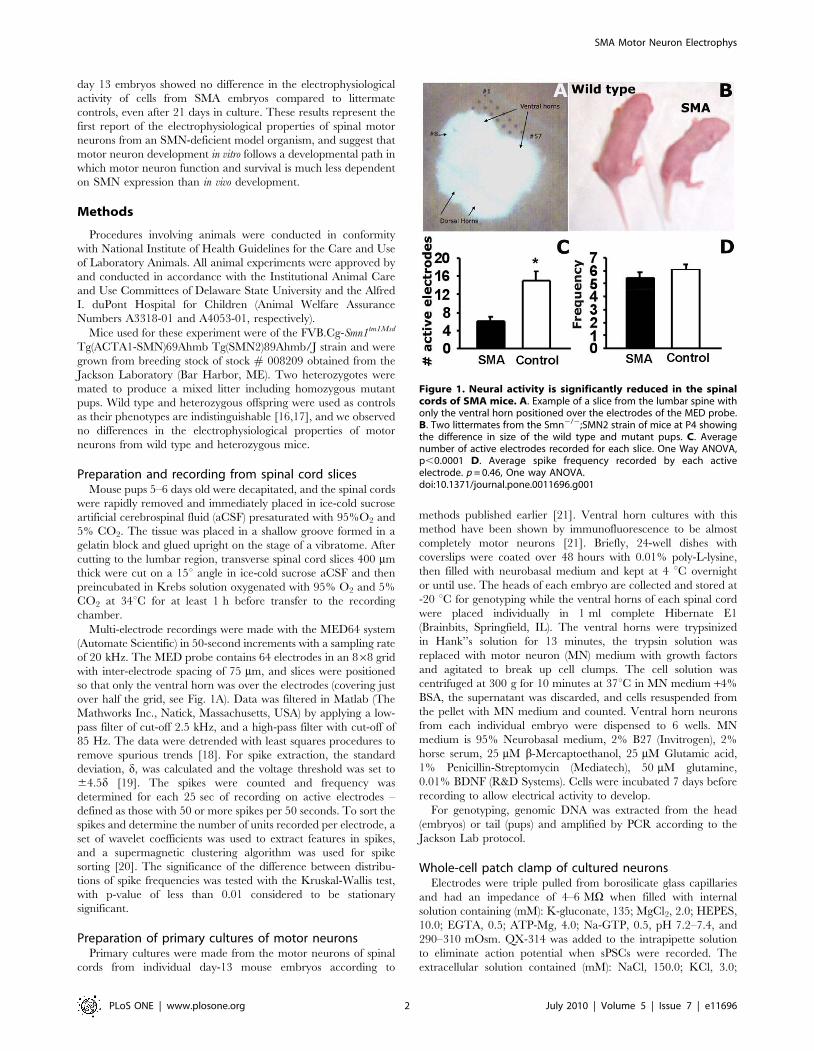
Figure 1. Neural activity is significantly reduced in the spinalcords of SMA mice. A. Example of a slice from the lumbar spine withonly the ventral horn positioned over the electrodes of the MED probe.B. Two littermates from the Smn2/2;SMN2 strain of mice at P4 showingthe difference in size of the wild type and mutant pups. C. Averagenumber of active electrodes recorded for each slice. One Way ANOVA,p,0.0001 D. Average spike frequency recorded by each activeelectrode. p = 0.46, One way ANOVA.doi:10.1371/journal.pone.0011696.g001
SMA Motor Neuron Electrophys
PLoS ONE | www.plosone.org 2 July 2010 | Volume 5 | Issue 7 | e11696
MgCl2, 1.0; CaCl2, 2.0; glucose, 10.0; and HEPES 10.0, pH 7.2–
7.4 with osmolarity of 310–330 mOsm. Motor neurons could be
identified by their morphology - a triangular shape with a single
well-defined axon and large soma (.20 mm). Recordings of
postsynaptic currents began 3 minutes after whole-cell access was
established and the current reached a steady state. The input
resistance was monitored and the recording as abandoned if
it changed more than 15%. Signals were recorded using a
MultiClamp700B (Axon Instruments, Foster City, CA) filtered at
1–2 kHz, digitized at 10 kHz, and stored with pCLAMP 10.2
(Axon Instruments). All spontaneous postsynaptic currents (sPSCs)
were recorded in voltage-clamp. 20 mM bicuculline, a GABAA
receptor antagonist and 10 mM 6-cyano-7-nitroquinoxaline-2,3-
dione (CNQX), a specific glutamate non-NMDA antagonist are
used to differentiate AMPA receptor- induced or GABA-induced
postsynaptic currents. Membrane potential and action potentials
were recorded in current-clamp.
Data analysisThe sPSCs and action potentials were analyzed off-line with a
peak detection program (MiniAnalysis, Synaptosoft, Decatur, GA).
Measurements of the amplitude and frequency of sPSCs and
action potentials were performed over a period of at least 2 min.
Events were manually excluded when noise was erroneously
identified as sPSCs or action potentials by the program.
Background noise levels were typically constant throughout the
recording of a single neuron. Significance of results was tested with
a one-way ANOVA.
Results
Recordings from ventral horns of spinal cord slicesFor recordings from spinal cord slices, SMA and control pups
(wild type and heterozygous) were identified by body size at day 4
(Fig 1B) and confirmed by genotyping. Spinal cord slices were
positioned on the MED64 multi-electrode array so that only the
ventral horns were covering the electrodes (Fig 1A). The MED64
was used to record extracellularly from the ventral horn of 11
spinal cord slices from 3 SMA mice and 12 slices from 3 control
mice from post-natal day 5 or 6. The recordings demonstrate that
the number of spiking motor neurons in the lumbar spinal cord
was much lower in SMA mice than control mice. The average
number of electrodes recording action potential (spike) activity was
only 661 per slice in the SMA mice, while in slices from control
mice, the number of active electrodes/slice averaged 1562
(Fig 1C). In the active electrodes, the average spike frequencies
in basal conditions were similar in slices from control and SMA
mice - 5.4860.37 Hz in SMA and 6.0860.42 Hz in control
(Fig. 1D). However, spike sorting showed that each electrode
recorded fewer neurons in slices from SMA mice. In basal
conditions, each active electrode recorded an average of 5 different
neurons in slices from control mice, while in slices from SMA mice
each active electrode recorded an average of only 4 different
neurons.
As shown in Figure 2, serotonin significantly increased the
number of active spinal motor neurons in both control and SMA
mice, increasing both the number of active electrodes per slice
from 15 to 2562 electrodes/slice in controls and from 6 to 1162
electrodes/slice in SMA (Fig. 2A) while also increasing the number
of neurons recorded per active electrode from 5 to 7 in control
slices and from 4 to 5 in SMA slices. Reflecting the increase in
both the number of active cells recorded by each electrode and the
increased spiking activity for those cells, serotonin significantly
increased the overall spike frequency on active electrodes in both
SMA and control mice although the magnitude of the effect was
smaller in SMA mice (6.9860.49 Hz in SMA slices compared to
10.2060.27 Hz in controls (Fig. 2B).
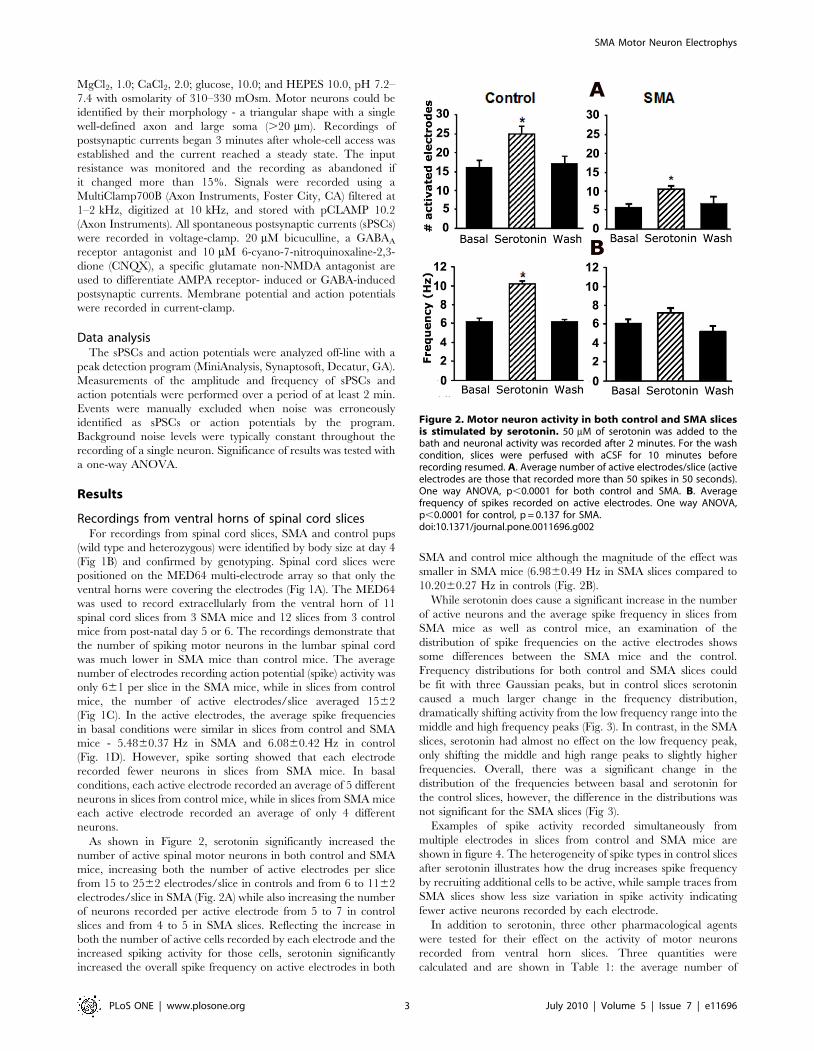
While serotonin does cause a significant increase in the number
of active neurons and the average spike frequency in slices from
SMA mice as well as control mice, an examination of the
distribution of spike frequencies on the active electrodes shows
some differences between the SMA mice and the control.
Frequency distributions for both control and SMA slices could
be fit with three Gaussian peaks, but in control slices serotonin
caused a much larger change in the frequency distribution,
dramatically shifting activity from the low frequency range into the
middle and high frequency peaks (Fig. 3). In contrast, in the SMA
slices, serotonin had almost no effect on the low frequency peak,
only shifting the middle and high range peaks to slightly higher
frequencies. Overall, there was a significant change in the
distribution of the frequencies between basal and serotonin for
the control slices, however, the difference in the distributions was
not significant for the SMA slices (Fig 3).
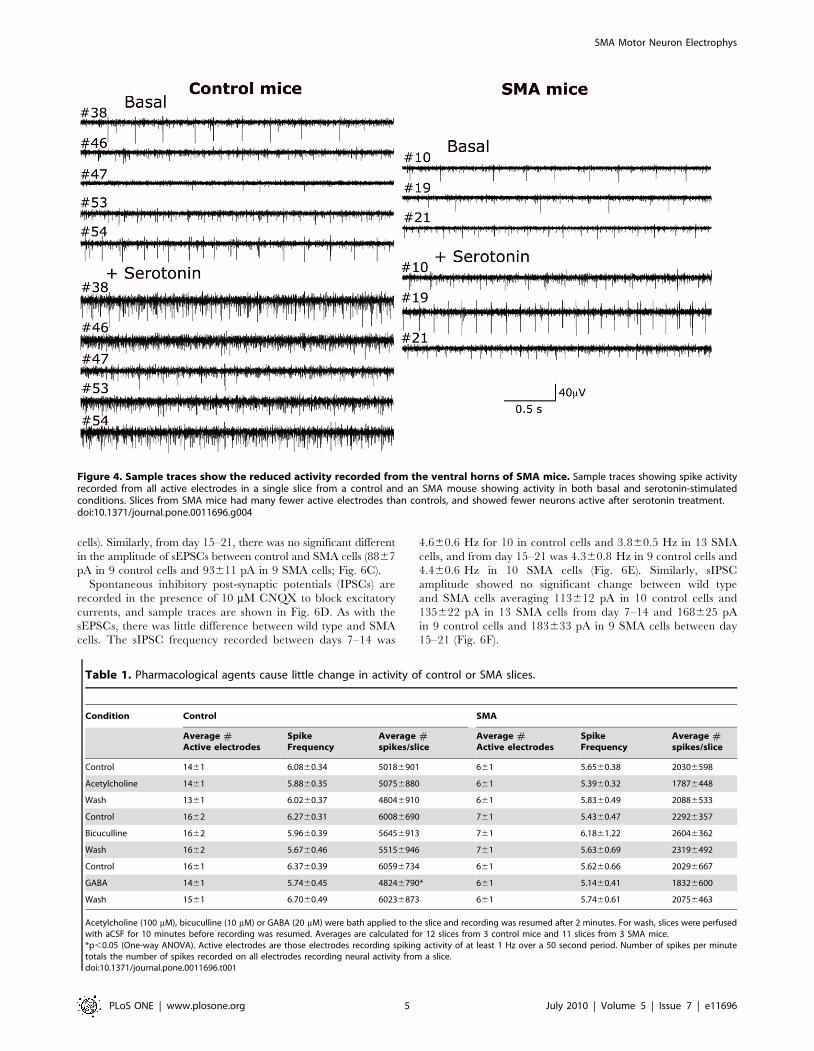
Examples of spike activity recorded simultaneously from
multiple electrodes in slices from control and SMA mice are
shown in figure 4. The heterogeneity of spike types in control slices
after serotonin illustrates how the drug increases spike frequency
by recruiting additional cells to be active, while sample traces from
SMA slices show less size variation in spike activity indicating
fewer active neurons recorded by each electrode.
In addition to serotonin, three other pharmacological agents
were tested for their effect on the activity of motor neurons
recorded from ventral horn slices. Three quantities were
calculated and are shown in Table 1: the average number of
Figure 2. Motor neuron activity in both control and SMA slicesis stimulated by serotonin. 50 mM of serotonin was added to thebath and neuronal activity was recorded after 2 minutes. For the washcondition, slices were perfused with aCSF for 10 minutes beforerecording resumed. A. Average number of active electrodes/slice (activeelectrodes are those that recorded more than 50 spikes in 50 seconds).One way ANOVA, p,0.0001 for both control and SMA. B. Averagefrequency of spikes recorded on active electrodes. One way ANOVA,p,0.0001 for control, p = 0.137 for SMA.doi:10.1371/journal.pone.0011696.g002
SMA Motor Neuron Electrophys
PLoS ONE | www.plosone.org 3 July 2010 | Volume 5 | Issue 7 | e11696
electrodes recording activity; the average frequency of spikes on
each electrode, and the average number of spikes per minute
recorded from each slice. This final quantity sums the spikes
recorded on all electrodes recoding neural activity. Of the
compounds tested, only GABA (20 mM) had a significant effect
on slice activity, reducing the total number of spikes per slice, but
only in the control slices. None of the compounds caused a
significant change in slice activity in SMA slices (Table 1).
Whole-cell recordings from primary motor neuroncultures
In culture, neurons dissociated from ventral horns of wild type and
SMA mice form extensive processes, and are indistinguishable in
appearance. Whole-cell recordings were made from neurons cultured
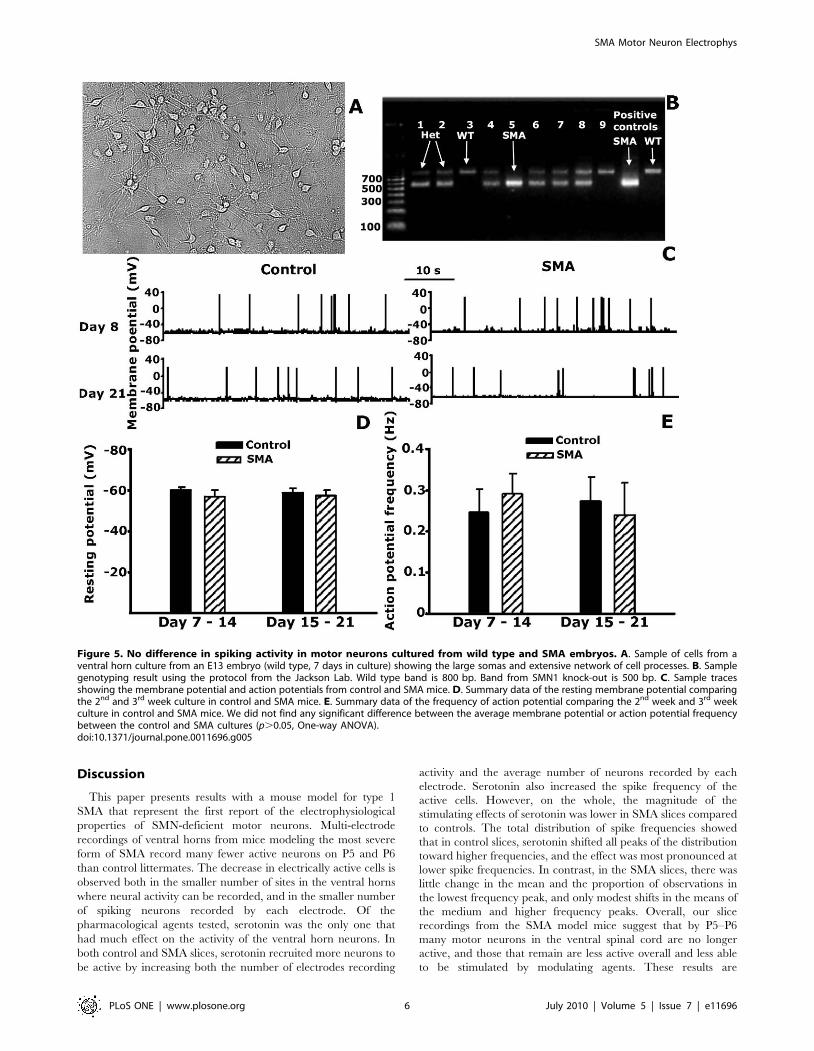
from 4 separate SMA embryos and 5 wild-type embryos. Action
potential activity could be recorded from the cells starting on culture
day 6. Patch-clamp recordings with cultured motor neurons were
conducted between culture days 7–21 (Fig. 5,B,C). Initially the data
was pooled per day of culture, but as no differences between the SMA
and wild-type cells could be observed, the results were pooled into two
groups: recordings made between culture day 7 to day 14 which
correspond to the time that pups are born and SMA pups typically
are alive; and recordings made between culture days 15–21, which
correspond to the second post-natal week beyond the time that SMA
pups survive.
The resting membrane potential (RMP) recorded between day 7 to
14 averaged 259.861.2 mV in 13 control cells and 256.763.2 mV
in 11 SMA cells. Between days 15–21 the average RMP was
– 58.362.4 mV in 12 control cells and 257.262.5 mV in 13 SMA
cells (Fig. 5D). There is no significant difference between the control
and SMA groups regardless of the recording period (Fig. 5; P.0.05,
One way ANOVA). Similarly, action potential frequency from day
7–14 averaged 0.2460.06 Hz in 13 control cells and 0.2960.05 Hz
in 11 SMA cells, while from day 15–21 the action potential frequency
averaged 0.2760.06 Hz in 12 control cells and 0.2360.08 Hz in 13
SMA cells (Fig. 5E). There is no significant different between cells in
the control and SMA cultures (Fig. 4; P.0.05, One way ANOVA). In
addition to the lack of difference in the electrical activity and resting
membrane potential between SMA and wild type cells, no difference
was observed in cell survival as long as day 21 of culture.
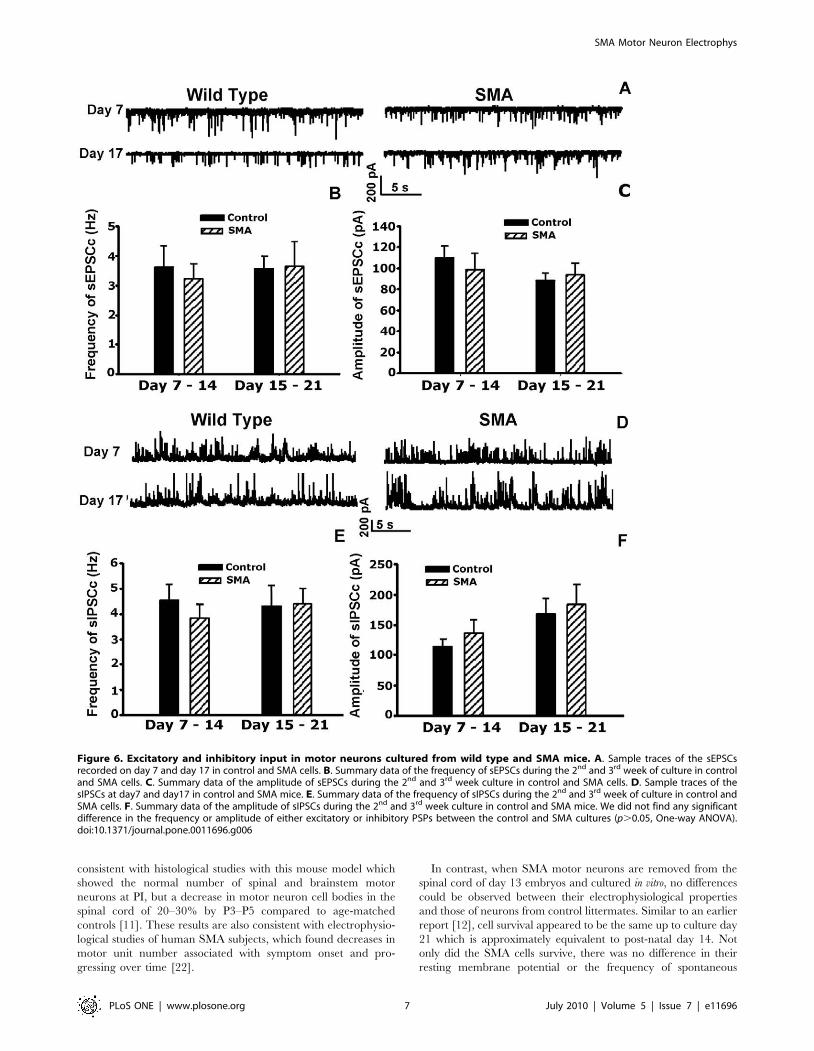
Spontaneous excitatory post-synaptic potentials (EPSCs) were
recorded in the presence of bicuculline (20 mM) and strychnine
(2 mM) to block inhibitory currents, and sample traces are shown
in Fig 6A. From day 7–14, the frequency of sEPSCs was
3.660.7 Hz in 9 control cells and 3.260.5 Hz in 9 SMA cells,
while from day 15–21, the frequency of sEPSCs averaged
3.660.4 Hz in 9 control cells and 3.660.8 mV in 9 SMA cells
(Fig. 6B). In addition, the average amplitude of sEPSCs recorded
from day 7–14 did not differ significantly between control and
SMA cells (108612 pA for 9 control and 98615 pA for 9 SMA
Figure 3. In SMA slices the overall distribution of spike frequencies is not significantly changed by serotonin. Histograms of spikefrequency comparing slices from control and SMA mice. The number of observations was normalized to the total number of observations in eachslice and divided into. 0.5 Hz bins. The distributions were fitted with mixed Gaussian approximations using the Expectation-Maximization (EM)algorithm [26]. Serotonin significantly shift the frequency distribution in control slices (p,0.0001), but the shift is not significant in the SMA slices(p = 0.1433; Kruskal-Wallis).doi:10.1371/journal.pone.0011696.g003
SMA Motor Neuron Electrophys
PLoS ONE | www.plosone.org 4 July 2010 | Volume 5 | Issue 7 | e11696
cells). Similarly, from day 15–21, there was no significant different
in the amplitude of sEPSCs between control and SMA cells (8867
pA in 9 control cells and 93611 pA in 9 SMA cells; Fig. 6C).
Spontaneous inhibitory post-synaptic potentials (IPSCs) are
recorded in the presence of 10 mM CNQX to block excitatory
currents, and sample traces are shown in Fig. 6D. As with the
sEPSCs, there was little difference between wild type and SMA
cells. The sIPSC frequency recorded between days 7–14 was
4.660.6 Hz for 10 in control cells and 3.860.5 Hz in 13 SMA
cells, and from day 15–21 was 4.360.8 Hz in 9 control cells and
4.460.6 Hz in 10 SMA cells (Fig. 6E). Similarly, sIPSC
amplitude showed no significant change between wild type
and SMA cells averaging 113612 pA in 10 control cells and
135622 pA in 13 SMA cells from day 7–14 and 168625 pA
in 9 control cells and 183633 pA in 9 SMA cells between day
15–21 (Fig. 6F).
Figure 4. Sample traces show the reduced activity recorded from the ventral horns of SMA mice. Sample traces showing spike activityrecorded from all active electrodes in a single slice from a control and an SMA mouse showing activity in both basal and serotonin-stimulatedconditions. Slices from SMA mice had many fewer active electrodes than controls, and showed fewer neurons active after serotonin treatment.doi:10.1371/journal.pone.0011696.g004
Table 1. Pharmacological agents cause little change in activity of control or SMA slices.
Condition Control SMA
Average #Active electrodes
SpikeFrequency
Average #spikes/slice
Average #Active electrodes
SpikeFrequency
Average #spikes/slice
Control 1461 6.0860.34 50186901 661 5.6560.38 20306598
Acetylcholine 1461 5.8860.35 50756880 661 5.3960.32 17876448
Wash 1361 6.0260.37 48046910 661 5.8360.49 20886533
Control 1662 6.2760.31 60086690 761 5.4360.47 22926357
Bicuculline 1662 5.9660.39 56456913 761 6.1861.22 26046362
Wash 1662 5.6760.46 55156946 761 5.6360.69 23196492
Control 1661 6.3760.39 60596734 661 5.6260.66 20296667
GABA 1461 5.7460.45 48246790* 661 5.1460.41 18326600
Wash 1561 6.7060.49 60236873 661 5.7460.61 20756463
Acetylcholine (100 mM), bicuculline (10 mM) or GABA (20 mM) were bath applied to the slice and recording was resumed after 2 minutes. For wash, slices were perfusedwith aCSF for 10 minutes before recording was resumed. Averages are calculated for 12 slices from 3 control mice and 11 slices from 3 SMA mice.*p,0.05 (One-way ANOVA). Active electrodes are those electrodes recording spiking activity of at least 1 Hz over a 50 second period. Number of spikes per minutetotals the number of spikes recorded on all electrodes recording neural activity from a slice.doi:10.1371/journal.pone.0011696.t001
SMA Motor Neuron Electrophys
PLoS ONE | www.plosone.org 5 July 2010 | Volume 5 | Issue 7 | e11696
Discussion
This paper presents results with a mouse model for type 1
SMA that represent the first report of the electrophysiological
properties of SMN-deficient motor neurons. Multi-electrode
recordings of ventral horns from mice modeling the most severe
form of SMA record many fewer active neurons on P5 and P6
than control littermates. The decrease in electrically active cells is
observed both in the smaller number of sites in the ventral horns
where neural activity can be recorded, and in the smaller number
of spiking neurons recorded by each electrode. Of the
pharmacological agents tested, serotonin was the only one that
had much effect on the activity of the ventral horn neurons. In
both control and SMA slices, serotonin recruited more neurons to
be active by increasing both the number of electrodes recording
activity and the average number of neurons recorded by each
electrode. Serotonin also increased the spike frequency of the
active cells. However, on the whole, the magnitude of the
stimulating effects of serotonin was lower in SMA slices compared
to controls. The total distribution of spike frequencies showed
that in control slices, serotonin shifted all peaks of the distribution
toward higher frequencies, and the effect was most pronounced at
lower spike frequencies. In contrast, in the SMA slices, there was
little change in the mean and the proportion of observations in
the lowest frequency peak, and only modest shifts in the means of
the medium and higher frequency peaks. Overall, our slice
recordings from the SMA model mice suggest that by P5–P6
many motor neurons in the ventral spinal cord are no longer
active, and those that remain are less active overall and less able
to be stimulated by modulating agents. These results are
Figure 5. No difference in spiking activity in motor neurons cultured from wild type and SMA embryos. A. Sample of cells from aventral horn culture from an E13 embryo (wild type, 7 days in culture) showing the large somas and extensive network of cell processes. B. Samplegenotyping result using the protocol from the Jackson Lab. Wild type band is 800 bp. Band from SMN1 knock-out is 500 bp. C. Sample tracesshowing the membrane potential and action potentials from control and SMA mice. D. Summary data of the resting membrane potential comparingthe 2nd and 3rd week culture in control and SMA mice. E. Summary data of the frequency of action potential comparing the 2nd week and 3rd weekculture in control and SMA mice. We did not find any significant difference between the average membrane potential or action potential frequencybetween the control and SMA cultures (p.0.05, One-way ANOVA).doi:10.1371/journal.pone.0011696.g005
SMA Motor Neuron Electrophys
PLoS ONE | www.plosone.org 6 July 2010 | Volume 5 | Issue 7 | e11696
consistent with histological studies with this mouse model which
showed the normal number of spinal and brainstem motor
neurons at PI, but a decrease in motor neuron cell bodies in the
spinal cord of 20–30% by P3–P5 compared to age-matched
controls [11]. These results are also consistent with electrophysio-
logical studies of human SMA subjects, which found decreases in
motor unit number associated with symptom onset and pro-
gressing over time [22].
In contrast, when SMA motor neurons are removed from the
spinal cord of day 13 embryos and cultured in vitro, no differences
could be observed between their electrophysiological properties
and those of neurons from control littermates. Similar to an earlier
report [12], cell survival appeared to be the same up to culture day
21 which is approximately equivalent to post-natal day 14. Not
only did the SMA cells survive, there was no difference in their
resting membrane potential or the frequency of spontaneous
Figure 6. Excitatory and inhibitory input in motor neurons cultured from wild type and SMA mice. A. Sample traces of the sEPSCsrecorded on day 7 and day 17 in control and SMA cells. B. Summary data of the frequency of sEPSCs during the 2nd and 3rd week of culture in controland SMA cells. C. Summary data of the amplitude of sEPSCs during the 2nd and 3rd week culture in control and SMA cells. D. Sample traces of thesIPSCs at day7 and day17 in control and SMA mice. E. Summary data of the frequency of sIPSCs during the 2nd and 3rd week of culture in control andSMA cells. F. Summary data of the amplitude of sIPSCs during the 2nd and 3rd week culture in control and SMA mice. We did not find any significantdifference in the frequency or amplitude of either excitatory or inhibitory PSPs between the control and SMA cultures (p.0.05, One-way ANOVA).doi:10.1371/journal.pone.0011696.g006
SMA Motor Neuron Electrophys
PLoS ONE | www.plosone.org 7 July 2010 | Volume 5 | Issue 7 | e11696
action potential activity compared to wild type motor neurons. In
addition, no difference was observed in synaptic function between
the wild type and SMA neurons in culture, in spite of several
studies with mutant pups showing reduced excitability in the axon
terminals, impaired synaptic vesicle release and neurotransmission
failures at neuromuscular synapses [16,23,24]. Recordings of the
frequency and amplitude of spontaneous excitatory post-synaptic
potentials (many of which are likely to represent synapses between
motor neurons) found no difference between wild type and SMA
neurons even after 21 days in culture. Inhibitory post-synaptic
potentials were also the same in mutant and control neurons,
indicating that cultured wild type and mutant neurons were
equally responsive to GABA, while in slice recordings, only control
cells were inhibited by GABA. These results suggest that there is
no difference in the number and efficacy of synapses formed by
networks of wild type and SMN-deficient motor neurons grown in
culture.
Taken together, these results suggest that motor neuron
development in culture proceeds down a different developmental
pathway than in vivo development in the spinal cord, and that in
vitro development leads to motor neurons that are much less
dependent on expression of SMN for survival and function. The
lack of dependence of cultured motor neurons on SMN expression
indicates that care must be taken in using motor neuron culture as
a model system for studying SMA, but also suggests that a deeper
understanding of how motor neuron development in culture differs
from development in vivo may provide key insights into the
pathophysiology of SMA.
One major difference between in vitro and in vivo development is
contact with muscle cells. For primary culture, motor neurons are
harvested from E13 embryos, a stage when the motor neuron
axons have begun to leave the spinal cord, but have not yet made
synapses on muscle cells [25]. It is possible that contact with
muscle cells starts motor neurons down a developmental path in
which SMN expression is critical for cell function and survival. In
the absence of that contact, motor neurons may be no more
dependent on SMN expression than other types of neurons.
Author Contributions
Conceived and designed the experiments: HZ MAH. Performed the
experiments: HZ. Analyzed the data: HZ NR. Contributed reagents/
materials/analysis tools: CW WW. Wrote the paper: HZ MAH.
References
1. Crawford TO, Pardo CA (1996) The neurobiology of childhood spinal muscular
atrophy. Neurobiology of Disease 3: 97–110.
2. Iannaccone ST, Smith SA, Simard LR (2004) Spinal muscular atrophy. CurrentNeurology and Neuroscience Reports 4: 74–80.
3. Swash M, Desai J (2000) Motor neuron disease: Classification and nomencla-ture. Amyotroph Lateral Sclerosis and Other Motor Neuron Disorders 1:
105–112.
4. Talbot K, Davies KE (2001) Spinal muscular atrophy. Semin Neurol 21:198–197.
5. Lefebvre S, Burglen L, Reboulett S, Clermont O, Burlet P, et al. (1995)Identification and characterization of a spinal muscular atrophy-determining
gene. Cell 80: 155–165.6. Monani UR (2005) Spinal muscular atrophy: a deficiency in a ubiquitous
protein; a motor neuron-specific disease. Neuron 48: 885–896.
7. Lorson CL, Strasswimmer J, Yao JM, Baleja JD, Hahnen E, et al. (1999) SMNoligomerization defect correlates with spinal muscular atrophy severity. Nature
Genetics 19: 63–66.8. Monani UR, Lorson CL, Parsons DW, Prior TW, Androphy EJ, et al. (1999) A
single nucleotide difference that alters splicing patterns distinguishes the SMA
gene SMN1 from the copy gene SMN2. Human Molecular Genetics 8:1177–1183.
9. Lorson CL, Androphy EJ (2000) An exonic enhancer is required for inclusion ofessential exon in the SMA determining gene SMN. Human Molecular Genetics
9: 259–265.10. Burghes AH, Beattie CE (2009) Spinal muscular atrophy: why do low levels of
survival motor neuron protein make motor neurons sick? Nature Reviews
Neuroscience 10: 597–609.11. Monani UR, Sendtner M, Coovert DD, Parsons DW, Andreassi C, et al. (2000)
The human centromeric survival motor neuron gene (SMN2) rescues embryoniclethality in Smn(-/-) mice, and results in a mouse with spinal muscular atrophy.
Human Molecular Genetics 9: 333–339.
12. Rossoll W, Jablonka S, Andreassi C, Kroning AK, Karle K, et al. (2003) Smnthe spinal muscular atrophy determining gene product, modulates axon growth
and localization of B-actin mRNA in growth cones of motor neurons. Journal ofCell Biology 163: 801–812.
13. Ting CH, Lin CW, Wen SL, Hsieh-Li HM, Li H (2007) Stat5 constituitiveactivation rescues defects in spinal muscular atrophy. Human Molecular
Genetics 16: 499–514.
14. Jablonka S, Beck M, Lechner B, Dorothea, Mayer C, Sendtner M (2007)
Defective Ca2+ channel clustering in axon terminals disturbs excitability in
motoneurons in spinal muscular atrophy. Journal of Cell Biology 179: 139–149.
15. McGovern VL, Gavrilina TO, Beattie CE, Burghes AH (2008) Embryonic
motor axon development in the severe SMA mouse. Human Molecular Genetics
15: 2900–2909.
16. Kong L, Wang X, Choe DW, Polley M, Burnett BG, et al. (2009) Impaired
synaptic vesicle release and immaturity of neuromuscular junctions in spinal
muscular atrophy mice. J Neurosci 29: 842–851.
17. Schrank B, Gotz R, Gunnersen JM, Ure JM, Toyka KV, et al. (1997)
Inactivation of the survival motor neuron gene, a candidate gene for human
spinal muscular atrophy, leads to massive cell death in early mouse embryos.
Proceedings of National Academy of Sciences, USA 94: 9920–9925.
18. Bendat JS, Piersol AG (2000) Random Data. Analysis and Measurement
Procedures, 3rd ed., New York: John Wiley & Sons, Inc.
19. Smith S (2002) Digital Signal Processing: A Practical Guide for Engineers and
Scientists Burlington, MA: Elsevier Science.
20. Quiroga RQ, Nadasdy Z, Ben-Shaul Y (2004) Unsupervised Spike Detection
and Sorting with Wavelets and Superparamagnetic Clustering. Neural
Computation 16: 1661–1687.
21. Zhang H, Robinson N, Gomez-Curet I, Wang W, Harrington M (2009)
Neuronal and network activity in networks of cultured spinal motor neurons.
NeuroReport 20: 854–859.
22. Swoboda KJ, Prior TW, Scott CB, McNaught TP, Wride MC, et al. (2005)
Natural history of denervation in SMA: relation to age, SMN2 copy number,
and function. Ann Neurol 57: 704–712.
23. Jablonka S, Wiese S, Sendtner M (2004) Axonal defects in mouse models of
motoneuron disease. J Neurobiol 58: 272–286.
24. Kariya S, Park GH, Maeno-Hikichi Y, Leykekhman O, Lutz C, et al. (2008)
Reduced SMN protein impairs maturation of the neuromuscular junctions in
mouse models of spinal muscular atrophy. Hum Mol Genet 17: 2552–2569.
25. Noakes PG, Phillips WD, Hanley TA, Sanes JR, Merlie JP (1993) 43K protein
and acetylcholine receptors colocalize during the initial stages of neuromuscular
synapse formation in vivo. Dev Biol 155: 275–280.
26. Alpaydin E (2004) Introduction to Machine Learning. Cambridge, MA: The
MIT Press.
SMA Motor Neuron Electrophys
PLoS ONE | www.plosone.org 8 July 2010 | Volume 5 | Issue 7 | e11696


