Embed Size (px)
Citation preview

This article appeared in a journal published by Elsevier. The attachedcopy is furnished to the author for internal non-commercial researchand education use, including for instruction at the authors institution
and sharing with colleagues.
Other uses, including reproduction and distribution, or selling orlicensing copies, or posting to personal, institutional or third party
websites are prohibited.
In most cases authors are permitted to post their version of thearticle (e.g. in Word or Tex form) to their personal website orinstitutional repository. Authors requiring further information
regarding Elsevier’s archiving and manuscript policies areencouraged to visit:
http://www.elsevier.com/copyright

Author's personal copy
Electrochemical performance of lanthanum calcium cobalt ferrite cathodeinterfaced to LAMOX electrolyte
Cheng-Wei Chen a, Dah-Shyang Tsai a,⁎, Tsu-Yung Jin a,Wen-Hung Chung a, Chen-Chia Chou b
a Department of Chemical Engineering, National Taiwan University of Science and Technology, Taipei 106 Taiwanb Department of Mechanical Engineering, National Taiwan University of Science and Technology, Taipei 106 Taiwan
Received 6 November 2007; received in revised form 9 February 2008; accepted 15 February 2008
Abstract
Lanthanum calcium cobalt ferrite (LCCF), a potential cathode composition for the LAMOX electrolyte, is studied on its electrocatalyticperformance in oxygen reduction reaction (ORR) using impedance spectroscopy. Nyquist plots of LCCF impedance at 600–800 °C display twoarcs, in which the low-frequency arc is constantly larger than the high-frequency arc. When interfaced to the electrolyte containing 20 mol%tungsten, the ORR polarization resistance of LCCF exhibits a strong temperature dependency whose activation energy increases with increasingCo content, 190 (10 mol%)–220 (90 mol%) kJ mol−1. Among the cathode compositions, LCCF82 (80 mol% Co) exhibits the best catalyticperformance. Its zero-bias ORR resistance is 242.4 at 600 °C, 0.845 Ω cm2 at 800 °C, along with the capacitance 7.79 (600 °C), 14.93 mF cm−2
(800 °C). The ORR resistance of LCCF82 decreases with increasing dc bias at 600 and 700 °C, hardly changes at 800 °C. The electrocatalyticactivity of LCCF82 is also influenced by the tungsten content of its interfacing electrolyte. The exchange current density of LCCF82 correlatespositively with the electrolyte ion conductivity which increases with decreasing tungsten content.© 2008 Elsevier B.V. All rights reserved.
Keywords: SOFC; Cathode; Electrode kinetics; Perovskite; Lanthanum calcium cobalt ferrite; LAMOX
1. Introduction
The materials system of a solid oxide fuel cell (SOFC) isbuilt around its electrolyte [1,2]. LAMOX is a family of oxygenion conductors based on the parent crystal of La2Mo2O9, whoseion conductivity of β phase has been reported higher than yttriastabilized zirconia (YSZ) [3–5]. Being more conductive thanthe baseline electrolyte, LAMOX is considered as a candidatefor the electrolyte of intermediate temperature SOFC, whosematerials cost could be reduced significantly because inexpen-sive interconnect materials can be implemented. A properselection of the cathode composition interfaced to LAMOX
plays a leading role in its SOFC efficiency of power productionsince the cathodic loss constitutes a major fraction of totalpolarization loss, especially at low operating temperatures [6,7].
Perovskite-type oxides of lanthanum, such as (La1− xAx)BO3
(A=Sr or Ca, B=Mn, Co, or Fe), appear to be a rational choicefor cathode in contact with a LAMOX electrolyte because of thecommon La element. (La1− xAx)BO3 cathodes have receivedconsiderable research attention in the literature. (La1− xSrx)MnO3 (LSM) is the first functional SOFC cathode interfaced toYSZ, operated at ~1000 °C. Yet the insufficient ion conduc-tivity of LSM at lower temperatures (≤800 °C) leads to a majorpolarization loss and a poor energy efficiency [8–10]. A numberof reports have demonstrated that (La1− xSrx)(CoyFe1− y)O3
(LSCF) is a low loss cathode composition at low and inter-mediate operation temperatures. LSCF is not only a betteroxygen ion conductor but also a more active catalyst for oxygenreduction reaction (ORR), mainly because of cobalt on the Bsite of this perovskite [11–15]. However, LSCF of high Co
Available online at www.sciencedirect.com
Solid State Ionics 179 (2008) 330–337www.elsevier.com/locate/ssi
⁎ Corresponding author. Department of Chemical Engineering, NationalTaiwan University of Science and Technology, 43, Keelung Road, Section 4,Taipei 10607 Taiwan. Tel.: +886 2 2737 6618; fax: +886 2 2737 6644.
E-mail address: [email protected] (D.-S. Tsai).
0167-2738/$ - see front matter © 2008 Elsevier B.V. All rights reserved.doi:10.1016/j.ssi.2008.02.044

Author's personal copy
content tends to react more readily with YSZ electrolyte and itslarge thermal expansion coefficient is difficult for YSZ to matchwith [16,17]. Furthermore, although Sr is probably the bestalkaline earth for A site substitution, strontium of the cathodehas been shown to react with Mo of LAMOX and form SrMoO4
in the intermediate temperature range 600–700 °C [18]. Thisresult was also confirmed in our laboratory in the pursuit of anappropriate cathode composition interfacing LAMOX. Repla-cing Sr with Ca, LCCF seems to be an adequate alternative forthe cathode composition [19].
In this contribution, we explore the electrochemical perfor-mance of lanthanum deficient LCCF as LAMOX cathode. Spe-cifically, we study its ORR polarization loss and the influentialfactors when interfacing lanthanum dysprosium tungsten molyb-date (LDMW). The LDMW composition is chosen for the elec-trolyte since the Dy substitution on the La site suppresses theα–βphase transformation of La2Mo2O9 and raises its ion conductivityin the high-temperature range. The W substitution on Mo siteenhances the structure stability against hydrogen reduction, butlowers its high-temperature ion conductivity. The ion conductiv-ity of LDMW is found involved in the ORR polarization loss.
2. Experimental
2.1. LCCF and LDMW preparation and notation
Both LCCF and LDMWoxide powders were prepared via thesolid state reaction route, using high-purity chemicals of La2O3
(Aldrich, N99.9%), CaCO3 (Kanto, N99.9%), Co3O4 (Alfa Aesar,N99.7%), Fe2O3 (Alfa Aesar, N99.9%), Dy2O3 (Sigma, N99.9%),MoO3 (Aldrich, N99.5%), WO3 (Aldrich, N99.9%) as reactants.These chemicals were used as-received without further treatment,except La2O3. The powder of La2O3was dried at 430 °C for 4 h toreduce its water content before weighing its stoichiometricamount. The starting chemicals were mixed in a polyethylene jarwith partial stabilized zirconia balls. LDMWof tungsten content0–50 mol% was calcined at 880 °C for 1 h, and pulverized andmilled using agate mortar and pestle. The green pellets wereuniaxially pressed, and sintered at 950 °C for 6 h. The sintereddisks of LDMW were sufficiently densified, their relative den-sities were 96–98%,measured by the Archimedesmethod. LCCFpowders of cobalt content 10–90 mol% were calcined at 1200 °Cfor 2 h, ball milled in ethyl alcohol for 48 h, then collected anddried. For each LCCF composition, a thick paste was prepared bymixing the LCCF milled powder 40 wt.%, with ethyl cellulose10 wt.% and terpineol 50 wt.%, in another ball mill. The LCCFfine particles were suspended indefinitely in the paste, ready forscreen printing.
Owing to the hygroscopic nature of La2O3 powder and theincomplete water removal, the prepared LCCF and LDMWsamples are La-deficient. The calcium content of LCCF is fixedat 25 mol%. The solid solutions of (La0.74Ca0.25)(CoxFe1− x)O3
are denoted by its Co content. For example, LCCF46 means theCo content is 40 mol% and the Fe content 60 mol%. Similarly,the Dy content of LDMW is fixed at 10 mol%. The solidsolutions of (La1.78Dy0.2)(Mo2− yWy)O9 are denoted by its Wcontent. LDMW82 means the Mo content is 80 mol% and the
W content 20 mol%. If the W content is 0 mol%, the electrolyteis denoted as LDM. In the earlier thermal analysis experiments,we checked the possibility of solid state reaction between LCCF(50 wt.%) and LDMW (50 wt.%) in their mixtures. We found nothermal event in the temperature range 300–900 °C.
2.2. Structure analysis
The crystalline phases of LCCF and LDMW were examined,using an X-ray diffractometer equipped with a Cu Kα radiationsource and operated at 40 kVand 100mA (D/MAX-RC, Rigaku).X-ray diffraction (XRD) patterns were recorded in the 2θ range15–90° at 0.05° per stepwith 3 s counting time for each step.XRDpatterns of the calcined powder were recorded until the resultindicated a single phase. Lattice constants of the solid solutionswere calculated in fitting the diffraction positions using Unit Cell,which is the non-linear least squares cell refinement programauthored by Holland and Redfern [20]. And the correlated latticeconstants were used in calculating the theoretical densities of solidsolutions and their relative densities. Microstructures of porouscathodes and the cathode/electrolyte interfacewere analyzed usinga field-emission scanning electron microscope (JSM-6500F,JEOL), which was equipped with an energy dispersive spectro-meter EDS (INCA, Oxford) for elemental analysis.
2.3. Electrochemical measurements
The electrochemical performance of LCCF was evaluatedusing a half cell of three-electrode configuration. The electrolytewas a dense disk, 13mm in diameter and 1.2mm in thickness. Thecircular LCCFcathodewas porous, 0.636 cm2 in area and 4–5µmin thickness. The LCCF cathode was screen-printed on LDMW,and sintered at 900 °C for 3 h. The counter and reference elec-trodes were painted on the electrolyte using Pt paste (C3605 P/S,Heraeus), and sintered at 900 °C for 30 min. The area of counterelectrode was 0.636 cm2, that of reference electrode was 6 mm2.The half-cell experiments were conducted in air at temperature600–800 °C, which was measured by an inserted thermocouple.For impedance measurements, a Solartron 1260 frequencyanalyzer was employed. The impedance spectra were recordedin the frequency range 0.01 Hz–1 MHz at open circuit potential,with perturbation amplitude of 50 mV. Impedance data under 0–100 mV dc bias were also collected for the selected composition.The impedance measurement control and its data fitting werecarried out using the ZPLOTsoftware. To double check the valuesof exchange current density obtained from impedance analysis, i–V data of selected samples were measured by a Solartron 1287potentiostat, and collected in the potentiodynamic experiment thatwas controlled by the CorrWare software. The potential sweepwas performed from −0.5 V to 0.3 V.
3. Results and discussion
3.1. Structure of LCCF solid solution
Typical XRD patterns of LCCF used in the paste are illustratedin Fig. 1. The diffraction results of LCCF with various Co
331C.-W. Chen et al. / Solid State Ionics 179 (2008) 330–337

Author's personal copy
contents display sharp reflections and clear features of theperovskite structure when the calcination temperature was above1200 °C. The patterns of 850 and 1000 °C calcined powders werealso examined, each of the most intense four reflections was splitinto two or three peaks, suggesting two or more solid solutions ofperovskite were present simultaneously. Additionally, the porouscathodes prepared using 850 and 1000 °C calcined powdersresulted in higher polarization losses. Therefore the impedanceresults reported afterward were measured on the cathode preparedwith 1200 °C calcined powders only. Fig. 1 indicates the peakpositions shift toward higher angles with increasing Co content,because the d-spacing of LCCF shrinks when Fe3+ (0.645 Å atcoordination number CN=6) is substituted by smaller Co3+
(0.610 Å at CN=6). The diffraction lines are indexed on anorthorhombic cell, according to McCready and Kingsley [21].
The correlated lattice parameters (a, b, and c) along with thevolume of orthorhombic cell for (La0.74Ca0.25)(CoxFe1− x)O3
are plotted in Fig. 2. The three lattice parameters and the cellvolume decrease almost linearly with increasing Co content. Thecell length c declines more rapidly than the other two lengthsa, b. Fig. 2 also reveals that minor deviations from the linearrelation at high cobalt contents, x=0.8 and 0.9. Similar linearvariations in lattice parameters and cell volume were reportedon the solid solutions of (LnSr)(CoFe)O3 (Ln=Pr, Nd, Gd)perovskites [22].
One feature noteworthy in the patterns of Fig. 1 is thesplitting in reflections at 2θ=40–41, 46.5–47.5, 58–59, 68–69.5, 77.5–79°. The doublet becomes evident when x≥0.5.Merino and his co-workers reported that the above doublets
changed into single lines when 20 or 40 mol% Ca was sub-stituted in the A site of La(CoFe)O3, which was prepared at700 °C using the citrate method [23]. Nevertheless, their XRDpatterns of LCCF with high cobalt content showed high-angledoublets or an apparent broadening in the low-angle lines.
3.2. Impedance spectra and ORR loss
Fig. 3 shows two representative impedance results of LCCF,along with the equivalent circuit used in fitting. The impedancecurve of LCCF55/LDMW82 at 800 °C, shown in Fig. 3(a),includes a large arc at low frequencies and a much smaller arc athigh frequencies. The low-frequency arc is nearly a semicircle,while the high-frequency one is relatively incomplete anddepressed. The apex is located at the rear of arc. Evidently, theimpedance data can be fitted to an equivalent circuit of theelectrolyte resistance Rohm in series with (RHF/CPEHF) and(RLF/CPELF), where R is the resistance, CPE is the constantphase element, and the subscripts HF and LF denote the highand low frequencies. The attribute of two discrete RC isgenerally more evident at high temperatures or high Co con-tents, when the arcs shrink significantly. The other typicalimpedance curve, shown in Fig. 3(b), was recorded on LCCF28/LDMW82 at 800 °C. The impedance curve appears to be acombination of the high-frequency diffusion contribution (~45°line) and the low-frequency RC contribution, in which the high-frequency contribution may be fitted by a Warburg element.Nyquist plots similar to Fig. 3(b) were recorded on the LCCFsamples of low Co contents or at low temperatures, when thelow-frequency arc dwarfed the high-frequency arc. In theliterature, the former equivalent circuit was more widespreadthan the latter in impedance data fitting [24–27]. We prefer the
Fig. 2. Variations in the lattice constant a, b, and c of LCCF orthorhombic cellwith respect to its cobalt content. An inset shows the linear decline in cellvolume.
Fig. 1. XRD patterns of 1200 °C calcined (La0.74Ca0.25)(CoxFe1− x)O3 x=0.2,0.4, 0.6, 0.8.
332 C.-W. Chen et al. / Solid State Ionics 179 (2008) 330–337

Author's personal copy
equivalent circuit of two (R/CPE) in series, since Fig. 3(b)seems to be a degenerate curve of Fig. 3(a). Furthermore, thefitted value of CPE exponent n can quantify the arc shapeevolution. The fitted CPELF exponent of Fig. 3(a) is 0.89, andthat of Fig. 3(b) 0.84, indicating both of the low-frequency arcssufficiently resemble a semicircle. In contrast, the fitted CPEHF
exponent of Fig. 3(b) 0.51 clearly points out the high-frequencycurve looks like a diffusion contribution, since CPE is virtuallya distorted Warburg element at n=0.5±0.1. Additionally, thefitted CPEHF exponent of Fig. 3(a) 0.66 means the impedancecurve is more a semicircle than a straight line.
In the temperature range of SOFC interest, the cathodepolarization loss mainly resides in the low-frequency arc whosemechanistic origin has been recognized quite complex [28]. Thegeneral opinion is that the high-frequency arc arises from theelectron-transfer and ion-transfer processes occurring at theinterfaces of current collector/electrode and electrode/electro-lyte. The low-frequency arc is the convoluted contributions ofORR surface reaction, solid state ion diffusion, and gas-phasediffusion in the pore space [28–31]. Hence, the low-frequencyimpedance, representing the ORR catalytic performance ofporous cathode in converting electrons into oxygen ions, is acentral issue in the following discussion.
Nyquist plots of LCCF82/LDMW82 zero-bias impedanceare illustrated in Fig. 4. Also marked in the low-frequency arcs
are the frequencies at the apexes of imaginary impedance, whichare approximately the reciprocals of time constant. The apexfrequency increases rapidly with increasing temperature,0.089 Hz (600 °C)–12.6 Hz (800 °C), signifying a quick uprisein the ORR rate. Table 1 lists the fitted values of low-frequencyresistance, capacitance, and CPE exponent of Fig. 4. The ca-pacitance value slightly increases with increasing temperature,7.79 (600 °C) and 14.93 (800 °C) mF cm−2. Its magnitude ismuch larger than the value of classical double layer capacitance1–10 µF cm−2. The capacitance value is comparable to that of thedense LSCFmicroelectrode 15mF cm−2 (750 °C) [31], the denseBa0.5Sr0.5Co0.8Fe0.2O3 microelectrode 30 mF cm−2 (750 °C)
Fig. 4. Nyquist plots of LCCF82/LDMW82 at (a) 800 and 750 °C; (b) 700, 650,and 600 °C. The fitted values of the low-frequency resistance and capacitanceare listed in Table 1.
Table 1Values of zero-bias resistance, capacitance, and CPE exponent of the low-frequency arc for LCCF82/LDMW82, measured at 600–800 °C
Temperature (°C) RLF (Ω cm2) Capacitance a (mF cm−2) CPE exponent n
600 242.4 7.79 0.830650 50.7 9.62 0.868700 12.0 10.98 0.872750 2.97 12.76 0.885800 0.845 14.93 0.894a The equation for CPE is written as impedance Z=[Q(jω)n]−1, in which Q is
the proportional factor, j the imaginary number,ω the frequency. The capacitancevalue is extracted from (Q/RLF
(n−1))1/n, RLF is the parallel resistance [39].
Fig. 3. Typical zero-bias impedance spectra and the equivalent circuit used indata fitting. The impedance results of (a) LCCF55 and (b) LCCF28 both weremeasured in contact with LDMW82 electrolyte at 800 °C.
333C.-W. Chen et al. / Solid State Ionics 179 (2008) 330–337
Author's personal copy
[15], the porous LSCF electrode 3.6 mF cm−2 (n=0.67, 700 °C)[32], the porous LSM electrode 12×10−3 Ω−1 cm−2 sn (n=0.9,900 °C) [33], and the porous LSM electrode 12.2×10⁻³ Ω−1
cm−2 sn (n=0.7, 700 °C) [34]. On the other hand, theRLF value ofLCCF82 is generally less than that of LSM, larger than that ofLSCF. The RLF value of LCCF82 is 12.0 (700 °C), and 0.845 Ωcm2 (800 °C). The ORR resistance value of porous LSCF wasmeasured 0.3 Ω cm2 (700 °C) [32], 0.35 Ω cm2 (700 °C) [34],while that of porous LSM was 54.52 Ω cm2 (700 °C) [34],12.2 Ω cm2 (800 °C) [25].
The low-frequency resistance of LCCF/LDMW exhibits astrong temperature dependency. The fitted RLF values of LCCFcontaining 10–90mol% cobalt are summarized in Fig. 5. Straightlines of the Arrhenius-like plots shown in Fig. 5(a) are packed athigh Co contents (≥50mol%), while discrete at low Co contents.Fig. 5(b) reveals that the activation energy Ea increases from 189(10 mol% Co) to 213 kJ mol−1 (40 mol% Co), and levels off~216 kJ mol−1 at higher Co contents. In the same figure, the RLFvalue of LCCF at 750 °C demonstrates a similar cobalt influence.The RLF value decreases rapidly from 67.9Ω cm2 (10 mol% Co)to 9.1Ω cm2 (40 mol% Co). Further reduction on RLF is difficultas the Co content is over 50mol%. TheminimumRLF at 750 °C is2.97 Ω cm2 of LCCF82.
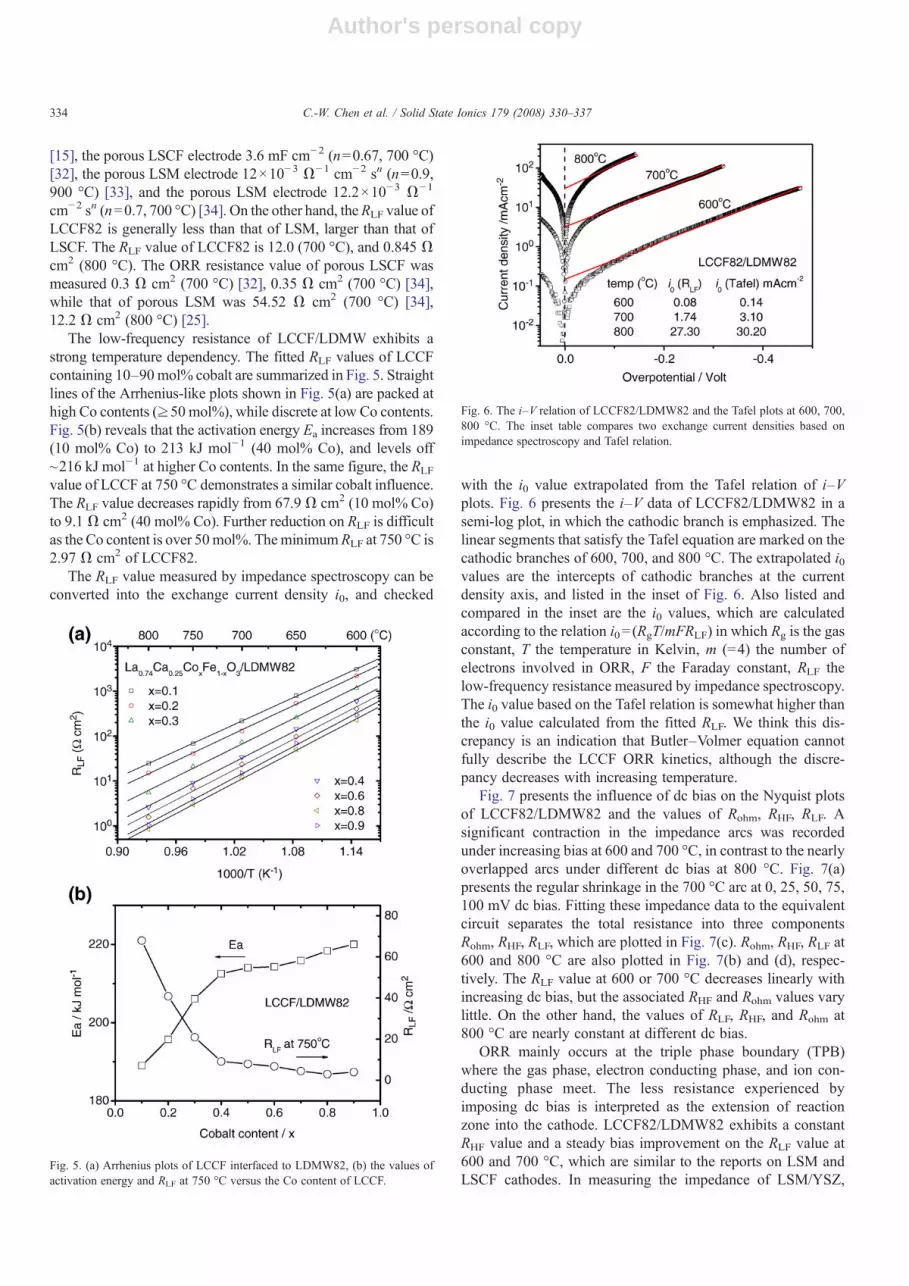
The RLF value measured by impedance spectroscopy can beconverted into the exchange current density i0, and checked
with the i0 value extrapolated from the Tafel relation of i–Vplots. Fig. 6 presents the i–V data of LCCF82/LDMW82 in asemi-log plot, in which the cathodic branch is emphasized. Thelinear segments that satisfy the Tafel equation are marked on thecathodic branches of 600, 700, and 800 °C. The extrapolated i0values are the intercepts of cathodic branches at the currentdensity axis, and listed in the inset of Fig. 6. Also listed andcompared in the inset are the i0 values, which are calculatedaccording to the relation i0= (RgT/mFRLF) in which Rg is the gasconstant, T the temperature in Kelvin, m (=4) the number ofelectrons involved in ORR, F the Faraday constant, RLF thelow-frequency resistance measured by impedance spectroscopy.The i0 value based on the Tafel relation is somewhat higher thanthe i0 value calculated from the fitted RLF. We think this dis-crepancy is an indication that Butler–Volmer equation cannotfully describe the LCCF ORR kinetics, although the discre-pancy decreases with increasing temperature.
Fig. 7 presents the influence of dc bias on the Nyquist plotsof LCCF82/LDMW82 and the values of Rohm, RHF, RLF. Asignificant contraction in the impedance arcs was recordedunder increasing bias at 600 and 700 °C, in contrast to the nearlyoverlapped arcs under different dc bias at 800 °C. Fig. 7(a)presents the regular shrinkage in the 700 °C arc at 0, 25, 50, 75,100 mV dc bias. Fitting these impedance data to the equivalentcircuit separates the total resistance into three componentsRohm, RHF, RLF, which are plotted in Fig. 7(c). Rohm, RHF, RLF at600 and 800 °C are also plotted in Fig. 7(b) and (d), respec-tively. The RLF value at 600 or 700 °C decreases linearly withincreasing dc bias, but the associated RHF and Rohm values varylittle. On the other hand, the values of RLF, RHF, and Rohm at800 °C are nearly constant at different dc bias.
ORR mainly occurs at the triple phase boundary (TPB)where the gas phase, electron conducting phase, and ion con-ducting phase meet. The less resistance experienced byimposing dc bias is interpreted as the extension of reactionzone into the cathode. LCCF82/LDMW82 exhibits a constantRHF value and a steady bias improvement on the RLF value at600 and 700 °C, which are similar to the reports on LSM andLSCF cathodes. In measuring the impedance of LSM/YSZ,
Fig. 5. (a) Arrhenius plots of LCCF interfaced to LDMW82, (b) the values ofactivation energy and RLF at 750 °C versus the Co content of LCCF.
Fig. 6. The i–V relation of LCCF82/LDMW82 and the Tafel plots at 600, 700,800 °C. The inset table compares two exchange current densities based onimpedance spectroscopy and Tafel relation.
334 C.-W. Chen et al. / Solid State Ionics 179 (2008) 330–337

Author's personal copy
Jiang [34] reported a constant RHF value and a decreasing RLF
value with increasing bias at 700 °C, but an increase-then-decrease RLF value at 800 °C. On the impedance of LSCF/SDC,the electrode resistance at 700 °C slightly decreased, while theresistance at 800 or 900 °C remained constant under increasingdc bias. Lee and his co-workers [25] reported a decreasing RLF
value with increasing dc bias at 800 °C for LSM/YSZ. Appar-ently the extension of reaction zone by imposing dc bias is moreeffective at 700 °C than 800 °C. The extension is more sig-nificant for LSM than LSCF, because the ORR resistance ofLSCF is already small. Regarding the dc bias influence, the low-frequency resistance of LCCF82 is less affected when comparedwith that of LSM, more affected when compared with that ofLSCF.
3.3. Influences of LDMW electrolyte
The electrocatalytic performance of LCCF is also affected bythe tungsten content (or the ion conductivity) of its interfacingelectrolyte. Similar to other LAMOX ion conductors, the ionconductivity of LDMW decreases with increasing tungstencontent on the Mo site [35–37]. Fig. 8(b) is a semi-log plot,showing the LDMW ion conductivities at 600, 700, 800 °C inthe range of 0–50 mol% tungsten. Fig. 8(a) displays theelectrolyte effect on the 700 °C impedance arc of LCCF82/LDMW, which inflates in size and shifts to the right as the Wcontent increases. Hence the fitted Rohm and RLF values increaseas the W content increases at 700 °C. Similar increases in Rohm
and RLF at 600 and 800 °C have also been recorded. Ourdiscussion is focused on the connection between RLF and theelectrolyte ion conductivity.
If the oxygen ion, being reduced on cathode, is assumed totraverse the electrolyte sufficiently fast, the exchange currentdensity i0 is supposed to be independent of the electrolyte ionconductivity σ. As pointed out by Uchida and his co-workers[38], the assumption held true for a Pt cathode in contact with
Fig. 8. Influence of the electrolyte ion conductivity on ORR kinetics of LCCF82.(a) Contraction of the impedance arc at 700 °C with decreasing W content ofLDMW. (b) Variation of ion conductivity of LDMW with respect to its Wcontent.
Fig. 7. Influence of dc bias on (a) the impedance curve of LCCF82/LDMW82 at700 °C; the fitted values of Rohm, RHF, RLF at (b) 600 °C, (c) 700 °C, (d) 800 °C.
Fig. 9. Exchange current density of LCCF82 versus the ion conductivity of itsinterfacing electrolyte LDMW at 600, 700, 800 °C.
335C.-W. Chen et al. / Solid State Ionics 179 (2008) 330–337

Author's personal copy
the electrolytes based on zirconia at 900 and 1000 °C, in whichthe rate-determining step was either the oxygen dissociation orthe oxygen transport on the Pt surface. In contrast, the log–logplot of i0 versus σ for Pt/zirconia (800 °C) and LSM/zirconia(800–1000 °C) exhibited a first-order relation (slope=1.0),indicating both the surface steps on cathode and the oxygen iontransport into the electrolyte were rate-determining. Addition ofdispersed Pt nanoparticles in LSM enhanced the rate of itssurface steps, not the ion transport rate of electrolyte, so that thei0 dependence on the electrolyte ion conductivity was magnifiedand the slope became ~2.0. Regarding LCCF82/LDMW, Fig. 9shows a positive correlation in the log–log plot of i0 (calculatedusing the RLF value of LCCF82) versus σ (the ion conductivityof LDMW). The six data points measured at 600 °C fall on astraight line whose slope is 0.6. But the data points of 700 °Cappear to fall on two lines with different slopes. The i0 values ofy=0.0, 0.2, and 0.4 are on a line with slope 0.2, which is lessthan the slope of a line consisting of y=0.4, 0.6, 0.8, 1.0. Thedata points of 800 °C also fall on two separate lines. Hence theelectrolyte ion conductivity of LDMW does play a role in theORR kinetics of LCCF82, but the influence of tungsten contentseems to be more complicated than the variation of ion conduc-tivity of interfacing electrolyte.
Fig. 10 illustrates the porous structure of LCCF82 interfacedto a dense electrolyte LDMW55. The thickness of porousLCCF82 is estimated 4.7 µm from the cross-sectional image.The front view of Fig. 10(a) indicates some aggregates of 0.6–0.9 µm in size are present among many small and connectedgrains of 0.1–0.2 µm. The EDS elemental analysis of LCCF82detects a small amount of Mo, whose implication and influencerequire further investigation.
4. Conclusions
The electrocatalytic performance of (La0.74Ca0.25)(CoxFe1− x)O3 (x=0.1–0.9) has been investigated at 600–800 °C usingimpedance spectroscopy. In contact with LDMW, LCCF82 is theoptimum composition in terms of low ORR resistance. The zero-bias ORR resistance of LCCF82/LDMW82 at 800 °C is0.845 Ω cm2, generally less than LSM and higher than LSCF.The ORR resistance displays a high temperature dependency,with its activation energy 218 kJ mol−1. The associated capac-itance of LCCF82 is comparable to the values of LSM and LSCF.The ORR rate processes of LCCF82 are co-limited by its surfacereaction on cathode and the oxygen transport into the electrolyte.Changing the ion conductivity of its interfacing LDMW byvarying the tungsten content affects the exchange current densityof LCCF82.
Acknowledgement
This work is financially supported by the National ScienceCouncil of Taiwan through project nos. NSC 95-ET-011-003-ET and 96-ET-011-003-ET.
References
[1] A. Lashtabeg, S.J. Skinner, J. Mater. Chem. 16 (2006) 3161.[2] H. Yokokawa, N. Sakai, T. Horita, K. Yamaji, M.E. Brito, MRS Bull. 30
(2005) 591.[3] P. Lacorre, F. Goutenoire, O. Bohnke, R. Retoux, Y. Laligant, Nature 404
(2000) 856.[4] F. Goutenoire, O. Isnard, R. Retoux, P. Lacorre, Chem. Mater. 12 (2000)
2575.[5] F. Goutenoire, O. Isnard, E. Suard, O. Bohnke, Y. Laligant, R. Retoux, P.
Lacorre, J. Mater. Chem. 11 (2001) 119.[6] M. Feng, J.B. Goodenough, K. Huang, C. Milliken, J. Power Sources 63
(1996) 47.[7] M.T. Colomer, B.C.H. Steele, J.A. Kilner, Solid State Ionics 147 (2002) 41.[8] J.M. Ralph, C. Rossignol, R. Kumar, J. Electrochem. Soc. 150 (2003)
A1518.[9] S.P. Jiang, J. Power Sources 124 (2003) 390.[10] I. Yasuda, K. Ogasawara, M. Hishinuma, T. Kawada, M. Dokiya, Solid
State Ionics 86–88 (1996) 1197.[11] S. Bebelis, N. Kotsionopoulos, A. Mai, F. Tietz, J. Appl. Electrochem. 37
(2007) 15.[12] L.W. Tai, M.M. Nasrallah, H.U. Anderson, D.M. Sparlin, S.R. Sehlin,
Solid State Ionics 76 (1995) 259.[13] Y. Teraoka, H.M. Zhang, K. Okamoto, N. Yamazoe, Mater. Res. Bull. 23
(1988) 51.[14] J.W. Stevenson, T.R. Armstrong, R.D. Carneim, L.R. Pederson, W.J.
Weber, J. Electrochem. Soc. 143 (1996) 2722.[15] F.S. Baumann, J. Fleig, H.U. Habermeier, J. Maier, Solid State Ionics 177
(2006) 3187.
Fig. 10. SEM micrographs of LCCF82/LDMW55, showing (a) the top view, (b)the cross-sectional view of LCCF82.
336 C.-W. Chen et al. / Solid State Ionics 179 (2008) 330–337

Author's personal copy
[16] K.T. Lee, A. Manthiram, J. Electrochem. Soc. 153 (2006) A794.[17] H. Uchida, S. Arisaka, M. Watanabe, Electrochem. Solid-State Lett. 2
(1999) 428.[18] G. Corbel, S. Mestiri, P. Lacorre, Solid Stat Sci. 7 (2005) 1216.[19] M.H. Hung, M.V. Madhava Rao, D.S. Tsai, Mater. Chem. Phys. 101
(2007) 297.[20] T.J.B. Holland, S.A.T. Redfern, Mineral. Mag. 61 (1997) 65.[21] D.E. McCready, J.J. Kingsley, Powder Diffr. 9 (1994) 143.[22] L. Qiu, T. Ichikawa, A. Hirano, N. Imanishi, Y. Takeda, Solid State Ionics
158 (2003) 55.[23] N.A. Merino, B.P. Barbero, C. Cellier, J.A. Gamboa, L.E. Cadus, Catal.
Lett. 113 (2007) 130.[24] S.P. Jiang, J.G. Love, Y. Ramprakash, J. Power Sources 110 (2002) 201.[25] H.Y. Lee, W.S. Cho, S.M. Oh, H.D. Wiemhofer, W. Gopel, J. Electrochem.
Soc. 142 (1995) 2659.[26] I.R. de Larramendi, N. Ortiz, R. Lopez-Anton, J.I.R. de Larramendi, T.
Rojo, J. Power Sources 171 (2007) 747.[27] N. Grunbaum, L. Dessemond, J. Fouletier, F. Prado, A. Caneiro, Solid
State Ionics 177 (2006) 907.
[28] S.B. Adler, Chem. Rev. 104 (2004) 4791.[29] S.B. Adler, Solid State Ionics 135 (2000) 603.[30] S.B. Adler, J.A. Lane, B.C.H. Steele, J. Electrochem. Soc. 143 (1996) 3554.[31] F.S. Baumann, J. Fleig, H.U. Habermeier, J. Maier, Solid State Ionics 177
(2006) 1071.[32] J. Liu, A.C. Co, S. Paulson, V.I. Birss, Solid State Ionics 177 (2006) 377.[33] A.C. Co, S.J. Xia, V.I. Birss, J. Electrochem. Soc. 152 (2005) A570.[34] S.P. Jiang, Solid State Ionics 146 (2002) 1.[35] T.Y. Jin, M.V. Madhava Rao, C.L. Cheng, D.S. Tsai, M.H. Hung, Solid
State Ionics 178 (2007) 367.[36] P. Pinet, J. Fouletier, S. Georges, Mater. Res. Bull. 42 (2007) 935.[37] S. Georges, F. Goutenoire, Y. Laligant, P. Lacorre, J. Mater. Chem. 13
(2003) 2317.[38] H. Uchida, M. Yoshida, M. Watanabe, J. Electrochem. Soc. 146 (1999) 1.[39] E. Barsoukov, J.R. Macdonald, Impedance Spectroscopy, 2nd Ed., Wiley-
Interscience, Hoboken, New Jersey, 2005, p. 495.
337C.-W. Chen et al. / Solid State Ionics 179 (2008) 330–337