Embed Size (px)
Citation preview

IJSRSET1622296 | Received : 13 April 2016 | Accepted : 20 April 2016 | March-April 2016 [(2)2: 833-842]
© 2016 IJSRSET | Volume 2 | Issue 2 | Print ISSN : 2395-1990 | Online ISSN : 2394-4099 Themed Section: Engineering and Technology
833
Electrochemical Corrosion Behavior, Microstructure, Mechanical and Thermal Performance of Tin-Aluminum Based Bearing Alloys
Abu Bakr El-Bediwi1, N. A. El-Shishtawi1, Manal Mawloud Abdullah1, 2
1Metal Physics Lab., Physics Department, Faculty of Science, Mansoura University, Egypt 1, 2 Faculty of Education Aboaesa, University of Alzawya, Libya
ABSTRACT
Electrochemical corrosion behavior, elastic modului, internal friction, Vickers hardness, thermal performance and
microstructure of Sn80Al20, Sn70Al20Bi5Zn3Cu2, Sn65Al20Sb5Pb5Cd5, Sn70Al20Sb5Ag3Zn2 and Sn63Al20Sb10Pb5Zn2
alloys have been investigated. Internal friction of Sn80Al20 alloy decreased after adding Bi- Zn- Cu or Sb- Pb- Cd or
Sb- Ag- Zn or Sb- Pb- Zn elements. Elastic modulus and lattice microstrain of Sn80Al20 alloy decreased after adding
Bi- Zn- Cu or Sb- Pb- Cd or Sb- Ag- Zn but it’s increased after adding 10%Sb- 5%Pb- 2%Zn. Vickers hardness of
Sn80Al20 alloy varied after adding Bi- Zn- Cu or Sb- Pb- Cd or Sb- Ag- Zn or Sb- Pb- Zn elements. The corrosion
rate of Sn80Al20 alloy in 0.5 M HCl increased after adding Bi- Zn-Cu or Sb- Ag- Zn or Sb- Pb- Zn elements but it’s
decreased after Sb-Pb-Cd elements. The corrosion current density (icorr) of Sn80Al20 alloy in 0.5 M HCl increased
after adding Bi- Zn-Cu or Sb- Pb- Cd or Sb- Pb- Zn elements but it’s decreased after Sb-Ag-Zn elements. The
Sn70Al20Sb5Ag3Zn2 alloy has the beast properties for bearing applications.
Key words: Corrosion Parameters, Microstructure, Elastic Modulus, Internal Friction, Vickers Hardness, Thermal
Behavior
I. INTRODUCTION
Bearings are used as a mechanical component to transfer
the power and to move a certain part which makes them
rotate easily. It can be classified into two major groups,
sliding bearings and rolling bearings, depending on their
friction type. Bearings are used to prevent friction
between parts during relative movement. Tin-based
bearing alloys with different compositions is widely
used in the automotive industry and especially in heavy
industrial service conditions [1]. High tin- aluminum
alloys are used as linings bonded to a steel-backing strip.
Aluminum- tin alloys have good mechanical properties
with conformability but these are quite costly. Al-Sn
alloys have a very long history to be used as bearing
materials [2]. Also Al-Sn alloys deliver a good
combination of strength and surface properties [3]. Low
modulus of elasticity is required in a bearing alloy to
ensure good compatibility with the journal surface.
Aluminum has a low modulus of elasticity. Indium and
lead have the lowest modulus of elasticity of all the soft
phases alloying with aluminum [4]. The fatigue strength
of cold worked and heat treated AlSn20Cu1 alloy having
reticular structure is close to that of CuPb30 alloy with
higher seizure resistance [5]. Aluminum- tin based
alloys are widely used as sliding bearing materials in
automobile and shipbuilding industry [6, 7]. Tin phase
in Al-Sn bearing materials can provide suitable friction
properties and shear surface during sliding because it's
low modulus, low strength and the excellent anti-
welding characteristics with iron [6]. Two compositions
of aluminum base alloys were selected and equal
amounts of tin and lead as a soft phase were prepared by
impeller mixing and chill casting technique [8].
Aluminum- tin and lead- aluminum alloys slightly differ
in mechanical properties. Adding Ag or Au to SnSb5
alloy reduced the melting temperature and increased the
capabilities for precipitation hardening [9]. But strength
and ductility of SnSb5 alloy improved after adding Bi or
Cu content [10]. Elastic modulus and internal friction of
Sn86Sb10Cu2X2 (X = Pb or Ag or Se or Cd- Zn) alloys
dependent on alloy composition [11]. The influence of

International Journal of Scientific Research in Science, Engineering and Technology (ijsrset.com)
834
adding Cu or Ag or Cu- Ag on structure, electrical
resistivity and elastic modulus of SnSb7 alloy has been
investigated [12]. The SnSb7Ag2Cu2 has best bearing
properties such as lowest internal friction, cast and
adequate elastic modulus. Adding 1 wt. % Cu or Ag
improved mechanical properties of Sn-Sb alloy [13].
Adding Bi or Cu to SnSb5 alloy increased both ultimate
tensile strength (UTS) and ductility [14]. Adding (Cu-
Pb) to Sn-Sb alloy improves their elastic modulus,
internal friction, hardness and thermal conductivity [15].
The aim of this research was to investigate the
modification structure by adding different alloying
elements on electrochemical corrosion behavior,
hardness, elastic modulus, internal friction and thermal
performance of tin-aluminum based alloy
II. METHODS AND MATERIAL
Were melted in a muffle furnace using tin, aluminum,
bismuth, zinc, copper, lead, antimony, sliver and
cadmium of purity better than 99.5 %. The resulting
ingots were turned and re-melted four times to increase
the homogeneity. Long ribbons of 4 mm width and
~80 µm thickness were prepared by melt spinning
technique. The surface velocity of the roller was 31.4
m/s giving a cooling rate of ~3.7 × 10⁵ K/s. The samples
then cut into convenient shape for the measurements
using double knife cuter. Microstructure of used
samples was performed using scanning electron
microscope (JEOL JSM-6510LV, Japan) and Shimadzu
X–ray Diffractometer (Dx–30, Japan) of Cu–K
radiation with =1.54056 Å at 45 kV and 35 mA and
Ni–filter in the angular range 2 ranging from 0 to 100°
in continuous mode with a scan speed 5 deg/min. The
differential thermal analysis (DSC) thermographs were
obtained by SDT Q600 (V20.9 Build 20) instrument (U.
S. A) with heating rate 10 k/min in the temperature
range 50-400 C. All the samples have the same mass,
which is 2 mg. A digital Vickers micro-hardness tester,
(Model-FM-7- Japan), was used to measure Vickers
hardness values. The internal friction Q–1
and the elastic
constants were determined using the dynamic resonance
method. The value of the dynamic Young modulus E is
determined by the relationship [16– 18].
Electrochemical corrosion measurements of used alloys
were performed using Gamry Instrument PCI4G750
Potentiostat/Galvanostat/ZRA.
III. RESULTS AND DISCUSSION
A. Microstructure
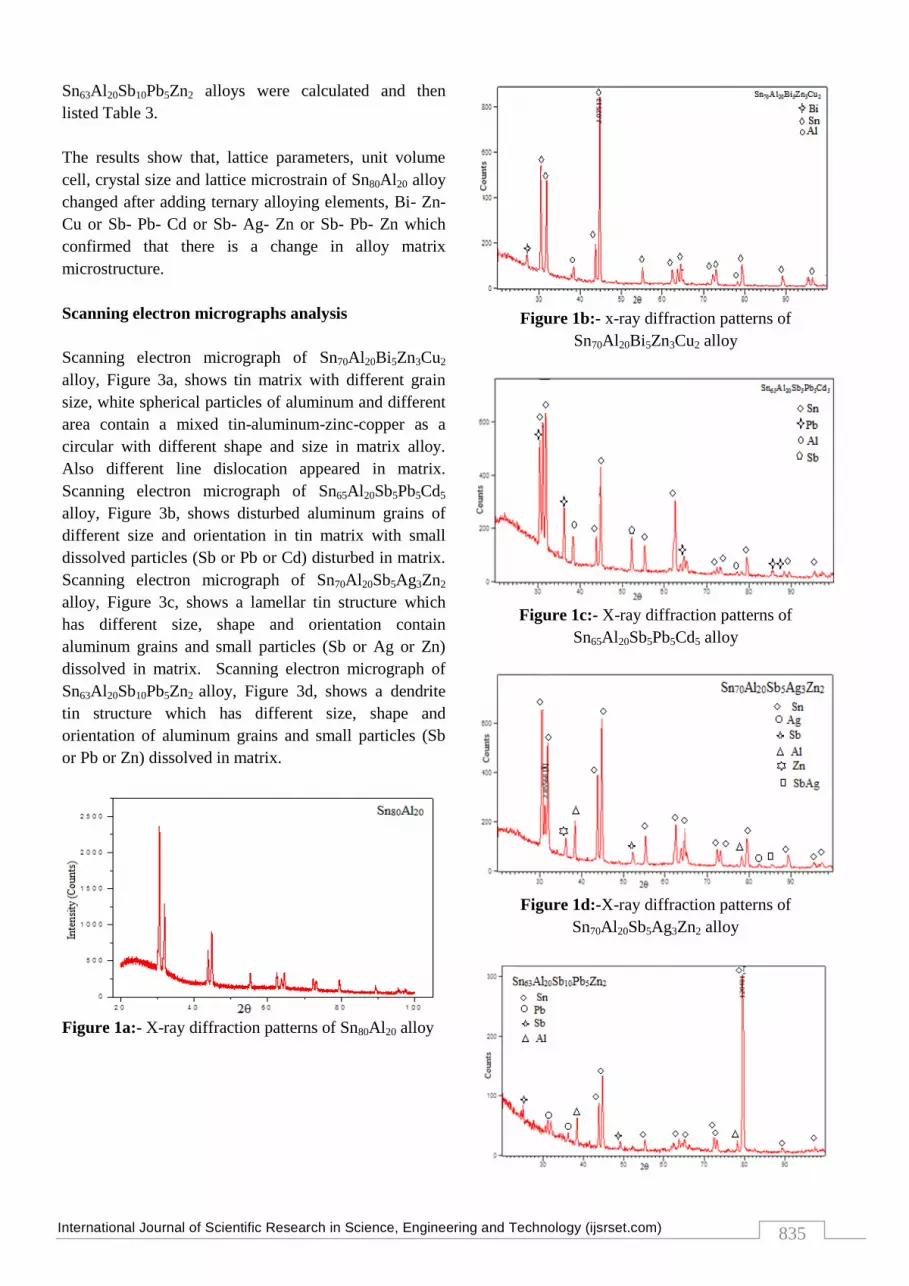
X-ray diffraction patterns of Sn70Al20Bi5Zn3Cu2 alloy
have lines corresponding to tetragonal tin phase,
hexagonal bismuth phase and face centered cubic
aluminum phase. Copper and zinc atoms dissolved in
matrix alloy. Also started base a round 180 counts, that
is mean that, the matrix atoms random distribution in
small part as shown in Figure 1a. Figure 1b shows x-ray
diffraction patterns of Sn65Al20Sb5Pb5Cd5 alloy which
have lines corresponding to tetragonal tin phase, face
centered cubic lead phase, antimony phase and face
centered cubic aluminum phase. Cadmium atoms
dissolved in matrix alloy. Also started base a round 230
counts, that is mean that, the matrix atoms random
distribution in small part. X-ray diffraction patterns of
Sn70Al20Sb5Ag3Zn2 alloy have lines corresponding to
tetragonal tin phase, zinc phase, silver phase sliver-
antimony intermetallic phase and face centered cubic
aluminum phase. Also started base a round 180 counts,
that is mean that, the matrix atoms random distribution
in small part as shown in Figure 1c. X-ray diffraction
patterns of Sn63Al20Sb10Pb5Zn2 alloy have lines
corresponding to tetragonal tin phase, lead phase,
antimony phase and face centered cubic aluminum phase.
Zinc atoms dissolved in alloy matrix. Also started base
a round 100 counts, that is mean that, the matrix atoms
random distribution in small part as shown in Figure 1d.
X-ray diffraction analysis in Table 1 (a, b, c and d) show
that adding different ternary alloying elements, Bi- Zn-
Cu or Sb- Pb- Cd or Sb- Ag- Zn or Sb- Pb- Zn, to
Sn80Al20 alloy caused a change in matrix microstructure
such as peak intensity (crystallinity), peak broadness
(crystal size), peak position (orientation) and started
base line (amorphousity).
Lattice parameters and unit cell volume of body centered
tetragonal tin in penta tin-aluminum based alloys are
determined using equation [16] and then listed in Table
2. The volume of tetragonal unit cell is .
The estimated crystal size is given by Scherer equation
[16] and then listed in Table 2. Also from the relation
between full width half maximum (β) and 4tan as
shown in Figure 2, the induced internal lattice
microstrain of Sn80Al20, Sn70Al20Bi5Zn3Cu2,
Sn65Al20Sb5Pb5Cd5, Sn70Al20Sb5Ag3Zn2, and
International Journal of Scientific Research in Science, Engineering and Technology (ijsrset.com)
835
Sn63Al20Sb10Pb5Zn2 alloys were calculated and then
listed Table 3.
The results show that, lattice parameters, unit volume
cell, crystal size and lattice microstrain of Sn80Al20 alloy
changed after adding ternary alloying elements, Bi- Zn-
Cu or Sb- Pb- Cd or Sb- Ag- Zn or Sb- Pb- Zn which
confirmed that there is a change in alloy matrix
microstructure.
Scanning electron micrographs analysis
Scanning electron micrograph of Sn70Al20Bi5Zn3Cu2
alloy, Figure 3a, shows tin matrix with different grain
size, white spherical particles of aluminum and different
area contain a mixed tin-aluminum-zinc-copper as a
circular with different shape and size in matrix alloy.
Also different line dislocation appeared in matrix.
Scanning electron micrograph of Sn65Al20Sb5Pb5Cd5
alloy, Figure 3b, shows disturbed aluminum grains of
different size and orientation in tin matrix with small
dissolved particles (Sb or Pb or Cd) disturbed in matrix.
Scanning electron micrograph of Sn70Al20Sb5Ag3Zn2
alloy, Figure 3c, shows a lamellar tin structure which
has different size, shape and orientation contain
aluminum grains and small particles (Sb or Ag or Zn)
dissolved in matrix. Scanning electron micrograph of
Sn63Al20Sb10Pb5Zn2 alloy, Figure 3d, shows a dendrite
tin structure which has different size, shape and
orientation of aluminum grains and small particles (Sb
or Pb or Zn) dissolved in matrix.
Figure 1a:- X-ray diffraction patterns of Sn80Al20 alloy
Figure 1b:- x-ray diffraction patterns of
Sn70Al20Bi5Zn3Cu2 alloy
Figure 1c:- X-ray diffraction patterns of
Sn65Al20Sb5Pb5Cd5 alloy
Figure 1d:-X-ray diffraction patterns of
Sn70Al20Sb5Ag3Zn2 alloy

International Journal of Scientific Research in Science, Engineering and Technology (ijsrset.com)
836
Table 1a:- x-ray diffraction analysis of
Sn70Al20Bi5Zn3Cu2 alloy
Table 1b:- x-ray diffraction analysis of
Sn65Al20Sb5Pb5Cd5 alloy
Table 1c:- x-ray diffraction analysis of
Sn70Al20Sb5Ag3Zn2 alloy
Table 1d: - x-ray diffraction analysis of
Sn63Al20Sb10Pb5Zn2 alloy
Table 2:- lattice parameters (a and c), unit cell volume
(V) and crystal size () of β-Sn in used alloys

International Journal of Scientific Research in Science, Engineering and Technology (ijsrset.com)
837
Table 3:- lattice microstrain induced in used alloys
Alloys Lattice strain () x10-3
Sn80Al20 1.5
Sn70Al20Bi5Zn3Cu2 0.3
Sn65Al20Sb5Pb5Cd5 0.6
Sn70Al20Sb5Ag3Zn2 1.3
Sn63Al20Sb10Pb5Zn2 9
Figure 2 :- FWHM versus 4tanθ for used alloys
Figure 3a :- SEM of Sn70Al20Bi5Zn3Cu2 alloy
Figure 3b :- SEM of Sn65Al20Sb5Pb5Cd5 alloy

International Journal of Scientific Research in Science, Engineering and Technology (ijsrset.com)
838
Figure 3c :- SEM of Sn70Al20Sb5Ag3Zn2 alloy
Figure 3d:- of Sn63Al20Sb10Pb5Zn2 alloy
B. Mechanical properties
Elastic Moduli
The elastic constants are directly related to atomic
bonding. The measured elastic modulus of Sn80Al20,
Sn70Al20Bi5Zn3Cu2, Sn65Al20Sb5Pb5Cd5, Sn70Al20Sb5Ag3
Zn2, and Sn63Al20Sb10Pb5Zn2 alloys are shown in Table 4.
Elastic modulus of Sn80Al20 alloy varied after Bi- Zn- Cu
or Sb- Pb- Cd or Sb- Ag- Zn or Sb- Pb- Zn elements.
That is meant, the dissolved different alloying atoms in
Sn80Al20 matrix formed a solid solution\ or stick on grain
boundary/ or formed a small cluster caused variation
bond matrix strengthens. The Sn70Al20Sb5Ag3Zn2 alloy
has adequate elastic modulus value.
Table 4:- elastic modului of used alloys
Alloys E (GPa) µ (GPa) B (GPa)
Sn80Al20 39.87 14.68 46.79
Sn70Al20Bi5Zn3Cu2 22.99 8.48 26.42
Sn65Al20Sb5Pb5Cd5 25.82 9.53 29.68
Sn70Al20Sb5Ag3Zn2 34.23 12.64 39.07
Sn63Al20Sb10Pb5Zn2 44.01 16.25 50.27
Internal Friction and Thermal Diffusivity
Internal friction is a useful tool for the study of structural
features of alloys. Resonance curves of Sn80Al20,
Sn70Al20Bi5Zn3Cu2, Sn65Al20Sb5Pb5Cd5, Sn70Al20Sb5Ag3
Zn2 and Sn63Al20Sb10Pb5Zn2 alloys are shown in Figure 4
and the calculated internal friction values are presented
in Table 5. Also from resonance frequency at which the
peak damping occur using the dynamic resonance
method the thermal diffusivity value was calculated and
then listed in Table 5. Internal friction of Sn80Al20 alloy
deceased after Bi- Zn- Cu or Sb- Pb- Cd or Sb- Ag- Zn
or Sb- Pb- Zn elements. The Sn70Al20Sb5Ag3Zn2 alloy
has lowest internal friction and thermal diffusivity
values.
Figure 4:- resonance curves of used alloys
Table 5 :- internal friction and thermal diffusivity
of used alloys
Alloys Q-1
x
10-3
Dth x10-8
(m2/sec)
Sn80Al20 18.37 11.58
Sn70Al20Bi5Zn3Cu2 16.16 12.58
Sn65Al20Sb5Pb5Cd5 9.65 9.27
Sn70Al20Sb5Ag3Zn2 6.56 4.71
Sn63Al20Sb10Pb5Zn2 14.76 7.83
Vickers microhardness and maximum shear stress
The hardness is the property of material, which gives it
the capability to resist being enduringly deformed when
a load is applied. The Vickers hardness of Sn80Al20,
Sn70Al20Bi5Zn3Cu2, Sn65Al20Sb5Pb5Cd5, Sn70Al20Sb5Ag3
Zn2 and Sn63Al20Sb10Pb5Zn2 alloys at 10 gram force and
indentation time 5 sec are listed in Table 6. Vickers
hardness of Sn80Al20 alloy varied after adding Bi- Zn-
Cu or Sb- Pb- Cd or Sb- Ag- Zn or Sb- Pb- Zn elements.
That is because the dissolved different alloying atoms
formed a solid solution\ or stick on grain boundary/ or a
small cluster effected bonding strengthens. Also the
maximum shear stress (µm) value of Sn80Al20,

International Journal of Scientific Research in Science, Engineering and Technology (ijsrset.com)
839
Sn70Al20Bi5Zn3Cu2, Sn65Al20Sb5Pb5Cd5, Sn70Al20Sb5Ag3
Zn2 and Sn63Al20Sb10Pb5Zn2 alloys was calculated using
the equation [19] and then listed in Table 6.
Table 6 :- Vickers hardness and minimum shear stress
of used alloys
Alloys Hv kg/mm2 µn
kg/mm2
Sn80Al20 36.43±2.7 10.21
Sn70Al20Bi5Zn3Cu2 30.86±4.12 12.11
Sn65Al20Sb5Pb5Cd5 55.7±5.66 11.81
Sn70Al20Sb5Ag3Zn2 44.8±5.49 17.41
Sn63Al20Sb10Pb5Zn2 44.33±7.5 17.48
C. Thermal performance
Thermal analysis is often used to study solid state
transformations as well as solid- liquid reactions. The
magnitudes of thermal properties depend on the nature
of solid phase and on its temperature. The solidus
temperature has been reached the tangent line, drawn in
by the DSC, is an approximation of the solidus
temperature. The liquidus temperature is defined as the
temperature at which the graph returns to the baseline.
The end of the deviation signifies the end of the phase
change. Figure 5 shows the DSC thermographs of
Sn70Al20Bi5Zn3Cu2, Sn65Al20Sb5Pb5Cd5, Sn70Al20Sb5Ag3
Zn2, and Sn63Al20Sb10Pb5Zn2 alloys. There is a variation
caused in thermo-graph of Sn80Al20 alloy after adding
Bi- Zn- Cu or Sb- Pb- Cd or Sb- Ag- Zn or Sb- Pb- Zn
elements. That is indicated to a change was happen in
structure of Sn80Al20 alloy and that agrees with the
results seen in x-ray diffraction analysis.
Figure 5 :- DSC thermographs of used alloys
D. Electrochemical Corrosion Behavior
Figure 6 shows the electrochemical polarization curves
of Sn80Al20, Sn70Al20Bi5Zn3Cu2, Sn65Al20Sb5Pb5Cd5,

International Journal of Scientific Research in Science, Engineering and Technology (ijsrset.com)
840
Sn70Al20Sb5Ag3Zn2 and Sn63Al20Sb10Pb5Zn2 alloys in 0. 5
M HCl. The corrosion potential of the Sn80Al20,
Sn70Al20Bi5Zn3Cu2, Sn65Al20Sb5Pb5Cd5, Sn70Al20Sb5Ag3
Zn2 and Sn63Al20Sb10Pb5Zn2 alloys showed a negative
potential. Also the cathodic and the anodic polarization
curves exhibited similar corrosion trends. The corrosion
potential (ECorr), corrosion current (ICorr), and corrosion
rate (C. R) of Sn80Al20, Sn70Al20Bi5Zn3Cu2,
Sn65Al20Sb5Pb5Cd5, Sn70Al20Sb5Ag3Zn2 and Sn63Al20Sb10
Pb5Zn2 alloys are presented in Table 7. The corrosion
rate of Sn80Al20 alloy in 0.5 M HCl increased after
adding Bi- Zn-Cu or Sb- Ag- Zn or Sb- Pb- Zn elements
but it’s decreased after Sb-Pb-Cd elements.
Figure 6 :- electrochemical polarization curves of used
alloys
Table 7:- corrosion potential (ECorr), corrosion current
(ICorr), and corrosion rate (C. R) of used alloys
Alloys ICorr
μA cm-
2
ECorr
Vm
C. R
mpy
Sn80Al20 22.60 -876 23.69e3
Sn70Al20Bi5Zn3Cu2 23.20 -943 24.32e3
Sn65Al20Sb5Pb5Cd5 11.10 -851 11.64e3
Sn70Al20Sb5Ag3Zn2 32.20 -863 33.75e3
Sn63Al20Sb10Pb5Zn2 118.0 -850 123.6e3
EFM is a non-destructive corrosion measurement
technique. In which current responses due to a potential
perturbation by one or more sine waves are measured at
more frequencies than the frequency of the applied
signal. The results of EFM experiments are a spectrum
of current response as a function of frequency. The
intermodulation spectrum of Sn80Al20,
Sn70Al20Bi5Zn3Cu2, Sn65Al20Sb5Pb5Cd5, Sn70Al20Sb5Ag3
Zn2 and Sn63Al20Sb10Pb5Zn2 alloys in 0. 5 M HCl
solutions are shown in Figure 7. The larger peaks were
used to calculate the corrosion current density (icorr)
and the corrosion rate (C. R) whish listed in Table 8.
The corrosion current density (icorr) of Sn80Al20 alloy in
0.5 M HCl increased after adding Bi- Zn-Cu or Sb- Pb-

International Journal of Scientific Research in Science, Engineering and Technology (ijsrset.com)
841
Cd or Sb- Pb- Zn elements but it’s decreased after Sb-
Ag-Zn elements.
Figure 7:- intermodulation spectrum obtained by EFM
technique for used alloys
Table 8:- the corrosion current density (icorr) and the
corrosion rate (C. R) of used alloys
Alloys iCorr μA cm-
2
C. R mpy
Sn80Al20 841.0 811.4
Sn70Al20Bi5Zn3Cu2 719.2 781.4
Sn65Al20Sb5Pb5Cd5 718.1 524.5
Sn70Al20Sb5Ag3Zn2 014.7 821.2
Sn63Al20Sb10Pb5Zn2 711.0 784.1
IV. CONCLUSION
1. Microstructural of Sn80Al20 alloy changed after
adding different ternary alloying elements, Bi- Zn-
Cu or Sb- Pb- Cd or Sb- Ag- Zn or Sb- Pb- Zn.
2. Internal friction of Sn80Al20 alloy deceased after Bi-
Zn- Cu or Sb- Pb- Cd or Sb- Ag- Zn or Sb- Pb- Zn
elements. The Sn70Al20Sb5Ag3Zn2 alloy has lowest
internal friction and thermal diffusivity values.
3. Elastic modulus and Vickers hardness of Sn80Al20
alloy varied after Bi- Zn- Cu or Sb- Pb- Cd or Sb-
Ag- Zn or Sb- Pb- Zn elements. The
Sn70Al20Sb5Ag3Zn2 alloy has adequate elastic
modulus and Vickers hardness values.
4. The corrosion current density (icorr) of Sn80Al20
alloy in 0.5 M HCl increased after adding Bi- Zn-Cu
or Sb- Pb- Cd or Sb- Pb- Zn elements but it’s
decreased after Sb-Ag-Zn elements
5. The corrosion rate of Sn80Al20 alloy in 0.5 M HCl
increased after adding Bi- Zn-Cu or Sb- Ag- Zn or
Sb- Pb- Zn elements but it’s decreased after Sb-Pb-
Cd elements
International Journal of Scientific Research in Science, Engineering and Technology (ijsrset.com)
842
V. REFERENCES
[1] A. Zeren, E. Feyzullahoglu, M. Zeren, Materials
and Design 28 (2007) 318
[2] P G Forrester, Met. Rev. 5 (1960) 507
[3] G C Pratt G C, Int. Met. Rev. 18 (1973) 62
[4] W I M Tegart, Elements of mechanical
metallurgy. New York: The MacMillan Co. 1966:
91
[5] P G Forrester, Curr. Engg. Pract. 3 (1961) 4
[6] T. Desaki, Y. Goto, S. Kamiya, JSAE Rev. 21
(2000) 321
[7] K. Lepper, M. James, J. Chashechkina, D.A.
Rigney, Wear 203–204 (1997) 46
[8] J P Pathak and S Mohan, Bull. Mater. Sci. 26: 3
(2003) 315
[9] A. A. El-Daly, Y. Swilem, A.E. Hammad, J.
Alloy. Comp. 471 (2009) 98
[10] M.J. Esfandyarpour, R. Mahmudi, Mater. Sci.
Eng. A 530 (2011) 402–410
[11] A. El-Bediwi, A.R. Lashin, M. Mossa, M. Kamal,
Mater. Sci. Eng. A 528 (2011) 3568
[12] A. B. El-Bediwi, Radia. Eff. Def. Solid. 159
(2004) 125
[13] A. B. El-Bediwi, Radia. Eff. Def. Solid. 159
(2004) 539
[14] M.J. Esfandyarpour, R. Mahmudi, Mater. Sci.
Eng. A 530 (2011) 402
[15] M. Kamal, A. El-Bediwi and M. R. El-Shobaki,
Radia. Eff. Def. Sol. 161 (2006) 549
[16] B. D Cullity, "Element of x-ray diffraction" Ch.10
(1959) 297
[17] S. Sppinert and W. E. Teffit, ASTM, Proc. 61
(1961) 1221
[18] E. Schreiber, O. L. Anderson and N. Soga, Elastic
Constants and their Measurement, McGraw-Hill
Book Company, Ch. 4 (1973)
[19] S. Timoshenko and J. N. Goddier, "Theory of
elasticity, 2nd Ed", McGraw-Hill, New York,
(1951) 277


